Impacts of Erratic Snowfall on Apple Orchards in Kashmir ...
14
sustainability Article Impacts of Erratic Snowfall on Apple Orchards in Kashmir Valley, India Irfan Rashid 1, * , Ulfat Majeed 1 , Sheikh Aneaus 1 , Juan Antonio Ballesteros Cánovas 2,3 , Markus Stoffel 2,3,4 , Nadeem Ahmad Najar 1 , Imtiyaz Ahmad Bhat 1 and Sonam Lotus 5 1 Department of Geoinformatics, University of Kashmir, Hazratbal Srinagar 190006, Jammu and Kashmir, India; [email protected] (U.M.); [email protected] (S.A.); [email protected] (N.A.N.); [email protected] (I.A.B.) 2 Climatic Change and Climate Impacts, Institute for Environmental Sciences, University of Geneva, Boulevard Carl-Vogt 66, CH-1205 Geneva, Switzerland; [email protected] (J.A.B.C.); Markus.Stoff[email protected] (M.S.) 3 Dendrolab.ch, Institute for Environmental Sciences, University of Geneva, Boulevard Carl-Vogt 66, CH-1205 Geneva, Switzerland 4 Department F.A. Forel for Environmental and Aquatic Sciences, University of Geneva, Boulevard Carl-Vogt 66, CH-1205 Geneva, Switzerland 5 India Meteorological Department, Srinagar 190008, Jammu and Kashmir, India; [email protected] * Correspondence: [email protected]; Tel.: +91-901-888-5992 Received: 19 October 2020; Accepted: 3 November 2020; Published: 5 November 2020 Abstract: Kashmir Valley has been witnessing erratic snowfall events in recent autumns which severely impacted apple orchards and harvests. Here, we combine remotely sensed data and field observations to map snowfall distribution and snow depths during the recent snowfall events in November 2018 and November 2019. Besides, we used ERA-5 reanalysis climate datasets to investigate the causes of these erratic snowfall events, pointing to an early arrival of Western Disturbances (WD) to the area. Analysis of these untimely snowfall episodes indicates that snow depths varied from 5–122 cm and 31–152 cm during the 2018 and 2019 snowfall events, respectively. In turn, satellite data analysis reveals that the apple orchards cover roughly 9.8% (1329 km 2 ) of the entire surface of Kashmir Valley, out of which 32.6% were mildly to severely damaged by snow. The areas in South Kashmir suffered the most from the untimely snowfall with an area affected estimated to ~264 km 2 , followed by North Kashmir (~151 km 2 ) and Central Kashmir (18 km 2 ). The snowfall caused substantial harvest losses in orchards ranging from 4–50% with an average of ~35%. The geopotential analysis from the ERA-5 dataset provides insights into the synoptic weather patterns leading to the snowfall events and point to a trough in the high-troposphere (200 mb), along with a col at lower levels (850 mb) over the Kashmir Valley from November 2–5, 2018. The lower levels (850 mb) experienced intense cyclonic circulation which favored advection of moisture from the Arabian Sea during the November 6–7, 2019, snowfall event. The large economic losses related to early arrival of WD led to a virtual grounding of the horticultural sector in 2018 and 2019. Therefore, more baseline research is critically needed along with a comprehensive evaluation of the suitability of horticulture as an economically viable sector that is being promoted over the Kashmir region, also under climate change. Keywords: snowfall variability; western disturbances; erratic snow precipitation; Kashmir Himalaya; horticulture 1. Introduction The Himalayan region constitutes one of the most vulnerable areas as it suffers from extreme weather events under present climate conditions and also in light of climate projections [1]. Over the Sustainability 2020, 12, 9206; doi:10.3390/su12219206 www.mdpi.com/journal/sustainability
-
Upload
khangminh22 -
Category
Documents
-
view
1 -
download
0
Transcript of Impacts of Erratic Snowfall on Apple Orchards in Kashmir ...

sustainability
Article
Impacts of Erratic Snowfall on Apple Orchards inKashmir Valley, India
Irfan Rashid 1,* , Ulfat Majeed 1 , Sheikh Aneaus 1 , Juan Antonio Ballesteros Cánovas 2,3,Markus Stoffel 2,3,4, Nadeem Ahmad Najar 1, Imtiyaz Ahmad Bhat 1 and Sonam Lotus 5
1 Department of Geoinformatics, University of Kashmir,Hazratbal Srinagar 190006, Jammu and Kashmir, India; [email protected] (U.M.);[email protected] (S.A.); [email protected] (N.A.N.); [email protected] (I.A.B.)
2 Climatic Change and Climate Impacts, Institute for Environmental Sciences, University of Geneva,Boulevard Carl-Vogt 66, CH-1205 Geneva, Switzerland; [email protected] (J.A.B.C.);[email protected] (M.S.)
3 Dendrolab.ch, Institute for Environmental Sciences, University of Geneva, Boulevard Carl-Vogt 66,CH-1205 Geneva, Switzerland
4 Department F.A. Forel for Environmental and Aquatic Sciences, University of Geneva,Boulevard Carl-Vogt 66, CH-1205 Geneva, Switzerland
5 India Meteorological Department, Srinagar 190008, Jammu and Kashmir, India; [email protected]* Correspondence: [email protected]; Tel.: +91-901-888-5992
Received: 19 October 2020; Accepted: 3 November 2020; Published: 5 November 2020�����������������
Abstract: Kashmir Valley has been witnessing erratic snowfall events in recent autumns which severelyimpacted apple orchards and harvests. Here, we combine remotely sensed data and field observationsto map snowfall distribution and snow depths during the recent snowfall events in November 2018 andNovember 2019. Besides, we used ERA-5 reanalysis climate datasets to investigate the causes of theseerratic snowfall events, pointing to an early arrival of Western Disturbances (WD) to the area. Analysisof these untimely snowfall episodes indicates that snow depths varied from 5–122 cm and 31–152 cmduring the 2018 and 2019 snowfall events, respectively. In turn, satellite data analysis reveals that theapple orchards cover roughly 9.8% (1329 km2) of the entire surface of Kashmir Valley, out of which32.6% were mildly to severely damaged by snow. The areas in South Kashmir suffered the mostfrom the untimely snowfall with an area affected estimated to ~264 km2, followed by North Kashmir(~151 km2) and Central Kashmir (18 km2). The snowfall caused substantial harvest losses in orchardsranging from 4–50% with an average of ~35%. The geopotential analysis from the ERA-5 datasetprovides insights into the synoptic weather patterns leading to the snowfall events and point to atrough in the high-troposphere (200 mb), along with a col at lower levels (850 mb) over the KashmirValley from November 2–5, 2018. The lower levels (850 mb) experienced intense cyclonic circulationwhich favored advection of moisture from the Arabian Sea during the November 6–7, 2019, snowfallevent. The large economic losses related to early arrival of WD led to a virtual grounding of thehorticultural sector in 2018 and 2019. Therefore, more baseline research is critically needed alongwith a comprehensive evaluation of the suitability of horticulture as an economically viable sectorthat is being promoted over the Kashmir region, also under climate change.
Keywords: snowfall variability; western disturbances; erratic snow precipitation; Kashmir Himalaya;horticulture
1. Introduction
The Himalayan region constitutes one of the most vulnerable areas as it suffers from extremeweather events under present climate conditions and also in light of climate projections [1]. Over the
Sustainability 2020, 12, 9206; doi:10.3390/su12219206 www.mdpi.com/journal/sustainability

Sustainability 2020, 12, 9206 2 of 14
last few decades, changing climate has had adverse impacts on several processes and key ecosystems tohuman wellbeing across the Himalayan arc, including the quantity and seasonality of snow cover [2–4],glacier changes [5,6], natural disasters [7,8], and land degradation and vegetation cover changes [9,10],with repercussions on strategic socio-economic sectors, such as hydropower [11,12], tourism [13,14], and,ultimately, on local livelihoods [15–17]. According to the observational records and climate projections,the ongoing climatic change over the Himalayas has not only impacted the pristine ecosystems andearth surface processes but also altered weather circulation patterns over the region [18,19].
Kashmir Valley, with an area of ~15,000 km2, is a nappe zone interlaced between the GreaterHimalayas and the Pir Panjal Range (Lat: 33◦22′–34◦42′ N; Lon: 73◦54′–75◦35′ E) in northern India(Figure 1).
Sustainability 2020, 12, x FOR PEER REVIEW 2 of 14
1. Introduction
The Himalayan region constitutes one of the most vulnerable areas as it suffers from extreme weather events under present climate conditions and also in light of climate projections [1]. Over the last few decades, changing climate has had adverse impacts on several processes and key ecosystems to human wellbeing across the Himalayan arc, including the quantity and seasonality of snow cover [2–4], glacier changes [5,6], natural disasters [7,8], and land degradation and vegetation cover changes [9,10], with repercussions on strategic socio-economic sectors, such as hydropower [11,12], tourism [13,14], and, ultimately, on local livelihoods [15–17]. According to the observational records and climate projections, the ongoing climatic change over the Himalayas has not only impacted the pristine ecosystems and earth surface processes but also altered weather circulation patterns over the region [18,19].
Kashmir Valley, with an area of ~15,000 km2, is a nappe zone interlaced between the Greater Himalayas and the Pir Panjal Range (Lat: 33°22′–34°42′ N; Lon: 73°54′–75°35′ E) in northern India (Figure 1).
Figure 1. Location of the study area. Top Panel: Location of Kashmir Valley (shown as a red rectangle) with relevant cities found across the western Himalayas. Background elevation data is from Global Topography 30 Arc Second (GTOPO30). Bottom Panel: Shuttle Radar Topographic Mission (SRTM) Digital Elevation Model (DEM) of Kashmir Valley, a region that is interspersed between the Pir Panjal and the Greater Himalayan Mountain ranges. Stars indicate locations of the six weather stations used in this study: 1- Gulmarg, 2- Kokernag, 3- Kupwara, 4- Pahalgam, 5- Qazigund, 6- Srinagar.
Figure 1. Location of the study area. Top Panel: Location of Kashmir Valley (shown as a red rectangle)with relevant cities found across the western Himalayas. Background elevation data is from GlobalTopography 30 Arc Second (GTOPO30). Bottom Panel: Shuttle Radar Topographic Mission (SRTM)Digital Elevation Model (DEM) of Kashmir Valley, a region that is interspersed between the Pir Panjaland the Greater Himalayan Mountain ranges. Stars indicate locations of the six weather stations usedin this study: 1—Gulmarg, 2—Kokernag, 3—Kupwara, 4—Pahalgam, 5—Qazigund, 6—Srinagar.
The Kashmir region, located toward the western part of the Himalayan arc, has experiencederratic weather patterns frequently in the past [20–22]; with further warming, erratic weather eventsare projected to become much more frequent by the end of this century [23]. Erratic weather regimes
Sustainability 2020, 12, 9206 3 of 14
have—among others—caused the megaflood of 2014 during which the Kashmir Region suffered massiveeconomic losses totaling 1 trillion INR (corresponding to roughly US$13.7 billion) [24]. Besides floods [25],the Kashmir Region is also affected by other weather-related events, including the heavy snowfall eventin February 2005 which caused widespread damage to infrastructure [26,27].
Climatologically, the Kashmir area belongs to the temperate zone [28,29] characterized by fourseasons (spring, summer, autumn, and winter). Srinagar, the region’s capital, is located in the center of thevalley at an altitude of 1580 m asl. The city receives an annual precipitation of ~750 mm, predominantlyduring Western Disturbances (WDs), but a weak influence from the Indian summer monsoon exists,as well [30]. The mountains experience more precipitation. Mean seasonal temperatures range from5–25 ◦C at Srinagar and decrease along an altitudinal gradient [31,32]. The elevation of the valley rangesfrom 1073 to 5400 m asl. Kashmir Valley witnessed untimely, widespread snowfall on 3–4 November 2018and 6–7 November 2019, driven by WDs. These two erratic snowfall events were not only surprising tothe residents but also severely dented the horticultural sector in Kashmir. It is pertinent to mentionthat the six meteorological stations maintained by the India Meteorological Department in the KashmirValley do not gather any information about the snowfall records over the region.
WDs are known to produce severe weather over the northern Indian subcontinent [33]. Thesesynoptic-scale weather systems occur at mid-latitudes during the winter season and originate fromfrontal systems in the Mediterranean Region [34] before reaching the north-western part of India withthe subtropical jet stream [35,36]. WDs advect moisture not only from the Mediterranean basin andthe Caspian Sea, but occasionally are also supplied with fresh moisture from the Arabian Sea, whichmay then cause extreme weather with snowfall or intense rain [33,37]. WDs can also interfere withmonsoon activity, which again can enhance the intensity of precipitation events [38]. Much of thesnowfall and precipitation recorded in the Himalayas can be attributed to the passage of WD [36,39],and even more so in Jammu and Kashmir where the occurrence of spells of snowfall has been linked tothe occurrence and persistence of WDs, which often last from 2 to 4 days [40]. Besides, the occurrenceof WDs has also been linked to the occurrence of floods or snow avalanches [41]. Linking such extremeevents with the intra-seasonal occurrence of WDs is important, not only to forecast future events [34],but also to anticipate intra-sectoral impacts in a context of climate change, for which enhanced WDactivity is expected in the region [42].
In this paper, we focus on the causes and impacts of the erratic snowfall events that took placein early November 2018 and November 2019. By doing so, we provide insights into their climatecausative factors and analyze snowfall data obtained through the physical surveying of the area at theend of the snowfall event. This was done through the combination of observations with outputs fromthe European Centre for Medium-Range Weather Forecasts Re-analyses (ERA-5) climate dataset.
2. Materials and Methods
This study relies on a suite of data from remote sensing platforms, ground surveys, as well asancillary data of damage assessment (Table 1).
Whereas satellite data of 2018 (Sentinel 2A with a spatial resolution of 10m) and 2019 (Landsat 8Operational Land Imager, OLI) with a spatial resolution of 30 m) provided first-hand insights into theextent of the areas affected by snowfall over the Kashmir Valley, snow depth was measured manuallyat 65 locations across the Kashmir Region (Figure 1) using a handheld GPS device and a meter scale.Optical satellite data from Sentinel 2A and Landsat 8 OLI was used since none of the datasets capturedboth the snowfall events. In addition, long-term precipitation data for November have been collectedfrom six meteorological stations across the Kashmir Valley and for the period 1980–2019, so as to gainmore insights into the dynamics of late autumn precipitation over the region. Data was collectedfrom the regional center of the India Meteorological Department located at Srinagar. The area underapple orchards was mapped using freely available high-resolution satellite imagery (Basemap in ESRIArcMap 10.1) for 2016–18 at a scale of 1:5000 employing manual digitization. Since the apple trees areplanted in rows and columns, we identified apple orchards based on the pattern using high-resolution

Sustainability 2020, 12, 9206 4 of 14
ESRI Base map. Damage assessment data from the orchards affected by the November 2018 snowfallwas procured from the Directorate of Horticulture, Kashmir. As damage assessment data for theNovember 2019 event are still under compilation, we inferred information remotely by using a kriginginterpolation [43,44] to locate hotspots of damage for 2018 snowfall event. Additionally, we employedreanalysis data from ERA-5 to draw inferences about weather circulation patterns prevalent over theregion during the first week of November 2018 and November 2019. The ERA-5 reanalysis datasetconstitutes the fifth state-of-the-art reanalysis generated by European Centre for Meduim-RangeWeather Forecasts (ECMWF, https://www.ecmwf.int/). It is based on data assimilation from modeland observations across the world with a spatial resolution of 0.25◦ and temporal (12-h) coveragefrom 1979 to present. To evaluate the synoptic situation related to the snow spell, synoptic chartswere investigated. A more detailed description about the ERA-5 global reanalysis is provided inHersbach et al. [45].
Table 1. Details of the datasets used in the study.
Dataset Scene ID/Acquisition Date Spatial Resolution
A. Remote Sensing Imagery
Basemap in ESRI ArcMap 10.1 2016–2018 1:5000 scale
ECMWF Re-Analysis (ERA-5) 1–7 November 20181–7 November 2019 0.25◦
B. Precipitation Data November (1980–2019) Point data
C. Field Data
GPS measurements5 November 2018 Point data7 November 2019 Point data
Photographs 5 November 2018 Point data7 November 2019 Point data
Damage assessment data November 2018 Point data
3. Results
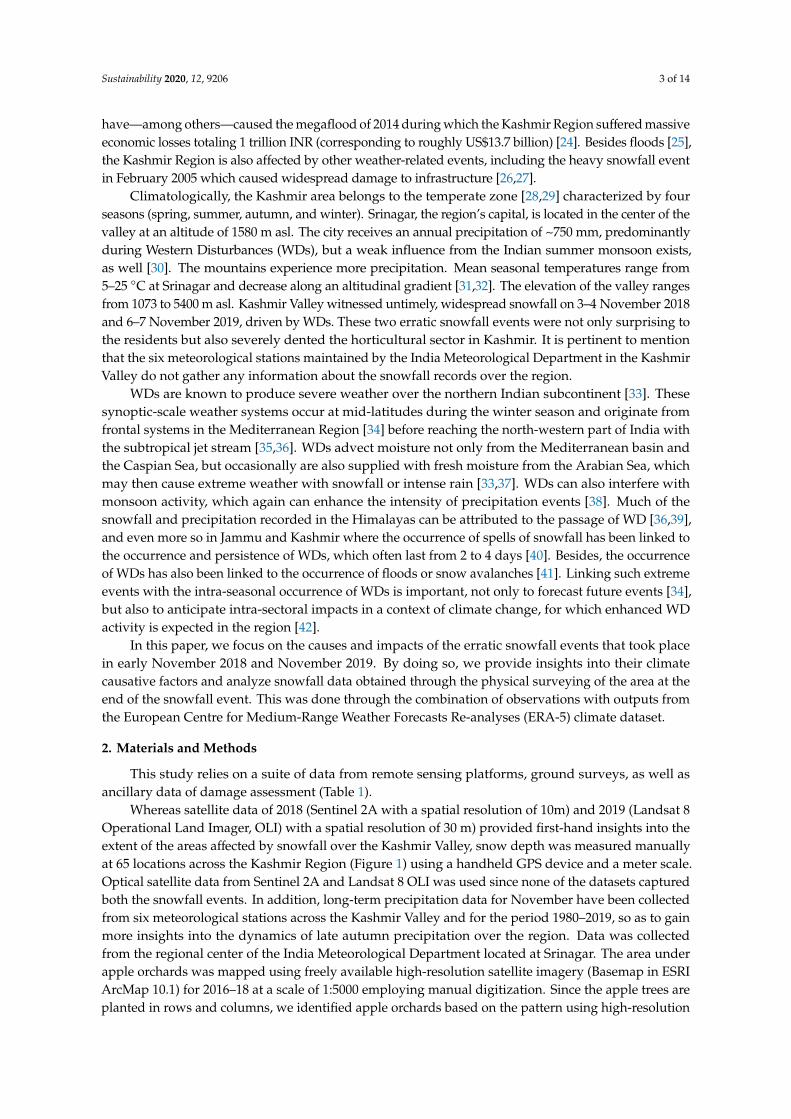
The satellite images of both severe weather episodes indicated widespread snowfall across theKashmir Valley (Supplementary Information Figure S1); however, optical remote sensing data usedin this study did not yield any information on the quantity of snow. Consequently, snow depth wasmeasured manually at 65 locations across Kashmir Valley and interpolated in ArcMap 10.1, to producea seamless snow depth map for the events of 2018 and 2019 (Figure 2). During November 2018,snow varied from 5 cm (areas in central and north Kashmir) to 122 cm (south Kashmir), whereas theNovember 2019 snowfall event left between 30 cm (in central and north Kashmir) and 152 cm (in southand south-west Kashmir) of snow. Although the amount of snowfall was temporally variable duringthe two events, spatial variability was similar between the events with the southern part of the valleyreceiving substantially more snow. Details of field-based snow depth measurements are provided inTable S1.
Analysis of long-term November precipitation data over the Kashmir Valley indicates consistentlyincreasing precipitation (Figure 3) across time for the 5 stations located at lower altitudes (<2400 m asl).This increasing trend is heterogeneous across the five stations in Kashmir Valley but most pronouncedat Pahalgam (R2: 0.087; Figure 3d), followed by Srinagar (R2: 0.059; Figure 3c), Kokernag (R2: 0.048;Figure 3f), Kupwara (R2: 0.014; Figure 3a) and Qazigund (R2: 0.006; Figure 3e). By contrast, precipitationdata of the high-altitude station Gulmarg showed a weak declining trend (Figure 3b).
Sustainability 2020, 12, 9206 5 of 14
Sustainability 2020, 12, x FOR PEER REVIEW 5 of 14
has the highest land under apple orchards (305 km2), while Srinagar has the smallest area (15.7 km2). The zone-wise statistics of area under orchards is provided in Table S3. South Kashmir accounts for ~56% of the total orchard area followed by north Kashmir (32%) and central Kashmir (12%).
Figure 2. Snow depth during (top) November 2018 and (bottom) November 2019.
The assessment of snowfall data specifically over orchards suggests that snow depth varied from 2–80 cm during the snowfall episodes. During the November 2018 event, orchards experienced 2.7–80 cm of snowfall with a mean of 20.7 cm, whereas, in November 2019, snowfall was more severe ranging from 29–76.5 cm with a mean of 40 cm. Noteworthy, south Kashmir received substantially more snow compared to other areas of the valley during both events. The apple orchards suffered massive damage during both the 2018 and 2019 snowfall events. The damage ranged from damage to the foliage, crumbling of branches and also uprooting of apple tree in certain areas. Data compiled
Figure 2. Snow depth during (top) November 2018 and (bottom) November 2019.
Apple orchards cover 1330 km2 and are spread over 10 districts of the Kashmir Valley as mappedfrom the satellite data (Figure 4). The district-wise land under orchards is provided in Table S2. Analysissuggests that out of the ten districts of Kashmir Valley, Baramulla District in north Kashmir has the highestland under apple orchards (305 km2), while Srinagar has the smallest area (15.7 km2). The zone-wisestatistics of area under orchards is provided in Table S3. South Kashmir accounts for ~56% of the totalorchard area followed by north Kashmir (32%) and central Kashmir (12%).
The assessment of snowfall data specifically over orchards suggests that snow depth variedfrom 2–80 cm during the snowfall episodes. During the November 2018 event, orchards experienced2.7–80 cm of snowfall with a mean of 20.7 cm, whereas, in November 2019, snowfall was more severeranging from 29–76.5 cm with a mean of 40 cm. Noteworthy, south Kashmir received substantiallymore snow compared to other areas of the valley during both events. The apple orchards suffered

Sustainability 2020, 12, 9206 6 of 14
massive damage during both the 2018 and 2019 snowfall events. The damage ranged from damage tothe foliage, crumbling of branches and also uprooting of apple tree in certain areas. Data compiledby the Directorate of Horticulture, Kashmir for the 2018 (Supplementary Information Table S2) eventrevealed that 433.55 km2 of orchards were affected across Kashmir Valley by the weather event with thehighest damage reported for Kulgam District (99.45 km2) and the lowest impacts around Srinagar (1.76km2). The interpolated data for damage to orchards, expressed as percentage, for the 2018 snowfall isshown in Figure 5. Analysis indicates that areas in south Kashmir suffered most damage followedby north Kashmir and central Kashmir. Our results also suggest that orchards got damaged between4–50% with an average damage of ~35%.
Sustainability 2020, 12, x FOR PEER REVIEW 6 of 14
by the Directorate of Horticulture, Kashmir for the 2018 (Supplementary Information Table S2) event revealed that 433.55 km2 of orchards were affected across Kashmir Valley by the weather event with the highest damage reported for Kulgam District (99.45 km2) and the lowest impacts around Srinagar (1.76 km2). The interpolated data for damage to orchards, expressed as percentage, for the 2018 snowfall is shown in Figure 5. Analysis indicates that areas in south Kashmir suffered most damage followed by north Kashmir and central Kashmir. Our results also suggest that orchards got damaged between 4–50% with an average damage of ~35%.
Figure 3. Historical Precipitation data (1980–2020) of November over the Kashmir Valley from six meteorological stations. (a): Kupwara, (b): Gulmarg, (c): Srinagar, (d): Pahalgam, (e): Qazigund, and (f): Kokernag.
Figure 3. Historical Precipitation data (1980–2020) of November over the Kashmir Valley from six meteorologicalstations. (a): Kupwara, (b): Gulmarg, (c): Srinagar, (d): Pahalgam, (e): Qazigund, and (f): Kokernag.

Sustainability 2020, 12, 9206 7 of 14
Sustainability 2020, 12, x FOR PEER REVIEW 7 of 14
Figure 4. District-wise area under orchards in Kashmir Valley (in km2). AN: Anantnag, KU: Kulgam, SH: Shopian, PU: Pulwama, BU: Budgam, SR: Srinagar, GA: Ganderbal, BA: Baramulla, BN: Bandipora, and KP: Kupwara.
Figure 5. District-wise damage to orchards in Kashmir Valley during November 2018 (in %). AN: Anantnag, KU: Kulgam, SH: Shopian, PU: Pulwama, BU: Budgam, SR: Srinagar, GA: Ganderbal, BA: Baramulla, BN: Bandipora, and KP: Kupwara.
Figure 4. District-wise area under orchards in Kashmir Valley (in km2). AN: Anantnag, KU: Kulgam,SH: Shopian, PU: Pulwama, BU: Budgam, SR: Srinagar, GA: Ganderbal, BA: Baramulla, BN: Bandipora,and KP: Kupwara.
Sustainability 2020, 12, x FOR PEER REVIEW 7 of 14
Figure 4. District-wise area under orchards in Kashmir Valley (in km2). AN: Anantnag, KU: Kulgam, SH: Shopian, PU: Pulwama, BU: Budgam, SR: Srinagar, GA: Ganderbal, BA: Baramulla, BN: Bandipora, and KP: Kupwara.
Figure 5. District-wise damage to orchards in Kashmir Valley during November 2018 (in %). AN: Anantnag, KU: Kulgam, SH: Shopian, PU: Pulwama, BU: Budgam, SR: Srinagar, GA: Ganderbal, BA: Baramulla, BN: Bandipora, and KP: Kupwara.
Figure 5. District-wise damage to orchards in Kashmir Valley during November 2018 (in %). AN: Anantnag,KU: Kulgam, SH: Shopian, PU: Pulwama, BU: Budgam, SR: Srinagar, GA: Ganderbal, BA: Baramulla, BN:Bandipora, and KP: Kupwara.

Sustainability 2020, 12, 9206 8 of 14
Synoptic analysis of the two weather events leading to unseasonal snowfall across the KashmirValley was related to the early arrival of WDs. In the case of the November 2018 event, geopotentialanalysis from the ERA-5 dataset points to the formation of a trough at high tropospheric levels (200 mb)around 67◦ E and 40◦ N on 2 November 2018 (Figure 6). In the following days, this trough evolvedsteadily to reach northern Pakistan and north-western India where it persisted at 75◦ E and 35◦
N until 6 November 2018. At lower atmospheric levels (850 mb), a col situation formed between2–5 November 2018 around 75◦ E and 34◦ N (see Figure S2). This synoptic situation induced a cycloniccirculation in north-eastern Pakistan and south-west of the Tibetan plateau and led to positive potentialvorticity over the region. The lack of ventilation, typical during such situations, likely favored theaccumulation of moisture originating from northern and western Pakistan (Figure S2). At the sametime, colder air masses from northern latitudes were transported over the Kashmir Region, where theyled to a significant drop of average surface temperatures (Figure 7). Temperature and geopotentialvalues recovered partially 4–5 days after the events (Table S4).
Sustainability 2020, 12, x FOR PEER REVIEW 8 of 14
Synoptic analysis of the two weather events leading to unseasonal snowfall across the Kashmir Valley was related to the early arrival of WDs. In the case of the November 2018 event, geopotential analysis from the ERA-5 dataset points to the formation of a trough at high tropospheric levels (200 mb) around 67° E and 40° N on November 2, 2018 (Figure 6). In the following days, this trough evolved steadily to reach northern Pakistan and north-western India where it persisted at 75° E and 35° N until November 6, 2018. At lower atmospheric levels (850 mb), a col situation formed between November 2–5, 2018 around 75° E and 34° N (see Figure S2). This synoptic situation induced a cyclonic circulation in north-eastern Pakistan and south-west of the Tibetan plateau and led to positive potential vorticity over the region. The lack of ventilation, typical during such situations, likely favored the accumulation of moisture originating from northern and western Pakistan (Figure S2). At the same time, colder air masses from northern latitudes were transported over the Kashmir Region, where they led to a significant drop of average surface temperatures (Figure 7). Temperature and geopotential values recovered partially 4–5 days after the events (Table S4).
Figure 6. Geopotential (200 mb and 850 mb) and surface temperature fields from ERA-5 at the start of the snowfall spells in November 2018 (left panels) and November 2019 (right panels).
Similar to the 2018 event, on November 6–7, 2019, we observe again the arrival of a WD; identification of a trough at high tropospheric levels (200 mb) is even clearer in this case and localized
Figure 6. Geopotential (200 mb and 850 mb) and surface temperature fields from ERA-5 at the start ofthe snowfall spells in November 2018 (left panels) and November 2019 (right panels).
Sustainability 2020, 12, 9206 9 of 14
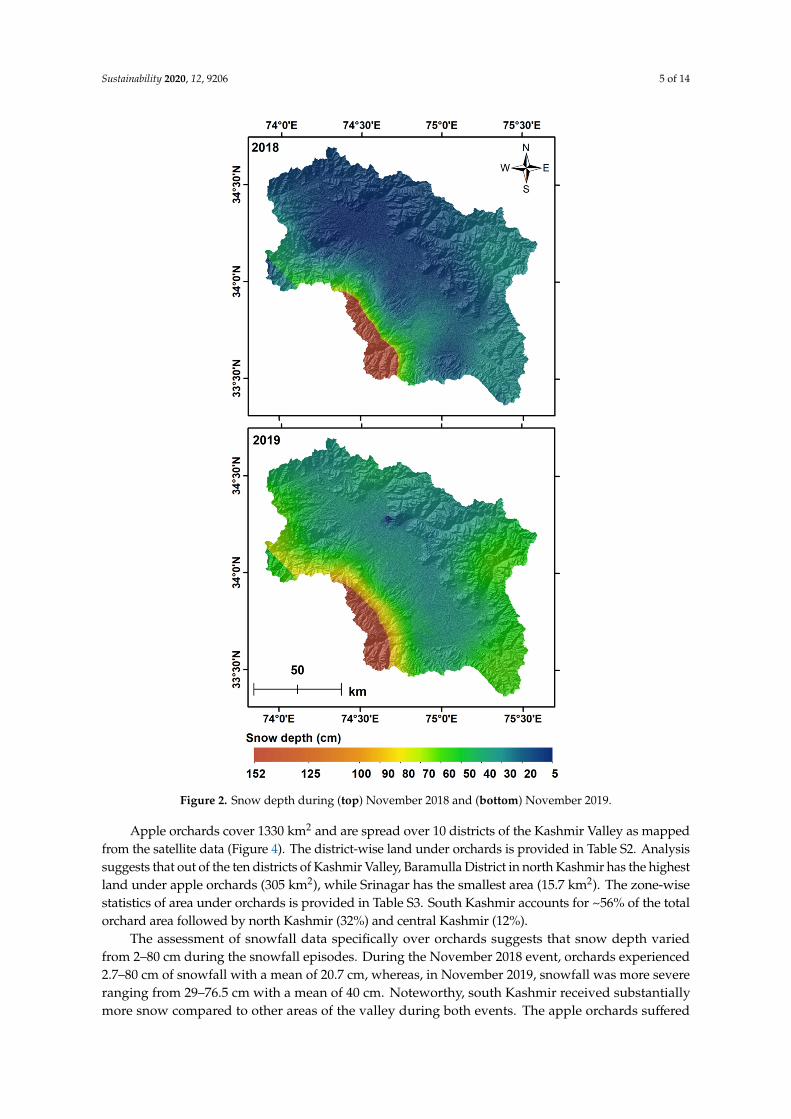
Similar to the 2018 event, on 6–7 November 2019, we observe again the arrival of a WD; identificationof a trough at high tropospheric levels (200 mb) is even clearer in this case and localized at 67.5◦ E and35◦ N. At lower levels (850 mb), a more intense cyclonic circulation (72◦ E and 32.5◦ N) formed to favoradvection of moisture from the Arabian Sea. Associated to the arrival of the WD, the incursion of lowtemperatures from higher latitudes can be observed, favoring the snowfall episode further (Figure S3).The satellite imagery from Indian National Satellite (INSAT-3D, Figures S2 and S3) and the ERA-5derived upper-level winds support the presence of convective cloud bands with the arrival of the WDin both years; the effects were, however, more intense during the 2019 snowfall due to advection ofmoisture from the north Arabian Sea.
Sustainability 2020, 12, x FOR PEER REVIEW 9 of 14
at 67.5° E and 35° N. At lower levels (850 mb), a more intense cyclonic circulation (72° E and 32.5° N) formed to favor advection of moisture from the Arabian Sea. Associated to the arrival of the WD, the incursion of low temperatures from higher latitudes can be observed, favoring the snowfall episode further (Figure S3). The satellite imagery from Indian National Satellite (INSAT-3D, Figure S2 and S3) and the ERA-5 derived upper-level winds support the presence of convective cloud bands with the arrival of the WD in both years; the effects were, however, more intense during the 2019 snowfall due to advection of moisture from the north Arabian Sea.
Figure 7. Pre- and post-event evolution of average surface temperatures (°C) and geopotential (z500) with the snowfall events based on ERA-5 dataset (data represent average values over the region 33.3°–34.3° N and 74.3°–75° E).
4. Discussion
In this study, we assessed the causes and impacts of untimely, strong snowfall events in Kashmir in November 2018 and November 2019, as well as looked into the consequences they have had on apple orchards in the valley. The orchard areas in south Kashmir have been affected most by the erratic snowfall in 2018 and 2019, with the latter being more intense and hence resulting in colossal damage to the apple production in the valley. Noteworthy, the occurrence of these two recent events is in line with a general tendency for the more frequent occurrence of extreme weather events over Kashmir [46,47]. Whereas the Department of Horticulture estimated losses after the November 2018 snowfall at INR 5 billion (https://bit.ly/2TDATpR), damage observed following the November 2019 snowfall was more pronounced and resulted in the losses amounting to INR 22.5 billion (or c. US$302 million; https://bit.ly/3aJxmvN). Even if meteorological records are lacking to confirm the statement, reports suggest that the 2019 snowfall was the heaviest that Kashmir experienced over the past six decades, claiming 7 lives (https://bit.ly/2wInowb) and damaged power infrastructure worth INR 220 million (or c. US$2.95 billion; https://bit.ly/2TG99Rj). Historical precipitation data from India Meteorological Department (IMD) also point to a consistent increase in precipitation totals across the valley, and are thus in line with what is projected to occur in the Kashmir Region by the end of this century [23].
The horticultural sector of the Kashmir Valley, dominated by apple orchard, contributes 27% (INR 50 billion or US$670 million) to the economy of Jammu and Kashmir [48], and the government is contemplating to strengthen the sector further. This study indicates that of the total area of 1330 km2 under apple orchards in Kashmir Valley, more than half of orchards (56%) are located in south Kashmir. Given the stark promotion of the horticultural sector, massive areas under irrigation-intensive rice paddy currently undergo conversion to seemingly more viable apple orchards [49–52]. However, we argue that the ever-increasing area under orchards may well become unsustainable in
Figure 7. Pre- and post-event evolution of average surface temperatures (◦C) and geopotential (z500)with the snowfall events based on ERA-5 dataset (data represent average values over the region33.3◦–34.3◦ N and 74.3◦–75◦ E).
4. Discussion
In this study, we assessed the causes and impacts of untimely, strong snowfall events in Kashmirin November 2018 and November 2019, as well as looked into the consequences they have had onapple orchards in the valley. The orchard areas in south Kashmir have been affected most by theerratic snowfall in 2018 and 2019, with the latter being more intense and hence resulting in colossaldamage to the apple production in the valley. Noteworthy, the occurrence of these two recent eventsis in line with a general tendency for the more frequent occurrence of extreme weather events overKashmir [46,47]. Whereas the Department of Horticulture estimated losses after the November 2018snowfall at INR 5 billion (https://bit.ly/2TDATpR), damage observed following the November 2019snowfall was more pronounced and resulted in the losses amounting to INR 22.5 billion (or c. US$302million; https://bit.ly/3aJxmvN). Even if meteorological records are lacking to confirm the statement,reports suggest that the 2019 snowfall was the heaviest that Kashmir experienced over the past sixdecades, claiming 7 lives (https://bit.ly/2wInowb) and damaged power infrastructure worth INR220 million (or c. US$2.95 billion; https://bit.ly/2TG99Rj). Historical precipitation data from IndiaMeteorological Department (IMD) also point to a consistent increase in precipitation totals across thevalley, and are thus in line with what is projected to occur in the Kashmir Region by the end of thiscentury [23].
The horticultural sector of the Kashmir Valley, dominated by apple orchard, contributes 27% (INR50 billion or US$670 million) to the economy of Jammu and Kashmir [48], and the government iscontemplating to strengthen the sector further. This study indicates that of the total area of 1330 km2
under apple orchards in Kashmir Valley, more than half of orchards (56%) are located in south Kashmir.
Sustainability 2020, 12, 9206 10 of 14
Given the stark promotion of the horticultural sector, massive areas under irrigation-intensive ricepaddy currently undergo conversion to seemingly more viable apple orchards [49–52]. However,we argue that the ever-increasing area under orchards may well become unsustainable in economic(but also in environmental) terms given the challenges of changing climate [31,53] and the relatedexacerbation of extreme weather events. In addition, a massive increase of orchards could ultimatelyresult in serious health repercussions [54] as a result of the reckless use of pesticides [55]. While thechanging climate may shift the flowering patterns of apples in the long term [56–58], the erratic snowfallevents like those of 2018 and 2019 have already resulted in unprecedented losses that have beenaffecting local economy seriously (Figures S4 and S5). Any further developments in the horticulturalsector should thus be studied carefully using state-of-the-art scientific approaches to consider whetherthe promotion of horticulture in Kashmir will be socio-economically and ecologically viable in thelong run.
Analyzing data made available by the Department of Horticulture, we find that the November 2018snowfall damaged 35% of the orchards in Kashmir Valley. Data for the November 2019 snow episodehas not been made available yet, but it is highly likely that damage will be more pronounced than the2018 erratic snowfall event. This assumption is supported by information from the Kashmir ValleyFruit Growers cum Dealers Union who estimated that a stunning 80% of the fruit plants of all orchardsof the Kashmir Valley were uprooted during the November 2019 snowfall (https://bit.ly/2TItfKR).
Analysis of ERA-5 reanalysis datasets suggest that the November 2018 and 2019 snowfalls wereformed after a trough (i.e., a low-pressure system) developed with the arrival of a WD. Weather in Kashmirwas influenced further by a cyclonic circulation that developed south of Jammu-Kashmir, as well as theintrusion of cold air masses from northern latitudes. The situation was especially intense in November2019. Whereas the influence of WD on winter precipitation and snowfall over the Himalaya [59,60]including the Kashmir Region [40,61] is pronounced, it is more so the early arrival of the snowfallepisodes in November 2018 and 2019 that made these two events special. Although snowfall linked toWDs normally occur in Kashmir between November and April, large intense events are rare in the earlyseason and normally occur in February and March [40]. According to the records and our observation,the large snowfall events in the first weeks of November 2018 and 2019 can be considered anomaliesbased on existing records [39]. Some existing studies suggest that the occurrence of WD is increasingunder current conditions already in winter [39], and that the frequency of WDs may increase furtherunder climate change [62], resulting in increased winter snow precipitation [42]. Other studies, however,have found a decreasing or unchanged trend of WD over the last decades [63,64]. While it was notthe goal of this study to identify changes in the occurrence of WD situations, we find that the earlierarrival of WD in early winter—along with cold temperatures arriving from northern latitudes and theadvection of moisture from the still-warm Arabian Sea—indeed pose a serious threat to the agricultureand horticulture sectors in the region, even more so should the incidence of such early-season eventsbecome more frequent. We, therefore, call for research on intra-seasonal changes of WD occurrences ormore reliable indicators to predict these events [34] to mitigate further economic losses in the agriculturalsectors and possibly by diversifying (cash) crops with more and more resilient species.
5. Conclusions
The untimely and extreme weather patterns over Kashmir in recent years have not only impactedecosystems but also severely dented the economic sectors. Over the past few years, Kashmir Valleywitnessed two such erratic snowfall events in late autumn 2018 and 2019—both events destroyed appleorchards across the valley. This assumes importance since the government is contemplating to expandthe horticulture sector from INR 60 billion to 300 billion. As a result of recent losses and to boost theproduction of apple, government has recently introduced a highly-subsidized High Density ApplePlantation (HDAP) scheme with plant protection mechanism (like anti-hail nets and trellis systemcomprising of metallic/wooden stakes and wiring). This set up minimizes damage to the apple trees incase of heavy snowfall and is getting popular among the apple orchardists of Kashmir. However, many
Sustainability 2020, 12, 9206 11 of 14
experts fear that the HDAP might altogether wipe out local apple cultivars in this highly competitivebusiness, with negative impacts on local varieties and diversity of species.
Using data from multiple sources (remote sensing, ERA-5 reanalysis, field data, and ancillaryinformation), we characterize the two erratic snowfall events to conclude that the snow depths recordedduring the November 2019 snowfall were not only larger (mean snow depth = 47 cm) than duringthe November 2018 event (mean snow depth = 26 cm), but that the most recent event on record wasprobably also unique in terms of magnitude and timing over the last 60 or so years. The installation ofsnow gauges at all IMD-managed weather observatories are critically needed to get credible baselinedata on snowfall in the region and on event-specific snowfall patterns, not only to inform policy butalso to facilitate the decision makers with scientifically sound information.
Supplementary Materials: The following are available online at http://www.mdpi.com/2071-1050/12/21/9206/s1,Figure S1: Figure S1: (a) November 2018 snow extent and (b) November 2019 snow extent as observed fromSentinel 2A and Landsat satellites, Figure S2: Left column: Temporal evolution of the cloud as observed byINSAT-3D imagery for 0000UTC for 2nd, 3rd, and 4th, November 2018. Right column: ERA-5 derived upper-levelwinds at the same moment, Figure S3: Left column: temporal evolution of the cloud as observed by INSAT-3Dimagery for 0000UTC of 6th and 7th November 2019. Right column: ERA-5 derived upper-level winds at thesame moment, Figure S4: Field photographs showing damages to the Apple orchards in the snowfall eventsof 2018 and 2019, and Figure S5: Field photographs showing damage caused by untimely snowfall to the fruitduring harvesting. Table S1: Field-measured snow depth for 2018 and 2019 November snowfall events, Table S2:District-wise area under orchards in Kashmir Valley, and Table S3: Zone-wise orchards area of Kashmir Valley.
Author Contributions: Conceptualization, I.R., U.M. and J.A.B.C.; methodology, I.R., U.M., S.A., J.A.B.C.; software,I.R., U.M., S.A., J.A.B.C.; validation, I.R., U.M., S.A., J.A.B.C.; formal analysis, I.R., U.M., S.A., J.A.B.C.; investigation,I.R., U.M., S.A., J.A.B.C.; resources, I.R., U.M., J.A.B.C., N.A.N., I.A.B., S.L.; data curation, I.R., U.M., J.A.B.C.,N.A.N., I.A.B., S.L.; writing—original draft preparation, I.R., U.M.; writing—review and editing, I.R., U.M.,J.A.B.C., M.S.; visualization, I.R., U.M., J.A.B.C.; supervision, I.R., J.A.B.C.; project administration, I.R. All authorshave read and agreed to the published version of the manuscript.
Funding: This research received no external funding
Acknowledgments: The authors express gratitude to United States Geological Survey (USGS) for freely hostingthe Sentinel and Landsat satellite data used in this analysis. The authors are grateful to European Centre forMedium-Range Weather Forecasts (ECMWF) for freely providing the reanalysis data. The authors acknowledgethe Directorate of Horticulture, Kashmir, for providing the horticulture damage data analyzed in this study.The second author also acknowledges the support of Department of Science and Technology, Government of India(DST, GoI) for the INSPIRE fellowship (Grant Number: IF180682) for pursuing Ph.D. The suggestions from thetwo anonymous reviewers helped in improving the manuscript content and structure.
Conflicts of Interest: The authors declare no conflict of interest.
References
1. Nandargi, S.; Dhar, O.N. Extreme rainfall events over the Himalayas between 1871 and 2007. Hydrol. Sci. J.2011, 56, 930–945. [CrossRef]
2. Immerzeel, W.W.; Droogers, P.; de Jong, S.M.; Bierkens, M.F.P. Large-Scale monitoring of snow cover andrunoff simulation in Himalayan river basins using remote sensing. Remote Sens. Environ. 2009, 113, 40–49.[CrossRef]
3. Dar, R.A.; Rashid, I.; Romshoo, S.A.; Marazi, A. Sustainability of winter tourism in a changing climate overKashmir Himalaya. Environ. Monit. Assess. 2014, 186, 2549–2562. [CrossRef] [PubMed]
4. Gurung, D.R.; Maharjan, S.B.; Shrestha, A.B.; Shrestha, M.S.; Bajracharya, S.R.; Murthy, M.S.R. Climateand topographic controls on snow cover dynamics in the Hindu Kush Himalaya. Int. J. Climatol. 2017, 37,3873–3882. [CrossRef]
5. Bolch, T.; Kulkarni, A.; Kääb, A.; Huggel, C.; Paul, F.; Cogley, J.G.; Frey, H.; Kargel, J.S.; Fujita, K.; Scheel, M.;et al. The state and fate of Himalayan glaciers. Science 2012, 336, 310–314. [CrossRef]
6. Rashid, I.; Majeed, U. Recent recession and potential future lake formation on Drang Drung glacier, ZanskarHimalaya, as assessed with earth observation data and glacier modelling. Environ. Earth Sci. 2018, 77, 429.[CrossRef]
Sustainability 2020, 12, 9206 12 of 14
7. Ballesteros-Cánovas, J.A.; Trappmann, D.; Madrigal-González, J.; Eckert, N.; Stoffel, M. Climate warmingenhances snow avalanche risk in the Western Himalayas. Proc. Natl. Acad. Sci. USA 2018, 115, 3410–3415.[CrossRef]
8. Veh, G.; Korup, O.; Walz, A. Hazard from Himalayan glacier lake outburst floods. Proc. Natl. Acad. Sci. USA2020, 117, 907–912. [CrossRef]
9. Chaturvedi, R.K.; Gopalakrishnan, R.; Jayaraman, M.; Bala, G.; Joshi, N.V.; Sukumar, R.; Ravindranath, N.H.Impact of climate change on Indian forests: A dynamic vegetation modeling approach. Mitig. Adapt. Strateg.Glob. Chang. 2011, 16, 119–142. [CrossRef]
10. Gottfried, M.; Pauli, H.; Futschik, A.; Akhalkatsi, M.; Barancok, P.; Benito Alonso, J.L.; Coldea, G.; Dick, J.;Erschbamer, B.; Fernández Calzado, M.R.; et al. Continent-Wide response of mountain vegetation to climatechange. Nat. Clim. Chang. 2012, 2, 111–115. [CrossRef]
11. Hamududu, B.; Killingtveit, A. Assessing climate change impacts on global hydropower. Energies 2012, 5,305–322. [CrossRef]
12. Kumar, D.; Katoch, S.S. Environmental sustainability of run of the river hydropower projects: A study fromwestern Himalayan region of India. Renew. Energy 2016, 93, 599–607. [CrossRef]
13. Nyaupane, G.P.; Chhetri, N. Vulnerability to climate change of nature-based tourism in the NepaleseHimalayas. Tour. Geogr. 2009, 11, 95–119. [CrossRef]
14. Nepal, S.K. Mountain tourism and climate change: Implications for the Nepal Himalaya. Nepal Tour. Dev.Rev. 2013, 1, 1–14. [CrossRef]
15. Xu, J.; Grumbine, R.E.; Shrestha, A.; Eriksson, M.; Yang, X.; Wang, Y.U.N.; Wilkes, A. The melting Himalayas:Cascading effects of climate change on water, biodiversity, and livelihoods. Conserv. Biol. 2009, 23, 520–530.[CrossRef]
16. Sujakhu, N.M.; Ranjitkar, S.; He, J.; Schmidt-Vogt, D.; Su, Y.; Xu, J. Assessing the livelihood vulnerability ofrural indigenous households to climate changes in Central Nepal, Himalaya. Sustainability 2019, 11, 2977.[CrossRef]
17. Nüsser, M.; Dame, J.; Parveen, S.; Kraus, B.; Baghel, R.; Schmidt, S. Cryosphere-Fed irrigation networks inthe northwestern himalaya: Precarious livelihoods and adaptation strategies under the impact of climatechange. Mt. Res. Dev. 2019, 39, R1–R11. [CrossRef]
18. Kamil, S.; Almazroui, M.; Kang, I.S.; Hanif, M.; Kucharski, F.; Abid, M.A.; Saeed, F. Long-Term ENSOrelationship to precipitation and storm frequency over western Himalaya–Karakoram–Hindukush regionduring the winter season. Clim. Dyn. 2019, 53, 5265–5278. [CrossRef]
19. Das, L.; Meher, J.K. Drivers of climate over the Western Himalayan region of India: A review. Earth Sci. Rev.2019, 198, 102935. [CrossRef]
20. Rafiq, M.; Mishra, A.K. A study of heavy snowfall in Kashmir, India in January 2017. Weather 2018, 73, 15–17.[CrossRef]
21. Romshoo, S.A.; Altaf, S.; Rashid, I.; Ahmad Dar, R. Climatic, geomorphic and anthropogenic drivers of the2014 extreme flooding in the Jhelum basin of Kashmir, India. Geomat. Nat. Hazards Risk 2018, 9, 224–248.[CrossRef]
22. Para, J.A.; Kesarkar, A.; Bhate, J.; Singh, V.; Panchal, A.; Munsi, A.; Shivamurthy, Y.; Lotus, S.; Ahmad, N.;Sheikh, J.A. Large-Scale dynamics of western disturbances caused extreme precipitation on 24–27 January2017 over Jammu and Kashmir, India. Model. Earth Syst. Environ. 2020, 6, 99–107. [CrossRef]
23. Gujree, I.; Wani, I.; Muslim, M.; Farooq, M.; Meraj, G. Evaluating the variability and trends in extreme climateevents in the Kashmir Valley using PRECIS RCM simulations. Model. Earth Syst. Environ. 2017, 3, 1647–1662.[CrossRef]
24. World Bank. Jhelum and Tawi Flood Recovery Project: Environment and Social Management Framework; WorldBank: Washington, DC, USA, 2015; p. 110.
25. Ballesteros-Cánovas, J.A.; Koul, T.; Bashir, A.; del Pozo, J.M.B.; Allen, S.; Guillet, S.; Rashid, I.; Alamgir, S.H.;Shah, M.; Bhat, M.S.; et al. Recent flood hazards in Kashmir put into context with millennium-long historicaland tree-ring records. Sci. Total Environ. 2020, 722, 137875. [CrossRef] [PubMed]
26. Prakash, S.; Giri, R.; Kumar, R. An analysis of western disturbance during 17th to 21st february 2005 overwestern Himalayan region. Invertis J. Sci. Technol. 2012, 5, 45–53.
Sustainability 2020, 12, 9206 13 of 14
27. Mushtaq, H.; Rehman, S.; Margoob, M.A. Understanding long term community psychosocial needs ofchildren and adolescent survivors of a natural disaster: One decade after 2005, ’Snow-Tsunami’ in Kashmir.JK Pract. 2017, 22, 1–5. [CrossRef]
28. Bagnouls, F. Bioclimatic Types of South-East Asia; Institute Francais de Pondichery: Pondicherry, India, 1959.29. Rashid, I.; Parray, A.A.; Romshoo, S.A. Evaluating the performance of remotely sensed precipitation estimates
against in-situ observations during the september 2014 mega-flood in the Kashmir Valley. Asia Pac. J. Atmos.Sci. 2019, 55, 209–219. [CrossRef]
30. Ray, K.; Bhan, S.C.; Bandopadhyay, B.K. The catastrophe over Jammu and Kashmir in september 2014:A meteorological observational analysis. Curr. Sci. 2015, 109, 580–591.
31. Rashid, I.; Romshoo, S.A.; Chaturvedi, R.K.; Ravindranath, N.H.; Sukumar, R.; Jayaraman, M.; Lakshmi, T.V.;Sharma, J. Projected climate change impacts on vegetation distribution over Kashmir Himalayas. Clim. Chang.2015, 132, 601–613. [CrossRef]
32. Rashid, I.; Romshoo, S.A.; Abdullah, T. The recent deglaciation of Kolahoi valley in Kashmir Himalaya, Indiain response to the changing climate. J. Asian Earth Sci. 2017, 138, 38–50. [CrossRef]
33. Dimri, A.P.; Niyogi, D.; Barros, A.P.; Ridley, J.; Mohanty, U.C.; Yasunari, T.; Sikka, D.R. Western disturbances:A review. Rev. Geophys. 2015, 53, 225–246. [CrossRef]
34. Hunt, K.M.R.; Turner, A.G.; Shaffrey, L.C. The evolution, seasonality and impacts of western disturbances.Q. J. R. Meteorol. Soc. 2018, 144, 278–290. [CrossRef]
35. Lang, T.J.; Barros, A.P. Winter storms in the central Himalayas. J. Meteorol. Soc. Jpn. 2004, 82, 829–844. [CrossRef]36. Schiemann, R.; Lüthi, D.; Schär, C. Seasonality and interannual variability of the westerley jet in the Tibetan
Plateau region. J. Clim. 2009, 22, 2940–2957. [CrossRef]37. Lone, A.; Achyuthan, H.; Chakraborty, S.; Metya, A.; Datye, A.; Kriplani, R.H.; Fousiya, A.A. Controls on
the isotopic composition of daily precipitation characterized by dual moisture transport pathways at themonsoonal margin region of North-Western India. J. Hydrol. 2020, 588, 125106. [CrossRef]
38. Nandargi, S.; Dhar, O.N. Extreme rainstorm events over the northwest Himalayas during 1875–2010. J. Hydrometeorol.2012, 13, 1383–1388. [CrossRef]
39. Kumar, N.; Yadav, B.P.; Gahlot, S.; Singh, M. Winter frequency of western disturbances and precipitationindices over Himachal Pradesh, India: 1977–2007. Atmosfera 2015, 28, 63–70. [CrossRef]
40. Dimri, A.P.; Mohanty, U.C. Snowfall statistics of some SASE field stations in J&K. Def. Sci. J. 1999, 49, 437–445.41. Dimri, A.P.; Chevuturi, A. Model sensitivity analysis study for western disturbances over the Himalayas.
Meteorol. Atmos. Phys. 2014, 123, 155–180. [CrossRef]42. Ridley, J.; Wiltshire, A.; Mathison, C. More frequent occurrence of westerly disturbances in Karakoram up to
2100. Sci. Total Environ. 2013, 468–469, S31–S35. [CrossRef] [PubMed]43. Oliver, M.A.; Webster, R. Kriging: A method of interpolation for geographical information systems. Int. J.
Geogr. Inf. Syst. 1990, 4, 313–332. [CrossRef]44. McGrath, D.; Zhang, C.; Carton, O.T. Geostatistical analyses and hazard assessment on soil lead in Silvermines
area, Ireland. Environ. Pollut. 2004, 127, 239–248. [CrossRef]45. Hersbach, H.; Bell, B.; Berrisford, P.; Hirahara, S.; Horányi, A.; Muñoz-Sabater, J.; Nicolas, J.; Peubey, C.;
Radu, R.; Schepers, D.; et al. The ERA5 global reanalysis. Q. J. R. Meteorol. Soc. 2020, 146, 1999–2049. [CrossRef]46. De, U.S.; Dube, R.K.; Rao, G.S.P. Extreme weather events over India in the last 100 years. J. Ind. Geophys.
Union 2005, 9, 173–187.47. Shekhar, M.S.; Devi, U.; Paul, S.; Singh, G.P.; Singh, A. Analysis of trends in extreme precipitation events over
Western Himalaya Region: Intensity and duration wise study. J. Indian Geophys. Union 2017, 21, 223–229.48. Rasool, R.; Shafiq, M.; Ahmed, P.; Ahmad, P. An analysis of climatic and human induced determinants of
agricultural land use changes in Shupiyan area of Jammu and Kashmir state, India. GeoJournal 2018, 83,49–60. [CrossRef]
49. Rashid, I.; Romshoo, S.A. Impact of anthropogenic activities on water quality of Lidder River in KashmirHimalayas. Environ. Monit. Assess. 2013, 185, 4705–4719. [CrossRef]
50. Rather, M.I.; Rashid, I.; Shahi, N.; Murtaza, K.O.; Hassan, K.; Yousuf, A.R.; Romshoo, S.A. Massive landsystem changes impact water quality of the Jhelum River in Kashmir Himalaya. Environ. Monit. Assess.2016, 188, 1–20. [CrossRef] [PubMed]
51. Rashid, I.; Bhat, M.A.; Romshoo, S.A. Assessing changes in the above ground biomass and carbon stocks ofLidder valley, Kashmir Himalaya, India. Geocarto Int. 2017, 32, 717–734. [CrossRef]

Sustainability 2020, 12, 9206 14 of 14
52. Rashid, I.; Majeed, U.; Aneaus, S.; Pelto, M. Linking the recent glacier retreat and depleting streamflowpatterns with land system changes in Kashmir himalaya, India. Water 2020, 12, 1168. [CrossRef]
53. Romshoo, S.A.; Bashir, J.; Rashid, I. Twenty-First century-end climate scenario of Jammu and KashmirHimalaya, India, using ensemble climate models. Clim. Chang. 2020, 1–19. [CrossRef]
54. Bhat, A.R.; Wani, M.A.; Kirmani, A.R.; Raina, T.H. Pesticides and brain cancer linked in orchard farmers ofKashmir. Indian J. Med. Paediatr. Oncol. 2010, 31, 110–120. [CrossRef]
55. Bhat, A.R.; Wani, M.A.; Kirmani, A.R. Brain cancer and pesticide relationship inorchard farmers of kashmir.Indian J. Occup. Environ. Med. 2010, 14, 78–86. [CrossRef]
56. Rana, R.S.; Bhagat, R.M.; Kalia, V. Impact of climate change on apple crop in Himachal Pradesh. J. Agrometeorol.2011, 13, 97–103.
57. Kuniyal, C.P. Climate change is affecting apple cultivation in Himachal Pradesh. Curr. Sci. 2014, 106, 498–499.58. Basannagari, B.; Kala, C.P. Climate change and apple farming in Indian Himalayas: A study of local perceptions
and responses. PLoS ONE 2013, 8, e77976. [CrossRef]59. Cannon, F.; Carvalho, L.M.V.; Jones, C.; Bookhagen, B. Multi-Annual variations in winter westerly disturbance
activity affecting the Himalaya. Clim. Dyn. 2015, 44, 441–455. [CrossRef]60. Dimri, A.P.; Chevuturi, A.; Dimri, A.P.; Chevuturi, A. Western disturbances—Structure. In Western Disturbances—
An Indian Meteorological Perspective; Springer International Publishing: Cham, Switzerland, 2016; pp. 1–26.61. Kumar, V.; Jain, S.K. Trends in seasonal and annual rainfall and rainy days in Kashmir Valley in the last
century. Quat. Int. 2010, 212, 64–69. [CrossRef]62. Madhura, R.K.; Krishnan, R.; Revadekar, J.V.; Mujumdar, M.; Goswami, B.N. Changes in western disturbances
over the Western Himalayas in a warming environment. Clim. Dyn. 2014, 44, 1157–1168. [CrossRef]63. Das, S.; Singh, S.; Rajagopal, E.N.; Gall, R. Mesoscale modeling for mountain weather forecasting over the
Himalayas. Bull. Am. Meteorol. Soc. 2003, 84, 1237–1244. [CrossRef]64. Shekhar, M.S.; Chand, H.; Kumar, S.; Srinivasan, K.; Ganju, A. Climate-Change studies in the western
Himalaya. Ann. Glaciol. 2010, 51, 105–112. [CrossRef]
Publisher’s Note: MDPI stays neutral with regard to jurisdictional claims in published maps and institutionalaffiliations.
© 2020 by the authors. Licensee MDPI, Basel, Switzerland. This article is an open accessarticle distributed under the terms and conditions of the Creative Commons Attribution(CC BY) license (http://creativecommons.org/licenses/by/4.0/).