Impact Study on development of Agriculture and Allied activities
639
-
Upload
khangminh22 -
Category
Documents
-
view
1 -
download
0
Transcript of Impact Study on development of Agriculture and Allied activities


C O N T E N T S
Sl. No. ITEM Page No.
1 Chapter One
Executive Summary
1
2 Chapter Two –
Historical Background and Objectives of Krishi Vigyan Kendra [K.V.K.] Programme and its Present Status in Madhya Pradesh
41
3 Chapter Three –
Frame and Methodology of the Study
46
4 Chapter Four –
Krishi Vigyan Kendra, Bhopal
50
5 Chapter Five
Krishi Vigyan Kendra, Indore
164
6 Chapter Six
Krishi Vigyan Kendra, Chhindwada
263
7 Chapter Seven
Krishi Vigyan Kendra, Satna
360
8 Chapter Eight
Krishi Vigyan Kendra, Shahdol
442
9 Chapter Nine
Krishi Vigyan Kendra, Tikamgarh
523
10 Chapter Ten
The Wrap-Up
602
11 Chapter Eleven
The Recommendation
623
12 Addendum 628

Chapter – One Executive Summary
1.1 The agriculture sector forms the backbone of Nation’s economy. Since the percentage of workers
engaged in agriculture to total workers is 58.80, any attempt to growth with social justice shall have to keep the agriculture on priority list.
[Para, 2.1] 1.2 Since the initial years of economic planning, particularly from the Third Plan onwards,
agriculture remained the prime agenda of planners. With the advent of new technologies in the field of agriculture, it was felt necessary to come out with package of programme to boost agriculture output to desired levels. The best way, thus perceived was to take technological advancement to farming communities in the form of packages of basic agriculture inputs. This is where the concept of constituting Krishi Vigyan Kendras took roots in the sensibilities of agriculture experts, that, in subsequent years, took deeper roots.
[Para, 2.4] 1.3 Consequent upon the recommendations of Education Commission [1964-66], the Indian Council
of Agriculture Research [I.C.A.R.], Government of India, finally mooted the idea of establishing Krishi Vigyan Kendras [Agriculture Science Centres] as innovative institutions for imparting vocational training to the practicing farmers, school drop-outs and the field level extension functionaries with the following basic suggestions of:-
- Accelerating production relating to agriculture and its allied sectors in the operational
area of Kendra. - Experiential learning, i.e., “teaching by doing” and “learning by doing” should be the
principal methods of imparting training. - The benefits of training should reach to the poorest of the poor sections of the
community for raising their living conditions. [Para 2.5, 2.6]
1.4 During Eighth Plan period the mandates of the K.V.K. was revised as detailed below:-
- Conducting “On Farm Testing” for identifying technologies in terms of location specific sustainable land-use systems.
- Organising training to up-date the knowledge of extension personnel regarding latest development in agriculture field on regular basis.
- Organising short and long run vocational courses in agriculture and allied vocations for farmers and rural youth with emphasis on learning by doing for higher productivity and generating self employment.
- Organising “Front Line Demonstrations” on various crops to generate production data and their information.
[Para, 2.7] 1.5 In order to achieve the above mandates, the broad Objectives of the K.V.Ks. are:-
- Demonstrate the latest agricultural technologies to the farmers as well as the extension workers of the State Departments of Agriculture/Horticulture/ Fisheries/Animal Husbandary/N.G.Os. with a view to reduce the time-lag between technology generation and its adoption.
- Impart training to practicing farmers/farm women/rural youth and field level extension functionaries by following the method of “teaching by doing” and “learning by doing”.
- Krishi Vigyan Kendras should have no uniform syllabus, the courses will vary according to the local requirements and specific needs of the targeted groups.

2
- The district being the operational area of K.V.K. may be covered in phased manner. - The training courses and other programmes of the Kendras should be in line with the
developmental programmes of the government. [Para, 2.8]
1.6 The basic objective of the K.V.K., therefore, is to carry the technological advancement
relating to agriculture to the farms in phased manner to enhance agriculture production through the techniques of vocational training, front line demonstration and on farm testing in spheres of agriculture and its allied sectors including the subjects like home science and training of rural youth for creating the avenue of self employment as well. The phased development of the district is supposed to be achieved by adopting limited number of villages for intensive efforts, the flow effects of which is supposed to influence the cluster group of villages around the periphery of the adopted villages.
[Para, 2.9] 1.7 The frame of the study is as follows:-
a. No. of K.V.K. 6 b. No. of Adopted Villages 3 x 6 = 18 c. No. of Cluster Villages 2 x 3 x 6 = 36 d. One Control Village from each K.V.K. 1 x 6 = 6 e. The total number of villages covered 60
[Para, 3.5] 1.8 The methodology consists of details of the schedule as given below:- VILLAGE SCHEDULE : This schedule has been canvassed to all the adopted villages [18],
cluster villages [36] and control villages [6]. [Para, 3.7] 1.9 HOUSE LISTING SCHEDULE : The information in this schedule has been collected from all
the 60 villages. [Para, 3.12] 1.10 HOUSEHOLD SCHEDULE : this schedule consists of 25 percent of the households taken from
House Listing Schedule. [Para, 3.14] 1.11 INDIVIDUAL QUESTIONNAIRE : This questionnaire consists of 25 percent of individuals
taken from Household Schedule.

3
KRISHI VIGYAN KENDRA, BHOPAL 1.12 Established in the year 1979, the K.V.K. is located in Nabibagh, Berasia Road area of capital city
of Bhopal. The institution is run under the supervision of Central Institute of Agriculture Engineering [C.I.A.E.], G.O.I. with Director as head of the institution. The farm area of the K.V.K. is 20 hectares, entirely cultivated and irrigated.
[Para, 4.8] 1.13 Regarding budget allocation, the K.V.K. receives an average allocation of Rs. 31.35 lakh per year
against which the average expenditure is around Rs. 29.21 lakh per annum. [Para, 4.10] RESULTS OF SURVEY – VILLAGE PARTICULARS 1.14 The total population of ten identified villages of K.V.K., Bhopal as per census, 2001 is 8778
constituting 2.59 percent to total rural population of district Bhopal. In all the ten identified villages the percentage of S.C. population is more than the S.T. population. The literacy rate that range between 52.60 percent in village Ratibad to 66.50 percent in village Kolukhedi is close to district percentage literacy level of 64.27 and state level of 64.11 percent.
[Para, 4.39] 1.15 The work participation rate that ranged between 24.10 percent for village Kolukhedi to 56.40
percent for village Ratibad, is, in general, more among males than females. The proportion of non-workers that ranged between 43.10 percent in village Manikhedi Kot to 75.90 percent in village Kolukhedi, presents a dismal picture as it shows higher number of dependent population.
[Para, 4.41] 1.16 In all the ten number of villages covered under the study, agriculture remains to be the main
occupation. The proportion of cultivators to main workers is more than that of agriculture labour with preponderance of male cultivators over females. In case of agriculture labour, a reverse trend is true.
[Para, 4.42, 4.43] 1.17 Regarding land-use the gross cropped area of identified ten number of villages is 83.59 percent
of the total geographical area of ten number of villages. As regards irrigation the percentage of gross irrigated area to gross cropped area is 37.18 for ten identified villages which is more than the district average of 33.19 percent and state average of 28.54 percent.
[Para 4.45, 4.46] 1.18 All the ten number of villages covered under the study are electrified with irregular power
supply situation having 1464 number of pump sets energized which is 8.65 percent to total number of pump sets energized in Bhopal district, that stands at 16,923 for the year 1999-2000.
[Para, 4.93] 1.19 The availability of the facility of road infrastructure in identified ten number of villages is
satisfactory as they have fair weather roads within the villages and also the link roads to all weather roads.
[Para, 4.93] 1.20 In all the identified ten villages the primary schools exist within the village limits. [Para, 4.93] 1.21 Against the total number of ten villages, 3 number of villages have Sub-Health Centres within
the village while 4 villages have Sub-Health-Centres within 5 km limit and 3 villages have this facility at a distance of more than 5 kms.
[Para, 4.93]

4
1.22 In all the ten number of sample villages one or the other drinking water source, mostly hand pumps is available.
[Para, 4.93] RESULTS OF SURVEY – HOUSEHOLD PARTICULARS MACRO DIMENSION 1.23 Information from all the 1245 households residing in 10 number of sample villages has been
collected with average size of the family of 7 persons. [Para, 4.94, 4.97] 1.24 There is preponderance of households from S.C. communities and O.B.Cs. that constitute 84.02
percent to total households. [Para, 4.99] 1.25 Against the total number of 1245 households, 1219 households belong to Hindu community
constituting 97.91 percent to total households. Only 26 families are following the muslim religion.
[Para, 4.101] 1.26 Agriculture is the main stay of the households residing in ten identified villages as 86.75 percent
of households are engaged directly in agriculture, as main occupation. [Para, 4.118] 1.27 Only 18 number of households from adopted and cluster group of villages constituting 1.45
percent to total number of households are engaged in livestock activities as source of main occupation.
[Para, 4.118] 1.28 Regarding average monthly income, 83.54 percent of the households are in the income range of
Rs. 1001.00 and above per-month which indicates the affluence level of the area. [Para, 4.118] RESULTS OF THE SURVEY – MICRO DIMENSION 1.29 In this part of the write-up 25 percent of the households, i.e. 314, have been taken for detailed
inquiry. [Para, 4.119] 1.30 Out of the total number of 1921 family members the males are 1044 [54.35 percent] while
females are 877 [45.65 percent]. [Para, 4.121] 1.31 The literacy percentage being 88.03 percent in sample area is amazingly high. The overall
educational scenario that emerges shows the absorption capacity of the people of the sample area to adopt latest technology regarding agriculture imparted by K.V.K.
[Para, 4.135] 1.32 The bulk of farming communities is from the category of farmers consisting of middle level and
big cultivators constituting 72.26 percent to total of 359 persons pursuing main occupations that denotes feasibility to implement various technology related to agriculture.
[Para, 4.135]
5
1.33 Regarding average monthly income 82.77 percent of family members are within the income range of Rs. 1001.00 and above per month which is obvious as most of the farmers are pursuing agriculture on viable manner.
[Para, 4.135] IMPACT OF K.V.K.–VOCATIONAL TRAINING–ADOPTED AND CLUSTER VILLAGES 1.34 Regarding yield per-hectare both for agronomical and horticultural crops the after training
situations as compared to before training conditions are better that clearly shows the positive impact of vocational training imparted by the K.V.K.
[Para, 4.189] 1.35 In case of crops like wheat, maize, gram, arhar, lentil, soybean and mustard the per-hectare
yield in after training situations is more than average productivity prevailing both at district and state levels. The impact of the K.V.Ks. effort, thus, is evident.
[Para, 4.189] 1.36 For important horticultural crops like tomato, brinjal and bhindi wherein the participation
rate is 10.69 percent, 11.24 percent and 7.25 percent respectively, the per-hectare yield in after training situations is more than those prevailing in before training conditions thus vouching the positive impact of K.V.Ks. efforts.
[Para, 4.189] 1.37 Livestock and dairying where the participation rate that ranged between 4.48 percent for
improved breeding practices to 8.97 percent for milk production need some more effort to enhance the participation of the villagers.
[Para, 4.189] 1.38 For home science activities the important constituents are preparation of pickles, bakery
items, making of papad/badi etc. where though participation is limited but the things are picking-up giving a promise of better performance.
[Para, 4.189] 1.39 Agro-forestry is yet another field where 32 number of households from six villages have
taken advantage of vocational training programme. [Para 4.189] 1.40 Regarding watershed activities, 38 number of households that comes to 13.10 percent to
total number of sample households have participated in the training relating to construction of soak-pits.
[Para, 4.189] IMPACT OF K.V.K. – FRONT LINE DEMONSTRATIONS – ADOPTED AND CLUSTER VILLAGES 1.41 Organisation of Front Line Demonstration has led to enhanced productivity in most of the
agriculture and horticulture crops in after training situations as compared to before training conditions which are positive impacts of the efforts of Bhopal K.V.K.
[Para, 4.219] 1.42 In cluster group of villages the performance is as good as adopted villages that shows the
efforts of agriculture scientists have percolated to such villages through various forward linkages.
[Para, 4.219]

6
1.43 For crops like wheat, gram, arhar, mustard and potato the number of front line demonstrations to the tune of 52,40,9,7 and 7 have been organised with per-hectare yields higher than those prevailing at district and state levels in after training situations.
[Para, 4.219] IMPACT OF K.V.K. – ON FARM TESTING 1.44 Regarding On Farm Testing also the per-hectare yield of all the agronomical and
horticulture crops is higher in after training conditions as compared to before training situations showing the positive impact of K.V.Ks. effort.
[Para, 4.241] 1.45 Major number of on farm testings have been organised for crops like wheat [14 numbers]
gram [10 numbers], soybean [20 numbers], tomato [2 numbers], brinjal [3 numbers] and agro-forestry [2 numbers] with per-hectare yield of most of the crops higher than those prevailing both at district and state levels.
[Para, 4.241] STATUS OF ACTIVITIES IN CONTROL VILLAGE – MANIKHEDI KOT 1.46 The study has identified one control village i.e. Manikhedi-Kot with 15 sample households and 90
sample family members where there is no intervention of K.V.K. In the following table comparative information regarding performance in control village and adopted and cluster villages has been shown.
[Para, 4.242]
Comparative Status of Performance Among Control Village and Adopted and Cluster Villages Sl. No.
Item Control Village Adopted and cluster villages (average)
Difference [+ or -] over col. 3
1 2 3 4 5 PER HECTARE YIELD – KG
CEREALS 1 Wheat 1971.00 2076.00 +105.00 2 Paddy 576.00 700.00 +124.00 3 Maize 1492.00 1975.00 +483.00 4 Jowar 596.00 1002.00 +406.00 PULSES 5 Gram 1059.00 1252.00 +193.00 6 Arhar 1115.00 1455.00 +340.00 7 Lentil 811.00 1003.00 +192.00 OIL SEEDS 8 Soybean 1127.00 1156.00 +29.00 9 Mustard 857.00 1216.00 +359.00 10 Linseed 457.00 - -
HORTICULTURE CROPS PER HECTARE YIELD – QUINTAL 11 Potato 100.00 181.00 +81.00 12 Onion - 151.67 - 13 Tomato - 178.44 - 14 Brinjal 100.00 197.00 +97.00 15 Chilly 160.00 201.00 +41 16 Bhindi 50.00 113.00 +63 17 Cucerbits - 127.75 - 18 Spices - - - 19 Papaya - 200.50 - 20 Citrus - 30.00 -

7
1.47 The conclusion that can be drawn from the above narration is that regarding agronomical
and horticulture crop productivity, the performance of adopted and cluster villages, where there is intervention of K.V.K. is better than the performance of control village that shows the positive impact of K.V.Ks. efforts over the crop production.
[Para, 4.256] RESULTS OF SURVEY – INDIVIDUAL PARTICULARS 1.48 The reactions of the 25 percent of individuals taken from the family members of the 25 percent households have been recorded. The table below shows the details;
Basic Details
Sl. No.
Item Total number of family members of 25% of households
25 % of individuals taken from 25% of households
1 2 3 4 1 Adopted Villages 761 188 2 Cluster Villages 1070 269 3 Control Village 90 23 Total 1921 480
[Para, 4.268] Individual Particulars - Adopted and Cluster Villagers 1.49 The criteria for selection of individuals are - the individual should be the adult member of the family, he should be associated with any programme of K.V.K., he should be literate – may be without having any formal education. These criteria are common for all the six K.V.Ks. covered under the study. [Para, 4.323] 1.50 The bulk of 360 individuals are from O.B.C. group that accounts for 78.77 percent to total number of 457 individuals. [Para, 4.323] 1.51 The cent-percent awareness about the services rendered by the K.V.K. is a positive indication. [Para, 4.323] 1.52 The regular contact of 98.47 percent of individuals is an achievement of K.V.K. [Para, 4.323] 1.53 Regarding level of satisfaction of individuals about the services of K.V.K., agronomy, home science, agro-forestry, watershed and horticulture are the areas of maximum satisfaction. [Para, 4.323] 1.54 Regarding impact of K.V.K. activities over income enhancement, 447 individuals, which is 97.81 percent to total of 457 individuals have reported agronomy as the main source of income enhancement. [Para, 4.323] 1.55 As regards continuance of the services of K.V.K., 444 individuals [96.16 percent to total of 457 individuals] have reported in favour of the continuance of the services rendered by the K.V.K. [Para, 4.323]

8
1.56 It is worth considering to incorporate in the mandate of the K.V.K., the subjects like production of by-products and development of marketing strategy of the products of the cultivators. [Para, 4.323] 1.57 Regarding impact of income enhancement, 84.63 percent, 96.72 percent and 38.07 percent individuals to total of 457 individuals respectively have reported positive impact over education, health status and housing conditions respectively. [Para, 4.323] INDIVIDUAL PARTICULARS – CONTROL VILLAGE 1.58 The majority of individuals i.e. 95.65 percent to total of 23 individuals are from the community of O.B.C. [Para, 4.340] 1.59 Regarding satisfaction level of per-hectare yield of agronomical and horticulture produce,
only 4.35 percent individuals are satisfied with the present level of per-hectare yield against the level of satisfaction of 96.28 percent individuals in case of adopted/cluster villages.
[Para, 4.340] 1.60 Regarding elementary level of education 56.62 percent individuals have reported that their
male wards attend the school while for female wards 47.83 percent individuals have reported for their school attendance.
[Para, 4.340] 1.61 A very satisfactory level of health scenario is existing in the control village. [Para, 4.340] 1.62 Regarding housing facilities, the individual of control village have shown interest in construction of semi pucca houses, pucca houses and separate cattle shed. [Para, 4.340]

9
KRISHI VIGYAN KENDRA, INDORE 1.63 Established in the year 1976, the K.V.K. is located in the Kasturbagram area of Indore. It is being
run by an N.G.O. headed by the Secretary of the Organisation as Chief of the K.V.K. having nine number of technical staff and six number of non-technical staff. The farm area of the K.V.K. is 20 hectares which is entirely cultivated with irrigated and unirrigated areas of 15 hects and 5 hects respectively. The K.V.K. has got no administrative building of its own.
[Para, 5.6] 1.64 The K.V.K. receives an average allocation of Rs. 22.51 lakh per year over the years 2001-2002 to
2003-2004 against which the average expenditure per-year is Rs. 17.06 lakh. [Para, 5.9] RESULTS OF SURVEY – VILLAGE PARTICULARS 1.65 The total population of ten identified villages of K.V.K., Indore, as per census, 2001 is 6139
which is 0.84 percent of the total rural population of district Indore. In villages like Indira Gram [adopted village], Bari Kalmer [cluster village], Jagjivan Gram [cluster village] and Nehru Van Gram [cluster village] the percentage of S.C. population is more than that of S.T. population while in rest of villages a reverse trend is prevailing. The literacy rate that ranged between 24.5 percent for village Menda – a predominantly tribal village, to 57.8 percent for village Bercha [control village] is lower than both district and state level per-centage literacy of 74.82 and 64.11 respectively.
[Para, 5.31] 1.66 The work participation rate that ranged between 44.9 percent for village Jagjeevan Gram to
61.4 percent for village Bari Kalmer [cluster village] with, more or less, similar participation rate between male and female is indicative of the awareness and intent of the female population residing in our area of study to contribute meaningfully towards household income. The proportion of non-workers that ranged between 38.6 percent for village Bari Kalmer [cluster village] to 55.1 percent for village Jagjeevan Gram [cluster village] presents a dismal picture as it shows the higher number of dependent population.
[Para, 5.33] 1.67 Agriculture remains to be the main occupation of the ten villages identified for the study. Out of
ten villages, in five number of villages viz. Indira Gram, Bari Kalmer, Nehru Van Gram, Mendal and Bercha, the proportion of female cultivators is more then that of male cultivators that signifies the awareness and intent of the female members of the farming community to work along with their male counterpart for addition in household income. Regarding proportion of agriculture labour to total workers, that ranged between 18..2 percent for village Mendal [cluster village] to 73.9 percent for village Bercha [control village], the involvement of female participation is more than males.
[Para, 5.35] 1.68 Regarding land-use the gross cropped area of the identified ten villages is 83.30 percent to total
geographical area. As regards irrigation, the percentage of gross area irrigated to gross cropped area is 54.23 for ten number of identified villages covered under the study which is more than the district average of 36.70 percent and state average of 28.54 percent.
[Para 5.40, 5.41] 1.69 All the villages covered under the study are electrified with irregular power supply situation. The
total number of pump-sets energized is 754 which is 1.71 percent to total number of 44132 pump sets energized in district, Indore in the year 1999-2000.
[Para, 5.44, 5.46]

10
1.70 The situation of availability of road network in the sample area of the study is not satisfactory as in non of the villages even the fair weather roads exist.
[Para, 5.83] 1.71 Every village has primary school within the physical limits of the village. [Para, 5.83] 1.72 Only in village Bari Kalmer [cluster village] Sub-Health Centre within the geographical limits
of the village exists, while in 8 number of villages [all from adopted and cluster groups] this facility is located within 5 km distance from the village.
[Para, 5.83] 1.73 In all the ten number of sample villages one or the other drinking water source, mostly hand
pumps is available. [Para, 5.83] RESULTS OF SURVEY – HOUSEHOLD PARTICULARS MACRO DIMENSION 1.74 The total number of household as per survey is 861 for all the ten identified villages with average
size of the family of seven persons. [Para, 5.87] 1.75 There is preponderance of S.C. and S.T. households, the combined percentage of which is 79.21
to total number of 861 households which underlines one important fact that vulnerable communities in our sample villages are pursuing the agriculture occupation on viable scale.
[Para, 5.89] 1.76 All the households in our area of study belong to Hindu religion. [Para, 5.91] 1.77 Agriculture remains to be the main occupation of the households of all the sample villages as out
of total number of 861 number of households 724 number of households constituting 84.09 percent to total households are engaged directly in agriculture as main occupation.
[Para, 5.93] 1.78 Only marginal number of 20 households [2.32 percent] are pursuing livestock activities as their
main occupation. [Para, 5.109] 1.79 Regarding average monthly income the combined number of households within the income range
of Rs. 901.00 to Rs. 1000.00 and Rs. 1001.00 and above per-month is 815 which is 94.66 percent to total households, indicating overall affluence level of the area.
[Para, 5.109] RESULTS OF THE SURVEY – MICRO DIMENSION 1.80 In this part of the write-up 25 percent of the households have been identified for the detailed
inquiry which comes to 214.. [Para, 5.110] 1.81 Out of the total number of 1185 number of family members from 214 households, males
constitute 52.74 percent while females constitute 47.26 percent. [Para, 5.112]

11
1.82 The literacy percentage against the total of 1185 persons is 67.08 which is lower than the district average of 74.82 percent but higher than state average of 64.11 percent as per census 2001. The overall educational status that emerges justifies the absorption capacity of the people of the sample area to adopt technology regarding agriculture introduced particularly by the K.V.K.
[Para, 5.114] 1.83 The bulk of farming community consists of farmers and small farmers constituting 79.85 percent
percent to total number of persons pursuing various main occupations that indicates the feasibility to implement various technology related to agriculture.
[Para, 5.134] 1.84 The near absence of activities relating to allied spheres of agriculture is not very uncommon in
our area of study, as generally in rural areas such activities, particularly animal rearing is pursued on a very limited scale.
[Para, 5.134] 1.85 Regarding average monthly income, 78.82 percent family members against the 1185 persons are
within the income range of Rs. 1001.00 and above per-month that shows the affluence level of the area to some extent.
[Para, 1.134] IMPACT OF K.V.K.–VOCATIONAL TRAINING – ADOPTED AND CLUSTER VILLAGES 1.86 Regarding the yield per-hectare for both agronomical and horticultural crops the
performance in after training situations is better than before training conditions that clearly shows the positive impact of vocational training imparted by the K.V.K.
[Para, 5.184] 1.87 In case of crops like wheat, maize, gram, arhar, lentil, soybean and mustard the per-hectare
yield in after training situations is more than the average productivity prevailing both at district and state levels. The impact of the K.V.Ks. effort, thus, is evident.
[Para, 5.184] 1.88 For important horticultural crops like potato, onion, tomato, brinjal and bhindi where the
participation rate is 9.14 percent, 5.08 percent, 15.74 percent, 12.69 percent and 9.64 percent households respectively, the per-hectare yield in after training situations is more than those prevailing in before training conditions, thus, indicating the positive impact of K.V.K.
[Para, 5.184] 1.89 A total of only 8 number of households have taken part in various activities relating to
livestock and dairying with hardly any performance in after training situations. [Para, 5.184] 1.90 For home science activities, the important constituents are preparation of pickles and
papad/badi/jam/jelly etc. wherein 96.45 percent and 75.63 percent households respectively have participated in vocational training with good performance in after training conditions.
[Para, 5.184] 1.91 No vocational trainings have been organised on subjects like poultry and fishery
development, training of rural youth, agro-forestry and watershed activities which are important functions from the view point of income augmentation in rural areas.
[Para, 5.184]

12
IMPACT OF K.V.K. – FRONT LINE DEMONSTRATIONS – ADOPTED AND CLUSTER VILLAGES 1.92 Front Line Demonstrations have lead to enhancement in productivity of most of
agronomical and horticulture crops in after training situations as compared to before training conditions which shows the positive impact of K.V.Ks. efforts.
[Para, 5.201] 1.93 For crops like wheat, maize, gram and soybean the number of front line demonstrations
organised are 33, 1, 12 and 23 respectively with per-hectare yield more than the productivity prevailing at district and state levels in after training situations.
[Para, 5.201] 1.94 Regarding horticultural crops like tomato, brinjal chilly, bhindi and cucerbits for which
12,8,3,1,1 number respectively of F.L.Ds. have been organised with better performance in after training situations leading to higher yield per-hectare in after training situations as compared to before training conditions.
[Para, 5.201] 1.95 Since no F.L.Ds. have been organised on subjects like livestock and dairying, poultry,
fishery development, agro-forestry, organic farming and watershed activities, the impact of F.L.D. for these subjects will not be visible.
[Para, 5.201] IMPACT OF K.V.K. – ON FARM TESTING – ADOPTED AND CLUSTER VILLAGES 1.96 In case of On Farm Testing [O.F.T.] also the per-hectare yield of all the agronomical and
horticultural crops is higher in after training conditions as compared to before training situations showing the positive impact of K.V.Ks. efforts.
[Para, 5.214] 1.97 The O.F.Ts. have been organised only in adopted villages where as a few O.F.Ts. should
have been organised in cluster villages also to have wider impact. [Para, 5.214] 1.98 No. O.F.Ts. have been organised for any of the horticulture crops which certainly shows the deficiency in performance. [Para, 5.214] 1.99 Since no O.F.Ts. have been organised on subjects like livestock and dairying, poultry,fishery development, agro-forestry, organic farming and watershed activities, the impact of O.F.T. relating to such subjects will not be visible. [Para, 5.214] STATUS OF ACTIVITIES IN CONTROL VILLAGE – BERCHA 1.100 The study has identified one control village i.e. Bercha with 17 number of sample households and
85 sample family members where there is no intervention of K.V.K. In the following table comparative information regarding performance in control village and adopted and cluster villages has been shown.
[Para, 5.215]

13
Comparative Status of Performance Among Control Village and Adopted and Cluster Villages Sl. No.
Item Control Village Adopted and cluster villages (average)
Difference [+ or -] over col. 3
1 2 3 4 5 PER HECTARE YIELD – KG
CEREALS 1 Wheat 3294.00 3993.22 (+) 699.22 2 Maize 1688.00 2344.00 (+) 656.00 3 Jowar 738.00 1806.75 (+) 1068.75 PULSES 4 Gram 1005.00 1093.89 (+) 88.89 5 Arhar 1038.00 1542.80 (+) 504.80 6 Lentil - 1005.00 - OIL SEEDS 7 Soybean 1091.00 1180.22 (+) 89.22 8 Mustard - 1700.00 -
HORTICULTURE CROPS – QUINTAL 9 Potato 197.00 284.50 (+) 87.50 10 Onion 197.00 261.67 (+) 64.67 11 Tomato 164.00 228.13 (+) 64.13 12 Brinjal 183.00 220.63 (+) 37.63 13 Chilly - 252.50 - 14 Bhindi 100.00 162.50 (+) 62.50 15 Cucerbits 85 - -
1.101 The information clearly shows the better performance in adopted and cluster villages with
interference of K.V.K. as compared to control village. For all crops, the per-hectare yields, due to training efforts of K.V.K. are more than the per-hectare yield of control village.
[Para, 5.216] RESULTS OF SURVEY – INDIVIDUAL PARTICULARS 1.102 The reactions of the 25 percent of individuals taken from the family members of the 25 percent households have been recorded. The table below shows the details;
Basic Details
Sl. No.
Item Total number of family members of 25% of households
25 % of individuals taken from 25% of households
1 2 3 4 1 Adopted Villages 359 91 2 Cluster Villages 741 184 3 Control Village 85 21 Total 1185 296
[Para, 5.219] Individual Particulars - Adopted and Cluster Villagers 1.103 The majority of 123 individuals are from the S.T. community that accounts for 44.73 percent to total of 275 individuals from adopted and cluster villages with cent-percent individuals as followers of Hindu religion. [Para, 5.278] 1.104 The cent-percent awareness of individuals about the services rendered by the K.V.K. is an important achievement. [Para, 5.278]

14
1.105 The absence of knowledge of sufficient number of individuals regarding F.L.D. and O.F.T. is some what discouraging. [Para, 5.278] 1.106 Regarding regular contact with K.V.K., the survey results show the regular contact of 71.64 percent individuals mainly because of desire for adopting new technology and for obtaining quality seed. [Para, 5.278] 1.107 Out of 275 individuals, 270 individuals have implemented the services of K.V.K. which is 98.18 percent to total respondents, which, in itself, is an achievement of K.V.K. 1.108 Home science, agronomy and horticulture are the subjects for which satisfaction level is
substantial. In subjects like animal husbandry, fishery, poultry, organic farming, watershed activities and training of rural youth the satisfaction level is nil, because of the basic fact that for these subjects no vocational training in tangible way has been imparted nor the F.L.Ds. or O.F.Ts. have been organised.
[Para, 5.278] 1.109 Cent-percent positive response regarding impact of K.V.K. services over income enhancement has been reported which is of credit to the various efforts of K.V.K. [Para, 5.278] 1.110 Out of 275 individuals, 268 individuals [97.45 percent] have reported for the continuance of
the services of K.V.K. particularly for subjects like agronomy and horticulture which again shows the positive impact of the services rendered by K.V.K.
[Para, 5.278] 1.111 Regarding suggestions for additional services to be rendered by K.V.K., the sample
individuals have given useful suggestions regarding introduction of production of by-products of crops and development of marketing strategy for fair return of the product for incorporation in the mandates of K.V.K.
[Para, 5.278] 1.112 Regarding impact of income enhancement, 76.63 percent, 95.64 percent, 43.27 percent individuals to total of 275 individuals respectively have reported positive impact over levels of education, health and housing conditions respectively. [Para, 5.278] INDIVIDUAL PARTICULARS – CONTROL VILLAGE 1.113 The majority of individuals i.e. 95.24 percent to total of 21 sample individuals are from S.T. community. Cent percent individuals are followers of Hindu religion. [Para, 5.294] 1.114 The cent-percent level of unawareness among sample individuals of control village about the
existence of K.V.K. is a matter of concern. [Para, 5.294] 1.115 Regarding satisfaction level of per-hectare yield of agronomical and horticultural crops, the
cent-percent individuals of control village have expressed their dissatisfaction with suggestions to organize training activities on water conservation methods, application of agriculture inputs and crop rotation.
[Para, 5.294]

15
1.116 Regarding elementary level of education 52.38 percent individuals have reported that their male wards attend the school, where as for female wards 61.90 percent individuals have reported in favour of school attendence. [Para, 5.294] 1.117 A very satisfactory level of health scenario is existing in control village wherein most of the basic health parameters, the percentage positive response is much higher than the responses from adopted and cluster villages. [Para, 5.294] 1.118 Hand pumps are the main source of drinking water in our control village where 95.24 percent individuals have reported for its existence. [Para, 5.294] 1.119 Regarding housing facilities, the individuals of control village have shown interest in constructing semi-pucca houses.

16
KRISHI VIGYAN KENDRA, CHHINDWARA 1.120 Established in the year 1983, the K.V.K. is located in the Chandangaon area of Chhindwara
district. The institution is being run under the overall control of Jawahar Lal Nehru Krishi Vishwa Vidyalaya [J.N.K.V.V.], Jabalpur with training organiser as head of the institute with 8 number of technical staff and 3 number of non-technical staff. The farm area of the K.V.K. is 20 hectares, entirely irrigated and cultivated. The K.V.K. has its own administrative building.
[Para, 6.9, 6.10] 1.121 Regarding budget provision, during the year 2003-2004 the K.V.K. has received an allocation of
Rs. 28.45 lakh with expenditure of entire amount. [Para, 6.15] RESULTS OF SURVEY – VILLAGE PARTICULARS 1.122 The total population of ten identified villages as per census, 2001 is 8029 which is 0.57 percent to
total rural population of district Chhindwara. Out of the ten identified villages, in seven number of villages viz. Moadai, Lahgurua, Omariya, Munga, Baranga, Oseria and Pipariya Birsa the percentage of S.T. population is much more than percentage of S.C. population. The literacy rate that ranged between 57.6 percent for village, Baranga [cluster village] to 86.6 percent for village Simriya Kalan [adopted village] is close to the district percentage literacy level of 66.03 and state percentage literacy level of 64.11, thus defying one of the fixed notions that areas with substantial tribal population usually have low literacy rate.
[Para, 6.37] 1.123 The work participation rate that ranged between 35.1 percent in village Baranga [cluster
village] to 56.1 percent for village Char-Gaon-Bhat [cluster village] is in general more among males than females except for village Omariya [cluster village] where a reverse trend is visible. For all the ten identified villages the proportion of female marginal workers is more than that of males which is rather obvious as the females do odd jobs in their spare time. Regarding non-workers that ranged between 43.9 percent in village Char-Gaon-Bhat [cluster village] to 64.9 percent in village Baranga [cluster village] presents a dismal picture as it shows higher percentage of dependent population.
[Para, 6.39] 1.124 Agriculture is the main occupation of the ten number of identified villages covered under the
study as the combined average percentage of cultivators and agriculture labour is 81.3 to total workers. In general the proportion of male cultivators to total workers is more than that of females except in village Simariyan Kalan where percentage of female cultivators is 60.4 as against 52.1 percent of male cultivators. In case of agriculture labour, the percentage of female participation, in general, is more than male participation, which, seems natural as in villages with substantial tribal population where the work culture among the females is very common, at times more than even males. The proportion of household workers to total workers is far from being satisfactory that ranged between 0.9 percent in village Omariya to 4.6 percent in village Munga. One of the important causes of rural poverty is absence of secondary occupation which give household income support particularly in an agrarian economy.
[Para, 6.41] 1.125 Regarding land-use the percentage of gross cropped area of the ten identified villages is 85.32
percent to total geographical area. As regards irrigation, the percentage of gross area irrigated to gross cropped area is 35.76 which is more than the district and state average figures of 22.51 percent and 28.54 percent respectively.
[Para, 6.87]

17
1.126 All the ten number of villages covered under the study are electrified with irregular power supply positions. The total number of pump sets energized is 482 which is 0.75 percent to total number of pump sets energized for district Chhindwara that stands at 64584 in the year 1999-2000.
[Para, 6.87] 1.127 The status of availability of road infrastructure in ten identified villages covered under the study
is satisfactory. [Para, 6.87] 1.128 With the exception of the village Char-Gaon-Bhat where the primary school is located at a
distance of 3 kms., in rest of nine number of villages the facility of primary school is available within the village periphery.
[Para, 6.87] 1.129 Though non of the villages have Sub-Health-Centres within the village limits, but is located
within reachable distance ranging between one to three kms. Similar is the situation with location of facility regarding Rural Family Welfare Centres.
[Para, 6.87] 1.130 In all the ten number of sample villages one or the other drinking water source, mostly hand
pumps are available. [Para, 6.87] RESULTS OF SURVEY – HOUSEHOLD PARTICULARS MACRO DIMENSION 1.131 The total number of household as on the date of the survey is 907 for all the ten number of
villages covered under the study with average family size of nine persons. [Para, 6.91] 1.132 There is preponderance of households from S.C., S.T. and O.B.C. communities that constitute
84.34 percent to total number of 907 households. [Para, 6.93] 1.133 Against the total of 907 households, 906 households are the followers of Hindu religion while
only one household is the follower of Muslim religion. [Para, 6.95] 1.134 Agriculture remains to be the main occupation of the households of all the sample villages as out
of total number of 907 households, 819 number of households are engaged directly in agriculture accounting for 90.30 percent to total number of households.
[Para, 6.98] 1.135 The complete absence of secondary sector activities among sample households is indicative of the
fact that inhabitants of the sample villages have to fall back on agriculture for earning livelihood which at times compel them to migrate to nearby areas having job opportunities.
[Para, 6.114] 1.136 The total number of households in the average monthly income range of Rs. 901.00 to Rs.
1001.00 and above is 896 which is 98.79 percent to total number of households indicating the affluence level of the area.
[Para, 6.114]

18
RESULTS OF THE SURVEY – MICRO DIMENSION 1.137 In this section of write-up, 25 percent of households have been identified for detailed enquiry
which comes to 224. [Para, 6.115] 1.138 Out of the total number of 1278 family members, the males are 663, constituting 51.88 percent to
total family members, while for females, this percentage is 48.12. [Para, 6.117] 1.139 The literacy percentage being 78.25 in the sample area is amazingly high that indicates the
absorption capacity of the individuals to adopt latest technology regarding agriculture imparted by the K.V.K.
[Para, 6.135] 1.140 The complete absence of occupations relating to activities allied to agriculture [as main
occupation] in our area of study is somewhat discouraging. [Para, 6.135] 1.141 Regarding average monthly income 81.22 percent family members are within the average
monthly income range of Rs. 1001.00 and above. [Para, 6.135] IMPACT OF K.V.K.–VOCATIONAL TRAINING – ADOPTED AND CLUSTER VILLAGES 1.142 Regarding the yield per-hectare for both agronomical and horticultural crops, the after
training status as compared to before training conditions are better that clearly shows the positive impact of vocational training imparted by K.V.K.
[Para, 6.189] 1.143 In case of crops like wheat, paddy, maize, gram, arhar, lentil, soybean, mustard and linseed
the per-hectare yield in after training situations is more than the average productivity prevailing both at district and state levels. The impact of the K.V.Ks. effort, thus, is evident.
[Para, 6.189] 1.144 For important horticultural crops like potato, tomato, and brinjal wherein 69.19 percent,
18.48 percent and 8.53 percent family representatives respectively have responded to the vocational training programmes, the per-hectare yield in after training conditions is better than before training situations.
[Para, 6.189] 1.145 The participation rate of villagers in the training courses related to livestock and dairying is
hardly meaningful which requires intensive efforts to popularize such activities. [Para, 6.189] 1.146 For home science, the important constituents are preparation of pickles and
papad/badi/jam/jelly etc. which have immense scope in our area of study. [Para, 6.189] 1.147 The activities like organic farming and bio-pesticides are getting popular in our area of
study as 18.01 percent and 3.79 percent households respectively have shown interest in such activities.
[Para, 6.189]

19
1.148 No vocational trainings have been organised for subjects like poultry, fishery, training of rural youth and watershed activities.
[Para, 6.189] IMPACT OF K.V.K. – FRONT LINE DEMONSTRATIONS – ADOPTED AND CLUSTER VILLAGES 1.149 Front Line Demonstrations organised in our area of study has lead to enhancement in
productivity of most of the agronomical and horticulture crops in after training situations as compared to before training conditions.
[Para, 6.207] 1.150 Regarding crops like wheat, gram, arhar, soybean the number of F.L.Ds. organised are
15,3,1 and 3 respectively with better performance in after training situations as compared to per-hectare yield prevailing both at district and state levels.
[Para, 6.207] 1.151 Regarding horticulture crops like potato, tomato, brinjal, chilly and papaya crops, very
marginal number of F.L.Ds. have been organised with very little tangible results. [Para, 6.207] 1.152 Since no F.L.Ds. have been organised on subjects like livestock and dairying, poultry,
fishery development, organic farming and watershed activities, the impact of F.L.D. on these subjects will not be visible.
[Para, 6.207] IMPACT OF K.V.K. – ON FARM TESTING – ADOPTED AND CLUSTER VILLAGES 1.153 In case of On Farm Testing [O.F.T.], the yield per hectare in after training situations is
more than before training conditions as has happened for both vocational training and front line demonstrations which shows the positive impact of K.V.Ks. efforts.
[Para, 6.215] 1.154 The overall performance regarding organizing O.F.Ts. is some what sketchy. Whatever
O.F.Ts. have been organised are mostly limited to only adopted villages, disregarding cluster villages which are the main forward linkages for adoption of agriculture related technology.
[Para, 6.215] STATUS OF ACTIVITIES IN CONTROL VILLAGE – PIPARIYA BIRSA 1.155 The study has identified one control village i.e. Pipariya Birsa with 14 number of households
and 71 number of sample family members where there is no intervention of K.V.K. In the following table comparative information regarding performance in control village and adopted and cluster villages has been shown;
[Para, 6.216]

20
Comparative Status of Performance Among Control Village and Adopted and Cluster Villages Sl. No.
Item Control Village Adopted and cluster villages (average)
Difference [+ or -] over col. 3
1 2 3 4 5 PER HECTARE YIELD – KG
CEREALS 1 Wheat 3850 4014 (+) 164 2 Paddy 2200 2433 (+) 233 3 Maize 2264 2287 (+) 23 4 Jowar 1045 1097 (+) 52 PULSES 5 Gram 1500 2087 (+) 587 6 Arhar 1200 1455 (+) 255 7 Lentil 750 761 (+) 11 OIL SEEDS 8 Soybean 1569 2198 (+) 629 9 Mustard 1000 1521 (+) 521 10 Linseed 1000 2486 (+) 1486
HORTICULTURE CROPS – QUINTAL 11 Potato 287 316 (+) 25 12 Onion 203 252 (+) 49 13 Tomato 219 228 (+) 9 14 Brinjal 240 247 (+) 7 15 Chilly 176 183 (+) 7 16 Bhindi 100 155 (+) 5 17 Cucerbits - 142 - 18 Spices 100 130 (+) 30 19 Papaya 120 198 (+) 78 20 Citrus - 148 -
1.156 The above table shows that except for the crops like wheat, paddy, gram, arhar, soybean,
mustard and linseed when the per-hectare yield for adopted and cluster villages is substantially high as compared to that prevailing in control village, for rest of the crops the difference in per-hectare yield is not much between adopted and cluster villages on one side and the control village on other side. This shows that district as a whole has conducive conditions for agricultural activities.
[Para, 6.217] RESULTS OF SURVEY – INDIVIDUAL PARTICULARS 1.157 The reactions of the 25 percent of individuals taken from the family members of the 25 percent households have been recorded. The table below shows the details;
Basic Details
Sl. No.
Item Total number of family members of 25% of households
25 % of individuals taken from 25% of households
1 2 3 4 1 Adopted Villages 464 116 2 Cluster Villages 743 185 3 Control Village 71 18 Total 1278 319
[Para, 6.220] Individual Particulars - Adopted and Cluster Villagers

21
1.158 The majority of 231 individuals are from the O.B.C. community that accounts for 76.74 percent to total of 301 individuals from adopted and cluster villages with cent percent individuals as followers of Hindu religion. [Para, 6.267] 1.159 The cent-percent awareness of individuals about the K.V.K. in terms of its location and more importantly the services rendered by it is an important achievement of K.V.K. [Para, 6.267] 1.160 Regarding regular contact with K.V.K., 78.41 percent individuals have regular contact because of desire for adopting new technology and for obtaining quality seed. [Para, 6.267] 1.161 Out of 301 individuals, 241 individuals have implemented the services of K.V.K. which is 80.07 percent to total respondents which in itself is an achievements of K.V.Ks. efforts. [Para, 6.267] 1.162 In the field of agronomy maximum number of 235 individuals [78.07 percent to total of 301 individuals] have implemented the improved techniques, followed by 25 individuals [8.31 percent] for organic farming and 4 individuals implementing the techniques regarding agro-forestry. [Para, 6.267] 1.163 Regarding subjects like animal husbandry, fishery, poultry and training of rural youth not
much implementation efforts have been made by sample individuals as for these activities vocational trainings have hardly been organised.
[Para, 6.267] 1.164 About 99 percent positive response regarding impact of K.V.K. services over income enhancement has been reported which is of credit to the efforts of K.V.K. in various fields of its operation. [Para, 6.267] 1.165 Out of 301 individuals, 296 individuals [98.34 percent] have reported for the continuance of
the services of K.V.K., particularly for subjects like agronomy and horticulture. [Para, 6.267] 1.166 Regarding suggestions for additional services to be rendered by K.V.K., the sample
individuals have given useful suggestions regarding introduction of production of by-products of crops and development of marketing strategy for fair return of the product for incorporation in the mandates of K.V.K.
[Para, 6.267] 1.167 Regarding impact of income enhancement, 92.36 percent, 96.01 percent and 40.53 percent individuals to total of 301 individuals respectively have reported positive impact over levels of education, health and housing conditions respectively. [Para, 6.267] INDIVIDUAL PARTICULARS – CONTROL VILLAGE 1.168 The majority of individuals i.e. 55.56 percent to total of 18 sample individuals are followers of Hindu religion. [Para, 6.294] 1.169 The cent-percent level of unawareness among sample individuals of control village about the
services rendered by the K.V.K. is a matter of concern. [Para, 6.294]

22
1.170 Regarding satisfaction level of per-hectare yield of agronomical and horticultural crops, the 17 number of individuals out of the total of 18 sample individuals have expressed their dissatisfaction with suggestions to organize training activities on water conservation methods and application of agriculture inputs.
[Para, 6.294] 1.171 Regarding elementary level of education, 50.00 percent individuals have reported their male wards attending the school, where as for female wards 38.89 percent individuals have reported in favour of school attendance. [Para, 6.294] 1.172 A very satisfactory level of health scenario is existing in control village wherein most of the basic health parameters, the percentage positive response is much higher than the responses from adopted and cluster villages. [Para, 6.294] 1.173 Hand pumps are the main source of drinking water in our control village where cent-percent individuals have reported for its existence. [Para, 6.294] 1.174 Regarding housing facilities, the individuals of control village have shown interest in constructing semi-pucca houses. [Para, 6.294]

23
KRISHI VIGYAN KENDRA, SATNA 1.175 Established in the year 1992, the K.V.K. is located in the Maghgawan Development Block of
Satna district. It is being run by an N.G.O. with Training Organiser as chief of the K.V.K. having nine number of technical staff and six number of non-technical staff. The farm area of the K.V.K. is 25 hect. Out of which 15 hectares are cultivated with 7 hectares of irrigated area. The K.V.K. has got the administrative building of its own.
[Para, 7.5] 1.176 The K.V.K. receives an average allocation of Rs. 51.41 lakh per-year over the years 2001-2002 to
2003-2004, against which the average expenditure per-year is 52.05 lakh. [Para, 7.8] RESULTS OF SURVEY – VILLAGE PARTICULARS 1.177 The total population of ten identified villages as per census, 2001 is 4121 which is 0.28 percent to
total rural population of district Satna. In all the ten identified villages the proportion of S.T. population is more than that of S.C. population. The literacy rate ranged between 28.9 percent for village Umariha to 68.8 percent for village Devlaha, not far below the district level percentage literacy of 65.12 and state level figure of 64.11. The The average size of the family is five persons.
[Para, 7.29] 1.178 The work participation rate that ranged between 32.6 percent for village Patni [cluster village]
to 55.06 percent for village Tangi [cluster village] with similar participation rate between male and female [with the exception of village Umariha and Patni] which is a positive indication showing awareness and intent of female population, residing in our sample area to contribute meaningfully towards household income. The proportion of non-workers that ranged between 50.4 percent for village Rahaniya [cluster village] to 71.1 percent for village Umariya [cluster village] presents a dismal picture as it shows larger extent of dependent population.
[Para, 7.31] 1.179 Agriculture remains to be the main occupation of the ten identified villages covered under the
study. The proportion of cultivators to total workers ranged between 20.00 percent for village Khodari [adopted village] to 91.7 percent for village Bhargawan [control village] with male participation usually more than females except for the villages Khodari [adopted village] and Devlaha [adopted village] where a reverse trend is true. In case of proportion of agriculture labour to total workers that ranged between 3.4 percent for village Bhargawan [control village] to 72.3 percent for village Rahaniya [cluster village] the involvement of female participation, in general, is more than that of males. The situation regarding proportion of workers in household industries to total workers is far from being satisfactory as it ranged between 0.2 percent for village Devlaha [adopted village] to 2.1 percent for village Patni [cluster village]. One of the important factors of rural poverty is absence of such occupations that encourage migration during lean season of agriculture.
[Para, 7.33,7.34,7.35] 1.180 Regarding land-use the gross cropped area of the ten identified villages is 2392 hectares which is
27.69 percent to total geographical area. As regards irrigation, the percentage of gross area irrigated to gross cropped area is 7.19 which is much less than district average of 23.27 percent and state average of 28.54 percent.
1.181 All the villages covered under the study are electrified with irregular power supply situation. The
total number of pump sets energized is 88 which is 0.43 percent to total number of 20375 pump sets energized in district Satna in the year 1999-2000.
[Para, 7.78]

24
1.182 The status of road infrastructure in identified 10 number of villages is fairly satisfactory. [Para, 7.78] 1.183 Regarding education, the existence of primary schools within the geographical limits of all the ten
number of villages covered under the study is encouraging. [Para, 7.78] 1.184 Regarding health scenario, in non of the identified ten number of villages the facilities like sub-
health-centre, rural family welfare centre, government hospitals and dispensaries, private clinics and nursing homes exist within village or their nearby limits.
[Para, 7.78] 1.185 In all the ten number of sample villages one or the other drinking water source, mostly hand
pumps, is available. [Para, 7.78] RESULTS OF SURVEY – HOUSEHOLD PARTICULARS MACRO DIMENSION 1.186 The total number of household as per survey is 349 for all the ten identified villages covered
under the study with average family size of 11 persons. [Para, 7.82] 1.187 There is preponderance of S.T. and S.C households, the combined percentage of which is 87.97 to
total number of 349 households which underlines one important fact that the vulnerable communities in our sample villages are pursuing agriculture occupation in viable manner.
[Para, 7.84] 1.188 All the households in our area of study belong to Hindu religion. [Para, 7.86] 1.189 Agriculture remains to be the main occupation as out of total number of 349 households, 301
number of households constituting 86.25 percent to total households are engaged directly in agriculture as their main occupation.
[Para, 7.88] 1.190 In non of the villages secondary and tertiary sector occupations are being pursued as main
occupation. [Para, 7.103] 1.191 Regarding income level, 91.40 percent households are within the average monthly income range
of Rs. 901.00 to Rs. 1000.00 and Rs. 1001.00 and above with similar trend of monthly expenditure that shows overall affluence status of the area.
[Para, 7.103] RESULTS OF THE SURVEY – MICRO DIMENSION 1.192 In this section of write-up, 25 percent of the households have been selected for detailed enquiry
which comes to around 89 households. [Para, 7.104] 1.193 Out of the total number of 510 number of persons from 89 households, males constitute 46.47
percent while females constitute 53.53 percent, higher than male percentage. [Para, 7.106]

25
1.194 The literacy percentage being 55.69 is not discouraging though lower than district and state average percentage literacy.
[Para, 7.126] 1.195 The bulk of farming community is from small and marginal farmers pursuing agriculture as main
source of livelihood. [Para, 7.126] 1.196 The complete absence of persons in occupation allied to agriculture as main occupation is a
definite drawback. [Para, 7.126] 1.197 The involvement of only eight number of family members in secondary sector as main occupation
can hardly be termed as satisfactory. [Para, 7.126] 1.198 Regarding average monthly income, 80.59 percent family members are within the average
monthly income range of below Rs. 500.00 per month. [Para, 7.126] IMPACT OF K.V.K.–VOCATIONAL TRAINING – ADOPTED AND CLUSTER VILLAGES 1.199 Regarding yield per-hectare of both agronomical and horticultural crops, the performance
in after training situation is better than before training conditions that clearly shows the positive impact of vocational training imparted by the K.V.K.
[Para, 7.172] 1.200 In case of crops like wheat, paddy, gram, arhar and mustard the per-hectare yield in after
training situations is higher than average productivity prevailing both at district and state levels.
[Para, 7.172] 1.201 Regarding horticulture crops the vocational training have been organised for crop like
potato, onion, tomato, brinjal, chilly, bhindi and papaya with rate of participation of 72.84 percent, 34.57 percent, 54.32 percent, 41.98 percent, 35.80 percent, 22.22 percent and 1.23 percent to total of 81 responding families respectively which no doubt is a very bright picture indicating the impact of vocational training organised by the K.V.K.
[Para, 7.172] 1.202 As regards livestock and dairying, 12.35 percent households have participated in vocational
training on improved feeding management. The response is encouraging as in case of other K.V.Ks. the participation for this subject is either nil or negligible.
[Para, 7.172] 1.203 Regarding poultry 12.35 percent households have participated in the vocational training
pertaining to breeding practices, improved caging system, improved feed management and vaccination of birds which are positive deviations from other K.V.Ks. where the response to this activity, is, generally, nil.
[Para, 7.172] 1.204 Response to home science activities is also encouraging particularly for items like
preparation of pickles and preparation of papad/bari/jam/jelly etc wherein 96.30 percent and 55.56 percent households respectively have taken part in vocational training with substantial physical output.
[Para, 7.172]

26
1.205 Organic farming is yet another field wherein 38.27 percent households have taken training on subject like preparation of bio-fertilizer with tangible physical results.
[Para, 7.172] 1.206 No vocational training has been organised on subjects like fishery development, agro -
forestry and watershed activities. [Para, 7.172] IMPACT OF K.V.K. – FRONT LINE DEMONSTRATIONS – ADOPTED AND CLUSTER VILLAGES 1.207 Front Line Demonstrations organised in our area of study have lead to enhancement in
productivity of most of the agronomical and horticultural crops in after training situations as compared to before training conditions which show the positive impact of K.V.Ks. efforts.
[Para, 7.195] 1.208 Regarding crops like wheat, paddy, maize, gram, arhar and mustard, the per-hectare yield
in after training situations is more than the average productivity prevailing at district and state levels.
[Para, 7.195] 1.209 Regarding horticultural crops like tomato, brinjal and chilly, the number of F.L.Ds.
organised 13,2 and 1 respectively with better performance in after training conditions as compared to before training situations.
[Para, 7.195] 1.210 Since no F.L.Ds. have been organised on subjects like livestock and dairying, fisheries
development, agro-forestry, organic farming and watershed activities, the impact of F.L.Ds. for these subjects will not be visible.
[Para, 7.195] IMPACT OF K.V.K. – ON FARM TESTING – ADOPTED AND CLUSTER VILLAGES 1.211 In case of On Farm Testing [O.F.T.] also, the yield per-hectare in after training conditions
is more than before training situations for agronomical crops which shows the positive impact of K.V.Ks. efforts.
[Para, 7.209] 1.212 No O.F.Ts. have been organised for any of the horticulture crops which certainly is a gap in
performance. [Para, 7.209] 1.213 Since no O.F.Ts. have been organised on subjects like livestock and dairying, poultry,
fishery development, agro-forestry, organic farming and watershed activities, the impact of O.F.T. relating to such subjects is not visible.
[Para, 7.209] STATUS OF ACTIVITIES IN CONTROL VILLAGE – BHARGAWAN 1.214 The study has identified one control village with 8 number of sample households and 45
sample family members where there is no intervention of K.V.K. In the following table comparative information regarding performance in control village and adopted and cluster villages has been given;
[Para, 7.210]

27
Comparative Status of Performance Among Control Village and Adopted and Cluster Villages Sl. No.
Item Control Village Adopted and cluster villages (average)
Difference [+ or -] over col. 3
1 2 3 4 5 PER HECTARE YIELD – KG
CEREALS 1 Wheat 3175.00 3379.56 (+) 204.56 2 Paddy 2443.00 3088.50 (+) 645.50 3 Maize 1600.00 1809.00 (+) 209.00 4 Jowar 500.00 - - PULSES 5 Gram 3100.00 3128.44 (+) 28.44 6 Arhar 1250.00 1130.11 (-) 119.89 7 Lentil 1600.00 - - OIL SEEDS 8 Mustard 780.00 1058.67 (+)278.67
HORTICULTURE CROPS – QUINTAL 9 Potato 187.00 212.56 (+) 25.56 10 Onion 158.00 241.20 (+) 83.20 11 Tomato 100.00 184.88 (+) 84.88 12 Brinjal 150.00 196.75 (+) 46.75 13 Chilly 80.00 168.75 (+) 88.75 14 Bhindi 75.00 189.60 (+) 114.60 15 Cucerbits 40.00 - - 16 Papaya 50.00 - -
1.215 Except for the arhar crop where per-hectare yield in control village is more than adopted
and cluster villages, for rest of the crops the per-hectare yield in adopted and cluster villages is more than control village that shows the positive impact of the efforts of K.V.K.
[Para, 7.211] RESULTS OF SURVEY – INDIVIDUAL PARTICULARS 1.216 The reactions of 25 percent of individuals taken from the family members of 25 percent households have been recorded. The table below shows the details;
Basic Details Sl. No.
Item Total number of family members of 25% of households
25 % of individuals taken from 25% of households
1 2 3 4 1 Adopted Villages 183 45 2 Cluster Villages 282 68 3 Control Village 45 11 Total 510 124
[Para, 7.213] Individual Particulars - Adopted and Cluster Villagers 1.217 The majority of 62 individuals are from the S.T. community that accounts for 54.87 percent to total of 113 individuals from adopted and cluster villages with cent percent individuals as followers of Hindu religion. [Para, 7.274] 1.218 The cent-percent awareness of individuals about the K.V.K. in terms of its location and more importantly, the services rendered by it is an important achievement of K.V.K. [Para, 7.274]

28
1.219 Out of total of 113 individuals, 111 individuals [98.23 percent] are in regular contact with K.V.K. mainly because of their desire for adopting new technology [86.73 percent] and for plant protection [7.08 percent individuals]. [Para, 7.274] 1.220 Regarding implementation, 98.23 percent individuals have implemented the services of K.V.K. This is an achievement by itself. [Para, 7.274] 1.221 Except for the subjects like agronomy and home science where 98.23 percent and 97.35
percent individuals have implemented the services rendered by K.V.K., in rests of the subjects like horticulture, animal husbandry, fishery, poultry, agro-forestry, organic farming, watershed activities and training of rural youth, no implementation efforts have been done by the sample individuals.
[Para, 7.274] 1.222 Regarding impact of K.V.Ks. efforts over income enhancement, 99.12 percent individuals
have given positive response that justifies the laudable performance of the K.V.K. [Para, 7.274] 1.223 Regarding continuance of the services of K.V.K. 97.35 percent individuals have given positive response that justifies the laudable performance of the K.V.K. [Para, 7.274] 1.224 It is worth considering to incorporate in the mandate of K.V.K. the new subjects like
production of by-products and marketing of the product. [Para, 7.274] 1.225 Regarding impact of enhanced income, 76.99 percent and 87.61 percent individuals to total of 113 individuals have reported positive impact over levels of education and health respectively. [Para, 7.274] INDIVIDUAL PARTICULARS – CONTROL VILLAGE 1.226 The majority of 81.82 percent individuals are from S.T. community. Cent-percent individuals are followers of Hindu religion. [Para, 7.274] 1.227 Regarding awareness about existence of K.V.K., 36.36 percent individuals are aware of its
existence. [Para, 7.274] 1.228 Regarding satisfaction derived from per-hectare yield of agronomical and horticulture crops, the
cent percent individuals from control village have expressed their dissatisfaction. [Para, 7.274] 1.229 Regarding home science activities and training of rural youth the positive response from the individuals of control village is substantial. [Para, 7.274] 1.230 Regarding educational status, 36.36 percent individuals have reported positively above their male
children attend ing elementary level of education while 45.45 percent individuals reported positively about their female wards attending the elementary level of education.
[Para, 7.274] 1.231 Regarding health status the positive response from individuals is substantial. [Para, 7.274] 1.232 Regarding status of drinking water facilities, cent percent individuals have responded positively about availability of hand-pumps as main source of drinking water. [Para, 7.274]

29
KRISHI VIGYAN KENDRA, SHAHDOL 1.233 Established in the year 1992, the K.V.K. is located in the Technical School Campus, Rewa Road,
Shahdol. The institution is being run under the overall control of Jawahar Lal Nehru Krishi Vishwa Vidyalaya [J.N.K.V.V.], Jabalpur with Training Organiser as head of the institute. At present the total number of staff in position is 10 against the sanctioned strength of 16 persons. The farm area of the K.V.K. is 14.89 hectares, out of which 10.52 hectares is cultivable without any irrigation facility. The K.V.K. has got no administrative building of its own and the office is located in the building provided by the district Collector.
[Para, 8.8,8.9,8.10] 1.234 In the year 2003-2004 against the budget allocation of Rs. 12.10 lakh the expenditure was to the
tune of Rs. 7.56 lakh. [Para, 8.13] RESULTS OF SURVEY – VILLAGE PARTICULARS 1.235 The total population of ten identified villages as per census, 2001 is 5586 which is 0.48 percent to
total rural population of district Shahdol. In all the ten identified villages the percentage of S.T. population is more than S.C. population. The literacy rate that ranged between 19.6 percent for village Antari [cluster village] to 61.0 percent for village Nipaniya [adopted village] is close to the district percentage literacy level of 58.71 and state percentage literacy level of 64.11 thus defying one of the fixed notions that areas with substantial tribal population usually have low literacy rate.
[Para, 8.32] 1.236 The work participation rate that ranged between 37.5 percent in village Nipaniya [adopted
village] to 58.8 percent in village Antari [cluster village] is in general more among males than females. In general the proportion of female marginal workers is more than that of males which is rather obvious as the females do odd jobs in their spare time after completing household obligations. Regarding non-workers that ranged between 43.2 percent in village Antari [cluster village] to 62.5 percent in village Nipaniya [adopted village] present a dismal picture as it shows higher percentage of dependent population.
[Para, 8.34,8.35] 1.237 Agriculture is the main occupation of ten number of identified villages covered under the study as
the combined average percentage of cultivators and agriculture labour is 72.78 percent to total workers. In general the proportion of male cultivators is more than that of females except in village Simariya [cluster village] where percentage of female cultivators is 28.1 as against 23.8 percent of male cultivators. In case of agriculture labour the percentage of female participation, in general, is more than male participation which seems natural as in villages with substantial tribal population where the work culture is equally high among females.
[Para, 8.37] 1.238 Regarding land-use the gross cropped area of the ten identified villages is 63.84 percent to total
geographical area. As regards irrigation, the percentage of gross irrigated area to gross cropped area is only 3.90.
[Para, 8.39, 8.40] 1.239 All the ten number of villages covered under the study are electrified with irregular power supply
situation. The total number of pump sets energized is 131 which is 4.57 percent to total number of 2865 pump sets energized in the district.
[Para, 8.82] 1.240 The availability of road infrastructure is not much satisfactory as only 2 villages have fair weather
roads and only in one village Kharanja Roads exist. [Para, 8.82]

30
1.241 Except for village Antari [cluster village] where the primary school is located at a distance of within 3 kms, in rest of nine number of villages the facility of primary school is available within the village periphery.
[Para, 8.82] 1.242 The sub-health-centres and rural family welfare centres are located within the easy reach of the
villagers. [Para, 8.82] 1.243 In all the ten number of sample villages one or other drinking water source, mostly hand pumps,
is available. [Para, 8.82] RESULTS OF SURVEY – HOUSEHOLD PARTICULARS MACRO DIMENSION 1.244 The total number of household covered under the study is 815 for all the ten number of identified
villages. The average size of the family comes to six persons. [Para, 8.86] 1.245 There is preponderance of households from S.T. and O.B.C. communities that constitute 94.48
percent to total number of 815 households. [Para, 8.88] 1.246 Against the total number of 815 households, 810 households are followers of Hindu religion
while only 5 households are the followers of Muslim religion. [Para, 8.90] 1.247 Agriculture is the main stay of the households residing in identified ten number of villages as
86.99 percent households as compared to total households are engaged directly in agriculture occupation as prime source of livelihood.
[Para, 8.107] 1.248 In secondary and tertiary sector activities, 37 number of households are engaged as main source
of livelihood which is 4.54 percent to total number of 815 number of households. [Para, 8.107] 1.249 The 93.62 percent of households are within the average monthly income range of Rs. 901.00 to
Rs. 1001.00 and above is the indication of affluence level of sample area with matching levels of average monthly expenditure.
[Para, 8.107] RESULTS OF THE SURVEY – MICRO DIMENSION 1.250 In this section of write-up, 25 percent of households have been identified for detailed enquiry that
comes to 199 households. [Para, 8.108] 1.251 Out of the total number of 1145 family members the male members are 550 constituting 48.03
percent to total family members, while for females this percentage is 51.97, a rare trend of more females over males.
[Para, 8.110] 1.252 The literacy percentage being 68.32 in the sample area is amazingly high that indicates the
absorption capacity of the individuals to adopt latest technology regarding agriculture imparted by K.V.K.
[Para, 8.126]

31
1.253 The bulk of farming community is from the category of farmers having sizeable land holdings constituting 57.63 percent total of 236 persons pursuing various main occupations.
[Para, 8.126] 1.254 Regarding activities allied to agriculture 16 number of persons are engaged in minor forest
produce collection which is 6.78 percent to total of 236 persons engaged in various main occupations.
[Para, 8.126] 1.255 The employment of only 8 persons in secondary and tertiary sectors is hardly meaningful. [Para, 8.126] 1.256 Regarding average monthly income, 80.44 percent family members are within the average
monthly income of Rs. 1001.00 and above. [Para, 8.126] IMPACT OF K.V.K.–VOCATIONAL TRAINING – ADOPTED AND CLUSTER VILLAGES 1.257 Regarding the yield per-hectare both for agronomical and horticulture crops, the after
training status as compared to before training conditions are better that clearly shows the positive impact of vocational training imparted by the K.V.K.
[Para, 8.167] 1.258 In case of crops like wheat, paddy, gram, arhar, lentil and mustard, the per-hectare yield in
after training situations is more than the average productivity prevailing both at district and state levels.
[Para, 8.167] 1.259 Regarding horticulture crops, the vocational trainings have been organised for crops like
potato, onion, tomato, brinjal, chilly, bhindi and cucerbits with productivity much higher in after training situations as compared to before training conditions.
[Para, 8.167] 1.260 Home science activities, particularly for functions like preparation of pickles and
papad/bari etc are getting popular as responses to vocational trainings are substantial. [Para, 8.167] 1.261 Regarding training of rural youth, only 3 households have taken part in vocational
trainings for motor binding with placement of three persons in after training situations. [Para, 8.167] 1.262 Preparation of bio-fertilizer is becoming popular as 11.70 percent to total of 188 responding
households have participated in the vocational training with preparation of 640 kgs of it in after training situations as compared to preparation of only 40 kgs in before training conditions.
[Para, 8.167] 1.263 No vocational trainings have been organised on subjects like livestock and dairying,
poultry, fishery development, agro-forestry and watershed activities. [Para, 8.167] IMPACT OF K.V.K.–FRONT LINE DEMONSTRATIONS–ADOPTED AND CLUSTER VILLAGES 1.264 Regarding organisation of F.L.Ds. the performance is just sketchy without having tangible
impact as most of the important subjects like horticulture, livestock and dairying, poultry, fishery development, home science, training of rural youth agro forestry, organic farming and watershed activities have been left out.
[Para, 8.175]

32
IMPACT OF K.V.K. – ON FARM TESTING – ADOPTED AND CLUSTER VILLAGES 1.265 In case of On Farm Testing [O.F.T.], the yield per-hectare in after training situation is more
than before training conditions as has happened for both vocational training and front line demonstration, which shows the positive impact of K.V.Ks. efforts.
[Para, 8.183] 1.266 The overall performance regarding organisation of O.F.Ts. is sketchy as is evident from the
fact that on very important subjects like horticulture, livestock and dairying, poultry, fishery development, agro-forestry and watershed activities no O.F.Ts. have been organised.
[Para, 8.183] STATUS OF ACTIVITIES IN CONTROL VILLAGE – KERHAI 1.267 The study has identified one control village i.e. Kerhai with 11 number of households and 61
sample family members where there is no intervention of K.V.K. In the following table comparative information regarding performance in control village and adopted and cluster villages has been sown;
Comparative Status of Performance Among Control Village and Adopted and Cluster Villages
Sl. No.
Item Control Village Adopted and cluster villages (average)
Difference [+ or -] over col. 3
1 2 3 4 5 PER HECTARE YIELD – KG
CEREALS 1 Wheat 3033.00 3213.67 (+) 180.67 2 Paddy 2291.00 2303.00 (+) 12.00 3 Maize 1417.00 1456.00 (+) 39.00 4 Jowar 533.00 850.00 (+) 317.00 PULSES 5 Gram 900.00 2300.89 (+) 1400.89 6 Arhar 800.00 1022.56 (+) 222.56 7 Lentil - 700.00 - OIL SEEDS 8 Soybean - - - 9 Mustard 733.00 819.25 (+) 86.25 10 Linseed - - -
HORTICULTURE CROPS – QUINTAL 11 Potato - 216.20 - 12 Onion 200.00 248.33 (+) 48.33 13 Tomato 170.00 187.88 (+) 17.88 14 Brinjal 180.00 271.44 (+) 91.44 15 Chilly - 185.14 - 16 Bhindi - 163.33 - 17 Cucerbits - 190.00 -
1.268 The above table shows that except for the crops like wheat, jowar, arhar, mustard and brinjal
where the per-hectare yield for adopted and cluster villages is substantially high as compared to that prevailing in control village, for rest of the crops the difference in per hectare yield is not much between adopted/cluster villages on one side and the control village on the other side. This shows that district as whole has condusive conditions for agricultural activities.
[Para, 8.184]

33
RESULTS OF SURVEY – INDIVIDUAL PARTICULARS 1.269 The reactions of 25 percent of individuals taken from the family members of 25 percent households have been recorded. The table below shows the details;
Basic Details Sl. No.
Item Total number of family members of 25% of households
25 % of individuals taken from 25% of households
1 2 3 4 1 Adopted Villages 561 138 2 Cluster Villages 523 132 3 Control Village 61 15 Total 1145 285
[Para, 8.187] Individual Particulars - Adopted and Cluster Villagers 1.270 The majority of 119 individuals are from the S.T. community that accounts for 44.07 percent to total of 270 individuals from adopted and cluster villages. The cent percent sample individuals from our area of study are followers of Hindu religion. [Para, 8.244] 1.271 The cent-percent awareness of individuals about the K.V.K. in terms of its location and services rendered by it is an important achievement of K.V.K. [Para, 8.244] 1.272 The survey results show the regular contact of 89.63 percent individuals mainly because of the desire for adopting new technology and for obtaining quality seed. The positive impact of the efforts of the K.V.K. is clearly visible. [Para, 8.244] 1.273 Out of 270 individuals, 263 individuals have implemented the services of K.V.K. which is 97.41 percent to total respondents which, in itself, is an achievement of the K.V.Ks. efforts. [Para, 8.244] 1.274 In the field of agronomy maximum number of 266 individual [98.52 percent to total of 270 individuals] have implemented the improved techniques followed by 65 individuals [24.07 percent] for home science and 19 individuals implementing the technique regarding organic farming. [Para, 8.244] 1.275 About 99 percent positive response regarding impact of K.V.K. services over income
enhancement has been reported which is of credit to the efforts of K.V.K. in its various fields of operation.
[Para, 8.244] 1.276 Out of 270 individuals, 269 individuals [99.63 percent to total individuals] have reported for the continuance of the services of K.V.K. particularly for subjects like agronomy, home science and organic farming which again shows the positive impact of the services rendered by the K.V.K. [Para, 8.244] 1.277 Regarding suggestions for additional services to be rendered by K.V.K., the sample
individuals have given useful suggestions regarding introduction of production of by -products of crops and development of marketing strategy for fair return of the product for incorporation in the training mandates of K.V.K.
[Para, 8.244]

34
1.278 Regarding impact of income enhancement, 83.33 percent, 96.67 percent and 34.44 percent individuals to total of 270 individuals have reported positive impact over levels of education, health and housing conditions respectively. [Para, 8.244] INDIVIDUAL PARTICULARS – CONTROL VILLAGE 1.279 The majority of individuals i.e. 60 percent to total of 15 sample individuals are from S.T. community. Cent-percent individuals are followers of Hindu religion. [Para, 8.261] 1.280 The 40 percent level of awareness among sample individuals of control village is a matter of
concern which shows a portion of population is unaware about prevailing and new technology relating to agriculture and allied services.
[Para, 8.261] 1.281 Regarding satisfaction level of per-hectare yield of agronomical and horticultural crops, the cent-
percent individuals of control village have expressed their dissatisfaction with suggestions to organize training activities on water conservation methods and application of agriculture inputs.
[Para, 8.261] 1.282 For augmentation of income levels, cent-percent individuals are in favour of toy making, followed by pickle preparation by 73.33 percent individuals, backing activities by 20.00 percent individuals and preparation of papad/bari/jam/jelly by 40.00 percent individuals. [Para, 8.261] 1.283 Regarding elementary level of education 26.67 percent individuals have reported that their male
wards attend the schools whereas for female wards 60.00 percent individuals have reported in favour of their school attendance.
[Para, 8.261] 1.284 A very satisfactory level of health scenario is existing in control village wherein for most of the basic health parameters the positive responses are much higher than the responses from adopted and cluster villages. [Para, 8.261] 1.285 Hand pumps are the main source of drinking water in our control village where cent percent
individuals have reported for its existence. [Para, 8.261]

35
KRISHI VIGYAN KENDRA, TIKAMGARH 1.286 Established in the year 1999, the K.V.K. is located in the Tikamgarh Development Block of
district Tikamgarh. It is being run under the overall control of J.N.K.V.V., Jabalpur with Training Organiser as the Chief of the K.V.K., having six number of technical staff and three number of non-technical staff. The farm area of the K.V.K. is 20 hect., entirely irrigated and cultivated. The K.V.K. has got administrative building of its own.
[Para, 9.5] 1.287 Regarding budget allocation, the K.V.K. receives an average allocation of Rs. 27.47 lakh per year
over the years 2001-2002 to 2003-2004 against which the average expenditure per year is Rs. 23.94 lakh.
[Para, 9.8] RESULTS OF SURVEY – VILLAGE PARTICULARS 1.288 The total population of ten identified villages as per census, 2001 is 7201 which is 0.73 percent to
the total rural population of district Tikamgarh with preponderance of male population over female population and S.C. population over S.T. population. The percentage literacy that ranged between 43.2 for village Manikpura to 65.7 percent fo r village Neemkhera, is close to district level percentage literacy of 55.80 and state level figure of 64.11.
[Para, 9.29] 1.289 The work participation rate that ranged between 26.6 percent for village Surajpur [adopted
village] to 58.8 percent in village Sujanpura [cluster village] is, in general, more among males than females except for villages Sujanpura, Papawani and Neemkhera where a reverse trend is true. In cent-percent sample villages the male participation as main workers is higher than female participation, while a reverse situation is seen in case of marginal workers where female participation is more than male participation. The proportion of non-workers that ranged between 41.3 percent for village Sujanpura [cluster village] to 73.4 percent for village Surajpur [adopted village] presents a dismal picture.
[Para, 9.31] 1.290 Agriculture remains to be the main occupation of the ten villages identified for the study. Out of
the ten villages, in five number of villages viz. Surajpur, Charpuan, Papawani, Bauri and Khiriya, the proportion of female cultivators is more than that of male cultivators [In case of village Surajpur cent percent cultivators are females] that signifies the awareness and intent of the female members of the farming community to work along with their male counterpart for addition in household income. The situation regarding the proportion of workers in household industrics to total workers is far from being satisfactory as it ranged between 0.3 percent for villages Khiriya and Manikpura [both cluster villages] to 1.7 percent for village Bauri [cluster village]
[Para, 9.33, 9.35] 1.291 Regarding land-use the gross cropped area of the ten identified villages is 2788 hectares which is
84.43 percent to total geographical area. As regards irrigation, the percentage of gross irrigated area to gross cropped area is 64.20 which is much above the district average of 53.56 percent and state average of 28.54 percent.
[Para, 9.38, 9.39] 1.292 All the villages covered under the study are electrified with irregular power supply situation. The
total number of pump sets energized is 410 which is 1.42 percent to total number of 28920 pump sets energized in district Tikamgarh in the year 1999-2000.
[Para, 9.78] 1.293 The status of road infrastructure in identified ten number of villages is highly satisfactory. [Para, 9.78]

36
1.294 Regarding education, the existence of primary schools within the geographical limits of all the ten number of villages covered under that study is an encouraging factor.
[Para, 9.78] 1.295 Regarding health scenario, village Khiriya [cluster village] has both sub-health centre and rural
family welfare centre within the geographical limit of the village. In two villages even the private clinics are located within the village periphery.
[Para, 9.78] 1.296 In all the ten number of sample villages one or the other drinking water source, mostly hand
pumps, is available. [Para, 9.78] RESULTS OF SURVEY – HOUSEHOLD PARTICULARS MACRO DIMENSION 1.297 The total number of households as per survey is 1020 with average size of the family of 7
persons. All the households are the followers of Hindu religion. [Para, 9.104] 1.298 The combined percentage of S.C. and O.B.C. communities is 86.47 to total of 1020 households. [Para, 9.104] 1.299 Out of total of 1020 households, 870 number of households constituting 85.29 percent to total
households are engaged directly in agriculture as their main occupation. [Para, 9.104] 1.300 Out of 1020 households, 5 number of families are engaged in livestock activities as main
occupation while six number of households are pursuing hunting as their main occupation which are encouraging deviations.
[Para, 9.104] 1.301 The pursuance of secondary and tertiary sectors as main occupation is only marginal. [Para, 9.104] 1.302 Out of 1020 number of households, the combined percentage of households within the average
monthly income range of Rs. 901.00 to Rs. 1000.00 and Rs. 1001 and above is 99.90 which shows overall affluence level of the area.
[Para, 9.104] RESULTS OF THE SURVEY – MICRO DIMENSION 1.303 In this part of the Chapter 25 percent of households have been identified for detailed enquiry
which comes to 256 households. [Para, 9.105] 1.304 Out of total of 1434 number of persons from 256 households males constitute 51.60 percent while
females constitute 48.40 percent. [Para, 9.128] 1.305 Against the total of 1434 persons among sample households, the percentage literacy is 73.85, far
above than the district average of 55.80 percent and state average of 64.11 percent. [Para, 9.128] 1.306 The incorporation of 81.03 percent family members within the average monthly income range of
Rs. 1001.00 and above and similar percentage of 82.29 family members within the average monthly expenditure of Rs. 1001.00 and above is the sure indication of the affluence level of the area.
[Para, 9.128]

37
IMPACT OF K.V.K.–VOCATIONAL TRAINING – ADOPTED AND CLUSTER VILLAGES 1.307 Regarding the yield per-hectare both for agronomical and horticulture crops, the after
training situation is better than before training conditions that clearly shows the positive impact of vocational training imparted by the K.V.K.
[Para, 9.175] 1.308 In case of crops like wheat, paddy, maize, gram, arhar, lentil, soybean, mustard and linseed,
the per-hectare yield in after training situation is more than the average productivity prevailing both at district and state levels.
[Para, 9.175] 1.309 For important horticulture crops like potato, onion, tomato, brinjal, chilly, bhindi and
papaya with rate of participation of 24.39 percent, 6.50 percent, 15.04 percent, 8.54 percent, 10.60 percent, 5.69 percent and 1.22 percent respectively with yield rates higher in A.T. situations as compared to B.T. conditions.
[Para, 9.175] 1.310 In case of livestock, dairy and poultry though the response is marginal, but somehow the
picture is encouraging. [Para, 9.175] 1.311 Response to home science activities in quite encouraging particularly for items like
preparation of pickles and papad/bari/jam/jelly etc. [Para, 9.175] 1.312 No vocational trainings have been organised for subjects like fishery, agro -forestry and
watershed activities which are important functions from the view points of income augmentation in rural areas.
[Para, 9.175] IMPACT OF K.V.K. – FRONT LINE DEMONSTRATIONS – ADOPTED AND CLUSTER VILLAGES 1.313 Front line demonstrations organised in our area of study has lead to enhancement in
productivity of most of agronomical and horticultural crops in after training situations as compared to before training conditions which show the positive impact of K.V.Ks. efforts.
[Para, 9.191] 1.314 Regarding crops like wheat, paddy, maize, gram, arhar, lentil, soybean and mustard the
F.L.Ds. organised are 26,3,2,6,5,6,10 and 6 respectively with better performance in after training situations as compared to per-hectare yield prevailing both at district and state levels.
[Para, 9.191] 1.315 Since no F.L.Ds. have been organised on subjects like horticulture, livestock and dairying,
fisheries development, home science, training of rural youth, agro-forestry, organic farming and watershed activities the impact of F.L.D. for these subjects will not be visible.
[Para, 9.191]

38
IMPACT OF K.V.K. – ON FARM TESTING – ADOPTED AND CLUSTER VILLAGES 1.316 In case of On Farm Testing [O.F.T.], the yield per-hectare in after training situation is more
than before training conditions as has occurred for both vocational training and front line demonstrations, which shows the positive impact of K.V.Ks. efforts.
[Para, 9.204] 1.317 Since no O.F.Ts. have been organised on subjects like horticulture, livestock and dairying,
poultry, fishery development, home science, training of rural youth, agro -forestry, organic farming and watershed activities, the impact of O.F.T. on such subject will not be visible.
[Para, 9.204] STATUS OF ACTIVITIES IN CONTROL VILLAGE – NEEMKHERA 1.318 The study has identified one control village, i.e., Neemkhera with 10 number of sample
households and 68 sample family members where there is no intervention of K.V.K. In the following table comparative information regarding performance in control village and adopted and cluster villages has been shown.
[Para, 9.205]
Comparative Status of Performance Among Control Village and Adopted and Cluster Villages Sl. No.
Item Control Village Adopted and cluster villages (average)
Difference [+ or -] over col. 3
1 2 3 4 5 PER HECTARE YIELD – KG
CEREALS 1 Wheat 4060.00 4176.33 (+) 116.33 2 Paddy 3240.00 3418.67 (+) 178.67 3 Maize 2028.00 2034.80 (+) 6.80 4 Jowar - 1393.43 -
PULSES 5 Gram 1800.00 2448.33 (+) 648.33 6 Arhar 1629.00 1688.67 (+) 59.67 7 Lentil 1500.00 1550.20 (+) 50.20 OIL SEEDS 2945.75 (+) 975.75 8 Soybean 1970.00 2945.75 (+) 975.75 9 Mustard 1606.00 1635.63 (+) 29.63 10 Linseed 3000.00 3001.00 (+) 1.00
HORTICULTURE CROPS – QUINTAL 11 Potato 240.00 242.33 (+) 2.33 12 Onion 179.00 184.25 (+) 5.25 13 Tomato 210.00 218.78 (+) 8.78 14 Brinjal 200.00 273.38 (+) 73.38 15 Chilly 210.00 212.22 (+) 76.63 16 Bhindi 87.00 163.63 (+) 114.60 17 Papaya - 105.00 -
1.319 Except for the crops like Gram, Soybean, Wheat and Paddy where there is substantial gap in
per hectare yield between adopted and cluster villages and control village in rest of the crops the difference is only marginal that shows the overall situation of agriculture is good in district Tikamgarh.
[Para, 9.206]

39
RESULTS OF SURVEY – INDIVIDUAL PARTICULARS 1.320 The reactions of 25 percent of individuals taken from the family members of 25 percent households have been recorded. The table below shows the details;
Basic Details Sl. No.
Item Total number of family members of 25% of households
25 % of individuals taken from 25% of households
1 2 3 4 1 Adopted Villages 449 109 2 Cluster Villages 917 231 3 Control Village 68 16 Total 1434 356
[Para, 9.208] Individual Particulars - Adopted and Cluster Villagers 1.321 The majority of 269 individuals are from S.C. and O.B.C. communities accounting for 79.12 percent to total of 340 individuals from adopted and cluster villages. The cent percent sample individuals from our area of study are the followers of Hindu religion. [Para, 9.269] 1.322 The cent-percent awareness of individuals about the K.V.K. in terms of its location and more importantly the services rendered by it is an important achievement of K.V.K. [Para, 9.269] 1.323 Out of 340 individuals, 321 individuals [94.41 percent] are in regular contact with K.V.K. mainly because of the desire for adopting new technology. [Para, 9.269] 1.324 Regarding implementation, 97.94 percent individuals have implemented the services of K.V.K. This is an achievement by itself. [Para, 9.269] 1.325 Except for the subjects like agronomy and home science where 97.94 percent and 33.53
percent individuals have implemented the services rendered by K.V.K., in rest of the subjects like animal husbandry, fishery, poultry, agro -forestry, watershed activities and training of rural youth, no implementation efforts have been done.
[Para, 9.269] 1.326 Agronomy and home science are the subjects for which satisfaction level is substantial. [Para, 9.269] 1.327 Regarding impact of K.V.Ks. efforts, over income enhancement, cent-percent individuals
have given positive response, which is an achievement by itself. [Para, 9.269] 1.328 Regarding continuance of the services of K.V.K., 99.71 percent individuals have given positive response that shows the laudable performance of the K.V.K. [Para, 9.269] 1.329 It is worth considering to incorporate in the mandates of K.V.K., the new subjects like production of by products and marketing strategy of the product. [Para, 9.269] 1.330 Regarding impact of enhanced income over levels of education, 82.06 percent individuals have given positive response, particularly in case of elementary education for both boys and girls, which, no doubt, is an encouraging trend. [Para, 9.269]

40
1.331 90 percent to total of 340 individuals have reported about positive impact of enhanced income over health status. [Para, 9.269] INDIVIDUAL PARTICULARS – CONTROL VILLAGE 1.332 The cent percent individuals are from O.B.C. community with cent-percent of individuals as followers of Hindu religion. [Para, 9.285] 1.333 Regarding awareness, 56.25 percent individuals are aware of the existence of K.V.K. [Para, 9.285] 1.334 Regarding satisfaction derived from per-hectare yield of agronomical and horticulture crops, 75.00
percent individuals for control village have expressed their satisfaction. [Para, 9.285] 1.335 Regarding satisfaction level for activities like livestock and dairy and poultry, 62.50 percent and 50.00 percent individuals have expressed their satisfaction. [Para, 9.285] 1.336 Regarding educational status, 56.25 percent individuals have reported positively about their male
children attending elementary level of education. More or less similar is the situation for girls where 31.25 percent individuals have given positive response.
[Para, 9.285] 1.337 Regarding health status, the positive response from individuals is substantial. [Para, 9.285] 1.338 Regarding status of drinking water facilities, cent-percent individuals have responded positively
about availability of hand pumps as main source of drinking water. [Para, 9.285]

41
Chapter Two Historical Background and Objectives of the Krishi Vigyan Kendra [K.V.K.]
Programme and its Present Status in Madhya Pradesh
2.1 The agriculture sector forms the backbone of the Nation’s economy. The prosperity of the nation lies in the advancement of agriculture and its allied activities that basically calls for the transformation of agriculture and its related sectors from its present traditional status to some what vibrant and galloping functioning units assuming characteristics of secondary sector through introduction of modern technology. Since the percentage of workers engaged in agriculture to total works is 58.20, any attempt to growth with social justice shall have to keep the agriculture on priority list.
2.2 Agriculture development is desirable not only for its direct impact on the lives of most of
rural population reliant on it, but also for its favorable impact on the other sectors of industry and services. Employment opportunities that the agriculture sector generates are critical to the size of the market for the industry and service sectors. Development of rural non-farm sector which is equally important for its impact on the development process through employment creation, higher income and poverty alleviation is, ultimately, dependent on dynamic growth of agriculture and its related sectors.
2.3 Agriculture production though made satisfactory progress in terms of per hectare yield of
food crops from 13.8 quintals per hectare in 1990-01 to 17.4 quintal per hectare in 2001-2002, but judging from the view points of overall population growth and vagaries of crop production due to dependence on monsoon and traditional nature of Indian agricultural practices, the need for better organisation of agriculture and its related sectors has been felt as reflected in various plan documents.
2.4 Since the initial years of economic planning, particularly from the Third Plan onwards,
agriculture remained the prime agenda of the planners, as very justifiably said that agriculture forms the pivot round which most of the socio-economic functions of the country revolve. The attempts made though were sincere, but, some how, lacked the compositeness necessary for rapid growth of any sector particularly the agriculture sector, which has, perhaps, the smallest gestation period i.e. one agriculture year from July to June. With the advent of new technologies in the field of agriculture, it was felt necessary to come out with a package of programme to boost agriculture output to desired levels. The best way, thus, perceived was to take technological advancement to farming communities in the form of packages of basic agriculture inputs. This is where the concept of constituting Krishi Vigyan Kendras took roots in the sensibilities of agriculture experts that, in subsequent years, took deeper roots.
2.5 The Education Commission [1964-66] recommended that a vigorous effort be made to
establish specialized institutions to provide Vocational Education in agriculture and allied fields at the pre and the post matriculation levels to cater to the training needs of a large number of boys and girls coming from rural areas. The Commission, further suggested that such institutions be named as “Agricultural Polytechnics”. The recommendations of the Commission was thoroughly discussed during 1966-72 by the Ministry of Education, Ministry of Agriculture, Planning Commission, Indian Council of Agricultural Research [I.C.A.R.] and other allied institutions. Finally, the ICAR mooted the idea of establishing Krishi Vigyan Kendras [Agricultural Science Centres] as innovative institutions for imparting vocational training to the practicing farmers, school drop-outs and the field level extension functionaries. The I.C.A.R. constituted a committee headed by Dr. Mohan Sinha Mehta in 1973 to sort out the modalities for implementing the scheme. The

42
Committee enunciated the three basic concepts/postulates for establishing Krishi Vigyan Kendras : -
- The Kendras will impart learning through work experience and hence will be concerned
with the technical literacy, the acquisition of which does not necessarily require a pre-condition for the ability to read and write.
- The Kendras will impart training to only those extension workers who are already employed
or to the practicing farmers and fishermen. In other words the Kendras will cater to the needs of those who are already employed or wish to be self employed.
- There will be no uniform syllabus for Kendras. The syllabus and programme of each Kendra
will be tailored to the felt needs, natural resources and the potential for agricultural growth in that particular area.
2.6 The Committee further suggested that the success of Kendras will depend upon adherence to
the following three basic principles : - - Accelerating production relating to agriculture and its allied sectors in the operational area
of the Kendra. - Experiential learning i.e. “teaching by doing” and “learning by doing” should be the
principal methods of imparting training. - The benefits of training should reach to the poorest of the poor sections of the community
for raising their living conditions. 2.7 During the course of the implementation of the scheme, it was felt that the vocational
training alone would not be useful unless it is followed by front line demonstration in the farmers’ fields to demonstrate latest technology for enhancing agriculture production. Accordingly front line demonstrations on important crops of the district was added to the mandate of the K.V.K. During Eight Plan period the mandate of the K.V.K. was further reviewed as detailed hereunder : -
- Conducting “On farm testing” for identifying technologies in terms of location specific
sustainable land use systems. - Organising training to up-date the knowledge of extension personnel regarding latest
development in agriculture field on regular basis. - Organising short and long term vocational training courses in agriculture and allied
vocations for farmers and rural youths with emphasis on learning by doing for higher productivity and generating self employment.
- Organising front line demonstration on various crops to generate production data and other
information. 2.8 In order to achieve the above mandate the following broad objectives are detailed below
which will help the individual K.V.Ks. to develop their specific objectives : - - Demonstrate the latest agricultural technologies to the farmers as well as the extension
workers of the State Departments of Agriculture/Horticulture/ Fisheries/Animal Husbandry/N.G.Os. with a view to reduce the time- lag between technology generation and its adoption.
- In the context of socio-economic status of the farmers, testing and verifying the quality of
any technology to suit to the life style of the peripheral farming communities and add additional parameters or delete snags, if any, from the introduced technology.

43
- To impart training to the practicing farmers/farm women, rural youth and field level extension functionaries by following the method of “teaching by doing” and “learning by doing”.
- In order to benefit large number of farmers/farm women, attempts should be made to
organize large number of short courses of one day to one week duration and only limited number of long duration courses. The ‘on campus’ long duration courses should be focused on young farmers both boys and girls with special emphasis on school drop-outs.
- The Krishi Vigyan Kendras [K.V.Ks.] should have no uniform syllabus, the courses will
vary according to the local requirements and the specific needs of the targeted groups, which, obviously, will demand interdisciplinary approach and multi- institutional linkages and support. Thus, at the K.V.K. level no specialization in terms of Entomology, Plant Pathology, Soil Science etc. are required, instead a broad based training is required to cater to the requirements of heterogenous farming community.
- The district being the operational area of a K.V.K., may be covered in phased manner. Some
small but crucial course like repair and maintenance of diesel pumping sets and electric motors may be organized for the farmers from entire district in different batches.
- The training courses and other programmes of the Kendras should be in line with the
developmental programmes of the government. The K.V.Ks. should function in liaison with the government departments, lead bank, cooperatives and other institutions.
2.9 To sum-up, the basic objective of the K.V.K. is to carry the technological advancement
relating to agriculture to the farms scattered over the country in phased manner to enhance agriculture production through the techniques of vocational training, front line demonstration and on farm testing in the spheres of agriculture and its allied sectors including the subjects like home science and training of rural youth for creating avenues of self-employment as well. The phased development of the district is supposed to be achieved by adopting limited number of villages for intensive efforts, the flow effects of which is supposed to influence the cluster group of villages around the periphery of adopted villages. The idea, therefore, is to gradually spread positive effects of technological advancement in the field of agriculture and its allied sectors either directly through adoption of villages or indirectly through identification of cluster group of villages around the adopted villages through the spread effects of knowledge and its positive results in adopted villages. It is worthwhile to mention here that in every district there exist a network of government institutions relating to agriculture and its allied activities working more or less on the lines of K.V.Ks. The K.V.Ks. are therefore supposed to function in liaison with such district functionaries to avoid overlaps and repeat performances in areas already having interventions by government functionaries.
PRESENT STATUS OF K.V.KS. IN MADHYA PRADESH 2.10 Agriculture is the main stay of the State’s economy. The percentage of workers engaged in
agriculture to the total workers, as per Census 2001, is 71.49. The situation, thus, clearly indicates that any attempt to socio-economic development presupposes priority emphasis on agriculture and its related activities. The predominance of marginal and small land holders which, at present, constitute 60.93 percent to total land holders, reinforces the need for developing the agriculture and its related sectors for sustained and holistic development of the State’s economy.

44
2.11 Change in the cropping pattern since 1956-57 is one of the positive factors of agriculture sector. During the year 1956-57 about 63 percent of gross cropped area was covered under cereal crops and that remained more or less the same during the period of “Grow More Food” campaign. However, after the introduction of soybean in 1980-81 some low value cereal crops have been replaced and the percentage coverage of cereals declined to 41 percent of the cropped area in 1999-2000. Similarly the percentage coverage of oilseed crops increased during the period 1980-81 and onwards. The change in the cropping pattern has borne fruit which is evident from the fact that in 1999-2000 the State share of soybean production to national production was about 70 percent and that of oil-seed production was about 27 percent.
2.12 With all these achievements, agriculture in Madhya Pradesh is still traditional. The
undulating topography, unutilized irrigation potential, practice of keeping land fallow during Kharif and taking only one crop in rabi make it imperative that the soil and water conservation, ground water development, crop diversification and substitution are to be undertaken on priority to accelerate growth in agriculture production.
2.13 The policy approach to agriculture, particularly in 1990s has been to secure increased
production through subsidies in inputs such as power, water and fertilizer rather than building capital assets. This strategy has run into serious difficulties as the subsidies have become financially unsustainable. Therefore, the proposed, important strategies for the Tenth Plan for agriculture development in Madhya Pradesh are : -
- Focus on raising the productivity of land in a manner which is sustainable over a long
period. - Bringing the uncultivated waste land into productive use whether in agriculture or
horticulture. - Increasing work opportunities to women farmers. - Raising crop intensity of agricultural land. - Enhancing rain water harvesting and increasing the irrigation potential through scientific
watershed development. - Emphasizing ground water development. - Undertaking Watershed Development Programme with people’s participation. - Improving rural and district road connectivities through Mandi funds. - Strengthening the agriculture research by introducing latest technologies relating to the
agriculture. - Diversification of agriculture to meet the enhanced food and nutritional needs. - Farm mechanization would be given special thrust. 2.14 One of the efforts to implement the strategies as envisaged in the Tenth Plan is the
constitution of additional numbers of Krish Vigyan Kendras in the State to bring about enhancement in agriculture production through introduction of latest technology through various modes of extension efforts. The table below shows the status of Krishi Vigyan Kendras in Madhya Pradesh.

45
Table No. 2.1 Status of Krishi Vigyan Kendras in Madhya Pradesh
As on 31st March, 2005
Sr. No.
Name of the district where K.V.K. is located
Name of the host organisation Year of establishment
1 Seoni Vice Chancellor, J.N.K.V.V., Jabalpur 1994 2 Tikamgarh Vice Chancellor, J.N.K.V.V., Jabalpur 1994 3 East Nimar [Khandwa] Vice Chancellor, J.N.K.V.V., Jabalpur 1994 4 Guna Vice Chancellor, J.N.K.V.V., Jabalpur 1994 5 Chhindwara Vice Chancellor, J.N.K.V.V., Jabalpur 1983 6 Jhabua Vice Chancellor, J.N.K.V.V., Jabalpur 1984 7 Sidhi Vice Chancellor, J.N.K.V.V., Jabalpur 1992 8 Shahdol Vice Chancellor, J.N.K.V.V., Jabalpur 1992 9 Gwalior Vice Chancellor, J.N.K.V.V., Jabalpur 1997 10 Balaghat Vice Chancellor, J.N.K.V.V., Jabalpur 1992 11 Ratlam President, Kalukheda Siksha Samiti [N.G.O.] 1994 12 Indore Secretary, Kasturba Gandhi National
Memorial Trust [N.G.O.] 1976
13 Satna Chairman, Deendayal Research Institute, New Delhi [N.G.O.]
1992
14 Bhopal Director, CIAE [ICAR], Nabibagh, Bhopal 1979 15 Sehore Executive Director, CRDE-KVK, [N.G.O.] 1999 16 Rajgarh Vice Chancellor, J.N.K.V.V., Jabalpur 1974 17 Betul Vice Chancellor, J.N.K.V.V., Jabalpur 2002 18 Dhar Vice Chancellor, J.N.K.V.V., Jabalpur 2002 19 Panna Vice Chancellor, J.N.K.V.V., Jabalpur 2002 20 Dindori Vice Chancellor, J.N.K.V.V., Jabalpur 2002 21 Lahar [Bhind] Vice Chancellor, J.N.K.V.V., Jabalpur 2003 22 Jabalpur Vice Chancellor, J.N.K.V.V., Jabalpur 2004 23 Mandsaur Vice Chancellor, J.N.K.V.V., Jabalpur 2004 24 Rewa Vice Chancellor, J.N.K.V.V., Jabalpur 2004 25 Ujjain Vice Chancellor, J.N.K.V.V., Jabalpur 2004 26 Shajapur Vice Chancellor, J.N.K.V.V., Jabalpur 2004 27 Hoshangabad Vice Chancellor, J.N.K.V.V., Jabalpur 2004 28 Morena Vice Chancellor, J.N.K.V.V., Jabalpur 2004 29 Sagar Vice Chancellor, J.N.K.V.V., Jabalpur 2004 30 West Nimar [Khargone] Vice Chancellor, J.N.K.V.V., Jabalpur 2004 31 Raisen Chairman, Deendayal KrishiVikas Avam
Anusandhan Samiti., N.G.O. 2003
32 Harda Vice Chancellor, J.N.K.V.V., Jabalpur 2004 33 Damoh Vice Chancellor, J.N.K.V.V., Jabalpur 2004 34 Narshingpur Vice Chancellor, J.N.K.V.V., Jabalpur 2004
J.N.K.V.V. : Jawaharlal Nehru Krishi Vishwa Vidyalaya 2.15 The above table shows that during the Tenth Plan period [2002-2007] 18 new K.V.Ks. have
been constituted in Madhya Pradesh to cater to the requirement of the state as enumerated in the strategies of the Tenth Plan for agriculture development.

46
CHAPTER THREE Frame and Methodology of the Study
3.1 The Centre for Rural Development and Environment [C.R.D.E.], Bhopal, an N.G.O.
consisting of dedicated persons of multi disciplinary areas has taken up an impact study on “Development of Agriculture and Allied Activities in Madhya Pradesh through Krishi Vigyan Kendras [Agriculture Science Centres] having the basic objective to assess the impact of the transfer of agriculture technology over the crop production on one hand and the development of activities allied to agriculture on the other. The study has been funded by the Planning Commission, Government of India [G.O.I.] vide their sanction letter no. 0-15012/57/03-SER, dated 6th September, 2004 for Rs. 6,17,000.00.
THE FRAME 3.2 The study has covered six number of K.V.Ks. which have completed minimum of five years
of functioning. It is generally understood that at least five years of continuous functioning of any institution yield results in the form of impact over its periphery. The criteria for selection of K.V.Ks. are : -
- Each K.V.K. to represent one or more than one Agro-Climatic Zone. At present the State of
Madhya Pradesh has been divided into eleven Agro-Climatic Zones. - The six K.V.Ks. have been selected from the North, South, East and West parts of the State to
have adequate representation of the area. - The six K.V.Ks. have been selected from among K.V.Ks. run by the Jawaharlal Nehru Krishi
Vishwa Vidyalaya [J.N.K.V.V.], Jabalpur [three numbers], Indian Council of Agriculture Research [I.C.A.R.], Govt. of India [one number] and N.G.Os. [two numbers].
The table below gives the details of the six K.V.Ks. : -
Table No. 3.1
Details of Selected Six K.V.Ks. Sl. No.
Name of the district where K.V.K. is located
Name of the host organisation
Year of establishment
Agro-climatical Zone covered
1 Bhopal ICAR, GoI 1979 Vindhya Plateau 2 Tikamgarh J.N.K.V.V., Jabalpur 1994 Bundelkhand Region 3 Chhindwara J.N.K.V.V., Jabalpur 1983 Satpura Plateau 4 Shahdol J.N.K.V.V., Jabalpur 1992 Northern Hill Region 5 Indore N.G.O. 1976 Malwa Plateau 6 Satna N.G.O. 1992 Kymore Plateau and
Satpura Hills 3.3 Three adopted villages from each K.V.K. where the agriculture scientists have provided new
technology through training, demonstration and other extension activities have been selected. 3.4 Two cluster of villages from each adopted village have been identified to study the impact of
flow benefits. 3.5 One control group village from each K.V.K. area has been selected where there is no
interference to K.V.K. The purpose is to compare the development scenarios in areas of involvement of K.V.Ks. [adopted and cluster group of villages] and area of non- involvement [control village].

47
The frame of the study, therefore, a. No. of K.V.K. - 6 b. No. of adopted villages - 3 x 6 = 18 c. No. of cluster villages - 2 x 3 x 6 = 36 d. One control group village from each K.V.K. - 1 x 6 = 6 The total number of villages covered is sixty. THE METHODOLOGY 3.6 The methodology consists of the details of schedules to be canvassed for collection of
information as given hereunder : - VILLAGE SCHEDULE 3.7 This schedule has been canvassed to all the Adopted Villages [18], Cluster of Villages 36 and
Control Group of Villages 6 ADOPTED VILLAGES 3.8 These are the villages where it is mandatory on the part of the Krishi Vigyan Kendras
[K.V.Ks.] to transfer the technology relating to agriculture and its allied sectors. These villages are taken as nucleus villages.
CLUSTER GROUP OF VILLAGES 3.9 These are peripheral villages around the adopted villages where the flow benefits of the
K.V.K. reach through the efforts of either K.V.K. functionaries or K.V.K. beneficiaries. CONTROL GROUP OF VILLAGES 3.10 These are the villages where there are no interventions of K.V.Ks. 3.11 The information collected through Village Schedule will clearly bring out the present
economic, social and cultural scenarios of above mentioned three groups of villages which is necessary to assess the extent of absorption capacity of the technology transfer.
HOUSE LISTING SCHEDULE 3.12 The information in the House Listing Schedule will be collected from all the sixty villages,
i.e. : - Adopted villages - 18 Cluster of villages - 36 Control Group of villages - 06 60 3.13 The House Listing Schedule will serve as frame of the study on the basis of which 25 percent
of sample households will be selected for detailed enquiry.

48
HOUSEHOLD SCHEDULE 3.14 The schedule will consist of 25 percent of households taken from House Listing Schedule.
The following is the magnitude of sample design : - Adopted villages - 25% of the households Cluster of villages - 25% of the households Control Group of villages - 25% of the households Schedule wise details are given below : - HOUSEHOLD SCHEDULE – A – GENERAL PARTICULARS 3.15 This schedule will be uniformly canvassed to all Adopted Villages, Cluster Group of Villages
and Control Group of Villages. HOUSEHOLD SCHEDULE – B 3.16 This schedule will only be canvassed among Adopted Villages and Cluster Villages to
capture information regarding Vocational Training, Front Line Demonstration and On Farm Testing. These are the three mandatory functions of K.V.Ks. that bring about change in the agriculture scenario of the district where K.V.K. is located. The schedule dealt in detail the parameters like crop production [Agronomy], Horticulture, Live Stock and Dairying, Poultry, Fisheries Development, Home Science, Training of Rural Youth, Agro-forestry, Organic Farming and Watershed Activities. These activities are more or less common to Vocational Training, Front Line Demonstration and On Farm Testing.
HOUSEHOLD SCHEDULE – C 3.17 This schedule will be canvassed to only control village where there is no intervention of the
K.V.K. The items of information are more or less the same as used for collecting information from beneficiary families.
HOUSEHOLD SCHEDULE–D–HOUSEHOLD CONSUMER EXPENDITURE 3.18 This schedule will be canvassed uniformly to adopted, cluster and control group of villages to
analyse the consumption pattern both in beneficiary and non-beneficiary villages as consumption pattern is one of the important indictors of standard of living.
INDIVIDUAL QUESTIONNAIRE 3.19 This Questionnaire consists of 25 percent of individuals taken from Household schedule. The
following is the details of the sampling design : - Adopted villages - 25% of the individuals Cluster Group of villages - 25% of the individuals Control Group of villages - 25% of the individuals

49
3.20 The following criteria has been followed to identify the individuals : - - The individual should be the adult member of the family and preferably an earning member. - He should be associated with any of the programme of the K.V.K. For individuals from
control group of villages this criterion is not applicable. - He should be literate, may be without having any formal education. The same criteria are applicable for selection of 25 percent of households. INDIVIDUAL QUESTIONNAIRE – A 3.21 This Questionnaire pertains to only identified individuals from Adopted and Cluster Group of
Villages. The Questionnaire has been divided in to : -
- General Particulars - Economic Scenario - Social Scenario - Cultural Scenario - General
INDIVIDUAL QUESTIONNAIRE – B 3.22 This Questionnaire is meant to be canvassed to the identified individuals from Control village
where there is no intervention of K.V.K. COLLECTION OF SECONDARY DATA 3.23 A schedule has been specifically designed for the collection of secondary information from
six identified K.V.Ks. 3.24 The Chapter Plan of the study, though strictly can not form a part of methodology, but it has
been mentioned here to define the premise of the study in broad manner. 3.25 The subsequent six chapters has been devoted to study the impact of K.V.Ks. over the
agriculture scenario of the districts. After that an inter comparison of the performance of the K.V.Ks. hosted by I.C.A.R., J.N.K.V.V. and N.G.Os. has been attempted. The performance of the 60 villages covered by the six K.V.Ks. has been compared with the State averages through a separate chapter. The experiences of six K.V.Ks. along with their suggestions have been presented in a separate chapter. The last chapter has been dealt with probable solutions.

50
CHAPTER FOUR KRISHI VIGYAN KENDRA - BHOPAL
The Premise 4.1 The present chapter has been categorized into : -
- General particulars of the district. - Details of Krishi Vigyan Kendra based on secondary information. - Results of the survey.
The above mentioned sequence will, generally, be followed for the subsequent chapters dealing with individual K.V.K.
GENERAL PARTICULARS OF THE DISTRICT 4.2 Located in between 23.070 to 23.540 north latitude to 77.120 to 77.400 east longitude, the
district is situated in the south-west part of the State of Madhya Pradesh with total geographical area of 2772.40 squ.km. constituting 0.90 percent of the total geographical area of the State.
4.3 Bhopal being the capital city of Madhya Pradesh has the head quarters of almost all the
government departments with secretariat as an apex body of all administrative functions. 4.4 The Bhopal district has 505 inhabited villages with 194 Gram Panchayats delegated with
various powers of administration in view of 73rd constitutional amendment. The district has two development Blocks and two tahsils that indicate for area wise smallness of the district along with 35 number of police stations for administration of law and order.
4.5 The average annual rainfall of the district is around 1100 m.m., mainly concentrated over
the months of June to September and mainly received from the monsoon winds coming from Arabean Sea. The average maximum temperature during summer is around 410 Celsius while average minimum temperature during winter is around 100 Celsius. Over the years the district has come within the category of extreme climate which otherwise used to be a pleasant area of moderate climate.
4.6 The total population of the district as per census 2001 is 1843510 which is 3.80 percent to
the total population of the State. Of the total population of the district the total rural population is 360792 persons constituting 19.57 percent to total population of the district while urban population is 1482718 which is 80.43 percent to total population. The percentage of scheduled caste population to total population as per census 2001 is 14.00 while that for scheduled tribe population is 2.24. The percentage of population within the age group of 15 to 59 years of age [considered to be the labour force] is 55.31 that indicates broadly the magnitude of the problem of providing gainful employment to the employment seekers. The total number of persons engaged in agriculture occupation [both main and marginal] in Bhopal district as per census 1991 is 93031 constituting 5.05 percent to total population and 25.79 percent to rural population. The lesser percentage of population of farming community clearly shows that agriculture is not the main stay of the population of Bhopal district. The following indicators relating to agriculture will further show the extent of agriculture activities in Bhopal district.

51
Table No. 4.1 Important Indicators Relating to Agriculture
Sl. No.
Indicators District Bhopal
State of Madhya Pradesh
1 2 3 4 1 Percentage of forest area to total geographical area, ha 15.83 26.65 2 Net cropped area as percent to total geographical area,
ha 57.19 49.02
3 Per-capita net cropped area [Hect.] 0.08 0.25 4 Per-capita gross cropped area [Hect.] 0.12 0.34 5 Percentage of double cropped area to net cropped area,
ha 45.91 35.49
6 Net area irrigated as percent to net cropped area, ha 48.43 37.56 7 Gross area irrigated as percent to gross cropped area, ha 33.19 28.54 8 Per-capita production of food-grains [Kg.] 100 266 9 Per hectare use of fertilizer [Kg.] 62.25 46.21 10 Gross value of agriculture produce-per hect. [Rs.] 11701 11968 11 Per hectare yield of agriculture produce [Kg.]*
a) Paddy 727 1058 b) Wheat 1837 1867 c) Jowar 1216 1342 d) Maize 1566 2072 e) Gram 1002 932 f) Tuar 550 825 g) Soybean 1076 1132
12 Electrified villages as percent to total inhabited villages 100 97.04 13 Energised pump sets per thousand hectare 73 60
*Figures relate to the year 2003-2004 [Final Forecast] 4.7 One typical indication as derived from the above table is that though in indicators like
percentage of double cropped area to net cropped area, net area irrigated as percent to net and gross cropped area the position of Bhopal district is ahead of the State but per hectare yield of most of the crops is lower than the State average which is mainly due to the drought conditions at Bhopal for the last two years.
DETAILS OF KRISHI VIGYAN KENDRA, BHOPAL BASED ON SECONDARY INFORMATION 4.8 Established in the year 1979 the K.V.K. is located in the Nabibagh, Berasia Road area of the
capital city of Bhopal. The institution is being run under the supervision of Central Institute of Agriculture Engineering, Government of India with Director as the head of the institution. The K.V.K. at present has 12 number of technical personnel and four number of non-technical personnel. The technical staff consists of Training Associates and one Principal Scientist as incharge of the institution. The K.V.K. has its own administrative building with the existence of farmers hostel and threshing floor. Besides, the K.V.K. has its own demonstration units relating to dairy, poultry and farm pond for acquaculture etc. The farm area of the K.V.K. is 20 hectare – entirely cultivated and irrigated. It has 2 number of wells, 4 number of tube –wells, 2 number of farm ponds and 6 number of electrically energized pump sets. As on the date of the survey the institution has 2 number of jeeps and one bus.
4.9 The K.V.K. has adequate number of agricultural implements as detailed below;

52
1. Tractor – 1 8. Thresher – 2 2. Trolly – 1 9. Leveller – 1 3. Harvester – 2 10. Tractor drawn ferti-seed drill – 2 4. M.B. Plough –2 11. Planter – 2 5. Cultivator – 2 12. Power Weeder – 2 6. Bund Farmer – 1 13. Hand Weeder – 50 7. Scrapper – 1 14. Hort. Implements/tools – 2 sets
These variety of implements are, more or less, sufficient to do the extension work with
reasonable efficiency. 4.10 Regarding budget allocation, the K.V.K. receives an average allocation of Rs. 31.35 lakh per
year against which the average expenditure is around Rs. 29.21 lakh per-annum. The table below shows the details;
Table No. 4.2
Budget Allocation and Expenditure Rs. Lakh
2001-2002 2002-2003 2003-2004 Sl. No.
Particulars
Alloca-tion
Expend. Alloca-tion
Expend. Alloca-tion
Expend.
Remarks
1 2 3 4 5 6 7 8 9
I. RECURRING ITEMS 1 Pay and
Allowances 23.00 23.80 25.00 25.56 30.00 29.50
2 Travelling Allowances
0.50 0.27 1.00 0.31 0.80 0.30
3 Contingencies 2.05 1.97 3.10 1.33 4.10 4.60 Total – I 25.55 26.04 29.10 27.20 34.90 34.40
II. NON-RECURRING ITEMS 4 Equipments - - - - 4.50 -
Tractor
replacement Total – II - - - - 4.50 - Grand Total
I+II 25.55 26.04 29.10 27.20 39.40 34.40
4.11 The above table shows the matching trend of expenditure against the allocation with gradual
increase in allocation to cover-up cost over-runs. 4.12 The information regarding Technical performance has been collected under the heads of;
- Vocational Training - In-service Training - Front Line Demonstration - On Farm Testing.

53
4.13 In what follows an attempt has been made to present the details of the above mentioned items of technical performance.
VOCATIONAL TRAINING 4.14 Being one of the important items of the training, this method is not only limited to aspects of
agriculture only but extends to cover-up areas for providing self-employment. The table below shows the details;
Table No. 4.3
Status of Vocational Training No. of training in 2003-2004 Sl.
No. Subject
Adopted Villages
Cluster Villages
Other Villages
Total no. of trainees
2003-2004 1 2 3 4 5 6 1 Crop Production 10 6 4 398 2 Horticulture 9 4 4 319 3 Plant Protection 6 4 0 173 4 Veterinary Services 8 0 0 233 5 Home Science 3 0 0 42 6 Ag. Engineering 5 0 0 125 7 Training of Rural Youth for
Self Employment
a. Horticulture 2 2 1 49 b. Ag. Engineering 4 3 1 75 c. Animal Science 1 2 2 66 d. Home Science 2 2 8 211 Total 50 23 20 1691
Note : Other villages [Col. 5] indicate those villages of the district where the training programmes of the Agriculture Department are imparted through K.V.K.
4.15 The above table shows that total number of training programmes organized relating to
vocational training in the year 2003-2004 was 93 which was satisfactory. The subjects like crop production, horticulture and veterinary services attracted the maximum number of trainees i.e. 23.54 percent, 18.86 percent and 13.78 percent to the total number of trainees respectively which seems obvious in view of the basic objective of the K.V.K. for enhancing agriculture production and making its services more viable. The total number of 401 trainees [23.71%] participating in various self employment oriented training programmes in one year is indicative of the fact that the villagers are not very confident of such trainings which hardy guarantee any placement. They usually find such efforts per-functory. However, participation of 211 trainees [mostly females] in programmes relating to home science is somewhat encouraging from the view point of self employment.
IN SERVICE TRAINING 4.16 In service training is provided to the field functionaries of Agriculture, Veterinary,
Horticulture and Forest Departments. The following table shows the details of the training provided.

54
Table No. 4.4 Status of In-service Training
No. of training 2003-2004
Sl. No.
Subject
On campus Off campus
Total number of trainees 2003-
2004 1 2 3 4 5 1 Horticulture 1 - 24 2 Agriculture Engineering 5 - 63 Total 6 - 87
4.17 Though the number of training programmes conducted in the year 2003-2004 is
satisfactory but the inclusion of more subjects like Crop Production and Home Science would have been more fruitful.
FRONT LINE DEMONSTRATION 4.18 The special features of front line demonstrations are;
- These demonstrations are conducted under the close supervision of the scientists of the KVK.
- Only newly released technologies or those likely to be released in near future are selected for the front line demonstrations.
- Front line demonstrations are organized in a block of two to four hectares of land involving all those farmers whose plots fall in the identified demonstration blocks.
- Only critical inputs and training are provided from the scheme budget. Remaining inputs are supplied by farmers themselves.
- The target audience of front line demonstrations is both farmers and the extension officers.
- Front line demonstrations are supposed to generate data relating to factors leading to higher crop yields and constraints under various farming conditions.
4.19 The table below shows the number of front line demonstrations conducted during the year
2003-2004. Table No. 4.5
Status of Front Line Demonstrations No. of demonstrations 2003-2004 Sl.
No. Subjects
Adopted Villages Cluster Group of Villages 1 2 3 4 1 Pulses 24 20 2 Oil Seeds 20 28 3 Other than pulses and oilseeds 87 94 Total 131 142
4.20 The total number of demonstration both in adopted and cluster group of villages which
comes to 273 in the years 2003-2004 is some what satisfactory. The demonstrations in the other group mainly concentrated over wheat, brinjal, cauliflower and tomato.

55
ON FARM TESTING 4.21 On farm testing is a part of adaptive research that takes into account existing technology and
its application over defined areas and defined group of farmers. 4.22 The procedure of on farm testing has five steps viz.,
- Diagnosis - Planning - Experimentation - Assessment/evaluation of results - Recommendation and diffusion.
DIAGNOSIS 4.23 In this step, an understanding of farmer’s circumstances and practices is developed in order
to understand the farming system, possible productive problems and offer possible solutions. It is a continuous process practiced in every cycle of research. Normally the Participatory Rural Appraisal [P.R.A.] technique is used for having an insight into the problems of farming communities.
PLANNING 4.24 The planning involves setting-up of priorities in order to improve research efficiency in
terms of research benefits/costs by identifying following kinds of problems;
- Problems causing large productive loss. - Problems that occur frequently. - Problems that affect many farmers and their major crops.
EXPERIMENTATION 4.25 This step includes exploring production problems, testing possible solutions and
demonstrating them on the farms. ASSESSMENT 4.26 Under this phase the results of on farm testing are analysed taking primarily into
consideration the reactions and opinions of farmers. The results of the assessments are then used to plan future research.
RECOMMENDATION AND DIFFUSION 4.27 On the basis of on farm testing the researchers formulate recommendations/ non-
recommendations for demonstration on larger area. The diffusion of new technology is done mainly be the farmer’s who once convinced of the benefits of new technology advise their fellow cultivators to adopt the system.
4.28 Against the background of above mentioned procedure the status of “On Farm Testing” in
the year 2003-2004 has been shown in the following table;

56
Table No. 4.6 Status of On Farm Testing
No. of demonstration
2003-2004
Sl. No.
Subject
Adopted Villages
Cluster group of Villages
1 2 3 4
1 Integrated weed management in Soybean 10 10
2 IPM in Soybean 10 10
3 Diversification in Soybean 10 10
4 Balanced fertilizer [IPNM] in Soybean 10 10
5 IPM for pod borer in Chickpea and Pigeonpea 10 10
6 Integrated wilt management in Chickpea and Lentil 10 10
7 IPM shoot and fruit borer in Brinjal 10 10
8 Inter cropping in Mango Orchard 10 10
9 Control of citrus cancer in Lemon 10 10
10 Control of leaf curl virus in solanacious vegetables [Potato, Chilli, Brinjal, Tomato]
10 10
Total 100 100 IPM – Integrated Pest Management 4.29 The number of “On Farm Testing” being 100 in the year 2003-2004 is somewhat
satisfactory. The spread of existing technology particularly that of pest control through forward linkages by the farmers who must have extended the knowledge to their fellow farmers has definitely made a dent towards arresting the spread of pest in the crop, thereby improving the quality of agriculture production. However a continuous monitoring of the impact of On Farm Testing is necessary to keep a record of the positive effects of such efforts.
4.30 Besides organizing training courses as laid down in the mandate of K.V.K. i.e. Vocational
Training, In-service Training, Front Line Demonstration and On Farm Testing, the K.V.K., Bhopal has also organized various other training programmes in liaison with departments of the state government. The table below shows the details;

57
Table No. 4.7 Record of other Training Courses
2001-2002 2002-2003 2003-2004 Sl. No.
Topic Duration
Days No. of training courses
No. of partici-pants
No. of training courses
No. of partici-pants
No. of training courses
No. of partici-pants
Remarks
1 2 3 4 5 6 7 8 9 10 1 Crop Production 2 9 336 6 164 5 198 Directorate of
Agriculture 2 Women in Agriculture 6 3 118 - - - - M.P. Mahila
Arthik Vikas Nigam
3 Plant Protection 2 1 45 9 23 8 293 NATP 4 Horticulture 2 4 205 1 15 1 10 NATP 5 Ag. Engineering 2 3 100 3 81 2 21 NATP 6 Animal Science 2 7 353 2 25 1 34 NATP 7 Medicinal Crops 7 - - 1 50 2 63 Directorate of
Horticulture 8 Organic Farming 2 - - 2 84 - - NATP 9 IPNM 2 - - - - 4 226 NATP and
Directorate of Agri., M.P.
10 Agro-forestry 2 - - - - 1 23 NATP 11 Water Management 2 - - - - 3 97 NATP Total - 27 1157 24 442 26 965
IPNM – Integrated Pest and Nutrition Management NATP – National Agriculture Technology Project 4.31 The above table shows that most of the training courses organized had the duration of two
days only which, basically, gives an impression that such courses were organized as a matter of formality to achieve certain target instead of transacting business sincerely. Every training programme may be minimum of four days with maximum participation of 35 persons to make the business transaction meaningful. The above table brings out one fact very clearly that farmers are more interested in the programmes like crop production, plant protection, horticulture and animal science which persistently attracted more number of farmers. The programmes like organic farming, agro-forestry and water management were not very popular as the participation by the farmers were poor. Therefore, it is suggested to concentrate more on programmes like crop production, women in agriculture, plant protection, horticulture , agriculture engineering and animal science as these are the core spheres meaningful to farmers as a source of their income. Gradually the training schedule may be extended to cover the areas of organic farming, medicinal crops agro-forestry and water management. The above suggestion is substantiated by the fact that since in Madhya Pradesh 59.33 percent of land holdings belong to marginal and small farmers, intensive emphasis on training relating to crop production is required to enhance the agricultural income. Once the agriculture becomes sustainable to such categories of farmers the shift in emphasis over organic farming, medicinal crop rearing etc may be attempted.

58
4.32 One of the important functions of the K.V.K. is to conduct specific research to improve the agriculture production both quantitatively and qualitatively. The table below shows the details;
Table No. 4.8 Status of Specific Research
Impact over Sl. No.
Topic of Research Year
Production Pest Control
Improved Animal Breed
1 Optimising Planting Density in Soybean, Groundnut and Pigeon Nut
2002-2004 30-50% increase over F.P.
Reduced by 7%
2 Integrated Weed Management of Soybean
2002-2004 50% increase over F.P.
Reduced by 80%
3 Development of IPNM system for Soybean, Wheat
2002-2004 44% increase over F.P.
- -
4 Alternative crops/ cropping system for Soybean
2002-2004 100% Reduced by 36.6%
5 I.P.M. for pod borer in pulses 2002-2004 60% Reduced by 25%
6 Agri - Hort. System 2002-2004 25.30% -
7 Integrated Animal Production system
2002-2004 100% Reduced by 41%
Increased by 10-15%
FP – Farmers Practice 4.33 The impact of the specific research as mentioned above is satisfactory. 4.34 Each K.V.K. is supposed to hold the meeting of Scientific Advisory Committee twice in a
year for performing following functions; - Providing necessary guidance and leadership in developing infrastructure facilities and
thereby supporting the Kendra to fulfil its objectives. - Reviewing of the annual and five year plans of the Kendra. - Reviewing the progress of the activities and achievements and offering necessary
guidance/suggestions to improve the functioning of the Kendra. - Approval of the Annual Accounts of the Kendra before the same is sent to the Chartered
Accountant/Statutory Auditor for audit. - Adoption of the Statement of Audited Accounts before the same is sent to the Council. - Approval of the recommendations of the Recruitment/Selection committee for appointment
of staff on vacant posts.

59
4.35 The Scientific Advisory Committee will consist of fo llowing members; 1. Head of the host institution Chairperson 2. Director, Extension of concerned SAU Member 3. Zonal Coordinator of the concerned zone Member 4. Representative of ICAR Instt./ICAR Regional Research Station if
located in the district or nearby Member
5. Associate Director Research & Extension of the Zonal Research Station in which KVK is located
Member
6. District officers of the line departments such as Agriculture, Horticulture, Animal Husbandry, Soil conservation, Social/Agroforestry, Sericulture, Fisheries, Irrigation, Social Welfare, Small Scale Industries etc.
Members
7. Representative of the Lead Bank of the District Member 8. Farm Radio Officer of the AIR in which KVK is located Member 9. Representative of Doordarshan Centre in which KVK is located Member 10. Two representatives of the farmers - one small and one big
nominated by the Head of the Institution Member
11. Two representatives of Farm Women nominated by Head of the Institution
Members
12. Training Organiser, KVK Member Secretary 4.36 The K.V.K., Bhopal has conducted the meeting twice in a year as laid down by I.C.A.R. and
availed necessary guidance for preparing Five Year Plans of the Kendra and other administrative guidance for efficient functioning of the K.V.K.
4.37 The K.V.K., Bhopal has continuously interacted with district administration, three-tier
system of Panchayati Raj Institutions and progressive cultivators of the district and took valuable guidance from them. Publicity measures like organizing Kisan Melas, Field Days, use of Audio-Visual Aids, arranging T.V. Interviews and Radio talks were attempted to spread the knowledge about utility of K.V.K. among rural population.
RESULTS OF THE SURVEY – VILLAGE PARTICULARS 4.38 As stated earlier the study has covered sixty villages @ ten villages per K.V.K. with
following bifurcations;
- Three numbers of Adopted Villages. - Six numbers of Cluster Villages. - One number of Control Village. The bifurcation as shown above is common to all the six K.V.Ks. covered under the study. The table below gives a few important demographic details of the selected villages of K.V.K., Bhopal;

60
Table No. 4.9 Demographic Particulars
Of which Sl. No.
Name of the Village
Name of the Development
Block
No.of househ
olds ason date
servey
Total population Census
2001
Males Census 2001
Females Census 2001
Proportion of S.C.
population [%]
Proportion of S.T.
population [%]
Literacy rate [%]
House-hold size
1 2 3 4 5 6 7 8 9 10 11 ADOPTED VILLAGES
1 Khajuri Phanda 121 941 503 438 14.30 7.70 62.00 6 2 Polashgunj Berasiya 51 349 205 144 12.57 5.16 52.97 6 3 Mugliahat Phanda 310 1867 964 903 24.90 - 58.80 6 Total – I 482 3157
[35.96] 1672
[35.90] 1485
[36.03] - - - -
CLUSTER VILLAGES 4 Sonkatch Berasiya 109 751 397 354 37.90 12.30 57.70 5 5 Kolukhedi Berasiya 81 497 273 224 27.00 4.20 66.50 5 6 Kurana Phanda 131 1677 882 795 52.50 1.30 54.90 6 7 Ratatal Phanda 119 656 364 292 7.80 - 52.60 6 8 Ratibad Phanda 49 335 170 165 10.40 1.50 59.90 5 9 Khamkhedi Phanda 215 1408 733 675 34.40 3.10 56.90 6 Total – II 704 5324
[60.66] 2819
[60.54] 2505
[60.79] - - - -
CONTROL VILLAGE 10 Manikhedi
Kot Phanda 59 297 166 131 7.70 - 53.20 6
Total – III 59 297 [3.38]
166 [3.56]
131 [3.18] - - - -
Grand Total I+II+III 1245 8778 [100]
4657 [100]
4121 [100]
- - - -
Source – Census 2001 Note – Figures in brackets show percentage to total. 4.39 The total population of the ten identified villages as per census – 2001 is 8778
constituting 2.59 percent of the total rural population of district Bhopal. The adopted villages cover 35.96 percent of the population as compared to total population of ten identified villages covered under the study while for the cluster villages the percentage population to total population of ten villages is 60.66 and that for control village the percentage is 3.38. The largest village, population wise is Mugalia Hat [1867 persons] while the smallest village is Ratibad [335 persons]. The preponderance of males over females in ten identified villages is obvious as the sex ratio [female per 1000 males] ranged between 971 in village Ratibad to 789 in village Manikhedi Kot. In all the villages the percentage of S.C. population is more than the S.T. population. The literacy rate that ranged between 52.60 percent in village Ratibad to 66.50 percent in village Kolukhedi is close to the district percentage literacy level of 64.27 and state level of 64.11 percent. The impact of the proximity of the capital city of Bhopal has reflected over the literacy levels. Similarly the average size of the household being 6 persons is mainly due to the positive impact of family welfare measures implemented over the years.
WORK FORCE 4.40 An analysis of the information regarding workforce for all the ten villages covered under the
study will give an idea of the persons engaged in different occupation and also the extent of dependent population not pursuing any occupation. The table below shows the details;

61
Table No. 4.10
Status of Work Participation Sl. No.
Name of the Village Work participation rate [%]
Proportion of main workers [%]
Proportion of Marginal workers
[%]
Proportion of Non-workers [%]
Person Male FemalePerson Male Female Person Male Female Person Male Female1 2 3 4 5 6 7 8 9 10 11 12 13 14
ADOPTED VILLAGES 1 Khajuri 29.10 45.10 10.70 26.80 41.60 9.80 2.30 3.60 0.90 70.90 54.90 89.30 2 Polashgunj 42.90 32.80 11.50 21.90 32.70 5.10 24.00 12.60 38.90 52.10 46.10 55.90 3 Mugaliahat 48.00 52.10 43.60 20.20 35.90 3.50 27.70 16.20 40.10 52.00 47.90 56.40 CLUSTER VILLAGES 4 Sonkatch 40.90 48.10 32.80 30.80 39.00 21.50 10.10 9.10 11.30 59.10 51.90 67.20 5 Kolukhedi 24.10 39.20 5.80 17.10 28.20 3.60 7.00 11.00 2.20 75.90 60.80 94.20 6 Kurana 35.20 44.70 24.80 18.90 31.70 4.70 16.30 12.90 20.10 64.80 55.30 75.20 7 Ratatal 44.40 50.30 37.00 29.00 40.70 14.40 15.40 9.60 22.60 55.60 49.70 63.00 8 Ratibad 56.40 58.20 54.50 26.90 44.70 8.50 29.60 13.50 46.10 43.60 41.80 45.50 9 Khamkheda 34.20 44.20 23.30 25.70 43.20 6.70 8.50 1.00 16.60 65.80 55.80 76.70 CONTROL VILLAGE 10 Manikhedi Kot 56.90 55.40 58.80 37.40 34.30 41.20 19.50 21.10 17.60 43.10 44.60 41.20 Source – Census 2001 4.41 The above table shows that the work participation rate which ranged between 24.10% in
village Kalukhedi to 56.40% in village Ratibad is, in general, more among males than females. In villages Ratibad and Manikhedi Kot where female work participation rate is 54.50 percent and 58.80 percent respectively is somewhat remarkable that shows the awareness among female population about value of work for augmenting family income. The proportion of marginal workers as compared to main workers is usually low that shows the dearth of avenues of subsidiary occupations in our area of study. Generally proportion of female marginal worker is more than males which seems obvious as the females take up jobs to fill-up their spare hours for enhancing family income. The proportion of non-workers, which ranged between 43.10% in village Manikhedi Kot to 75.90 percent in village, Kolukhedi presents a dismal picture as it shows the higher number of dependent population consisting of children, old persons and in firms who are not in a position to contribute much towards family income.
4.42 In all the ten number of villages covered under the study, agriculture remains to be the
main occupation. The table below shows the occupational distribution;

62
Table No. 4.11 Occupational Distribution
Sl. No.
Name of the Village
Proportion of Cultivators to total
Workers [%]
Proportion of Agr. Labourers to total
workers [%]
Proportion of workers in
household industries to total workers [%]
Proportion of other workers to total
workers [%]
Person Male Female Person Male Female Person Male Female Person Male Female1 2 3 4 5 6 7 8 9 10 11 12 13 14
ADOPTED VILLAGES 1 Khajuri 32.80 37.90 8.50 29.20 30.00 25.50 1.50 1.80 0.00 36.50 30.40 66.00 2 Polashgunj 50.90 51.10 49.90 32.00 29.50 40.90 2.90 3.00 0.00 32.00 29.90 27.00 3 Mugaliahat 52.50 52.20 52.80 33.70 27.30 41.90 4.60 5.60 3.30 9.30 14.90 2.00 CLUSTER VILLAGES 4 Sonkatch 32.20 33.50 30.20 47.20 40.30 58.60 9.40 9.40 9.50 11.10 16.80 1.70 5 Kolukhedi 57.50 57.00 61.50 29.20 28.00 38.50 0.80 0.90 0.00 12.50 14.00 0.00 6 Kurana 41.60 41.10 42.60 37.70 31.70 49.70 1.40 2.00 0.00 19.30 25.10 7.60 7 Ratatal 41.90 49.20 29.60 47.40 36.10 66.70 0.00 0.00 0.00 10.70 14.80 3.70 8 Ratibad 57.10 57.60 56.70 33.90 30.30 37.80 0.50 1.00 0.00 8.50 11.10 5.60 9 Khamkheda 40.10 42.90 34.40 41.60 35.20 54.80 0.00 0.00 0.00 18.30 21.90 10.80 CONTROL VILLAGE 10 Manikhedi Kot 61.50 56.50 67.50 32.50 35.90 28.60 0.00 0.00 0.00 5.90 7.60 3.90 Source – Census 2001 4.43 The proportion of cultivators to the total workers ranged between 32.20 percent in village
Sonkatch to 61.50 percent in village Manikhedi Kot while the proportion of agricultural labourers to total workers ranged between 29.20 percent in villages Khajuri and Kolukhedi to 47.40 percent in village Ratatal. Usually the proportion of cultivators to main workers is more than that of agricultural labour. With the exception of the villages Mugaliahat, Kalukhedi, Kurana and Monikhedi Kot, in the rest of the villages the proportion of male cultivators is more than that of female while in villages Kolukhedi and Manikhedi Kot the proportion of female cultivators is much higher, which is an encouraging indicator that indicates the positive role of females, associating themselves with their male counterpart to enhance family income. The proportion of female agricultural labourer, in general, is higher than that of males which confirms one basic fact that males from such category usually do some odd jobs or migrate to the nearby towns in search of work while their female counterpart continues with various functions of agricultural labour like harvesting, threshing etc. The situation of proportion of workers in household industries to total worker is far from being encouraging as it ranged between 0.90 percent in village Kolukhedi to 9.40 percent in Sonkatch. In villages like Ratatal, Khamkheda and Manikhedi Kot secondary sector occupations are not existing. Usually in India in general and in Madhya Pradesh in particular the status of secondary sector occupations in villages is poor. One of the important factors of rural poverty is absence of such occupations that encourage migration during lean season of agriculture. Such sort of secondary occupation may be encouraged through proper implementation of various welfare schemes particularly relating to rural development being run by the government. Similarly the proportion of other workers to total workers which ranged between 5.90 percent in village Manikhedi Kot to 36.50 percent in village Khajuri indicates the preponderance of odd jobs with urban orientation that induces a particular portion of the work force to remain in nearby urban areas because of the lack of full time employment in agriculture. What is therefore required is the encouragement of

63
household industries through various subsidy schemes of the government to arrest the migration among agriculture labourers and persons involved in other category of work by enhancing their family income.
LAND USE DETAILS 4.44 The table below shows the land use details of the identified ten villages covered under the
study.
Table No. 4.12 Land Use Details
In Hectare Irrigation
Sl. No. Name of Village
Total geogra-
phic covered
Gross cropped
area Forest
Not available
for cultiva-
tion
Culti-vable waste land C
anal
Pond
Wel
l
Oth
ers Total
irriga- ted area
Un- irriga-
ted
1 2 3 4 5 6 7 8 9 10 11 12 13 ADOPTED VILLAGES
1 Khajuri 373 196 [52.55] 2 175 44 15 - 70 10
(TW) 95
[48.47] 57
2 Polashgunj 356 347 [97.42] - 15 6 - - 12 92
(TW) 104
[29.97] 237
3 Mugaliahat 623 585 [93.90] - 38 57 - - 96 198
(TW) 294
[50.26] 234
CLUSTER VILLAGES
4 Sonkatch 640 561 [87.66] - 79 48 - - 65 34
(TW) 99
[17.65] 414
5 Kolukhedi 183 162 [88.52] - 21 13 - - 50 36
(TW) 86
[53.09] 63
6 Kurana 745 671 [90.07] - 74 52 - - 175 200
(TW) 375
[55.89] 244
7 Ratatal 398 236 [59.30] 70 92 68 6 - 27 16
(TW) 50
[21.19] 118
8 Ratibad 403 340 [84.37] - 63 37 - - 20 25
(TW) 45
[13.24] 258
9 Khamkheda 772 667 [86.40] - 105 119 15 - 25 147
(TW) 192
[28.79] 356
CONTROL VILLAGE
10 Manikhedi Kot 552 452 [81.88] 87 13 7 - - 13 115
(TW) 228
[50.44] 217
Total 5045 4217 [83.59] 159 675 451 36 - 553 979 1568
[37.18] 2198
Source – Census – 2001 Note – Col-4 Figures in bracket show percentage to total geographical area. Col-12 Figures in bracket show percentage to gross cropped area. 4.45 The total gross cropped area of the identified ten villages is 83.59 percent of the total
geographical area of ten number of villages that confirms the fact that the main occupation of these villages is agriculture. The survey area is not rich in forest resources as the total area under forest is only 3.15 percent to total geographical area of the ten identified villages.

64
4.46 Regarding irrigation, the percentage of gross irrigated area to gross-cropped area is 37.18 for ten identified villages which is more than the district average of 33.19 percent and state average of 28.54 percent. In adopted three villages this figure ranged between 29.97 percent [village Polashganj] to 50.26 percent [village Mugalia hat] whereas in cluster villages this range was between 13.24 percent [village Khamkheda] to 55.89 percent [village Ratatal]. Minikhedi Kot, being a control village having no interference of K.V.K., has this percentage to the tune of 50.44. The overall status of irrigation is comparatively lagging behind in case of Adopted Villages though not dismal. The selection of such three adopted villages seems justified as the cultivators of such areas having paucity of water need more intensive training for enhancing crop productivity.
4.47 Cultivable waste land that provides promise for expanding agricultural activities, is 451 hect in
identified ten villages which is 8.94 percent to total geographical area. The magnitude of this potential area is quite high in Adopted and Cluster villages as against Control village of Manikhedi Kot where only 7 hectares are under cultivable waste. The selection of these nine number of villages for intervention of K.V.K. is again justified for expansion of agricultural activities through the inputs of new and already existing technologies.
RURAL ELECTRIFICATION 4.48 Un-interrupted and adequate power supply is essential for economic development,
particularly in the sectors of agriculture and industry. The table below shows the status of rural electrification in ten identified villages;
Table No. 4.13
Status of Rural Electrification Villages Electrified Regular supply Sl.
No. Name of the Village
Yes No Yes No If Regular supply
(Actual hrs. of supply) 1 2 3 4 5 6 7 ADOPTED VILLAGES 1 Khajuri 1 0 0 1 12 2 Polashganj 1 0 0 1 12 3 Mugalia Hat 1 0 0 1 12 CLUSTER VILLAGES 4 Sonkatch 1 0 0 1 12 5 Kolukhedi 1 0 0 1 12 6 Kurana 1 0 0 1 12 7 Ratatal 1 0 0 1 12 8 Ratibad 1 0 0 1 12 9 Khamkheda 1 0 0 1 12 CLUSTER VILLAGE
10 Manikkhedi Kot 1 0 0 1 10 Total 10 0 0 10
4.49 The above table shows that all the ten number of villages covered under the study are
electrified with irregular power supply situation with hours of supply ranging between 10 hours in village Manikhedi Kot to 12 hours in rest of the 9 villages. Looking to the overall power shortage condition of the state the hours of power supply seem tolerable.
4.50 The direct impact of rural electrification is visible in the form of pump sets energized. Since
the main occupation of these identified villages is agriculture, energisation of pump sets is a definite support factor for advancement of agricultural scenario of the area. The table below shows the status of pump sets energized.

65
Table No. 4.14 Status of Pump Sets Energised
Pump set energized Sl. No.
Name of the Village Electricity (No.) Diesel (No.)
1 2 3 4 ADOPTED VILLAGES 1 Khajuri 60 12 2 Polashganj 70 2 3 Mugalia Hat 400 20 CLUSTER VILLAGES 530 34 4 Sonkatch 60 5 5 Kolukhedi 85 7 6 Kurana 180 4 7 Ratatal 300 4 8 Ratibad 50 0 9 Khamkheda 150 20 CLUSTER VILLAGE 825 40
10 Manikkhedi Kot 35 0 Total 1390 74
4.51 The total number of pump sets energized is 1464 which is 8.65 percent of total number of
pump sets energized in district Bhopal that stands at 16,923 for the year 1999-2000. This is, undoubtedly, a bright picture that denotes sincere effort of the rural population of the identified area for pursuing agricultural occupation. It is worth mentioning that for district Bhopal the number of energized pump set per thousand hectare is 73 as against the state average of 60 that further underlines the fact of sincere attitude of the farmers of district Bhopal in general towards their occupation relating to agriculture which is their sustainable source of livelihood.
4.52 Energisation of pump sets by diesel is less popular than energisation of pump sets through
electricity. The total number of pump sets energized ranged between 420 in village Mugalia Hat to 35 Manikheda Kot.
4.53 The above table brings out another fact that in adopted and cluster villages the rate of
energisation per village is more than that of control village. The support of K.V.Ks. in these villages is definitely one of the contributory factor since the cultivators are given constant technological input inducing them to resort to better modes of cultivation.
HOUSEHOLD INDUSTRIAL UNITS 4.54 There is complete absence of the existence of any household industrial units in all the
ten number of villages covered under the study. Though the census figures as shown in table no. 4.11 vouch for the presence of such units in scanty manner but such information relates to the year 2001 which with the passage of time might have become none existent or insignificant from income generation point of view. Since the villages are agriculturally advanced any attempt to establish agro-based household industrial units will certainly augment the existing income levels.

66
COOPERATIVES 4.55 Cooperative movement in the country is basically aimed at improving the socio-economic
status of the weaker section of society and, in turn, arrest the tendency of their exploitation. The important strategies envisaged for the development of cooperative sector in the Tenth Plan are to enhance membership base of the cooperative credit societies to cover hundred percent families engaged in agricultural activities, enhancing availability of loan for purchase of agricultural inputs by the cultivators and emphasis on distribution of dividends among the members. Against such background the status of the existence of cooperative societies in our area of study is not very encouraging. The table below shows the details;
Table No. 4.15
Cooperative Societies Sl. No.
Name of the Village Agri.co-operative
credit society
Fishermen co-
operative society
Milk co-operative society
Co-operative, marketing
society
Other specify
1 2 3 4 5 6 7 ADOPTED VILLAGES 1 Khajuri 0 0 0 0 0 2 Polashganj 0 0 0 1 0 3 Mugalia Hat 0 1 1 1 0 CLUSTER VILLAGES 4 Sonkatch 0 0 0 1 0 5 Kolukhedi 0 0 0 0 0 6 Kurana 1 0 1 0 0 7 Ratatal 0 0 0 0 0 8 Ratibad 0 0 0 0 0 9 Khamkheda 0 0 1 0 0 CLUSTER VILLAGE
10 Manikkhedi Kot 0 0 0 0 0 Total 1 1 3 3 0
4.56 Only 8 number of cooperative societies are existing in our area of study. Village Mugalia
Hat has 3 number of cooperative societies which seems somewhat extra-ordinary, based on the fact that the total population of the village is 1867 persons with work participation rate of 48.00 percent along with proportion of cultivators to total workers as 52.50 percent. The information as contained in the table confirms the extent of awareness of the inhabitants of this village.
4.57 Availability of basic and infrastructural facilities within and around the identified ten
villages are important indicators of levels of present development. BASIC FACILITIES 4.58 The table below shows the location of basic administrative facilities within and around the
ten villages selected for the study;

67
Table No. 4.16 Status of Basic Administrative Facilities
Tahsil head quarter
Block head quarter
Gram Panchayat Police station/ sub station
Sl. No.
Name of the Village
District head
quarter away from the
village,km
Within the
village 0 KM
Away from the
village KM
Within the
village 0 KM
Away from the
village KM
Within the
village 0 KM
Away from the
village KM
Within the
village 0 KM
Away from the
village KM
1 2 3 4 5 6 7 8 9 10 11 ADOPTED VILLAGES
1 Khajuri 16 16 16 0 6 2 Polashganj 22 20 20 4 12 3 Mugalia Hat 23 23 20 0 3
CLUSTER VILLAGES 4 Sonkatch 23 9 9 0 5 5 Kolukhedi 20 14 14 0 2 2 6 Kurana 17 17 16 3 7 Ratatal 19 19 18 3 7 8 Ratibad 20 20 15 0 0 9 Khamkheda 17 17 15 0 4
CLUSTER VILLAGE 10 Manikkhedi
Kot 16 16 12 5 6
Total 10 10 10 10 10 6 4 1 9
4.59 For all the identified ten villages the location of the district headquarter is a away from the village, ranging between 16 kms [villages Khajuri and Manikhedi Kot] to 23 kms [village sonkatch]. Similar is the status of distance for tahsil and block head quarters. Normally such distance factors regarding location of important administrative machineries have some sort of reverse effect over the general development of the area since the officials are not usually aware of the problems of such habitates as their visit to such areas are infrequent. However, location of Gram Panchayats within and around the identified ten villages covered under the study is advantageous since this ensures the contribution of the inhabitants of the identified villages towards framing of policy matters for the development of the area by the Gram Panchayat. Location of police station/sub station within or nearby village ensures to, some extent, the safety of the inhabitants of the villages. Though in non of the ten villages the police station/substation is located within the village but the distances are not much except for the village Polashganj where this facility is located at 12 kms away from the village.
INFRASTRUCTURAL FACILITIES - ROADS
4.60 For the development of particular area the availability of road network has always emerged
as the key factor. The table below shows the status of the availability of the road infrastructure in and around the identified ten villages.

68
Table No. 4.17 Road Infrastructure
Fair weather road Link road to all weather road
All weather road Sl. No.
Name of the Village
Within the village 0
KM
Away from the village
KM
Kharanja road within
the village
Within the village 0
KM
Away from the village
KM
Within the village 0
KM
Away from the village
KM 1 2 3 4 5 6 7 8 9
ADOPTED VILLAGES 1 Khajuri 0 0 0 0 2 Polashganj 0 0 0 1 3 Mugalia Hat 0 0 0 0
CLUSTER VILLAGES 4 Sonkatch 0 0 0 0 5 Kolukhedi 0 0 0 2 6 Kurana 0 0 0 0 7 Ratatal 0 0 0 0 8 Ratibad 0 0 0 0 9 Khamkheda 0 0 0 0
CLUSTER VILLAGE 10 Manikkhedi Kot 0 0 0 6 Total 10 10 10 7 3
4.61 Information contained in the above table reveals the satisfactory level of availability of
roads in ten identified villages. All the villages have fair weather road within the villages and also the link roads to all weather roads. Even within the every village there is Kharanja road made up of rudimentary square shaped stone. Even seven villages have all weather roads passing through the village which, undoubtedly, a remarkable situation.
Infrastructural Facilities - Railway Station, Bus Stand/Bus Stop/
Post Office/S.T.D. Booth 4.62 The table shows the details;
Table No. 4.18
Facilities Regarding Railway Station/Bus Stand/Bus Stop/Post Office/STD Booth Railway Station Bus stand/ Bus stop Post Office STD booth Sl.
No. Name of the
Village Within the
village 0 KM
Away from the village
KM
Within the
village 0 KM
Away from the village
KM
Within the
village 0 KM
Away from the village
KM
Within the
village 0 KM
Away from the village
KM 1 2 3 4 5 6 7 8 9 10
ADOPTED VILLAGES 1 Khajuri 16 0 4 5 13 2 Polashganj 22 1 2 2 3 Mugalia Hat 23 1 1
CLUSTER VILLAGES 4 Sonkatch 33 0 0 0 5 Kolukhedi 30 2 2 2 6 Kurana 17 1 0 9 0 7 Ratatal 19 0 2 15 8 Ratibad 20 1 2 9 Khamkheda 17 2 0 4
CONTROL VILLAGE 10 Manikhedi Kot 16 6 4 6 Total 10 3 7 3 7 2 8

69
4.63 For all the ten villages the facility of railway station is located far away from the village. Nearest distance of railway station is 16 kms for villages Khajuri, and Manikheda Kot. In three villages viz. Khajuri, Sonkatch and Ratatal Bus stand/Bus Stop facility is available within the village while for 7 villages the distance of this facility ranges between on km for villages Mugalia Hat, Kurana and Ratibad to 6 kms for the village Manikhedi Kot. Similarly within three villages post office is located while for rest of seven villages this facility is located within easy reachof the villagers except for village Ratatal where this facility is located 9 kms away from the village. Even the STD facilities are available within two villages while five villages viz Polashganj, Mugalia Hat, Kolukhedi, Ratibad and Khamkheda have this facility within the easy reach of one to four kms. For villages Khajuri, Kurana and Manikheda Kot this facility is located at a distance of 13 kms, 15 kms and 6 kms respectively.
4.64 The overall situation of transport and communication is satisfactory in identified ten
villages responsible for fairly advanced state of agriculture of the area under survey through accessibility of market located at nearby capital city of Bhopal. Infrastructural Facilities - Agriculture Marketing, Fair Price Shop,
Cold Storage 4.65 The fair return of agriculture produce to the farmers is as important as enhancing the
agriculture productivity. Mand i or Sub Mandi being regulated markets are meaningful destinations for fair transaction of agriculture produce. With a view to protect cultivators from the sharp practices of brokers the Government of Madhya Pradesh has established an independent Directorate of Mandi. Presently, Madhya Pradesh has about 229 Mandies and 255 Sub Mandies. The cold storage is yet another important infrastructure that helps in avoiding distress selling. The table below shows the details.
Table No. 4.19
Agriculture Marketing, Fair Price Shop and Cold Storage Regular market Weekly market Mandi Sl.
No. Name of the
Village Within the village 0
KM
Away from the village KM
Within the
village 0 KM
Away from the village
KM
Within the
village 0 KM
Away from the village KM
1 2 3 4 5 6 7 8 ADOPTED VILLAGES
1 Khajuri 3 0 16 2 Polashganj 4 4 20 3 Mugalia Hat 3 3 23
CLUSTER VILLAGES 4 Sonkatch 5 5 9 5 Kolukhedi 2 2 14 6 Kurana 3 3 27 7 Ratatal 15 15 15 8 Ratibad 2 5 25 9 Khamkheda 4 4 17
CONTROL VILLAGE 10 Minikhedi Kot 6 6 6 Total 10 1 9 10

70
Table No. 4.19 [Contd..] Agriculture Marketing, Fair Price Shop and Cold Storage
Sub Mandi Fari Price Shop Cold Storage Sl. No.
Name of the Village Within the
village 0 KM
Away from the village KM
Within the
village 0 KM
Away from the village
KM
Within the
village 0 KM
Away from the village KM
1 2 9 10 11 12 13 14 ADOPTED VILLAGES
1 Khajuri 16 0 10 2 Polashganj 2 2 22 3 Mugalia Hat 23 1 23
CLUSTER VILLAGES 4 Sonkatch 9 0 9 5 Kolukhedi 14 0 14 6 Kurana 27 0 15 7 Ratatal 19 3 19 8 Ratibad 25 2 20 9 Khamkheda 17 0 17
CONTROL VILLAGE 10 Minikhedi Kot 6 6 16 Total 10 5 5 10
4.66 The above table shows that in non of the ten identified villages regular market, mandi, sub
mandi and cold storage exist. Distances of regular markets and weekly markets are within manageable limits that denotes the existence of bigger village at nearby distance where the villagers of ten identified villages go for transaction. Mandi, sub mandi and cold storage facilities are located far away from the village boundaries of identified ten villages. The situation is some what discouraging. Agriculture being the main occupation of these village the government may organize a regular market by providing some minimum infrastructure at village Mugalia hat having population of 1867 persons which may serve as nucleus for marketing destinations of nearby adopted and cluster group of villages.
4.67 In five number of villages mostly consisting of adopted and cluster villages the facility of
fair price shops exists within village limits whereas in other five number of villages this facility is located within manageable limits that indicates the government’s initiative to protect the interests of the villagers by providing them consumables at reasonable rates.
AGRO BASED INDUSTRIAL UNITS 4.68 Agro-based industries, if exist in rural areas, add to the affluence of the area by creating
employment avenues, that, besides providing regular employment, absorbe the agriculture work force in lean season. The table below shows the existence of agro-based industries in sample villages.

71
Table No. 4.20 Status of Agro Based Industrial Units
Flour Mill Oil Mill Dal Mill Sl. No.
Name of the Village Within the
village 0 KM
Away from the village
KM
Within the
village 0 KM
Away from the village
KM
Within the
village 0 KM
Away from the village
KM
1 2 3 4 5 6 7 8 ADOPTED VILLAGES
1 Khajuri 0 16 16 2 Polashganj 2 20 20 3 Mugalia Hat 0 23 23
CLUSTER VILLAGES 4 Sonkatch 0 9 9 5 Kolukhedi 0 14 14 6 Kurana 0 5 15 7 Ratatal 0 18 18 8 Ratibad 2 2 20 9 Khamkheda 0 4 17
CONTROL VILLAGE 10 Minikhedi Kot 0 16 16 Total 8 2 10 10
Table No. 4.20 [Contd..]
Status of Agro Based Industrial Units Saw Mill Repair of Agri. Implements Sl.
No.
Name of the Village Within the
village 0 KM Away from the
village KM Within the
village 0 KM Away from the
village KM 1 2 9 10 11 12
ADOPTED VILLAGES 1 Khajuri 16 13 2 Polashganj 20 6 3 Mugalia Hat 12 3
CLUSTER VILLAGES 4 Sonkatch 9 9 5 Kolukhedi 14 14 6 Kurana 10 5 7 Ratatal 15 7 8 Ratibad 15 2 9 Khamkheda 15 4
CONTROL VILLAGE 10 Minikhedi Kot 6 10 Total 10 10
4.69 The above table shows that out of 10 villages, in 8 number of villages flour mills are located
within the village boundary while in two villages viz. Polashganj and Ratibad this facility is located 2 kms away from the village which can considered to be at the proximity of the village boundary. In non of the villages the Oil Mills exist and the locational distance is substantial except for the villages Kurana, Ratibad and Khamkheda where this facility is located at a distance of 5,2 and 4 kms respectively. “Similar is the case with Dal Mill where the locational distance range between 9 kms [village Sonkatch] to 23 kms [village Mugalia Hat]. The non-availability of facilities like saw mills in ten identified villages seems justified as the area is not rich in forest resources but total absence of any repair unit of agricultural implements seems out of place since the area is fairly advanced agriculturally. The educated youth of the villages may be encouraged through subsidy schemes of the government to establish such units which may serve the purpose of income augmentation by creating employment opportunities.

72
SOCIAL INPUTS EDUCATION ELEMENTARY EDUCATION – PRIMARY LEVEL 4.70 The Directive Principles of Constitution of India envisages provision of free and compulsory
education to all children up to the age of 14 years of age before the commencement of 21st century. Now that the 21st century has set-in, fresh dead lines have been drawn-up. The goals of the Universalisation of Elementary Education [U.E.E.] are;
- Universal access to primary schooling facility within a radius of one km and a
middle school within a radius of at least 3 kms. - Universal enrolment of children of age group of 6 to 14 years - Universal retention of all enroled children till they complete eight years of
elementary schooling.
Keeping in view the above criteria, the information has been collected from sample villages. The table below shows the details of primary level of education;
Table No. 4.21
Status of Primary Level of Education
Primary School Non formal education Sl. No.
Name of the Village Within the
village 0 KM
Within 1 KM
Within 2 KM
Within 3 KM
>3 KM Within the
village 0 KM
Away from the village
KM 1 2 3 4 5 6 7 8 9
ADOPTED VILLAGES 1 Khajuri 0 7 2 Polashganj 0 4 3 Mugalia Hat 0 0
CLUSTER VILLAGES 4 Sonkatch 0 0 5 Kolukhedi 0 0 6 Kurana 0 0 7 Ratatal 0 5 8 Ratibad 0 6 9 Khamkheda 0 3
CLUSTER VILLAGE 10 Manikkhedi
Kot 0 6
Total 10 4 6
4.71 One positive fact revealed by the above table is the existence of primary schools within the village periphery of all the identified ten number of villages that contributed for higher level of literacy rate in all the identified ten number of villages.. Non-formal education centres, which are meant for working children who can not attend the regular primary institutions, are in vogue in four villages while in rest of the six villages these centres are located within manageable distance of the village. However, due to availability of primary level institutions the location of such centres within the village is not also much required.

73
ELEMENTARY EDUCATION–MIDDLE LEVEL AND ADULT EDUCATION 4.72 The table below shows the status of middle level and adult education.
Table No. 4.22
Status of Middle Level and Adult Education Middle School Adult Education Sl.
No. Name of the
Village Within the village 0 KM
Within 5 KM
More than 5 KM
Within 1 KM
Within 2 KM
Within 3 KM
> 3KM
1 2 3 4 5 6 7 8 9 ADOPTED VILLAGES
1 Khajuri 0 5 2 Polashganj 4 3 3 Mugalia Hat 0 6
CLUSTER VILLAGES 4 Sonkatch 0 4 5 Kolukhedi 2 3 6 Kurana 0 7 7 Ratatal 0 8 8 Ratibad 2 6 9 Khamkheda 0 17
CLUSTER VILLAGE 10 Manikkhedi
Kot 6 6
Total 6 3 1 10 4.73 The above table shows that in six villages the middle school is located within the village
while in four villages the location is within the easy reach of the villagers. Since the criterion of the accessibility of the middle school is 3 kms, the eight number of villages are within the laid down criterion. In non of the villages the adult education centres exist Since the literacy rate in these ten villages is high the existence of such centers is not essential as well.
4.74 The policy relating to secondary education implies extension of the school system in
unserved areas, consolidating the existing facilities and providing special arrangements for the talented students.
4.75. In view of above policy decisions, the status of secondary level education in sample villages is
not satisfactory. The table below shows the details.

74
Table No. 4.23 Secondary Level Education
High School Higher School (+2) Sl. No.
Name of the Village In the
village 0 KM
Within 5 KM
More than 5 Km
In the village 0
KM
Within 5 KM
More than 5 KM
1 2 3 4 5 6 7 8 ADOPTED VILLAGES
1 Khajuri 6 6 2 Polashganj 10 10 3 Mugalia Hat 3 10
CLUSTER VILLAGES 4 Sonkatch 5 5 5 Kolukhedi 2 2 6 Kurana 5 5 7 Ratatal 0 7 8 Ratibad 2 6 9 Khamkheda 4 4
CONTROL VILLAGE 10 Minikhedi Kot 6 6 Total 7 3 4 6
4.76 The above table shows that in non of the villages high or higher schools [+2] exist. For high
school the location is usually within 5 km distance from the village while for higher schools this locational distance is usually more than 6 kms.
COLLEGIATE AND TECHNICAL EDUCATION 4.77 The table below shows the details
Table No. 4.24 Collegiate, Technical Education
College Industrial Training Institute Sl. No.
Name of the Village Within the
village 0 KM Within 5 KM
More than 5 Km
In the village 0 KM
Within 5 KM
More than 5 KM
1 2 3 4 5 6 7 8 ADOPTED VILLAGES
1 Khajuri 13 16 2 Polashganj 20 20 3 Mugalia Hat 10 23
CLUSTER VILLAGES 4 Sonkatch 9 33 5 Kolukhedi 30 30 6 Kurana 8 8 7 Ratatal 14 15 8 Ratibad 10 15 9 Khamkheda 17 17
CONTROL VILLAGE 10 Minikhedi Kot 16 12 Total 10 10
4.78 In non of the villages college or Industrial Training Institutes exist which seem obvious as
such institutions usually exist in tahsil or district headquarters.

75
HEALTH 4.79 Improvement in health status of the population has been one of the thrust areas in the social
development programmes of the State of Madhya Pradesh. The ultimate objective of the health and family welfare activities in the State is to achieve the goal of “Health for All” as outlined in the National Health Policy which emphasized on implementation of primary health care approach.
4.80 In pursuit of this goal, a multi-tier health and family welfare service delivery system has
been established in the State consisting of Sub-Health Centres, Primary Health Centres and Community Health Centres. Besides, civil hospitals, district hospitals and other special health care institutions have been provided for as a support to three-tier system. A mention of the norms accepted for three-tier system is given below;
a) Sub Health Centre for every 5000 population in non-tribal areas and 3000 population in
tribal areas. b) Primary Health Centre for every 30000 population in non-tribal areas and 20000
population in tribal areas.
c) Community Health Centre for every 120000 population in no-tribal areas and 80000 population in tribal areas.
4.81 In view of the population criteria for rural health facilities as shown in above paragraph the
consideration for location of only Sub Health Centres, Rural Family Welfare Centres etc. may be considered. The table below shows the details;
Table No. 4.25
Rural Health Infrastructural Sub Health Centre Rural Family Welfare Centre Sl.
No. Name of the
Village Within the village 0
KM
Within 5 KM
More than 5 Km
In the village 0
KM
Within 5 KM
More than 5 KM
1 2 3 4 5 6 7 8 ADOPTED VILLAGES
1 Khajuri 0 0 2 Polashganj 10 4 3 Mugalia Hat 0 0
CLUSTER VILLAGES 4 Sonkatch 7 7 5 Kolukhedi 2 4 6 Kurana 0 0 7 Ratatal 3 3 8 Ratibad 2 2 9 Khamkheda 4 0
CONTROL VILLAGE 10 Minikhedi Kot 6 6 Total 3 4 3 4 4 2

76
Table No. 4.25 [Contd…] Rural Health Infrastructural Government Hospital Government Dispensary Sl.
No. Name of the
Village Within the village 0
KM
Within 5 KM
More than 5 Km
In the village 0
KM
Within 5 KM
More than 5 KM
1 2 9 10 11 12 13 14 ADOPTED VILLAGES
1 Khajuri 10 10 2 Polashganj 10 10 3 Mugalia Hat 0 0
CLUSTER VILLAGES 4 Sonkatch 9 9 5 Kolukhedi 25 25 6 Kurana 5 0 7 Ratatal 3 3 8 Ratibad 5 5 9 Khamkheda 17 4
CONTROL VILLAGE 10 Minikhedi Kot 12 12 Total 1 3 6 2 3 5
Table No. 4.25 [Contd…]
Rural Health Infrastructural Private Clinic Nursing Home Sl.
No. Name of the
Village Within the village 0
KM
Within 5 KM
More than 5 Km
In the village 0
KM
Within 5 KM
More than 5 KM
1 2 15 16 17 18 19 20 ADOPTED VILLAGES
1 Khajuri 0 16 2 Polashganj 4 20 3 Mugalia Hat 0 18
CLUSTER VILLAGES 4 Sonkatch 9 5 Kolukhedi 2 25 6 Kurana 0 10 7 Ratatal 0 15 8 Ratibad 2 17 9 Khamkheda 4 10
CONTROL VILLAGE 10 Minikhedi Kot 0 6 12 Total 5 4 1 10
4.82 Against the total number of 10 villages, 3 villages have Sub Health Centres within the
village while 3 villages have this facility within 5 km limit and 3 villages have this facility at a distance of more than five kms. From the view point of accessibility the situation is satisfactory.

77
4.83 Regarding Rural Family Welfare Centres it may be seen that in four number of villages the facility is located within the geographical limit of the village while in another four number of villages the facility is located within 5 kms distance of the village while for two number of villages the facility is located more than 5 kms away from the village. The overall situation is satisfactory as the facility can be accessed by the eligible couples conveniently.
4.84 Regarding Government Hospitals, in one village [Mugalia Hat] this facility is located within
the village while in three villages the facility is located within 5 kms distance from the village and in 6 number of villages the facility is located more than 5 kms away from the village. More or less, similar is the case with the location of Government Dispensaries. As said earlier, the importance of Sub Health Centres and Rural Family Welfare Centres as Rural Health infrastructure are significant, therefore, the existence of hospitals and dispensaries are not very meaningful as these places are not much frequented by the villagers due to perpetual absence of doctors.
4.85 In most of the villages Private Clinics are within easy reach of the villagers which indicate
the confidence of the villagers on private licentiate practitioners, not necessarily a qualified doctor.
FAMILY WELFARE 4.86 Limiting the size of the family is, perhaps, the most important factor of family welfare. The
nation wide campaign of family welfare has certainly made a dent both in urban and rural areas. The table below shows the status of acceptors of family welfare measures in sample villages covered under the study;
Table No. 4.26
Status of Acceptors of Family Welfare Measures In Nos.
Sl. No.
Name of the Village
Total worker
s
Acceptors of Nirodh
(No. of Ben.)
Tubec-tomy (No.
of Ben.)
Vasectomy (No. of
Ben.)
Loop Insertion (No.
of Ben.)
Oral Pills (No. of Ben.)
Traditional Methods (No.
of Ben.) 1 2 3 4 5 6 7 8 9 1 Khajuri 274 15
[5.47] 25 [9.12] 0 7
[2.55] 0 0
2 Polashganj 190 9 [4.74]
14 [7.37] 0 2 [1.05]
6 [3.16]
0
3 Mugalia Hat 896 25 [2.79]
245 [27.34] 10 [1.12] 7 [0.78]
20 [2.23] 0
Adopted Villages 1360 49 [3.60]
284 [20.88] 10 [0.74] 16 [1.18] 26 [1.91] 0
4 Sonkatch 307 40 [19.32]
18 [5.86] 1 [0.33]
7 [2.28]
3 [0.98]
0
5 Kolukhedi 120 20 [16.67]
26 [21.67] 3 [2.50]
3 [2.50]
9 [7.50]
0
6 Kurana 591 60 [10.15]
48 [8.12] 3 [0.51]
10 [1.69] 28 [4.74] 0
7 Ratatal 291 10 [3.43]
20 [6.87] 3 [1.03]
5 [1.72]
7 [2.41]
0
8 Ratibad 189 15 [7.94]
10 [5.29] 0 3 [1.59]
7 [3.70]
0
9 Khamkheda 481 93 [19.33]
70 [14.55] 2 [Neg.] 12 [2.49] 35 [7.28] 0
Cluster villages 1979 238 [12.03] 192 [9.70] 12 [0.61] 40 [2.02] 89 [4.50] 0 10 Manikkhedi Kot 169 13
[7.69] 15 [8.88] 0 5
[2.96] 7
[4.14] 0
Control VIllage 169 13 7.69] 15 [8.88] 0 5 [2.96] 7 [4.14] 0 Total 3508 300 [8.55] 491 [14.00] 22 [0.63] 61 [1.74] 122 [3.48] 0
Note : Figures in brackets show percentage to the figures of Col -3

78
4.87 In the above table the percentage figures have been arrived at on the basis of the figures of the work force which is, strictly, not very correct. The comparison should have been on the basis of the figures of eligible couples. Since village wise such figures are not available, therefore as a second option the work force figures that usually include persons within the age group of 15 to 59 years have been taken who may be considered as population with reproductive capacity, particularly of males.
4.88 Against the total figure of 3508 persons in the work force the total number of persons
adopting various methods of family welfare is 996 constituting 28.39 percent to total work force of ten identified villages. The performance, to some extent, is satisfactory as the figure would have gone to higher level had the comparisons made with the figures of eligible couples. As has been expected the emphasis is more on the methods of tubectomy and acceptance of Nirodh than on other measures.
4.89 In adopted and cluster group of villages the response to family welfare measures is better
than the control village. DRINKING WATER 4.90 The strategies envisaged for the Tenth Plan mainly centred round the qualitative and
quantitative improvement in rural water supply system by raising the level of services from 40 lped to 55 lped, reduce the maximum distance of water sources from the present 1.6 kms to 0.5 km, providing alternate safe water source where existing sources have been contaminated and providing potable drinking water to new settlements etc.
4.91 Against the back drop of such strategies, the table below shows the existing level of
drinking water facilities in the sample villages.
Table No. 4.27 Status of Drinking Water Facilities
Source of drinking water Distance from the village
Sl. No.
Name of the Village In the village 0
KM =1 KM =2KMS =3KMS =4KMS 1 2 3 4 5 6 7
ADOPTED VILLAGES 1 Khajuri 0 - - - - 2 Polashganj 0 - - - - 3 Mugalia Hat 0 - - - -
CLUSTER VILLAGES 4 Sonkatch 0 - - - - 5 Kolukhedi 0 - - - - 6 Kurana 0 - - - - 7 Ratatal 0 - - - - 8 Ratibad 0 - - - - 9 Khamkheda 0 - - - -
CONTROL VILLAGE 10 Manikkhedi Kot 0 - - - -
Total 10 - - - - 4.92 The above table shows that in all the ten number of sample villages one or other drinking
water source, mostly hand pumps, is available within the village which is the result of massive work of installation of hand pumps in rural areas undertaken by the State Government.

79
4.93 In what follows an attempt has been made to summarise the details of village particulars;
- The basic purpose of the collection of information about village facilities for
identified 10 number of villages is to ascertain the absorption capacity of any prevailing or new technology for any field what-so-ever.
- In all the identified ten villages the percentage of S.C. population is more that of S.T. population. The literacy rate that ranged between 52.60 percent in village Ratibad to 66.50 percent in village Kalukhedi is close to the district percentage literacy level of 64.27 and higher than the State average of 44.67 percent.
- In villages Ratibad and Manikhedi Kot where female work participation rate is 54.40 percent and 58.80 percent respectively is somewhat remarkable that shows the awareness among female population about value of work for augmenting family income.
- The proportion of non-workers which ranged between 43.10 percent in village Manikhedi Kot to 75.90 percent in village Kolukhedi is some what discouraging that shows the higher number of dependent population.
- In all the ten number of villages covered under the study agriculture remains to be the main occupation with preponderance of male cultivators over females. In villages Kolukhedi and Manikhedi Kot the proportion of female cultivators is much higher which indicates the positive role of females.
- The situation of proportion of warkers in household industries to total workers is far from being encouraging as it ranged between 0.90 percent in village Kolukhedi to 9.40 percent in Sonkatch. One of the important factors of rural poverty is the near absence of secondary sector activities that play an important role in enhancing rural income.
- The percentage of gross irrigated area to gross cropped area is 37.18 for ten identified villages which is more than the district average of 33.19 percent and State average of 28.54 percent.
- All the ten number of villages covered under the study are electrified with irregular power supply situation.
- The total number of pump sets energized in ten identified villages is 1464 which is 8.65 percent of total number of pump sets energized in Bhopal district that stands at 16,923 for the year 1999-2000. This is, no doubt, a bright picture that denotes sincere efforts of the rural population of the identified area for pursuing agriculture occupation.
- Village Mugalia Hat has 3 members of cooperative Societies which is somewhat extra ordinary based on the fact that the total population of this village is 1867 persons as per census, 2001 with work participation rate of 48.00 percent along with proportion of cultivators to total workers as 52.50 percent.
- The availability of the facility of road infrastructure in identified ten villages is satisfactory as they have fair weather roads within the villages and also the link roads to all weather roads.
- In non of the villages the regular markets, weekly markets are held. Agriculture being the main occupation of these villages the government may organize a regular market by providing some minimum infrastructure at village Mugalia Hat having population of 1867 persons which may serve as nucleus for marketing destinations of nearby adopted and cluster group of villages.
- In all the identified ten villages the primary schools exist in village limits that contributed for higher level of literacy in the identified ten number of villages.
- Against the total number of ten villages, 3 number of villages have Sub-Health Centres within the village while 4 villages have this facility within 5 km limit

80
and 3 villages have this facility at a distance of more than 5 kms. From the view point of accessibility, the situation is satisfactory.
- The locational status of Rural Family Welfare Centres is also satisfactory as the facility can be accessed by eligible couples conveniently.
- Against the total figure of 3508 persons in the work force the total number of persons adopting various methods of family welfare is 996 constituting 28.39 percent to total work force of ten identified villages. The performance, to some extent, is satisfactory.
- In all the ten number of sample villages one or the other drinking water source, mostly hand pumps, is available within the village.
RESULTS OF SURVEY - Households particulars Macro Dimensions 4.94 In any impact study, household particulars present the socio-economic and cultural trends of
the area. The present part of the chapter deals with the information relating to the households in following dimensions;
(i) Macro dimensions – Wherein information from all the households residing in 10
number of sample villages has been collected. (ii) Micro dimensions – Wherein 25 percent of the households have been identified for
the detailed enquiry. 4.95 In what follows an attempt has been made to detail out both the macro and micro
dimensions based on the information collected through House Listing Schedule and household Schedule respectively.
MACRO DIMENSIONS - GENERAL PARTICULARS 4.96 The table below shows the details
Table No. 4.28
Household Details Sl. No.
Name of the Village No. of households as on the date of survey
Population Census – 2001
Average size of the family (based on the figure of col. 4)
1 2 3 4 5 ADOPTED VILLAGES
1 Khajuri 121 941 8 2 Polashganj 51 349 7 3 Mugalia Hat 310 1867 6
Total I 482 3157 7 CLUSTER VILLAGES
4 Sonkatch 109 751 7 5 Kolukhedi 81 497 6 6 Kurana 131 1677 13 7 Ratatal 119 656 6 8 Ratibad 49 335 6 9 Khamkheda 215 1408 7
Total II 704 5324 8 CONTROL VILLAGE
10 Manikkhedi Kot 59 297 5 Total III 59 297 5
Grand Total 1245 8778 7

81
4.97 The total number of households as per survey is 1245 for all the ten identified villages. The average size of the family comes to 7 persons which is more than the standard size of the family of 5 persons. In village Kurana the average size of the family is exceptionally high [13 persons] that needs the special attention of district administration.
SOCIAL STATUS OF HOUSEHOLDS 4.98 The table below shows the social status of the households;
Table No. 4.29 Social Status of the Households
Caste (Social Classification) Interaction with KVK
Sl. No.
Name of the Village
No. of Household
S.T. S.C. O.B.C. General Yes No 1 2 3 4 5 6 7 8 9
ADOPTED VILLAGES 1 Khajuri 121 19 3 24 75 74 47 2 Polashganj 51 0 9 40 2 37 14 3 Mugalia Hat 310 0 90 209 11 152 158
Total I 482 19 102 273 88 263 219 CLUSTER VILLAGES
4 Sonkatch 109 17 48 36 8 63 46 5 Kolukhedi 81 2 24 54 1 42 39 6 Kurana 131 0 37 90 4 70 61 7 Ratatal 119 0 18 99 2 56 63 8 Ratibad 49 3 1 41 4 30 19 9 Khamkheda 215 23 67 103 22 83 132
Total II 704 45 195 423 41 344 360 CLUSTER VILLAGE 10 Manikkhedi
Kot 59 0 4 49 6 1 58
Total III 59 0 4 49 6 1 58 Total I+II+III 1245 [100] 64
[5.14] 301
[24.18] 745
[59.84] 135
[10.84] 608
[48.84] 637
[51.16] Note : Figures in brackets show the percentage to total number of households.
4.99 The above table shows the preponderance of households from S.C. communities and
O.B.Cs. that constitutes 84.02 percent to total number of households. Only 5.14 percent households hail from S.T. communities that too from adopted and cluster villages only. One interesting feature of the table is represented by the fact that families belonging to general communities is maximum in three number of adopted villages i.e. 65.19 percent to total number of general category households in ten identified villages whereas in six number of cluster villages this percentage is only 30.37. These three villages are advanced agriculturally as the percentage of total irrigated area to gross cropped area is quite high along with fair magnitude of cultivable waste land [table no. 4.12].

82
HOUSEHOLDS CLASSIFIED ON THE BASIS OF RELIGION 4.100 The table below shows the details;
Table No. 4.30
Distribution of Households according to Religion Sl. No.
Name of the Village
No. of Household
Hindu Muslim
Sikh Christian Nu-Buddh
1 2 3 4 5 6 7 8 ADOPTED VILLAGES
1 Khajuri 121 96 25 0 0 0 2 Polashganj 51 51 0 0 0 0 3 Mugalia Hat 310 310 0 0 0 0
Total I 482 457 25 0 0 0 CLUSTER VILLAGES
4 Sonkatch 109 108 1 0 0 0 5 Kolukhedi 81 81 0 0 0 0 6 Kurana 131 131 0 0 0 0 7 Ratatal 119 119 0 0 0 0 8 Ratibad 49 49 0 0 0 0 9 Khamkheda 215 215 0 0 0 0
Total II 704 703 1 0 0 0 CONTROL VILLAGE 10 Minikhedi Kot 59 59 0 0 0 0
Total III 59 59 0 0 0 0 Total 1245 1219 26 0 0 0
4.101 Against the total number 1245 households, 1219 households belong to Hindu community
constituting 97.91 percent to total households. Only 26 families are following the muslim religion. There is complete absence of families belonging to Sikh, Christian or Nu-Budh religion.
OCCUPATIONAL DISTRIBUTION OF HOUSEHOLDS–MAIN OCCUPATION PRIMARY SECTOR – AGRICULTURE 4.102 The table below shows the details

83
Table No. 4.31 Household According to their Main Occupation – Agriculture
Sl. No.
Name of the Village
No. of Household
Marginal Farmers
Small Farmers
Other Farmers Agriculture Labour
1 2 3 4 5 6 7 ADOPTED VILLAGES
1 Khajuri 121 7 13 36 55 2 Polashganj 51 7 17 10 12 3 Mugalia Hat 310 10 43 105 138
Total I 482 24 [4.98] 73 [15.15] 151 [31.33] 205 [42.53] CLUSTER VILLAGES
4 Sonkatch 109 14 22 15 29 5 Kolukhedi 81 14 11 15 2 6 Kurana 131 14 32 22 2 7 Ratatal 119 14 20 22 49 8 Ratibad 49 14 8 9 10 9 Khamkheda 215 29 37 42 98
Total II 704 99 [14.06] 130 [18.47]
125 [17.76] 231 [32.81]
CONTROL VILLAGE 10 Minikhedi Kot 59 0 7 15 20
Total III 59 0 7 [11.86] 15 [25.42] 20 [33.90] Grand Total 1245 123 [9.86] 210 [16.87] 291 [23.37] 456 [36.63]
Note : Figures in brackets show percentage to total number of households 4.103 Out of the total number of 1245 households 1080 households are engaged directly in
agriculture occupation that account for 86.75 percent to total number of households. Small and marginal farmers together constitute 26.73 percent which is an encouraging indicator while other farmers mostly consisting of medium and large cultivators consist of 23.37 percent to total number of households. The percentage of agriculture labour to total households is 36.63 percent. Agriculture, therefore, is carried out on viable scale in all the identified ten villages.
PRIMARY SECTOR – FOREST, LIVESTOCK, FISHERIES, HUNTING 4.104 Activities allied to agriculture are equally important as additional source of income and
employment in rural areas. The table below shows the details;

84
Table No. 4.32 Households according to their Main Occupations – Forest, Livestock, Fisheries, Hunting
Sl. No.
Name of the Village
No. of Household
Minor Forest Produce
Collection
Live Stock Activities
Fishing Activities
Hunting Activities
1 2 3 4 5 6 7 ADOPTED VILLAGES
1 Khajuri 121 0 0 0 0 2 Polashganj 51 0 0 0 0 3 Mugalia Hat 310 0 7 0 0
Total I 482 0 7 [1.45] 0 0 CLUSTER VILLAGES
4 Sonkatch 109 0 0 0 0 5 Kolukhedi 81 0 3 0 0 6 Kurana 131 0 0 0 0 7 Ratatal 119 0 1 0 0 8 Ratibad 49 0 0 0 0 9 Khamkheda 215 0 7 0 0
Total II 704 0 11 [1.56] 0 0 CONTROL VILLAGE 10 Minikhedi Kot 59 0 0 0 0 Total III 59 0 0 0 0 Grand Total 1245 0 18 [1.45] 0 0
Note : Figures in brackets show percentage to total number of households. 4.105 In non of the ten identified villages the occupations like minor forest produce collection,
fishing activities and hunting activities are performed as main source of livelihood. Only 18 families mostly from adopted and cluster villages that constitute 1.45 percent to total number of households are engaged in livestock activities as main source of livelihood, which emphasizes a basic fact that in the context of rural scenario, in general, agriculture remains to be the main occupation which requires intensive attention of the planners. The reasons for failure of government initiatives to develop animal husbandry in rural areas is the lack of intent and resources of the rural households along with absence of marketing avenues. Agriculture, once made viable and sustainable will automatically lead to the development of its allied activities for which no government initiative vis-à-vis investment will perhaps be required in the long run.
SECONDARY AND TERTIARY SECTORS 4.106 Secondary and tertiary sector occupations, being a meaningful destinations for
diversification of agriculture, also offer work opportunities to absorbe the work force engaged in marginal farming or pursuing the occupation of agriculture labour. The table below shows the details

85
Table No. 4.33 Households According to Main Occupations – Secondary and Tertiary Sectors
Secondary Sector Tertiary Sector Sl. No.
Name of the Village
No. of Household Servicing
and Repairs
Const-ruction Work
Govern-ment
Service
Service in Private Sector
Other
1 2 3 4 5 6 7 8 ADOPTED VILLAGES
1 Khajuri 121 0 0 6 0 4 2 Polashganj 51 0 2 2 0 3 3 Mugalia Hat 310 0 1 10 6 5
Total I 482 0 3 [0.62] 18 [3.75]
6 [1.24]
12 [2.49]
CLUSTER VILLAGES 4 Sonkatch 109 0 1 4 2 2 5 Kolukhedi 81 0 0 1 2 3 6 Kurana 131 0 1 14 1 5 7 Ratatal 119 0 0 6 0 4 8 Ratibad 49 0 1 3 0 3 9 Khamkheda 215 0 0 18 0 3
Total II 704 0 3 [0.43] 46 [6.53]
5 [0.71]
20 [2.84]
CONTROL VILLAGE 10 Minikhedi Kot 59 0 0 0 0 3
Total III 59 0 0 0 0 3 [5.08]
Grand Total 1245 0 6 [0.48] 64 [5.14]
11 [0.88]
35 [2.81]
Note : Figures in brackets show percentage to total number of households. 4.107 The picture that emerged from the above table is dismal. In secondary sector only 0.48
percent families are engaged in construction work as compared to total number of households where as tertiary sector i.e. government service and service in private sector is only 6.02. In ‘Other’ group those households have been incorporated who do not come under any of the specified category. In fact, this group can not be categorized under tertiary sector, but far the sake of tabular representation this item has been shown along with the tertiary sector. In this group 35 households are engaged constituting 2.81 percent of the total households. The families engaged in this group of activities are vulnerable who do not possess any sort of fixed asset to pursue a line of activity for livelihood. They are sort of floating households who grab at any thing for sustenance.
OCCUPATIONAL DISTRIBUTION OF HOUSEHOLDS – SUBSIDIARY OCCUPATIONS
PRIMARY SECTOR – AGRICULTURE 4.108 The table below shows the details;

86
Table No. 4.34 Households According to their Subsidiary Occupation – Agriculture
Sl. No.
Name of the Village
No. of Household
Marginal Farmers
Small Farmers
Other Farmers
Agriculture Labour
1 2 3 4 5 6 7 ADOPTED VILLAGES
1 Khajuri 121 1 2 0 0 2 Polashganj 51 3 1 0 3 3 Mugalia Hat 310 15 11 1 22
Total I 482 19 [3.94] 14 [2.90] 1 [0.21] 25 [5.19] CLUSTER VILLAGES
4 Sonkatch 109 10 2 0 12 5 Kolukhedi 81 8 1 0 9 6 Kurana 131 12 4 0 15 7 Ratatal 119 11 5 0 13 8 Ratibad 49 5 2 0 7 9 Khamkheda 215 32 4 4 26
Total II 704 78 [11.08] 18 [2.56] 4 [0.57] 82 [11.65] CONTROL VILLAGE 10 Minikhedi Kot 59 5 5 0 3 Total III 59 5 [8.47] 5 [8.47] 0 3 [5.08] Grand Total 1245 102 [8.19] 37 [2.97] 5 [0.40] 110 [8.84]
Note : Figures in brackets show percentage to total number of households. 4.109 Out of the total number of 1245 sample households the number of households pursuing
agriculture as subsidiary occupation is 254 constituting 20.40 percent to total households. Mostly the families engaged are from marginal farmers, small farmers and from the category of agriculture labour who along with other activities perform agriculture activities for additional source of income. In general the percentage of such families are more or less evenly distributed among adopted, cluster and control group of villages.
PRIMARY SECTOR – FOREST, LIVESTOCK, FISHERIES, HUNTING 4.110 The table below shows the details;

87
Table No. 4.35 Households According to their Subsidiary Occupation – Forest, Livestock, Fisheries, Hunting
Sl. No.
Name of the Village
No. of Household
Minor Forest
Produce Collection
Live Stock Activities
Fishing Activities
Hunting Activities
1 2 3 4 5 6 7 ADOPTED VILLAGES
1 Khajuri 121 0 1 0 0 2 Polashganj 51 0 0 0 0 3 Mugalia Hat 310 0 6 0 0
Total I 482 0 7 [1.45] 0 0 CLUSTER VILLAGES
4 Sonkatch 109 0 0 1 2 5 Kolukhedi 81 0 3 0 0 6 Kurana 131 0 0 0 0 7 Ratatal 119 0 0 0 0 8 Ratibad 49 0 0 0 0 9 Khamkheda 215 0 0 0 0
Total II 704 0 3 [0.43] 1 [0.14] 2 [0.28] CONTROL VILLAGE 10 Minikhedi Kot 59 0 2 0 0 Total III 59 0 2 [3.39] 0 0 Grand Total 1245 0 12 [0.96] 1 [0.08] 2 [0.16]
Note : Figures in brackets show percentage to total households. 4.111 The aggregate percentage of livestock fisheries and hunting activities wherein families are
engaged as subsidiary occupation [mostly in adopted and cluster villages] is 1.2 which can hardly be termed as any sort of performance. Actually these activities as supportive source of income should be encouraged by government initiatives provided there is willingness from the target groups to adopt such occupations.
SECONDARY AND TERTIARY SECTORS 4.112 The table below shows the details;

88
Table No. 4.36 Households According to their Subsidiary Occupations – Secondary and Tertiary Sectors
Secondary Sector Tertiary Sector Sl. No.
Name of the Village
No. of Household Servicing
and Repairs Const-ruction work
Govt. Service
Service in Private Sector
1 2 3 4 5 6 7 ADOPTED VILLAGES
1 Khajuri 121 0 0 1 0 2 Polashganj 51 0 0 6 2 3 Mugalia Hat 310 0 0 4 6
Total I 482 0 0 11 [2.28] 8 [1.66] CLUSTER VILLAGES
4 Sonkatch 109 0 0 4 6 5 Kolukhedi 81 0 0 0 0 6 Kurana 131 0 0 2 1 7 Ratatal 119 0 0 8 1 8 Ratibad 49 0 0 1 1 9 Khamkheda 215 0 0 0 0
Total II 704 0 0 15 [2.13] 9 [1.28] CONTROL VILLAGE 10 Minikhedi Kot 59 0 0 0 0 Total III 59 0 0 0 0 Grand Total 1245 0 0 26 [2.09] 17 [1.37]
Note : Figures in brackets show percentage to total households. The performance of the households in subsidiary occupation in secondary and tertiary
sectors is negligible. In government, mostly as grass root health and education workers, the percentage involvement of families is only 2.09 whereas this percentage for service in private sector is only 1.37.
4.113 The overall conclusion that can be drawn from the information relating to
occupational distribution of households is the preponderance of agriculture as main occupation for earning the livelihood.
AVERAGE MONTHLY INCOME 4.114 In any data collection work, the task of getting correct information from informants about
their monthly income and expenditure is difficult as they are usually very cautious to come out with the facts. However, an attempt has been made to collect such information with clear understanding that the information may not be altogether correct. However, a trend is visible, which may be useful. The table below shows the details;

89
Table No. 4.37 Average Monthly Income
Sl. No.
Name of the Village
No. of House-
hold
Below Rs. 500
Rs. 501-600
Rs. 601- 700
Rs. 701- 800
Rs. 801- 900
Rs. 901- 1000
Rs. 1001 and
above 1 2 3 4 5 6 7 8 9 10
ADOPTED VILLAGES 1 Khajuri 121 0 0 0 0 0 0 121 2 Polashganj 51 1 4 0 1 0 3 42 3 Mugalia Hat 310 7 5 1 10 5 21 261 Total I 482 8
[1.66] 9
[1.87] 1
[0.21] 11
[2.28] 5
[1.04] 24
[4.98] 424
[87.96] CLUSTER VILLAGES
4 Sonkatch 109 4 1 0 5 0 12 87 5 Kolukhedi 81 1 0 0 0 0 4 76 6 Kurana 131 4 1 0 7 2 26 91 7 Ratatal 119 3 0 0 10 0 22 84 8 Ratibad 49 1 0 0 3 0 6 39 9 Khamkheda 215 3 0 0 1 0 14 197 Total II 704 16
[2.27] 2
[0.28] 0 26
[3.69] 2
[0.28] 84
[11.94]
574 [81.54]
CONTROL VILLAGE 10 Manikhedi Kot 59 1 2 0 6 0 8 42 Total III 59 1
[1.69] 2
[3.39] 0 6
[10.17] 0 8
[13.56] 42
[71.15] Grand Total 1245 25
[2.01] 13
[1.04] 1
[0.08] 43
[3.45] 7
[0.56] 116
[9.32] 1040
[83.54] Note : Figures in brackets show percentage to total househo lds.
4.115 The above table shows that 83.54 percent of the households are in the income range of Rs.
1001 and above per month which indicates the affluence level of the area. In adopted villages this percentage is 87.96 while in cluster villages the percentage is 81.54 as compared to total number of households. Even in control village where there is no intervention of K.V.K. the percentage level is 71.19. In the low income range i.e. from Rs. 500.00 and below to Rs. 601.00 to Rs. 700.00 per month the combined average is 3.13 percent to total households which can termed to be negligible. Normally such households are subject to migration during lean agriculture period and require particular income support by the government through various welfare schemes. However, the overall picture that emerges, proceeds to justify the selection of villages in the categories of adopted and cluster groups as the absorption of agriculture related technology is only possible when occupation of agriculture is pursued on viable scale.
AVERAGE MONTHLY EXPENDITURE 4.116 Here again it may be mentioned that the informants are usually reluctant in giving
information regarding their expenditure details. However, through indirect interaction, an attempt has been made to collect the information about the average monthly expenditure of the sample households which is presented in the following table;

90
Table No. 4.38 Average Monthly Expenditure
Sl. No.
Name of the Village
No. of House-
hold
Below Rs. 500
Rs. 501-600
Rs. 601- 700
Rs. 701- 800
Rs. 801- 900
Rs. 901- 1000
Rs. 1001 and
above 1 2 3 4 5 6 7 8 9 10
ADOPTED VILLAGES 1 Khajuri 121 5 0 0 0 0 0 116 2 Polashganj 51 0 0 0 2 0 1 48 3 Mugalia Hat 310 8 2 1 4 3 17 275 Total I 482 13
[2.70] 2
[0.42] 1
[0.21] 6
[1.24] 3
[0.62] 18
[3.73] 439
[91.08] CLUSTER VILLAGES
4 Sonkatch 109 1 0 0 4 0 8 96 5 Kolukhedi 81 2 0 0 0 0 1 78 6 Kurana 131 9 4 0 5 2 16 95 7 Ratatal 119 2 2 0 9 0 14 92 8 Ratibad 49 1 0 0 1 0 5 42 9 Khamkheda 215 6 0 1 1 0 1 206 Total II 704 21
[2.98] 6
[0.85] 1
[0.14] 20
[2.84] 2
[0.28] 45
[6.39] 609
[86.52] CONTROL VILLAGE 10 Manikhedi
Kot 59 2 1 0 6 0 8 42
Total III 59 2 [3.39]
1 [1.69]
0 6 [10.17]
0 8 [13.56]
42 [71.19]
Grand Total 1245 36 [2.89]
9 [0.72]
2 [0.16]
32 [2.57]
5 [0.40]
71 [5.70]
1090 [87.56]
Note : Figures in brackets show percentage to total households. 4.117 In line with income levels, the maximum of 87.56 percent households are within the
expenditure range of Rs. 1001.00 and above per month with the break-up of 91.08 percent for adopted villages, 86.52 percent for cluster villages and 71.19 percent for control village. A portion of expenditure for adopting improved agriculture technology, thus, is obvious particularly in adopted and cluster group of villages.
4.118 To sum-up, it may be mentioned that;
- The average size of the family for all the identified villages is 7 persons which is more than average size of the family of 5 persons. In village Kurana the average size of the family is 13 persons that needs the special attention of district administration.
- Preponderance of households from S.C. communities and O.B.Cs. constituting 84.02 percent to total households is the characteristics of the identified villages with only 5.14 percent of S.T. households hailing from adopted and cluster villages.
- The three number of adopted villages have substantial irrigated area along with fair magnitude of cultivable waste land that offers a promise of extension of cultivated area. Selection of these areas as adopted villages is correct as it is comparatively easier to implement the agriculture related technology where there exists absorption capacity for such technologies.

91
- The area is predominated by persons following Hindu religion constituting 97.91 percent to total households.
- Agriculture is the main stay of the households residing in ten identified villages as 86.75 percent of households are engaged directly in agriculture, as main occupation. In the group of ‘other farmers’ mostly consisting of medium and large cultivators 23.37 percent of households are engaged which emphasizes the viable nature of agriculture occupation being pursued in identified ten number of villages.
- Only 18 number of households from adopted and cluster group of villages constituting 1.45 percent to total number of households are engaged in livestock activities as source of main occupation. The activities allied to agriculture is not much developed in the sample area of study.
- In secondary and tertiary sectors where only 0.48 percent families and 6.02 families are engaged is far from being developed. In ‘other’ group 2.81 percent of households are engaged who do not pursue any fixed line of activity.
- Only 20.40 percent of households are engaged in agriculture as subsidiary occupation, mostly from the categories of marginal farmers , small farmers and agriculture labour.
- In activities allied to agriculture the aggregate percentage of livestock, fisheries and hunting activities is 1.2 which can hardly be termed as any sort of performance in the group of subsidiary occupation.
- The performance of households in subsidiary occupations in secondary and tertiary sectors is negligible.
- Regarding average monthly income, 83.54 percent of the household are in income range of Rs. 1001.00 and above per month, which indicates the affluence level of the area. In adopted villages this percentage is 87.96 while in cluster villages the percentage is 81.54 as compared to total number of households. Even in control village where there is no intervention of K.V.K. the percentage level is 71.19.
- Regarding average monthly expenditure 87.56 percent of households are within the expenditure group of Rs. 1001.00 and above per month.
RESULTS OF THE SURVEY – MICRO DIMENSION 4.119 In this part of the write-up, 25 percent of the households have been identified for detailed
enquiry. Though 25 percent of the total of 1245 households comes to 311 but we have taken 314 number of households because mainly due to demographic elements of the households. However, a few number plus or minus from the determined parameter is not very much meaningful so long it does not vitiate the results of the survey.
DEMOGRAPHIC PARTICULARS – MALE-FEMALE DISTRIBUTION 4.120 The table below shows the details;

92
Table No. 4.39 Male – Female Distribution
Age, Male Numbers S. No
.
Name of the Village No. of Families Selected
No. of Family
Members
Male Total 0-10
Years 10-20 Years
20-30 Years
30-40 Years
40-50 Years
50-60 Years
60 Years and
Above 1 2 3 4 5 6 7 8 9 10 11 12
1. Khajuri (Phanda) 30 212 120 28 39 19 15 7 8 4 2. Polashganj (Bersiya) 13 81 38 17 3 7 6 3 1 1 3. Mugalia Hat (Phanda) 76 468 245 69 67 29 29 32 9 10 Adopted Village 119 761 403 114 109 55 50 42 18 15
4. Sonkatch (Bersiya) 28 169 92 22 21 19 12 8 7 3 5. Kolukhedi (Bersiya) 21 128 70 29 7 13 10 5 6 0 6. Kurana (Phanda) 34 221 116 39 21 8 27 9 9 3 7. Ratatal (Phanda) 30 179 93 23 27 14 13 12 1 3 8. Ratibad (Phanda) 12 71 39 11 12 4 9 3 0 0 9. Khamkheda (Phanda) 55 302 179 44 59 20 17 23 7 9 Cluster Village 180 1070 589 168 147 78 88 60 30 18 10 Manikhedi Kot
(Phanda) 15 90 52 16 16 6 9 4 0 1
Control Village 15 90 52 16 16 6 9 4 0 1 Total 314 1921 1044 298 272 139 147 106 48 34
Contd ….Table No. 4.39
Male – Female Distribution Age, Male-Female S.
No.
Name Of The Village No. Of Families Selected
No. of Family
Members
Female
Total 0-10
Years 10-20 Years
20-30 Years
30-40 Years
40-50 Years
50-60 Years
60 Years and
Above 1 2 3 4 13 14 15 16 17 18 19 20
1. Khajuri (Phanda) 30 212 92 33 15 12 16 7 6 3 2. Polashganj (Bersiya) 13 81 43 19 8 5 7 2 1 1 3. Mugalia Hat (Phanda) 76 468 223 66 54 27 39 21 11 5 Adopted Village 119 761 358 118 77 44 62 30 18 9 4. Sonkatch (Bersiya) 28 169 77 22 15 13 12 9 3 3 5. Kolukhedi (Bersiya) 21 128 58 19 11 10 8 6 4 0 6. Kurana (Phanda) 34 221 105 30 22 13 23 9 6 2 7. Ratatal (Phanda) 30 179 86 32 13 14 13 10 0 4 8. Ratibad (Phanda) 12 71 32 13 6 4 7 2 0 0 9. Khamkheda (Phanda) 55 302 123 23 33 19 22 14 5 7 Cluster Village 180 1070 481 139 100 73 85 50 18 16
10 Manikhedi Kot (Phanda) 15 90 38 9 8 5 10 3 1 2 Control Village 15 90 38 9 8 5 10 3 1 2
Total 314 1921 877 266 185 122 157 83 37 27 4.121 Out of the total number of 1921 family members the male members are 1044 which is 54.35
percent to total number of family members while number of females are 877 constituting 45.65 percent to total number of family members from 314 families identified for detailed enquiry. The number of males within the population group of 20 to 60 years, which normally represent the labour force of the area, is 440 which is 42.15 percent to total number of males, has twin indications of availability of more persons eligible to work which is a positive indicator and requirement of more employment opportunities for potential workers. In case of females this percentage is 45.50 which is indicative of the

93
fact that besides household work more female labour force is available for agriculture being the main occupation of the area. The percentage of dependant population among males, which normally is constituted by the population within 0 to 10 years and 60 years and above, is 31.80 which is a negative factor since this group of population do not contribute much towards family income. Similar is the case with dependent population among females which is 33.41 percent to female population. Fortunately dependent population among males in adopted villages is 16.95 percent that leaves a sufficient ground for implementation of latest technology relating to agriculture in the area. However, in cluster group of villages the percentage of dependent population both among males and females is substantial [31.58 percent for males and 32.22 percent for females]. This is a negative factor of development. This figure is still more high in control village where percentage for males is 58.89 while for females it is 44.44.
EDUCATIONAL STATUS OF SAMPLE HOUSEHOLDS 4.122 Literacy and education are the prerequisites for adoption of any technology what-so-ever
that require mental participation. Therefore, information regarding educationa l status of the sample household has been collected to study the impact of literacy/education levels over the acceptability of agriculture related technology. The table below shows the details;
Table No. 4.40
Educational Status In Numbers
S.No.
Name of The Village No. of Families Selected
No. of Family
Members
Illiterate Literate without going to school
Primary
Middle
1 2 3 4 5 6 7 8 1. Khajuri (Phanda) 30 212 20 2 100 41 2. Polashganj (Bersiya) 13 81 11 2 78 7 3. Mugalia Hat (Phanda) 76 468 36 7 201 97 Adopted Village 119 761 67 11 379 145 4. Sonkatch (Bersiya) 28 169 24 2 40 33 5. Kolukhedi (Bersiya) 21 128 23 0 37 17 6. Kurana (Phanda) 34 221 16 2 200 29 7. Ratatal (Phanda) 30 179 30 7 75 35 8. Ratibad (Phanda) 12 71 6 1 50 17 9. Khamkheda (Phanda) 55 302 54 0 102 72 Cluster Village 180 1070 153 12 504 203 10 Manikhedi Kot
(Phanda) 15 90 10 0 23 20
Control Village 15 90 10 0 23 20 Total 314 1921 230 23 906 368

94
Table No. 4.40 Educational Status [Contd…]
In Numbers S.
No. Name of The Village No. of
Families Selected
No. of Family
Members
High School
Higher School
Gra-duate
Post Graduate
Others
1 2 3 4 9 10 11 12 13 1. Khajuri (Phanda) 30 212 32 15 2 0 0 2. Polashganj (Bersiya) 13 81 9 3 3 0 0 3. Mugalia Hat (Phanda) 76 468 47 28 5 0 0 Adopted Village 119 761 88 46 10 0 0 4. Sonkatch (Bersiya) 28 169 41 4 1 1 0 5. Kolukhedi (Bersiya) 21 128 15 6 2 0 0 6. Kurana (Phanda) 34 221 21 12 0 0 0 7. Ratatal (Phanda) 30 179 17 3 3 0 1 8. Ratibad (Phanda) 12 71 6 4 0 0 0 9. Khamkheda (Phanda) 55 302 55 19 9 1 0 Cluster Village 180 1070 155 48 15 2 1 10 Manikhedi Kot (Phanda) 15 90 25 0 4 0 0 Control Village 15 90 25 0 4 0 0 Total 314 1921 268 94 29 2 1 4.123 A total of 230 persons have been reported to be illiterate which is 11.97 percent to total
number of family members of 1921 persons from 314 identified sample families. The situation is not dismal since the literacy percentage is 88.03 which is amazingly high. The percentage of elementary education [primary + middle levels] is 66.32 which clearly shows the impact of the programme of the universalisation of the Elementary Education Programme in the area. The extent of higher education is not impressive, reason being the lack of higher educational facilities in the area. However, the overall educational situation that emerges proceeds to show the absorption capacity of the people of the sample area to adopt latest technology regarding agriculture imparted particularly by the K.V.K.
OCCUPATIONAL DISTRIBUTION OF HOUSEHOLDS – MAIN OCCUPATION 4.124 Out of the total of 1921 members of the sample households 359 number of persons have
been reported to be engaged in various main occupations which comes to 18.69 percent to total number of persons in identified sample households for detailed enquiry. In what follows an attempt has been made to analyse the information pertaining to main occupation.
AGRICULTURAL OCCUPATIONS 4.125 The table below shows the distribution of persons engaged in agricultural occupation;

95
Table No. 4.41 Main Occupation - Agriculture
S.No.
Name of The Village No. of families selected
No. of family
members
Small Farmer
Marginal Farmer
Farmer Agriculture
Labour 1 2 3 4 5 6 7 8
1. Khajuri (Phanda) 30 212 11 1 21 0 2. Polashganj (Bersiya) 13 81 0 0 17 1 3. Mugalia Hat (Phanda) 76 468 8 0 74 2 Adopted Village 119 761 19 1 112 3 4. Sonkatch (Bersiya) 28 169 3 0 25 1 5. Kolukhedi (Bersiya) 21 128 6 1 16 0 6. Kurana (Phanda) 34 221 16 1 19 1 7. Ratatal (Phanda) 30 179 11 0 21 0 8. Ratibad (Phanda) 12 71 0 0 12 1 9. Khamkheda (Phanda) 55 302 13 1 45 0 Cluster Village 180 1070 49 3 138 3 10 Manikhedi Kot
(Phanda) 15 90 2 0 13 0
Control Village 15 90 2 0 13 0 Total 314 1921 70 4 263 6 Note : Information in brackets shows the name of the Development Block where the village is located. This factor is common to all subsequent tables. 4.126 One of the satisfactory trends depicted by the above table is that bulk of the farming
community is from the category of ‘farmers’ consisting of middle level and big cultivators [263 in number] constituting 13.69 percent to total number of 1921 persons and 73.26 percent to total of 359 persons pursuing various main occupations. The combined percentage of small and marginal farmers and agriculture labour is 4.16 percent to total number of 1921 persons identified for detailed enquiry and 22.28 percent to total of 359 persons engaged in various main occupations. The application of agriculture related technology through K.V.K. in particular and other agencies in general is convenient in adopted villages where the percentage of farmers to the total family members as well as to total persons pursuing various main occupations are 14.72 and 31.20 respectively. In case of cluster villages these percentages are 12.90 and 38.44 respectively. The selection of these villages within adopted and cluster groups is justified for obvious simple reason of capacity to adopt the technology on sustainable basis.

96
OCCUPATIONS ALLIED TO AGRICULTURE
Table No. 4.42 Main Occupation – Allied to Agriculture
S.No.
Name of The Village No. of families selected
No. of family membe
rs
Minor Forest Produce
Collection
Live stock
Activities
Fishing Activiti
es
Hunting
Activities
1 2 3 4 5 6 7 8 1. Khajuri (Phanda) 30 212 0 0 0 0 2. Polashganj (Bersiya) 13 81 0 1 0 0 3. Mugalia Hat (Phanda) 76 468 0 1 0 0 Adopted Village 119 761 0 2 0 0 4. Sonkatch (Bersiya) 28 169 0 0 1 0 5. Kolukhedi (Bersiya) 21 128 1 3 0 0 6. Kurana (Phanda) 34 221 1 0 0 0 7. Ratatal (Phanda) 30 179 0 1 1 0 8. Ratibad (Phanda) 12 71 0 0 0 0 9. Khamkheda (Phanda) 55 302 2 2 0 0 Cluster Village 180 1070 4 6 2 0 10 Manikhedi Kot
(Phanda) 15 90 0 2 0 0
Control Village 15 90 0 2 0 0 Total 314 1921 4 10 2 0
4.127 One of the mandates of the K.V.K. is to encourage the activities allied to agriculture
particularly that of animal husbandry and fisheries by application of technological advancement to augment income. The above table clearly shows the near absence of such activities in our sample area of study relating to sample households. Only 12 number of persons are engaged in livestock and fishing activities that hardly offer a field for application of technologies.
OCCUPATIONS RELATING TO SECONDARY/TERTIARY SECTORS AND OTHERS 4.128 The K.V.Ks. offer training to unemployed youth for self-employment particularly in
secondary sector. The complete absence of such activities among sample population identified for detailed enquiry is dismal as it provides no scope for such extension activity by the K.V.K. The table has not been given as the information is nil.
OCCUPATIONAL DISTRIBUTION OF HOUSEHOLDS IN SUBSIDIARY OCCUPATIONS – AGRICULTURE 4.129 Out of the total of 1921 persons, 17 number of persons [all in agriculture occupation] are
having subsidiary occupation. The table below shows the details;

97
Table No. 4.43 Subsidiary Occupation – Agriculture
S. No.
Name of The Village No. of families selected
No. of family
members
Small Farmer
Marginal Farmer
Farmer Agriculture
Labour 1 2 3 4 5 6 7 8
1. Khajuri (Phanda) 30 212 1 0 1 0 2. Polashganj (Bersiya) 13 81 0 0 0 0 3. Mugalia Hat (Phanda) 76 468 1 1 1 0 Adopted Village 119 761 2 1 2 0 4. Sonkatch (Bersiya) 28 169 1 0 2 1 5. Kolukhedi (Bersiya) 21 128 0 0 0 0 6. Kurana (Phanda) 34 221 0 0 1 6 7. Ratatal (Phanda) 30 179 0 0 1 0 8. Ratibad (Phanda) 12 71 0 0 0 0 9. Khamkheda (Phanda) 55 302 0 0 0 0 Cluster Village 180 1070 1 0 4 7 10 Manikhedi Kot(Phanda) 15 90 0 0 0 0 Control Village 15 90 0 0 0 0 Total 314 1921 3 1 6 7
4.130 The above table shows the involvement only 17 persons in agriculture related occupations,
which is hardly a meaningful picture. AVERAGE MONTHLY INCOME 4.131 The table below shows the details;
Table No. 4.44 Average Monthly Income
S. No.
Name of The Village No. of families selected
No. of family memb
ers
Below Rs. 500
Rs. 501 to
Rs. 600
Rs. 601 to
Rs. 700
Rs. 701 to
Rs. 800
Rs. 801 to
Rs. 900
Rs. 901 to
Rs. 1000
Rs. 1001 and
Above
1 2 3 4 5 6 7 8 9 10 11 1. Khajuri (Phanda) 30 212 30 0 0 0 0 2 180 2. Polashganj(Bersiya) 13 81 14 0 0 0 0 0 67 3. Mugalia Hat Phanda) 76 468 81 0 0 0 0 0 387 Adopted Village 119 761 125 0 0 0 0 2 634
4. Sonkatch (Bersiya) 28 169 26 0 0 0 0 0 143 5. Kolukhedi (Bersiya) 21 128 22 0 0 0 0 1 105 6. Kurana (Phanda) 34 221 34 0 0 0 0 1 186 7. Ratatal (Phanda) 30 179 30 0 0 0 0 0 149 8. Ratibad (Phanda) 12 71 12 0 0 0 0 0 59 9. Khamkheda (Phanda) 55 302 59 0 0 0 0 2 241 Cluster Village 180 1070 183 0 0 0 0 0 883
10 Manikhedi Kot(Phanda) 15 90 17 0 0 0 0 0 73 Control Village 15 90 0 0 0 0 0 0 73
Total 314 1921 325 [16.92]
0 0 0 0 6 [0.31]
1590 [82.77]

98
4.132 The above table shows that 82.77 percent family members are within the income range of Rs. 1001 and above per month which is obvious as most of farmers are pursuing agriculture in viable manner with medium and large holdings.
AVERAGE MONTHLY EXPENDITURE 4.133 The table below shows the details;
Table No. 4.45
Average Monthly Expenditure S.No
. Name of The Village No. of
families selected
No. of family memb
ers
Below Rs. 500
Rs. 501 to
Rs. 600
Rs. 601 to
Rs. 700
Rs. 701 to
Rs. 800
Rs. 801 to
Rs. 900
Rs. 901 to
Rs. 1000
Rs. 1001 and
Above 1 2 3 4 5 6 7 8 9 10 11
1. Khajuri (Phanda) 30 212 29 0 0 2 0 0 181 2. Polashganj (Bersiya) 13 81 14 0 0 0 0 0 67 3. Mugalia Hat (Phanda) 76 468 75 0 0 0 0 4 389 Adopted Village 119 761 118 0 0 2 0 4 637 4. Sonkatch (Bersiya) 28 169 26 0 0 0 0 1 142 5. Kolukhedi (Bersiya) 21 128 16 0 0 0 0 2 110 6. Kurana (Phanda) 34 221 33 0 0 0 0 1 187 7. Ratatal (Phanda) 30 179 30 0 0 0 0 0 149 8. Ratibad (Phanda) 12 71 11 0 0 0 0 0 60 9. Khamkheda (Phanda) 55 302 55 0 0 0 0 3 244 Cluster Village 180 1070 171 0 0 0 0 7 892
10 Manikhedi Kot (Phanda) 15 90 14 0 0 0 0 2 74 Control Village 15 90 14 0 0 0 0 2 74 Total 314 1921 303
[1577] 0 0 2
[0.10] 0 13
[0.68] 1603
[83.45]
4.134 In line with information pertaining to income, 83.45 percent of family members are within the expenditure range of Rs. 1001 and above per month.
4.135 To sum-up;
- The percentage of males within the age group of 20 to 60 years representing the labour force is 42.15 while that for females it is 45.50 percent indicating the availability of eligible work force.
- The percentage of dependent male population, considered from the age groups of 0 to 10 years and 60 years and above is 31.80 and for females it is 33.41 percent which is negative demographic characteristics, since this group of population do not contribute much towards family income.
- The literacy percentage being 88.03 percent in the sample area is amazingly high. The overall educational situation that emerges show the absorption capacity of the people of the sample area to adopt latest technology regarding agriculture imparted by the K.V.K.
- The bulk of the farming communities is from the category of ‘farmers’ consisting of middle level and big cultivators [263 in number] constituting 72.26 percent to total of 359 persons pursuing various main occupations that denotes feasibility to implement various technology related to agriculture, particularly by the K.V.K. in our area of study.

99
- Only 12 number of persons are engaged in livestock and fishing activities in our area of study as main occupation which hardly offers any scope for bringing new technology in the field of animal husbandry and fisheries.
- The complete absence of main occupation in secondary and tertiary sectors is another dismal factor that provides no scope for extension activities by the K.V.K. in our area of study.
- Only 17 persons are pursuing agriculture as subsidiary occupation. In rest of the categories there is total absence of involvement of any person in any occupation
- Regarding average monthly income 82.77 percent of family members are within the income range of Rs. 1001 and above per month which is obvious as most of the farmers are pursuing agriculture in viable manner. Similarly 83.45 percent of family members are within the expenditure range of Rs. 1001 and above per month.
SUBJECTS OF TRAINING RECEIVED 4.136 At the outset, it is, perhaps, necessary to clarify the point that there are 290 number of
families who took part in vocational training, front line demonstration and on farm testing which are the three basic mandates of K.V.K. Therefore, the total of responding families from vocational training, front line demonstration and on farm testing will not tally with the figure of 290 as from this basis figure of 290 the responding families participated in three fundamental activities. The entire analysis is based upon family approach as normally one member from each family from adopted and cluster villages where there is direct intervention of K.V.K. takes part in various training programmes. It is evident that in what follows only adopted and cluster villages have been taken into account, i.e. 9 number of villages, excluding one control village where there is no intervention of K.V.K.
4.137 Out of the total of 314 families identified for detailed enquiry, 290 families have
responded to the various training and demonstration initiatives of the K.V.K. constituting 92.36 percent to total identified households which, of course, is an encouraging fact that shows awareness and intent of the cultivators to adopt various technologies related to agriculture. In what follows an attempt has been made to present the item wise details of various initiatives adopted by the K.V.K. in the fields of vocational training, front line demonstration and on farm testing.
VOCATIONAL TRAINING 4.138 The table shows the details;

100
Table No. 4.46 Subjects of Training Received – Vocational Training
*Subject On Which Training Received S.No.
Name Of The Village No. of Responde
nt Families
Crop Prod
Agronomy
Horticulture Livestock Dairying Poultry
Fisheries
1 2 3 4 5 6 7 Khajuri (Phanda) 30 30 6 5 0 Polashganj (Bersiya) 13 13 7 2 0 Mugalia Hat (Phanda) 77 77 18 5 0 I Adopted Village 120 120 31 12 0
Sonkatch (Bersiya) 27 27 6 0 0 Kolukhedi (Bersiya) 20 20 5 6 0 Kurana (Phanda) 27 27 10 0 0 Ratatal (Phanda) 30 30 8 0 0 Ratibad (Phanda) 12 12 5 0 0 Khamkheda (Phanda) 54 54 13 9 0
II Cluster VIllages 170 170 47 15 0 Total All VIllages 290 290 78 27 0
Table No. 4.46 [Contd…]
Subjects of Training Received – Vocational Training *Subject On Which Training Received S.No
. Name Of The Village
Home Science
Training Of Rural Youth
Agro Forestry
Organic Farms
Water Shed
Activities 1 2 8 9 10 11 12 Khajuri (Phanda) 6 2 5 0 4 Polashganj (Bersiya) 4 2 3 0 3 Mugalia Hat (Phanda) 28 7 2 0 14 I Adopted Village 38 11 10 0 21
Sonkatch (Bersiya) 4 2 6 0 2 Kolukhedi (Bersiya) 1 5 8 0 5 Kurana (Phanda) 2 0 0 0 0 Ratatal (Phanda) 0 0 0 0 0 Ratibad (Phanda) 4 0 2 0 0 Khamkheda (Phanda) 8 4 11 0 10
II Cluster VIllages 19 11 27 0 17 Total All VIllages 57 22 37 0 38
4.139 The above table shows that cent-percent families i.e. 290, responded to the various training
programmes relating to crop production. The next popular programme is relating to horticulture where 78 households forming 26.90 percent to total respondent families have reacted to the training effort of K.V.K. Home Science, watershed activities and agro-forestry are different subjects where number of households involved are 57,38,37 respectively that shows the interest of the households to diversify their activities, besides agriculture, for augmentation of income. Livestock, dairy and poultry and training of rural youth where only 9.31 percent and 7.59 percent households respectively are involved, clearly shows the lack of interest of the households in such subjects.

101
FRONT LINE DEMONSTRATION 4.140 The main objective of the front line demonstration is to demonstrate newly released crop
production and protection technologies and its management practices in the farmer’s fields. However, in front line demonstrations, the interactions regarding home science activities, training of rural youth and all the other items as specified for vocational training are done to educate and the farmers for augmentation of income. The table below shows the details;
Table No. 4.47
Subjects of Training Received – Front Line Demonstration Subject On Which Training Received S.No
. Name Of The Village No. of
Respondent
Families
Crop Prod
Agronomy
Horticulture Livestock Dairy
Poultry
Fisheries
1 2 3 4 5 6 7 Khajuri (Phanda) 15 15 5 0 0 Polashganj (Bersiya) 13 13 3 0 0 Mugalia Hat (Phanda) 13 11 13 0 0 I Adopted Village 41 39 21 0 0
Sonkatch (Bersiya) 15 15 3 0 0 Kolukhedi (Bersiya) 11 11 3 0 0 Kurana (Phanda) 7 7 5 0 0 Ratatal (Phanda) 9 9 5 0 0 Ratibad (Phanda) 8 8 2 0 0 Khamkheda (Phanda) 23 23 10 0 0
II Cluster VIllages 73 73 19 0 0 Total All VIllages 114 112 40 0 0
Table No. 4.47 [Contd…]
Subjects of Training Received – Front Line Demonstration Subject On Which Training Received S.No
. Name Of The Village
Home Science
Training Of Rural Youth
Agro Forestry
Organic Farms
Water Shed
Activities 1 2 8 9 10 11 12 Khajuri (Phanda) 0 0 3 0 2 Polashganj (Bersiya) 0 0 2 0 0 Mugalia Hat (Phanda) 0 0 1 0 0 I Adopted Village 0 0 6 0 2
Sonkatch (Bersiya) 0 0 2 0 0 Kolukhedi (Bersiya) 0 0 2 0 0 Kurana (Phanda) 0 0 0 0 0 Ratatal (Phanda) 0 0 0 0 0 Ratibad (Phanda) 0 0 1 0 0 Khamkheda (Phanda) 0 0 8 0 0
II Cluster VIllages 0 0 13 0 0 Total All VIllages 0 0 19 0 2

102
4.141 The above table shows that out of 290 responding families 114 i.e. 39.31 percent households have responded to the various programmes of front line demonstration which is, reasonably, a fair response. Here again, like vocational training, crop production [agronomy] group seems very popular where 112 households were involved for having demonstration regarding newly released crop production and protection technologies followed by horticulture where 40 number of households showed interest, followed by 19 households in agro-forestry and 2 households in watershed activities. A total gap is seen in the fields like livestock, dairy and poultry, fisheries, home science and organic farming activities which again indicate to one point that cultivators are basically interested in enhancing their agriculture related productivity which, firstly, they understand even without formal education and secondly their clear understanding that once the income from agriculture is enhanced the other activities allied to agriculture will naturally be taken care of because of a secure financial position.
ON FARM TESTING 4.142 In this practice the farmers participate in identifying problems and its priorities and
managing experiment and evaluating results. It is, therefore, an adaptive research with farmers perspective. The basic objective of on farm testing is to identify existing inputs or practices that might help to solve major problems of many farmers in a defined study area. The table below shows the details;
Table No. 4.48
Subjects of Training Received – On Farm Testing Subject On Which Training Received S.No
. Name Of The Village No. of
Respondent
Families
Crop Prod
Agronomy
Horticulture Livestock Dairy
Poultry
Fisheries
1 2 3 4 5 6 7 Khajuri (Phanda) 1 1 0 0 0 Polashganj (Bersiya) 2 2 0 0 0 Mugalia Hat (Phanda) 7 7 1 0 0 I Adopted Village 10 10 1 0 0 Sonkatch (Bersiya) 3 3 0 0 0 Kolukhedi (Bersiya) 2 2 0 0 0 Kurana (Phanda) 0 0 0 0 0 Ratatal (Phanda) 3 3 0 0 0 Ratibad (Phanda) 1 1 0 0 0 Khamkheda (Phanda) 3 3 0 0 0
II Cluster VIllages 12 12 0 0 0 Total All VIllages 22 22 1 0 0

103
Table No. 4.48 [Contd…] Subjects of Training Received – On Farm Testing
Subject On Which Training Received S.No.
Name Of The Village Home
Science Training Of Rural Youth
Agro Forestry
Organic Farms
Water Shed
Activities 1 2 8 9 10 11 12 Khajuri (Phanda) 0 0 0 0 0 Polashganj (Bersiya) 0 0 0 0 0 Mugalia Hat (Phanda) 0 0 0 0 0 I Adopted Village 0 0 0 0 0 Sonkatch (Bersiya) 0 0 0 0 0 Kolukhedi (Bersiya) 0 0 0 0 0 Kurana (Phanda) 0 0 0 0 0 Ratatal (Phanda) 0 0 0 0 0 Ratibad (Phanda) 0 0 0 0 0 Khamkheda (Phanda) 0 0 0 0 0
II Cluster VIllages 0 0 0 0 0 Total All VIllages 0 0 0 0 0
4.143 The above table shows that out of the total of 290 responding households only 22
households [7.59 percent to total responding households] have participated in the programme of on farm testing. A crowded participation is not expected as only bigger farmers having particular problem can afford testing the improved practices in their fields. Here again in crop production [agronomy] practices 22 number of households and one household in horticulture were involved. In rest of the fields, there was no participation at all.
4.144 The conclusion that can be drawn from above narration is that crop production
[agronomy] and horticulture are the areas where the cultivators are interested as these areas have direct relevance to their occupation. The other areas are home science, watershed, agro forestry and training of rural youth where the villagers have some interest. Livestock and poultry activities, fisheries and organic farming are the areas where the villagers have hardly any interest as the participation in such training programmes is almost nil.
IMPACT OF K.V.K. 4.145 In the foregoing paragraphs an analysis of subject wise training received has been presented.
In what follows an attempt has been made to present the impact of individual items of training in the broad categories of;
- Vocational Training - Front Line Demonstration - On Farm Testing
both before and after training [BT, AT] situations. This is the most important part of the report that clearly indicates the impact of K.V.K’s. intervention on agronomy, horticulture, livestock and dairying, fisheries, home science etc.

104
VOCATIONAL TRAINING – AGRONOMY - CEREALS 4.146 The table below shows the impact of K.V.K’s. intervention over cereal crops;
Table No. 4.49 Agronomy – Cereals
Yield Per – Hectare – Kg Wheat Paddy
Sl. No.
Name of the Village
No. of responding
families
BT AT No. of responding
families
BT AT
1 2 3 4 5 6 7 8 Khajuri (Phanda) 12 1950 2001 0 0 0 Polashganj (Bersiya) 13 1981 2008 2 680 701 Mugalia Hat
(Phanda) 49 1990 2110 0 0 0
I Adopted Village 74 2 Sonkatch (Bersiya) 19 1985 2112 0 Kolukhedi (Bersiya) 12 1975 2115 0 0 0 Kurana (Phanda) 10 1982 2110 0 0 0 Ratatal (Phanda) 15 1979 2115 0 0 0 Ratibad (Phanda) 9 1958 2005 0 0 0 Khamkheda
(Phanda) 17 1955 2110 5 582 699
II Cluster VIilages 82 7 Total All Villages 156 9
Table No. 4.49 [Contd…]
Agronomy – Cereals Yield Per – Hectare – Kg
Maize Jowar Sl. No.
Name of the Village
No. of responding
families
BT AT No. of responding
families
BT AT
1 2 3 4 5 6 7 8 Khajuri (Phanda) 2 1450 2100 2 400 1000 Polashganj (Bersiya) 3 1800 2050 0 0 0 Mugalia Hat (Phanda) 15 1650 1819 0 0 0 I Adopted Village 20 2
Sonkatch (Bersiya) 7 1300 1801 0 0 0 Kolukhedi (Bersiya) 0 0 0 0 0 0 Kurana (Phanda) 0 0 0 2 800 1000 Ratatal (Phanda) 0 0 0 0 0 Ratibad (Phanda) 0 0 0 0 0 0 Khamkheda (Phanda) 13 1450 2105 1 600 1005
II Cluster VIilages 20 3 Total All Villages 40 5
4.147 Among cereals wheat and to some extent maize are the important crops of Bhopal district.

105
4.148 Regarding wheat crop a total of 156 head of the households against the total of 290 families have responded to the vocational training that constitutes 53.79 percent to the total households. The yield per hectare before training [BT] ranged between 1955 kg in village Khamkheda [cluster village] to 1990 kg in village Mugalia Hat [adopted village] which is above the district average of 1837 kg and State average of 1867 kg. The after training scenario is much brighter wherein the yield per hectare ranged between 2001 kg in village Khajuri [adopted village] to 2115 kg in village Ratatal [cluster village]. The yield per hectare both in the situations of BT and AT is higher than the district and State averages that clearly indicates the positive effects of vocational training imparted by K.V.K. over the wheat crop.
4.149 As regards paddy crop only 9 families [2 number of families from adopted villages and 7
number of families from cluster villages] took part in vocational training with yield rate per hectare ranging between 582 kg for village Khamkheda [cluster village] to 680 kg for Polashganj [adopted village] in BT situation and 699 kg for village Khamkheda to 701 kg for Polashganj in AT situation. The yield per hectare after training [AT] though is less than district and State averages of 727 kg and 1058 kg respectively but definitely higher than the before training situations. Moreover for district Bhopal, paddy is comparatively a less important crop as is evident from number of families responding to vocational training.
4.150 Regarding Maize crop the total responding families are 40 with equal number of
participation from both adopted and cluster villages forming 13.79 percent to total responding families. During BT the maximum per hectare yield was reported to 1800 kg [more than the State average] for Polashganj which is one of the adopted villages while the minimum per hectare yield reported was 1300 kg from Sonkatch [cluster village]. The after training [AT] situation being 2105 kg in village Khamkheda and 1801 kg in village Sonkatch [cluster village] is better than the district average of 1566 kg per hectare and less than the state average figure of 2072 kg for most of the reporting villages. The impact of the vocational training over the maize crop is obviously good when compared particularly with the district average.
4.151 Jowar being unimportant crop of Bhopal district only 5 number of households have
participated in vocational training that constitutes only 1.72 percent to total households. The per-hectare yield before training though is less than the district average and State average of 1216 kg and 1342 kg respectively but the after training situation is better which ranged between 1000 kg for villages Khajuri and Kurana to 1005 kg for village Khamkheda, which is higher than before training scenario. The positive impact of the K.V.K. is, thus, obvious.
VOCATIONAL TRAINING – AGRONOMY – PULSES 4.152 The table below shows the details;

106
Table No. 4.50 Agronomy – Pulses
Yield Per – Hectare – Kg Gram Arhar Lentil
Sl. No.
Name of the Village
No. of respon-
ding families
BT AT No. of respon-
ding families
BT AT No. of respon-
ding families
BT AT
Khajuri (Phanda) 5 1100 1800 1 1000 1500 0 0 0 Polashganj
(Bersiya) 11 1000 1200 0 0 0 4 800 1000
Mugalia Hat (Phanda)
26 1075 1120 16 1110 1540 17 806 1005
I Adopted Village 42 17 21 Sonkatch (Bersiya) 10 1001 1170 6 1120 1500 0 0 0 Kolukhedi
(Bersiya) 10 1058 1152 0 0 0 0 0 0
Kurana (Phanda) 12 1082 1162 0 0 0 0 0 0 Ratatal (Phanda) 12 1110 1235 1 1123 1500 0 0 0 Ratibad (Phanda) 7 1050 1256 0 0 0 0 0 0 Khamkheda
(Phanda) 9 1058 1161 6 1005 1215 0 0 0
II Cluster Villages 60 13 0 Total All Villages 102 30 21
4.153 In pulses group Gram and Arhar are comparatively important crops for Bhopal district.
Regarding Gram, against the total of 290 households, 102 household [35.17 percent] have participated in vocational training. The after training performance that resulted in per-hectare yield ranging between 1256 kg for village Ratibad [cluster village] to 1161 kg for village Khamkheda [cluster village] is much higher than district average of 1002 kg and State average of 932 kg per hectare.
4.154 Arhar being comparatively less important crop in pulses group for Bhopal district, 30
household [10.34 percent to total households] have responded to vocational training which is reflected in enhanced productivity in after training situation that ranged between 1215 kg per hectare for village Khamkheda [cluster village] to 1540 kg for Mugalia Hat [adopted village], far more than district average of 550 kg per hectare and State average of 825 kg per hectare. The positive intervention of the K.V.K. is, thus, obvious.
4.155 Regarding lentil, only 21 households which is 7.24 percent to total households have attended
the vocational training. All the households are from the adopted villages. The AT situation is reflected in enhanced productivity that ranged between 1000 kg for Polashganj to 1005 kg for village Mugalia hat, which are much higher than district average productivity of 484 kg per hectare.
VOCATIONAL TRAINING - AGRONOMY – OIL SEEDS 4.156 The table below shows the details;

107
Table No. 4.51 Agronomy – Oil Seeds
Yield Per – Hectare – Kg Soybean Mustard
Sl. No.
Name of the Village
No. of responding
families
BT AT No. of responding
families
BT AT
1 2 3 4 5 6 7 8 Khajuri (Phanda) 29 1005 1174 0 0 0 Polashganj (Bersiya) 13 1112 1142 3 805 1600 Mugalia Hat (Phanda) 77 1129 1146 13 800 1112 I Adopted Village 119 16 Sonkatch (Bersiya) 26 1127 1139 2 0 1115 Kolukhedi (Bersiya) 20 1110 1137 0 0 0 Kurana (Phanda) 21 1115 1150 0 0 0 Ratatal (Phanda) 30 1125 1158 0 0 0 Ratibad (Phanda) 12 1128 1172 2 858 1115 Khamkheda (Phanda) 51 1125 1189 1 870 1137
II Cluster VIilages 160 5 Total All Villages 279 21
4.157 Soybean being important cash crop of Bhopal district, 279 number of families against 290
families have responded to various vocational training programmes organized by the K.V.K. that comes to 96.21 percent to total households. For every village the after training [AT] status is better than before training status [BT] that clearly shows the positive impact of the vocational training. In after training situation, the productivity ranged between 1137 kg per-hectare for village Kolukhedi to 1189 kg for village Khamkheda which are higher than the district status of 1076 kg and State average of 1132 kg per hectare.
4.158 Mustard though is an important cash crop, the response is not very bright as only 21
households have responded to the various vocational training programmes forming 7.24 percent to total number of sample households. The productivity in after training situation is better than that of before training that ranged between 1112 kg per-hectare for village Mugalia Hat to 1600 kg for Polashganj, higher than district and State average figures of 818 kg and 1009 kg respectively. The impact of the K.V.Ks. effort is thus obvious.
4.159 The participation of the households for receiving training on crops like cotton,
sugarcane, linseed is nil that clearly indicates the lack of interest of cultivators of Bhopal district in pursuing the cultivation of these crops.
4.160 Horticulture crops are important as they generate employment opportunities and income.
Being perennial, these crops also help in checking soil erosion and provide high density green cover to the soil. Being tough many of these crops can successfully be grown on waste land not suitable for traditional crop cultivation. The important strategies adopted for the Tenth Plan are extensive fruit tree plantation on government and private fa llow land and by the side of state highways and irrigation canals, popularizing plantation of medicinal and aromatic varieties, providing improved variety of vegetable seed to the cultivators and agriculture labour living below the poverty line and adopting cluster approach in selected villages for the development of horticulture produce. Against this background the information has been collected as shown in the following table;

108
Table No. 4.52 Horticulture Crops
Yield Per – Hectare – Quintal Potato Onion
Sl. No.
Name of the Village
No. of responding
families
BT AT No. of responding
families
BT AT
1 2 3 4 5 6 7 8 Khajuri (Phanda) 3 110 205 2 100 180 Polashganj (Bersiya) 0 0 0 0 0 0 Mugalia Hat (Phanda) 1 100 125 3 98 140 I Adopted Village 4 5 Sonkatch (Bersiya) 0 0 0 0 0 0 Kolukhedi (Bersiya) 0 0 0 0 0 0 Kurana (Phanda) 0 0 0 0 0 0 Ratatal (Phanda) 2 105 131 0 0 0 Ratibad (Phanda) 0 0 0 0 0 0 Khamkheda (Phanda) 3 110 132 2 97 135
II Cluster VIilages 5 2 Total All Villages 9 7
Table No. 4.52 [ Contd…]
Horticulture Crops Yield Per – Hectare – Quintal
Tomato Brinjal Sl. No.
Name of the Village
No. of responding
families
BT AT No. of responding
families
BT AT
1 2 3 4 5 6 7 8 Khajuri (Phanda) 4 110 182 5 185 237 Polashganj (Bersiya) 2 120 171 3 133 151 Mugalia Hat (Phanda) 7 115 170 6 150 190 I Adopted Village 13 14 Sonkatch (Bersiya) 3 121 162 4 131 195 Kolukhedi (Bersiya) 1 120 180 1 150 192 Kurana (Phanda) 4 121 171 5 135 190 Ratatal (Phanda) 3 125 181 3 140 191 Ratibad (Phanda) 3 128 191 1 200 240 Khamkheda (Phanda) 4 129 198 6 115 190
II Cluster VIilages 18 20 Total All Villages 31 34

109
Table No. 4.52 [ Contd…] Horticulture Crops
Yield Per – Hectare – Quintal
Chilli Bhindi
Sl. No.
Name of the Village
No. of responding
families
BT AT No. of responding
families
BT AT
1 2 3 4 5 6 7 8 Khajuri (Phanda) 0 0 0 2 70 110 Polashganj (Bersiya) 1 190 200 3 78 105 Mugalia Hat (Phanda) 2 101 165 4 82 98 I Adopted Village 3 9
Sonkatch (Bersiya) 1 190 230 3 84 101 Kolukhedi (Bersiya) 0 0 0 0 0 0 Kurana (Phanda) 2 105 151 1 95 130 Ratatal (Phanda) 1 200 250 3 90 115 Ratibad (Phanda) 1 150 210 2 98 120 Khamkheda (Phanda) 2 152 198 3 100 125
II Cluster VIilages 7 12 Total All Villages 10 21
Table No. 4.52 [ Contd…] Horticulture Crops
Yield Per – Hectare – Quintal
Cucerbits Mango
Sl. No.
Name of the Village
No. of responding
families
BT AT No. of responding
families
BT AT
1 2 3 4 5 6 7 8 Khajuri (Phanda) 0 0 0 0 0 0 Polashganj (Bersiya) 2 0 125 2 175 250 Mugalia Hat (Phanda) 1 0 100 0 0 0 I Adopted Village 3 2
Sonkatch (Bersiya) 0 0 0 0 0 0 Kolukhedi (Bersiya) 0 0 0 3 0 215 Kurana (Phanda) 0 0 0 0 0 0 Ratatal (Phanda) 2 110 171 0 0 0 Ratibad (Phanda) 0 0 0 0 0 0 Khamkheda (Phanda) 1 0 115 1 0 256
II Cluster VIilages 3 4 Total All Villages 6 6

110
Table No. 4.52 [ Contd…] Horticulture Crops
Yield Per – Quintal Papaya Citrus Other
Sl. No.
Name of the Village
No. of respon-
ding families
BT AT No. of respon-
ding families
BT AT No. of respon-
ding families
BT AT
Khajuri (Phanda) 0 0 0 0 0 0 0 0 0 Polashganj
(Bersiya) 0 0 0 2 0 30 0 0 0
Mugalia Hat (Phanda)
1 92 150 0 0 0 0 0 0
I Adopted Village 1 2 0 Sonkatch (Bersiya) 0 0 0 0 0 0 0 0 0 Kolukhedi
(Bersiya) 0 0 0 0 0 0 0 0 0
Kurana (Phanda) 0 0 0 0 0 0 0 0 0 Ratatal (Phanda) 2 191 251 0 0 0 0 0 0 Ratibad (Phanda) 0 0 0 0 0 0 0 0 0 Khamkheda
(Phanda) 0 0 0 0 0 0 1 0 50
[Garlic}
II Cluster Villages 2 1 Total All Villages 3 2 1
4.161 The above table shows that in case of potato only 9 number of families have responded to
the vocational training programme which is 3.10 percent to total of 290 families. The per-hectare yield has enhanced in every reporting village after receiving the training which ranged between 125 quintal per hectare in case of village Mugalia Hat to 205 quintal in case of village Khajuri, higher than the district average of 115 quintal and State average of 119 quintal.
4.162 Regarding onion only 7 member of families [2.41 percent to total number of sample
families] took vocational training resulting in increased per-hectare yield after receiving the training as compared to before training [BT] situations. The after training results ranged between 125 quintal per hectare for the village Mugalia hat to 205 quintal for Khajuri which are above the district average of 115 quintal per-hectare and State average of 119 quintal per-hectare.
4.163 Tomato is yet another crop gradually becoming popular as 31 families have responded to
the vocational training programme constituting 10.69 percent to total number of families. The after training scenario as compared to before training status is better in case of every reporting village. A comparison with district and State averages is not possible because of the absence of such information. Similar is the case with brinjal crop wherein 34 families have taken the advantage of vocational training which resulted in better performance reflected in the shape of enhanced per-hectare yield in after training situations as compared to before training. The non-availability of per-hectare yield figures of district and State levels is a constraint for comparing the information with sample villages.

111
4.164 Chilly and bhindi are the crops wherein 10 and 21 families respectively have responded to the vocational training programme that constitute 3.45 percent and 7.25 percent respectively to the total number of 290 sample families. The difference between per-hectare yields in before and after training situations are substantial that obviously shows the impact of the vocational training programme initiated by the K.V.K.
4.165 In the group of cucerbits, mango crop, papaya, citrus crops and other crops the
number of families responded are only 6,6,3,2 and 1 respectively which can hardly be termed as an encouraging picture. However, the yield per hectare in after training situation is better than before training position that vouches for the positive impact of vocational training. The absence of district and State average figures have resulted in absence of comparison with the yield rates of sample villages.
4.166 However, the conclusion that can be drawn from the above narration is that the
horticulture related crops are yet to make an impact over the prevailing cropping pattern of the district.
VOCATIONAL TRAINING – LIVESTOCK AND DAIRY 4.167 An important component of agricultural diversification is animal husbandry including
dairying and poultry which hold immense promise for improving the rural livelihoods by providing additional source of income and employment, specially to land less and small and marginal farmers. Proper development of this sector will require attention not only to technology, processing and marketing arrangements but also to issues of animal welfare. Among many strategies laid down for the Tenth Plan the subsidy programme for purchase of animal feed cutters by the cultivators, initiating programme of extending subsidy for constructing silage pits by the cultivators to popularize stall feeding and provision of goat units to persons living below the poverty line are important. However, the situation at the grass roots relating to animal husbandry is not that encouraging as is revealed by the survey results. The table below shows the details;
Table No. 4.53
Live Stock and Dairying Improved Breed (No.) Milk production (liters) Sl.
No. Name of the Village
No. of responding
families
BT AT No. of responding
families
BT AT
1 2 3 4 5 6 7 8 Khajuri (Phanda) 0 0 0 5 3 7 Polashganj (Bersiya) 1 0 12 2 5 17 Mugalia Hat (Phanda) 3 0 5 4 6 12 I Adopted Village 4 0 17 11 14 36
Sonkatch (Bersiya) 0 0 0 0 0 0 Kolukhedi (Bersiya) 6 7 23 6 24 43 Kurana (Phanda) 0 0 0 0 0 0 Ratatal (Phanda) 0 0 0 0 0 0 Ratibad (Phanda) 0 0 0 0 0 0 Khamkheda (Phanda) 3 0 3 9 24 74
II Cluster VIilages 9 7 26 15 48 117 Total All Villages 13 7 43 26 62 153

112
Table No. 4.53 [Contd….] Live Stock and Dairying
Artificial insemination
No. of animals Improved feeding
management Vaccination No.
Sl. No.
Name of the Village
No. of respon-
ding families
BT AT No. of respon-
ding families
Yes No No. of respon-
ding families
BT AT
1 2 3 9 10 11 12 13 14 15 16 Khajuri (Phanda) 5 0 1 5 5 0 5 0 5 Polashganj
(Bersiya) 0 0 0 2 2 0 0 0 0
Mugalia Hat (Phanda)
3 0 5 3 3 0 3 0 7
I Adopted Village 8 0 6 10 10 0 8 0 12
Sonkatch (Bersiya) 0 0 0 0 0 0 0 0 0 Kolukhedi
(Bersiya) 6 0 16 6 6 0 6 10 23
Kurana (Phanda) 0 0 0 0 0 0 0 0 0 Ratatal (Phanda) 0 0 0 0 0 0 0 0 0 Ratibad (Phanda) 0 0 0 0 0 0 0 0 0 Khamkheda
(Phanda) 3 1 2 5 5 0 9 5 10
II Cluster Villages 9 1 18 11 11 0 15 15 33 Total All Villages 17 1 24 21 21 0 23 15 45
4.168 Ensuring the development of local pedigree animals and control the population of non-
descript animals through improved breeding practices are a few of the initiatives taken by the State Government. However, the number of families involved in vocational training regarding improved breed is only 13 [4.48 percent to total number of 290 families] that shows rather lack of interest of the participants. However, only 7 number of improved animals were there before training which increased to 43 number of animals after training which shows the positive impact though on limited scale.
4.169 Regarding milk production, 26 number of families from five sample villages have attended
the vocational training that comes to 8.97 percent to total number of sample families. In before training situation the total milk production of five reporting villages was 62 liters which increased 153 liters in after training situation. Though the impact is there in limited sense but a continuous effort may lead to still better level of milk production.
4.170 As regards artificial insemination 17 families [5.86 percent] from four villages have
attended the training programme resulting in 24 number of animals inseminated in after training situation against one insemination in before training condition. The positive impact is thus visible.
4.171 Regarding improved feeding management, one of important ingredients of animal
husbandry functions, 21 [7.24 percent] families from 4 villages have adopted such practices. The situation, though is not very bright, but a continuous effort may lead to better conditions.

113
4.172 Similarly for vaccination, 23 families [7.93 percent] from four villages have responded to the training programme getting 15 number of animals vaccinated during before training situation which increased to 45 in after training conditions that speaks of the impact of the training imparted by the K.V.K.
4.173 In rural areas animal rearing activities are normally taken-up on small scale mainly
because of the paucity of expert services and lack of road connectivity that deters the marketing of the product. Normally dairy farms are located close to urban areas, properly linked with the road network. For developing dairy activities in villages the first requirement, therefore, is the development of road connectivity, only then the dairying can be taken-up on viable scale for augmenting the income of the cultivators, which actually is the basic objective of the animal husbandry activities. Till then any effort of vocational training for animal husbandry and dairy will remain to be a matter of formality.
VOCATIONAL TRAINING – POULTRY 4.174 The table below shows the details;
Table No. 4.54 Poultry Farming
Improved Breed (No.) Broilers (No.)
Sl. No.
Name of the Village
No. of responding
families
BT AT No. of responding
families
BT AT
1 2 3 4 5 6 7 8 Khajuri (Phanda) 0 0 0 0 0 0 Polashganj (Bersiya) 0 0 0 0 0 0 Mugalia Hat (Phanda) 1 0 1000 1 0 1000 I Adopted Village 1 0 1000 1 0 1000
Sonkatch (Bersiya) 0 0 0 0 0 0 Kolukhedi (Bersiya) 0 0 0 0 0 0 Kurana (Phanda) 0 0 0 0 0 0 Ratatal (Phanda) 0 0 0 0 0 0 Ratibad (Phanda) 0 0 0 0 0 0 Khamkheda (Phanda) 0 0 0 0 0 0
II Cluster VIilages 0 0 0 0 0 0 Total All Villages 1 0 1000 1 0 1000

114
Table No. 4.54 [Contd….] Poultry Farming
Improved caging
system Improved feed management
Vaccination No. of Birds
Sl. No.
Name of the Village
No. of respon-
ding families
Yes No No. of respon-
ding families
Yes No No. of respon-
ding families
BT AT
1 2 3 9 10 11 12 13 14 15 16 Khajuri (Phanda) 0 0 0 0 0 0 0 0 0 Polashganj(Bersiya 0 0 0 0 0 0 0 0 0 Mugalia Hat
(Phanda) 1 1 1 0 1 0 1 0 1000
I Adopted Village 1 1 1 1 1 0 1 0 1000 Sonkatch (Bersiya) 0 0 0 0 0 0 0 0 0 Kolukhedi(Bersiya 0 0 0 0 0 0 0 0 0 Kurana (Phanda) 0 0 0 0 0 0 0 0 0 Ratatal (Phanda) 0 0 0 0 0 0 0 0 0 Ratibad (Phanda) 0 0 0 0 0 0 0 0 0 Khamkheda
(Phanda) 0 0 0 0 0 0 0 0 0
II Cluster Villages 0 0 0 0 0 0 0 0 0 Total All Villages 1 1 1 1 1 0 1 0 1000
4.175 Poultry again is an activity in rural areas which is undertaken on a very small scale
which is evident from the fact that only one family each has taken part in various poultry related activities viz. improved breed, broiler rearing, improved caging system, improved feed management and vaccination of birds. Though 1000 number of improved poultry [breed wise] and the same number of broilers have been produced after attending the training, yet only one number of respondent in each parameter raises a question whether in Bhopal district the training programme for poultry development should at all be organized and instead the effort involved in such subject should be directed to the spheres of agronomy where more families participate. If at all poultry related training is to be organized an assessment of the number of trainees to attend the programme must be done beforehand so that the effort becomes meaningful.
4.176 Inland fisheries though is an integral component of rural development in Madhya Pradesh
but in our sample area of study not a single family has taken vocational training in fishery activities, though it is possible tha t the fishing activities in a stray way are being pursued in our sample area. This is an activity where more number of persons should respond. The K.V.K. may make special efforts for popularizing the training on fishery activities along with State Government personnel.

115
VOCATIONAL TRAINING – HOME SCIENCE 4.177 Vocational training in Home Science activities like toy making, preparation of pickles,
bakery and jute items, preparation of papad/bari/jam/jelly etc. are important as usually the women and old people in rural areas get themselves engaged, that, besides, giving an income support, provide avenues of employment to rural population. The table below shows the details;
Table No. 4.55 Home Science Activities
Toy making (No.) Pickels (Kg.) Sl. No.
Name of the Village No. of
responding families
BT AT No. of responding
families
BT AT
1 2 3 4 5 6 7 8 Khajuri (Phanda) 0 0 0 6 2 5 Polashganj (Bersiya) 1 0 2 4 9 21 Mugalia Hat (Phanda) 0 0 0 27 59 115 I Adopted Village 1 0 2 37 70 141
Sonkatch (Bersiya) 0 0 0 4 6 20 Kolukhedi (Bersiya) 0 0 0 0 0 0 Kurana (Phanda) 0 0 0 2 1 9 Ratatal (Phanda) 0 0 0 0 0 0 Ratibad (Phanda) 0 0 0 1 2 10 Khamkheda (Phanda) 0 0 0 11 23 65
II Cluster Viilages 0 0 0 18 32 104 Total All Villages 1 0 2 55 102 245
Table No. 4.55 [Contd…] Home Science Activities
Bakery (Kg.) Papad/Badi/Jam/Jelly (Kg.) Sl. No.
Name of the Village No. of
responding families
BT AT No. of responding
families
BT AT
1 2 3 4 5 6 7 8 Khajuri (Phanda) 2 0 2 5 2 6 Polashganj (Bersiya) 0 0 0 1 0 4 Mugalia Hat (Phanda) 16 54 110 21 3 88 I Adopted Village 18 54 112 27 5 98 Sonkatch (Bersiya) 2 0 5 2 0 9 Kolukhedi (Bersiya) 0 0 0 0 0 0 Kurana (Phanda) 0 0 0 2 8 2 Ratatal (Phanda) 0 0 0 0 0 0 Ratibad (Phanda) 1 0 1 1 0 5 Khamkheda (Phanda) 1 0 2 9 8 27
II Cluster Viilages 4 2 8 14 8 43 Total All Villages 22 56 120 41 13 141
4.178 Ever since the plastic toys have come in the rural markets, the indigenous art of making clay
toys is getting extinct as is evident from the fact that only one family member from village Polashganj has taken training in toy making with no tangible output.

116
4.179 Preparation of pickles, of course, is an item getting popular in rural areas as the skill is already there being sharpened by the vocational training. Out of 290 sample families 55 households [18.97 percent to total sample households] have responded to the vocational training organized by the K.V.K. with production of 245 kg of pickles after getting the training as compared to 102 kg in before training situation.
4.180 In bakery items, which is supposed to be an urban activity, 22 households from 5 villages
have taken part in vocational training resulting in production of bakery worth 120 kg. as against 56 kg in before training situation. The gradual impact of intervention of K.V.K. is thus visible.
4.181 Regarding making of paper/badi etc., which is becoming a popular activity in rural areas
mainly due to portability of the product in nearby market, 41 households [14.14 percent to total number of sample households] have responded to the training programme resulting in production of 141 kgs of product after getting training as against the production of 13 kg in before training situation. Such type of activities may be extensively popularized in rural areas as these functions have immense employment potential for augmenting family income.
VOCATIONAL TRAINING – TRAINING OF RURAL YOUTH 4.182 Training of rural youth for self employment is an integral part of rural development.
Multiple of activities have been identified for imparting training. In our area of study placements have been recorded only in two trades viz. motor binding and tractor, diesel engine repair. The table below shows the details.
Table No. 4.56
Training of Rural Youth Placement, motor binding No. of
beneficiaries Placement, Tractor, diesel
engine repairing Sl. No.
Name of the Village
No. of responding families
BT AT No. of responding families
BT AT
1 2 3 4 5 6 7 8 Khajuri (Phanda) 2 0 2 0 0 0 Polashganj (Bersiya) 1 0 1 1 0 1 Mugalia Hat (Phanda) 3 0 3 1 0 1 I Adopted Village 4 0 6 2 0 2 Sonkatch (Bersiya) 2 0 2 0 0 4 Kolukhedi (Bersiya) 2 0 2 3 0 1 Kurana (Phanda) 0 0 0 0 0 0 Ratatal (Phanda) 0 0 0 0 0 0 Ratibad (Phanda) 0 0 0 0 0 0 Khamkheda (Phanda) 2 0 2 1 0 1
II Cluster VIilages 6 0 4 4 0 2 Total All Villages 10 0 10 6 0 6
4.183 Regarding motor binding 10 respondents have been self employed while in case of engine
repairs 6 persons got placement after receiving training. This is not a very mean achievement, as the trend will induce more number of rural youth to attend such training courses for rehabilitating themselves in life. Seemingly other trades like black smithy, carpentry, masonry are not popular as no rural youth has responded to such programmes.

117
VOCATIONAL TRAINING – AGRO FORESTRY 4.184 Agro-forestry is the concept of eightees which guarantees farm income, covers the risk of
crop failure, improves the soil fertility, its structure and texture and checks the soil erosion. The table below shows the details;
Table No. 4.57
Agro Forestry – On Farm Plantation On farm plantation (Hectare) Sl. No. Name of the Village
No. of responding families
BT AT
1 2 3 4 5 Khajuri (Phanda) 5 5 8 Polashganj (Bersiya) 3 0 2 Mugalia Hat (Phanda) 2 10 15 I Adopted Village 10 15 25 Sonkatch (Bersiya) 4 0 20 Kolukhedi (Bersiya) 7 2 6 Kurana (Phanda) 0 0 0 Ratatal (Phanda) 0 0 0 Ratibad (Phanda) 0 0 0 Khamkheda (Phanda) 11 2 13
II Cluster VIilages 22 4 39 Total All Villages 32 19 64
4.185 Out of total of 290 families, 32 number of households from six villages have responded to
the vocational training programme organized by the K.V.K. which is 11.03 percent to the total of sample households. The area coverage before training was 19 hect that increased to 64 hect which reflects the impact of K.V.K. effort, though on limited scale. More efforts are required to enhance the area under agro-forestry as the concept has immense advantages.
VOCATIONAL TRAINING – ORGANIC FARMING 4.186 The concept is yet to pick-up in our area of study as the response is nil to the various
training programmes relating to organic farming. However, as on date the organic farming concept is followed either in government farms or by the big cultivators as the yield per-hectare derived out of this practice is usually low which the small cultivators can not afford. However, efforts must be made to popularize the organic farming techniques as the product fetches more income.
VOCATIONAL TRAINING – WATERSHED ACTIVITIES 4.187 Watershed activities are undertaken mainly to conserve rain water by evolving various
check points to arrest the flow of water. In our area of study the response was only to construction of soak pits that collects the domestic waste water outside the residential building which have the various advantages from sanitation point of view and also raises the water table through percolation technique. The table below shows the details;

118
Table No. 4.58 Watershed Activities – Soak Pits
Soak Pits Nos. Sl. No. Name of the Village No. of responding
families BT AT
1 2 3 4 5 Khajuri (Phanda) 4 6 4 Polashganj (Bersiya) 3 0 10 Mugalia Hat (Phanda) 14 0 173 I Adopted Village 21 6 227
Sonkatch (Bersiya) 2 0 15 Kolukhedi (Bersiya) 5 6 35 Kurana (Phanda) 0 0 0 Ratatal (Phanda) 0 0 0 Ratibad (Phanda) 0 0 0 Khamkheda (Phanda) 10 0 104
II Cluster VIilages 17 6 154 Total All Villages 38 12 381
4.188 The above table shows that out of 290 sample families 38 number of households from six
villages have responded that comes to 13.10 percent to the total number of sample families. The number of soak pits constructed in before training situation is 12 which increased to 381 – a quantum jump, that speaks of the impact of K.V.K. intervention in creating awareness. The other items of watershed activities i.e. nallah bunding, construction of check dams and counter trenches are basically aimed at creating community assets which require the initiative of the government with public participation.
4.189 In the following paragraphs an attempt has been made to sum-up the efforts of vocational
training imparted by the K.V.K.
- Regarding the yield per-hectare both for agronomical and horticultural crops the after training situation as compared to before training situation is better that clearly shows the positive impact of vocational training imparted by the K.V.K.
- In case of wheat crop where the response is 53.79 percent to total number of 290 sample households, the per-hectare yield is more than the district and State averages both in before training and after training situations.
- For paddy crop the percentage response is 3.10 with per-hectare yield less than district and State averages both in before training and after training situations. However, paddy being comparatively less important crop for district Bhopal, the lesser response seems obvious. However intensive efforts are required to enhance the productivity to bring it at par with at least the district average.
- Regarding maize crop where the participation is 13.79 percent to total number of sample households the per-hectare yield in after training conditions is better than district average and less than the State average.
- For gram crop the percentage participation is 35.17 with remarkable after training performance resulting in much higher productivity as compared to both district and State averages.
- Regarding arhar crop where the percentage participation is 10.34, the per hectare yield in after training scenario is better than both district and State averages.

119
- Similarly for lentil crop the productivity in AT situations are higher than district and State level performances.
- Soybean being an important cash crop of Sehore district, 96.21 percent families have participated in the vocational training programmes. The per-hectare yield in after training status is higher than both district and State average.
- In case of mustard crop though the percentage response is only 7.24 but the after training performance is satisfactory because of higher per-hectare yield as compared to district and State averages. An intensive effort will perhaps enhance the participation rate.
- The important horticulture crops of the district are tomato, brinjal and bhindi wherein the participation rate is 10.69 percent, 11.24 percent and 7.25 percent respectively. In these crops the after training performances are better than before training situations. An intensive effort is, perhaps, required to persuade the cultivators to take-up cultivation of horticulture crops on affordable scale looking to the availability of market as these crops give income support to the families.
- Livestock and dairying where the participation rate that ranged between 4.48 percent for improved breeding practices to 8.97 percent for milk production, need some more effort to enhance the participation of the villagers as the live stock and dairy activities are important constituents of income augmentation.
- Poultry and fisheries are the areas where negligible or nil participation has been recorded. These are the activities which are pursued by the villagers on a limited scale that hardly induce them to attend any training programme what-so-ever.
- For home science the important constituents are preparation of pickles, bakery items, making of papad/badi etc where though participation is limited but the things are picking-up that gives a promise of better performance.
- Similar is the case with training of rural youth wherein 10 and 6 persons respectively got placements in the trades like motor binding and engine repairs respectively. Though the performance is on limited scale, a better performance is expected provided the awareness campaigns are organized on more extensive scale.
- Agro-forestry is yet another field where 32 number of households from six villages have taken advantage of the vocational training programme.
- The concept of organic farming is yet to pick-up in our area of study as the response is nil to the various training programmes relating to organic farming.
- Regarding watershed activities, 38 number of households that comes to 13.10 percent to total number of sample households have participated in the training relating to construction of soak pits.
FRONT LINE DEMONSTRATION – AGRONOMY CEREALS 4.190 Front line demonstrations are organized on farmers field with the result the response is
bound to be low as compared to vocational training. Normally the front line demonstrations are organized for such cultivators who have received the vocational training. The table below shows the impact of front line demonstrations on cereal crops.

120
Table No. 4.59 Agronomy – Cereals
Yield Per – Hectare – Kg Wheat Paddy
Sl. No.
Name of the Village
No. of responding
families
BT AT No. of responding
families
BT AT
1 2 3 4 5 6 7 8 Khajuri (Phanda) 3 1981 2121 0 0 0 Polashganj (Bersiya) 6 1970 2012 0 0 0 Mugalia Hat (Phanda) 13 1992 2115 0 0 0 I Adopted Village 22 0 Sonkatch (Bersiya) 13 1915 2115 2 684 712 Kolukhedi (Bersiya) 0 0 0 0 0 0 Kurana (Phanda) 2 1928 2118 0 0 0 Ratatal (Phanda) 2 1915 2111 0 0 0 Ratibad (Phanda) 4 1968 2019 0 0 0 Khamkheda (Phanda) 9 1970 2116 3 619 705
II Cluster VIilages 30 5 Total All Villages 52 5
Table No. 4.59 [contd…]
Agronomy – Cereals Yield Per – Hectare – Kg
Maize Jowar Sl. No.
Name of the Village
No. of responding
families
BT AT No. of responding
families
BT AT
1 2 3 4 5 6 7 8 Khajuri (Phanda) 1 1500 2200 0 0 0 Polashganj (Bersiya) 0 0 0 0 0 0 Mugalia Hat (Phanda) 3 1478 1501 0 0 0 I Adopted Village 4 Sonkatch (Bersiya) 3 1311 1415 2 0 1205 Kolukhedi (Bersiya) 0 0 0 0 0 0 Kurana (Phanda) 0 0 0 0 0 0 Ratatal (Phanda) 0 0 0 0 0 0 Ratibad (Phanda) 0 0 0 0 0 0 Khamkheda (Phanda) 6 1401 1425 0 0 0
II Cluster VIilages 9 2 Total All Villages 13 2
4.191 The front line demonstrations for the wheat crop have been organized on the fields of 52
farmers. In before training situations the per hectare yield of wheat ranged between 1928 kg for village Kurana [cluster village] to 1992 kg for village Mugalia Hat [adopted village] which are higher than the per hectare yield levels of district Bhopal [1837 kg] and state [1867 kg]. In after training situations, for every reporting village the yield rate is higher than before training conditions.

121
4.192 Regarding paddy, a total number of 5 demonstrations have been organized in two cluster villages. The productivity in after training situation is better than that of before training status though the productivity is less than the district and State averages of 727 kg per hectare and 1058 kg. respectively. Paddy being less important crop of Bhopal district, such results are expected.
4.193 In case of maize crop 13 numbers of FLDs have been organized in 4 number of villages that
resulted in better performance in after training situation where the yield rate varied between 1415 kg per hectare in case of village Sonkatch to 2200 kg in case of Khajuri, which are lower than district and State average figure of 1566 kg and 2072 kg respectively [except for village Khajuri].
4.194 Similarly for jowar crop 2 numbers of FLDs have been organized in one village. Since the
crop is hardly of any importance to Bhopal district only after training result of 1200 kg have been recorded which is less that the district and State average figures of 1216 kg and 1342 kg respectively.
AGRONOMY - PULSES 4.195 The table below shows the details;
Table No. 4.60
Agronomy – Pulses Yield per hectare – Kg
Gram Sl. No. Name of the Village
No. of responding families
BT AT
1 2 3 4 5 Khajuri (Phanda) 5 1300 1400 Polashganj (Bersiya) 2 1200 1350 Mugalia Hat (Phanda) 6 1100 1275 I Adopted Village 13 Sonkatch (Bersiya) 9 1106 1215 Kolukhedi (Bersiya) 7 1105 1216 Kurana (Phanda) 3 1110 1213 Ratatal (Phanda) 1 1400 1800 Ratibad (Phanda) 2 1105 1910 Khamkheda (Phanda) 5 1107 1400
II Cluster VIilages 27 Total All Villages 40

122
Table No. 4.60 [Contd…] Agronomy – Pulses
Yield Per – Hectare – Kg Arhar Lentil
Sl. No.
Name of the Village
No. of responding
families
BT AT No. of responding
families
BT AT
1 2 3 4 5 6 7 8 Khajuri (Phanda) 1 1000 1200 0 0 0 Polashganj (Bersiya) 0 0 0 0 0 0 Mugalia Hat (Phanda) 1 979 1150 3 1100 1175 I Adopted Village 2 3 Sonkatch (Bersiya) 4 978 1151 0 0 0 Kolukhedi (Bersiya) 0 0 0 0 0 0 Kurana (Phanda) 0 0 0 0 0 0 Ratatal (Phanda) 0 0 0 0 0 0 Ratibad (Phanda) 0 0 0 0 0 0 Khamkheda (Phanda) 3 890 1000 0 0 0
II Cluster VIilages 7 0 Total All Villages 9 3
4.196 Gram being one of the important crops of Bhopal district,40 number of front line
demonstration [F.L.Ds.] were organized in all the 9 number of villages resulting in per-hectare yield ranging between 1004 kg in village Mugalia Hat [adopted village] to 1300 kg in village Khajuri [adopted village] which are more than district and State averages of 1002 kg and 825 kg respectively in BT situations. In AT situations the per-hectare yield for all the villages is more than the BT situation that ranged between 1213 kg in case of village Kurana to [cluster village] to 1910 kg for village Ratibad [cluster village] with obvious advantage over district and State averages. The satisfactory performance in cluster villages is indicative of the fact that the positive results of the FLD have percolated to cluster group of villages through various forward linkages.
4.197 In case of Arhar, 9 number of FLDs have been organized in four villages resulting in crop
productivity which is higher in AT situations for all the villages indicating the positive impact of K.V.K’s. effort. The yield per-hectare both in BT and AT situations is higher than the district average of 550 kg and state average of 825 kg which again is an indication of better performance.
4.198 Regarding Lentil, 3 number of FLDs have been organized in village Mugalia Hat [adopted
village] resulting in yield which is more than district average of 484 kg [the state average figure is not available] both in BT and AT situations.

123
FLD – AGRONOMY – OIL SEEDS 4.199 The table below shows the details;
Table No. 4.61
Agronomy – Oil Seeds Yield Per – Hectare – Kg
Soybean Mustard Sl.
No. Name of the Village
No. of responding
families
BT AT No. of responding
families
BT AT
1 2 3 4 5 6 7 8 Khajuri (Phanda) 5 1000 1100 0 0 0 Polashganj (Bersiya) 7 1325 1635 1 0 916 Mugalia Hat (Phanda) 19 1000 1115 3 700 890 I Adopted Village 31 4
Sonkatch (Bersiya) 16 1005 1125 2 0 827 Kolukhedi (Bersiya) 6 1005 1125 0 0 0 Kurana (Phanda) 1 1006 1126 0 0 0 Ratatal (Phanda) 5 1009 1125 0 0 0 Ratibad (Phanda) 4 1110 1139 0 0 0 Khamkheda(Phanda) 27 1115 1171 1 0 829
II Cluster VIilages 59 3 Total All Villages 90 7
4.200 Soybean being important crop of Bhopal district, the number of FLDs organized are 90 for
all the nine number of sample villages resulting in yield rate that ranged between 1000 kg for village Khajuri [adopted village] to 1335 kg for village Polashganj [adopted village] in BT situations which is lower than district and state averages of 1076 kg and 1132 kg respectively for most of the villages, while in AT situation the yield per hectare [higher than BT situations for all the villages] ranged between 1100 kg for Khajuri [adopted village] to 1171 kg for village Khamkheda [cluster village] which are higher than district level per hectare yield. The performance of the K.V.K. in positive manner is obvious.
4.201 Regarding Mustard, 7 number of FLDs have been organized in four number of villages
resulting in productivity that ranged between 827 kg for village Sonkatch [Cluster village] to 916 kg for Polashganj [adopted village] in after training situations which is more than the district average of 818 kg and less than state average of 1009 kg.
4.202 No FLDs have been organized for cotton, sugarcane, linseed which are not
important crops of Bhopal district.

124
FLD – HORTICULTURE 4.203 The table below shows the details;
Table No. 4.62 Horticulture
Yield Per – Hectare – Kg Potato Onion
Sl. No.
Name of the Village
No. of responding
families
BT AT No. of responding
families
BT AT
1 2 3 4 5 6 7 8 Khajuri (Phanda) 3 100 201 0 0 0 Polashganj (Bersiya) 0 0 0 0 0 0 Mugalia Hat (Phanda) 1 105 178 2 100 118 I Adopted Village 4 2
Sonkatch (Bersiya) 0 0 0 0 0 0 Kolukhedi (Bersiya) 0 0 0 0 0 0 Kurana (Phanda) 0 0 0 0 0 0 Ratatal (Phanda) 0 0 0 0 0 0 Ratibad (Phanda) 0 0 0 0 0 0 Khamkheda (Phanda) 3 108 158 2 97 105
II Cluster VIilages 3 2 Total All Villages 7 4
Table No. 4.62 [Contd…]
Horticulture Yield Per – Hectare – Kg
Tomato Brinjal Sl. No.
Name of the Village
No. of responding
families
BT AT No. of responding
families
BT AT
1 2 3 4 5 6 7 8 Khajuri (Phanda) 4 100 205 5 155 236 Polashganj (Bersiya) 1 120 190 2 150 201 Mugalia Hat (Phanda) 5 100 140 3 110 475 I Adopted Village 9 10
Sonkatch (Bersiya) 0 0 0 1 180 200 Kolukhedi (Bersiya) 0 0 0 0 0 0 Kurana (Phanda) 0 0 0 2 125 201 Ratatal (Phanda) 2 110 145 1 125 211 Ratibad (Phanda) 2 115 155 0 0 0 Khamkheda (Phanda) 4 121 161 6 126 181
II Cluster VIilages 8 10 Total All Villages 17 20

125
Table No. 4.62[Contd…] Horticulture
Yield Per – Hectare – Kg Chilli Bhindi
Sl. No.
Name of the Village
No. of responding
families
BT AT No. of responding
families
BT AT
1 2 3 4 5 6 7 8 Khajuri (Phanda) 0 0 0 1 70 110 Polashganj (Bersiya) 0 0 0 0 0 0 Mugalia Hat (Phanda) 3 100 125 4 92 100 I Adopted Village 3 5 Sonkatch (Bersiya) 1 190 230 1 75 102 Kolukhedi (Bersiya) 0 0 0 0 0 0 Kurana (Phanda) 1 150 210 1 95 130 Ratatal (Phanda) 1 200 250 0 0 0 Ratibad (Phanda) 0 0 0 1 78 102 Khamkheda (Phanda) 1 98 119 1 71 125
II Cluster VIilages 4 4 Total All Villages 7 9
4.204 Potato being a common crop of the district, 7 number of FLDs have been organized in four
sample villages with the yield rates in AT situations far exceeding the BT situations with yield rates above the district average of 115 quintal and State average of 119 quintal per hectare.
4.205 Similarly for onion crop four number of FLDs have been organized in two villages wherein
the yield rates in AT conditions are more than BT conditions. The yield per hectare is more than the district average of 96 quintal for both BT and AT situations but less than the state average of 119 quintal for both BT and at conditions.
4.206 Tomato is one of the horticultural crops which is picking up in Bhopal district as is evident
from the fact that 17 number of FLDs have been organized with substantial yield rates particularly in AT situations. As the information regarding district and state average is not available, a comparison, therefore is not possible.
4.207 Similar is the case with Brinjal crop wherein 20 number of FLDs have been organized in 7
number of villages with satisfactory yield rates in AT situations that ranged between 181 quintal per hectare in village Khamkheda [cluster village] to 236 quintal in village Khajuri [adopted village]. Here again due to non-availability of district and State average information a comparison is not possible.
4.208 Regarding Chilly crop 7 number of FLDs have been organized in 5 sample villages leading
to a substantial yield rate particularly in AT situations leading to a visible positive impact of K.V.K. efforts. The non-availability of district and state average figures are constraint, hindering any sort of comparison with the results of sample villages.
4.209 Similarly for Bhindi crop 9 number of FLDs have been organized in six number of villages
with AT situations brighter than BT. Again due to non-availability of information regarding district and state averages a comparison with the results of sample villages is not possible.

126
4.210 For crops like cucerbits, spices, mango, banana, papaya, citrus, no FLD has been organized.
FRONT LINE DEMONSTRATION – LIVESTOCK AND DAIRYING No FLDs have been organised on any of the subjects of livestock and dairying. POULTRY 4.211 Similarly no FLDs have been organised on any of the subjects of poultry. FISHERIES 4.212 Fisheries is yet another field where no FLD has been organised. FRONT LINE DEMONSTRATION – HOME SCIENCE 4.213 The table below shows the details;
Table No. 4.63 Home Science
Pikles, kg
Sl. No. Name of the Village
No. of responding families
BT AT
1 2 3 4 5 Khajuri (Phanda) 0 0 0 Polashganj (Bersiya) 0 0 0 Mugalia Hat (Phanda) 0 0 0 I Adopted Village 0 Sonkatch (Bersiya) 2 0 28 Kolukhedi (Bersiya) 0 0 0 Kurana (Phanda) 00 0 0 Ratatal (Phanda) 0 0 0 Ratibad (Phanda) 0 0 0 Khamkheda (Phanda) 0 0 0
II Cluster Viilages 2 28 Total All Villages 2 28
4.214 Only for Pickles 2 number of FLDs have been organised in village Sonkatch [cluster village]
resulting in the production of 28 kgs of pickles mostly for domestic consumption. For items like toy making, bakery, jute items, papad/bari etc. no FLD has been organised.
FRONT LINE DEMONSTRATION – AGRO FORESTRY 4.215 The table below shows the details;

127
Table No. 4.64 Agro Forestry
On farm Plantation Hectare No. of respondents BT AT
Sl. No. Name of the Village
3 4 5 Khajuri (Phanda) 3 2 5 Polashganj (Bersiya) 2 0 1 Mugalia Hat (Phanda) 2 0 1 I Adopted Village 7 2 8 Sonkatch (Bersiya) 3 0 3 Kolukhedi (Bersiya) 3 0 10 Kurana (Phanda) 0 0 0 Ratatal (Phanda) 0 0 0 Ratibad (Phanda) 0 0 0 Khamkheda (Phanda) 8 0 12
II Cluster Viilages 14 0 25 Total All Villages 21 2 33
4.216 Agro-forestry is the field which is becoming popular in Bhopal district because of its many
advantages which is evident from the fact that 21 FLDs have been organised in 6 villages with 2 hectare coverage in BT situation that enhanced to 33 hectares in after training situation.
ORGANIC FARMING 4.217 Organic Farming is again an area where no FLD has been organised. FRONT LINE DEMONSTRATION – WATERSHED ACTIVITIES
Table No. 4.65
Watershed Activities Soak Pits Nos. Sl.
No. Name of the Village
No. of respondents BT AT 1 2 3 4 5 Khajuri (Phanda) 2 5 30 Polashganj (Bersiya) 0 0 0 Mugalia Hat (Phanda) 0 0 0 I Adopted Village 2 5 30
Sonkatch (Bersiya) 0 0 0 Kolukhedi (Bersiya) 0 0 0 Kurana (Phanda) 0 0 0 Ratatal (Phanda) 0 0 0 Ratibad (Phanda) 0 0 0 Khamkheda (Phanda) 0 0 0
II Cluster Viilages 0 0 0 Total All Villages 2 5 30
4.218 Only on subject of construction of soak pits 2 number of FLDs have been organised
resulting in construction of 5 number of soak pits in BT situation which enhanced to 30 soak pit in AT conditions. On subjects like Nallah Bunding, Check Dams, Counter Trenches, Farm Ponds and Self Help Groups no FLD has been organised.

128
4.219 To sum-up
- Front Line Demonstrations organised in our area of study has led to enhanced productivity in most of the agriculture and horticulture crops in AT situations as compared to BT situations which is a positive impact of the efforts of Bhopal KVK.
- In cluster group of villages the performance is as good as adopted villages that shows the efforts of agriculture scientists have percolated to such villages through various forward linkages.
- In case of wheat crop 52 number of FLDs have been organised that lead to the yield rates higher than district and State averages both in before and after training situations.
- In case of paddy, maize and jowar crops though the number FLDs organised are 5,13 and 2 respectively but yield per hectare is less than the district and State averages. These crops though are not important for district Bhopal but an intensive effort for paddy crop may be made as this crop has ready market.
- Gram being one of the important crops of Bhopal district 40 number of FLDs have been organised with yield per hectare higher than both in BT and AT conditions as compared to district and state averages.
- In case of Arhar, 9 number of FLDs have been organised resulting in higher per hectare yield as compared to district and State averages both in BT and AT situations.
- Regarding lentil 3 number of FLDs have been organised that lead to higher yield per hectare as compared to district average both in BT and AT situations.
- Soybean being an important crop of Bhopal district 90 number of FLDs have been organised that lead to higher yield rate as compared to district average but lower to the state average figure of 1132 kg [except for village Khamkhedi].
- Regarding Mustard crop 7 number of FLDs have been organised resulting in higher yield as compared to district average but less than State average in AT situations.
- In case of Potato, 7 number of FLDs have been organised with yield rate far exceeding as compared to district and State averages in AT situations.
ON FARM TESTING 4.220 In case of On Farm Testing new technologies are tested on farmer’s fields leading to the
solution of group of farming problems. The extent of response is bound to be low as the new technologies are not frequent. Normally the participants of this activity are from the farmers on whose fields front line demonstration have been organised.
4.221 The table below shows the details;

129
Table No. 4.66 Cereal Crops
Yield Per – Hectare – Kg Wheat Maize Jowar
Sl. No.
Name of the Village
No. of respon-
ding families
BT AT No. of respon-
ding families
BT AT No. of respon-
ding families
BT AT
Khajuri (Phanda) 0 0 0 0 0 0 0 0 0 Polashganj
(Bersiya) 0 0 0 0 0 0 0 0 0
Mugalia Hat Phanda)
4 1991 2012 0 0 0 1 500 800
I Adopted Village 4 0 1 Sonkatch (Bersiya) 1 1960 1975 0 0 0 0 0 0 Kolukhedi
(Bersiya) 6 1911 1975 0 0 0 0 0 0
Kurana (Phanda) 0 0 0 0 0 0 0 0 0 Ratatal (Phanda) 2 1915 1995 0 0 0 0 0 0 Ratibad (Phanda) 0 0 0 0 0 0 0 0 0 Khamkheda(Phanda
) 1 1901 1990 1 1100 1201 0 0 0
II Cluster Villages 10 1 0 Total All Villages 14 1 1
4.222 In case of Wheat, 14 number of on farm testing activities have been organised in 5 number
of villages leading to the crop yield per hectare that ranged between 1901 kg in case of village Khamkheda [cluster village] to 1971 kg in case of village Mugalia Hat [adopted village] in BT situations, registering yield rates, higher than district average of 1837 kg and State average of 1867 kg. In AT situations the per-hectare yield for every village is higher than the BT situations that ranged between 1975 kg for village Kolukhedi [cluster village] to 2012 kg in case of village Mugalia Hat [adopted village]. Obviously the yield rates are much higher than both district and state averages.
4.223 For Maize crop only one member of on farm testing has been organised in village
Khamkheda [cluster village] leading to yield per-hectare of 1100 kg and 1201 kg in BT and AT situations respectively which are less than district average of 1566 kg and state average of 2072 kg per hectare.
4.224 Similarly for Jowar one number of on farm testing was organised for village Mugalia Hat
[Adopted village] leading to the yield rates which are lower than district and state averages of 1216 kg and 1342 kg respectively both in BT and AT situations.
ON FARM TESTING – PULSES CROP 4.225 The table below shows the details;

130
Table No. 4.67 Pulses Crop
Yield Per – Hectare – Kg Gram Arhar
Sl. No.
Name of the Village
No. of responding
families
BT AT No. of responding
families
BT AT
1 2 3 4 5 6 7 8 Khajuri (Phanda) 0 0 0 1 1000 1600 Polashganj (Bersiya) 1 1400 1900 0 0 0 Mugalia Hat (Phanda) 2 1003 1500 0 0 0 I Adopted Village 3 1 Sonkatch (Bersiya) 1 800 1200 0 0 0 Kolukhedi (Bersiya) 5 715 1110 0 0 0 Kurana (Phanda) 0 0 0 0 0 0 Ratatal (Phanda) 0 0 0 0 0 0 Ratibad (Phanda) 0 0 0 0 0 0 Khamkheda (Phanda) 1 800 1400 0 0 0
II Cluster VIilages 7 0 Total All Villages 10 1
4.226 Gram being one of the important crops of Bhopal district, 10 numbers of on farm testing
have been organisewd in 5 number of villages with yield rate in AT conditions more than BT situations for every village that ranged between 1110 kg in case of village Kilukhedi [cluster villages] to 1900 kg in case of Polashganj [adopted village] registering a higher yield per hectare of district average of 1002 kg and state average of 932 kg.
4.227 In case of Arhar, one number of on farm testing has been organised for village Khajuri
[adopted village] wherein the per-hectare yield in both BT and AT conditions is far more than district average of 550 kg and State average of 825 kg.
ON FARM TESTING – OIL SEED CORPS 4.228 The table below shows the details;

131
Table No. 4.68 Oil Seed Crop
Yielf Per – Hectare – Kg Soybean
Sl. No.
Name of the Village
No. of respondents BT AT 1 2 3 4 5 Khajuri (Phanda) 1 1110 1193 Polashganj (Bersiya) 1 1300 1400 Mugalia Hat (Phanda) 1 1115 1190 I Adopted Village 3 Sonkatch (Bersiya) 1 900 1138 Kolukhedi (Bersiya) 11 1000 1171 Kurana (Phanda) 0 0 0 Ratatal (Phanda) 1 1050 1193 Ratibad (Phanda) 1 1011 1250 Khamkheda (Phanda) 3 1050 1260
II Cluster VIilages 17 Total All Villages 20
4.229 Soybean again being one of the important crops of Bhopal district 20 numbers of on farm
testing activities have been organised in 8 number of villages resulting in enhanced yield rates for all the reporting villages in AT conditions as compared to BT situations which are higher than district and State averages of 1076 kg and 1132 kg respectively.
4.230 For crops like paddy, lentil, mustard, cotton, sugarcane, linseed no on farm testings
have been organised being less important crops of the district. ON FARM TESTING – HORTICULTURE CROPS 4.231 The following table shows the details
Table No. 4.69 On Farm Testing
Yield Per – Hectare – Quintal Potato Tomato Brinjal
Sl. No.
Name of the Village
No. of respon-
ding families
BT AT No. of respon-
ding families
BT AT No. of respon-
ding families
BT AT
Khajuri (Phanda) 0 0 0 0 0 0 0 0 0 Polashganj (Bersiya) 0 0 0 0 0 0 0 0 0 Mugalia Hat (Phanda) 0 0 0 0 0 0 1 160 250 I Adopted Village 0 0 1 160 190
Sonkatch (Bersiya) 0 0 0 0 0 0 0 0 0 Kolukhedi -Bersiya 0 0 0 1 103 125 1 115 130 Kurana (Phanda) 0 0 0 0 0 0 0 0 0 Ratatal (Phanda) 0 0 0 0 0 0 0 0 0 Ratibad (Phanda) 0 0 0 0 0 0 0 0 0 Khamkheda (Phanda) 1 110 157 1 127 157 1 120 135
II Cluster Villages 1 2 2 Total All Villages 1 2 3

132
Table No. 4.69[Contd…] On Farm Testing
Yield Per – Hectare – Quintal Chilly Mango
Sl. No.
Name of the Village
No. of responding
families
BT AT No. of responding
families
BT AT
1 2 3 4 5 6 7 8 Khajuri (Phanda) 0 0 0 0 0 0 Polashganj (Bersiya) 0 0 0 0 0 0 Mugalia Hat (Phanda) 0 0 0 0 0 0 I Adopted Village 0 0 Sonkatch (Bersiya) 0 0 0 0 0 0 Kolukhedi (Bersiya) 0 0 0 1 7 10 Kurana (Phanda) 0 0 0 0 0 0 Ratatal (Phanda) 0 0 0 0 0 0 Ratibad (Phanda) 0 0 0 0 0 0 Khamkheda (Phanda) 1 100 120 0 0 0
II Cluster VIilages 1 1 Total All Villages 1 1
4.232 In case of potato only one on-farm testing activity has been organised for village
Khamkheda [cluster village] with AT situation better than BT conditions with yield rate more than district average of 115 quintal per hectare and state average of 119 quintal per hectare.
4.233 For tomato which is a popular horticulture crop of the district, two numbers of on farm
testings have been organised for villages Kolukhedi and Khamkheda [both cluster villages] wherein the per hectare yield is better in AT situations as compared to BT situations.
4.234 Similarly for brinjal 3 numbers of on farm testings have been organised in 3 villages with
better crop yield in AT situation as compared to BT. 4.235 For Chilly crop one number of on farm testing has been organised for village Khamkheda
[cluster village] with better performance in AT situations that BT conditions. 4.236 As regards Mango crop one number of on farm testing has been organised for village
Kolukhedi [cluster village] with better performance in AT situation than BT. 4.237 For horticultural crops like onion, bhindi, cuccerbits, spices, banana, papaya and
citrus no on farm testings have been organised. 4.238 On activities like livestock and dairying, poultry, fisheries development, home science,
organic farming and watershed activities, no on farm testings have been organised. ON FARM TESTING – AGRO FORESTRY 4.239 The following table shows the details;

133
Table No. 4.70 Agro Forestry
On Farm Plantation Hectare Sl. No. Name of the Village No. of respondents BT AT
1 2 3 4 5 Khajuri (Phanda) 0 0 0 Polashganj (Bersiya) 0 0 0 Mugalia Hat (Phanda) 0 0 0 I Adopted Village 0 Sonkatch (Bersiya) 0 0 0 Kolukhedi (Bersiya) 0 0 0 Kurana (Phanda) 0 0 0 Ratatal (Phanda) 0 0 0 Ratibad (Phanda) 0 0 0 Khamkheda (Phanda) 2 0 3
II Cluster VIilages 2 Total All Villages 2
4.240 Regarding on farm plantation, only two numbers of on farm testings have been conducted
for village Khamkheda [cluster village] with 3 hectare coverage in AT situation. 4.241 In the following paragraph summing – up effort has been made for the results of on farm
testing.
- For every parameter the performance in after training situations is better than before tra ining conditions that shows the positive impact of KVK efforts both in case of adopted and cluster group of villages.
- Major number of on farm testing activities have organised in case of crops like wheat [14 numbers], gram [10 numbers] soybean [20 numbers] tomato [2numbers] brinjal [3 numbers] agro forestry [2 numbers] which are important crops/activity of Bhopal district.
- Complete vaccum in the fields of livestock and dairying, home science and watershed activities are matters of concern. May be more intensive efforts are required to boost-up such activities as these functions are important to the rural economy.
- The foregoing paragraphs have given a clear picture of the impact of the efforts of the KVK in case of various mandates laid down for them in fields of vocational training, front line demonstration and on farm testing. It has come out very clearly that in only limited number of subjects the response is substantial or satisfactory. For example in case of crops like wheat, gram, soybean potato and tomato are important from participation point of view. Livestock and dairying, agro-forestry and watershed are the subjects [beyond crop production] where the participation rate is satisfactory. Fields like training for rural youth fishery, poultry and organic farming where the participation is either negligible or nil. It is now a matter of consideration whether the limited resources of the KVK is to be concentrated over the subjects of higher participation or induced to be applied over every parameter that might lead to low key results. The matter will be dealt in detail in recommendation part.

134
STATUS OF ACTIVITIES IN CONTROL VILLAGE – MANIKHEDI KOT 4.242 In the foregoing paragraphs an attempt has been made to show the impact of the functions of
KVK over adopted and cluster group of villages where there is direct intervention of KVK. 4.243 The study has identified one control village i.e. Manikhedi Kot with 15 sample household
and 90 sample family members where there is no intervention of the KVK, considering similar subjects as taken for adopted and cluster villages to show the comparative status in areas of intervention and non- intervention. However, in case of control villages, before and after training situations have not been shown since there is no effort of KVK in this village. For comparison the average performance of vocational training in after training situation has been taken as the participation regarding all subjects is maximum in case of vocational training.
CONTROL VILLAGE – MANIKHEDI KOT – CEREALS 4.244 In Case of wheat crop the per hectare yield is 1971 kg which though close to BT situation
but definitely less than AT situation where the average yield for both adopted and cluster village is 2076 kg per hectare.
4.245 Regarding Paddy crop again the yield rate of 576 kg per hectare for control village is below
the average yield of 700 kg for AT situations for adopted and cluster villages. 4.246 Similarly for Maize crop the yield per hectare that stands at 1429 kg for control village is
less than the average yield of 1975 kg per hectare in AT situation both for adopted and cluster villages.
4.247 Regarding Jowar crop, per hectare yield being 596 kg for control village is again less than
the average per hectare yield of 1002 kg in AT situations for adopted and cluster villages. CONTROL VILLAGE – MANIKHEDIKOT – PULSES 4.248 Gram being one of the important crops of Bhopal district, the per hectare yield for control
village is 1059 kg which again is lower than the average per hectare yield of 1252 kg for adopted and cluster villages in AT situations.
4.249 Similarly for Arhar crop the per hectare yield being 1115 kg for control village is again less
than the average per hectare yield of 1455 kg in AT situations for both adopted and cluster villages.
4.250 Regarding the lentil crop the per hectare yield is 811 kg for control village which is less than
the average yield of 1003 kg in AT situations for both adopted and cluster villages. CONTROL VILLAGE – MANIKHEDI KOT – OIL SEEDS 4.251 Soybean being important crop of Bhopal district the per hectare yield of the crop is 1127 kg
for control village which is lower than the average per hectare yield of 1156 kg in AT situations for both adopted and cluster villages.
4.252 Regarding Mustard the per hectare yield is 857 kg for control village which is less than the
average per hectare yield of 1216 kg in AT situations for both adopted and cluster villages.

135
4.253 Linseed is the crop where though no participation has been recorded for adopted and cluster villages, but in control village 3 numbers of sample families have reported to be cultivating the linseed with average yield per hectare of 457 kg.
CONTROL VILLAGE – MANIKHEDIKOT – HORTICULTURE CROPS 4.254 In Case of Tomato only one sample household is reported to be cultivating with per hectare
yield of 100 quintal which is far less than 181 quintals for adopted and cluster villages in AT situations.
4.255 Similarly for Brinjal, Chilly and Bhindi crops the per hectare yield is 100 quintal, 160
quintal and 50 quintal respectively for control village which are less than the average per hectare yield of 197 quintal 201 quintal and 113 quintal respectively for adopted and cluster villages in AT situations.
4.256 The conclusion that can be drawn from the above narration is that regarding
agriculture and horticulture crop productivity the performance of adopted and cluster villages where there is intervention of the KVK is better than the performance of control village that shows the positive impact of KVKs over the crop production. The yield per hectare for most of the crops of control village is close to the yield rates prevailing in adopted and cluster villages in BT situations.
4.257 Regarding horticulture crops it may be seen that against the production of three crops
viz. Tomato, Brinjal and Chilly in control village the extent of adaptability of such crops is much higher in both adopted and cluster villages where 10 number of horticulture crops viz. Potato, Onion, Tomato, Brinjal, Chilly, Bhindi, Cucerbits, Mango, Papaya and Citrus are grown that shows the efforts of KVK have borne fruit in getting diversification of crop production from traditional crops.
CONTROL VILLAGE – MANIKHEDI KOT – LIVESTOCK AND DAIRYING 4.258 In case of improved breeding practices the per- family production of improved breed is one
number of animal for control village against the per- family production of 3 animals of improved category for adopted and control village in AT situations. Though the difference is not much but the impact of KVK, however, is visible.
4.259 In case of milk production the per-family production for control village is 6 lit. whereas in
case of adopted and control village the per- family production is again 6 liters in AT situations. An equal level of performance is possible as in control village there are farmers of resource who can afford a better milk yield.
4.260 In case of artificial insemination, the level of performance is again equal i.e. per- family one
number of animal artificially inseminated for both control village and adopted and cluster villages in AT situations.
4.261 Similarly the level of improved feeding management is similar for both control, adopted and
cluster group of villages where in per- family number of improved management is one number.
4.262 As said earlier, since in villages the animal rearing is done mostly for self consumption,
the villagers are not keen in adopting improved technology for animal rearing.

136
4.263 In case of poultry and fisheries the reaction of the villagers in adopting improved technology is nil in case of control village which is similar to adopted and cluster villages.
CONTROL VILLAGE- MANIKHEDIKOT – HOME SCIENCE 4.264 In case of toy making and preparation of pickles wherein per- family making of toy and
production of pickles are 5 number and 2.55 kg respectively in case of control village and 2 number and 4.45 kg respectively for both adopted and cluster village in AT situations is hardly meaningful.
4.265 There is absolutely no response of the farmers for activities like training of rural
youth, organic farming and watershed activities. CONTROL VILLAGE MANIKHEDA KOT – AGRO FORESTRY 4.266 The per- family coverage of the area under on farm plantation in case of control village is
1.33 hectare as against the figure of 2 hectares for adopted and cluster villages in AT situations. Though the difference is not much but one satisfactory fact is that the farmers have started understanding the value of agro-forestry.
4.267 In what follows an attempt has been made to sum-up the findings of control village
- The information for the control village where there is no intervention of KVK has been collected to compare its performance with adopted and cluster villages in AT situations to show the impact of the efforts of KVK.
- It has been observed that in case of all agronomical and horticulture corps about which cultivation has been recorded in crontrol village, the yield per hectare is lower as compared to adopted and cluster villages in AT situations that shows the positive effects of the efforts of KVK towards popularizing various technologies relating to crop production.
- The efforts of the KVK in popularizing the horticulture crop is apparent as 10 number of such crops viz. Potato, Onion, Tomato, Brinjal, Chilly, Bhindi, Cucerbits, Mango, Papaya and Citrus are presently cultivated in our sample adopted and cluster villages against only three number of crops viz. Tomato, Brinjal and Chilly being cultivated in control village.
- In case of livestock and dairying, home science and agro forestry the participation of the villagers is nominal leading to production which is not much meaningful.
- The activities like poultry, fisheries, training of rural youth organic farming and watershed the response of the sample families in control village is nil.
RESULTS OF SURVEY – INDIVIDUAL PARTICULARS – ADOPTED AND CLUSTER VILLAGES 4.268 In the ensuing paragraphs an attempt has been made to narrate the reactions of the 25
percent of individuals taken from the sample family members. The total number of sample family members as reported in the foregoing paragraphs is 1921 for adopted, cluster and control villages, the 25 percent of which comes 480 individuals. The following table gives the break up;

137
Table No. 4.71 Basic Details
Item Total number of family members of 25 percent of households
25 percent of individuals taken from 25 percent of households
a Adopted villages 761 188 b Cluster villages 1070 269 c Control village 90 23 Total 1921 480
4.269 Though the 25 percent of 761 and 1070 comes to 190 and 267 respectively but we have
taken the figures of 188 and 269 because of certain demographic particulars. However, a figure or two plus or minus is hardly meaningful so long it does not vitiate the survey results.
4.270 In the following paragraphs an attempt has been made to highlight the individual reactions
of adopted and cluster villages i.e. for 457 individuals.
The criteria for selection of individuals are as follows;
- The individual should be adult member of the family. - He should be associated with any programme of KVK. For individuals of control
village, this criterion is not necessary. - He should be literate, may be without having any formal education.
SOCIAL CLASSIFICATION OF INDIVIDUALS 4.271 The table below shows the details;
Table No. 4.72 Social Classification
Social classification S. No.
Name of the Village No. of Individual S.T. S.C. O.B.C. GENERAL
1 2 3 4 5 6 7 1. Khajuri (Phanda) 52 5 0 6 41 2. Polashganj (Bersiya) 20 0 0 20 0 3. Mugalia Hat (Phanda) 116 0 10 101 5 Adopted Village 188 5 10 127 46 4. Sonkatch (Bersiya) 42 0 11 29 2 5. Kolukhedi (Bersiya) 32 0 5 27 0 6. Kurana (Phanda) 55 0 0 55 0 7. Ratatal (Phanda) 45 0 4 41 0 8. Ratibad (Phanda) 18 0 0 16 2 9. Khamkheda (Phanda) 77 0 0 65 12 Cluster Village 269 0 20 233 16 Total 457 5 30 360 62
The above table shows that the bulk of 360 individuals are from OBC group that accounts for 78.77 percent to total number of 457 individuals from adopted and cluster villages. The combined percentage of ST and SC is 7.66 while the general category forms 13.57 percent.

138
INDIVIDUALS CLASSIFIED ON THE BASIS OF RELIGION 4.272 The following table gives the details;
Table No. 4.73 Classification on the Basis of Religion
Religion code S. No.
Name of the Village No. of Individual Hindu Muslim Sikh Christen Naua-budh Others
1 2 3 4 5 6 7 8 9 1. Khajuri (Phanda) 52 47 5 0 0 0 0 2. Polashganj (Bersiya) 20 20 0 0 0 0 0 3. Mugalia Hat (Phanda) 116 116 0 0 0 0 0 Adopted Village 188 183 5 0 0 0 0 4. Sonkatch (Bersiya) 42 42 0 0 0 0 0 5. Kolukhedi (Bersiya) 32 32 0 0 0 0 0 6. Kurana (Phanda) 55 55 0 0 0 0 0 7. Ratatal (Phanda) 45 45 0 0 0 0 0 8. Ratibad (Phanda) 18 18 0 0 0 0 0 9. Khamkheda (Phanda) 77 77 0 0 0 0 0 Cluster Village 269 269 0 0 0 0 0 Total 457 452 5 0 0 0 0
4.273 The above table shows that 98.91 percent of individuals are from Hindu religion while only
5 number of individuals from village Khajuri are from Muslim religion. AWARENESS ABOUT THE K.V.K. 4.274 Awareness about the existence and services rendered by the K.V.K. is very important for the
efficient functioning of this institution. The table below shows the details;
Table No. 4.74 Awareness About K.V.K.
Awareness about existence
of K.V.K.
If 'yes' knowledge about its location
Awareness about services rendered
by the K.V.K.
S. No.
Name of the Village No. of Individua
l Yes No Yes No Yes No
1 2 3 4 5 6 7 8 9 1. Khajuri (Phanda) 52 52 0 52 0 52 0 2. Polashganj (Bersiya) 20 20 0 20 0 20 0 3. Mugalia Hat (Phanda) 116 116 0 116 0 116 0 Adopted Village 188 188 0 188 0 188 0 4. Sonkatch (Bersiya) 42 42 0 42 0 42 0 5. Kolukhedi (Bersiya) 32 32 0 32 0 32 0 6. Kurana (Phanda) 55 55 0 55 0 55 0 7. Ratatal (Phanda) 45 45 0 45 0 45 0 8. Ratibad (Phanda) 18 18 0 18 0 18 0 9. Khamkheda (Phanda) 77 77 0 77 0 77 0 Cluster Village 269 269 0 269 0 269 0 Total 457 457 0 457 0 457 0
The above table shows the cent-percent awareness about the K.V.K. in terms of its location and services rendered by it which, ofcourse, is a very positive indication.

139
KNOWLEDGE ABOUT SPECIFIC SERVICES RENDERED BY K.V.K. 4.275 The table below shows the details;
Table No. 4.75 Specific Services Rendered by the K.V.K.
Knowledge about vocational training
Knowledge about front line
demonstration
Knowledge about on farm
testing
S.
No.
Name of the Village No. of Individua
l
Yes
(1)
No
(2)
Yes
(1)
No
(2)
Yes
(1)
No
(2)
1 2 3 4 5 6 7 8 9
1. Khajuri (Phanda) 52 52 0 52 0 52 0
2. Polashganj (Bersiya) 20 20 0 20 0 20 0
3. Mugalia Hat (Phanda) 116 116 0 116 0 116 0
Adopted Village 188 188 0 188 0 188 0
4. Sonkatch (Bersiya) 42 42 0 42 0 42 0
5. Kolukhedi (Bersiya) 32 32 0 32 0 32 0
6. Kurana (Phanda) 55 55 0 55 0 55 0
7. Ratatal (Phanda) 45 45 0 45 0 45 0
8. Ratibad (Phanda) 18 18 0 18 0 18 0
9. Khamkheda (Phanda) 77 77 0 77 0 77 0
Cluster Village 269 269 0 269 0 269 0
Total 457 457 0 457 0 457 0
4.276 Again the cent-percent knowledge about the three basic functions of the K.V.K. viz. vocational training, front line demonstration and on farm testings is a satisfactory factor that indicates the useful efforts of the K.V.K.
FIELD VISITS OF K.V.K. SCIENTISTS 4.277 Regular field visits by the K.V.K. scientists are not only important from technical point of
view but also very important to keep alive the confidence of the cultivators. In the following table an attempt has been made to highlight the extent of the visits of K.V.K. Scientists.

140
Table No. 4.76 Field Visits of K.V.K. Scientists
Duration Gap S. No
Name of the Village No. of Individual One
month (1)
Two month
(2)
More than two month
(3)
Never (4)
1 2 3 4 5 6 7 1. Khajuri (Phanda) 52 2 0 0 0 2. Polashganj (Bersiya) 20 0 0 0 0 3. Mugalia Hat (Phanda) 116 5 0 0 0 Adopted Village 188 7 0 0 0 4. Sonkatch (Bersiya) 42 0 0 0 0 5. Kolukhedi (Bersiya) 32 1 0 0 0 6. Kurana (Phanda) 55 0 0 0 2 7. Ratatal (Phanda) 45 0 0 0 0 8. Ratibad (Phanda) 18 0 0 0 0 9. Khamkheda (Phanda) 77 0 0 0 0 Cluster Village 269 1 0 0 2 Total 457 8 0 0 2
4.278 The 8 number of individuals have reported that Scientist of KVK visit their fields with a
duration gap of one month while 2 number of individuals from village Kurana (Cluster village) have reported that the Scientist of KVK never visited their fields. In rest of the 6 villages the visits are regular. The frequent visits – at least once in fortnight is necessary to keep alive the implementation process. The Bhopal K.V.K. may plug this snag.
THE STATUS OF REGULAR CONTACT WITH K.V.K. 4.279 The regular contact with the K.V.K. is one of the determining factors for implementation of
agriculture related technologies in the field. The table below shows the details;
Table No. 4.77 Status of Regular Contact with K.V.K.
Regular touch with
K.V.K.
If yes reason if 'no' the reason S. No
Name of the Village No. of Indivi-
ual Yes
No
For
seed
plant protection
New technology
Distance
Do not feel the
necessity 1 2 3 4 5 6 7 8 9 10
1. Khajuri (Phanda) 52 50 2 2 5 42 2 0 2. Polashganj (Bersiya) 20 20 0 6 3 11 0 0 3. Mugalia Hat (Phanda) 116 113 3 22 0 100 3 0 Adopted Village 188 183 5 30 8 153 5 0 4. Sonkatch (Bersiya) 42 42 0 2 2 37 0 0 5. Kolukhedi (Bersiya) 32 31 1 4 9 17 1 0 6. Kurana (Phanda) 55 54 1 5 2 45 1 0 7. Ratatal (Phanda) 45 45 0 8 5 31 0 0 8. Ratibad (Phanda) 18 18 0 1 6 11 0 0 9. Khamkheda (Phanda) 77 77 0 3 0 71 0 0 Cluster Village 269 267 2 23 24 212 2 0 Total 457 450 7 53 32 365 7 0

141
4.280 Out of the total of 457 individuals, 450 individuals [98.47 percent] are in regular contact with K.V.K. while only 7 number of individuals from villages Khajuri, Mugalia Hat [both adopted villages], Kolukhedi and Kurana [both cluster villages] are not in regular contact with the K.V.K. The situation is highly satisfactory. Out of 450 respondents, 365 individuals [81.11 percent] are keen over adoption of new technology [one of the main objectives of K.V.K.], 53 individuals [11.78 percent] go to K.V.K. for getting quality seed and rest 32 individuals [7.11 percent ] contact the K.V.K. for plant protection activities. Seven number of individuals are not in regular contact with K.V.k. because of the distance factor which can not be helped by the K.V.K.
STATUS OF IMPLEMENTATION OF THE SERVICES OF THE K.V.K. 4.281 The table below shows the details;
Table No. 4.78 Implementation of the Services of K.V.K.
Implementation of the services
of K.V.K.
If yes in what fields S No.
Name of the Village No. of Individual
Yes (1)
No (2)
Agronomy Horticulture
Animal husbandry
Fisheries Poultry
1 2 3 4 5 6 7 8 9 10 1. Khajuri (Phanda) 52 50 2 52 0 0 0 0 2. Polashganj (Bersiya) 20 20 0 20 0 0 0 0 3. Mugalia Hat (Phanda) 116 113 3 113 0 0 0 0 Adopted Village 188 183 5 185 0 0 0 0 4. Sonkatch (Bersiya) 42 42 0 42 0 0 0 0 5. Kolukhedi (Bersiya) 32 31 1 32 0 0 0 0 6. Kurana (Phanda) 55 49 6 16 35 4 0 0 7. Ratatal (Phanda) 45 45 0 42 3 0 0 0 8. Ratibad (Phanda) 18 18 0 18 0 0 0 0 9. Khamkheda (Phanda) 77 74 3 74 0 0 0 0 Cluster Village 269 259 10 224 38 4 0 0 Total 457 442 15 409 38 4 0 0
Table No. 4.78 [Contd…]
Implementation of the Services of K.V.K. If yes in what fields If no the reason S.
No. Name of the Village
Home science
Agro forestry
Organic farming
Water shed
Training of rural youth
Not satisfied with new
technology
Problem of
resources
Satisfied with
present status
1 2 11 12 13 14 15 16 17 18 1. Khajuri (Phanda) 11 7 0 2 1 0 2 0 2. Polashganj (Bersiya) 6 2 0 2 3 0 0 0 3. Mugalia Hat (Phanda) 43 0 0 15 5 0 3 0 Adopted Village 60 9 0 19 9 0 5 0 4. Sonkatch (Bersiya) 7 8 3 0 1 0 0 0 5. Kolukhedi (Bersiya) 0 11 4 2 2 1 0 0 6. Kurana (Phanda) 1 0 0 0 0 0 0 6 7. Ratatal (Phanda) 0 0 0 0 0 0 0 0 8. Ratibad (Phanda) 6 0 0 0 0 0 0 0 9. Khamkheda (Phanda) 14 12 0 9 3 0 3 0 Cluster Village 28 31 7 11 6 1 3 6 Total 88 40 7 30 15 1 8 6

142
4.282 The above table shows that 442 number of individuals have implemented the mandates of K.V.K. which is 96.72 percent to total of 457 individuals. This is an achievement by itself. Only 15 number of individuals from villages Khajuri, Mugalia Hat, Kolukhedi and Khamkheda have not implemented the mandates of K.V.K. which, of course, is a possibility looking to the wide range of coverage, though the ideal situation should have been a cent-percent coverage. It is worth mentioning here that the figures of itemwise coverage will not tally with the figure of 442 as the same person from agronomy might have implemented the improved technique in the fields of horticulture, animal husbandry, home science etc.
4.283 The subject wise coverage figures show that the highest number of individuals [409] have
gone for agronomy for implementation of improved technology followed by home science [88 individuals], agro forestry [40 individuals] horticulture [ 38 individuals] watershed activities [30 individuals] training of rural youth [15 individuals] animal husbandry [8 individuals] and organic farming [7 individuals]. In case of fisheries and poultry no implementation effort has been made by the sample individuals. Thus it may be seen that only on subjects of agronomy, horticulture, home science agro-forestry and watershed activities the individuals of our sample area have shown interest in implementing the improved techniques as in such fields they have more control over the resources. Only marginal interests have been expressed in case of animal husbandry, organic farming and training of rural youth. Animal husbandry is the sector where intensive efforts are required as this is the field with extensive scope for employment and income augmentation. The complete absence of response in case of fishery and poultry seems obvious as the individuals in rural areas in general do not have either adequate resource or sufficient knowledge to sustain such activities. A casual training of week or so by the K.V.K. is hardly meaningful to induce the individuals to take-up such activities on viable scale.
STATISFACTION LEVEL OF THE INDIVIDUALS ABOUT THE SERVICES OF K.V.K. 4.284 The table below shows the details;
Table No. 4.79 Satisfaction Level of the Individuals
Satisfied with the impact
If yes in what fields S. No
Name of the Village No. of Individua
l Yes (1)
No (2)
Agronomy
Horticulture
Animal husban-
dry
Fisheries
Poultry
1 2 3 4 5 6 7 8 9 10 1. Khajuri (Phanda) 52 52 0 52 0 0 0 0 2. Polashganj (Bersiya) 20 20 0 20 0 0 0 0 3. Mugalia Hat(Phanda) 116 113 3 116 0 0 0 0 Adopted Village 188 185 3 188 0 0 0 0 4. Sonkatch (Bersiya) 42 42 0 41 0 0 0 0 5. Kolukhedi (Bersiya) 32 31 1 29 0 0 0 0 6. Kurana (Phanda) 55 55 0 32 21 0 0 0 7. Ratatal (Phanda) 45 34 11 41 4 0 0 0 8. Ratibad (Phanda) 18 18 0 18 0 0 0 0 9. Khamkheda(Phanda) 77 75 2 75 0 0 0 0 Cluster Village 269 255 14 236 25 0 0 0 Total 457 440 17 424 25 0 0 0

143
Table No. 4.79 [Contd…] Satisfaction Level of the Individuals
If yes in what fields If no the reason S. No.
Name of the Village Home
science Agro
forestry Organic farming
Water shed
Training of rural youth
Techn-ique is
difficult to
imple-ment
Inputs are not easily
available
Non-availability of advice in time
1 2 11 12 13 14 15 16 17 18 1. Khajuri (Phanda) 16 5 0 2 1 0 0 0 2. Polashganj (Bersiya) 6 2 0 2 4 0 0 0 3. Mugalia Hat
(Phanda) 42 0 0 15 6 0 0 0
Adopted Village 64 7 0 19 11 0 0 0 4. Sonkatch (Bersiya) 7 8 3 0 1 5 0 0 5. Kolukhedi (Bersiya) 0 9 0 8 2 0 5 0 6. Kurana (Phanda) 2 1 0 0 3 0 0 0 7. Ratatal (Phanda) 0 0 0 0 0 2 0 0 8. Ratibad (Phanda) 6 0 0 0 0 0 5 0 9. Khamkheda (Phanda) 15 11 0 7 4 0 0 0 Cluster Village 30 29 3 15 10 7 10 0 Total 94 36 3 34 21 7 10 0
4.285 Out of 457 sample individuals 440 individuals have [96.28 percent] expressed their
satisfaction for the services rendered by the K.V.K. while only 17 number of individuals from villages Mugalia Hat, kolukhedi, Ratatal and Khamkheda have shown their dissatisfaction mainly because of the fact that technique is difficult to implement [7 numbers] and non-availability of inputs [10 numbers] Both are very small problems which can easily be rectified by the K.V.K. to arrive at cent-percent level of satisfaction.
4.286 Agronomy, Home Science, Agro-forestry, watershed and horticulture are the areas
where the satisfaction level is maximum as these are the areas which have direct relevance to the livelihoods of our sample population. Only marginal extent of satisfaction has been shown for organic farming and training of rural youth. The level of satisfaction in case of animal husbandry is nil which is a serious matter. Since, in general, the villagers rear milch animals on a very small scale, not inducing them to learn any thing for such activity and also the K.V.K. personnel not taking much interest in imparting training because of non-availability of the activity. Thus in terms of K.V.K. effort this activity is entrapped in some vicious circle of non-availability and dis-interest which the K.V.K. personnel have to break by awaring the villagers about utility of animal husbandry.
IMPACT ON INCOME ENHANCEMENT 4.287 The validity of any effort is ultimately measured by its impact over income enhancement
whether directly or indirectly. The table below shows the details;

144
Table No. 4.80 Impact on Income Enhancement
Income enhancement
If yes the fields S. No.
Name of the Village No. of Individual
Yes (1)
No (2)
Agro-omy
Horticulture
Animal husbandry
Fisheries Poultry
1 2 3 4 5 6 7 8 9 10 1. Khajuri (Phanda) 52 52 0 50 0 0 0 0 2. Polashganj (Bersiya) 20 20 0 20 0 0 0 0 3. Mugalia Hat
(Phanda) 116 115 1 113 0 0 0 0
Adopted Village 188 187 1 183 0 0 0 0 4. Sonkatch (Bersiya) 42 41 1 42 0 0 0 0 5. Kolukhedi (Bersiya) 32 31 1 26 2 2 0 0 6. Kurana (Phanda) 55 53 2 22 27 2 0 0 7. Ratatal (Phanda) 45 43 2 36 7 0 0 0 8. Ratibad (Phanda) 18 18 0 18 0 0 0 0 9. Khamkheda (Phanda) 77 74 3 72 2 0 0 0 Cluster Village 269 260 9 216 38 4 0 0 Total 457 447 10 399 38 4 0 0
Table No. 4.80 [Contd…]
Impact on Income Enhancement If yes the fields S.
No. Name of the Village
Home science
Agro forestry
Organic farming
Water shed
Training of rural youth
Could not follow the instruction
Problem of
recourse
Non- availability technical advice in
time 1 2 11 12 13 14 15 16 17 18
1. Khajuri (Phanda) 13 7 0 2 1 0 0 0 2. Polashganj (Bersiya) 6 2 0 2 3 0 0 0 3. Mugalia Hat
(Phanda) 40 0 0 15 9 0 0 0
Adopted Village 59 9 0 19 13 0 0 0 4. Sonkatch (Bersiya) 7 8 3 0 1 0 0 0 5. Kolukhedi (Bersiya) 0 6 2 8 2 0 0 0 6. Kurana (Phanda) 1 0 0 0 0 0 0 2 7. Ratatal (Phanda) 0 0 0 0 0 0 2 0 8. Ratibad (Phanda) 6 0 0 0 0 4 0 0 9. Khamkheda
(Phanda) 10 10 0 12 4 2 0 0
Cluster Village 24 24 5 20 7 6 2 2 Total 83 33 5 39 20 6 2 2
4.288 The above table shows that 447 individuals, which is 97.81 percent to total of 457
individuals, have reported the positive impact of K.V.K. activities over income enhancement. Only 10 individuals from villages Ratibad, Khamkheda, Ratatal and kurana have reported in negative mainly because of their inability to follow the instructions, problem of resources and non-availability of technical advice in time. Except for the problem of resource availability, the rest of the problems can be solved by the K.V.K. personnel by little more sincerety. Here again the subject wise total positive responses will not tally with the positive response figure of 447 as the same individual may have positive statement for multiple of subjects.

145
4.289 As is expected, maximum number of 399 individuals which is 87.31 percent to total of 457 individuals have reported agronomy as the main source of income enhancement followed by home science [83 individuals], watershed activities [39 individuals] horticulture [38 individuals], agro-forestry [33 individuals] and training of rural youth [20 individuals]. Only 4 and 5 individuals relating to animal husbandry and organic farming activities respectively have reported the impact over income enhancement. The result is obvious as more persons have responded to the various training activities relating to the subjects like agronomy, horticulture, home science, watershed activities etc. that has direct relevance to their livelihoods.
EXTENT OF INCOME ENHANCEMENT 4.290 In any kind of sample survey the most difficult work is to collect information regarding
income from respondents as the persons are usually shy of giving correct information. However through indirect approach information regarding income has been collected which is given in the following table.
Table No. 4.81
Extent of Income Enhancement Percentage increases in income S.
No Name of the Village No. of
Individual
1 to 10%
11 to 20%
21 to 30%
31 to 50%
51 to 60%
61 to 70%
71 to
80%
81 to 90%
91 to 100%
1 2 3 3 4 5 6 7 8 9 10 11 1. Khajuri (Phanda) 52 40 12 0 0 0 0 0 0 0 2. Polashganj
(Bersiya) 20 0 1 10 3 6 0 0 0 0
3. Mugalia Hat (Phanda)
116 52 22 28 14 0 0 0 0 0
Adopted Village 188 92 35 38 17 6 0 0 0 0 4. Sonkatch (Bersiya) 42 40 0 0 2 0 0 0 0 0 5. Kolukhedi (Bersiya) 32 0 6 11 11 3 0 0 0 0 6. Kurana (Phanda) 55 1 7 26 21 0 0 0 0 0 7. Ratatal (Phanda) 45 13 17 11 2 0 0 0 0 0 8. Ratibad (Phanda) 18 0 3 9 2 4 0 0 0 0 9. Khamkheda
(Phanda) 77 65 0 0 12 0 0 0 0 0
Cluster Village 269 119 33 57 50 7 0 0 0 0 Total 457 211 68 95 67 13 0 0 0 0
4.291 Out of 457 individuals 454 individuals have given information about extent of income
enhancement. Only 3 individuals have abstained from giving such information for reasons best known to them. The striking feature of the above table is that 80 individuals have reported the income enhancement within the range of 31 to 60 percent due to impact of various technologies introduced by K.V.K. which, in itself, is a startling performance.
OPINION ABOUT CONTINUANCE OF THE SERVICES OF K.V.K. 4.292 An opinion survey was conducted among the sample individuals about the continuance of
the services of K.V.K. The table below shows the details;

146
Table No. 4.82 Opinion about Continuance of K.V.K. Services
Continuation of the services of K.V.K.
S. No.
Name of the Village No. of Individual
Yes (1)
No (2)
1 2 3 4 5 1. Khajuri (Phanda) 52 49 3 2. Polashganj (Bersiya) 20 20 0 3. Mugalia Hat (Phanda) 116 115 1 Adopted Village 188 184 4 4. Sonkatch (Bersiya) 42 42 0 5. Kolukhedi (Bersiya) 32 31 1 6. Kurana (Phanda) 55 53 2 7. Ratatal (Phanda) 45 43 2 8. Ratibad (Phanda) 18 18 0 9. Khamkheda (Phanda) 77 73 4 Cluster Village 269 260 9 Total 457 444 13
4.293 The above table shows that out of 457 individuals, 444 individuals [97.16 percent] have
reported in favour of the continuance of the K.V.K. services which they find very useful particularly in the fields of agronomy, home science, agro-forestry, organic farming watershed activities and training of rural youth etc. The organic farming, though hardly practiced by the cultivators of our study area but since they are aware of the value of such activity, have reported in favour of the continuance of this subject.
SUGGESTIONS FOR ADDITIONAL SERVICES TO BE RENDERED BY THE K.V.K. 4.294 Information regarding suggestions for additional services to be rendered by the K.V.K. has
been collected from the individuals. The table below shows the details;
Table No. 4.83 Suggestions for Additional Services to be rendered by K.V.K.
Suggestions for additional services by KVK S. No
Name of the Village No. of Individual Production of
by products of crops
Marketing strategy
Weather forecasting
Availability of agri. in puts at Gram Panchayat
level 1 2 3 4 5 6 7
1. Khajuri (Phanda) 52 9 34 4 5 2. Polashganj (Bersiya) 20 2 11 2 5 3. Mugalia Hat (Phanda) 116 23 80 0 8 Adopted Village 188 34 125 6 18 4. Sonkatch (Bersiya) 42 7 30 3 1 5. Kolukhedi (Bersiya) 32 7 22 2 0 6. Kurana (Phanda) 55 11 35 4 5 7. Ratatal (Phanda) 45 16 20 3 6 8. Ratibad (Phanda) 18 6 7 0 5 9. Khamkheda (Phanda) 77 7 59 0 6 Cluster Village 269 54 173 12 23 Total 457 88 298 18 41

147
4.295 The above table shows that 445 individuals out of 457 individuals [97.37 percent] have given their suggestions for introduction of additional services to be rendered by the K.V.K. maximum number of 298 individuals have suggested for introduction of the subject of developing marketing strategy of their products for getting fair return of their efforts. Marketing, of late has become an important constituent of any training programme. The intervention of the K.V.K. persons will be very useful, if some sort of training be organised for the beneficiary cultivators in liaison with Mandi Committees, particularly in view of the mal-practices of brokers leading to the exploitation of farmers in terms of return of their product.
4.296 About the production of by-products of crops 88 number of individuals have suggested for
introduction of this subject in K.V.Ks. training programme since this subject is effective for not only income enhancement but for employment generation as well. Intensive efforts are required for introduction of this subject as it may lead to processing activities which may be done in liaison with Industries Department of the area.
4.297 Forty one and 18 number of individuals have suggested for items like weather forecasting
and availability of agriculture inputs at Gram Panchayat level which though can not be the subjects of training but the organizing efforts of the persons of K.V.K. may yield results.
The K.V.K. personnel may suggest the cultivators to see the T.V. programme relating to agriculture where the news about weather forecaste is regularly given at some community point preferably at Gram Panchayat level. About availability of agriculture input at Gram Panchayat level an effort may be made along with the Chief Executive Officer of Zila Panchayat in this direction.
4.298 It is therefore worth considering to incorporate in the mandate of K.V.K., the subjects like production of by products and development of marketing strategy of the product of the cultivators.
UTILIZATION OF THE ENHANCED INCOME 4.299 Proper utilization of the income is equally important as its generation. The table below
shows the utilization of enhanced income relating to agriculture activities;
Table No. 4.84 Utilization of Enhanced Income
Enhanced income led to purchase of Tractor Harvester Thresher
S. No.
Name of the Village No. of Individual
Yes No Yes No Yes No 1 2 3 4 5 6 7 8 9
1. Khajuri (Phanda) 52 0 52 0 52 2 50 2. Polashganj (Bersiya) 20 0 20 0 20 6 14 3. Mugalia Hat (Phanda) 116 2 114 0 116 0 116 Adopted Village 188 2 186 0 188 8 180 4. Sonkatch (Bersiya) 42 0 42 0 42 10 32 5. Kolukhedi (Bersiya) 32 0 32 0 32 4 28 6. Kurana (Phanda) 55 0 55 0 55 5 50 7. Ratatal (Phanda) 45 0 45 0 45 1 44 8. Ratibad (Phanda) 18 0 18 0 18 3 15 9. Khamkheda (Phanda) 77 2 75 0 77 0 77 Cluster Village 269 2 267 0 269 23 246 Total 457 4 453 0 457 31 426

148
Table No. 4.84 [Contd…] Utilization of Enhanced Income
Enhanced income led to purchase of Plough Seed drill Bullock pairs
S. No.
Name of the Village No. of Individu
al Yes (1) No (2) Yes (1) No (2) Yes (1) No (2) 1 2 3 10 11 12 13 14 15 1. Khajuri (Phanda) 52 3 49 1 51 9 43 2. Polashganj (Bersiya) 20 1 19 0 20 2 18 3. Mugalia Hat
(Phanda) 116 19 97 2 114 32 84
Adopted Village 188 23 165 3 185 43 145 4. Sonkatch (Bersiya) 42 0 42 0 42 10 32 5. Kolukhedi (Bersiya) 32 10 22 0 32 4 28 6. Kurana (Phanda) 55 9 46 6 49 8 47 7. Ratatal (Phanda) 45 8 37 1 44 13 32 8. Ratibad (Phanda) 18 5 13 0 18 5 13 9. Khamkheda
(Phanda) 77 0 77 0 77 18 59
Cluster Village 269 32 237 7 262 58 211 Total 457 55 402 10 447 101 356
Table No. 4.84[Contd…]
Utilization of Enhanced Income Enhanced income led to purchase of
Power/Knapsac sprayer
Handhoe Storage facility S. No
Name of the Village
No. of Individu
al Yes (1) No (2) Yes (1) No (2) Yes (1) No (2)
1 2 3 16 17 18 19 20 21 1. Khajuri (Phanda) 52 0 52 2 50 0 52 2. Polashganj
(Bersiya) 20 0 20 3 17 0 20
3. Mugalia Hat (Phanda)
116 15 101 3 113 0 116
Adopted Village 188 15 173 8 180 0 188 4. Sonkatch
(Bersiya) 42 0 42 0 42 0 42
5. Kolukhedi (Bersiya)
32 0 32 5 27 0 32
6. Kurana (Phanda) 55 2 53 1 54 1 54 7. Ratatal (Phanda) 45 2 43 3 42 0 45 8. Ratibad (Phanda) 18 0 18 8 10 0 18 9. Khamkheda
(Phanda) 77 13 64 0 77 0 77
Cluster Village 269 17 252 17 252 1 268 Total 457 32 425 25 432 1 456

149
Table No. 4.84 [Contd…] Utilization of Enhanced Income
Enhanced income led to purchase of
Tube well /Dug well Electric/diesel motor
S. No
Name of the Village No. of Indivi-dual
Yes (1) No (2) Yes (1) No (2) 1 2 3 22 23 24 25
1. Khajuri (Phanda) 52 0 52 3 49 2. Polashganj (Bersiya) 20 0 20 7 13 3. Mugalia Hat
(Phanda) 116 2 114 21 95
Adopted Village 188 2 186 31 157 4. Sonkatch (Bersiya) 42 0 42 0 42 5. Kolukhedi (Bersiya) 32 0 32 5 27 6. Kurana (Phanda) 55 1 54 0 55 7. Ratatal (Phanda) 45 0 45 4 41 8. Ratibad (Phanda) 18 0 18 0 18 9. Khamkheda (Phanda) 77 0 77 1 76 Cluster Village 269 1 268 10 259 Total 457 3 454 41 416
4.300 The above table shows that out of 457 individuals, 303 individuals [66.30 percent] have
indicated the utilization of the enhanced income for purchase of agriculture implements/inputs on items like tractor [4 persons] thresher [31 persons] plough 55 persons] seed drill [10 persons] bullock pairs [101 persons], power knapsack sprayer [32 persons] hand hoe [25 persons] storage facility [1 person] tube well/dug well [3 persons] and electric/diesel motor [41 persons]. The level of expenditure is justified as the cultivators do not purchase agriculture inputs too frequently.
IMPACT OF ENHANCED INCOME OVER EDUCATION LEVELS 4.301 Education is important social parameter which is reflected over efficient performance of any
activity as it improves the quality of human resource. The table below shows the impact of enhanced income over levels of education in our area of study;

150
Table No. 4.85 Impact of Enhanced Income Over Levels of Education
Impact on education
due to enriched income
If yes in what manner S. No
Name of the Village No. of Individual
Yes (1)
No (2)
Male Children
go to primary/ middle
(1)
Female Children
go to primary/middle
(2)
More male
children attend
secondary level
education (3)
More female
children attend
Female secondary
level (4)
Male Female children
go to higher
education non (5)
1 2 3 4 5 6 7 8 9 10 1. Khajuri (Phanda) 52 44 8 22 20 7 0 0 2. Polashganj (Bersiya) 20 16 4 13 10 0 0 3 3. Mugalia Hat
(Phanda) 116 110 6 69 22 11 0 3
Adopted Village 188 170 18 104 52 18 0 6 4. Sonkatch (Bersiya) 42 40 2 13 12 4 5 0 5. Kolukhedi (Bersiya) 32 25 7 16 7 2 0 3 6. Kurana (Phanda) 55 43 12 30 14 0 0 0 7. Ratatal (Phanda) 45 39 6 23 8 5 0 1 8. Ratibad (Phanda) 18 18 0 10 7 1 0 0 9. Khamkheda
(Phanda) 77 60 17 28 11 13 2 0
Cluster Village 269 225 44 120 59 25 7 4 Total 457 395 62 224 111 43 7 10
Table No. 4.85 [Contd…]
Impact of Enhanced Income Over Levels of Education If no the reasons S.
No. Name of the Village No.
of Individual
Educa-tion is
no priority
(1)
Purchase of agr.
inputs (2)
Exp. on religious/social a rituals
(3)
Purchase of items TV fridge
two wheeler
(4)
Consumtion of
intoxicants (5)
Deposited in the
bank (6)
Debt repaym
ent (7)
1 2 3 11 12 13 14 15 16 1. Khajuri (Phanda) 52 1 0 1 0 0 2 0 2. Polashganj (Bersiya) 20 1 0 0 0 0 2 0 3. Mugalia Hat
(Phanda) 116 0 9 0 0 0 0 2
Adopted Village 188 2 9 1 0 0 4 2 4. Sonkatch (Bersiya) 42 2 1 0 0 0 2 0 5. Kolukhedi (Bersiya) 32 1 3 0 0 0 2 0 6. Kurana (Phanda) 55 1 0 0 2 0 2 5 7. Ratatal (Phanda) 45 0 0 0 0 0 5 0 8. Ratibad (Phanda) 18 0 0 0 0 0 0 0 9. Khamkheda
(Phanda) 77 1 9 4 0 0 2 0
Cluster Village 269 7 13 4 2 0 13 5 Total 457 9 22 5 2 0 17 7

151
4.302 Out of 457 individuals, 395 individuals have informed about positive impact of enhanced income over levels of education which comes to 86.43 percent to total number of respondents. In case of elementary level of education the combined figure of boys and girls account for 335 individuals which is 84.81 percent to the figure of 395 of positive respondents, which ofcourse is an encouraging picture that shows the awareness of the sample population towards value of educating their wards. Similarly the combined information of secondary and higher level of education is 60 individuals who have reported about expenditure over such levels of education, which again is not a grim picture as infrastructural facilities of secondary and higher levels of education are not available within the easy reach of the villages.
4.303 The important reasons given by 62 individuals for not spending the portion of enhanced
income over educations are mainly due to purchase of agriculture implements, increasing the bank deposits and debt repayment. However all these excuses may be overcome by the extension effort of the K.V.K. personnel by convincing the villagers about value of education while they impart vocational training.
IMPACT OF ENHANCED INCOME OVER HEALTH STATUS 4.304 Health is again an important social factor that accounts for efficiency in pursuance of any
occupation what-so-ever. The table below shows the impact of enhanced income over health status of sample population.
Table No. 4.86
Impact of Enhanced Income over Health Conditions Impact of Additional
income
If yes in what manner S. No.
Name of the Village No. of Indivi-
dual Yes (1)
No (2)
Services of medical personnel
(1)
Vaccination of children/
women done (2)
Child nutrition
(3)
Female nutrition during
gestation (4)
Adoption of Family welfare
measures
1 2 3 4 5 6 7 8 9 10 1. Khajuri (Phanda) 52 52 0 14 13 21 4 0 2. Polashganj
(Bersiya) 20 18 2 2 3 13 0 0
3. Mugalia Hat (Phanda)
116 116 0 22 53 35 1 5
Adopted Village 188 186 2 38 69 69 5 5 4. Sonkatch (Bersiya) 42 42 0 10 7 22 3 0 5. Kolukhedi (Bersiya) 32 29 3 0 7 16 2 4 6. Kurana (Phanda) 55 54 1 2 15 35 0 2 7. Ratatal (Phanda) 45 36 9 1 11 21 3 0 8. Ratibad (Phanda) 18 18 0 0 7 9 1 1 9. Khamkheda
(Phanda) 77 77 0 33 10 34 0 0
Cluster Village 269 256 13 46 57 137 9 7 Total 457 442 15 84 126 206 14 12

152
Table No. 4.86 [Contd…] Impact of Enhanced Income over Health Conditions
If no the reasons S. No.
Name of the Village No. of Indivi-
dual Health is no
priority (1)
Believe in local healing
methods (2)
Purchase of agri. inputs (3)
Exp. on religious functions
(4)
Luxury items TV
Fridge, Two wheeler,
Four wheeler
(5)
Consumption of intoxicants
(6)
Deposited in bank
(7)
1 2 3 11 12 13 14 15 16 17 1. Khajuri (Phanda) 52 0 0 0 0 0 0 0 2. Polashganj (Bersiya) 20 4 0 0 0 0 0 0 3. Mugalia Hat
(Phanda) 116 0 0 0 0 0 0 0
Adopted Village 188 4 0 0 0 0 0 0 4. Sonkatch (Bersiya) 42 0 0 0 0 0 0 0 5. Kolukhedi (Bersiya) 32 3 0 0 0 0 0 0 6. Kurana (Phanda) 55 1 0 0 0 0 0 0 7. Ratatal (Phanda) 45 2 2 0 0 0 3 0 8. Ratibad (Phanda) 18 0 0 0 0 0 0 0 9. Khamkheda (Phanda) 77 0 0 0 0 0 0 0 Cluster Village 269 6 2 0 0 0 3 0 Total 457 10 2 0 0 0 3 0 4.305 Out of 457 individuals, 442 individuals [96.72 percent] have reported about positive impact
of income over health status while only 15 individuals [3.28 percent] have refused about such impact mainly on the grounds as health being no priority [10 individuals] consumption of intoxicants [3 individuals] and believing in local healing methods [2 individuals]. Though the extent of negetive response is only marginal but reasons like health being no priority or consumption of intoxicants are damaging attitudes requiring immeditiate eradication lest they go deep into the thinking of our sample population. Here again agriculture scientists while their trip to villages in connection with organizing Front line demonstration may emphasize upon the value of good health even at the cost of reducing some expenditure over the essentials of agriculture inputs.
4.306 The items of positive responses like hiring of the services of medical personnel [84
individuals], vaccination of children and women [126 individuals], expenditure on child nutrition [206 individuals] female nutrition during gestation period [14 individuals] and adoption of family welfare measures [12 individuals] are indicative of healthy trend that shows the awareness of our sample individuals towards health conditions, particularly that of women and children.

153
IMPACT OF ENHANCED INCOME OVER POTABLE DRINKING WATER SUPPLY 4.307 The table below shows the details;
Table No. 4.87
Impact of Enhanced Income over Potable Drinking Water Supply Improve in potable
drinking water If yes in what way S.
No. Name of the
Village No. of
Individual Yes
(1) No (2)
Piped water supply
Hand pump (2)
Aqua guard (3)
1 2 3 4 5 6 7 8 1. Khajuri (Phanda) 52 5 47 1 4 0 2. Polashganj (Bersiya) 20 8 12 1 8 0 3. Mugalia Hat
(Phanda) 116 20 96 4 9 1
Adopted Village 188 33 155 6 21 1 4. Sonkatch (Bersiya) 42 4 38 2 0 0 5. Kolukhedi (Bersiya) 32 15 17 0 13 0 6. Kurana (Phanda) 55 24 31 8 9 4 7. Ratatal (Phanda) 45 6 39 1 5 2 8. Ratibad (Phanda) 18 6 12 5 6 0 9. Khamkheda
(Phanda) 77 6 71 6 5 0
Cluster Village 269 61 208 22 38 6 Total 457 94 363 28 59 7
Table No. 4.87 [Contd…] Impact of Enhanced Income over Potable Drinking Water Supply
If No the reasons S. No.
Name of the Village
No. of Individua
l Drinking water is
no priority
(1)
Purchase of agri.
inputs (2)
Exp. on religious, social rituals
(3)
Luxury items TV
Fridge, Two wheeler,
Four wheeler
(4)
Consumption of
intoxicants (5)
Deposited in bank
(6)
1 2 3 9 10 11 12 13 14 1. Khajuri (Phanda) 52 17 0 0 0 0 30 2. Polashganj
(Bersiya) 20 11 0 0 0 0 0
3. Mugalia Hat (Phanda)
116 86 1 0 0 0 4
Adopted Village 188 114 1 0 0 0 34 4. Sonkatch (Bersiya) 42 25 0 0 0 0 15 5. Kolukhedi (Bersiya) 32 19 0 0 0 0 0 6. Kurana (Phanda) 55 24 2 0 0 0 0 7. Ratatal (Phanda) 45 26 1 0 2 0 5 8. Ratibad (Phanda) 18 29 0 0 0 0 0 9. Khamkheda
(Phanda) 77 61 1 1 1 0 2
Cluster Village 269 184 4 1 3 0 22 Total 457 298 5 1 3 0 56

154
4.308 A reverse situation can be visualized from the above table where the negetive response is to the tune of 363 individuals [79.43 percent to total of 457 individuals] while the positive response is by 94 individuals [20.57 percent] which underlines one point that the availability of potable drinking water in rural areas is no priority in general and for our sample area in particular which is proved by the fact that 298 individuals [82.09 percent to 363 negetive respondents] have said about lack of priority of the potable drinking water supply. The majority of the positive respondents have indicated the spending of a portion of enhanced income over installation of hand pumps. The solution to this problem of neglect of protable drinking water lies in enhancement of agricultural income of the rural population which if achieved will solve the problem of drinking water and also sanitation as the enhanced income induces the individuals to take care of the finer details of life. When the majority of the rural population has to grapple with the basic problem of earning adequate food, the idea of getting potable drinking water becomes a matter of pipe dream.
IMPACT OF ENHANCED INCOME OVER HOUSING CONDITIONS 4.309 The table below shows the details;
Table No. 4.88 Impact of Enhanced Income over Housing Conditions
Enhancement in income resulted in improved housing
conditions
If yes in what way S. No.
Name of the Village
No. of Individu
al
Yes (1)
No (2)
Semi pucca house
constructed
(1)
Pucca house
constructed (2)
Separate cattle shed constructed
(3)
1 2 3 4 5 6 7 8 1. Khajuri (Phanda) 52 33 19 22 7 4 2. Polashganj
(Bersiya) 20 9 11 0 7 0
3. Mugalia Hat (Phanda)
116 48 68 32 5 14
Adopted Village 188 90 98 54 19 18 4. Sonkatch
(Bersiya) 42 23 19 13 0 10
5. Kolukhedi (Bersiya)
32 9 23 3 5 0
6. Kurana (Phanda) 55 12 43 7 3 0 7. Ratatal (Phanda) 45 5 40 4 1 0 8. Ratibad (Phanda) 18 3 15 1 2 0 9. Khamkheda
(Phanda) 77 32 45 14 2 18
Cluster Village 269 84 185 42 13 28 Total 457 174 283 96 32 46

155
Table No. 4.88[Contd…] Impact of Enhanced Income over Housing Conditions
If No the reasons S .No
Name of the Village
No. of
Individual
Better housing
no priority
(1)
Purchase of agr. inputs
(2)
Exp. on religious/
social rituals
(3)
Luxury items TV, Fridge,
Two wheeler, Four wheeler
(4)
Consumption of
intoxicants (5)
Deposited in bank
(6)
1 2 3 9 10 11 12 13 14 1. Khajuri (Phanda) 52 8 0 0 0 0 13 2. Polashganj
(Bersiya) 20 8 0 0 0 0 14
3. Mugalia Hat (Phanda)
116
9 30 0 2 0 36
Adopted Village 188 25 30 0 2 0 63 4. Sonkatch
(Bersiya) 42 4 10 0 0 0 7
5. Kolukhedi (Bersiya)
32 5 1 0 1 0 15
6. Kurana (Phanda) 55 13 4 0 1 0 19 7. Ratatal (Phanda) 45 6 6 0 0 0 19 8. Ratibad (Phanda) 18 3 1 0 0 0 5 9. Khamkheda
(Phanda) 77 30 11 2 0 0 0
Cluster Village 269 61 33 2 2 0 65 Total 457 86 63 2 4 0 128 4.310 The above table shows that out of 457 sample individuals 174 individuals [38.07 percent to
total individuals] have reported about spending of enhanced income over improving the housing conditions by constructing semi-pucca houses [96 individuals], puccas houses [32 individuals] and constructing cattleshed [46 individuals].
4.311 Against the total number of 457 individuals, 283 individuals have negetive responses that
constitute 61.93 percent to total individuals. However, this situation is expected as people do not construct, extend or renovate the houses frequently. However reasons forwared are mainly better housing being no priority [86 individuals], purchase of agriculture inputs, [63 individuals] and deposits in the bank [128 individuals]. The bank deposit factor is an encouraging trend that indicates the desire for saving by the sample population.
AWARENESS ABOUT WELFARE SCHEMES INITIATED BY THE STATE GOVERNMENT ALSO WITH ASSISTANCE FROM GOVERNMENT OF INDIA 4.312 In what follows an attempt has been made to present the extent of awareness of the
individuals towards various welfare schemes initiated by the State Government. Though this information has no direct relationship with the functioning of the K.V.K. but the awareness towards such scheme will help the sample individuals to take benefit of the schemes as and when required. Moreover popularizing such schemes is also one of the functions of the K.V.K. Therefore extent of positive response towards such schemes will be a credit to the K.V.K. functionaries. In the following paragraphs the details of a few import welfare schemes have been given which have direct impact over the livelihoods of sample population.

156
JAWAHAR GRAM SAMRIDHI YOJANA 4.313 The former scheme of Jawahar Rojgar Yojna renamed as Jawahar Gram Samridhi Yojna
was started from the year 1999-2000 with the basic objective of creating community assets of permanent nature, thereby providing employment to local labour. The survey results show that out of 457 individuals only 63 individuals [13.79 percent] are aware of this scheme. The rest of the sample individuals are unaware of its existence. This is a scheme important to any area from the view points of both creation of community assets and employment opportunities that help in development. The K.V.K. functionaries may make concentrated efforts to make people aware about the benefits of this scheme in cooperation with concerned government functionaries.
EMPLOYMENT ASSURANCE SCHEME 4.314 Started from the year 1997-98, the scheme aims at providing employment to rural
population during lean season of agriculture thereby creating community assets. The response to this scheme is somewhat encouraging as 110 individuals [24.07 percent] are aware about the scheme
ESTABLISHMENT OF HAND LOOM UNITS 4.315 Under this scheme units having 5 to 20 looms are registered and loom-shed subsidy and
margin money subsidy are given. Only one person of our sample area is aware of the scheme which shows the plight of implementation of this scheme in our area of study. When even awareness is not there, there can hardly be any possibility of its implementation. The huge administrative expenditure being incurred seems futile unless the benefits of the scheme is availed by the individuals for whom the scheme has been conceived.
ESTABLISHMENT OF SERICULTURE UNITS 4.316 Under this scheme the beneficiaries are given training on various aspects of sericulture
activities to supplement their income. For this purpose Resham Kendras spread over in districts assume nodal responsibilities to train the beneficiaries and augment their infrastructure. In our area of study only one individual is aware of this scheme that shows apathy of the field level government functionaries to popularize the scheme which is so important from both income and employment generation point of views.
ESTABLISHMENT OF FAMILY BASED RURAL INDUSTRIAL UNITS 4.317 The scheme is being implemented by Madya Pradesh Khadi and Gramodoyog Board. Under
this scheme the units pertaining to SC, ST and OBCs are given 90 percent subsidy on capital loan and remaining 10 percent loan is given by the banks. The levels of awareness about this scheme is only 5 persons which again is far from being satisfactory.
MID DAY MEALS 4.318 The programme has proved to be an effective incentive of retention of school going children
of primary education level, specially the children coming from low income group. Under this programme cooked meals are provided to the school going children. The level of awareness of this scheme is encouraging as 383 sample individuals [83.81 percent to total of 457 sample individuals] are aware about this scheme.

157
SUPPLY OF TEXT BOOKS 4.319 Under this scheme all the students of primary standard [classes 1st to 5th] belonging to SC,
ST and OBCs and students of classes 1st to 3rd standards belonging to general communities are given text books free of cost. As per our survey results 192 individuals [42.01 percent] are aware of the scheme while 265 number of individuals [57.99 percent] are not aware of the scheme. Since the supply of text books free of cost is mandatory, the individuals unaware of the scheme are either persons having their wards above primary standards or the rate of drop-out is so high that they are not particular about the scheme. However an effort both by persons of school education department and K.V.K. may reduce such extent of unawareness.
WOMEN SELF HELP GROUP 4.320 With a view to ensure social and economic empowerment of women, self help groups
[S.H.Gs.] are formed for making the women confident to face challenges on all fronts, be it social or economic. In this scheme, the members of the group deposit a part of their saving in the fund raised by the group and may take loan to meet their various social and economic obligations, subject to return of the amount with interest. In our area of study 383 individuals out of 457 persons [83.81 percent] are aware of the scheme which is very encouraging that shows that particularly the women folk are aware of the value of the scheme. Unawareness aspect about 74 individuals may be easily overcome by little more extension efforts by concerned government officials and persons of K.V.K.
GRAMYA YOJNA 4.321 Under this scheme the poor women are given interest free loan upto Rs. 500.00 towards
starting a small business. After repayment of this loan within one year, second loan to the tune of Rs. 1500.00 is given. The extent of awareness about this scheme [161 persons] though is not very satisfactory as this is the area important for women empowerment, a little more extension effort by persons of Woman and Child Development may lead to starting results and reduce the extent of unawareness by 296 persons to a very negligible point.
AUSMATI YOJNA 4.322 With the objective of providing better medical assistance to the women belonging to the
families living below the poverty line in rural areas, this scheme was started in the year 1999. For this scheme again the extent of unawareness by 265 individuals [57.99 percent to total individuals] against 192 persons having awareness may well be removed by Department of Woman and Child Development by intensive extension efforts.
4.323 In the following paragraphs an attempt has been made to summarise the individual
particulars of adopted and cluster villages.
- The frame of the present part of the narration is 457 individuals which is 25 percent of the family members of 25 percent sample households.
- The criteria for selection of individuals are – the individual should be the adult member of the family, he should be associated with any programme of the K.V.K., he should be literate – may be without having any formal education.

158
- The bulk of 360 individuals are from O.B.C. group that accounts for 78.77 percent to total number of 457 individuals.
- Regarding religion 98.91 percent individuals follow Hindu religion. - The cent-percent awareness about the services rendered by the K.V.K. is no
doubt a positive indication. - Gap in visits by the scientists in few case for one month and complete absence of
visit by two number of scientists at village Kurana is matter of concern requiring the attention of the K.V.K. authorities.
- The regular contact of 98.47 percent of individuals is positive achievement of K.V.K. Out of 450 individuals who are in regular contact with K.V.K. 409 individuals [90.89 percent to total of 450 individuals] have gone for agronomy for implementation of improved technology followed by 88 individuals for home science [19.56 percent], 40 individuals for agro -forestry [8.89 percent], 38 individuals for horticulture [8.44 percent], 30 individuals for watershed activities [6.67 percent] 15 individuals for training of rural youth [3.33 percent], 8 individuals for animal husbandry [1.78 percent] and 7 individuals for organic farming [1.56 percent]. In case of fisheries and poultry no implementation effort has been made by the sample individuals.
- Regarding level of satisfaction of individuals about the services of K.V.K. agronomy, home science, agro-forestry watershed and horticulture are the areas of maximum satisfaction as these are the areas having direct relevance to the livelihoods of our sample population. Only a marginal extent of satisfaction has been shown for organic farming and training of rural youth. The level of satisfaction in case of animal husbandry is nil which is a serious matter as the animal husbandry is an important activity having immense potential for employment and income augmentation.
- Regarding impact of K.V.K. activities over income enhancement, 447 individuals, which is 97.81 percent to total of 457 individuals have reported agronomy as the main source of income enhancement followed by home science [18.16 percent], watershed activities [8.53 percent] horticulture [8.31 percent], agro-forestry [7.22 percent] and training of rural youth [4.38 percent].
- Regarding extent of income enhancement, the striking feature is that 80 individuals [17.62 percent to total of 454 individuals] have reported the income within the range of 31 to 60 percent due to impact of various technologies introduced by KVK which shows the startling performance of the KVK.
- As regards the continuance of the services of KVK the result of the survey shows that 444 individuals [96.16 percent to total of 457 individuals] have reported in favour of the continuance of the KVK services which they find very useful. This again is one of the positive achievements of KVK.
- As regards suggestions for introducing additional services to be rendered by KVK 445 individuals out of 457 individuals [97.37 percent] have given a positive response for introduction of the subject of marketing strategy by 298 individuals [66.97 percent to total of 445 individuals] while 88 number of individuals [19.78 percent] were of the opinion of the introduction of subject regarding making of by products and 18 number of individuals [4.04 percent] have suggested for items like weather forecasting and making available the agriculture inputs at Gram Panchayat levels. It is therefore, worth considering to incorporte in the mandate of the KVK, the subjects like production of by products and development of marketing strategy of the products of the cultivators.

159
- Regarding utilization of enhanced income 303 individuals [66.30 percent to total of 457 individuals] have indicated the utilization of the enhanced in for purchase of various agriculture inputs.
- Similarly 395 individuals have informed about positive impact of enhanced income over various levels of education that comes to 86.43 percent to total number of 457 respondents. The result no dubt is encouraging that indicates the awareness of our sample population towards value of education.
- Similarly out of 457 individuals, 442 individuals [96.72 percent] have reported about positive impact of enhanced income over health status.
- A reverse situation can be visualized regarding availability of potable drinking water where the negetive response is to the tune of 363 individuals [79.43 percent to total of 457 individuals] while the positive response is by 94 individuals [20.57 percent] which underlines one point that the availability of potable drinking water in rural areas is no priority in general and for our sample area in particular.
- Regarding impact of income over housing conditions, out of 457 individuals, 174 individuals [38.07 percent to total individuals] have reported about spending of enhanced income over improving housing conditions, while 283 individuals [61.93 percent] have forwarded a negetive response. This situation is expected as people do not construct, extend or renovte the house frequently.
- Regarding awareness about various welfare schemes initiated by the State Government with assistance from the Government of India, it has been observed that in case of schemes Like Jawahar Gram Samridhi Yojna, Establishment of Hand Loom Units, Establishment of Sericulture Units, Establishment of Family Based Rural Industrial Units and Gramya and Ausmati Yojna the level of awareness is poor while in case of schemes like Employment Assurance Scheme, Mid Day Meals, Supply of Text Books and Woman Self Help Groups the level of awareness is encouraging.
RESULTS OF SURVEY–INDIVIDUAL PARTICULARS–CONTROL VILLAGE 4.324 In the following paragraphs and attempt has been made to record the reactions of 25 percent
of individuals taken from control village where there is no intervention of KVK. The Total number of family members of the 25 percent of the households for control village of Manikhedi Kot is 90, the twenty five percent of which is 23 individuals. Therefore, the reactions of 23 number of individuals have been recorded to have a comparison with the reactions of individuals of adopted and cluster villages having direct intervention of KVK. The criteria for selection of individuals for control village are similar to that for adopted and cluster villages.
4.325 Like adopted and cluster villages, the 22 individuals out of 23 are from the community of
Other Backward Classes [O.B.Cs.], while only one individual is from General Community. Similarly the cent-percent individuals are from Hindu religion.
4.326 Regarding awareness about the existence of KVK, 18 number of individuals out of total of
23 individuals [78.26 percent] are aware of its existence while only 5 number of persons have shown their unawareness against the level of cent -percent awareness by the individuals of adopted and cluster villages which seems obvious as in such case the intervention of the KVK is direct. Similarly about the location of KVK, 15 persons have given a positive respons [65.22 percent] while 8 number of individuals [34.78 percent] have given a negetive respons against the cent-percent positive reactions from the individuals of adopted and cluster villages which again seems obvious. Regarding awareness about

160
services rendered by the KVK, only one individual has given a positive reply while 22 individuals have shown their unawareness against the cent-percent positive respons from adopted and cluster villages.
4.327 Regarding satisfaction level of per-hectare yield of agronomical and horticulture crops,
the 22 individuals out of 23 sample individuals have reacted in negetive way while only one individual is satisfied with the prevailing status of per-hectare yield whereas in case of the adopted and cluster villages the satisfaction level is 96.28 percent of the total of 457 individuals, particularly regarding the production of agronomical and horticulture crops. As regards suggestions for improvement in productivity, 14 individuals [60.87 percent to total of 23 individuals] have asked for training regarding application of agricultural inputs while 3 individuals each [13.04 percent] have asked for promotion of water conservation and crop rotation and 2 individuals [8.70 percent] have suggested for organizing training about organic farming. No response was there for training regarding contour bunding and for any ‘other’ activities.
4.328 Regarding satisfaction level of present status of livestock and dairy activities, 21
number of individuals [91.30 percent to total of 23 respondents] have expressed their dissatisfaction while only 2 individua ls [8.70 percent] are satisfied with the present status. The suggestions forwarded for improvement are improved breed production facilities by 7 individuals [30.43 percent] artificial insemination facilities by 13 individuals [56.62 percent] and improved feed facilities by one individual [4.35 percent]. It will be worth mentioning that even in cases of adopted and cluster villages the satisfaction level for livestock and poultry activities is nil.
4.329 As for poultry development, all the 23 participants have expressed their dissatisfaction
over the present state of affairs. For improvement in present status, 13 individuals [56.62 percent to total of 23 individuals] have advocated for improved breed production, 9 individuals [39.13 percent] for broiler production facilities and one individual ]4.35 percent] for improved feed management. In case of adopted and cluster villages also the satisfaction level for this activity is nil.
4.330 Regarding fishery development the level of dissatisfaction is again cent-percent and the
suggestions are for training about supply of improved feed by 6 individuals [26.09 percent to total of 23 individuals], training about use of improved implementation by 17 persons [73.91 percent]. It is worth mentioning again that for adopted and cluster villages the level of satisfaction for this activity is also nil.
4.331 Important information has been collected about adoption of home science activities that
may augment the income of the family. Toy making is one activity where all the 23 individuals have asked for training facility that may augment their family income, followed by pickle preparation by 19 individuals [82.61 percent to total of 23 individuals], papad, jam and jelly preparation by 13 individuals [56.52 percent], food preservation by 11 individuals [47.83 percent], jute items by 5 individuals [21.74 percent] and backing by 3 individuals [13.04 percent]. It is again worth mentioning that considerable interests have been shown by the individuals of adopted and cluster villages towards implementation of the aforesaid items that come under the group of home science.
4.332 Regarding training of rural youth for self employment 21 individuals [91.30 percent to
total of 23 individuals] have advocated for motor binding activities followed by diesel engine repairs by 16 individuals [69.57 percent], cycle/scooter repair by 12 individuals [52.17 percent] and one individual each for masonary and tailoring [4.35 percent] In case of

161
adopted and cluster villages the main emphasis is for motor binding and engine repair activities where the placements have been recorded.
4.333 Regarding educational status of the sample population it has been reported by 13 number
of individuals that their wards attend the elementary level of education that comes to 56.62 percent to total of 23 individuals. Only 10 number of individuals have given negetive response which is 43.38 percent to total respondents. More or less similar is the situation with female children wherein 11 number of individuals [47.83 percent] have given positive response while 12 number of individuals [52.17 percent] have given negetive respons. It will not be out of place to clarify the point that elementary education include both primary and middle level education i.e. from classes 1st to 8th standards. Similarly regarding boys students of secondary level of education i.e. from classes 9th to 12th standards, the 9 number of individuals [39.13 percent] have informed that their wards attend the school while 14 individuals [60.87 percent] have given a negetive respons. In case of girl students of secondary level of education only 2 individuals [8.70 percent] have given a positive reply while 21 individuals [91.30 percent] have given a negetive response. In case of higher education for both male and female students the response by all the 23 individuals is negetive.
4.334 Regarding health status of the control village the following table show the survey results;
Item Status of control village [percentage to total respondent of 23]
1 Hiring of services of medical personnel 47.83 [11 individuals] 2 Vaccination of children/pregnant mother 96.65 [22 individuals] 3 Child nutrition 100 [23 individuals] 4 Female nutrition during gestation 100 [23 individuals] 5 Adoption of family welfare measures 82.61 [19 individuals]
4.335 The above table shows a very satisfactory health status particularly in the areas of child
nutrition and female nutrition where cent-percent individuals have given a positive response. 4.336 Regarding status of drinking water facilities, only one individual has responded positively
for availability of piped water supply which seems obvious as in villages this facility is seldom available. Hand pumps are main sources of drinking water in our control village of Manikhedi Kot wherein 22 individuals of the total of 23 individuals have reported for its existence.
4.337 Regarding houseing facilities, 11 individuals [47.83 percent to total of 23 individuals] have
reported for construction of semi pucca houses while 4 individuals [17.39 percent] have positive response for construction of pucca houses and 5 individuals [21.74 percent] have reported that they have constructed separte cattle shed.

162
4.338 The following table shows the comperative level of awareness about the various welfare schemes between adopted/cluster villages and control village.
Name of the scheme Level of awareness in
percentage for adopted/ cluster villages [percent to total of 457 individuals]
Level of awareness in percentage for control
village [percent to total of 23 individuals]
1 Jawahar Gram Samridhi Yojna 13.79 0 2 Employment Assurance Scheme 24.07 34.78 3 Establishment of Handloom units 0.22 0 4 Establishment of sericulture units 0.22 0 5 Establishment of family based rural
industrial units 1.09 0
6 Mid-day Meals 83.81 34.78 7 Supply of Text Books 42.01 17.39 8 Women Selfhelp Group 83.81 43.48 9 Gramya Yojna 35.23 0 10 Ausmati Yojna 42.01 0 4.339 The above table clearly shows that the level of awareness about various welfare scheme is
much higher among the individuals of adopted/cluster group of villages as compared to that of control village.
4.340 In what follows an attempt has been made to summarise the individual particulars of
the control village;
- The majority of the individuals i.e. 95.65 percent to total of 23 individuals are from the community of Other Backward Classes and the cent-percent individuals are from Hindu religion.
- About awareness regarding existence and location of KVK, 78.26 percent and 65.22 percent individuals respectively in control village are aware against the cent-percent level of such awareness in adopted/cluster villages which seems obvious.
- Regarding satisfaction level of per hectare yield of agronomical and horticulture product only 4.35 percent individual against the total of 23 individuals are satisfied with the present level of per hectare yield against the level of satisfaction of 96.28 percent individuals in case of adopted/cluster villages.
- Regarding satisfaction level of present status of live stock and dairy activities, 2 individuals [8.70 percent to total of 23 individuals] have positive reaction while in case of adopted and cluster villages such satisfaction level is nil.
- The satisfaction levels for poultry development for both control village and adopted/cluster villages are nil.
- Similar is the case with fishery development where the level of satisfaction for both control and adopted/cluster group of villages is nil.
- For augmentation of the income levels, cent percent individuals from control village are in favour of toy making followed by pickle preparation by 82.61 percent individuals, papad, jelly, jam preparation by 56.62 percent individuals, food preservation by 47.83 percent individuals, jute items by 21.74 percent individuals and backing by 13.04 percent of individuals.

163
- Regarding training of rural youth for self employment considerable interests have been shown by the individuals of control villages for activities like motor binding, diesel engine repairs, cycle/scooter repair etc. whereas in case of adopted and cluster villages the main emphasis is for motor binding and engine repair.
- Regarding elementary level of education [classes 1st to 8th standard] 56.62 percent of individuals have reported that their male wards attend the school whereas for female wards 47.83 percent of individuals have reported for their school attendance. In case of higher education for both male and female students the response by all the 23 individuals is negetive.
- A very satisfactory level of health scenario is existing in the control village wher cent-percent individuals have positively responded for child and female nutrition.
- Hand pumps are the main source of drinking water in our control village wherein 22 individuals out of 23 individuals have reported for its existence.
- Regarding housing facilities the individuals of control village have shown interests in construction of semi-pucca houses, pucca houses and separate cattleshed.
- The level of awareness of various welfare schemes initiated by the government is much higher in case of adopted/cluster villages as compared to control village.

164
CHAPTER FIVE KRISHI VIGYAN KENDRA - INDORE 5.1 The district Indore is located in between 22.200 to 23.050 north latitude to 72.250 to 76.150
east longitude with total geographical area of 3898 squ.km. [as per census 2001] which is 1.26 percent to total geographical area of the State.
5.2 District Indore being commercial capital of Madhya Pradesh has a small rural expanse,
which is evident from the fact that the district has only 645 number of inhabited villages with 304 Gram Panchayats and 4 Janpad Panchayats.
5.3 The average annual rainfall of the district is 657 mm concentrated over the months of June
to September and mainly received from the monsoon winds coming from Arabean Sea. The average maximum temperature during summer is around 41.60 celcius while the average minimum temperature during winter is 9.20 celcius.
5.4 The total population of the district as per census 2001 is 2465827 persons with rural and
urban breakups of 735464 and 1730363 persons respectively which is 29.83 percent and 70.17 percent to total population respectively that denotes the urban character of the district. The percentage of scheduled caste population to total population (as per census 2001) is 15.75 while that of S.T. population is 6.64. The percentage of workers engaged in the occupation of agriculture (as per census 1991) to total workers is 32.07 and for rural population is 36.03 percent that shows that agriculture is not the main stay of the population of Indore district. In the fallowing table a few indicators relating to agriculture has been shown;
Table No. 5.1 Important Indicators Relating to Agriculture
Sl. No.
Indicators District Indore
State of Madhya Pradesh
1 2 3 4 1 Percentage of forest area to total geographical area [ha] 13.58 26.65 2 Net cropped area as percent to total geographical area [ha] 66.58 49.02 3 Per-capita net cropped area [ha] 0.11 0.25 4 Per-capita gross cropped area [ha] 0.20 0.34 5 Percentage of double cropped area to net cropped area [ha] 78.43 35.49 6 Net area irrigated as percent to net cropped area [ha] 65.49 37.56 7 Gross area irrigated as percent to gross cropped area [ha] 36.70 28.54 8 Per-capita production of food-grains [Kg.] 145 266 9 Per hectare use of fertilizer [Kg.] 91.60 46.21 10 Gross value of agriculture produce-per hect. [Rs.] 16332 11968 11 Per hectare yield of agriculture produce [Kg.]*
a) Paddy 667 1058 b) Wheat 2698 1867 c) Jowar 1354 1342 d) Maize 1525 2072 e) Gram 920 932 f) Tuar 658 825 g) Soybean 1070 1137
12 Electrified villages as percent to total inhabited villages 99.36 97.04 13 Energised pump sets per thousand hectare 97 60
*Figures relate to the year 2003-2004 [Final Forecast]

165
5.5 One typical feature revealed by the above table is that though the district Indore is ahead of the State in indicators like percentage of double cropped area to net cropped area, gross area irrigated as percent to gross cropped area and per-capita use of fertilizer but regarding yield per hectare of most of the crops the district is lagging behind as compared to State level performance. This paradoxical situation is mainly because of prevailing drought conditions in the district for the last two years consequetively.
DETAILS OF KRISHI VIGYAN KENDRA, INDORE BASED ON THE SECONDARY INFORMATION 5.6 The K.V.K., Indore was established in the year 1976. It is located in the Kasturbagram area
of Indore city. It is being run by an N.G.O. headed by Secretary of organisation as chief of the K.V.K., having nine number of technical staff and six number of non-technical staff. The technical staff consists of training associates and farm managers mainly from the disciplines of Agriculture Extension, Agronomy, Agriculture Engineering, Horticulture and Veterinary Science. The farm area of the K.V.K. is 20 hect which is entirely cultivated with irrigated and un-irrigated area of 15 hects and 5 hects respectively. The K.V.K. has got no administrative building of its own. The host organisation has provided the building from their own resources.
5.7 The K.V.K. has its own demonstration units like dairy unit and nursery, vermi compost and
drip irrigation units along with existence of farmers hostel where the cultivators can be accomodated during training courses. Regarding availability of irrigation facilities the K.V.K. has 3 number of wells, 5 number of tube wells, one farm pond and 4 number of electrically operated pump sets, sufficient to irrigate 15 hectares of land. The K.V.K. has also got one four wheeler and one two wheeler to cater to the transportation needs.
5.8 The K.V.K. has adequate number of agricultural implements as detailed below;
1. Tractor – 1 2. M.B. Plough –1 3. Cultivator – 1 4. Tractor drawn Ferti seed drill –1 5. Duck foot harrow – 1
These variety of implements are, more or less, sufficient to do the extension work with
reasonable efficiency. 5.9 The K.V.K. receives an average allocation of Rs. 22.51 lakh per year over the years 2001-
2002 to 2003-2004 against which the average expenditure per year is Rs. 17.06 lakh. The table below shows the details;

166
Table No. 5.2 Budget Allocation and Expenditure Rs. Lakh
2001-2002 2002-2003 2003-2004 Sl. No.
Particulars
Alloca-tion
Expen-diture
Alloca-tion
Expen-diture
Alloca-tion
Expen-diture
Remarks
1 2 3 4 5 6 7 8 9
1. RECURRING EXPENDITURE
a Pay and Allowances
6.00 1.99 18.00 10.42 18.00 15.25
b Travelling Allowances
0.30 0.07 1.00 0.07 0.50 0.36
c Contingencies 2.00 1.51 3.00 3.00 3.00 2.81
Total – 1 8.30 3.57 22.00 13.49 21.50 18.42
2. NON-RECURRING EXPENDITURE
a Vehicles 4.00 4.00
b Equipment and furniture
- - - - 6.00 5.99
c Works - - - - 4.52 4.52
d Farm Development
- - 1.00 1.00 - -
e Library - - 0.10 0.10 0.10 0.09
Total 2 4.00 4.00 1.10 1.10 10.62 10.60
Grand Total 1+2 12.30 7.57 23.10 14.59 32.12 29.02 5.10 The above table shows that in every year under report the expenditure has fallen short of
allocation which is a trend not much desirable. 5.11 Regarding Technical performance, the information has been collected under following
heads;
- Vocational Training - In-service Training - Front Line Demonstration - On Farm Testing.
5.12 In what follows an attempt has been made to present the details of the above mentioned items of technical performance.

167
VOCATIONAL TRAINING 5.13 The table below shows the details;
Table No. 5.3 Status of Vocational Training
No. of trainings organised -2003-2004 Sl. No.
Subject Adopted Villages
Cluster Villages
Other Villages
Total no. of trainees
2003-2004 1 2 3 4 5 6 1 Crop Production 10 5 8 508 2 Horticulture 4 - 3 114 3 Plant Protection - - 19 404 4 Veterinary Services - - 1 30 5 Home Science 10 - 7 419 6 Ag. Engineering 5 - 1 108 7 Training of Rural Youth for
Self Employment
a. Crop Production 2 - 1 47 b. Home Science 2 - - 46 c. Ag. Engineering 1 - - 13 d. Horticulture - - 1 18 Total 34 5 41 1707
Note : Other villages [Col. 5] indicate those villages of the district where the training programmes of Agriculture. Department are imparted through K.V.K.
5.14 The above table shows that the total number of vocational training organised in the year
2003-2004 was 80 which was, to some extent, satisfactory. Only 5 number of training courses organised in cluster group of villages in one year is far from being satisfactory. Cluster group of villages are supposed to inculcate the positive effects of training programmes organised in adopted villages through various forward linkages that ultimately help in covering the entire district through spread effects. More number of vocational trainings need to be organised in such villages to keep alive the flow benefits on regular basis. More numbers of vocational training courses have been organised on subjects like crop production, plant protection, home science and horticulture in both adopted villages and other villages which seem obvious as the farmers are usually interested in enhancing their crop productivity. More number of vocational training should have been organised on horticulture as this is one of the important fields of quick income generation with availability of ready market. Organisation of 17 number of training programmes on various subjects of home science like pickle preparation, bakery items, preparation of papad/bari/jam/jelly etc is indicative of the fact the female population residing in the villages are keen over augmenting the family income by utilizing their spare time meaningfully. The organisation of only 7 number of training courses to impart training to rural youth for self employment and attended by only 124 persons [7.26% to total trainees] is indicative of the fact that the villagers are not very confident about such trainings which hardly gurantee any placement.
5.15 The combined percentage of trainees attending subjects like crop production, plant
protection and home science to total number of trainees was 77.97 that confirms the fact that farming communities are more interested to enhance their income through adoption of technology particularly in the field of crop production.

168
IN SERVICE TRAINING 5.16 This training is related to the field functionaries of Agriculture, Veterinary, Horticulture and
Forest Departments. The following table shows the details;
Table No. 5.4 Status of In-service Training
No. of trainings 2003-2004
Sl. No.
Subject
On campus Off campus
Total number of trainees 2003-
2004 1 2 3 4 5 1 Crop Production 1 - 21 2 Home Science 1 - 11 3 Horticulture 1 - 13 4 Agriculture Engineering 1 - 12 Total 4 - 57
5.17 Though the number of training programmes conducted in the year 2003-2004 is satisfactory,
a few more training programmes particularly for Crop Production and Horticulture would have been more helpful.
FRONT LINE DEMONSTRATION 5.18 Front line demonstrations are conducted under the close supervision of the scientists of the
KVK for newly released technologies or those likely to be released in near future with target participants both farmers and extension officers. The table below shows the number of front line demonstrations conducted in the year 2003-2004.
Table No. 5.5
Status of Front Line Demonstrations No. of demonstrations 2003-2004 Sl.
No. Subjects
Adopted Villages Cluster Group of Villages 1 2 3 4 1 Pulses 28 - 2 Oil Seeds 25 - 3 Other than pulses and oilseeds 100 - Total 153 -
5.19 Though total of 153 FLDs organised in adopted villages is satisfactory but the complete
absence of any such demonstrations in cluster villages, supposed to form the periphery of adopted villages where the benefits of the positive aspects of adopted villages are supposed to percolate, is some what peculiar that required to be looked after by the K.V.K. authorities immediately.
ON FARM TESTING 5.20 On farm testing is a part of adaptive research that takes into account existing technology and
its application over defined areas and defined group of farmers. The following table shows the details;

169
Table No. 5.6 Status of On Farm Testing
No. of demonstrations 2003-2004 Sl. No.
Subject Adopted Villages Cluster Group of Villages
1 2 3 4 1 Horticulture 5 - 2 Agronomy 10 - 3 Ag. Engineering 10 - Total 25 -
5.21 Organisation of only 25 number of on farm testing in one year that too only in adopted
villages is not an encouraging picture that required to be increased covering cluster villages as well. The K.V.K. authorities may look into the matter immediately.
5.22 Besides organizing training courses on Vocational Training, In Service training, Front Line
Demonstration and On Farm Testing the K.V.K., Indore has also organised other training programmes in liaison with the line departments of State Government. The table below shows the details;
Table No. 5.7
Record of Other Training Courses Year 2003-2004 Sl.
No. Topic
Duration – Days No. of Participants 1 2 3 4 1 Storage of Food Grains 3 60 2 Vermi Compost 3 60 3 Water Conservation 3 60 4 NADEP 3 60 5 Medicinal Crop Cultivation 3 60 6 SHG Activities 1 25 Total - 325
5.23 The above table shows that most of the training courses organised were related to crop
production and storage which seem obvious as the cultivators are usually interested in enhancement of agriculture production. A few number of trainings relating to home science and training of rural youth for self employment could have been organised which would have made such efforts more meaningful. However, it has also been felt that every training programme should have a minimum duration of 4 days to ensure purposeful transaction as about half of the day in case of most of such meetings is usually lost in observing formalities.
5.24 One of the important functions of the K.V.K. is to conduct specific research to improve the
quality of agriculture produce. The K.V.K., Indore has conducted one specific research, the details of which are given below;

170
Table No. 5.8 Status of Specific Research
Impact Over Topic of Research Year Production Pest
Control Improved
Animal Breed Others
[Specify] 1 2 3 4 5 6 7 1 Inter-cropping of
Merigold and Soybean 2003
[Kharif] Increase Decreas
e - -
5.25 The above information is nol impressive. The K.V.K. should have quantified the impact that
shows the per- functory nature of effort. 5.26 Each K.V.K. is supposed to hold the meeting of Scientific Advisory Committee twice in a
year for performing following functions; 5.27 The Scientific Advisory Committee will consist of following members; 1. Head of the host institution Chairperson 2. Director, Extension of concerned SAU Member 3. Zonal Coordinator of the concerned zone Member 4. Representative of ICAR Instt./ICAR Regional Research Station if
located in the district or nearby Member
5. Associate Director, Research & Extension of the Zonal Research Station in which KVK is located
Member
6. District officers of the line departments such as Agriculture, Horticulture, Animal Husbandry, Soil conservation, Social/Agroforestry, Sericulture, Fisheries, Irrigation, Social Welfare, Small Scale Industries etc.
Members
7. Representative of the Lead Bank of the District Member 8. Farm Radio Officer of the AIR in which KVK is located Member 9. Representative of Doordarshan Centre in which KVK is located Member 10. Two representatives of the farmers - one small and one big nominated by
the Head of the Institution Member
11. Two representatives of Farm Women nominated by Head of the Institution
Members
12. Training Organiser, KVK Member Secretary 5.28 During the years 2002-2003 and 2003-2004, the K.V.K., Indore has not organised any
meeting of the Scientific Advisory Committee on the grounds that the members do not give time and slackness on the part of the K.V.K. The situation is very unfortunate. The Zonal Coordination Office may please look into the matter as these meetings are important to monitor the activities of the K.V.K. at certain point of time.
5.29 The K.V.K., Indore has continuously interacted with district administration, three-tier
system of Panchayati Raj Institutions and progressive cultivators of the district and took valuable guidance from them. Publicity measures like organizing Krishi Melas, Field Days, use of Audio-Visual Aids, arranging T.V. Interviews and Radio talks were attempted to spread the knowledge about utility of K.V.K. among rural population.

171
RESULTS OF THE SURVEY – VILLAGE PARTICULARS 5.30 The study has covered sixty number of villages with ten number of villages from each
K.V.K. with bifurcation as follows;
- Three number of Adopted Villages - Six number of Cluster Villages - One number of Control Village The bifurcation as shown above is common to all the six K.V.Ks. covered under the study. The table below gives a few important demographic details of the selected villages of K.V.K., Indore;
Table No. 5.9 Demographic Particulars
Of which Sl. No.
Name of the Village
No. of households as on date the servey
Total population
Census 2001
Males Census 2001
Females Census 2001
Proportion of S.C.
population [%]
Proportion of S.T.
population [%]
Literacy rate [%]
House-hold size
1 2 3 4 5 6 7 8 9 10 ADOPTED VILLAGES
1 Mali Badodia 79 515 279 236 7.6 29.3 41.1 5 2 Indira Gram 47 338 177 161 9.2 0.0 45.5 6 3 Gaginda 103 1168 581 587 11.1 81.0 37.9 6 Total – I 229 2021
[32.92] 1037
[32.67] 984
[33.19] - - - -
CLUSTER VILLAGES 4 Phool Karari 77 536 261 275 12.7 17.4 47.4 5 5 Bari Kalmer 92 435 226 209 21.8 0.0 46.7 6 6 Jagjivan Gram 51 274 149 125 3.3 0.7 40.9 6 7 Nehru Van
Gram 52 332 170 162 13.6 0.0 48.8 6
8 Sendal 125 736 385 351 5.4 67.9 39.9 6 9 Mendal 166 874 459 415 0.0 99.4 24.5 6 Total – II 563 3187
[51.91] 1650
[51.98] 1537
[51.84] - - - -
CONTROL VILLAGE 10 Bercha 69 931 487 444 37.5 16.8 57.8 6 Total – III 69 931
[15.17] 487
[15.35] 444
[14.97] - - - -
Grand Total I+II+III
861 6139 [100]
3174 [100]
2965 [100]
- - - -
Source – Census 2001 Note – Figures in brackets show percentage to total. 5.31 The total population of the ten identified villages as per census – 2001 is 6139 which is
0.84 percent of the total rural population of district Indore. The adopted villages cover 32.92 percent population as compared to total population of ten identified villages covered under the study while for the cluster villages this percentage is 51.91 to the total population of ten villages and for control village the percentage coverage of population is 15.17. The largest village, population wise is Giginda [adopted village] while the smallest village is Jagjivan Gram [Cluster Village]. Except for the villages

172
Gaginda and Phool Karari where the female population is more than male population, in rest of the villages a reverse trend is visible. In villages like Indira Gram [adopted village], Bari Kalmer [Cluster Village], Jagjivan Gram [Cluster village] and Nehru van gram [Cluster village] the per-centage of S.C. population is more than that of S.T. population while in rest of villages a reverse trend is prevailing. The literacy rate that ranged between 24.5 percent for village Mendal – a predominantly tribal village to 57.8 percent for village Bercha [Control village] is lower than both district and State level percentage literacy of 74.82 and 64.08 respectively. The average size of the household is 6 persons for most of the villages except for the villages like Mali Badodia and Phool Karari where the average size of the household is 5 persons.
WORK FORCE 5.32 An analysis of the information regarding workforce for all the ten villages covered under the
study will give an idea of the persons engaged in different occupation and also the magnitude of dependent population not pursuing any occupation. The table below shows the details;
Table No. 5.10
Status of Work Participation Sl. No
Name of the Village Work participation rate [%]
Proportion of main workers [%]
Proportion of Marginal workers
[%]
Proportion of Non-workers [%]
Person Male FemalePerson Male Female Person Male Female Person Male Female1 2 3 4 5 6 7 8 9 10 11 12 13 14
ADOPTED VILLAGES 1 Mali Badodia 48.7 55.6 40.7 40.0 54.1 23.3 8.7 1.4 17.4 51.3 44.4 59.3 2 Indira Gram 45.9 44.6 47.2 23.1 40.1 4.3 22.8 4.5 42.9 54.1 55.4 52.8 3 Gaginda 52.8 54.6 51.1 31.3 40.8 22.0 21.5 13.8 29.1 47.2 45.4 48.9 CLUSTER VILLAGES 4 Phool Karari 56.0 58.6 53.5 26.7 30.7 22.9 29.3 28.0 30.5 44.0 41.4 46.5 5 Bari Kalmer 61.4 61.5 61.2 49.4 57.5 40.7 12.0 4.0 20.6 38.6 38.5 38.8 6 Jag Jeewan Gram 44.9 52.3 36.0 29.2 41.6 14.4 15.7 10.7 21.6 55.1 47.7 64.0 7 Nehru Van Gram 56.0 58.2 53.7 55.1 57.1 53.1 0.9 1.2 0.6 44.0 41.8 46.3 8 Sendal 51.4 52.7 49.9 42.5 49.1 35.3 8.8 3.6 14.5 48.6 47.3 50.1 9 Mendal 53.5 53.2 54.0 41.6 41.8 41.4 11.9 11.3 12.5 46.5 46.8 46.0 CONTROL VILLAGE 10 Bercha 56.0 54.6 57.4 56.0 54.6 57.4 0.0 0.0 0.0 44.0 45.4 42.6 Source – Census 2001 5.33 The above table shows that the work participation rate ranged between 44.9% for village Jag
Jeevan Gram [Cluster village] to 61.4% for village Bari Kalmer [cluster village] with similar participation rate between male and female which is positive indication indicating awareness and intent of the female population, residing in our sample area to contribute meaningfully towards household income. The proportion of main workers which is, in general, higher than the porportion of marginal workers, ranged between 23.1 percent for village Indira Gram [adopted village] to 56.0 percent for village Bercha [control village]. In cent percent sample villages the male participation as main workers is higher than female participation while a reverse situation is seen in case of marginal workers where female participation is higher than male participation. This shows that in our sample area of study avenues of activities other than agriculture like preparation of papad/bari/jelly, toy making etc are available with ready market at Indore city that employes substantial number of rural female population.

173
The results of the survey will also justify this fact. The proportion of non-workers that ranged between 38.6 percent for village Bari Kalmer [cluster village] to 55.1 percent for village Jag Jeevan Gram [cluster village] presents a dismal picture as it shows the higher number of dependent population consisting mainly of children, old persons, infirms and unemployed who are nol in position to contribute much towards family income.
OCCUPATIONAL DISTRIBUTION 5.34 The table below shows the details;
Table No. 5.11 Occupational Distribution
Proportion of Cultivators to total
Workers [%]
Proportion of Agr. Labourer to total
workers [%]
Proportion of workers in household
industries to total workers [%]
Proportion of other workers to total
workers [%]
Sl. No
Name of the Village
Person Male FemalePerson Male Female Person Male Female Person Male Female1 2 3 4 5 6 7 8 9 10 11 12 13 14
ADOPTED VILLAGES 1 Mali Badodia 28.3 29.0 27.1 39.0 23.9 63.5 1.6 2.6 0.0 31.1 44.5 9.4 2 Indira Gram 56.1 46.8 65.8 31.6 29.1 34.2 0.6 1.3 0.0 11.6 22.8 0.0 3 Gaginda 36.8 40.1 33.3 56.9 50.2 64.0 0.6 0.6 0.7 5.7 9.1 2.0 CLUSTER VILLAGES 4 Phool Karari 39.7 39.5 39.5 52.0 46.4 57.8 6.3 9.8 2.7 2.0 3.9 0.0 5 Bari Kalmer 73.8 70.5 77.3 19.5 17.3 21.9 0.4 0.7 0.0 6.4 11.5 0.8 6 Jag Jeewan Gram 33.3 35.9 28.9 50.4 42.3 64.4 0.8 1.3 0.0 15.4 20.5 6.7 7 Nehru Van Gram 57.5 55.6 59.8 39.2 39.4 39.1 0.0 0.0 0.0 3.2 5.1 1.1 8 Sendal 35.2 34.5 36.0 52.1 46.8 58.3 1.9 2.0 1.7 10.8 16.7 4.0 9 Mendal 71.2 68.4 74.1 18.2 17.2 19.2 0.0 0.0 0.0 10.7 14.3 6.7 CONTROL VILLAGE 10 Bercha 12.7 11.3 14.1 73.9 66.2 82.0 0.4 0.0 0.8 13.1 22.6 3.1 Source – Census 2001 5.35 Agriculture remains to be the main occupation of the ten villages identified for the study.
The proportion of cultivators to the total workers ranged between 12.7 percent for village Bercha [control village] to 73.8 percent for village Bari Kalmer [cluster village]. Usually these percentages are fairly high among adopted and cluster villages that justify the selection of such villages in the group of adopted and cluster. Out of ten villages, in six number of villages viz. Indira Gram [adopted village], Bari Kalmer [cluster village], Nehru Van Gram [cluster village] Mendal [cluster village] and Bercha [control village] the proportion of female cultivators is more than that of male cultivators that signifies the awareness and intent of the female members of the farming community to work along with their male counterpart for addition in household income. The trend matches with the modern expectations of equality of gender participation in work that, besides, income augmentation, ensures women empowerment to a great extent. Another significant fact revealed by the above table is that in case of villages like Indira Gram [adopted village], Bari Kalmer [cluster village] Nehru Van Gram [cluster village] and Mendal [cluster village] the proportion of cultivators is more than that of agriculture labour which is a sure indication that in these villages the occupation of agriculture is being pursued fairly satisfactorily.
5.36 Regarding proportion of agriculture labour to total workers, that ranged between 18.2
percent for village Mendal [cluster village] to 73.9 percent for village Bercha [control

174
village], the involvement of female participation is more than that of males that indicates the performance of odd jobs regarding farming by women folk of our sample area.
5.37 The situation regarding proportion of workers in household industries to total workers is far
from being satisfactory as it ranged between 0.4 percent for villages Bari Kalmer [cluster village] and Bercha [control village] to 6.3 percent for village Phool Karari [cluster village]. In villages like Nehru Van Gram and Mendal [both cluster villages] such secondary sector activity is practically missing. Usually in Madhya Preadesh the status of secondary sector occupation in villages is poor. One of the important factors of rural poverty is absence of such occupations that encourage migration during lean season of agriculture. Such sort of secondary occupation may be encouraged through proper implementation of various welfare schemes, particularly relating to rural development, being run by the government.
5.38 Except for the village Mali Badodia [adopted village] is rest of the villages, the proportion
of other workers to total workers is far below than the proportion of cultivators and agriculture labour to total workers with prepondirance of male participation as compared to female participation.
LAND USE DETAILS 5.39 The table below shows the land use details of the identified ten villages covered under the
study;
Table No. 5.12 Land Use Details In hectare
Irrigation Sl. No.
Name of the Village
Total geogra- phical area
Gross cropped area
Forest Not available for culti-vation
Culti-vable waste
Canal Pond Wells Others Total irri-gated area
Unirri- gated
1 2 3 4 5 6 7 8 9 10 11 12 13 1 Mali Badodia 181 173 [95.58] 0 8 25 0 0 36 100 136 [78.61] 12 2 Indira Gram 234 226 [96.58] 0 8 16 0 0 0 108 108 [47.19] 102 3 Gaginda 296 285 [96.28] 0 11 10 0 0 14 18 32 [11.23] 243
Adopted Village I 711 684 [96.20] 0 27 51 0 0 50 226 276 [40.35] 357 4 Phool Karari 518 507 [97.88] 0 11 44 0 0 0 343 343 [67.65] 120 5 Bari Kalmer 300 281 [93.67] 0 19 26 0 0 0 206 206 [73.31] 49 6 Jagjeevan
Gram 190 178 [93.68] 0 12 32 0 0 0 92 92 [51.69] 54
7 Nehru Van Gream
193 186 [96.37] 0 7 24 0 0 0 86 86 [46.24] 76
8 Sendal 305 174 [57.05] 128 3 0 0 0 51 65 116 [66.67] 58 9 Mendal 121 95 [78.51] 16 10 0 0 0 31 35 66 [69.47] 29
Cluster Village II 1627 1421 [87.34] 144 62 126 0 0 82 827 909 [63.97] 386 10 Bercha 564 327 [57.98] 19 218 193 67 0 30 37 134 [40.98] 0 Control Village III 564 327 [57.98] 19 218 193 67 0 30 37 134 [40.98] 0 Total – I+II+III 2902 2432 [83.80] 163 307 370 67 0 162 1090 1319[54.23] 743 Source – Census, 2001 Note – Col. –4 = Figures in brackets show percentage to total geographical area. Col. – 12 = Figures in brackets show percentage to gross cropped area. 5.40 The gross cropped area of the identified ten villages is 83.80 percent to total geographical
area that confirms the fact that the main occupation of these villages is agriculture. The survey area is not rich in forest resources as the total area under forest is 5.62 percent to total geographical are of the ten identified villages.
5.41 Regarding irrigation, the percentage of gross irrigated area to gross cropped area is 54.23
which is more than the district average of 36.70 percent and state average of 28.54

175
percent. In adopted three villages this figure ranged between 11.23 percent in village Gaginda to 78.61 percent in village Mali Badodia whereas in cluster villages this range is 46.24 percent in village Nehru Van Gram to 73.31 percent for village Bari – Kalmer. The overall status of irrigation is quite satisfactory in all the ten identified villages covered under the study.
5.42 Cultivable waste land, that provides promise for expanding agriculture activities, is 370
hectares in identified ten number of villages which is 12.75 percent to total geographical area, assuring a fact that through the intervention of K.V.K. the expansion of agriculture is possible through implementation of various agriculture related technology.
RURAL ELECTRIFICATION 5.43 Rural electrification is one of the important parameters for agricultural development,
particularly in the context of energisation of pump sets. The table below shows the details;
Table No. 5.13 Status of Rural Electrification
Village Electrified Regular supply If irregular supply actual hrs. of supply
Sr. No.
Name of the village
Yes No Yes No 1 2 3 4 5 6 7
1. Mali Badodia (Indore)* 1 1 18 2. Indira Gram (Mahu) 1 1 18 3. Gaginda (Mahu) 1 1 16 Adopted Village 3 3 4. Phool Karari (Indore) 1 1 18 5. Bari Kalmer (Indore) 1 1 18 6. Jag Jeewan Gram
(Mahu) 1 1 18
7. Nehru Van Gram (Mahu)
1 1 18
8. Sendal (Mahu) 1 1 18 9. Mendal (Mahu) 1 1 13 Cluster Village 6 6
10 Bercha (Mahu) 1 1 18 Control Village 1 1 Total 10 10
*The information in brackets shows the name of the Development Block where the village is located. This information will be common to all the subsequent tables. 5.44 All the villages covered under the study are electrified with irregular power supply
situations. The power supply for most of the villages is 18 hours a day which seems satisfactory in view of overall power shortage situation in the state.
5.45 Energisation of pump sets is the direct impact of rural electrification over agriculture
development. The table below shows the extent of energisation of pump sets in our sample area of study;

176
Table No. 5.14 Status of Pump Sets Energised
Pump sets energized Sr. No.
Name of the village Electricity (No.) Diesel (No.)
1 2 3 4 1. Mali Badodia (Indore) 150 0 2. Indira Gram (Mahu) 18 0 3. Gaginda (Mahu) 55 2 Adopted Village 223 2
4. Phool Karari (Indore) 96 10 5. Bari Kalmer (Indore) 160 5 6. Jag Jeewan Gram (Mahu) 20 0 7. Nehru Van Gram (Mahu) 20 0 8. Sendal (Mahu) 100 5 9. Mendal (Mahu) 100 3 Cluster Village 496 23
10 Bercha (Mahu) 10 0 Control Village 10 0 Total 729 25
5.46 The total number of pump sets energized is 754 which is 1.71 percent to total number of
44132 pump sets energized in district Indore in the year 1999-2000. It may be mentioned here that for district Indore the number of energized pump sets per thousand hectare of gross cropped area is 97 as against the State average of 60 that shows the viable nature of agriculture in the district. In general, the number of pump sets energized is more in adopted and cluster group of villages as compared to control village which rather, is obvious as these villages have direct intervention of K.V.K. regarding technology transfer for better cultivation practices. Electrically energized number of pump sets are much more than that of pump sets energized by use of diesel that ranged between 10 numbers in village Bercha [control village] to 160 numbers in village Bari kalmer [cluster village].
HOUSEHOLD INDUSTRIAL UNITS 5.47 The complete absence of the existence of household industrial units in the sample area
of our study is not very peculiar as such units are generally not found in rural areas of Madhya Pradesh which is one of the important contributory factors of rural poverty. Since agriculture as occupation is quite developed in district Indore with better road connectivites the opening of agro-based rural industrial units may be considered.

177
COOPERATIVES 5.48 The table below shows the details;
Table No. 5.15 Cooperative Societies
In number Sr. No.
Name of the village Agriculture co-operative credit society
Fishermen co-
operative society
Milk co-operative society
Co-operative. marketing
society
Others specify
1 2 3 4 5 6 7 1. Mali Badodia (Indore) 0 0 0 0 0 2. Indira Gram (Mahu) 0 0 0 0 1 3. Gaginda (Mahu) 1 1 1 1 1 Adopted Village 1 1 1 1 2 4. Phool Karari (Indore) 0 1 0 0 0 5. Bari Kalmer (Indore) 1 0 0 1 0 6. Jag Jeewan Gram (Mahu) 0 0 0 0 0 7. Nehru Van Gram (Mahu) 0 0 0 0 0 8. Sendal (Mahu) 1 0 0 0 0 9. Mendal (Mahu) 0 0 0 0 0 Cluster Village 2 1 0 1 0 10 Bercha (Mahu) 0 0 0 0 0 Control Village 0 0 0 0 0 Total 3 2 1 2 2
5.49 Total of 10 cooperative societies are existing in our area of study as on the date of
survey, evenly distributed between adopted and cluster villages with no such societies functioning in control village i.e. Bercha.
5.50 The existence of various basic and infrastructural facilities is important from the angel of
absorption capacity of technology of any sort in identified areas to gurantee future chain of development. In the subsequent paragraphs an attempt has been made to present such inventories for sample villages covered under the study.
BASIC FACILITIES 5.51 The table below shows the details;

178
Table No. 5.16 Status of Basic Administrative Facilities
Tahsil head- quarter
Block head quarter
Sr. No.
Name of the village District head quarter away
from the village KM
within the
village 0 KM
Away from the
village Km
within the
village 0 KM
Away from the
village Km
1 2 3 4 5 6 7 1. Mali Badodia (Indore) 16 16 16 2. Indira Gram (Mahu) 25 18 18 3. Gaginda (Mahu) 33 25 25 Adopted Village 4. Phool Karari (Indore) 22 20 20 5. Bari Kalmer (Indore) 14 14 14 6. Jag Jeewan Gram (Mahu) 25 18 18 7. Nehru Van Gram (Mahu) 15 4 9 8. Sendal (Mahu) 38 38 38 9. Mendal (Mahu) 40 40 40 Cluster Village 10 Bercha (Mahu) 28 28 28 Control Village Total 10 0 10 0 10
Table No. 5.16 [Contd…]
Status of Basic Administrative Facilities Gram Panchayat Police Station/sub station Sr.
No. Name of the village
within the village 0 KM
Away from the village
Km
within the village 0 KM
Away from the village
Km 1 2 8 9 10 11
1. Mali Badodia (Indore) 2 8 2. Indira Gram (Mahu) 5 5 3. Gaginda (Mahu) 3 13 Adopted Village 4. Phool Karari (Indore) 3 3 5. Bari Kalmer (Indore) 0 8 6. Jag Jeewan Gram (Mahu) 6 5 7. Nehru Van Gram (Mahu) 2 5 8. Sendal (Mahu) 4 14 9. Mendal (Mahu) 3 18 Cluster Village 10 Bercha (Mahu) 5 12 Control Village Total 1 9 10

179
5.52 The above table shows the location of district, tahsil and block headquarters quite far away from most of the sample villages. The location of Gram Panchayat within or close to the sample villages is a positive factor that, to some extent, gurantees involvement of villagers in the development of their area. Though in non of the villages police stations are located within the geographical area of the village but within the manageable distance.
INFRASTRUCTURAL FACILITIES - ROADS
5.53 For the socio-economic development of any area the role of availability of proper road
network is very important. The table below shows the status of availability of road network in and around the identified ten villages;
Table No. 5.17
Road Infrastructure Fair weather road Sr.
No. Name of the village
Within the village 0 Km
Away from the village Km
Kharanja road within the village 0 km
1 2 3 4 5 1. Mali Badodia (Indore) 2 0 2. Indira Gram (Mahu) 6 0 3. Gaginda (Mahu) 9 0 Adopted Village 4. Phool Karari (Indore) 9 0 5. Bari Kalmer (Indore) 9 0 6. Jag Jeewan Gram (Mahu) 13 0 7. Nehru Van Gram (Mahu) 13 0 8. Sendal (Mahu) 13 0 9. Mendal (Mahu) 13 0 Cluster Village 10 Bercha (Mahu) 16 0 Control Village Total 10 10
Table No. 5.17 [Contd…]
Road Infrastructure Link road to all weather road All weather road Sr.
No. Name of the village
Within the village 0 Km
Away from the village Km
Within the village 0 Km
Away from the village Km
1 2 6 7 8 9 1. Mali Badodia (Indore) 2 2 2. Indira Gram (Mahu) 4 4 3. Gaginda (Mahu) 3 3 Adopted Village 4. Phool Karari (Indore) 3 3 5. Bari Kalmer (Indore) 0 0 6. Jag Jeewan Gram (Mahu) 4 4 7. Nehru Van Gram (Mahu) 0 0 8. Sendal (Mahu) 5 10 9. Mendal (Mahu) 0 3 Cluster Village 10 Bercha (Mahu) 3 3 Control Village Total 3 7 2 8

180
5.54 Information contained in the above table reveals a not very satisfactory situation as in non of the villages even fair weather roads exist. Though Kharanja roads are available within all the sample villages that ensure convenient transport in rainy season within the village with reasonable clean sanitary conditions but absence of link roads in seven villages is a definite draw back that deters the development of activities like animal husbandry and poultry or other such perishable items that require road linkages. One of the basic reasons for the status of backwardness regarding animal husbandry activities is the absence of road linkages in rural areas. Though the distances of link roads and all weather roads are within the easy reach for most of the villages but in rainy season such destinations become inaccessible leading to so many inconveniences. Moreover, absence of proper road infrastructure abstains the officials to reach such villages that results in perpetual neglect of such areas.
Infrastructural Facilities - Railway Station, Bus Stand/Bus Stop/ Post Office/S.T.D. Booth
5.55 The table shows the details;
Table No. 5.18
Facilities Regarding Railway Station/Bus Stand/Bus Stop/Post Office/STD Booths Railway station Bus stand/Bus stop Sr.
No. Name of the village
within the village 0 Km
Away from the village Km
within the village 0 Km
Away from the village
Km 1 2 3 4 5 6
1. Mali Badodia (Indore) 16 2 2. Indira Gram (Mahu) 25 4 3. Gaginda (Mahu) 25 3 Adopted Village 4. Phool Karari (Indore) 20 1 5. Bari Kalmer (Indore) 16 0 6. Jag Jeewan Gram (Mahu) 25 4 7. Nehru Van Gram (Mahu) 15 3 8. Sendal (Mahu) 38 10 9. Mendal (Mahu) 40 10 Cluster Village 10 Bercha (Mahu) 28 3 Control Village Total 10 1 9

181
Table No. 5.18 [Contd…] Facilities Regarding Railway Station/Bus Stand/Bus Stop/Post Office/STD Booths
Post office STD booth Sr. No. Name of the village within the
village 0 Km
Away from the village
Km
within the village 0 Km
Away from the village
Km 1 2 7 8 9 10
1. Mali Badodia (Indore) 2 2 2. Indira Gram (Mahu) 5 5 3. Gaginda (Mahu) 3 3 Adopted Village 4. Phool Karari (Indore) 3 3 5. Bari Kalmer (Indore) 0 0 6. Jag Jeewan Gram (Mahu) 5 5 7. Nehru Van Gram (Mahu) 3 2 8. Sendal (Mahu) 8 8 9. Mendal (Mahu) 10 10 Cluster Village 10 Bercha (Mahu) 7 12 Control Village Total 1 9 1 9
5.56 For all the ten sample villages the railway station is located far away from the village that
ranged between 16 kms for villages Mali Badodia [adopted village] and Bari Kalmer [cluster village] to 40 kms for village Mendal [cluster village]. In one village i.e. Bari Kalmer [cluster village] the bus stand/bus stop is located within the village and in rest of 9 villages this facility is mostly located within the easy reach of the villagers. Similar is the situation with the availability of the facilities regarding post office and STD booth. Bari Kalmer is again the village where the facility of post office and STD booth is available within the physical boundry of the village.
Infrastructural Facilities - Agriculture Marketing, Fair Price Shop, Cold Storage
5.57 Mandi or Sub Mandi being regulated markets are important destinations for fair transaction
of agriculture produce. The cold storage is yet another important asset that helps in avoiding distress selling. The table below shows the details;

182
Table No. 5.19 Agriculture Marketing, Fair Price Shop, Cold Storage
Regular market Weekly market Mandi Sr. No.
Name of the village within
the village 0 Km
Away from the
village Km
within the
village 0 Km
Away from the
village Km
within the
village 0 Km
Away from the
village Km
1 2 3 4 5 6 7 8 1. Mali Badodia (Indore) 7 7 16 2. Indira Gram (Mahu) 5 5 18 3. Gaginda (Mahu) 10 10 25 Adopted Village 4. Phool Karari (Indore) 3 3 20 5. Bari Kalmer (Indore) 3 3 14 6. Jag Jeewan Gram (Mahu) 5 5 18 7. Nehru Van Gram (Mahu) 5 5 15 8. Sendal (Mahu) 16 16 16 9. Mendal (Mahu) 18 18 25 Cluster Village 10 Bercha (Mahu) 12 12 28 Control Village Total 10 10 10
Table No. 5.19 [Contd…] Agriculture Marketing, Fair Price Shop, Cold Storage
Name of the village Sub-Mandi Fair Price Shop Cold Storage Sr. No. within
the village 0 Km
Away from the
village Km
within the
village 0 Km
Away from the
village Km
within the
village 0 Km
Away from the
village Km
1 2 9 10 11 12 13 14 1. Mali Badodia (Indore) 16 2 16 2. Indira Gram (Mahu) 17 5 10 3. Gaginda (Mahu) 25 3 15 Adopted Village 4. Phool Karari (Indore) 20 3 3 5. Bari Kalmer (Indore) 14 20 14 6. Jag Jeewan Gram
(Mahu) 18 5 11
7. Nehru Van Gram (Mahu) 15 2 10 8. Sendal (Mahu) 16 1 38 9. Mendal (Mahu) 25 3 40 Cluster Village 10 Bercha (Mahu) 28 7 7 Control Village Total 10 10 10

183
5.58 In non of the identified ten villages covered under the study any of the facilities as shown in the above table exist within geographical limits of the village, which undoubtedly is a definite draw back. Except for a few villages regular markets and weekly markets are available within the easy reach of the villagers. Mandies, Sub Mandies and cold storage facilities are usually located far away from the village. The absence of any fair price shop [though at a distance of easy accessibility except for village Bari Kalmer [cluster village] where this facility is located 20 kms away from the village] is no doubt a negetive exception. The district administration may sort out this problem.
AGRO BASED INDUSTRIAL UNITS 5.59 The table below shows the details; 5.60 Agro-based industries are important as they generate employment opportunities in rural
areas. The table below shows the status of agro-based industries in our area of study;
Table No. 5.20 Status of Agro Based Industrial Units
Flour mill Oil mill Dal mill Sr. No.
Name of the village Within
the village 0 Km
Away from the village
Km
Within the
village 0 Km
Away from the village
Km
Within the
village 0 Km
Away from the village
Km 1 2 3 4 5 6 7 8
1. Mali Badodia (Indore) 2 7 16 2. Indira Gram (Mahu) 1 5 18 3. Gaginda (Mahu) 0 3 25 Adopted Village 4. Phool Karari (Indore) 0 20 20 5. Bari Kalmer (Indore) 7 14 14 6. Jag Jeewan Gram (Mahu) 2 5 18 7. Nehru Van Gram (Mahu) 2 15 15 8. Sendal (Mahu) 0 38 38 9. Mendal (Mahu) 0 40 40 Cluster Village 10 Bercha (Mahu) 3 28 28 Control Village Total 4 6 10 10

184
Table No. 5.21 Status of Agro Based Industrial Units
Saw mill Repair of Agr. implements Sr. No.
Name of the village Within the
village 0 Km Away from the
village Km Within the
village 0 Km Away from the
village Km 1 2 9 10 11 12
1. Mali Badodia (Indore) 16 8 2. Indira Gram (Mahu) 18 4 3. Gaginda (Mahu) 25 4 Adopted Village 4. Phool Karari (Indore) 10 3 5. Bari Kalmer (Indore) 14 8 6. Jag Jeewan Gram (Mahu) 18 5 7. Nehru Van Gram(Mahu) 10 2 8. Sendal (Mahu) 38 8 9. Mendal (Mahu) 40 10 Cluster Village 10 Bercha (Mahu) 28 12 Control Village Total 10 10
5.61 The above table shows that out of 10 number of villages, flour mills are located within the
physical boundaries of 4 number of villages while in rest of 6 villages this facility is located within the easy reach of the villagers except for village Bari Kalmer [Cluster village] where this facility is located 7 kms away from the village. In non of the villages, oil mills, dal mills and saw mills are located within the easy reach of the villagers [except in few marginal cases where the distance is not much]. The non-existence of any unit of repair of agricultural implements is a drawback as the inhabitants of these villages are pursuing agriculture as main occupation.
SOCIAL INPUTS – EDUCATION ELEMENTARY EDUCATION – PRIMARY LEVEL 5.62 The Universalisation of Elementary Education Programme [U.E.E.] which envisages
compulsory enrolment of children upto the age of 14 years of age has become popular in Madhya Pradesh. The table below shows the details of primary level of education in our area of study.

185
Table No. 5.22 Status of Primary Level of Education
Name of the village Primary School Non formal education Sr. No. Within the
village 0 km
with-in 1 km
with-in 2 km
with-in 3 km
> 3 km
Within the village 0 km
Away from the village
km 1 2 3 4 5 6 7 8 9
1. Mali Badodia (Indore) 0 2 2. Indira Gram (Mahu) 0 2 3. Gaginda (Mahu) 0 3 Adopted Village 4. Phool Karari (Indore) 0 2 5. Bari Kalmer (Indore) 0 2 6. Jag Jeewan Gram (Mahu) 0 8 7. Nehru Van Gram (Mahu) 0 2 8. Sendal (Mahu) 0 2 9. Mendal (Mahu) 0 15 Cluster Village 10 Bercha (Mahu) 0 3 Control Village Total 10 10 5.63 One positive fact revealed by the above table is the existence of primary schools within
the geographical limits of all the ten number of villages covered under the study that contributed for higher levels of literacy rate within the sample area. Non formal education centres meant for working children who can not attend the regular primary institutions are not existing within the sample villages but within its manageable distance.
ELEMENTARY EDUCATION–MIDDLE LEVEL AND ADULT EDUCATION 5.64 The table below shows the status of middle level and adult education.
Table No. 5.23
Status of Middle Level and Adult Education Middle School Adult Education Sr.
No. Name of the village
In the village 0 km
within 5 km
more than 5 km
within 1 km
within 2 km
within 3 km
> 3 km
1 2 9 10 11 11 12 13 14 1. Mali Badodia (Indore) 5 16 2. Indira Gram (Mahu) 5 5 3. Gaginda (Mahu) 0 10 Adopted Village 4. Phool Karari (Indore) 0 4 5. Bari Kalmer (Indore) 0 14 6. Jag Jeewan Gram (Mahu) 5 18 7. Nehru Van Gram (Mahu) 2 3 8. Sendal (Mahu) 0 7 9. Mendal (Mahu) 0 15 Cluster Village 10 Bercha (Mahu) 3 10 Control Village Total 5 5 1 9

186
5.65 The above table shows the location of middle school within the geographical limits of five number of villages, all in adopted and cluster villages. Since the criterion of the accessibility of middle school is 3 kms, the seven number of villages are therefore within the laid down criterion which is an encouraging picture. In none of the villages the adult education centres exist.
SECONDARY LEVEL EDUCATION 5.66 The policy relating to secondary education implies extension of school system in unserved
areas, consolidating existing facilities and providing special arrangements for talented students. Inview of above policy decisions the table below shows the details;
Table No. 5.24
Status of Secondary Level Education High School Higher School (+2) Sr.
No. Name of the village
In the village 0 km
within 5 km
more than 5 km
In the village 0 km
within 5 km
more than 5 km
1 2 3 4 5 6 7 8 1. Mali Badodia (Indore) 5 5 2. Indira Gram (Mahu) 5 5 3. Gaginda (Mahu) 11 11 Adopted Village 4. Phool Karari (Indore) 3 3 5. Bari Kalmer (Indore) 5 5 6. Jag Jeewan Gram (Mahu) 5 5 7. Nehru Van Gram (Mahu) 7 7 8. Sendal (Mahu) 11 11 9. Mendal (Mahu) 14 14 Cluster Village 10 Bercha (Mahu) 10 10 Control Village Total 5 5 5 5
5.67 The above table shows that though in non of the villages the high or higher school is located
but in 5 number of villages these two facilities are located within the easy reach of the villagers i.e. within the five km radius of the village which are as per laid down distance criterion i.e. 5 kms for high school and more than 6 kms for higher school.

187
COLLEGIATE AND TECHNICAL EDUCATION 5.68 The table below shows the details
Table No. 5.25
Status of Collegiate and Technical Education College Industrial training Instt. Sr.
No. Name of the village
within the village 0
km
within 5 km
more than 5 km
within the village 0
km
within 5 km
more than 5 km
1 2 3 4 5 6 7 8 1. Mali Badodia (Indore) 16 16 2. Indira Gram (Mahu) 18 18 3. Gaginda (Mahu) 25 25 Adopted Village
4. Phool Karari (Indore) 20 20 5. Bari Kalmer (Indore) 14 14 6. Jag Jeewan Gram (Mahu) 18 18 7. Nehru Van Gram (Mahu) 5 15 8. Sendal (Mahu) 38 38 9. Mendal (Mahu) 40 40 Cluster Village
10 Bercha (Mahu) 23 28 Control Village Total 1 9 10
5.69 The above table shows that in non of the villages these facilities are located within the
physical limits of ten sample villages which seem obvious as colleges and I.T.Is. are usuall located at district or tahsil headquarters. However, in the village Nehru Van Gram a college is located within the easy distance of 5 kms.
HEALTH 5.70 Primary health care approach being the core strategy of the Tenth Plan for Madhya Pradesh,
a multi tier health and family welfare service delivery system has been developed in the State consisting of sub-health centres, primary health centres and community health centres. Besides, civil hospitals, district hospitals and other special health care institutions have been provided as a support to three tier system. The norms accepted for three tier system is given below;
a. Sub Health Centre for every 5,000 population in non-tribal areas and 3,000 population in
tribal. b. Primary Health Centre for every 30,000 population in non-tribal areas and 20,000
population in tribal areas. c. Community Health Centre for 1,20,000 population in non-tribal areas and 80,000 population
in tribal areas.

188
5.71 On the basis of aforesaid population criteria, the locational analysis of sub-health centres and Rural Family Welfare Centres may be attempted.
5.72 The table below shows the details;
Table No. 5.26
Rural Health Infrastructure Sub Health Centre Rural Family Welfare Centre Sr.
No. Name of the village
Within the Village 0 km
Within 5 km
More than 5 km
Within the Village 0 km
Within 5 km
More than 5 km
1 2 3 4 5 6 7 8 1. Mali Badodia (Indore) 2 2 2. Indira Gram (Mahu) 5 5 3. Gaginda (Mahu) 3 2 Adopted Village
4. Phool Karari (Indore) 3 3 5. Bari Kalmer (Indore) 0 1 6. Jag Jeewan Gram
(Mahu) 5 5
7. Nehru Van Gram (Mahu)
2 2
8. Sendal (Mahu) 1 1 9. Mendal (Mahu) 3 3 Cluster Village
10 Bercha (Mahu) 7 7 Control Village
Total 1 8 1 9 1
Table No. 5.26 [Contd…] Rural Health Infrastructure
Government Hospital Government Dispensary Sr. No.
Name of the village within
the village 0 km
within 5 km
more than 5 km
within the village 0 km
within 5 km
more than 5
km
1 2 9 10 11 12 13 14 1. Mali Badodia (Indore) 16 16 2. Indira Gram (Mahu) 5 5 3. Gaginda (Mahu) 25 4 Adopted Village
4. Phool Karari (Indore) 3 3 5. Bari Kalmer (Indore) 14 0 6. Jag Jeewan Gram
(Mahu) 5 5
7. Nehru Van Gram (Mahu)
10 5
8. Sendal (Mahu) 12 12 9. Mendal (Mahu) 14 14 Cluster Village
10 Bercha (Mahu) 28 7 Control Village Total 3 7 1 5 4

189
Table No. 5.26 [Contd…] Rural Health Infrastructure
Private Clinic Nursing Home Sr. No.
Name of the village within the
village 0 km
within 5 km
more than 5 km
within the village 0 km
within 5 km
more than 5 km
1 2 15 16 17 18 19 20 1. Mali Badodia (Indore) 5 16 2. Indira Gram (Mahu) 5 17 3. Gaginda (Mahu) 4 20 Adopted Village
4. Phool Karari (Indore) 3 20 5. Bari Kalmer (Indore) 0 14 6. Jag Jeewan Gram (Mahu) 5 17 7. Nehru Van Gram (Mahu) 2 6 8. Sendal (Mahu) 3 28 9. Mendal (Mahu) 0 30 Cluster Village
10 Bercha (Mahu) 7 23 Control Village Total 2 7 1 10
5.73 Against the total number of 10 villages only one village i.e. Bari Kalmer [cluster
village] has sub health centre within the geographical limits of the village. In rest of the 8 villages [all from adopted and cluster villages] The sub health centre is located within 5 km distance from the village while for village Bercha [control village] this facility is located at a distance of 7 km from the village. However, from the view point of accessibility the situation is satisfactory.
5.74 Regardomg Rural Family Welfare Centre, in non of the villages this facility is located
within the village. In 9 member of villages [all from adopted and cluster villages] the facility is located within easy reach of the villagers while only for village Bercha [control village] this facility is located 7 kms away from the village. However, in general, Rural Family Welfare Centres are within the easy reach of the villagers of our 10 number of sample villages.
5.75 As regards government hospitals, the facility is not available within the geographical limits
of any of the sample village while in 3 number of villages this facility is available within 5 km radius of the village and for 7 number of villages, government hospitals are located more than 5 kms away from the village ranging between 10 kms for village Nehru Van Gram [cluster village] to 28 kms for village Bercha [control village].
5.76 In two villages viz. Bari Kalmer and Mendal [cluster villages] the private clinics are
located within the geographical limits of the village while in 7 villages this facility is located within easy reach of the villagers and in village Bercha [control village] the facility is located 7 kms away from the village. The information indicates the confidence of the villagers on private medical practitioners because of the perpetual absence of doctors particularly of govt. institutions in rural health centres.
5.77 The private nursing homes are located for away from the identified ten villages ranging
between 6 kms for the village Nehru Van Gram [cluster village] to 30 kms for village Mendal [cluster village].

190
FAMIL WELFARE 5.78 Limiting the size of the family is the most important parameter of family welfare measures.
The table below shows the status of the acceptors of family welfare measures in the sample villages covered under the study.
Table No. 5.27
Status of Acceptors of Family Welfare Measurer Sr. No
Name of the village Total Workers
Acceptors of Nirodh
(No.of Benefic-iaries)
Tubectomy (No. of
Benefic-iaries)
Vasectomy (No. of
Benefic-iaries)
Loop Insertion (No. of
Benefic-iaries)
Oral Pills (No. of
Benefic-iaries)
Traditional Methods (No. of
Benefic-iaries)
1 2 3 4 5 6 7 8 9 1. Mali Badodia (Indore) 251 10
[3.98] 10
[3.98] 3
[1.20] 4
[1.59] 9
[3.59] 0
2. Indira Gram (Mahu) 155 5 [3.23]
7 [4.52]
0 3 [1.94]
7 [4.52]
0
3. Gaginda (Mahu) 617 5 [0.81]
45 [7.29]
0 5 [0.81]
15 [2.43]
0
Adopted Villages 1023 20 [1.96]
62 [6.06]
3 [0.29]
12 [1.17]
31 [3.03]
0
4. Phool Karari (Indore) 300 15 [5.00]
16 [5.33]
0 0 18 [6.00]
0
5. Bari Kalmer (Indore) 267 15 [5.62]
17 [6.37]
0 5 [1.87]
9 [3.37]
0
6. Jag Jeewan Gram (Mahu)
123 6 [4.88]
5 [4.07]
1 [0.81]
2 [1.63]
5 [4.07]
0
7. Nehru Van Gram (Mahu)
186 10 [5.38]
7 [3.76]
0 2 [1.08]
5 [2.69]
0
8. Sendal (Mahu) 378 12 [3.17]
30 [7.94]
7 [1.85]
3 [0.79]
6 [1.59]
0
9. Mendal (Mahu) 468 10 [2.14]
40 [8.55]
12 [2.56]
0 4 [0.85]
0
Cluster Villages 1722 68 [3.95]
115 [6.68]
20 [1.16]
12 [0.70]
47 [2.73]
0
10 Bercha (Mahu) 521 4 [0.77]
18 [3.45]
0 0 10 [1.92]
0
Control Village 521 4 [0.77]
18 [3.45]
0 0 10 [1.92]
0
Total 3266 92 [2.82]
195 [5.97]
23 [0.70]
24 [0.73]
88 [2.69]
0
Note : Figures in brackets show the percentage to figures of column laterally.
5.79 In the above table the percentage figures have been arrived at on the basis of the figures of the workforce, which is, in strict sense is not correct. The comparison should have been on the basis of the figures of eligible couples. Since village wise such figures are not available, therefore as a second option the work force figures that usually include persons within the age group of 15 to 59 years have been taken who may be considered as population with reproductive capacity, particularly males.
5.80 Against the total figure of 3266 persons in the work force the total number of persons
adopting various methods of family welfare is 422 which is 12.92 percent to total work force of ten identified villages. The performance to some extent is satisfactory as the figure would have gone to much higher level had the comparison made with the figure of eligible couple. As has been expected the emphasis is more on the methods of tubectomy and acceptance of Nirodh than on any other method.

191
DRINKING WATER 5.81 The table below shows the existing level of drinking water facilities available in the sample
villages.
Table No. 5.28 Status of Drinking Water Facilities
Sources of drinking water Distance from the village
Sl. No.
Name of the Village In the village =1 KM =2 KMS. =3 KMS. =4KMS.
1 2 3 4 5 6 7 Adopted Villages
1 Mali Badodia 0 - - - - 2 Indira Gram 0 - - - - 3 Gaginda 0 - - - - Cluster Villages 4 Phool Karari 0 - - - - 5 Bari Kalmer 0 - - - - 6 Jag Jeevan Gram 0 - - - - 7 Nehru Van Gram 0 - - - - 8 Sendal 0 - - - - 9 Mendal 0 - - - - Control Village
10 Bercha 0 - - - - Total 10 - - - - 5.82 In all the 10 number of sample villages one or other drinking water source, mostly hand
pumps is available. 5.83 In what follows an attempt has been made to summarise the details of the village
particulars. - The basic purpose of the collection of information about village facilities for identified
ten villages is to ascertain the absorption capacity of any prevailing or new technology regarding any field what-so-ever.
- In villages like Indira Gram [adopted village], Bari Kalmer [cluster village], Jag Jeevan Gram [cluster village] and Nehru Van Gram [cluster village] the percentage of S.C. population is more than that of S.T., population while in rest of the villages a reverse trend is visible.
- The literacy rate that ranged between 24.5 percent for village Mendal [cluster village] a predominantly tribal village to 57.8 percent for village Bercha [control village] is lower than both district and state level per centage literacy of 74.82 and 64.08 respectively.
- The extent of similar work participation rate between male and female is healthy trend indicating awareness and intent of female population residing in our sample area to contribute meaningfully towards household income.
- The proportion of non workers that ranged between 38.6 percent for village Bari Kalmer [cluster village] to 55.1 percent for village Jag Jivan Gram [cluster village] presents a dismal picture as it shows the higher number of dependent population consisting mainly of children, old persons, infirms and unemployed who are not in position to contribute much towards family income.

192
- Agriculture remains to be the main occupation of the ten villages identified for the study. Out of the ten villages, in six number of village the proportion of female cultivators is more than that of male that signifies the awareness of the female members of the farming community to work along with their male counterpart for addition in household income.
- In case of the occupation of agriculture labour the preponderance of female participation over male participation is indicative of the fact that females of our sample area are making strides for enhancement of household income.
- The situation regarding proportion of workers in the household industries to total workers is far from being satisfactory as it ranged between 0.4 percent for village Bari Kalmer [cluster village] and Bercha [control village] to 6.3 percent for village Phool Karari [cluster village].
- Regarding land use the percentage of gross irrigated area to gross cropped area is 54.23 which is more than the district average of 36.70 percent and state average of 28.54 percent.
- All the villages covered under the study are electrified with irregular hours of power supply.
- For district Indore the number of pump sets energized per thousand hectare of gross cropped area is 97 as against state average of 60 that shows the viable nature of agriculture in the district.
- There is complete absence of the existence of any household industrial units in the sample area of our study.
- Total number of 10 cooperative societies are esxisting in our area of study distributed between adopted and cluster villages with no such societies functioning in control village i.e. Bercha.
- The situation of availability of road net work in the sample area of the study is not very satisfactory as in non of the villages even the fair weather roads exist.
- In non of the villages the agriculture marketing facilities exist, even the weekly markets are not organised. The absence of any fair price shop in all the identified 10 villages is a definite draw back.
- In 4 numbers of villages the flour mills exist within the geographical limits of the district.
- Every village has primary school within the physical limits of the village. - Only five number of villages have middle school within the geographical limits of the
district while in non of the villages facilities regarding secondary level education, collegiat level education and technical institution exist.
- Only in village Bari Kalmer [cluster village] sub health centre within the geographical limits of the village exist while in 8 number of villages [all from adopted and cluster groups] this facility is located within 5 km. distance from the village.
- Rural family welfare centres are within the easy reach of all the ten number of sample villages.
- In two villages viz. Bari Kalmer and Mendal [cluster villages] the private clinics are located within the geographical limits of the district while in 7 number of villages this facility is located within easy reach.
- Regarding family welfare, the emphasis is more on the acceptance of measures like tubectomy and nirodh than any other method.
- In all the 10 number of villages one or other drinking water source, mostly hand pumps, is available.
Results of Survey - Household Particulars

193
5.84 The present part of the chapter deals with the information relating to the households in the following dimensions;
(i) Macro Dimensions – Wherein information from all the households residing in 10 number of
sample villages has been collected. (ii) Micro Dimensions – Wherein 25 percent of the households have been identified for the
detailed enquiry. 5.85 In what follows an attempt has been made to detail out both macro and micro dimensions
based on the information collected through House Listing Schedule and household Schedule.
MACRO DIMENSIONS – GENERAL PARTICULARS 5.86 The table below shows the details;
Table No. 5.29 Household Details
S. No.
Name of the Village No. of household as on the date of
survey
Population Census-2001
Average size of he family (based on the figure of col.4
1 2 3 4 5 1. Mali Badodia (Indore) 79 515 6 2. Indira Gram (Mahu) 47 338 7 3. Gaginda (Mahu) 103 1168 11 Adopted Village 229 2021 9
4. Phool Karari (Indore) 77 536 7 5. Bari Kalmer (Indore) 92 435 5 6. Jag Jeewan Gram
(Mahu) 51 274 5
7. Nehru Van Gram (Mahu)
52 332 6
8. Sendal (Mahu) 125 736 6 9. Mendal (Mahu) 166 874 5 Cluster Village 563 3187 7
10 Bercha (Mahu) 69 931 13 Control Village 69 931 13 Total 861 6139 7
5.87 The total number of households as per survey is 861 for all the ten identified villages. The
average size of the family comes to 7 persons which is more than the average size of the family of 5 persons. For village Gaginda and Bercha the average size of the family is 11 and 13 respectively that needs the special attention of district administration.

194
SOCIAL STATUS OF THE HOUSEHOLDS 5.88 The table below shows the social status of the households;
Table No. 5.30 Social Status of the Households.
Caste (Social classification) Interaction with KVK
S. No.
Name of the Village No. of Household
S.T. S.C. O.B.C. General Yes No 1 2 3 4 5 6 7 8 9 1. Mali Badodia (Indore) 79 7 15 49 8 28 51 2. Indira Gram (Mahu) 47 0 41 6 0 36 11 3. Gaginda (Mahu) 103 101 0 2 0 47 56 Adopted Village 229 108 56 57 8 111 118
4. Phool Karari (Indore) 77 2 34 16 25 24 53 5. Bari Kalmer (Indore) 92 0 54 8 30 30 62 6. Jag Jeewan Gram (Mahu) 51 0 51 0 0 21 30 7. Nehru Van Gram (Mahu) 52 0 52 0 0 19 33 8. Sendal (Mahu) 125 81 9 31 4 63 62 9. Mendal (Mahu) 166 166 0 0 0 66 100 Cluster Village 563 249 200 55 59 223 340
10 Bercha (Mahu) 69 68 1 0 0 0 69 Control Village 69 68 1 0 0 0 69 Total 861 425 257 112 67 334 527
5.89 The above table shows the prepondence of S.T., S.C. households, the combined percentage
of which is 79.21 to total number of 861 households which underlines one important fact that the vulnerable communities in our sample villages are pursuing the agriulture occupation in viable manner.
HOUSEHOLDS CLASSIFIED ON THE BASIS OF RELIGION 5.90 The table below shows the details;
Table No. 5.31 Distribution of Households according to Religion
S. No
Name of the Village No. of Household
Hindu Muslim Sikh Christian Nu-Buddh
1 2 3 4 5 6 7 8 1. Mali Badodia (Indore) 79 79 0 0 0 0 2. Indira Gram (Mahu) 47 47 0 0 0 0 3. Gaginda (Mahu) 103 103 0 0 0 0 Adopted Village 229 229 0 0 0 0
4. Phool Karari (Indore) 77 77 0 0 0 0 5. Bari Kalmer (Indore) 92 92 0 0 0 0 6. Jag Jeewan Gram(Mahu) 51 51 0 0 0 0 7. Nehru Van Gram(Mahu) 52 52 0 0 0 0 8. Sendal (Mahu) 125 125 0 0 0 0 9. Mendal (Mahu) 166 166 0 0 0 0 Cluster Village 563 563 0 0 0 0
10 Bercha (Mahu) 69 69 0 0 0 0 Control Village 69 69 0 0 0 0 Total 861 861 0 0 0 0
5.91 All the households in our area of study belong to Hindu religion.

195
OCCUPATIONAL DISTRIBUTION OF HOUSEHOLDS – MAIN OCCUPATION PRIMARY SECTOR – AGRICULTURE 5.92 The table below shows the details;
Table No. 5.32 Household According to their Main Occupation – Agriculture
S. No.
Name of the Village No. of household
Marginal Farmers
Small Farmers
Other Farmers
Agriculture Labour
1 2 3 4 5 6 7 1. Mali Badodia (Indore) 79 4 54 15 1 2. Indira Gram (Mahu) 47 4 20 0 1 3. Gaginda (Mahu) 103 16 26 25 14 Adopted Villages 229 24 100 40 16
4. Phool Karari (Indore) 77 21 10 22 15 5. Bari Kalmer (Indore) 92 26 19 21 15 6. Jag Jeewan Gram (Mahu) 51 15 8 4 15 7. Nehru Van Gram (Mahu) 52 10 15 8 15 8. Sendal (Mahu) 125 31 29 27 16 9. Mendal (Mahu) 166 55 27 40 19 Cluster Villages 563 158 108 122 95
10 Bercha (Mahu) 69 15 17 10 19 Control Village 69 15 17 10 19 Total 861 197 225 172 130
5.93 Out of the total number of 861 households 724 number of households constituting
84.09 percent to total households are engaged directly in agriculture as their main occupation that clearly indicaters the proper rational of selection of villages in the groups of adopted and cluster. The combined percentage of other farmers and small farmers is 46.11 that justifies one fact clearly that the absorption capacity of new or prevailing technologies exists in our area of study which in due course will definitely cover the marginal farmers as well.
PRIMARY SECTOR – FOREST, LIVESTOCK, FISHERIES, HUNTING 5.94 Activities allied to agriculture are equally important as additional source of income and
employment in rural areas. The table below shows the details;

196
Table No. 5.33 Households according to their Main Occupations – Forest, Livestock, Fisheries, Hunting
S. No.
Name of The Village No. of Household
Minor Forest Produce
Collection
Livestock Activities
Fishing Activities
Hunting Activities
1 2 3 4 5 6 7 1. Mali Badodia (Indore) 79 1 4 0 0 2. Indira Gram (Mahu) 47 0 0 0 0 3. Gaginda (Mahu) 103 0 9 0 0 Adopted Villages 229 1 13 0 0
4. Phool Karari (Indore) 77 0 0 0 0 5. Bari Kalmer (Indore) 92 0 0 0 0 6. Jag Jeewan Gram (Mahu) 51 0 0 0 0 7. Nehru Van Gram (Mahu) 52 0 0 0 0 8. Sendal (Mahu) 125 0 0 0 0 9. Mendal (Mahu) 166 1 3 0 0 Cluster Villages 563 1 3 0 0
10 Bercha (Mahu) 69 0 4 0 0 Control Village 69 0 4 0 0 Total 861 2 20 0 0
5.95 The above table shows that in non of the 10 identified villages the activities like fishing
and hunting are being pursued as main occupation. Only marginal number of 2 households are engaged in minor forest produce collection work while 20 households are pursuing livestock activities as their main source of livelihood. In short activities allied to agriculture are not popular in our area of study.
SECONDARY AND TERTIARY SECTORS 5.96 Secondary and tertiary sector occupations are important from view points of income
augmentation and employment generation and absorption of work force in lean season of agriculture. The table below shows the details;
Table No. 5.34
Households According to their Main Occupations – Secondary and Tertiary Sectors Secondary Sector Tertiary Sector S.
No. Name of The Village No. of
Household Servicing And Repairs
Construction Work
Government Service
Service in Pvt. Sector
1 2 3 4 5 6 7 1. Mali Badodia (Indore) 79 0 0 0 0 2. Indira Gram (Mahu) 47 0 0 0 3 3. Gaginda (Mahu) 103 0 0 0 8 Adopted Village 229 0 0 0 11
4. Phool Karari (Indore) 77 0 0 2 5 5. Bari Kalmer (Indore) 92 0 0 0 2 6. Jag Jeewan Gram (Mahu) 51 0 0 0 1 7. Nehru Van Gram (Mahu) 52 0 0 0 0 8. Sendal (Mahu) 125 0 0 0 3 9. Mendal (Mahu) 166 1 3 1 2 Cluster Village 563 1 3 3 13
10 Bercha (Mahu) 69 0 0 2 6 Control Village 69 0 0 2 6 Total 861 1 3 5 30

197
5.97 The above table shows that out of the total number of 861 households only 4
households [0.46 percent to total households] are engaged in secondary sector occupations while 35 number of households [4.07 percent] are engaged in tertiary sector occupations which are insignificant. However, comparatively higher level of employment in private sector indictes the presence of private entrepreneur in our area of study.
OCCUPATIONAL DISTRIBUTION OF HOUSEHOLDS – SUBSIDIARY OCCUPATIONS
PRIMARY SECTOR – AGRICULTURE 5.98 The table below shows the details;
Table No. 5.35
Households According to their Subsidiary Occupation – Agriculture S.
No. Name of the Village No. of
household Marginal Farmers
Small Farmers
Other Farmers
Agriculture Labour
1 2 3 4 5 6 7 1. Mali Badodia (Indore) 79 0 1 1 11 2. Indira Gram (Mahu) 47 0 4 0 11 3. Gaginda (Mahu) 103 0 4 0 40 Adopted Village 229 0 9 1 62
4. Phool Karari (Indore) 77 0 11 2 46 5. Bari Kalmer (Indore) 92 0 11 0 51 6. Jag Jeewan Gram (Mahu) 51 0 12 0 20 7. Nehru Van Gram (Mahu) 52 0 12 0 22 8. Sendal (Mahu) 125 1 13 0 93 9. Mendal (Mahu) 166 4 15 0 100 Cluster Village 563 5 74 2 350
10 Bercha (Mahu) 69 4 15 0 20 Control Village 69 4 15 0 20 Total 861 9 98 3 432
5.99 The above table shows that out of total number of 861 households, 542 households are
engaged in agriculture as subsidiary occupation which is 62.95 percent to total households. Normally the percentage of households to total households engaged in agriculture both in main and subsidiary occupations should be 100 but in this case the percentage is 147.04 which is mainly due the fact that at times agriculture labour in main oiccupation start working as hired agriculture labour for other cultivators as part time workers for income enhancement with the result the percentage involvement gets inflated which is evident from the fact that 50.17 percent households are engaged in pursuing the occupatiojn of agriculture labour as subsidiary occupation.
PRIMARY SECTOR – FOREST, LIVESTOCK, FISHERIES, HUNTING 5.100 The table below shows the details;

198
Table No. 5.36 Households According to their Subsidiary Occupation – Forest, Livestock, Fisheries, Hunting
S. No.
Name of The Village No. of Household
Minor Forest Produce
Collection
Livestock Activities
Fishing Activities
Hunting Activities
1 2 3 4 5 6 7 1. Mali Badodia (Indore) 79 0 0 0 0 2. Indira Gram (Mahu) 47 0 0 0 0 3. Gaginda (Mahu) 103 0 1 0 0 Adopted Villages 229 0 1 0 0
4. Phool Karari (Indore) 77 0 0 0 0 5. Bari Kalmer (Indore) 92 0 3 0 0 6. Jag Jeewan Gram (Mahu) 51 0 0 0 0 7. Nehru Van Gram (Mahu) 52 0 0 0 0 8. Sendal (Mahu) 125 8 4 0 0 9. Mendal (Mahu) 166 8 8 0 1 Cluster Villages 563 16 15 0 1
10 Bercha (Mahu) 69 0 0 0 0 Control Village 69 0 0 0 0 Total 861 16 16 0 1
5.101 The aggregate percentage of households engaged in activities like forest, livestock, fisheries
and hunting as subsidiary occupation to total households [mostly in adopted and cluster villages] is 3.83 which can hardly be termed as any sort of performance. These activities are supportive source of income which should be encouraged by government initiatives provided there is willingness from the target groups to adopt such occupations.
SECONDARY AND TERTIARY SECTORS 5.102 The table below shows the details;
Table No. 5.37 Households According to their Subsidiary Occupations – Secondary and Tertiary Sectors
Secondary Sector Tertiary Sector S. No.
Name of The Village No. of Household Servicing and
Repairs Construc-tion Work
Govt. Service
Service in Pvt Sector
1 2 3 4 5 6 7 1. Mali Badodia (Indore) 79 0 0 0 2 2. Indira Gram (Mahu) 47 0 0 2 0 3. Gaginda (Mahu) 103 0 0 0 1 Adopted Villages 229 0 0 2 3
4. Phool Karari (Indore) 77 0 0 0 3 5. Bari Kalmer (Indore) 92 0 0 0 4 6. Jag Jeewan Gram (Mahu) 51 0 0 0 4 7. Nehru Van Gram(Mahu) 52 0 0 0 1 8. Sendal (Mahu) 125 0 0 0 7 9. Mendal (Mahu) 166 0 0 0 7 Cluster Villages 563 0 0 0 26
10 Bercha (Mahu) 69 0 0 0 0 Control Village 69 0 0 0 0 Total 861 0 0 2 29

199
5.103 Involvement of households in activities relating to secondary sector as subsidiary occupation is nil in our area of study while only 31 households are engaged in tertiary sector mostly service in private sector.
5.104 The Only conclusion that can be drawn from the narrations in foregoing paragraphs is
that agriculture is the only activity of the area under study which is being persued on viable scale.
AVERAGE MONTHLY INCOME 5.105 In any survey work the most difficult part is the collection of information regarding income
and expenditure of the household with reasonable accuracy as the households are very cautious about parting with the facts. However, the information shows a trend that may be useful for supporting conclusions which have direct or indirect relations with levels of income of the households. The table below shows the details;
Table No. 5.38
Average Monthly Income S.
No. Name of the
Village No. of House hold
Blow Rs.500
Rs.5001 to
Rs.600
Rs.601 to
Rs.700
Rs.701 to
Rs.800
Rs.801 to
Rs.900
Rs.901 to
Rs.1000
Rs.1001 and
Above
1 2 3 4 5 6 7 8 9 10 1. Mali Badodia
(Indore) 79 1 0 0 2 0 13 63
2. Indira Gram (Mahu)
47 0 0 0 1 0 2 44
3. Gaginda (Mahu) 103 2 1 0 4 1 24 71 Adopted Villages 229 3 1 0 7 1 39 178
4. Phool Karari (Indore)
77 0 0 0 1 1 6 69
5. Bari Kalmer (Indore)
92 3 0 0 1 0 9 79
6. Jag Jeewan Gram (Mahu)
51 1 0 0 0 0 0 50
7. Nehru Van Gram (Mahu)
52 0 0 0 1 0 2 49
8. Sendal (Mahu) 125 2 0 0 4 0 11 108 9. Mendal (Mahu) 166 4 1 1 8 0 31 121 Cluster Villages 563 10 1 1 15 1 59 476
10 Bercha (Mahu) 69 0 0 0 5 1 20 43 Control Village 69 0 0 0 5 1 20 43 Total 861 13 2 1 27 3 118 697
5.106 The viable nature of agriculture as main and subsidiary occupations is reflected by the fact
that out of 861 number of households the combined number of households within the income range of Rs. 901 to Rs. 1000 and Rs. 1001 and above per month is 815 which is 94.66 percent to total households. In adopted villages this percentage is 94.76 while in cluster villages it is 95.03 percent. Even in control village where there is no intervention of K.V.K. the percentage of households within the income range Rs. 901 to Rs. 1000 and Rs. 1001 and above per month as 91.30 that shows overall affluence level of the area.

200
AVERAGE MONTHLY EXPENDITURE 5.107 The table below shows the details;
Table No. 5.39 Average Monthly Expenditure
S. No.
Name of the Village
No. of Household
Blow Rs.500
Rs.501 to
Rs.600
Rs.601 to
Rs.700
Rs.701 to
Rs.800
Rs.801 to
Rs.900
Rs.901 to
Rs.1000
Rs.1001 and
Above 1 2 3 4 5 6 7 8 9 10 1. Mali Badodia
(Indore) 79 0 0 0 7 1 16 55
2. Indira Gram (Mahu)
47 1 0 0 1 1 5 39
3. Gaginda (Mahu) 103 1 2 0 4 0 23 73 Adopted Village 229 2 2 0 12 2 44 167
4. Phool Karari (Indore)
77 2 0 0 1 0 9 65
5. Bari Kalmer (Indore)
92 1 0 0 1 0 14 76
6. Jag Jeewan Gram (Mahu)
51 1 0 0 0 0 1 49
7. Nehru Van Gram (Mahu)
52 0 0 1 1 0 9 41
8. Sendal (Mahu) 125 8 1 0 2 0 7 107 9. Mendal (Mahu) 166 6 1 1 9 0 45 104 Cluster Village 563 18 2 2 14 0 85 442
10 Bercha (Mahu) 69 1 0 1 5 0 14 48 Control Village 69 1 0 1 5 0 14 48 Total 861 21 4 3 31 2 143 657
5.108 In line with income level, the percentage of households within the expenditure range of Rs.
901 to Rs. 1000 and Rs. 1001 and above per month to total households is 92.93 with the break-up of 92.14 percent for adopted villages and 93.61 percent for cluster villages which further shows the affluence level of the area.
5.109 To sum up it may be mentioned that - The average size of the households for all the identified ten villages is 7 persons - The preponderance of S.C., S.T. households the combined percentage of which is 79.21
percent to total of 861 households is the marked feature of our sample area. - All the households in our area of study belong to Hindu religion. - Agriculture is the main occupation of the households of our sample area constituting
84.09 percent to total households. The combnined percentage of other farmers and small farmers is 46.11 that indicates the extent of absorption capacity of new or prevailing technologies pertaining to agriculture.
- Only marginal number of 20 households [2.32 percent] are pursuing livestock activities as their main occupation. In short activities allied to agriculture is not popular in our area of study.
- In secondary and tertiary sector occupations only 4.53 percent households to total of 861 households are engaged. Comparatively higher level of employment in private sector indicates the presence of private entrepreneur in our area of study.

201
- Only 31 number of households [3.60 percent] are engaged in tertiary sector mostly serving in private sector.
- Regarding averge monthly income the combined number of households within the income range of Rs. 901.00 to Rs. 1000.00 and Rs. 1001.00 and above per month is 815 which is 94.66 percent to total households which shows an overall affluence level of the area.
- Regarding average monthly expenditure the percentage of households within the expenditure range of Rs. 901.00 to Rs. 1000.00 and Rs. 1001.00 and above to total households is 92.33
RESULTS OF THE SURVEY – MICRO DIMENSION 5.110 In this part of the Chapter 25 percent of the households have been identified for detailed
enquiry which comes 214 households. 5.111 The table below shows the details;
Table No. 5.40 Male – Female Distribution
Age, Male S. No.
Name of the Village No. of Families Selected
No. of Family
Members
Male Total 0-10
Years 10-20 Years
20-30 Years
30-40 Years
40-50 Years
50-60 Years
60 Years and
Above 1 2 3 4 5 6 7 8 9 10 11 12 1. Mali Badodia(Indore) 20 104 54 13 14 13 4 3 6 1 2. Indira Gram (Mahu) 12 94 55 11 17 15 3 5 2 2 3. Gaginda (Mahu) 26 161 90 19 39 8 10 12 2 0 Adopted Villages 58 359 199 43 70 36 17 20 10 3
4. Phool Karari (Indore) 19 114 64 25 13 10 7 6 3 0 5. Bari Kalmer (Indore) 23 121 50 7 13 9 9 8 4 0 6. Jag Jeewan Gram
(Mahu) 12 67 36 13 5 8 4 6 0 0
7. Nehru Van Gram (Mahu)
13 76 41 6 17 5 3 7 3 0
8. Sendal (Mahu) 31 164 90 27 25 10 11 10 3 4 9. Mendal (Mahu) 41 199 101 35 22 23 10 8 2 1 Cluster Villages 139 741 382 113 95 65 44 45 15 5
10 Bercha (Mahu) 17 85 44 20 6 7 8 2 1 0 Control Village 17 85 44 20 6 7 8 2 1 0 Total 214 1185 625 176 171 108 69 67 26 8

202
Table No. 5.40 [Contd…] Male – Female Distribution
Age, Female S. No.
Name Of The Village No. of Families Selected
No. of Family
Members
Female
Total 0-10
Years 10-20 Years
20-30 Years
30-40 Years
40-50 Years
50-60 Years
60 Years and
Above1 2 3 4 13 14 15 16 17 18 19 20
1. Mali Badodia (Indore) 20 104 50 12 12 9 4 5 5 3 2. Indira Gram (Mahu) 12 94 39 8 7 9 5 5 3 2 3. Gaginda (Mahu) 26 161 71 22 22 7 14 4 2 0 Adopted Village 58 359 160 42 41 25 23 14 10 5 4. Phool Karari (Indore) 19 114 50 11 16 7 8 5 3 0 5. Bari Kalmer (Indore) 23 121 71 23 18 12 6 9 3 0 6. Jag Jeewan Gram
(Mahu) 12 67 31 4 13 4 4 4 1 1
7. Nehru Van Gram (Mahu)
13 76 35 8 9 5 5 6 1 1
8. Sendal (Mahu) 31 164 74 25 15 9 10 7 5 3 9. Mendal (Mahu) 41 199 98 40 20 16 11 5 4 2 Cluster Village 139 741 359 111 91 53 44 36 17 7 10 Bercha (Mahu) 17 85 41 13 12 9 6 1 0 0 Control Village 17 85 41 13 12 9 6 1 0 0 Total 214 1185 560 166 144 87 73 51 27 12
5.112 The above table shows that out of the total number of 1185 number of persons from
214 households males constitute 52.74 percent while females constitute 47.26 percent. The number of males within the age group of 20 to 60 years which represents labour force is 270 which is 43.20 percent to total number of 625 males is indicative of a positive fact that more persons are available for any productive work. These percentages are 41.71 in adopted villages and 44.24 in cluster villages which underline one basic point that in case of rapid development of agriculture through application of technology by the K.V.Ks. the possibility of absorbing the existing labour force will arrest the tendency of migration during lean season of agriculture. In case of females this percentage is 42.50 with break ups of 45.00 percent for adopted villages and 41.78 percent for cluster villages [more or less in line with male population] that again shows the availability of female labour – force for pursuance of any activity for family income augmentation along with engaging themselves in agriculture with their male counterpart. The percentage of dependent persons comprising of population within the age group of 0 to 10 years and 60 years and above who do not usually contribute towards family income is 13.44 in case of males and 31.79 percent in case females, is within a fair limit particularly for males which ofcource is again a positive indicator.

203
EDUCATIONAL STATUS OF SAMPLE HOUSEHOLDS 5.113 Education and literacy are the twin prerequisites necessary for adoption of any sort of
technology. The table below shows the educational status of sample households; Table No. 5.41
Educational Status S.
No. Name of The Village No. of
Families Selected
No. of Family
Members
Illiterate Literate without going to school
Primary No.
Middle No.
1 2 3 4 5 6 7 8 1. Mali Badodia (Indore) 20 104 42 0 19 31 2. Indira Gram (Mahu) 12 94 32 0 25 23 3. Gaginda (Mahu) 26 161 69 0 45 22 Adopted Village 58 359 143 0 89 76
4. Phool Karari (Indore) 19 114 22 1 41 34 5. Bari Kalmer (Indore) 23 121 17 0 39 54 6. Jag Jeewan Gram (Mahu) 12 67 18 0 24 14 7. Nehru Van Gram (Mahu) 13 76 20 0 20 20 8. Sendal (Mahu) 31 164 38 1 68 46 9. Mendal (Mahu) 41 199 117 1 47 26 Cluster Village 139 741 232 3 239 194
10 Bercha (Mahu) 17 85 15 0 58 11 Control Village 17 85 15 0 58 11 Total 214 1185 390 3 386 281
Table No. 5.41 [Contd…]
Educational Status S. No
Name of The Village No. of Families Selected
No. of Family
Members
High School
No.
Higher School
No.
Graduate No.
Post Graduate
No.
Others
1 2 3 4 9 10 11 12 13 1. Mali Badodia (Indore) 20 104 11 1 0 0 0 2. Indira Gram (Mahu) 12 94 12 2 0 0 0 3. Gaginda (Mahu) 26 161 22 3 0 0 0 Adopted Villages 58 359 45 6 0 0 0
4. Phool Karari (Indore) 19 114 15 0 1 0 0 5. Bari Kalmer (Indore) 23 121 10 1 0 0 0 6. Jag Jeewan Gram(Mahu) 12 67 8 3 0 0 0 7. Nehru Van
Gram(Mahu) 13 76 10 5 1 0 0
8. Sendal (Mahu) 31 164 9 2 0 0 0 9. Mendal (Mahu) 41 199 8 0 0 0 0 Cluster Villages 139 741 60 11 2 0 0
10 Bercha (Mahu) 17 85 1 0 0 0 0 Control Village 17 85 1 0 0 0 0 Total 214 1185 106 17 2 0 0

204
5.114 The literacy percentage against the total of 1185 persons is 67.08 which is lower than the district average of 74.82 percent but higher than the state average of 64.11 percent as per census 2001. The percentage of children in levels of elementary education [primary + middle levels] is 56.29 which shows the fair impact of the programme of Universalisation of Elementary Education over our area of study. The extent of higher education is far from being impressive mainly because of the lack of higher educational facilities in our area of study. However, an overall educational status that emerges justifies the extent of absorption capacity of the people of the sample area to adopt technology regarding agriculture introduced particularly by the K.V.K.
OCCUPATIONAL DISTRIBUTION OF HOUSEHOLDS–MAIN OCCUPATION 5.115 Out of the total of 1185 household members of our sample area, 273 persons are engaged in
various main occupations which constitute 23.04 percent to total household members. In what follow an attempt has been made to analyse the information pertaining to main occupations.
OCCUPATIONS RELATING TO AGRICULTURE 5.116 The table below shows the details;
Table No. 5.42 Main Occupation – Agriculture
S. No.
Name of The Village No. of families selected
No. of family
members
Small Farmer
Marginal Farmer
Farmer Agriculture Labour
1 2 3 4 5 6 7 8 1. Mali Badodia (Indore) 20 104 11 0 7 0 2. Indira Gram (Mahu) 12 94 12 0 0 8 3. Gaginda (Mahu) 26 161 8 0 19 2 Adopted Village 58 359 31 0 26 10
4. Phool Karari (Indore) 19 114 0 0 23 0 5. Bari Kalmer (Indore) 23 121 0 0 25 2 6. Jag Jeewan Gram (Mahu) 12 67 10 0 1 1 7. Nehru Van Gram (Mahu) 13 76 6 0 8 1 8. Sendal (Mahu) 31 164 13 2 17 5 9. Mendal (Mahu) 41 199 12 0 29 1 Cluster Village 139 741 41 2 103 10
10 Bercha (Mahu) 17 85 6 0 11 5 Control Village 17 85 6 0 11 5 Total 214 1185 78 2 140 25
5.117 One of the conclusions that can be drawn from the information contained in the above table
is that farmers usually middle level and large cultivators and the small farmers the combined percentage of which is 18.40 to total household members and 79.85 percent to total number of persons engaged in various main occupations pursue the agriculture as their main source of livelihood and are capable of implementing the improved technology relating to agriculture production. The number of persons engaged as marginal farmers and agriculture labour are negligible which is positive indication that agriculture in our area of study is being pursued on viable scale.

205
5.118 In case of adopted villages the combined percentage of small farmers and farmers is 15.88 to total household members and 67.86 percent to persons pursing various main occupations while for cluster group of villages these percentages are 19.43 and 86.75 respectively that clearly indicate the rational base followed for selection of such villages in the groups of adopted and cluster for transfer of improved technology relating to enhancement of agriculture production.
OCCUPATIONS ALLIED TO AGRICULTURE 5.119 The table below shows the details;
Table No. 5.43 Main Occupations – Allied to Agriculture
S. No.
Name of The Village No. of families selected
No. of family
members
Minor Forest
Produce Collection
Live stock
Activities
Fishing Activities
Hunting Activities
1 2 3 4 5 6 7 8 1. Mali Badodia (Indore) 20 104 0 1 0 0 2. Indira Gram (Mahu) 12 94 0 0 0 0 3. Gaginda (Mahu) 26 161 0 1 0 0 Adopted Villages 58 359 0 2 0 0
4. Phool Karari (Indore) 19 114 0 0 0 0 5. Bari Kalmer (Indore) 23 121 0 0 0 0 6. Jag Jeewan Gram
(Mahu) 12 67 0 0 0 0
7. Nehru Van Gram (Mahu)
13 76 0 0 0 0
8. Sendal (Mahu) 31 164 0 1 0 0 9. Mendal (Mahu) 41 199 0 0 0 0 Cluster Villages 139 741 0 1 0 0
10 Bercha (Mahu) 17 85 0 0 0 1 Control Village 17 85 0 0 0 1 Total 214 1185 0 3 0 1
5.120 One of the mandates of K.V.K. is to encourage the activities allied to agriculture particularly that of animal husbandry and fisheries as alternate sources of rural income with immense advantage of reducing pressure on land. The above table shows the near absence of such activities in our area of study as only 3 persons are pursing livestock activities as main occupation [all from adopted and cluster villages] and only one person in control village is engaged in hunting activities on full time basis. One of the greatest disadvantages of the rural scenario of Madhya Pradesh is the absence of such activities particularly in the far-flung areas that keep the rural inhabitants in a state of perpetual poverty.
OCCUPATIONS RELATING TO SECONDARY AND TERTIARY SECTORS 5.121 The table below shows the details;

206
Table No. 5.44 Main Occupation – Secondary and Tertiary Sectors
S. No.
Name of The Village No. of families selected
No. of family
members
Manufac-turing of
by Product
Servicing and
repairs
Const-ruction work
Govt. Service
Service in Pvt. Sector
1 2 3 4 5 6 7 8 9 1. Mali Badodia (Indore) 20 104 0 0 0 0 0 2. Indira Gram Mahu) 12 94 0 3 11 0 0 3. Gaginda (Mahu) 26 161 0 0 1 0 0 Adopted Village 58 359 0 3 12 0 0
4. Phool Karari (Indore) 19 114 0 0 0 0 0 5. Bari Kalmer (Indore) 23 121 0 0 0 0 0 6. Jag Jeewan Gram
(Mahu) 12 67 0 0 7 0 0
7. Nehru Van Gram (Mahu)
13 76 0 0 1 0 0
8. Sendal (Mahu) 31 164 0 0 0 0 0 9. Mendal (Mahu) 41 199 0 0 0 1 0 Cluster Village 139 741 0 0 8 1 0
10 Bercha (Mahu) 17 85 0 0 0 0 0 Control Village 17 85 0 0 0 0 0 Total 214 1185 0 3 20 1 0
5.122 The K.V.Ks. offer training to unemployed youth for self employment. Employment of only
23 persons in secondary occupations [all from adopted and cluster villages] can hardly be termed as encouraging. One of the important causes of rural poverty is absence of secondary sector occupations in rural areas.
OCCUPATIONAL DISTRIBUTION OF HOUSEHOLDS IN SUBSIDIUARY OCCUPATIONS 5.123 Out of total of 1185 persons only 22 persons are engaged in various subsidiary occupations
that constitute 1.86 percent to total household members of our sample area. The picture is hardly meaningful.
SUBSIDIARY OCCUPATIONS – AGRICULTURE 5.124 The table below shows the details;

207
Table No. 5.45 Subsidiary Occupation – Agriculture
S. No.
Name of The Village No. of families selected
No. of family
members
Small Farmer
Marginal Farmer
Farmer Agriculture Labour
1 2 3 4 5 6 7 8 1. Mali Badodia (Indore) 20 104 1 0 2 2 2. Indira Gram (Mahu) 12 94 0 0 0 0 3. Gaginda (Mahu) 26 161 0 0 0 2 Adopted Village 58 359 1 0 2 4
4. Phool Karari (Indore) 19 114 0 0 0 0 5. Bari Kalmer (Indore) 23 121 0 0 0 0 6. Jag Jeewan Gram (Mahu) 12 67 1 0 0 3 7. Nehru Van Gram(Mahu) 13 76 0 1 0 1 8. Sendal (Mahu) 31 164 1 0 0 0 9. Mendal (Mahu) 41 199 0 0 1 0 Cluster Village 139 741 2 1 1 4
10 Bercha (Mahu) 17 85 0 0 1 0 Control Village 17 85 0 0 1 0 Total 214 1185 3 1 4 8
5.125 The above table shows the involvement of only 16 persons in agricultural occupations which
is hardly a meaningful affair. SUBSIDIARY OCCUPATIONS – ALLIED TO AGRICULTURE 5.126 The table below shows the details;
Table No. 5.46 Subsidiary Occupation – Allied to Agriculture
S. No.
Name of The Village No. of families selected
No. of family
members
Minor Forest
Produce Collection
Live stock
activities
Fishing Activities
Hunting Activities
Mining and
Quarying
1 2 3 4 5 6 7 8 9 1. Mali Badodia (Indore) 20 104 0 0 0 0 0 2. Indira Gram (Mahu) 12 94 0 0 0 0 0 3. Gaginda (Mahu) 26 161 0 1 0 0 0 Adopted Village 58 359 0 1 0 0 0
4. Phool Karari (Indore) 19 114 0 0 0 0 0 5. Bari Kalmer (Indore) 23 121 0 1 0 0 0 6. Jag Jeewan Gram
(Mahu) 12 67 0 0 0 0 0
7. Nehru Van Gram (Mahu)
13 76 0 0 0 0 0
8. Sendal (Mahu) 31 164 0 0 0 0 0 9. Mendal (Mahu) 41 199 0 0 0 0 0 Cluster Village 139 741 0 1 0 0 0
10 Bercha (Mahu) 17 85 0 0 0 0 0 Control Village 17 85 0 0 0 0 0 Total 214 1185 0 2 0 0 0

208
5.127 The above table shows that only two persons are pursuing occupation regarding livestock rearing as subsidiary occupation which hardly carries any meaning.
SUBSIDIARY OCCUPATION – SECONDARY AND TERTIARY SECTORS 5.128 The table below shows the details;
Table No. 5.47
Subsidiary Occupations – Secondary and Tertiary Sectors S.
No. Name of The Village No. of
families selected
No. of family
members
Manufacturing of by Product
Servi-cing and repairs
Const-ruction work
Govt. Service
Service in Pvt.
Sector
1 2 3 4 5 6 7 8 9 1. Mali Badodia(Indore) 20 104 0 0 1 0 0 2. Indira Gram (Mahu) 12 94 0 0 0 0 0 3. Gaginda (Mahu) 26 161 0 0 0 0 0 Adopted Village 58 359 0 0 1 0 0 4. Phool Karari (Indore) 19 114 0 0 1 1 0 5. Bari Kalmer (Indore) 23 121 0 0 0 0 0 6. Jag Jeewan Gram (Mahu) 12 67 0 0 0 0 0 7. Nehru Van Gram (Mahu) 13 76 0 0 0 0 0 8. Sendal (Mahu) 31 164 0 0 0 1 0 9. Mendal (Mahu) 41 199 0 0 0 0 0 Cluster Village 139 741 0 0 1 2 0
10 Bercha (Mahu) 17 85 0 0 0 0 0 Control Village 17 85 0 0 0 0 0
Total 214 1185 0 0 2 2 0
5.129 Again there are only four persons engaged in secondary and tertiary sectors which is not a
meaningful state of affairs. AVERAGE MONTHLY INCOME 5.130 The table below shows the details;
Table No. 5.48 Average Monthly Income
S. No.
Name of The Village No. of families selected
No. of family memb
ers
Below Rs. 500
Rs. 501 to
Rs. 600
Rs. 601 to
Rs. 700
Rs. 701 to
Rs. 800
Rs. 801 to
Rs. 900
Rs. 901 to
Rs. 1000
Rs. 1001 & above
1 2 3 4 5 6 7 8 9 10 11 1. Mali Badodia (Indore) 20 104 20 0 0 0 0 0 84 2. Indira Gram (Mahu) 12 94 18 2 0 1 0 9 64 3. Gaginda (Mahu) 26 161 28 0 0 0 0 2 131 Adopted Villages 58 359 66 2 0 1 0 11 279
4. Phool Karari (Indore) 19 114 20 0 0 0 0 0 94 5. Bari Kalmer (Indore) 23 121 22 0 0 0 0 0 99 6. Jag Jeewan Gram (Mahu) 12 67 17 0 0 0 0 2 48 7. Nehru Van Gram (Mahu) 13 76 13 0 0 0 0 2 61 8. Sendal (Mahu) 31 164 31 0 0 0 0 4 129 9. Mendal (Mahu) 41 199 40 0 0 0 0 1 158 Cluster Villages 139 741 0 0 0 0 0 0 589
10 Bercha (Mahu) 17 85 16 1 0 0 0 2 66 Control Village 17 85 0 1 0 0 0 0 66
Total 214 1185 225 3 0 1 0 22 934

209
5.131 The above table shows that 78.82 percent family members against the 1185 persons are within the income range of Rs. 1001 and above per month which is obvious as most of the farmers are pursuing agricultural occupations in viable manner with medium and large holdings.
AVERAGE MONTHLY EXPENDITURE 5.132 The table shows the details;
Table No. 5.49 Average Monthly Expenditure
S. No.
Name of The Village No. of families selected
No. of family
members
Below Rs. 500
Rs. 501 to
Rs. 600
Rs. 601 to
Rs. 700
Rs. 701 to
Rs. 800
Rs. 801 to
Rs. 900
Rs. 901 to
Rs. 1000
Rs. 1001 and
Above
1 2 3 4 5 6 7 8 9 10 11 1. Mali Badodia (Indore) 20 104 17 0 0 0 0 3 84 2. Indira Gram (Mahu) 12 94 11 0 2 1 0 9 71 3. Gaginda (Mahu) 26 161 27 0 0 0 0 1 133 Adopted Village 58 359 55 0 2 1 0 13 288
4. Phool Karari (Indore) 19 114 19 0 0 0 0 1 94 5. Bari Kalmer (Indore) 23 121 22 0 0 0 0 0 99 6. Jag Jeewan Gram (Mahu) 12 67 12 0 0 0 0 6 49 7. Nehru Van Gram (Mahu) 13 76 11 0 2 0 0 1 62 8. Sendal (Mahu) 31 164 31 0 0 0 0 0 133 9. Mendal (Mahu) 41 199 30 0 0 0 0 9 160 Cluster Village 139 741 0 0 2 0 0 0 597
10 Bercha (Mahu) 17 85 15 1 1 2 0 1 65 Control Village 17 85 0 1 1 2 0 0 65 Total 214 1185 195 1 5 3 0 31 950
5.133 In line with information pertaining to income, 80.17 percent of family members are within
the expenditure range of Rs. 1001.00 and above per month. 5.134 To sum up - The percentage of males with the age group of 20 to 60 years, considered to be the
labour force is 43.20 while that for females is 42.50 indicating the availability of eligible work force requiring employment opportunities.
- The percentage of dependent persons comprising of population within the age group of 0 to 10 years and 60 years and above who do not usually contribute towards family income is 13.44 in case of males and 31.79 percent in case of females, is within a fair limit particularly for males which is a positive demographic indicator.
- The literacy percentage being 67.08 in the sample area is higher than the state average of 64.11 percent. The overall educational status that emerges show the absorption capacity of the people of the sample area to adopt latest technology regarding agriculture introduced by the K.V.K.
- The bulk of the farming community consists of farmers and small farmers constituting 79.85 percent to total number of persons pursuing various main occupations that indicates the feasibility to implement various technology related to agriculture.

210
- The near absence of activities relating to allied spheres of agriculture is not very uncommon in our area of study as, generally, in rural areas such activities particularly animal rearing is pursued on a very limited scale.
- In our sample area of study only 23 persons are engaged in secondary occupations which can not be termed as satisfactory.
- Regarding subsidiary occupations only 22 persons are engaged in various such occupations [1.86 percent to total household members] which is not at all meaningful.
- Regarding average monthly income, 78.82 percent family members against the 1185 persons are within the income range of Rs. 1001.00 and above per month that shows the affluence level of the area to some extent.
- Similarly 80.17 percent persons are within the expenditure range of Rs. 1001.00 and above per-month.
RESULTS OF SURVEY SUBJECTS OF TRAINING RECEIVED– ADOPTED AND CLUSTER VILLAGES 5.135 At the outset it is necessary to clarify the point that there are 197 number of families out of
the total number of 214 families [92.06 percent] who took part in vocational training, front line demonstration and on farm testing which are the three basic mandates of K.V.K. Therefore, the total of responding families from vocational training, front line demonstration and on farm testing will not tally with the figure of 197 as from this basic figure the families participated in three fundamental activities. The entire analysis is based upon family approach as normally one member from each family from adopted and cluster villages where there is direct intervention of K.V.K. takes part in various training programmes. In what follows an attempt has been made to present the item wise details of various initiatives adopted by K.V.K. in the fields of vocational training, front line demonstrations and on farm testing.
VOCATIONAL TRAINING 5.136 The table below shows the details;
Table No. 5.50 Subjects of Training Received – Vocational Training.
Subject on Which Training Received S. No.
Name of Village No. of Respondents Crop Prod
Agronomy Horticulture Live stock
Dairying Poultry
Fisheries
1 2 3 4 5 6 7 1 Mali Badodia(Indore) 20 20 7 2 0 2 Indira Gram (Mahu) 12 12 12 1 1 3 Gaginda (Mahu) 26 26 8 1 0 I Adopted Villages 58 58 27 4 1 4 Phool Karari (Indore) 19 4 2 1 2 5 Bari Kalmer (Indore) 23 6 3 0 1 6 Jag Jeewan Gram
(Mahu) 12 3 2 0 1
7 Nehru Van Gram (Mahu)
13 7 3 0 0
8 Sendal (Mahu) 31 12 4 0 0 9 Mendal (Mahu) 41 23 6 0 0 II Cluster Villages 139 55 20 1 4 Total All Villages 197 113 47 5 5
Table No. 5.50 [Contd…]

211
Subjects of Training Received – Vocational Training. Subject On Which Training Received S.
No. Name of Village
Home Science
Training of Rural Youth
Agro Forestry
Organic Farming
Water Shed
Activities 1 2 8 9 10 11 12 1 Mali Badodia (Indore) 20 1 0 0 0 2 Indira Gram (Mahu) 12 0 0 2 5 3 Gaginda (Mahu) 23 0 0 8 9 I Adopted Villages 55 1 0 10 14 4 Phool Karari (Indore) 19 1 0 0 0 5 Bari Kalmer (Indore) 23 0 1 3 0 6 Jag Jeewan Gram(Mahu) 12 0 0 0 1 7 Nehru Van Gram (Mahu) 13 0 0 3 1 8 Sendal (Mahu) 27 0 0 1 1 9 Mendal (Mahu) 41 1 1 7 3 II Cluster Villages 135 2 2 14 6 Total All Villages 190 3 2 24 20
5.137 One very peculiar feature as revealed by the above table is that out of the total of 197
responding family, representatives from 190 families i.e. 96.45 percent to total responding families have responded to vocational training programmes relating to home science and by 113 families [57.36 percent] for crop production followed horticulture crops wherein 47 family representatives [23.86 percent] took part in vocational training. Marginal number of families attended the training programmes relating to livestock and dairying, fisheries, training of rural youth and agroforestry – the aggregate percentage of which is 7.61 to total responding families. On the subject of organic farming 24 families [12.18 percent] have responded to various vocational training programmes which is a positive indications that shows the awareness towards such activities. Similarly the response of 20 families [10.15 percent] towards watershed activities is indicative of the fact that villagers are becoming aware of the importance of water conservation. The maximum respone for subject on home science is mainly due to the availability of ready market at Indore city.
FRONT LINE DEMONSTRATION 5.138 The main objective of the front line demonstration is to demonstrate newly released crop
production and protection technologies and its management practices in the farmer’s fields. However, in front line demonstrations, the interactions regarding home science activities, training of rural youth and all the other items as specified for vocational training are done to educate and support the farmers for augmentation of income. The table below shows the details;

212
Table No. 5.51 Subjects of Training Received – Front Line Demonstration
Subject On Which Training Received S. No
Name of The Village No. of Responden
ts Crop Prod Agronomy
Horticulture Live Stock
Dairying Poultry
Fisheries
1 2 3 4 5 6 7 1 Mali Badodia(Indore) 18 18 3 0 0 2 Indira Gram (Mahu) 12 12 12 0 0 3 Gaginda (Mahu) 9 8 4 0 0 I Adopted Villages 39 38 19 0 0 4 Phool Karari (Indore) 0 0 0 0 0 5 Bari Kalmer (Indore) 1 1 0 0 0 6 Jag Jeewan Gram (Mahu) 1 1 0 0 0 7 Nehru Van Gram (Mahu) 1 1 0 0 0 8 Sendal (Mahu) 2 2 0 0 0 9 Mendal (Mahu) 3 3 0 0 0 II Cluster Villages 8 8 0 0 0 Total All Villages 47 46 19 0 0
Table No. 5.51[Contd…]
Subjects of Training Received – Front Line Demonstration Subject On Which Training Received S.
No. Name of The Village
Home Science
Training of Rural Youth
Agro Forestry
Organic Farming
Water Shed
Activities 1 2 8 9 10 11 12 1 Mali Badodia (Indore) 0 0 0 0 0 2 Indira Gram (Mahu) 0 0 0 0 0 3 Gaginda (Mahu) 0 0 0 0 0
I Adopted Villages 0 0 0 0 0 4 Phool Karari (Indore) 0 0 0 0 0 5 Bari Kalmer (Indore) 0 0 0 0 0 6 Jag Jeewan Gram (Mahu) 0 0 0 0 0 7 Nehru Van Gram (Mahu) 0 0 0 0 0 8 Sendal (Mahu) 0 0 0 0 0 9 Mendal (Mahu) 0 0 0 0 0
II Cluster Villages 0 0 0 0 0 Total All Villages 0 0 0 0 0
5.139 The above table shows that out of total number of 197 responding families 47 households
i.e. 23.86 percent to total households have responded to front line demonstrations, out of which in agronomical activities, 46 family respresentatives have taken part in various vocational trainings, followed by horticulture related activities where 19 family representatives have participated in vocational training organised by the K.V.K. A total gap in participation on subjects like livestock and dairying, fisheries, agro-forestry, organic farming and watershed activities shows that cultivators are basically interested in enhancing their agriculture related productivity with basic understanding that once the income from agriculture is enhanced the other activities allied to agriculture will gradually develop.

213
ON FARM TESTING 5.140 In this practice the farmers participate in identifying problems and priorities and managing
experiment and evaluating results. It is, therefore, an adaptive research with farmers perspective. The basic objective of on farm testing is to identify existing inputs or practices that might help to solve major problems of many farmers in a defined study area. The table below shows the details;
Table No. 5.52
Subjects of Training Received – On Farm Testing Subject On Which Training Received S.
No. Name of The Village No. of
Respondents Crop Prod Agronomy
Horticulture
Live Stock
Dairying Poultry
Fisheries
1 2 3 4 5 6 7 1 Mali Badodia (Indore) 4 4 0 0 0 2 Indira Gram (Mahu) 3 3 0 0 0 3 Gaginda (Mahu) 4 4 0 0 0 I Adopted Village 11 11 0 0 0 4 Phool Karari (Indore) 0 0 0 0 0 5 Bari Kalmer (Indore) 0 0 0 0 0 6 Jag Jeewan Gram
(Mahu) 0 0 0 0 0
7 Nehru Van Gram (Mahu)
0 0 0 0 0
8 Sendal (Mahu) 0 0 0 0 0 9 Mendal (Mahu) 0 0 0 0 0 II Cluster Village 0 0 0 0 0 Total All Villages 11 11 0 0 0
Table No. 5.52 [Contd…]
Subjects of Training Received – On Farm Testing Subject On Which Training Received S.
No. Name of The Village
Home Science
Training of Rural Youth
Agro Forestry
Organic Farming
Water-shed
Activities1 2 8 9 10 11 12 1 Mali Badodia (Indore) 0 0 0 0 0 2 Indira Gram (Mahu) 0 0 0 0 0 3 Gaginda (Mahu) 0 0 0 0 0 I Adopted Village 0 0 0 0 0 4 Phool Karari (Indore) 0 0 0 0 0 5 Bari Kalmer (Indore) 0 0 0 0 0 6 Jag Jeewan Gram (Mahu) 0 0 0 0 0 7 Nehru Van Gram (Mahu) 0 0 0 0 0 8 Sendal (Mahu) 0 0 0 0 0 9 Mendal (Mahu) 0 0 0 0 0 II Cluster Village 0 0 0 0 0 Total All Villages 0 0 0 0 0

214
5.141 The above table shows that out of the total of 197 responding families, only 11 households [5.58%] have responded to the programme. A large participation is not also expected as only bigger cultivators can afford getting such activity organised on the ir field.
5.142 A complete absence of participation in most of the subjects is visualized except on the
subject of crop production where cent-percent participation has been reported. 5.143 The basic facts as revealed by above narration are that most of the cultivators are
interested in training programmes relating to crop production, horticulture, home science and watershed activities which have direct relevance to their income. Livestock and poultry activities and fisheries are the areas where the villagers have hardly any interest.
IMPACT OF K.V.K. 5.144 In the foregoing paragraphs the analysis of subject wise training received was presented. In
what follows an attempt has been made to present the impact of individual items of training in the broad categories of;
- Vocational Training - Front Line Demonstration - On Farm Testing
both before and after training [BT, AT] situations. This is the most important part of the report that clearly indicates the impact of K.V.Ks. intervention on agronomy, horticulture, livestock and dairying, fisheries, home science etc.
VOCATIONAL TRAINING – AGRONOMY - CEREALS 5.145 The table below shows the impact of K.V.K’s. intervention over cereal crops;
Table No. 5.53 Agronomy – Cereals
Yield Per- Hectare - Kg. Wheat Paddy
S.No. Name Of The Village
No. Of Respondents
BT AT No. Of Respondents
BT AT
1 2 3 4 5 6 7 8 1 Mali Badodia (Indore) 20 3735 4210 0 0 0 2 Indira Gram (Mahu) 12 2798 3425 0 0 0 3 Gaginda (Mahu) 26 3120 3295 0 0 0
I Adopted Village 58 4 Phool Karari (Indore) 3 3667 4300 0 0 0 5 Bari Kalmer (Indore) 5 3580 4280 0 0 0 6 Jag Jeewan Gram (Mahu) 3 3433 4167 0 0 0 7 Nehru Van Gram (Mahu) 5 3400 4120 0 0 0 8 Sendal (Mahu) 11 3609 4245 0 0 0 9 Mendal (Mahu) 22 3750 3897 0 0 0
II Cluster Village 49 Total All Villages 107

215
Table No. 5.53 [Contd…] Agronomy – Cereals
Yield Per- Hectare - Kg. Maize Jowar
S. No.
Name of The Village
No. of Respondents
BT AT No. of Respondents
BT AT
1 2 9 10 11 12 13 14 1 Mali Badodia (Indore) 9 2033 2578 5 1020 1380 2 Indira Gram (Mahu) 0 0 0 1 0 2100 3 Gaginda (Mahu) 15 1840 1987 23 1109 2427
I Adopted Villages 24 29 4 Phool Karari (Indore) 0 0 0 0 0 0
5 Bari Kalmer (Indore) 0 0 0 0 0 0
6 Jag Jeewan Gram (Mahu)
0 0 0 0 0 0
7 Nehru Van Gram (Mahu)
0 0 0 0 0 0
8 Sendal (Mahu) 1 2000 2700 0 0 0 9 Mendal (Mahu) 19 1874 2111 10 920 1320 II Cluster Villages 20 10 Total All Villages 44 39
5.146 For Indore district wheat is the important crop followed by maize and jowar. 5.147 Regarding wheat crop the responding family representatives are 107 which is 54.31
percent to total 197 number of responding families who have shown interest in vocational training regarding wheat crop. The yield per hectare in before training situations [B.T.] ranged between 2798 kg per hectare for village Indira Gram [adopted village] to 3750 kg/ha for village Mendal [cluster village] which are more than the district level and State level per hectare yields of 2698 kg and 1867 kg respectively. The after training [A.T.] scenario is much better wherein the per hectare yield ranged between 3295 kg per hectare for village Gaginda [adopted village] to 4300 kg per hectare for village Phool Karari [cluster village] – obviously much higher than the district and State average per hectare yield rates. The above fact clearly indicates the positive effects of vocational training imparted by the K.V.K. over the wheat crop.
5.148 Regarding paddy crop no vocational training has been organised as the paddy is the least
important crop of Indore district. 5.149 Regarding maize, though not important crop of Indore district, 44 number of families [22.34
percent] have participated in the vocational training programme with yield rates in B.T. situations ranging between 1840 kg per hectare for village Gaginda [adopted village] to 2023 kg, for village Mali Badodia [adopted village]. In AT situations the yield per hectare is much higher than B.T. situations, ranging between 2111 kg per hectare for village Mendal [cluster village] to 2700 kg for village Sendal [cluster villages] higher than district and state average figures of 1525 kg and 2072 kg respectively. The positive impact of the K.V.Ks. intervention is, thus, obvious.

216
5.150 Jowar again is not important crop of Indore district whereing 39 family representatives have taken part in vocational training from four number of villages with productivity in AT situations better than B.T. situations that ranged between 1320 kg per hect for village Mendal [cluster village] to 2427 kg for village Gaginda [adopted village] which are better than district and state average figures of 1354 kg and 1342 kg per hectare respectively far most of the villages.
VOCATIONAL TRAINING – AGRONOMY – PULSES 5.151 The table below shows the details
Table No. 5.54 Agronomy – Pulses
Yield Per- Hectare - Kg. Gram Arhar Lentil
S. No
Name of The Village
No. of Respondents
BT AT No. of
Respondent
s
BT AT No. of Respondents
BT AT
1 2 3 4 5 6 7 8 9 10 11 1 Mali Badodia
(Indore) 17 980 1005 10 1225 1310 0 0 0
2 Indira Gram(Mahu) 5 985 1008 0 0 0 1 0 1005 3 Gaginda (Mahu) 10 998 1110 20 981 1410 0 0 0
I AdoptedVillages 32 30 1 0
4 Phool Karari (Indore) 2 1005 1115 0 0 0 0 0 0
5 Bari Kalmer (Indore) 4 988 1120 0 0 0 0 0 0
6 Jag Jeewan Gram (Mahu)
3 1002 1121 0 0 0 0 0 0
7 Nehru Van Gram (Mahu)
2 988 1110 2 1000 1500 0 0 0
8 Sendal (Mahu) 4 991 1125 2 1200 1600 0 0 0 9 Mendal (Mahu) 16 1002 1131 16 1569 1894 0 0 0
II Cluster Villages 31 20 0 0 0
Total All Villages 63 50 1 0

217
5.152 In pulses group gram and arhar are the important crops of Indore district. Regarding Gram, against the total of 197 households, 63 households [31.98 percent] have participated in vocational training. The after training performance that resulted in per hectare yield ranging between 1005 kg for village Mali Badodia [adopted village] to 1131 kg for village Mendal [cluster village] is much higher than district and State average figures of 920 kg and 932 kg per hectare respectively.
5.153 Regarding Arhar crop, 50 households [25.38 percent] have responded to vocational training
which is reflected in enhanced productivity in after training situations that ranged between 1310 kg per hectare for village Mali Badodia [adopted village] to 1894 kg for village Mendal [cluster village] far above than district and state average productivity of 656 kg and 825 kg per hectare respectively.
5.154 Lentil being one of the minor crops of Indore district as only one household from village
Indira Gram [adopted village] has participated in the vocational training programme with per hectare yield of 1005 kg in AT situation which is higher than district level per hectare yield of 361 kg and state level per hectare yield of 506 kg.
VOCATIONAL TRAINING – AGRONOMY – OIL SEEDS 5.155 The table below shows the details;
Table No. 5.55 Agronomy – Oil Seeds
Yield Per- Hectare - Kg. Soyabeen Mustard
S.No. Name of The Village
No. of Responde
nts
BT AT No. of Responden
ts
BT AT
1 2 3 4 5 6 7 8 1 Mali Badodia (Indore) 20 1008 1184 0 0 0 2 Indira Gram (Mahu) 11 1121 1198 0 0 0 3 Gaginda (Mahu) 26 1005 1178 1 0 1700 I Adopted Village 57 1 0 0 4 Phool Karari (Indore) 3 1009 1127 0 0 0
5 Bari Kalmer (Indore) 5 1400 1197 0 0 0 6 Jag Jeewan Gram (Mahu) 2 1006 1181 0 0 0 7 Nehru Van Gram (Mahu) 6 1110 1189 0 0 0 8 Sendal (Mahu) 8 1006 1179 0 0 0 9 Mendal (Mahu) 24 1003 1189 0 0 0 II Cluster Village 48 0 0 0 Total All Villages 105 1 0 0

218
5.156 Soybean being important crop of Indore district, 105 number of families constituting 53.30 percent to total of 197 responding families have participated in vocational training. For every village the status of productivity in after training situation is better than before training position that shows the positive impact of vocationa training programme organised by K.V.K. The per-hectare yield in after training situation ranged between 1127 kg per hectare in village Phool Karari [cluster village] to 1198 for village Indira Gram [adopted village] which are higher than the district and state average figures of 1070 kg and 1132 kg per hectare respectively.
5.157 Regarding Mustard crop only one household from village Gaginda [adopted village]
took part in vocational training programme resulting in the yield rate of 1700 kg per hectare in after tra ining situation which is higher than district and state average figures of 925 kg and 1009 kg per hectare respectively.
5.158 The participation of households for receiving training on crops like cotton, sugarcane,
linseed is nil that clearly indictes the lack of interest of cultivators of Indore district in pursuing the cultivation of these crops.
HORTICULTURE 5.159 Horticulture crops are important from the view points of employment generation, checking
of soil erosion and providing high density green cover to the soil. Being tough, many of these crops may be successfully grown on waste land not suitable for traditional crop cultivation. The table below shows the status of horticulture crop production in the sample area of our study;
Table No. 5.56
Horticulture Crops Yield Per- Hectare - Quintal
Potato Onion S.No
. Name of The Village
No. of Respond
ents
BT AT No. of Respondents
BT AT
1 2 3 4 5 6 7 8 1 Mali Badodia (Indore) 6 223 277 0 0 0 2 Indira Gram (Mahu) 4 193 265 1 200 270 3 Gaginda (Mahu) 2 230 295 5 180 210 I Adopted Villages 12 6
4 Phool Karari (Indore) 2 220 280 0 0 0 5 Bari Kalmer (Indore) 2 215 300 1 200 260 6 Jag Jeewan Gram
(Mahu) 0 0 0 1 230 270
7 Nehru Van Gram (Mahu) 0 0 0 1 220 280 8 Sendal (Mahu) 0 0 0 1 210 280 9 Mendal (Mahu) 2 220 290 0 0 0 II Cluster Villages 6 4
Total All Villages 18 10

219
Table No. 5.56 [Contd…] Horticulture Crops
Yield Per- Hectare - Quintal Tomato Brinjal
S. No.
Name of The Village
No. of Respondents
BT AT No. of Respondents
BT AT
1 2 9 10 11 12 13 14 1 Mali Badodia(Indore) 4 115 186 2 125 201 2 Indira Gram (Mahu) 8 198 210 5 140 208 3 Gaginda (Mahu) 4 210 248 5 133 235 I Adopted Village 16 62 2520 12 4 Phool Karari (Indore) 3 190 225 1 210 230 5 Bari Kalmer (Indore) 3 193 233 3 180 231 6 Jag Jeewan Gram (Mahu) 0 0 0 1 137 208 7 Nehru Van Gram (Mahu) 1 180 240 0 0 0 8 Sendal (Mahu) 2 205 240 3 171 225 9 Mendal (Mahu) 6 198 243 5 151 227 II Cluster Village 15 13 Total All Villages 31 25
Table No. 5.56 [Contd…]
Horticulture Crops Yield Per- Hectare - Kg.
Chilly Bhindi Spices S. No
Name of The Village
No. of Respondents
BT AT No. of
Respondents
BT AT No. of Respondents
BT AT
1 2 15 16 17 18 19 20 21 22 23 1 Mali Badodia
(Indore) 1 220 270 6 105 190 0 0 0
2 Indira Gram(Mahu) 2 205 235 1 100 120 0 0 0
3 Gaginda (Mahu) 0 0 0 5 98 135 0 0 0 I AdoptedVillages 3 12 0 0 0
4 Phool Karari (Indore)
0 0 0 0 0 0 0 0 0
5 Bari Kalmer (Indore)
0 0 0 2 110 171 0 0 0
6 Jag Jeewan Gram (Mahu)
0 0 0 0 0 0 0 0 0
7 Nehru Van Gram (Mahu)
0 0 0 0 0 0 0 0 0
8 Sendal (Mahu) 0 0 0 2 115 178 1 80 84 9 Mendal (Mahu) 0 0 0 3 117 181 0 0 0
II Cluster Villages 0 0 0 7 1
Total All Villages 3 0 0 19 1

220
5.160 The above table shows that in case of Potato 18 number of families have participated in the vocational training which is 9.14 percent to total of 197 responding families. For every village the per-hectare yield in after training situation is higher than before training conditions that ranged between 277 quintal per hectare for village Mali Badodia [adopted village] to 300 quintal per hectare for Bari Kalmer [cluster village]. These yield rates are much higher than the State average figure of 119 quintal per hectare. The positive impact of the efforts of the K.V.K., is, thus, obvious.
5.161 Regarding Onion, 10 number of households [5.08 percent] have responded to the vocational
training, resulting in enhanced per-hectare yield in after training situations as compared to before training conditions that ranged between 210 quintal per-hectare for Gaginda [adopted village] to 280 quintal per hectare for villages Nehru-Van-Gram and Sendal [both cluster villages] which are much higher than State average figure of 140 quintal per hectare.
5.162 Tomato is yet another crop which is gradually picking-up at Indore as 31 families have
participated in the vocational training constituting 15.74 percent to total of 197 families. The yield rates in after training conditions are higher than before training situations that ranged between 186 quintal per hectare for village Mali Badodia [adopted village] to 248 quintal per-hectare for village Gaginda [adopted village].
5.163 Brinjal too is a crop getting popular at Indore as 25 number of families [12.69 percent] have
shown interest in training programme, the positive effects of which have been reflected in the form of enhanced per-hectare yield in after training situations as compared to before training conditions that ranged between 201 quintal per-hectare for village Mali Badodia [adopted village] to 235 quintal per-hectare for village Gaginda [adopted village].
5.164 For Chilly crop, only 3 families from two villages viz Mali Badodia and Indira Gram [both
adopted villages] have taken part in vocational training with yield rates higher in after training conditions as compared to before training situations.
5.165 Similarly for Bhindi crop, 19 number of families [9.64 percent] have taken part in
vocational training programme from six number of villages resulting in enhanced productivity in after training situations as compared to before training status that ranged between 120 quintal per-hectare for village Indira Gram [adopted village] to 181 quintal per-hectare for village Mendal [cluster village].
5.166 As regards Spices crops, only one household from village Sendal [cluster village] has taken
part in the vocational training programme resulting in enhanced output per hectare in after training conditions as compared to before training situations.
5.167 For crops like Cucerbits, Mango, Banana, Papaya and Citrus no vocational training
programmes have been organised as the cultivators were not interested in producing such crops.
VOCATIONAL TRAINING – LIVESTOCK AND DAIRY 5.168 Though these functions are important from the view points of both income augmentation
and diversification of agriculture for reducing pressure on land in rural areas but in general such functions are not taken-up on viable scale with proper organizational skill as is evident from the information contained in the following table;

221
Table No. 5.57 Live Stock and Dairying
Milk production (Liters) Artificial insemination
N0. of animals
S. No.
Name of Village
No. of Respond
ents
BT AT No. of Respond
ents
BT AT
1 2 3 4 5 6 7 8 1 Mali Badodia (Indore) 2 11 17 2 0 7 2 Indira Gram (Mahu) 0 0 0 0 0 0 3 Gaginda (Mahu) 0 0 0 0 0 0
I Adopted Village 2 0
4 Phool Karari (Indore) 0 0 0 0 0 0
5 Bari Kalmer (Indore) 0 0 0 0 0 0 6 Jag Jeewan Gram
(Mahu) 0 0 0 0 0 0
7 Nehru Van Gram (Mahu)
0 0 0 0 0 0
8 Sendal (Mahu) 0 0 0 0 0 0 9 Mendal (Mahu) 0 0 0 0 0 0 II Cluster Village 0 0 0 0 0 0 Total All Villages 2 11 17 2 0
Table No. 5.57 [Contd…] Live Stock and Dairying
Improved feeding management
Vaccination No. S. No
Name of Village
No. of Respond
ents
Yes No No. of Respond
ents
BT AT
1 2 9 10 11 12 13 14 1 Mali Badodia (Indore) 2 2 2 0 6 2 Indira Gram (Mahu) 0 0 0 0 0 0 3 Gaginda (Mahu) 0 0 0 0 0 0 I Adopted Village 2 0 2 0
4 Phool Karari (Indore) 0 0 0 0 0 0
5 Bari Kalmer (Indore) 0 0 0 0 0 0 6 Jag Jeewan Gram (Mahu) 0 0 0 0 0 0 7 Nehru Van Gram (Mahu) 0 0 0 0 0 0 8 Sendal (Mahu) 0 0 0 0 0 0 9 Mendal (Mahu) 0 0 0 0 0 0 II Cluster Village 0 0 0 0 0 0
Total All Villages 2 2 0 2 0 6 5.169 The above table shows that a total of 8 households have taken part in various functions of
livestock and dairy activities constituting 1.06 percent to total of 197 households which is far from being encouraging.

222
5.170 For milk production activities only two family representatives from village Mali Badodia [adopted village] have participated in training programme resulting in slight enhancement of milk production in after training situations.
5.171 Similarly for artificial insemination two number of families from village Mali Badodia
[adopted village] have taken part in vocational training resulting in insemination of 7 number of animals in after training situations.
5.172 Regarding improved feeding management again two number of families from village Mali
Badodia [adopted village] have adopted improved feeding management practices. 5.173 Similarly for vaccination of livestock two family representatives from village Mali Badodia
[adopted village] have taken part in vocational training leading to vaccination of 6 number of livestock in after training situation.
5.174 The conclusion that can be drawn from above narration is that the livestock and dairy
activities though important functions, are not popular in our sample area of study mainly because of the paucity of expert services and lack of road connectivity hampering the marketing of the product.
VOCATIONAL TRAINING – HOME SCIENCE 5.175 Vocational training in Home Science activities like toy making, preparation of pickles and
jute items, preparation of papad/bari/jam/jelly etc. are important from both income support and employment generation point of views engaging women and old people in rural areas. The table below shows the details;
Table No. 5.58
Home Science Activities
Pickle, Kg. Backery, Kg. Papad/Badi/Jam/Jelly, Kg.
S. No
Name of The Village
No. of Respondents
BT AT No. of
Respondents
BT AT No. of Respond
ents
BT AT
1 2 3 4 5 6 7 8 9 10 11 1 Mali Badodia (Indore) 20 14 76 0 0 0 16 1 39 2 Indira Gram(Mahu) 12 5 37 1 4 0 12 0 20 3 Gaginda (Mahu) 23 14 96 0 0 0 19 2 48
I AdoptedVillages 55 33 209 1 4 0 47 3 107
4 Phool Karari (Indore) 19 3 69 1 5 0 19 5 56 5 Bari Kalmer (Indore) 23 5 77 0 0 0 23 5 63
6 Jag Jeewan Gram (Mahu)
12 21 60 0 0 0 4 0 8
7 Nehru Van Gram (Mahu)
13 17 63 0 0 0 0 0 0
8 Sendal (Mahu) 28 23 101 0 0 0 19 2 38 9 Mendal (Mahu) 40 13 110 0 0 0 37 5 85
II Cluster Villages 135 82 480 1 5 0 102 17 250
Total All Villages 190 115 689 2 9 0 149 20 357

223
5.176 Preparation of Pickles is an item getting popular in rural areas as 190 number of family representatives have taken part in the vocational training constituting 96.45 percent of total of 197 responding families with production of 689 kgs of pickle in after training situation as compared to 115 kgs of pickle in before training conditions. The impact of K.V.Ks. effort is clearly visible.
5.177 Regarding preparation of backery items which is not very popular in our sample area of
study, only 2 number of households from villages Indira Gram [adopted village] and Phoot Karari [cluster village] have taken part in vocational training with nil production in after training situation that clearly shows the lack of interest of sample household in pursuing such occupation.
5.178 Regarding preparation of paper/badi/jam/jelly etc., which is becoming popular activity
in rural area of our study mainly due to portability of the product, 149 household [75.63 percent] have taken part in vocational training organised by the K.V.K. with production of 357 kg in after training situation as compared to only 20 kg in before training conditions that underlines the positive impact of the K.V.Ks. efforts.
VOCATIONAL TRAINING – ORGANIC FARMING 5.179 The table below shows the details;
Table No. 5.59 Organic Farming Compost by NADEP
method (Nos.) Bio-pesticide, Liter S.
No. Name of The Village
No. of Respondents
BT AT No. of Respondents
BT AT
1 2 3 4 5 6 7 8 1 Mali Badodia (Indore) 5 0 5 0 0 0 2 Indira Gram(Mahu) 0 0 0 0 0 0 3 Gaginda (Mahu) 0 0 0 0 0 0 I Adopted Village 5 0 5 0 0 0
4 Phool Karari (Indore) 0 0 0 0 0 0
5 Bari Kalmer (Indore) 0 0 0 0 0 0 6 Jag Jeewan Gram (Mahu) 0 0 0 0 0 0 7 Nehru Van Gram (Mahu) 0 0 0 0 0 0 8 Sendal (Mahu) 0 0 0 0 0 0 9 Mendal (Mahu) 1 0 1 1 0 8 II Cluster Village 1 0 1 1 0 8 Total All Villages 6 0 6 1 0 8
5.180 The practice of organic farming is gradually picking up in our area of study as 6 number of households from villages Mali Badodia [adopted village] and Mendal [cluster village] have participated in the training programme relating to preparation of compost by NADEP method with construction of 6 numbers of NADEP structure in after training situation as compared to nil performance in before training conditions.
5.181 Regarding preparation of bio-pesticide only one household from village Mendal [cluster
village] has taken part in the training with production of 8 liters of bio-pesticide in after training situation as compared to nil performance in before training conditions.

224
5.182 Normally the organic farming practices are followed either by government farms or big cultivators, therefore extensive response for this practice can not be expected. A beginning has already been done in our sample area of study which perhaps, will pick-up popularity in due course.
5.183 No vocational training has been organised on subjects like poultry and fishery
development training of rural youth, agro forestry and watershed activities which are important functions from the view point of income augmentation in rural areas.
5.184 In the following paragraphs an attempt has been made to sum-up the efforts of vocational
training imparted by the K.V.K. - Regarding the yield per hectare both for agronomical and horticutlral crops the after
training situation is better than before training conditions that clearly shows the positive impact of vocational training imparted by the K.V.K.
- In case of wheat crop where the response is 54.31 percent to total of 197 responding families wherein the per hectare yield for all the 9 number of villages in after training situation is better than before training conditions and more than district and state average yield rates for both in BT and AT conditions.
- Regarding maize crop where the participation is 22.34 percent to total responding families the yield per hectare is much higher than the district and state averages.
- Jowar, though not important crop of Indore district, the percentage participation in vocational training is 19.80 percent to total of 197 responding families with productivity in after trainig situation higher than district and state average per hectare yields.
- Regarding gram crop, 31.98 percent households have participated in vocational training programme, the yield per hectare in after training situation is higher than average productivity of district and state levels.
- Similarly regarding Arhar crop wherein 25.38 percent households have responded to vocational training, the per hectare yield in after training situation is far above than district and state average productivity.
- Lentil being one of the minor crops of Indore district only one household has participated in vocational training programme with per hectare yield higher than district and state averages in after training situation.
- Soybean being important crop of Indore district wherein 53.30 percent households have participated in vocational training with yield per hectare higher than district and state average productivity in after training situations.
- Regarding Mustard crop only one household has participated in the training from village Gaginda [adopted village] with yield rates higher than district and state average productivity in after training situation.
- The participation of households for receiving training on crops like cotton, sugarcane, linseed is nil.
- In the group of horticulture crop, production of potato is important, accounting for the involvement of 9.14 percent households with productivity higher than district and state average productivity in after training situations.
- Other important horticulture crops of the district are Onion, Tomato, Brinjal and Bhindi wherein 5.08 percent, 15.74 percent, 12.69 percent and 9.64 percent households respectively have participated in vocational training with the yield rates much higher in after training situations as compared to before training conditions. An intensive effort is, perhaps required to persuade the cultivators to take-up cultivation of horticulture on bigger scale as these crops give income support to families.

225
- A total of only 8 households have taken part in various activities relating to livestock and dairying with hardly any performance in after training situations. These activities being important factors of income augmentation in rural areas, more efforts are required by the K.V.K. functionaries to popularize these occupations.
- For home science the important constituents are preparation of pickles and papad/bari/jam/jelly etc. wherein 96.45 percent and 75.63 percent households respectively have participated in vocational training with good performance in after training conditions. Such activities, if encouraged more may enhance family income to startling limits.
- Organic farming is one area which is gradually picking-up in our area of study. However, a leap forward is not expected as the activities relating to orgnic farming are more concerned with big cultivators.
- No vocational training has been organised on subjects like poultry and fishery development, training of rural youth, agro-forestry and watershed activities which are important functions from the view point of income augmentation in rural areas.
- The impact of the efforts of Krishi Vigyan Kendra is assessed through results of various vocational training programmes, front line demonstration and on farm testing. If on any subject the trainings and demonstrations have not been arranged, the impact will not be visible. For example since the vocational training on subjects like poultry and fishery development, training of rural youth, agro-forestry and watershed activities have not been organised then the impact of these subjects will not be visible. Therefore, the impact of rain water conservation, water management, reclamation/ restoration of degraded soils/lands and degree of adoption for non-land based enterprises will not be reflected.
FRONT LINE DEMONSTRATION – AGRONOMY CEREALS 5.185 Front line demonstrations [FLD] are organized on farmer’s field with the result the response
is bound to be low as compared to vocational training. The table below shows the impact of front line demonstrations on cereal crops.
Table No. 5.60
Agronomy – Cereals Name of The Village Yield Per- Hectare - Kg.
Wheat Maize S. No
No. of Respon-
dents BT AT
No. of Respon-
dents BT AT
1 Mali Badodia (Indore) 14 3543 4286 0 0 0 2 Indira Gram (Mahu) 12 3650 4058 0 0 0 3 Gaginda (Mahu) 3 3667 4433 1 1700 2400
I Adopted Village 29 1 4 Phool Karari (Indore) 0 0 0 0 0 0
5 Bari Kalmer (Indore) 1 3400 4500 0 0 0 6 Jag Jeewan Gram (Mahu) 1 3500 4400 0 0 0 7 Nehru Van Gram (Mahu) 1 3400 4200 0 0 0 8 Sendal (Mahu) 0 0 0 0 0 0 9 Mendal (Mahu) 1 3500 4400 0 0 0
II Cluster Village 4 0 0 0
Total All Villages 33 1

226
5.186 The front line demonstrations for the wheat crop have been organized on the fields of 33 cultivators which is 16.75 percent to total of 197 responding families. The per hectare yield in after training situation is much higher than before training conditions that ranged between 4200 kg. per hectare for the village Nehru Van Gram [cluster village] to 4500 kg per hectare for village Bari Kalmer [cluster village] far in excess of district average of 2698 kg and state average of 1867 kg. The positive impact of the efforts of K.V.K. is clearly visible.
5.187 Regarding Maize crop only one demonstration has been organised in village Gaginda
[adopted village] with per hectare yield of 2400 kg in after training situation which is not only higher than the productivity in before training situation but in excess of district and state average productivities of 1525 kg and 2072 kg per hectare respectively. However matching to vocational training, a few more F.L.Ds. should have been organised.
5.188 No F.L.Ds. have been organised for crops like paddy and Jowar. Paddy being an
unimportant crop of Indore district the lack of response seems natural but for Jowar crop, usually grown by poor cultivators, the F.L.Ds. should have been organised as the response to vocational training for this crop is quite satisfactory.
AGRONOMY - PULSES 5.189 The table below shows the details;
Table No. 5.61
Agronomy – Pulses Yield Per- Hectare - Kg.
Gram Arhar S. No
Name of The Village
No. of Respondents BT AT No. of
Respondents BT AT
1 Mali Badodia (Indore) 5 1420 1800 1 1100 1500 2 Indira Gram (Mahu) 6 1300 1366 1 1600 1700 3 Gaginda (Mahu) 1 1200 1700 1 1400 1800
I Adopted Village 12 3
4 Phool Karari (Indore) 0 0 0 0 0 0 5 Bari Kalmer (Indore) 0 0 0 0 0 0 6 Jag Jeewan Gram (Mahu) 0 0 0 0 0 0 7 Nehru Van Gram (Mahu) 0 0 0 0 0 0 8 Sendal (Mahu) 0 0 0 0 0 0 9 Mendal (Mahu) 0 0 0 0 0 0
II Cluster Village 0 0 0 0 0 0
Total All Villages 12 3 5.190 Gram being one of the important crops of Indore district, 12 number of front line
demonstration [F.L.Ds.] have been organised [all in adopted villages] which is 6.09 percent to total of 197 responding families with better performance in after training situation as compared to before training conditions. The per hectare yield in after training situation ranged between 1366 for Indira Gram [adopted village] to 1800 kg for Mali Badodia [adopted village] which are higher than the district average productivity figure of 920 kg and similar state level figure of 932 kg. The remarkable feature that may be noted is that compared to vocational training, the per hectare yield in after training situation in case of F.L.D. areas is higher that again shows the positive effect of F.L.Ds. However a few F.L.Ds. should have been organised for cluster villages as well for wider impact of F.L.D. activities.

227
5.191 Regarding Arhar crop only 3 number of F.L.Ds. have been organised [all in adopted villages] resulting in crop productivity which is higher in after training situation as compared to before training conditions and far in excess of average district and state level productivity per hectare accounting for 656 kg and 825 kg respectively. Here again the yield per hectare for F.L.D. areas in after training situation is higher than the villages where vocational trainings have been organised. However for Arhar crops also, a few F.L.Ds. should have been organised for cluster villages as well for wider impact.
AGRONOMY – OIL SEEDS 5.192 The table below shows the details;
Table No. 5.62
Agronomy – Oil Seeds Yield Per- Hectare - Kg. -Soybean Sl.
No. Name of the Village
No. of Respondents BT AT 1 Mali Badodia (Indore) 5 1225 1560 2 Indira Gram (Mahu) 12 1193 1914 3 Gaginda (Mahu) 2 1149 1971 I Adopted villages 19 4 Phool Karari (Indore) 0 0 0
5 Bari Kalmer (Indore) 0 0 0 6 Jag Jeewan Gram (Mahu) 0 0 0 7 Nehru Van Gram (Mahu) 0 0 0 8 Sendal (Mahu) 2 1189 2014 9 Mendal (Mahu) 2 1210 1981 II Cluster villages 4
Total all villages 23 5.193 Soybean being one of the important crops of Indore district, the number of 23 F.L.Ds. [11.68
percent to total of 197 responding families] have been organised with yield rates ranging between 1560 kg per hectare for village Mali Badodia [adopted village] to 2014 kg per hectare for village Sendal [cluster village] in after training situations which are far ahead of district average productivity of 1070 kg and state average productivity of 1132 kg. Again the yield per hectare of F.L.D. areas in after training situation is higher than the villages where vocational trainings have been organised.
- No FLDs have been organized for crops like Mustard, Cotton, Sugarcane and Linseed as
these crops are not important for Indore district. HORTICULTURE 5.194 The table below shows the details;

228
Table No. 5.63 Horticulture Crops
Yield Per- Hectare - Quintal Tomato Brinjal
S.No.
Name of The Village
No. of Respondents
BT AT No. of Respondents
BT AT
1 Mali Badodia (Indore) 2 190 240 1 180 270 2 Indira Gram (Mahu) 7 140 221 5 176 257 3 Gaginda (Mahu) 3 213 253 2 190 290
I Adopted Village 12 8 176 257 4 Phool Karari (Indore) 0 0 0 0 0 0 5 Bari Kalmer (Indore) 0 0 0 0 0 0 6 Jag Jeewan Gram
(Mahu) 0 0 0 0 0 0
7 Nehru Van Gram (Mahu) 0 0 0 0 0 0 8 Sendal (Mahu) 0 0 0 0 0 0 9 Mendal (Mahu) 0 0 0 0 0 0
II Cluster Village 0 0 0 0
Total All Villages 12 8
Table No. 5.63 [Contd…] Horticulture Crops
Chilli Bhindi Cucerbits
S. No
Name of The Village
No. of Respondents
BT AT No. of
Respondents
BT AT No. of Respond
ents
BT AT
1 Mali Badodia (Indore) 0 0 0 1 100 120 0 0 0 2 Indira Gram(Mahu) 2 205 235 0 0 0 0 0 0 3 Gaginda (Mahu) 1 220 248 0 0 0 1 100 120
I AdoptedVillages 3 1 1
4 Phool Karari (Indore) 0 0 0 0 0 0 0 0 0 5 Bari Kalmer (Indore) 0 0 0 0 0 0 0 0 0 6 Jag Jeewan Gram
(Mahu) 0 0 0 0 0 0 0 0 0
7 Nehru Van Gram (Mahu)
0 0 0 0 0 0 0 0 0
8 Sendal (Mahu) 0 0 0 0 0 0 0 0 0 9 Mendal (Mahu) 0 0 0 0 0 0 0 0 0
II Cluster Villages 0 0 0
Total All Villages 3 1 1
5.195 Tomato is one of the horticultural crops which is picking-up in Indore district as is evident from the fact that 12 number of F.L.Ds. have been organised all in adopted villages with productivity in after training situation higher than before training situation, having range distribution of 140 kg per hectare in village Indira Gram to 213 kg per hectare for village Gaginda. A few F.L.Ds. should have also been organised in cluster villages as well.

229
5.196 Regarding Brinjal crop, 8 number of F.L.Ds. have been organised in all the adopted villages with better performance in after training situations as compared to before training conditions. The yield rates in after training situations ranged between 257 kg per hectare for village Indira Gram to 290 kg per hectare for village Gaginda. However, a few F.L.Ds. should have been organised for cluster villages as well for wider positive impact.
5.197 Regarding Chilly crop only 3 F.L.Ds. have been organised in two adopted villages with
yield rates higher in after training situation as compared to before tratining conditions. 5.198 Similarly for crops like Bhindi and Cucerbits one each F.L.Ds. have been organised in
villages Mali Badodia and Gaginda respectively [both adopted villages] with yield rates per hectare higher in after training situation as compared to before training situations.
5.199 No F.L.Ds. have been organised for crops like Potato, Onion, Spices, Mango, Banana,
Papaya and Citrus crops. Potato and Onion being important crops from demand point of view, a few number of F.L.Ds. should have been organised. More over horticulture crops give income support to farming families with ready market that call for more training emphasis for these crops along with organisation of F.L.Ds.
5.200 Regarding subjects like livestock and dairying, poultry, fisheries development, home
science activities, agro-forestry, organic farming and watershed activities no F.L.Ds. have been organised. All the above mentioned activities are important for any rural economy, particularly the subjects like livestock, dairying and agro forestry and watershed activities are important from the view points of income augmentation and enhancement of agriculture production. F.L.Ds, therefore, should have been organised for such activities.
5.201 To sum-up - Front Line Demonstrations organised in our area of study has lead to enhancement in
productivity of most of the agronomical and horticultural crops in after training situations as compared to before training situations which show the positive impact of K.V.Ks. efforts.
- In case of wheat crop 33 number of F.L.Ds. have been organised that lead to productivity far excess of district and state average productivity, particularly in after training situations.
- Regarding Maize crop only one demonstration has been organised with per-hectare yield higher than district and state average productivity in after training situation.
- No F.L.Ds. have been organised for paddy and jowar crops. F.L.Ds. should have been organised for Jowar crop which is usually grown by poor cultivators and for which response regarding vocational training is satisfactory.
- As regards Gram crop 12 number of F.L.Ds. have been organised with better performance in after training situations that lead to higher productivity as compared to average productivity at district and state levels.
- Soybean being one of the important crops of Indore district, 23 F.L.Ds. have been organised with better performance in after training situations leading to higher yield per hectare as compared to district and state average productivity.
- Regarding horticultural crops like Tomato, Brinjal, Chilly, Bhindi and Cucerbits for which 12,8,3,1,1 number respectively of F.L.Ds. have been organised with better performance in after training situations as compared to before training conditions.

230
- No F.L.Ds. have been organised for crops like Potato, Onion, Spices, Mango, Banana, Papaya and Citrus crops. A few number of F.L.Ds. should have been organised for potato and onion being common items of consumption with ready market.
- No F.L.Ds. have been organised on subjects like livestock and dairying, poultry, fishery development, home science agro-forestry, organic farming and watershed activities which are important functions of any rural economy. F.L.Ds. should be organised on subjects like livestock and dairying, agro-forestry and watershed activities which have direct relevance to income augmentation and enhancement of agricultural production.
- Since F.L.Ds. are measures of learning by doing, more extensive implemention of this mandate must be attempted matching to vocational training. What is actually required is to plan out the F.L.Ds. much in advance in consultation with concerned district authorities of line departments like agriculture, horticulture and Chief Executive Officer of Zila Panchayat so that an understanding of State Plan priorities are reflected over such advance planning. The vocational training may thus be organised to provide a basic classroom knowledge regarding subjects on which F.L.Ds. are to be organised so that farmers are equipped with ready knowledge. After this step, the F.L.Ds. may be organised which will immensely help the cultivators to implement the technology.
- Since no F.L.Ds. have been organised on subjects like livestock and dairying, poultry, fishery development, agro-forestry, organic farming and watershed activities the impact F.L.D. for these subjects will not be visible.
ON FARM TESTING [OFT] - CEREALS 5.202 In case of On Farm Testing, recommended new technologies are tested on farmer’s fields
leading to the solution of group of farming problems. The extent of response is bound to be low as the new technologies are always limited in numbers.
5.203 The table below shows the details;
Table No. 5.64
Cereal Crops – Wheat Yield Per- Hectare - Kg. Sl.
No. Name of the Village
No. of Respondents BT AT 1 Mali Badodia (Indore) 1 4000 4500 2 Indira Gram (Mahu) 1 3600 4000 3 Gaginda (Mahu) 1 3600 4400 I Adopted villages 3
4 Phool Karari (Indore) 0 0 0 5 Bari Kalmer (Indore) 0 0 0 6 Jag Jeewan Gram (Mahu) 0 0 0 7 Nehru Van Gram (Mahu) 0 0 0 8 Sendal (Mahu) 0 0 0 9 Mendal (Mahu) 0 0 0 II Cluster villages 0
Total all villages 3
5.204 In case of Wheat, 3 number of on farm testing activities have been organised [all in adopted villages] with substantial yield per hectare in after training situation that ranged between 4000 kg per hectare for village Indira Gram to 4500 kg per-hectare for village Mali Badodia which are much higher than the district average per hectare productivity of 2698 kg and state average figure of 1867 kg.

231
5.205 In non-other cereal crops like Maize and Jowar the O.F.Ts. have been organised, which perhaps should have been done looking to the satisfactory response of vocational training for these crops.
ON FARM TESTING – PULSES CROP 5.206 The table below shows the details;
Table No. 5.65 Pulses Crop
Yield Per- Hectare - Kg. Gram Arhar
S. No
Name of The Village
No. of Respon-
dents BT AT
No. of Respon-
dents BT AT
1 Mali Badodia (Indore)
1 1400 1800 1 1400 1800
2 Indira Gram (Mahu) 1 1400 1600 0 0 0 3 Gaginda (Mahu) 1 1200 1809 1 1400 1900
I Adopted Village 3 2
4 Phool Karari (Indore) 0 0 0 0 0 0
5 Bari Kalmer (Indore) 0 0 0 0 0 0 6 Jag Jeewan Gram
(Mahu) 0 0 0 0 0 0
7 Nehru Van Gram (Mahu)
0 0 0 0 0 0
8 Sendal (Mahu) 0 0 0 0 0 0 9 Mendal (Mahu) 0 0 0 0 0 0
II Cluster Village 0 0
Total All Villages 3 2 5.207 Gram being one of the important crops of Indore district, 3 O.F.Ts. have been organised [all
in adopted villages] with productivity ranging between 1600 kg per hectare for village Indira Gram to 1809 kg for village Gaginda in after training situations which are higher than before training conditions and far in excess of district average productivity of 920 kg per hectare and state average productivity of 932 kg per hectare.
5.208 Similarly, for Arhar crop two number of O.F.Ts. have been organised in two adopted
villages of Mali Badodia and Gaginda with yields per hectare in after training situations which are far in excess of district level and state level per hectare yields of 656 kg and 825 kg respectively.

232
ON FARM TESTING – OIL SEED CROP 5.209 The table below shows the details;
Table No. 5.66
Oil Seed Crop - Soybean Yield Per- Hectare - Kg. Sl.
No. Name of the Village
No. of Respondents BT AT 1 Mali Badodia (Indore) 1 1300 1535 2 Indira Gram (Mahu) 1 1350 1970 3 Gaginda (Mahu) 1 1250 1981 I Adopted villages 3 4 Phool Karari (Indore) 0 0 0
5 Bari Kalmer (Indore) 0 0 0 6 Jag Jeewan Gram (Mahu) 0 0 0 7 Nehru Van Gram (Mahu) 0 0 0 8 Sendal (Mahu) 0 0 0 9 Mendal (Mahu) 0 0 0 II Cluster villages 0
Total all villages 3
5.210 Soybean being one of the important crops of Indore district, 3 number of O.F.Ts. have been organised in three identified adopted villages with much higher yield rates in after training situations as compared to district and state level per hectare yields of 1070 kg and 1132 kg respectively.
5.211 No O.F.T. has been organised for crops like paddy, maize, lentil, jowar, mustard, cotton,
sugarcane and linseed which are not important crops of Indore district. 5.212 Surprisingly, no O.F.T. has been organised for any of the horticulture crops which
obviously is a gap in performance. The O.F.Ts. should have been organised for crops like Potato, Onion, Tomato and Brinjal for which there is good response in vocational training courses. Besides, horticultural crops are good source of income which are gradually becoming popular in Indore district. The measures of O.F.Ts. would have boosted-up the productivity levels of such crops along with enhancement of family income.
5.213 No. O.F.Ts. have been organised for subjects like livestock and dairying, poultry,
fishery development, agro-forestry, organic farming and watershed activities. A few O.F.Ts. should have been organised for livestock and dairying, agro forestry and watershed activities which have scope in our sample area of study.
5.214 In the following paragraphs summing-up efforts have been made for the results of
O.F.T. - In case of O.F.T., the yield per-hectare in after training situation is more than before
training conditions as has occurred for both vocational training and front line demonstrations which shows the positive impact of K.V.Ks. efforts.
- The O.F.Ts. have been organised only in adopted villages whereas a few O.F.Ts. should have been organised in cluster villages also to have wider impact.

233
- No O.F.T. has been organised for any of the horticulture crops which certainly shows the deficiency in performance. A few O.F.Ts. must have been organised for horticulture crops like potato, onion and and tomato etc. which are common items of consumption.
- Since no O.F.Ts. have been organised on subjects like livestock and dairying, poultry, fishery development, agro-forestry, organic farming and watershed activities, the impact of O.F.T. relating to such subjects is obviously not visible.
STATUS OF ACTIVITIES IN CONTROL VILLAGE – BERCHA 5.215 The study has identified one control village i.e. Bercha with 17 number of sample
households and 85 sample family members where there is no interventions of K.V.K. The information regarding common items of agronomical and horticulture crops have been collected to show the comparative status in areas of intervention and non- intervention. However, in case of control village before and after training situations have not been shown as there is no effort of K.V.K. in this village. For comparison, the average performance of vocational training in after training situation has been taken as the participation regarding all subjects is maximum in case of vocational training. The table below shows the comparative status of control village on one side and adopted and cluster villages on other side.
Table No. 5.67 Comparative Status of Performance Among Control Village and Adopted and Cluster Villages
Sl. No.
Item Control Village Adopted and cluster villages (average)
Difference [+ or -] over col. 3
1 2 3 4 5 PER HECTARE YIELD – KG
CEREALS 1 Wheat 3294.00 3993.22 (+) 699.22 2 Maize 1688.00 2344.00 (+) 656.00 3 Jowar 738.00 1806.75 (+) 1068.75 PULSES 4 Gram 1005.00 1093.89 (+) 88.89 5 Arhar 1038.00 1542.80 (+) 504.80 6 Lentil - 1005.00 - OIL SEEDS 7 Soybean 1091.00 1180.22 (+) 89.22 8 Mustard - 1700.00 -
HORTICULTURE CROPS – QUINTAL 9 Potato 197.00 284.50 (+) 87.50 10 Onion 197.00 261.67 (+) 64.67 11 Tomato 164.00 228.13 (+) 64.13 12 Brinjal 183.00 220.63 (+) 37.63 13 Chilly - 252.50 - 14 Bhindi 100.00 162.50 (+) 62.50 15 Cucerbits 85 - -

234
5.216 The above information clearly shows the better performance in adopted and cluster villages with interference of K.V.K. as compared to control village. For every crop the per hectare yields, due to training efforts of K.V.K. are more than the per hectare yield of control village. The difference in per hectare yield is substantial in cases of crops like Jowar, Wheat, Maize and Arhar where the per hectare yields in adopted and cluster villages have exceeded by 1068.75 kg, 699.22 kg, 656.00 kg and 504.80 kg respectively.
5.217 In the field of home science activities particularly for activities like preparation of
pickles and papad/badi/jam/jelly etc. substantial work has been done in adopted and cluster villages through the intervention of K.V.K. whereas such activities are totally missing in control village. These activities are important both form income augmentation and employment point of views.
5.218 Like vocational training programme no work has been done in control village on activities
like poultry and fishery development, training of rural youth, agro-forestry and watershed activities which are important functions for development of any rural economy.
RESULTS OF SURVEY – INDIVIDUAL PARTICULARS ADOPTED AND CLUSTER VILLAGES 5.219 In the following paragraphs an attempt has been made to highlight the various reactions of
25 percent of individuals taken from the sample family members. The total number of sample family members as reported is 1185 for adopted, cluster and control villages, the 25 percent of which comes to 296 individuals. The following table gives the break-up;
Table No. 5.68 Basic Details
Sl. No.
Item Total number of family members of 25% of households
25 % of individuals taken from 25% of households
1 2 3 4 1 Adopted Villages 359 91 2 Cluster Villages 741 184 3 Control Village 85 21 Total 1185 296
5.220 Though the 25 percent of 359 comes to 89.75 [say 90] and of 741, 185, but we have taken
figures of 91 and 184 respectively because of certain demographic particulars. However, a figure or two plus or minus is hardly meaningful so long it does not vitiate the survey results.
5.221 In the following paragraphs an attempt has been made to highlight the individual reactions
in adopted and cluster villages i.e. for 275 individuals. 5.222 The criteria for selection of individuals are as follows; - The individual should be the adult member of the family. - He should be associated with any programme of K.V.K. For individuals of control village,
this criterion is not applicable. - He/She should be literate, may be without having any formal education. SOCIAL CLASSIFICATION OF INDIVIDUALS

235
5.223 The table below shows the details;
Table No. 5.69 Social Classification
Social classification S. No.
Name of the Village No. of Individual S.T. S.C. O.B.C. GENERAL
1 2 3 4 5 6 7 1. Mali Badodia (Indore) 27 2 1 17 7 2. Indira Gram (Mahu) 24 0 15 9 0 3. Gaginda (Mahu) 40 40 0 0 0 Adopted Village 91 42 16 26 7
4. Phool Karari (Indore) 28 2 0 7 19 5. Bari Kalmer (Indore) 30 0 7 6 17 6. Jag Jeewan Gram (Mahu) 17 0 17 0 0 7. Nehru Van Gram (Mahu) 19 0 19 0 0 8. Sendal (Mahu) 40 29 2 7 2 9. Mendal (Mahu) 50 50 0 0 0 Cluster Village 184 81 45 20 38 Total 275 123 61 46 45
5.224 The above table shows that the majority of 123 individuals are from S.T. community that
accounts for 44.73 percent to total of 275 individuals from adopted and cluster villages. The combined percentage of S.C. and O.B.C. communities is 38.91 while the members from general communities constitute 16.36 percent to total individuals. Thus the entire area of adopted and cluster villages is predominated by scheduled tribe population that throws a challenge to K.V.K. Scientists to achieve tangible results for bringing this vulnerable community to main streatm of development.
INDIVIDUALS CLASSIFIED ON THE BASIS OF RELIGION 5.225 The following table gives the details;
Table No. 5.70 Classification on the Basis of Religion
Religion S. No.
Name of the Village No. of Individual Hindu Muslim Sikh Christian Nauabudh Others
1 2 3 4 5 6 7 8 9 1. Mali Badodia (Indore) 27 27 0 0 0 0 0 2. Indira Gram (Mahu) 24 24 0 0 0 0 0 3. Gaginda (Mahu) 40 40 0 0 0 0 0 Adopted Village 91 91 0 0 0 0 0
4. Phool Karari (Indore) 28 28 0 0 0 0 0 5. Bari Kalmer (Indore) 30 30 0 0 0 0 0 6. Jag Jeewan Gram (Mahu) 17 17 0 0 0 0 0 7. Nehru Van Gram (Mahu) 19 19 0 0 0 0 0 8. Sendal (Mahu) 40 40 0 0 0 0 0 9. Mendal (Mahu) 50 50 0 0 0 0 0 Cluster Village 184 184 0 0 0 0 0 Total 275 275 0 0 0 0 0
5.226 The above table shows that cent-percent individuals are the followers of Hindu religion. AWARENESS ABOUT THE K.V.K. 5.227 The table below shows the details;

236
Table No. 5.71
Awareness About the K.V.K. Awareness about
existence of K.V.K.
If 'yes' knowledge about
its location
Awareness about services rendered
by the K.V.K.
S. No
Name of the Village No. of Individual
Yes (1)
No (2)
Yes (1)
No (2)
Yes (1)
No (2)
1 2 3 4 5 6 7 8 9 1. Mali Badodia (Indore) 27 27 0 27 0 27 0 2. Indira Gram (Mahu) 24 24 0 24 0 24 0 3. Gaginda (Mahu) 40 40 0 40 0 40 0 Adopted Village 91 91 0 91 0 91 0
4. Phool Karari (Indore) 28 28 0 28 0 28 0 5. Bari Kalmer (Indore) 30 30 0 30 0 30 0 6. Jag Jeewan Gram (Mahu) 17 17 0 17 0 17 0 7. Nehru Van Gram (Mahu) 19 19 0 19 0 19 0 8. Sendal (Mahu) 40 40 0 40 0 40 0 9. Mendal (Mahu) 50 50 0 50 0 50 0 Cluster Village 184 184 0 184 0 184 0 Total 275 275 0 275 0 275 0
5.228 The cent percent awareness about K.V.K. in terms of its location and more importantly the
services rendered by it is undoubtedly an encouraging indiction that indicats the fruitful efforts of K.V.K. scientists in their stride to populerise the functions of K.V.K.
KNOWLEDGE ABOUT SPECIFIC SERVICES RENDERED BY K.V.K. 5.229 The table below shows the details;
Table No. 5.72 Specific Services Rendered by the K.V.K.
knowledge about
vocational
knowledge about front line
demonstration training
knowledge about on farm
testing
S. No
Name of the Village No. of Individual
Yes (1)
No (2)
Yes (1)
No (2)
Yes (1)
No (2)
1 2 4 5 6 7 8 9 10 1. Mali Badodia (Indore) 27 27 0 27 0 27 0 2. Indira Gram (Mahu) 24 24 0 24 0 24 0 3. Gaginda (Mahu) 40 40 0 40 0 40 0 Adopted Village 91 91 0 91 0 91 0
4. Phool Karari (Indore) 28 28 0 0 28 0 28 5. Bari Kalmer (Indore) 30 30 0 18 12 11 19 6. Jag Jeewan Gram (Mahu) 17 17 0 6 11 6 11 7. Nehru Van Gram (Mahu) 19 19 0 3 16 3 16 8. Sendal (Mahu) 40 40 0 24 16 12 28 9. Mendal (Mahu) 50 50 0 8 42 8 42 Cluster Village 184 184 0 59 125 40 144 Total 275 275 0 150 125 131 144
5.230 Regarding Vocational Training the cent percent awareness of the individuals from adopted and cluster villages seems obvious as participation of households in such training programmes is maximum.

237
5.231 The absence of any knowledge about front line demonstrations among 125 individuals
which is 45.45 percent to total number of 275 sample individuals is some what discouraging which is mainly due to the fact that very limited numbers of F.L.Ds. have been organised. Though the F.L.Ds. can not be organised on large number of farmer’s fields but the lack of knowledge about this activity is indicative of the fact that good number of sample population is unaware of the modern technology relating to agriculture that presents a dismal picture. The solution to this problem lies in organisation of more number of F.L.Ds. covering wider number of subjects as well as wider dissemination of the results of F.L.Ds. among large number of cultivators.
5.232 Similarly regarding on farm testing the lack of knowledge by 144 individuals [52.36
percent] indicates the level of unawareness about new technology relating to agriculture, the solution to which lies in organisation of more number of O.F.Ts. covering wider spectrum of subjects as well as wider dissemination of the results of O.F.T. among large number of farming community.
FIELD VISITS OF K.V.K. SCIENTISTS 5.233 Regular field visits by the K.V.K. scientists are necessary pre-requisites for implematation
of agriculture related technology and also to keep alive the confidence level of the farming community. The table below shows the extent of such visits.
Table No. 5.73
Field Visits of K.V.K. Scientists The duration gap S.
No Name of the Village No. of
Individual One month
(1)
Two months
(2)
More than two months
(3)
Never (4)
1 2 3 4 5 6 7 1. Mali Badodia (Indore) 27 1 0 0 18 2. Indira Gram (Mahu) 24 0 0 0 24 3. Gaginda (Mahu) 40 0 1 0 39 Adopted Village 91 1 1 0 81 4. Phool Karari (Indore) 28 0 0 0 28 5. Bari Kalmer (Indore) 30 1 0 24 5 6. Jag Jeewan Gram (Mahu) 17 0 1 13 3 7. Nehru Van Gram (Mahu) 19 0 2 17 0 8. Sendal (Mahu) 40 5 0 34 1 9. Mendal (Mahu) 50 15 5 12 17 Cluster Village 184 21 8 100 54 Total 275 22 9 100 135
5.234 Out of total of 275 individuals 266 individuals [96.73 percent] have informed about irregular
visits of K.V.K. scientists which seems rather an inflated information, which is contradicted by the fact of cent-percent awareness level of the farmers about services rendered by the K.V.K. The high degree of absence of K.V.K. scientists would have not lead to such type of positive results. May be the individuals might have vented out their regrets caused due to some other factors by informing about irregular visits by K.V.K. scientists. Even if half the information is taken to be correct, the picture remains to be grim. At least a fortnightly visit by K.V.K. scientists is necessary to keep-up the confidence level of the farmers. The

238
authorities of K.V.K., Indore may sort out this issue to avoid such regrets from farming communities for whom they work.
THE STATUS OF REGULAR CONTACT WITH K.V.K. 5.235 The regular contact of the farmes with the K.V.K. is one of the determining factors for
implementation of agriculture related technologies in the field. The table below shows the details;
Table No. 5.74 Status of Regular Contact with K.V.K.
Are you regular
touch with KVK
If yes reason if 'no' the reason S. No
Name of the Village No. of
Indivi-dual
Yes (1)
No (2)
for seed (1)
plant protection
(2)
New technolog
y (3)
Distance
(1)
Do not feel the necessit
y (2) 1 2 3 4 5 6 7 8 9 10
1. Mali Badodia (Indore) 27 27 0 12 3 12 2 0 2. Indira Gram (Mahu) 24 24 0 7 3 13 0 0 3. Gaginda (Mahu) 40 39 1 0 0 40 1 0 Adopted Village 91 90 1 19 6 65 3 0
4. Phool Karari (Indore) 28 28 0 0 0 20 0 10 5. Bari Kalmer (Indore) 30 7 23 0 1 12 9 4 6. Jag Jeewan Gram
(Mahu) 17 11 6 0 0 10 10 0
7. Nehru Van Gram (Mahu)
19 14 5 1 0 8 8 0
8. Sendal (Mahu) 40 10 30 0 0 11 28 0 9. Mendal (Mahu) 50 37 13 9 0 35 6 0 Cluster Village 184 107 77 10 1 96 61 14
Total 275 197 78 29 7 161 64 14 5.236 Out of total of 275 individuals, 197 individuals [71.64 percent] are in regular contact with
K.V.K. mainly because of the desire for adopting new technology [58.55 percent individuals] and for obtaining quality seed [10.55 percent individuals]. A total number of 78 individuals are not in regular contact with K.V.K. which is 28.36 percent to total individuals. The main reason is the distance factor due to which 64 number of individuals can not keep a regular contact. Fourteen number of individuals have not contacted the K.V.K. as they do not feel the necessity of it. Though the number of such individuals is limited but the attitude seems disturbing. The K.V.K. Scientists may initiate particular efforts to stop brewing such attitudinal trend which, in long run, may be very harmful.

239
STATUS OF IMPLEMENTATION OF THE SERVICES OF THE K.V.K. 5.237 The table below shows the details;
Table No. 5.75 Implementation of the Services of K.V.K.
Implementation of the
services of K.V.K.
If yes in what fields S No
Name of the Village No. of Individual
Yes (1)
No (2)
Agronomy
Horticulture
Animal husbandry
Fisheries
Poultry
1 2 3 4 5 6 7 8 9 10 1. Mali Badodia (Indore) 27 27 0 27 0 0 0 0 2. Indira Gram (Mahu) 24 24 0 24 0 0 0 0 3. Gaginda (Mahu) 40 40 0 40 0 0 0 0 Adopted Village 91 91 0 91 0 0 0 0
4. Phool Karari (Indore) 28 28 0 6 2 0 0 0 5. Bari Kalmer (Indore) 30 28 2 5 5 0 0 0 6. Jag Jeewan Gram (Mahu) 17 17 0 4 2 0 0 0 7. Nehru Van Gram (Mahu) 19 19 0 11 2 0 0 0 8. Sendal (Mahu) 40 39 1 12 2 0 0 0 9. Mendal (Mahu) 50 48 2 34 0 0 0 0 Cluster Village 184 179 5 72 13 0 0 0
Total 275 270 5 163 13 0 0 0
Table No. 5.75 [Contd…]
Implementation of the Services of K.V.K If yes in what fields If no the reason S.
No. Name of the Village
Home science
Agro forestry
Organic farming
Water shed
Training of rural youth
Not satisfied with new
technology
Problem of
resources
Satisfied with
present status
1 2 11 12 13 14 15 16 17 18 1. Mali Badodia (Indore) 27 0 0 0 0 0 0 0 2. Indira Gram (Mahu) 24 0 0 0 0 0 0 0 3. Gaginda (Mahu) 37 0 0 0 0 0 0 0 Adopted Village 88 0 0 0 0 0 0 0
4. Phool Karari (Indore) 28 0 0 0 0 0 2 0 5. Bari Kalmer (Indore) 30 0 0 0 0 0 0 0 6. Jag Jeewan Gram (Mahu) 17 0 0 0 0 0 1 0 7. Nehru Van Gram (Mahu) 19 0 0 0 0 0 0 0 8. Sendal (Mahu) 35 0 0 0 0 0 0 0 9. Mendal (Mahu) 49 0 0 0 0 0 2 0 Cluster Village 178 0 0 0 0 0 5 0
Total 266 0 0 0 0 0 5 0
5.238 The above table shows that out of 275 individuals, 270 individuals have implemented the
services of K.V.K. which is 98.18 percent to total respondents. This is an achievement by itself. It is worth mentioning here that the figures of itemwise coverage will not tally with the figure of 270 as the same person from agronomy might have implemented the improved techniques in the fields of horticulture, animal husbandry, home science etc.

240
5.239 The subject wise coverage figures show that the highest number of 266 individuals [96.73 percent to total individuals] have implemented the improved techniques relating to home science followed by 163 individuals [59.27 percent] implementing the improved techniques relating agronomy and 13 individuals [4.73 percent] implementing the techniques regarding horticulture crops. In rest of the subjects like animal husbandry, fishery, poultry, agro-forestry, organic farming, watershed activities and training of rural youth no implementation efforts have been done by the sample individuals as for these activities even vocational trainings have hardly been organised. Intensive efforts are required in the fields like animal husbandry, agro-forestry and watershed activities as these fields have extensive scope for employment and income generation.
5.240 Only five individuals from villages like Phool Karari, Jag Jeevan Gram and Mendal
[all cluster villages] have not implemented the services of K.V.K., mainly because of the problems of resources.
SATISFACTION LEVEL OF THE INDIVIDUALS ABOUT THE SERVICES OF K.V.K. 5.241 The level of satisfaction derived from the services of K.V.K. is important to sustain the
efforts of K.V.K. over a period of time. The table below shows the details;
Table No. 5.76 Satisfaction Level of the Individuals
Satisfied with the impact
If yes in what fields S. No
Name of the Village No. of Individual
Yes (1)
No (2)
Agronomy
Horticulture
Animal husban-
dry
Fisheries
Poultry
1 2 3 4 5 6 7 8 9 10 1. Mali Badodia (Indore) 27 27 0 26 0 0 0 0 2. Indira Gram (Mahu) 24 24 0 24 0 0 0 0 3. Gaginda (Mahu) 40 40 0 40 0 0 0 0 Adopted Village 91 91 0 90 0 0 0 0
4. Phool Karari (Indore) 28 28 0 5 3 0 0 0 5. Bari Kalmer (Indore) 30 30 0 6 4 0 0 0 6. Jag Jeewan Gram
(Mahu) 17 17 0 4 2 0 0 0
7. Nehru Van Gram (Mahu)
19 19 0 11 2 0 0 0
8. Sendal (Mahu) 40 40 0 15 2 0 0 0 9. Mendal (Mahu) 50 50 0 27 0 0 0 0 Cluster Village 184 184 0 68 13 0 0 0 Total 275 275 0 158 13 0 0 0

241
Table No. 5.76 [Contd…] Satisfaction Level of the Individuals
If yes in what fields If no the reason S. No.
Name of the Village Home
scienceAgro
forestry Organic farming
Water shed
Training of rural youth
Techn-ique is difficul
t to follow
Inputs are not easily
available
Non-availability of advice in the time
1 2 11 12 13 14 15 16 17 18 1. Mali Badodia
(Indore) 27 0 0 0 0 0 0 0
2. Indira Gram (Mahu) 24 0 0 0 0 0 0 0 3. Gaginda (Mahu) 36 1 0 0 0 0 0 0 Adopted Village 87 1 0 0 0 0 0 0
4. Phool Karari (Indore) 28 0 0 0 0 0 0 0 5. Bari Kalmer (Indore) 30 0 0 0 0 0 0 0 6. Jag Jeewan Gram
(Mahu) 17 0 0 0 0 0 0 0
7. Nehru Van Gram (Mahu)
19 0 0 0 0 0 0 0
8. Sendal (Mahu) 35 0 0 0 0 0 0 0 9. Mendal (Mahu) 50 0 0 0 0 0 0 0 Cluster Village 179 0 0 0 0 0 0 0
Total 266 1 0 0 0 0 0 0
5.242 The above table shows the cent-percent level of satisfaction of sample individuals for the
services rendered by the K.V.K. which in itself is a startling achievement. 5.243 Home Science, Agronomy and Horticulture are the subjects for which satisfaction level
is substantial. In subjects like animal husbandry, fishery, poultry, organic farming, watershed activities and training of rural youth the satisfaction level is nil because of the basic fact that for these subjects no vocational training has been initiated nor the FLDs or OFTs have been organised. Moreover the cultivators of our sample area are not much interested in these activities as they do not contribute much to their family income. However, efforts must be made to popularize the activities like animal husbandry, agro-forestry and watershed activities, as these subjects are important for rural economy. However only one individual from village Gaginda [adopted village] has expressed satisfaction for agro-forestry which is not of much consequence. Here again subjectwise response will not tally with the figure of 270 as the same individual may have response on other subjects.
IMPACT ON INCOME ENHANCEMENT 5.244 The validity of any effort is ultimately measured by its impact over income enhancement
whether directly or indirectly. The table below shows the details;

242
Table No. 5.77 Impact on Income Enhancement
Income enhanceme
nt
If yes the fields S. No.
Name of the Village No. of Individ-ual
Yes (1)
No (2)
Agronomy
Horticu- lture
Animal husbandr
y
Fisheries
Poultry
1 2 3 4 5 6 7 8 9 10 1. Mali Badodia (Indore) 27 27 0 26 0 0 0 0 2. Indira Gram (Mahu) 24 24 0 24 0 0 0 0 3. Gaginda (Mahu) 40 40 0 36 0 0 0 0 Adopted Village 91 91 0 86 0 0 0 0
4. Phool Karari (Indore) 28 28 0 5 3 0 0 0 5. Bari Kalmer (Indore) 30 30 0 7 3 0 0 0 6. Jag Jeewan Gram
(Mahu) 17 17 0 4 2 0 0 0
7. Nehru Van Gram (Mahu)
19 19 0 9 2 0 0 0
8. Sendal (Mahu) 40 40 0 14 2 0 0 0 9. Mendal (Mahu) 50 50 0 29 0 0 0 0 Cluster Village 184 184 0 68 12 0 0 0
Total 275 275 0 154 12 0 0 0
Table No. 5.77 [Contd…] Impact on Income Enhancement
If no the reasons S. No.
Name of the Village Home scien
ce
Agro forestr
y
Organic
farming
Water shed
Training of rural youth
Could not
follow the
instruction
Problem of resourse
Non- availabilit
y technical advice in
time 1 2 11 12 13 14 15 16 17 18
1. Mali Badodia (Indore)
26 1 0 0 0 0 0 0
2. Indira Gram (Mahu) 24 0 0 0 0 0 0 0 3. Gaginda (Mahu) 37 0 0 0 0 0 0 0 Adopted Village 87 1 0 0 0 0 0 0
4. Phool Karari (Indore) 28 0 0 0 0 0 0 0 5. Bari Kalmer (Indore) 30 0 0 0 0 0 0 0 6. Jag Jeewan Gram
(Mahu) 17 0 0 0 0 0 0 0
7. Nehru Van Gram (Mahu)
19 0 0 0 0 0 0 0
8. Sendal (Mahu) 35 0 0 0 0 0 0 0 9. Mendal (Mahu) 50 0 0 0 0 0 0 0 Cluster Village 179 0 0 0 0 0 0 0 Total 266 1 0 0 0 0 0 0

243
5.245 From the aove table a cent-percent positive response regarding impact of K.V.K. services over income enhancement is visualized which is creditable to the efforts of the K.V.K. in various fields of its operation.
5.246 As is expected, maximum number of 266 individuals i.e. 96.73 percent to total of 275
individuals have expressed the positive impact on income enhancement through home science activities followed by agronomy [154 individuals] and horticulture [12 individuals] who have found these activities useful for family income enhancement.
EXTENT OF INCOME ENHANCEMENT - Assessment of income level of individuals is one of the most difficult aspects of primary
data collection as the persons are usually shy of giving the correct information. However, through indirect approach, information regarding income has been collected which is given in the following table;
Table No. 5.78
Extent of Income Enhancement Percentage increase in Income S.
No Name of the Village
1to 10%
11 to
20%
21 to
30%
31 to
50%
51 to 60%
61 to
70%
71 to
80%
81 to
90%
91 to 100%
1 2 3 4 5 6 7 8 9 10 11 1. Mali Badodia (Indore) 15 10 2 0 0 0 0 0 0 2. Indira Gram (Mahu) 12 4 4 4 0 0 0 0 0 3. Gaginda (Mahu) 16 15 9 0 0 0 0 0 0 Adopted Village 43 29 15 4 0 0 0 0 0
4. Phool Karari (Indore) 26 0 0 2 0 0 0 0 0 5. Bari Kalmer (Indore) 26 4 0 0 0 0 0 0 0 6. Jag Jeewan Gram (Mahu) 17 0 0 0 0 0 0 0 0 7. Nehru Van Gram (Mahu) 19 0 0 0 0 0 0 0 0 8. Sendal (Mahu) 25 10 5 0 0 0 0 0 0 9. Mendal (Mahu) 50 0 0 0 0 0 0 0 0 Cluster Village 163 14 5 2 0 0 0 0 0
Total 206 43 20 6 0 0 0 0 0
5.247 The above table shows that out of 275 individuals, 206 individuals [74.91 percent to total individuals] have reported about 1 to 10 percent enhancement in income due to the impact of various services of K.V.K. while 43 individuals [15.64 percent] reported about 11 to 20 percent income enhancement The income enhancement in the percentage group of 21 to 50 has been reported by 26 persons [9.45 percent] due to impact of various technologies introduced by K.V.K. which, in itself, is a startling achievement.

244
OPINION ABOUT CONTINUANCE OF THE SERVICES OF K.V.K. - The table below shows the details;
Table No. 5.79 Opinion about Continuance of K.V.K. Services
Continuation of the services of K.V.K.
S. No.
Name of the Village No. of Individual
Yes No 1 2 3 4 5 1. Mali Badodia (Indore) 27 25 2 2. Indira Gram (Mahu) 24 24 0 3. Gaginda (Mahu) 40 39 1 Adopted Village 91 88 3
4. Phool Karari (Indore) 28 28 0 5. Bari Kalmer (Indore) 30 29 1 6. Jag Jeewan Gram (Mahu) 17 17 0 7. Nehru Van Gram (Mahu) 19 18 1 8. Sendal (Mahu) 40 38 2 9. Mendal (Mahu) 50 50 0 Cluster Village 184 180 4 Total 275 268 7
5.248 The above table shows that out of 275 individuals, 268 individuals [97.45 percent to total
individuals] have reported for continuance of the services by K.V.K. particularly for subjects like home science, agronomy and horticulture. Only 7 number of individuals have given negetive opinion which seems natural in the context of large number of respondents. Viewing things from the positive angle, the performance of the K.V.K. seems laudable, as the efforts have won the confidence of the farming community of our area of study.
SUGGESTIONS FOR ADDITIONAL SERVICES TO BE RENDERED BY THE K.V.K. 5.249 Information regarding suggestions for additional services to be rendered by the K.V.K. has
been collected from the individuals. The table below shows the details;
Table No. 5.80 Suggestions for Additional Services to be Rendered by K.V.K.
Suggestions for additional services by KVK S. No.
Name of the Village No. of Individual Production of
by product of crops
Marketing strategy
Weather forecasting
Availability of agri. inputs at
panchayat level 1 2 3 4 5 6 7 1. Mali Badodia (Indore) 27 9 15 0 2 2. Indira Gram (Mahu) 24 9 9 0 6 3. Gaginda (Mahu) 40 28 11 0 1 Adopted Village 91 46 35 0 9
4. Phool Karari (Indore) 28 18 0 0 10 5. Bari Kalmer (Indore) 30 18 8 0 3 6. Jag Jeewan Gram (Mahu) 17 2 0 0 14 7. Nehru Van Gram (Mahu) 19 9 2 0 8 8. Sendal (Mahu) 40 22 13 2 0 9. Mendal (Mahu) 50 18 0 0 32 Cluster Village 184 87 23 2 67 Total 275 133 58 2 76

245
5.250 Out of 301 individuals, 242 individuals [80.40 percent to total individuals] have given their useful suggestions about introduction of additional services to be rendered by the K.V.K. Important among these are regarding suggestions about production of by-product of crops, development of marketing strategy for fair re turn of the product and making available agricultural inputs at Gram Panchayat Level wherein 133, 58 and 76 individuals respectively have given their useful suggestions.
5.251 Regarding production of by-product, that may lead to some processing activities, the work
may be initiated in liaison with Industries Department of the district. 5.252 Marketing of agriculture produce is gaining importance to avoid the exploitation of farmers
by brokers. The intervention of K.V.K. personnel will be very useful if some sort of training is organised for beneficiary cultivators in liaison with Mandi Committees.
5.253 Regarding availability of agriculture inputs at Gram Panchayat level, the K.V.K Scientists
may bring home the solution in consultation with the Chief Executive Officer of Zila Panchayat by developing modalities for making available things at Gram Panchayat level.
5.254 It is, therefore, worth considering to incorporte in the mandate of K.V.K. the subjects
like production of by-products and development of marketing strategy of the product of the cultivators.
UTILIZATION OF THE ENHANCED INCOME 5.255 Proper utilization of enhanced income, is equally important as compared to its generation.
The table below shows the utilization of enhanced income of sample individuals for purchase of various agriculture inputs;
Table No. 5.81
Utilization of Enhanced Income Enhanced income led to purchase of
Tractor Harvester Thresher S. No.
Name of the Village No. of Individual
Yes (1)
No (2)
Yes (1)
No (2)
Yes (1)
No (2)
1 2 3 4 5 6 7 8 9 1. Mali Badodia (Indore) 27 0 27 0 27 0 27 2. Indira Gram (Mahu) 24 0 24 0 24 0 24 3. Gaginda (Mahu) 40 0 40 0 40 0 40 Adopted Village 91 0 91 0 91 0 91
4. Phool Karari (Indore) 28 0 28 0 28 0 28 5. Bari Kalmer (Indore) 30 0 30 0 30 1 29 6. Jag Jeewan Gram (Mahu) 17 0 17 0 17 0 17 7. Nehru Van Gram (Mahu) 19 0 19 0 19 0 19 8. Sendal (Mahu) 40 0 40 0 40 0 40 9. Mendal (Mahu) 50 0 50 0 50 0 50 Cluster Village 184 0 184 0 184 1 183
Total 275 0 275 0 275 1 274

246
Table No. 5.81 [Contd…] Utilization of Enhanced Income
Plough Seed drill Bullock pair
S. No.
Name of the Village No. of Individual
Yes (1)
No (2)
Yes (1)
No (2)
Yes (1)
No (2)
1 2 3 10 11 12 13 14 15 1. Mali Badodia (Indore) 27 5 22 0 27 3 24 2. Indira Gram (Mahu) 24 9 15 0 24 2 22 3. Gaginda (Mahu) 40 16 24 0 40 6 34 Adopted Village 91 30 61 0 91 11 80
4. Phool Karari (Indore) 28 0 28 0 28 2 26 5. Bari Kalmer (Indore) 30 4 26 0 30 1 29 6. Jag Jeewan Gram (Mahu) 17 0 17 0 17 0 17 7. Nehru Van Gram (Mahu) 19 0 19 0 19 1 18 8. Sendal (Mahu) 40 10 30 0 40 1 39 9. Mendal (Mahu) 50 0 50 0 50 11 39 Cluster Village 184 14 170 0 184 16 168
Total 275 44 231 0 275 27 248
Table No. 5.81 [Contd…] Utilization of Enhanced Income
Power/Knapsa
c sprayer Handhoe Storage
facility
S. No.
Name of the Village No. of Individual
Yes (1)
No (2)
Yes (1)
No (2)
Yes (1)
No (2)
1 2 3 16 17 18 19 20 21 1. Mali Badodia (Indore) 27 1 26 7 20 1 26 2. Indira Gram (Mahu) 24 0 24 4 20 0 24 3. Gaginda (Mahu) 40 5 35 0 40 0 40 Adopted Village 91 6 85 11 80 1 90
4. Phool Karari (Indore) 28 6 22 0 28 0 28 5. Bari Kalmer (Indore) 30 2 28 0 30 0 30 6. Jag Jeewan Gram (Mahu) 17 2 15 0 17 0 17 7. Nehru Van Gram (Mahu) 19 0 19 0 19 0 19 8. Sendal (Mahu) 40 5 35 4 36 1 39 9. Mendal (Mahu) 50 8 42 0 50 0 50 Cluster Village 184 23 161 4 180 1 183
Total 275 29 246 15 260 2 273

247
Table No. 5.81 [Contd…] Utilization of Enhanced Income
Tube well /Dug well Electric/diesel motor
Yes (1) No (2) Yes (1) No (2)
S. No.
Name of the Village No. of Individual
22 23 24 25 1. Mali Badodia (Indore) 27 0 27 1 26 2. Indira Gram (Mahu) 24 0 24 0 24 3. Gaginda (Mahu) 40 0 40 0 40 Adopted Village 91 0 91 1 90
4. Phool Karari (Indore) 28 0 28 0 28 5. Bari Kalmer (Indore) 30 0 30 0 30 6. Jag Jeewan Gram (Mahu) 17 0 17 0 17 7. Nehru Van Gram (Mahu) 19 0 19 0 19 8. Sendal (Mahu) 40 0 40 0 40 9. Mendal (Mahu) 50 0 50 0 50 Cluster Village 184 0 184 0 184
Total 275 0 275 1 274 5.256 The above table shows that 152 individuals have utilized their enhanced income for
purchase of various agriculture inputs which constitutes 50.50 percent to total number of 301 sample individuals. The purchases are mainly limited on items like tractor, harvester, plough, bullock pairs power/knapsac sprayer and hand hoe.The utilization level of enhanced income for purchase of agriculture input is some what encouraging.
IMPACT OF ENHANCED INCOME OVER EDUCATION LEVELS 5.257 The table jbelow shows the impact of enhanced income over levels of education in our area
of study;

248
Table No. 5.82 Impact of Enhanced Income Over Levels of Education
Impact on
education due to
enhanced income
If yes in what manner S. No.
Name of the Village No. of Individua
l
Yes (1)
No (2)
More Male
Children go to primary/midd
le (1)
More Female Children go to primary/midd
le (2)
More male
children attend
secondary level
education
(3)
More female children attend
secondary level
education
(4)
Male Female children go for higher
education non (5)
1 2 3 4 5 6 7 8 9 10 1. Mali Badodia (Indore) 27 21 6 7 8 4 0 0 2. Indira Gram (Mahu) 24 14 10 11 8 1 0 0 3. Gaginda (Mahu) 40 33 7 18 8 7 0 0 Adopted Village 91 68 23 36 24 12 0 0
4. Phool Karari (Indore) 28 24 4 16 4 2 2 0 5. Bari Kalmer (Indore) 30 26 4 15 9 2 0 0 6. Jag Jeewan Gram
(Mahu) 17 9 8 7 0 0 0 1
7. Nehru Van Gram(Mahu)
19 16 3 10 0 7 0 0
8. Sendal (Mahu) 40 36 4 24 6 3 1 0 9. Mendal (Mahu) 50 32 18 26 2 2 0 0 Cluster Village 184 143 41 98 21 16 3 1 Total 275 211 64 134 45 28 3 1

249
Table No. 5.82 [Contd…] Impact of Enhanced Income Over Levels of Education
If no the reasons S. No
Name of the Village No. of Individua
l Educa-tion is no
priority
(1)
Purchase of agr.
inputs (2)
Exp. on
religious/soci
al rituals
(3)
Purchase of luxutry items like TV fridge
two wheeler
etc. (4)
Consump- tion of
intoxicants
(5)
Deposi-ted in the bank (6)
Debt repay-
ment (7)
1 2 3 11 12 13 14 15 16 1. Mali Badodia
(Indore) 27 7 0 0 0 0 0 0
2. Indira Gram (Mahu) 24 3 7 0 0 0 0 0 3. Gaginda (Mahu) 40 6 0 0 0 1 0 0 Adopted Village 91 16 7 0 0 1 0 0
4. Phool Karari (Indore)
28 4 0 0 0 0 0 0
5. Bari Kalmer (Indore) 30 4 0 0 0 0 0 0 6. Jag Jeewan Gram
(Mahu) 17 2 5 0 0 0 0 0
7. Nehru Van Gram (Mahu)
19 0 2 0 0 0 0 0
8. Sendal (Mahu) 40 4 0 0 0 0 0 0 9. Mendal (Mahu) 50 7 12 0 0 0 0 0 Cluster Village 184 21 19 0 0 0 0 0
Total 275 37 26 0 0 1 0 0 5.258 Out of 301 individuals, 278 individuals [92.36 percent] have reported positive impact of
enhanced income over levels of education while 23 number of individuals [7.64 percent] have refused about such impact. The positive impact is predominant in case of primary and middle level education for both boys and girls wherein 245 individuals [81.40 percent to total individuals] have reported that due to enhanced income more number of boys and girls are being sent to attend elementary level [primary + middle] of education. The positive impact of enhanced income on levels of education shows the awareness of the sample individuals about value of education.
5.259 Regarding negetive responses by 23 individuals, 4 individuals [1.33 percent to total of 301
individuals] have reported that education is no priority to them while 18 individuals [5.98 percent to total individuals] have given the reason of spending the portions of enhanced income over purchase of agriculture inputs. However all these reasons may be overcome by the extension efforts of K.V.K. personnel by convincing the villagers about value of education while they impart vocational training.
IMPACT OF ENHANCED INCOME OVER HEALTH STATUS 5.260 Health is again an important social factor that accounts for efficiency in pursuance of any
occupation. The table below shows the impact of enhanced income over health status of sample population.

250
Table No. 5.83 Impact of Enhanced Income over Health Conditions
Impact on
Health
If yes in what manner S. No.
Name of the Village No. of Individual
Yes
(1)
No (2)
Services of
medical personne
l (1)
Vaccination of
children/ women
done (2)
Child nutrition
(3)
Female nutrition during
gestation
(4)
Adoption of
Family welfare
measuries
1 2 3 4 5 6 7 8 9 10 1. Mali Badodia (Indore) 27 23 4 2 15 4 0 2 2. Indira Gram (Mahu) 24 23 1 14 9 0 0 0 3. Gaginda (Mahu) 40 38 2 26 6 5 0 1 Adopted Village 91 84 7 42 30 9 0 3
4. Phool Karari (Indore) 28 28 0 25 0 3 0 0 5. Bari Kalmer (Indore) 30 29 1 9 17 2 0 0 6. Jag Jeewan Gram
(Mahu) 17 17 0 16 0 1 0 0
7. Nehru Van Gram (Mahu)
19 19 0 19 0 0 0 0
8. Sendal (Mahu) 40 37 3 23 12 2 0 0 9. Mendal (Mahu) 50 49 1 50 0 0 0 0 Cluster Village 184 179 5 142 29 8 0 0
Total 275 263 12 184 59 17 0 3
Table No. 5.83 [Contd…]
Impact of Enhanced Income over Health Conditions If no the reasons S.
No Name of the Village No. of
Individual
Health is no
priority
Believe in local healing
methods
Purchase of agri. inputs
Exp. on religious functions
Luxury items TV
Fridge, Two
wheeler, Four
wheeler
Consumption of intoxica
nts
Deposited in bank
1 2 3 11 12 13 14 15 16 17 1. Mali Badodia (Indore) 27 3 0 0 0 0 0 0 2. Indira Gram (Mahu) 24 1 0 0 3 0 0 0 3. Gaginda (Mahu) 40 2 0 0 0 0 0 0 Adopted Village 91 6 0 0 3 0 0 0
4. Phool Karari (Indore) 28 0 0 0 0 0 0 0 5. Bari Kalmer (Indore) 30 0 0 0 2 0 0 0 6. Jag Jeewan Gram
(Mahu) 17 0 0 0 0 0 0 0
7. Nehru Van Gram (Mahu)
19 0 0 0 0 0 0 0
8. Sendal (Mahu) 40 1 0 0 0 0 0 0 9. Mendal (Mahu) 50 0 0 0 0 0 0 0 Cluster Village 184 1 0 0 2 0 0 0
Total 275 7 0 0 5 0 0 0

251
5.261 The above table shows that out of 301 individuals, 289 individuals [96.01 percent to total of 301 individuals] have reported about positive impact of enhanced income over health status which shows the awareness of the sample population about value of keeping good health. The items of positive responses like hiring of the services of medical personnel [224 individuals], vaccination of children/women [45 individuals]. Child nutrition [12 individuals] and adoption of family welfare measures [4 individuals] are indicative of healthy trend since the individuals are more concerned particularly about, the health status of women and children.
5.262 Though the number of individuals with negetive response is only 12 [3.99 percent to
total of 301 individuals] but the opinion like health is no priority by 3 number of individuals is a sort of red alert to K.V.K. scientists who must uproot such attitude lest they go deep into the thinking of more individuals.
IMPACT OF ENHANCED INCOME OVER POTABLE DRINKING WATER SUPPLY 5.263 The table below shows the details;
Table No. 5.84
Impact of Enhanced Income over Potable Drinking Water Supply Improve in
potable drinking water
If yes in what way S. No
Name of the Village No. of Individual
Yes
No
Piped water supply
Hand pump
Aqua guard
1 2 3 4 5 6 7 8
1. Mali Badodia (Indore) 27 4 23 1 1 1 2. Indira Gram (Mahu) 24 0 24 0 0 0 3. Gaginda (Mahu) 40 10 30 0 11 0 Adopted Village 91 14 77 1 12 1 4. Phool Karari (Indore) 28 5 23 2 1 0 5. Bari Kalmer (Indore) 30 4 26 2 6 0 6. Jag Jeewan Gram (Mahu) 17 0 17 0 0 1 7. Nehru Van Gram (Mahu) 19 0 19 0 0 0 8. Sendal (Mahu) 40 5 35 0 3 0 9. Mendal (Mahu) 50 4 46 0 3 0 Cluster Village 184 18 166 4 13 1 Total 275 32 243 5 25 2

252
Table No. 5.84 [Contd…] Impact of Enhanced Income over Potable Drinking Water Supply
If No the reasons S. No.
Name of the Village No. of Individual
Drinking water is no
priority
Purchase of agri.
inputs
Exp. on religious social -rituals
Luxury items TV Fridge,
Two wheeler,
Four wheeler
Consumption of
intoxicants
Deposi-ted in bank
1 2 3 9 10 11 12 13 14 1. Mali Badodia (Indore) 27 23 1 0 0 0 0 2. Indira Gram (Mahu) 24 24 0 0 0 0 0 3. Gaginda (Mahu) 40 25 0 0 0 0 0 Adopted Village 91 72 1 0 0 0 0
4. Phool Karari (Indore) 28 16 0 0 0 0 10 5. Bari Kalmer (Indore) 30 21 0 0 0 0 0 6. Jag Jeewan Gram
(Mahu) 17 11 5 0 0 0 1
7. Nehru Van Gram (Mahu)
19 17 2 0 0 0 0
8. Sendal (Mahu) 40 32 1 0 0 0 0 9. Mendal (Mahu) 50 41 4 1 0 0 8 Cluster Village 184 138 12 1 0 0 19
Total 275 210 13 1 0 0 19 5.264 The above tabke shows a reverse situation where the negetive response is to the tune of 182
individuals which is 60.47 percent to total of 301 individuals while the positive response is by only 119 individuals [39.53 percent]. These facts show that availability of potable drinking water is no priority in rural areas which is again proved by the information that 210 individuals [76.36 percent to total of 275 individuals] have informed that drinking water supply is no priority for them as against the basic priority of earning sufficient income. The majority of positive respondents have indicated the spending of portion of enhanced income over installation of hand pumps. The solution to this problem of neglect of protable drinking water lies in enhancement of agricultural income of the rural population which if achieved will solve the problem of drinking water and also sanitation as the enhanced income induces the individuals to take care of the finer details of life.
IMPACT OF ENHANCED INCOME OVER HOUSING CONDITIONS 5.265 The table below shows the details;

253
Table No. 5.85 Impact of Enhanced Income over Housing Conditions
Enhancement in income resulted
in improved housing
contentions
If yes in what way S. No
Name of the Village No. of Individual
Yes
No
Semi pucca house
constructed
Pucca house
constructed
Separate cattle shed constructed
1 2 3 4 5 6 7 8 1. Mali Badodia (Indore) 27 9 18 5 2 0 2. Indira Gram (Mahu) 24 0 24 0 0 0 3. Gaginda (Mahu) 40 16 24 14 0 7 Adopted Village 91 25 66 19 2 7
4. Phool Karari (Indore) 28 20 8 9 0 11 5. Bari Kalmer (Indore) 30 16 14 11 3 0 6. Jag Jeewan Gram (Mahu) 17 6 11 5 0 0 7. Nehru Van Gram (Mahu) 19 9 10 8 0 1 8. Sendal (Mahu) 40 18 22 10 7 0 9. Mendal (Mahu) 50 25 25 19 0 7 Cluster Village 184 94 90 62 10 19
Total 275 119 156 81 12 26
Table No. 5.85 [Contd…] Impact of Enhanced Income over Housing Conditions
If No the reasons S .No.
Name of the Village No. of Individual Better
housing no
priority
Purchase of agr. inputs
Exp. on religious/ social rituals
Luxury items TV,
Fridge, Two
wheeler, Four
wheeler
Consum-ption
of intoxi-cants
Deposited in bank
1 2 3 9 10 11 12 13 14 1. Mali Badodia (Indore) 27 11 0 0 2 0 3 2. Indira Gram (Mahu) 24 2 0 0 0 4 8 3. Gaginda (Mahu) 40 9 20 0 3 0 9 Adopted Village 91 22 20 0 5 4 20
4. Phool Karari (Indore) 28 0 10 0 2 0 0 5. Bari Kalmer (Indore) 30 7 0 0 1 0 3 6. Jag Jeewan Gram
(Mahu) 17 1 13 0 0 0 0
7. Nehru Van Gram(Mahu)
19 0 5 0 0 0 0
8. Sendal (Mahu) 40 20 2 0 0 0 0 9. Mendal (Mahu) 50 0 15 1 0 3 2 Cluster Village 184 28 45 1 3 3 5
Total 275 50 65 1 8 7 25

254
5.266 The above table shows that out of 301 individuals, 122 individuals [40.53 percent] have positive respons while 179 individuals [59.47 percent] have refused spending of any amount of enhanced income over improving the housing conditions. The status seems obvious as frequent expenditure over improving the houseing condition is not usually done. The enhanced income has generally been utilized for construction of semi pucca houses and separate cattle-shed. For negetive respondents the important reasons are lack of priority in matters of better hous ing conditions [50 individuals] and purchase of agriculture inputs [65 individuals]. However the purchase of agriculture inputs being a matter of higher priority against improving the housing conditions seems justified but better housing being no priority is an attitudinal drawback which at times deters the effort even with availability of resources. This sort of thinking can easily be rectified by the K.V.K. Scientists during their field visits by emphasizing upon the importance of better living conditions from various health point of views.
AWARENESS ABOUT WELFARE SCHEMES INITIATED BY THE STATE GOVERNMENT WITH ASSISTANCE FROM GOVERNMENT OF INDIA 5.267 The basic objectives of various welfare schemes initiated by the government are for
providing employment opportunities to the target group for augmentation of income thereby improving the quality of life of the individuals/community. Though this information has no direct relevance to the functioning of K.V.K. but its personnel are supposed to popularize such schemes among villagers for taking financial support from such programmes. In the following paragraphs the details of a few important schemes have been given which have direct impact over the livelihoods of sample population.
JAWAHAR GRAM SAMRIDHI YOJANA 5.268 The former scheme of Jawahar Rojgar Yojna renamed as Jawahar Gram Samridhi Yojna
was started from the year 1999-2000 with the basic objective of creating community assets of permanent nature, thereby providing employment to local labour. The survey results show that out of 301 individuals 233 individuals [77.41 percent] are aware of the scheme while rest of 68 individuals [22.59 percent] have no knowledge about the scheme. The scheme is important from the view point of creating community asset that results in availability of employment opportunities. Awareness about this scheme will induce the villagers to assert their demand through Gram Panchayat to develop their area. The K.V.K. personnel may, during their field visits, publicize the utility of the scheme among the villagers.
. EMPLOYMENT ASSURANCE SCHEME 5.269 Started from the year 1997-98, the scheme aims at providing employment to rural
population during lean season of agriculture thereby creating community assets. The response to this scheme is somewhat encouraging as 190 individuals [63.12 percent] are aware about the scheme.
ESTABLISHMENT OF HAND LOOM UNITS 5.270 Under this scheme, the units having 5 to 10 looms are registered and loom-shed subsidy and
margin money subsidy are given. Only 3 persons of our sample area are aware of the scheme. When even awareness is not there, there can hardly be any possibility of its implementation in our area of study.

255
ESTABLISHMENT OF SERICULTURE UNITS 5.271 Under this scheme the beneficiaries are given training on various aspects of sericulture
activities to supplement their income. For this purpose Resham Kendras spread over in districts assume nodal responsibilities to train the beneficiaries and augment their infrastructure. Only 2 individuals from our area of study are aware of the existence of such scheme when the scheme is so important for rural economy. The K.V.K. personnel in liaison with concerned district authorities may take-up a compaign for making villagers aware about the benefits of the scheme.
ESTABLISHMENT OF FAMILY BASED RURAL INDUSTRIAL UNITS 5.272 The scheme is implemented by the Madya Pradesh Khadi and Gramodoyog Board. Under
this scheme the units pertaining to SC, ST and OBCs are given 90 percent subsidy on capital loan and remaining 10 percent loan is given by the banks. The level of awareness about this scheme is reasonably fair as 18 individuals [5.98 percent to total of 301 individuals] are aware about this scheme.
MID DAY MEALS 5.273 The programme has proved to be an effective incentive for retention of school going
children relating to primary education, specially the children coming from low income group. Under this programme cooked meals are provided to the school going children. The level of awareness of this scheme, as 242 individuals, which is 88.00 percent to total of 275 individuals are aware about this scheme.
FREE SUPPLY OF TEXT BOOKS 5.274 Under this scheme all the students of primary standard [classes 1st to 5th] belonging to SC,
ST and OBCs and students of classes 1st to 3rd standards belonging to general communities are given text books free of cost. As per our survey results 234 individuals [77.74 percent] are aware about the scheme while 67 individuals [22.26 percent] are not aware of the scheme. Since the supply of text books free of cost is mandatory, the individuals unaware of the scheme are either persons having their wards above primary standards of education or the rate of drop-out is so high that they are not particular about the scheme. However, efforts both by persons of school education department and K.V.K. may reduce such extent of unawareness.
WOMEN SELF HELP GROUP 5.275 With view to ensure social and economic empowerment of women, self help groups
[S.H.Gs.] are formed for making the women confident to face challenges on all fronts, be it social or economic. In this scheme, the members of the group deposit a part of their saving in the fund raised by the group and may take loan to meet their various social and economic obligations, subject to return of the amount with interest. In our area of study 291 individuals [96.68 percent] are aware of this scheme which, ofcourse, is very encouraging that indicates the awareness of individuals about the value of such institution. Unawareness aspect for 10 individuals may easily overcome by little more extension efforts by concerned government officials and persons of K.V.K.

256
GRAMYA YOJNA 5.276 Under this scheme the poor women are given interest free loan upto Rs. 500.00 towards
starting a small bus iness. After repayment of the first loan within one year, second loan to the tune of Rs. 1500.00 is given. In our area of study, 215 numbers of individuals [71.43 percent] are aware of this scheme, which is quit satisfactory.
AUSMATI YOJNA 5.277 With the objective of providing better medical assistance to the women belonging to the
families living below the poverty line in rural areas, this scheme was started in the year 1999. For this scheme also the extent of awareness by 246 individuals [81.73 percent] is satisfactory.
5.278 In what follows an attempt has been made to summarise the details of individual
particulars of adopted and cluster villages. - The frame of the present part of the narration is 310 individuals which is 25
percent of the family members of 25 percent sample households belonging to adopted and cluster villages.
- The criteria for selection of individuals are – the persons should be the adult member of the family, he/she should be associated with any programme of the K.V.K., he/she should be literate – may be without having any formal education.
- The majority of 231 individuals are from OBC community that accounts for 76.74 percent to total of 301 individuals from adopted and cluster villages.
- The cent-percent sample individuals from our area of study are the followers of Hindu religion.
- The cent-percent awareness of the individuals about the K.V.K. in terms of its location and more importantly the services rendered by it is an important achievement of the K.V.K.
- The cent percent awareness about vocational training is encouraging. - Regarding regular contact with K.V.K. the survey results show the regular
contact of 78.41 percent individuals mainly because of the desire for adopting new technology and for obtaining quality seed. The positive impact of the efforts of the K.V.K. is clearly visible.
- Out of 301 individuals, 241 individuals have implemented the services of K.V.K. which is 80.07 percent to total respondents which in itself is an achievement of K.V.K’s. efforts.
- In the field of agronomy maximum number of 235 individuals [78.07 percent to total of 301 individuals] have implemented the improved technique, followed by 25 individuals [8.31 percent] for organic farming and 4 individuals implementing the techniques regarding agro-forestry.
- Regarding subjects like animal husbandry, fishery, poultry and training of rural youth not much implementation efforts have been made by sample individuals as for these activities even the vocational trainings have hardly been organised. Intensive efforts are required in the fields of animal husbandry, agro-forestry and watershed activities as these areas are important for rural economy.
- Agronomy and horticulture are the subjects for which the satisfaction level is substantial. In subjects like animal husbandry, fishery, poultry and training of rural youth the satisfaction level is negligiable because of the basic fact that for these subjects no vocational training in tangible way has been imparted nor the FLDs or OFTs have been organised. Efforts must be made to popularize the

257
activities like animal husbandry, agro-forestry and watershed activities as these fields have immense promise of employment generation followed by income augmentation in rural areas.
- About 99 percent positive response regarding impact of K.V.K. services over income enhancement has been reported which is of credit to the efforts of K.V.K. in various fields of its operation.
- The extent of income enhancement in the percentage group of 1 to 10 has been reported by 277 persons [92.03 percent] due to impact of various technologies introduced by K.V.K. which, in itself, is a startling achievement.
- Out of 301 individuals, 296 individuals [98.34 percent to total individuals] have reported for the continuance of the services of K.V.K. particularly for subjects like agronomy and horticulture which again shows the positive impact of the services rendered by K.V.K.
- Regarding suggestions for additional services to be rendered by K.V.K. the sample individuals have given useful suggestions regarding introduction of production of by-products of crops and development of marketing strategy for fair return of the product for incorporation in the training mandates of K.V.K.
- As regards utilization of enhanced income, 152 individuals [50.50 percent] have informed about purchase of various agriculture inputs out of their income enhancement.
- Out of 301 individuals, 278 individuals [92.36 percent] have reported positive impact of income enhancement over levels of education particularly over the levels of primary education for both boys and girls that shows the awareness of sample individuals about value of educating their wards.
- Out of 301 individuals, 289 individuals [96.01 percent to total of 301 individuals] have reported about positive impact of enhanced income over health status resulting in hiring of the services of medical personnel, vaccination of children/women, better application of child nutrition and adoption of family welfare measures.
- A reverse situation is visualized in case of potable drinking wter supply where the negetive response is to the tune of 182 individuals [60.47 percent] which shows that the availability of potable drinking water is no priority in rural areas in general and in our area of study in particular against the basic problem of enhancing agriculture income.
- Regarding impact of enhanced income over improving housing conditions, 122 individuals [40.53 percent] have positive response while 179 individuals [59.47 percent] have refused spending any amount of enhanced income over improving the housing conditions. The situation seems obvious as frequent expenditure over improving housing conditions is not done.
- Regarding awareness about various welfre schemes initiated by the State Government with assistance from Government of India, it has been observed that in case of schemes like Jawahar Gram Samridhi Yojna, Employment Assurance Scheme, Mid-Day Meals, Free Supply of Text Books, Women Self Help Group, Gramya and Ausmati Yojna the level of awareness is encouraging while in respect of schemes like Establishment of Hand Loom Units, Establishment of Sericulture Units and Establishment of Family Based Rural Industrial Units the level of awareness is poor.
RESULTS OF SURVEY–INDIVIDUAL PARTICULARS–CONTROL VILLAGE 5.279 In the following paragraphs an attempt has been made to record the reactions of 25 percent
of individuals taken from control village of Pipariya Birsa where there is no intervention of KVK. The Total number of family members of the 25 percent of the households in village Pipariya Birsa is 71, the twenty five percent of which is 18 individuals. Therefore, the reactions of 18 number of individuals have been recorded to have a comparison with the

258
reactions of individuals of adopted and cluster villages having direct intervention of KVK. The criteria for selection of individuals for control village are similar to that for adopted and cluster villages.
5.280 Like adopted and cluster villages, 10 individuals out of 18 individuals [55.56 percent] are
from O.B.C. community, only 3 individual are from S.T. community and 5 individuals are from general community. Non of the persons are from S.C. community Cent-percent individuals are followers of Hindu religion.
5.281 Regarding awareness about the existence of KVK, 6 individuals of control village are
aware of the its existence against the cent-percent awareness about K.V.K. in-terms of its location and services rendered by it by the individuals of adopted and cluster villages which seems obvious as in such cases the interventiojn of K.V.K. is direct. Regarding awareness about he services of K.V.K. the response in the control village is negetive. Awareness is the basic paramter that leads to positive impact of any activity over a long period of time. The ultimate aim of any K.V.K. is to cover the entire district in terms of implementation of prevailing and new technology relating to agriculture and its allied activities that presupposes awareness about this organisation by the farming community of the district. For this purpose the K.V.K. personnel of district Chhindwara may organize meetings at Gram Panchayat level at least twice in a year inviting one representative from villages where there is no intervention of K.V.K. to make them aware about the utility of services rendered by the K.V.K.
5.282 Regarding satisfaction derived from per hectare yield of agronomical and horticulture
crops, the 17 individuals of control village [94.44 percent] have expressed their dissatisfaction while for adopted and cluster villages this satisfaction level is substantial. However for improving the per-hectare yield, 13 number of individuals from control village which is 72.22 percent to total of 18 individuals have suggested for organizing training for water conservation methods, followed by 4 individuals [22.22 percent] for organizing training about application of inputs.
5.283 Regarding satisfaction level of livestock and dairy activities cent percent individuals have
expressed their dissatisfaction The suggestions forwarded are making available the improved breed production facilities by 12 individuals [66.67 percent] followed by artificial insemination by 5 individuals [2.78 percent] and one individual [5.56 percent] has opined for making available the improved feed facilities. It will be worth mentioning that even in cases of adopted and cluster villages the satisfaction level for livestock and poultry activities is negligible.
5.284 As for poultry development the level of dissatisfaction is again cent-percent. The important suggestions forwarded are arrangement of improved breeding facilities by 9 individuals [50.00 percent] and providing broiler production facilities by 9 individuals [50.00 percent]. In case of adopted and cluster villages also the satisfaction level for this activity is negligible.
5.285 Regarding fishery development, again the level of dissatisfaction is cent-percent supported
by the suggestions like supply of improved feed by 12 individuals [66.67 percent] followed by arranging training about use of improved implements by 6 individuals [33.33 percent] It is worth mentioning again that for adopted and cluster villages the level of satisfaction for this activity is nil.

259
5.286 Important information has been collected about adoption of home science activities for augmentation of family income. Toy making is one such activity where 5 individuals [27.78 percent] have asked for training facility followed by pickle prepartion by 5 individuals [27.78 percent]. Training regarding backing activities have also been supported by 5 individuals, papad/jam/jelly making by 5 individuals. It is again worth mentioning that in case of adopted and cluster villages the positive response in favour of home science activities is substantial.
- Regarding training of rural youth for self employment, 12 individuals out of total of 18
sample individuals [66.64 percent] have suggested for organizing training programme for motor binding which is very relevant for performing agricultural activities followed by 12 individuals in favour of training courses for repair of diesel engine that accounts for 66.67 percent to total of 18 sample individuals. For activities like black smithy, carpentry, masonary, tailoring and cycle/scooter repairs individuals to the tune of 12 individuals each have suggested for organizing training courses. It will not be out of place to mention here that in case of adopted and cluster villages, no individual has shown any inclination for such activities regarding training of rural youth
5.287 Regarding educational status of the sample individuals of control village, the survey results
show that out of 18 individuals, 9 persons [50.00 percent] have reported positively about their male children attending the elementary level of education [primary + middle i.e. classes 1st to 8th standards] while the response from 19 individuals [50.0 percent] for this item are negetive. More or less similar is the situation with girls wherein 7 number of individuals [38.89 percent] have given positive response while 11 number of individuals [61.11 percent] were negetive in their responses. Similarly regarding boys students of secondary level of education, i.e. from from classes 9th to 12th standards only 4 individuals [22.22 percent] have informed that their wards attend the school. In case of higher education for both male and femal children the positive responses is by 2 individuals only. In case of adopted and cluster villages 92.36 percent individuals have reported about their male and female wards attending the elementary level of eduction against the average percentage figure of 50.00 for control village that shows better awareness among the sample inhabitants of adopted and cluster villages about value of elementary education.
5.288 Regarding health status the following table presents a comparitive picture between adopted
and cluster villages on one side and the control village on the other; Table No. 5.86
Compartive Status of Health Facilities Among Sample Individuals Sl. No.
Item Status of control village –percentage to total 21 sample
individuals
Status of adopted and cluster villages percentage to 275
sample individuals 1 Hiring of services of
medical personnel 72.22 74.42
2 Vaccination of children/ pregnant mother
77.78 31.56
3 Child nutrition 55.56 3.99 4 Female nutrition during
gestation period 44.44 1.33
5 Adoption of family welfare measures
55.56 1.33
Note – Only positive responses have been taken into account.

260
5.289 The above table shows that except for the item of hiring of services of medical personal where the positive response of individuals from adopted and cluster villages is higher than control village, in rest of the health parameters the percentage positive responses of the individuals of control village are much higher than theat of adopted and cluster villages that shows the relatively higher level of awareness among the sample individuals of control village regarding various health parameters.
5.290 Regarding status of drinking water facilities, cent percent individuals have responded
positively about availability of hand pumps as main source of drinking water. Piped water supply is not in existence in the sample village which seems obvious as in villages in general this facility is seldom available. In case of adopted and cluster villages also the majority of respondents have informed about hand pums as main source of drinking water in their villages.
5.291 Regarding housing facilities, 8 number of individuals [44.44 percent] have reported for
construction of semi-pucca houses while 5 individual [27.78 percent] have positive response for construction of pucca house.
5.292 The table below shows the comparative level of awareness about the various welfare
schemes between adopted/cluster villages and control village;

261
Table No. 5.87 Comparative Levels of Awareness
Sl. No.
Name of the Scheme Level of awareness in percentage for adopted/cluster villages [percent to total of 275
individuals]
Level of awareness in percentage for control
village [percent to total of 21 individuals]
1 Jawahar Gram Samridhi Yojna 77.41 22.22 2 Employment Assurance Scheme 63.21 55.56 3 Establishment of Hand Loom Units 1.00 - 4 Establishment of Sericulture Units 0.66 - 5 Establishment of family based rural
industrial Units 5.98 -
6 Mid-day Meals 100.00 16.67 7 Free supply of Text Books 77.74 5.56 8 Women Self Help Group 96.68 33.33 9 Gramya Yojna 71.43 - 10 Ausmati Yojna 81.73 44.44 5.293 The above table shows that the level of awareness about welfare schemes is much
higher in adopted/cluster villages as compared to control village. Regarding schemes like Establishment of Hand Loom Units, Establishment of Sericulture Units and Establishment of family based rural industrial Units the level of awareness among individuals of control village is nil while that for adopted and cluster villages the level of awareness is marginal. The validity of such schemes therefore is doubtful as since the awareness about these schemes are missing, the plight of their implementation may well be imagined.
5.294 In what follows an attempt has been made to summarise the findings of individual
particulars of the control village; - The majority of individuals i.e. 55.56 percent to total of 18 sample individuals are from
O.B.C. community. Cent percent individuals are followers of Hindu religion. - The cent-percent level of unawareness among sample individuals of control village
about the services rendered by the K.V.K. is a matter of concern which shows that a portion of population is unaware about prevailing and new technology relating to agriculture and allied services. Since the ultimate objective of any K.V.K. is to cover the farming communities of entire district, it will, therefore, be worthwhile if the K.V.K. Scientists organize meetings at Gram Panchayat level – twice in a year, inviting representative cultivators from control village and apprise them with latest technology or suggest them to be in regular contact with the cultivators of adopted and cluster villages who are already implementing technologies both prevailing and new relating to agriculture and allied activities.
- Regarding satisfaction level of per hectare yield of agronomical and horticultural crops, the 17 individuals of control village have expressed their dissatisfaction with suggestions to organize training activities on water conservation methods and application of agriculture imputs.
- Regarding satisfaction level derived from present status of livestock and dairy activities cent percent individuals have expressed their dissatisfaction. The suggestions forwarded are making available the improved breed production facilities, artificial insemination facilities etc.

262
- As for poultry development the level of dissatisfaction is again cen-percent. The important suggestions forwarded are arrangement of improved breeding facilities and providing broiler production facilities.
- Similarly for fishery development the level of dissatisfaction is cent-percent supported by the suggestions like supply of improved feed and arranging training about use of improved implements.
- For augmentation of income levels, 27.78 percent individuals are in favour of toy making activities followed by pickle preparation by 27.78 percent individuals, backing activities by 27.78 percent individuals and preparation of papad/jam/jelly by 27.78 percent individuals.
- Regarding training of rural youth for self employment, considerable interests hve been shown by the sample individuals of control village pertaining to activities like motor binding, repair of diesel engine, black smithy, carpentry, msonary, tailoring and cycle/scooter repair etc.
- Regarding elementary level of education [classes 1st to 8th standards] 50.00 percent individuals have reported that their male wards attend the school where as for female wards 38.89 percent individuals have reported in favour of their school attendance.
- A very satisfactory level of health scenario is existing in control villge wherein for most of the basic health parameters the percentage positive response is much higher than the responses from adopted and cluster villages.
- Hand pumps are the main source of drinking water in our control village where cent percent individuals have reported for its existence.
- Regading housing facilities the individuals of control village have shown interest in constructing semi-pucca houses.
- The level of awareness about various welfare schemes initiated by the government is much higher in case of adopted/cluster villages as compared to control village.

263
Chapter Six KRISHI VIGYAN KENDRA - CHHINDWARA The Premise 6.1 The present chapter has been categorized into;
- General Particulars of the district - Details of Krishi Vigyan Kendra based on secondary information - Results of the survey
GENERAL PARTICULARS OF THE DISTRICT 6.2 District Chhindwara is located in between 21.280 to 22.490 north latitude to 78.100 to 79.240
east longitude and 1164 meter above sea level. The district is situated in the Southern part of the State of Madhya Pradesh with total geographical area of 11815 squ.km constituting 3.83 percent of the total 308245 squ.km. area of the State.
6.3 The district is bordering the State of Maharashtra imbibing the culture of that State. The area
is largest orange producing district of the State of Madhya Pradesh with extensive export potentiality.
6.4 The district has 1903 inhabited villages with 808 Gram Panchayats delegated with various
powers of administration in view of 73rd constitutional amendment. The district has 11 number of Development Blocks that vouches for the expanse of rural area with 22 number of police stations for administration of low and order. The population, in general is law abiding since in worst of the nation wide turmoil, nothing untoward happened in the district.
6.5 The average annual rainfall of the district is 940.50 mm mainly spread over between June to
September. The average maximum temperature during summer is 39.70 celsius while average minimum temperature during winter is 14.90 celsius.
6.6 The total population of the district as per census 2001 is 1849283 which is 3.06 percent to
total population of the State. Of the total population of the district the total rural population is 1397080 which is 75.55 percent to total population of the district while the urban population is 452203 constituting 24.45 percent total district population. The fact shows the rural character of the district. The percentage of scheduled caste population to total population as per census 2001 is 24.72 while that for scheduled tribe population is 3.11 as against the State level percentage figures of 15.17 and 20.27 respectively. The percentage of total workers to total population of the district as per census 1991 is 43.43 as against the State average figure of 42.74 percent as per census 2001.The total number of persons engaged in agriculture in district Chhindwara as per census 1991 is 445711 which is 65.42 percent to total workers as against the State level percentage figure of 71.49 [as per census 2001].
6.7 The following indicators relating to agriculture will show the extent of agriculture related
activities in district Chhindwara.

264
Table No. 6.1 Important Indicators Relating to Agriculture
Sl. No.
Indicators District Chhindwara
State of Madhya Pradesh
1 2 3 4 1 Percentage of forest area to total geographical area [ha] 40.42 26.65 2 Net cropped area as percent to total geographical area [ha] 41.94 49.02 3 Per-capita net cropped area [ha] 0.26 0.25 4 Per-capita gross cropped area [ha] 0.32 0.34 5 Percentage of double cropped area to net cropped area [ha] 25.15 35.49 6 Net area irrigated as percent to net cropped area [ha] 26.76 37.56 7 Gross area irrigated as percent to gross cropped area [ha] 22.51 28.54 8 Per-capita production of food-grains [Kg.] 317 266 9 Per hectare use of fertilizer [Kg.] 30.37 46.21 10 Gross value of agriculture produce-per hect. [Rs.] 17516 11968 11 Per hectare yield of agriculture produce [Kg.]*
a) Paddy 914 1058 b) Wheat 2096 1867 c) Jowar 988 1342 d) Maize 2949 2072 e) Gram 1344 932 f) Tuar 1679 825 g) Soybean 1464 1132
12 Electrified villages as percent to total inhabited villages 99.68 97.04 13 Energised pump sets per thousand hectare 104 60
*Figures relate to the year 2003-2004 [Final Forecast] 6.8 The above table shows that district Chhindwara is agriculturally advanced as for most of the
important crops like wheat, maize, gram, tuar and soybean the per hectare yield of the district is much higher than the State level average yield of such crops reflected over per-capita production of food grains which is 317 kg as against the State average of 266 kg. The per-hectare use of fertilizer [though less than State average figure] and per-capita net cropped area are substantial resulting ultimately in enhanced per-hectare yield and also advanced status of gross value of agriculture produce per hectare.
The district has immense forest wealth as the percentage of forest area to total geographical area is 40.42 as against the State average of 26.65 percent which has direct impact over the average rainfall and moderate climatic nature of the area supporting the cultivation of orange crop with much higher return as compared to traditional crops. Moreover, the area has immense scope for development of forest based secondary occupations. For most of the indicators the performance of the district is close to the State level performance resulting ultimately in viability of agricultural occupation.
DETAILS OF KRISHI VIGYAN KENDRA, CHHINDWARA BASED ON THE SECONDARY INFORMATION 6.9 Established in the year 1983, the K.V.K. is located in the Chandangaon area of Chhindwara
district. The institution is being run under the overall control of Jawahar Lal Nehru Krishi Vishwa Vidyalaya [J.N.K.V.V.], Jabalpur with Training Organiser as head of the institute.
265
Against the total sanctioned strength of 16 number of staff members, the institution, at present has 11 number of staff members, the institution, at present has 6 number of scientific staff with one Training Organiser and five Training Associates which is as per the quota of sanctioned strength followed by two filled- in posts of Technical Assistants against the sanctioned strength of five such personnel and three number of non-technical staff against the sanctioned strength of five number of non-technical personnel. Thus, at present, the total number of staff in position is 11 against the sanctioned strength of 16 persons. The number of staff in position though is fairly enough to carry on with the activities of K.V.K. but the filling- in of the all the five number of the posts of Technical Assistants will definitely add more efficiency in performance of technical functions.
6.10 The K.V.K. has its own administrative building with farmers hostel and threshing floor with
existence of demonstration units like dairy unit, poultry unit, nursery and vermi compost pits that shows the fair equipage of the institituion for performing various technical functions.
6.11 The farm area of the K.V.K. is 20 hectares, entirely irrigated and cultivated with 3 number
of tube wells and equal number of electric engines. As on the date of the survey the institution has one number of four wheeler and two number of two wheelers adding efficiency to various functions being performed by the K.V.K.
6.12 The K.V.K. has adequate number of agriculture implements as detailed below;
1. Tractor – 1 2. M.B. Plough –1 3. Cultivator – 1 4. Tractor drawn Ferti seed drill – 2 5. Thresher – 2 6. Trolley – 1
6.13 These variety of implements are, more or less, sufficient to do the extension work with
reasonable efficiency. 6.14 In short, the K.V.K., Chhindwara has fair extent of infrastructure to perform its
various activities with reasonable convenience. 6.15 Regarding budget provision, during the year 2003-2004 the K.V.K. has received an
allocation of Rs. 28.45 lakh with expenditure of entire amount. Major amount of Rs. 27.60 lakh has been made available for pay and allowances, training etc whereas only marginal amount of Rs. 0.85 lakh has been allocated for non-recurring items like purchase of equipment, books etc. Since the data for 2001-2002 and 2002-2003 has not been given, information in tabular form has not been presented.
6.16 The information regarding technical performance has been collected under the heads of;
- Vocational Training - In Service Training - Front Line Demonstration - On Farm Testing
6.17 In what follows an attempt has been made to present the details of above mentioned items.

266
VOCATIONAL TRAINING 6.18 Vocational training is not only limited to subjects relating to agriculture but supposed to
cover various subjects relating to activities allited to agriculture also. The table below shows the details;
Table No. 6.2 Status of Vocational Training
No. of trainings organised -2003-2004 Sl. No.
Subject Adopted Villages
Cluster Villages
Other Villages Total no. of
trainees 2003-2004
1 2 3 4 5 6 1 Crop Production 10 - 4 260 2 Horticulture 3 - 3 304 3 Plant Protection 2 - 8 244 4 Veterinary Services - - - - 5 Home Science - - - - 6 Ag. Engineering 3 - 1 69 7 Training of Rural Youth for
Self Employment
a. Book Keeping 1 - 2 62 b. Vermi Compost 1 - 1 27 c. Tailoring 1 - 1 25 d. Spray and Duster 1 - 1 30
Total 22 - 21 1021 Note : Other villages [Col. 5] mean those villages of the district where the training programmes of
Agriculture. Department are imparted through K.V.K. 6.19 One fact has very clearly come out from the above table is that the cultivators are basically
interested in enhancing productivity of agronomical and horticultural crops with the result maximum number of 30 training programmes have been organised in adopted and other villages which is 69.77 percent of total of 43 number of training courses organised in the year 2003-2004 with maximum number of attendance of 808 number of trainees accounting for 79.14 percent of total of 1021 number of trainees. The situation seems obvious as the cultivators are interested in enhancing their household income through improved farming practices over which they have control over resources backed by knowledge borne of years of experience. The complete absence of any training programme for veterinary services and home science is a matter of concern as these are the areas which have immense promise for generation of income and employment in rural areas that arrest the tendency of migration during lean season of agriculture. The K.V.K. may make special efforts to organize training programmes on such subjects. Regarding training of rural youth for self employment, only 9 number of training courses have been organised in adopted and other villages attended by 144 number of trainees which is 14.10 percent to total number of 1021 trainees attending the vocational training courses. The achievement is fair as it has normally been seen that in rural areas the young persons are usually not much interested in such training activities due to absence of placement gurantee. Complete absence of organisation of any training programme in cluster villages is a definite gap in performance. Cluster villages are usually the peripheral villages of adopted villaghes where the technological impact of K.V.Ks. efforts are supposed to percolate through various forward linkages. Trainings organised in cluster villages give momentum to such percolation process. The K.V.K., Bhopal has organised 23 number of vocational training courses in areas of cluster villages which have made definite dent over the awareness levels of cultivators about new and prevailing technology relating to agriculture. The K.V.K., Chhindwara may organize vocational training courses among cluster group of villages in coming years.

267
IN SERVICE TRAINING 6.20 In-service training is provided to the field functionaries of the line departments of
Agriculture, Veterinary, Horticulture and Forest. The following table shows the details of training provided;
Table No. 6.3
Status of In-service Training No. of trainings organised in
the year2003-04 Total number of trainees 2003-04
Sl. No.
Subject
On campus Off campus 1 2 3 4 5 1 Crop Production 1 - 25 2 Agriculture
Engineering 1 - 10
3 Horticulture 1 - 10 4 Plant Protection 1 - 15 Total 4 - 60
6.21 The position of organizing four number of training programmes with attendance of 60
number of trainees in the year 2003-2004 is somewhat satisfactory. However, the trainees from the office of the Chief Executive Officer, Zila Panchayat, implementing the scheme of rural development pertaining to creation of community and inditivual assets which have direct impact over enhancement of household income, should have been invited. The role of such personnel is important to implement various programmes relating to training of rural youth which is one of the basic responsibilities of K.V.K. Any programme of in-service-training should have duration of at least two days as usuall the first day is practically lost awaiting for the arrival of the trainees. The K.V.K. scientists should have a constant liaison with the district collector to make such training programmes meaningful.
FRONT LINE DEMONSTRATION 6.22 The special features of F.L.Ds. are;
- These demonstrations are conducted under the close supervision of the scientists of the K.V.K.
- Only newly released technologies or those likely to be selected in near future are selected for conducting F.L.Ds.
- F.L.Ds. are organised in a block of two to four hectares of land involving all those farmers whose plots fall in the identified demonstration blocks.
- Only critical inputs and training are provided from the scheme budget. Remaining inputs are supplied by farmers themselves.
- The target audience of F.L.Ds. is both farmers and extension officers. - The F.L.Ds. are supposed to generate data relating to factors leading to higher crop
yields and constraints under various farming conditions. 6.23 The table below shows the number of F.L.Ds. conducted during the year 2003-04.

268
Table No. 6.4 Status of Front Line Demonstrations
No. of demonstrations organised 2003-2004 Sl. No.
Subjects Adopted Villages Cluster Group of Villages
1 2 3 4 1 Pulses 20 - 2 Oil Seeds 20 - 3 Other than pulses and oilseeds 90 - Total 130 -
6.24 Since organizing F.L.Ds. is one of the most important functions of the K.V.K. as through this
activity the various technologies regarding agriculture are tested on the farmes fields, the complete absence of such demonstrations in cluster villages is a serious lapse. In case of K.V.K., Bhopal 142 number of F.L.Ds. have been organised in cluster villages. The K.V.K., Chhindwara with fair equipage of personnel and implements could have organised F.L.Ds. in cluster villages to have wider coverage of demonstrating agriculture related technologies that could have percolated gradually to cover the greater part of the district. The K.V.K., Chhindwara may look into this matter and prepare modalities for future planning.
ON FARM TESTING 6.25 On farm testing is a part of adaptive research that takes into account existing technology and
its application over defined areas and defined group of farmers. The procedure of on farm testing has five steps viz.,
- Diagnosis - Planning - Experimentation - Assessment/evaluation of results - Recommendation and diffusion.
DIAGNOSIS In this step, an understanding of farmer’s circumstances and practices is developed in order
to understand the farming system, possible productive problems and offer possible solutions. It is a continuous process practiced in every cycle of research. Normally the Participatory Rural Appraisal [P.R.A.] technique is used for having an insight into the problems of farming communities.
PLANNING The planning involves setting-up of priorities in order to improve research efficiency in
terms of research benefits/costs by identifying following kinds of problems;
- Problems causing large productive loss. - Problems that occur frequently. - Problems that affect many farmers and their major crops.
EXPERIMENTATION This step includes exploring production problems, testing possible solutions and
demonstrating them on the farms.

269
ASSESSMENT Under this phase the results of on farm testing are analysed taking primarily into
consideration the reactions and opinions of farmers. The results of the assessments are then used to plan future research.
RECOMMENDATION AND DIFFUSION On the basis of on farm testing the researchers formulate recommendations/ non-
recommendations for demonstration on larger area. The diffusion of new technology is done mainly be the farmer’s who once convinced of the benefits of new technology advise their fellow cultivators to adopt the system.
6.26 Against this background, the status of O.F.T. in the year 2003-2004 has been shown in the following table;
Table No. 6.5 Status of On Farm Testing
No. of O.F.Ts. organised 2003-2004 Sl. No.
Subject Adopted Villages Cluster Group of Villages
1 2 3 4 1 Agronomy 4 - 2 Horticulture 4 - 3 Ag. Engineering 5 - 4 Agro Forestry 2 - Total 15 -
6.27 The organisation of only 15 number of on farm testing in one year that too only in adopted
villages is far from being satisfactory, particularly when this activity is most important for implementation of prevailing technology relating to agriculture. The matching figure of K.V.K., Bhopal is organisation of 200 number of O.F.Ts. equally distributed between adopted and cluster villages. The K.V.K., Chhindwara may look into the matter and may attempt to organize more number of O.F.Ts. covering cluster villages as well in coming years.
6.28 Besides organizing training courses as laid down in the mandates of K.V.K. i.e. Vocational
Training, In Service training, Front Line Demonstration and On Farm Testing, the K.V.K., Chhindwara has also organised other training programmes in liaison with the offices of district administration. The table below shows the details;
Table No. 6.6
Record of Other Training Courses No. of participants Sl.
No. Topic Duration
2001-2002 2002-2003 2003-2004 1 2 3 4 5 6 1 Plant Protection 2 days - - 40 2 Agr. Engineering 2 days - - 40 3 Vermi Compost 2 days - - 40 4 Bee Keeping 3 days - - 40 5 Spray and Duster 3 days - - 40 6 Storage of Food Grains 2 days - - 40 7 Nadep 2 days - - 40 Total - - - 280

270
6.29 Organisation of training courses of seven number of topics all important to rural economy with 280 number of participants is somewhat satisfactory. Training duration regarding agriculture engineering that basically includes topics like repair and binding of motor etc. should have been for at least a week for more meaningful transaction. However, every such training programme should have minimum duration of at least three days as usually the first day is lost in observing formalities. A few days training courses on topics like home science, growing of medicinal crops, agro-forestry and water management could have been organize to have a wider coverage of activities.
6.30 One of the important functions of the K.V.K. is to conduct specific research to improve the
quality of agriculture produce, the details of which are given below;
Table No. 6.7 Status of Specific Research
Impact Over Topic of Research Year Production Pest
Control Improved
Animal Breed Others
[Specify] 1 2 3 4 5 6 7 1 Integrated animal
production system 2003-2004
100 percent over F.P.
- - -
2 Integrated weed management in Soybean
2003-2004
50 percent increase over
F.P.
- - -
F.P. – Farmers practice 6.31 The impact of specific research is satisfactory as indicated by their effect on production as
compared to farmer practice. Since the K.V.K., Chhindwara is functioning from the year 1983, more number of specific research particularly concerning horticulture crops could have been undertaken.
6.32 Each K.V.K. is supposed to hold the meeting of Scientific Advisory Committee twice in a
year for performing following functions; - Providing necessary guidance and leadership in developing infrastructure facilities and
thereby supporting the Kendra to fulfil its objectives. - Reviewing of the annual and five year plans of the Kendra. - Reviewing the progress of the activities and achievements and offering necessary
guidance/suggestions to improve the functioning of the Kendra. - Approval of the Annual Accounts of the Kendra before the same is sent to the Chartered
Accountant/Statutory Auditor for audit. - Adoption of the Statement of Audited Accounts before the same is sent to the Council. - Approval of the recommendations of the Recruitment/Selection committee for appointment
of staff on vacant posts. 6.33 The Scientific Advisory Committee will consist of following members; 1. Head of the host institution Chairperson 2. Director, Extension of concerned SAU Member 3. Zonal Coordinator of the concerned zone Member 4. Representative of ICAR Instt./ICAR Regional Research Station
if located in the district or nearby Member

271
5. Associate Director, Research & Extension of the Zonal Research Station in which KVK is located
Member
6. District officers of the line departments such as Agriculture, Horticulture, Animal Husbandry, Soil conservation, Social/Agroforestry, Sericulture, Fisheries, Irrigation, Social Welfare, Small Scale Industries etc.
Members
7. Representative of the Lead Bank of the District Member 8. Farm Radio Officer of the AIR in which KVK is located Member 9. Representative of Doordarshan Centre in which KVK is located Member 10. Two representatives of the farmers - one small and one big
nominated by the Head of the Institution Member
11. Two representatives of Farm Women nominated by Head of the Institution
Members
12. Training Organiser, KVK Member Secretary 6.34 The K.V.K., Chhindwara has arranged the meeting of Scientific Advisory Committee twice
in the year 2003-2004 as laid down by Indian Council of Agriculture Research, Government of India.
6.35 The K.V.K., Chhindwara has continuously interacted with district administration, three-tier
institution of Panchayati Raj and progressive cultivators of the district and took valuable guidance from them. Publicity measures like organizing Kisan Melas, Field Days, use of Audio-Visual Aids, arranging T.V. Interviews and Radio talks were attempted to spread the knowledge about utility of K.V.K. among rural population.
RESULTS OF THE SURVEY – VILLAGE PARTICULARS 6.36 The study has covered sixty number of villages at the rate of ten number of villages per
K.V.K. with following bifercations;
- Three number of Adopted Villages - Six number of Cluster Villages - One number of Control Village The bifurcation as shown above is common to all the six K.V.Ks. covered under the study. The table below shows a few important demographic details of the selected villages of K.V.K., Chhindwara;

272
Table No. 6.8 Demographic Particulars
Of which Sl. No.
Name of the Village
No. of households
as on thedate of
servey
Total population
Census 2001
Males Census 2001
Females Census 2001
Proportion of S.C.
population [%]
Proportion of S.T.
population [%]
Literacy rate [%]
House-hold size
1 2 3 4 5 6 7 8 9 10 ADOPTED VILLAGES
1 Simriya Kalan 105 733 377 356 13.0 3.0 86.6 5 2 Thunia Ddana 143 1335 709 626 15.5 15.8 61.5 6 3 Moadai 95 677 357 320 8.3 41.8 70.1 6 Total – I 343 2745
[34.19] 1443
[35.03] 1302
[33.30] - - - -
CLUSTER VILLAGES 4 Lahgurua 104 2288 1160 1128 29.1 49.7 60.7 6 5 Omariya 45 443 221 222 0.0 75.6 60.0 5 6 Munga 93 687 355 332 5.2 64.2 66.5 5 7 Baranga 130 732 346 386 4.5 84.6 57.6 6 8 Char-Gaon-Bhat 55 262 138 124 32.8 17.6 63.2 5 9 Oseria 80 572 299 273 0.3 46.3 66.5 6 Total – II 507 4984
[62.07] 2519
[61.16] 2465
[63.04] - - - -
CONTROL VILLAGE 10 Pipariya Birsa 57 300 157 143 2.7 40.7 58.0 5 Total – III 57 300
[3.74] 157
[3.81] 143
[3.66] - - - -
Grand Total I+II+III
907 8029 [100]
4119 [100]
3910 [100]
- - - -
Source – Census 2001 Note – Figures in brackets show percentage to total. 6.37 The total population of the ten identified villages as per census – 2001 is 8029 which is
0.57 percent to total rural population of district Chhindwara. The adopted villages cover 34.19 percent of population as compared to total population of ten number of identified villages covered under the study while for the cluster villages this percentage is 62.07 and for control village, the percentage coverage is 3.74. Population wise largest village is Lahgurua [cluster village with population of 2288 persons] while the smallest village is Char-Gaon-Bhat [cluster village with population of 262 persons]. Except for the villages Omariya and Baranga where female population is more than male population, in rest of the eight number of villages the trend is otherwise. Out of the ten identified villages in seven number of villages viz. Moadai, Lahgurua, Omariya, Munga, Baranga, Oseria and Pipariya Birsa the percentage of S.T. population is much more than percentage of S.C. population. In villages like Omariya, Munga and Baranga these percentages are as high as 75.6, 64.2 and 84.6 respectively. The literacy rate that ranged between 57.6 percent for village. Baranga [cluster village] to 86.6 percent for village Simriya Kalan [adopted village] is close to the district percentage literacy level of 66.03 and State percentage literacy level of 64.11. In villages like Simriya Kalan, Moadai, Munga and Oseria the percentage literacy is as high as 86.6, 70.1, 66.5 and 66.5 respectively which are higher than the percentage literacy levels of both district and State. One very startling fact as revealed by above information is that

273
even with substantial tribal population in identified villages covered under the study, the percentage literacy is more than satisfactory thus defying one of the fixed notions that areas with substantial tribal population usually have low literacy rate. The extensive literacy campaign initiated by the government has thus started showing results as the tribals have started understanding the value of literacy, particularly in our area of study.
WORK FORCE 6.38 An analysis of the information regarding workforce is important as it gives an idea of
persons engaged in various occupations along with the extent of dependent population not pursuing any occupation. The table below shows the details;
Table No. 6.9
Status of Work Participation Sl. No
Name of the Village Work participation rate [%]
Proportion of main workers [%]
Proportion of Marginal workers
[%]
Proportion of Non-workers [%]
Person Male FemalePerson Male Female Person Male Female Person Male Female1 2 3 4 5 6 7 8 9 10 11 12 13 14
ADOPTED VILLAGES 1 Simariya Kalan 47.5 51.5 43.3 46.4 50.7 41.9 1.1 0.8 1.4 52.5 48.5 56.7 2 Thunia Ddana 45.4 51.8 38.2 39.6 50.6 27.0 5.8 1.1 11.2 54.6 48.2 61.8 3 Moadai 48.4 50.7 45.9 23.2 39.5 5.0 25.3 11.2 40.9 51.6 49.3 54.1 CLUSTER VILLAGES 4 Lahgurua 40.1 51.7 28.1 28.5 48.2 8.2 11.6 3.5 19.9 59.9 48.3 71.9 5 Omariya 51.0 49.8 52.3 35.7 45.7 25.7 15.3 4.1 26.6 49.0 50.2 47.7 6 Munga 50.9 55.8 45.8 34.8 49.9 18.7 16.2 5.9 27.1 49.1 44.2 54.2 7 Baranga 35.1 54.0 18.1 19.9 39.3 2.6 15.2 14.7 15.5 64.9 46.0 81.9 8 Char-Gaon-Bhat 56.1 61.6 50.0 44.7 59.4 28.2 11.5 2.2 21.8 43.9 38.4 50.0 9 Dseriya 53.3 55.9 50.5 28.7 53.8 1.1 24.7 2.0 49.5 46.7 44.1 49.5 CONTROL VILLAGE 10 Pipariya Birsa 40.3 47.8 32.2 27.3 43.9 9.1 13.0 3.8 23.1 59.7 52.2 67.8 Source – Census 2001 6.39 The work participation rate that ranged between 35.1 percent in village Baranga [cluster
village] to 56.1 percent in village Char-Gaon-Bhat [cluster village] is in general more among males than females except for the village Omariya [cluster village] where a reverse trend is visible which is somewhat remarkable that shows the awareness among the female population about value of work for augmenting family income. The proportion of marginal workers is usually much low as compared to the proportion of main workers indicating the overall lack of additional work opportunities in our area of study particularly generated by various welfare schemes like Gramya, home science activities, S.H.Gs, Jawahar Gram Samridhi Yojna, establishment of Sericulture unit etc which generally generate marginal employment opportunities. For all the ten identified villages the proportion of female marginal workers is more than that of males which is rather obvious as the females do odd jobs in their spare time after completing household obligations. Since our area of study is predominated by tribal population, higher per centage of female marginal workers is somewhat matching to the trend as in the tribal communities females also do the work to support the household.

274
Regarding non-workers that ranged between 43.9 percent in village Char-Gaon-Bhat
[cluster village] to 64.9 percent in village Baranga [cluster village] presents a dismal picture as it shows higher percentage of dependent population consisting of children, old person, infirms and unemployed who are not in a position to contribute anything towards family income.
6.40 The table shows the occupational distribution of the population residing in ten number of
village covered under the study.
Table No. 6.10 Occupational Distribution
Proportion of Cultivators to total
Workers [%]
Proportion of Agr. Labourer to total
workers [%]
Proportion of workers in household
industries to total workers [%]
Proportion of other workers to total
workers [%]
Sl. No
Name of the Village
Person Male Female Person Male Female Person Male Female Person Male Female1 2 3 4 5 6 7 8 9 10 11 12 13 14
ADOPTED VILLAGES 1 Simariya Kalan 55.7 52.1 60.4 30.5 26.3 35.7 4.3 5.2 3.2 9.5 16.5 0.6 2 Thunia Odana 60.4 63.8 55.2 35. 29.2 43.9 0.0 0.0 0.0 4.6 7.1 0.8 3 Moadai 34.1 38.1 29.3 59.8 51.9 69.4 0.3 0.6 0.0 5.8 9.4 1.4 CLUSTER VILLAGES 4 Lahgurua 23.3 25.7 18.9 32.8 16.0 64.7 1.7 1.3 2.5 42.1 57.0 13.9 5 Omariya 55.8 60.0 51.7 27.0 25.5 28.4 0.9 1.8 0.0 16.4 12.7 19.8 6 Munga 43.1 43.4 42.8 22.6 13.1 34.9 4.6 5.1 3.9 29.7 38.4 18.4 7 Baranga 38.1 48.1 11.4 5.1 5.9 2.9 3.5 2.7 5.7 53.3 43.3 80.0 8 Char-Gaon-Bhat 66.7 67.1 66.1 29.3 25.9 33.9 0.0 0.0 0.0 4.1 7.1 0.0 9 Dseriya 46.2 76.0 10.1 51.5 20.4 89.1 0.0 0.0 0.0 2.3 3.6 0.7 CONTROL VILLAGE 10 Pipariya Birsa 33.1 38.7 23.9 62.0 53.3 76.1 0.0 0.0 0.0 5.0 8.0 0.0 Source – Census 2001 6.41 Agriculture is the main occupation of the ten number of identified villages covered under the
study as the combined averge percentage of cultivators and agriculture labour is 81.3 to total workers. Against the total number of ten villages, in six villages viz. Simariya Kalan, Thunia Ddana, Omariya, Munga, Baranga and Chargaon Bhat, the proportion of cultivators is more than the proportion of agriculture labour to total workers which is a positive indicator of viable status of agriculture in these six village. In rest of the four villages viz. Moadai, Lahgurua, Oseria and Pipariya Birsa the reverse trend is true. In general the proportion of male cultivators to total workers is more than that of females except in village Simariyan Kalan where percentage of female cultivators is 60.4 as against 52.1 percent of male cultivators. In case of agriculture labour percentage of female participation in general is more than male participation which seems natural as in villages with substantial tribal population where the work culture among females is very common-at times more than even males. The proportion of household workers to total workers is far from being satisfactory that ranged between 0.9 percent in village Omariya to 4.6 percent in village Munga. One of the important causes of rural poverty is absence of secondary occupations which give household income support particularly in agrarian economy. It also reduces pressure on land with the result the occupation of agriculture becomes more viable. Usually the proportion of other workers to total workers is much lower than that of

275
cultivators and agriculture labour which broady indicates the absence of activities other than agriculture in our sample villages. The villages like Lahgurua, Munga and Baranga are exceptions where the percentage of other workers to total workers is 57.0, 38.4 and 43.3 respectively which is indicative of the positive fact that in these villages avenues of employment other than agriculture is available.
LAND USE DETAILS 6.42 The table below shows the land use details of the ten identified villages covered under the
study; Table No. 6.11
Land Use Details In hectare Irrigation Sl.
No. Name of the
Village Total
geogra-phical area
Gross cropped area
Forest Not available for culti-vation
Culti-vable waste
Canal Pond Wells Others Total irri-gated area
Total unirri- gated
1 2 3 4 5 6 7 8 9 10 11 12 13 1 Simariyan Kala 417 413 [99.04] 0 4 41 0 0 150 0 150 [36.62] 222 2 Thunia Ddana 430 383 [89.07] 6 47 23 0 0 99 32 131 [34.20] 229 3 Moadai 369 334 [90.51] 0 35 35 0 0 123 26 149 [44.61] 150
Adopted Village I 1216 1130 [92.93] 0 86 99 0 0 372 58 430 [38.05] 601 4 Lahgurua 268 239 [89.18] 0 29 21 0 0 62 27 89 [37.24] 129 5 Omariya 435 252 [57.93] 178 5 25 0 0 4 0 4 [1.59] 223 6 Munga 213 183 [85.92] 0 30 12 0 0 34 0 34 [18.58] 137 7 Baranga 253 215 [84.98] 3 35 16 0 0 29 0 29 [13.49] 170 8 Char-Gaon-
Bhat 169 152 [89.94] 0 17 20 0 0 107 7 114 [75.00] 18
9 Dseriya 488 424 [86.89] 0 64 21 0 0 169 40 209 [49.29] 194 Cluster Village II 1826 1465 [80.23] 181 180 115 0 0 405 74 479 [32.70] 871 10 Pipariya Birsa 167 143 [85.63] 0 24 7 0 0 51 19 70 [48.95] 66 Control Village III 167 143 [85.63] 0 24 7 0 0 51 19 70 [48.95] 66 Total – I+II+III 3209 2738 [85.32] 181 290 221 0 0 828 151 979 [35.76] 1538 Source – Census, 2001 Note – Col. –4 = Figures in brackets show percentage to total geographical area. Col. – 12 = Figures in brackets show percentage to gross cropped area. 6.43 The gross cropped area of the identified ten villages is 85.32 percent to total geographical
area that confirms the basic fact that main occupation of these villages is agriculture. The survey area is not rich in forest resources as the total area under forest is 5.64 percent to total geographical area of the ten identified villages.
6.44 Regarding irrigation, the percentage of gross irrigated area to gross cropped area is 35.76
percent which is more than the district and state average figures of 22.51 percent and 28.54 percent respectively. In adopted three villages this figure ranged between 34.20 percent for village Thuniay Ddana to 44.61 percent for village Moadai whereas in cluster villages this range is 1.59 percent for village Omariya to 75.00 percent for Char-Gaon-Bhat. The overall status of irrigation is quite satisfactory.
6.45 Cultivable waste land, that provides promise for expanding agriculture activities is 221 hectares for ten number of identified villages which is 6.88 percent to total geographical area, assuring the fact that through the intervention of K.V.K. the expansion of agriculture is possible.
RURAL ELECTRIFICATION 6.46 The table below shows the details;

276
Table No. 6.12
Status of Rural Electrification Village Electrified Regular supply If irregular supply actual
hrs. of supply Sr. No.
Name of the village
Yes No Yes No 1 2 3 4 5 6 7
1. Simariya Kala (Muhkhed) 1 1 14 2. Thunia Ddana
(Chhindwara) 1 1 9
3. Moadai (Chhindwara) 1 1 8 Adopted Village 3 3
4. Lahgurua (Muhked) 1 1 14 5. Omariya (Muhked) 1 1 14 6. Munga (Parasiya) 1 1 12 7. Baranga (Parasiya) 1 1 12 8. Char Gaon Bhat
(Chhindwara) 1 1 10
9. Dseriya (Chhindwara) 1 1 10 Cluster Village 6 6
10 Pipariya Birsa (Chhindwara)
1 1 10
Control Village 1 1
Total 10 10
*The information in brackets shows the name of the Development Block where the village is located. This information will be common to all the subsequent tables.
6.47 The above table shows that all the ten villages covered under the study are electrified with
irregular power supply situation ranging between 8 hours per day for village Moadai [adopted village] to 14 hours per-day for villages Lahgurua and Omariya [both cluster villages]. The overall power shortage condition in the State is responsible for such situation. However, average of 11 hours power supply per-day in identified ten villages covered under the study is perhaps, sufficient for pursuing agriculture related activities in convenient manner.
6.48 The impact of rural electrification is directly visible over number of pump-sets energized.
The table below shows the details;

277
Table No. 6.13 Status of Pump Sets Energised
Pump sets energized Sr. No.
Name of the village Electricity (No.) Diesel (No.)
1 2 3 4 1. Simariya Kala (Muhkhed) 0 2. Thunia Ddana (Chhindwara) 80 3. Moadai (Chhindwara) 75 Adopted Village 155
4. Lahgurua (Muhked) 80 5. Omariya (Muhked) 40 6. Munga (Parasiya) 52 7. Baranga (Parasiya) 70 8. Char Gaon Bhat (Chhindwara) 30 9. Dseriya (Chhindwara) 25 Cluster Village 297
10 Pipariya Birsa (Chhindwara) 30 Control Village 30
Total 482
The total number of pump sets energized [electricity] is 482 [as on the date of survey] which
is 0.75 percent of total number of pump sets energized for district that stands at 64584 for the year 1999-2000. It is worth mentioning here that for district Chhindwara the number of energized pump set per thousand hectare is 104 as against the state average of 60 that indicates attitudinal positiveness of the cultivators of district Chhindwara towards pursuing agriculture related activities. The rate of energisation of pump sets per village for adopted and cluster villages is around 50 which is higher than that of control village having no intervention of K.V.K. that indicates the positive impact of the efforts of K.V.K. towards technology transfer inducing the cultivators to resort to better modes of cultivation.
HOUSEHOLD INDUSTRIAL UNITS 6.49 There is complete absence of household industrial units in all the ten number of villages
covered under the study. Though in table no. 6.10 presence of workers in household industries have been shown in scanty manner but since such information pertains to the year 2001 which with the passage of years might have become extinct. As said earlier, one of the basic causes of rural poverty is absence of secondary sector occupation which could absorbe excess labour force thereby easing the pressure on land and solve the existing problem of underemployment in agriculture sector. Since the villages under study are agriculturally viable, any attempt to establish agro based industries will be helpful in augmenting household income.
COOPERATIVES 6.50 Formation of primary level cooperative societies as reflected in plan documents, basically
aims at improving the socio-economic status of the weaker section of society and in turn, arrest the tendency of their exploitation. The table below shows the status of existence of cooperative societies in our area of study.

278
Table No. 6.14 Cooperative Societies
In number Sr. No.
Name of the village Agriculture co-operative credit society
Fishermen co-
operative society
Milk co-operative society
Co-operative. marketing
society
Others specify
1 2 3 4 5 6 7 1. Simariya Kala (Muhkhed) 0 0 0 0 0 2. Thunia Ddana
(Chhindwara) 3 3 10 10 0
3. Moadai (Chhindwara) 0 0 0 0 0 Adopted Village 3 3 10 10 0 4. Lahgurua (Muhked) 0 0 1 0 1 5. Omariya (Muhked) 0 0 0 0 0 6. Munga (Parasiya) 0 0 0 0 0 7. Baranga (Parasiya) 0 0 0 0 0 8. Char Gaon Bhat
(Chhindwara) 0 0 0 0 0
9. Dseriya (Chhindwara) 0 0 0 0 0 Cluster Village 0 0 1 0 1
10 Pipariya Birsa (Chhindwara)
0 0 0 0 0
Control Village 0 0 0 0 0
Total 3 3 11 10 1
6.51 Existence of total number of 28 number of cooperative societies covering wide range of
fields is somewhat remarkable, particularly for adopted villages where most of the cooperative societies are existing.
6.52 Present level and prospect of future development of any area can fairly be assessed by the
extent of availability of basic and infrastural facilities in and around the villages. In what follows an attempt has been made to show the availability of such facilities in ten number of villages covered under the study.
BASIC FACILITIES 6.53 The table below shows the location of basic administrative facilities within and around the
ten villages identified for the study;

279
Table No. 6.15 Status of Basic Administrative Facilities
Tahsil head- quarter Block head quarter Sr. No.
Name of the village District head quarter away
from the village KM
Within the village 0 KM
Away from the village
Km
Within the
village 0 KM
Away from the village
Km
1 2 3 4 5 6 7
1. Simariya Kala (Muhkhed) 25 25 12 2. Thunia Ddana (Chhindwara) 10 10 10 3. Moadai (Chhindwara) 10 10 11 Adopted Village
4. Lahgurua (Muhked) 22 22 14 5. Omariya (Muhked) 28 28 14
6. Munga (Parasiya) 12 12 12
7. Baranga (Parasiya) 17 16 16
8. Char Gaon Bhat (Chhindwara) 8 10 10
9. Dseriya (Chhindwara) 6 6 5
Cluster Village
10 Pipariya Birsa (Chhindwara) 11 11 11 Control Village
Total 10 10 10
Table No. 6.15 [Contd…]
Status of Basic Administrative Facilities Gram Panchayat Police Station/sub station Sr.
No. Name of the village
Within the village 0 KM
Away from the village
Km
Within the village 0 KM
Away from the village
Km 1 2 8 9 10 11
1. Simariya Kala (Muhkhed) 1 3 2. Thunia Ddana (Chhindwara) 0 10 3. Moadai (Chhindwara) 2 12 Adopted Village 1
4. Lahgurua (Muhked) 0 3 5. Omariya (Muhked) 3 6 6. Munga (Parasiya) 0 2 7. Baranga (Parasiya) 2 4 8. Char Gaon Bhat (Chhindwara) 2 10 9. Dseriya (Chhindwara) 1 5 Cluster Village 2 10 Pipariya Birsa (Chhindwara) 1 10 Control Village 0
Total 3 7 10

280
6.54 For all the identified ten villages the location of district headquarter is away from the village ranging between 6 kms for village Dseriya [cluster village] to 20 kms for village Omariya [cluster village]. Similar is status of distance for tahsil and block headquarter. Normally such distance factor regarding location of important administrative units has some reverse effect on socio-economic development of any area since the officials who matters remain slightly unaware about the problems of the area as their visits to such habitates are usually infrequent. However, location of Gram Panchayat within 3 number of villages and within easy distance of seven villages is somewhat encouraging as the villagers have sufficient scope of remaining aware about the developmental activities being performed by Gram Panchayat. For most of the village the location of police station is within occassable distance ensuring, to some extent, safety of the inhabitants of identified ten number of villages.
INFRASTRUCTURAL FACILITIES - ROADS
6.55 Roads are one of the basic infrastructures required for development of perhaps all the socio-
economic parameters relating to human development. The status of backwardness of animal husbandry sector and horticulture in rural areas is mainly attributed by the absence of link roads as such products are perishable in nature requiring quick transport for sale in nearby big markets. Perhaps basic cause of the location of poultry and milk farms in nearby cities/towns is the availability of road facility for quick transport of the product in nearby market where even cold storage facilities are available. The table below shows the details;
Table No. 6.16
Road Infrastructure Fair weather road Sr.
No. Name of the village
Within the village 0 Km
Away from the village
Km
Kharanja road within
the village 0 km
1 2 3 4 5 1. Simariya Kala (Muhkhed) 0 0 2. Thunia Ddana (Chhindwara) 0 0 3. Moadai (Chhindwara) 0 Adopted Village 4. Lahgurua (Muhked) 3 0 5. Omariya (Muhked) 0 0 6. Munga (Parasiya) 0 0 7. Baranga (Parasiya) 0 0 8. Char Gaon Bhat (Chhindwara) 0 0 9. Dseriya (Chhindwara) 5 0 Cluster Village 10 Pipariya Birsa (Chhindwara) 0 0 Control Village
Total 8 2 10

281
Table No. 6.16 [Contd…] Road Infrastructure
Link road to all weather road
All weather road Sr. No.
Name of the village
Within the
village 0 Km
Away from the village
Km
Within the
village 0 Km
Away from the village
Km 1 2 6 7 8 9
1. Simariya Kala (Muhkhed) 0 3 2. Thunia Ddana (Chhindwara) 0 4 3. Moadai (Chhindwara) 0 3 Adopted Village
4. Lahgurua (Muhked) 0 4 5. Omariya (Muhked) 0 5 6. Munga (Parasiya) 0 2 7. Baranga (Parasiya) 3 3 8. Char Gaon Bhat (Chhindwara) 0 2 9. Dseriya (Chhindwara) 6 6 Cluster Village
10 Pipariya Birsa (Chhindwara) 0 4 Control Village
Total 8 2 10
6.56 The information contained in the above table reveals a satisfactory status of availability
of road infrastructure in ten identified villages covered under the study. In eight number of villages fair weather roads exist while in two villages the distance of this facility is within accessable limit. Karanja roads made of redimentary square shaped stone are available within all the villages ensuring convenient movement within the village particularly in rainy season with absence of slush around that usually is the source of many dieases, particularly water borne in rural areas. Link roads to all weather roads, being one of the prime agendas of Five ear Plans since the initiation of Minimum Needs Programme, are available within eight number of villages and within easy distance of remaining two number of villages linking all weather roads within an average distance of 3.5 kms away from ten number of identified villages.
Infrastruc tural Facilities - Railway Station, Bus Stand/Bus Stop/
Post Office/S.T.D. Booth 6.57 The table below shows the details;

282
Table No. 6.17 Facilities Regarding Railway Station, Bus Stand, Bus Stop, Post Office, STD Booth
Railway station Bus stand/Bus stop Sr. No.
Name of the village within the
village 0 Km
Away from the village
Km
within the village 0 Km
Away from the village
Km 1 2 3 4 5 6
1. Simariya Kala (Muhkhed) 4 0 2. Thunia Ddana (Chhindwara) 12 3 3. Moadai (Chhindwara) 4 2 Adopted Village 4. Lahgurua (Muhked) 4 1 5. Omariya (Muhked) 6 5 6. Munga (Parasiya) 2 2 7. Baranga (Parasiya) 4 4 8. Char Gaon Bhat
(Chhindwara) 10 3
9. Dseriya (Chhindwara) 8 2 Cluster Village 10 Pipariya Birsa (Chhindwara) 10 2 Control Village Total 10 1 9
Table No. 6.17 [Contd…]
Facilities Regarding Railway Station, Bus Stand, Bus Stop, Post Office, STD Booth Post office STD booth Sr. No. Name of the village
Within the village 0 Km
Away from the village Km
Within the village 0 Km
Away from the village
Km 1 2 7 8 9 10
1. Simariya Kala (Muhkhed) 1 1 2. Thunia Ddana (Chhindwara) 3 3 3. Moadai (Chhindwara) 3 3 Adopted Village 4. Lahgurua (Muhked) 2 0 5. Omariya (Muhked) 3 3 6. Munga (Parasiya) 2 2 7. Baranga (Parasiya) 4 4 8. Char Gaon Bhat (Chhindwara) 3 3 9. Dseriya (Chhindwara) 1 1 Cluster Village 10 Pipariya Birsa (Chhindwara) 2 2 Control Village Total 10 1 9

283
6.58 Though no railway station is situated within any of the selected village but the location of this facility is within convenient reach of the sample villagers. With the availability of satisfactory road network and railway track within a distance of manageable limits, the entire transport infrastructure is supportive to the economics of ten selected villages covered under the study.
6.59 Regarding bus stand/bus stop, the facility is available within village Simariya Kala and in
rest of the nine number of villages these facilities are located within a easy distance. 6.60 Though in non of the villages the post offices exist but their locations are within the easy
reach of the villagers. Similarly for the facility of STD booths, which so far is an urban concept, is available within village Lahgurua [cluster village] while in rest of the 9 number of villages the facility is located within the easy reach of the villagers.
6.61 Thus, transport and communication wise the ten number of identified villages are in
preferred position with positive contribution towards socio-economic development of the area as vouched by survey results.
Infrastructural Facilities - Agriculture Marketing, Fair Price Shop,
Cold Storage 6.62 Fair return to agriculture produce, to a great extent, is ensured by the availability of
marketing facilities like mandi yards, cold storage facilities to avoid distress selling which are as important as making provision for agriculture inputs for enhancement of agriculture production. The table below shows the details of the availability of such facilities within and around the ten number of selected villages covered under the study.
Table No. 6.18
Status of Agriculture Marketing, Fair Price Shops and Cold Storage Regular market Weekly market Mandi Sr.
No. Name of the village
Within the
village 0 Km
Away from the village
Km
Within the
village 0 Km
Away from the village
Km
Within the
village 0 Km
Away from the village
Km
1 2 3 4 5 6 7 8 1. Simariya Kala (Muhkhed) 3 3 25 2. Thunia Ddana
(Chhindwara) 3 3 10
3. Moadai (Chhindwara) 3 3 17 Adopted Village 4. Lahgurua (Muhked) 3 3 22 5. Omariya (Muhked) 6 6 28 6. Munga (Parasiya) 2 2 10 7. Baranga (Parasiya) 4 4 16 8. Char Gaon Bhat
(Chhindwara) 3 3 10
9. Dseriya (Chhindwara) 5 5 5 Cluster Village
10 Pipariya Birsa (Chhindwara)
2 2 10
Control Village
Total 10 10 10

284
Table No. 6.18 [Contd…] Status of Agriculture Marketing, Fair Price Shops and Cold Storage
Sub-Mandi Fair Price Shop Cold Storage Sr. No.
Name of the village Within
the village 0 Km
Away from the village
Km
Within the
village 0 Km
Away from the village
Km
Within the
village 0 Km
Away from the village
Km 1 2 9 10 11 12 13 14
1. Simariya Kala (Muhkhed) 20 1 25 2. Thunia Ddana (Chhindwara) 10 3 10 3. Moadai (Chhindwara) 8 0 10 Adopted Village
4. Lahgurua (Muhked) 22 0 22 5. Omariya (Muhked) 28 3 28 6. Munga (Parasiya) 10 2 10 7. Baranga (Parasiya) 14 2 15 8. Char Gaon Bhat (Chhindwara) 10 3 10 9. Dseriya (Chhindwara) 5 1 3 Cluster Village
10 Pipariya Birsa (Chhindwara) 10 1 10 Control Village Total 10 2 8 10
6.63 The above table shows that in non of the ten identified villages the facilities
regarding regular markets or weekly markets exist though such infrastructures exist within manageable distance from ten identified villages. The mandies, submandies and cold storages are generally located for away from the villages with the exception of villages like Desriya [cluster village] and Moadai [adopted village] where these facilities are located within a manageable distance. Only in two villages viz. Maadai [adopted village] and Lahgurua [cluster village] the fair price shops are located within geographical limits of the villages while in 8 number of villages this facility is located within approachable limits. District administration may consider organizing a regular market by providing basic infrastructure at village Lahgurua having population of 2288 persons which may serve as nucleus for marketing distinations of nearby adopted and cluster villages.
AGRO BASED INDUSTRIAL UNITS 6.64 Agro-based industrial units are important value additons in rural areas taking
care of unemployment and under employment by providing sustainable income and thereby reducing the pressure on and. The table below shows the present status of agro-based industrial units in our sample villages;

285
Table No. 6.19 Status of Agro Based Industrial Units
Flour mill Oil mill Dal mill Sr. No.
Name of the village Within
the village 0 Km
Away from the village
Km
Within the
village 0 Km
Away from the village
Km
Within the
village 0 Km
Away from the village
Km 1 2 3 4 5 6 7 8
1. Simariya Kala (Muhkhed) 0 12 25 2. Thunia Ddana
(Chhindwara) 0 10 10
3. Moadai (Chhindwara) 0 10 10 Adopted Village 4. Lahgurua (Muhked) 0 22 22 5. Omariya (Muhked) 0 28 28 6. Munga (Parasiya) 0 10 12 7. Baranga (Parasiya) 2 16 16 8. Char Gaon Bhat
(Chhindwara) 2 10 10
9. Dseriya (Chhindwara) 1 5 6 Cluster Village 10 Pipariya Birsa
(Chhindwara) 2 10 10
Control Village Total 6 4 10 10
Table No. 6.19 [Contd…]
Status of Agro Based Industrial Units Saw mill Repair of Agr. implements Sr.
No. Name of the village
Within the village 0 Km
Away from the village
Km
Within the village 0 Km
Away from the village
Km 1 2 9 10 11 12
1. Simariya Kala (Muhkhed) 25 25 2. Thunia Ddana (Chhindwara) 10 3 3. Moadai (Chhindwara) 10 10 Adopted Village 4. Lahgurua (Muhked) 22 14 5. Omariya (Muhked) 28 28 6. Munga (Parasiya) 12 2 7. Baranga (Parasiya) 15 4 8. Char Gaon Bhat (Chhindwara) 10 3 9. Dseriya (Chhindwara) 5 0 Cluster Village
10 Pipariya Birsa (Chhindwara) 10 10 Control Village Total 10 1 9

286
6.65 The above table shows that except for flour mills non of the other industrial units like oil mill, dal mill and saw mill are located within the villages identified for the study. In case of flour mills, six number of villages have such units located within their geographical limits while in four villages the locational distance is within manageable limits not exceeding 2 kms. The villages like Baranga and Dseriya having population of 732 and 572 persons respectively may have flour mills within the village limit as the population can sustain this activity. Dseriya is the only village where there is one unit pertaining to repair of agricultural implements. For villages like uniya Dadua [adopted village] Munga, Baranga and Char-Gaon-Bhat [all cluster villages] the repair units are located at a distance of 3 kms, 2 kms, 4 kms and 3 kms respectively which can be considered as manageable distance from rural point of view, thus offering sufficient avenues for repair of agricultural implements to all the ten identified villages covered under the study.
SOCIAL INPUTS – EDUCATION ELEMENTARY EDUCATION – PRIMARY LEVEL 6.66 The Directive Principles of Constitution of India envisages provision of free and compulsory
education to all children upto the age of fourteen years of age before the commencement of 21st century. Now that the 21st century has set in, fresh dead lines have been drawn. The goals of the Universalisation of Elementary Education [U.E.E.] Programme area;
- Universal access to primary schooling facility within a radius of one km and a
middle school within a radius of at least 3 kms. - Universal enrolment of children of age group of 6 to 14 years. - Universal retention of all enrolled children till they complete eight years of
elementary schooling. Against this background, the information has been collected from sample villages. The table below shows the details of primary level of education.
Table No. 6.20
Status of Primary Level of Education Name of the village Primary School Non formal education Sr.
No. Within the village 0 km
With-in 1 km
With-in 2 km
With-in 3 km
> 3 km
Within the village 0 km
Away from the village
km 1 2 3 4 5 6 7 8 9
1. Simariya Kala (Muhkhed) 0 12 2. Thunia Ddana (Chhindwara) 0 3 3. Moadai (Chhindwara) 0 2 Adopted Village
4. Lahgurua (Muhked) 0 22 5. Omariya (Muhked) 0 3 6. Munga (Parasiya) 0 5 7. Baranga (Parasiya) 0 4 8. Char Gaon Bhat (Chhindwara) 3 4 9. Dseriya (Chhindwara) 0 5 Cluster Village
10 Pipariya Birsa (Chhindwara) 0 2 Control Village
Total 9 1 0 10

287
6.67 The above table shows that with the exception of village Char-Gaon-Bhat [cluster village] where the primary school is located at distance of 3 kms, in rest of the nine number of villages the facility of primary school is available within the village periphery. One of the reasons of high literacy percentage in the villages covered under the study is locational advantage of this facility. Village Char-gaon-Bhat, with total population of 262 persons might not be having viability of running a primary school on sustainable basis, may be considered by the destrict administration for opening at least a non-formal education centre meant for working children who can not attend the regular primary educational institution.
ELEMENTARY EDUCATION–MIDDLE LEVEL AND ADULT EDUCATION 6.68 The table below shows the details;
Table No. 6.21
Status of Middle Level and Adult Education Middle School Adult Education Sr.
No. Name of the village
In the village 0 km
Within 5 km
More than 5
km
Within 1 km
Within 2 km
Within 3 km
> 3 km
1 2 9 10 11 11 12 13 14 1. Simariya Kala (Muhkhed) 1 25 2. Thunia Ddana (Chhindwara) 3 4 3. Moadai (Chhindwara) 2 11 Adopted Village
4. Lahgurua (Muhked) 0 20 5. Omariya (Muhked) 3 19 6. Munga (Parasiya) 2 12 7. Baranga (Parasiya) 4 16 8. Char Gaon Bhat
(Chhindwara) 3 8
9. Dseriya (Chhindwara) 2 6 Cluster Village
10 Pipariya Birsa (Chhindwara) 2 10 Control Village
Total 1 9 10
6.69 Though in only one village i.e. Lahgurua [cluster village] the middle school is located within
the village periphery, in rest of the 8 number of villages the middle schools are locted within an easy distance of 2 to 3 kms which is in line with the laid down criterion for availability of middle school within a radius of 3 kms. Only in village Baranga [cluster village] the middle school is located four kms away from the village which again is not much of a distance from rural view point.
6.70 For most of the villages adult education centres are located for away from the village
periphery. Since the percentage literacy of all the ten identified villages is fairly high, the necessity of having such institutions is not felt.
SECONDARY LEVEL OF EDUCATION–HIGH SCHOOL & HIGHER SCHOOL [+2] 6.71 The policy regarding secondary level of education implies extension of school system in
unserved areas consolidating the existing facilities and providing special arrangements for the talented students. In view of the above policy decisions, the following table shows the status of secondary level education in our area of study;

288
Table No. 6.22 Status of Secondary Level Education
High School Higher School (+2) Sr. No.
Name of the village In the village 0 km
Within 5 km
More than 5 km
In the village 0 km
Within 5 km
More than 5 km
1 2 3 4 5 6 7 8 1. Simariya Kala (Muhkhed) 1 1 2. Thunia Ddana (Chhindwara) 3 3 3. Moadai (Chhindwara) 2 2 Adopted Village
4. Lahgurua (Muhked) 3 3 5. Omariya (Muhked) 3 3 6. Munga (Parasiya) 2 2 7. Baranga (Parasiya) 4 4 8. Char Gaon Bhat (Chhindwara) 3 3 9. Dseriya (Chhindwara) 2 2 Cluster Village
10 Pipariya Birsa (Chhindwara) 2 2 Control Village
Total 10 10
6.72 A highly satisfactory extent of availability of secondary level of educational infrastructure
can ve visualized from the above table. For all the ten selected villages covered under the study the facilities of high schools and higher schools [+2] are available within an easy reach of 1 to 3 kms distance. This is an exceptional situation as normally it has been seen that such institutions are situated at distance of more than 5 kms away from the villages.
COLLEGIATE AND TECHNICAL EDUCATION 6.73 The table below shows the details
Table No. 6.23
Status of Collegiate and Technical Education College Industrial Training Instt. Sr.
No. Name of the village
within the village 0
km
within 5 km
more than 5 km
within the village 0 km
within 5 km
more than 5 km
1 2 3 4 5 6 7 8 1. Simariya Kala (Muhkhed) 25 25 2. Thunia Ddana (Chhindwara) 10 10 3. Moadai (Chhindwara) 10 10 Adopted Village
4. Lahgurua (Muhked) 22 22 5. Omariya (Muhked) 28 28 6. Munga (Parasiya) 13 12 7. Baranga (Parasiya) 17 16 8. Char Gaon Bhat (Chhindwara) 8 8 9. Dseriya (Chhindwara) 6 8 Cluster Village
10 Pipariya Birsa (Chhindwara) 11 10 Control Village
Total 10 10

289
In non of the villages colleges or Industrial Training Institutes exist which is obvious as such institutions are usually located at tahsil or district headquarters.
HEALTH 6.74 Improvement in health status of population has been one of the thrust areas in the social
development programmes of the state of Madhya Pradesh. The ultimate objectivew of the health and family welfare activities of the State is to achieve the goal of “Health for All” as outlined in the National Health Policy which emphasized on implementation of primary health care approach.
6.75 In persuit of this goal, a multitier health and family welfare service delivery system has been
established in the State consisting of Sub Health Centres, Primary Health Centres and Community Health Centres. Besides, civil hospitals district hospitals and other special health care institutions have been provided for as a support to three tier system. A mention of the norms accepted for three tier system is given below;
a. Sub Health Centre for every 5,000 population in non-tribal areas and 3,000 population in tribal areas.
b. Primary Health Centre for every 30,000 population in non-tribal areas and 20,000
population in tribal areas. c. Community Health Centre for every 1,20,000 population in non-tribal areas and 80,000
population in tribal areas. 6.76 In view of the population criteria for rural health facilities the consideration for location of
only Sub Health Centres, Rural Family Welfare Centres etc may be considered. The table below shows the details;
Table No. 6.24
Rural Health Infrastructure Sub Health Centre Rural Family Welfare Centre Sr.
No. Name of the village
Within the Village 0 km
Within 5 km
More than 5
km
Within the Village 0 km
Within 5 km
More than 5
km 1 2 3 4 5 6 7 8 1. Simariya Kala (Muhkhed) 1 1 2. Thunia Ddana
(Chhindwara) 3 3
3. Moadai (Chhindwara) 3 1 Adopted Village
4. Lahgurua (Muhked) 3 0 5. Omariya (Muhked) 3 3 6. Munga (Parasiya) 2 2 7. Baranga (Parasiya) 4 2 8. Char Gaon Bhat
(Chhindwara) 3 3
9. Dseriya (Chhindwara) 2 0 Cluster Village
10 Pipariya Birsa (Chhindwara)
2 2
Control Village
Total 10 1 8 1

290
Table No. 6.24 [Contd…] Rural Health Infrastructure
Government Hospital Government Dispensary Sr. No.
Name of the village Within
the village 0 km
Within 5 km
More than 5 km
Within the
village 0 km
Within 5 km
More than 5
km
1 2 9 10 11 12 13 14 1. Simariya Kala (Muhkhed) 12 8 2. Thunia Ddana (Chhindwara) 10 3 3. Moadai (Chhindwara) 10 3 Adopted Village
4. Lahgurua (Muhked) 14 3 5. Omariya (Muhked) 14 14 6. Munga (Parasiya) 12 4 7. Baranga (Parasiya) 16 4 8. Char Gaon Bhat (Chhindwara) 11 3 9. Dseriya (Chhindwara) 6 5 Cluster Village
10 Pipariya Birsa (Chhindwara) 10 2 Control Village
Total 10 8 2
Table No. 6.24 [Contd…] Rural Health Infrastructure
Private Clinic Nursing Home Sr. No.
Name of the village Within the
village 0 km
Within 5 km
More than 5 km
Within the village 0 km
Within 5 km
More than 5 km
1 2 15 16 17 18 19 20 1. Simariya Kala (Muhkhed) 3 25 2. Thunia Ddana (Chhindwara) 3 10 3. Moadai (Chhindwara) 3 10 Adopted Village
4. Lahgurua (Muhked) 0 22 5. Omariya (Muhked) 3 28 6. Munga (Parasiya) 2 0 7. Baranga (Parasiya) 4 0 8. Char Gaon Bhat
(Chhindwara) 3 11
9. Dseriya (Chhindwara) 0 6 Cluster Village
10 Pipariya Birsa (Chhindwara) 2 11 Control Village
Total 2 8 2 8
6.77 Though non of the villages have Sub Health Centres within the village limits but are
located within reachable distance, ranging between one to three kms. Similar is the case with rural family welfare centres where with the exception of the village Lahgurua where this facility is available within the village, in rest of 9 villages the facility is located within manageable limits ranging between one to three kms.

291
6.78 Government Hospitals are located quite at far away distance from identified ten number of villages with obvious reasons that such health infrastructures are usually provided at tahsil or district levels serving as referal units for grass root level health services particularly that of Sub Health Centres and Primary Health Centres. Government Dispensaries are, ofcourse, available within easy reach of the inhabitants of sample villages which serve as support institution to the three tier system of health infrastructure.
6.79 The institution of Private Clinic is gradually becoming popular in rural areas as is evident
from the fact that in our sample area of study two number of villages have private clinics within the village while in eight number of villages the facility is located within an easy distance. The basic cause of incoming of private practitioners usually not a qualified doctor, is the prepetual absence of medical personnel in rural health institutions that compel the rural population to take resort of the quakes, at least for common diseases. Even two number of nursing homes are located in villages like Munga and Baranga [both cluster villages] with population of 687 and 732 persons respectively that further underlines lack of efficiency in government health institutions prompting the private initiatives to prevail over the health related requirements of rural population. The trend is not bad so long such private practioners are not motivated by the profit at the cost of life of the rural inhabitants.
FAMILY WELFARE 6.80 Limiting the size of the family is, perhaps, the most important constituent of family welfare
as population growth, very rightly said, is the reutralising factor of development. The nation wide campaign of family welfare has undoubtedy made a dent both in urban and rural areas. The table below shows the status of acceptors of family welfare measures in sample villages covered under the study;
Table No. 6.25 Status of Acceptors of Family Welfare Measurs
Sr. No
Name of the village
Total Workers
Acceptors of Nirodh (No.of
Benefic-iaries)
Tubectomy (No. of
Benefic-iaries)
Vasectomy (No. of
Benefic-iaries)
Loop Insertion (No. of
Benefic-iaries)
Oral Pills (No. of
Benefic-iaries)
Traditional Methods (No. of
Benefic-iaries)
1 2 3 4 5 6 7 8 9 1. Simariya Kala 348 12 [3.45] 19 [5.46] 1 [0.29] 3[0.86] 11[3.16] 0 2. Thunia Ddana 606 18 [2.97] 40 [6.60] 2 [0.33] 3[0.50] 16[2.64] 0 3. Moadai 328 5 [1.52] 8 [2.44] 0 3[0.91] 6 [1.83] 0 Adopted Village 1282 35 [2.73] 67 [5.23] 3 [0.23] 9[0.70] 33[2.57] 0
4. Lahgurua 917 12 [1.31] 18 [1.96] 2 [0.22] 3[0.33] 9 [0.98] 0 5. Omariya 226 8 [3.54] 6 [2.65] 0 2[0.88] 5 [2.21] 0 6. Munga 350 20 [5.71] 30 [8.57] 3 [0.86] 3[0.86] 25[7.14] 0 7. Baranga 257 11 [4.28] 17 [6.61] 0 0 13[5.06] 0 8. Char Gaon Bhat 147 6 [4.08] 3 [2.04] 0 4[2.72] 6 [4.08] 0 9. Dseriya 305 0 10 [3.28] 0 0 0 0 Cluster Village 2202 57 [2.59] 84 [3.81] 5 [0.23] 12[0.54] 58[2.63] 0
10 Pipariya Birsa 121 7 [5.79] 6 [4.96] 0 3[2.48] 4 [3.31] 0 Control Village 121 7[5.79] 6 [4.96] 0 3[2.48] 4 [3.31] 0 Total 3605 99 [2.75] 157[4.36] 8 [0.22] 24[0.67] 95[2.64] 0
Note : Figures in brackets show the percentage to the figures of column 3.

292
6.81 In the above table the percentage figures have been arrived at on the basis of the figures of the workforce which is not very correct. The percentages should have been on the basis of the figures of eligible couples. Since village wise such figures are not available, therefore, as second option the work force figures that include persons within the age group of 15 to 59 years of age have been taken who may be taken as population with reproductive capacity, particularly of males.
6.82 Against the total figure of 3605 persons in the work force, the total number of persons
adopting various methods of family welfare are 383 which is 10.62 percent to total work force. The performance though not very encouraging but would have presented a better picture had the comparision made with the figures of eligible couples.
6.83 The extent of adoption of family welfare measures, in general, is better in adopted villages
as compared to both cluster and control villages. In line with prevailing trend, the response to acceptance of Nirodh and Tubectomy is more than the other methods.
DRINKING WATER 6.84 The strategies envisaged for the Tenth Plan mainly centred round the qualitative and
quantitative improvement in rural water supply system by raising the level of services from 40 lped to 55 lpd, reduce the maximum distance of water sources from the present 1.6 km to 0.5 km, providing alternate safe water source where existing sources have been contaminated and potable drinking water to new settlements etc.
6.85 Against the back drop of such strategies, the table below shows the existing level of drinking
water facilities in the sample villages;
Table No. 6.26 Status of Drinking Water Facilities
Sources of drinking water Distance from the village
Sl. No.
Name of the Village In the
village 0 km =1 KM =2 KMS. =3 KMS. =4 KMS. 1 2 3 4 5 6 7
Simariya Kala (Muhkhed) 1 Thunia Ddana
(Chhindwara) 0 - - - -
2 Moadai (Chhindwara) 0 - - - - 3 Adopted Village 0 - - - -
Lahgurua (Muhked) 4 Omariya (Muhked) 0 - - - - 5 Munga (Parasiya) 0 - - - - 6 Baranga (Parasiya) 0 - - - - 7 Char Gaon Bhat
(Chhindwara) 0 - - - -
8 Dseriya (Chhindwara) 0 - - - - 9 Cluster Village 0 - - - -
Pipariya Birsa (Chhindwara)
10 Control Village 0 - - - -
Total 10 - - - -

293
6.86 The above table shows that in all the ten number of sample villages one or other drinking water source, mostly hand-pumps, is available within the village which is the result of massive work of installation of hand pumps in rural areas undertaken by the State Government.
6.87 In what follows an attempt has been made to summarise the details of the village
particulars. - A very genuine question may arise as to the necessity of detailed analysis of the
existence of facilities both infrastructural and otherwise in identified ten villages when the basic aim of the study is to highlight the impact of the performance of the K.V.Ks. in transferring agriculture related technologies to the farming communities. The answer is simple as the availability of basic facilities in and around the villages are prerequisites for absorption and implementation of any knowledge what-so-ever. Any attempt to transfer knowledge of efficiency to a back of the beyond village may prove fertile because of the constraints of basic facilities that cause negetive attitudinal status. But this does not mean that such villages should be left in lurch. Any way this being altogether a different topic is left for the time being.
- In seven number of identified villages viz Moadai, Lahgurua, Omariya Munga, Baranga, Oseria and Pipariya Birsa the percentage of ST population is much more than SC population.
- Even with the preponderence of substantial tribal population the percentage literacy is quite high that ranged between 57.6 percent in village Baranga [cluster village] to 86.6 percent in village Simriya Kalan [adopted village] close to the district percentage literacy level of 66.03 and state percentage literacy level of 64.11.
- The work participation rate is generally high among males than females, except for the village Omeriya [cluster village] where a reverse trend is visible.
- The proportion of marginal workers is usually much lower as compared the proportion of main workers indicating over all lack of additional work opportunities particularly generated by various welfare schemes of the government. The preponderence of female marginal workers over males is visible mainly due to the fact that area of the study is adequated by tribal communities where work culture is equally high among females as well.
- The proportion of non-workers to total population that ranged between 43.9 percent in village Char-Gaon-Bhat [cluster village] to 64.9 percent in village Baranga [cluster village] presents a dismal picture as it shows higher percentage of dependent population.
- Agriculture is the main occupation of the inhabitants of the ten number of identified villages covered under the study as the combined average percentage of cultivators and agriculture labour is 81.3 to total workers. In general, the proportion of cultivators to total workers is more than that of agriculture labour which is positive indication.
- In case of agriculture labour the percentage of female participation, in general, is more than that of males which seems obvious as the villages covered under the study have substantial tribal population.
- The proportion of household workers to total workers is far from being satisfactory that ranged between 0.9 percent in village Omeriya [cluster village] to 4.6 percent in village Munga [cluster village].
- Regarding land use details 85.32 percent area to total geographical area is under gross cropped area that confirms that the main occupation of identified ten villages is agriculture. The percentage of gross irrigated area to gross cropped area is 35.76 which is more than the district and state average figures of 22.51 percent and 28.54 percent respectively.

294
- All the ten number of villages covered under the study are electrified with irregular power supply situation ranging between 8 hours per day for village Moadai [adopted village] to 14 hours per day for village Lahgurua and Omeriya [both cluster villages]
- The total number of pump-sets energized [electricity] is 482 [as on the date of the survey] which is 0.75 percent to total number of pump sets energized for district Chhindwara that stands at 64584 for the year 1999-2000.
- Existence of total number of 27 number of cooperative societies covering wide range of fields is somewhat remarkable particularly for adopted villages where most of the cooperative societies are located.
- The status of availability of road infrastructure in ten identified villages covered under the study is satisfactory.
- In non of the ten identified villages the facilities regarding regular markets or weekly markets exist but such infrastructures are located within the manageable distance from the ten number of identified villages.
- With the exception of the village Char-Gaon-Bhat where the primary school is located at a distance of 3 kms., in rest of nine number of villages the facility of primary school is available within the village periphery.
- Though in only one village i.e. Lahgurua [cluster village] the middle school is located within the village periphery, in rest of the 8 number of villages the middle schools located within an easy distance of 2 to 3 kms which is in line with laid down criterion of availability of middle school within a radius of 3 kms. Only for village Baranga [cluster village] the middle school is located four kms. away from the village.
- For all the ten selected villages covered under the study the facilities of high schools and higher schools [+] are available within an easy distance of 1 to 3 kms from the village. This is an exceptional situation as normally it has been seen that such institutions are situated at a distance of more than 5 kms away from the village.
- Though non of the villages have Sub Health Centres within the village limits, but are located within reachable distance ranging between one to three kms. Similar is the situation with the location of facility regarding Rural Family Welfare Centres.
- Regarding location of private clinics, two number of villages have this facility within the village limits while in eight number of villages this facility is located within an easy distance. Even two number of Nursing Homes are located in villages Munga and Baranga [coth cluster villages].
- Against the total figure of 3605 persons in the work force, the total number of persons adopting various methods of family welfare are 383 which is 10.62 percent to total work force.
- In all the ten number of sample villages one or other drinking water source, mostly hand pumps are available.
Results of Survey - Household Particulars 6.88 The present part of the chapter deals with the information relating to the households in the
following dimensions; (i) Macro Dimensions – Wherein information from all the households residing in 10 number of
sample villages has been collected. (ii) Micro Dimensions – Wherein 25 percent of the households have been identified for the
detailed enquiry. 6.89 In what follows an attempt has been made to deal with both the macro and micro dimensions
based on the information collected through House Listing Schedule and household Schedule respectively.

295
MACRO DIMENSIONS – GENERAL PARTICULARS 6.90 The table below shows the details;
Table No. 6.27 Household Details
S. No.
Name of the Village No. of household as on the date of survey
Population Census-2001
Average size of family (based on the figure of col.4
1 2 3 4 5 1. Simariya Kala (Muhkhed) 105 733 7 2. Thunia Ddana (Chhindwara) 143 1335 9 3. Moadai (Chhindwara) 95 677 7 Adopted Village 343 2745 8
4. Lahgurua (Muhked) 104 2288 22 5. Omariya (Muhked) 45 443 10 6. Munga (Parasiya) 93 687 7 7. Baranga (Parasiya) 130 732 6 8. Char Gaon Bhat (Chhindwara) 55 262 5 9. Dseriya (Chhindwara) 80 572 7 Cluster Village 507 4984 10
10 Pipariya Birsa (Chhindwara) 57 300 5 Control Village 57 300 5 Total 907 8029 9
6.91 The total number of households as on the date of survey is 907 for all the ten number of
villages covered under the study. The average size of the family comes to 9 persons which is more than the average size of the family of 5 persons. In village Lahgurua [cluster village] the family size is 22 person which is exceptionally high requiring the special attention of district administration.
SOCIAL STATUS OF THE HOUSEHOLDS 6.92 The table below shows the details;
Table No. 6.28 Social Status of the Households.
Caste (Social classification) Interaction with KVK S. No.
Name of the Village No. of Household S.T. S.C. O.B.C. General Yes No
1 2 3 4 5 6 7 8 9 1. Simariya Kala (Muhkhed) 105 1 5 99 0 33 72 2. Thunia Ddana (Chhindwara) 143 14 6 123 0 20 123 3. Moadai (Chhindwara) 95 41 13 41 0 38 57 Adopted Village 343 56 24 263 0 91 252
4. Lahgurua (Muhked) 104 0 6 98 0 36 68 5. Omariya (Muhked) 45 23 7 15 0 20 25 6. Munga (Parasiya) 93 35 30 27 1 9 84 7. Baranga (Parasiya) 130 108 7 14 1 14 116 8. Char Gaon Bhat (Chhindwara) 55 21 7 26 1 14 41 9. Dseriya (Chhindwara) 80 2 37 36 5 25 55 Cluster Village 507 189 94 216 8 118 389
10 Pipariya Birsa (Chhindwara) 57 18 4 23 12 2 55 Control Village 57 18 4 23 12 2 55
Total 907 263 122 502 20 211 696

296
6.93 The above table shows the preponderance of households from S.T., S.C. and O.B.C. communities that constitute 84.34 percent to total number of 907 households whereas the combined percentage of S.C. and General Communities is 15.66 to total number of households.
HOUSEHOLDS CLASSIFIED ON THE BASIS OF RELIGION 6.94 The table below shows the details;
Table No. 6.29 Distribution of Households on the Basis of Religion
S. No.
Name of the Village No. of Household
Hindu Muslim Sikh Christian Nu-Buddh
1 2 3 4 5 6 7 8 1. Simariya Kala (Muhkhed) 105 105 0 0 0 0 2. Thunia Ddana (Chhindwara) 143 143 0 0 0 0 3. Moadai (Chhindwara) 95 95 0 0 0 0 Adopted Village 343 343 0 0 0 0
4. Lahgurua (Muhked) 104 104 0 0 0 0 5. Omariya (Muhked) 45 45 0 0 0 0 6. Munga (Parasiya) 93 93 0 0 0 0 7. Baranga (Parasiya) 130 130 0 0 0 0 8. Char Gaon Bhat (Chhindwara) 55 54 1 0 0 0 9. Dseriya (Chhindwara) 80 80 0 0 0 0 Cluster Village 507 506 1 0 0 0
10 Pipariya Birsa (Chhindwara) 57 57 0 0 0 0 Control Village 57 57 0 0 0 0
Total 907 906 1 0 0 0
6.95 Against the total number of 907 households, 906 households are the followers of Hindu
religion while only one household is the follower of Muslim religion.
OCCUPATIONAL DISTRIBUTION OF HOUSEHOLDS – MAIN OCCUPATION PRIMARY SECTOR – AGRICULTURE 6.96 The table below shows the details;
Table No. 6.30 Household According to their Main Occupation – Agriculture
S. No.
Name of the Village No. of household
Marginal Farmers
Small Farmers
Other Farmers
Agriculture Labour
1 2 3 4 5 6 7 1. Simariya Kala (Muhkhed) 105 2 20 66 0 2. Thunia Ddana (Chhindwara) 143 17 31 87 0 3. Moadai (Chhindwara) 95 19 34 29 1 Adopted Village 343 57[16.62] 85[24.78] 182[53.06] 1 [0.29]
4. Lahgurua (Muhked) 104 27 31 22 1 5. Omariya (Muhked) 45 27 11 5 0 6. Munga (Parasiya) 93 29 22 31 5 7. Baranga (Parasiya) 130 39 39 22 7 8. Char Gaon Bhat (Chhindwara) 55 15 9 15 7 9. Dseriya (Chhindwara) 80 58 11 10 0 Cluster Village 507 195 [38.46] 123 [24.26] 105 [20.71] 20 [3.94]
10 Pipariya Birsa (Chhindwara) 57 24 15 9 3 Control Village 57 24 [42.11] 15 [26.32] 9 [15.19] 3 [5.26]
Total 907 276 [30.43] 223 [24.59] 296 [32.64] 24 [2.65]
Note : Figures in brackets show percentage to total number of households.

297
6.98 Out of the total number of 907 households, 819 number of households are engaged directly in agriculture accounting for 90.30 percent to total number of households. Small and other farmers together constitute 56.60 percent to total households that shows vaible nature of agricultre being pursued as main source of livelihood. The total number of households in the groups of marginal farmers and agriculture labour are 300 [33.08 percent] which are vulnurable households prone to migrate during lean season of agriculture.
6.99 In adopted villages the combined percentage of small and other farmers usually having
viable size of land holdings is 77.84, much higher than what is prevailing in cluster and control villages that indicates the rationale of the selection of villages in the adopted group as transfer of agriculture related technology through vocational training, front line demonstration and on farm testing is convenient when the holdings are sizeable. Though there are agriculture related technologies for even smaller holdings covering marginal farmers but generally in rural areas it has been seen that such cultivators are not serious about their farming occupation and resort to other sundry jobs as a stand-by to their main occupation. Obviously the urge to adopt improved agriculture related technology is generally missing among them.
6.100 The pursuance of occupations like minor forest produce collection, live stock, fishing and
hunting activities are completely missing among sample households presenting a negetive state of affairs as these occupations are good sources of augmenting household income through alternate sources, thereby reducing extent of under employment among farming communities.
SECONDARY AND TERTIARY SECTORS 6.101 The secondary and tertiary sector occupations, being meaningful destinations that offer work
opportunities to absorbe the workforce engaged in marginal farming or pursuing the occupation of agriculture labour. The table below shows the details;
Table No. 6.31
Households According to their Main Occupations – Secondary and Tertiary Sectors Secondary Sector Tertiary Sector S.
No. Name Of The Village No. of
Household Servicing And Repairs
Construction Work
Government Service
Service in Private Sector
1 2 3 4 5 6 7 1. Simariya Kala (Muhkhed) 105 0 0 0 0 2. Thunia Ddana (Chhindwara) 143 0 0 0 1 3. Moadai (Chhindwara) 95 0 0 0 5 Adopted Village 343 0 0 0 6
4. Lahgurua (Muhked) 104 0 0 2 2 5. Omariya (Muhked) 45 0 0 2 5 6. Munga (Parasiya) 93 0 0 0 0 7. Baranga (Parasiya) 130 0 0 0 8 8. Char Gaon Bhat
(Chhindwara) 55 0 0 0 0
9. Dseriya (Chhindwara) 80 0 0 0 0 Cluster Village 507 0 0 4 15
10 Pipariya Birsa (Chhindwara) 57 0 0 0 1 Control Village 57 0 0 0 1
Total 907 0 0 4 22

298
6.102 The situation emerging from the above table is somewhat dismal. The complete absence of secondary sector activities among sample households is indicative of the fact the inhabitants of the sample villages have to fall back entirely upon agriculture for earning livelihood which at times compel them to migrate to nearby areas having job opportunities, particularly in lean season of agriculture or in conditions of crop failure. In tertiary sector only 26 households are engaged, mainly in private sector, which is hardly meaningful.
OCCUPATIONAL DISTRIBUTION OF HOUSEHOLDS – SUBSIDIARY OCCUPATIONS
PRIMARY SECTOR – AGRICULTURE 6.103 The table below shows the details;
Table No. 6.32
Households According to their Subsidiary Occupation – Agriculture S.
No. Name of the Village No. of
household Marginal Farmers
Small Farmers
Other Farmers
Agriculture Labour
1 2 3 4 5 6 7 1. Simariya Kala (Muhkhed) 105 0 2 5 30 2. Thunia Ddana (Chhindwara) 143 0 5 3 67 3. Moadai (Chhindwara) 95 1 8 3 75 Adopted Village 343 1[0.29] 15[4.37] 11[3.21] 172[50.15]
4. Lahgurua (Muhked) 104 2 12 1 72 5. Omariya (Muhked) 45 2 15 0 20 6. Munga (Parasiya) 93 2 17 0 30 7. Baranga (Parasiya) 130 2 21 0 55 8. Char Gaon Bhat (Chhindwara) 55 2 22 0 21 9. Dseriya (Chhindwara) 80 3 24 0 38 Cluster Village 507 13 [2.56] 111 [21.89] 1 [0.20] 236 [46.55]
10 Pipariya Birsa (Chhindwara) 57 7 24 3 19 Control Village 57 7 [12.28] 24 [42.11] 3 [5.26] 19
Total 907 21 [2.32]
150 [16.54]
15 [1.65]
427 [47.08]
Note : Figures in brackets show percentage to total number of households. 6.104 The agriculture as subsidiary occupation is being pursued by 613 number of households
which is 67.59 percent to total number of households. The combined high percentage of marginal farmers, small farmers and agriculture labour which comes to 65.93 to total of 907 households, pursuing agriculture as subsidiary occupation is understandable as such cultivators usually have to resort to add jobs in nearby places to sustain their livelihoods but the agriculture as subsidiary occupation being pursued by 15 number of other farmers generally having sizable land holdings is somewhat paradoxical. Usually such farmers live in nearby bigger settlements and the cultivation is done by other persons on the basis of certain financial or barter agreements.
PRIMARY SECTOR – FOREST, LIVESTOCK, FISHERIES, HUNTING 6.105 The table below shows the details;

299
Table No. 6.33 Households According to their Subsidiary Occupation – Forest, Livestock, Fisheries, Hunting
S. No.
Name of The Village No. of Household
Minor Forest Produce
Collection
Livestock Activities
Fishing Activities
Hunting Activities
1 2 3 4 5 6 7 1. Simariya Kala (Muhkhed) 105 0 0 0 0 2. Thunia Ddana (Chhindwara) 143 0 0 0 0 3. Moadai (Chhindwara) 95 0 0 0 0 Adopted Village 343 0 0 0 0
4. Lahgurua (Muhked) 104 0 0 0 0 5. Omariya (Muhked) 45 0 0 0 0 6. Munga (Parasiya) 93 0 0 0 0 7. Baranga (Parasiya) 130 9 0 0 0 8. Char Gaon Bhat (Chhindwara) 55 0 0 0 0 9. Dseriya (Chhindwara) 80 0 0 0 0 Cluster Village 507 9 0 0 0
10 Pipariya Birsa (Chhindwara) 57 0 0 0 0 Control Village 57 0 0 0 0
Total 907 9 0 0 0
6.106 The near absence of activities allied to agriculture is somewhat discouraging as such
activities are income additive to household earnings arresting the tendency of migration during the lean season of agriculture.
SECONDARY AND TERTIARY SECTORS 6.107 The table below shows the details;
Table No. 6.34 Households According to their Subsidiary Occupations – Secondary and Tertiary Sectors
Secondary Sector Tertiary Sector S. No.
Name of The Village No. of Household Servicing
and Repairs Construc-tion Work
Govt. Service
Service in Private Sector
1 2 3 4 5 6 7 1. Simariya Kala (Muhkhed) 105 0 0 14 0 2. Thunia Ddana (Chhindwara) 143 0 0 14 6 3. Moadai (Chhindwara) 95 0 0 0 4 Adopted Village 343 0 0 28 10
4. Lahgurua (Muhked) 104 0 0 7 3 5. Omariya (Muhked) 45 0 0 0 3 6. Munga (Parasiya) 93 0 0 8 3 7. Baranga (Parasiya) 130 1 0 0 12 8. Char Gaon Bhat (Chhindwara) 55 0 0 5 0 9. Dseriya (Chhindwara) 80 0 0 3 3 Cluster Village 507 1 0 23 24
10 Pipariya Birsa (Chhindwara) 57 0 0 0 0 Control Village 57 0 0 0 0
Total 907 1 0 51 34
6.108 Households engaged in secondary and tertiary sectors are negligible. Family members from
51 families [5.62 percent] are employed in government service while family members from 34 families are employed in private sector constituting 3.75 percent to total households.

300
6.109 The overall conclusion that can be drawn from the information relating to occupational distribution of the households is that agriculture is main occupation of the households residing in ten number of identified villages covered under the study.
AVERAGE MONTHLY INCOME 6.110 The table below shows the details;
Table No. 6.35
Average Monthly Income S.
No. Name of the Village No. of
House hold
Blow Rs.500
Rs.5001 to Rs.600
Rs.601 to
Rs.700
Rs.701 to
Rs.800
Rs.801 to
Rs.900
Rs.901 to
Rs.1000
Rs.1001 and
Above 1 2 3 4 5 6 7 8 9 10 1. Simariya Kala
(Muhkhed) 105 0 0 0 0 0 13 92
2. Thunia Ddana (Chhindwara)
143 1 0 0 0 0 17 125
3. Moadai (Chhindwara) 95 0 0 0 0 0 9 86 Adopted Village 343 1 0 0 0 0 39 303
4. Lahgurua (Muhked) 104 0 0 0 0 0 13 91 5. Omariya (Muhked) 45 0 0 0 0 0 5 40 6. Munga (Parasiya) 93 0 0 0 0 0 21 72 7. Baranga (Parasiya) 130 0 0 0 2 0 20 108 8. Char Gaon Bhat
(Chhindwara) 55 0 0 0 0 0 9 46
9. Dseriya (Chhindwara)
80 0 0 0 0 0 13 67
Cluster Village 507 0 0 0 2 0 81 424
10 Pipariya Birsa (Chhindwara)
57 3 0 0 5 0 10 39
Control Village 57 3 0 0 5 0 10 39
Total 907 4 0 0 7 0 130 766
6.111 The total number of households in the average monthly income range of Rs. 901.00 to Rs.
1001.00 and above is 896 which is 98.79 percent to total number of households that indicate the affluence level of the area. Since 56.60 percent households are within the category of small and other farmers having viable size of land holdings the affluent income levels seem obvious. In adopted villages this percentage is 99.71 while in cluster villages the percentage is 99.61 percent. Even in control village where there is no intervention of K.V.K., the total number of households in the average monthly income range of Rs. 901.00 to Rs. 1001.00 and above is 49 accounting for 85.96 percent to total number of 57 households.

301
AVERAGE MONTHLY EXPENDITURE 6.112 The table below shows the details;
Table No. 6.36 Average Monthly Expenditure
S. No.
Name of the Village
No. of Household
Blow Rs.500
Rs.501 to
Rs.600
Rs.601 to
Rs.700
Rs.701 to
Rs.800
Rs.801 to
Rs.900
Rs.901 to
Rs.1000
Rs.1001 and
Above 1 2 3 4 5 6 7 8 9 10 1. Simariya Kala
(Muhkhed) 105 0 0 0 0 0 1 104
2. Thunia Ddana (Chhindwara)
143 0 0 0 0 0 8 135
3. Moadai (Chhindwara)
95 0 0 0 0 0 11 84
Adopted Village 343 0 0 0 0 0 20 323 4. Lahgurua
(Muhked) 104 0 0 0 0 0 6 98
5. Omariya (Muhked) 45 0 0 0 0 0 7 38 6. Munga (Parasiya) 93 0 0 0 0 0 1 92 7. Baranga (Parasiya) 130 0 0 0 3 0 18 109 8. Char Gaon Bhat
(Chhindwara) 55 0 0 0 0 0 1 54
9. Dseriya (Chhindwara)
80 0 0 0 0 0 0 80
Cluster Village 507 0 0 0 3 0 33 471
10 Pipariya Birsa (Chhindwara)
57 3 0 0 3 0 6 45
Control Village 57 3 0 0 3 0 6 45
Total 907 3 0 0 6 0 59 839
6.113 In line with income levels, the maximum number of 898 households are within the average
monthly expenditure range of Rs. 901.00 to Rs. 1001.00 and above which is 99.01 percent to total number of households with the break-up of cent percent for adopted villages, 99.41 percent for cluster villages and 89.47 percent for control village.

302
6.114 To sum up it may be mentioned that - The average size of the family of households residing in the sample area of study is 9
persons which is more than the standard size of the family of 5 persons. In village Lahgurua [cluster village] the average size of the family is 22 persons which is exceptionally high requiring special attention of district administration.
- Preponderance of households from S.T. and O.B.C. communities is visible constituting 84.34 percent to total number of 907 households.
- The sample area is predominated by followers of Hindu religion that constitute 99.89 percent to total households.
- Agriculture is the main stay of the households residing in identified ten numbers of villages as 90.30 percent households as compared to total households are engaged directly in agriculture occupation as prime source of livelihood. Small and other farmers [having sizeable land holding] together constitute 56.60 percent to total household that shows viability of agriculture being pursued as main occupation.
- The pursuance of occupations like minor forest produce collection, livestock, fishing and hunting activities are completely missing among sample households.
- The complete absence of secondary sector activities among sample households is indicative of the fact that inhabitants of sample villages have to fall back on agriculture for earning livelihood which at times compel them to migrate to nearby areas having job opportunities.
- The combined high percentage of marginal farmers, small farmers and agriculture labour which comes to 65.93 to total of 907 households pursuing agriculture as subsidiary occupation is obvious as such cultivators have to resort to odd jobs to sustain their livelihoods.
- The near absence of activities allied to agriculture as subsidiary occupation is discouraging as such activities are income additives to household earnings.
- Similarly the households engaged in secondary and tertiary sectors as secondary occupations are negligible.
- The total number of households in the average monthly income range of Rs. 901.00 to Rs. 1001.00 and above is 896 which is 98.79 percent to total number of households indicating the affluence level of the area.
- In line with income levels, the maximum number of 898 households are within the average monthly expenditure range of Rs. 901.00 to Rs. 1001.00 and above which is 99.01 percent to total households.
RESULTS OF THE SURVEY – MICRO DIMENSION 6.115 In the section of write-up, 25 percent of the households have been identified for detailed
inquiry. Though the 25 percent of the households of the total of 907 households comes to 226 but we have taken 224 households because of mainly due to their demographic elements. However, a few number plus or minus from the determined parameter is not much meaningful so long it does not vitiate the results of the survey.
DEMOGRAPHIC PARTICULARS – MALE –FEMALE DISTRIBUTION 6.116 The table below shows the details;

303
Table No. 6.37 Male – Female Distribution
Age, Male S. No.
Name of the Village No. of Families Selected
No. of Family
Members
Male Total 0-10
Years 10-20 Years
20-30 Years
30-40 Years
40-50 Years
50-60 Years
60 Years and
Above 1 2 3 4 5 6 7 8 9 10 11 12 1. Simariya Kala
(Muhkhed) 27 130 76 13 29 13 6 9 5 1
2. Thunia Ddana (Chhindwara)
35 179 88 25 23 6 19 6 8 1
3. Moadai (Chhindwara) 22 155 80 14 22 16 11 7 9 1 Adopted Village 84 467 244 52 74 35 36 22 22 3
4. Lahgurua (Muhked) 26 158 89 34 19 7 11 11 2 5 5. Omariya (Muhked) 12 70 32 14 5 5 5 2 1 0 6. Munga (Parasiya) 22 129 67 13 18 12 12 5 5 2 7. Baranga (Parasiya) 32 197 95 28 24 8 16 13 2 4 8. Char Gaon Bhat
(Chhindwara) 14 77 36 12 10 3 8 3 0 0
9. Dseriya (Chhindwara) 20 112 64 23 12 6 13 2 3 5 Cluster Village 126 743 383 124 88 41 65 36 13 16
10 Pipariya Birsa (Chhindwara)
14 71 36 6 10 6 6 6 0 2
Control Village 14 71 36 6 10 6 6 6 0 2
Total 224 1278 663 182 172 82 107 64 35 21
Table No. 6.37 [Contd…]
Male – Female Distribution Age, Female S.
No. Name Of The Village No. of
Families Selected
No. of Family
Members
Female
Total 0-10
Years 10-20 Years
20-30 Years
30-40 Years
40-50 Years
50-60 Years
60 Years and
Above 1 2 3 4 13 14 15 16 17 18 19 20
1. Simariya Kala (Muhkhed)
27 130 54 15 11 8 9 8 2 1
2. Thunia Ddana (Chhindwara)
35 179 91 32 16 15 14 6 5 3
3. Moadai (Chhindwara) 22 155 75 16 16 14 8 7 11 3 Adopted Village 84 464 220 63 43 37 31 21 18 7 4. Lahgurua (Muhked) 26 158 69 15 21 12 9 8 1 3 5. Omariya (Muhked) 12 70 38 15 8 8 4 2 0 1 6. Munga (Parasiya) 22 129 62 14 16 11 10 6 1 4 7. Baranga (Parasiya) 32 197 102 30 28 8 20 7 4 5 8. Char Gaon Bhat
(Chhindwara) 14 77 41 17 10 5 9 0 0 0
9. Dseriya (Chhindwara) 20 112 48 16 8 11 7 2 3 1 Cluster Village 126 743 360 107 91 55 59 25 9 14 10 Pipariya Birsa
(Chhindwara) 14 71 35 8 10 4 7 4 1 1
Control Village 14 71 35 8 10 4 7 4 1 1 Total 224 1278 615 178 144 96 97 50 28 22

304
6.117 Out of the total number of 1278 family members [which can also be considered as the total population of sample households] the male members are 663, constituting 51.88 percent to total family members, while far females this percentage is 48.12. The number of males within the population group of 20 to 60 years considered to be the labour force of the area is 288 which is 43.44 percent to total male family members, is representative of the fact that substantial number of males are available for work. In case of females, this percentage is 44.06, again indicating the availability of substantial number of females for producing marketable commodity as usually the females have to do the household work which is not marketable. Similar trend is more or less prevailing among the male-female population of adopted, cluster and control villages. The percentage of dependent population among males in the age group of 0-10 years and 60 years and above is 30.62 to total number of males which is a negetive factor since this group of population do not contribute much towards family income. Similarly among females this percentage is 32.52 showing higher extent of dependent population as compared to males. The percentage of dependent population among males in adopted villages is 22.54 and that in cluster villages is 36.55 that leaves a sufficient ground for implementation of latest technology in the area.
EDUCATIONAL STATUS OF SAMPLE HOUSEHOLDS 6.118 Literacy and education are the prerequisites for adoption of any technology what-so-ever,
requiring mental participation. Therefore, information regarding the educational status of the sample households has been collected to study the impact of literacy/education levels over the acceptability of agriculture related technology. The table below shows the details;
Table No. 6.38
Educational Status S.
No. Name Of The Village No. of
Families Selected
No. of Family
Members
Illiterate Literate without going to school
Primary No.
Middle No.
1 2 3 4 5 6 7 8 1. Simariya Kala (Muhkhed) 27 130 41 0 49 51 2. Thunia Ddana
(Chhindwara) 35 179 24 6 81 44
3. Moadai (Chhindwara) 22 155 54 2 47 29 Adopted Village 84 464 119 8 177 124
4. Lahgurua (Muhked) 26 158 38 9 44 31 5. Omariya (Muhked) 12 70 19 2 21 15 6. Munga (Parasiya) 22 129 20 2 46 41 7. Baranga (Parasiya) 32 197 53 2 83 38 8. Char Gaon Bhat
(Chhindwara) 14 77 0 1 25 32
9. Dseriya (Chhindwara) 20 112 10 0 40 24 Cluster Village 126 743 140 16 259 181
10 Pipariya Birsa (Chhindwara)
14 71 19 5 17 16
Control Village 14 71 19 5 17 16 Total 224 1278 278 29 453 321

305
Table No. 6.38 [Contd…] Educational Status
S. No
Name of The Village No. of Families Selected
No. of Family
Members
High School
No.
Higher School
No.
Graduate No.
Post Graduate
No.
Others No.
1 2 3 4 9 10 11 12 13 1. Simariya Kala
(Muhkhed) 27 130 10 0 0 0 0
2. Thunia Ddana (Chhindwara)
35 179 18 1 0 0 0
3. Moadai (Chhindwara) 22 155 35 10 3 0 0 Adopted Village 84 464 63 11 3 0 0
4. Lahgurua (Muhked) 26 158 22 4 1 0 0 5. Omariya (Muhked) 12 70 4 3 0 0 0 6. Munga (Parasiya) 22 129 15 4 2 0 0 7. Baranga (Parasiya) 32 197 8 3 1 0 0 8. Char Gaon Bhat
(Chhindwara) 14 77 10 0 0 0 0
9. Dseriya (Chhindwara) 20 112 12 10 4 0 0 Cluster Village 126 743 71 24 8 0 0
10 Pipariya Birsa (Chhindwara)
14 71 13 2 2 0 0
Control Village 14 71 13 2 2 0 0 Total 224 1278 147 37 13 0 0
6.119 The above table shows a total of 278 persons as illiterate which is 21.75 percent to total
family members. The extent of illiteracy is within reasonable limit which, ofcourse, is positive indication. The total number of children attending elementary level of education [primary + middle] is 774 accounting for 60.56 percent to total family member is again an encouraging factor indicating proper implementation of the programme of universalisation of Elementary Education in our area of study while number of students attending secondary level of education [high school + higher school (+)] is 184 which is 14.70 percent to total family members – a near satisfactory level. The extent of higher education is not impressive, reason being the lack of higher educational facilities in the area. The overall educational status that emerges proceeds to show the absorption capacity of the people of the sample area to adopt various technologies regarding agriculture communicated particularly by the K.V.K.
OCCUPATIONAL DISTRIBUTION OF HOUSEHOLDS–MAIN OCCUPATION 6.120 Out of the total of 1278 family members of sample households 244 persons are engaged in
various main occupations that comes to 19.10 percent to total number of persons in identified sample households for detailed enquiry. In what follows an attempt has been made to analyse the information pertaining to main occupation.
AGRICULTURE OCCUPATIONS 6.121 The table below shows the details;

306
Table No. 6.39 Main Occupation – Agriculture
S. No.
Name of The Village No. of families selected
No. of family
members
Small Farmer
Marginal Farmer
Farmer Agriculture Labour
1. Simariya Kala (Muhkhed) 27 130 0 0 25 0 2. Thunia Ddana (Chhindwara) 35 179 2 1 34 1 3. Moadai (Chhindwara) 22 155 5 0 16 0 Adopted Village 84 464 7 1 75 1
4. Lahgurua (Muhked) 26 158 3 0 25 0 5. Omariya (Muhked) 12 70 4 0 8 1 6. Munga (Parasiya) 22 129 1 0 23 1 7. Baranga (Parasiya) 32 197 18 0 15 0 8. Char Gaon Bhat (Chhindwara) 14 77 1 0 12 1 9. Dseriya (Chhindwara) 20 112 5 0 16 3 Cluster Village 126 743 32 0 99 6
10 Pipariya Birsa (Chhindwara) 14 71 2 1 11 1 Control Village 14 71 2 1 11 1 Total 224 1278 41 2 185 8
6.122 One of the satisfactory trends as depicted by the above table is that the bulk of the farming
community is from the category of farmers consisting cultivatiors [185 number] having sizeable land holdings constituting 14.48 percent to total of 1278 family members and 75.82 percent to total of 244 persons pursuing various main occupations. In case of adopted and cluster villages the percentage of farmers to total family members is 16.16 and 13.32 respectively while as compared to total main workers these percentages are 96.45 and 97.16 respectively. Thus the application of agriculture related technology through K.V.K. in particular and other agencies in general is convenient in adopted and cluster villages.
6.123 The complete absence of occupations relating to activities allied to agriculture in our
area of study is somewhat discouraging as these activities help in diversification of agriculture, thereby reducing the pressure onland.
OCCUPATIONS RELATING TO SECONDARY AND TERTIARY SECTORS 6.124 The table below shows the details;
Table No. 6.40 Main Occupation – Secondary and Tertiary Sectors
S. No
Name of The Village No. of families selected
No. of family
members
Manufac-turing of by
Product
Servicing and repairs
Const-ruction work
Govt. Service
Service in Pvt. Sector
1. Simariya Kala (Muhkhed) 27 130 0 1 0 0 0 2. Thunia Ddana (Chhindwara) 35 179 0 2 0 0 0 3. Moadai (Chhindwara) 22 155 0 0 0 1 0 Adopted Village 84 464 0 3 0 1 0
4. Lahgurua (Muhked) 26 158 0 0 2 0 0 5. Omariya (Muhked) 12 70 0 0 0 0 0 6. Munga (Parasiya) 22 129 0 1 0 0 0 7. Baranga (Parasiya) 32 197 0 0 1 0 0 8. Char Gaon Bhat (Chhindwara) 14 77 0 0 0 0 0 9. Dseriya (Chhindwara) 20 112 0 0 0 0 0 Cluster Village 126 743 0 1 3 0 0
10 Pipariya Birsa (Chhindwara) 14 71 0 0 0 0 0 Control Village 14 71 0 0 0 0 0 Total 224 1278 0 4 3 1 0

307
The employment of only 8 persons in secondary and tertiary sectors is hardly meaningful to avoid the stress on agriculture that ultimately results in population migration during lean season of agriculture.
OCCUPATIONAL DISTRIBUTION OF HOUSEHOLDS IN SUBSIDIUARY OCCUPATIONS - AGRICULTURE 6.125 Out of total of 1278 persons from 224 households, 22 number of persons [1.72 percent] are
engaged in subsidiary occupations mostly in agricultural activities [16 persons] and secondary sector activities [6 persons].
SUBSIDIARY OCCUPATION – AGRICULTURE 6.126 The table below shows the details;
able No. 6.41 Subsidiary Occupation – Agriculture
S. No.
Name of The Village No. of families selected
No. of family
members
Small Farmer
Marginal Farmer
Farmer Agriculture Labour
1 2 3 4 5 6 7 8 1. Simariya Kala (Muhkhed) 27 130 0 0 0 0 2. Thunia Ddana (Chhindwara) 35 179 0 0 0 2 3. Moadai (Chhindwara) 22 155 0 0 1 1 Adopted Village 84 464 0 0 1 3
4. Lahgurua (Muhked) 26 158 0 0 0 0 5. Omariya (Muhked) 12 70 0 0 0 2 6. Munga (Parasiya) 22 129 0 0 0 0 7. Baranga (Parasiya) 32 197 0 0 0 5 8. Char Gaon Bhat (Chhindwara) 14 77 0 0 1 2 9. Dseriya (Chhindwara) 20 112 0 0 0 0 Cluster Village 126 743 0 0 1 9
10 Pipariya Birsa (Chhindwara) 14 71 1 1 0 0 Control Village 14 71 1 1 0 0
Total 224 1278 1 1 2 12
6.127 The above table shows the involvement of only 16 persons mostly as agriculture labour
which is 1.25 percent to total number of 1278 family members. The status is hardly meaningful.
6.128 Non of the persons from sample families are involved in occupations allied to agriculture
which again is a definite gap in performance by sample households. 6.129 Only 6 number of persons are engaged in construction work [secondary sector] which is far
from being an encouraging picture. 6.130 Involvement in subsidiary occupations, particularly activities allied to agriculture and
secondary and tertiary sector occupations are highly meaningful for rural economy on the twin grounds of income augmentation and reduction of under employment in agriculture sector which, undoubtedly, is missing in our area of study. One of the basic drawbacks with rural economy is the absence of supportive functions, though the plethora of welfare activities initiated by the government are aimed at creating employment opportunities mainly through subsidiary occupations to ease pressure on

308
land. Unfortunately such welfare schemes are yet to show their impact on far flung villages where even the basic awareness about the scheme do not exist, what to say of their implementation. Once the subsidiary employment avenues are created covering the back of the beyond villages, there will not be any looking back as the development will come as a logical outcome of forward linkages covering not only income generating sectors but social sectors like education, health etc.
AVERAGE MONTHLY INCOME 6.131 The table below shows the details;
Table No. 6.42
Average Monthly Income S.
No. Name of The Village No. of
families selected
No. of family memb
ers
Below Rs. 500
Rs. 501 to
Rs. 600
Rs. 601 to
Rs. 700
Rs. 701 to
Rs. 800
Rs. 801 to
Rs. 900
Rs. 901 to
Rs. 1000
Rs. 1001 & above
1 2 3 4 5 6 7 8 9 10 11 1. Simariya Kala (Muhkhed) 27 130 27 0 0 0 0 1 102 2. Thunia Ddana
(Chhindwara) 35 179 36 0 1 0 0 0 142
3. Moadai (Chhindwara) 22 155 23 0 0 0 0 0 132 Adopted Village 84 464 86 0 1 0 0 1 376
4. Lahgurua (Muhked) 26 158 29 0 0 0 0 0 129 5. Omariya (Muhked) 12 70 12 0 0 0 0 0 58 6. Munga (Parasiya) 22 129 25 0 0 0 0 0 104 7. Baranga (Parasiya) 32 197 34 0 0 0 0 0 163 8. Char Gaon Bhat
(Chhindwara) 14 77 14 0 0 0 0 0 63
9. Dseriya (Chhindwara) 20 112 21 0 0 0 0 2 89 Cluster Village 126 743 135 0 0 0 0 3 606
10 Pipariya Birsa (Chhindwara)
14 71 13 1 0 1 0 0 56
Control Village 14 71 13 1 0 1 0 0 56
Total 224 1278 234 1 1 1 0 3 1038
6.132 The above table shows that 81.22 percent family members are within the average monthly
income range of Rs. 1001.00 and above while 18.31 percent family members are within the average monthly income range of Rs. 500.00 and below. This shows that the farmers are pursuing agriculture on fair scale as agriculture is the main occupation of the sample area of our study.
AVERAGE MONTHLY EXPENDITURE 6.133 The table shows the details;

309
Table No. 6.43 Average Monthly Expenditure
S. No.
Name of The Village No. of families selected
No. of family
members
Below Rs. 500
Rs. 501 to
Rs. 600
Rs. 601 to
Rs. 700
Rs. 701 to
Rs. 800
Rs. 801 to
Rs. 900
Rs. 901 to
Rs. 1000
Rs. 1001 and
Above 1 2 3 4 5 6 7 8 9 10 11 1. Simariya Kala (Muhkhed) 27 130 25 0 0 0 0 1 104 2. Thunia Ddana
(Chhindwara) 35 179 36 0 0 0 0 0 143
3. Moadai (Chhindwara) 22 155 21 0 0 0 0 0 134 Adopted Village 84 464 82 0 0 0 0 1 381
4. Lahgurua (Muhked) 26 158 27 0 0 0 0 0 131 5. Omariya (Muhked) 12 70 11 0 0 0 0 0 59 6. Munga (Parasiya) 22 129 24 0 0 0 0 0 105 7. Baranga (Parasiya) 32 197 31 0 0 0 0 2 164 8. Char Gaon Bhat
(Chhindwara) 14 77 14 0 0 0 0 0 63
9. Dseriya (Chhindwara) 20 112 18 0 0 0 1 3 90 Cluster Village 126 743 125 0 0 0 1 5 612
10 Pipariya Birsa (Chhindwara)
14 71 12 0 0 1 0 0 58
Control Village 14 71 12 0 0 0 1 0 58
Total 224 1278 219 0 0 1 1 6 1051
6.134 In line with income trend, 82.24 percent family members are within average monthly
expenditure range of Rs. 1001.00 and above. 6.135 To sum up - The percentage of males within the age group of 20 to 60 years, representing the
labour force is 43.44 percent to total male family members while that for females the percentage is 44.06 indicating availability of substantial number of persons far performing various economic activities.
- The percentage of dependent population among males in the age group of 0-10 years and 60 years and above is 30.60 to total number of males is a negetive factor since this group of population do not contribute much towards family income. Similarly among females this percentage is 35.52 showing higher extent of dependent population.
- The literacy percentage being 78.25 in the sample area is amazingly high that indicates the absorption capacity of the individuals to adopt latest technology regarding agriculture imparted by the K.V.K.
- The bulk of the farming community is from the category of farmers having sizeable land holdings constituting 75.82 percent to total of 244 persons pursuing various main occupations.
- The complete absence of occupations relating to activities allied to agriculture [as main occupation] in our area of study is somewhat discouraging.
- The employment of only 8 persons in secondary and tertiary sectors is hardly meaningful.
- Regarding subsidiary occupations, only 22 number of persons are engaged mostly in agricultural activities [16 person] and secondary sector activities [6 persons].
- Regarding average monthly income, 81.22 percent family members are within the average monthly income range of Rs. 1001.00 and above.
- Similarly regarding expenditure, 82.24 percent family members are within average monthly expenditure range of Rs. 1001.00 and above.

310
RESULTS OF SURVEY SUBJECTS OF TRAINING RECEIVED– ADOPTED AND CLUSTER VILLAGES 6.136 At the outset it is, perhaps, necessary to clarify the point that there are 211 number of
families who took part in vocational training, front line demonstration and on farm testing which are three basic mandates of K.V.K. The total responding families from vocational training, front line demonstration and on farm testing will not tally with the figure of 211 as from this basic figure the responding families participated in three fundamental activities. The entire analysis is based upon family approach as normally one member from each family from adopted and cluster villages, where there is direct intervention of K.V.K. takes part in various training programmes. It is evident that in what follows only adopted and cluster villages have been taken into account, i.e. 9 number of villages, excluding one control village where there is no intervention of K.V.K.
6.137 Out of the total of 224 households identified for detailed enquiry, 211 families have
responded to various training and demonstration initiatives of the K.V.K. constituting 94.20 percent to total identified households, which, no doubt, is an encouraging picture that shows the awareness and intent of the farming community to adopt various technologies related to agriculture. In what follows an attempt has been made to present the item wise details of various initiatives adopted by the K.V.K. in the fields of vocational training, front line demonstration and on farm testing.
VOCATIONAL TRAINING 6.138 The table below shows the details;
Table No. 6.44
Subjects of Training Received – Vocational Training. Subject on Which Training Received S.
No. Name of Village No. of
Respondent/families
Crop Prod Agronomy
Horticulture Livestock Dairying Poultry
Fisheries
1 2 3 4 5 6 7 1 Simariya Kala
(Muhkhed) 26 16 16 0 0
2 Thunia Ddana (Chhindwara)
34 34 21 0 0
3 Moadai (Chhindwara) 23 23 15 4 0 I Adopted Villages 83 73 52 4 0 4 Lahgurua (Muhked) 26 26 26 0 0 5 Omariya (Muhked) 12 12 12 0 0 6 Munga (Parasiya) 23 23 11 0 0 7 Baranga (Parasiya) 33 33 15 0 0 8 Char Gaon Bhat
(Chhindwara) 14 14 14 0 0
9 Dseriya (Chhindwara) 20 20 17 0 0 II Cluster Villages 128 128 95 0 0 Total All Villages 211 201 147 4 0

311
Table No. 6.44 [Contd…] Subjects of Training Received – Vocational Training.
Subject On Which Training Received S. No.
Name of Village Home
Science Training of Rural Youth
Agro Forestry
Organic Farming
Water Shed
Activities 1 2 8 9 10 11 12 1 Simariya Kala
(Muhkhed) 0 0 0 2 2
2 Thunia Ddana (Chhindwara)
13 0 3 10 2
3 Moadai (Chhindwara) 0 0 2 5 3 I Adopted Villages 13 0 5 17 7 4 Lahgurua (Muhked) 0 0 0 0 0 5 Omariya (Muhked) 0 0 0 1 0 6 Munga (Parasiya) 11 0 2 8 0 7 Baranga (Parasiya) 15 0 0 11 0 8 Char Gaon Bhat
(Chhindwara) 0 0 0 0 0
9 Dseriya (Chhindwara) 0 0 0 1 0 II Cluster Villages 26 0 2 21 0 Total All Villages 39 0 7 38 7
6.139 The above table shows the extent of major participation in the fields of agronomical and
horticultural crops by 201 and 147 household representatively that occount for 95.26 percent and 69.67 percent respectively to total of 211 responding families. The trend is more or less common for all the six K.V.Ks. covered under the study which emphatically indicates that rural households still cling to agriculture for earning livelihood and consider their farm as sole savier of their families backed by the years of confidence that they repose in it, despite its vagarent nature. Next to agriculture, comes the subjects like home science wherein 39 household [18.48 percent] and organic farming with 38 households [18.01 percent] have shown their interest. Home science is an area which is gradually picking – up in rural areas as being considered to be good source of subsidiary income mainly generated by women who do jobs like preparation of pickles, papad, bari etc. The introduction of the concept of self help groups constituted for women have brought startling change in awareness among females who want to contribute for augmentation of family income. This, in stride, to some extent, has brought a degree of empowerment as well. Though the progress is slow, but, given the proper surrounding, the roots will certainly be deepened. The interest for subject like organic farming is indicative of one basic fact that cultivators of our area of study are serious about the qualitative upgradation of their product that fetchs higher returns. Only marginal number of persons have shown interest in livestock, dairying and poultry, agro-forestry and watershed activities. The trend is again more or less common among all the six K.V.Ks. covered under the study. Animal husbandry considered to be an occupation next to agriculture with potentiality to diversify agriculture is pursued in villages on a very limited scale, mostly for family consumption since regular veterinary services are usually not available in far- flung areas and secondly the absence of ready market due to insufficient road linkages. These twin factors are the basic constraints for the development of activities relating to animal husbandry in rural areas in general and in our area of study in particular which is substantiated by the fact that only 4 number of family representatives [persons] have shown interest in vocational training

312
relating to livestock, dairying and poultry. Agro-forestry, will, perhaps, continue to be on low key so long agriculture is not supported by subsidiary occupation [main aim of most of the welfare schemes initiated by the government is to generate subsidiary occupations in primary, secondary and tertiary sectors which have made no satisfactory impact in rural areas] that reduces pressure on land leaving scope for agro-forestry. Watersheds in nature are community assets where the individual interests are bound to be diversified. Only few cultivator with very large holdings can afford implementing watershed activities of their own. However, such cultivators are not the sole target group of the K.V.Ks., the small and marginal farmers are equally important as they form the bulk of the farming community.
FRONT LINE DEMONSTRATION [F.L.D.] 6.140 The main objective of the front line demonstration is to demonstrate newly released crop
production and protection technologies and its management practices in the farmer’s fields. However, in front line demonstrations, the interactions regarding home science activities, training of rural youth and all the other items as specified for vocational training are supposed to be done to educate the farmers for augmentation of income. The table below shows the details;
Table No. 6.45
Subjects of Training Received – Front Line Demonstration Subject On Which Training Received S.
No Name of The Village No. of
Respondent Crop Prod Agronomy
Horticulture Live Stock Dairying Poultry
Fisheries
1 2 3 4 5 6 7 1 Simariya Kala (Muhkhed) 5 5 0 0 0 2 Thunia Ddana
(Chhindwara) 8 7 1 0 0
3 Moadai (Chhindwara) 3 2 2 0 0 I Adopted Villages 16 14 3 0 0
4 Lahgurua (Muhked) 4 4 0 0 0 5 Omariya (Muhked) 2 2 0 0 0 6 Munga (Parasiya) 2 1 0 0 0 7 Baranga (Parasiya) 5 3 2 0 0 8 Char Gaon Bhat
(Chhindwara) 2 2 0 0 0
9 Dseriya (Chhindwara) 4 4 0 0 0 II Cluster Villages 19 16 2 0 0 Total All Villages 35 30 5 0 0

313
Table No. 6.45 [Contd…] Subjects of Training Received – Front Line Demonstration
Subject On Which Training Received S. No.
Name of The Village Home
Science Training of
Rural Youth
Agro Forestry
Organic Farming
Water Shed
Activities 1 2 8 9 10 11 12 1 Simariya Kala (Muhkhed) 0 0 0 0 0 2 Thunia Ddana (Chhindwara) 0 0 1 0 0 3 Moadai (Chhindwara) 0 0 0 0 0
I Adopted Villages 0 0 1 0 0
4 Lahgurua (Muhked) 0 0 0 0 0 5 Omariya (Muhked) 0 0 0 0 0 6 Munga (Parasiya) 0 0 1 0 0 7 Baranga (Parasiya) 0 0 0 0 0 8 Char Gaon Bhat (Chhindwara) 0 0 0 0 0 9 Dseriya (Chhindwara) 0 0 0 0 0
II Cluster Villages 0 0 1 0 0 Total All Villages 0 0 2 0 0
6.141 At the outset it may, perhaps, be necessary to clarify the point that a crowded participation
in F.L.Ds. is not possible for the reasons that these are organised on selected areas and are constrained by availability of budget.
6.142 The above table shows that out of 211 responding families 35 family representatives [16.59
percent] have responded to various programmes of front line demonstrations which is not much fair as in case of K.V.K. Bhopal the extent of respons is 39.31 percent. Here again, like vocational training, the crop production [agronomy] group seems very popular where 30 households [85.71 percent to total of 211 responding households] have shown interest in newly released crop production and protection technologies followed by horticulture where 5 number of households [2.37 percent] showed interest and 2 number of households in agro-forestry [0.95 percent]. A total gap is seen in the fields livestock, dairy, poultry, fisheries, home science, training of rural youth, organic farming and watershed activities where no efforts have been made through F.L.Ds. This again indicates to one point that cultivators are basically interested in enhancing their agriculture related productivity which firstly they understand even without formal education and secondly their clear understanding that once the income from agriculture is enhanced the other activities allied to agriculture will naturally be taken care-of because of secure financial position.
ON FARM TESTING [O.F.T.] 6.143 In this practice the farmers participate in identifying problems and its priorities and
managing experiments and evaluating results. It is, therefore, an adaptive research with farmers perspective. The basic objective of O.F.T. is to identify existing inputs or practices that might help to solve major problems of many farmers in defined study area. The table below shows the details;

314
Table No. 6.46 Subjects of Training Received – On Farm Testing
Subject On Which Training Received S. No.
Name of The Village No. of Respondents Crop Prod
Agronomy Horticulture Live Stock
Dairying Poultry Fisheries
1 2 3 4 5 6 7 1 Simariya Kala (Muhkhed) 3 3 0 0 0 2 Thunia Ddana (Chhindwara) 3 3 0 0 0 3 Moadai (Chhindwara) 2 2 0 0 0 I Adopted Villages 8 8 0 0 0 4 Lahgurua (Muhked) 1 1 0 0 0 5 Omariya (Muhked) 0 0 0 0 0 6 Munga (Parasiya) 0 0 0 0 0 7 Baranga (Parasiya) 0 0 0 0 0 8 Char Gaon Bhat
(Chhindwara) 0 0 0 0 0
9 Dseriya (Chhindwara) 0 0 0 0 0 II Cluster Villages 1 1 0 0 0 Total All Villages 9 9 0 0 0
Table No. 6.46 [Contd…]
Subjects of Training Received – On Farm Testing Subject On Which Training Received S.
No. Name of The Village
Home Science
Training of Rural Youth
Agro Forestry
Organic Farming
Watershed Activities
1 2 8 9 10 11 12 1 Simariya Kala (Muhkhed) 0 0 0 0 0 2 Thunia Ddana (Chhindwara) 0 0 0 0 0 3 Moadai (Chhindwara) 0 0 0 0 0 I Adopted Villages 0 0 0 0 0
4 Lahgurua (Muhked) 0 0 0 0 0 5 Omariya (Muhked) 0 0 0 0 0
6 Munga (Parasiya) 0 0 0 0 0
7 Baranga (Parasiya) 0 0 0 0 0
8 Char Gaon Bhat(Chhindwara) 0 0 0 0 0
9 Dseriya (Chhindwara) 0 0 0 0 0
II Cluster Villages 0 0 0 0 0
Total All Villages 0 0 0 0 0
6.144 The above table shows that out of the total of 211 responding households only
representatives of 9 households have shown towards organisation of O.F.T., which is 4.27 percent to total responding households. Only on subjects of agronomical produce 9 number of household have got O.F.Ts. organised. In rest of the subjects no interest has been shown by the households for organizing O.F.Ts.
6.145 The conclusion that can be drawn from above narration is that the efforts of the
K.V.K. through vocational training, front line demonstration and on farm testing were concentrated mainly on subjects like agronomy, horticulture and to some extent home science and organic farming wherein the resprentatives from responding households took interest and got vocational training and F.L.Ds. and O.F.Ts. organised. On rest of the subjects like live stock, fisheries, training of rural youth, agro-forestry and watershed activities the interest was either marginal or nil. Therefore the impact of such activities can not be assessed.

315
IMPACT OF K.V.K. 6.146 In the foregoing paragraphs an analysis of subject wise training received has been presented.
In what follows an attempt has been made to present the impact of individual items of training in the broad categories of;
- Vocational Training - Front Line Demonstration - On Farm Testing
both before and after training [BT, AT] situations. This is the most important part of the report that clearly indicates the impact of K.V.K’s. interventions on agronomy, horticulture, livestock and dairying, fisheries, home science. Watershed activities, agro-forestry etc.
VOCATIONAL TRAINING – AGRONOMY - CEREALS 6.147 The table below shows the impact of K.V.K’s. intervention over cereal crops;
Table No. 6.47 Agronomy – Cereals
Yield Per- Hectare - Kg. Wheat Paddy
S. No.
Name of The Village
No. of Respon-
dents
BT AT No. of Respondents
BT AT
1 2 3 4 5 6 7 8 1 Simariya Kala
(Muhkhed) 16 3875 4119 0 0 0
2 Thunia Ddana (Chhindwara)
34 3912 4156 1 1800 2500
3 Moadai (Chhindwara) 23 3935 4243 0 0 0 I Adopted Villages 73 1 4 Lahgurua (Muhked) 26 3842 4077 3 1810 2900 5 Omariya (Muhked) 12 3867 4208 0 0 0 6 Munga (Parasiya) 23 3265 3587 0 0 0 7 Baranga (Parasiya) 33 3291 3612 0 0 0 8 Char Gaon Bhat
(Chhindwara) 14 3664 4193 0 0 0
9 Dseriya (Chhindwara) 20 3665 3935 1 0 190 II Cluster Villages 128 4 Total All Villages 201 5

316
Table No. 6.47 [Contd…] Agronomy – Cereals
Yield Per- Hectare - Kg. Maize Jowar
S. No.
Name of The Village
No. of Respondents
BT AT No. of Respondents
BT AT
1 2 9 10 11 12 13 14 1 Simariya Kala
(Muhkhed) 16 1944 2256 5 780 980
2 Thunia Ddana (Chhindwara)
27 1756 2078 14 993 1214
3 Moadai (Chhindwara) 15 2147 2427 11 936 1164 I Adopted Villages 58 30
4 Lahgurua (Muhked) 26 2315 2604 8 800 1040
5 Omariya (Muhked) 12 2067 2333 4 875 925
6 Munga (Parasiya) 21 1810 2019 12 875 1092
7 Baranga (Parasiya) 17 1900 2206 13 792 1038 8 Char Gaon Bhat
(Chhindwara) 12 2400 2767 3 933 1100
9 Dseriya (Chhindwara) 20 1635 1890 14 1164 1321 II Cluster Villages 108 54 Total All Villages 166 84
6.148 Regarding wheat crop a total of 201 households have responded to the vocational training
which is 95.25 percent to total of 211 responding household. For every village the yield per hectare in after training situation is better than before training condition that ranged between 3587 kg per hectare in village Munga [cluster village] to 4243 kg per-hectare in village Moadai [adopted village]. The yield per hectare of wheat in both before and after training situations is higher than district and state level productivity figures of 2096 kg and 1867 kg respectively that indicates the positive impact of K.V.Ks. effort.
6.149 As regards paddy crop only 5 number of households [2.37 percent] have responded to
vocational training with yield per hectare in A.T. situations, more than of B.T. situations for all the villages covered under the study that ranged between 1900 kg per hectare for village Dseriya [cluster village] to 2900 kg per hectare for village Lahgurua [cluster village], much higher than the district and state level average per hectare yield of 914 kg and 1058 kg respectively. Again the impact of the K.V.Ks. effort is evident.
6.150 Regarding maize crop the total responding families are 166 [78.67 percent] which is
exceptionally high. Here again the per-hectare yield in after training situations is higher than before training conditions ranging between 1890 kg per hectare for village Dseriya [cluster village] to 2604 kg per hectare for village Lahgurua [cluster village] indicating positive impact. As compared to district and state level produc tivity of 2949 kg and 2072 kg respectively, the per hectare yield in identified adopted and cluster villages is lower than district average and higher than state average.
6.151 Regarding Jowar crop, the total responding families are 84, forming 39.81 percent to total of
211 responding households. For every reporting village the per hectare yield in after training

317
situation is higher than that of before training conditions which ranged between 925 kg per hectare for village Omariya [cluster village] to 1321 kg per hectare for village Dseriya [cluster village] which are more than the district average productivity of 988 Kg. and less than the state average productivity of 1342 Kg. The impact of the efforts of the K.V.K. is thus obvious.
VOCATIONAL TRAINING – AGRONOMY – PULSES 6.152 The table below shows the details
Table No. 6.48 Agronomy – Pulses
Yield Per- Hectare - Kg. Gram Arhar Lentil
S. No
Name of The Village
No. of Respond
ents
BT AT No. of Responden
ts
BT AT No. of Respondents
BT AT
1 2 3 4 5 6 7 8 9 10 11 1 Simariya Kala
(Muhkhed) 11 1530 1820 10 1450 1620 0 0 0
2 Thunia Ddana (Chhindwara)
21 1690 2100 13 1131 1269 1 0 800
3 Moadai (Chhindwara) 15 2120 2510 12 1325 1367 1 0 900 I Adopted Villages 47 35 2
4 Lahgurua (Muhked) 12 1720 2050 7 1357 1457 0 0 0 5 Omariya (Muhked) 6 1980 2051 3 967 1133 1 0 800
6 Munga (Parasiya) 12 16800 1880 15 1467 1687 0 0 0 7 Baranga (Parasiya) 22 1990 2080 15 1447 1760 3 601 725 8 Char Gaon Bhat
(Chhindwara) 3 1859 2090 2 850 1050 0 0 0
9 Dseriya (Chhindwara)
15 1770 2200 12 1433 1750 3 480 580
II Cluster Villages 70 54 7
Total All Villages 117 89 9

318
6.153 Gram being an important crop in pulses group the total number of families responding to vocational training are 117 [55.45 percent] with remarkable yield rates in after training conditions as compared to before training situations which ranged between 1820 kg per hectare for village Simriya Kala [adopted village] to 2510 kg per hectare for village Moadai [adopted village] which are higher than both district average productivity of 1344 kg and state average productivity of 932 kg.
6.154 Similarly for Arhar crop the responding households are 89 [42.18 percent] with yield rates per hectare higher
in after training situations as compared to prevailing rates in before training conditions which ranged between 1050 kg per hectare for village Char-Gaon-Bhat [cluster village] to 1760 kg per hectare for village Baranga [cluster village]. When compared with district average productivity [1679 kg] and state average productivity [825 kg] it has been found that the yield rates prevailing in after training situations for most of the villages covered under the study are higher than district average and for all the villages, higher than the state average.
6.155 Lentil being comparatively an unimportant crop of the district, the responding families requiring vocational
training are only 9 [4.27 percent] from four number of villages wherein the yield rates in after training situation are more than before training conditions that ranged between 580 kg per hectare for village Dseriya [cluster village] to 900 kg per hectare for village Moadai [adopted village]. These rates are higher than the district average productivity of 434 kg and state average productivity of 506 kg.
VOCATIONAL TRAINING – AGRONOMY – OIL SEEDS 6.156 The table below shows the details;
Table No. 6.49 Agronomy – Oil Seeds
Yield Per- Hectare - Kg. Soybean Mustard Linseed
S. No
Name of The Village
No. of Respondents
BT AT No. of Respondents
BT AT No. of Respondents
BT AT
1 2 3 4 5 6 7 8 9 10 11 1 Simariya Kala
(Muhkhed) 12 1950 2260 0 0 0 3 2500 2800
2 Thunia Ddana (Chhindwara)
23 1954 2271 12 1150 1225 2 1600 2300
3 Moadai (Chhindwara) 15 1981 2920 0 0 0 2 1700 1900 I Adopted Villages 50 12 7
4 Lahgurua (Muhked) 19 1521 2140 0 0 0 0 0 0
5 Omariya (Muhked) 8 1210 1400 0 0 0 3 2500 2805
6 Munga (Parasiya) 19 1247 1971 5 1060 1220 0 0 0
7 Baranga (Parasiya) 30 1259 2189 9 1689 1791 3 2100 2600 8 Char Gaon Bhat
(Chhindwara) 11 1460 1730 0 0 0 2 1800 2300
9 Dseriya (Chhindwara) 17 1245 2125 2 1550 1850 2 2100 2700 II Cluster Villages 104 16 10 Total All Villages 154 28 17
6.157 Soybean being important crop of the district, 154 families against 211 families [72.99
percent] have responded to vocational training programme organised by K.V.K. For every village the after training status is better than before training situations that clearly shows the positive impact of K.V.Ks. effort. In after training situation the productivity ranged between 1971 kg per hectare for village Munga [cluster village] to 2271 kg per hectare for village Thunia Ddna [adopted village] which are higher than the district status of 1464 kg and state average of 1132 kg per hectare.

319
6.158 Mustard, though is an important cash crop, the response is not very bright as only 28 number of households have responded to the vocational training organised by K.V.K. that comes to 13.27 percent to total of 211 responding households. The productivity in after training situation is better than before training conditions that ranged between 1791 kg per hectare for village Baranga [adopted village] to 1225 kg per hectare for village Thunia Dadna [adopted village], higher than district and state average figures of 714 kg and 1009 kg per hectare respectively.
6.159 Similarly for linseed crop only 17 number of households [8.06 percent] have responded to
the vocational training programme organised by the K.V.K. The productivity in case of every village is higher in after training situation as compared to before training conditions that ranged between 1900 kg per hectare for village Moadai [adopted village] to 2805 kg. per hectare for village Omariya [cluster village], much higher than the district and state average productivity of 534 kg and 452 kg respectively. The impact of the K.V.Ks. effort is thus obvious.
6.160 The participation of households for receiving training on crops like cotton and
sugarcane is nil as such crops are not grown in the district. VOCATIONAL TRAINING – HORTICULTURE 6.161 Horticulture crops are important from the twin view points of diversification of traditional
crop cultivation and employment generation. Being perennial these crops help in checking soil erosion and being tough can be grown on waste land not suitable for traditional crops. The following table shows the details;
Table No. 6.50
Horticulture Crops Yield Per- Hectare - Quintal
Potato Onion S.No. Name of The Village
No. of Responden
ts
BT AT No. of Responde
nts
BT AT
1 2 3 4 5 6 7 8 1 Simariya Kala (Muhkhed) 16 292 307 1 260 276 2 Thunia Ddana (Chhindwara) 21 282 304 1 200 260 3 Moadai (Chhindwara) 15 302 319 2 213 278 I Adopted Villages 52 4
4 Lahgurua (Muhked) 25 301 315 1 200 250 5 Omariya (Muhked) 12 273 304 0 0 0 6 Munga (Parasiya) 11 283 302 3 211 235 7 Baranga (Parasiya) 15 292 309 2 209 215 8 Char Gaon Bhat (Chhindwara) 14 294 329 0 0 0 9 Dseriya (Chhindwara) 17 295 315 0 0 0 II Cluster Villages 94 6
Total All Villages 146 10

320
Table No. 6.50 [Contd…] Horticulture Crops
Yield Per- Hectare - Quintal Tomato Brinjal
S. No.
Name of The Village
No. of Responde
nts
BT AT No. of Responde
nts
BT AT
1 2 9 10 11 12 13 14 1 Simariya Kala (Muhkhed) 5 202 228 2 125 245 2 Thunia Ddana (Chhindwara) 5 178 188 4 156 271 3 Moadai (Chhindwara) 6 198 213 3 125 255 I Adopted Villages 16 9
4 Lahgurua (Muhked) 4 250 268 4 151 246 5 Omariya (Muhked) 2 210 245 0 0 0 6 Munga (Parasiya) 6 212 227 0 0 0 7 Baranga (Parasiya) 7 210 228 3 135 224 8 Char Gaon Bhat (Chhindwara) 0 0 0 0 0 0 9 Dseriya (Chhindwara) 4 193 225 2 171 239 II Cluster Villages 23 9 Total All Villages 39 18
Table No. 6.51
Horticulture Crops Yield Per- Hectare - Kg.
Chilly Bhindi Spices S. No
Name of The Village
No. of Respondents
BT AT No. of Responde
nts
BT AT No. of Respondents
BT AT
1 2 15 16 17 18 19 20 21 22 23 1 Simariya Kala
(Muhkhed) 2 191 233 3 101 146 0 0 0
2 Thunia Ddana (Chhindwara)
2 170 200 2 97 191 3 280 100
3 Moadai (Chhindwara) 3 110 120 2 110 201 0 0 0
I Adopted Villages 7 7 3
4 Lahgurua (Muhked) 1 190 230 1 100 150 0 0 0 5 Omariya (Muhked) 0 0 0 0 0 0 0 0 0 6 Munga (Parasiya) 4 203 240 1 100 120 0 0 0 7 Baranga (Parasiya) 1 190 200 1 100 120 0 0 0 8 Char Gaon Bhat
(Chhindwara) 0 0 0 0 0 0 0 0 0
9 Dseriya (Chhindwara)
2 230 245 0 0 0 1 0 160
II Cluster Villages 8 3 1 Total All Villages 15 10 4

321
Table No. 6.51 [Contd…] Horticulture Crops
Yield Per- Hectare - Quintal Cucerbits Papaya
S. No.
Name of The Village
No. of Responde
nts
BT AT No. of Responde
nts
BT AT
1 2 9 10 11 12 13 14 1 Simariya Kala (Muhkhed) 0 0 0 1 0 200 2 Thunia Ddana (Chhindwara) 1 0 100 0 0 0 3 Moadai (Chhindwara) 1 0 160 3 0 197 I Adopted Villages 2 4
4 Lahgurua (Muhked) 0 0 0 0 0 0
5 Omariya (Muhked) 0 0 0 0 0 0 6 Munga (Parasiya) 0 0 0 0 0 0 7 Baranga (Parasiya) 2 150 165 0 0 0 8 Char Gaon Bhat (Chhindwara) 0 0 0 0 0 0 9 Dseriya (Chhindwara) 0 0 0 0 0 0 II Cluster Villages 2 0
Total All Villages 4 4
Table No. 6.51 [Contd…] Horticulture Crops
Yield Per- Hectare - Quintal
Citrus
S. No.
Name of The Village
No. of Respondents BT AT 1 2 9 10 11 1 Simariya Kala (Muhkhed) 2 0 120 2 Thunia Ddana (Chhindwara) 1 140 180 3 Moadai (Chhindwara) 0 0 0 I Adopted Villages 3
4 Lahgurua (Muhked) 0 0 0
5 Omariya (Muhked) 0 0 0 6 Munga (Parasiya) 0 0 0 7 Baranga (Parasiya) 2 108 121 8 Char Gaon Bhat (Chhindwara) 0 0 0 9 Dseriya (Chhindwara) 1 140 170 II Cluster Villages 3 Total All Villages 6
6.162 The cultivation of horticulture crops is popular in district Chhindwara due to climatic
support and awareness among cultivators about the value of such crops for income augmentation. In ensuing paragraphs the cropwise analysis has been presented. However, it will not be out of place to mention that since district and state average productivity figures are not available, a comparison has not been made.
6.163 In case of Potato crop 146 number of households have responded to the vocational training
programme which is 69.19 percent to total of 211 responding families. The per hectare yield has enhanced in every reporting village after receiving the training which ranged between 302 quintal per hectare for village Munga [cluster village] to 329 quintal per hectare for village Char-Gaon-Bhat [cluster village]. The impact of the efforts of the K.V.K. is thus evident.

322
6.164 Regarding Onion crop only 10 number of family representatives [3.32 percent] have participated in vocational training resulting in enhanced per hectare yield in after training situation as compared to before training conditions that ranged between 215 quintal per hectare for village Baranga [cluster village] to 278 quintal per hectare for village Moadai [adopted village].
6.165 Tomato is yet another crop gradually becoming popular as 39 number of households [18.48
percent] have shown interest to have vocational training resulting in enhancement of per hectare yield after participating in training as compared to before training conditions, ranging between 188 quintal per hectare for village Thunia Ddna [adopted village] to 268 quintal per hectare for village Lahgurua [cluster village].
6.166 Regarding Brinjal, 18 family members [8.53 percent] have taken part in vocational training
that resulted in enhanced per hectare yield in after training situation as compared to before training conditions, ranging between 224 quintal per hectare for village Baranga [cluster village] to 271 quintal per hectare for village Thunia Ddna [adopted village].
6.167 Chilly and Bhindi are the crops wherein 15 and 10 family representatives respectively have
responded to vocational training programme that constitute 7.11 percent and 4.74 percent respectively to total of 211 responding families. The per hectare yield in after training situation is much higher as compared to before training conditions that shows the impact of vocational training programme initiated by the K.V.K.
6.168 In the group of Cucerbits, spices, papaya and citrus the number of families responded are
4,4,4 and 6 respectively which can hardly be termed as encouraging picture. However the yield per hectare in after training situation is better than before training position that vouches for positive impact of vocational training. It seems parodoxical that district being highest producer of orange in the state the response for vocational training regarding citrus crop is only 6 households. It may be mentioned that mostly orange orchard owners are cultivators having large holding with well organised production system having vast knowledge about the crop and well conversed with latest technology. Therefore they seldom feel the necessity of expert knowledge of the K.V.K.
VOCATIONAL TRAINING – LIVESTOCK AND DAIRY 6.169 An important component of agricultural diversification is animal husbandry including
dairying and poultry which hold immense potential for improving the rural livelihood conditions by providing additional source of employment and income. Therefore these activities have been particularly included in the mandates of the K.V.K. by providing a post of veterinary scientist. But it hs been seen across Madhya Pradesh that there is hardly any substantial response from rural households for either having training on the subject of animal husbandry, dairying and poultry or interest in technology transfer through F.L.D. or O.F.T. The basic reasons are lack of technical persons to look after the veterinary and poultry related problems particularly in interior villages resulting in lack of initiatives among rural folk, in general, to take up this activity on reasonably viable scale that may augment their family income. The table below shows the status of veterinary related activities in our area of study;

323
Table No. 6.52 Live Stock and Dairying
Improved Breed (No.) Milk Production (Liters)
S. No.
Name of Village
No. of Respond
ents
BT AT No. of Respond
ents
BT AT
1 2 3 4 5 6 7 8 1 Simariya Kala
(Muhkhed) 0 0 0 0 0 0
2 Thunia Ddana (Chhindwara)
0 0 0 0 0 0
3 Moadai (Chhindwara) 2 0 2 4 6 21 I Adopted Villages 2 0 2 4 6 21 4 Lahgurua (Muhked) 0 0 0 0 0 0 5 Omariya (Muhked) 0 0 0 0 0 0 6 Munga (Parasiya) 0 0 0 0 0 0 7 Baranga (Parasiya) 0 0 0 0 0 0 8 Char Gaon Bhat
(Chhindwara) 0 0 0 0 0 0
9 Dseriya (Chhindwara) 0 0 0 0 0 0 II Cluster Villages 0 0 0 0 0 0 Total All Villages 2 0 2 4 6 21
Table No. 6.52 [Contd…] Live Stock and Dairying
Artificial insemination No. of animals
Improved feeding management
S. No
Name of The Village
No. of Respond
ents
BT AT No. of Respond
ents
BT AT
1 2 9 10 11 12 13 14 1 Simariya Kala (Muhkhed) 0 0 0 0 0 0 2 Thunia Ddana
(Chhindwara) 0 0 0 0 0 0
3 Moadai (Chhindwara) 2 0 2 4 4 0 I Adopted Villages 2 0 2 4 4 0 4 Lahgurua (Muhked) 0 0 0 0 0 0 5 Omariya (Muhked) 0 0 0 0 0 0 6 Munga (Parasiya) 0 0 0 0 0 0 7 Baranga (Parasiya) 0 0 0 0 0 0 8 Char Gaon Bhat
(Chhindwara) 0 0 0 0 0 0
9 Dseriya (Chhindwara) 0 0 0 0 0 0 II Cluster Villages 0 0 0 0 0 0 Total All Villages 2 0 2 4 4 0

324
Table No. 6.52 [Contd…] Live Stock and Dairying
Vaccination No. S. No Name of The Village No. of
Respondents BT AT
1 2 15 16 17 1 Simariya Kala (Muhkhed) 0 0 0 2 Thunia Ddana (Chhindwara) 0 0 0 3 Moadai (Chhindwara) 2 0 2 I Adopted Villages 2 0 2 4 Lahgurua (Muhked) 0 0 0 5 Omariya (Muhked) 0 0 0 6 Munga (Parasiya) 0 0 0 7 Baranga (Parasiya) 0 0 0 8 Char Gaon Bhat (Chhindwara) 0 0 0 9 Dseriya (Chhindwara) 0 0 0 II Cluster Villages 0 0 0
Total All Villages 2 0 2 6.170 Regarding improved breeding practices only 2 number of family representatives [0.95
percent] from village Moadai [adopted village] participated in the vocational training with breeding of 2 number of improved animals in after training situation which shows hardly any impact.
6.171 Similarly for milk production only 4 number of family members from village Moadai
[adopted village] have participated in vocational training with 6 liters of milk production in after training situation which is, rather, insignificant from the impact point of view.
6.172 Regarding artificial insemination, only 2 number of family representatives from village
Moadai [cluster village] took part in vocational training with 2 number of animals artificially inseminated. Again the impact is insignificant.
6.173 Regarding improved feeding management, one of the important ingredients of animal
husbandry functions, only 4 number of families from village Moadai [adopted village] have participated in vocational training which is far from being satisfactory.
6.174 Similarly for vaccination, 2 number of family representatives from village Moadai [adopted
village] have participated in vocational training with 2 number of animals vaccinated in after training situation.
6.175 Since there is no response from the persons of our sample area to get vocational
training on subjects like poultry and fishery development, no vocational training programmes have been organised for such disciplines with the result the impact of the K.V.K. for such activities is nil.
VOCATIONAL TRAINING – HOME SCIENCE 6.176 Home Science activities are getting popular in rural areas as it generates employment
opportunities among women. The initiatives taken by the government in forming self help groups for females have brought awareness to go for supporting activities that ultimately culminates into augmentation of income. The table below shows the details;

325
Table No. 6.53 Home Science Activities
Toy Making No.
Pickeles Kg.
S. No.
Name of The Village
No. of Respondents
BT AT No. of Respondents
BT AT
1 2 3 4 5 6 7 8 1 Simariya Kala (Muhkhed) 0 0 0 0 0 0 2 Thunia Ddana (Chhindwara) 5 0 10 13 47 55 3 Moadai (Chhindwara) 0 0 0 0 0 0
I Adopted Village 5 0 10 13 47 55
4 Lahgurua (Muhked) 0 0 0 0 0 0 5 Omariya (Muhked) 0 0 0 0 0 0 6 Munga (Parasiya) 0 0 0 11 22 89 7 Baranga (Parasiya) 0 0 0 15 25 83 8 Char Gaon Bhat (Chhindwara) 0 0 0 0 0 0 9 Dseriya (Chhindwara) 0 0 0 0 0 0
II Cluster Village 0 0 0 26 47 172 Total All Villages 5 0 10 39 94 227
Table No. 6.54 [Contd…] Home Science Activities
Jute items No. Papad/Bari/Jam/Jelly Kg. S. No.
Name of The Village
No. of Respondents
BT AT No. of Respondents
BT AT
1 2 9 10 11 12 13 14 1 Simariya Kala (Muhkhed) 0 0 0 0 0 0 2 Thunia Ddana (Chhindwara) 0 0 0 14 5 50 3 Moadai (Chhindwara) 0 0 0 0 0 0
I Adopted Village 0 0 0 14 5 50
4 Lahgurua (Muhked) 0 0 0 0 0 0
5 Omariya (Muhked) 0 0 0 0 0 0 6 Munga (Parasiya) 0 0 0 9 10 26 7 Baranga (Parasiya) 2 0 3 8 8 8 8 Char Gaon Bhat (Chhindwara) 0 0 0 0 0 0 9 Dseriya (Chhindwara) 0 0 0 0 0 0
II Cluster Village 2 0 3 17 18 34
Total All Villages 2 0 3 31 23 84
6.177 Ever since the plastic toys have come in the rural markets, the indigenous art of making clay toys is getting extinct as is evident from the fact that only 5 number of family representatives have participated in vocational training organised for toy making from the village Thunia Ddna [adopted village] which is 2.37 percent to total of 211 responding families with 10 number of toys made in after training conditions which is hardly an impact worth mentioning.
6.178 Preparation of pickles is an item getting popular in rural areas as the skill is already there.
Out of 211 responding families, 39 households [18.48 percent] have responded to the vocational training with preparation of 227 kg of pickles after getting the training as compared to 94 kgs in before training conditions. The impact of the intervention of K.V.K. is, thus, visible.
6.179 For making jute items only 2 number of households from village Baranga [cluster village] have participated in the training programme resulting in making of 3 number of items after getting the training. The impact is intangible.

326
6.180 Regarding preparation of papad/bari/jam/jelly, 31 family representatives [14.69 percent] have participated in vocational training with preparation of 84 kgs of such items in after training conditions as compared to 23 kgs in before training situations. This is one of the home science activities which have immense scope in rural areas. The government interventions through various target oriented programmes of Rural development department may yield startling results.
6.181 No vocational training regarding training of rural youth has been organised. It may be
mentioned that TRYSEM is one of the massive schemes of the government aimed at training of rural youth for self employment. With such scheme in vogue, it is always doubtful whether the rural youth will be participating in any such training organised by K.V.K., specially when there is no gurantee of placement.
VOCATIONAL TRAINING – AGRO FORESTRY 6.182 Agro forestry is the concept of eightees which gurantees farm income, covers the risk of
crop failure, improves the soil fertility, its structure and texture and checks the soil erosion. The table below shows the details;
Table No. 6.55 Agro Forestry – On Farm Plantation
On farm plantation Hectare
S.No. Name of The Village
No. of Respondents BT AT 1 2 3 4 5
1 Simariya Kala (Muhkhed) 0 0 0 2 Thunia Ddana (Chhindwara) 4 0 3 3 Moadai (Chhindwara) 2 0 2
I Adopted Village 6 0 5
4 Lahgurua (Muhked) 0 0 0 5 Omariya (Muhked) 0 0 0 6 Munga (Parasiya) 1 0 0 7 Baranga (Parasiya) 0 0 0 8 Char Gaon Bhat (Chhindwara) 0 0 0 9 Dseriya (Chhindwara) 0 0 0
II Cluster Village 1 0 0 Total All Villages 7 0 5
6.183 Out of the total of 211 responding families only 7 number of households from 3 villages
have responded to the vocational training programme pertaining to agro-forestry with area coverage of 5 hectares after receiving training as compared to nil area coverage in before training situation. Though the achievement is limited, more efforts are required to enhance the area under agro-forestry as the concept has immense potential.
VOCATIONAL TRAINING – ORGANIC FARMING 6.184 Organic farming though is a practice usually followed by big cultivators or government
farms, but in our area of study 38 number of family representatives have participated in the vocational training organised on various aspects of organic farming. The table below shows the details;

327
Table No. 6.56 Organic Farming
Compost by NADEP method Nos.
Bio fertilizer, Kg. S. No.
Name of The Village
No. of Respondents
BT AT No. of Respondents
BT AT
1 2 3 4 5 6 7 8 1 Simariya Kala (Muhkhed) 2 0 2 1 0 125 2 Thunia Ddana(Chhindwara) 5 0 11 10 0 405 3 Moadai (Chhindwara) 2 0 4 3 0 350
I Adopted Village 9 0 17 14 0 880
4 Lahgurua (Muhked) 0 0 0 0 0 0
5 Omariya (Muhked) 0 0 0 4 0 170 6 Munga (Parasiya) 5 1 5 8 0 2450 7 Baranga (Parasiya) 2 0 2 14 50 1650 8 Char Gaon Bhat (Chhindwara) 0 0 0 0 0 0 9 Dseriya (Chhindwara) 1 0 4 0 0 0
II Cluster Village 8 1 11 24 50 4270
Total All Villages 17 1 28 38 50 5150
Table No. 6.57 [Contd…] Organic Farming
Bio-pesticide Liter S.No. Name of the Village
No. of Respondents
BT AT
1 2 9 10 11 1 Simariya Kala (Muhkhed) 0 0 0 2 Thunia Ddana (Chhindwara) 0 0 0 3 Moadai (Chhindwara) 0 0 0
I Adopted Village 0 0 0
4 Lahgurua (Muhked) 0 0 0 5 Omariya (Muhked) 0 0 0 6 Munga (Parasiya) 5 70 400 7 Baranga (Parasiya) 3 0 150 8 Char Gaon Bhat (Chhindwara) 0 0 0 9 Dseriya (Chhindwara) 0 0 0
II Cluster Village 8 70 550
Total All Villages 8 70 550 6.185 Regarding preparation of compost by NADEP method, 17 number of households [8.06
percent] have responded to the training programme resulting in construction of 28 NADEP pits in after training situation as compared to only construction of one number of pit in before training condition. The impact of the K.V.K. is obvious.
6.186 Regarding bio-fertilizer, 38 number of households [18.01 percent] have participated in the
vocational training with production lf 5150 kg of bio-fertiliser in after training situation as compared to 50 kgs of bio-fertiliser production in before training situation. The impact of the K.V.Ks. efforts are clearly visible.
6.187 As regards bio-pesticide, 8 number of households [3.79 percent] have responded to the
training programme resulting in production of 550 liters of bio-pesticide in after training situation as compared to 70 liters in before training conditions, which again is a leap forward performance due to various efforts of K.V.K.

328
6.188 Regarding watershed activities no training programmes have been organised. 6.189 In the following paragraphs an attempt has been made to sum-up the efforts of
vocational training imparted by the K.V.K. - Regarding the yield per hectare both for agronomical and horticutlral crops the after
training status as compared to before training conditions are better that clearly shows the positive impact of vocational training imparted by the K.V.K.
- In case of wheat crop where the response is 95.25 percent to total of 211 responding households, the per hectare yield in after training situation is more than the district and state level productivity.
- For paddy the response level is only 2.37 percent with per hectare yield much higher than district and state level yields per hectare in after training situation.
- The response level in case of Maize crop is 78.67 percent to total of 211 responding families with per hectare yield more than the district level average productivity and more than the state level per hectare yield in after training situation.
- Similarly regarding Jowar crop the productivity is more than the district average productivity and less than per hectare yield as reported at state level in after training situation.
- For Gram the percentage of responding familiy is 55.45 with higher productivity as compared to what has been reported for district and state levels in after training situation.
- Similarly for Arhar crop the extent of response is 42.18 percent to total of 211 responding families with yield rates higher than district and state average productivity in after training situation.
- Lentil being comparatively an unimportant crop of the district, only 4.27 percent households have responded to the vocational training with higher yield rates as compared to both district and state level productivity in after training situation.
- Regarding soybean 72.99 percent households have responded to the training programme with yield rates in after training situation higher than district and state level average productivity.
- In case of Mustard 13.27 percent households have responded to the training programme with yield rates higher than both district and state level average productivity.
- Similarly for linseed the productivity level in after training situation is higher than the average productivity at district and state levels.
- The important horticultural crops of the district are potato, tomato and brinjal wherein 69.19 percent, 18.48 percent and 8.53 percent family representatives have responded to the vocational training. In these crops the after training performance are better than before training situations. An intensive effort is perhaps required to persuade the cultivators to take up the cultivation of horticulture crops on affordable scale.
- The participation rate of villagers in the training courses related to livestock and dairying is hardly meaningful which requires intensive efforts to popularize such activities.
- For home science the important constituents are preparation of pickles, papad/bari/jam/jelly etc which have immense scope in our area of study.
- In case of agro-forestry though only 7 number of households have shown interest in the training programme, the activity can pick-up with more intensive efforts.
- The activities like organic farming and bio pesticides are getting popular in our area of study as 18.01 percent and 3.79 percent households respectively have shown interest in such activities.

329
- No vocational trainings have been organised for subjects like poultry, fishery, training of rural youth and watershed activities. It may be mentioned have that the main reasons of not organizing such trainings are mainly the apathy of the target group. However the lack of interest on behalf of K.V.K. may not be ruled-out altogether.
FRONT LINE DEMONSTRATION [F.L.D.] 6.190 Front line demonstrations [FLD] are organized on farmer’s field with the result the response
is bound to be low as compared to vocational training. The table below shows the impact of front line demonstrations on cereal crops.
Table No. 6.58
Agronomy – Cereals Name of The Village Yield Per- Hectare - Kg.
Wheat Maize S. No
No. of Respon-
dents BT AT
No. of Respon-
dents BT AT
1 Simariya Kala (Muhkhed) 2 3850 4300 1 1900 2500 2 Thunia Ddana (Chhindwara) 3 4067 4333 1 2000 2500 3 Moadai (Chhindwara) 1 4000 4500 0 0 0
I Adopted Village 6 2
4 Lahgurua (Muhked) 2 3850 4150 1 2400 2900
5 Omariya (Muhked) 1 3900 4500 1 2600 2800 6 Munga (Parasiya) 1 2700 3000 0 0 0 7 Baranga (Parasiya) 2 2950 3600 0 0 0 8 Char Gaon Bhat (Chhindwara) 1 3600 4000 1 2600 2800 9 Dseriya (Chhindwara) 2 3700 4000 0 0 0
II Cluster Village 9 3
Total All Villages 15 5 6.191 The front line demonstrations for the wheat crop have been organized on the fields of 15
cultivating households which is 7.11 percent to total of 211 responding families. The yield per-hectare in after training situation is higher than before training situation for every village that ranged between 3000 kg. per hectare for the village Munga [cluster village] to 4500 kg per hectare for village Moadai [adopted village] and Omariya [cluster village] which is far in excess of district and state average productivity of 2096 kg and 1867 kg respectively.
6.192 Regarding Maize crop only 5 number [2.37 percent] of demonstrations have been organised
with yield per hectare higher in after training situations as compared to before training conditions that ranged between 2500 kg per hectare for villages Simariya Kala and Thunia Ddana [both adopted villages] to 2900 kg per hectare for village Lahgurua which are lower than the district average productivity of 2949 kg and higher than state average productivity of 2072 kg.
6.193 No F.L.Ds. have been organised for paddy and Jowar. Paddy being unimportant crop of
district Chhindwara, the low response seems obvious but Jowar, for which response regarding vocational training is substantion, a few F.L.Ds. should have been organised for this crop specially when this crop is grown mostly by marginal and small farmers.
AGRONOMY - PULSES 6.194 The table below shows the details;

330
Table No. 6.59 Agronomy – Pulses
Yield Per- Hectare - Kg. Gram Arhar
S. No
Name of The Village
No. of Respon-
dents BT AT
No. of Respon-dents
BT AT
1 Simariya Kala (Muhkhed) 1 1400 1700 0 0 0 2 Thunia Ddana (Chhindwara) 1 1400 1800 1 1600 1800 3 Moadai (Chhindwara) 0 0 0 0 0 0
I Adopted Village 2 1
4 Lahgurua (Muhked) 0 0 0 0 0 0 5 Omariya (Muhked) 0 0 0 0 0 0 6 Munga (Parasiya) 0 0 0 0 0 0 7 Baranga (Parasiya) 0 0 0 0 0 0 8 Char Gaon Bhat (Chhindwara) 0 0 0 0 0 0 9 Dseriya (Chhindwara) 1 1300 1500 0 0 0
II Cluster Village 1 0
Total All Villages 3 1 6.195 Gram, though an important crop of district Chhindwara, only 3 number of F.L.Ds. have
been organised which is 1.42 percent to total of 211 responding families with better performance in after training situations as copared to before training conditions, which ranged between 1500 kg per hectare for village Dseriya [cluster village] to 1800 kg per hectare for village Thunia Ddana [adopted village] much higher than district and state average productivity of 1344 kg and 932 kg respectively.
6.196 Similarly for Arhar only one F.L.D. has been organised at village Thunia Ddana despite
substantial response for vocational training, with productivity of 1800 kg per hectare in after training situation, higher than both in before training conditions and average district productivity of 1679 kg and state average productivity of 825 kg.
AGRONOMY – OIL SEEDS 6.197 The table below shows the details;
Table No. 6.60
Agronomy – Oil Seeds Soybean, Yield Per- Hectare - Kg. Sl.
No. Name of the Village
No. of Respondents BT AT 1 Simariya Kala (Muhkhed) 1 2000 2200 2 Thunia Ddana (Chhindwara) 1 1500 1900 3 Moadai (Chhindwara) 1 1900 2400 I Adopted Village 3
4 Lahgurua (Muhked) 1 1400 1904
5 Omariya (Muhked) 0 0 0 6 Munga (Parasiya) 0 0 0 7 Baranga (Parasiya) 1 1600 2000 8 Char Gaon Bhat (Chhindwara) 0 0 0 9 Dseriya (Chhindwara) 1 2100 2300 II Cluster Village 3
Total All Villages 6

331
6.198 Soybean though an important crop of the district, only 6 number of F.L.Ds. have been organised which is 2.84 percent to total of 211 responding households with per hectare yield higher in after training situation as compared to before training conditions that ranged between 1900 kg per hectare for village Thunia Ddana [adopted village] to 2400 kg per hectare for village Moadai [adopted village] which are higher than the district and state average productivities of 1464 kg and 1132 kg respectively.
6.199 No FLDs have been organized for crops like Paddy, Lentil, Jowar, Mustard, Cotton,
Sugarcane and Linseed. The impact of F.L.D. for these crops will not be visible. HORTICULTURE 6.200 The table below shows the details;
Table No. 6.61
Horticulture Crops Name of The Village
Potato Tomato Brinjal S. No
No. of Respond
ents
BT AT No. of Respond
ents
BT AT No. of Responde
nts
BT AT
1 Simariya Kala (Muhkhed) 0 0 0 0 0 0 0 0 0 2 Thunia Ddana (Chhindwara) 1 300 320 0 0 0 0 0 0 3 Moadai (Chhindwara) 0 0 0 1 190 220 0 0 0
I Adopted Village 1 1 0 4 Lahgurua (Muhked) 0 0 0 0 0 0 0 0 0
5 Omariya (Muhked) 0 0 0 0 0 0 0 0 0 6 Munga (Parasiya) 0 0 0 0 0 0 0 0 0 7 Baranga (Parasiya) 0 0 0 1 200 260 1 240 280 8 Char Gaon Bhat (Chhindwara) 0 0 0 0 0 0 0 0 0 9 Dseriya (Chhindwara) 0 0 0 0 0 0 0 0 0
II Cluster Village 0 1 1 Total All Villages 1 2 1
Table No. 6.61 [Contd…] Horticulture Crops
Yield Per- Hectare - Kg. Chilli Papaya
S. No
Name of The Village
No. of Respon-
dents BT AT
No. of Respon-dents BT AT
1 Simariya Kala (Muhkhed) 0 0 0 0 0 0 2 Thunia Ddana (Chhindwara) 0 0 0 0 0 0 3 Moadai (Chhindwara) 0 0 0 1 0 200
I Adopted Village 0 0 0 1
4 Lahgurua (Muhked) 0 0 0 0 0 0 5 Omariya (Muhked) 0 0 0 0 0 0 6 Munga (Parasiya) 0 0 0 0 0 0 7 Baranga (Parasiya) 1 0 260 0 0 0 8 Char Gaon Bhat (Chhindwara) 0 0 0 0 0 0 9 Dseriya (Chhindwara) 0 0 0 0 0 0
II Cluster Village 1 0 0
Total All Villages 1 0 1 0 200

332
6.201 Potato, though an important horticulture crop of district Chhindwara with 146 responding families for vocational training, only one F.L.D. has been organised for Thunia Ddana [adopted village] with yield per hectare higher in after training situation as compared to before training conditions. There should be some extent of matching performance between vocational training and F.L.D. to keep up the tempo of transferring agriculture related technology to the field.
6.202 Regarding Tomato also, only two number of F.L.Ds. have been organised [even though the
crop is important with ready market] at villages Moadai [adopted village] and Baranga [cluster village] with better performance in after training situation as compared to before training conditions.
6.203 Similarly for Brinjal crop only one F.L.D. has been organised for village Baranga [cluster
village] with higher yield per hectare in after training situation as compared to before training conditions.
6.204 As regards Chilly and Papaya crops only on F.L.D. each has been organised for villages
Baranga [cluster village] and Moadai [adoted village] respectively with not much tangible results.
AGRO FORESTRY 6.205 The table below shows the details;
Table No. 6.62 Agro Forestry
On farm plantation Hectare
S.No. Name of The Village
No. of Respondents
BT AT
1 Simariya Kala (Muhkhed) 0 0 0 2 Thunia Ddana (Chhindwara) 1 0 1 3 Moadai (Chhindwara) 0 0 0
I Adopted Village 1 0 1 4 Lahgurua (Muhked) 0 0 0 5 Omariya (Muhked) 0 0 0 6 Munga (Parasiya) 1 0 0 7 Baranga (Parasiya) 0 0 0 8 Char Gaon Bhat (Chhindwara) 0 0 0 9 Dseriya (Chhindwara) 0 0 0
II Cluster Village 1 0 0
Total All Villages 2 0 1
The above table shows an insignificant performance as only 2 F.L.Ds. have been organised in villages Thuniya Ddana [adopted village] and Munga [cluster village] with only 1 hectare of on farm plantation.
6.206 Regarding subjects like livestock and dairying, poultry, fisheries development, organic
farming and watershed activities no F.L.Ds. have been organised with the result the impact of these activities through F.L.Ds. will not be visible. Since all these activities are important for rural economy, particularly the subjects like livestock, dairying and watershed activities, a few F.L.Ds. may be organised on such subjects.

333
6.207 To sum-up - Front Line Demonstrations organised in our area of study has lead to enhancement in
productivity of most of agronomical and horticultural crops in after training situations as compared to before training conditions which show the positive impact of the efforts of the K.V.Ks.
- The F.L.Ds. for wheat crop has been organised on the fields of 15 number of cultivating households that lead to productivity in excess of average productivity prevailing at district and state levels.
- Regarding Maize crop, 5 number of F.L.Ds. have been organised with yield per hectare lower than district average and more than state level average productivity.
- As regards gram, only 3 number of F.L.Ds. have been organised with yield rates much higher as compared to district and state level average productivity.
- Similarly for Arhar, only one F.L.Ds. has been organised with productivity higher than prevailing yield rates at district and state levels.
- Regarding Soybean, 3 number of F.L.Ds. have been organised with higher yield per hectare as compared to district and state levels average productivities.
- Regarding horticulture crops like potato, tomato, brinjal, chilly and papaya crops, very marginal numbers of F.L.Ds. have been organised with very little tangible results.
- Similarly regarding agro forestry, F.L.Ds. for on farm plantation have been organised for two number of cultivators with not much tangible result.
- No F.L.Ds. have been organised on subjects like livestock and dairying, poultry, fisheries development, organic farming and watershed activities, the impact of such activities through F.L.D. will not be visible.
- Since F.L.Ds. are measures of learning by doing, more extensive implemention of this mandate must be attempted, matching to vocational training. What is required is to plan the F.L.Ds. much in advance in consultation with district authorities of line departments like agriculture, horticulture and Chief Executive Officer of Zila Panchayat etc. so that an understanding of State Plan priorities are reflected over such advance planning. The vocational training may thus be organised to provide a basic class room knowledge regarding subjects on which F.L.Ds. are to be organised so that farmers are equipped with ready knowledge. After this step, the F.L.Ds. may be organised which will immensely help the cultivators to implement the technology.
ON FARM TESTING [OFT] - CEREALS 6.208 In case of On Farm Testing, recommended technologies are tested on farmer’s fields leading
to the solution of various farming problems. The extent of response will obviously be low as the new technologies are not very frequent.
6.209 The table below shows the details;

334
Table No. 6.63 Cereal Crops
Yield Per- Hectare - Kg. Wheat Maize
S. No.
Name of The Village
No. of Responden
ts BT AT
No. of Responde
nts BT AT
1 Simariya Kala (Muhkhed) 2 3850 4400 0 0 0 2 Thunia Ddana (Chhindwara) 3 4067 4467 0 0 0 3 Moadai (Chhindwara) 1 4000 4500 0 0 0
I Adopted Village 6 0
4 Lahgurua (Muhked) 0 0 0 1 2400 2900
5 Omariya (Muhked) 0 0 0 0 0 0 6 Munga (Parasiya) 0 0 0 0 0 0 7 Baranga (Parasiya) 0 0 0 0 0 0 8 Char Gaon Bhat (Chhindwara) 0 0 0 0 0 0 9 Dseriya (Chhindwara) 0 0 0 0 0 0
II Cluster Village 0 1
Total All Villages 6 1
6.210 In case of Wheat, 6 number of on farm testing have been organised [all in adopted villages] with yield per hectare higher in after training situation as compared to before training conditions that ranged between 4400 kg per hectare in village Simariya Kala [adopted village] to 4500 kg per-hectare in village Moadai [adopted village] which are much higher than the district and state average productivities of 2096 kg and 1867 kg respectively.
6.211 Regarding Maize, only one O.F.T. has been organised in village Lahgurua [cluster village]
with yield per hectare lower than average district level productivity of 2949 kg and more than state level average productivity of 2072 kg.
ON FARM TESTING – OIL SEED CROPS 6.212 The table below shows the details;
Table No. 6.64 Oil Seed Crop - Soybean
Soyabeen S. No.
Name of The Village No. of Respondents BT AT
1 Simariya Kala (Muhkhed) 1 2000 2200 2 Thunia Ddana (Chhindwara) 0 0 0 3 Moadai (Chhindwara) 1 1900 2400
I Adopted Village 2 4 Lahgurua (Muhked) 0 0 0 5 Omariya (Muhked) 0 0 0 6 Munga (Parasiya) 0 0 0 7 Baranga (Parasiya) 0 0 0 8 Char Gaon Bhat (Chhindwara) 0 0 0 9 Dseriya (Chhindwara) 0 0 0
II Cluster Village 0 Total All Villages 2

335
6.213 Regarding Soybean only 2 number of O.F.Ts. have been organised in villages Simariya Kala and Moadai [both adopted villages] with higher yield rates as compared to district and state level average productivities of 1464 kg and 1132 kg respectively in after training situations.
6.214 No O.F.Ts. have been organised on subjects like horticulture, livestock and dairying,
poultry, fishery development, home science, training of rural youth, agro -forestry organic farming and watershed activities, which are very relevant to rural economy. The impact of such activities through O.F.Ts. therefore, will not be visible.
6.215 In the following paragraphs summing-up efforts have been made regarding results of
O.F.T. - In case of O.F.T., the yield per-hectare in after training situation is more than before
training conditions as has happened for both vocational training and front line demonstrations which shows the positive impact of K.V.Ks. efforts.
- The overall performance regarding organizing O.F.Ts. is somewhat sketchy as is evident from that fact that on very important subjects like horticulture, livestock and dairying, poultry, fishery development, agro-forestry and watershed activities, no O.F.Ts. have been organised. Whatever O.F.Ts. have been arranged are mostly limited to adopted villages, disregarding cluster villages which are the main forward linkages for adoption of agriculture related technology. Also there is complete mismatch between extent of organizing vocational training and O.F.T. As said earlier there should be definite chain of action between three basic mandates, i.e. vocational training, F.L.D. and O.F.T. with sequential results of impact of new or prevailing technologies.
STATUS OF ACTIVITIES IN CONTROL VILLAGE – PIPARIYA BIRSA 6.216 The study has identified one control village, i.e,. Pipariya Birsa with 14 number of
households and 71 sample family members, where there is no intervention of K.V.K. The information regarding common items of agronomical and horticulture crops have been collected to show the comparative status in areas of intervention and non- intervention. However, in case of control village before and after training situations have not been shown as there is no effort of K.V.K. in this village. For comparison, the average performance of vocational training in after training situation for adopted and cluster villages have been taken as the participation regarding all subjects is maximum in case of vocational training. The table below shows the comparative status of control village on one side and adopted and cluster villages on other side.

336
Table No. 6.65 Comparative Status of Performance Among Control Village and Adopted and Cluster Villages
Sl. No.
Item Control Village Adopted and cluster villages (average)
Difference [+ or -] over col. 3
1 2 3 4 5 PER HECTARE YIELD – KG
CEREALS 1 Wheat 3850 4014 (+) 164 2 Paddy 2200 2433 (+) 233 3 Maize 2264 2287 (+) 23 4 Jowar 1045 1097 (+) 52 PULSES 5 Gram 1500 2087 (+) 587 6 Arhar 1200 1455 (+) 255 7 Lentil 750 761 (+) 11 OIL SEEDS 8 Soybean 1569 2198 (+) 629 9 Mustard 1000 1521 (+) 521 10 Linseed 1000 2486 (+) 1486
HORTICULTURE CROPS – QUINTAL 11 Potato 287 316 (+) 25 12 Onion 203 252 (+) 49 13 Tomato 219 228 (+) 9 14 Brinjal 240 247 (+) 7 15 Chilly 176 183 (+) 7 16 Bhindi 100 155 (+) 5 17 Cucerbits - 142 - 18 Spices 100 130 (+) 30 19 Papaya 120 198 (+) 78 20 Citrus - 148 -
6.217 The above table shows that except for the crops like wheat, paddy, gram, arhar, soybean,
mustard and linseed where the per-hectare yield for adopted and cluster villages is substantially high as compared to that prevailing in control village, for rest of the crops the difference in per hectare yield is not much between adopted/cluster villages on one side and the control village on the other side. This shows that district as whole has condusive conditions for agricultural activities.
6.218 In the field of home science activities, particularly regarding preparation of pickles and
papad/bari/jam/jelly etc. substantial work has been done in adopted and cluster villages through the efforts of K.V.K. whereas such activities are not very popular in control village.
6.219 Like vocational training programme no work has been done in control village on
activities like poultry farming, fishery development, training of rural youth, watershed activities which have substantial scope in a rural economy.

337
RESULTS OF SURVEY – INDIVIDUAL PARTICULARS ADOPTED AND CLUSTER VILLAGES 6.220 In the following paragraphs an attempt has been made to highlight the various reactions of
25 percent of individuals. The total number of sample family members as reported is 1278 for adopted, cluster and control villages, the 25 percent of which comes to 319 individuals. The following table gives the break-up;
Table No. 6.66 Basic Details
Sl. No.
Item Total number of family members of 25% of households
25 % of individuals taken from 25% of households
1 2 3 4 1 Adopted Villages 464 116 2 Cluster Villages 743 185 3 Control Village 71 18 Total 1278 319
6.221 In the following paragraphs an attempt has been made to highlight the individual reactions
in adopted and cluster villages, i.e. for 301 individuals. 6.222 The criteria for selection of individuals are as follows; - The individual should be the adult member of the family. - He should be associated with any programme of K.V.K. For individuals of control village,
this criterion is not applicable for control village. - He/She should be literate, may be without having any formal education. SOCIAL CLASSIFICATION OF INDIVIDUALS 6.223 The table below shows the details;
Table No. 6.67 Social Classification
Social classification S. No.
Name of the Village No. of Individual S.T. S.C. O.B.C. GENERAL
1 2 3 4 5 6 7 1. Simariya Kala (Muhkhed) 37 0 0 40 0 2. Thunia Ddana (Chhindwara) 35 2 0 37 0 3. Moadai (Chhindwara) 44 7 7 33 0 Adopted Village 116 9 7 110 0
4. Lahgurua (Muhked) 48 0 0 50 0 5. Omariya (Muhked) 22 7 0 11 0 6. Munga (Parasiya) 20 8 0 10 0 7. Baranga (Parasiya) 38 18 0 11 0 8. Char Gaon Bhat (Chhindwara) 23 5 6 13 0 9. Dseriya (Chhindwara) 34 0 10 26 0 Cluster Village 185 38 16 121 0
Total All Villages 301 47 23 231 0 6.224 The above table shows that the majority of 231 individuals are from the group of O.B.C.
which is 76.74 percent to total of 301 sample invididuals from adopted and cluster villages. The combined percentage of S.T. and S.C. individuals is 23.26 to total sample individuals while no. of individuals from general community is nil. Thus the entire area of adopted and cluster villages is predominated by O.B.C. population that throws a challenge before K.V.K. scientists to achieve tangible results.

338
INDIVIDUALS CLASSIFIED ON THE BASIS OF RELIGION 6.225 The following table gives the details;
Table No. 6.68
Classification on the Basis of Religion Religion S.
No. Name of the Village No. of
Individual Hindu Muslim Sikh Christian Nauabudh Others 1 2 3 4 5 6 7 8 9 1. Simariya Kala (Muhkhed) 37 37 0 0 0 0 0 2. Thunia Ddana (Chhindwara) 35 35 0 0 0 0 0 3. Moadai (Chhindwara) 44 44 0 0 0 0 0 Adopted Village 116 116 0 0 0 0 0
4. Lahgurua (Muhked) 48 48 0 0 0 0 0 5. Omariya (Muhked) 22 22 0 0 0 0 0 6. Munga (Parasiya) 20 20 0 0 0 0 0 7. Baranga (Parasiya) 38 38 0 0 0 0 0 8. Char Gaon Bhat (Chhindwara) 23 23 0 0 0 0 0 9. Dseriya (Chhindwara) 34 34 0 0 0 0 0 Cluster Village 185 185 0 0 0 0 0
Total All Villages 301 301 0 0 0 0 0 6.226 The above table shows that cent-percent individuals are the followers of Hindu religion. AWARENESS ABOUT THE K.V.K. 5.227 The table below shows the details;
Table No. 6.69
Awareness About the K.V.K. Awareness about
existence of K.V.K.
If 'yes' knowledge about its location
Awareness about services rendered
by the K.V.K.
S. No
Name of the Village No. of Individual
Yes (1)
No (2)
Yes (1)
No (2)
Yes (1)
No (2)
1 2 3 4 5 6 7 8 9 1. Simariya Kala (Muhkhed) 37 37 0 37 0 37 0 2. Thunia Ddana (Chhindwara) 35 35 0 35 0 35 0 3. Moadai (Chhindwara) 44 44 0 44 0 44 0 Adopted Village 116 116 0 116 0 116 0
4. Lahgurua (Muhked) 48 48 0 48 0 48 0 5. Omariya (Muhked) 22 22 0 22 0 22 0 6. Munga (Parasiya) 20 20 0 20 0 20 0 7. Baranga (Parasiya) 38 38 0 38 0 38 0 8. Char Gaon Bhat (Chhindwara) 23 23 0 23 0 23 0 9. Dseriya (Chhindwara) 34 34 0 34 0 34 0 Cluster Village 185 185 0 185 0 185 0
Total All Villages 301 301 0 301 0 301 0
6.228 The cent percent awareness about the location and, more important, the services rendered by
it is an encouraging indication which shows the positive efforts of the K.V.K. to popularize the functions of K.V.K.

339
KNOWLEDGE ABOUT SPECIFIC SERVICES RENDERED BY K.V.K. 6.229 The table below shows the details;
Table No. 6.70 Specific Services Rendered by the K.V.K.
knowledge about vocational
knowledge about front line
demonstration training
knowledge about on farm testing
S. No
Name of the Village No. of Individual
Yes (1)
No (2)
Yes (1)
No (2)
Yes (1)
No (2)
1 2 3 4 5 6 7 8 9 1. Simariya Kala (Muhkhed) 37 37 0 32 0 32 0 2. Thunia Ddana (Chhindwara) 35 35 0 30 0 30 0 3. Moadai (Chhindwara) 44 44 0 39 0 39 0 Adopted Village 116 116 0 101 0 101 0
4. Lahgurua (Muhked) 48 48 0 39 0 39 0 5. Omariya (Muhked) 22 22 0 18 0 18 0 6. Munga (Parasiya) 20 20 0 0 40 0 24 7. Baranga (Parasiya) 38 38 0 2 54 2 46 8. Char Gaon Bhat (Chhindwara) 23 23 0 19 0 8 21 9. Dseriya (Chhindwara) 34 34 0 28 0 27 5 Cluster Village 185 185 0 106 94 104 96
Total All Villages 301 301 0 207 94 205 96
6.230 The above table shows the substantial knowledgeof individuals about the specific services
rendered by the K.V.K. particularly knowledge about vocational training which is cent-percent.
FIELD VISITS OF K.V.K. SCIENTISTS 6.231 Regular field visits by the K.V.K. scientists are necessary prerequisites for the
implementation of agriculture related technology. The table below shows the extent of such visits;
Table No. 6.71
Field Visits of K.V.K. Scientists If no the duration gap S.
No Name of the Village No. of
Individual One month (1)
Two month
(2)
More than two month
(3)
Never (4)
1 2 3 4 5 6 7 1. Simariya Kala (Muhkhed) 37 0 0 0 0 2. Thunia Ddana (Chhindwara) 35 2 0 0 0 3. Moadai (Chhindwara) 44 1 0 0 0 Adopted Village 116 3 0 0 0
4. Lahgurua (Muhked) 48 0 0 0 0 5. Omariya (Muhked) 22 1 0 1 2 6. Munga (Paraisya) 20 0 0 0 0 7. Baranga (Parasiya ) 38 0 0 2 0 8. Char Gaon Bhat (Chhindwara) 23 0 0 1 0 9. Dseriya (Chhindwara) 34 0 0 0 0 Cluster Village 185 1 0 4 2 Total 301 4 0 4 2

340
6.232 Out of total of 301 individuals only 10 individuals [3.32 percent] have reported about irregular visits of the K.V.K. scientists which is quite negligible and can be improved by a bit more careful approach.
THE STATUS OF REGULAR CONTACT WITH K.V.K. 6.233 The regular contact of the farmes with K.V.K. is one of the determining factors for
implementation of agriculture related technologies in the field. The table below shows the details;
Table No. 6.72 Status of Regular Contact with K.V.K.
Are you in regular touch
If yes reason if 'no' the reason S No
Name of the Village No. of Individ
ual Yes (1)
No (2)
For seed (1)
Plant protection
(2)
New technology
(3)
Distance (1)
Do not feel the
necessity (2)
1 2 3 4 5 6 7 8 9 10 1. Simariya Kala (Muhkhed) 37 32 11 0 1 30 7 3 2. Thunia Ddana (Chhindwara) 35 28 8 0 0 27 7 2 3. Moadai (Chhindwara) 44 38 9 0 0 38 6 0 Adopted Village 116 98 28 0 1 95 20 5
4. Lahgurua (Muhked) 48 38 7 0 2 29 1 0 5. Omariya (Muhked) 22 18 6 4 0 12 0 0 6. Munga (Paraisya) 20 16 4 0 0 14 0 0 7. Baranga (Parasiya ) 38 26 10 4 1 23 11 4 8. Char Gaon Bhat
(Chhindwara) 23 14 3 2 2 15 6 9
9. Dseriya (Chhindwara) 34 26 7 0 2 30 6 3 Cluster Village 185 138 37 10 7 123 24 16
Total 301 236 65 10 8 218 44 21
6.234 The above table shows that out of 301 individuals, 236 individuals [78.41 percent] have
reported about regular contact with K.V.K. while 65 persons [21.59 percent] have reported about irregular contact. The positive response by 218 individuals [72.43 percent] is mainly due the desire far new technology which obviously is an achievement of the K.V.K. while 18 sample individuals [5.98 percent] have contacted the K.V.K. for seed and plant protection measurers. The main cause of negetive response by 44 individuals [14.62 percent] is the distance factor which the K.V.K. scientists can not help. Twenty one number of individuals have not contacted the K.V.K. as they do not feel the necessity of it. Though the number of such individuals is limited but the attitude is not healthy. The K.V.K. scientists may initiate sincere efforts to stop brewing such attitudinal trend, which, in long run, may be disastrous.

341
STATUS OF IMPLEMENTATION OF THE SERVICES OF THE K.V.K. 6.235 The table below shows the details;
Table No. 6.73
Implementation of the Services of K.V.K. Implementation
of the services of K.V.K.
If yes in what fields S No.
Name of the Village No. of Individual
Yes (1)
No (2)
Agro-nomy
Hortic -ulture
Animal husbandry
Fishe-ries
Poultry
1 2 3 4 5 6 7 8 9 10
1. Simariya Kala (Muhkhed)
37 31 11 22 10 0 0 0
2. Thuniya Ddana (Chhindwara)
35 30 7 30 0 0 0 0
3. Moadai (Chhindwara) 44 39 6 39 0 0 0 0 Adopted Village 116 100 24 91 10 0 0 0 4. Lahgurua (Muhked) 48 38 7 39 0 0 0 0 5. Omariya (Muhked) 22 18 5 18 0 0 0 0 6. Munga (Paraisya) 20 16 6 16 0 0 0 0 7. Baranga (Parasiya ) 38 26 9 26 0 0 0 0 8. Char Gaon Bhat
(Chhindwara) 23 19 7 18 0 0 0 0
9. Dseriya (Chhindwara) 34 24 2 27 0 0 0 0 Cluster Village 185 141 36 144 0 0 0 0
Total 301 241 60 235 10 0 0 0
Table No. 6.73[Contd….]
Implementation of the Services of K.V.K. If yes in what fields If no the reason S.
No. Name of the Village
Home science
Agro forestry
Organic farming
Water-shed
Training of rural youth
Not satisfied with new
technology
Problem of
resources
Satisfied with
present status
1 2 11 12 13 14 15 16 17 18 1. Simariya Kala
(Muhkhed) 0 0 2 0 0 0 11 0
2. Thuniya Ddana (Chhindwara)
8 0 10 0 0 0 7 0
3. Moadai (Chhindwara) 0 4 7 0 0 0 6 0 Adopted Village 8 4 19 0 0 0 24 0 4. Lahgurua (Muhked) 0 0 0 0 0 0 7 0 5. Omariya (Muhked) 0 0 3 0 0 0 5 0 6. Munga (Paraisya) 0 0 0 0 0 0 6 0 7. Baranga (Parasiya ) 0 0 0 0 0 0 9 0 8. Char Gaon Bhat
(Chhindwara) 0 0 0 0 0 0 7 0
9. Dseriya (Chhindwara) 0 0 3 0 0 0 2 0 Cluster Village 0 0 6 0 0 0 36 0 Total 8 4 25 0 0 0 60 0

342
6.236 The above table shows that out of 301 individuals, 241 individuals [80.07 percent] have implemented the services of K.V.K. which is a fair account of achievement. It is worth mentioning that the figure of itemwise coverage will not tally with the figure of 241 as the same person from agronomy might have implemented the improved techniques in the fields of horticulture, animal husbandry etc.
6.237 The subject wise coverage figures show that the highest number of 235 individuals [78.07
percent] have implemented the services of K.V.K. in the fields of agronomy followed by 25 persons [8.31 percent] for organic farming and only 4 individuals have shown interest in agro-forestry.
6.238 Problem of resource is the only factor due to which 60 number of sample individuals [19.93
percent] have not implemented the services of the K.V.K. SATISFACTION LEVEL OF THE INDIVIDUALS ABOUT THE SERVICES OF K.V.K. 6.239 The level of satisfaction derived from the services of K.V.K. is important to sustain the
efforts of K.V.K. over a period of time. The table below shows the details;
Table No. 6.74 Satisfaction Level of the Individuals
Satisfied with the impact
If yes in what fields S. No
Name of the Village No. of Individual
Yes (1)
No (2)
Agronomy Horticulture
Animal husban-
dry
Fisheries Poultry
1 2 3 4 5 6 7 8 9 10 1. Simariya Kala
(Muhkhed) 37 37 0 20 12 0 0 0
2. Thunia Ddana (Chhindwara)
35 35 0 30 0 0 0 0
3. Moadai (Chhindwara) 44 44 0 39 0 0 0 0 Adopted Village 116 116 0 89 12 0 0 0
4. Lahgurua (Muhked) 48 48 0 39 0 0 0 0 5. Omariya (Muhked) 22 22 0 18 0 0 0 0 6. Munga (Paraisya) 20 20 0 16 0 0 0 0 7. Baranga (Parasiya ) 38 38 0 28 0 0 0 0 8. Char Gaon Bhat
(Chhindwara) 23 22 1 19 0 0 0 0
9. Dseriya (Chhindwara) 34 32 2 26 0 0 0 0 Cluster Village 185 182 3 146 0 0 0 0
Total 301 298 3 235 12 0 0 0

343
Table No. 6.74 [Contd…] Satisfaction Level of the Individuals
If yes in what fields If no the reason S. No.
Name of the Village Home
science Agro
forestry Organic farming
Water shed
Training of rural youth
Techn-ique is difficult to follow
Inputs are not easily available
Non-availabili
ty of advice in the time
1 2 11 12 13 14 15 16 17 18 1. Simariya Kala (Muhkhed) 0 0 2 10 0 0 0 0 2. Thunia Ddana (Chhindwara) 10 0 8 0 0 0 0 0 3. Moadai (Chhindwara) 0 4 7 4 0 0 0 0 Adopted Village 10 4 17 14 0 0 0 0
4. Lahgurua (Muhked) 0 0 0 0 0 0 1 0 5. Omariya (Muhked) 0 0 3 0 0 0 1 0 6. Munga (Paraisya) 0 0 0 0 0 0 0 0 7. Baranga (Parasiya ) 0 0 0 0 0 0 0 0 8. Char Gaon Bhat (Chhindwara) 0 0 0 0 0 0 0 0 9. Dseriya (Chhindwara) 0 0 3 0 0 0 1 0 Cluster Village 0 0 6 0 0 0 3 0
Total 10 4 23 14 0 0 3 0
6.240 The above table shows that out of 301 individuals 298 individuals [99.00 percent] have
expressed their satisfaction towards impact of the efforts of K.V.K. which in itself is an encouraging achievement.
6.241 Regarding subjectwise level of satisfaction, agronomy is the prime subject where 235
individuals [78.07 percent] have shown their satisfaction followed by organic farming activities [23 individuals] and horticulture [12 individuals] only 3 individuals are not satisfied because of the non-availability of inputs.
IMPACT ON INCOME ENHANCEMENT 6.242 The table below shows the details;
Table No. 6.75 Impact on Income Enhancement
Income enhancement
If yes the fields S. No.
Name of the Village No. of Individ
-ual Yes (1)
No (2)
Agronomy Horticu-lture
Animal husbandry
Fisheries Poultry
1 2 3 4 5 6 7 8 9 10 1. Simariya Kala(Muhkhed) 37 36 1 20 12 0 0 0 2. Thunia Ddana
(Chhindwara) 35 35 0 30 0 0 0 0
3. Moadai (Chhindwara) 44 44 0 39 0 0 0 0 Adopted Village 116 115 1 89 12 0 0 0
4. Lahgurua (Muhked) 48 48 0 39 0 0 0 0 5. Omariya (Muhked) 22 22 0 18 0 0 0 0 6. Munga (Paraisya) 20 20 0 16 0 0 0 0 7. Baranga (Parasiya ) 38 38 0 28 0 0 0 0 8. Char Gaon Bhat
(Chhindwara) 23 23 0 19 0 0 0 0
9. Dseriya (Chhindwara) 34 33 1 27 0 0 0 0 Cluster Village 185 184 1 147 0 0 0 0
Total 301 299 2 236 12 0 0 0

344
Table No. 6.75 [Contd…] Impact on Income Enhancement
If no the reasons S. No.
Name of the Village Home
science Agro
forestry Organic farming
Water shed
Training of rural youth
Could not follow the instruction
Problem of
resourse
Non- availability technical advice in
time 1 2 11 12 13 14 15 16 17 18
1. Simariya Kala (Muhkhed) 0 0 1 0 12 0 0 0 2. Thunia Ddana (Chhindwara) 10 0 7 1 5 0 0 0 3. Moadai (Chhindwara) 0 0 9 0 0 0 0 0 Adopted Village 10 0 17 1 17 0 0 0 4. Lahgurua (Muhked) 0 0 0 0 0 0 0 0 5. Omariya (Muhked) 0 0 3 0 0 0 0 0 6. Munga (Paraisya) 0 0 0 0 0 0 0 0 7. Baranga (Parasiya ) 0 0 0 0 0 1 0 0 8. Char Gaon Bhat
(Chhindwara) 0 0 0 0 0 1 0 0
9. Dseriya (Chhindwara) 0 0 1 2 0 0 0 0 Cluster Village 0 0 4 2 0 2 0 0
Total 10 0 21 3 17 2 0 0 6.243 Out of 301 number of individuals 299 individuals [99.34 percent] have expressed the
positive impact of K.V.Ks. efforts over income enhancement which, in itself is an startling achievement. Maximum number of 236 individuals which is 78.40 percent to total individuals have positive response of income enhancement through agronomy followed by response of 21 persons for organic farming and 17 persons for training of rural youth.
EXTENT OF INCOME ENHANCEMENT 6.244 Assessment of income level of individuals is one of the most difficult aspects of primary
data collection as the persons are usually shy of giving the correct information. However, through indirect approach, information regarding income has been collected which is given in the following table;
Table No. 6.76 Extent of Income Enhancement
Percentage increase in Income S. No
Name of the Village No. of Individ-
ual 1to 10%
11 to 20%
21 to 30%
31 to 50%
51 to 60%
61 to 70%
71 to 80%
81 to 90%
91 to 100%
1 2 3 4 5 6 7 8 9 10 11 12 1. Simariya Kala
(Muhkhed) 37 37 0 0 0 0 0 0 0 0
2. Thunia Ddana (Chhindwara)
35 34 1 0 0 0 0 0 0 0
3. Moadai (Chhindwara) 44 40 4 0 0 0 0 0 0 0 Adopted Village 116 111 5 0 0 0 0 0 0 0
4. Lahgurua (Muhked) 48 48 0 0 0 0 0 0 0 0 5. Omariya (Muhked) 22 17 5 0 0 0 0 0 0 0 6. Munga (Paraisya) 20 20 0 0 0 0 0 0 0 0 7. Baranga (Parasiya ) 38 38 0 0 0 0 0 0 0 0 8. Char Gaon Bhat
(Chhindwara) 23 15 8 0 0 0 0 0 0 0
9. Dseriya (Chhindwara) 34 28 6 0 0 0 0 0 0 0 Cluster Village 185 166 19 0 0 0 0 0 0 0
Total 301 277 24 0 0 0 0 0 0 0

345
6.245 The above table shows that out of 301 individuals, 277 individuals [92.03 percent] have reported bout 1 to 10 percent income enhancement due to the efforts of the K.V.K. while 24 persons [7.97 percent] reported about 11 to 20 percent enhancement in income which is a creditable achievement.
OPINION ABOUT CONTINUANCE OF THE SERVICES OF K.V.K. 6.246 The table below shows the details;
Table No. 6.77 Opinion about Continuance of K.V.K. Services
Continuation of the services of K.V.K. S. No.
Name of the Village No. of Individual Yes
(1) No (2)
1 2 3 4 5 1. Simariya Kala (Muhkhed) 37 35 2 2. Thunia Ddana (Chhindwara) 35 35 0 3. Moadai (Chhindwara) 44 44 0 Adopted Village 116 114 2
4. Lahgurua (Muhked) 48 48 0 5. Omariya (Muhked) 22 21 1 6. Munga (Paraisya) 20 20 0 7. Baranga (Parasiya ) 38 36 2 8. Char Gaon Bhat (Chhindwara) 23 23 0 9. Dseriya (Chhindwara) 34 34 0 Cluster Village 185 182 3
Total 301 296 5
6.247 The above table shows that out of 301 individuals, 296 individuals [98.34 percent] have
opined for continuance of the services of K.V.K. particularly in the fields of agromony and horticulture while only 5 number of individuals [1.66 percent] have given negetive opinion which seems natural in view of large number of respondents. Viewing things from the positive angle, the performance of the K.V.K. is laudable, as the efforts have won the confidence of the farming community of our area of study.
SUGGESTIONS FOR ADDITIONAL SERVICES TO BE RENDERED BY THE K.V.K. 6.248 Information regarding suggestions for additional services to be rendered by the K.V.K. has
been collected from the individuals. The table below shows the details;

346
Table No. 6.78 Suggestions for Additional Services to be Rendered by K.V.K.
Suggestions for additional services by KVK S. No.
Name of the Village No. of Individual Production of
by product Marketing strategy
Weather forecasting
Availability of agri. inputs at
panchayat level 1 2 3 4 5 6 7 1. Simariya Kala (Muhkhed) 37 18 3 0 10 2. Thunia Ddana (Chhindwara) 35 20 8 2 0 3. Moadai (Chhindwara) 44 24 7 0 8 Adopted Village 116 62 18 2 18
4. Lahgurua (Muhked) 48 9 8 2 20 5. Omariya (Muhked) 22 10 4 4 0 6. Munga (Paraisya) 20 14 2 0 0 7. Baranga (Parasiya ) 38 8 7 0 7 8. Char Gaon Bhat (Chhindwara) 23 9 10 0 0 9. Dseriya (Chhindwara) 34 16 8 1 3 Cluster Village 185 66 39 7 30
Total 301 128 57 9 48
6.249 Out of 301 individuals, 242 individuals [80.40 percent to total individuals] have given their
useful suggestions about introduction of additional services to be rendered by the K.V.K. Important among these are regarding suggestions about production of by-product of crops, development of marketing strategy for fair return of the product and making available agricultural inputs at Gram Panchayat Level wherein 128, 57 and 48 individuals respectively have given their useful suggestions.
6.240 Regarding production of by-product, that may lead to some processing activities, the work
may be initiated in liaison with Industries Department of the district. 6.241 Marketing of agriculture produce is gaining importance to avoid the exploitation of farmers
by brokers. The intervention of K.V.K. personnel will be very useful if some sort of training is organised for beneficiary cultivators in liaison with Mandi Committees.
6.242 Regarding availability of agriculture inputs at Gram Panchayat level, the K.V.K Scientists
may bring home the solution in consultation with the Chief Executive Officer of Zila Panchayat by developing modalities for making available things at Gram Panchayat level.
6.243 It is, therefore, worth considering to incorporte in the mandate of K.V.K. the subjects
like production of by-products and development of marketing strategy of the product of the cultivators.
UTILIZATION OF THE ENHANCED INCOME 6.244 Proper utilization of enhanced income is equally important as compared to its generation.
The table below shows the utilization of enhanced income of sample individuals for purchase of various agriculture inputs;

347
Table No. 6.79 Utilization of Enhanced Income
Enhanced income led to purchase of Tractor Harvester Thresher
S. No.
Name of the Village No. of Individual
Yes(1) No (2) Yes(1) No(2) Yes(1) No(2) 1 2 3 4 5 6 7 8 9 1. Simariya Kala (Muhkhed) 37 2 35 0 37 0 37 2. Thunia Ddana (Chhindwara) 35 0 35 0 35 0 35 3. Moadai (Chhindwara) 44 0 44 0 44 0 44 Adopted Village 116 2 114 0 116 0 116
4. Lahgurua (Muhked) 48 3 45 0 48 0 48 5. Omariya (Muhked) 22 0 22 0 22 0 22 6. Munga (Paraisya) 20 0 20 0 20 0 20 7. Baranga (Parasiya ) 38 0 38 2 36 0 38 8. Char Gaon Bhat (Chhindwa ra) 23 0 23 0 23 0 23 9. Dseriya (Chhindwara) 34 0 34 0 34 0 34 Cluster Village 185 3 182 2 183 0 185
Total 301 5 296 2 299 0 301
Table No. 6.79 [Contd…] Utilization of Enhanced Income
Plough Seed drill Bullock pair
S. No.
Name of the Village No. of Individual
Yes (1) No (2) Yes (1) No (2) Yes (1) No (2) 1 2 3 10 11 12 13 14 15 1. Simariya Kala (Muhkhed) 37 2 35 0 37 2 35 2. Thunia Ddana (Chhindwara) 35 7 28 0 35 4 31 3. Moadai (Chhindwara) 44 6 38 0 44 6 38 Adopted Village 116 15 101 0 116 12 104
4. Lahgurua (Muhked) 48 1 47 0 48 4 44 5. Omariya (Muhked) 22 6 16 0 22 1 21 6. Munga (Paraisya) 20 0 20 0 20 6 14 7. Baranga (Parasiya ) 38 0 38 0 38 4 34 8. Char Gaon Bhat (Chhindwara) 23 6 17 0 23 3 20 9. Dseriya (Chhindwara) 34 6 28 0 34 5 29 Cluster Village 185 19 166 0 185 23 162
Total 301 34 267 0 301 35 266
Table No. 6.79 [Contd…] Utilization of Enhanced Income
Power/Knapsac
sprayer Handhoe Storage facility
S. No.
Name of the Village No. of Individual
Yes (1) No(2) Yes(1) No(2) Yes (1) No (2) 1 2 3 16 17 18 19 20 21 1. Simariya Kala (Muhkhed) 37 8 29 6 31 0 37 2. Thunia Ddana(Chhindwara) 35 3 32 8 27 0 35 3. Moadai (Chhindwara) 44 6 38 2 42 0 44 Adopted Village 116 17 99 16 100 0 116
4. Lahgurua (Muhked) 48 13 35 3 45 0 48 5. Omariya (Muhked) 22 5 17 0 22 0 22 6. Munga (Paraisya) 20 4 16 0 20 0 20 7. Baranga (Parasiya ) 38 4 34 2 36 0 38 8. Char Gaon Bhat (Chhindwara) 23 3 20 3 20 0 23 9. Dseriya (Chhindwara) 34 0 34 6 28 0 34 Cluster Village 185 29 156 14 171 0 185 Total 301 46 255 30 271 0 301

348
Table No. 6.79 [Contd…] Utilization of Enhanced Income
Tube well /Dug well Electric/diesel motor Yes (1) No (2) Yes (1) No (2)
S. No.
Name of the Village No. of Individual
22 23 24 25 1. Simariya Kala (Muhkhed) 37 0 37 0 37 2. Thunia Ddana (Chhindwara) 35 0 35 0 35 3. Moadai (Chhindwara) 44 0 44 0 44 Adopted Village 116 0 116 0 116
4. Lahgurua (Muhked) 48 0 48 0 48 5. Omariya (Muhked) 22 0 22 0 22 6. Munga (Paraisya) 20 0 20 0 20 7. Baranga (Parasiya ) 38 0 38 0 38 8. Char Gaon Bhat (Chhindwara) 23 0 23 0 23 9. Dseriya (Chhindwara) 34 0 24 0 24 Cluster Village 185 0 185 0 185
Total 301 0 301 0 301 6.245 The above table shows that 152 individuals have utilized their enhanced income for
purchase of various agriculture inputs which constitutes 50.50 percent to total number of 301 sample individuals. The purchases are mainly limited on items like tractor, harvester, plough, bullock pairs power/knapsac sprayer and hand hoe.The utilization level of enhanced income for purchase of agriculture input is some what encouraging.
IMPACT OF ENHANCED INCOME OVER EDUCATION LEVELS 6.246 The table below shows the impact of enhanced income over levels of education in our area
of study; Table No. 6.80
Impact of Enhanced Income Over Levels of Education Impact on education
due to enhanced income
If yes in what manner S. No.
Name of the Village No. of Individual
Yes (1)
No (2)
More Male
Children go to
primary/middle
(1)
More Female Children
go to primary/middle
(2)
More male children attend
secondary level
education (3)
More female
children attend
secondary level
education (4)
Male Female children go for higher
education non(5)
1 2 3 4 5 6 7 8 9 10 1. Simariya Kala (Muhkhed) 37 37 0 30 5 2 0 0 2. Thunia Ddana (Chhindwara) 35 33 2 24 7 1 0 1 3. Moadai (Chhindwara) 44 42 2 27 5 8 0 2 Adopted Village 116 112 4 81 17 11 0 3
4. Lahgurua (Muhked) 48 46 2 28 8 7 1 2 5. Omariya (Muhked) 22 17 5 8 6 3 0 0 6. Munga (Paraisya) 20 18 2 14 2 0 2 0 7. Baranga (Parasiya ) 38 32 6 26 4 2 0 0 8. Char Gaon Bhat (Chhindwara) 23 22 1 18 4 0 0 0 9. Dseriya (Chhindwara) 34 21 3 18 1 1 1 0 Cluster Village 185 166 19 92 25 13 4 2
Total 301 278 23 203 42 24 4 5
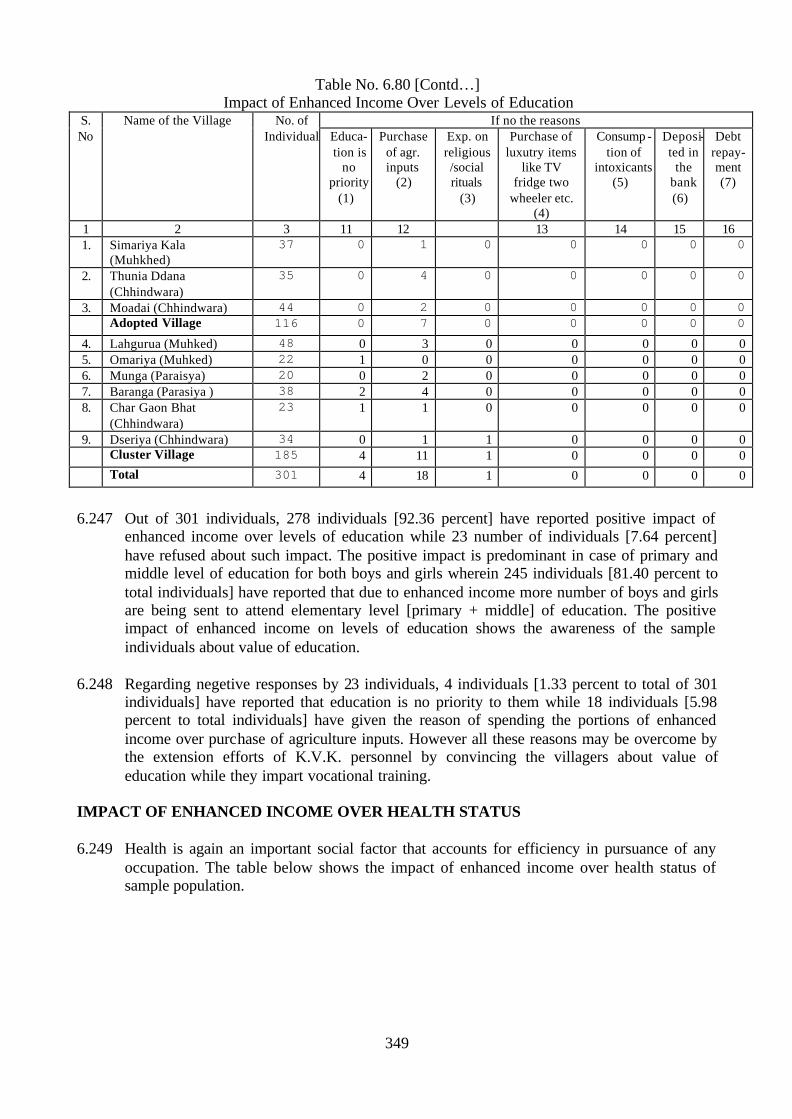
349
Table No. 6.80 [Contd…] Impact of Enhanced Income Over Levels of Education
If no the reasons S. No
Name of the Village No. of Individual Educa-
tion is no
priority (1)
Purchase of agr. inputs
(2)
Exp. on religious/social rituals
(3)
Purchase of luxutry items
like TV fridge two
wheeler etc. (4)
Consump - tion of
intoxicants (5)
Deposi-ted in
the bank (6)
Debt repay-ment (7)
1 2 3 11 12 13 14 15 16 1. Simariya Kala
(Muhkhed) 37 0 1 0 0 0 0 0
2. Thunia Ddana (Chhindwara)
35 0 4 0 0 0 0 0
3. Moadai (Chhindwara) 44 0 2 0 0 0 0 0 Adopted Village 116 0 7 0 0 0 0 0
4. Lahgurua (Muhked) 48 0 3 0 0 0 0 0 5. Omariya (Muhked) 22 1 0 0 0 0 0 0 6. Munga (Paraisya) 20 0 2 0 0 0 0 0 7. Baranga (Parasiya ) 38 2 4 0 0 0 0 0 8. Char Gaon Bhat
(Chhindwara) 23 1 1 0 0 0 0 0
9. Dseriya (Chhindwara) 34 0 1 1 0 0 0 0 Cluster Village 185 4 11 1 0 0 0 0
Total 301 4 18 1 0 0 0 0
6.247 Out of 301 individuals, 278 individuals [92.36 percent] have reported positive impact of
enhanced income over levels of education while 23 number of individuals [7.64 percent] have refused about such impact. The positive impact is predominant in case of primary and middle level of education for both boys and girls wherein 245 individuals [81.40 percent to total individuals] have reported that due to enhanced income more number of boys and girls are being sent to attend elementary level [primary + middle] of education. The positive impact of enhanced income on levels of education shows the awareness of the sample individuals about value of education.
6.248 Regarding negetive responses by 23 individuals, 4 individuals [1.33 percent to total of 301
individuals] have reported that education is no priority to them while 18 individuals [5.98 percent to total individuals] have given the reason of spending the portions of enhanced income over purchase of agriculture inputs. However all these reasons may be overcome by the extension efforts of K.V.K. personnel by convincing the villagers about value of education while they impart vocational training.
IMPACT OF ENHANCED INCOME OVER HEALTH STATUS 6.249 Health is again an important social factor that accounts for efficiency in pursuance of any
occupation. The table below shows the impact of enhanced income over health status of sample population.

350
Table No. 6.81 Impact of Enhanced Income over Health Conditions
Impact on Health
If yes in what manner S. No.
Name of the Village No. of Individual
Yes (1)
No (2)
Services of
medical personnel
(1)
Vaccination of
children/ women done(2)
Child nutrition
(3)
Female nutrition during
gestation (4)
Adoption of Family
welfare measuries
1. Simariya Kala (Muhkhed) 37 37 0 37 0 0 0 0 2. Thunia Ddana (Chhindwara) 35 32 3 7 15 5 2 3 3. Moadai (Chhindwara) 44 40 4 33 4 1 1 1 Adopted Village 116 109 7 77 19 6 3 4
4. Lahgurua (Muhked) 48 47 1 47 0 0 0 0 5. Omariya (Muhked) 22 22 0 11 9 2 0 0 6. Munga (Paraisya) 20 18 2 18 0 0 0 0 7. Baranga (Parasiya ) 38 38 0 38 0 0 0 0 8. Char Gaon Bhat
(Chhindwara) 23 23 0 20 2 1 0 0
9. Dseriya (Chhindwara) 34 22 2 3 15 3 1 0 Cluster Village 185 180 5 147 26 6 1 0
Total 301 289 12 224 45 12 4 4
Table No. 6.81 [Contd…]
Impact of Enhanced Income over Health Conditions If no the reasons S.
No Name of the Village No. of
Individual Health is no
priority
Believe in local healing methods
Purchase of agri.
inputs
Exp. on religious functions
Luxury items TV
Fridge, Two wheeler,
Four wheeler
Consumption of
intoxicants
Deposited in bank
1. Simariya Kala (Muhkhed)
37 0 0 1 0 0 0 0
2. Thunia Ddana (Chhindwara)
35 0 2 1 0 0 0 0
3. Moadai (Chhindwara) 44 3 0 1 0 0 0 0 Adopted Village 116 3 2 3 0 0 0 0
4. Lahgurua (Muhked) 48 0 0 0 0 0 0 0 5. Omariya (Muhked) 22 0 0 0 0 0 0 0 6. Munga (Paraisya) 20 0 3 0 0 0 0 0 7. Baranga (Parasiya ) 38 0 0 0 0 0 0 0 8. Char Gaon Bhat
(Chhindwara) 23 0 0 0 0 0 0 0
9. Dseriya (Chhindwara) 34 0 0 1 0 0 0 0 Cluster Village 185 0 3 1 0 0 0 0
Total 301 3 5 4 0 0 0 0
6.250 The above table shows that out of 301 individuals, 289 individuals [96.01 percent to total of
301 individuals] have reported about positive impact of enhanced income over health status which shows the awareness of the sample population about value of keeping good health. The items of positive responses like hiring of the services of medical personnel [224 individuals], vaccination of children/women [45 individuals]. Child nutrition [12 individuals] and adoption of family welfare measures [4 individuals] are indicative of healthy trend since the individuals are more concerned particularly about, the health status of women and children.

351
6.251 Though the number of individuals with negetive response is only 12 [3.99 percent to total of 301 individuals] but the opinion like health is no priority by 3 number of individuals is a sort of red alert to K.V.K. scientists who must uproot such attitude lest they go deep into the thinking of more individuals.
IMPACT OF ENHANCED INCOME OVER POTABLE DRINKING WATER SUPPLY 6.252 The table below shows the details;
Table No. 6.82
Impact of Enhanced Income over Potable Drinking Water Supply Improve in potable drinking water S.
No Name of the Village No. of
Individual Yes No 1 2 3 4 5 1. Simariya Kala (Muhkhed) 37 19 18 2. Thunia Ddana (Chhindwara) 35 10 25 3. Moadai (Chhindwara) 44 11 33 Adopted Village 116 40 76
4. Lahgurua (Muhked) 48 21 27 5. Omariya (Muhked) 22 7 15 6. Munga (Paraisya) 20 8 12 7. Baranga (Parasiya ) 38 22 16 8. Char Gaon Bhat (Chhindwara) 23 11 12 9. Dseriya (Chhindwara) 34 10 14
Cluster Village 185 79 106
Total 301 119 182
6.253 The above tabke shows a reverse situation where the negetive response is to the tune of 182
individuals which is 60.47 percent to total of 301 individuals while the positive response is by 119 individuals [39.53 percent]. These facts show that availability of potable drinking water is no priority in rural areas.
IMPACT OF ENHANCED INCOME OVER HOUSING CONDITIONS 6.254 The table below shows the details;
Table No. 6.83
Impact of Enhanced Income over Housing Conditions Enhancement in income resulted in
improved housing contentions S. No
Name of the Village No. of Individual
Yes No 1 2 3 4 5 1. Simariya Kala (Muhkhed) 37 20 17 2. Thunia Ddana (Chhindwara) 35 12 23 3. Moadai (Chhindwara) 44 15 29 Adopted Village 116 47 69
4. Lahgurua (Muhked) 48 19 29 5. Omariya (Muhked) 22 10 12 6. Munga (Paraisya) 20 6 14 7. Baranga (Parasiya ) 38 18 20 8. Char Gaon Bhat (Chhindwara) 23 10 13 9. Dseriya (Chhindwara) 34 12 12 Cluster Village 185 75 110
Total 301 122 179

352
6.255 The above table shows that out of 301 individuals, 122 individuals [40.53 percent] have positive respons while 179 individuals [59.47 percent] have refused spending of any amount of enhanced income over improving the housing conditions. The status seems obvious as frequent expenditure over improving the houseing condition is not usually done.
AWARENESS ABOUT WELFARE SCHEMES INITIATED BY THE STATE GOVERNMENT WITH ASSISTANCE FROM GOVERNMENT OF INDIA 6.256 The basic objectives of various welfare schemes initiated by the government are for
providing employment opportunities to the target group for augmentation of income thereby improving the quality of life of the individuals/community. Though this information has no direct relevance to the functioning of K.V.K. but its personnel are supposed to popularize such schemes among villagers for taking financial support from such programmes. In the following paragraphs the details of a few important schemes have been given which have direct impact over the livelihoods of sample population.
JAWAHAR GRAM SAMRIDHI YOJANA 6.257 The former scheme of Jawahar Rojgar Yojna renamed as Jawahar Gram Samridhi Yojna
was started from the year 1999-2000 with the basic objective of creating community assets of permanent nature, thereby providing employment to local labour. The survey results show that out of 301 individuals 233 individuals [77.41 percent] are aware of the scheme while rest of 68 individuals [22.59 percent] have no knowledge about the scheme. The scheme is important from the view point of creating community asset that results in availability of employment opportunities. Awareness about this scheme will induce the villagers to assert their demand through Gram Panchayat to develop their area. The K.V.K. personnel may, during their field visits, publicize the utility of the scheme among the villagers.
EMPLOYMENT ASSURANCE SCHEME 6.258 Started from the year 1997-98, the scheme aims at providing employment to rural
population during lean season of agriculture thereby creating community assets. The response to this scheme is somewhat encouraging as 190 individuals [63.12 percent] are aware about the scheme.
ESTABLISHMENT OF HAND LOOM UNITS 6.259 Under this scheme, the units having 5 to 10 looms are registered and loom-shed subsidy and
margin money subsidy are given. Only 3 persons of our sample area are aware of the scheme. When even awareness is not there, there can hardly be any possibility of its implementation in our area of study.
ESTABLISHMENT OF SERICULTURE UNITS 6.260 Under this scheme the beneficiaries are given training on various aspects of sericulture
activities to supplement their income. For this purpose Resham Kendras spread over in districts assume nodal responsibilities to train the beneficiaries and augment their infrastructure. Only 2 individuals from our area of study are aware of the existence of such scheme when the scheme is so important for rural economy. The K.V.K. personnel in liaison with concerned district authorities may take-up a compaign for making villagers aware about the benefits of the scheme.

353
ESTABLISHMENT OF FAMILY BASED RURAL INDUSTRIAL UNITS 6.261 The scheme is implemented by the Madya Pradesh Khadi and Gramodoyog Board. Under
this scheme the units pertaining to SC, ST and OBCs are given 90 percent subsidy on capital loan and remaining 10 percent loan is given by the banks. The level of awareness about this scheme is reasonably fair as 18 individuals [5.98 percent to total of 301 individuals] are aware about this scheme.
MID DAY MEALS 6.262 The programme has proved to be an effective incentive for retention of school going
children relating to primary education, specially the children coming from low income group. Under this programme cooked meals are provided to the school going children. The level of awareness of this scheme in our area of study is cent percent.
FREE SUPPLY OF TEXT BOOKS 6.263 Under this scheme all the students of primary standard [classes 1st to 5th] belonging to SC,
ST and OBCs and students of classes 1st to 3rd standards belonging to general communities are given text books free of cost. As per our survey results 234 individuals [77.74 percent] are aware about the scheme while 67 individuals [22.26 percent] are not aware of the scheme. Since the supply of text books free of cost is mandatory, the individuals unaware of the scheme are either persons having their wards above primary standards of education or the rate of drop-out is so high that they are not particular about the scheme. However, efforts both by persons of school education department and K.V.K. may reduce such extent of unawareness.
WOMEN SELF HELP GROUP 6.264 With view to ensure social and economic empowerment of women, self help groups
[S.H.Gs.] are formed for making the women confident to face challenges on all fronts, be it social or economic. In this scheme, the members of the group deposit a part of their saving in the fund raised by the group and may take loan to meet their various social and economic obligations, subject to return of the amount with interest. In our area of study 291 individuals [96.68 percent] are aware of this scheme which, ofcourse, is very encouraging that indicates the awareness of individuals about the value of such institution. Unawareness aspect for 10 individuals may easily overcome by little more extension efforts by concerned government officials and persons of K.V.K.
GRAMYA YOJNA 6.265 Under this scheme the poor women are given interest free loan upto Rs. 500.00 towards
starting a small business. After repayment of the first loan within one year, second loan to the tune of Rs. 1500.00 is given. In our area of study, 215 number of individuals [71.43 percent] are aware of this scheme which is satisfactory.
AUSMATI YOJNA 6.266 With the objective of providing better medical assistance to the women belonging to the
families living below the poverty line in rural areas, this scheme was started in the year 1999. For this scheme also the extent of awareness by 246 individuals [81.73 percent] is satisfactory.

354
6.267 In what follows an attempt has been made to summarise the details of individual particulars of adopted and cluster villages. - The frame of the present part of the narration is 310 individuals which is 25
percent of the family members of 25 percent sample households belonging to adopted and cluster villages.
- The criteria for selection of individuals are – the persons should be the adult member of the family, he/she should be associated with any programme of the K.V.K., he/she should be literate – may be without having any formal education.
- The majority of 231 individuals are from OBC community that accounts for 76.74 percent to total of 301 individuals from adopted and cluster villages.
- The cent-percent sample individuals from our area of study are the followers of Hindu religion.
- The cent-percent awareness of the individuals about the K.V.K. in terms of its location and more importantly the services rendered by it is an important achievement of the K.V.K.
- The cent percent awareness about vocational training is encouraging. - Regarding regular contact with K.V.K. the survey results show the regular
contact of 78.41 percent individuals mainly because of the desire for adopting new technology and for obtaining quality seed. The positive impact of the efforts of the K.V.K. is clearly visible.
- Out of 301 individuals, 241 individuals have implemented the services of K.V.K. which is 80.07 percent to total respondents which in itself is an achievement of K.V.K’s. efforts.
- In the field of agronomy maximum number of 235 individuals [78.07 percent to total of 301 individuals] have implemented the improved technique, followed by 25 individuals [8.31 percent] for organic farming and 4 individuals implementing the techniques regarding agro-forestry.
- Regarding subjects like animal husbandry, fishery, poultry and training of rural youth not much implementation efforts have been made by sample individuals as for these activities even the vocational trainings have hardly been organised. Intensive efforts are required in the fields of animal husbandry, agro-forestry and watershed activities as these areas are important for rural economy.
- Agronomy and horticulture are the subjects for which the satisfaction level is substantial. In subjects like animal husbandry, fishery, poultry and training of rural youth the satisfaction level is negligiable because of the basic fact that for these subjects no vocational training in tangible way has been imparted nor the FLDs or OFTs have been organised. Efforts must be made to popularize the activities like animal husbandry, agro-forestry and watershed activities as these fields have immense promise of employment generation followed by income augmentation in rural areas.
- About 99 percent positive response regarding impact of K.V.K. services over income enhancement has been reported which is of credit to the efforts of K.V.K. in various fields of its operation.
- The extent of income enhancement in the percentage group of 1 to 10 has been reported by 277 persons [92.03 percent] due to impact of various technologies introduced by K.V.K. which, in itself, is a startling achievement.
- Out of 301 individuals, 296 individuals [98.34 percent to total individuals] have reported for the continuance of the services of K.V.K. particularly for subjects like agronomy and horticulture which again shows the positive impact of the services rendered by K.V.K.
- Regarding suggestions for additional services to be rendered by K.V.K. the sample individuals have given useful suggestions regarding introduction of production of by-products of crops and development of marketing strategy for fair return of the product for incorporation in the training mandates of K.V.K.

355
- As regards utilization of enhanced income, 152 individuals [50.50 percent] have informed about purchase of various agriculture inputs out of their income enhancement.
- Out of 301 individuals, 278 individuals [92.36 percent] have reported positive impact of income enhancement over levels of education particularly over the levels of primary education for both boys and girls that shows the awareness of sample individuals about value of educating their wards.
- Out of 301 individuals, 289 individuals [96.01 percent to total of 301 individuals] have reported about positive impact of enhanced income over health status resulting in hiring of the services of medical personnel, vaccination of children/women, better application of child nutrition and adoption of family welfare measures.
- A reverse situation is visualized in case of potable drinking wter supply where the negetive response is to the tune of 182 individuals [60.47 percent] which shows that the availability of potable drinking water is no priority in rural areas in general and in our area of study in particular against the basic problem of enhancing agriculture income.
- Regarding impact of enhanced income over improving housing conditions, 122 individuals [40.53 percent] have positive response while 179 individuals [59.47 percent] have refused spending any amount of enhanced income over improving the housing conditions. The situation seems obvious as frequent expenditure over improving housing conditions is not done.
- Regarding awareness about various welfre schemes initiated by the State Government with assistance from Government of India, it has been observed that in case of schemes like Jawahar Gram Samridhi Yojna, Employment Assurance Scheme, Mid-Day Meals, Free Supply of Text Books, Women Self Help Group, Gramya and Ausmati Yojna the level of awareness is encouraging while in respect of schemes like Establishment of Hand Loom Units, Establishment of Sericulture Units and Establishment of Family Based Rural Industrial Units the level of awareness is poor.
RESULTS OF SURVEY–INDIVIDUAL PARTICULARS–CONTROL VILLAGE 6.268 In the following paragraphs an attempt has been made to record the reactions of 25 percent
of individuals taken from control village of Pipariya Birsa where there is no intervention of KVK. The Total number of family members of the 25 percent of the households in village Pipariya Birsa is 71, the twenty five percent of which is 18 individuals. Therefore, the reactions of 18 number of individuals have been recorded to have a comparison with the reactions of individuals of adopted and cluster villages having direct intervention of KVK. The criteria for selection of individuals for control village are similar to that for adopted and cluster villages.
6.269 Like adopted and cluster villages, 10 individuals out of 18 individuals [55.56 percent] are
from O.B.C. community, only 3 individual are from S.T. community and 5 individuals are from general community. Non of the persons are from S.C. community Cent-percent individuals are followers of Hindu religion.
6.270 Regarding awareness about the existence of KVK, 6 individuals of control village are
aware of the its existence against the cent-percent awareness about K.V.K. in-terms of its location and services rendered by it by the individuals of adopted and cluster villages which seems obvious as in such cases the interventiojn of K.V.K. is direct. Regarding awareness about he services of K.V.K. the response in the control village is negetive. Awareness is the basic paramter that leads to positive impact of any activity over a long period of time. The ultimate aim of any K.V.K. is to cover the entire district in terms of implementation of prevailing and new technology relating to agriculture and

356
its allied activities that presupposes awareness about this organisation by the farming community of the district. For this purpose the K.V.K. personnel of district Chhindwara may organize meetings at Gram Panchayat level at least twice in a year inviting one representative from villages where there is no intervention of K.V.K. to make them aware about the utility of services rendered by the K.V.K.
6.271 Regarding satisfaction derived from per hectare yield of agronomical and horticulture
crops, the 17 individuals of control village [94.44 percent] have expressed their dissatisfaction while for adopted and cluster villages this satisfaction level is substantial. However for improving the per-hectare yield, 13 number of individuals from control village which is 72.22 percent to total of 18 individuals have suggested for organizing training for water conservation methods, followed by 4 individuals [22.22 percent] for organizing training about application of inputs.
6.272 Regarding satisfaction level of livestock and dairy activities cent percent individuals have
expressed their dissatisfaction The suggestions forwarded are making available the improved breed production facilities by 12 individuals [66.67 percent] followed by artificial insemination by 5 individuals [2.78 percent] and one individual [5.56 percent] has opined for making available the improved feed facilities. It will be worth mentioning that even in cases of adopted and cluster villages the satisfaction level for livestock and poultry activities is negligible.
6.273 As for poultry development the level of dissatisfaction is again cent-percent. The important
suggestions forwarded are arrangement of improved breeding facilities by 9 individuals [50.00 percent] and providing broiler production facilities by 9 individuals [50.00 percent]. In case of adopted and cluster villages also the satisfaction level for this activity is negligible.
6.274 Regarding fishery development, again the level of dissatisfaction is cent-percent supported
by the suggestions like supply of improved feed by 12 individuals [66.67 percent] followed by arranging training about use of improved implements by 6 individuals [33.33 percent] It is worth mentioning again that for adopted and cluster villages the level of satisfaction for this activity is nil.
6.275 Important information has been collected about adoption of home science activities for
augmentation of family income. Toy making is one such activity where 5 individuals [27.78 percent] have asked for training facility followed by pickle prepartion by 5 individuals [27.78 percent]. Training regarding backing activities have also been supported by 5 individuals, papad/jam/jelly making by 5 individuals. It is again worth mentioning that in case of adopted and cluster villages the positive response in favour of home science activities is substantial.
6.276 Regarding training of rural youth for self employment, 12 individuals out of total of 18
sample individuals [66.64 percent] have suggested for organizing training programme for motor binding which is very relevant for performing agricultural activities followed by 12 individuals in favour of training courses for repair of diesel engine that accounts for 66.67 percent to total of 18 sample individuals. For activities like black smithy, carpentry, masonary, tailoring and cycle/scooter repairs individuals to the tune of 12 individuals each have suggested for organizing training courses. It will not be out of place to mention here that in case of adopted and cluster villages, no individual has shown any inclination for such activities regarding training of rural youth.

357
6.277 Regarding educational status of the sample individuals of control village, the survey results show that out of 18 individuals, 9 persons [50.00 percent] have reported positively about their male children attending the elementary level of education [primary + middle i.e. classes 1st to 8th standards] while the response from 19 individuals [50.0 percent] for this item are negetive. More or less similar is the situation with girls wherein 7 number of individuals [38.89 percent] have given positive response while 11 number of individuals [61.11 percent] were negetive in their responses. Similarly regarding boys students of secondary level of education, i.e. from from classes 9th to 12th standards only 4 individuals [22.22 percent] have informed that their wards attend the school. In case of higher education for both male and femal children the positive responses is by 2 individuals only. In case of adopted and cluster villages 92.36 percent individuals have reported about their male and female wards attending the elementary level of eduction against the average percentage figure of 50.00 for control village that shows better awareness among the sample inhabitants of adopted and cluster villages about value of elementary education.
6.278 Regarding health status the following table presents a comparitive picture between adopted
and cluster villages on one side and the control village on the other;
Table No. 6.84 Compartive Status of Health Facilities Among Sample Individuals
Sl. No.
Item Status of control village –percentage to total 18 sample
individuals
Status of adopted and cluster villages percentage to 301 sample
individuals 1 Hiring of services of medical
personnel 72.22 74.42
2 Vaccination of children/ pregnant mother
77.78 31.56
3 Child nutrition 55.56 3.99 4 Female nutrition during gestation
period 44.44 1.33
5 Adoption of family welfare measures
55.56 1.33
Note – Only positive responses have been taken into account. 6.279 The above table shows that except for the item of hiring of services of medical personal
where the positive response of individuals from adopted and cluster villages is higher than control village, in rest of the health parameters the percentage positive responses of the individuals of control village are much higher than that of adopted and cluster villages that shows the relatively higher level of awareness among the sample individuals of control village regarding various health parameters.
6.280 Regarding status of drinking water facilities, cent percent individuals have responded
positively about availability of hand pumps as main source of drinking water. Piped water supply is not in existence in the sample village which seems obvious as in villages in general this facility is seldom available. In case of adopted and cluster villages also the majority of respondents have informed about hand pums as main source of drinking water in their villages.
6.281 Regarding housing facilities, 8 number of individuals [44.44 percent] have reported for
construction of semi-pucca houses while 5 individual [27.78 percent] have positive response for construction of pucca house.

358
6.282 The table below shows the comparative level of awareness about the various welfare schemes between adopted/cluster villages and control village;
Table No. 6.85
Comparative Levels of Awareness Sl. No.
Name of the Scheme Level of awareness in percentage for adopted/cluster villages [percent to total of 301
individuals]
Level of awareness in percentage for control
village [percent to total of 18 individuals]
1 Jawahar Gram Samridhi Yojna 77.41 22.22 2 Employment Assurance Scheme 63.21 55.56 3 Establishment of Hand Loom Units 1.00 - 4 Establishment of Sericulture Units 0.66 - 5 Establishment of family based rural
industrial Units 5.98 -
6 Mid-day Meals 100.00 16.67 7 Free supply of Text Books 77.74 5.56 8 Women Self Help Group 96.68 33.33 9 Gramya Yojna 71.43 - 10 Ausmati Yojna 81.73 44.44 6.283 The above table shows that the level of awareness about welfare schemes is much
higher in adopted/cluster villages as compared to control village. Regarding schemes like Establishment of Hand Loom Units, Establishment of Sericulture Units and Establishment of family based rural industrial Units the level of awareness among individuals of control village is nil while that for adopted and cluster villages the level of awareness is marginal. The validity of such schemes therefore is doubtful as since the awareness about these schemes are missing, the plight of their implementation may well be imagined.
6.284 In what follows an attempt has been made to summarise the findings of individual
particulars of the control village; - The majority of individuals i.e. 55.56 percent to total of 18 sample individuals are from
O.B.C. community. Cent percent individuals are followers of Hindu religion. - The cent-percent level of unawareness among sample individuals of control village
about the services rendered by the K.V.K. is a matter of concern which shows that a portion of population is unaware about prevailing and new technology relating to agriculture and allied services. Since the ultimate objective of any K.V.K. is to cover the farming communities of entire district, it will, therefore, be worthwhile if the K.V.K. Scientists organize meetings at Gram Panchayat level – twice in a year, inviting representative cultivators from control village and apprise them with latest technology or suggest them to be in regular contact with the cultivators of adopted and cluster villages who are already implementing technologies both prevailing and new relating to agriculture and allied activities.
- Regarding satisfaction level of per hectare yield of agronomical and horticultural crops, the 17 individuals of control village have expressed their dissatisfaction with suggestions to organize training activities on water conservation methods and application of agriculture imputs.
- Regarding satisfaction level derived from present status of livestock and dairy activities cent percent individuals have expressed their dissatisfaction. The suggestions

359
forwarded are making available the improved breed production facilities, artificial insemination facilities etc.
- As for poultry development the level of dissatisfaction is again cen-percent. The important suggestions forwarded are arrangement of improved breeding facilities and providing broiler production facilities.
- Similarly for fishery development the level of dissatisfaction is cent-percent supported by the suggestions like supply of improved feed and arranging training about use of improved implements.
- For augmentation of income levels, 27.78 percent individuals are in favour of toy making activities followed by pickle preparation by 27.78 percent individuals, backing activities by 27.78 percent individuals and preparation of papad/jam/jelly by 27.78 percent individuals.
- Regarding training of rural youth for self employment, considerable interests hve been shown by the sample individuals of control village pertaining to activities like motor binding, repair of diesel engine, black smithy, carpentry, msonary, tailoring and cycle/scooter repair etc.
- Regarding elementary level of education [classes 1st to 8th standards] 50.00 percent individuals have reported that their male wards attend the school where as for female wards 38.89 percent individuals have reported in favour of their school attendance.
- A very satisfactory level of health scenario is existing in control villge wherein for most of the basic health parameters the percentage positive response is much higher than the responses from adopted and cluster villages.
- Hand pumps are the main source of drinking water in our control village where cent percent individuals have reported for its existence.
- Regading housing facilities the individuals of control village have shown interest in constructing semi-pucca houses.
- The level of awareness about various welfare schemes initiated by the government is much higher in case of adopted/cluster villages as compared to control village.

360
Chapter Seven KRISHI VIGYAN KENDRA - SATNA 7.1 The district Satna is located in between 23.580 to 25.120 north latitude to 80.200 to 81.230
east longitude with total geographical area of 7502 squ.km. which is 2.43 percent to total geographical area of the State.
7.2 The average annual rainfall of the district is 1063.2 mm concentrated over the months of
June to September. The average maximum temperature during summer is around 41.40 celcius while the average minimum temperature during winter is 9.20 celcius.
7.3 The total population of the district as per census 2001 is 1868648 persons with rural and
urban breakups of 1483058 and 385590 persons respectively which is 79.37 percent and 20.63 percent to total population respectively. The percentage of scheduled caste population to total population (as per census 2001) is 16.27 while that of S.T. population is 14.34. The percentage of workers engaged in the occupation of agriculture (as per census 1991) to total workers is 63.54 that shows agriculture is the main stay of the population of Satna district. In the fallowing table a few indicators relating to agriculture has been been shown;
Table No. 7.1
Important Indicators Relating to Agriculture Sl. No.
Indicators District Satna
State of Madhya Pradesh
1 2 3 4 1 Percentage of forest area to total geographical area [ha] 27.36 26.65 2 Net cropped area as percent to total geographical area [ha] 49.06 49.02 3 Per-capita net cropped area [ha] 0.20 0.25 4 Per-capita gross cropped area [ha] 0.27 0.34 5 Percentage of double cropped area to net cropped area [ha] 34.62 35.49 6 Net area irrigated as percent to net cropped area [ha] 31.32 37.56 7 Gross area irrigated as percent to gross cropped area [ha] 23.27 28.54 8 Per-capita production of food-grains [Kg.] 323 266 9 Per hectare use of fertilizer [Kg.] 42.05 46.21 10 Gross value of agriculture produce-per hect. [Rs.] 8773 11968 11 Per hectare yield of agriculture produce [Kg.]*
a) Paddy 1000 1058 b) Wheat 1305 1867 c) Jowar 945 1342 d) Maize 1344 2072 e) Gram 698 932 f) Tuar 501 825 g) Soybean 634 1137
12 Electrified villages as percent to total inhabited villages 93.11 97.04 13 Energised pump sets per thousand hectare 42 60
*Figures relate to the year 2003-2004 [Final Forecast]

361
7.4 The per-hectare yield of the most of the crops for district Satna is lower than State average mainly due to paucity of irrigation facilities in the area and overall deficiency in soil productivity.
DETAILS OF KRISHI VIGYAN KENDRA, SATNA BASED ON THE SECONDARY INFORMATION 7.5 The K.V.K., Satna was established in the year 1992. It is located in the Maghgawan
Development Block of Satna District. It is being run by an N.G.O. with Training Organizer as chief of the K.V.K., having nine number of technical staff and six number of non-technical staff. The technical staff consists of training associates, farm manager and technical assistant mainly from the disciplines of Agronomy, Horticulture and Veterinary Science. The farm area of the K.V.K. is 25 hect, out of which 15 hectares are cultivated with 7 hectares of irrigated area. The KVK got administrative building of its own.
7.6 The K.V.K. has its own demonstration units like poultry unit, farm pond for fishing,
mushroom unit and net house along with existence of farmer’s hostel where the cultivators can be accomodated during training courses. Regarding availability of irrigation facilities the K.V.K. has 2 number of tubewells, 3 farm ponds and 2 number of diesel operated pump sets, sufficient to irrigate 7 hectares of land. The K.V.K. has also got one four wheeler and two, two wheeler to cater to the transportation needs.
7.7 The K.V.K. has adequate number of agricultural implements as detailed below;
1. Tractor with trolly – 1 2. M.B. Plough –1 3. Cultivator – 1 4. Scraper – 1 5. Thresher – 1 6. Leveller – 1 7. Tractor drawn Ferti seed drill –1
These variety of implements are, more or less, sufficient to do the extension work with
reasonable efficiency. 7.8 The K.V.K. receives an average allocation of Rs. 51.41 lakh per year over the years 2001-
2002 to 2003-2004 against which the average expenditure per year is Rs. 52.05 lakh. The table below shows the details;

362
Table No. 7.2 Budget Allocation and Expenditure Rs. Lakh 2001-2002 2002-2003 2003-2004 Sl.
No. Particulars
Alloca-tion
Expen-diture
Alloca-tion
Expen-diture
Alloca-tion
Expen-diture
Remarks
1 2 3 4 5 6 7 8 9
1. RECURRING EXPENDITURE
a Pay and Allowances 23.0 22.45 26.00 21.85 29.00 27.38
b Travelling Allowances 0.50 0.61 1.00 0.99 1.00 1.00
c Contingencies 4.00 3.02 3.94 4.07 5.00 4.00
Total – 1 27.50 26.08 30.94 26.91 35.00 32.38
2. NON-RECURRING EXPENDITURE
a Works and Construction 39.50 39.50 - 6.39 8.00 8.54
b Establishment of Unit 0.08 0.08 - - - -
c Furniture & Equip ment 1.09 1.09 - - 0.70 0.69
d Library 0.10 0.09 0.10 0.10 0.10 0.09
e Soil Testing Lab 6.00 5.99 - 0.05 - -
f Farm Development - - - 0.03 0.50 0.49
g TV/DVD - - - - 0.30 0.28
h Tractor/ Agri. Equip. - - - - 4.00 4.04
i Generator - - - - 0.30 0.35
Total 2 46.77 46.75 0.10 6.57 13.90 14.48
Grand Total 1+2 74.27 72.83 31.04 33.48 48.90 46.86
7.9 The above table shows a more or less matching share of expenditure against allocation. The
major share of allocation is for pay and allowances against very small allocation for performing technical functions which at times lead to in-efficient performance. Re-scheduling of allocation is, perhaps necessary.
7.10 Regarding Technical performance, the information has been collected under following
heads;
- Vocational Training - In-service Training - Front Line Demonstration - On Farm Testing.
7.11 In what follows an attempt has been made to present the details of the above mentioned items of technical performance.

363
VOCATIONAL TRAINING 7.12 The table below shows the details;
Table No. 7.3 Status of Vocational Training
No. of trainings organised -2003-2004 Sl. No.
Subject Adopted Villages
Cluster Villages Other Villages Total no. of
trainees 2003-2004
1 2 3 4 5 6 1 Crop Production 11 4 - 159 2 Horticulture 7 4 - 58 3 Plant Protection 8 4 - 307 4 Veterinary Services 4 4 - 23 5 Home Science - - - - 6 Ag. Engineering - - - - 7 Training of Rural Youth for Self
Employment
a. Plant Protection 6 4 - 44 Total 36 20 - 591
Note : Other villages [Col. 5] indicate those villages of the district where the training programmes of Agriculture. Department are imparted through K.V.K.
7.13 The above table shows that the total number of vocational training organised in the year
2003-2004 was 56 which was, to some extent, satisfactory. More numbers of vocational training courses have been organised on subjects like crop production, plant protection and horticulture in both adopted villages and cluster villages which seem obvious as the farmers are usually interested in enhancing their crop productivity. More number of vocational training should have been organised on horticulture as this is one of the important fields of quick income generation with availability of ready market. The organisation of only 10 number of training courses to impart training to rural youth for self employment and attended by only 44 persons [0.07% to total trainees] is indicative of the fact that the villagers are not very confident about such trainings which hardly gurantee any placement.
7.14 The combined percentage of trainees attending subjects like crop production, plant
protection and horticulture to total number of trainees was 88.66 that confirms the fact that farming communities are more interested to enhance their income through adoption of technology particularly in the field of crop production.
IN SERVICE TRAINING 7.15 This training is related to the field functionaries of Agriculture, Veterinary, Horticulture and
Forest Departments. The following table shows the details;
Table No. 7.4 Status of In-service Training
No. of trainings 2003-2004
Sl. No.
Subject
On campus Off campus
Total number of trainees 2003-2004
1 2 3 4 5 1 Crop Production 2 - 33 2 Plant Protection 2 - 57 Total 4 - 90

364
7.16 Though the number of training programmes conducted in the year 2003-2004 is satisfactory, arrangement of a few more training programmes particularly for Crop Production and Horticulture would have been more helpful.
FRONT LINE DEMONSTRATION 7.17 Front line demonstrations are conducted under the close supervision of the scientists of the
KVK for newly released technologies or those likely to be released in near future with target participants both farmers and extension officers. The table below shows the number of front line demonstrations conducted in the year 2003-2004.
Table No. 7.5
Status of Front Line Demonstrations No. of demonstrations 2003-2004 Sl.
No. Subjects
Adopted Villages Cluster Group of Villages 1 2 3 4 1 Pulses 25 4 2 Oil Seeds 25 4 3 Other than pulses and oilseeds 12 4 Total 62 16
7.18 The total of 78 FLDs organised in one year in both in adopted and cluster villages is
satisfactory. ON FARM TESTING 7.19 On farm testing is a part of adaptive research that takes into account existing technology and
its application over defined areas and defined group of farmers. The following table shows the details;
Table No. 7.6
Status of On Farm Testing No. of demonstrations 2003-2004 Sl.
No. Subject
Adopted Villages Cluster Group of Villages 1 2 3 4 1 Testing of improved varieties of paddy under
upland condition 5 4
2 Testing of weed control method in up land paddy
5 4
3 Control of Dowdery mildeo in coriander 5 4 4 Control of Carly Blight in Potato 5 4 Total 20 16
7.20 Organisation of 36 number of on farm testing in one year is an encouraging picture. 7.21 Besides organizing training courses on Vocational Training, In Service training, Front Line
Demonstration and On Farm Testing the K.V.K., Satna has also organised other training programmes in liaison with the line departments of State Government. The table below shows the details;

365
Table No. 7.7 Record of Other Training Courses
Year 2003-2004 Sl. No.
Topic Duration – Days Organised by
1 2 3 4 1 Krishi Pakhwara 6 Department of Agriculture 2 Bio-farming 1 Department of Agriculture 3 Training on IPM 1 Department of Agriculture 4 Training on IPM 1 Department of Agriculture 5 Biological Cultivation 1 Department of Agriculture 6 Puse Development Programme 1 Department of Agriculture 7 Scientists interaction with farmers 1 Department of Agriculture 8 Integrated Cereal Development Programme 2 Department of Agriculture
7.22 The above table shows that most of the training courses organised were related to crop
production which seems obvious as the cultivators are usually interested in enhancement of agriculture production. A few number of trainings relating to home science and training of rural youth for self employment could have been organised which would have made such efforts more meaningful. However, it has also been felt that every training programme should have a minimum duration of 4 days to ensure purposeful transaction as about half of the day in case of most of such meetings is usually lost in observing formalities.
7.23 One of the important functions of the K.V.K. is to conduct specific research to improve the
quality of agriculture produce. The K.V.K., Satna has not conducted specific research any such;
7.24 Each K.V.K. is supposed to hold the meeting of Scientific Advisory Committee twice in a
year for performing following functions; 7.25 The Scientific Advisory Committee will consist of following members; 1. Head of the host institution Chairperson 2. Director, Extension of concerned SAU Member 3. Zonal Coordinator of the concerned zone Member 4. Representative of ICAR Instt./ICAR Regional Research Station if
located in the district or nearby Member
5. Associate Director, Research & Extension of the Zonal Research Station in which KVK is located
Member
6. District officers of the line departments such as Agriculture, Horticulture, Animal Husbandry, Soil conservation, Social/Agroforestry, Sericulture, Fisheries, Irrigation, Social Welfare, Small Scale Industries etc.
Members
7. Representative of the Lead Bank of the District Member 8. Farm Radio Officer of the AIR in which KVK is located Member 9. Representative of Doordarshan Centre in which KVK is located Member 10. Two representatives of the farmers - one small and one big nominated by
the Head of the Institution Member
11. Two representatives of Farm Women nominated by Head of the Institution
Members
12. Training Organiser, KVK Member Secretary

366
7.26 During the years 2002-2003 and 2003-2004, the K.V.K., Satna has organised meeting of the Scientific Advisory Committee.
7.27 The K.V.K., Satna has continuously interacted with district administration, three-tier system
of Panchayati Raj Institutions and progressive cultivators of the district and took valuable guidance from them. Publicity measures like organizing Krishi Melas, Field Days, arranging T.V. Interviews and Radio talks were attempted to spread the knowledge about utility of K.V.K. among rural population.
RESULTS OF THE SURVEY – VILLAGE PARTICULARS 7.28 The study has covered sixty number of villages with ten number of villages from each
K.V.K. with bifurcation as follows;
- Three number of Adopted Villages - Six number of Cluster Villages - One number of Control Village The bifurcation as shown above is common to all the six K.V.Ks. covered under the study. The table below gives a few important demographic details of the selected villages of K.V.K., Satna;
Table No. 7.8 Demographic Particulars
Of which Sl. No.
Name of the Village
Name of the Dev. Block
Total population
Census 2001 Males
Census 2001
Females Census
2001
Proportion of S.C.
population [%]
Proportion of S.T.
population [%]
Literacy rate [%]
House-hold size
1 2 3 4 5 6 7 8 9 10 ADOPTED VILLAGES
1 Khodari Majhgawan 198 114 84 - 36.9 54.6 5 2 Devlaha Majhgawan 974 497 477 - 58.9 68.8 6 3 Patnakalan Majhgawan 563 286 277 8.5 86.7 35.8 5 Total – I 1735 [42.10] 897
[42.67] 838
[41.51] - - - -
CLUSTER VILLAGES 4 Kanpur Majhgawan 357 166 191 - 89.4 33.9 4 5 Tangi Majhgawan 378 190 188 - 94.4 36.7 5 6 Degarhot Majhgawan 219 118 101 - 56.2 52.9 6 7 Umariha Majhgawan 239 127 112 - 87.0 28.9 6 8 Patni Majhgawan 433 224 209 33.7 59.6 53.0 6 9 Rahaniya Majhgawan 276 136 140 - 94.6 42.9 5 Total – II 1902 [46.15] 961
[45.72] 941
[46.60] - - - -
CONTROL VILLAGE 10 Bhargawan Majhgawan 484 244 240 - 68.8 65.4 6 Total – III 484
[11.75] 244
[11.61] 240
[11.89]
Grand Total I+II+III 4121 [100]
2102 [100]
2019 [100]
Source – Census 2001, Note – Figures in brackets show percentage to total.

367
7.29 The total population of the ten identified villages as per census – 2001 is 4121 which is 0.28 percent of the total rural population of district Satna. The adopted villages cover 42.10 percent population as compared to total population of ten identified villages covered under the study while for the cluster villages this percentage is 46.15 to the population is of ten villages and for control village the percentage coverage of population is 11.75. The largest village, population wise is Devlaha [adopted village] while the smallest village is Khodari [Adopted Village]. Except for the villages Kanpur and Rahaniya where the female population is more than male population, in rest of the villages a reverse trend is visible. In all the ten identified villages the proportion of ST population is more than that of SC population. Basically all the ten identified villages are tribal predominated where the percentage literacy ranged between 28.9 for village Umariha to 68.8 percent for village Devlaha, not far below the district level percentage literacy of 65.12 and state level figure of 64.11. The above information has pleasantly defied the age-old notion of low percentage literacy in tribal predominated areas. The average size of the family is 5 persons which is in line with state average.
WORK FORCE 7.30 An analysis of the information regarding workforce for all the ten villages covered under the
study will give an idea of the persons engaged in different occupations and also the magnitude of dependent population not pursuing any occupation. The table below shows the details;
Table No. 7.9 Status of Work Participation
Sl. No
Name of the Village Work participation rate [%]
Proportion of main workers [%]
Proportion of Marginal workers
[%]
Proportion of Non-workers [%]
Person Male FemalePerson Male Female Person Male Female Person Male Female1 2 3 4 5 6 7 8 9 10 11 12 13 14
ADOPTED VILLAGES 1 Khodari 42.9 50.0 33.3 36.9 50.0 19.0 6.1 0.0 14.3 57.1 50.0 66.7 2 Devlaha 47.7 48.9 46.5 22.5 38.0 6.3 25.3 10.9 40.3 52.3 51.1 53.5 3 Patnakalan 44.4 50.0 38.6 24.9 45.8 3.2 19.5 4.2 35.4 55.6 50.0 61.4 CLUSTER VILLAGES 4 Kanpur 48.2 62.0 36.1 22.4 42.8 4.7 25.8 19.3 31.4 51.8 38.0 63.9 5 Tangi 55.0 57.4 52.7 25.4 32.6 18.1 29.6 24.7 34.6 45.0 42.6 47.9 6 Degarhot 35.6 40.7 29.7 27.4 40.7 11.9 8.2 0.0 17.8 64.4 59.3 70.3 7 Umariha 28.9 47.2 8.0 28.5 47.2 7.1 0.4 0.0 0.9 71.1 52.8 92.0 8 Patni 32.6 48.7 15.3 21.7 40.2 1.9 10.9 8.5 13.4 67.4 51.3 84.7 9 Rahaniya 49.6 50.7 48.6 15.9 31.6 0.7 33.7 19.1 47.9 50.4 49.3 51.4 CONTROL VILLAGE 10 Bhargawan 42.4 46.3 38.3 42.4 46.3 38.3 0.0 0.0 0.0 57.6 53.7 61.7 Source – Census 2001 7.31 The above table shows that the work participation rate ranged between 32.6% for village
Patni [Cluster village] to 55.06% for village Tangi [cluster village] with similar participation rate between male and female [with the exception of village Umariha and Patni] which is positive indication indicating awareness and intent of the female population, residing in our sample area to contribute meaningfully towards household income. The proportion of main workers which is, in general, higher than the porportion of marginal workers, that ranged between 15.9 percent for village Rahaniya [cluster village] to 42.4 percent for village Bhargawan [control village]. In cent percent sample villages the male participation as main

368
workers is higher than female participation while a reverse situation is seen in case of marginal workers where female participation is higher than male participation. This shows that in our sample area of study avenues of activities other than agriculture like preparation of papad/bari/jelly, toy making etc are available that employes substantial number of rural female population. The proportion of non-workers that ranged between 50.4 percent for village Rahaniya [cluster village] to 71.1 percent for village Umariya [cluster village] presents a dismal picture as it shows the higher number of dependent population consisting mainly of children, old persons, infirms and unemployed who are nol in position to contribute much towards family income.
OCCUPATIONAL DISTRIBUTION 7.32 The table below shows the details;
Table No. 7.10
Occupational Distribution Proportion of Cultivators
to total Workers [%] Proportion of Agr. Labourer to total
workers [%]
Proportion of workers in household industries
to total workers [%]
Proportion of other workers to total
workers [%]
Sl. No
Name of the Village
Person Male Female Person Male Female Person Male Female Person Male Female 1 2 3 4 5 6 7 8 9 10 11 12 13 14
ADOPTED VILLAGES 1 Khodari 20.0 15.8 28.6 14.1 5.3 32.1 1.2 1.8 0.0 64.7 77.2 39.3 2 Devlaha 44.1 41.2 47.3 32.5 32.1 32.9 0.2 0.4 0.0 23.2 26.3 19.8 3 Patnakalan 27.2 45.5 2.8 66.8 44.8 96.3 0.0 0.0 0.0 6.0 9.8 0.9 CLUSTER VILLAGES 4 Kanpur 22.1 35.9 1.4 16.9 20.4 11.6 0.0 0.0 0.0 61.0 43.7 87.0 5 Tangi 53.8 59.6 47.5 45.7 39.4 52.5 0.0 0.0 0.0 0.5 0.9 0.0 6 Degarhot 21.8 27.1 13.3 21.8 27.1 13.3 1.3 2.1 0.0 55.1 43.8 73.3 7 Umariha 47.8 55.0 0.0 14.5 13.3 22.2 0.0 0.0 0.0 37.7 31.7 77.8 8 Patni 49.6 64.2 0.0 27.0 12.8 75.0 2.1 0.0 9.4 21.3 22.9 15.6 9 Rahaniya 27.7 53.6 1.5 72.3 46.4 98.5 0.0 0.0 0.0 0.0 0.0 0.0 CONTROL VILLAGE 10 Bhargawan 91.7 92.0 91.3 3.4 1.8 5.4 0.0 0.0 0.0 4.9 6.2 3.3 Source – Census 2001 7.33 Agriculture remains to be the main occupation of the ten villages identified for the study.
The proportion of cultivators to the total workers ranged between 20.0 percent for village Khodari [adopted village] to 91.7 percent for village Bhargawan [control village]. Usually these percentages are also fairly high among adopted and cluster villages that justify the selection of such villages in the group of adopted and cluster. Out of ten villages, in two number of villages viz. Khodari [adopted village] and Devlaha [adopted village], the proportion of female cultivators is more than that of male cultivators that signifies the awareness and intent of the female members of the farming community to work along with their male counterpart for addition in household income. The trend matches with the modern expectations of equality of gender participation in work that, besides, income augmentation, ensures women empowerment to a great extent. Another significant fact revealed by the above table is that in case of villages like Khodari [adopted village], Devlaha [adopted village], Kanpur [cluster village] Tangi [cluster village] Umariha [cluster village], Patni [cluster village] and Bhargawan [control village] the proportion of cultivators is more than that of agriculture labour which is a sure indication that in these villages the occupation of agriculture is being pursued fairly satisfactorily.

369
7.34 Regarding proportion of agriculture labour to total workers, that ranged between 3.4 percent for village Bhargawan [control village] to 72.3 percent for village Rahaniya [cluster village], the involvement of female participation in general is more than that of males that indicates the performance of odd jobs regarding farming by women folk of our sample area.
7.35 The situation regarding proportion of workers in household industries to total workers is far
from being satisfactory as it ranged between 0.2 percent for villages Devlaha [adopted village] to 2.1 percent for village Patni [cluster village]. In villages like Patnakalan, Kanpur, tangi, Umariha and Bhargawan such secondary sector activity is totality missing. Usually in Madhya Preadesh the status of secondary sector occupation in villages is poor. One of the important factors of rural poverty is absence of such occupations that encourage migration during lean season of agriculture. Such sort of secondary occupation may be encouraged through proper implementation of various welfare schemes, particularly relating to rural development, being run by the government.
7.36 Except for the village Khodari, Kanpur and Degarhot, in rest of the villages, the proportion
of other workers to total workers is far below than the proportion of cultivators and agriculture labour to total workers with mixed trend of participation by both males and females.
LAND USE DETAILS 7.37 The table below shows the land use details of the identified ten villages covered under the
study; Table No. 7.11
Land Use Details In hectare Irrigation Sl.
No. Name of the
Village Total
geogra- phical area
Gross cropped area
Forest Not available for culti-vation
Culti-vable waste
Canal Pond Wells Others Total irri-gated area
Unirri- gated
1 2 3 4 5 6 7 8 9 10 11 12 13 1 Khodari 1269 298 [23.48] 436 535 267 - - - 1 1 [0.34] 30 2 Devlaha 1027 375 [36.51] 598 54 29 - - 20 11 31 [8.27] 315 3 Patnakalan 1623 214 [13.19] 1403 6 1 - - - 26 26 [12.15] 187
Adopted Village I 3919 887 [22.63] 2437 595 297 - - 20 38 58 [6.54] 532 4 Kanpur 705 226 [32.06] 425 54 29 - - - 9 9 [3.98] 188 5 Tangi 591 163 [27.58] 32 396 121 - - - - - 42 6 Degarhot 825 603 [73.09] 222 - 409 - - - 53 53 [8.79] 141 7 Umariha 591 105 [17.77] 470 16 17 - - 3 7 10 [9.52] 78 8 Patni 105 96 [91.43] 7 2 11 - - - 5 5 [5.21] 80 9 Rahaniya 1172 81 [6.91] 1087 4 16 - - - 9 9 [11.11] 56
Cluster Village II 3989 1274 [31.94] 2243 472 603 - - 3 83 86 [6.75] 585 10 Bhargawan 729 231 [31.69] 351 147 45 - - 5 23 28 [12.12] 158 Control Village III 729 231 [31.69] 351 147 45 - - 5 23 28 [12.12] 158 Total – I+II+III 8637 2392 [27.69] 5031 1214 945 - - 28 144 172 [7.19] 1275 Source – Census, 2001 Note – Col. – 4 = Figures in brackets show percentage to total geographical area. Col. – 12 = Figures in brackets show percentage to gross cropped area. 7.38 The gross cropped area of the identified ten villages 2392 hectares which is 27.69 percent to
total geographical area. The survey area is rich in forest resources as 58.25 percent area to the total geographical area is under forest that indicates a potential for development of forest based industries in the sample area of study.

370
7.39 Regarding irrigation, the percentage of gross irrigated area to gross cropped area is 7.19 percent which is much less than district average of 23.27 percent and state average of 28.54 percent. In adopted villages, cluster and control villages these percentages are 6.54, 6.75 and 12.12 respectively.
7.40 Cultivable waste land, that gives promise for expanding agriculture activities is 945 hectares
which is 10.94 percent to total geographical area, assures the fact that through the intervention of K.V.K. the expansion of agriculture is possible.
RURAL ELECTRIFICATION 7.41 Rural electrification is one of the important parameters for agricultural development,
particularly in the context of energisation of pump sets. The table below shows the details;
Table No. 7.12 Status of Rural Electrification
Village Electrified Regular supply Sr. No.
Name of the village Yes No Yes No
If irregular, actual hrs. of supply
1 2 3 4 5 6 7 1. Khodari 1 0 0 1 10 2. Devlaha 1 0 0 1 8 3. Patnakalan 1 0 0 1 8 Adopted Villages 3 0 0 3
4. Kanpur 1 0 0 1 8 5. Tangi 1 0 0 1 10 6. Degarhot 1 0 0 1 10 7. Umariha 1 0 0 1 6 8. Patni 1 0 0 1 8 9. Rahaniya 1 0 0 1 8 Cluster Villages 6 0 0 6 10 Bhargawan 1 0 0 1 10 Control Village 1 0 0 1
Total 10 0 0 10
*The information in brackets shows the name of the Development Block where the village is located. This information will be common to all the subsequent tables. 7.42 All the villages covered under the study are electrified with irregular power supply
situations. The power supply of the villages ranged between 6 hours per day for village Umariha [cluster village] to 10 hrs per day for villages Khodari [adoted village] Tangi, Degarhot [cluster villages] and Bhargawan [control village].
7.43 Energisation of pump sets is the direct impact of rural electrification over agriculture
development. The table below shows the extent of energisation of pump sets in our sample area of study;

371
Table No. 7.13 Status of Pump Sets Energised
Pump sets energized Sr. No.
Name of the village Electricity (No.) Diesel (No.)
1 2 3 4 1. Khodari 0 10 2. Devlaha 0 4 3. Patnakalan 0 6 Adopted Villages 0 20
4. Kanpur 0 4 5. Tangi 0 4 6. Degarhot 0 3 7. Umariha 0 3 8. Patni 0 40 9. Rahaniya 2 4 Cluster Villages 2 58
10 Bhargawan 3 5 Control Village 3 5
Total 5 83
7.44 The total number of pump sets energized is 88 which is 0.43 percent to total number of
20375 pump sets energized in district Satna in the year 1999-2000. It may be mentioned here that for district Satna the number of energized pump sets per thousand hectare of gross cropped area is 42 as against the State average of 60 that shows a fair nature of agriculture in the district. In general, the number of pump sets energized is more in adopted and cluster group of villages as compared to control village which rather, is obvious as these villages have direct intervention of K.V.K. regarding technology transfer for better cultivation practices. Diesel energized number of pump sets are much more than that of pump sets energized by use of electricity that ranged between 3 numbers in villages Degarhot and Umariha to 40 numbers in village Patni.
HOUSEHOLD INDUSTRIAL UNITS 7.45 The complete absence of the existence of household industrial units in the sample area
of our study is not very peculiar as such units are generally not found in rural areas of Madhya Pradesh which is one of the important contributory factors of rural poverty.
COOPERATIVES 7.46 The complete absence of existence of any type of cooperative society in identified ten
villages is a definite draw back that particularly indicates the possibility of exploitation of the poor villagers by local money lenders.
7.47 The existence of various basic and infrastructural facilities is important from the angel of
absorption capacity of technology of any sort in identified areas to gurantee future chain of development. In the subsequent paragraphs an attempt has been made to present such inventories for sample villages covered under the study.

372
BASIC FACILITIES 7.48 The table below shows the details;
Table No. 7.14 Status of Basic Administrative Facilities
Tahsil head- quarter Block head quarter Sr. No.
Name of the village
District head quarter away from
the village KM Within the
village 0 KM
Away from the village
Km
Within the village 0 KM
Away from the village
Km 1 2 3 4 5 6 7
1. Khodari 44 24 24 2. Devlaha 47 6 6 3. Patnakalan 55 10 10 Adopted Villages 4. Kanpur 55 12 12 5. Tangi 45 27 27 6. Degarhot 45 28 28 7. Umariha 50 8 8 8. Patni 55 10 10 9. Rahaniya 49 7 7 Cluster Villages
10 Bhargawan 16 14 14 Control Village
Total 10 10 10
Table No. 7.14 [Contd…]
Status of Basic Administrative Facilities Gram Panchayat Police Station/sub station Sr.
No. Name of the village
Within the village 0 KM
Away from the village
Km
Within the village 0 KM
Away from the village
Km 1 2 8 9 10 11
1. Khodari 0 24 2. Devlaha 0 5 3. Patnakalan 0 10 Adopted Villages 4. Kanpur 4 12 5. Tangi 9 27 6. Degarhot 9 28 7. Umariha 2 8 8. Patni 3 10 9. Rahaniya 2 7 Cluster Villages
10 Bhargawan 6 15 Control Village
Total 3 7 10
7.49 The above table shows the location of district, tahsil and block headquarters quite far away
from most of the sample villages. The location of Gram Panchayat within or close to the sample villages is a positive factor that, to some extent, gurantees involvement of villagers in the development of their area. Though in non of the villages police stations are located within the geographical area of the village but within the manageable distance.

373
INFRASTRUCTURAL FACILITIES - ROADS
7.50 For the socio-economic development of any area the role of availability of proper road network is very important. The table below shows the status of availability of road network in and around the identified ten villages;
Table No. 7.15
Road Infrastructure Fair weather road Sr.
No. Name of the village
Within the village 0 Km
Away from the village Km
Kharanja road within the village
0 km 1 2 3 4 5
1. Khodari 2 2. Devlaha 6 3. Patnakalan 0 Adopted Villages
4. Kanpur 0 5. Tangi 12 6. Degarhot 0 7. Umariha 16 8. Patni 21 9. Rahaniya 25 Cluster Villages
10 Bhargawan 0 0 Control Village
Total 4 6 1
Table No. 7.15 [Contd…]
Road Infrastructure Link road to all weather road All weather road Sr.
No. Name of the village
Within the village 0 Km
Away from the village Km
Within the village 0 Km
Away from the village Km
1 2 6 7 8 9 1. Khodari 0 20 2. Devlaha 0 0 3. Patnakalan 5 10 Adopted Villages 4. Kanpur 3 4 5. Tangi 0 23 6. Degarhot 24 24 7. Umariha 0 8 8. Patni 3 10 9. Rahaniya 0 7 Cluster Villages
10 Bhargawan 5 0 Control Village
Total 5 5 2 8
7.51 Information contained in the above table reveals a near satisfactory situation as in 4
number of villages fair weather roads exist. Kharanja roads are available within one sample village that ensure convenient transport in rainy season within one village with reasonable clean sanitary conditions. But absence of link roads in five villages is a definite draw back that deters the development of activities like animal husbandry and poultry or other such perishable items that require road linkages. One of the basic

374
reasons for the status of backwardness regarding animal husbandry activities is the absence of road linkages in rural areas. Though the distances of link roads is within the easy reach for most of the villages but in rainy season such destinations become inaccessible leading to so many inconveniences. Moreover, absence of proper road infrastructure abstains the officials to reach such villages that results in perpetual neglect of such areas.
Infrastructural Facilities - Railway Station, Bus Stand/Bus Stop/ Post Office/S.T.D. Booth
7.52 The table shows the details;
Table No. 7.16
Facilities Regarding Railway Station/Bus Stand/Bus Stop/Post Office/STD Booths Railway station Bus stand/Bus stop Sr. No. Name of the village
Within the village 0 Km
Away from the village Km
Within the village 0 Km
Away from the village
Km 1 2 3 4 5 6
1. Khodari 24 20 2. Devlaha 5 5 3. Patnakalan 10 10 Adopted Villages 4. Kanpur 12 12 5. Tangi 27 23 6. Degarhot 28 24 7. Umariha 8 8 8. Patni 10 10 9. Rahaniya 7 7 Cluster Villages
10 Bhargawan 15 15 Control Village
Total 10 10
Table No. 7.16 [Contd…]
Facilities Regarding Railway Station/Bus Stand/Bus Stop/Post Office/STD Booths Post office STD booth Sr. No. Name of the village
Within the village 0 Km
Away from the village
Km
Within the village 0 Km
Away from the village
Km 1 2 7 8 9 10
1. Khodari 6 24 2. Devlaha 5 5 3. Patnakalan 5 10 Adopted Villages 4. Kanpur 6 12 5. Tangi 9 27 6. Degarhot 10 28 7. Umariha 8 8 8. Patni 10 10 9. Rahaniya 7 7 Cluster Villages
10 Bhargawan 3 15 Control Village
Total 10 10

375
7.53 For all the ten sample villages the railway station is located away from the village that ranged between 5 kms for village Devlaha [adopted village] to 28 kms for village Umariya [cluster village]. Similar is the situation for bus stand/stop as such facilities are not available within non of the villages. Similarly post office and STD facilities are located away from the identified ten villages. Infrastructural Facilities - Agriculture Marketing, Fair Price Shop,
Cold Storage 7.54 Mandi or Sub Mandi being regulated markets are important destinations for fair transaction
of agriculture produce. The cold storage is yet another important asset that helps in avoiding distress selling. The table below shows the details;
Table No. 7.17
Agriculture Marketing, Fair Price Shop, Cold Storage Regular market Weekly market Mandi Sr.
No. Name of the
village Within the village 0 Km
Away from the village
Km
Within the village 0 Km
Away from the village
Km
Within the village 0 Km
Away from the village
Km 1 2 3 4 5 6 7 8
1. Khodari 24 24 24 2. Devlaha 5 6 5 3. Patnakalan 10 10 10 Adopted Villages
4. Kanpur 12 12 12 5. Tangi 27 27 27 6. Degarhot 28 28 28 7. Umariha 8 8 9 8. Patni 10 10 10 9. Rahaniya 7 7 8 Cluster Villages
10 Bhargawan 15 15 15 Control Village
Total 10 10 10
Table No. 7.17 [Contd…] Agriculture Marketing, Fair Price Shop, Cold Storage
Sub-Mandi Fair Price Shop Cold Storage Sr. No.
Name of the village Within the
village 0 Km
Away from the
village Km
Within the village 0 Km
Away from the village
Km
Within the village 0 Km
Away from the village
Km 1 2 9 10 11 12 13 14
1. Khodari 0 5 23 2. Devlaha 5 0 5 3. Patnakalan 10 1 10 Adopted Villages 4. Kanpur 12 4 12 5. Tangi 27 3 27 6. Degarhot 28 6 28 7. Umariha 9 2 8 8. Patni 10 3 10 9. Rahaniya 8 2 7 Cluster Villages
10 Bhargawan 15 0 15 Control Village
Total 1 9 2 8 10

376
7.55 In non of the ten identified villages the facilities like regular market, weekly market and mandi exist. The availability of sub-mandi facility within the geographical limit of village Khodari [adopted village] is an encouraging exception which assures fair transaction of agriculture commodities in periheral villages. The non-availability of fair price shops in eight number of villages is a definite gap. The cold storage facilities are located far away from the villages, which, seems natural.
AGRO BASED INDUSTRIAL UNITS 7.56 The table below shows the details;
Table No. 7.18 Status of Agro Based Industrial Units
Flour mill Oil mill Dal mill Sr. No. Name of the village Within
the village 0 Km
Away from the village
Km
Within the
village 0 Km
Away from the village
Km
Within the
village 0 Km
Away from the village
Km
1 2 3 4 5 6 7 8 1. Khodari 7 44 24 2. Devlaha 0 5 47 3. Patnakalan 0 10 45 Adopted Villages 4. Kanpur 0 12 47 5. Tangi 3 10 43 6. Degarhot 6 11 44 7. Umariha 2 8 50 8. Patni 0 10 55 9. Rahaniya 2 7 49 Cluster Villages
10 Bhargawan 0 15 4 Control Village
Total 5 5 10 10
Table No. 7.18 [Contd…]
Status of Agro Based Industrial Units Name of the village Saw mill Repair of Agr. implements Sr. No.
Within the village 0 Km
Away from the village Km
Within the village 0 Km
Away from the village Km
1 2 9 10 11 12 1. Khodari 24 24 2. Devlaha 5 5 3. Patnakalan 10 10 Adopted Villages 4. Kanpur 12 12 5. Tangi 27 28 6. Degarhot 28 29 7. Umariha 8 8 8. Patni 11 10 9. Rahaniya 7 7 Cluster Villages
10 Bhargawan 15 15 Control Village
Total 10 10

377
7.57 The above table shows that out of 10 number of villages, flour mills are located within the physical boundaries of 5 number of villages while in rest of 5 villages this facility is located within the easy reach of the villagers. In non of the villages, oil mills, dal mills and saw mills are located within the easy reach of the villagers [except in few marginal cases where the distance is not much]. The non-existence of any unit of repair of agricultural implements is a drawback as the inhabitants of these villages are pursuing agriculture as main occupation.
SOCIAL INPUTS – EDUCATION ELEMENTARY EDUCATION – PRIMARY LEVEL 7.58 The Universalisation of Elementary Education Programme [U.E.E.] which envisages
compulsory enrolment of children upto the age of 14 years of age has become popular in Madhya Pradesh. The table below shows the details of primary level of education in our area of study.
Table No. 7.19
Status of Primary Level of Education Primary School Non formal education Sr.
No. Name of the village
Within the village 0 km
With-in 1 km
With-in 2 km
With-in 3 km
> 3 km
Within the village 0 km
Away from the village
km 1 2 3 4 5 6 7 8 9
1. Khodari 0 5 2. Devlaha 0 7 3. Patnakalan 0 3 Adopted Villages
4. Kanpur 5. Tangi 0 22 6. Degarhot 0 20 7. Umariha 0 9 8. Patni 0 12 9. Rahaniya 0 8 Cluster Villages
10 Bhargawan 0 10 Control Village
Total 10 10
7.59 One positive fact revealed by the above table is the existence of primary schools within
the geographical limits of all the ten number of villages covered under the study that contributed for higher levels of literacy rate within the sample area. Non formal education centres meant for working children who can not attend the regular primary institutions are not existing within the sample villages.
ELEMENTARY EDUCATION–MIDDLE LEVEL AND ADULT EDUCATION 7.60 The table below shows the status of middle level and adult education.

378
Table No. 7.20 Status of Middle Level and Adult Education
Middle School Adult Education Sr. No.
Name of the village In the village 0 km
Within 5 km
More than 5
km
Within 1 km
Within 2 km
Within 3 km
> 3 km
1 2 9 10 11 11 12 13 14 1. Khodari 0 0 2. Devlaha 5 6 3. Patnakalan 1 10 Adopted Villages
4. Kanpur 4 14 5. Tangi 5 9 6. Degarhot 6 44 7. Umariha 7 10 8. Patni 2 10 9. Rahaniya 7 9 Cluster Villages
10 Bhargawan 3 12 Control Village
Total 1 6 3 1 9
7.61 The above table shows the location of middle school within the geographical limits of one
number of village, Since the criterion of the accessibility of middle school is 3 kms, the three number of villages are therefore within the laid down criterion which is an encouraging picture. Only in village Khodari [adopted village] adult education centre exists.
SECONDARY LEVEL EDUCATION 7.62 The policy relating to secondary education implies extension of school system in unserved
areas, consolidating existing facilities and providing special arrangements for talented students. Inview of above policy decisions the table below shows the details;
Table No. 7.21
Status of Secondary Level Education High School Higher School (+2) Sr.
No. Name of the village
In the village 0 km
Within 5 km
More than 5 km
In the village 0 km
Within 5 km
More than 5 km
1 2 3 4 5 6 7 8 1. Khodari 24 24 2. Devlaha 5 5 3. Patnakalan 10 10 Adopted Villages
4. Kanpur 14 14 5. Tangi 27 27 6. Degarhot 28 28 7. Umariha 8 8 8. Patni 10 10 9. Rahaniya 7 7 Cluster Villages
10 Bhargawan 3 15 Control Village
Total 2 8 1 9

379
7.63 The above table shows the existence of high school and higher school with 5 km radius for two villages and one village respectively. For rest of the villages these facilities are located far–away from the geographical limits of the identified sample villages.
COLLEGIATE AND TECHNICAL EDUCATION 7.64 The table below shows the details
Table No. 7.22
Status of Collegiate and Technical Education College Industrial Training Instt. Sr.
No. Name of the village
Within the village 0
km
Within 5 km
More than 5 km
Within the village 0 km
Within 5 km
More than 5 km
1 2 3 4 5 6 7 8 1. Khodari 43 43 2. Devlaha 47 47 3. Patnakalan 50 53 Adopted Villages
4. Kanpur 55 55 5. Tangi 45 45 6. Degarhot 45 44 7. Umariha 50 50 8. Patni 55 55 9. Rahaniya 49 49 Cluster Villages
10 Bhargawan 10 14 Control Village
Total 10 10
7.65 The above table shows that in non of the villages these facilities are located within the
physical limits of ten sample villages which seem obvious as colleges and I.T.Is. are usuall located at district or tahsil headquarters.
HEALTH 7.66 Primary health care approach being the core strategy of the Tenth Plan for Madhya Pradesh,
a multi tier health and family welfare service delivery system has been developed in the State consisting of sub-health centres, primary health centres and community health centres. Besides, civil hospitals, district hospitals and other special health care institutions have been provided as a support to three tier system. The norms accepted for three tier system is given below;
a. Sub Health Centre for every 5,000 population in non-tribal areas and 3,000 population in
tribal. b. Primary Health Centre for every 30,000 population in non-tribal areas and 20,000
population in tribal areas. c. Community Health Centre for 1,20,000 population in non-tribal areas and 80,000 population
in tribal areas. 7.67 On the basis of aforesaid population criteria, the locational analysis of sub-health centres
and Rural Family Welfare Centres may be attempted. 7.68 The table below shows the details;

380
Table No. 7.23 Rural Health Infrastructure
Sub Health Centre Rural Family Welfare Centre Sr. No.
Name of the village Within the
Village 0 km Within 5
km More than 5
km
Within the Village 0 km
Within 5 km
More than 5
km 1 2 3 4 5 6 7 8 1. Khodari 24 6 2. Devlaha 5 5 3. Patnakalan 10 10 Adopted Villages
4. Kanpur 14 14 5. Tangi 27 9 6. Degarhot 28 7 7. Umariha 8 8 8. Patni 10 10 9. Rahaniya 7 7 Cluster Villages
10 Bhargawan 15 15 Control Village
Total 1 9 1 9
Table No. 7.23 [Contd…] Rural Health Infrastructure Government Hospital Government Dispensary Sr.
No. Name of the village
Within the village 0 km
Within 5 km
More than 5 km
Within the village 0 km
Within 5 km
More than 5 km
1 2 9 10 11 12 13 14 1. Khodari 24 6 2. Devlaha 5 5 3. Patnakalan 10 10 Adopted Villages
4. Kanpur 14 14 5. Tangi 27 27 6. Degarhot 28 28 7. Umariha 8 8 8. Patni 10 10 9. Rahaniya 7 7 Cluster Villages
10 Bhargawan 15 15 Control Village
Total 1 9 1 9

381
Table No. 7.23 [Contd…] Rural Health Infrastructure
Private Clinic Nursing Home Sr. No.
Name of the village Within the
village 0 km
Within 5 km
More than 5 km
Within the village 0 km
Within 5 km
More than 5 km
1 2 15 16 17 18 19 20 1. Khodari 24 24 2. Devlaha 5 5 3. Patnakalan 10 10 Adopted Villages
4. Kanpur 14 14 5. Tangi 27 27 6. Degarhot 28 28 7. Umariha 8 7 8. Patni 10 10 9. Rahaniya 7 7 Cluster Villages
10 Bhargawan 15 15 Control Village
Total 1 9 1 9
7.69 Against the total number of 10 villages only one village i.e. Devlaha [adopted village]
has sub health centre within 5 kms of the geographical limits of the village. In rest of the 9 villages [all from adopted and cluster villages] The sub health centre is located more than 5 km distance from the village.
7.70 Regarding Rural Family Welfare Centre, in non of the villages this facility is located within
the village. In village Devlaha this facility is located within easy reach of the villagers while for rest of the 9 villages this facility is locted far away from the villages.
7.71 As regards government hospitals, the facility is not available within the geographical limits
of any of the sample village while in 1 number of village this facility is available within 5 km radius of the village and for 9 number of villages, government hospitals are located more than 5 kms away from the village ranging between 7 kms for village Rahaniya [cluster village] to 28 kms for village Degarhot [control village]. Similar is the situation with government dispensaries.
7.72 In non of the ten identified villages the private clinic and nursing homes exist within the
geographical limit of the village. FAMILY WELFARE 7.73 Limiting the size of the family is the most important parameter of family welfare measures.
The table below shows the status of the acceptors of family welfare measures in the sample villages covered under the study.

382
Table No. 7.24 Status of Acceptors of Family Welfare Measurer
Sr. No
Name of the village Total Workers
Acceptors of Nirodh
(No.of Benefic-iaries)
Tubectomy (No. of
Benefic-iaries)
Vasectomy (No. of
Benefic-iaries)
Loop Insertion (No. of
Benefic-iaries)
Oral Pills (No. of
Benefic-iaries)
Traditional Methods (No. of
Benefic-iaries)
1 2 3 4 5 6 7 8 9 1. Khodari 85 5
[5.88] 21
[24.71] 3
[3.53] 0 15
[17.65] 0
2. Devlaha 465 6 [1.29]
8 [1.72] 4 [0.86]
0 11 [2.37]
0
3. Patnakalan 250 5 [2.00]
9 [3.60] 0 3 [1.20]
10 [4.00]
1 [0.40]
Adopted Villages 800 16 [2.00]
38 [4.75]
7 [0.89]
3 [0.38]
36 [4.50]
1 [0.13]
4. Kanpur 172 2 [1.16]
11 [6.40]
3 [1.74]
4 [2.33]
12 [6.98]
0
5. Tangi 208 2 [0.96]
7 [3.37] 0 0 6 [2.88] 0
6. Degarhot 78 2 [2.56]
14 [17.95]
2 [2.56]
0 15 [19.23]
0
7. Umariha 69 2 [2.90]
5 [7.25] 1 [1.45]
0 3 [4.35] 0
8. Patni 141 2 [1.42]
8 [5.67] 0 0 3 [2.13] 0
9. Rahaniya 137 2 [8.76]
7 [5.11] 0 2 [1.46]
2 [1.46] 0
Cluster Villages 805 12 [1.49]
52 [6.46]
6 [0.75]
6 [0.75]
41 [5.09]
0
10 Bhargawan 205 8 [3.90]
11 [5.37]
2 [0.98]
0 6 [2.93] 1 [0.49]
Control Village 205 8 [3.90]
11 [5.37]
2 [0.98]
0 6 [2.93] 1 [0.49]
Total 1810 36 [1.99]
101 [5.58]
15 [0.83]
9 [0.50]
83 [4.59]
2 [0.11]
Note : Figures in brackets show the percentage to figures of column 3 laterally. 7.74 In the above table the percentage figures have been arrived at on the basis of the figures of
the workforce which is, in strict sense is not correct. The comparison should have been on the basis of the figures of eligible couples. Since village wise such figures are not available, therefore as a second option the work force figures that usually include persons within the age group of 15 to 59 years have been taken who may be considered as population with reproductive capacity, particularly males.
7.75 Against the total figure of 1810 persons in the work force the total number of persons
adopting various methods of family welfare is 246 which is 13.59 percent to total work force of ten identified villages. The performance to some extent is satisfactory as the figure would have gone to much higher level had the comparison made with the figure of eligible couple. As has been expected, the emphasis is more on the methods of tubectomy and oral bills than on any other method.
DRINKING WATER 7.76 The table below shows the existing level of drinking water facilities available in the sample
villages.

383
Table No. 7.25 Status of Drinking Water Facilities
Sources of drinking water Distance from the village
Sl. No.
Name of the Village In the village =1 KM =2 KMS. =3 KMS. =4KMS.
1 2 3 4 5 6 7 Adopted Villages
1 Khodari 0 - - - - 2 Devlaha 0 - - - - 3 Patnakalan 0 - - - - Cluster Villages 4 Kanpur 0 - - - - 5 Tangi 0 - - - - 6 Degarhot 0 - - - - 7 Umariha 0 - - - - 8 Patni 0 - - - - 9 Rahaniya 0 - - - - Control Village
10 Bhargawan 0 - - - -
Total 10 - - - -
7.77 In all the 10 number of sample villages one or other drinking water source, mostly hand
pumps is available. 7.78 In what follows an attempt has been made to summarise the details of the village
particulars. - The basic purpose of the collection of information about village facilities for identified
ten villages is to ascertain the absorption capacity of any prevailing or new technology regarding any field what-so-ever.
- The total population of 10 identified villages is 4121 which is 0.28 percent of total rural population of Satna district.
- Basically all the ten identified villages are tribal predominated where the percentage literacy ranged between 28.9 far village Umariha to 68.8 percent for village Devlaha, not far below the district level percentage literacy of 65.12 and state level figure of 64.11. The average size of the family is 5 persons.
- The work participation rate ranged between 32.6 percent for village Patni [cluster village] to 55.0 percent for village Tangi [cluster village].
- The proportion of main workers, in general is higher than marginal workers with male participation higher than female participation.
- A reverse situation is visible in case of marginal workers where female participation is more than male participation.
- The proportion of non-workers that ranged between 50.4 percent for village Rahaniya [cluster village] to 71.1 percent for village Umaria [cluster village] presents a dismal picture.
- The agriculture remains to be the main occupation of the ten identified villages covered under the study with substantial proportion of cultivators as compared to agriculture labour. In two number of villages viz. Khodari [adopted village] and Devlaha [adopted village] the proportion of female cultivators is more than that of male cultivators that signifies the awareness and intent of the female members of the farming community to work along with their male counterpart.
- The situation regarding proportion of workers in household industries is for from being satisfactory as it ranged between 0.2 percent for village Devlaha [adopted village] to 2.1 percent for village Patni [cluster village].

384
- Regarding land use, the survey area is rich in forest resources as 58.25 percent area to the total geographical area is under forest. Regarding irrigation the percentage of gross irrigated to gross cropped area is 7.19, which is less than district average of 23.27 percent and state average of 28.54 percent.
- All the villages covered under the study are electrified with irregular power supply situation.
- The total number of pumpsets energized is 88 which is 0.43 percent of total number of 20375 pumpsets energized in district Satna in the year 1999-2000.
- The complete absence of the existence of household industrial units and cooperative societies presents a dismal picture.
- The location of Gram Panchayat within or close to the sample villages is a positive factor that, to some extent, gurantees involvement of villagers in the development of their area.
- The status of road infrastructure in identified 10 number of villages is fairly satisfactory.
- The facility of railway station and bus stand/stop is not available within the close proximity of any of the village.
- The availability of sub-mandi facility within the geographical limit of village Kodari [adopted village] is an encouraging factor.
- In non of the villages the oil mills, dal mills saw mills and repair units are located within easy reach of the villagers.
- Regarding education, the existence of primary school within the geographical limits of all the ten number of villages covered under the study is encouraging factor that contributed to higher levels of literacy rate.
- Regarding health scenario, in non of the identified ten number of villages the facilities like sub-health centre, rural family welfare centre, government hospitals and dispensaries, private clinics and nursing homes exist within villages or their nearby limits.
- Against the total of 1810 persons in the work force the total number of persons adopting various methods of family welfare is 246 which is 13.59 percent to total work force of ten identified villages.
- In all the 10 number of sample villages one or other drinking water source, mostly hand pumps, is available. Results of Survey - Household Particulars
7.79 The present part of the chapter deals with the information relating to the households in the
following dimensions; (i) Macro Dimensions – Wherein information from all the households residing in 10 number of
sample villages has been collected. (ii) Micro Dimensions – Wherein 25 percent of the households have been identified for the
detailed enquiry. 7.80 In what follows an attempt has been made to detail out both macro and micro dimensions
based on the information collected through House Listing Schedule and household Schedule.
MACRO DIMENSIONS – GENERAL PARTICULARS 7.81 The table below shows the details;

385
Table No. 7.26 Household Details
S. No.
Name of the Village No. of household as on the date of survey
Population Census-2001
Average size of the family (based on the figure of col.4
1 2 3 4 5 1. Khodari 19 198 10 2. Devlaha 40 974 24 3. Patnakalan 70 563 8 Adopted Villages 129 1735 13
4. Kanpur 43 357 8 5. Tangi 21 378 18 6. Degarhot 31 219 7 7. Umariha 23 239 10 8. Patni 42 433 10 9. Rahaniya 29 276 9 Cluster Villages 189 1902 10
10 Bhargawan 31 484 15 Control Village 31 484 15
Total 349 4121 11
7.82 The total numbe of households as per survey is 349 for all the ten identified village. The
average size of the family comes to 11 persons which is more than the average size of the family of 5 persons. For villages Devlaha and Tangi the average size of the family is 24 and 18 respectively that needs the special attention of district administration.
SOCIAL STATUS OF THE HOUSEHOLDS 7.83 The table below shows the social status of the households;
Table No. 7.27 Social Status of the Households.
Caste (Social classification) Interaction with KVK S. No.
Name of the Village No. of Household S.T. S.C. O.B.C. General Yes No
1 2 3 4 5 6 7 8 9 1. Khodari 19 10 7 0 2 19 0 2. Devlaha 40 32 0 8 0 40 0 3. Patnakalan 70 44 15 11 0 70 0 Adopted Villages 129 86 22 19 2 129 0
4. Kanpur 43 21 22 0 0 43 0 5. Tangi 21 21 0 0 0 21 0 6. Degarhot 31 25 0 5 1 31 0 7. Umariha 23 18 2 1 2 23 0 8. Patni 42 5 32 3 2 42 0 9. Rahaniya 29 27 0 0 2 29 0 Cluster Villages 189 117 56 9 7 189 0
10 Bhargawan 31 26 0 3 2 31 0 Control Village 31 26 0 3 2 31 0
Total 349 229 78 31 11 349 0
7.84 The above table shows the prepondence of S.T., S.C. households, the combined percentage
of which is 87.97 to total number of 349 households which underlines one important fact that the vulnerable communities in our sample villages are pursuing the agriulture occupation in viable manner. All the households have interacted with K.V.K. in one way or other.

386
HOUSEHOLDS CLASSIFIED ON THE BASIS OF RELIGION 7.85 The table below shows the details;
Table No. 7.28 Distribution of Households according to Religion
S. No.
Name of the Village No. of Household
Hindu Muslim Sikh Christian Nu-Buddh
1 2 3 4 5 6 7 8 1. Khodari 19 19 0 0 0 0 2. Devlaha 40 40 0 0 0 0 3. Patnakalan 70 70 0 0 0 0 Adopted Villages 129 129 0 0 0 0
4. Kanpur 43 43 0 0 0 0 5. Tangi 21 21 0 0 0 0 6. Degarhot 31 31 0 0 0 0 7. Umariha 23 23 0 0 0 0 8. Patni 42 42 0 0 0 0 9. Rahaniya 29 29 0 0 0 0 Cluster Villages 189 189 0 0 0 0
10 Bhargawan 31 31 0 0 0 0 Control Village 31 31 0 0 0 0
Total 349 349 0 0 0 0
7.86 All the households in our area of study belong to Hindu religion.
OCCUPATIONAL DISTRIBUTION OF HOUSEHOLDS – MAIN OCCUPATION PRIMARY SECTOR – AGRICULTURE 7.87 The table below shows the details;
Table No. 7.29
Household According to their Main Occupation – Agriculture S.
No. Name of the Village No. of
household Marginal Farmers
Small Farmers
Other Farmers
Agriculture Labour
1 2 3 4 5 6 7 1. Khodari 19 9 9 1 0 2. Devlaha 40 20 20 0 0 3. Patnakalan 70 42 22 3 0 Adopted Villages 129 71 51 4 0
4. Kanpur 43 19 15 3 0 5. Tangi 21 8 6 0 0 6. Degarhot 31 11 12 0 0 7. Umariha 23 2 19 0 0 8. Patni 42 12 19 0 0 9. Rahaniya 29 8 15 1 0 Cluster Villages 189 60 86 4 0
10 Bhargawan 31 5 19 1 0 Control Village 31 5 19 1 0
Total 349 136 156 9 0

387
7.88 Out of the total number of 349 households 301 number of households constituting 86.25 percent to total households are engaged directly in agriculture as their main occupation that clearly indicaters the proper rational of selection of villages in the groups of adopted and cluster. The combined percentage of other farmers and small farmers is 47.28 that justifies one fact clearly that the absorption capacity of new or prevailing technologies exists in our area of study which in due course will definitely cover the marginal farmers as well.
PRIMARY SECTOR – FOREST, LIVESTOCK, FISHERIES, HUNTING 7.89 Activities allied to agriculture are equally important as additional source of income and
employment in rural areas. The table below shows the details;
Table No. 7.30 Households according to the ir Main Occupations – Forest, Livestock, Fisheries, Hunting
S. No.
Name of The Village No. of Household
Minor Forest Produce
Collection
Livestock Activities
Fishing Activities
Hunting Activities
1 2 3 4 5 6 7 1. Khodari 19 0 0 0 0 2. Devlaha 40 0 0 0 0 3. Patnakalan 70 0 0 0 0 Adopted Villages 129 0 0 0 0
4. Kanpur 43 0 0 0 0 5. Tangi 21 0 0 0 0 6. Degarhot 31 0 0 0 0 7. Umariha 23 0 0 0 0 8. Patni 42 5 0 0 0 9. Rahaniya 29 0 0 0 0 Cluster Villages 189 5 0 0 0
10 Bhargawan 31 0 0 0 0 Control Village 31 0 0 0 0
Total 349 5 0 0 0
7.90 The above table shows that in non of the 10 identified villages the activities like
livestock, fishing and hunting are being pursued as main occupation. Only marginal number of 5 households are engaged in minor forest produce collection work. In short activities allied to agriculture are not popular in our area of study.
SECONDARY AND TERTIARY SECTORS 7.91 Secondary and tertiary sector occupations are important from view points of income
augmentation and employment generation and absorption of work force in lean season of agriculture.
7.92 In non of the villages secondary and tertiary sector occupations are being pursued by any of
the households which is an indication of definite gap in the economic scena rio of the area covered under the study.

388
OCCUPATIONAL DISTRIBUTION OF HOUSEHOLDS – SUBSIDIARY OCCUPATIONS
PRIMARY SECTOR – AGRICULTURE 7.93 Agriculture as subsidiary occupation is not being pursued by any of the households in our
area of study.
PRIMARY SECTOR – FOREST, LIVESTOCK, FISHERIES, HUNTING 7.94 The table below shows the details;
Table No. 7.31
Households According to their Subsidiary Occupation – Forest, Livestock, Fisheries, Hunting S.
No. Name of The Village No. of
Household Minor Forest
Produce Collection
Livestock Activities
Fishing Activities
Hunting Activities
1 2 3 4 5 6 7 1. Khodari 19 18 0 0 0 2. Devlaha 40 40 0 0 0 3. Patnakalan 70 68 0 0 0 Adopted Villages 129 126 0 0 0
4. Kanpur 43 43 0 0 0 5. Tangi 21 21 0 0 0 6. Degarhot 31 31 0 0 0 7. Umariha 23 23 0 0 0 8. Patni 42 37 0 0 0 9. Rahaniya 29 27 0 0 0 Cluster Villages 189 182 0 0 0
10 Bhargawan 31 31 0 0 0 Control Village 31 31 0 0 0
Total 349 339 0 0 0
7.95 Minor forest produce collection is a popular activity in all the ten number of sample villages
which is evident from the fact that 97.13 percent households to total of 349 households are engaged in this activity as a source of their subsidiary income. Non of the households are pursuing activities like livestock, fishing and hunting even as subsidiary occupation.
SECONDARY AND TERTIARY SECTORS 7.96 The table below shows the details;

389
Table No. 7.32 Households According to their Subsidiary Occupations – Secondary and Tertiary Sectors
Secondary Sector Tertiary Sector S. No.
Name of The Village No. of Household Servicing
and Repairs Construc-tion Work
Govt. Service
Service in Private Sector
1 2 3 4 5 6 7 1. Khodari 19 0 0 0 0 2. Devlaha 40 0 0 0 0 3. Patnakalan 70 0 0 0 2 Adopted Villages 129 0 0 0 2
4. Kanpur 43 0 0 0 0 5. Tangi 21 0 0 0 0 6. Degarhot 31 0 0 0 0 7. Umariha 23 0 0 0 0 8. Patni 42 0 0 0 0 9. Rahaniya 29 0 0 0 2 Cluster Villages 189 0 0 0 2
10 Bhargawan 31 0 0 0 0 Control Village 31 0 0 0 0 Total 349 0 0 0 4
7.97 Involvement of households in activities relating to secondary sector as subsidiary occupation
is nil in our area of study while only 4 households are engaged in tertiary sector mostly employed in private sector.
7.98 The only conclusion that can be drawn from the narrations in foregoing paragraphs is
that agriculture is the only activity of the area under study which is being persued on viable scale.
AVERAGE MONTHLY INCOME 7.99 In any survey work the most difficult part is the collection of information regarding income
and expenditure of the household with reasonable accuracy as the households are very cautious about parting with the facts. However, the information shows a trend that may be useful for supporting conclusions which have direct or indirect relations with levels of income of the households. The table below shows the details;
Table No. 7.33
Average Monthly Income S.
No. Name of the Village No. of
House hold
Blow Rs.500
Rs.5001 to Rs.600
Rs.601 to
Rs.700
Rs.701 to
Rs.800
Rs.801 to
Rs.900
Rs.901 to
Rs.1000
Rs.1001 and
Above 1 2 3 4 5 6 7 8 9 10 1. Khodari 19 0 0 0 1 5 3 10 2. Devlaha 40 0 0 0 0 0 1 39 3. Patnakalan 70 0 0 0 1 0 17 52 Adopted Villages 129 0 0 0 2 5 21 101
4. Kanpur 43 1 0 0 0 1 7 34 5. Tangi 21 0 0 0 1 3 4 13 6. Degarhot 31 0 0 0 1 0 2 28 7. Umariha 23 0 0 0 0 3 6 14 8. Patni 42 0 0 0 2 3 12 25 9. Rahaniya 29 0 0 0 4 4 3 18 Cluster Villages 189 1 0 0 8 14 34 132
10 Bhargawan 31 0 0 0 0 0 2 29 Control Village 31 0 0 0 0 0 2 29
Total 349 1 0 0 10 19 57 262

390
7.100 The viable nature of agriculture as main and subsidiary occupations is reflected by the fact that out of 349 number of households the combined number of households within the income range of Rs. 901.00 to Rs. 1000.00 and Rs. 1001 and above per month is 319 which is 91.40 percent to total households. In adopted villages this percentage is 94.57 while in cluster villages it is 87.83 percent. Even in control village where there is no intervention of K.V.K. the percentage of households within the income range Rs. 901.00 to Rs. 1000.00 and Rs. 1001 and above per month is cent percent that shows overall affluence level of the area.
AVERAGE MONTHLY EXPENDITURE 7.101 The table below shows the details;
Table No. 7.34
Average Monthly Expenditure S.
No. Name of the Village No. of
Household Blow
Rs.500 Rs.501
to Rs.600
Rs.601 to
Rs.700
Rs.701 to
Rs.800
Rs.801 to
Rs.900
Rs.901 to
Rs.1000
Rs.1001 and
Above 1 2 3 4 5 6 7 8 9 10 1. Khodari 19 0 0 0 0 0 1 18 2. Devlaha 40 0 0 0 0 0 2 38 3. Patnakalan 70 0 0 0 0 0 10 60 Adopted Villages 129 0 0 0 0 0 13 116
4. Kanpur 43 0 0 0 0 0 1 42 5. Tangi 21 0 0 0 0 0 1 20 6. Degarhot 31 0 0 0 1 0 1 29 7. Umariha 23 0 0 0 0 0 1 22 8. Patni 42 0 0 0 1 0 3 38 9. Rahaniya 29 0 0 0 0 0 4 25 Cluster Villages 189 0 0 0 2 0 11 176
10 Bhargawan 31 0 0 0 0 0 1 30 Control Village 31 0 0 0 0 0 1 30
Total 349 0 0 0 2 0 25 322
7.102 In line with income level, the percentage of households within the expenditure range of Rs.
901.00 to Rs. 1000.00 and Rs. 1001.00 and above per month to total households is 94.43 with the break-up of 100.00 percent for adopted villages and 98.94 percent for cluster villages which further shows the affluence level of the area.
7.103 To sum up it may be mentioned that :- - The total number of household as per survey is 349. - The average size of the family is 11 persons which is much higher than average family
size of 5 persons. - The preponderence of ST, SC households, the combined percentage of which is 87.97 is
the typical feature of the area. - All the households of the area are followers of Hindu religion. - Agriculture is the main occupation of the area where 86.25 percent households are
dependent on it. - Activities like livestock, fishing and hunting as main occupations are completely
missing. Only 5 households are engaged in forest produce collection work. - In non of the villages secondary and tertiary sector occupations are being pursued as
main occupation.

391
- Agriculture as subsidiary occupation is not being pursued by any of the households in our area of study.
- Collection of minor forest produce is important source of subsidiary income as 97.13 percent households are engaged in this occupation
- Only four number of households are engaged in tertiary sector, mostly employed in private sector.
- Regarding income level, 91.40 percent households are within the average monthly income range of Rs. 901.00 to Rs. 1000.00 and Rs. 1001.00 and above with similar trend for monthly expenditure that shows overall affluence status of the area.
RESULTS OF THE SURVEY – MICRO DIMENSION 7.104 In this part of the Chapter 25 percent of the households have been identified for detailed
enquiry which comes to 89 households. The 25% of 349 households comes to 87 but we have taken the figure of 89 due to unavoidable demographic particulars.
7.105 The table below shows the details;
Table No. 7.35 Male – Female Distribution
Age, Male S. No.
Name of the Village No. of Families Selected
No. of Family
Members
Male Total 0-10
Years 10-20 Years
20-30 Years
30-40 Years
40-50 Years
50-60 Years
60 Years and
Above 1 2 3 4 5 6 7 8 9 10 11 12 1. Khodari 5 29 12 0 6 1 1 2 2 0 2. Devlaha 10 58 25 9 5 5 3 1 2 0 3. Patnakalan 18 96 36 7 9 6 5 5 2 2 Adopted Villages 33 183 73 16 20 12 9 8 6 2
4. Kanpur 11 65 35 12 9 5 5 2 1 1 5. Tangi 5 31 14 4 4 3 0 1 1 1 6. Degarhot 8 51 28 9 7 3 5 2 0 2 7. Umariha 6 35 20 6 6 1 4 1 1 1 8. Patni 11 61 30 7 6 5 5 3 2 2 9. Rahaniya 7 39 17 3 6 2 2 3 0 1 Cluster Villages 48 282 144 41 38 19 21 12 5 8
10 Bhargawan 8 45 20 4 4 4 4 1 0 3 Control Village 8 45 20 4 4 4 4 1 0 3
Total 89 510 237 61 62 35 34 21 11 13

392
Table No. 7.35 [Contd…] Male – Female Distribution
Age, Female S. No.
Name Of The Village No. of Families Selected
No. of Family
Members
Female
Total 0-10
Years 10-20 Years
20-30 Years
30-40 Years
40-50 Years
50-60 Years
60 Years and
Above1 2 3 4 13 14 15 16 17 18 19 20
1. Khodari 5 29 17 4 7 1 2 1 2 0 2. Devlaha 10 58 33 16 6 5 2 2 1 1 3. Patnakalan 18 96 60 16 24 10 5 4 0 1 Adopted Villages 33 183 110 36 37 16 9 7 3 2
4. Kanpur 11 65 30 7 8 5 4 4 1 1 5. Tangi 5 31 17 8 1 3 2 2 0 1 6. Degarhot 8 51 23 5 7 2 5 2 0 2 7. Umariha 6 35 15 5 3 1 5 0 0 1 8. Patni 11 61 31 14 3 6 4 2 2 0 9. Rahaniya 7 39 22 5 9 2 3 2 0 1 Cluster Villages 48 282 138 44 31 19 23 12 3 6
10 Bhargawan 8 45 25 7 8 3 3 1 0 3 Control Village 8 45 25 7 8 3 3 1 0 3
Total 89 510 273 87 76 38 35 20 6 11
7.106 The above table shows that out of the total number of 510 number of persons from 89
households males constitute 46.47 percent while females constitute 53.53 percent higher than male percentage. The number of males within the age group of 20 to 60 years which represents labour force is 101 which is 42.62 percent to total number of 237 males is indicative of a positive fact that more persons are available for any productive work. These percentages are 41.95 in adopted villages and 39.58 in cluster villages which underline one basic point that in case of rapid development of agriculture through application of technology by the K.V.Ks. the possibility of absorbing the existing labour force will arrest the tendency of migration during lean season of agriculture. In case of females this percentage is 36.26 with break ups of 31.82 percent for adopted villages and 41.30 percent for cluster villages [more or less in line with male population] that again shows the availability of female labour – force for pursuance of any activity for family income augmentation along with engaging themselves in agriculture with their male counterpart. The percentage of dependent persons comprising of population within the age group of 0 to 10 years and 60 years and above who do not usually contribute towards family income is 31.22 in case of males and 35.50 percent in case females, is within a fair limit particularly for males which, ofcourse, is again a positive indicator.
EDUCATIONAL STATUS OF SAMPLE HOUSEHOLDS 7.107 Education and literacy are the twin prerequisites necessary for adoption of any sort of
technology. The table below shows the educational status of sample households;

393
Table No. 7.36 Educational Status
S. No.
Name of The Village No. of Families Selected
No. of Family
Members
Illiterate Literate without going to school
Primary No.
Middle No.
1 2 3 4 5 6 7 8 1. Khodari 5 29 8 0 13 8 2. Devlaha 10 58 33 0 20 5 3. Patnakalan 18 96 25 0 45 26 Adopted Villages 33 183 66 0 78 39
4. Kanpur 11 65 35 1 21 8 5. Tangi 5 31 19 0 7 3 6. Degarhot 8 51 27 0 14 9 7. Umariha 6 35 18 0 11 5 8. Patni 11 61 33 0 20 8 9. Rahaniya 7 39 13 0 18 8 Cluster Villages 48 282 145 1 91 41
10 Bhargawan 8 45 15 4 18 8 Control Village 8 45 15 4 18 8
Total 89 510 226 5 187 88
Table No. 7.36 [Contd…] Educational Status
S. No
Name of The Village No. of Families Selected
No. of Family
Members
High School
No.
Higher School
No.
Graduate No.
Post Graduate
No.
Others
1 2 3 4 9 10 11 12 13 1. Khodari 5 29 0 0 0 0 0 2. Devlaha 10 58 0 0 0 0 0 3. Patnakalan 18 96 0 0 0 0 0 Adopted Villages 33 183 0 0 0 0 0
4. Kanpur 11 65 0 0 0 0 0 5. Tangi 5 31 2 0 0 0 0 6. Degarhot 8 51 0 1 0 0 0 7. Umariha 6 35 1 0 0 0 0 8. Patni 11 61 0 0 0 0 0 9. Rahaniya 7 39 0 0 0 0 0 Cluster Villages 48 282 3 1 0 0 0
10 Bhargawan 8 45 0 0 0 0 0 Control Village 8 45 0 0 0 0 0
Total 89 510 3 1 0 0 0
7.108 The literacy percentage against the total of 510 persons is 55.69 which is lower than the
district average of 65.12 percent and the state average of 64.11 percent as per census 2001. The percentage of children in levels of elementary education [primary + middle levels] is 53.92 which shows the fair impact of the programme of universalisation of Elementary Education over our area of study. The extent of higher education is far from being impressive mainly because of the lack of higher educational facilities in our area of study. However, an overall educational status that emerges justifies the extent of absorption capacity of the people of the sample area to adopt technology regarding agriculture introduced particularly by the K.V.K.

394
OCCUPATIONAL DISTRIBUTION OF HOUSEHOLDS–MAIN OCCUPATION 7.109 Out of the total of 510 household members of our sample area, 98 persons are engaged in
various main occupations which constitute 19.22 percent to total household members. In what follow an attempt has been made to analyse the information pertaining to main occupations.
OCCUPATIONS RELATING TO AGRICULTURE 7.110 The table below shows the details;
Table No. 7.37 Main Occupation – Agriculture
S. No.
Name of The Village No. of families selected
No. of family
members
Small Farme r
Marginal Farmer
Farmer Agriculture Labour
1 2 3 4 5 6 7 8 1. Khodari 5 29 2 2 1 0 2. Devlaha 10 58 9 1 0 0 3. Patnakalan 18 96 11 6 1 0 Adopted Villages 33 183 22 9 2 0
4. Kanpur 11 65 3 8 0 0 5. Tangi 5 31 3 2 0 0 6. Degarhot 8 51 6 3 0 0 7. Umariha 6 35 6 0 0 0 8. Patni 11 61 6 5 0 0 9. Rahaniya 7 39 3 3 1 0 Cluster Villages 48 282 27 21 1 0
10 Bhargawan 8 45 5 3 0 0 Control Village 8 45 5 3 0 0
Total 89 510 54 33 3 0
7.111 The bulk of farming community from sample population is constituted by small and marginal
farmers whichis 17.06 percent to total of 510 family members. The complete absence of agriculture labour is a supportive factor.
OCCUPATIONS ALLIED TO AGRICULTURE 7.112 The complete absence of persons pursuing occupation allied to agriculture is a negetive
factor that indicates dependence of agriculture for earning livelihood. 7.113 One of the mandates of K.V.K. is to encourage the activities allied to agriculture particularly
that of animal husbandry and fisheries as alternate sources of rural income with immense advantage of reducing pressure on land. The above table shows the absence of such activities in our area of study. One of the greatest disadvantages of the rural scenario of Madhya Pradesh is the absence of such activities particularly in the far-flung areas that keep the rural inhabitants in a state of perpetual poverty.
OCCUPATIONS RELATING TO SECONDARY AND TERTIARY SECTORS 7.114 The table below shows the details;

395
Table No. 7.38 Main Occupation – Secondary and Tertiary Sectors
S. No.
Name of The Village No. of families selected
No. of family
members
Manufac-turing of by-
Product
Servicing and repairs
Const-ruction work
Govt. Service
Service in Pvt. Sector
1 2 3 4 5 6 7 8 9 1. Khodari 5 29 0 0 0 0 0 2. Devlaha 10 58 0 0 2 0 0 3. Patnakalan 18 96 0 0 0 0 0 Adopted Villages 33 183 0 0 2 0 0
4. Kanpur 11 65 0 0 2 0 0 5. Tangi 5 31 0 0 0 0 0 6. Degarhot 8 51 0 0 1 0 0 7. Umariha 6 35 0 0 0 0 0 8. Patni 11 61 0 0 2 0 0 9. Rahaniya 7 39 1 0 0 0 0 Cluster Villages 48 282 1 0 5 0 0
10 Bhargawan 8 45 0 0 0 0 0 Control Village 8 45 0 0 0 0 0
Total 89 510 1 0 7 0 0
7.115 The involvement of eight number of family members in secondary sector can hardly be
termed as satisfactory. One of the important causes of rural poverty is the absence of secondary sector occupations in the rural areas.
OCCUPATIONAL DISTRIBUTION OF HOUSEHOLDS IN SUBSIDIUARY OCCUPATIONS 7.116 Out of total of 510 persons, 92 persons are engaged in various subsidiary occupations that
constitute 18.03 percent to total household members of our sample area. SUBSIDIARY OCCUPATIONS – AGRICULTURE 7.117 The table below shows the details;
Table No. 7.39 Subsidiary Occupation – Agriculture
S. No.
Name of The Village No. of families selected
No. of family
members
Small Farmer
Marginal Farmer
Farmer Agriculture Labour
1 2 3 4 5 6 7 8 1. Khodari 5 29 0 0 0 0 2. Devlaha 10 58 0 0 1 0 3. Patnakalan 18 96 1 0 1 0 Adopted Villages 33 183 1 0 0 0
4. Kanpur 11 65 0 0 0 0 5. Tangi 5 31 0 0 0 0 6. Degarhot 8 51 0 0 0 0 7. Umariha 6 35 0 0 0 0 8. Patni 11 61 0 0 0 0 9. Rahaniya 7 39 0 0 0 0 Cluster Villages 48 282 0 0 0 0
10 Bhargawan 8 45 0 0 0 0 Control Village 8 45 0 0 0 0
Total 89 510 1 0 1 0

396
7.118 The above table shows the involvement of only 2 person in agricultural occupations which is hardly a meaningful affair.
SUBSIDIARY OCCUPATIONS – ALLIED TO AGRICULTURE 7.119 The table below shows the details;
Table No. 7.40 Subsidiary Occupation – Allied to Agriculture
S. No.
Name of The Village No. of families selected
No. of family
members
Minor Forest
Produce Collection
Live stock
activities
Fishing Activitie
s
Hunting Activitie
s
Mining and
Quarying
1 2 3 4 5 6 7 8 9 1. Khodari 5 29 4 0 0 0 0 2. Devlaha 10 58 10 0 0 0 0 3. Patnakalan 18 96 17 0 0 0 0 Adopted Villages 33 183 31 0 0 0 0
4. Kanpur 11 65 11 0 0 0 0 5. Tangi 5 31 5 0 0 0 0 6. Degarhot 8 51 8 0 0 0 0 7. Umariha 6 35 6 0 0 0 0 8. Patni 11 61 11 0 0 0 0 9. Rahaniya 7 39 5 0 0 0 0 Cluster Villages 48 282 46 0 0 0 0
10 Bhargawan 8 45 8 0 0 0 0 Control Village 8 45 8 0 0 0 0
Total 89 510 85 0 0 0 0
7.120 The above table shows the involvement of 85 persons for the occupation of minor forest produce collection as subsidiary occupation which is 16.67 percent to total family members.
SUBSIDIARY OCCUPATION – SECONDARY AND TERTIARY SECTORS 7.121 The table below shows the details;

397
Table No. 7.41 Subsidiary Occupations – Secondary and Tertiary Sectors
S. No.
Name of The Village No. of families selected
No. of family
members
Manufacturing of
by Product
Servi-cing and repairs
Const-ruction work
Govt. Service
Service in Pvt.
Sector
1 2 3 4 5 6 7 8 9 1. Khodari 5 29 0 0 0 0 0 2. Devlaha 10 58 0 0 0 0 0 3. Patnakalan 18 96 0 0 2 0 0 Adopted Villages 33 183 0 0 2 0 0 4. Kanpur 11 65 0 0 0 0 0 5. Tangi 5 31 0 0 0 0 0 6. Degarhot 8 51 0 0 0 0 0 7. Umariha 6 35 0 0 0 0 0 8. Patni 11 61 0 0 0 0 0 9. Rahaniya 7 39 0 0 3 0 0 Cluster Villages 48 282 0 0 3 0 0
10 Bhargawan 8 45 0 0 0 0 0 Control Village 8 45 0 0 0 0 0
Total 89 510 0 0 5 0 0
7.122 Again there are only five persons engaged in secondary sector which is not a meaningful
state of affairs. AVERAGE MONTHLY INCOME 7.123 The table below shows the details;
Table No. 7.42 Average Monthly Income
S. No.
Name of The Village No. of families selected
No. of family memb
ers
Below Rs. 500
Rs. 501 to
Rs. 600
Rs. 601 to
Rs. 700
Rs. 701 to
Rs. 800
Rs. 801 to
Rs. 900
Rs. 901 to
Rs. 1000
Rs. 1001 & above
1 2 3 4 5 6 7 8 9 10 11 1. Khodari 5 29 24 0 0 0 0 0 5 2. Devlaha 10 58 46 0 0 0 0 1 11 3. Patnakalan 18 96 76 0 0 0 0 2 18 Adopted Villages 33 183 146 0 0 0 0 3 34
4. Kanpur 11 65 52 0 0 2 0 0 11 5. Tangi 5 31 26 0 0 0 0 0 5 6. Degarhot 8 51 42 0 0 0 0 1 8 7. Umariha 6 35 29 0 0 0 0 0 6 8. Patni 11 61 48 0 0 0 0 2 11 9. Rahaniya 7 39 31 0 0 0 0 2 6 Cluster Villages 48 282 228 0 0 2 0 0 0
10 Bhargawan 8 45 37 0 0 0 0 0 8 Control Village 8 45 37 0 0 0 0 0 0 Total 89 510 411 0 0 2 0 8 89
7.124 The above table shows that 80.59 percent family members against the 510 persons are
within the average income range of below Rs. 500 per month which seems obvious as most of the farmers are from the category of small and marginal farmers.

398
AVERAGE MONTHLY EXPENDITURE 7.125 The table shows the details;
Table No. 7.43 Average Monthly Expenditure
S. No.
Name of The Village No. of families selected
No. of family
members
Below Rs. 500
Rs. 501 to
Rs. 600
Rs. 601 to
Rs. 700
Rs. 701 to
Rs. 800
Rs. 801 to
Rs. 900
Rs. 901 to
Rs. 1000
Rs. 1001 and
Above 1 2 3 4 5 6 7 8 9 10 11 1. Khodari 5 29 24 0 0 0 0 0 5 2. Devlaha 10 58 48 0 0 0 0 2 8 3. Patnakalan 18 96 78 0 0 0 0 2 16 Adopted Villages 33 183 150 0 0 0 0 4 29
4. Kanpur 11 65 54 0 0 0 0 0 11 5. Tangi 5 31 26 0 0 0 0 0 5 6. Degarhot 8 51 43 0 0 0 0 1 7 7. Umariha 6 35 29 0 0 0 0 0 6 8. Patni 11 61 52 0 0 1 0 0 8 9. Rahaniya 7 39 31 1 0 0 0 3 4 Cluster Villages 48 282 235 1 0 1 0 0 0
10 Bhargawan 8 45 37 0 0 0 0 1 7 Control Village 8 45 37 0 0 0 0 0 0
Total 89 510 422 1 0 1 0 9 77
7.126 In line with information pertaining to income, 82.75 percent of family members are within
the average expenditure range of Rs. 500.00 and below. To sum up - The percentage of males within the age group of 20 to 60 years which represents
labour force is 42.62 while that for females it is 36.26 which underline one fact that there exist a scope for absorption of agriculture related technology in our area of study.
- The percentage of dependent population is within fair limits for both males and females.
- The literacy percentage being 55.69 is not discouraging though lower than district and state average percentage literacy.
- The bulk of the farming community is from small and marginal farmers pursuing agriculture as main source of livelihood.
- The complete absence of persons in occupation allied to agriculture as main occupation is a definite drawback.
- The involvement of only eight number of family members in secondary sector as main occupation can hardly be termed as satisfactory.
- Regarding subsidiary occupation, the involvement of only two persons in agriculture occupation is hardly a meaningful conclusion.
- Involvement of 85 persons for the occupation of minor forest produce collection as a subsidiary occupation is a pleasant deviation.
- Regarding average monthly income , 80.59 percent family members are within the average income range of below Rs. 500.00 per month. Similar is the trend with average monthly expenditure.

399
RESULTS OF SURVEY SUBJECTS OF TRAINING RECEIVED– ADOPTED AND CLUSTER VILLAGES 7.124 At the outset it is necessary to clarify the point that there are 81 number of families out of the
total number of 89 families [91.01 percent] who took part in vocational training, front line demonstration and on farm testing which are the three basic mandates of K.V.K. Therefore, the total of responding families from vocational training, front line demonstration and on farm testing will not tally with the figure of 89 as from this basic figure the families participated in three fundamental activities. The entire analysis is based upon family approach as normally one member from each family from adopted and cluster villages where there is direct intervention of K.V.K. takes part in various training programmes. In what follows an attempt has been made to present the item wise details of various initiatives adopted by K.V.K. in the fields of vocational training, front line demonstrations and on farm testing.
VOCATIONAL TRAINING 7.125 The table below shows the details;
Table No. 7.44 Subjects of Training Received – Vocational Training.
Subject on Which Training Received S. No.
Name of Village No. of Respondents Crop Prod
Agronomy Horticulture Livestock
Dairying Poultry Fisheries
1 2 3 4 5 6 7 1 Khodari 5 5 5 5 0 2 Devlaha 10 10 10 0 0 3 Patnakalan 18 18 18 5 1 I Adopted Villages 33 33 33 10 1
4 Kanpur 11 11 11 0 0 5 Tangi 5 5 5 0 0 6 Degarhot 8 8 6 0 1 7 Umariha 6 6 6 0 0 8 Patni 11 11 11 0 0 9 Rahaniya 7 7 5 0 0 II Cluster Villages 48 48 44 0 1
Total All Villages 81 81 77 10 2
Table No. 7.44 [Contd…] Subjects of Training Received – Vocational Training.
Subject On Which Training Received S. No.
Name of Village Home
Science Training of Rural Youth
Agro Forestry
Organic Farming
Water Shed Activities
1 2 8 9 10 11 12 1 Khodari 5 0 0 4 0 2 Devlaha 10 2 0 3 0 3 Patnakalan 17 2 1 6 0 I Adopted Villages 32 4 1 13 0 4 Kanpur 11 2 0 2 0 5 Tangi 5 0 0 5 0 6 Degarhot 7 1 0 3 0 7 Umariha 6 0 0 2 0 8 Patni 10 2 0 2 0 9 Rahaniya 7 2 0 3 0 II Cluster Villages 46 7 0 17 0
Total All Villages 78 11 1 30 0

400
7.126 The cent percent response of family representatives for crop production seems obvious as the traditional crops are still in vogue in our area of study followed by home science activities by 78 families [96.30 percent to totalof 81 responding families] that indicates the involvement mainly of women to adopt occupation for augmentation of family income. The participation of 77 and 30 families for subjects like horticulture and organic farming is an encouraging deviation. Complete lack of respons for watershed activities is a sort of drawback for which K.V.K. scientists should make some efforts.
FRONT LINE DEMONSTRATION 7.127 The main objective of the front line demonstration is to demonstrate newly released crop
production and protection technologies and its management practices in the farmer’s fields. However, in front line demonstrations, the interactions regarding home science activities, training of rural youth and all the other items as specified for vocational training are done to educate and support the farmers for augmentation of income. The table below shows the details;
Table No. 7.45
Subjects of Training Received – Front Line Demonstration Subject On Which Training Received S.
No Name of The Village No. of
Respondents Crop Prod Agronomy
Horticulture Live Stock Dairying Poultry
1 2 3 4 5 6 1 Khodari 5 5 5 5 2 Devlaha 10 10 10 0 3 Patnakalan 10 9 0 5 I Adopted Villages 25 24 15 10
4 Kanpur 4 4 0 0 5 Tangi 5 5 0 0 6 Degarhot 5 5 0 0 7 Umariha 6 6 0 0 8 Patni 3 3 0 0 9 Rahaniya 7 7 0 0 II Cluster Villages 30 30 0 0
Total All Villages 55 54 15 10 7.128 The above table shows that out of total number of 81 responding families 55 households i.e.
67.90 percent to total households have responded to front line demonstrations, out of which in agronomical activities, 54 family respresentatives have taken part in various vocational trainings, followed by horticulture related activities and livestock where 15 and 10 family representatives respectively have participated in vocational training organised by the K.V.K. A total gap in participation in subjects like fisheries, home science, training of rural youth, agro-forestry, organic farming and watershed activities shows that cultivators are basically interested in enhancing their agriculture related productivity with basic understanding that once the income from agriculture is enhanced the other activities allied to agriculture will gradually develop. However, the efforts may be made by the K.V.K. scientists to arrange a few vocational training on livestock activities, agro forestry and watershed activities as these are very relevant occupations for rural economy.

401
ON FARM TESTING 7.129 In this practice the farmers participate in identifying problems and priorities and managing
experiment and evaluating results. It is, therefore, an adaptive research with farmers perspective. The basic objective of on farm testing is to identify existing inputs or practices that might help to solve major problems of many farmers in a defined study area. The table below shows the details;
Table No. 7.46
Subjects of Training Received – On Farm Testing Subject On Which Training Received S.
No. Name of The Village No. of
Respondents Crop Prod Agronomy
Horticulture
Live Stock Dairying Poultry
1 2 3 4 5 6 1 Khodari 2 2 0 0 2 Devlaha 1 1 0 0 3 Patnakalan 3 3 0 0 I Adopted Villages 6 6 0 0
4 Kanpur 1 1 0 0 5 Tangi 1 1 0 0 6 Degarhot 4 4 0 0 7 Umariha 0 0 0 0 8 Patni 1 1 0 0 9 Rahaniya 3 3 0 0 II Cluster Villages 10 10 0 0
Total All Villages 16 16 0 0
7.130 The above table shows that out of the total of 81 responding families, only 16 households [19.75%] have responded to the programme. A large participation is not also expected as only bigger cultivators can afford getting such activity organised on their field.
7.131 A complete absence of participation in most of the subjects is visualized except on the
subject of crop production where cent-percent participation has been reported. 7.132 The basic facts as revealed by above narration are that most of the cultivators are
interested in training programmes relating to crop production, horticulture and home science which have direct relevance to their income. Livestock and poultry activities and fisheries are the areas where the villagers have hardly any interest.
IMPACT OF K.V.K. 7.133 In the foregoing paragraphs the analysis of subject wise training received was presented. In
what follows an attempt has been made to present the impact of individual items of training in the broad categories of;
- Vocational Training - Front Line Demonstration - On Farm Testing
both before and after training [BT, AT] situations. This is the most important part of the report that clearly indicates the impact of K.V.Ks. intervention on agronomy, horticulture, livestock and dairying, fisheries, home science etc.

402
VOCATIONAL TRAINING – AGRONOMY - CEREALS 7.134 The table below shows the impact of K.V.K’s. intervention over cereal crops;
Table No. 7.47 Agronomy – Cereals
Wheat Paddy Maize S. No
Name of The Village No. of
Respondents
BT AT No. of Respondents
BT AT No. of Respond
ents
BT AT
1 2 3 4 5 6 7 8 9 10 11 1 Khodari 5 1560 3360 2 3900 5800 2 1000 1850 2 Devlaha 10 1660 3100 10 2830 3380 10 1030 1750 3 Patnakalan 18 2089 3583 16 3850 3210 14 1250 1871
I Adopted Villages 33 28 26
4 Kanpur 11 1827 3236 11 2900 3600 11 1264 1882
5 Tangi 5 1900 3320 5 1540 1760 5 1100 1480
6 Degarhot 8 2325 3188 3 1541 1798 0 0 0
7 Umariha 6 2733 3817 0 0 0 6 1417 2050
8 Patni 11 2218 3355 9 2300 3140 9 1311 1789 9 Rahaniya 7 2457 3457 7 1320 2020 2 1450 1800
II Cluster Villages 48 35 33 Total All Villages 81 63 59
7.135 Regarding wheat crop the responding family representatives are 81 which is cent percent
to total of 81 number of responding families who have shown interest in vocational training regarding wheat crop. The after training [A.T.] scenario is much better than before training situation wherein the per hectare yield ranged between 3100 kg per hectare for village Devlaha [adopted village] to 3817 kg per hectare for village Degarhot [cluster village] – obviously much higher than the district and State average per hectare yield rates of 1305 and 1867 kg respectively. The above fact clearly indicates the positive effects of vocational training imparted by the K.V.K. over the wheat crop.
7.136 Regarding paddy crop the per-hectare yield in after training situation for every village is
higher than before training situation that ranged between 1760 kg for village Tangi [cluster village] to 5800 kg for villge Khodari [adopted village] much higher than district and state average figures of 1305 kg and 1867 kg respectively.
7.137 Regarding maize, 50 number of families [72.84 percent] have participated in the vocational
training programme with yield rates in A.T. situations ranging between 1480 kg per hectare for village Tangi [cluster village] to 2050 kg in Umariha [cluster village], higher than district average of 1344 kg. The positive impact of the K.V.Ks. intervention is, thus, obvious.
VOCATIONAL TRAINING – AGRONOMY – PULSES 7.138 The table below shows the details

403
Table No. 7.48 Agronomy – Pulses
Yield Per- Hectare - Kg. Gram Arhar
S. No.
Name of The Village
No. of Respondents
BT AT No. of Respondents
BT AT
1 2 3 4 5 6 7 8 1 Khodari 5 2801 3010 2 750 1300
2 Devlaha 10 2010 3941 10 700 1080 3 Patnakalan 12 1280 1680 8 763 1075
I Adopted Village 27 20 4 Kanpur 2 1500 2100 4 850 1150
5 Tangi 5 2900 3914 5 800 1000
6 Degarhot 8 2141 3180 3 733 1100
7 Umariha 6 2789 3547 3 667 1033
8 Patni 3 2400 3000 3 767 1000 9 Rahaniya 6 2410 3784 3 867 1433
II Cluster Village 30 21 Total All Villages 57 41
7.139 In pulses group gram and arhar are the important crops of Satna district. Regarding Gram,
against the total of 81 households, 57 households [70.37 percent] have participated in vocational training. The after training performance that resulted in per hectare yield ranging between 1680 kg for village Patnakalan [adopted village] to 3941 kg for village Devlaha [adopted village] is much higher than district and State average figures of 698 kg and 932 kg per hectare respectively.
7.140 Regarding Arhar crop, 41 households [50.61 percent] have responded to vocational training
which is reflected in enhanced productivity in after training situations that ranged between 1000 kg per hectare for villages Tangi and Patni [both cluster village] to 1433 kg for village Rahaniya [cluster village] far above than district and state average productivity of 501 kg and 825 kg per hectare respectively.
VOCATIONAL TRAINING – AGRONOMY – OIL SEEDS 7.141 The table below shows the details;

404
Table No. 7.49 Agronomy – Oil Seeds – Mustard
Yield Per- Hectare - Kg. Mustared
S. No.
Name of The Village
No. of Respondents
BT AT
1 2 3 4 5 1 Khodari 5 560 1140
2 Devlaha 7 529 986 3 Patnakalan 9 711 1056
I Adopted Village 21
4 Kanpur 3 533 1000 5 Tangi 5 500 964 6 Degarhot 5 580 1100 7 Umariha 5 740 1240 8 Patni 3 700 967 9 Rahaniya 4 600 1075
II Cluster Village 25
Total All Villages 46 7.142 Regarding Mustard crop 46 households [56.79 percent] took part in vocational training
programme resulting in the yield rate ranging between 967 kg for village Patni [cluster village] to 1240 kg for village Umariha [cluster village] in after training situation which is higher than district and state average figures of 385 kg and 1009 kg per hectare respectively.
7.143 The participation of households for receiving training on crops like lentil, jowar, soybean,
sugarcane, linseed is nil that clearly indicates the lack of interest of cultivators of Satna district in pursuing the cultivation of these crops. The impact of vocational training, thus, will not be visible over such crops.
HORTICULTURE 7.144 Horticulture crops are important from the view points of employment generation, checking
of soil erosion and providing high density green cover to the soil. Being tough, many of these crops may be successfully grown on waste land not suitable for traditional crop cultivation. The table below shows the status of horticulture crop production in the sample area of our study;
Table No. 7.50 Horticulture Crops
Yield Per- Hectare - Quintal Potato Onion
S.No. Name of The Village
No. of Respondents
BT AT No. of Respondents
BT AT
1 2 3 4 5 6 7 8 1 Khodari 5 0 200 3 0 249 2 Devlaha 10 0 204 0 0 0 3 Patnakalan 25 21 198 12 150 257 I Adopted Villages 40 15
4 Kanpur 3 0 197 0 0 0 5 Tangi 5 0 211 5 0 211 6 Degarhot 5 148 204 3 0 271 7 Umariha 6 157 248 3 0 218 8 Patni 6 0 201 0 0 0 9 Rahaniya 12 203 250 2 350 0 II Cluster Villages 37 13
Total All Villages 77 28

405
Table No. 7.50 [Contd…] Horticulture Crops
Yield Per- Hectare - Quintal Tomato Brinjal
S. No.
Name of The Village
No. of Respondents
BT AT No. of Respondents
BT AT
1 2 9 10 11 12 13 14 1 Khodari 5 0 164 5 0 235 2 Devlaha 10 0 196 0 0 0 3 Patnakalan 10 14 171 9 100 159 I Adopted Villages 25 14
4 Kanpur 6 0 209 5 0 103 5 Tangi 5 0 187 3 0 286 6 Degarhot 0 0 0 2 190 190 7 Umariha 3 0 170 4 0 310 8 Patni 3 0 172 5 0 101 9 Rahaniya 2 0 210 1 140 190 II Cluster Villages 19 20
Total All Villages 44 34
Table No. 7.50 [Contd…] Horticulture Crops
Yield Per- Hectare - Kg. Papaya Chilly Bhindi
S. No
Name of The Village
No. of Respondents
BT AT No. of Respondents
BT AT No. of Respondents
BT AT
1 2 15 16 17 18 19 20 21 22 23 1 Khodari 0 0 0 5 0 134 2 0 180 2 Devlaha 0 0 0 3 0 208 2 0 190 3 Patnakalan 0 0 0 10 0 170 10 60 231
I Adopted Villages 0 0 18 14
4 Kanpur 0 0 0 1 0 200 1 0 100
5 Tangi 0 0 0 5 0 215 0 0 0
6 Degarhot 0 0 0 0 0 0 0 0 0
7 Umariha 0 0 0 1 0 90 0 0 0 8 Patni 1 0 70 3 0 183 3 0 247 9 Rahaniya 0 0 0 1 0 150 0 0 0
II Cluster Villages 1 0 11 4
Total All Villages 1 0 29 18
7.145 The above table shows that in case of Potato 59 number of families have participated in the vocational training which is 72.84 percent to total of 81 responding families. For every village the per-hectare yield in after training situation is higher than before training conditions that ranged between 197 quintal per hectare for village Kanpur [cluster village] to 250 quintal per hectare for village Rahaniya [cluster village]. These yield rates are much higher than the State average figure of 119 quintal per hectare. The positive impact of the efforts of the K.V.K., is, thus, obvious.
7.146 Regarding Onion, 28 number of households [34.57 percent] have responded to the
vocational training, resulting in enhanced per-hectare yield in after training situations as compared to before training conditions that ranged between 211 quintal per-hectare for village Tangi [cluster village] to 271 quintal per hectare for village Degarhot [cluster village] which are much higher than State average figure of 140 quintal per hectare.

406
7.147 Tomato is yet another crop which is gradually picking-up at Satna as 44 families have participated in the vocational training constituting 54.32 percent to total of 81 families. The yield rates in after training conditions ranged between 164 quintal per hectare for village Khodari [adopted village] to 210 quintal per-hectare for village Rahaniya [cluster village].
7.148 Brinjal too is a crop getting popular at Satna as 34 number of families [41.98 percent] have
shown interest in training programme, the positive effects of which have been reflected in the form of enhanced per-hectare yield in after training situations as compared to before training conditions that ranged between 101 quintal per-hectare for village Patni [cluster village] to 310 quintal per-hectare for village Umriha [cluster village].
7.149 For Chilly crop, 29 families have taken part in vocational training with yield rates that
ranged between 90 quintal per hectare is village Umariha [cluster village] to 215 quintal per hectare in village Tangi [cluster village] in after training situation.
7.150 Similarly for Bhindi crop, 18 number of families [22.22 percent] have taken part in
vocational training programme resulting in enhanced productivity in after training situations as compared to before training status that ranged between 100 quintal per-hectare for village Kanpur [cluster village] to 247 quintal per-hectare for village Patni [cluster village].
7.151 As regards Papaya, only one household from village Patni [cluster village] has taken part in
the vocational training programme resulting in output of 70 quintal per hectare in after training conditions.
7.152 For crops like Cucerbits, Spices, Mango, Banana and Citrus, no vocational tra ining
programmes have been organised as the cultivators were not interested in producing such crops.
VOCATIONAL TRAINING – LIVESTOCK AND DAIRY 7.153 Though these functions are important from the view points of both income augmentation
and diversification of agriculture for reducing pressure on land in rural areas but in general such functions are not taken-up on viable scale with proper organizational skill as is evident from the information contained in the following table;
Table No. 7.51 Live Stock and Dairying
Improved feeding management S. No Name of The Village No. of Respondents Yes No
1 2 9 10 11 1 Khodari 5 5 0 2 Devlaha 0 0 0 3 Patnakalan 5 5 0 I Adopted Villages 10 0 0
4 Kanpur 0 0 0
5 Tangi 0 0 0
6 Degarhot 0 0 0 7 Umariha 0 0 0 8 Patni 0 0 0 9 Rahaniya 0 0 0 II Cluster Villages 0 0 0 Total All Villages 10 10 0

407
7.154 Only for feeding management 10 number of households have given a positive response and adopted the practice.
VOCATIONAL TRAINING – POULTRY 7.155 Poultry is yet another activity which is relevant to rural economy for augmentation of family
income. The table below shows the details;
Table No. 7.52 Poultry Activities
Improved breed No.
Improved caging system S. No
Name of The Village
No. of Respondents
BT AT No. of Respondents
Yes No
1 2 3 4 5 6 7 8 1 Khodari 5 0 17 5 5
2 Devlaha 0 0 0 0 0 3 Patnakalan 5 0 21 5 5
I Adopted Village 10 0 38 10 10
4 Kanpur 0 0 0 0 0
5 Tangi 0 0 0 0 0
6 Degarhot 0 0 0 0 0 7 Umariha 0 0 0 0 0 8 Patni 0 0 0 0 0 9 Rahaniya 0 0 0 0 0
II Cluster Village 0 0 0 Total All Villages 10 10 10
Table No. 7.52 [Contd…]
Poultry Activities Improved feed management Vaccination of bird S.
No Name of The Village
No. of Respondents
Yes No No. of Respondents
BT AT
1 2 3 4 5 6 7 8 1 Khodari 5 5 0 5 0 20
2 Devlaha 0 0 0 0 0 0 3 Patnakalan 5 0 0 5 21 4
I Adopted Village 10 0 0 10 4 Kanpur 0 0 0 0 0 0 5 Tangi 0 0 0 0 0 0 6 Degarhot 0 0 0 0 0 0 7 Umariha 0 0 0 0 0 0 8 Patni 0 0 0 0 0 0 9 Rahaniya 0 0 0 0 0 0
II Cluster Village 0 0 0 0
Total All Villages 10 10 0 10
7.156 For improved breeding practices ten number of households from villages Khodari and Patnakalan have participated in vocational training with production of 17 and 21 number of improved breed in after training situation.
7.157 Similarly for improved caging system 10 number of households have taken part in
vocational training who have followed the practice.

408
7.158 The training programme for improved feed management has been attended by 10 number of households.
7.159 Regarding vaccination of birds 10 number of households have attended the training
programme with not much tangible results. VOCATIONAL TRAINING – HOME SCIENCE 7.160 Vocational training in Home Science activities like toy making, preparation of pickles and
jute items, preparation of papad/bari/jam/jelly etc. are important from both income support and employment generation point of views engaging women and old people in rural areas. The table below shows the details;
Table No. 7.53
Home Science Activities Pickle, Kg. Backery, Kg. Papad/Badi/Jam/Jelly,
Kg. S. No
Name of The Village
No. of Respondents
BT AT No. of Respond
ents
BT AT No. of Responde
nts
BT AT
1 2 3 4 5 6 7 8 9 10 11 1 Khodari 5 0 19 0 0 0 0 0 0 2 Devlaha 10 0 31 0 0 0 10 0 26 3 Patnakalan 17 5 57 2 0 3 9 0 14
I Adopted Villages 32 5 107 2 0 3 19 0 40
4 Kanpur 11 4 30 0 0 0 11 0 21
5 Tangi 5 0 23 0 0 0 5 0 16
6 Degarhot 8 7 41 0 0 0 0 0 0
7 Umariha 6 5 26 0 0 0 0 0 0 8 Patni 10 0 29 0 0 0 10 0 29 9 Rahaniya 6 1 25 0 0 0 0 0 0
II Cluster Villages 46 17 174 0 0 0 26 0 66
Total All Villages 78 22 281 2 0 3 45 0 106
7.161 Preparation of Pickles is an item getting popular in rural areas as 78 number of family representatives have taken part in the vocational training constituting 96.30 percent of total of 81 responding families with production of 281 kgs of pickle in after training situation as compared to 22 kgs of pickle in before training conditions. The impact of K.V.Ks. effort is clearly visible.
7.162 Regarding preparation of backery items which is not very popular in our sample area of
study, only 2 number of households from village Patnakalan [adopted village] have taken part in vocational training with 3 kgs of production in after training situation that clearly shows the lack of interest of sample household in pursuing such occupation.
7.163 Regarding preparation of paper/badi/jam/jelly etc., which is becoming popular activity
in our study mainly due to portability of the product, 45 household [55.56 percent] have taken part in vocational training organised by the K.V.K. with production of 106 kg in after training situation as compared to nil production in before training conditions that underlines the positive impact of the K.V.Ks. efforts.

409
VOCATIONAL TRAINING – TRAINING OF RURAL YOUTH 7.164 Training of rural youth, though do not have any direct relevance to transfer of agriculture
related technology, but has immense impact on employment generation. The table below shows the details;
Table No. 7.54
Training of Rural Youth Motor binding Engine repair Other activities S.
No Name of The Village
No. of Respondents
BT AT No. of Respond
ents
BT AT No. of Responde
nts
BT AT
1 2 3 4 5 6 7 8 9 10 11 1 Khodari 0 0 0 0 0 0 0 0 0 2 Devlaha 0 0 0 0 0 0 2 0 2 3 Patnakalan 0 0 0 0 0 0 1 0 1
I Adopted Villages 0 0 0 0 0 0 3 0 3
4 Kanpur 0 0 0 0 0 0 2 0 2
5 Tangi 0 0 0 0 0 0 0 0 0
6 Degarhot 0 0 0 0 0 0 1 0 1
7 Umariha 0 0 0 0 0 0 0 0 0 8 Patni 0 0 0 2 0 2 0 0 0 9 Rahaniya 1 0 1 0 0 0 1 0 1
II Cluster Villages 1 0 1 2 0 2 4 0 4
Total All Villages 1 0 1 2 0 2 7 0 7
7.165 Regarding motor binding activity one family member from village Rahaniya [cluster village] has taken part in the training with placement.
7.166 Similarly for tractor, diesel engine repair two number of family members from village Patni
[cluster village] have undergone the training and got placement. 7.167 Regarding other activities 7 number of family members have undergone training and got
placement in various jobs. 7.168 The impact of K.V.Ks. efforts regarding training of rural youth is quite satisfactory. Though
the figures seem inadequate but in view of the requirement of such services in rural areas the number of trained persons is sufficient.
VOCATIONAL TRAINING – ORGANIC FARMING 7.169 The table below shows the details;

410
Table No. 7.55 Organic Farming
Bio-Fertilizer Kg. S. No. Name of The Village No. of
Respondents BT AT
1 2 6 7 8 1 Khodari 4 0 95
2 Devlaha 3 0 85 3 Patnakalan 6 0 180
I Adopted Village 13 0 360
4 Kanpur 3 0 88 5 Tangi 4 0 125 6 Degarhot 3 0 75 7 Umariha 2 0 50 8 Patni 2 0 55 9 Rahaniya 4 0 105
II Cluster Village 18 0 498
Total All Villages 31 0 858
7.170 The practice of organic farming is gradually picking up in our area of study as 31 number of households have participated in the training programme relating to Bio-fertilizer with production of 858 kgs of bio-fertilizer in after training situation as compared to nil performance in before training conditions.
7.171 No vocational training has been organised on subjects like fishery development, agro
forestry and watershed activities which are important functions from the view point of income augmentation in rural areas. The impact of vocational training over such activities will not visible.
7.172 In the following paragraphs an attempt has been made to sum-up the efforts of vocational
training imparted by the K.V.K. - Regarding the yield per hectare both for agronomical and horticutlral crops, the after
training situation is better than before training conditions that clearly shows the positive impact of vocational training imparted by the K.V.K.
- Regarding wheat crop cent -percent responding families have taken part in vocational training with yield rates higher than district and state level average productivity.
- Similarly for paddy crop the productivity is much higher than average roductivity levels prevailing at district and in state.
- Regarding Gram crop 70.37 percent family representatives have taken part in vocational training with much higher yield rates as compard to district and state average productivity.
- Regarding Arhar 50.61 percent households have responded to vocational training with yield rates far above the district and state average productivity.
- Regarding Mustard 56.79 percent households have taken part in vocational training with higher level of productivity as compared to per hectare yields prevailing at district and in the state.
- Regarding horticulture crops the vocational training have been organised for crops like potato, onion, tomato, brinjal, chilly, bhindi and papaya with rate of participation of 72.84 percent, 34.57 percent, 54.32 percent, 41.98 percent, 35.80 percent, 22.22 percent and 1.23 percent to total of 81 responding families respectively which no doubt is a very bright picture indicating the desire of the farming community of our sample area to deviate from producing only traditional crops.

411
- As regards livestock and dairy, 12.35 percent households have participated in vocational training on improved feeding management. The response is encouraging as in case of other K.V.Ks. the participation for this subject is either nil or negligible.
- Regarding poultry 12.35 percent households have participated in the vocational training pertaining to breeding practices, improved caging system, improved feed management and vaccination of birds which are positive deviations from other K.V.Ks. where the response to this activity is, generally, nil.
- Response to home science activities is also encouraging part icularly for items like preparation of pickles and preparation of papad/bari/jam/jelly etc. wherein 96.30 percent and 55.56 percent households respectively have taken part in vocational training with substantial physical output.
- Organic farming is yet another field wherein 38.27 percent households have taken part in subject like preparation of bio-fertilizer with tangible physical result.
7.173 Vocational training has not been organised on subjects like fishery development, agro-forestry and watershed activities. The impact of vocational training over such activities will not be visible.
FRONT LINE DEMONSTRATION – AGRONOMY CEREALS 7.174 Front line demonstrations [FLD] are organized on farmer’s field with the result the response
is bound to be low as compared to vocational training. The table below shows the impact of front line demonstrations on cereal crops.
Table No. 7.56
Agronomy – Cereals Wheat Paddy Maize S.
No Name of The Village
No. of Respondents
BT AT No. of Respond
ents
BT AT No. of Responde
nts
BT AT
1 2 3 4 5 6 7 8 9 10 11 1 Khodari 2 1100 3800 0 0 0 0 0 0 2 Devlaha 10 1660 3200 0 0 0 0 0 0 3 Patnakalan 7 2100 3557 0 0 0 0 0 0
I Adopted Villages 19 0 0 0 0
4 Kanpur 4 2000 3300 0 0 0 0 0 0
5 Tangi 5 1680 3320 0 0 0 0 0 0
6 Degarhot 2 3050 3900 0 0 0 0 0 0
7 Umariha 2 2850 4000 0 0 0 1 1400 2600
8 Patni 3 2467 3533 0 0 0 0 0 0 9 Rahaniya 2 2900 3800 1 2000 3500 0 0 0
II Cluster Villages 18 1 1
Total All Villages 37 1 1 7.175 The front line demonstrations for the wheat crop have been organized on the fields of 37
cultivators which is 45.68 percent to total of 81 responding families. The per hectare yield in after training situation is much higher than before training conditions that ranged between 3200 kg. per hectare for the village Devlaha [adopted village] to 4000.00 kg per hectare for village Umariha [cluster village] far in excess of district average of 1305 kg and state average of 1867 kg. The positive impact of the efforts of K.V.K. is clearly visible.
7.176 Regarding paddy crop only one F.L.D. has been organised for village Rahaniya [cluster
village] with 3500 kg per hectare in after training situation which is much higher than district and state average productivities of 1000 kg and 1058 kg respectively.

412
7.177 Regarding Maize crop only one demonstration has been organised in village Umariha [cluster village] with per hectare yield of 2600 kg in after training situation which is not only higher than the productivity in before training situation but in excess of district and state average productivities of 1344 kg and 2072 kg per hectare respectively. However matching to vocational training, a few more F.L.Ds. should have been organised.
7.178 No F.L.Ds. have been organised for crop like Jowar which is usually grown by poor
cultivators. AGRONOMY - PULSES 7.179 The table below shows the details;
Table No. 7.57
Agronomy – Pulses Yield Per- Hectare - Kg.
Gram Arhar S. No
Name of The Village
No. of Respon-
dents BT AT
No. of Respon-
dents BT AT
1 Khodari 2 1500 2900 1 800 1200 2 Devlaha 2 1400 2200 2 750 1100 3 Patnakalan 1 1400 1800 1 900 1200
I Adopted Villages 5 4
4 Kanpur 0 0 0 1 1000 1100
5 Tangi 2 1100 2400 0 0 0
6 Degarhot 1 800 1500 1 700 1200
7 Umariha 2 1900 3600 0 0 0 8 Patni 1 700 1000 0 0 0 9 Rahaniya 1 700 1600 1 700 1400
II Cluster Villages 7 3
Total All Villages 12 7 7.180 Gram being one of the important crops of Satna district, 12 number of front line
demonstration [F.L.Ds.] have been organised which is 14.81 percent to total of 81 responding families with better performance in after training situation as compared to before training conditions. The per hectare yield in after training situation ranged between 1600 Kg for Patni [cluster village] to 3600 kg for Umariha [cluster village] which are higher than the district average productivity figure of 698 kg and state level figure of 932 kg.
7.181 Regarding Arhar crop only 7 number of F.L.Ds. have been organised resulting in crop
productivity which is higher in after training situation as compared to before training conditions and far in excess of average district and state level productivity per hectare accounting for 501 kg and 825 kg respectively.

413
FLD – AGRONOMY – OIL SEEDS 7.182 The table below shows the details;
Table No. 7.58
Agronomy – Oil Seeds - Mustard Yield Per- Hectare - Kg. Sl.
No. Name of the Village
No. of Respondents BT AT 1 Khodari 2 600 1300 2 Devlaha 0 0 0 3 Patnakalan 1 900 1408 I Adopted Villages 3
4 Kanpur 0 0 0 5 Tangi 0 0 0 6 Degarhot 1 700 1400
7 Umariha 1 900 1400 8 Patni 0 0 0 9 Rahaniya 2 600 1350 II Cluster Villages 4
Total All Villages 7 7.183 Mustard being one of the important crops of district Satna 7 number of F.L.Ds. have been
organised. The yield per hectare in after training situation is much higher than before training conditions that ranged between 1300 kg per hectare for village Khodari [adopted village] to 1408 kg per hectare for village Patnakalan [adopted village] higher than both district and state average productivity of 385 kg and 1009 kg respectively.
No FLDs have been organized for crops like soybean, cotton, sugarcane, linseed with the
result the crops will not be visible. FLD – HORTICULTURE 7.184 The table below shows the details;
Table No. 7.59
Horticulture Crops
Tomato Brinjal Chilli S. No
Name of The Village
No. of Respondents
BT AT No. of Respondents
BT AT No. of Responde
nts
BT AT
1 Khodari 3 0 180 2 0 311 1 0 160 2 Devlaha 10 0 196 0 0 0 0 0 0 3 Patnakalan 0 0 0 0 0 0 0 0 0
I Adopted Villages 13 2 1
4 Kanpur 0 0 0 0 0 0 0 0 0
5 Tangi 0 0 0 0 0 0 0 0 0
6 Degarhot 0 0 0 0 0 0 0 0 0
7 Umariha 0 0 0 0 0 0 0 0 0 8 Patni 0 0 0 0 0 0 0 0 0 9 Rahaniya 0 0 0 0 0 0 0 0 0
II Cluster Villages 0 0 0
Total All Villages 13 2 1

414
7.185 Tomato is one of the horticultural crops which is picking-up in Satna district as is evident from the fact that 13 number of F.L.Ds. have been organised, all in adopted villages with productivity in after training situation higher than before training situation, having range distribution of 180 kg per hectare in village Khodari to 196 kg per hectare for village Devlaha. A few F.L.Ds. should have also been organised in cluster villages as well.
7.186 Regarding Brinjal crop, 2 number of F.L.Ds. have been organised in adopted villages with
better performance in after training situations as compared to before training conditions. However, a few F.L.Ds. should have been organised for cluster villages as well for wider positive impact.
7.187 Regarding Chilly crop only 1 F.L.D. has been organised in adopted village Khodari with
yield rates higher in after training situation as compared to nil production in before tratining conditions.
7.188 No F.L.Ds. have been organised for crops like Potato, Onion, Bhindi, Cucerbits, Spices,
Mango, Banana, Papaya and Citrus crops. Potato and Onion being important crops from demand point of view, a few number of F.L.Ds. should have been organised. More over horticulture crops give income support to farming families with ready market that call for more training emphasis for these crops along with organisation of F.L.Ds.
F.L.D. – POULTRY 7.189 The table below shows the details;
Table No. 7.60 Poultry Development
Improved Breed Improved caging system
S. No
Name of The Village
No. of Respon-
dents BT AT
No. of Respon-
dents Yes No
1 Khodari 4 0 16 4 4 2 Devlaha 0 0 0 0 0 0 3 Patnakalan 4 4 4
I Adopted Villages 8 8
4 Kanpur 0 0 0 0 0 0
5 Tangi 0 0 0 0 0 0
6 Degarhot 0 0 0 0 0 0
7 Umariha 0 0 0 0 0 0 8 Patni 0 0 0 0 0 0 9 Rahaniya 0 0 0 0 0 0
II Cluster Villages 0 0 Total All Villages 8 8 8

415
Table No. 7.60 [Contd…] Poultry Development
Improved Feed Management Vaccination
S. No
Name of The Village
No. of Respon-
dents Yes No
No. of Respon-
dents Yes No
1 Khodari 0 0 0 0 0 0 2 Devlaha 0 0 0 0 0 0 3 Patnakalan 4 4 0 4 12 4
I Adopted Villages 4 4 0 4
4 Kanpur 0 0 0 0 0 0
5 Tangi 0 0 0 0 0 0
6 Degarhot 0 0 0 0 0 0 7 Umariha 0 0 0 0 0 0 8 Patni 0 0 0 0 0 0 9 Rahaniya 0 0 0 0 0 0
II Cluster Villages 0 0 0 0
Total All Villages 4 4 0 4 7.190 The above table shows that regarding improved breeding practices 8 number of F.L.Ds. have
been organised [all in adopted villages] with production of 32 number of improved breed species in after training situation.
7.191 Regarding improved caging practices 8 number of families have participated in the F.L.D.
that comes to 9.88 percent to total of 81 responding households. 7.192 Similarly for improved feed management four number of F.L.Ds. have been organised at
village Patnakalan [adopted village which is 4.94 percent to total number of 81 responding families.
Though performance over vaccination of birds is not impressive as only 4 number of
households [4.94 percent] have taken part in F.L.D. with vaccination of only 12 birds in after training situation but a beginning has been done that in due course of time will get momentum.
7.193 Since in all the ten identified villges the proportion of S.T. population is substantial
[please refer table no. 7.8] who have traditional knowledge abou the up-keep of poultry, a more coordinated efforts by K.V.K. may lead to better performance regarding poultry which will reflect upon enhanced income levels
7.194 Regarding subjects like livestock and dairying, fisheries development, agro-forestry,
organic farming and watershed activities no F.L.Ds. have been organised. All the above mentioned activities are important for any rural economy. Particularly the subjects like livestock, agro forestry and watershed activities are important from the view points of income augmentation and enhancement of agriculture production. F.L.Ds, therefore, should have been organised for such activities.
7.195 To sum-up - Front Line Demonstrations organised in our area of study have lead to enhancement in
productivity of most of agronomical and horticultural crops in after training situations as compared to before training situations which show the positive impact of K.V.Ks. efforts.

416
- In case of wheat 37 number of F.L.Ds. have been organised which is 45.68 percent to total of 81 responding families with yield per hectare far in excess of average productivity of district and state levels.
- Similarly for paddy and maize crops one F.L.D. each have been organised with higher yield rates as compared to district and state level averages.
- Gram being one of the important crops of Satna district 12 number of F.L.Ds. have been organised which is 14.81 percent to total of 81 number of responding families with higher productivity as compared to prevailing rates at both district and state levels.
- Similarly for Arhar crop 7 number of F.L.Ds. have been organised [8.64 percent] with per hectare yield for in excess of average district and state level productivity.
- Mustard being one of the important crops of district Satna 7 number of F.L.Ds. have been organised with yield per hectare higher than the average productivity prevailing at district and state levels.
- As regards horticulture crops like tomato, brinjal and chilly the number of F.L.Ds. organised are 13,2 and 1 respectively with better performance in after training conditions as compared to before training situations.
- Since in all the ten identified villages there is preponderence of tribal population, poultry activities are in ascendancy which requires both technical and financial support from the government.
- Since no F.L.Ds. have been organised on subjects like livestock and dairying, fisheries development, agro forestry, organic farming and watershed activities the impact of F.L.D. for these subjects will not be visible.
ON FARM TESTING [OFT] - CEREALS 7.196 In case of On Farm Testing, recommended new technologies are tested on farmer’s fields
leading to the solution of group of farming problems. The extent of response is bound to be low as the new technologies are always limited in numbers.
7.197 The table below shows the details;
Table No. 7.61 Cereal Crops
Yield Per- Hectare - Kg. Wheat Paddy
S. No.
Name of The Village
No. of Respondents
BT AT No. of Respondents
BT AT
1 Khodari 1 2200 3800 0 0 0
2 Devlaha 1 2200 3300 0 0 0 3 Patnakalan 2 1000 3900 0 0 0
I Adopted Village 4 0
4 Kanpur 1 2000 3400 0 0 0 5 Tangi 1 2200 3400 0 0 0 6 Degarhot 1 3100 4000 0 0 0 7 Umariha 0 0 0 0 0 0 8 Patni 1 2400 4008 0 0 0 9 Rahaniya 1 3000 4009 1 2000 3800
II Cluster Village 5 1
Total All Villages 9 1

417
7.198 In case of Wheat, 8 number of on farm testing activities have been organised with substantial yield per hectare in after training situation that ranged between 3300 kg per hectare for village Devlaha to 4009 kg per-hectare for village Rahaniya which are much higher than the district average per hectare productivity of 1305 kg and state average figure of 1867 kg.
7.199 Regarding paddy crop only one O.F.T. has been organised in village Rahaniya [cluster
village] with yield rates higher in after training situation as compared to prevailing district level average productivity of 1000 Kg and state level average productivity of 1058 Kg.
7.200 In non other cereal crops like Maize and Jowar the O.F.Ts. have been organised. ON FARM TESTING – PULSES CROP 7.201 The table below shows the details;
Table No. 7.62 Pulses Crop
Yield Per- Hectare - Kg. Gram Arhar
S. No
Name of The Village
No. of Respon-
dents BT AT
No. of Respon-
dents BT AT
1 Khodari 0 0 0 0 0 0 2 Devlaha 0 0 0 0 0 0 3 Patnakalan 0 0 0 0 0 0
I Adopted Villages 0 0
4 Kanpur 0 0 0 0 0 0
5 Tangi 0 0 0 0 0 0
6 Degarhot 1 800 1500 1 700 1200
7 Umariha 0 0 0 0 0 0 8 Patni 0 0 0 0 0 0 9 Rahaniya 1 700 1600 0 0 0
II Cluster Villages 2 1 Total All Villages 2 1
7.202 Gram being one of the important crops of Satna district, 2 O.F.Ts. have been organised [all
in cluster villages] with productivity ranging between 1500 kg per hectare for village Degarhot to 1600 kg for village Rahaniya in after training situations which are higher than before training conditions and far in excess of district average productivity of 698 kg per hectare and state average productivity of 932 kg per hectare.
7.203 Similarly, for Arhar crop one number of O.F.T. has been organised in village Degarhat with
yields per hectare in after training situations which are far in excess of district level and state level per hectare yields of 501 kg and 825 kg respectively.
ON FARM TESTING – OIL SEED CROP 7.204 The table below shows the details;

418
Table No. 7.63 Oil Seed Crop - Mustard
Yield Per- Hectare - Kg. Sl. No.
Name of the Village No. of Respondents BT AT
1 Khodari 1 700 1400 2 Devlaha 0 0 0 3 Patnakalan 1 900 1400 I Adopted Villages 2
4 Kanpur 0 0 0 5 Tangi 0 0 0
6 Degarhot 1 700 1400
7 Umariha 0 0 0 8 Patni 0 0 0 9 Rahaniya 0 0 0 II Cluster Villages 1
Total All Villages 3
7.205 Mustard being one of the important crops of Satna district, 3 number of O.F.Ts. have been organised with much higher yield rates in after training situations as compared to district and state level per hectare yields of 385 kg and 1009 kg respectively.
7.206 No O.F.T. has been organised for crops like maize, lentil, jowar, soybean, cotton, sugarcane
and linseed which are not important crops of Satna district. 7.207 Surprisingly, no O.F.T. has been organised for any of the horticulture crops which
obviously is a gap in performance. The O.F.Ts. should have been organised for crops like Potato, Onion, Tomato and Brinjal for which there is good response in vocational training courses. Besides, horticultural crops are good source of income which are gradually becoming popular in Satna district. The measures of O.F.Ts. would have boosted-up the productivity levels of such crops along with enhancement in family income.
7.208 No. O.F.Ts. have been organised for subjects like livestock and dairying, fishery
development, agro-forestry, organic farming and watershed activities. A few O.F.Ts. should have been organised for livestock and dairying, agro forestry and watershed activities which have scope in our sample area of study.
7.209 In the following paragraphs summing-up efforts have been made for the results of
O.F.T. - In case of O.F.T., the yield per-hectare in after training situation is more than before
training conditions as has occurred for both vocational training and front line demonstrations which shows the positive impact of K.V.Ks. efforts.
- No O.F.T. has been organised for any of the horticulture crops which certainly shows the deficiency in performance. A few O.F.Ts. must have been organised for horticulture crops like potato, onion and and tomato etc. which are common items of consumption.
- Since no O.F.Ts. have been organised on subjects like livestock and dairying, poultry, fishery development, agro-forestry, organic farming and watershed activities, the impact of O.F.T. relating to such subjects is obviously not visible.

419
STATUS OF ACTIVITIES IN CONTROL VILLAGE – BHARGAWAN 7.210 The study has identified one control village i.e. Bhargawan with 8 number of sample
households and 45 sample family members where there is no interventions of K.V.K. The information regarding common items of agronomical and horticulture crops have been collected to show the comparative status in areas of intervention and non- intervention. However, in case of control village before and after training situations have not been shown as there is no effort of K.V.K. in this village. For comparison the average performance of vocational training in after training situation has been taken as the participation regarding all subjects is maximum in case of vocational training. The table below shows the comparative status of control village on one side and adopted and cluster villages on other side.
Table No. 7.64 Comparative Status of Performance Among Control Village and Adopted and Cluster Villages
Sl. No.
Item Control Village Adopted and cluster villages (average)
Difference [+ or -] over col. 3
1 2 3 4 5 PER HECTARE YIELD – KG
CEREALS 1 Wheat 3175.00 3379.56 (+) 204.56 2 Paddy 2443.00 3088.50 (+) 645.50 3 Maize 1600.00 1809.00 (+) 209.00 4 Jowar 500.00 - - PULSES 5 Gram 3100.00 3128.44 (+) 28.44 6 Arhar 1250.00 1130.11 (-) 119.89 7 Lentil 1600.00 - - OIL SEEDS 8 Mustard 780.00 1058.67 (+)278.67
HORTICULTURE CROPS – QUINTAL 9 Potato 187.00 212.56 (+) 25.56 10 Onion 158.00 241.20 (+) 83.20 11 Tomato 100.00 184.88 (+) 84.88 12 Brinjal 150.00 196.75 (+) 46.75 13 Chilly 80.00 168.75 (+) 88.75 14 Bhindi 75.00 189.60 (+) 114.60 15 Cucerbits 40.00 - - 16 Papaya 50.00 - -
7.211 Except for the Arhar crop where per hectare yield in control village is more than adopted
and cluster villages, for rest of the crops the per hectare yield in adopted and cluster villages is more than control village that shows the positive impact of K.V.Ks. efforts.
7.212 In the field of home science activities particularly for activities like preparation of
pickles and papad/badi/jam/jelly etc. substantial work has been done in adopted and cluster villages through the intervention of K.V.K. whereas such activities are very marginal in control village. These activities are important both form income augmentation and employment point of views.
RESULTS OF SURVEY – INDIVIDUAL PARTICULARS ADOPTED AND CLUSTER VILLAGES 7.213 In the following paragraphs an attempt has been made to highlight the various reactions of
25 percent of individuals taken from the sample family members. The table below shows the details;

420
Table No. 7.65 Basic Details
Sl. No.
Item Total number of family members of 25% of households
25 % of individuals taken from 25% of households
1 2 3 4 1 Adopted Villages 183 45 2 Cluster Villages 282 68 3 Control Village 45 11 Total 510 124
7.214 Though the 25 percent of 510 comes to 127 but we have taken figures of 124 because of
certain demographic particulars. However, a few figures plus or minus is hardly meaningful so long it does not vitiate the survey results.
7.215 In the following paragraphs an attempt has been made to highlight the individual reactions
in adopted and cluster villages i.e. for 113 individuals. 7.216 The criteria for selection of individuals are as follows; - The individual should be the adult member of the family. - He should be associated with any programme of K.V.K. For individuals of control village,
this criterion is not applicable. - He/She should be literate, may be without having any formal education. SOCIAL CLASSIFICATION OF INDIVIDUALS 7.217 The table below shows the details;
Table No. 7.66
Social Classification Social classification S.
No. Name of the Village No. of
Individual S.T. S.C. O.B.C. GENERAL 1 2 3 4 5 6 7 1. Khodari 7 4 2 0 1 2. Devlaha 14 11 0 3 0 3. Patnakalan 24 8 8 8 0 Adopted Villages 45 23 10 11 1
4. Kanpur 16 8 8 0 0 5. Tangi 7 7 0 0 0 6. Degarhot 10 6 0 3 1 7. Umariha 9 8 0 0 1 8. Patni 16 2 12 2 0 9. Rahaniya 10 8 0 0 2 Cluster Villages 68 39 20 5 4
Total All Villages 113 62 30 16 5 7.218 The above table shows that the majority of 62 individuals are from S.T. community that
accounts for 54.87 percent to total of 113 individuals from adopted and cluster villages. The combined percentage of S.C. and O.B.C. communities is 40.71 while the members from general communities constitute 4.42 percent to total individuals. Thus the entire area of adopted and cluster villages is predominated by scheduled tribe population that throws a challenge to K.V.K. Scientists to achieve tangible results for bringing this vulnerable community to main streatm of development.

421
INDIVIDUALS CLASSIFIED ON THE BASIS OF RELIGION 7.219 The following table gives the details;
Table No. 7.67
Classification on the Basis of Religion Religion S.
No. Name of the Village No. of
Individual Hindu Muslim Sikh Christian Nauabudh Others 1 2 3 4 5 6 7 8 9 1. Khodari 7 7 0 0 0 0 0 2. Devlaha 14 14 0 0 0 0 0 3. Patnakalan 24 24 0 0 0 0 0 Adopted Villages 45 45 0 0 0 0 0
4. Kanpur 16 16 0 0 0 0 0 5. Tangi 7 7 0 0 0 0 0 6. Degarhot 10 10 0 0 0 0 0 7. Umariha 9 9 0 0 0 0 0 8. Patni 16 16 0 0 0 0 0 9. Rahaniya 10 10 0 0 0 0 0 Cluster Villages 68 68 0 0 0 0 0
Total 113 113 0 0 0 0 0 7.220 The above table shows that cent-percent individuals are the followers of Hindu religion. AWARENESS ABOUT THE K.V.K. 7.221 The table below shows the details;
Table No. 7.68 Awareness About the K.V.K.
Awareness about existence of
K.V.K.
If 'yes' knowledge about its location
Awareness about services rendered
by the K.V.K.
S. No
Name of the Village No. of Individual
Yes No
Yes
No
Yes
No
1 2 3 4 5 6 7 8 9 1. Khodari 7 7 0 7 0 7 0 2. Devlaha 14 14 0 14 0 14 0 3. Patnakalan 24 24 0 24 0 24 0 Adopted Villages 45 45 0 45 0 45 0
4. Kanpur 16 16 0 16 0 16 0 5. Tangi 7 7 0 7 0 7 0 6. Degarhot 10 10 0 10 0 10 0 7. Umariha 9 9 0 9 0 9 0 8. Patni 16 16 0 16 0 16 0 9. Rahaniya 10 10 0 10 0 10 0 Cluster Villages 68 68 0 68 0 68 0
Total All Villages 113 113 0 113 0 113 0
7.222 The cent percent awareness about K.V.K. in terms of its location and more importantly the services rendered by it is undoubtedly an encouraging indiction that indicats the fruitful efforts of K.V.K. scientists in their stride to populerise the functions of K.V.K.
KNOWLEDGE ABOUT SPECIFIC SERVICES RENDERED BY K.V.K. 7.223 The table below shows the details;

422
Table No. 7.69 Knowledge about Specific Services Rendered by the K.V.K.
Knowledge about vocational
training
Knowledge about front line
demonstration
Knowledge about on farm
testing
S. No
Name of the Village No. of Individual
Yes No Yes No Yes No 1 2 3 4 5 6 7 8 9 1. Khodari 7 7 0 7 0 7 0 2. Devlaha 14 14 0 14 0 14 0 3. Patnakalan 24 24 0 24 0 24 0 Adopted Villages 45 45 0 45 0 45 0
4. Kanpur 16 16 0 14 2 8 8 5. Tangi 7 7 0 7 0 7 0 6. Degarhot 10 10 0 10 0 10 0 7. Umariha 9 9 0 9 0 9 0 8. Patni 16 16 0 16 0 16 0 9. Rahaniya 10 10 0 10 0 10 0 Cluster Villages 68 68 0 66 2 60 8
Total All Villages 113 113 0 111 2 105 8 7.224 Regarding Vocational Training the cent percent awareness of the individuals from adopted
and cluster villages seems obvious as participation of households in such training programmes is maximum.
7.225 Knowledge of 111 individuals [98.23 percent] about F.L.D. is encouraging that shows
impact of the positive efforts of K.V.K. Scientists. 7.226 Similarly awareness of the 105 individuals [92.92 percent] about O.F.T. is, somewhat,
encouraging. FIELD VISITS OF K.V.K. SCIENTISTS 7.227 Regular field visits by the K.V.K. scientists are necessary pre-requisites for implematation
of agriculture related technology and also to keep alive the confidence level of the farming community. The table below shows the extent of such visits.
Table No. 7.70
Field Visits of K.V.K. Scientists The duration gap S.
No Name of the Village No. of
Individual One month (1)
Two months
(2)
More than two months
(3)
Never (4)
1 2 3 4 5 6 7 1. Khodari 7 0 0 0 6 2. Devlaha 14 0 0 0 14 3. Patnakalan 24 0 0 0 24 Adopted Villages 45 0 0 0 44
4. Kanpur 16 0 0 7 9 5. Tangi 7 0 0 0 7 6. Degarhot 10 0 0 0 10 7. Umariha 9 1 0 0 8 8. Patni 16 0 0 0 16 9. Rahaniya 10 0 0 0 10 Cluster Villages 68 1 0 7 60
Total All Villages 113 1 0 7 104

423
7.228 Out of total of 113 individuals 112 individuals [99.12 percent] have informed about irregular visits of K.V.K. scientists which seems rather an inflated information, which is contradicted by the fact of cent-percent awareness level of the farmers about services rendered by the K.V.K. The high degree of absence of K.V.K. scientists would have not lead to such type of positive results. May be the individuals might have vented out their regrets caused due to some other factors by informing about irregular visits by K.V.K. scientists. Even if half the information is taken to be correct, the picture remains to be grim. At least a fortnightly visit by K.V.K. scientists is necessary to keep-up the confidence level of the farmers. The authorities of K.V.K., Satna may sort out this issue to avoid such regrets from farming communities for whom they work.
THE STATUS OF REGULAR CONTACT WITH K.V.K. 7.229 The regular contact of the farmes with the K.V.K. is one of the determining factors for
implementation of agriculture related technologies in the field. The table below shows the details;
Table No. 7.71 Status of Regular Contact with K.V.K.
Are you regular touch
with KVK
If yes reason if 'no' the reason S. No
Name of the Village No. of Indivi-dual
Yes (1)
No (2)
for seed (1)
plant protection
(2)
New technology
(3)
Distance
1 2 3 4 5 6 7 8 9 1. Khodari 7 7 0 1 0 5 0 2. Devlaha 14 14 0 0 1 13 0 3. Patnakalan 24 23 1 0 1 23 0 Adopted Villages 45 44 1 1 2 41 0
4. Kanpur 16 16 0 3 3 10 0 5. Tangi 7 7 0 0 0 7 0 6. Degarhot 10 10 0 0 0 10 0 7. Umariha 9 8 1 0 1 8 2 8. Patni 16 16 0 0 0 16 0 9. Rahaniya 10 10 0 2 2 6 0 Cluster Villages 68 67 1 5 6 57 2
Total All Villages 113 111 2 6 8 98 2 7.230 Out of total of 113 individuals, 111 individuals [98.23 percent] are in regular contact with
K.V.K. mainly because of the desire for adopting new technology [86.73 percent individuals] and for plant protection [7.08 percent individuals]. A total number of 2 individuals are not in regular contact with K.V.K. which is 1.77 percent to total individuals. The main reason is the distance factor due to which such individuals can not keep a regular contact.
STATUS OF IMPLEMENTATION OF THE SERVICES OF THE K.V.K. 7.231 The table below shows the details;

424
Table No. 7.72 Implementation of the Services of K.V.K.
Implementation of the services of
K.V.K.
If yes in what fields S No
Name of the Village
No. of Indivi-
dual Yes (1)
No (2)
Agronomy Horticu-lture
Animal husbandry
Fisheries Poultry
1 2 3 4 5 6 7 8 9 10 1. Khodari 7 7 0 7 0 0 0 0 2. Devlaha 14 14 0 12 0 0 0 0 3. Patnakalan 24 24 0 24 0 0 0 0 Adopted Villages 45 45 0 43 0 0 0 0
4. Kanpur 16 16 0 16 0 0 0 0 5. Tangi 7 7 0 7 0 0 0 0 6. Degarhot 10 10 0 10 0 0 0 0 7. Umariha 9 9 0 9 0 0 0 0 8. Patni 16 16 0 16 0 0 0 0 9. Rahaniya 10 8 2 10 0 0 0 0 Cluster Villages 68 66 2 68 0 0 0 0
Total All Villages 113 111 2 111 0 0 0 0
Table No. 7.72 [Contd…] Implementation of the Services of K.V.K
If yes in what fields If no the reason S. No.
Name of the Village Home
science Agro
forestry Organic farming
Water shed
Training of rural youth
Not satisfied with new
technology
Problem of
resources
Satisfied with present
status 1 2 11 12 13 14 15 16 17 18
1. Khodari 7 0 0 0 0 0 0 0 2. Devlaha 14 0 0 0 0 0 0 0 3. Patnakalan 22 0 0 0 0 0 0 0 Adopted Villages 43 0 0 0 0 0 0 0
4. Kanpur 16 0 0 0 0 0 0 0 5. Tangi 7 0 0 0 0 0 2 0 6. Degarhot 10 0 0 0 0 0 0 0 7. Umariha 9 0 0 0 0 0 0 0 8. Patni 15 0 0 0 0 0 0 0 9. Rahaniya 10 0 0 0 0 0 0 0 Cluster Villages 67 0 0 0 0 0 2 0
Total All Villages 110 0 0 0 0 0 2 0 7.232 The above table shows that out of 113 individuals, 111 individuals have implemented the
services of K.V.K. which is 98.23 percent to total respondents. This is an achievement by itself. It is worth mentioning here that the figures of itemwise coverage will not tally with the figure of 111 as the same person from agronomy might have implemented the improved techniques in the fields of horticulture, animal husbandry, home science etc.
7.233 The subject wise coverage figures show that the highest number of 111 individuals [98.23
percent to total individuals] have implemented the improved techniques relating to agronomy followed by 110 individuals [97.35 percent] implementing the improved techniques relating to home science. In rest of the subjects like horticulture, animal husbandry, fishery, poultry, agro-forestry, organic farming, watershed activities and training of rural youth no implementation efforts have been done by the sample individuals as for these activities even vocational trainings have hardly been organised. Intensive efforts are required in the fields like animal husbandry, agro -forestry and watershed activities as these fields have extensive scope for employment and income generation.
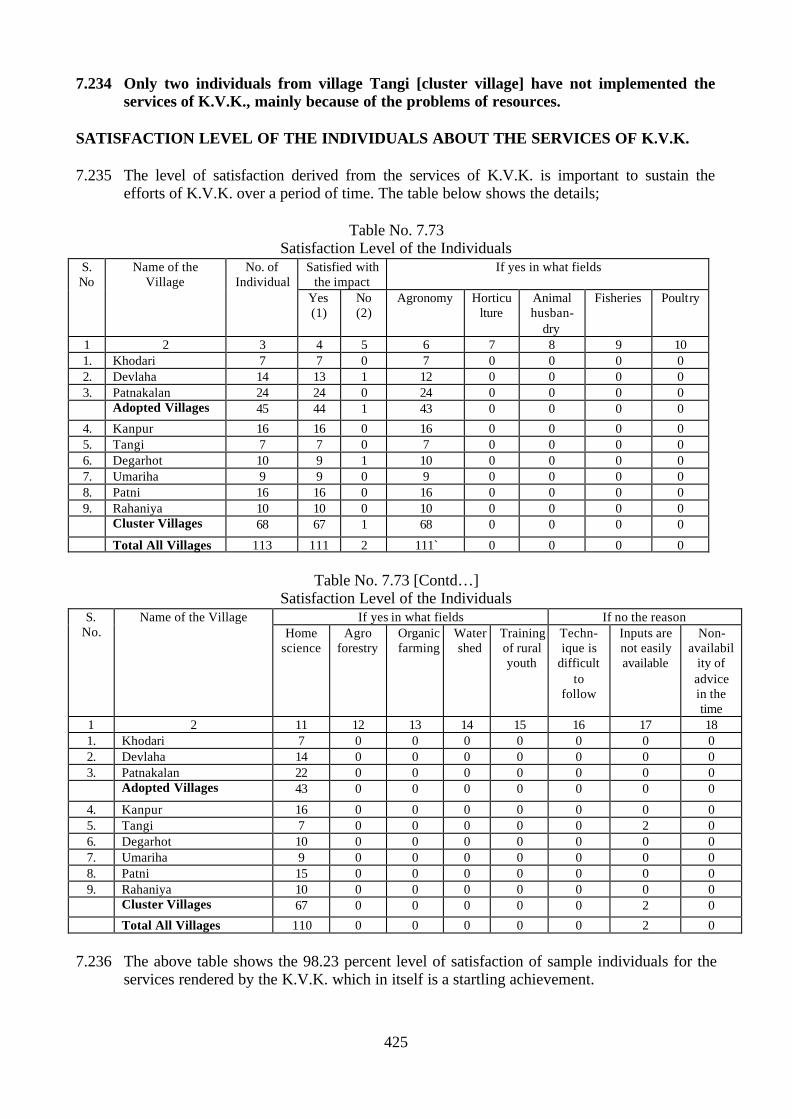
425
7.234 Only two individuals from village Tangi [cluster village] have not implemented the services of K.V.K., mainly because of the problems of resources.
SATISFACTION LEVEL OF THE INDIVIDUALS ABOUT THE SERVICES OF K.V.K. 7.235 The level of satisfaction derived from the services of K.V.K. is important to sustain the
efforts of K.V.K. over a period of time. The table below shows the details;
Table No. 7.73 Satisfaction Level of the Individuals
Satisfied with the impact
If yes in what fields S. No
Name of the Village
No. of Individual
Yes (1)
No (2)
Agronomy Horticulture
Animal husban-
dry
Fisheries Poultry
1 2 3 4 5 6 7 8 9 10 1. Khodari 7 7 0 7 0 0 0 0 2. Devlaha 14 13 1 12 0 0 0 0 3. Patnakalan 24 24 0 24 0 0 0 0 Adopted Villages 45 44 1 43 0 0 0 0
4. Kanpur 16 16 0 16 0 0 0 0 5. Tangi 7 7 0 7 0 0 0 0 6. Degarhot 10 9 1 10 0 0 0 0 7. Umariha 9 9 0 9 0 0 0 0 8. Patni 16 16 0 16 0 0 0 0 9. Rahaniya 10 10 0 10 0 0 0 0 Cluster Villages 68 67 1 68 0 0 0 0
Total All Villages 113 111 2 111` 0 0 0 0
Table No. 7.73 [Contd…] Satisfaction Level of the Individuals
If yes in what fields If no the reason S. No.
Name of the Village Home
science Agro
forestry Organic farming
Water shed
Training of rural youth
Techn-ique is
difficult to
follow
Inputs are not easily available
Non-availabil
ity of advice in the time
1 2 11 12 13 14 15 16 17 18 1. Khodari 7 0 0 0 0 0 0 0 2. Devlaha 14 0 0 0 0 0 0 0 3. Patnakalan 22 0 0 0 0 0 0 0 Adopted Villages 43 0 0 0 0 0 0 0
4. Kanpur 16 0 0 0 0 0 0 0 5. Tangi 7 0 0 0 0 0 2 0 6. Degarhot 10 0 0 0 0 0 0 0 7. Umariha 9 0 0 0 0 0 0 0 8. Patni 15 0 0 0 0 0 0 0 9. Rahaniya 10 0 0 0 0 0 0 0 Cluster Villages 67 0 0 0 0 0 2 0
Total All Villages 110 0 0 0 0 0 2 0
7.236 The above table shows the 98.23 percent level of satisfaction of sample individuals for the services rendered by the K.V.K. which in itself is a startling achievement.

426
7.237 Agronomy and Home Science are the subjects for which satisfaction level is substantial. In subjects like horticulture, animal husbandry, fishery, poultry, organic farming, watershed activities and training of rural youth the satisfaction level is nil because of the basic fact that for these subjects no substantial number of vocational training has been initiated nor much of the FLDs or OFTs have been organised. Moreover, the cultivators of our sample area are not much interested in these activities, as they do not contribute substantially to their family income. However, efforts must be made to popularize the activities like animal husbandry, agro-forestry and watershed activities, as these subjects are important for rural economy.
IMPACT ON INCOME ENHANCEMENT 7.238 The validity of any effort is ultimately measured by its impact over income enhancement
whether directly or indirectly. The table below shows the details;
Table No. 7.74 Impact on Income Enhancement
Income enhancement
If yes the fields S. No.
Name of the Village No. of Individ
-ual Yes (1)
No (2)
Agronomy Horticu-lture
Animal husbandry
Fisheries Poultry
1 2 3 4 5 6 7 8 9 10 1. Khodari 7 7 0 11 0 0 0 0 2. Devlaha 14 14 0 14 0 0 0 0 3. Patnakalan 24 23 1 21 0 0 0 1 Adopted Villages 45 44 1 46 0 0 0 1
4. Kanpur 16 16 0 16 0 0 0 0 5. Tangi 7 7 0 7 0 0 0 0 6. Degarhot 10 10 0 8 0 0 0 0 7. Umariha 9 9 0 9 0 0 0 0 8. Patni 16 16 0 16 0 0 0 0 9. Rahaniya 10 10 0 10 0 0 0 0 Cluster Villages 68 68 0 66 0 0 0 0
Total All Villages 113 112 1 112 0 0 0 1
Table No. 7.74 [Contd…] Impact on Income Enhancement
If no the reasons S. No.
Name of the Village Home
science Agro
forestry Organic farming
Water shed
Training of rural youth
Could not follow the instruction
Problem of
resourse
Non- availability technical advice in
time 1 2 11 12 13 14 15 16 17 18
1. Khodari 7 0 0 0 0 0 0 0 2. Devlaha 14 0 0 0 0 0 0 0 3. Patnakalan 23 0 0 0 0 0 0 0 Adopted Villages 44 0 0 0 0 0 0 0
4. Kanpur 16 0 0 0 0 0 0 0 5. Tangi 7 0 0 0 0 0 0 0 6. Degarhot 10 0 0 0 0 0 0 0 7. Umariha 9 0 0 0 0 0 0 0 8. Patni 15 0 0 0 0 0 0 0 9. Rahaniya 10 0 0 0 0 0 0 1 Cluster Villages 67 0 0 0 0 0 0 1
Total All Villages 111 0 0 0 0 0 0 1

427
7.239 From the aove table 99.12 percent positive response regarding impact of K.V.K. services
over income enhancement is visualized which is creditable to the efforts of the K.V.K. in various fields of its operation.
7.240 As is expected, maximum number of 112 individuals i.e. 99.12 percent to total of 113
individuals have expressed the positive impact on income enhancement through practice of agronomy followed by home science [111 individuals].
EXTENT OF INCOME ENHANCEMENT 7.241 Assessment of income level of individuals is one of the most difficult aspects of primary
data collection as the persons are usually shy of giving the correct information. However, through indirect approach, information regarding income has been collected which is given in the following table;
Table No. 7.75
Extent of Income Enhancement Percentage increase in Income S.
No Name of the Village
1to 10%
11 to
20%
21 to
30%
31 to
50%
51 to 60%
61 to
70%
71 to
80%
81 to
90%
91 to 100%
1 2 3 4 5 6 7 8 9 10 11 1. Khodari 0 0 7 0 0 0 0 0 0 2. Devlaha 0 1 13 0 0 0 0 0 0 3. Patnakalan 0 2 15 7 0 0 0 0 0 Adopted Villages 0 3 35 7 0 0 0 0 0
4. Kanpur 8 0 8 0 0 0 0 0 0 5. Tangi 0 0 7 0 0 0 0 0 0 6. Degarhot 0 2 8 0 0 0 0 0 0 7. Umariha 0 1 8 0 0 0 0 0 0 8. Patni 0 10 4 2 0 0 0 0 0 9. Rahaniya 0 2 8 0 0 0 0 0 0 Cluster Villages 8 15 43 2 0 0 0 0 0
Total All Villages 8 18 78 9 0 0 0 0 0
7.242 The above table shows that out of 113 individuals, 96 individuals [84.96 percent to total individuals] have reported about 11 to 30 percent enhancement in income due to the impact of various services of K.V.K. while 9 individuals [7.96 percent] reported about 31 to 50 percent income enhancement. The impact of the K.V.Ks. efforts over income enhancement is, somewhat, stratling.

428
OPINION ABOUT CONTINUANCE OF THE SERVICES OF K.V.K. 7.243 The table below shows the details;
Table No. 7.76 Opinion about Continuance of K.V.K. Services
Continuation of the services of K.V.K. S. No.
Name of the Village No. of Individual Yes
(1) No (2)
1 2 3 4 5 1. Khodari 7 7 0 2. Devlaha 14 14 0 3. Patnakalan 24 23 1 Adopted Villages 45 44 1
4. Kanpur 16 16 0 5. Tangi 7 5 2 6. Degarhot 10 10 0 7. Umariha 9 9 0 8. Patni 16 16 0 9. Rahaniya 10 10 0 Cluster Villages 68 66 2
Total All Villages 113 110 3 7.244 The above table shows that out of 113 individuals, 110 individuals [97.35 percent to total
individuals] have reported for continuance of the services by K.V.K. particularly for subjects like home science and agronomy. Only 3 number of individuals have given negetive opinion which seems natural in the context of large number of respondents. Viewing things from the positive angle, the performance of the K.V.K. seems laudable, as the efforts have won the confidence of the farming community of our area of study.
SUGGESTIONS FOR ADDITIONAL SERVICES TO BE RENDERED BY THE K.V.K. 7.245 Information regarding suggestions for additional services to be rendered by the K.V.K. has
been collected from the individuals. The table below shows the details;
Table No. 7.77 Suggestions for Additional Services to be Rendered by K.V.K.
Suggestions for additional services by KVK S. No.
Name of the Village
No. of Individual Production of
by product Marketing strategy
Weather forecasting
Availability of agri. inputs at panchayat level
1 2 3 4 5 6 7 1. Khodari 7 6 0 0 1 2. Devlaha 14 7 1 0 6 3. Patnakalan 24 10 7 7 0 Adopted Villages 45 23 8 7 7
4. Kanpur 16 3 3 0 10 5. Tangi 7 4 1 0 2 6. Degarhot 10 6 0 0 4 7. Umariha 9 1 6 2 0 8. Patni 16 2 1 6 7 9. Rahaniya 10 9 0 0 1 Cluster Villages 68 25 11 8 24
Total All Villages 113 48 19 15 31

429
7.246 Cent percent individuals have given their useful suggestions about introduction of additional services to be rendered by the K.V.K. Important among these are regarding suggestions about production of by-product of crops, development of marketing strategy for fair return of the product and making available agricultural inputs at Gram Panchayat Level wherein 48, 19 and 31 individuals respectively have given their useful suggestions.
7.247 Regarding produc tion of by-product, that may lead to some processing activities, the work
may be initiated in liaison with Industries Department of the district. 7.248 Marketing of agriculture produce is gaining importance to avoid the exploitation of farmers
by brokers. The intervention of K.V.K. personnel will be very useful if some sort of training is organised for beneficiary cultivators in liaison with Mandi Committees.
7.249 Regarding availability of agriculture inputs at Gram Panchayat level, the K.V.K Scientists
may bring home the solution in consultation with the Chief Executive Officer of Zila Panchayat by developing modalities for making available things at Gram Panchayat level.
7.250 It is, therefore, worth considering to incorporte in the mandate of K.V.K. the subjects
like production of by-products and development of marketing strategy of the product of the cultivators.
UTILIZATION OF THE ENHANCED INCOME 7.251 Proper utilization of enhanced income is equally important as compared to its generation.
The table below shows the utilization of enhanced income of sample individuals for purchase of various agriculture inputs;
Table No. 7.78
Utilization of Enhanced Income Enhanced income led to purchase of
Tractor Harvester Thresher S. No.
Name of the Village No. of Individual
Yes (1)
No (2)
Yes (1)
No (2)
Yes (1)
No (2)
1 2 3 4 5 6 7 8 9 1. Khodari 7 0 7 0 7 0 7 2. Devlaha 14 0 14 0 14 0 14 3. Patnakalan 24 0 24 0 24 0 24 Adopted Villages 45 0 45 0 45 0 45
4. Kanpur 16 0 16 0 16 0 16 5. Tangi 7 0 7 0 7 0 7 6. Degarhot 10 0 10 0 10 0 10 7. Umariha 9 0 9 0 9 0 9 8. Patni 16 0 16 0 16 0 16 9. Rahaniya 10 0 10 0 10 0 10 Cluster Villages 68 0 68 0 68 0 68
Total All Villages 113 0 113 0 113 0 113

430
Table No. 7.78 [Contd…] Utilization of Enhanced Income
Plough Seed drill Bullock pair
S. No.
Name of the Village No. of Individual
Yes (1)
No (2)
Yes (1)
No (2)
Yes (1)
No (2)
1 2 3 10 11 12 13 14 15 1. Khodari 7 0 7 0 7 2 5 2. Devlaha 14 0 14 0 14 0 14 3. Patnakalan 24 13 11 0 24 4 20 Adopted Villages 45 13 32 0 45 6 39
4. Kanpur 16 0 16 0 16 0 16 5. Tangi 7 0 7 0 7 0 7 6. Degarhot 10 0 10 0 10 0 10 7. Umariha 9 4 5 0 9 1 8 8. Patni 16 12 4 0 16 2 14 9. Rahaniya 10 0 10 0 10 1 9 Cluster Villages 68 16 52 0 68 4 64
Total All Villages 113 29 84 0 113 10 103
Table No. 7.78 [Contd…] Utilization of Enhanced Income
Power/Knapsa
c sprayer Handhoe Storage
facility
S. No.
Name of the Village No. of Individual
Yes (1)
No (2)
Yes (1)
No (2)
Yes (1)
No (2)
1 2 3 16 17 18 19 20 21 1. Khodari 7 0 7 0 7 0 7 2. Devlaha 14 0 14 0 14 0 14 3. Patnakalan 24 0 24 0 24 0 24 Adopted Villages 45 0 45 0 45 0 45
4. Kanpur 16 1 15 0 16 0 16 5. Tangi 7 0 7 0 7 0 7 6. Degarhot 10 1 9 0 10 0 10 7. Umariha 9 0 9 0 9 0 9 8. Patni 16 0 16 0 16 0 16 9. Rahaniya 10 0 10 0 10 0 10 Cluster Villages 68 2 66 0 68 0 68
Total All Villages 113 2 111 0 113 0 113

431
Table No. 7.78 [Contd…] Utilization of Enhanced Income
Tube well /Dug well Electric/diesel motor Yes (1) No (2) Yes (1) No (2)
S. No.
Name of the Village No. of Individual
22 23 24 25 1. Khodari 7 0 7 0 7 2. Devlaha 14 0 14 0 14 3. Patnakalan 24 0 24 0 24 Adopted Villages 45 0 45 0 45
4. Kanpur 16 0 16 0 16 5. Tangi 7 0 7 0 7 6. Degarhot 10 0 10 0 10 7. Umariha 9 0 9 0 9 8. Patni 16 0 16 0 16 9. Rahaniya 10 0 10 0 10 Cluster Villages 68 0 68 0 68
Total All Villages 113 0 113 0 113 7.252 The above table shows that 41 individuals have utilized their enhanced income for
purchase of various agriculture inputs which constitutes 36.28 percent to total number of 113 sample individuals. The purchases are mainly limited on items like plough, bullock pair and power knapsac sprayer. The utilization level of enhanced income for purchase of agriculture input is not much impressive.
IMPACT OF ENHANCED INCOME OVER EDUCATION LEVELS 7.253 The table below shows the impact of enhanced income over levels of education in our area
of study; Table No. 7.79
Impact of Enhanced Income Over Levels of Education Impact on education
due to enhanced
income
If yes in what manner S. No.
Name of the Village No. of Individual
Yes (1)
No (2)
More Male
Children go to
primary/middle
(1)
More Female Children
go to primary/middle
(2)
More male children attend
secondary level
education (3)
More female
children attend
secondary level
education (4)
Male Female children go for higher
education non (5)
1 2 3 4 5 6 7 8 9 10 1. Khodari 7 6 1 6 0 0 0 0 2. Devlaha 14 9 5 11 1 0 0 0 3. Patnakalan 24 19 5 10 8 0 0 0 Adopted Villages 45 34 11 27 9 0 0 0
4. Kanpur 16 10 6 9 1 0 0 0 5. Tangi 7 6 1 6 0 0 0 0 6. Degarhot 10 9 1 9 0 0 0 0 7. Umariha 9 9 0 7 2 0 0 0 8. Patni 16 11 5 4 5 0 0 0 9. Rahaniya 10 8 2 4 4 0 0 0 Cluster Villages 68 53 15 39 12 0 0 0
Total All Villages 113 87 26 66 21 0 0 0

432
Table No. 7.79 [Contd…] Impact of Enhanced Income Over Levels of Education
If no the reasons S. No
Name of the Village No. of Individual Educa-
tion is no
priority (1)
Purchase of agr. inputs
(2)
Exp. on religious/social rituals
(3)
Purchase of luxutry items like TV fridge two wheeler
etc.(4)
Consump - tion of
intoxicants (5)
Deposi-ted in
the bank (6)
Debt repay-ment (7)
1 2 3 11 12 13 14 15 16 17 1. Khodari 7 1 0 0 0 0 0 0 2. Devlaha 14 0 7 0 0 0 0 0 3. Patnakalan 24 2 0 0 0 0 0 0 Adopted Villages 45 3 7 0 0 0 0 0
4. Kanpur 16 1 5 0 0 0 0 0 5. Tangi 7 0 1 0 0 0 0 1 6. Degarhot 10 0 0 1 0 0 0 0 7. Umariha 9 0 0 0 0 0 0 0 8. Patni 16 5 0 0 0 0 0 0 9. Rahaniya 10 0 2 0 0 0 0 0 Cluster Villages 68 6 8 1 0 0 0 1
Total All Villages 113 9 15 1 0 0 0 1 7.254 Out of 113 individuals, 87 individuals [76.99 percent] have reported positive impact of
enhanced income over levels of education while 26 number of individuals [23.01 percent] have refused about such impact. The positive impact is predominant in case of primary and middle level education for both boys and girls wherein 87 individuals [76.99 percent to total individuals] have reported that due to enhanced income more number of boys and girls are being sent to attend elementary level [primary + middle] of education. The positive impact of enhanced income on levels of education shows the awareness of the sample individuals about value of education.
7.255 Regarding negetive responses by 26 individuals, 15 individuals [13.27 percent to total of
113 individuals] have reported that due to purchase of agriculture implements the priority on education could not be given.
IMPACT OF ENHANCED INCOME OVER HEALTH STATUS 7.256 Health is again an important social factor that accounts for efficiency in pursuance of any
occupation. The table below shows the impact of enhanced income over health status of sample population.

433
Table No. 7.80 Impact of Enhanced Income over Health Conditions
Impact on Health
If yes in what manner S. No.
Name of the Village No. of Individual
Yes (1)
No (2)
Services of
medical personnel
(1)
Vaccination of
children/ women done (2)
Child nutrition
(3)
Female nutrition during
gestation (4)
Adoption of Family
welfare measuries
1 2 3 4 5 6 7 8 9 10 1. Khodari 7 7 0 7 0 0 0 0 2. Devlaha 14 14 0 11 1 0 0 0 3. Patnakalan 24 17 7 2 8 3 4 2 Adopted Villages 45 38 7 20 9 3 4 2
4. Kanpur 16 16 0 7 8 0 1 0 5. Tangi 7 7 0 6 1 0 0 0 6. Degarhot 10 10 0 5 5 0 0 0 7. Umariha 9 8 1 0 5 3 0 0 8. Patni 16 10 6 0 9 1 0 0 9. Rahaniya 10 10 0 8 1 0 1 0 Cluster Villages 68 61 7 26 29 4 2 0
Total All Villages 113 99 14 46 38 7 6 2
Table No. 7.80 [Contd…] Impact of Enhanced Income over Health Conditions
If no the reasons S. No
Name of the Village No. of Individual Health
is no priority
Believe in local healing methods
Purchase of agri. inputs
Exp. on religious functions
Luxury items TV Fridge,
Two wheeler,
Four wheeler
Consumption of
intoxicants
Deposited in bank
1 2 3 11 12 13 14 15 16 17 1. Khodari 7 0 0 0 0 0 0 0 2. Devlaha 14 0 0 0 0 0 0 0 3. Patnakalan 24 6 2 0 0 0 0 0 Adopted Villages 45 6 2 0 0 0 0 0
4. Kanpur 16 0 0 0 0 0 0 0 5. Tangi 7 0 0 0 0 0 0 0 6. Degarhot 10 0 0 0 0 0 0 0 7. Umariha 9 1 0 0 0 0 0 0 8. Patni 16 5 0 0 0 0 0 0 9. Rahaniya 10 0 0 0 0 0 0 0 Cluster Villages 68 6 0 0 0 0 0 0
Total All Villages 113 12 2 0 0 0 0 0 7.257 The above table shows that out of 113 individuals, 99 individuals [87.61 percent to total of
113 individuals] have reported about positive impact of enhanced income over health status which shows the awareness of the sample population about value of keeping good health. The items of positive responses like hiring of the services of medical personnel [46 individuals], vaccination of children/women [38 individuals]. Child nutrition [7 individuals] female nutrition during gestation [6 indivuduals] and adoption of family welfare measures [2 individuals] are indicative of healthy trend since the individuals are more concerned particularly about, the health status of women and children.

434
7.258 Though the number of individuals with negetive response is only 14 [12.37 percent to total of 113 individuals] but the opinion like health is no priority by 12 number of individuals is a sort of red alert to K.V.K. scientists who must uproot such attitude lest they go deep into the thinking of more individuals.
IMPACT OF ENHANCED INCOME OVER POTABLE DRINKING WATER SUPPLY 7.259 The table below shows the details;
Table No. 7.81
Impact of Enhanced Income over Potable Drinking Water Supply Improve in potable
drinking water S. No
Name of the Village No. of Individual
Yes
No
1 2 3 4 5 1. Khodari 7 2 5 2. Devlaha 14 0 14 3. Patnakalan 24 0 24 Adopted Villages 45 2 43
4. Kanpur 16 0 16 5. Tangi 7 0 7 6. Degarhot 10 0 10 7. Umariha 9 0 9 8. Patni 16 2 14 9. Rahaniya 10 2 8 Cluster Villages 68 4 64
Total All Villages 113 6 107 7.260 The above tabke shows a reverse situation where the negetive response is to the tune of 107
individuals which is 94.69 percent to total of 113 individuals while the positive response is by only 6 individuals [5.31 percent]. These facts show that availability of potable drinking water is no priority in rural areas. The majority of positive respondents have indicated the spending of portion of enhanced income over installation of hand pumps. The solution to this problem of neglect of protable drinking water lies in enhancement of agricultural income of the rural population which if achieved will solve the problem of drinking water and also sanitation as the enhanced income induces the individuals to take care of the finer details of life.

435
IMPACT OF ENHANCED INCOME OVER HOUSING CONDITIONS 7.261 The table below shows the details;
Table No. 7.82
Impact of Enhanced Income over Housing Conditions Enhancement in income resulted in
improved housing contentions S. No
Name of the Village No. of Individual
Yes No 1 2 3 4 5 1. Khodari 7 3 4 2. Devlaha 14 7 7 3. Patnakalan 24 2 22 Adopted Villages 45 12 33
4. Kanpur 16 0 16 5. Tangi 7 3 4 6. Degarhot 10 4 6 7. Umariha 9 2 7 8. Patni 16 1 15 9. Rahaniya 10 0 10 Cluster Villages 68 10 58
Total All Villages 113 22 91 7.262 The above table shows that out of 113 individuals, 22 individuals [19.47 percent] have
positive respons while 91 individuals [80.53 percent] have refused spending of any amount of enhanced income over improving the housing conditions. The status seems obvious as frequent expenditure over improving the houseing condition is not usually done.
AWARENESS ABOUT WELFARE SCHEMES INITIATED BY THE STATE GOVERNMENT WITH ASSISTANCE FROM GOVERNMENT OF INDIA 7.263 The basic objectives of various welfare schemes initiated by the government are providing
employment opportunities to the target group for augmentation of income thereby improving the quality of life of the individuals/community. Though this information has no direct relevance to the functioning of K.V.K., but its personnel are supposed to popularize such schemes among villagers for taking financial support from such programmes. In the following paragraphs the details of a few important schemes have been given which have direct impact over the livelihoods of sample population.
JAWAHAR GRAM SAMRIDHI YOJANA 7.264 The former scheme of Jawahar Rojgar Yojna renamed as Jawahar Gram Samridhi Yojna
was started from the year 1999-2000 with the basic objective of creating community assets of permanent nature, thereby providing employment to local labour. The survey results show that out of 113 individuals 55 individuals [48.67 percent] are aware of the scheme while rest of 58 individuals [51.33 percent] have no knowledge about the scheme. The scheme is important from the view point of creating community asset that results in availability of employment opportunities. Awareness about this scheme will induce the villagers to assert their demand through Gram Panchayat to develop their area. The K.V.K. personnel may, during their field visits, publicize the utility of the scheme among the villagers.

436
EMPLOYMENT ASSURANCE SCHEME 7.265 Started from the year 1997-98, the scheme aims at providing employment to rural
population during lean season of agriculture thereby creating community assets. The response to this scheme is somewhat encouraging as 44 individuals [38.93 percent] are aware about the scheme.
ESTABLISHMENT OF HAND LOOM UNITS 7.266 Under this scheme, the units having 5 to 10 looms are registered and loom-shed subsidy and
margin money subsidy are given. Only one person of our sample area is aware of the scheme. When even awareness is not there, there can hardly be any possibility of its implementation in our area of study.
ESTABLISHMENT OF SERICULTURE UNITS 7.267 Under this scheme the beneficiaries are given training on various aspects of sericulture
activities to supplement their income. For this purpose Resham Kendras spread over in districts assume nodal responsibilities to train the beneficiaries and augment their infrastructure. Only 2 individuals from our area of study are aware of the existence of such scheme [what to say of its implementation] when the scheme is so important for rural economy. The K.V.K. personnel in liaison with concerned district authorities may take-up a compaign for making villagers aware about the benefits of the scheme.
ESTABLISHMENT OF FAMILY BASED RURAL INDUSTRIAL UNITS 7.268 The scheme is implemented by the Madya Pradesh Khadi and Gramodoyog Board. Under
this scheme the units pertaining to SC, ST and OBCs are given 90 percent subsidy on capital loan and remaining 10 percent loan is given by the banks. The level of awareness about this scheme is poor as 3 individuals [2.65 percent to total of 113 individuals] are aware about this scheme.
MID DAY MEALS 7.269 The programme has proved to be an effective incentive for retention of school going
children relating to primary education, specially the children coming from low income group. Under this programme, cooked meals are provided to the school going children. The level of awareness of this scheme is encouraging as 95 individuals, which is 84.07 percent to total of 113 individuals, are aware about this scheme.
FREE SUPPLY OF TEXT BOOKS 7.270 Under this scheme all the students of primary standard [classes 1st to 5th] belonging to SC,
ST and OBCs and students of classes 1st to 3rd standards belonging to general communities are given text books free of cost. As per our survey results 62 individuals [54.87 percent] are aware about the scheme while 51 individuals [45.13 percent] are not aware of the scheme. Since the supply of text books free of cost is mandatory, the individuals unaware of the scheme are either persons having their wards above primary standards of education or the rate of drop-out is so high that they are not particular about the scheme. However, efforts both by persons of school education department and K.V.K. may reduce such extent of unawareness.

437
WOMEN SELF HELP GROUP 7.271 With view to ensure social and economic empowerment of women, self help groups
[S.H.Gs.] are formed for making the women confident to face challenges on all fronts, be it social or economic. In this scheme, the members of the group deposit a part of their saving in the fund raised by the group and may take loan to meet their various social and economic obligations, subject to return of the amount with interest. In our area of study 100 individuals [88.50 percent] are aware of this scheme which, ofcourse, is very encouraging that indicates the awareness of individuals about the value of such institution. Unawareness aspect for 13 individuals may easily overcome by little more extension efforts by concerned government officials and persons of K.V.K.
GRAMYA YOJNA 7.272 Under this scheme the poor women are given interest free loan upto Rs. 500.00 towards
starting a small business. After repayment of the first loan within one year, second loan to the tune of Rs. 1500.00 is given. In our area of study, 49 number of individuals [43.36 percent] are aware of this scheme which is not much satisfactory as the scheme is important from the view point of economic empowerment of wome n. A little more extension effort by the officials of Woman and Child Development may reduce the level of unawareness of 64 persons to negligible level.
AUSMATI YOJNA 7.273 With the objective of providing better medical assistance to the women belonging to the
families living below the poverty line in rural areas, this scheme was started in the year 1999. For this scheme also the extent of awareness by 75 individuals [66.37 percent] is not much satisfactory as the scheme has direct relevance to health status of poor women. Perhaps a wide awareness campaign is necessary so that more number of poor women may come forward for medical assistance.
7.274 In what follows an attempt has been made to summarise the details of individual
particulars of adopted and cluster villages.
- The frame of the present part of the narration is 113 individuals which is 25 percent of the family members of 25 percent sample households belonging to adopted and cluster villages.
- The criteria for selection of individuals are – the persons should be the adult member of the family, he/she should be associated with any programme of the K.V.K., he/she should be literate – may be without having any formal education.
- The majority of 62 individuals are from Scheduled Tribe [ST] community that accounts for 54.87 percent to total of 113 individuals from adopted and cluster villages.
- The cent-percent sample individuals from our area of study are the followers of Hindu religion.
- The cent-percent awareness of the individuals about the K.V.K. in terms of its location and more importantly the services rendered by it is an important achievement of the K.V.K.
- Regarding knowledge about specific services, cent-percent sample individuals are aware of the vocational training while 98.23 percent individuals are aware

438
of F.L.D. and 92.92 percent individuals know about O.F.T. The impact of the K.V.K. services are obvious.
- Out of total of 113 individuals, 111 individuals [98.23 percent] are in regular contact with K.V.K. mainly because of the desire for adopting new technology [86.73 percent] and for plant protection [7.08 percent individuals.
- Regarding implementation, 98.23 percent individuals have implemented the services of K.V.K. This is an achievement by it self.
- Except for the subjects like agronomy and home science where 98.23 percent and 97.35 percent individuals have implemented the services rendered by K.V.K., in rest of the subjects viz. horticulture, animal husbandry, fishery, poultry, agro-forestry, organic farming, watershed activities and training of rural youth no implementation efforts have been done by the sample individuals.
- Agronomy and the home science are the subjects for which satisfaction level is substantial. In subjects like horticulture, animal husbandry, poultry, fishery, organic farming, watershed activities and training of rural youth the satisfaction level is nil.
- Regarding impact of K.V.K’s. efforts over income enhancement, 99.12 percent individuals have given positive response which is an achievement in itself.
- Regarding continuance of the services of K.V.K. 97.35 percent individuals have given positive response that justifies the laudable performance of the K.V.K.
- It is worth considering to incorporate in the mandate of the K.V.K. the new subjects like production of by-products and marketing strategy of the product.
- As regards utilization of enhanced income, 36.28 percent individuals have spent their enhanced income over purchase of agriculture implements.
- Regarding impact of enhanced income over levels of education, 76.99 percent individuals have given positive response particularly in case of elementary education for both boys and girls, which, no dubt is an encouraging trend.
- 87.61 percent to total of 113 individuals have reported about positive impact of enhanced income over health status that shows the awareness of sample population about value of keeping good health.
RESULTS OF SURVEY–INDIVIDUAL PARTICULARS–CONTROL VILLAGE 7.275 In the following paragraphs an attempt has been made to record the reactions of 25 percent
of individuals taken from control village of Bhargawan where there is no intervention of KVK. The Total number of family members of the 25 percent of the households in village Bercha is 45, the twenty five percent of which is 11 individuals. Therefore, the reactions of 11 number of individuals have been recorded to have a comparison with the reactions of individuals of adopted and cluster villages having direct intervention of KVK. The criteria for selection of individuals for control village are similar to tha t for adopted and cluster villages.
7.276 Like adopted and cluster villages, 9 individuals out of 11 individuals [81.82 percent] are
from S.T. community, only two individuals are from O.B.C. community. Non of the persons are from S.C. and General Community. Cent-percent individuals are followers of Hindu religion.
7.277 Regarding awareness about the existence of KVK, four number of individuals [36.36
percent] of Bhargawan village are aware of the its existence against the cent-percent awareness about K.V.K. in-terms of its location and services rendered by it by the individuals of adopted and cluster villages which seems obvious as in such cases the

439
interventiojn of K.V.K. is direct. Awareness is the basic paramter that leads to positive impact of any activity over a long period of time. The ultimate aim of any K.V.K. is to cover the entire district in terms of implementation of prevailing and new technology relating to agriculture and its allied activities that presupposes awareness about this organisation by the farming community of the district. For this purpose the K.V.K. personnel of district Satna may organize meetings at Gram Panchayat level at least twice in a year inviting one representative from villages where there is no intervention of K.V.K. to make them aware about the utility of services rendered by the K.V.K.
7.278 Regarding satisfaction derived from per hectare yield of agronomical and horticulture
crops, the cent-percent individuals of control village Bhargawa have expressed their dissatisfaction while for adopted and cluster villages this satisfaction level is 48.23 percent to total of 113 individuals. However for improving the per-hectare yield, 3 number of individuals from control village which is 27.27 percent to total of 11 individuals have suggested for organizing training for application of inputs, followed by 8 individuals [72.73 percent] for organizing training about water conservation.
7.279 Regarding satisfaction level of livestock and dairy activities cent percent individuals have
expressed their dissatisfaction. The suggestions forwarded are making available the improved breed production facilities by 7 individuals [63.64 percent] followed by training on artificial insemination by 3 individuals [27.27 percent] and one individual [9.09 percent] has opined for making available the improved feed facilities. It will be worth mentioning that even in cases of adopted and cluster villages the satisfaction level for livestock and poultry activities is negligible.
7.280 As for poultry development 10 number of individuals [90.91 percent] have expressed
dissatisfaction. The important suggestion forwarded is arrangement of improved caging facilities by 1 individual [9.09 percent]. In case of adopted and cluster villages also the satisfaction level for this activity is not substantial.
7.281 Regarding fishery development, again the level of dissatisfaction is cent-percent supported
by the suggestions like supply of improved feed by 6 individuals [54.55 percent] followed by arranging training about use of improved implements by 5 individuals [45.45 percent] It is worth mentioning again that for adopted and cluster villages the level of satisfaction for this activity is nil.
7.282 Important information has been collected about adoption of home science activities for
augmentation of family income. Toy making is one such activity where cent percent individuals have asked for training facility followed by pickle prepartion by 7 individuals [63.64 percent]. Training regarding backing activities have been supported by 3 individuals [27.27 percent], followed by jute items by 2 individuals [18.18 percent] preparation papad/jam/jelly etc by 5 persons [45.45 percent] and food processing by 1 pesons [9.09 percent]. It is worth mentioning that in case of adopted and cluster villages the positive response in favour of home science activities is substantial.
- Regarding training of rural youth for self employment, cent percent individuals have
suggested for organizing training programme for motor binding which is very relevant for performing agricultural activities followed by 6 individuals in favour of training courses for repair of diesel engine that accounts for 54.55 percent to total of 11 sample individuals. For activities like black smithy, carpentry, masonary and tailoring, and cycle/scooter repair individuals to the tune of 2 [18.18 percent], 1 [9.09 percent], 3 [27.27 percent], 4 [36.36 percent] and 8 [72.73 percent] respectively have suggested for organizing training courses. It

440
will not be out of place to mention here that in case of adopted and cluster villages, no individual has shown any inclination for such activities regarding training of rural youth.
7.283 Regarding educational status of the sample individuals of control village, the survey results
show that out of 11 individuals, 4 persons [36.36 percent] have reported positively about their male children attending the elementary level of education [primary + middle i.e. classes 1st to 8th standards] while the response from 7 individuals [63.64 percent] for this item are negetive. More or less similar is the situation with girls wherein 5 number of individuals [45.45 percent] have given positive response while 6 number of individuals [54.55 percent] were negetive in their responses. Similarly regarding boys and girls students of secondary level of education, i.e. from from classes 9th to 12th the cent percent.response is negetive.
7.284 Regarding health status the following table presents a comparitive picture between adopted
and cluster villages on one side and the control village on the other; Table No. 7.83
Compartive Status of Health Facilities Among Sample Individuals Sl. No.
Item Status of control village –percentage to total 11 sample
individuals
Status of adopted and cluster villages percentage to 113
sample individuals 1 Hiring of services of
medical personnel - 40.71
2 Vaccination of children/ pregnant mother
27.27 33.63
3 Child nutrition 63.64 6.19 4 Female nutrition during
gestation period 81.82 5.31
5 Adoption of family welfare measures
- 1.77
Note – Only positive responses have been taken into account. 7.285 The above table shows that except for the item of hiring of services of medical personal
vaccination of children/women and adoption of family welfare measures where the positive response of individuals from adopted and cluster villages is higher than control village, in rest of the health parameters the percentage positive responses of the individuals of control village are much higher than that of adopted and cluster villages that shows the relatively higher level of awareness among the sample individuals of control village regarding various health parameters.
7.286 Regarding status of drinking water facilities, cent percent individuals have responded
positively about availability of hand pumps as main source of drinking. Piped water supply is not in existence in the sample village which seems obvious as in villages in general this facility is seldom available. In case of adopted and cluster villages also the majority of respondents have informed about hand pums as main source of drinking water in their villages.
7.287 The table below shows the comparative level of awareness about the various welfare
schemes between adopted/cluster villages and control village;

441
Table No. 7.84 Comparative Levels of Awareness
Sl. No.
Name of the Scheme Level of awareness in percentage for adopted/cluster
villages [percent to total of 113individuals]
Level of awareness in percentage for control
village [percent to total of 11 individuals]
1 Jawahar Gram Samridhi Yojna 48.67 9.09 2 Employment Assurance Scheme 38.93 81.82 3 Establishment of Hand Loom Units 0.88 - 4 Establishment of Sericulture Units 1.77 - 5 Establishment of family based rural
industrial Units 2.65 -
6 Mid-day Meals 84.07 90.91 7 Free supply of Text Books 54.87 9.09 8 Women Self Help Group 88.50 81.82 9 Gramya Yojna 43.36 18.18 10 Ausmati Yojna 66.37 90.91 7.288 The above table shows that except for Employment Assurance Scheme and Mid-day
meals, the level of awareness about other schemes is much higher in adopted/cluster villages as compared to control village. Regarding schemes like Establishment of Hand Loom Units, Establishment of Sericulture Units and Establishment of family based rural industrial Units the level of awareness among individuals of control village is nil while that for adopted and cluster villages the level of awareness is marginal. The validity of such schemes, therefore, is doubtful as since the awareness about these schemes are missing, the plight of their implementation may well be imagined.
7.289 In what follows an attempt has been made to summarise the findings of individual
particulars of the control village; - The majority of 81.82 percent individuals are from S.T. community. Non of the
persons are from S.C. and general community. Cent percent individuals are followers of Hindu religion.
- Regarding awareness about existence of K.V.K. 36.36 percent individuals are aware of its existence.
- Regarding satisfaction derived from per hectare yield of agronomical and horticulture crops the cent percent individuals from control village have expressed their dissatisfaction.
- Dissatisfaction level for activities like livestock and dairy and fishery is centy percent while for poultry 90.91 percent individuals have expressed their dissatisfaction.
- Regarding home science activities the positive response from individuals of control village is substantial.
- Similarly for training of rural youth the positive response of the individuals of control village is substantial.
- Regarding educational status 36.36 percent individuals have reported positively about their male children attenditng the elementary level of education. More or less similar is the situation for girls wherein 45.45 percent individuals have given positive response.
- Regarding health status the positive response from individuals is substantial. - Regarding status of drinking water facilities cent percent individuals have responded
positively about availability of hand pumps as main source of drinking water. - As regards awareness about various welfare schemes the level of awareness for
schemes like Employment Assurance Scheme, Mid-day Meals, Women Self Help Group and Ausmati Yojana is substantial.

442
Chapter Eight
KRISHI VIGYAN KENDRA - SHAHDOL The Premise 8.1 The present chapter has been categorized into;
- General Particulars of the district - Details of Krishi Vigyan Kendra based on secondary information - Results of the survey
GENERAL PARTICULARS OF THE DISTRICT 8.2 District Shahdol is located in between 22.380 to 24.200 north latitude to 80.280 to 82.120 east
longitude with total geographical area of 9485 squ.km constituting 3.08 percent of the total 308245 squ.km. area of the State.
8.3 The district has 1390 inhabited villages with 662 Gram Panchayats delegated with various
powers of administration in view of 73rd constitutional amendment. The district has 9 number of Development Blocks that vouches for the expanse of rural area with 17 number of police stations for administration of law and order. The population, in general is law abiding since in worst of the nation wide turmoil, nothing untoward happened in the district.
8.4 The average annual rainfall of the district is 1302.4 mm mainly spread over between June to
September. The average maximum temperature during summer is 41.60 celsius while average minimum temperature during winter is 9.20 celsius.
8.5 The total population of the district as per census 2001 is 1575303 which is 2.61 percent to
total population of the State. Of the total population of the district the total rural population is 1174613 which is 74.56 percent to total population of the district while the urban population is 400690 constituting 25.44 percent to total district population. The fact shows the rural character of the district. The percentage of scheduled caste population to total population as per census 2001 is 7.36 while that for scheduled tribe population is 44.48 as against the State level percentage figures of 15.17 and 20.27 respectively. The percentage of workers engaged in agriculture in district Shahdol as per census 1991 is 67.08 to total workers that shows agriculture is the main occupation of district Shahdol.
8.6 The following indicators relating to agriculture will show the extent of agriculture related
activities in district Shahdol.

443
Table No. 8.1 Important Indicators Relating to Agriculture
Sl. No.
Indicators District Shahdol
State of Madhya Pradesh
1 2 3 4 1 Percentage of forest area to total geographical area [ha] 32.48 26.65 2 Net cropped area as percent to total geographical area [ha] 38.99 49.02 3 Per-capita net cropped area [ha] 0.22 0.25 4 Per-capita gross cropped area [ha] 0.24 0.34 5 Percentage of double cropped area to net cropped area [ha] 19.18 35.49 6 Net area irrigated as percent to net cropped area [ha] 5.21 37.56 7 Gross area irrigated as percent to gross cropped area [ha] 4.37 28.54 8 Per-capita production of food-grains [Kg.] 178 266 9 Per hectare use of fertilizer [Kg. ] 8.84 46.21 10 Gross value of agriculture produce-per hect. [Rs.] 7565 11968 11 Per hectare yield of agriculture produce [Kg.]*
a) Paddy 997 1058 b) Wheat 771 1867 c) Jowar 1134 1342 d) Maize 1299 2072 e) Gram 452 932 f) Tuar 567 825 g) Soybean 508 1132
12 Electrified villages as percent to total inhabited villages 93.59 97.04 13 Energised pump sets per thousand hectare 7 60
*Figures relate to the year 2003-2004 [Final Forecast] 8.7 Regarding important indicators like net area irrigated as percent to net cropped area,
percentage of double cropped area to net cropped area, per hectare use of fertilizer etc., the district Shahdol is far behind than state average with the result the per-hectare yield of most of the crops are less than the state average.
The district has immense forest wealth as the percentage of forest area to total geographical area is 32.48 as against the State average of 26.65 percent which is holding a promise for development of forest based economic activities in the area.
DETAILS OF KRISHI VIGYAN KENDRA, SHAHDOL BASED ON THE SECONDARY INFORMATION 8.8 Established in the year 1992, the K.V.K. is located in the Technical School Campus, Rewa
Road, Shahdol. The institution is being run under the overall control of Jawahar Lal Nehru Krishi Vishwa Vidyalaya [J.N.K.V.V.], Jabalpur with Training Organiser as head of the institute. Against the total sanctioned strength of 16 number of staff members, the institution, at present has 6 number of scientific staff with one Training Organiser and two Training Associates followed by three filled-in posts of Technical Assistants against the sanctioned strength of five such personnel and four number of non-technical staff against the sanctioned strength of five number of non-technical personnel. Thus, at present, the total number of staff in position is 10 against the sanctioned strength of 16 persons. The number of staff in position though is fairly enough to carry on with the activities of K.V.K. but the filling- in of the all the posts will definitely add more efficiency in performance of technical functions.

444
8.9 At present the K.V.K. has got no administrative building of its own and the office is located in the building provided by the district Collector. The infrastructures like farmers hostel, threshing floor and demonstration units regarding dairy, poultry, farm pond for fishing are not in existence. Only a small unit for crop and agro-horticultural system is available which can hardly be termed as fair equipage.
8.10 The farm area of the K.V.K. is 14.89 hectares, out of which 10.52 hectares is cultivable
without any irrigation facility. As on the date of the survey the institution has one number of four wheeler and one number of two wheeler adding efficiency to various functions being performed by the K.V.K.
8.11 The K.V.K. has adequate number of agriculture implements as detailed below;
1. Tractor – 1 2. M.B. Plough –1 3. Cultivator – 1 4. Tractor drawn Ferti seed drill – 1 5. Thresher – 1 6. Trolley – 1
7. Leveller – 1 8.12 These variety of implements are, more or less, sufficient to do the extension work with
reasonable efficiency. 8.13 Regarding budget allocation, during the year 2001-2002 the total budget provision was Rs.
2.05 lakh against which the expenditure amounted to Rs. 1.87 lakh while for the year 2002-2003 the budget allocation was Rs. 4.10 lakh with expenditure to the tune of Rs. 3.64 lakh. Similarly during the year 2003-2004 against the budget allocation of Rs. 12.10 lakh the expenditure was to the tune of Rs. 7.56 lakh. Mostly the budget allocation was for recurring items like pay and allowances, P.O.L. and organizing FLD, OFT etc. The budget allocation for technical functions along with POL need to be enhanced.
8.14 The information regarding technical performance has been collected under the heads of;
- Vocational Training - In Service Training - Front Line Demonstration - On Farm Testing
8.15 In what follows an attempt has been made to present the details of above mentioned items. VOCATIONAL TRAINING 8.16 Vocational training is not only limited to subjects relating to agriculture but supposed to
cover various subjects relating to activities allied to agriculture also. The table below shows the details;

445
Table No. 8.2 Status of Vocational Training
No. of trainings organised -2003-2004 Sl. No.
Subject Adopted Villages
Cluster Villages Other Villages Total no. of
trainees 2003-2004
1 2 3 4 5 6 1 Crop Production 11 - 10 21 2 Agriculture Extension 6 - - 6 3 Plant Protection 1 - 2 3 4 Veterinary Services - - - - 5 Home Science - - - - 6 Ag. Engineering 3 - - - 7 Training of Rural Youth for Self
Employment
a. Crop Production 2 - 8 10 b. Agriculture Extension 1 - 2 3 c. Plant Protection 2 - 2 4 d. Home Science 1 - - 1 e. Animal Science 1 - - 1
Total 28 - 24 49 Note : Other villages [Col. 5] mean those villages of the district where the training programmes of
Agriculture. Department are imparted through K.V.K. 8.17 One fact has very clearly come out from the above table is that the cultivators are basically
interested in enhancing productivity of agronomical crops with the result maximum number of 21 training programmes have been organised in adopted and other villages which is 42.86 percent of total of 49 number of training courses organised in the year 2003-2004 with maximum number of attendance of 21 number of trainees accounting for 42.87 percent of total of 49 number of trainees. The situation seems obvious as the cultivators are interested in enhancing their household income through improved farming practices over which they have control over resources backed by knowledge borne of years of experience. The complete absence of any training programme for horticulture, veterinary services and home science is a matter of concern as these are the areas which have immense promise for generation of income and employment in rural areas that arrest the tendency of migration during lean season of agriculture. The K.V.K. may make special efforts to organize training programmes on such subjects. Regarding training of rural youth for self employment, only 19 number of training courses have been organised in adopted and other villages attended by 19 number of trainees which is 38.77 percent to total number of 49 trainees attending the vocational training courses. The achievement is fair as it has normally been seen that in rural areas. The young persons are usually not much interested in such training activities due to absence of placement gurantee. Complete absence of organisation of any training programme in cluster villages is a definite gap in performance. Cluster villages are usually the peripheral villages of adopted villaghes where the technological impact of K.V.Ks. efforts are supposed to percolate through various forward linkages. Trainings organised in cluster villages give momentum to such percolation process. The K.V.K., Bhopal has organised 23 number of vocational training courses in areas of cluster villages which have made definite dent over the awareness levels of cultivators about new and prevailing technology relating to agriculture. The K.V.K., Shahdol may organize vocational training courses among cluster group of villages in coming years.
IN SERVICE TRAINING 8.18 In-service training is provided to the field functionaries of the line departments of
Agriculture, Veterinary, Horticulture and Forest. The following table shows the details of training provided;

446
Table No. 8.3 Status of In-service Training
No. of trainings organised in the year2003-04
Total number of trainees 2003-04
Sl. No.
Subject
On campus Off campus 1 2 3 4 5 1 Crop Production 1 4 5 2 Agriculture Extension 4 2 6 3 Plant Protection - - - Total 5 6 11
8.19 The position of organizing 11 number of training programmes though is satisfactory but
attendance of 11 number of trainees in the year 2003-2004 is somewhat unsatisfactory. However, the trainees from the office of the Chief Executive Officer, Zila Panchayat, implementing the scheme of rural development pertaining to creation of community and inditivual assets which have direct impact over enhancement of household income, should have been invited. The role of such personnel is important to implement various programmes relating to training of rural youth which is one of the basic responsibilities of K.V.K. Any programme of in-service-training should have duration of at least two days as usually the first day is practically lost awaiting for the arrival of the trainees. The K.V.K. scientists should have a constant liaison with the district collector to make such training programmes meaningful.
FRONT LINE DEMONSTRATION 8.20 The special features of F.L.Ds. are;
- These demonstrations are conducted under the close supervision of the scientists of the K.V.K.
- Only newly released technologies or those likely to be release in near future are selected for conducting F.L.Ds.
- F.L.Ds. are organised in a block of two to four hectares of land involving all those farmers whose plots fall in the identified demonstration blocks.
- Only critical inputs and training are provided from the scheme budget. Remaining inputs are supplied by farmers themselves.
- The target audience of F.L.Ds. is both farmers and extension officers. - The F.L.Ds. are supposed to generate data relating to factors leading to higher crop
yields and constraints under various farming conditions. 8.21 The table below shows the number of F.L.Ds. conducted during the year 2003-04.
Table No. 8.4
Status of Front Line Demonstrations No. of demonstrations organised 2003-2004 Sl.
No. Subjects
Adopted Villages Cluster Group of Villages 1 2 3 4 1 Pulses 26 - 2 Oil Seeds 60 - 3 Other than pulses and oilseeds 33 21 Total 119 21

447
8.22 Since organizing F.L.Ds. is one of the most important functions of the K.V.K. as through this activity the various technologies regarding agriculture are tested on the farmers fields, the near absence of such demonstrations in cluster villages is a serious lapse.
ON FARM TESTING 8.23 On farm testing is a part of adaptive research that takes into account existing technology and
its application over defined areas and defined group of farmers. The procedure of on farm testing has five steps viz.,
- Diagnosis - Planning - Experimentation - Assessment/evaluation of results - Recommendation and diffusion.
DIAGNOSIS In this step, an understanding of farmer’s circumstances and practices is developed in order
to understand the farming system, possible productive problems and offer possible solutions. It is a continuous process practiced in every cycle of research. Normally the Participatory Rural Appraisal [P.R.A.] technique is used for having an insight into the problems of farming communities.
PLANNING The planning involves setting-up of priorities in order to improve research efficiency in
terms of research benefits/costs by identifying following kinds of problems;
- Problems causing large productive loss. - Problems that occur frequently. - Problems that affect many farmers and their major crops.
EXPERIMENTATION This step includes exploring production problems, testing possible solutions and
demonstrating them on the farms. ASSESSMENT Under this phase the results of on farm testing are analysed taking primarily into
consideration the reactions and opinions of farmers. The results of the assessments are then used to plan future research.
RECOMMENDATION AND DIFFUSION On the basis of on farm testing the researchers formulate recommendations/ non-
recommendations for demonstration on larger area. The diffusion of new technology is done mainly be the farmer’s who once convinced of the benefits of new technology advise their fellow cultivators to adopt the system.
Against this background, the status of O.F.T. in the year 2003-2004 has been shown in the following table;

448
Table No. 8.5 Status of On Farm Testing
No. of O.F.Ts. organised 2003-2004 Sl. No.
Subject Adopted Villages Cluster Group of Villages
1 2 3 4 1 Agronomy 50 - 2 Horticulture 15 - Total 65 -
8.24 The organisation of only 65 number of on farm testing in one year that too only in adopted
villages is not very fair, particularly when this activity is most important for implementation of prevailing technology relating to agriculture. The matching figure of K.V.K., Bhopal is organisation of 200 number of O.F.Ts. equally distributed between adopted and cluster villages. The K.V.K., Shahdol may look into the matter and may attempt to organize more number of O.F.Ts. covering cluster villages as well in coming years.
8.25 Besides organizing training courses as laid down in the mandates of K.V.K. i.e. Vocational
Training, In Service training, Front Line Demonstration and On Farm Testing, the K.V.K., Shahdol has also organised other training programmes in liaison with the offices of district administration. The table below shows the details;
Table No. 8.6
Record of Other Training Courses No. of participants Sl.
No. Topic Duration
2001-2002 2002-2003 2003-2004 1 2 3 4 5 6 1 Plant Protection 54 days 7 8 11 2 Agr. Extension 41 days 7 5 6 3 Plant Protection 17 days 3 - 1 4 Home Science 5 days 2 1 - Total - 19 14 18
8.26 The total number of 51 trainees participating on four subjects over the years 2001 to 2004 is
somewhat fair. The duration of training spread over in respective years is somewhat exceptional as in case of most of other K.V.Ks. the duration is normally for 2 days.
8.27 One of the important functions of the K.V.K. is to conduct specific research to improve the
quality of agriculture produce, the details of which are given below; Table No. 8.7
Status of Specific Research Impact Over Topic of Research Year
Production Pest Control
Improved Animal Breed
Others [Specify]
1 2 3 4 5 6 7 1 Fertilizer requirement of
deshi paddy – upland 1998-99
1999-2000 Peohi variety was replaced
by 50%
- - -
2 Fertilizer requirement of deshi paddy – local
”
”
- - -
3 Wheat rainfed ” -

449
8.27 The impact of specific research is satisfactory as indicated by their effect on production. Since there is no regular flow of fund for research, more number of such research activities could not have been taken.
8.28 Each K.V.K. is supposed to hold the meeting of Scientific Advisory Committee twice in a
year for performing following functions; - Providing necessary guidance and leadership in developing infrastructure facilities and
thereby supporting the Kendra to fulfil its objectives. - Reviewing of the annual and five year plans of the Kendra. - Reviewing the progress of the activities and achievements and offering necessary
guidance/suggestions to improve the functioning of the Kendra. - Approval of the Annual Accounts of the Kendra before the same is sent to the Chartered
Accountant/Statutory Auditor for audit. - Adoption of the Statement of Audited Accounts before the same is sent to the Council. - Approval of the recommendations of the Recruitment/Selection committee for appointment
of staff on vacant posts. The Scientific Advisory Committee will consist of following members; 1. Head of the host institution Chairperson 2. Director, Extension of concerned SAU Member 3. Zonal Coordinator of the concerned zone Member 4. Representative of ICAR Instt./ICAR Regional Research Station
if located in the district or nearby Member
5. Associate Director, Research & Extension of the Zonal Research Station in which KVK is located
Member
6. District officers of the line departments such as Agriculture, Horticulture, Animal Husbandry, Soil conservation, Social/Agroforestry, Sericulture, Fisheries, Irrigation, Social Welfare, Small Scale Industries etc.
Members
7. Representative of the Lead Bank of the District Member 8. Farm Radio Officer of the AIR in which KVK is located Member 9. Representative of Doordarshan Centre in which KVK is located Member 10. Two representatives of the farmers - one small and one big
nominated by the Head of the Institution Member
11. Two representatives of Farm Women nominated by Head of the Institution
Members
12. Training Organiser, KVK Member Secretary 8.29 The K.V.K., Shahdol has arranged the meeting of Scientific Advisory Committee once in
the year 2003-2004. 8.30 The K.V.K., Shahdol has continuously interacted with district administration, three-tier
institution of Panchayati Raj and progressive cultivators of the district and took valuable guidance from them. Publicity measures like organizing Kisan Melas, Field Days, use of Audio-Visual Aids, arranging T.V. Interviews and Radio talks were attempted to spread the knowledge about utility of K.V.K. among rural population.

450
RESULTS OF THE SURVEY – VILLAGE PARTICULARS 8.31 The study has covered sixty number of villages at the rate of ten number of villages per
K.V.K. with following bifercations;
- Three number of Adopted Villages - Six number of Cluster Villages - One number of Control Village The bifurcation as shown above is common to all the six K.V.Ks. covered under the study. The table below shows a few important demographic details of the selected villages of K.V.K., Shahdol;
Table No. 8.8 Demographic Particulars
Of which Sl. No.
Name of the Village
Name of the Dev.
Block
Total population
Census 2001 Males
Census 2001
Females Census
2001
Proportion of S.C. population
[%]
Proportion of S.T.
population [%]
Literacy rate [%]
House-hold size
1 2 3 4 5 6 7 8 9 10 ADOPTED VILLAGES
1 Baaruka Sohagpur 1276 644 632 0.9 67.3 32.3 5 2 Antara Sohagpur 725 373 352 1.4 64.4 32.5 4 3 Nipaniya Sohagpur 998 503 495 2.3 51.9 61.0 5 Total – I 2999 [53.67] 1520
[53.48] 1479
[53.86] - - - -
CLUSTER VILLAGES 4 Chhatarpur Sohagpur 146 69 77 14.4 80.1 55.5 6 5 Antari Sohagpur 241 119 122 - 98.3 19.6 6 6 Simariya Sohagpur 140 67 73 - 94.3 18.3 5 7 Katahari Sohagpur 374 195 179 - 68.4 36.0 4 8 Purnia Sohagpur 442 222 220 - 43.2 48.2 5 9 Jhagraha Sohagpur 987 512 475 - 68.0 43.7 5 Total – II 2330 [41.70] 1184
[41.66] 1146
[41.73] - - - -
CONTROL VILLAGE 10 Kerhai Sohagpur 259 138 121 - 38.3 57.0 4 Total – III 259
[4.63] 138
[4.86] 121 [4.41] - 38.3 57.0 4
Grand Total I+II+III 5588 [100.00] 2842 [100.00]
2746 [100.00]
- - - -
Source – Census 2001 Note – Figures in brackets show percentage to total. 8.32 The total population of the ten identified villages as per census – 2001 is 5586 which is
0.48 percent to total rural population of district Shahdol. The adopted villages cover 53.67 percent of population as compared to total population of ten number of identified villages covered under the study while for the cluster villages this percentage is 41.70 and for control village, the percentage coverage is 4.63. Population wise largest village is Baruka [adopted village with population of 1276 persons while the smallest village is Simariya [cluster village with population of 140 persons]. Except for the villages Chhatarpur, Antari and Simariya where female population is more than male population, in rest of the seven number of villages the trend is otherwise. In all the identified ten number of villages the percentage of S.T. population is more than S.C. population. The literacy rate that ranged between 19.6 percent for village. Antari [cluster village] to 61.0 percent for village Nipaniya

451
[adopted village] is close to the district percentage literacy level of 58.71 and State percentage literacy level of 63.74. One very startling fact as revealed by above information is that even with substantial tribal population in identified villages covered under the study, the percentage literacy is satisfactory thus defying one of the fixed notions that areas with substantial tribal population usually have low literacy rate. The extensive literacy campaign initiated by the government has thus started showing results as the tribals have started understanding the value of literacy, particularly in our area of study.
WORK FORCE 8.33 An analysis of the information regarding workforce is important as it gives an idea of
persons engaged in various occupations along with the extent of dependent population not pursuing any work. The table below shows the details;
Table No. 8.9
Status of Work Participation Sl. No
Name of the Village
Work participation rate [%]
Proportion of main workers [%]
Proportion of Marginal workers [%]
Proportion of Non-workers [%]
Person Male Female Person Male Female Person Male Female Person Male Female 1 2 3 4 5 6 7 8 9 10 11 12 13 14
ADOPTED VILLAGES 1 Baaruka 39.3 51.4 27.1 14.8 26.1 3.3 24.5 25.3 23.7 60.7 48.6 72.9 2 Antara 37.8 46.9 28.1 36.7 46.1 26.7 1.1 0.8 1.4 62.2 53.1 71.9 3 Nipaniya 37.5 50.3 24.4 10.8 19.3 2.2 26.7 31.0 22.2 62.5 49.7 75.6 CLUSTER VILLAGES 4 Chhatarpur 42.5 42.0 42.9 10.3 20.3 1.3 32.2 21.7 41.6 57.5 58.0 57.1 5 Antari 58.8 62.2 51.6 7.5 15.1 0.0 49.4 47.1 51.6 43.2 37.8 48.4 6 Simariya 52.9 62.7 43.8 43.6 61.2 27.4 9.3 1.5 16.4 47.1 37.3 56.2 7 Katahari 40.6 54.9 25.1 31.3 46.7 14.5 9.4 8.2 10.6 59.4 45.1 74.9 8 Purnia 50.0 57.7 42.3 44.3 54.5 34.1 5.7 3.2 8.2 50.0 42.3 57.7 9 Jhagraha 44.2 53.3 34.3 26.1 35.4 16.2 18.0 18.0 18.1 55.8 46.7 65.7 CONTROL VILLAGE 10 Kerhai 50.2 57.2 42.1 0.0 0.0 0.0 50.2 57.2 42.1 49.8 42.8 57.9 Source – Census 2001 8.34 The work participation rate that ranged between 37.5 percent in village Nipaniya [adopted
village] to 58.8 percent in village Antari [cluster village] is in general more among males than females. For six number of villages the proportion of marginal workers is much low as compared to the proportion of main workers while for four number of villages viz. Baaruka, Nipaniya, Chhatarpur and Antari a reverse trend is visible which shows that in these villages other avenues of employment besides marginal employment generated by agriculture also exist. In general the proportion of female marginal workers is more than that of males which is rather obvious as the females do odd jobs in their spare time after completing household obligations. Since our area of study is predominated by tribal population, higher per centage of female marginal workers is somewhat matching to the trend as in the tribal communities females also do the work to support the household.
8.35 Regarding non-workers that ranged between 43.2 percent in village Antari [cluster
village] to 62.5 percent in village Nipaniya [adopted village] presents a dismal picture as it shows higher percentage of dependent population consisting of children, old person, infirms and unemployed who are not in a position to contribute practically anything towards family income.

452
8.36 The table shows the occupational distribution of the population residing in ten number of village covered under the study.
Table No. 8.10
Occupational Distribution Proportion of Cultivators
to total Workers [%] Proportion of Agr. Labourer to total
workers [%]
Proportion of workers in household industries
to total workers [%]
Proportion of other workers to total
workers [%]
Sl. No
Name of the Village
Person Male Female Person Male Female Person Male Female Person Male Female 1 2 3 4 5 6 7 8 9 10 11 12 13 14
ADOPTED VILLAGES 1 Baaruka 6.6 9.7 0.6 55.0 41.7 80.7 0.2 0.3 0.0 38.2 48.3 18.7 2 Antara 22.7 34.3 16.2 17.5 14.3 23.2 0.7 1.1 0.0 54.0 50.3 60.6 3 Nipaniya 16.6 21.7 5.8 54.0 41.1 81.0 1.1 1.6 0.0 28.3 35.6 13.2 CLUSTER VILLAGES 4 Chhatarpur 17.7 34.5 3.0 69.4 37.9 97.0 0.0 0.0 0.0 12.9 27.6 0.0 5 Antari 13.1 24.3 0.0 70.8 48.6 96.8 0.0 0.0 0.0 16.1 27.0 3.2 6 Simariya 25.7 23.8 28.1 36.5 31.0 43.8 0.0 0.0 0.0 37.8 45.2 28.1 7 Kathari 51.3 59.8 31.1 31.6 25.2 46.7 0.7 0.0 2.2 16.4 15.0 20.0 8 Purnia 35.3 43.8 23.7 31.7 21.9 45.2 3.2 2.3 4.3 29.9 32.0 26.9 9 Jhagraha 17.0 25.3 3.1 55.3 41.4 78.5 0.7 0.4 1.2 27.1 33.0 17.2 CONTROL VILLAGE 10 Kerhai 40.0 41.8 37.3 60.0 58.2 62.7 0.0 0.0 0.0 0.0 0.0 0.0 Source – Census 2001 8.37 Agriculture is the main occupation of the ten number of identified villages covered under the
study as the combined averge percentage of cultivators and agriculture labour is 72.78 to total workers. In general the proportion of agriculture labour to total worker is more than proportion of cultivators to total workers which is not an encouraging situation as such type of workers are prone to migration during lean or adverse conditions of agriculture. In general the proportion of male cultivators to total workers is more than that of females except in village Simariya [cluster village] where percentage of female cultivators is 28.1 as against 23.8 percent of male cultivators. In case of agriculture labour percentage of female participation in general is more than male participation which seems natural as in villages with substantial tribal population where the work culture among females is very common-at times more than even males. The proportion of household workers to total workers is far from being satisfactory that ranged between 0.2 percent in village Baaruka to 1.1 percent in village Nipaniya. One of the important causes of rural poverty is absence of secondary occupations which give household income support particularly in agrarian economy. It also reduces pressure on land with the result the occupation of agriculture becomes more viable. The proportion of other workers to total workers that ranged between 0.0 percent in village Kerhai [control village] to 54.0 percent in village. Antara [adopted village] is quite substantial which, in general, shows the existence of other mix of employent opportunities, partly contributed by the various welfare schemes of the government, in ten numbr of identified villages covered under the study.

453
LAND USE DETAILS 8.38 The table below shows the land use details of the ten identified villages covered under the
study; Table No. 8.11
Land Use Details In hectare Irrigation Sl.
No. Name of the
Village Total
geogra-phical area
Gross cropped area
Forest Not available for culti-vation
Culti-vable waste
Canal Pond Wells Others Total irri-gated area
Total unirri- gated
1 2 3 4 5 6 7 8 9 10 11 12 13 1 Baaruka 346 303 [87.57] - 43 20 - - 1 1 2 [0.58] 281 2 Antara 394 210 [53.30] 143 41 4 - - 3 4 7 [3.33] 199 3 Nipaniya 662 364 [54.98] 263 35 1 - - 15 5 20 [5.49] 343
Adopted Village I 1402 877 [62.55] 406 119 25 - - 19 10 29 [3.31] 823 4 Chhatarpur 255 237 [92.94] - 18 22 - - - 1 1 [0.42] 214 5 Antari 273 211 [72.91] 54 8 53 - - 4 - 4 [1.90] 154 6 Simariya 183 161 [87.98] - 22 62 - - 1 5 6 [3.73] 93 7 Kathari 496 340 [68.54] 129 27 23 - - 19 - 19 [5.59] 298 8 Purnia 190 176 [92.63] - 14 10 - - 2 8 10 [5.68] 156 9 Jhagraha 196 185 [94.39] - 11 30 - - 3 13 16 [8.65] 139
Cluster Village II 1593 1310 [82.23] 183 100 200 - - 29 27 56 [4.27] 1054 10 Kerhai 697 170 [24.39] 517 10 47 - - - 7 7 [4.12] 116 Control Village III 697 170 [24.39] 517 10 47 - - - 7 7 [4.12] 116 Total – I+II+III 3692 2357 [63.84] 1106 229 272 - - 48 44 92 [3.90] 1993 Source – Census, 2001 Note – Col. –4 = Figures in brackets show percentage to total geographical area. Col. – 12 = Figures in brackets show percentage to gross cropped area. 8.39 The gross cropped area is 63.84 percent to total geographical area that confirms the basic
fact that main occupation of these villages is agri culture. The survey area is also rich in forest resources as 29.96 percent area to total geographical area is under forest.
8.40 Regarding irrigation the percentage of gross irrigated area to gross cropped area is only 3.90
with breack-up of 3.31 percent for adopted villages, 4.27 percent for cluster villages and 4.12 percent for control village. Evidently the status of irrigation is quite unsatisfactory.
8.41 The cultivable waste land that provides a promise for expanding agriculture activities is 272
hectares in ten number of identified villages which is 6.87 percent to total geographical area assuring the fact that through the intervention of K.V.K. the expansion of agricultural work will be possible.
RURAL ELECTRIFICATION 8.42 The table below shows the details;

454
Table No. 8.12 Status of Rural Electrification
Village Electrified Regular supply Sr. No.
Name of the village Yes No Yes No
If irregular supply actual hrs. of
supply 1 2 3 4 5 6 7 1. Baaruka 1 0 0 1 12 2. Antara 1 0 0 1 12 3. Nipaniya 1 0 0 1 8 Adopted Village 3 0 0 3
4. Chhatarpur 1 0 0 1 10 5. Antari 1 0 0 1 18 6. Simariya 1 0 0 1 10 7. Katahari 1 0 0 1 12 8. Purnia 1 0 0 1 12 9. Jhagraha 1 0 0 1 12 Cluster Village 6 0 0 6
10 Kerhai 1 0 0 1 12 Control Village 1 0 0 1
Total 10 0 0 10 8.43 The above table shows that all the ten villages covered under the study are electrified with
irregular power supply situation. The power supply for most of the villages is 12 hours a day.
8.44 The impact of rural electrification is directly visible over number of pump-sets energized.
The table below shows the details;
Table No. 8.13 Status of Pump Sets Energised
Pump set energized Sr. No. Name of the village Electricity (No.) Diesel (No.)
1 2 3 4 1. Baaruka 15 7 2. Antara 5 6 3. Nipaniya 15 10 Adopted Village 35 23
4. Chhatarpur 5 0 5. Antari 3 3 6. Simariya 3 4 7. Katahari 10 8 8. Purnia 5 8 9. Jhagraha 12 6 Cluster Village 38 29
10 Kerhai 2 4 Control Village 2 4 Total 75 56
8.45 The total number of pump sets energized is 131 [as on the date of survey] which is 4.57
percent of total number of pump sets energized for district that stands at 2865 for the year 1999-2000. It is worth mentioning here that for district Shahdol the number of energized pump set per thousand hectare is 7 as against the state average of 60.

455
HOUSEHOLD INDUSTRIAL UNITS 8.46 The existence of only 2 household industrial units in the sample area of our study is not very
peculiar as such units are generally not found in rural areas of the state. COOPERATIVES 8.47 Formation of primary level cooperative societies as reflected in plan documents, basically
aims at improving the socio-economic status of the weaker section of society and in turn, arrest the tendency of their exploitation. The table below shows the status of existence of cooperative societies in our area of study.
Table No. 8.14
Cooperative Societies In number
Sr. No
Name of the village Agricultureco-operative
credit society
Fishermen co-
operative society
Milk co-operative.
society
Co-operative. marketing
society
Other specify
1 2 3 4 5 6 7 1. Baaruka 0 0 0 1 0 2. Antara 0 0 0 0 0 3. Nipaniya 0 0 0 0 0 Adopted Village 0 0 0 1 0
4. Chhatarpur 0 0 0 0 0 5. Antari 0 0 0 0 0 6. Simariya 0 0 0 0 0 7. Katahari 0 0 0 0 0 8. Purnia 0 0 0 0 0 9. Jhagraha 0 0 0 0 0 Cluster Village 0 0 0 0 0
10 Kerhai 0 0 0 0 0 Control Village 0 0 0 0 0 Total 0 0 0 1 0
8.48 The existence of only one cooperative society in village Baaruka [adopted village] is for
from being satisfactory. 8.49 Present level and prospect of future development of any area can fairly be assessed by the
extent of availability of basic and infrastural facilities in and around the villages. In what follows an attempt has been made to show the availability of such facilities in ten number of villages covered under the study.
BASIC FACILITIES 8.50 The table below shows the location of basic administrative facilities within and around the
ten villages identified for the study;

456
Table No. 8.15 Status of Basic Administrative Facilities
Tahsil head quarter Block head quarter Sr. No.
Name of the village
District head quarter away than village
KM
Within the village 0 KM
Away from the village
Km
Within the village 0 KM
Away from the village
Km 1 2 3 4 5 6 7 1. Baaruka 9 7 7 2. Antara 10 12 12 3. Nipaniya 10 10 10 Adopted Village
4. Chhatarpur 7 7 7 5. Antari 15 16 16 6. Simariya 15 14 14 7. Katahari 15 15 15 8. Purnia 16 12 12 9. Jhagraha 10 12 12 Cluster Village
10 Kerhai 15 12 12 Control Village Total 10 0 10 0 10
Table No. 8.15 [Contd…]
Status of Basic Administrative Facilities Gram Panchayat Police Station/sub
station Forest post Sr.
No. Name of the village
Within the
village 0 KM
Away from the village
Km
Within the
village 0 KM
Away from the village
Km
Within the
village 0 KM
Away from the village
Km 1 2 8 9 10 11 12 13 1. Baaruka 0 7 5 2. Antara 1 10 5 3. Nipaniya 2 10 0 Adopted Village
4. Chhatarpur 2 7 3 5. Antari 2 12 5 6. Simariya 1 14 4 7. Katahari 2 15 2 8. Purnia 1 14 4 9. Jhagraha 0 8 5 Cluster Village
10 Kerhai 10 12 2 Control Village Total 2 8 0 10 1 9

457
8.51 For all the identified ten villages the location of district headquarter is away from the village. Similar is status of distance for tahsil and block headquarter. Normally such distance factor regarding location of important administrative units has some adverse effect on socio-economic development of any area since the officials who matter remain slightly unaware about the problems of the area as their visits to such habitates are usually infrequent. However, location of Gram Panchayat within and easy distance of villages is somewhat encouraging as the villagers have sufficient scope of remaining aware about the developmental activities being performed by Gram Panchayat. For most of the village the location of police station is within accessable distance ensuring, to some extent, safety of the inhabitants of identified ten number of villages.
INFRASTRUCTURAL FACILITIES - ROADS 8.52 Roads are one of the basic infrastructures required for development of perhaps all the socio-
economic parameters relating to human development. The status of backwardness of animal husbandry sector and horticulture in rural areas is mainly attributed to the absence of link roads as such products are perishable in nature requiring quick transport for sale in nearby big markets. Perhaps basic cause of the location of poultry and milk farms in nearby cities/towns is the availability of road facility for quick transport of the product in nearby market where even cold storage facilities are available. The table below shows the details;
Table No. 8.16 Road Infrastructure
Fair weather road Sr. No.
Name of the village Within the village
0 Km Away from the
village Km
Kharamra road within
the village 1 2 3 4 5 1. Baaruka 0 - 2. Antara 2 - 3. Nipaniya 4 - Adopted Village
4. Chhatarpur 3 - 5. Antari 4 - 6. Simariya 2 - 7. Katahari 2 - 8. Purnia 2 0 9. Jhagraha 0 - Cluster Village
10 Kerhai 4 - Control Village - Total 2 8 1

458
Table No. 6.16 [Contd…] Road Infrastructure
Link road to all weather road All weather road Sr. No. Name of the village Within the village
0 Km Away from the
village Km Within the village
0 Km Away from the
village Km 1 2 6 7 8 9 1. Baaruka 0 0 2. Antara 1 1 3. Nipaniya 0 0 Adopted Village
4. Chhatarpur 0 0 5. Antari 3 3 6. Simariya 0 3 7. Katahari 0 0 8. Purnia 3 5 9. Jhagraha 0 3 Cluster Village
10 Kerhai 0 4 Control Village
Total 7 3 4 6
8.53 The information contained in the above table reveals a not very satisfactory status of
availability of road infrastructure in ten identified villages covered under the study. In only 2 villages fair weather roads and only in one village Kharanja road exist. Link roads to all weather roads exist only in seven number of villages and for other three villages the facility is within easy reach.
Infrastructural Facilities - Railway Station, Bus Stand/Bus Stop/
Post Office/S.T.D. Booth 8.54 The table below shows the details;
Table No. 8.17
Facilities Regarding Railway Station, Bus Stand, Bus Stop, Post Office, STD Booth Railway station Bus stand/Bus stop Sr.
No. Name of the village
Within the village 0 Km
Away from the village
Km
Within the village 0 Km
Away from the village Km
1 2 3 4 5 6 1. Baaruka 9 0 2. Antara 10 1 3. Nipaniya 10 0 Adopted Village
4. Chhatarpur 7 2 5. Antari 12 12 6. Simariya 15 3 7. Katahari 15 3 8. Purnia 10 10 9. Jhagraha 8 5 Cluster Village
10 Kerhai 13 1 Control Village
Total 0 10 2 8

459
Table No. 8.17 [Contd…] Facilities Regarding Railway Station, Bus Stand, Bus Stop, Post Office, STD Booth
Post office STD booth Sr. No.
Name of the village Within the
village 0 Km Away from the
village Km Within the
village 0 Km Away from the
village Km 1 2 3 4 5 6
1. Baaruka 2 2 2. Antara 3 3 3. Nipaniya 2 2 Adopted Village 4. Chhatarpur 4 4 5. Antari 5 5 6. Simariya 4 4 7. Katahari 2 2 8. Purnia 4 4 9. Jhagraha 2 2 Cluster Village
10 Kerhai 4 4 Control Village
Total 10 10
8.55 For all the ten sample villages the railway station is located for away from the village. In two villages the bus stand/bus stop is located within the village and in rest of the eight villages these facilities are within the easy reach of the villagers. Similar is the situation with facilities like post office and STD booth etc.
INFRASTRUCTURAL FACILITIES – AGRICULTURE MARKETING, FAIR PRICE SHOP, COLD STORAGE 8.56 Fair return to agriculture produce, to a great extent, is ensured by the availability of
marketing facilities like mandi yards, cold storage facilities to avoid distress selling which are as important as making provision for agriculture inputs for enhancement of agriculture production. The table below shows the details of the availability of such facilities within and around the ten number of selected villages covered under the study.
Table No. 8.18
Status of Agriculture Marketing, Fair Price Shops and Cold Storage Regular market Weekly market Mandi Sr.
No Name of the
village Within the village 0 Km
Away from the
village Km
Within the village 0 Km
Away from the village
Km
Within the village 0 Km
Away from the village
Km 1 2 3 4 5 6 7 8 1. Baaruka 7 7 9 2. Antara 10 10 10 3. Nipaniya 10 10 10 Adopted Village
4. Chhatarpur 7 7 8 5. Antari 12 12 12 6. Simariya 14 14 14 7. Katahari 15 15 15 8. Purnia 10 10 10 9. Jhagraha 8 8 8 Cluster Village
10 Kerhai 12 12 12 Control Village Total 10 10 10

460
Table No. 8.18 [Contd…] Status of Agriculture Marketing, Fair Price Shops and Cold Storage
Sub-Mandi Fair Price Shop Cold Storage Sr. No.
Name of the village Within
the village 0 Km
Away from the village
Km
Within the
village 0 Km
Away from the village
Km
Within the
village 0 Km
Away from the village
Km 1 2 9 10 11 12 13 14 1. Baaruka 9 0 6 2. Antara 10 1 11 3. Nipaniya 10 0 10 Adopted Village
4. Chhatarpur 8 0 7 5. Antari 12 2 15 6. Simariya 14 1 13 7. Katahari 15 2 15 8. Purnia 10 1 11 9. Jhagraha 8 0 12 Cluster Village
10 Kerhai 12 0 9 Control Village Total 10 5 5 10
8.57 Exept for the facility of fair price shops, in non of the identified ten villages any of the
facilities as shown above exist withIN the geographical limit of the Villages. AGRO BASED INDUSTRIAL UNITS 8.58 Agro-based industrial units are important value additons in rural areas taking care of
unemployment and under employment by providing sustainable income and thereby reducing the pressure on and. The table below shows the present status of agro-based industrial units in our sample villages;
Table No. 8.19
Status of Agro Based Industrial Units Flour mill Oil mill Dal mill Sr.
No. Name of the village
Within the
village 0 Km
Away from the village
Km
Within the
village 0 Km
Away from the village
Km
Within the
village 0 Km
Away from the village
Km
1 2 3 4 5 6 7 8 1. Baaruka 1 7 9 2. Antara 1 8 10 3. Nipaniya 0 5 10 Adopted Village
4. Chhatarpur 2 8 8 5. Antari 2 10 15 6. Simariya 1 8 15 7. Katahari 2 3 15 8. Purnia 1 8 10 9. Jhagraha 0 8 11 Cluster Village
10 Kerhai 0 12 11 Control Village Total 3 7 10 10

461
Table No. 8.19 [Contd…] Status of Agro Based Industrial Units
Saw mill Repair of agr. implements Sr. No.
Name of the village Within the
village 0 Km Away from
the village Km Within the
village 0 Km Away from the
village Km 1 2 9 10 11 12 1. Baaruka 6 7 2. Antara 10 10 3. Nipaniya 10 8 Adopted Village
4. Chhatarpur 5 6 5. Antari 10 15 6. Simariya 14 14 7. Katahari 15 15 8. Purnia 8 8 9. Jhagraha 12 10 Cluster Village
10 Kerhai 9 8 Control Village Total 10 10
8.59 The above table shows that except for flour mills non of the other industrial units like oil
mill, dal mill and saw mill are located within the villages identified for the study. In case of flour mills, 3 number of villages have such units located within their geographical limits while in 7 villages the locational distance is within manageable limits not exceeding 2 kms. The villages like Baaruka and Jhagraha having population of 1276 and 987 persons respectively may have flour mills and repair of agriculture implements.
SOCIAL INPUTS – EDUCATION ELEMENTARY EDUCATION – PRIMARY LEVEL 8.60 The Directive Principles of Constitution of India envisages provision of free and compulsory
education to all children upto the age of fourteen years of age before the commencement of 21st century. Now that the 21st century has set in, fresh dead lines have been drawn. The goals of the Universalisation of Elementary Education [U.E.E.] Programme are;
- Universal access to primary schooling facility within a radius of one km and a
middle school within a radius of at least 3 kms. - Universal enrolment of children of age group of 6 to 14 years. - Universal retention of all enrolled children till they complete eight years of
elementary schooling. Against this background, the information has been collected from sample villages. The table below shows the details of primary level of education.

462
Table No. 8.20 Status of Primary Level of Education
Primary School Non formal education Sr. No.
Name of the village Within the
village 0 km
Within 1 km
Within 2 km
Within 3 km
> 3 km
Within the village 0 km
Away from the village
km 1 2 3 4 5 6 7 8 9 1. Baaruka 0 8 2. Antara 0 12 3. Nipaniya 0 10 Adopted Village
4. Chhatarpur 0 999 5. Antari 3 15 6. Simariya 0 12 7. Katahari 0 999 8. Purnia 0 10 9. Jhagraha 0 999 Cluster Village
10 Kerhai 0 10 Control Village
Total 9 1 10
8.61 The above table shows that with the exception of village Antari [cluster village] where the
primary school is located at distance of within 3 kms, in rest of the nine number of villages the facility of primary school is available within the village periphery. One of the reasons of high literacy percentage in the villages covered under the study is locational advantage of this facility. Village Antari, with total population of 241 persons might not be having viability of running a primary school on sustainable basis, may be considered by the destrict administration for opening at least a non-formal education centre meant for working children who can not attend the regular primary educational institution.
ELEMENTARY EDUCATION–MIDDLE LEVEL AND ADULT EDUCATION 8.62 The table below shows the details;
Table No. 8.21
Status of Middle Level and Adult Education Middle School Adult Education Sr.
No. Name of the village
In the village 0 km
Within 5 km
More than 5 km
Within 1 km
Within 2 km
Within 3 km
> 3 km
1 2 9 10 11 11 12 13 14 1. Baaruka 1 10 2. Antara 0 12 3. Nipaniya 3 12 Adopted Village
4. Chhatarpur 2 7 5. Antari 1 16 6. Simariya 2 15 7. Katahari 2 10 8. Purnia 4 15 9. Jhagraha 0 12 Cluster Village
10 Kerhai 2 9 Control Village
Total 2 8 10

463
8.63 Though in only two villages i.e. Antara [adopted village] and Jhagraha [cluster village] the middle schools are located within the village periphery, in rest of the 8 number of villages the middle schools are locted within an easy distance of 2 to 4 kms which is almost in line with the laid down criterion for availability of middle school within a radius of 3 kms.
8.64 For most of the villages adult education centres are located for away from the village
periphery. Since the percentage literacy of all the ten identified villages is fairly high, the necessity of having such institutions is not felt.
SECONDARY LEVEL OF EDUCATION–HIGH SCHOOL & HIGHER SCHOOL [+2] 8.65 The policy regarding secondary level of education implies extension of school system in
unserved areas consolidating the existing facilities and providing special arrangements for the talented student s. In view of the above policy decisions, the following table shows the status of secondary level of education in our area of study;
Table No. 8.22
Status of Secondary Level Education High School Higher School (+2) Sr.
No. Name of the
village In the village 0 km
Within 5 km
More than 5 km
In the village 0 km
Within 5 km
More than 5 km
1 2 3 4 5 6 7 8 1. Baaruka 7 7 2. Antara 8 12 3. Nipaniya 3 8 Adopted Village 4. Chhatarpur 4 7 5. Antari 5 10 6. Simariya 2 15 7. Katahari 2 15 8. Purnia 4 12 9. Jhagraha 5 12 Cluster Village 10 Kerhai 7 7 Control Village Total 7 3 10
8.66 A not very satisfactory situation is existing in ten number of identified villages regarding
high and higher school as in non of the villages the high and higher schools are located within the village periphery. Though high schools are located within the easy distance from the identified villages but higher schools are located far away from the village periphery.

464
COLLEGIATE AND TECHNICAL EDUCATION 8.67 The table below shows the details
Table No. 8.23
Status of Collegiate and Technical Education College Industrial Training Instt. Sr.
No. Name of the village
Within the village 0
km
Within 5 km
More than 5 km
Within the village 0
km
Within 5 km
More than 5 km
1 2 3 4 5 6 7 8 1. Baaruka 10 10 2. Antara 14 16 3. Nipaniya 12 8 Adopted Village
4. Chhatarpur 7 5 5. Antari 15 12 6. Simariya 15 12 7. Katahari 15 12 8. Purnia 12 16 9. Jhagraha 13 15 Cluster Village
10 Kerhai 13 10 Control Village Total 10 1 9
8.68 In non of the villages colleges or Industrial Training Institutes exist which is obvious as such
institutions are usually located at tahsil or district headquarters. HEALTH 8.69 Improvement in health status of population has been one of the thrust areas in the social
development programmes of the state of Madhya Pradesh. The ultimate objectivew of the health and family welfare activities of the State is to achieve the goal of “Health for All” as outlined in the National Health Policy which emphasized on implementation of primary health care approach.
8.70 In persuit of this goal, a multitier health and family welfare service delivery system has been
established in the State consisting of Sub Health Centres, Primary Health Centres and Community Health Centres. Besides, civil hospitals district hospitals and other special health care institutions have been provided for as a support to three tier system. A mention of the norms accepted for three tier system is given below;
a. Sub Health Centre for every 5,000 population in non-tribal areas and 3,000 population in tribal areas.
b. Primary Health Centre for every 30,000 population in non-tribal areas and 20,000
population in tribal areas. c. Community Health Centre for every 1,20,000 population in non-tribal areas and 80,000
population in tribal areas.

465
8.71 In view of the population criteria for rural health facilities the consideration for location of only Sub Health Centres, Rural Family Welfare Centres etc may be considered. The table below shows the details;
Table No. 8.24 Rural Health Infrastructure
Sub Health Centre Rural Family Welfare Centre Sr. No.
Name of the village Within
the village 0 km
Within 5 km
More than 5 km
Within the village 0 km
Within 5 km
More than 5 km
1 2 3 4 5 6 7 8 1. Baaruka 7 1 2. Antara 5 5 3. Nipaniya 8 0 Adopted Village
4. Chhatarpur 6 2 5. Antari 5 5 6. Simariya 5 1 7. Katahari 5 2 8. Purnia 4 5 9. Jhagraha 4 4 Cluster Village
10 Kerhai 8 2 Control Village Total 0 6 4 1 9
Table No. 8.24 [Contd…] Rural Health Infrastructure
Government Hospital Government Dispensary Sr. No.
Name of the village Within
the village 0 km
Within 5 km
More than 5 km
Within the village 0 km
Within 5 km
More than 5 km
1 2 9 10 11 12 13 14 1. Baaruka 7 7 2. Antara 12 10 3. Nipaniya 9 8 Adopted Village 4. Chhatarpur 6 7 5. Antari 12 5 6. Simariya 15 10 7. Katahari 15 12 8. Purnia 11 5 9. Jhagraha 12 5 Cluster Village
10 Kerhai 13 13 Control Village Total 10 3 7

466
Table No. 8.24 [Contd…] Rural Health Infrastructure
Private Clinic Nursing Home Sr. No.
Name of the village Within
the village 0 km
Within 5 km
More than 5 km
Within the
village 0 km
Within 5 km
More than 5 km
1 2 15 16 17 18 19 20 1. Baaruka 6 8 2. Antara 10 12 3. Nipaniya 10 10 Adopted Village 4. Chhatarpur 7 7 5. Antari 5 12 6. Simariya 10 15 7. Katahari 2 15 8. Purnia 10 11 9. Jhagraha 10 12 Cluster Village 10 Kerhai 7 9 Control Village Total 2 8 10
8.72 Though non of the villages have Sub Health Centres within the village limits but are
located within reachable distance, ranging between four to eight kms. Similar is the case with rural family welfare centres where with the exception of the village Nipaniya where this facility is available within the village, in rest of 9 villages the facility is located within manageable limits ranging between one to five kms.
8.73 Government Hospitals are located quite at far away distance from identified ten number of
villages with obvious reasons that such health infrastructures are usually provided at tahsil or district levels serving as referal units for grass root level health services particularly that of Sub Health Centres and Primary Health Centres. Government Dispensaries are, ofcourse, available within easy manageable reach of the inhabitants of sample villages which serve as support institution to the three tier system of health infrastructure.
8.74 The institution of Private Clinic is gradually becoming popular in rural areas as is evident
from the fact that in our sample area of study two number of villages have private clinics within five km range of the villages. The basic cause of incoming of private practitioners usually not a qualified doctor, is the prepetual absence of medical personnel in rural health institutions that compel the rural population to take resort of the quakes, at least for common diseases.
FAMILY WELFARE 8.75 Limiting the size of the family is, perhaps, the most important constituent of family welfare
as population growth, very rightly said, is the reutralising factor of development. The nation wide campaign of family welfare has undoubtedy made a dent both in urban and rural areas. The table below shows the status of acceptors of family welfare measures in sample villages covered under the study;

467
Table No. 8.25 Status of Acceptors of Family Welfare Measurs
Sr. No.
Name of the village
Total Workders
Acceptors of Nirodh
(No.of Benefic-iaries)
Tubectomy (No. of
Benefic-iaries)
Vasectomy (No. of
Benefic-iaries)
Loop Insertion (No. of
Benefic-iaries)
Oral Pills (No. of
Benefic-iaries)
Traditional Methods (No. of
Benefic-iaries)
1 2 3 4 5 6 7 8 9 1. Baaruka 502 7 [1.39] 18 [3.59] 0 3 [0.60] 5 [1.00] 0 2. Antara 274 9 [3.28] 17 [6.20] 3 [1.09] 5 [1.82] 10 [3.65] 0 3. Nipaniya 374 15 [4.01] 25 [6.68] 6 [1.60] 7 [1.87] 17 [4.55] 5 [1.34] Adopted Village 1150 31 [2.70] 60 [5.22] 9 [0.78] 15 [1.30] 32 [2.78] 5 [0.45]
4. Chhatarpur 62 0 3 [4.84] 0 0 2 [3.23] 0 5. Antari 137 0 5 [3.65] 0 0 2 [1.46] 0 6. Simariya 74 4 [5.41] 11 [14.86] 3 [4.05] 1 [1.35] 3 [4.05] 0 7. Katahari 152 3 [1.97] 22 [14.47] 6 [3.95] 0 7 [4.61] 0 8. Purnia 221 10 [4.52] 6 [2.72] 1 [0.45] 3 [1.36] 7 [3.17] 0 9. Jhagraha 436 14 [3.21] 25 [5.73] 5 [1.15] 0 19 [4.36] 0 Cluster Village 1082 31 [2.87] 72 [6.65] 15 [1.39] 4 [0.37] 40 [3.70] 0
10 Kerhai 130 2 [1.54] 6 [4.62] 0 0 2 [1.54] 0 Control Village 130 2 [1.54] 6 [4.62] 0 0 2 [1.54] 0
Total 2362 64 [2.71] 138 [5.84] 24 [1.02] 19 [0.80] 74 [3.13] 5 [0.21]
Note : Figures in brackets show the percentage to the figures of column 3.
8.76 In the above table the percentage figures have been arrived at on the basis of the figures of the workforce which is not very correct. The percentages should have been on the basis of the figures of eligible couples. Since village wise such figures are not available, therefore, as second option the work force figures that include persons within the age group of 15 to 59 years of age have been taken who may be taken as population with reproductive capacity, particularly of males.
8.77 Against the total figure of 2362 persons in the work force, the total number of persons
adopting various methods of family welfare are 324 which is 13.72 percent to total work force. The performance though not very encouraging but would have presented a better picture had the comparision made with the figures of eligible couples.
8.78 The extent of adoption of family welfare measures, in general, is better in adopted villages
as compared to both cluster and control villages. In line with prevailing trend, the response to acceptance of Nirodh, Tubectomy and oral pills is more than the other methods.
DRINKING WATER 8.79 The strategies envisaged for the Tenth Plan mainly centred round the qua litative and
quantitative improvement in rural water supply system by raising the level of services from 40 lped to 55 lped, reduce the maximum distance of water sources from the present 1.6 km to 0.5 km, providing alternate safe water source where existing sources have been contaminated and potable drinking water to new settlements etc.
8.80 Against the back drop of such strategies, the table below shows the existing level of drinking water facilities in the sample villages;

468
Table No. 8.26 Status of Drinking Water Facilities
Sources of drinking water Distance from the village
Sl. No.
Name of the Village In the
village 0 km
=1 KM =2 KMS. =3 KMS. =4 KMS.
1 2 3 4 5 6 7 1 Baaruka 0 2 Antara 0 - - - - 3 Nipania 0 - - - -
Adopted Village - - - - 4 Chhatarpur 0 5 Antari 0 - - - - 6 Simariya 0 - - - - 7 Katahari 0 - - - - 8 Purnia 0 - - - - 9 Jhagraha 0 - - - -
Cluster Village - - - - 10 Kerhai 0
Control Village - - - -
Total 10 - - - -
8.81 The above table shows that in all the ten number of sample villages one or other drinking
water source, mostly hand-pumps, is available within the village which is the result of massive work of installation of hand pumps in rural areas undertaken by the State Government.
8.82 In what follows an attempt has been made to summarise the details of the village
particulars. - A very genuine question may arise as to the necessity of detailed analysis of the
existence of facilities both infrastructural and otherwise in identified ten villages when the basic aim of the study is to highlight the impact of the performance of the K.V.Ks. in transferring agriculture related technologies to the farming communities. The answer is simple as the availability of basic facilities in and around the villages are prerequisites for absorption and implementation of any knowledge what-so-ever. Any attempt to transfer knowledge of efficiency to a back of the beyond village may prove futile because of the constraints of basic facilities that cause negetive attitudinal status. But this does not mean that such villages should be left in lurch. Any way this being altogether a different topic is left for the time being.
- The total population of the ten identified village is 5586 which is 0.48 percent to total rural population of district Shahdol.
- In all the identified ten villages the percentage of S.T. population is more than S.C. population.
- The literacy rate that ranged between 19.6 percent for village Antara [cluster village] to 61.0 percent for village Nipaniya [adopted village] is close to the district percentage literacy of 58.71 and state percentage literacy of 63.74.
- The work participation rate that ranged between 37.5 percent in village Nipaniya [adopted village] to 58.8 percent in village Antari [clus ter village] is in general more among males than females.
- In general proportion of female marginal workers is more than that of males which is obvious since our area of study is predominated by tribal population where work culture among females is equally high.

469
- Regarding non-workers that ranged between 43.2 percent in village Antari [cluster village] to 62.5 percent in village Nipaniya [adopted village] presents a dismal picture.
- In general the proportion of agriculture labour to total worker is more than cultivator which is not an encouraging situation However, the main occupation of the ten identified number of villages covered under the study is agriculture as the combined percentage of cultivators and agriculture labour is 72.78 percent.
- The proportion of household workers to total workers is far from being satisfactory that ranged between 0.2 percent in village Baaruka to 1.1 percent in village Nipaniya.
- The proportion of other workers to total workers that ranged between 0.0 percent in village Kerhai [control village] to 54.0 percent in village Antara [adopted village] is quite substantial which, in general, shows the existence of other mix of employment opportunities in ten number of identified villages covered under the study.
- Regarding land use, the percentage of gross cropped area to total geographical area is 63.84 confirming the basic fact that main occupation of the sample villages is agriculture with only 3.90 percent of gross cropped area is under agriculture.
- All the ten number of villages covered under the study is electrified with irregular power supply situation.
- The total number of pump sets energized is 131 which is 4.57 percent of total number of 2865 pump sets energized in the district.
- The existence of only 2 household industrial units in the sample area of our stud is not very peculiar as such units are generally not found in rural areas of the State.
- The existence of only one cooperative society in village Baaruka [adopted village] is for from being satisfactory.
- There is not much satisfactory status of availability of road infrastructure in the sample area of study as only 2 villages have fair weather roads and only in one village the Kharanza road exists.
- In only two villages the bus stand/bus stop is located within the village and in rest of the eight villages, these facilities are within the easy reach of the villagers.
- Except for the facility of fair price shops, in non of the identified villages the facilities like regulated market, weekly market, mandi etc exist.
- Except for flour mills, non of the other industrial units like oil mill, dal mill and saw mills are located within the villages identified for the study.
- Except for village Antari [cluster village] where the primary school is located at a distance of within 3 kms, in rest of nine number of villages the facility of primary school is available within the village periphery.
- Similarly for middle level of education in two villages viz. Antara [adopted village] and Jhagraha [cluster village] the middle schools are located within village periphery while in rest of 8 number of villages the middle schools are located within easy distance from the village.
- Non of the villages are having high school, higher school, college and Industrial Training Institutions within the geographical limits of the ten identified villages covered under the study.
- The sub health centres and rural family welfare centres are located within the easy reach of the villagers.
- Regardomg family welfare measures the response to acceptance of nirodh, tubectomy and oral pills is more than other methods.
- In all the ten number of sample villages one or other drinking water source, mostly hand-pumps is available.
Results of Survey - Household Particulars

470
8.83 The present part of the chapter deals with the information relating to the households in the following dimensions;
(i) Macro Dimensions – Wherein information from all the households residing in 10 number of
sample villages has been collected. (ii) Micro Dimensions – Wherein 25 percent of the households have been identified for the
detailed enquiry. 8.84 In what follows an attempt has been made to deal with both the macro and micro dimensions
based on the information collected through House Listing Schedule and household Schedule respectively.
MACRO DIMENSIONS – GENERAL PARTICULARS 8.85 The table below shows the details;
Table No. 8.27 Household Details
S. No.
Name of the Village
No. of household as on the date of survey
Population Census-2001
Average size of he family (based on the figure of col.5
1 2 3 4 5 1. Baaruka 124 1276 10 2. Antara 125 725 5 3. Nipaniya 155 998 6 Adopted Village 404 2999 7
4. Chhatarpur 25 146 5 5. Antari 33 241 7 6. Simariya 39 140 3 7. Katahari 70 374 5 8. Purnia 67 442 6 9. Jhagraha 134 987 7 Cluster Village 368 2330 6
10 Kerhai 43 259 6 Control Village 43 259 6
Total 815 5588 6
8.86 The total number of households as on the date of survey is 815 for all the ten number of villages covered under the study. The average size of the family comes to 6 persons which is more than the average size of the family of 5 persons. In village Baaruka [adopted village] the family size is 10 person which is exceptionally high requiring the special attention of district administration.
SOCIAL STATUS OF THE HOUSEHOLDS 8.87 The table below shows the details;

471
Table No. 8.28 Social Status of the Households.
Caste (Social classification) Interaction with KVK S. No.
Name of the Village
No. of House-
hold S.T. S.C. O.B.C. General Yes No
1 2 3 4 5 6 7 8 9 1. Baaruka 124 71 0 39 14 31 93 2. Antara 125 94 0 30 1 41 84 3. Nipaniya 155 89 0 45 21 53 102 Adopted Village 404 254 0 114 36 125 279
4. Chhatarpur 25 19 1 0 5 10 15 5. Antari 33 33 0 0 0 20 13 6. Simariya 39 35 0 4 0 19 20 7. Katahari 70 49 0 18 3 29 41 8. Purnia 67 23 0 44 0 28 39 9. Jhagraha 134 93 0 41 0 44 90 Cluster Village 368 252 1 107 8 150 218
10 Kerhai 43 18 0 25 0 21 22 Control Village 43 18 0 25 0 21 22 Total 815 524 1 246 44 296 519
8.88 The above table shows the preponderance of households from S.T. and O.B.C. communities
that constitute 94.48 percent to total number of 815 households whereas the combined percentage of S.C. and General Communities is 5.52 to total number of households.
HOUSEHOLDS CLASSIFIED ON THE BASIS OF RELIGION 8.89 The table below shows the details;
Table No. 8.29 Distribution of Households on the Basis of Religion
S. No.
Name of the Village No. of House-hold
Hindu Muslim Sikh Christen Nu-Buddh
1 2 3 4 5 6 7 8 1. Baaruka 124 124 0 0 0 0 2. Antara 125 125 0 0 0 0 3. Nipaniya 155 155 0 0 0 0 Adopted Village 404 404 0 0 0 0
4. Chhatarpur 25 20 5 0 0 0 5. Antari 33 33 0 0 0 0 6. Simariya 39 39 0 0 0 0 7. Katahari 70 70 0 0 0 0 8. Purnia 67 67 0 0 0 0 9. Jhagraha 134 134 0 0 0 0 Cluster Village 368 363 5 0 0 0
10 Kerhai 43 43 0 0 0 0 Control Village 43 43 0 0 0 0 Total 815 810 5 0 0 0

472
8.90 Against the total number of 815 households, 810 households are the followers of Hindu religion while only 5 households are the follower of Muslim religion.
OCCUPATIONAL DISTRIBUTION OF HOUSEHOLDS – MAIN OCCUPATION PRIMARY SECTOR – AGRICULTURE 8.91 The table below shows the details;
Table No. 8.30 Household According to their Main Occupation – Agriculture
S. No.
Name of the Village
No. of house-hold
Marginal Farmers
Small Farmers
Other Farmers
Agriculture Labour
1 2 3 4 5 6 7 1. Baaruka 124 0 42 70 0 2. Antara 125 25 21 39 25 3. Nipaniya 155 27 37 29 20 Adopted Village 404 52 100 138 50
4. Chhatarpur 25 0 8 4 5 5. Antari 33 6 9 4 11 6. Simariya 39 2 10 11 8 7. Katahari 70 12 11 21 15 8. Purnia 67 9 15 22 10 9. Jhagraha 134 21 29 62 21 Cluster Village 368 50 82 124 70
10 Kerhai 43 6 21 16 0 Control Village 43 6 21 16 0 Total 815 108 203 278 120
Note : Figures in brackets show percentage to total number of households. 8.92 Out of the total number of 815 households, 709 number of households are engaged directly
in agriculture accounting for 86.99 percent to total number of households. Small and other farmers together constitute 59.02 percent to total households that shows vaible nature of agricultre being pursued as main source of livelihood. The total number of households in the groups of marginal farmers and agriculture labour are 228 [27.97 percent] which are vulnurable households prone to migrate during lean season of agriculture.
8.93 The pursuance of occupations like minor forest produce collection, live stock, fishing and
hunting activities are completely missing among sample households presenting a negetive state of affairs as these occupations are good sources of augmenting household income through alternate sources, thereby reducing extent of under employment among farming communities.
SECONDARY AND TERTIARY SECTORS 8.94 The secondary and tertiary sector occupations, being meaningful destinations that offer work
opportunities to absorbe the workforce engaged in marginal farming or pursuing the occupation of agriculture labour. The table below shows the details;

473
Table No. 8.31 Households According to their Main Occupations – Secondary and Tertiary Sectors
Secondary Sector Tertiary Sector S. No.
Name of The Village Mining and Quarrying Servicing And
Repairs Construction
Work Government
Service Service in Private
Sector 1 2 3 4 5 6 7 1. Baaruka 124 3 4 2 0 2. Antara 125 0 0 0 1 3. Nipaniya 155 5 9 0 0 Adopted Village 404 8 13 2 1
4. Chhatarpur 25 0 1 2 0 5. Antari 33 0 0 0 0 6. Simariya 39 0 0 0 0 7. Katahari 70 0 0 0 0 8. Purnia 67 0 0 3 0 9. Jhagraha 134 3 2 2 0 Cluster Village 368 3 3 7 0
10 Kerhai 43 0 0 0 0 Control Village 43 0 0 0 0
Total 815 11 16 9 1 8.95 The situation emerging from the above table is somewhat dismal. Only 27 number of
households are engaged in secondary sector activities, mainly in construction work while only 10 number of workers are engaged in tertiary sector, mostly in government service.
OCCUPATIONAL DISTRIBUTION OF HOUSEHOLDS – SUBSIDIARY OCCUPATIONS
PRIMARY SECTOR – AGRICULTURE1 8.96 The table below shows the details;
Table No. 8.32
Households According to their Subsidiary Occupation – Agriculture S.
No. Name of the Village No. of
household Marginal Farmers
Small Farmers
Other Farmers
Agriculture Labour
1 2 3 4 5 6 7 1. Baaruka 124 0 9 2 2 2. Antara 125 1 12 0 2 3. Nipaniya 155 4 14 1 3 Adopted Village 404 5 35 7
4. Chhatarpur 25 4 17 0 3 5. Antari 33 4 17 0 3 6. Simariya 39 4 18 0 3 7. Katahari 70 4 18 0 3 8. Purnia 67 6 20 0 3 9. Jhagraha 134 7 22 0 3 Cluster Village 368 29 112 0 18
10 Kerhai 43 7 22 0 3 Control Village 43 0 0 0 0
Total 815 41 [5.03] 169 [20.74] 3 [0.37] 28 [3.43]
Note : Figures in brackets show percentage to total number of households. 8.97 The agriculture as subsidiary occupation is being pursued by 241 number of households
which is 29.57 percent to total number of 815 households. The combined high percentage of marginal farmers, small farmers and agriculture labour which comes to 29.20 to total of

474
815 households, pursuing agriculture as subsidiary occupation is understandable as such cultivators usually have to resort to add jobs in nearby places to sustain their livelihoods but the agriculture as subsidiary occupation being pursued by 3 number of other farmers [0.37 percent] generally having sizable land holdings is somewhat paradoxical. Usually such farmers live in nearby bigger settlements and the cultivation is done by other persons on the basis of certain financial or barter agreements.
PRIMARY SECTOR – FOREST, LIVESTOCK, FISHERIES, HUNTING 8.98 The table below shows the details;
Table No. 8.33
Households According to their Subsidiary Occupation – Forest, Livestock, Fisheries, Hunting S.
No. Name of The
Village No. of
Household Minor Forest
Producer Collection Liver Tock Activities
Fishing Activities
Hunting Activities
1 2 3 4 5 6 7 1. Baaruka 124 12 3 0 0 2. Antara 125 16 1 0 0 3. Nipaniya 155 21 0 0 0 Adopted Village 404 49 4 0 0
4. Chhatarpur 25 0 1 0 0 5. Antari 33 9 1 0 0 6. Simariya 39 5 0 0 0 7. Katahari 70 13 1 0 0 8. Purnia 67 5 0 0 0 9. Jhagraha 134 28 0 0 0 Cluster Village 368 60 3 0 0
10 Kerhai 43 3 5 0 0 Control Village 43 3 5 0 0
Total 815 112 12 0 0 8.99 The involvement of 112 households [13.74 percent] for collection of minor forest produce as
subsidiary occupation seems obvious as the area is quite rich in forest resources since 32.48 percent area is under forest as compared to total geographical area of the district. The involvement of 12 number of households pursuing livestock activities as subsidiary occupation, though negligible but somewhat encouraging as this occupation is hardly been pursued in other K.V.K.
SECONDARY AND TERTIARY SECTORS 8.100 The table below shows the details;

475
Table No. 8.34 Households According to their Subsidiary Occupations – Secondary and Tertiary Sectors
Secondary Sector Tertiary Sector S. No.
Name of The Village Mining and Quarrying Servicing
And Repairs
Construction Work
Government Service
Service in Private Sector
1 2 3 4 5 6 7 1. Baaruka 124 9 5 5 4 2. Antara 125 7 7 1 1 3. Nipaniya 155 7 2 0 0 Adopted Village 404 23 14 6 5
4. Chhatarpur 25 1 2 1 0 5. Antari 33 1 2 0 0 6. Simariya 39 1 1 1 0 7. Katahari 70 4 0 0 0 8. Purnia 67 0 2 1 0 9. Jhagraha 134 2 2 1 0 Cluster Village 368 9 9 4 0
10 Kerhai 43 0 1 2 0 Control Village 43 0 1 2 0
Total 815 32 24 12 5
8.101 In secondary sector occupations, 56 number of households [6.87 percent] are involved with
major particiption in servicing and repair activities, while in tertiary sectors the participation by 17 number of households [2.09 percent] mostly engaged in government services has been recorded.
8.102 The overall conclusion that can be drawn from the information relating to
occupational distribution of the households is that agriculture is main occupation of the households residing in ten number of identified villages covered under the study.
AVERAGE MONTHLY INCOME 8.103 The table below shows the details;
Table No. 8.35
Average Monthly Income S.
No. Name of the Village No. of
House hold
Blow Rs.500
Rs.5001 to Rs.600
Rs.601 to
Rs.700
Rs.701 to
Rs.800
Rs.801 to
Rs.900
Rs.901 to Rs.1000
Rs.1001 and
Above 1 2 3 4 5 6 7 8 9 10 1. Baaruka 124 1 1 0 2 0 12 108 2. Antara 125 1 3 2 7 3 16 93 3. Nipaniya 155 1 3 1 5 1 19 125 Adopted Village 404 3 7 3 14 4 47 326
4. Chhatarpur 25 0 1 0 0 0 3 21 5. Antari 33 0 0 0 1 1 4 27 6. Simariya 39 0 0 0 0 0 2 37 7. Katahari 70 0 0 0 1 2 14 53 8. Purnia 67 0 0 0 0 1 5 61 9. Jhagraha 134 0 0 3 5 4 23 99 Cluster Village 368 0 1 3 7 8 51 298
10 Kerhai 43 0 0 1 1 0 4 37 Control Village 43 0 0 1 1 0 4 37
Total 815 3 8 7 22 12 102 661

476
8.104 The total number of households in the average monthly income range of Rs. 901.00 to Rs. 1001.00 and above is 763 which is 93.62 percent to total number of households that indicate the affluence level of the area particularly in the field of agriculture. In adopted villages this percentage is 92.33 while in cluster villages the percentage is 94.84 percent. Even in control village where there is no intervention of K.V.K., the total number of households in the average monthly income range of Rs. 901.00 to Rs. 1001.00 and above is 41 accounting for 95.35 percent to total number of 43 households.
AVERAGE MONTHLY EXPENDITURE 8.105 The table below shows the details;
Table No. 8.36 Average Monthly Expenditure
S. No.
Name of the Village
No. of Househol
d
Blow Rs.50
0
Rs.501 to
Rs.600
Rs.601 to
Rs.700
Rs.701 to
Rs.800
Rs.801 to
Rs.900
Rs.901 to
Rs.1000
Rs.1001 and
Above
1 2 3 4 5 6 7 8 9 10 1. Baaruka 124 1 1 0 2 0 4 116 2. Antara 125 2 3 0 4 3 14 99 3. Nipaniya 155 1 3 1 7 1 11 131 Adopted Village 404 4 7 1 13 4 29 346
4. Chhatarpur 25 1 0 0 0 0 1 23 5. Antari 33 0 0 0 0 0 1 32 6. Simariya 39 0 0 0 0 0 2 37 7. Katahari 70 1 0 0 2 1 8 58 8. Purnia 67 0 0 0 0 1 4 62 9. Jhagraha 134 1 2 0 1 2 14 114 Cluster Village 368 3 2 0 3 4 30 326
10 Kerhai 43 0 0 0 1 0 1 41 Control Village 43 0 0 0 1 0 1 41
Total 815 7 9 1 17 8 60 713
8.106 In line with income levels, the maximum number of 773 households are within the average monthly expenditure range of Rs. 901.00 to Rs. 1001.00 and above which is 94.85 percent to total number of households with the break-up of 92.82 for adopted villages, 96.74 percent for cluster villages and 97.67 percent for control village.
8.107 To sum up it may be mentioned that - The average size of the family residing in the sample area of study is 6 persons which is
more than the standard size of the family of 5 persons. In village Baaruka [adopted village] the average size of the family is 10 persons which is exceptionally high requiring special attention of district administration.
- Preponderance of households from S.T. and O.B.C. communities is visible constituting 94.48 percent to total number of 815 households.
- The sample area is predominated by followers of Hindu religion that constitute 99.89 percent to total households.

477
- Agriculture is the main stay of the households residing in identified ten numbers of villages as 86.99 percent households as compared to total households are engaged directly in agriculture occupation as prime source of livelihood. Small and other farmers [having sizeable land holding] together constitute 59.02 percent to total household that shows viability of agriculture being pursued as main occupation.
- The pursuance of occupations like minor forest produce collection, livestock, fishing and hunting activities are completely missing among sample households.
- In secondary and tertiary sector activities 37 number of households are engaged as main source of occupation which is 4.54 percent to total number of 815 number of households.
- Agriculture as subsidiary occupation is being pursued by 241 number of households which is 29.57 percent to total number of 815 households.
- The involvement of 112 households [13.74 percent] for collection of minor forest produce as subsidiary occupation is justified as the district is rich in forest resources.
- The 93.62 percent of households are within the average monthly income range of Rs. 901.00 to Rs. 1001.00 and above is the indication of affluence level of the area with matching levels of average monthly expenditure.
RESULTS OF THE SURVEY – MICRO DIMENSION 8.108 In this section of write-up, 25 percent of the households have been identified for detailed
inquiry. Though the 25 percent of the households of the total of 815 households comes to 203 but we have taken 199 households because of mainly due to their demographic elements. However, a few number plus or minus from the determined parameter is not much meaningful so long it does not vitiate the results of the survey.
DEMOGRAPHIC PARTICULARS – MALE –FEMALE DISTRIBUTION 8.109 The table below shows the details;
Table No. 8.37 Male – Female Distribution
Age, Male S. No
Name of the Village
No. of Families Selected
No. of Family
Members
Male Total 0-10
Years 10-20 Years
20-30 Years
30-40 Years
40-50 Years
50-60 Years
60 Years and
Above 1 2 3 4 5 6 7 8 9 10 11 12 1. Baaruka 31 197 99 28 20 15 12 12 5 7 2. Antara 31 154 59 8 13 11 11 9 5 2 3. Nipaniya 36 210 110 37 23 17 13 9 7 4 Adopted Village 98 561 536 146 112 86 72 60 34 26
4. Chhatarpur 6 40 19 5 4 3 4 1 1 1 5. Antari 8 42 20 5 3 3 4 1 1 3 6. Simariya 10 58 23 6 2 5 5 0 3 2 7. Katahari 16 87 45 12 11 7 5 5 5 0 8. Purnia 17 99 47 14 12 6 6 6 3 0 9. Jhagraha 33 197 101 26 28 11 19 9 4 4 Cluster Village 90 523 510 136 120 70 86 44 34 20
10 Kerhai 11 61 27 5 6 6 3 4 2 1 Control Village 11 61 54 10 12 12 6 8 4 2
Total 199 1145 550 146 122 84 82 56 36 24
Table No. 8.37 [Contd…] Male – Female Distribution

478
Age, Female S. No.
Name of The Village
No. of Families Selected
No. of Family
Members
Female Total 0-10
Years 10-20 Years
20-30 Years
30-40 Years
40-50 Years
50-60 Years
60 Years and
Above
1 2 3 4 13 14 15 16 17 18 19 20 1. Baaruka 31 197 98 24 26 20 11 11 3 3 2. Antara 31 154 95 25 28 13 12 5 8 4 3. Nipaniya 36 210 100 28 25 17 14 6 5 5 Adopted
Village 98 561 586 154 158 100 74 44 32 24
4. Chhatarpur 6 40 21 5 7 2 4 1 2 0 5. Antari 8 42 22 11 1 3 5 1 0 1 6. Simariya 10 58 35 12 6 7 3 1 5 1 7. Katahari 16 87 42 11 14 4 7 4 2 0 8. Purnia 17 99 52 8 19 6 7 5 2 5 9. Jhagraha 33 197 96 32 19 15 19 5 4 2 Cluster Village 90 523 536 158 132 74 90 34 30 18
10 Kerhai 11 61 34 1 17 3 4 4 1 4 Control
Village 11 61 68 2 34 6 8 8 2 8
Total 199 1145 595 157 162 90 86 43 32 25 8.110 Out of the total number of 1145 family members [which can also be considered as the total
population of sample households] the male members are 550, constituting 48.03 percent to total family members, while far females this percentage is 51.97 a very rare trend of more females over males. The number of males within the population group of 20 to 60 years considered to be the labour force of the area is 258 which is 22.53 percent to total male family members, is representative of the fact that fair number of males are available for work. In case of females, this percentage is 21.92, again indicating the availability of substantial number of females for producing marketable commodity as usually the females have to do the household work which is not marketable. Similar trend is more or less prevailing among the male-female population of adopted, cluster and control villages. The percentage of dependent population among males in the age group of 0-10 years and 60 years and above is 30.91 to total number of males which is a negetive factor since this group of population do not contribute much towards family income. Similarly among females this percentage is 30.59 showing slightly lower extent of dependent population as compared to males.
EDUCATIONAL STATUS OF SAMPLE HOUSEHOLDS 8.111 Literacy and education are the prerequisites for adoption of any technology what-so-ever,
requiring mental participation. Therefore, information regarding the educational status of the sample households has been collected to study the impact of literacy/education levels over the acceptability of agriculture related technology. The table below shows the details;

479
Table No. 8.38 Educational Status
S. No.
Name of The Village No. of Families Selected
No. of Family
Members
Illiterate Literate without going to school
Primary No.
Middle No.
1 2 3 4 5 6 7 8 1. Baaruka 31 197 56 3 62 40 2. Antara 31 154 67 2 40 43 3. Nipaniya 36 210 57 3 88 56 Adopted Village 98 561 180 8 190 139
4. Chhatarpur 6 40 12 0 15 13 5. Antari 8 42 24 0 13 3 6. Simariya 10 58 31 0 21 6 7. Katahari 16 87 39 0 29 12 8. Purnia 17 99 33 6 16 30 9. Jhagraha 33 197 74 3 61 53 Cluster Village 90 523 213 9 155 117
10 Kerhai 11 61 27 2 13 16 Control Village 11 61 27 2 13 16
Total 199 1145 420 19 358 272
Table No. 8.38 [Contd…]
Educational Status S. No
Name of The Village No. of Families Selected
No. of Family
Members
High School
No.
Higher School
No.
Graduate No.
Post Graduate No.
Others No.
1 2 3 4 9 10 11 12 13 1. Baaruka 31 197 24 5 3 4 0 2. Antara 31 154 1 1 0 0 0 3. Nipaniya 36 210 6 0 0 0 0 Adopted Village 98 561 31 6 3 4 0
4. Chhatarpur 6 40 0 0 0 0 0 5. Antari 8 42 2 0 0 0 0 6. Simariya 10 58 0 0 0 0 0 7. Katahari 16 87 5 1 0 1 0 8. Purnia 17 99 12 2 0 0 0 9. Jhagraha 33 197 6 0 0 0 0 Cluster Village 90 523 25 3 0 1 0
10 Kerhai 11 61 3 0 0 0 0 Control Village 11 61 3 0 0 0 0
Total 199 1145 59 9 3 5 0
8.112 The above table shows a total of 420 persons as illiterate which is 31.68 percent to total
family members. The extent of illiteracy is within reasonable limit which, ofcourse, is positive indication. The total number of children attending elementary level of education [primary + middle] is 630 accounting for 55.02 percent to total family member is again an encouraging factor indicating proper implementation of the programme of universalisation of Elementary Education in our area of study while number of students attending secondary level of education [high school + higher school (+)] is 68 which is 5.94 percent to total family members, a near satisfactory level. The extent of higher education is not impressive, reason being the lack of higher educational facilities in the area. The overall educational status that emerges proceeds to show the absorption capacity of the people of the sample area to adopt various technologies regarding agriculture communicated particularly by the K.V.K.

480
OCCUPATIONAL DISTRIBUTION OF HOUSEHOLDS–MAIN OCCUPATION 8.113 Out of the total of 1145 family members of sample households 236 persons are engaged in
various main occupations that comes to 20.61 percent to total number of persons in identified sample households. In what follows an attempt has been made to analyse the information pertaining to main occupation.
AGRICULTURE OCCUPATIONS 8.114 The table below shows the details;
Table No. 8.39 Main Occupation – Agriculture
S. No.
Name of The Village No. of families selected
No. of family
members
Small Farmer
Marginal Farmer
Farmer Agriculture Labour
1 2 3 4 5 6 7 8 1. Baaruka 31 197 6 1 28 1 2. Antara 31 154 10 1 18 0 3. Nipaniya 36 210 21 0 17 0 Adopted Village 98 561 37 2 63 1
4. Chhatarpur 6 40 1 0 5 0 5. Antari 8 42 2 0 6 0 6. Simariya 10 58 3 0 7 0 7. Katahari 16 87 7 0 13 0 8. Purnia 17 99 2 0 17 0 9. Jhagraha 33 197 12 0 21 0 Cluster Village 90 523 27 0 69 0
10 Kerhai 11 61 7 1 4 1 Control Village 11 61 7 1 4 1
Total 199 1145 71 3 136 2
8.114 One of the satisfactory trends as depicted by the above table is that the bulk of the farming community is from the category of farmers consisting cultivatiors [136 number] having sizeable land holdings constituting 11.88 percent to total of 1145 family members and 57.63 percent to total of 236 persons pursuing various main occupations. In case of adopted and cluster villages the percentage of farmers to total family members is 11.23 and 13.19 respectively while as compared to total main workers these percentages are 26.69 and 26.24 respectively. Thus the application of agriculture related technology through K.V.K. in particular and other agencies in general is convenient in adopted and cluster villages.
8.115 Regarding activities allied to agriculture, 16 number of persons are engaged in minor-forest
produce collection as main source of livelihood which is 1.34 percent to total of 1145 family members. Since the area is fairly rich in forest resources adherance to such type of occupation seems obvious.

481
OCCUPATIONS RELATING TO SECONDARY AND TERTIARY SECTORS 8.116 The table below shows the details;
Table No. 8.40 Main Occupation – Secondary and Tertiary Sectors
S. No.
Name of The Village No. of families selected
No. of family members
Manufac-turing of by
Product
Servicing and repairs
Const-ruction work
Govt. Service
Service in Pvt. Sector
1. Baaruka 31 197 0 0 1 4 0 2. Antara 31 154 0 0 1 0 0 3. Nipaniya 36 210 0 0 0 0 0 Adopted Village 98 561 0 0 2 4 0
4. Chhatarpur 6 40 0 0 0 0 0 5. Antari 8 42 1 0 0 0 0 6. Simariya 10 58 0 0 0 0 0 7. Katahari 16 87 0 0 0 1 0 8. Purnia 17 99 0 0 0 0 0 9. Jhagraha 33 197 0 0 0 0 0 Cluster Village 90 523 1 0 0 1 0
10 Kerhai 11 61 0 0 0 0 0 Control Village 11 61 0 0 0 0 0
Total 199 1145 1 0 2 5 0
The employment of only 8 persons in secondary and tertiary sectors is hardly meaningful to
avoid the stress on agriculture that ultimately results in population migration during lean season of agriculture.
OCCUPATIONAL DISTRIBUTION OF HOUSEHOLDS IN SUBSIDIUARY OCCUPATIONS - AGRICULTURE 8.117 Out of total of 1145 persons from 199 households, 13 number of persons [1.14 percent] are
engaged in subsidiary occupations mostly in activities allied to agriculture [10 persons]. SUBSIDIARY OCCUPATION – AGRICULTURE 8.118 The table below shows the details;
Table No. 8.41 Subsidiary Occupation – Agriculture
S. No.
Name of The Village
No. of families selected
No. of family members
Small Farmer
Marginal Farmer
Farmer Agriculture Labour
1. Baaruka 31 197 1 0 0 0 2. Antara 31 154 0 0 1 0 3. Nipaniya 36 210 1 0 0 0 Adopted Village 98 561 2 0 1 0
4. Chhatarpur 6 40 0 0 0 0 5. Antari 8 42 0 0 0 0 6. Simariya 10 58 0 0 0 0 7. Katahari 16 87 0 0 0 0 8. Purnia 17 99 0 0 0 0 9. Jhagraha 33 197 0 0 0 0 Cluster Village 90 523 0 0 0 0
10 Kerhai 11 61 0 0 0 0 Control Village 11 61 0 0 0 0
Total 199 1145 2 0 1 0

482
8.119 The above table shows the involvement of only 3 persons mostly as small farmer which is 0.26 percent to total number of 1145 family members. The status is hardly meaningful.
8.120 In occupation allied to agricultre 9 persons are engaged in minor forest produce collection
[0.79 percent] and 1 person in live stock activities which is hardly a meaningful performance.
8.121 Involvement in subsidiary occupations, particularly activities allied to agriculture and
secondary and tertiary sector occupations are highly meaningful for rural economy on the twin grounds of income augmentation and reduction of under employment in agriculture sector which, undoubtedly, is almost missing in our area of study. One of the basic drawbacks with rural economy is the absence of supportive functions, though the plethora of welfare activities initiated by the government are aimed at creating employment opportunities mainly through subsidiary occupations to ease pressure on land. Unfortunately such welfare schemes are yet to show their impact on far flung villages where even the basic awareness about the scheme do not exist, what to say of their implementation. Once the subsidiary employment avenues are created covering the back of the beyond villages, there will not be any looking back as the development will come as a logical outcome of forward linkages covering not only income generating sectors but social sectors like education, health etc.
AVERAGE MONTHLY INCOME 8.122 The table below shows the details;
Table No. 8.42
Average Monthly Income S.
No. Name of The Village No. of
families selected
No. of family memb
ers
Below Rs. 500
Rs. 501 to
Rs. 600
Rs. 601 to
Rs. 700
Rs. 701 to
Rs. 800
Rs. 801 to
Rs. 900
Rs. 901 to
Rs. 1000
Rs. 1001 & above
1 2 3 4 5 6 7 8 9 10 11 1. Baaruka 31 197 35 0 0 1 0 5 156 2. Antara 31 154 31 2 1 0 0 0 120 3. Nipaniya 36 210 37 0 1 0 0 2 170 Adopted Village 98 561 103 2 2 1 0 7 446
4. Chhatarpur 6 40 6 0 0 0 0 0 34 5. Antari 8 42 9 0 0 0 0 0 33 6. Simariya 10 58 10 0 0 0 0 0 48 7. Katahari 16 87 19 0 0 1 0 0 67 8. Purnia 17 99 17 0 0 0 0 1 81 9. Jhagraha 33 197 33 1 0 0 0 0 163 Cluster Village 90 523 94 1 0 1 0 0 426
10 Kerhai 11 61 11 0 0 0 0 1 49 Control Village 11 61 11 0 0 0 0 0 49
Total 199 1145 208 3 2 2 0 9 921
8.123 The above table shows that 80.44 percent family members are within the average monthly
income range of Rs. 1001.00 and above while 18.17 percent family members are within the average monthly income range of Rs. 500.00 and below. This shows that the farmers are pursuing agriculture on fair scale as agriculture is the main occupation of the sample area of our study.

483
AVERAGE MONTHLY EXPENDITURE 8.124 The table shows the details;
Table No. 8.43 Average Monthly Expenditure
S. No.
Name of The Village No. of families selected
No. of family
members
Below Rs. 500
Rs. 501 to
Rs. 600
Rs. 601 to
Rs. 700
Rs. 701 to
Rs. 800
Rs. 801 to
Rs. 900
Rs. 901 to
Rs. 1000
Rs. 1001 and
Above 1 2 3 4 5 6 7 8 9 10 11 1. Baaruka 31 197 32 0 0 0 0 4 161 2. Antara 31 154 29 0 0 0 0 0 125 3. Nipaniya 36 210 33 0 0 0 0 2 175 Adopted Village 98 561 94 0 0 0 0 6 461
4. Chhatarpur 6 40 6 0 0 0 0 0 34 5. Antari 8 42 8 0 0 0 0 0 34 6. Simariya 10 58 9 0 0 0 0 0 49 7. Katahari 16 87 16 0 0 0 0 3 68 8. Purnia 17 99 17 0 0 0 0 0 82 9. Jhagraha 33 197 29 0 0 0 0 0 168 Cluster Village 90 523 85 0 0 0 0 3 435
10 Kerhai 11 61 10 0 0 0 0 1 50 Control Village 11 61 10 0 0 0 0 1 50
Total 199 1145 189 0 0 0 0 10 946
8.125 In line with income trend, 82.62 percent family members are within average monthly
expenditure range of Rs. 1001.00 and above. 8.126 To sum up - The percentage of males within the age group of 20 to 60 years, representing the
labour force is 22.53 percent to total male family members while that for females the percentage is 21.92 indicating availability of substantial number of persons far performing various economic activities.
- The percentage of dependent population among males in the age group of 0-10 years and 60 years and above is 30.91 to total number of males is a negetive factor since this group of population do not contribute much towards family income. Similarly among females this percentage is 30.59 showing higher extent of dependent population.
- The literacy percentage being 68.32 in the sample area is amazingly high that indicates the absorption capacity of the individuals to adopt latest technology regarding agriculture imparted by the K.V.K.
- The bulk of the farming community is from the category of farmers having sizeable land holdings constituting 57.63 percent to total of 236 persons pursuing various main occupations.
- Regarding activities allied to agriculture 16 number of persons are engaged in minor forest produce collection which is 6.78 percent to total of 236 persons engaged in main occupations.
- The employment of only 8 persons in secondary and tertiary sectors is hardly meaningful.
- Regarding subsidiary occupations, only 13 number of persons are engaged mostly in allied agricultural activities [10 person].

484
- Regarding average monthly income, 80.44 percent family members are within the average monthly income range of Rs. 1001.00 and above.
- Similarly regarding expenditure, 82.62 percent family members are within average monthly expenditure range of Rs. 1001.00 and above.
RESULTS OF SURVEY SUBJECTS OF TRAINING RECEIVED– ADOPTED AND CLUSTER VILLAGES 8.127 At the outset it is, perhaps, necessary to clarify the point that there are 188 number of
families who took part in vocational training, front line demonstration and on farm testing which are three basic mandates of K.V.K. The total responding families from vocational training, front line demonstration and on farm testing will not tally with the figure of 188 as from this basic figure the responding families participated in three fundamental activities. The entire analysis is based upon family approach as normally one member from each family from adopted and cluster villages, where there is direct intervention of K.V.K. takes part in various training programmes. It is evident that in what follows only adopted and cluster villages have been taken into account, i.e. 9 number of villages, excluding one control village where there is no intervention of K.V.K.
8.128 Out of the total of 199 households identified for detailed enquiry, 188 families have
responded to various training and demonstration initiatives of the K.V.K. constituting 94.47 percent to total identified households, which, no doubt, is an encouraging picture that shows the awareness and intent of the farming community to adopt various technologies related to agriculture. In what follows an attempt has been made to present the item wise details of various initiatives adopted by the K.V.K. in the fields of vocational training, front line demonstration and on farm testing.
VOCATIONAL TRAINING 8.129 The table below shows the details;
Table No. 8.44
Subjects of Training Received – Vocational Training. Subject on Which Training Received S.
No. Name of Village No. of
Respondent/families
Crop Prod Agronomy
Horticulture Livestock Dairying Poultry
Fisheries
1 2 3 4 5 6 7 1 Baaruka 30 30 4 0 0 2 Antara 31 31 15 0 0 3 Nipaniya 36 36 8 0 0 I Adopted Village 97 97 27 0 0
4 Chhatarpur 6 6 1 0 0 5 Antari 8 8 2 0 0 6 Simariya 10 10 2 0 0 7 Katahari 17 17 6 0 0 8 Purnia 17 17 8 0 0 9 Jhagraha 33 33 11 0 0 II Cluster Village 91 91 30 0 0 Total All Villages 188 188 57 0 0

485
Table No. 8.44 [Contd…] Subjects of Training Received – Vocational Training.
Subject On Which Training Received S. No.
Name of Village Home
Science Training of Rural Youth
Agro Forestry
Organic Farming
Water Shed
Activities 1 2 8 9 10 11 12 1 Baaruka 6 0 0 5 0 2 Antara 6 0 0 8 0 3 Nipaniya 7 0 0 5 0 I Adopted Village 19 0 0 18 0 4 Chhatarpur 0 0 0 3 0 5 Antari 2 0 0 0 0 6 Simariya 3 0 0 1 0 7 Katahari 3 0 0 4 0 8 Purnia 6 0 0 4 0 9 Jhagraha 8 0 0 4 0 II Cluster Village 22 0 0 16 0 Total All Villages 41 0 0 34 0
8.130 The above table shows the extent of major participation in the fields of agronomical crops
[cent percent] and horticultural crops by 57 household representative that occount for 30.32 percent to total of 188 responding families. The trend is more or less common for all the six K.V.Ks. covered under the study which emphatically indicates that rural households still cling to agriculture for earning livelihood and consider their farm as sole savier of their families backed by the years of confidence that they repose in it, despite its vagarent nature. Next to agriculture, comes the subjects like home science wherein 41 household [21.81 percent] and organic farming with 34 households [18.09 percent] have shown their interest. Home science is an area which is gradually picking – up in rural areas as being considered to be good source of subsidiary income mainly generated by women who do jobs like preparation of pickles, papad, bari etc. The introduction of the concept of self help groups constituted for women have brought startling change in awareness among females who want to contribute for augmentation of family income. This, in stride, to some extent, has brought a degree of empowerment as well. Though the progress is slow, but, given the proper surrounding, the roots will certainly be deepened. The interest for subject like organic farming is indicative of one basic fact that cultivators of our area of study are serious about the qualitative upgradation of their product that fetchs higher returns. Regarding subjects like livestock, dairying, poultry, fisheries, training of rural youth agro-forestry and watershed activities, the participation of persons are nil which, ofcourse, is a drawback as these subjects are very important for any rural economy.
FRONT LINE DEMONSTRATION [F.L.D.] 8.131 The main objective of the front line demonstration is to demonstrate newly released crop
production and protection technologies and its management practices in the farmer’s fields. However, in front line demonstrations, the interactions regarding home science activities, training of rural youth and all the other items as specified for vocational training are supposed to be done to educate the farmers for augmentation of income. The table below shows the details;

486
Table No. 8.45 Subjects of Training Received – Front Line Demonstration
Subject On Which Training Received S. No
Name of The Village No. of Responde
nt Crop Prod Agronomy
Horticulture Live Stock Dairying Poultry
Fisheries
1 Baaruka 7 7 0 0 0 1 Antara 6 6 0 0 0 2 Nipaniya 6 6 0 0 0 3 Adopted Village 19 19 0 0 0 I Chhatarpur 2 2 0 0 0
4 Antari 2 2 0 0 0 5 Simariya 1 1 0 0 0 6 Katahari 2 2 0 0 0 7 Purnia 3 3 0 0 0 8 Jhagraha 3 3 0 0 0 9 Cluster Village 13 13 0 0 0 II Total All Villages 32 32 0 0 0
8.132 At the outset it may, perhaps, be necessary to clarify the point that a crowded participation
in F.L.Ds. is not possible for the reasons that these are organised on selected areas and are constrained by availability of budget.
8.133 The above table shows that out of 188 responding families 32 family representatives [17.02
percent] have responded to various programmes of front line demonstrations which is not much fair as in case of K.V.K. Bhopal the extent of respons is 39.31 percent. Here again, like vocational training, the crop production [agronomy] group seems very popular where cent percent households have shown interest in newly released crop production and protection technologies. In non of the other subjects F.L.Ds. have been organised which no doubt is a definite gap.
ON FARM TESTING [O.F.T.] 8.134 In this practice the farmers participate in identifying problems and its priorities and
managing experiments and evaluating results. It is, therefore, an adaptive research with farmers perspective. The basic objective of O.F.T. is to identify existing inputs or practices that might help to solve major problems of many farmers in defined study area. The table below shows the details;

487
Table No. 8.46 Subjects of Training Received – On Farm Testing
Subject On Which Training Received S. No.
Name of The Village
No. of Respondents Crop Prod
Agronomy Horticu-lture
Live Stock Dairying Poultry
Fisheries
1 2 3 4 5 6 7 1 Baaruka 2 2 0 0 0 2 Antara 4 4 0 0 0 3 Nipaniya 1 1 0 0 0 I Adopted Village 7 7 0 0 0
4 Chhatarpur 0 0 0 0 0 5 Antari 0 0 0 0 0 6 Simariya 0 0 0 0 0 7 Katahari 0 0 0 0 0 8 Purnia 3 3 0 0 0 9 Jhagraha 1 1 0 0 0 II Cluster Village 4 4 0 0 0
Total All Villages 11 11 0 0 0 8.135 The above table shows that out of the total of 188 responding households only
representatives of 11 households have shown interest towards organisation of O.F.T., which is 5.85 percent to total responding households and that too only for agronomy. In rest of the subjects no a O.F.T.s have been organised which, ofcourse is a definite gap.
8.136 The conclusion that can be drawn from above narration is that the efforts of the
K.V.K. through vocational training, front line demonstration and on farm testing were concentrated mainly on subjects like agronomy, horticulture and to some extent home science and organic farming wherein the resprentatives from responding households took interest and got vocational training and F.L.Ds. and O.F.Ts. organised. On rest of the subjects like live stock, fisheries, training of rural youth, agro-forestry and watershed activities the interest was nil. Therefore the impact of such activities can not be assessed.
IMPACT OF K.V.K. 8.137 In the foregoing paragraphs an analysis of subject wise training received has been presented.
In what follows an attempt has been made to present the impact of individual items of training in the broad categories of;
- Vocational Training - Front Line Demonstration - On Farm Testing
both before and after training [BT, AT] situations. This is the most important part of the report that clearly indicates the impact of K.V.K’s. interventions on agronomy, horticulture, livestock and dairying, fisheries, home science. Watershed activities, agro-forestry etc.
VOCATIONAL TRAINING – AGRONOMY - CEREALS 8.138 The table below shows the impact of K.V.K’s. intervention over cereal crops;

488
Table No. 8.47 Agronomy – Cereals
Yield Per- Hectare - Kg. Wheat Paddy
S. No.
Name of The Village
No. of Respondents
BT AT No. of Respondents
BT AT
1 2 3 4 5 6 7 8 1 Baaruka 7 2571 2857 31 1190 2171 2 Antara 8 2475 2800 31 1350 2791 3 Nipaniya 9 2622 3233 36 1791 2987
I Adopted Village 24
4 Chhatarpur 3 3300 3500 6 1575 2259 5 Antari 2 2300 2950 8 1971 2140 6 Simariya 2 3300 3450 10 1971 2079 7 Katahari 4 2700 3125 17 1879 2051 8 Purnia 6 3683 4033 13 1991 2098 9 Jhagraha 8 2363 2975 33 1991 2151
II Cluster Village 25 87
Total All Villages 49 185
Table No. 8.47 [Contd…] Agronomy – Cereals
Yield Per- Hectare - Kg. Maize Jowar
S. No.
Name of The Village
No. of Respondents
BT AT No. of Respondents
BT AT
1 2 9 10 11 12 13 14 1 Baaruka 9 978 1244 0 0 0 2 Antara 0 0 0 0 0 0 3 Nipaniya 6 1633 1900 0 0 0 I Adopted Village 15 0
4 Chhatarpur 3 1733 1867 2 550 850
5 Antari 0 0 0 0 0 0
6 Simariya 2 1450 1750 0 0 0
7 Katahari 0 0 0 0 0 0 8 Purnia 4 1150 1175 0 0 0 9 Jhagraha 1 0 800 0 0 0 II Cluster Village 10 2
Total All Villages 25 2 8.139 Regarding wheat crop a total of 49 households have responded to the vocational training
which is 26.06 percent to total of 188 responding household. For every village the yield per hectare in after training situation is better than before training condition that ranged between 2800 kg per hectare in village Antara [adopted village] to 4033 kg per-hectare in village Purnia [cluster village]. The yield per hectare of wheat in both before and after training situations is higher than district and state level productivity figures of 771 kg and 1867 kg respectively respectively that indicates the positive impact of K.V.Ks. effort.

489
8.140 As regards paddy crop only 185 number of households [98.40 percent] have responded to vocational training with yield per hectare in A.T. situations, more than of B.T. situations for all the villages covered under the study that ranged between 2051 kg per hectare for village Ktahari [cluster village] to 2987 kg per hectare for village Nipaniya [adopeted village], much higher than the distric t and state level average per hectare yield of 997 kg and 1058 kg respectively. Again the impact of the K.V.Ks. effort is evident.
8.141 Regarding maize crop the total responding families are 29 [15.43 percent] which is exceptionally high. Here again the per-hectare yield in after training situations is higher than before training conditions ranging between 800 kg per hectare for village Jhagraha [cluster village] to 1900 kg per hectare for village Nipaniya [adopted village] indicating positive impact. As compared to district and state level productivity of 1299 kg and 2072 kg respectively, the per hectare yield in identified adopted and cluster villages is lower than both district and state average productivities. 8.142 Regarding Jowar crop, the total responding families are only 2 forming 1.06 percent to total
of 188 responding households. For every reporting village the per hectare yield in after training situation is higher than that of before training conditions which is 550 kg per hectare for village Chhatarpur [cluster village] which is less than the district average productivity of 1134 Kg. and State average productivity of 1342 kg.
VOCATIONAL TRAINING – AGRONOMY – PULSES 8.143 The table below shows the details
Table No. 8.48 Agronomy – Pulses
Yield Per- Hectare - Kg. Gram Arhar Lentil
S. No
Name of The Village
No. of Respondents
BT AT No. of Respondents
BT AT No. of Respondents
BT AT
1 2 3 4 5 6 7 8 9 10 11 1 Baaruka 6 2010 2395 9 833 1000 1 500 700 2 Antara 6 1982 2410 5 760 940 0 0 0 3 Nipaniya 6 2159 2491 7 900 1043 0 0 0
I Adopted Village 18 21 1
4 Chhatarpur 2 2001 2251 3 600 900 0 0 0 5 Antari 2 1991 2175 2 650 903 0 0 0 6 Simariya 2 2001 2251 3 767 933 0 0 0 7 Katahari 3 1997 2319 3 733 904 0 0 0
8 Purnia 4 2001 2159 5 1240
1480 0 0 0
9 Jhagraha 9 2110 2257 8 838 1100 0 0 0 II Cluster Village 22 24 0
Total All Villages 40 45 1 8.144 Gram being an important crop in pulses group the total number of families responding to
vocational training are 40 [21.28 percent] with remarkable yield rates in after training conditions as compared to before training situations which ranged between 2159 kg per hectare for village Purnia [cluster village] to 2491 kg per hectare for village Nipaniya [adopted village] which are higher than both district average productivity of 452 kg and state average productivity of 932 kg.
8.145 Similarly for Arhar crop the responding households are 45 [23.94 percent] with yield rates
per hectare higher in after training situations as compared to prevailing rates in before

490
training conditions which ranged between 900 kg per hectare for village Chhatarpur [cluster village] to 1480 kg per hectare for village purniya [cluster village]. When compared with district average productivity [567 kg] and state average productivity [825 kg] it has been found that the yield rates prevailing in after training situations for most of the villages are higher than both district and to state level average productivity.
8.146 Lentil being comparatively an unimportant crop of the district, the responding families
requiring vocational training is only a 1 [0.53 percent] from village Baaruka wherein the yield rate in after training situation is more than before training conditions that accounted for 700 kg per hectare higher than the district average productivity of 439 kg and state average productivity of 506 kg.
VOCATIONAL TRAINING – AGRONOMY – OIL SEEDS 8.147 The table below shows the details;
Table No. 8.49
Agronomy – Oil Seeds – Mustard Yield Per- Hectare - Kg.
Mustard S. No
Name of The Village
No. of Respondents
BT AT
1 2 3 4 5 1 Baaruka 7 543 700 2 Antara 6 633 833 3 Nipaniya 6 700 883
I Adopted Village 19 4 Chhatarpur 2 600 800 5 Antari 2 650 700 6 Simariya 0 0 0 7 Katahari 3 493 603 8 Purnia 4 1025 1175 9 Jhagraha 5 580 860
II Cluster Village 16 Total All Villages 35
8.148 Mustard, though an important crop of the district the response is substantial as 35 number
of households have responded to the vocational training organised by K.V.K. that comes to 18.62 percent to total of 188 responding households. The productivity in after training situation is better than before training conditions that ranged between 603 kg per hectare for village Katahari [cluster village] to 1775 kg per hectare for village Purnia [cluster village], higher than district average figures of 315 kg and lower than State level average productivity of 1009 for most of the villages.
8.149 The participation of households for receiving training on crops like Soyabean, cotton,
sugarcane and linseed is nil, therefore, the impact of vocational from training over such crops will not be visible.

491
VOCATIONAL TRAINING – HORTICULTURE 8.150 Horticulture crops are important from the twin view points of diversification of traditional
crop cultivation and employment generation. Being perennial these crops help in checking soil erosion and being tough can be grown on waste land not suitable for traditional crops. The following table shows the details;
Table No. 8.50
Horticulture Crops Yield Per- Hectare - Quintal
Potato Onion S.No
. Name of The Village
No. of Respond
ents
BT AT No. of Respondents
BT AT
1 2 3 4 5 6 7 8 1 Baaruka 0 0 0 1 180 290 2 Antara 14 197 203 0 0 0 3 Nipaniya 0 0 0 1 170 210 I Adopted Village 14 2
4 Chhatarpur 0 0 0 0 0 0 5 Antari 2 200 211 0 0 0 6 Simariya 0 0 0 0 0 0 7 Katahari 6 198 211 0 0 0 8 Purnia 2 200 245 3 187 245 9 Jhagraha 11 195 211 0 0 0 II Cluster Village 21 3
Total All Villages 35 5
Table No. 8.50 [Contd…] Horticulture Crops
Yield Per- Hectare - Quintal Tomato Brinjal
S. No.
Name of The Village
No. of Respondents
BT AT No. of Respondents
BT AT
1 2 9 10 11 12 13 14 1 Baaruka 3 153 193 2 320 341 2 Antara 8 139 158 8 201 247 3 Nipaniya 6 165 202 4 211 271 I Adopted Village 17 14
4 Chhatarpur 1 190 200 1 200 220 5 Antari 0 0 0 2 290 330 6 Simariya 1 150 180 1 200 250 7 Katahari 2 150 170 3 214 279 8 Purnia 3 200 230 4 209 214 9 Jhagraha 8 148 170 8 279 291 II Cluster Village 15 19
Total All Villages 32 33

492
Table No. 8.50 [Contd…] Horticulture Crops
Yield Per- Hectare - Kg. Chilly Bhindi Cucerbits
S. No
Name of The Village
No. of Respond
ents
BT AT No. of Respondents
BT AT No. of Respondents
BT AT
1 2 15 16 17 18 19 20 21 22 23 1 Baaruka 2 140 165 0 0 0 0 0 0 2 Antara 3 188 189 1 80 90 0 0 0 3 Nipaniya 2 160 185 2 140 190 0 0 0
I Adopted Village 7 3 0
4 Chhatarpur 0 0 0 0 0 0 0 0 0
5 Antari 0 0 0 0 0 0 0 0 0
6 Simariya 1 150 157 1 80 90 0 0 0
7 Katahari 1 200 210 1 70 90 0 0 0 8 Purnia 2 175 190 2 200 250 2 165 190 9 Jhagraha 2 170 200 3 265 270 0 0 0
II Cluster Village 6 7 2
Total All Villages 13 10 2
8.151 The cultivation of horticulture crops is popular in district Shahdol due to climatic support and awareness among cultivators about the value of such crops for income augmentation. In ensuing paragraphs the cropwise analysis has been presented. However, it will not be out of place to mention that since distric t and state average productivity figures are not available, a comparison has not been made.
8.152 In case of Potato crop 35 number of households have responded to the vocational training
programme which is 18.62 percent to total of 188 responding families. The per hectare yield has enhanced in every reporting village after receiving the training which ranged between 203 quintal per hectare for village Antara [adopted village] to 245 quintal per hectare for village Purni [cluster village]. The impact of the efforts of the K.V.K. is thus evident.
8.153 Regarding Onion crop only 5 number of family representatives [2.66 percent] have
participated in vocational training resulting in enhanced per hectare yield in after training situation as compared to before training conditions that ranged between 210 quintal per hectare for village Nipania [adopted village] to 290 quintal per hectare for village Baaruka [adopted village].
8.154 Tomato is yet another crop gradually becoming popular as 32 number of households [17.02
percent] have shown interest to have vocational training resulting in enhancement of per hectare yield after participating in training as compared to before training conditions, ranging between 158 quintal per hectare for village Antara [adopted village] to 230 quintal per hectare for village Purnia [cluster village].
8.155 Regarding Brinjal, 33 family members [17.55 percent] have taken part in vocational
training that resulted in enhanced per hectare yield in after training situation as compared to before training conditions, ranging between 214 quintal per hectare for village Purnia [cluster village] to 341 quintal per hectare for village Baaruka [adopted village].
8.156 Chilly and Bhindi are the crops wherein 13 and 10 family representatives respectively have
responded to vocational training programme that constitute 6.91 percent and 5.32 percent respectively to total of 188 responding families. The per hectare yield in after training situation is much higher as compared to before training conditions that shows the impact of vocational training programme initiated by the K.V.K.

493
8.157 In the group of Cucerbits, the number of families responded are 2 which can hardly be termed as encouraging picture. However the yield per hectare in after training situation is better than before training position that vouches for positive impact of vocational training.
8.158 Since no vocational trainings have been organised for horticultural crops like spices, mango,
banana, papaya and citrus, the impact of the K. V. K. will not be visible for such crops. VOCATIONAL TRAINING – HOME SCIENCE 8.159 Home Science activities are getting popular in rural areas as it generates employment
opportunities among women. The initiatives taken by the government in forming self help groups for females have brought awareness to go for supporting activities that ultimately culminates into augmentation of income. The table below shows the details;
Table No. 8.51
Home Science Activities Toy Making
No. Pickeles
Kg. S.
No. Name of The Village
No. of Respondents
BT AT No. of Respondents
BT AT
1 2 3 4 5 6 7 8 1 Baaruka 0 0 0 6 13 40 2 Antara 0 0 0 7 0 19 3 Nipaniya 1 0 2 6 17 33
I Adopted Village 1 0 2 19 30 92
4 Chhatarpur 0 0 0 0 0 0 5 Antari 0 0 0 2 1 9 6 Simariya 0 0 0 2 2 12 7 Katahari 0 0 0 1 2 0 8 Purnia 0 0 0 5 8 29 9 Jhagraha 0 0 0 6 3 26
II Cluster Village 0 0 0 16 16 76
Total All Villages 1 0 2 35 46 168
Table No. 8.51 [Contd…] Home Science Activities
Backery Papad/Bari/Jam/Jelly Kg. S. No.
Name of The Village
No. of Respondents
BT AT No. of Respondents
BT AT
1 2 9 10 11 12 13 14 1 Baaruka 0 0 0 1 0 2 2 Antara 0 0 0 5 1 14 3 Nipaniya 1 0 2 2 0 5
I Adopted Village 1 0 2 8 1 21
4 Chhatarpur 0 0 0 0 0 0
5 Antari 0 0 0 2 0 6
6 Simariya 2 0 3 0 0 0
7 Katahari 0 0 0 1 0 4 8 Purnia 1 0 1 3 0 10 9 Jhagraha 0 0 0 6 1 17
II Cluster Village 3 0 4 12 1 37
Total All Villages 4 0 6 20 2 58

494
8.160 Ever since the plastic toys have come in the rural markets, the indigenous art of making clay toys is getting extinct as is evident from the fact that only 1 number of family representative has participated in vocational training organised for toy making from the village Nipania [adopted village] which is 0.53 percent to total of 188 responding families with 2 number of toys made in after training conditions which is hardly an impact worth mentioning.
8.161 Preparation of pickles is an item getting popular in rural areas as the skill is already there.
Out of 188 responding families, 35 households [18.62 percent ] have responded to the vocational training with preparation of 168 kg of pickles after getting the training as compared to 46 kgs in before training conditions. The impact of the intervention of K.V.K. is, thus, visible.
8.162 Regarding backery items the participation of only 4 households is far from being tangible. 8.163 Regarding preparation of papad/bari/jam/jelly, 20 family representatives [10.64 percent]
have participated in vocational training with preparation of 58 kgs of such items in after training conditions as compared to 2 kgs in before training situations. This is one of the home science activities which have immense scope in rural areas. The government interventions through various target oriented programmes of Rural development department may yield startling results.
8.164 Regarding training of rural youth only 3 households have taken part in training regarding
motor binding with placement of 3 persons in after training situations. It may be mentioned that TRYSEM is one of the massive schemes of the government aimed at training of rural youth for self employment. With such scheme in vogue, it is always doubtful whether the rural youth will be participating in any such training organised by K.V.K., specially when there is no gurantee of placement.
VOCATIONAL TRAINING – ORGANIC FARMING 8.165 Organic farming though is a practice usually followed by big cultivators or government
farms, but in our area of study 22 number of family representatives which is 11.70 present to total of 188 responding households have participated in vocational training regarding bio–fertiliser with production 640 kgs. of bio-fertiliser in after training situations as compared to only 40 kgs. in before training conditions.
8.166 No vocational trainings have been organised on subjects like livestock and dairying,
poultry, fishery developments, agro forestry and watershed activities, all very important subjects for any rural economy. As such the impact of such subjects will not be visible.
8.167 In the following paragraphs an attempt has been made to sum-up the efforts of
vocational training imparted by the K.V.K. - Regarding the yield per hectare both for agronomical and horticutlral crops the after
training status as compared to before training conditions are better that clearly shows the positive impact of vocational training imparted by the K.V.K.
- Regarding wheat crop the per hectare yield in after training situation is more than district and state average productivity of 771 kg. and 1867 kg. respectively.
- Similar is the situation with paddy crop, where per hectare yield in after training situations is more than the district and state average productivity of 997 kg and 1058 kg respectively.
- Reverse is the situation with maize crop where per – hectare yield in after training situation is less than district and state level productivity of 1299 kg and 2072 kg respectively.

495
- Regarding jowar crop only 2 number of family representatives have responded to vocational training with per hactare yield less than the district level average productivity of 1134 kg and state level average productivity of 1342 kg.
- In pulses group vocational trainings have been organised for gram, arhar and lentil. The yied per hectare in after training situations for all these crops are higher than the prevailing average productivity both at district and state levels.
- In oil seed group, only for mustard crop vocational trainings has been organised with participation from 35 number of households [1862 percent to total of 188 responding households] with per hectare yield in excess of both district and state average productivities.
- Horticulture crops being non-conventional, are pieking–up in Shahdol district as vocational training regarding crops like potato, onion, tomato, brinjal, chilly, bhindi and cucerbits have been organised with productivity much higher in ofter training situations as companed to before training conditions.
- Home science activities, particularly for functions like preparation of pickles and papad/badi etc. are getting popular in shahdol district as response to vocational training is substantial.
- Regarding training of rural youth only 3 households have taken part in vocational trainings for motor binding with placement of three pesons in after training situations.
- Preparation of bio–fertilizer is becoming popular in the district as 22 number of family representatives which is 11.70 percent to total of 188 responding households have participated in the vocational training regarding bio–fertilizer with preparation of 640 kgs. of it in after training situations as compared to only 40 kgs. in befor training conditions.
- No vocational training have been arganised on subjects like livestock and dairying, poultry, fishery development, agro – forestry and watershed activities, all very important subjects for any rural economy. As such the impact of such subject will not be visible.
FRONT LINE DEMONSTRATION [F.L.D.] 8.168 Front line demonstrations [FLD] are organized on farmer’s field with the result the response
is bound to be low as compared to vocational training. The table below shows the impact of front line demonstrations on cereal crops.
Table No. 8.52
Agronomy – Cereals Yield Per- Hectare - Kg.
Wheat Paddy S. No
Name of The Village
No. of Respon-dents
BT AT No. of Respon-dents
BT AT
1 Baaruka 2 2900 3402 4 1420 1550 2 Antara 3 2167 2667 3 1521 2140 3 Nipaniya 2 2550 3400 4 1370 1570
I Adopted Village 7 11
4 Chhatarpur 0 0 0 1 3100 3900 5 Antari 1 2000 2700 0 0 0 6 Simariya 0 0 0 1 3100 3800 7 Katahari 0 0 0 2 2980 3541 8 Purnia 1 2451 3700 2 2781 2798 9 Jhagraha 2 3000 3200 2 2240 2895
II Cluster Village 4 8
Total All Villages 11 19

496
8.169 The front line demonstrations for the wheat crop have been organized on the fields of 11 cultivating households which is 5.85 percent to total of 188 responding families. The yield per-hectare in after training situation is higher than before training situation for every village that ranged between 2667 kg. per hectare for the village Antara [adopted village] to 3402 kg per hectare for village Baaruka [adopted village] which is far in excess of district and state average productivity of 771 kg and 1867 kg respectively.
8.170 Regarding paddy crop 19 number [10.11 percent] of demonstrations have been organised
with yield per hectare higher in after training situations as compared to before training conditions that ranged between 1550 kg per hectare for villages Baaruka [adopted villages] to 3900 kg per hectare for village Chhatarpur (cluster village) which are higher than the district average productivity of 997 kg and state average productivity of 1058 kg.
8.171 No F.L.Ds. have been organised for Maize and Jowar. Maize for which response
regarding vocational training is substantion, a few F.L.Ds. should have been organised for this crop specially when this is grown mostly by marginal and small farmers.
AGRONOMY - PULSES 8.172 The table below shows the details;
Table No. 8.53
Agronomy – Pulses – Arhar Yield Per- Hectare - Kg.
Arhar S. No
Name of The Village
No. of Respon-dents BT AT 1 Baaruka 1 800 1000 2 Antara 0 0 0 3 Nipaniya 0 0 0
I Adopted Village 1
4 Chhatarpur 0 0 0
5 Antari 1 700 900
6 Simariya 0 0 0
7 Katahari 1 900 1000 8 Purnia 0 0 0 9 Jhagraha 0 0 0
II Cluster Village 2 Total All Villages 3
8.173 For Arhar only 3 F.L.Ds. have been organised at villages Baaruka, Antari and Katahari
despite substantial response for vocational training, with productivity of 900 to 1000 kg per hectare in after training situation, higher than both in before training conditions and average district productivity of 567 kg and state average productivity of 825 kg.
8.174 No F. L. D.s have been organised on subjects like horticulture, livestock and dairy,
poultry, fishery development, home science, training of rural youth, agro-forestry, organic farming and watershed activities which no dobt is a gap in performance. Practically every subject has been left out. The performance is sketchy resulting in gap in introduction of new and prevailing technology in the field. The K.V.K. Shahdol have to sort out such snags in performance.

497
8.175 To sum-up - Regarding organisation of F.L.Ds. the performance is just sketchy without having
tangible impact as most of the important subjects like horticulture livestock and dairying, poultry, fishery development, home science, training of rural youth, agro-forestry, organic farming and watershed activities have been left out.
- Since F.L.Ds. are measures of learning by do ing, more extensive implemention of this mandate must be attempted, matching to vocational training. What is required is to plan the F.L.Ds. much in advance in consultation with district authorities of line departments like agriculture, horticulture and Chief Executive Officer of Zila Panchayat etc. so that an understanding of State Plan priorities are reflected over such advance planning. The vocational training may thus be organised to provide a basic class room knowledge regarding subjects on which F.L.Ds. are to be organised so that farmers are equipped with ready knowledge. After this step, the F.L.Ds. may be organised which will immensely help the cultivators to implement the technology.
ON FARM TESTING [OFT] - CEREALS 8.176 In case of On Farm Testing, recommended technologies are tested on farmer’s fields leading
to the solution of various farming problems. The extent of response will obviously be low as the new technologies are not very frequent.
8.177 The table below shows the details;
Table No. 8.54 Cereal Crops
Yield Per- Hectare - Kg. Wheat Paddy
S. No.
Name of The Village
No. of Respondents
BT AT No. of Respondents
BT AT
1 Baaruka 1 0 3500 2 1510 2151 2 Antara 2 2550 2850 1 2700 3000 3 Nipaniya 0 0 0 2 2151 3125
I Adopted Village 3 5
4 Chhatarpur 0 0 0 0 0 0 5 Antari 0 0 0 0 0 0 6 Simariya 0 0 0 0 0 0 7 Katahari 0 0 0 0 0 0 8 Purnia 1 3800 4500 2 2981 3051 9 Jhagraha 0 0 0 0 0 0
II Cluster Village 1 2
Total All Villages 4 7 8.178 In case of Wheat, 4 number of on farm testing have been organised with yield per hectare
higher in after training situation as compared to before training conditions that ranged between 2850 kg per hectare in village Antara [adopted village] to 4500 kg per-hectare in village Purnia [cluster village] which are much higher than the district and state average productivities of 771 kg and 1867 kg respectively.

498
8.179 Regarding Paddy, 7 O.F.Ts. have been organised with yield per hectare higher in after training situations that ranged between 2151 kg per hectare in village Baaruka [adopted village] to 3125 kg per hectare in village Nipaniya [adopted village] which are higher district average per hectare yield of 997 kg and state average figure of 1058 kg per hectare.
ON FARM TESTING – PULSES CROPS 8.180 The table below shows the details;
Table No. 8.55 Pulses - Arhar
Soyabeen S. No.
Name of The Village No. of Respondents BT AT
1 Baaruka 1 800 1000 2 Antara 0 0 0 3 Nipaniya 0 0 0
I Adopted Village 1
4 Chhatarpur 0 0 0 5 Antari 0 0 0 6 Simariya 0 0 0 7 Katahari 0 0 0 8 Purnia 0 0 0 9 Jhagraha 0 0 0
II Cluster Village 0
Total All Villages 1 8.181 Regarding Arhar only 1 number of O.F.T. has been organised in village Baaruka [adopted
villages] with higher yield rate as compared to district and state level average productivities of 567 kg and 825 kg respectively in after training situations.
8.182 No O.F.Ts. have been organised on subjects like horticulture, livestock and dairying,
poultry, fishery development, home science, training of rural youth, agro -forestry organic farming and watershed activities, which are very relevant to rural economy. The impact of such activities through O.F.Ts. therefore, will not be visible.
8.183 In the following paragraphs summing-up efforts have been made regarding results of
O.F.T. - In case of O.F.T., the yield per-hectare in after training situation is more than before
training conditions as has happened for both vocational training and front line demonstrations which shows the positive impact of K.V.Ks. efforts.
- The overall performance regarding organizing O.F.Ts. is somewhat sketchy as is evident from that fact that on very important subjects like horticulture, livestock and dairying, poultry, fishery development, agro-forestry and watershed activities, no O.F.Ts. have been organised. Also there is complete mismatch between extent of organizing vocational training and O.F.T. As said earlier there should be definite chain of action between three basic mandates, i.e. vocational training, F.L.D. and O.F.T. with sequential results of impact of new or prevailing technologies.

499
STATUS OF ACTIVITIES IN CONTROL VILLAGE – KERHAI 8.184 The study has identified one control village, i.e,. Kerhai with 11 number of households and
61 sample family members, where there is no intervention of K.V.K. The information regarding common items of agronomical and horticulture crops have been collected to show the comparative status in areas of intervention and non-intervention. However, in case of control village before and after training situations have not been shown as there is no effort of K.V.K. in this village. For comparison, average performance of vocational training in after training situation for adopted and cluster villages have been taken as the participation regarding all subjects is maximum in case of vocational training. The table below shows the comparative status of control village on one side and adopted and cluster villages on other side.
Table No. 8.56
Comparative Status of Performance Among Control Village and Adopted and Cluster Villages Sl. No.
Item Control Village Adopted and cluster villages (average)
Difference [+ or -] over col. 3
1 2 3 4 5 PER HECTARE YIELD – KG
CEREALS 1 Wheat 3033.00 3213.67 (+) 180.67 2 Paddy 2291.00 2303.00 (+) 12.00 3 Maize 1417.00 1456.00 (+) 39.00 4 Jowar 533.00 850.00 (+) 317.00 PULSES 5 Gram 900.00 2300.89 (+) 1400.89 6 Arhar 800.00 1022.56 (+) 222.56 7 Lentil - 700.00 - OIL SEEDS 8 Soybean - - - 9 Mustard 733.00 819.25 (+) 86.25 10 Linseed - - -
HORTICULTURE CROPS – QUINTAL 11 Potato - 216.20 - 12 Onion 200.00 248.33 (+) 48.33 13 Tomato 170.00 187.88 (+) 17.88 14 Brinjal 180.00 271.44 (+) 91.44 15 Chilly - 185.14 - 16 Bhindi - 163.33 - 17 Cucerbits - 190.00 -
8.185 The above table shows that except for the crops like wheat, jowar, arhar, mustard and brinjal
where the per-hectare yield for adopted and cluster villages is substantially high as compared to that prevailing in control village, for rest of the crops the diffe rence in per hectare yield is not much between adopted/cluster villages on one side and the control village on the other side. This shows that district as whole has condusive conditions for agricultural activities.
8.186 In the field of home science activities, particularly regarding preparation of pickles and
papad/bari/jam/jelly etc. substantial work has been done in adopted and cluster villages through the efforts of K.V.K. whereas such activities are not very popular in control village.

500
RESULTS OF SURVEY – INDIVIDUAL PARTICULARS ADOPTED AND CLUSTER VILLAGES 8.187 In the following paragraphs an attempt has been made to highlight the various reactions of
25 percent of individuals. The total number of sample family members as reported is 1145 for adopted, cluster and control villages, the 25 percent of which comes to 286. But we have taken the figure of 285 due to certain demographic particulrs. However, a deviation of few figures plus or minus is immaterial so long if does not vitiate the survey results.
Table No. 8.57 Basic Details
Sl. No.
Item Total number of family members of 25% of households
25 % of individuals taken from 25% of households
1 2 3 4 1 Adopted Villages 561 138 2 Cluster Villages 523 132 3 Control Village 61 15 Total 1145 285
8.188 In the following paragraphs an attempt has been made to highlight the individual reactions
in adopted and cluster villages, i.e. for 270 individuals. 8.189 The criteria for selection of individuals are as follows; - The individual should be the adult member of the family. - He should be associated with any programme of K.V.K. For individuals of control village,
this criterion is not applicable. - He/She should be literate, may be without having any formal education. SOCIAL CLASSIFICATION OF INDIVIDUALS 8.190 The table below shows the details;
Table No. 8.58
Social Classification Social classification S.
No. Name of the Village No. of
Individual S.T. S.C. O.B.C. GENERAL 1 2 3 4 5 6 7 1. Baaruka 48 12 0 28 8 2. Antara 38 12 0 26 0 3. Nipaniya 52 32 0 12 8 Adopted Village 138 56 0 66 16
4. Chhatarpur 10 10 0 0 0 5. Antari 11 11 0 0 0 6. Simariya 15 8 0 7 0 7. Katahari 22 10 0 8 4 8. Purnia 25 5 0 20 0 9. Jhagraha 49 19 0 30 0 Cluster Village 132 63 0 65 4 Total 270 119 0 131 20

501
8.191 The above table shows that the majority of 119 individuals are from the group of S.T. which is 44.07 percent to total of 270 sample invididuals from adopted and cluster villages. The combined percentage of O.B.C. and General individuals is 55.93 to total sample individuals while no. of individuals from S.C. community is nil. Thus the entire area of adopted and cluster villages is predominated by S.T. population that throws a challenge before K.V.K. scientists to achieve tangible results.
INDIVIDUALS CLASSIFIED ON THE BASIS OF RELIGION 8.192 The following table gives the details;
Table No. 8.59 Classification on the Basis of Religion
Religion S. No.
Name of the Village No. of Individual Hindu Muslim Sikh Christian Nauabudh Others
1 2 3 4 5 6 7 8 9 1. Baaruka 48 48 0 0 0 0 0 2. Antara 38 38 0 0 0 0 0 3. Nipaniya 52 52 0 0 0 0 0 Adopted Village 138 138 0 0 0 0 0
4. Chhatarpur 10 10 0 0 0 0 0 5. Antari 11 11 0 0 0 0 0 6. Simariya 15 15 0 0 0 0 0 7. Katahari 22 22 0 0 0 0 0 8. Purnia 25 25 0 0 0 0 0 9. Jhagraha 49 49 0 0 0 0 0 Cluster Village 132 132 0 0 0 0 0
Total 270 270 0 0 0 0 0
8.193 The above table shows that cent-percent individuals are the followers of Hindu religion. AWARENESS ABOUT THE K.V.K. 8.194 The table below shows the details;
Table No. 8.60 Awareness About the K.V.K.
Awareness about existence of
K.V.K.
If 'yes' knowledge about its location
Awareness about services rendered
by the K.V.K.
S. No
Name of the Village No. of Individual
Yes (1)
No (2)
Yes (1)
No (2)
Yes (1)
No (2)
1 2 3 4 5 6 7 8 9 1. Baaruka 48 48 0 48 0 48 0 2. Antara 38 38 0 38 0 38 0 3. Nipaniya 52 52 0 52 0 52 0 Adopted Village 138 138 0 138 0 138 0
4. Chhatarpur 10 10 0 10 0 10 0 5. Antari 11 11 0 11 0 11 0 6. Simariya 15 15 0 15 0 15 0 7. Katahari 22 22 0 22 0 22 0 8. Purnia 25 25 0 25 0 25 0 9. Jhagraha 49 49 0 49 0 49 0 Cluster Village 132 132 0 132 0 132 0
Total 270 270 0 270 0 270 0

502
8.195 The cent percent awareness about the location and, more important, the services rendered by it is an encouraging indication which shows the positive efforts of the K.V.K. to popularize the its functions.
KNOWLEDGE ABOUT SPECIFIC SERVICES RENDERED BY K.V.K. 8.196 The table below shows the details;
Table No. 8.61 Specific Services Rendered by the K.V.K.
Knowledge about vocational
Knowledge about front line
demonstration training
Knowledge about on farm
testing
S. No
Name of the Village No. of Individual
Yes No Yes No Yes No 1 2 3 4 5 6 7 8 9 1. Baaruka 48 48 0 48 0 48 0 2. Antara 38 38 0 38 0 38 0 3. Nipaniya 52 52 0 52 0 52 0 Adopted Village 138 138 0 138 0 138 0
4. Chhatarpur 10 8 2 0 10 0 10 5. Antari 11 11 0 11 0 11 0 6. Simariya 15 15 0 15 0 15 0 7. Katahari 22 22 0 22 0 22 0 8. Purnia 25 25 0 25 0 23 2 9. Jhagraha 49 49 0 18 31 1 48 Cluster Village 132 130 2 91 41 72 60
Total 270 268 2 229 41 210 60
8.197 The above table shows the substantial knowledgeof individuals about the specific services
rendered by the K.V.K. FIELD VISITS OF K.V.K. SCIENTISTS 8.198 Regular field visits by the K.V.K. scientists are necessary prerequisites for the
implementation of agriculture related technology. The table below shows the extent of such visits;
Table No. 8.62 Field Visits of K.V.K. Scientists
If no the duration gap S. No
Name of the Village No. of Individual One month
(1) Two
month (2)
More than two month
(3)
Never (4)
1 2 3 4 5 6 7 1. Baaruka 48 0 0 0 48 2. Antara 38 0 0 0 38 3. Nipaniya 52 5 0 0 47 Adopted Village 138 5 0 0 133
4. Chhatarpur 10 2 0 0 8 5. Antari 11 4 0 0 7 6. Simariya 15 2 0 0 13 7. Katahari 22 8 0 0 14 8. Purnia 25 1 0 2 22 9. Jhagraha 49 0 4 12 33 Cluster Village 132 17 4 14 97
Total 270 22 4 14 230
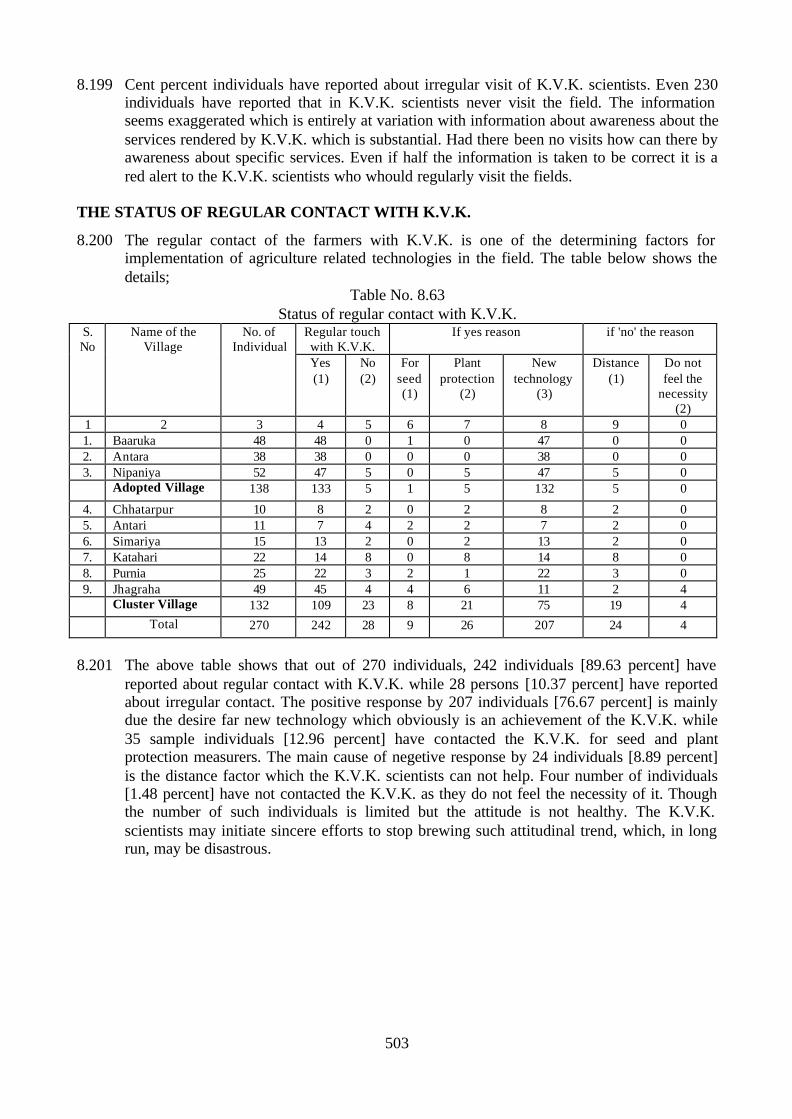
503
8.199 Cent percent individuals have reported about irregular visit of K.V.K. scientists. Even 230 individuals have reported that in K.V.K. scientists never visit the field. The information seems exaggerated which is entirely at variation with information about awareness about the services rendered by K.V.K. which is substantial. Had there been no visits how can there by awareness about specific services. Even if half the information is taken to be correct it is a red alert to the K.V.K. scientists who whould regularly visit the fields.
THE STATUS OF REGULAR CONTACT WITH K.V.K. 8.200 The regular contact of the farmers with K.V.K. is one of the determining factors for
implementation of agriculture related technologies in the field. The table below shows the details;
Table No. 8.63 Status of regular contact with K.V.K.
Regular touch with K.V.K.
If yes reason if 'no' the reason S. No
Name of the Village
No. of Individual
Yes (1)
No (2)
For seed (1)
Plant protection
(2)
New technology
(3)
Distance (1)
Do not feel the
necessity (2)
1 2 3 4 5 6 7 8 9 0 1. Baaruka 48 48 0 1 0 47 0 0 2. Antara 38 38 0 0 0 38 0 0 3. Nipaniya 52 47 5 0 5 47 5 0 Adopted Village 138 133 5 1 5 132 5 0
4. Chhatarpur 10 8 2 0 2 8 2 0 5. Antari 11 7 4 2 2 7 2 0 6. Simariya 15 13 2 0 2 13 2 0 7. Katahari 22 14 8 0 8 14 8 0 8. Purnia 25 22 3 2 1 22 3 0 9. Jhagraha 49 45 4 4 6 11 2 4 Cluster Village 132 109 23 8 21 75 19 4
Total 270 242 28 9 26 207 24 4
8.201 The above table shows that out of 270 individuals, 242 individuals [89.63 percent] have
reported about regular contact with K.V.K. while 28 persons [10.37 percent] have reported about irregular contact. The positive response by 207 individuals [76.67 percent] is mainly due the desire far new technology which obviously is an achievement of the K.V.K. while 35 sample individuals [12.96 percent] have contacted the K.V.K. for seed and plant protection measurers. The main cause of negetive response by 24 individuals [8.89 percent] is the distance factor which the K.V.K. scientists can not help. Four number of individuals [1.48 percent] have not contacted the K.V.K. as they do not feel the necessity of it. Though the number of such individuals is limited but the attitude is not healthy. The K.V.K. scientists may initiate sincere efforts to stop brewing such attitudinal trend, which, in long run, may be disastrous.

504
STATUS OF IMPLEMENTATION OF THE SERVICES OF THE K.V.K. 8.202 The table below shows the details;
Table No. 8.64
Implementation of the Services of K.V.K. Implementation of the services
of K.V.K.
If yes in what fields S No
Name of the Village
No. of Indivi-dual
Yes (1)
No (2)
Agro-nomy
Horti-culture
Animal husbandry
Fisheries
Poultry
1 2 3 4 5 6 7 8 9 10 1. Baaruka 48 47 1 48 0 0 0 0 2. Antara 38 38 0 38 0 0 0 0 3. Nipaniya 52 52 0 52 0 0 0 0 Adopted Village 138 137 1 138 0 0 0 0 4. Chhatarpur 10 10 0 8 0 0 0 0 5. Antari 11 9 2 11 0 0 0 0 6. Simariya 15 15 0 15 0 0 0 0 7. Katahari 22 22 0 22 0 0 0 0 8. Purnia 25 25 0 23 0 0 0 0 9. Jhagraha 49 45 4 49 0 0 0 0 Cluster Village 132 126 6 128 0 0 0 0 Total 270 263 7 266 0 0 0 0
Table No. 8.64 [Contd…]
Implementation of the Services of K.V.K. If yes in what fields If no the reason S.
No.
Name of the Village Home
science
Agro forestry
Organic farming
Water shed
Training of rural youth
Not satisfied with new technolog
y
Problem of
resources
Satisfiedwith
present status
1 2 11 12 13 14 15 16 17 18 1. Baaruka 9 0 4 0 0 0 0 0 2. Antara 10 0 4 0 0 0 0 0 3. Nipaniya 9 0 5 0 0 0 0 0 Adopted
Village 28 0 13 0 0 0 0 0
4. Chhatarpur 0 0 5 0 0 0 4 0 5. Antari 3 0 0 0 0 0 0 0 6. Simariya 6 0 0 0 0 0 0 0 7. Katahari 6 0 1 0 0 0 3 0 8. Purnia 7 0 0 0 0 0 0 0 9. Jhagraha 15 0 0 0 0 0 0 0 Cluster Village 37 0 6 0 0 0 7 0
Total 65 0 19 0 0 0 7 0

505
8.203 The above table shows that out of 270 individuals, 263 individuals [97.41 percent] have implemented the services of K.V.K. which is a fair account of achievement. It is worth mentioning that the figure of itemwise coverage will not tally with the figure of 263 as the same person from agronomy might have implemented the improved techniques in the fields of horticulture, animal husbandry etc.
8.204 The subject wise coverage figures show that the highest number of 266 individuals [98.52
percent] have implemented the services of K.V.K. in the fields of agronomy followed by 65 persons [24.07 percent] for home science and only 19 individuals have shown interest in organic farming.
8.205 Problem of resource is the only factor due to which 7 number of sample individuals [2.59
percent] have not implemented the services of the K.V.K. SATISFACTION LEVEL OF THE INDIVIDUALS ABOUT THE SERVICES OF K.V.K. 8.206 The level of satisfaction derived from the services of K.V.K. is important to sustain the
efforts of K.V.K. over a period of time. The table below shows the details;
Table No. 8.65 Satisfaction Level of the Individuals
Satisfied with the impact
If yes in what fields S. No
Name of the Village No. of Individual
Yes (1)
No (2)
Agronomy Horticultur
e
Animal husban-
dry
Fisheries Poultry
1 2 3 4 5 6 7 8 9 10 1. Baaruka 48 48 0 46 0 0 0 0 2. Antara 38 38 0 38 0 0 0 0 3. Nipaniya 52 52 0 52 0 0 0 0 Adopted Village 138 138 0 136 0 0 0 0
4. Chhatarpur 10 10 0 10 0 0 0 0 5. Antari 11 11 0 11 0 0 0 0 6. Simariya 15 15 0 15 0 0 0 0 7. Katahari 22 22 0 22 0 0 0 0 8. Purnia 25 25 0 25 0 0 0 0 9. Jhagraha 49 49 0 49 0 0 0 0 Cluster Village 132 132 0 132 0 0 0 0
Total 270 270 0 268 0 0 0 0

506
Table No. 8.65 [Contd…] Satisfaction Level of the Individuals
If yes in what fields If no the reason S. No.
Name of the Village Home
science Agro
forestry Organic farming
Water shed
Training of rural youth
Techn-ique is
difficult to
follow
Inputs are not easily available
Non-availabil
ity of advice in the time
1 2 11 12 13 14 15 16 17 18 1. Baaruka 9 0 4 0 0 0 0 0 2. Antara 9 0 5 0 0 0 0 0 3. Nipaniya 9 0 5 0 0 0 0 0 Adopted Village 27 0 14 0 0 0 0 0
4. Chhatarpur 0 0 5 0 0 0 0 0 5. Antari 3 0 0 0 0 0 0 0 6. Simariya 6 0 0 0 0 0 0 0 7. Katahari 6 0 2 0 0 0 0 0 8. Purnia 7 0 0 0 0 0 0 0 9. Jhagraha 15 0 0 0 0 0 0 0 Cluster Village 37 0 7 0 0 0 0 0
Total 64 0 21 0 0 0 0 0
8.207The above table shows the cent percent satisfaction level of individuals regarding impact of
K.V.K. services which in itself is an achievement. 8.208 Regarding subjectwise level of satisfaction, agronomy is the prime subject where 268
individuals [99.26 percent] have shown their satisfaction followed by home science activities [64 individuals] and organic farming [21 individuals].
IMPACT ON INCOME ENHANCEMENT 8.209 The table below shows the details;
Table No. 8.66
Impact on Income Enhancement Income
enhancement If yes the fields S.
No. Name of the Village No. of
Individ-ual Yes
(1) No (2)
Agronomy Horticu-lture
Animal husbandry
Fisheries Poultry
1 2 3 4 5 6 7 8 9 10 1. Baaruka 48 48 0 43 0 0 0 0 2. Antara 38 38 0 38 0 0 0 0 3. Nipaniya 52 52 0 51 0 0 0 0 Adopted Village 138 138 0 132 0 0 0 0
4. Chhatarpur 10 10 0 10 0 0 0 0 5. Antari 11 11 0 11 0 0 0 0 6. Simariya 15 15 0 15 0 0 0 0 7. Katahari 22 22 0 22 0 0 0 0 8. Purnia 25 25 0 25 0 0 0 0 9. Jhagraha 49 47 2 46 0 0 0 0 Cluster Village 132 130 2 129 0 0 0 0
Total 270 268 2 261 0 0 0 0

507
Table No. 8.66 [Contd…] Impact on Income Enhancement
If no the reasons S. No.
Name of the Village Home
science Agro
forestry Organic farming
Water shed
Training of rural youth
Could not follow the instruction
Problem of
resourse
Non- availability technical advice in
time 1 2 11 12 13 14 15 16 17 18
1. Baaruka 9 0 4 0 0 0 0 0 2. Antara 9 0 5 0 0 0 0 0 3. Nipaniya 10 0 3 0 0 0 0 0 Adopted Village 28 0 12 0 0 0 0 0
4. Chhatarpur 0 0 5 0 0 0 0 0 5. Antari 3 0 0 0 0 0 0 0 6. Simariya 6 0 0 0 0 0 0 0 7. Katahari 6 0 2 0 0 0 2 0 8. Purnia 7 0 0 0 0 0 0 0 9. Jhagraha 15 0 0 0 0 0 0 0 Cluster Village 37 0 7 0 0 0 2 0
Total 65 0 19 0 0 0 2 0 8.210 Out of 270 number of individuals 268 individuals [99.26 percent] have expressed the
positive impact of K.V.Ks. efforts over income enhancement which, in itself is an startling achievement. It may be mentioned here that subject wise reaction will not tally with the figure of 268 as the same person may react over multiple of subjects. Maximum number of 261 individuals which is 96.67 percent to total individuals have positive response of income enhancement through agronomy followed by response of 65 persons for home science and 19 persons for organic farming.
EXTENT OF INCOME ENHANCEMENT 8.211 Assessment of income level of individuals is one of the most difficult aspects of primary
data collection as the persons are usually shy of giving the correct information. However, through indirect approach, information regarding income has been collected which is given in the following table;
Table No. 8.67
Extent of Income Enhancement Percentage increase in Income S.
No Name of the
Village No. of
Individ-ual
1to 10%
11 to 20%
21 to 30%
31 to 50%
51 to 60%
61 to 70%
71 to 80%
81 to 90%
91 to 100%
1 2 3 4 5 6 7 8 9 10 11 12 1. Baaruka 48 48 0 0 0 0 0 0 0 0 2. Antara 38 32 6 0 0 0 0 0 0 0 3. Nipaniya 52 52 0 0 0 0 0 0 0 0 Adopted Village 138 132 6 0 0 0 0 0 0 0
4. Chhatarpur 10 10 0 0 0 0 0 0 0 0 5. Antari 11 11 0 0 0 0 0 0 0 0 6. Simariya 15 13 2 0 0 0 0 0 0 0 7. Katahari 22 20 2 0 0 0 0 0 0 0 8. Purnia 25 12 13 0 0 0 0 0 0 0 9. Jhagraha 49 49 0 0 0 0 0 0 0 0 Cluster Village 132 115 17 0 0 0 0 0 0 0
Total 270 247 23 0 0 0 0 0 0 0

508
8.212 The above table shows that out of 270 individuals, 247 individuals [91.48 percent] have reported bout 1 to 10 percent income enhancement due to the efforts of the K.V.K. while 23 persons [8.52 percent] reported about 11 to 20 percent enhancement in income which is a creditable achievement.
OPINION ABOUT CONTINUANCE OF THE SERVICES OF K.V.K. 8.213 The table below shows the details;
Table No. 8.68 Opinion about Continuance of K.V.K. Services
Continuation of the services of K.V.K.
S. No.
Name of the Village No. of Individual
Yes (1)
No (2)
1 2 3 4 5 1. Baaruka 48 48 0 2. Antara 38 38 0 3. Nipaniya 52 51 1 Adopted Village 138 137 1
4. Chhatarpur 10 10 0 5. Antari 11 11 0 6. Simariya 15 15 0 7. Katahari 22 22 0 8. Purnia 25 25 0 9. Jhagraha 49 49 0 Cluster Village 132 132 0
Total 270 269 1 8.214 The above table shows that out of 270 individuals, 269 individuals [99.63 percent] have
opined for continuance of the services of K.V.K. particularly in the fields of agromony, home science and organic farming while only one number of individual [0.27 percent] have given negetive opinion which seems natural in view of large number of respondents. Viewing things from the positive angle, the performance of the K.V.K. is laudable, as the efforts have won the confidence of the farming community of our area of study.
SUGGESTIONS FOR ADDITIONAL SERVICES TO BE RENDERED BY THE K.V.K. 8.215 Information regarding suggestions for additional services to be rendered by the K.V.K. has
been collected from the individuals. The table below shows the details;

509
Table No. 8.69 Suggestions for Additional Services to be Rendered by K.V.K.
Suggestions for additional services by KVK S. No.
Name of the Village No. of Individual Production
of by product
Marketing strategy
Weather forecasting
Availability of agri. inputs at panchayat
level 1 2 3 4 5 6 7 1. Baaruka 48 30 0 0 18 2. Antara 38 10 15 9 4 3. Nipaniya 52 36 8 0 8 Adopted Village 138 76 23 9 30
4. Chhatarpur 10 3 1 0 6 5. Antari 11 5 1 2 3 6. Simariya 15 9 6 0 0 7. Katahari 22 1 15 6 0 8. Purnia 25 5 14 6 0 9. Jhagraha 49 29 3 0 17 Cluster Village 132 52 40 14 26
Total 270 128 63 23 56 8.216 The cent percent individuals have given their useful suggestions about introduction of
additional services to be rendered by the K.V.K. Important among these are regarding suggestions about production of by-product of crops, development of marketing strategy for fair return of the product and making available agricultural inputs at Gram Panchayat Level wherein 128, 63 and 56 individuals respectively have given their useful suggestions.
8.217 Regarding production of by-product, that may lead to some processing activities, the work
may be initiated in liaison with Industries Department of the district. 8.218 Marketing of agriculture produce is gaining importance to avoid the exploitation of farmers
by brokers. The intervention of K.V.K. personnel will be very useful if some sort of training is organised for beneficiary cultivators in liaison with Mandi Committees.
8.219 Regarding availability of agriculture inputs at Gram Panchayat level, the K.V.K Scientists
may bring home the solution in consultation with the Chief Executive Officer of Zila Panchayat by developing modalities for making available things at Gram Panchayat level.
8.220 It is, therefore, worth considering to incorporte in the mandate of K.V.K. the subjects
like production of by-products and development of marketing strategy for the product of the cultivators.
UTILIZATION OF THE ENHANCED INCOME 8.221 Proper utilization of enhanced income is equally important as compared to its generation.
The table below shows the utilization of enhanced income of sample individuals for purchase of various agriculture inputs;

510
Table No. 8.70 Utilization of Enhanced Income
Enhanced income led to purchase of Tractor Harvester Thresher
S. No.
Name of the Village No. of Individual
Yes (1)
No (2)
Yes (1)
No (2)
Yes (1)
No (2)
1 2 3 4 5 6 7 8 9 1. Baaruka 48 0 48 0 48 0 48 2. Antara 38 0 38 0 38 0 38 3. Nipaniya 52 0 52 0 52 0 52 Adopted Village 138 0 138 0 138 0 138
4. Chhatarpur 10 0 10 0 10 0 10 5. Antari 11 0 11 0 11 0 11 6. Simariya 15 1 14 0 15 0 15 7. Katahari 22 0 22 0 22 0 22 8. Purnia 25 0 25 0 25 3 22 9. Jhagraha 49 2 47 0 49 0 49 Cluster Village 132 3 129 0 132 3 129
Total 270 3 267 0 270 3 267
Table No. 8.70 [Contd…] Utilization of Enhanced Income
Plough Seed drill Bullock pair
S. No.
Name of the Village No. of Individual
Yes (1)
No (2)
Yes (1)
No (2)
Yes (1)
No (2)
1 2 3 10 11 12 13 14 15 1. Baaruka 48 0 48 0 48 2 46 2. Antara 38 10 28 0 38 7 31 3. Nipaniya 52 0 52 0 52 5 47 Adopted Village 138 10 128 0 138 14 124
4. Chhatarpur 10 0 10 0 10 4 6 5. Antari 11 1 10 2 9 0 11 6. Simariya 15 7 8 0 15 2 13 7. Katahari 22 7 15 0 22 2 20 8. Purnia 25 6 19 3 22 3 22 9. Jhagraha 49 0 49 1 48 6 43 Cluster Village 132 21 111 6 126 17 115 Total 270 31 239 6 264 31 239

511
Table No. 8.70 [Contd…] Utilization of Enhanced Income
Power/Knapsa
c sprayer Handhoe Storage
facility
S. No.
Name of the Village No. of Individual
Yes (1)
No (2)
Yes (1)
No (2)
Yes (1)
No (2)
1 2 3 16 17 18 19 20 21 1. Baaruka 48 0 48 0 48 0 48 2. Antara 38 0 38 0 38 0 38 3. Nipaniya 52 5 47 0 52 0 52 Adopted Village 138 5 133 0 138 0 138
4. Chhatarpur 10 0 10 0 10 0 10 5. Antari 11 0 11 0 11 0 11 6. Simariya 15 0 15 0 15 0 15 7. Katahari 22 0 22 0 22 0 22 8. Purnia 25 3 22 0 25 2 23 9. Jhagraha 49 4 45 0 49 0 49 Cluster Village 132 7 125 0 132 2 130 Total 270 12 258 0 270 2 268
Table No. 8.70 [Contd…] Utilization of Enhanced Income
Tube well /Dug well Electric/diesel motor
Yes (1) No (2) Yes (1) No (2)
S. No.
Name of the Village No. of Individual
22 23 24 25 1. Baaruka 48 0 48 0 48 2. Antara 38 0 38 1 37 3. Nipaniya 52 0 52 0 52 Adopted Village 138 0 138 1 137
4. Chhatarpur 10 0 10 0 10 5. Antari 11 0 11 0 11 6. Simariya 15 0 15 0 15 7. Katahari 22 0 22 3 19 8. Purnia 25 0 25 0 25 9. Jhagraha 49 0 49 0 49 Cluster Village 132 0 132 3 129 Total 270 0 270 4 266
8.222 The above table shows that 92 individuals have utilized their enhanced income for
purchase of various agriculture inputs which constitutes 34.07 percent to total number of 270 sample individuals. The purchases are mainly limited on items like tractor, thresher, plough, seed drill, bullock pairs power/knapsac sprayer and electric/diesel motors.The utilization level of enhanced income for purchase of agriculture input is some what encouraging.

512
IMPACT OF ENHANCED INCOME OVER EDUCATION LEVELS 8.223 The table below shows the impact of enhanced income over levels of education in our area
of study;
Table No. 8.71 Impact of Enhanced Income Over Levels of Education
Impact on education
due to enhanced
income
If yes in what manner S. No.
Name of the Village No. of Individual
Yes (1)
No (2)
More Male
Children go to
primary/middle
(1)
More Female Children
go to primary/middle
(2)
More male children attend
secondary level
education (3)
More female
children attend
secondary level
education (4)
Male Female children go for higher
education non (5)
1 2 3 4 5 6 7 8 9 10 1. Baaruka 48 44 4 28 6 5 2 1 2. Antara 38 30 8 14 9 0 0 0 3. Nipaniya 52 43 9 33 1 2 0 0 Adopted Village 138 117 21 75 16 7 2 1
4. Chhatarpur 10 6 4 5 1 0 0 0 5. Antari 11 8 3 3 4 0 0 0 6. Simariya 15 12 3 7 4 0 0 0 7. Katahari 22 16 6 8 4 2 0 0 8. Purnia 25 22 3 9 5 4 0 0 9. Jhagraha 49 44 5 33 34 0 1 0 Cluster Village 132 108 24 65 52 6 1 0
Total 270 225 45 140 68 13 3 1
Table No. 8.71 [Contd…]
Impact of Enhanced Income Over Levels of Education If no the reasons S.
No Name of the Village No. of
Individual Educa-tion is
no priority
(1)
Purchase of agr. inputs
(2)
Exp. on religious/social rituals
(3)
Purchase of luxutry items
like TV fridge two
wheeler etc. (4)
Consump - tion of
intoxicants (5)
Deposi-ted in
the bank (6)
Debt repay-ment (7)
1 2 3 11 12 13 14 15 16 17 1. Baaruka 48 0 3 0 0 0 0 0 2. Antara 38 1 6 0 1 0 0 0 3. Nipaniya 52 4 10 0 0 0 0 0 Adopted Village 138 5 19 0 1 0 0 0
4. Chhatarpur 10 0 4 0 0 0 0 0 5. Antari 11 1 3 0 0 0 0 0 6. Simariya 15 0 0 0 0 0 0 0 7. Katahari 22 3 3 1 0 0 0 0 8. Purnia 25 0 0 0 0 0 0 0 9. Jhagraha 49 0 3 2 0 0 0 0 Cluster Village 132 4 13 3 0 0 0 0
Total 270 9 32 3 1 0 0 0

513
8.224 Out of 270 individuals, 225 individuals [83.33 percent] have reported positive impact of enhanced income over levels of education while 45 number of individuals [16.67 percent] have refused about such impact. The positive impact is predominant in case of primary and middle level of education for both boys and girls wherein 208 individuals [77.04 percent to total individuals] have reported that due to enhanced income more number of boys and girls are being sent to attend elementary level [primary + middle] of education. The positive impact of enhanced income on levels of education shows the awareness of the sample individuals about value of education.
8.225 Regarding negetive responses by 45 individuals, 9 individuals [33.33 percent to total of 270
individuals] have reported that education is no priority to them while 32 individuals [11.85 percent to total individuals] have given the reason of spending the portions of enhanced income over purchase of agriculture inputs. However all these reasons may be overcome by the extension efforts of K.V.K. personnel by convincing the villagers about value of education while they impart vocational training.
IMPACT OF ENHANCED INCOME OVER HEALTH STATUS 8.226 Health is again an important social factor that accounts for efficiency in pursuance of any
occupation. The table below shows the impact of enhanced income over health status of sample population.
Table No. 8.72
Impact of Enhanced Income over Health Conditions Impact on
Health If yes in what manner S.
No. Name of the Village No. of
Individual Yes (1)
No (2)
Services of
medical personnel
(1)
Vaccination of
children/ women done (2)
Child nutrition
(3)
Female nutrition during
gestation (4)
Adoption of Family
welfare measuries
1 2 3 4 5 6 7 8 9 10 1. Baaruka 48 48 0 44 0 0 0 0 2. Antara 38 36 2 13 16 2 1 4 3. Nipaniya 52 52 0 49 0 3 0 0 Adopted Village 138 136 2 106 16 5 1 4
4. Chhatarpur 10 10 0 6 2 2 0 0 5. Antari 11 10 1 1 7 2 0 1 6. Simariya 15 15 0 2 5 6 0 2 7. Katahari 22 16 6 15 3 0 0 1 8. Purnia 25 25 0 6 9 5 0 5 9. Jhagraha 49 49 0 24 19 5 1 0 Cluster Village 132 125 7 54 45 20 1 9
Total 270 261 9 160 61 25 2 13

514
Table No. 8.72 [Contd…] Impact of Enhanced Income over Health Conditions
If no the reasons S. No
Name of the Village
No. of Individual Health
is no priority
Believe in local healing methods
Purchase of agri. inputs
Exp. on religious functions
Luxury items TV Fridge,
Two wheeler, Four wheeler
Consumption of
intoxicants
Deposited in bank
1 2 3 11 12 13 14 15 16 17 1. Baaruka 48 0 0 0 0 0 0 0 2. Antara 38 1 0 0 0 1 0 0 3. Nipaniya 52 0 0 0 0 0 0 0 Adopted Village 138 1 0 0 0 1 0 0
4. Chhatarpur 10 0 0 0 0 0 0 0 5. Antari 11 1 0 0 0 1 0 0 6. Simariya 15 0 0 0 0 0 0 0 7. Katahari 22 3 1 0 0 0 0 0 8. Purnia 25 0 0 0 0 1 0 0 9. Jhagraha 49 0 0 0 0 0 0 0 Cluster Village 132 4 1 0 0 0 0 0
Total 270 5 1 0 0 3 0 0
8.227 The above table shows that out of 270 individuals, 261 individuals [96.67 percent to total of
270 individuals] have reported about positive impact of enhanced income over health status which shows the awareness of the sample population about value of keeping good health. The items of positive responses like hiring of the services of medical personnel [160 individuals], vaccination of children/women [61 individua ls]. Child nutrition [25 individuals] and adoption of family welfare measures [13 individuals] are indicative of healthy trend since the individuals are more concerned particularly about, the health status of women and children.
8.228 Though the number of individuals with negetive response is only 9 [3.33 percent to
total of 270 individuals] but the opinion like health is no priority by 5 number of individuals is a sort of red alert to K.V.K. scientists who must uproot such attitude lest they go deep into the thinking of more individuals.
IMPACT OF ENHANCED INCOME OVER POTABLE DRINKING WATER SUPPLY 8.229 The table below shows the details;
Table No. 8.73 Impact of Enhanced Income over Potable Drinking Water Supply
Improve in potable drinking water S. No
Name of the Village No. of Individual Yes No
1 2 3 4 5 1. Baaruka 48 1 47 2. Antara 38 1 37 3. Nipaniya 52 2 50 Adopted Village 138 4 134
4. Chhatarpur 10 0 10 5. Antari 11 0 11 6. Simariya 15 0 15 7. Katahari 22 0 22 8. Purnia 25 0 25 9. Jhagraha 49 0 49
Cluster Village 132 0 132
Total 270 4 266

515
8.230 The above tabke shows a reverse situation where the negetive response is to the tune of 266 individuals which is 98.52 percent to total of 270 individuals while the positive response is by 4 individuals [1.48 percent]. These facts show that availability of potable drinking water is no priority in rural areas.
IMPACT OF ENHANCED INCOME OVER HOUSING CONDITIONS 8.231 The table below shows the details;
Table No. 8.74
Impact of Enhanced Income over Housing Conditions Enhancement in income resulted in
improved housing contentions S. No
Name of the Village No. of Individual
Yes No 1 2 3 4 5 1. Baaruka 48 20 28 2. Antara 38 4 34 3. Nipaniya 52 22 30 Adopted Village 138 46 92
4. Chhatarpur 10 5 5 5. Antari 11 2 9 6. Simariya 15 3 12 7. Katahari 22 5 17 8. Purnia 25 6 19 9. Jhagraha 49 26 23 Cluster Village 132 47 85
Total 270 93 177 8.232 The above table shows that out of 270 individuals, 93 individuals [34.44 percent] have
positive respons while 177 individuals [65.56 percent] have refused spending of any amount of enhanced income over improving the housing conditions. The status seems obvious as frequent expenditure over improving the houseing condition is not usually done.
AWARENESS ABOUT WELFARE SCHEMES INITIATED BY THE STATE GOVERNMENT WITH ASSISTANCE FROM GOVERNMENT OF INDIA 8.233 The basic objectives of various welfare schemes initiated by the government are for
providing employment opportunities to the target group for augmentation of income thereby improving the quality of life of the individuals/community. Though this information has no direct relevance to the functioning of K.V.K. but its personnel are supposed to popularize such schemes among villagers for taking financial support from such programmes. In the following paragraphs the details of a few important schemes have been given which have direct impact over the livelihoods of sample population.
JAWAHAR GRAM SAMRIDHI YOJANA 8.234 The former scheme of Jawahar Rojgar Yojna renamed as Jawahar Gram Samridhi Yojna
was started from the year 1999-2000 with the basic objective of creating community assets of permanent nature, thereby providing employment to local labour. The survey results show that out of 270 individuals 202 individuals [74.81 percent] are aware of the scheme while rest of 68 individuals [25.19 percent] have no knowledge about the scheme. The scheme is important from the view point of creating community asset that results in availability of employment opportunities. Awareness about this scheme will induce the villagers to assert their demand through Gram Panchayat to develop their area. The K.V.K. personnel may, during their field visits, publicize the utility of the scheme among the villagers.

516
EMPLOYMENT ASSURANCE SCHEME 8.235 Started from the year 1997-98, the scheme aims at providing employment to rural
population during lean season of agriculture thereby creating community assets. The response to this scheme is somewhat encouraging as 94 individuals [34.81 percent] are aware about the scheme.
ESTABLISHMENT OF HAND LOOM UNITS 8.236 Under this scheme, the units having 5 to 10 looms are registered and loom-shed subsidy and
margin money subsidy are given. Only 1 person of our sample area is aware of the scheme. When even awareness is not there, there can hardly be any possibility of its implementation in our area of study.
ESTABLISHMENT OF SERICULTURE UNITS 8.237 Under this scheme the beneficiaries are given training on various aspects of sericulture
activities to supplement their income. For this purpose Resham Kendras spread over in districts assume nodal responsibilities to train the beneficiaries and augment their infrastructure. Non of the individuals from our area of study are aware of the existence of such scheme when the scheme is so important for rural economy. The K.V.K. personnel in liaison with concerned district authorities may take-up a compaign for making villagers aware about the benefits of the scheme.
ESTABLISHMENT OF FAMILY BASED RURAL INDUSTRIAL UNITS 8.238 The scheme is implemented by the Madya Pradesh Khadi and Gramodoyog Board. Under
this scheme the units pertaining to SC, ST and OBCs are given 90 percent subsidy on capital loan and remaining 10 percent loan is given by the banks. The level of awareness about this scheme is discouraging as 6 individuals [2.22 percent to total of 270 individuals] are aware about this scheme.
MID DAY MEALS 8.239 The programme has proved to be an effective incentive for retention of school going
children relating to primary education, specially the children coming from low income group. Under this programme cooked meals are provided to the school going children. The level of awareness of this scheme in our area of study is 96.30 percent.
FREE SUPPLY OF TEXT BOOKS 8.240 Under this scheme all the students of primary standard [classes 1st to 5th] belonging to SC,
ST and OBCs and students of classes 1st to 3rd standards belonging to general communities are given text books free of cost. As per our survey results 184 individuals [68.15 percent] are aware about the scheme while 86 individuals [31.85 percent] are not aware of the scheme. Since the supply of text books free of cost is mandatory, the individuals unaware of the scheme are either persons having their wards above primary standards of education or the rate of drop-out is so high that they are not particular about the scheme. However, efforts both by persons of school education department and K.V.K. may reduce such extent of unawareness.

517
WOMEN SELF HELP GROUP 8.241 With view to ensure social and economic empowerment of women, self help groups
[S.H.Gs.] are formed for making the women confident to face challenges on all fronts, be it social or economic. In this scheme, the members of the group deposit a part of their saving in the fund raised by the group and may take loan to meet their various social and economic obligations, subject to return of the amount with interest. In our area of study 252 individuals [93.33 percent] are aware of this scheme which, ofcourse, is very encouraging that indicates the awareness of individuals about the value of such institution. Unawareness aspect for 18 individuals may easily be overcome by little more extension efforts by concerned government officials and persons of K.V.K.
GRAMYA YOJNA 8.242 Under this scheme the poor women are given interest free loan upto Rs. 500.00 towards
starting a small business. After repayment of the first loan within one year, second loan to the tune of Rs. 1500.00 is given. In our area of study, 193 number of individuals [71.48 percent] are aware of this scheme which is satisfactory.
AUSMATI YOJNA 8.243 With the objective of providing better medical assistance to the women belonging to the
families living below the poverty line in rural areas, this scheme was started in the year 1999. For this scheme also the extent of awareness by 163 individuals [60.37 percent] is satisfactory.
8.244 In what follows an attempt has been made to summarise the details of individual
particulars of adopted and cluster villages. - The frame of the present part of the narration is 270 individuals which is 25 percent of
the family members of 25 percent sample households belonging to adopted and cluster villages.
- The criteria for selection of individuals are – the persons should be the adult member of the family, he/she should be associated with any programme of the K.V.K., he/she should be literate – may be without having any formal education.
- The majority of 119 individuals are from community of S.T. that accounts for 44.07 percent to total of 270 individuals from adopted and cluster villages.
- The cent-percent sample individuals from our area of study are the followers of Hindu religion.
- The cent-percent awareness of the individuals about the K.V.K. in terms of its location and more importantly the services rendered by it is an important achievement of the K.V.K.
- The awareness about specific services rendered by the K.V.K. is substantial. - Regarding regular contact with K.V.K. the survey results show the regular contact of
89.63 percent individuals mainly because of the desire for adopting new technology and for obtaining quality seed. The positive impact of the efforts of the K.V.K. is clearly visible.
- Out of 270 individuals, 263 individuals have implemented the services of K.V.K. which is 97.41 percent to total respondents which in itself is an achievement of K.V.K’s. efforts.
- In the field of agronomy maximum number of 266 individuals [98.52 percent to total of 270 individuals] have implemented the improved technique, followed by 65 individuals [24.07 percent] for home science and 19 individuals implementing the techniques regarding organic farming.

518
- The cent percent satisfaction level of individuals regarding impact of K.V.K. services is landable.
- Agronomy and home science are the subjects for which the satisfaction level is substantial. In subjects like horticulture, animal husbandary, agro -forestry, fishery, poultry and training of rural youth the satisfaction level is nil because of the basic fact that for these subjects no vocational training in tangible way has been imparted nor the FLDs or OFTs have been organised. Efforts must be made to popularize the activities like animal husbandry, agro-forestry and watershed activities as these fields have immense promise of employment generation followed by income augmentation in rural areas.
- About 99 percent positive response regarding impact of K.V.K. services over income enhancement has been reported which is of credit to the efforts of K.V.K. in various fields of its operation.
- The extent of income enhancement in the percentage group of 1 to 10 has been reported by 247 persons [91.49 percent] due to impact of various technologies introduced by K.V.K. which, in itself, is a startling achievement.
- Out of 270 individuals, 269 individuals [99.63 percent to total individuals] have reported for the continuance of the services of K.V.K. particularly for subjects like agronomy, home science and organic farming which again shows the positive impact of the services rendered by K.V.K.
- Regarding suggestions for additional services to be rendered by K.V.K. the sample individuals have given useful suggestions regarding introduction of production of by-products of crops and development of marketing strategy for fair return of the product for incorporation in the training mandates of K.V.K.
- As regards utilization of enhanced income, 92 individuals [34.07 percent] have informed about purchase of various agriculture inputs out of their income enhancement.
- Out of 270 individuals, 225 individuals [83.33 percent] have reported positive impact of income enhancement over levels of education particularly over the levels of primary education for both boys and girls that shows the awareness of sample individuals about value of educating their wards.
- Out of 270 individuals, 261 individuals [96.67 percent to total of 270 individuals] have reported about positive impact of enhanced income over health status resulting in hiring of the services of medical personnel, vaccination of children/women, better application of child nutrition and adoption of family welfare measures.
- A reverse situation is visualized in case of potable drinking wter supply where the negetive response is to the tune of 266 individuals [98.52 percent] which shows that the availability of potable drinking water is no priority in rural areas in general and in our area of study in particular against the basic problem of enhancing agriculture income.
- Regarding impact of enhanced income over improving housing conditions, 93 individuals [34.44 percent] have positive response while 177 individuals [65.56 percent] have refused spending any amount of enhanced income over improving the housing conditions. The situation seems obvious as frequent expenditure over improving housing conditions is not done.
- Regarding awareness about various welfre schemes initiated by the State Government with assistance from Government of India, it has been observed that in case of schemes like Jawahar Gram Samridhi Yojna, Employment Assurance Scheme, Mid-Day Meals, Free Supply of Text Books, Women Self Help Group, Gramya and Ausmati Yojna the level of awareness is encouraging while in respect of schemes like Establishment of Hand Loom Units, Establishment of Sericulture Units and Establishment of Family Based Rural Industrial Units the level of awareness is poor.

519
RESULTS OF SURVEY–INDIVIDUAL PARTICULARS–CONTROL VILLAGE 6.245 In the following paragraphs an attempt has been made to record the reactions of 25 percent
of individuals taken from control village of Kerhai where there is no intervention of KVK. The Total number of family members of the 25 percent of the households in village Pipariya Birsa is 61, the twenty five percent of which is 15 individuals. Therefore, the reactions of 15 number of individuals have been recorded to have a comparison with the reactions of individuals of adopted and cluster villages having direct intervention of KVK. The criteria for selection of individuals for control village are similar to that for adopted and cluster villages.
8.246 Like adopted and cluster villages, 9 individuals out of 15 individuals [60.00 percent] are
from S.T. community, only 6 individual are from O.B.C. community. No persons belong to S.C. and General communities. All the individuals from the control village are the followers of Hindu religon.
8.247 Regarding awareness about the existence of KVK, 6 individuals of control village are
aware of the its existence against the cent-percent awareness about K.V.K. in-terms of its location and services rendered by it by the individuals of adopted and cluster villages which seems obvious as in such cases the interventiojn of K.V.K. is direct. Regarding awareness about he services of K.V.K. the cent percent response in the control village is negetive. Awareness is the basic paramter that leads to positive impact of any activity over a long period of time. The ultimate aim of any K.V.K. is to cover the entire district in terms of implementation of prevailing and new technology relating to agriculture and its allied activities that presupposes awareness about this organisation by the farming community of the district. For this purpose the K.V.K. personnel of district Shahdol may organize meetings at Gram Panchayat level at least twice in a year inviting one representative from villages where there is no intervention of K.V.K. to make them aware about the utility of services rendered by the K.V.K.
8.248 Regarding satisfaction derived from per hectare yield of agronomical and horticulture
crops, the cent percent individuals of control village have expressed their dissatisfaction while for adopted and cluster villages this satisfaction level is substantial. However for improving the per-hectare yield, 10 number of individuals from control village which is 66.67 percent to total of 15 individuals have suggested for organizing training for water conservation methods, followed by 4 individuals [26.67 percent] for organizing training about application of inputs.
8.249 Regarding satisfaction level of livestock and dairy activities cent percent individuals have
expressed their dissatisfaction The suggestions forwarded are making available the improved breed production facilities by 12 individuals [80.00 percent] followed by improved feed facility by 1 individuals [6.67 percent] and one individual [6.67 percent] has opined for regular vaccination facilities. It will be worth mentioning that even in cases of adopted and cluster villages the satisfaction level for livestock and poultry activities is nil.
8.250 As for poultry development the level of dissatisfaction is again cent-percent. The important
suggestions forwarded are arrangement of improved breeding facilities by 10 individuals [66.67 percent] and providing broiler production facilities by 3 individuals [20.00 percent]. In case of adopted and cluster villages also the satisfaction level for this activity is nil.

520
8.251 Regarding fishery development, again the level of dissatisfaction is cent-percent supported by the suggestions like supply of improved feed by 11 individuals [73.33 percent] followed by arranging training about use of improved implements by 4 individuals [26.67 percent] It is worth mentioning again that for adopted and cluster villages the level of satisfaction for this activity is nil.
8.252 Important information has been collected about adoption of home science activities for
augmentation of family income. Toy making is one such activity where cent percent individuals have asked for training facility followed by pickle prepartion by 11 individuals [73.33 percent]. Training regarding backing activities have also been supported by 3 individuals, papad/jam/jelly making by 6 individuals, jute items by 3 indivuduals and food preservation by 3 individuals. It is again worth mentioning that in case of adopted and cluster villages the positive response in favour of home science activities is substantial.
8.253 Regarding training of rural youth for self employment, cent percent individuals have
suggested for organizing training programme for motor binding which is very relevant for performing agricultural activities followed by 9 individuals in favour of training courses for repair of diesel engine that accounts for 60.00 percent to total of 15 sample individuals. For activities like black smithy, carpentry, masonary, tailoring and cycle/scooter repairs individuals to the tune of 6,1,1,3,9 respectively have suggested for organizing training courses. It will not be out of place to mention here that in case of adopted and cluster villages, no individual has shown any inclination for such activities regarding training of rural youth.
8.254 Regarding educational status of the sample individuals of control village, the survey results
show that out of 15 individuals, 4 persons [26.67 percent] have reported positively about their male children attending the elementary level of education [primary + middle i.e. classes 1st to 8th standards] while the response from 11 individuals [73.33 percent] for this item are negetive. More or less similar is the situation with girls wherein 9 number of individuals [60.00 percent] have given positive response while 6 number of individuals [40.00 percent] were negetive in their responses. Similarly regarding boys students of secondary level of education, i.e. from from classes 9th to 12th standards only 1 individual [6.67 percent] have informed that their male and female wards attend the school. In case of higher education for both male and femal children the positive responses is nil. In case of adopted and cluster villages 83.33 percent individuals have reported about their male and female wards attending the elementary level of eduction that shows better awareness among the sample inhabitants of adopted and cluster villages about value of elementary education.
8.255 Regarding health status the following table presents a comparitive picture between adopted
and cluster villages on one side and the control village on the other;
Table No. 8.75 Compartive Status of Health Facilities Among Sample Individuals
Sl. No.
Item Status of control village –percentage to total 15
sample individuals
Status of adopted and cluster villages percentage to 270 sample individuals
1 Hiring of services of medical personnel 26.67 59.26 2 Vaccination of children/ pregnant mother 66.67 22.59 3 Child nutrition 66.67 9.26 4 Female nutrition during gestation period 60.00 0.74 5 Adoption of family welfare measures 40.00 4.81
Note – Only positive responses have been taken into account.

521
8.256 The above table shows that except for the item of hiring of services of medical personal where the positive response of individuals from adopted and cluster villages is higher than control village, in rest of the health parameters the percentage positive responses of the individuals of control village are much higher than that of adopted and cluster villages that shows the relatively higher level of awareness among the sample individuals of control village regarding various health parameters.
8.257 Regarding status of drinking water facilities, cent percent individuals have responded
positively about availability of hand pumps as main source of drinking water. Piped water supply is not in existence in the sample village which seems obvious as in villages in general this facility is seldom available. In case of adopted and cluster villages also the majority of respondents have informed about hand pums as main source of drinking water in their villages.
8.258 Regarding housing facilities, 1 number of individual each has reported for construction of
semi-pucca houses and construction of pucca house. 8.259 The table below shows the comparative level of awareness about the various welfare
schemes between adopted/cluster villages and control village;
Table No. 8.76 Comparative Levels of Awareness
Sl. No.
Name of the Scheme Level of awareness in percentage for adopted/cluster villages [percent to total of 270
individuals]
Level of awareness in percentage for control
village [percent to total of 15 individuals]
1 Jawahar Gram Samridhi Yojna 74.81 6.67 2 Employment Assurance Scheme 34.80 86.67 3 Establishment of Hand Loom Units 0.37 - 4 Establishment of Sericulture Units - - 5 Establishment of family based rural
industrial Units 2.22 -
6 Mid-day Meals 96.30 86.67 7 Free supply of Text Books 68.15 20.00 8 Women Self Help Group 93.33 46.67 9 Gramya Yojna 71.48 6.67 10 Ausmati Yojna 60.37 53.33 8.260 The above table shows that except for employment assurance scheme the level of
awareness about rest of welfare schemes is much higher in adopted/cluster villages as compared to control village. Regarding schemes like Establishment of Hand Loom Units, Establishment of Sericulture Units and Establishment of family based rural industrial Units the level of awareness among individuals of control village is nil while that for adopted and cluster villages the level of awareness is marginal. The validity of such schemes therefore is doubtful as since the awareness about these schemes are missing, the plight of their implementation may well be imagined.
8.261 In what follows an attempt has been made to summarise the findings of individual
particulars of the control village; - The majority of individuals i.e. 60.00 percent to total of 15 sample individuals are from
S.T. community. Cent percent individuals are followers of Hindu religion.

522
- The 40.00 percent level of awareness among sample individuals of control village about the services rendered by the K.V.K. is slightly a matter of concern which shows that a portion of population is unaware about prevailing and new technology relating to agriculture and allied services. Since the ultimate objective of any K.V.K. is to cover the farming communities of entire district, it will, therefore, be worthwhile if the K.V.K. Scientists organize meetings at Gram Panchayat level – twice in a year, inviting representative cultivators from control village and apprise them with latest technology or suggest them to be in regular contact with the cultivators of adopted and cluster villages who are already implementing technologies both prevailing and new relating to agriculture and allied activities.
- Regarding satisfaction level of per hectare yield of agronomical and horticultural crops, the cent percent individuals of control village have expressed their dissatisfaction with suggestions to organize training activities on water conservation methods and application of agriculture imputs.
- Regarding satisfaction level derived from present status of livestock and dairy activities cent percent individuals have expressed their dissatisfaction. The suggestions forwarded are making available the improved breed production facilities and regular vaccination facilities.
- As for poultry development the level of dissatisfaction is again cen-percent. The important suggestions forwarded are arrangement of improved breeding facilities and providing broiler production facilities.
- Similarly for fishery development the level of dissatisfaction is cent-percent supported by the suggestions like supply of improved feed and arranging training about use of improved implements.
- For augmentation of income levels, cent percent individuals are in favour of toy making activities followed by pickle preparation by 73.33 percent individuals, backing activities by 20.00 percent individuals and preparation of papad/jam/jelly by 40.00 percent individuals.
- Regarding training of rural youth for self employment, considerable interests hve been shown by the sample individuals of control village pertaining to activities like motor binding, repair of diesel engine, black smithy, carpentry, msonary, tailoring and cycle/scooter repair etc.
- Regarding elementary level of education [classes 1st to 8th standards] 26.67 percent individuals have reported that their male wards attend the school where as for female wards 60.00 percent individua ls have reported in favour of their school attendance.
- A very satisfactory level of health scenario is existing in control villge wherein for most of the basic health parameters the percentage positive response is much higher than the responses from adopted and cluster villages.
- Hand pumps are the main source of drinking water in our control village where cent percent individuals have reported for its existence.
- Regading housing facilities the individuals of control village have shown interest in constructing semi -pucca houses and puccs houses.
- The level of awareness about various welfare schemes initiated by the government is much higher in case of adopted/cluster villages as compared to control village.

523
Chapter Nine KRISHI VIGYAN KENDRA - TIKAMGARH 9.1 The district Tikamgarh is located in between 24.260 to 25.400 north latitude to 78.260 to
79.260 east longitude with total geographical area of 5048 squ.km. which is 1.64 percent to total geographical area of the State.
9.2 The average annual rainfall of the district is 765.00 mm concentrated over the months of
June to September. The average maximum temperature during summer is around 41.580 celcius while the average minimum temperature during winter is 3.300 celcius.
9.3 The total population of the district as per census 2001 is 1202998 persons with rural and
urban breakups of 990623 and 212375 persons respectively which is 82.35 percent and 17.65 percent to total population respectively. The percentage of scheduled caste population to total population (as per census 2001) is 24.29 while that of S.T. population is 4.32. The percentage of workers engaged in the occupation of agriculture (as per census 1991) to total workers is 69.85 that shows agriculture is the main stay of the population of Tikamgarh district. In the fallowing table a few indicators relating to agriculture has been been shown;
Table No. 9.1
Important Indicators Relating to Agriculture Sl. No.
Indicators District Tikamgarh
State of Madhya Pradesh
1 2 3 4 1 Percentage of forest area to total geographical area [ha] 13.29 26.65 2 Net cropped area as percent to total geographical area [ha] 52.31 49.02 3 Per-capita net cropped area [ha] 0.23 0.25 4 Per-capita gross cropped area [ha] 0.35 0.34 5 Percentage of double cropped area to net cropped area [ha] 53.58 35.49 6 Net area irrigated as percent to net cropped area [ha] 66.38 37.56 7 Gross area irrigated as percent to gross cropped area [ha] 53.56 28.54 8 Per-capita production of food-grains [Kg.] 336 266 9 Per hectare use of fertilizer [Kg.] 55.03 46.21 10 Gross value of agriculture produce-per hect. [Rs.] 11881 11968 11 Per hectare yield of agriculture produce [Kg.]*
a) Paddy 887 1058 b) Wheat 2162 1867 c) Jowar 1379 1342 d) Maize 1226 2072 e) Gram 1473 932 f) Tuar 582 825 g) Soybean 1462 1137
12 Electrified villages as percent to total inhabited villages 99.88 97.04 13 Energised pump sets per thousand hectare 71 60
*Figures relate to the year 2003-2004 [Final Forecast] 9.4 The per-hectare yield of the most of the crops for district Tikamgarh is more than State
average mainly due to better irrigation facilities and extensive use of fertilizer.

524
DETAILS OF KRISHI VIGYAN KENDRA, TIKAMGARH BASED ON THE SECONDARY INFORMATION 9.5 The K.V.K., Tikamgarh was established in the year 1994. It is located in the Tikamgarh
Development Block of the District. It is being run under the control of J.N.K.V.V., Jabalpur with Training Organizer as chief of the K.V.K., having six number of technical staff and three number of non-technical staff. The technical staff mainly consists of training associates and technical assistant mainly from the disciplines of Agronomy, Agriculture Extension and Food Science. The farm area of the K.V.K. is 20 hect, entirely irrigated and cultivated. The KVK has got administrative building of its own.
9.6 The K.V.K. has its own demonstration units like dairy unit, poultry unit along with existence
of farmer’s hostel where the cultivators can be accomodated during training courses. Regarding availability of irrigation facilities the K.V.K. has 2 number of tubewells, 2 number of diesel operated pump sets and one electric engine sufficient to irrigate 20 hectares of land. The K.V.K. has also got one four wheeler to cater to the transportation needs.
9.7 The K.V.K. has adequate number of agricultural implements as detailed below;
1. Tractor – 1 2. Trolly –1 3. Cultivator – 1 4 Thresher – 1 5. Tractor drawn Ferti seed drill –1 6. Harrow –1 7. Sprayers –2
These variety of implements are, more or less, sufficient to do the extension work with
reasonable efficiency. 9.8 The K.V.K. receives an average allocation of Rs. 27.47 lakh per year over the years 2001-
2002 to 2003-2004 against which the average expenditure per year is Rs. 23.94 lakh. The table below shows the details;
Table No. 9.2 Budget Allocation and Expenditure Rs. Lakh
2001-2002 2002-2003 2003-2004 Sl. No.
Particulars Alloca-
tion Expen-diture
Alloca-tion
Expen-diture
Alloca-tion
Expen-diture
Remarks
1 2 3 4 5 6 7 8 9 1. RECURRING EXPENDITURE a Pay and
Allowances 15.00 17.57 4.00 1.44 3.50 3.49
b Travelling Allowances
0.50 - - - - -
c Contingencies - - - - - - Total – 1 15.50 17.57 4.00 1.44 3.50 3.49 2. NON-RECURRING EXPENDITURE a Equipments 1.61 0.61 - - 2.85 0.82 Total 2 1.61 0.61 - - 2.85 0.82 Grand Total 1+2 17.11 18.18 4.00 1.44 6.35 4.31
9.9 The above table shows a more or less matching share of expenditure against allocation. The
major share of allocation is for pay and allowances against very small allocation for performing technical functions which at times lead to in-efficient performance. Re-scheduling of allocation is, perhaps necessary.

525
9.10 Regarding Technical performance, the information has been collected under following heads;
- Vocational Training - In-service Training - Front Line Demonstration - On Farm Testing.
9.11 In what follows an attempt has been made to present the details of the above mentioned items of technical performance.
VOCATIONAL TRAINING 9.12 The table below shows the details;
Table No. 9.3 Status of Vocational Training
No. of trainings organised -2003-2004 Sl. No.
Subject Adopted Villages
Cluster Villages
Other Villages
Total no. of trainees
2003-2004 1 2 3 4 5 6 1 Crop Production 1 4 - 159 2 Horticulture 1 4 - 58 3 Plant Protection 1 4 - 307 4 Veterinary Services 1 4 - 23 5 Home Science 1 - - - 6 Ag. Engineering 1 - - - 7 Training of Rural Youth for
Self Employment
a. Plant Protection - 4 - 44 Total 6 20 - 591
Note : Other villages [Col. 5] indicate those villages of the district where the training programmes of Agriculture Department are imparted through K.V.K.
9.13 The above table shows that the total number of vocational trainings organised in the year
2003-2004 was 26 which was, not very satisfactory. More number of vocational training should have been organised on horticulture as this is one of the important fields of quick income generation with availability of ready market. The organisation of only 4 number of training courses to impart training to rural youth for self employment and attended by only 44 persons [7.45% to total trainees] is indicative of the fact that the villagers are not very confident about such trainings which hardly gurantee any placement.
9.14 The combined percentage of trainees attending subjects like crop production, plant
protection and horticulture to total number of trainees was 88.66 that confirms the fact that farming communities are more interested to enhance their income through adoption of technology particularly in the field of crop production.
IN SERVICE TRAINING 9.15 This training is related to the field functionaries of Agriculture, Veterinary, Horticulture and
Forest Departments. The following table shows the details;

526
Table No. 9.4 Status of In-service Training
No. of trainings 2003-2004
Sl. No.
Subject
On campus Off campus
Total number of trainees 2003-
2004 1 2 3 4 5 1 Crop Production 133 - 133 2 Plant Protection 957 - 957 Total 90 - 90
9.16 Though the number of training programmes conducted in the year 2003-2004 is satisfactory,
arrangement of a few more training programmes particularly for Horticulture would have been more helpful.
FRONT LINE DEMONSTRATION 9.17 Front line demonstrations are conducted under the close supervision of the scientists of the
KVK for newly released technologies or those likely to be released in near future with target participants both farmers and extension officers. The table below shows the number of front line demonstrations conducted in the year 2003-2004.
Table No. 9.5
Status of Front Line Demonstrations No. of demonstrations 2003-2004 Sl.
No. Subjects
Adopted Villages Cluster Group of Villages 1 2 3 4 1 Pulses 25 4 2 Oil Seeds 25 4 3 Other than pulses and oilseeds 12 4 Total 62 12
9.18 The total of 74 FLDs organised in one year in both adopted and cluster villages are
satisfactory. ON FARM TESTING 9.19 On farm testing is a part of adaptive research that takes into account existing technology and
its application over defined areas and defined group of farmers. The following table shows the details;
Table No. 9.6 Status of On Farm Testing
No. of demonstrations 2003-2004 Sl. No.
Subject Adopted Villages Cluster Group of Villages
1 2 3 4 1 Testing of improved varieties of paddy
under upland condition 5 4
2 Testing of weed control method in up land paddy
5 4
3 Control of Dowdery mildew in coriander 5 4 4 Control of Carly Blight in Potato 5 4 Total 20 16

527
9.20 Organisation of 36 number of on farm testing in one year is an encouraging picture. 9.21 Besides organizing training courses on Vocational Training, In Service training, Front Line
Demonstration and On Farm Testing, the K.V.K., Tikamgarh has also organised other training programmes in liaison with the line departments of State Government. The table below shows the details;
Table No. 9.7
Record of Other Training Courses Year 2003-2004 Sl.
No. Topic
Duration – Days Organised by 1 2 3 4 1 Krishi Pakhwara 6 Department of Agriculture 2 Bio-farming 1 Department of Agriculture 3 Training on IPM 1 Department of Agriculture 4 Training on IPM 1 Department of Agriculture 5 Biological Cultivation 1 Department of Agriculture 6 Puse Development Programme 1 Department of Agriculture 7 Scientists interaction with farmers 1 Department of Agriculture 8 Integrated Cereal [Rice] Development
Programme 2 Department of Agriculture
9.22 The above table shows that most of the training courses organised were related to crop
production which seems obvious as the cultivators are usually interested in enhancement of agriculture production. A few number of trainings relating to home science and training of rural youth for self employment could have been organised which would have made such efforts more meaningful. However, it has also been felt that every training programme should have a minimum duration of 4 days to ensure purposeful transaction as about half of the day on the first day in case of most of such meetings is usually lost in observing formalities.
9.23 One of the important functions of the K.V.K. is to conduct specific research to improve the
quality of agriculture produce. The K.V.K., Tikamgarh has not conducted any such specific research during the year 2003-2004.
9.24 Each K.V.K. is supposed to hold the meeting of Scientific Advisory Committee twice in a year for performing following functions;
9.25 The Scientific Advisory Committee will consist of following members; 1. Head of the host institution Chairperson 2. Director, Extension of concerned SAU Member 3. Zonal Coordinator of the concerned zone Member 4. Representative of ICAR Instt./ICAR Regional Research Station if
located in the district or nearby Member
5. Associate Director, Research & Extension of the Zonal Research Station in which KVK is located
Member
6. District officers of the line departments such as Agriculture, Horticulture, Animal Husbandry, Soil conservation, Social/Agroforestry, Sericulture, Fisheries, Irrigation, Social Welfare, Small Scale Industries etc.
Members
7. Representative of the Lead Bank of the District Member 8. Farm Radio Officer of the AIR in which KVK is located Member 9. Representative of Doordarshan Centre in which KVK is located Member

528
10. Two representatives of the farmers - one small and one big nominated by the Head of the Institution
Member
11. Two representatives of Farm Women nominated by Head of the Institution
Members
12. Training Organiser, KVK Member Secretary 9.26 No specific information has been given by the K.V.K. Tikamgarh about holding meetings of
Scientific Advisory Committee. 9.27 The K.V.K., Tikamgarh has continuously interacted with district administration, three-tier
system of Panchayati Raj Institutions and progressive cultivators of the district and took valuable guidance from them. Publicity measures like organizing Krishi Melas, Field Days, arranging T.V. Interviews and Radio talks were attempted to spread the knowledge about utility of K.V.K. among rural population.
RESULTS OF THE SURVEY – VILLAGE PARTICULARS 9.28 The study has covered sixty number of villages with ten number of villages from each
K.V.K. with bifurcation as follows;
- Three number of Adopted Villages - Six number of Cluster Villages - One number of Control Village
The bifurcation as shown above is common to all the six K.V.Ks. covered under the study. The table below gives a few important demographic details of the selected villages of K.V.K., Tikamgarh;
Table No. 9.8 Demographic Particulars
Of which Sl. No.
Name of the Village
Name of the Dev. Block
Total population
Census 2001 Males
Census 2001
Females Census
2001
Proportion of S.C.
population [%]
Proportion of S.T.
population [%]
Literacy rate [%]
House-hold size
1 2 3 4 5 6 7 8 9 10 ADOPTED VILLAGES
1 Surajpur Tikamgarh 398 210 188 30.9 0.0 48.0 6.0 2 Minnora Tikamgarh 923 495 428 47.5 5.1 64.6 4.0 3 Charpuan Tikamgarh 940 502 438 39.8 0.0 58.9 6.0 Total – I 2261 [31.40] 1207
[31.88] 1054
[30.86] - - - -
CLUSTER VILLAGES 4 Sujanpura Tikamgarh 80 46 34 87.5 0.0 62.0 7.0 5 Papawani Tikamgarh 1215 620 595 24.0 4.6 52.4 6.0 6 Bauri Tikamgarh 907 484 423 12.5 5.2 50.6 8.0 7 Khiriya Tikamgarh 719 375 344 42.6 11.5 58.2 7.0 8 Ganeshganj Tikamgarh 725 367 358 57.1 1.9 54.1 6.0 9 Manikpura Tikamgarh 864 443 421 3.1 1.0 43.2 6.0 Total – II 4510 [62.63] 2335
[61.67] 2175
[63.69] - - - -
CONTROL VILLAGE 10 Neemkhera Tikamgarh 430 244 186 1.4 0.0 65.7 8.0 Total – III 430
[5.97] 244
[6.45] 186 [5.45] 1.4 0.0 65.7 8.0
Grand Total I+II+III 7201 [100]
3786 [100]
3415 [100]
Source – Census 2001, Note – Figures in brackets show percentage to total.

529
9.29 The total population of the ten identified villages as per census – 2001 is 7201 which is 0.73 percent of the total rural population of district Tikamgarh. The adopted villages cover 31.40 percent population as compared to total population of ten identified villages covered under the study while for the cluster villages this percentage is 62.63 to the population of ten villages and for control village the percentage coverage of population is 5.97. The largest village, population wise is Papawani [cluster village] while the smallest village is Sujanpura [cluster Village]. In all the villages, the male population is more than female population. In all the ten identified villages the proportion of SC population is more than that of ST population. The percentage literacy ranged between 43.2 for village Manikpura to 65.7 percent for village Neemkhera, not far below the district level percentage literacy of 55.80 and state level figure of 64.11. The above information has pleasantly defied the age-old notion of low percentage literacy in S.C. predominated areas. The average size of the family is 6 persons which, to some extent, is satisfactory in context of rural areas.
WORK FORCE 9.30 An analysis of the information regarding workforce for all the ten villages covered under the
study will give an idea of the persons engaged in different occupations and also the magnitude of dependent population not pursuing any occupation. The table below shows the details;
Table No. 9.9
Status of Work Participation Sl. No
Name of the Village
Work participation rate [%]
Proportion of main workers [%]
Proportion of Marginal workers
[%]
Proportion of Non-workers [%]
Person Male FemalePerson Male Female Person Male Female Person Male Female1 2 3 4 5 6 7 8 9 10 11 12 13 14
ADOPTED VILLAGES 1 Surajpur 26.6 50.0 0.5 26.6 50.0 0.5 0.0 0.0 0.0 73.4 50.0 99.5 2 Minnora 42.2 45.1 43.2 29.5 39.4 18.0 14.7 5.7 25.2 55.8 54.9 56.8 3 Charpuan 48.0 50.8 44.7 34.9 47.6 20.3 13.1 3.2 24.4 52.0 49.2 55.3 CLUSTER VILLAGES 4 Sujanpura 58.8 56.5 61.8 41.3 50.0 29.4 17.5 6.5 32.4 41.3 43.5 38.2 5 Papawani 51.9 51.6 52.1 36.5 47.4 25.2 15.3 4.2 26.9 48.1 48.4 47.9 6 Bauri 44.8 47.3 41.8 34.5 35.7 33.1 10.3 11.6 8.7 55.2 52.7 58.2 7 Khiriya 49.4 50.1 48.5 23.9 43.5 2.6 25.5 6.7 45.9 50.6 49.9 51.5 8 Ganeshganj 40.1 52.0 27.9 27.0 49.3 4.2 13.1 2.7 23.7 59.9 48.0 72.1 9 Manikpura 44.9 48.5 41.1 35.4 43.6 26.8 9.5 5.0 14.3 55.1 51.5 58.9 CONTROL VILLAGE 10 Neemkhera 52.3 47.1 59.1 35.1 43.0 24.7 17.2 4.1 34.4 47.7 52.9 40.9 Source – Census 2001
9.31 The above table shows that the work participation rate ranged between 26.6% for village
Surajpur [adopted village] to 58.8% for village Sujanpura [cluster village]. Out of identified villages in 3 number of villages viz. Sujanpura, Papawani and Neemkhera the proportion of female worker is more than of males, an healthy indication showing the intent of the female population to contribute meaningfully towards households income. The proportion of main workers which is, in general, higher than the porportion of marginal workers, ranged between 23.9 percent for village Khiriya [cluster village] to 41.3 percent for village Sujanpura [cluster village]. In cent percent sample villages the male participation as main workers is higher than female participation while a reverse situation is seen in case of marginal workers where female participation is higher than male participation. This shows

530
that in our sample area of study avenues of activities other than agriculture like preparation of papad/bari/jelly, toy making etc are available that employes substantial number of rural female population. The proportion of non-workers that ranged between 41.3 percent for village Sujanpura [cluster village] to 73.4 percent for village Surajpur [adopted village] presents a dismal picture as it shows the higher number of dependent population consisting mainly of children, old persons, infirms and unemployed who are not in position to contribute much towards family income.
OCCUPATIONAL DISTRIBUTION 9.32 The table below shows the details;
Table No. 9.10
Occupational Distribution Proportion of
Cultivators to total Workers [%]
Proportion of Agr. Labourer to total
workers [%]
Proportion of workers in household
industries to total workers [%]
Proportion of other workers to total
workers [%]
Sl. No
Name of the Village
Person Male Female Person Male Female Person Male Female Person Male Female1 2 3 4 5 6 7 8 9 10 11 12 13 14
ADOPTED VILLAGES 1 Surajpur 89.6 89.5 100.0 9.4 9.5 0.0 0.0 0.0 0.0 0.9 1.0 0.0 2 Minnora 36.8 37.7 35.7 44.4 33.6 57.3 0.2 0.4 0.0 18.6 28.3 7.0 3 Charpuan 75.4 71.8 80.1 7.1 7.5 6.6 0.2 0.0 0.5 17.3 20.8 12.8 CLUSTER VILLAGES 4 Sujanpura 38.3 38.5 38.1 53.2 46.2 61.9 0.0 0.0 0.0 8.5 15.4 0.0 5 Papawani 95.1 93.4 96.8 1.7 1.3 2.3 0.0 0.0 0.0 3.2 5.3 1.0 6 Bauri 72.7 70.3 75.7 24.1 25.8 22.0 1.5 1.7 1.1 1.7 2.2 1.1 7 Khiriya 84.5 81.9 87.4 13.0 13.8 12.0 0.3 0.5 0.0 2.3 3.7 0.6 8 Ganeshganj 49.5 59.2 31.0 41.6 29.8 64.0 1.7 1.6 2.0 7.2 9.4 3.0 9 Manikpura 45.4 53.0 35.8 36.9 24.7 52.0 0.3 0.5 0.0 17.5 21.9 12.1 CONTROL VILLAGE 10 Neemkhera 39.1 40.0 38.2 45.3 37.4 53.6 1.3 1.7 0.9 14.2 20.9 7.3 Source – Census 2001 9.33 Agriculture remains to be the main occupation of the ten villages identified for the study.
The proportion of cultivators to the total workers ranged between 36.8 percent for village Minnora [adopted village] to 95.1 percent for village Papawani [cluster village]. Usually these percentages are also fairly high among adopted and cluster villages that justify the selection of such villages in the group of adopted and cluster. Out of ten villages, in five number of villages viz. Surajpur, Charpuan, Papawani, Bauri and Khiriya, the proportion of female cultivators is more than that of male cultivators [in case of village Surajpur cent percent females are cultivators] that signifies the awareness and intent of the female members of the farming community to work along with their male counterpart for addition in household income. The trend matches with the modern expectations of equality of gender participation in work that, besides, income augmentation, ensures women empowerment to a great extent. Another significant fact revealed by the above table is that in general the proportion of cultivators is more than that of agriculture labour which is a sure indication that in these villages the occupation of agriculture is being pursued fairly satisfactorily.

531
9.34 Regarding proportion of agriculture labour to total workers, that ranged between 1.7 percent for village Papawani [cluster village] to 53.2 percent for village Sujanpura [cluster village], the involvement of female participation in general is more than that of males that indicates the performance of odd jobs regarding farming by women folk of our sample area.
9.35 The situation regarding proportion of workers in household industries to total workers is far
from being satisfactory as it ranged between 0.3 percent for villages Khiriya and Manikpura [both cluster village] to 1.7 percent for village Bauri [cluster village]. In villages like Minnora, Sujanpura, Papawani and Manikpura such secondary sector activities are totality missing. Usually in Madhya Preadesh the status of secondary sector occupation in villages is poor. One of the important factors of rural poverty is absence of such occupations that encourage migration during lean season of agriculture. Such sort of secondary occupation may be encouraged through proper implementation of various welfare schemes, particularly relating to rural development, being run by the government.
9.36 In all the identified ten number of villages, the proportion of other workers to total workers
is far below than the proportion of cultivators and agriculture labour to total workers with more participation of males as compared to females.
LAND USE DETAILS 9.37 The table below shows the land use details of the identified ten villages covered under the
study; Table No. 9.11
Land Use Details In hectare Irrigation Sl.
No. Name of the
Village Total
geogra- phical area
Gross cropped area
Forest Not available for culti-vation
Culti-vable waste
Canal Pond Wells/tube wells
Others Total irri-gated area
Unirri- gated
1 2 3 4 5 6 7 8 9 10 11 12 13 1 Surajpur 179 164 [91.62] - 15 10 68 - 27 24 119 [72.56] 35 2 Minnora 408 305 [74.75] - 103 33 - - 79 113 192 [62.95] 80 3 Charpua 521 437 [83.88] - 84 56 157 - 10 90 257 [58.81] 124
Adopted Village I 1108 906 [81.77] - 202 99 225 - 116 227 568 [62.69] 239 4 Sujanpura 231 183 [79.22] - 48 1 - - 35 4 39 [21.31] 143 5 Papawani 507 453 [89.35] - 54 118 43 - 173 - 216 [47.68] 119 6 Bori 172 157 [91.28] - 15 21 - - 116 - 116 [73.89] 20 7 Khiriya 316 269 [85.13] - 47 16 200 - 33 - 233 [86.62] 20 8 Ganesh Ganj 431 376 [87.24] - 55 37 172 - 81 60 313 [83.24] 26 9 Manikpura 280 238 [85.00] - 42 43 129 - 22 32 183 [76.89] 12
Cluster Village II 1937 1676 [86.53]
- 261 236 544 - 460 96 1100[65.63] 340
10 Neemkhera 257 206 [80.16] - 54 25 - - 76 46 122 [59.22] 59 Control Village III 257 206 [80.16] - 54 25 - - 76 46 122 [59.22] 59 Total – I+II+III 3302 2788
[84.43] - 517 360 769 - 652 369 1790 [64.20] 638
Source – Census, 2001 Note – Col. – 4 = Figures in brackets show percentage to total geographical area. Col. – 12 = Figures in brackets show percentage to gross cropped area. 9.38 The gross cropped area of the identified ten villages is 2788 hectares which is 84.43 percent
to total geographical area. The survey area is having no forest area which is somewhat out of ordinary.
9.39 Regarding irrigation, the percentage of gross irrigated area to gross cropped area is 64.20
which is much above the district average of 53.56 percent and state average of 28.54 percent. In adopted villages, cluster and control villages these percentages are 62.69, 65.63 and 59.22 respectively.

532
9.40 Cultivable waste land, that gives promise for expanding agriculture activities is 360 hectares which is 10.90 percent to total geographical area, assures the fact that through the intervention of K.V.K. the expansion of agriculture is possible.
RURAL ELECTRIFICATION 9.41 Rural electrification is one of the important parameters for agricultural development,
particularly in the context of energisation of pump sets. The table below shows the details; Table No. 9.12
Status of Rural Electrification Village Electrified Regular supply Sr.
No. Name of the village
Yes No Yes No If irregular actual
hrs. of supply 1 2 3 4 5 6 7 1. Surajpur 1 1 8 2. Minnora 1 1 10 3. Charpua 1 1 10 Adopted Village 3 3
4. Sujanpura 1 1 12 5. Papawani 1 1 12 6. Bori 1 1 12 7. Khiriya 1 1 12 8. Ganesh Ganj 1 1 12 9. Manikpura 1 1 12 Cluster Village 6 6
10 Neemkhera 1 1 12 Control Village 1 1
Total 10 10
*The information in brackets shows the name of the Development Block where the village is located. This information will be common to all the subsequent tables. 9.42 All the villages covered under the study are electrified with irregular power supply
situations. The power supply for most of the villages remained to be 12 hrs per day. 9.43 Energisation of pump sets is the direct impact of rural electrification over agriculture
development. The table below shows the extent of energisation of pump sets in our sample area of study;
Table No. 9.13 Status of Pump Sets Energised
Pump sets energized Sr. No.
Name of the village Electricity (No.) Diesel (No.)
1 2 3 4 1. Surajpur 30 5 2. Minnora 30 6 3. Charpua 40 15 Adopted Village 100 26
4. Sujanpura 8 2 5. Papawani 80 10 6. Bori 25 2 7. Khiriya 25 5 8. Ganesh Ganj 100 3 9. Manikpura 10 0 Cluster Village 248 22
10 Neemkhera 10 4 Control Village 10 4
Total 358 52

533
9.44 The total number of pump sets energized is 410 which is 1.42 percent to total number of 28920 pump sets energized in district Tikamgarh in the year 1999-2000. It may be mentioned here that for district Tikamgarh the number of energized pump sets per thousand hectare of gross cropped area is 71 as against the State average of 60 that shows a fair nature of agriculture in the district. In general, the number of pump sets energized is more in adopted and cluster group of villages as compared to control village which rather, is obvious as these villages have direct intervention of K.V.K. regarding technology transfer for better cultivation practices. Electricity energized number of pump sets are much more than that of pump sets energized by use of diesel that ranged between 8 numbers in village Sujanpura to 100 numbers in village Ganeshganj.
HOUSEHOLD INDUSTRIAL UNITS
9.45 The existence of only one rural industrial unit in village Papawani [cluster village] is
not very pecular as such units are generally not found in rural areas of Madhya Pradesh which is one of the important contributory factors of rural poverty.
COOPERATIVES
9.46 Only five number of cooperative societies in the break-up of Agriculture Cooperative Credit
Societies [2 numbers], Fisherman Cooperative Society [1 number] and Milk Cooperative Societies [2numbers] exist in our sample area of study which seems a fair number as compared to other villages covered under the study where either such societies are not in existence or the number is very marginal.
9.47 The existence of various basic and infrastructural facilities is important from the angel of
absorption capacity of technology of any sort in identified areas to gurantee future chain of development. In the subsequent paragraphs an attempt has been made to present such inventories for sample villages covered under the study.
BASIC FACILITIES 9.48 The table below shows the details;
Table No. 9.14 Status of Basic Administrative Facilities
Tahsil head- quarter Block head quarter Sr. No.
Name of the village District head quarter away
from the village KM
Within the village 0 KM
Away from the village
Km
Within the
village 0 KM
Away from the village
Km
1 2 3 4 5 6 7 1. Surajpur 13 13 13 2. Minnora 7 7 7 3. Charpua 10 10 11 Adopted Village
4. Sujanpura 8 8 8 5. Papawani 8 8 8 6. Bori 6 6 6 7. Khiriya 15 15 15 8. Ganesh Ganj 6 6 7 9. Manikpura 5 5 5 Cluster Village
10 Neemkhera 9 9 9 Control Village
Total 10 10 10

534
Table No. 9.14 [Contd…] Status of Basic Administrative Facilities
Gram Panchayat Police Station/sub station Sr. No.
Name of the village Within the
village 0 KM
Away from the village
Km
Within the village 0 KM
Away from the village
Km 1 2 8 9 10 11
1. Surajpur 2 2 2. Minnora 0 7 3. Charpua 0 6 Adopte d Village
4. Sujanpura 1 6 5. Papawani 0 5 6. Bori 0 5 7. Khiriya 0 0 8. Ganesh Ganj 0 5 9. Manikpura 2 6 Cluster Village
10 Neemkhera 2 6 Control Village
Total 6 4 1 9
9.49 The above table shows the location of district, tahsil and block headquarters quite far away
from most of the sample villages. The location of Gram Panchayat within or close to the sample villages is a positive factor that, to some extent, gurantees involvement of villagers in the development of their area. Though in non of the villages police stations are located within the geographical area of the village but within a manageable distance.
INFRASTRUCTURAL FACILITIES - ROADS
9.50 For the socio-economic development of any area the role of availability of proper road
network is very important. The table below shows the status of availability of road network in and around the identified ten villages;
Table No. 9.15
Road Infrastructure Fair weather road Sr.
No. Name of the village
Within the village 0 Km
Away from the village
Km
Kharanja road within
the village 0 km
1 2 3 4 5 1. Surajpur 4 0 2. Minnora 2 0 3. Charpua 0 2 0 Adopted Village
4. Sujanpura 8 0 5. Papawani 12 0 6. Bori 0 0 7. Khiriya 16 0 8. Ganesh Ganj 15 0 9. Manikpura 17 0 Cluster Village
10 Neemkhera 19 0 Control Village
Total 2 8 10

535
Table No. 9.15 [Contd…] Road Infrastructure
Link road to all weather road
All weather road Sr. No. Name of the village
Within the village 0 Km
Away from the village
Km
Within the village 0 Km
Away from the village
Km 1 2 6 7 8 9 1. Surajpur 0 0 2. Minnora 4 0 3. Charpua 0 0 Adopted Village
4. Sujanpura 0 0 5. Papawani 7 0 6. Bori 2 2 7. Khiriya 0 0 8. Ganesh Ganj 0 0 9. Manikpura 0 0 Cluster Village
10 Neemkhera 0 0 Control Village
Total 7 3 9 1
9.51 Information contained in the above table reveals a satisfactory situation as in 2 number of
villages fair weather roads exist. Kharanja roads are available within all the sample villages that ensure convenient transport in rainy season within the villages with reasonable clean sanitary conditions. The existence of link roads in seven villages alongwith the availability of all weather roads passing through 9 number of sample villages is a definite advantage that ensures the development of area to greater extent.
Infrastructural Facilities - Railway Station, Bus Stand/Bus Stop/
Post Office/S.T.D. Booth 9.52 The table shows the details;
Table No. 9.16
Facilities Regarding Railway Station/Bus Stand/Bus Stop/Post Office/STD Booths Railway station Bus stand/Bus stop Sr. No. Name of the village
Within the village 0 Km
Away from the village Km
Within the village 0 Km
Away from the village
Km 1 2 3 4 5 6 1. Surajpur 48 0 2. Minnora 52 0 3. Charpua 50 0 Adopted Village
4. Sujanpura 50 0 5. Papawani 60 0 6. Bori 62 2 7. Khiriya 44 0 8. Ganesh Ganj 55 0 9. Manikpura 60 1 Cluster Village
10 Neemkhera 50 1 Control Village
Total 10 7 3

536
Table No. 9.16 [Contd…] Facilities Regarding Railway Station/Bus Stand/Bus Stop/Post Office/STD Booths
Post office STD booth Sr. No.
Name of the village Within the village
0 Km Away from the
village Km Within the village
0 Km Away from the
village Km 1 2 7 8 9 10 1. Surajpur 2 2 2. Minnora 1 1 3. Charpua 5 0 Adopted Village
4. Sujanpura 4 1 5. Papoura (Mondu Bhak) 0 0 6. Bori 2 2 7. Khiriya 0 0 8. Ganesh Ganj 3 3 9. Manikpura 2 3 Cluster Village
10 Neemkhera 4 2 Control Village Total 2 8 3 7
9.53 For all the ten sample villages the railway station is located away from the village that
ranged between 44 kms for village Khiriya [cluster village] to 62 kms for village Bori [cluster village]. Regarding bus stand/bus stop, seven number of villages have this facility within the geographical limit of the village while for 3 villages the facility is located within a easy distance. Even two villages have post office within the village while rest of the villages have this facility within managable limits. Strange enough, even 3 villages have S.T.D. facilities within the village while seven villages have this facility within a short distance. Thus, even communication wise the villages are quite advanced. Infrastructural Facilities - Agriculture Marketing, Fair Price Shop,
Cold Storage 9.54 Mandi or Sub Mandi being regulated markets are important destinations for fair transaction
of agriculture produce. The cold storage is yet anothe r important asset that helps in avoiding distress selling. The table below shows the details;
Table No. 9.17
Agriculture Marketing, Fair Price Shop, Cold Storage Regular market Weekly market Mandi Sr.
No Name of the
village Within the village 0 Km
Away from the
village Km
Within the village
0 Km
Away from the village
Km
Within the village 0 Km
Away from the village
Km 1 2 3 4 5 6 7 8 1. Surajpur 11 11 13 2. Minnora 7 7 7 3. Charpua 9 9 9 Adopted Village
4. Sujanpura 8 8 8 5. Papawani 5 5 5 6. Bori 5 5 6 7. Khiriya 6 6 15 8. Ganesh Ganj 5 5 6 9. Manikpura 5 5 5 Cluster Village
10 Neemkhera 9 9 9 Control Village Total 10 10 10

537
Table No. 9.17 [Contd…] Agriculture Marketing, Fair Price Shop, Cold Storage
Sub-Mandi Fair Price Shop Cold Storage Sr. No. Name of the village Within the
village 0 Km
Away from the village
Km
Within the
village 0 Km
Away from the village
Km
Within the
village 0 Km
Away from the village
Km 1 2 9 10 11 12 13 14 1. Surajpur 13 0 11 2. Minnora 7 0 8 3. Charpua 9 0 10 Adopted Village
4. Sujanpura 8 1 8 5. Papawani 5 0 6 6. Bori 6 0 7 7. Khiriya 15 0 15 8. Ganesh Ganj 6 0 6 9. Manikpura 5 2 4 Cluster Village
10 Neemkhera 9 2 9 Control Village
Total 10 7 3 10
9.55 In non of the ten identified villages the facilities like regular market, weekly market, mandi
and sub-mandi exist though such facilities are located within managable distance in rural context. The availability of fair price shops in 7 number of villages is encoraging. The cold storage facilities are located away from the villages, which, seem natural.
AGRO BASED INDUSTRIAL UNITS 9.56 The table below shows the details;
Table No. 9.18 Status of Agro Based Industrial Units
Flour mill Oil mill Dal mill Sr. No. Name of the village Within
the village 0 Km
Away from the village
Km
Within the
village 0 Km
Away from the village
Km
Within the
village 0 Km
Away from the village
Km
1 2 3 4 5 6 7 8 1. Surajpur 0 5 13 2. Minnora 0 1 7 3. Charpua 0 3 10 Adopted Village
4. Sujanpura 2 8 9 5. Papawani 0 5 5 6. Bori 0 5 6 7. Khiriya 0 6 15 8. Ganesh Ganj 0 5 6 9. Manikpura 0 5 5 Cluster Village
10 Neemkhera 0 8 9 Control Village
Total 9 1 10 10

538
Table No. 9.18 [Contd…] Status of Agro Based Industrial Units
Saw mill Repair of Agr. implements Sr. No. Name of the village Within the village
0 Km Away from
the village Km Within the village
0 Km Away from the
village Km 1 2 9 10 11 12 1. Surajpur 13 5 2. Minnora 7 1 3. Charpua 10 3 Adopted Village
4. Sujanpura 9 2 5. Papawani 6 6 6. Bori 6 5 7. Khiriya 15 6 8. Ganesh Ganj 5 3 9. Manikpura 5 5 Cluster Village
10 Neemkhera 9 0 Control Village
Total 10 1 9
9.57 The above table shows that out of 10 number of villages, flour mills are located within the
physical boundaries of 9 number of villages while in rest of 1 village this facility is located within the easy reach of the villagers. In non of the villages, oil mills, dal mills and saw mills are located within the easy reach of the villagers [except in few marginal cases where the distance is not much]. With the exception of village Neemkhera non-existence of any unit of repair of agricultural implements in rest of the villages is a drawback as the inhabitants of these villages are pursuing agriculture as main occupation.
SOCIAL INPUTS – EDUCATION ELEMENTARY EDUCATION – PRIMARY LEVEL 9.58 The Universalisation of Elementary Education Programme [U.E.E.] which envisages
compulsory enrolment of children upto the age of 14 years of age has become popular in Madhya Pradesh. The table below shows the details of primary level of education in our area of study.
Table No. 9.19 Status of Primary Level of Education
Primary School Non formal education Sr. No.
Name of the village Within the
village 0 km With-in
1 km With-in
2 km With-in
3 km > 3 km
Within the village0 km
Away from the village km
1. Surajpur 0 5 2. Minnora 0 8 3. Charpua 0 6 Adopted Village
4. Sujanpura 0 8 5. Papawani 0 4 6. Bori 0 7 7. Khiriya 0 12 8. Ganesh Ganj 0 11 9. Manikpura 0 5 Cluster Village
10 Neemkhera 0 10 Control Village
Total 10 0 0 0 0 0 10

539
9.59 One positive fact revealed by the above table is the existence of primary schools within the geographical limits of all the ten number of villages covered under the study that contributed for higher levels of literacy rate within the sample area. Non formal education centres meant for working children who can not attend the regular primary institutions are not existing within the sample villages.
ELEMENTARY EDUCATION–MIDDLE LEVEL AND ADULT EDUCATION 9.60 The table below shows the status of middle level and adult education.
Table No. 9.20
Status of Middle Level and Adult Education Sr. No.
Name of the village
Middle School Adult Education
In the village 0 km
Within 5 km
More than 5 km
Within 1 km
Within 2 km
Within 3 km
> 3 km
1 2 3 4 5 6 7 8 9 1. Surajpur 2 10 2. Minnora 1 9 3. Charpua 0 15 Adopted Village
4. Sujanpura 2 8 5. Papawani 0 11 6. Bori 0 8 7. Khiriya 0 15 8. Ganesh Ganj 0 10 9. Manikpura 0 5 Cluster Village
10 Neemkhera 1 15 Control Village
Total 6 4 10
9.61 The above table shows the location of middle school within the geographical limits of 6
number of village, Since the criterion of the accessibility of middle school is 3 kms, the rest of 4 number of villages are therefore within the laid down criterion which is an encouraging picture. For every village the facility of adult educations centres are generally located for away from the village.
SECONDARY LEVEL OF EDUCATION 9.62 The policy relating to secondary education implies extension of school system in unserved
areas, consolidating existing facilities and providing special arrangements for talented students. In view of above policy decisions, the table below shows the details;

540
Table No. 9.21 Status of Secondary Level Education
High School Higher School (+2) Sr. No.
Name of the village In the village
0 km Within 5 km
More than 5 km
In the village 0 km
Within 5 km
More than 5 km
1 2 3 4 5 6 7 8 1. Surajpur 7 12 2. Minnora 1 7 3. Charpua 3 9 Adopted Village
4. Sujanpura 2 8 5. Papawani 5 5 6. Bori 5 5 7. Khiriya 9 15 8. Ganesh Ganj 3 5 9. Manikpura 3 3 Cluster Village
10 Neemkhera 2 9 Control Village
Total 8 2 4 6
9.63 The above table shows the existence of high school and higher school with 5 km radius for 8
villages and 4 village respectively. For rest of the villages these facilities are located far–away from the geographical limits of the identified sample villages. However, the situation is highly satisfactory.
COLLEGIATE AND TECHNICAL EDUCATION 9.64 The table below shows the details
Table No. 9.22
Status of Collegiate and Technical Education College Industrial Training Instt. Sr.
No Name of the
village Within the village 0 km
Within 5 km
More than 5 km
Within the village 0 km
Within 5 km
More than 5 km
1 2 3 4 5 6 7 8 1. Surajpur 10 12 2. Minnora 7 9 3. Charpua 10 10 Adopted Village
4. Sujanpura 9 9 5. Papawani 7 7 6. Bori 5 6 7. Khiriya 14 14 8. Ganesh Ganj 4 7 9. Manikpura 3 7 Cluster Village
10 Neemkhera 8 9 Control Village
Total 3 7 10
9.65 The above table shows that in non of the villages these facilities are located within the
physical limits of ten sample villages which seem obvious as colleges and I.T.Is. are usuall located at district or tahsil headquarters.

541
HEALTH 9.66 Primary health care approach being the core strategy of the Tenth Plan for Madhya Pradesh,
a multi tier health and family welfare service delivery system has been developed in the State consisting of sub-health centres, primary health centres and community health centres. Besides, civil hospitals, district hospitals and other special health care institutions have been provided as a support to three tier system. The norms accepted for three tier system is given below;
a. Sub Health Centre for every 5,000 population in non-tribal areas and 3,000 population in
tribal. b. Primary Health Centre for every 30,000 population in non-tribal areas and 20,000
population in tribal areas. c. Community Health Centre for 1,20,000 population in non-tribal areas and 80,000 population
in tribal areas. 9.67 On the basis of aforesaid population criteria, the locational analysis of sub-health centres
and Rural Family Welfare Centres may be attempted. 9.68 The table below shows the details;
Table No. 9.23 Rural Health Infrastructure Sub Health Centre Rural Family Welfare Centre Sr.
No. Name of the village
Within the Village 0 km
Within 5 km
More than 5
km
Within the Village 0 km
Within 5 km
More than 5
km 1 2 3 4 5 6 7 8 1. Surajpur 2 3 2. Minnora 1 1 3. Charpua 3 3 Adopted Village
4. Sujanpura 2 2 5. Papawani 5 5 6. Bori 2 2 7. Khiriya 0 0 8. Ganesh Ganj 3 3 9. Manikpura 3 3 Cluster Village
10 Neemkhera 2 2 Control Village
Total 1 9 1 9

542
Table No. 9.23 [Contd…] Rural Health Infrastructure Government Hospital Government Dispensary Sr.
No. Name of the village
Within the village 0 km
Within 5 km
More than 5 km
Within the village 0 km
Within 5 km
More than 5 km
1 2 9 10 11 12 13 14 1. Surajpur 8 10 2. Minnora 7 1 3. Charpua 9 3 Adopted Village
4. Sujanpura 8 3 5. Papawani 5 5 6. Bori 6 5 7. Khiriya 15 9 8. Ganesh Ganj 6 3 9. Manikpura 6 5 Cluster Village
10 Neemkhera 9 2 Control Village
Total 1 9 8 2
Table No. 9.23 [Contd…] Rural Health Infrastructure Private Clinic Nursing Home Sr.
No Name of the
village Within the village 0 km
Within 5 km
More than 5 km
Within the village 0 km
Within 5 km
More than 5 km
1 2 15 16 17 18 19 20 1. Surajpur 3 12 2. Minnora 1 8 3. Charpua 3 9 Adopted Village
4. Sujanpura 2 8 5. Papawani 0 6 6. Bori 5 7 7. Khiriya 0 15 8. Ganesh Ganj 3 7 9. Manikpura 5 5 Cluster Village
10 Neemkhera 2 9 Control Village
Total 2 8 1 9
9.69 Against the total number of 10 villages only one village i.e. Khiriya [cluster village] has
sub health centre within the geographical limits of the village. In rest of the 9 villages, the sub health centre is located within 5 km distance from the village which obviously is an encouraging situation.
9.70 Regarding Rural Family Welfare Centre, in village Khiriya this facility is located within the
village. In rest of the villages, this facility is located within 5 km distance from the village. 9.71 As regards government hospitals, the facility is not available within the geographical limits
of any of the sample village while in 1 number of village this facility is available within 5 km radius of the village and for 9 number of villages, government hospitals are located more than 5 kms away from the village. More or less similar is the situation with government dispensaries.

543
9.72 In two villages the private clinic are located within the geographical limits of the village while in non of the villages nursing homes are in existence.
FAMILY WELFARE 9.73 Limiting the size of the family is the most important parameter of family welfare measures.
The table below shows the status of the acceptors of family welfare measures in the sample villages covered under the study.
Table No. 9.24 Status of Acceptors of Family Welfare Measurer
Sr. No
Name of the village Total Workers
Acceptors of Nirodh
(No.of Benefic-iaries)
Tubectomy (No. of
Benefic-iaries)
Vasectomy (No. of
Benefic-iaries)
Loop Insertion (No. of
Benefic-iaries)
Oral Pills (No. of
Benefic-iaries)
Traditional Methods (No. of
Benefic-iaries)
1 2 3 4 5 6 7 8 9 1. Surajpur 106 3 [2.83] 9 [8.49] 0 0 5 [4.72] 0 2. Minnora 408 3 [0.74] 7 [1.72] 2 [0.49] 0 3 [0.74] 0 3. Charpua 451 10 [2.22] 18 [3.99] 4 [0.89] 6 [1.33] 12 [2.66] 2 [0.44] Adopted Village 965 16 [1.66] 34 [3.52] 6 [0.62] 6 [0.62] 20 [2.07] 2 [0.21]
4. Sujanpura 47 3 [6.38] 2 [4.26] 0 1 [2.13] 3 [6.38] 0 5. Papawani 630 5 [0.79] 7 [1.11] 0 0 6 [0.95] 1 [0.16] 6. Bori 406 5 [1.23] 11 [2.71] 3 [0.74] 1 [0.25] 6 [1.48] 1 [0.25] 7. Khiriya 355 11 [3.10] 4 [1.13] 2 [0.56] 3 [0.85] 3 [0.85] 2 [0.56] 8. Ganesh Ganj 291 10 [3.44] 6 [2.06] 2 [0.69] 4 [1.37] 4 [1.37] 3 [1.03] 9. Manikpura 388 11 [2.84] 12 [3.09] 3 [0.77] 1 [0.26] 10 [2.58] 0 Cluster Village 2117 45 [2.13] 42 [1.98] 10 [0.47] 10 [0.47] 32 [1.51] 7 [0.33]
10 Neemkhera 225 7 [3.11] 4 [1.78] 2 [0.89] 4 [1.78] 5 [2.22] 0 Control Village 225 7 [3.11] 4 [1.78] 2 [0.89] 4 [1.78] 5 [2.22] 0
Total 3307 68 [2.06] 80 [2.42] 18 [0.54] 20 [0.60] 57 [1.72] 9 [0.27]
Note : Figures in brackets show the percentage to figures of column 3 laterally. 9.74 In the above table the percentage figures have been arrived at on the basis of the figures of
the workforce which is, in strict sense is not correct. The comparison should have been made on the basis of the figures of eligible couples. Since village wise such figures are not available, therefore as a second option the work force figures that usually include persons within the age group of 15 to 59 years have been taken who may be considered as population with reproductive capacity, particularly males.
9.75 Against the total figure of 3307 persons in the work force the total number of persons
adopting various methods of family welfare is 252 which is 7.62 percent to total work force of ten identified villages. The performance to some extent is satisfactory as the figure would have gone to much higher level had the comparison made with the figures of eligible couple. As has been expected, the emphasis is more on the methods of tubectomy, acceptors of Nirodh and oral bills than on any other methods.
DRINKING WATER 9.76 The table below shows the existing level of drinking water facilities available in the sample
villages.

544
Table No. 9.25 Status of Drinking Water Facilities
Sources of drinking water Distance from the village
Sl. No.
Name of the Village In the village =1 KM =2 KMS. =3 KMS. =4KMS.
1 2 3 4 5 6 7 Surajpur
1 Minnora 0 - - - - 2 Charpua 0 - - - - 3 Adopted Village 0 - - - -
Sujanpura 4 Papawani 0 - - - - 5 Bori 0 - - - - 6 Khiriya 0 - - - - 7 Ganesh Ganj 0 - - - - 8 Manikpura 0 - - - - 9 Cluster Village 0 - - - -
Neemkhera 10 Control Village 0 - - - -
Total 10 - - - -
9.77 In all the 10 number of sample villages one or other drinking water source, mostly hand
pumps is available. 9.78 In what follows an attempt has been made to summarise the details of the village
particulars. - The basic purpose of the collection of information about village facilities for identified
ten villages is to ascertain the absorption capacity of any prevailing or new technology regarding any field what-so-ever.
- The total population of 10 identified villages is 7201 which is 0.73 percent of total rural population of Tikamgarh district.
- Basically all the ten identified villages are S.C. predominated where the percentage literacy ranged between 42.2 far village Manikpura to 65.7 percent for village Neemkhera, not far below the district level percentage literacy of 55.80 and state level figure of 64.11. The average size of the family is 6 persons.
- The work participation rate ranged between 26.6 percent for village Surajpur [adopted village] to 58.8 percent for village Sujanpura [cluster village].
- The proportion of main workers, in general is higher than marginal workers with male participation higher than female participation.
- A reverse situation is visible in case of marginal workers where female participation is more than male participation.
- The proportion of non-workers that ranged between 41.3 percent for village Sujanpura [adopted village] to 73.4 percent for village Surajpur [adopted village] presents a dismal picture.
- The agriculture remains to be the main occupation of the ten identified villages covered under the study with substantial proportion of cultivators as compared to agriculture labour. In five number of villages viz. Surajpur, Charpuan, Papawani, Bauri and Khiriya the proportion of female cultivators is more than that of male cultivators that signifies the awareness and intent of the female members of the farming community to work along with their male counterpart.
- The situation regarding proportion of workers in household industries is for from being satisfactory as it ranged between 0.3 percent for villages Khiriya and Manikpura [both cluster villages] to 1.7 percent for village Bauri [cluster village].

545
- Regarding land use, the gross cropped area of 10 number of identified villages is 84.43 percent to total geographical area. The percentage of gross irrigated area to gross cropped area is 64.20 much higher than district and state average percentages of 53.56 and 28.54 respectively.
- All the villages covered under the study are electrified with irregular power supply situation.
- The total number of pumpsets energized is 410 which is 1.42 percent of total number of 28920 pump sets energized in district Tikamgarh in the year 1999-2000.
- The existence of only one household industrial unit and five cooperative societies presents a discouraging picture.
- The location of Gram Panchayat within or close to the sample villages is a positive factor that, to some extent, gurantees involvement of villagers in the development of their area.
- The status of road infrastructure in identified 10 number of villages is highly satisfactory.
- The facility of railway station is not available within the close proximity of any of the village while seven number of villages have bus stand/bus stop within the village. Even two and three number of villages have post office and S.T.D. facility respectively within geographical limit of the district.
- In non of the ten identified villages any of agriculture marketing facilities exists. - In non of the villages the oil mills, dal mills saw mills exist. - Regarding education, the existence of primary school within the geographical limits of
all the ten number of villages covered under the study is encouraging factor that contributed to higher levels of literacy rate.
- Regarding health scenario, village Khiriya [cluster village] has both sub health centre and rural family welfare centre within the geographical limit of the village. In two villages the private clinics are located within the geographical limit of the village.
- Against the total of 3307 persons in the work force the total number of persons adopting various methods of family welfare is 252 which is 7.62 percent to total work force of ten identified villages.
- In all the 10 number of sample villages one or other drinking water source, mostly hand pumps, is available. Results of Survey - Household Particulars
9.79 The present part of the chapter deals with the information relating to the households in the
following dimensions; (i) Macro Dimensions – Wherein information from all the households residing in 10 number of
sample villages has been collected. (ii) Micro Dimensions – Wherein 25 percent of the households have been identified for the
detailed enquiry. 9.80 In what follows an attempt has been made to detail out both macro and micro dimensions
based on the information collected through House Listing Schedule and Household Schedule.
MACRO DIMENSIONS – GENERAL PARTICULARS 9.81 The table below shows the details;

546
Table No. 9.26 Household Details
S. No.
Name of the Village No. of household as on the date of survey
Population Census-2001
Average size of the family (based on the figure of col.4
1 2 3 4 5 1. Surajpur 77 398 5 2. Minnora 95 923 9 3. Charpua 146 940 6 Adopted Village 318 2261 7
4. Sujanpura 23 80 3 5. Papawani 136 1215 8 6. Bori 143 907 6 7. Khiriya 86 719 8 8. Ganesh Ganj 135 725 5 9. Manikpura 140 864 6 Cluster Village 663 4510 6
10 Neemkhera 39 430 11 Control Village 39 430 11 Total 1020 7201 7
9.82 The total numbe of households as per survey is 1020 for all the ten identified village. The
average size of the family comes to 7 persons which is more than the average size of the family of 5 persons.
SOCIAL STATUS OF THE HOUSEHOLDS 9.83 The table below shows the social status of the households;
Table No. 9.27 Social Status of the Households.
Caste (Social classification) Interaction with KVK
S. No.
Name of the Village No. of Household
S.T. S.C. O.B.C. General Yes No 1 2 3 4 5 6 7 8 9 1. Surajpur 77 14 14 48 1 24 53 2. Minnora 95 10 41 34 10 21 74 3. Charpua 146 1 83 38 24 75 71 Adopted Village 318 25 138 120 35 120 198
4. Sujanpura 23 0 22 0 1 9 14 5. Papawani 136 5 67 50 14 42 94 6. Bori 143 0 41 96 6 43 100 7. Khiriya 86 4 48 19 15 23 63 8. Ganesh Ganj 135 2 75 44 14 40 95 9. Manikpura 140 4 21 102 13 36 104 Cluster Village 663 15 274 311 63 193 470
10 Neemkhera 39 0 0 39 0 24 15 Control Village 39 0 0 39 0 24 15
Total 1020 40 412 470 98 337 683

547
9.84 The above table shows the prepondence of S.C. and O.B.C. households, the combined percentage of which is 86.47 to total number of 1020 households which underlines one important fact that the vulnerable communities in our sample villages are pursuing the agriulture occupation in viable manner. About 33 percent households have interacted with K.V.K. in one way or other.
HOUSEHOLDS CLASSIFIED ON THE BASIS OF RELIGION 9.85 The table below shows the details;
Table No. 9.28 Distribution of Households according to Religion
S. No.
Name of the Village No. of Household
Hindu Muslim Sikh Christian Nu-Buddh
1 2 3 4 5 6 7 8 1. Surajpur 77 77 0 0 0 0 2. Minnora 95 95 0 0 0 0 3. Charpua 146 146 0 0 0 0 Adopted Village 318 318 0 0 0 0
4. Sujanpura 23 23 0 0 0 0 5. Papawani 136 136 0 0 0 0 6. Bori 143 143 0 0 0 0 7. Khiriya 86 86 0 0 0 0 8. Ganesh Ganj 135 135 0 0 0 0 9. Manikpura 140 140 0 0 0 0 Cluster Village 663 663 0 0 0 0
10 Neemkhera 39 39 0 0 0 0 Control Village 39 39 0 0 0 0
Total 1020 1020 0 0 0 0
9.86 All the households in our area of study belong to Hindu religion.
OCCUPATIONAL DISTRIBUTION OF HOUSEHOLDS – MAIN OCCUPATION PRIMARY SECTOR – AGRICULTURE 9.87 The table below shows the details;
Table No. 9.29 Household According to their Main Occupation – Agriculture
S. No.
Name of the Village No. of household
Marginal Farmers
Small Farmers
Other Farmers
Agriculture Labour
1 2 3 4 5 6 7 1. Surajpur 77 1 38 28 0 2. Minnora 95 2 75 9 0 3. Charpua 146 3 115 10 0 Adopted Village 318 6 228 47 0
4. Sujanpura 23 7 16 4 0 5. Papawani 136 7 36 53 0 6. Bori 143 32 42 40 5 7. Khiriya 86 21 19 11 5 8. Ganesh Ganj 135 84 15 27 3 9. Manikpura 140 100 - 21 7 Cluster Village 663 251 128 156 20
10 Neemkhera 39 8 4 12 10 Control Village 39 8 4 12 10
Total 1020 265 360 215 30

548
9.88 Out of the total number of 1020 households 870 number of households constituting 85.29 percent to total households are engaged directly in agriculture as their main occupation that clearly indicaters the proper rational of selection of villages in the groups of adopted and cluster. The combined percentage of other farmers and small farmers is 56.37 that justifies one fact clearly that the absorption capacity of new or prevailing technologies exists in our area of study which in due course will definitely cover the marginal farmers as well. Existence of only 30 number of households as agriculture labour is indicative of the fact that agriculture as main occupation is being pursued on viable manner.
PRIMARY SECTOR – FOREST, LIVESTOCK, FISHERIES, HUNTING 9.89 Activities allied to agriculture are equally important as additional source of income and
employment in rural areas. The table below shows the details;
Table No. 9.30 Households according to their Main Occupations – Forest, Livestock, Fisheries, Hunting
S. No.
Name of The Village No. of Household
Minor Forest
Produce Collection
Livestock Activities
Fishing Activities
Hunting Activities
1 2 3 4 5 6 7 1. Surajpur 77 0 1 0 0 2. Minnora 95 0 0 0 0 3. Charpua 146 0 0 0 0 Adopted Village 318 0 1 0 0
4. Sujanpura 23 0 0 0 0 5. Papawani 136 0 0 0 0 6. Bori 143 0 0 0 3 7. Khiriya 86 0 1 0 0 8. Ganesh Ganj 135 0 3 0 0 9. Manikpura 140 0 0 0 3 Cluster Village 663 0 4 0 6
10 Neemkhera 39 0 0 0 0 Control Village 39 0 0 0 0 Total 1020 0 5 0 6
9.90 The above table reveals that out of 1020 households 5 number of families are engaged in
livestock activities as main occupation while 6 number of households are pursuing hunting as their main occupation. Among six number of districts covered under the study, only in district Tikamgarh such type of activities are in vogue which is a positive indication as part of the population of sample villages have inclination for activities allied to agriculture though having a small magnitude.
SECONDARY AND TERTIARY SECTORS 9.91 Secondary and tertiary sector occupations are important from view points of income
augmentation and employment generation and absorption of work force in lean season of agriculture and also reducing pressure on land. The table below shows the details;

549
Table No. 9.31 Household Accourding to their main Occupation Secondry and Tertiary Sectors
Secondary Sector Tertiary Sector S. No.
Name of The Village No. of households Servicing And
Repairs Construction
Work Govt.
Service Service in Private
Sector 1 2 3 4 5 6 7 1. Surajpur 77 0 6 2 0 2. Minnora 95 0 0 0 0 3. Charpua 146 0 14 13 0 Adopted Village 318 0 20 15 0
4. Sujanpura 23 0 0 0 0 5. Papawani 136 0 0 0 0 6. Bori 143 0 0 9 0 7. Khiriya 86 0 7 7 0 8. Ganesh Ganj 135 0 0 7 0 9. Manikpura 140 0 3 6 0 Cluster Village 663 0 10 29 0
10 Neemkhera 39 0 0 0 0 Control Village 39 0 0 0 0
Total 1020 0 30 44 0
9.92 Out of the total of 1020 households, 30 number of households [2.94 percent] are engaged in
secondary sector relating to construction work while 44 households [2.19 percent] are in government employment.
OCCUPATIONAL DISTRIBUTION OF HOUSEHOLDS – SUBSIDIARY OCCUPATIONS
PRIMARY SECTOR – AGRICULTURE 9.93 Agriculture as subsidiary occupation is being pursued by 568 number of households in our
area of study. The table below shows the details.
Table No. 9.32 Household according to Subsidiary Occupation – Agriculture
S. No.
Name of the Village No. of household
Marginal Farmers
Small Farmers Other Farmers
Agriculture Labour
1 2 3 4 5 6 7 1. Surajpur 77 3 8 0 3 2. Minnora 95 4 8 0 3 3. Charpua 146 26 31 0 19 Adopted Village 318 33 6 0 25
4. Sujanpura 23 5 15 0 7 5. Papawani 136 26 15 0 19 6. Bori 143 31 15 0 20 7. Khiriya 86 37 28 0 11 8. Ganesh Ganj 135 41 31 1 52 9. Manikpura 140 47 35 3 19 Cluster Village 663 187 130 4 128
10 Neemkhera 39 5 6 0 19 Control Village 39 5 6 0 19 Total 1020 225 167 4 172
9.94 Agriculture as subsidiary occupation is mainly pursued by marginal farmers and agriculture
labourers the combined percentage of which is 38.93 to total number of 1020 households. The situation seems obvious as these category of cultivators who are prone to migration, do other jobs as well for sustenance alongwith agriculture.

550
PRIMARY SECTOR – FOREST, LIVESTOCK, FISHERIES, HUNTING 9.95 The table below shows the details;
Table No. 9.33
Households According to their Subsidiary Occupation – Forest, Livestock, Fisheries, Hunting S.
No. Name of The Village No. of
Household Minor Forest Produce
Collection Livestock Activities
Fishing Activities
Hunting Activities
1 2 3 4 5 6 7 1. Surajpur 77 0 6 0 0 2. Minnora 95 0 19 0 0 3. Charpua 146 0 0 0 0 Adopted Village 318 0 25 0 0
4. Sujanpura 23 0 0 0 0 5. Papawani 136 0 0 12 0 6. Bori 143 0 5 0 0 7. Khiriya 86 0 4 0 0 8. Ganesh Ganj 135 0 2 0 0 9. Manikpura 140 0 3 0 0 Cluster Village 663 0 14 12 0
10 Neemkhera 39 0 13 0 0 Control Village 39 0 13 0 0 Total 1020 0 52 12 0
9.96 Livestock is a popular activity in all the ten number of sample villages which is evident from
the fact that 5.01 percent households to total of 1029 households are engaged in this activity as a source of their subsidiary income. While 12 number of households [1.18 percent] are pursuing fishing activities as subsidiary occupation.
SECONDARY AND TERTIARY SECTORS 9.97 The table below shows the details;
Table No. 9.34 Households According to their Subsidiary Occupations – Secondary and Tertiary Sectors
Secondary Sector Tertiary Sector S. No.
Name of The Village No. of Household Servicing and
Repairs Construc-tion Work
Govt. Service
Service in Private Sector
1 2 3 4 5 6 7 1. Surajpur 77 0 0 0 0 2. Minnora 95 0 0 3 0 3. Charpua 146 0 1 2 0 Adopted Village 318 0 1 5 0
4. Sujanpura 23 0 0 0 0 5. Papawani 136 0 1 0 0 6. Bori 143 0 0 0 0 7. Khiriya 86 0 0 2 1 8. Ganesh Ganj 135 0 0 0 0 9. Manikpura 140 0 0 1 0 Cluster Village 663 0 1 3 1
10 Neemkhera 39 0 0 0 0 Control Village 39 0 0 0 0
Total 1020 0 2 8 1
9.98 Involvement of households in activities relating to secondary sector as subsidiary occupation
is two in our area of study while only 9 households are engaged in tertiary sector mostly employed in government service.

551
9.99 The only conclusion that can be drawn from the narrations in foregoing paragraphs is that agriculture is the main activity of the area under study which is being persued on viable scale.
AVERAGE MONTHLY INCOME 9.100 In any survey work the most difficult part is the collection of information regarding income
and expenditure of the household with reasonable accuracy as the households are very cautious about parting with the facts. However, the information shows a trend that may be useful for supporting conclusions which have direct or indirect relations with levels of income of the households. The table below shows the details;
Table No. 9.35
Average Monthly Income S.
No. Name of the Village No. of
House hold
Blow Rs.500
Rs.5001 to Rs.600
Rs.601 to
Rs.700
Rs.701 to
Rs.800
Rs.801 to
Rs.900
Rs.901 to
Rs.1000
Rs.1001 and
Above 1 2 3 4 5 6 7 8 9 10 1. Surajpur 77 0 0 0 0 0 4 73 2. Minnora 95 0 0 0 0 0 0 95 3. Charpua 146 0 0 0 0 0 10 136 Adopted Village 318 0 0 0 0 0 14 304
4. Sujanpura 23 0 0 0 0 0 3 20 5. Papawani 136 0 0 0 0 0 1 135 6. Bori 143 0 0 0 0 0 5 138 7. Khiriya 86 0 0 0 0 1 17 68 8. Ganesh Ganj 135 0 0 0 0 0 3 132 9. Manikpura 140 0 0 0 0 0 2 138 Cluster Village 663 0 0 0 0 1 31 631
10 Neemkhera 39 0 0 0 0 0 0 39 Control Village 39 0 0 0 0 0 0 39
Total 1020 0 0 0 0 1 45 974
9.101 The viable nature of agriculture as main and subsidiary occupations is reflected by the fact
that out of 1020 number of households the combined number of households within the income range of Rs. 901.00 to Rs. 1000.00 and Rs. 1001 and above per month is 1019 which is 99.90 percent to total households. In adopted villages this percentage is cent percent while in cluster villages it is 99.85 percent. Even in control village where there is no intervention of K.V.K. the percentage of households within the income range Rs. 901.00 to Rs. 1000.00 and Rs. 1001 and above per month is cent percent that shows overall affluence level of the area.
AVERAGE MONTHLY EXPENDITURE 9.102 The table below shows the details;

552
Table No. 9.36 Average Monthly Expenditure
S. No.
Name of the Village No. of Household
Blow Rs.500
Rs.501 to
Rs.600
Rs.601 to
Rs.700
Rs.701 to
Rs.800
Rs.801 to
Rs.900
Rs.901 to
Rs.1000
Rs.1001 and
Above 1 2 3 4 5 6 7 8 9 10 1. Surajpur 77 0 0 0 1 0 0 76 2. Minnora 95 0 0 0 0 0 0 95 3. Charpua 146 0 0 0 0 0 0 146 Adopted Village 318 0 0 0 1 0 0 317
4. Sujanpura 23 0 0 0 0 0 3 20 5. Papawani 136 0 0 0 0 0 5 131 6. Bori 143 0 0 0 0 0 10 133 7. Khiriya 86 0 0 0 0 0 2 84 8. Ganesh Ganj 135 0 0 0 0 0 6 129 9. Manikpura 140 0 0 0 0 0 3 137 Cluster Village 663 0 0 0 0 0 29 634
10 Neemkhera 39 0 0 0 0 0 0 39 Control Village 39 0 0 0 0 0 0 39
Total 1020 0 0 0 1 0 29 990
9.103 In line with income level, the percentage of households within the expenditure range of Rs.
901.00 to Rs. 1000.00 and Rs. 1001.00 and above per month to total households is 99.90 with the break-up of 99.69 percent for adopted villages and cent percent for cluster villages which further shows the affluence level of the area.
9.104 To sum up it may be mentioned that :- - The total number of households as per survey is 1020 with average size of family of 7
persons. All the households are the followers of Hindu religion. - The combined percentage of S.C. and O.B.C. communities is 86.47 to total of 1020
households. - Out of total of 1020 households, 870 number of households constituting 85.29 percent
to total households are engaged directly in agriculture as their main occupation. - Out of 1020 households 5 number of families are engaged in livestock activities as main
occupation while six number of households are pursuing hunting as their main occupation which are encouraging deviations as in most of the districts covered under the study the pursuance of these occupations are either missing or highly marginal.
- The pursuance of secondary and tertiary sectors as main occupation is only marginal. - Agriculture as subsidiary occupation is mainly pursued by marginal farmers and
agriculture labourers, the combined percentage of which is 38.93 to total number of 1020 households.
- In livestock and fishing activities 5.01 and 1.18 percent households respectively are engaged as source of secondary occupation
- Out of 1020 number of households the combined percentage of households within the average monthly income range of Rs. 901.00 to Rs. 1000.00 and Rs. 1001.00 and above is 99.90 which shows, overall, affluence level of the area.
- Similar is the trend with level of expenditure where 99.90 percent households are within the average monthly expenditure range of Rs. 901.00 to Rs. 1000.00 and Rs. 1001.00 and above that further shows the affluence level of the area.

553
RESULTS OF THE SURVEY – MICRO DIMENSION 9.105 In this part of the Chapter 25 percent of the households have been identified for detailed
enquiry which comes to 256 households. The 25% of 1020 households comes to 255 but we have taken the figure of 256 due to unavoidable demographic particulars.
9.106 The table below shows the details;
Table No. 9.37 Male – Female Distribution
Age, Male S. No.
Name of the Village No. of Families Selected
No. of Family
Members
Male Total 0-10
Years 10-20 Years
20-30 Years
30-40 Years
40-50 Years
50-60 Years
60 Years and
Above 1 2 3 4 5 6 7 8 9 10 11 12 1. Surajpur 20 111 63 20 17 8 7 6 3 2 2. Minnora 24 136 69 15 20 11 6 8 5 4 3. Charpua 37 202 106 17 38 18 13 10 8 2 Adopted Village 81 449 238 52 75 37 26 24 16 8
4. Sujanpura 6 29 21 12 3 3 1 2 0 0 5. Papawani 34 186 98 34 23 11 14 8 6 2 6. Bori 37 196 101 42 16 14 19 5 4 1 7. Khiriya 21 119 66 11 20 12 11 5 3 4 8. Ganesh Ganj 34 196 83 14 24 14 10 11 7 3 9. Manikpura 33 191 105 19 44 5 19 9 3 6 Cluster Village 165 917 474 132 130 59 74 40 23 16
10 Neemkhera 10 68 28 4 7 5 3 4 3 2 Control Village 10 68 28 4 7 5 3 4 3 2
Total 256 1434 740 188 212 101 103 68 42 26
Table No. 9.37 [Contd…]
Male – Female Distribution Age, Female S.
No. Name Of The Village No. of
Families Selected
No. of Family
Members
Female
Total 0-10
Years 10-20 Years
20-30 Years
30-40 Years
40-50 Years
50-60 Years
60 Years and
Above1 2 3 4 13 14 15 16 17 18 19 20
1. Surajpur 20 111 48 9 13 8 9 5 2 2 2. Minnora 24 136 67 21 18 8 8 5 6 1 3. Charpua 37 202 96 17 31 14 13 14 4 3 Adopted Village 81 449 211 47 62 30 30 24 12 6
4. Sujanpura 6 29 8 1 1 3 2 1 0 0 5. Papawani 34 186 88 30 19 11 17 6 5 0 6. Bori 37 196 95 41 12 16 17 6 2 1 7. Khiriya 21 119 53 17 12 5 9 5 3 2 8. Ganesh Ganj 34 196 113 27 42 16 11 9 5 3 9. Manikpura 33 191 86 16 25 8 21 7 4 5 Cluster Village 165 917 443 132 111 59 77 34 19 11
10 Neemkhera 10 68 40 9 18 3 3 5 1 1 Control Village 10 68 40 9 18 3 3 5 1 1
Total 256 1434 694 188 191 92 110 63 32 18

554
9.107 The above table shows that out of the total number of 1434 number of persons from 256 households males constitute 51.60 percent while females constitute 48.40 percent. The number of males within the age group of 20 to 60 years which represents labour force is 314 which is 42.43 percent to total number of 740 males is indicative of a positive fact that more persons are available for any productive work. These percentages are 46.64 in adopted villages and 44.73 in cluster villages which underline one basic point that in case of rapid development of agriculture through application of technology by the K.V.Ks. the possibility of absorbing the existing labour force will arrest the tendency of migration during lean season of agriculture. In case of females this percentage is 43.39 with break ups of 48.34 percent for adopted villages and 45.15 percent for cluster villages [more or less in line with male population] that again shows the availability of female labour – force for pursuance of any activity for family income augmentation along with engaging themselves in agriculture with their male counterpart. The percentage of dependent persons comprising of population within the age group of 0 to 10 years and 60 years and above who do not usually contribute towards family income is 28.92 in case of males and 29.68 percent in case females, is within a fair limit particularly for males which, ofcourse, is again a positive indicator.
EDUCATIONAL STATUS OF SAMPLE HOUSEHOLDS 9.108 Education and literacy are the twin prerequisites necessary for adoption of any sort of
technology. The table below shows the educational status of sample households;
Table No. 9.38 Educational Status
S. No.
Name of The Village No. of Families Selected
No. of Family
Members
Illiterate Literate without going to school
Primary No.
Middle No.
1 2 3 4 5 6 7 8 1. Surajpur 20 111 41 0 32 25 2. Minnora 24 136 42 0 42 34 3. Charpua 37 202 36 2 41 51 Adopted Village 81 449 119 2 115 110
4. Sujanpura 6 29 12 0 8 6 5. Papawani 34 186 76 1 61 34 6. Bori 37 196 78 1 65 34 7. Khiriya 21 119 32 0 33 27 8. Ganesh Ganj 34 196 27 5 51 46 9. Manikpura 33 191 20 0 47 52 Cluster Village 165 917 245 7 265 199
10 Neemkhera 10 68 11 0 18 21 Control Village 10 68 11 0 18 21
Total 256 1434 375 9 398 330

555
Table No. 9.38 [Contd…] Educational Status
S. No
Name of The Village No. of Families Selected
No. of Family
Members
High School
No.
Higher School
No.
Graduate No.
Post Graduate
No.
Others
1 2 3 4 9 10 11 12 13 1. Surajpur 20 111 9 3 1 0 0 2. Minnora 24 136 14 3 1 0 0 3. Charpua 37 202 54 17 1 0 0 Adopted Village 81 449 77 23 3 0 0
4. Sujanpura 6 29 1 0 1 1 0 5. Papawani 34 186 10 4 0 0 0 6. Bori 37 196 10 7 1 0 0 7. Khiriya 21 119 16 7 3 1 0 8. Ganesh Ganj 34 196 49 18 0 0 0 9. Manikpura 33 191 61 11 0 0 0 Cluster Village 165 917 147 47 5 2 0
10 Neemkhera 10 68 18 0 0 0 0 Control Village 10 68 18 0 0 0 0
Total 256 1434 242 70 8 2 0
9.109 The literacy percentage against the total of 1434 persons is 73.85 which is far above than the
district average of 55.80 percent and the state average of 64.11 percent as per census 2001. The percentage of children in levels of elementary education [primary + middle levels] is 50.77 which shows the fair impact of the programme of universalisation of Elementary Education over our area of study. The extent of higher education is far from being impressive mainly because of the lack of higher educational facilities in our area of study. However, an overall educational status that emerges justifies the extent of absorption capacity of the people of the sample area to adopt technology regarding agriculture, introduced particularly by the K.V.K.
OCCUPATIONAL DISTRIBUTION OF HOUSEHOLDS–MAIN OCCUPATION 9.110 Out of the total of 1434 household members of our sample area, 268 persons are engaged in
various main occupations which constitute 18.69 percent to total household members. In what follow an attempt has been made to analyse the information pertaining to main occupations.
OCCUPATIONS RELATING TO AGRICULTURE 9.111 The table below shows the details;

556
Table No. 9.39 Main Occupation – Agriculture
S. No.
Name of The Village No. of families selected
No. of family
members
Small Farmer
Marginal Farmer
Farmer Agriculture Labour
1. Surajpur 20 111 6 0 14 0 2. Minnora 24 136 12 1 10 0 3. Charpua 37 202 19 1 16 2 Adopted Village 81 449 37 2 40 2
4. Sujanpura 6 29 4 0 2 0 5. Papawani 34 186 24 0 8 1 6. Bori 37 196 25 0 12 0 7. Khiriya 21 119 9 0 11 2 8. Ganesh Ganj 34 196 13 4 15 0 9. Manikpura 33 191 21 1 9 0 Cluster Village 165 917 96 5 57 3
10 Neemkhera 10 68 0 0 10 0 Control Village 10 68 0 0 10 0
Total 256 1434 133 7 107 5
9.112 The bulk of farming community from sample population is constituted by small farmers and
farmers which is 16.74 percent to total of 1434 family members. The marginal number of agriculture labour is a supportive factor.
OCCUPATIONS ALLIED TO AGRICULTURE 9.113 The table below shows the details;
Table No. 9.40 Main Occupation – Allied to Agricultural
S. No.
Name of The Village No. of families selected
No. of family
members
Minor Forest
Produce Collection
Live stock
Activities
Fishing Activities
Hunting Activities
Mining and
Quarying
1 2 3 4 5 6 7 8 9 1. Surajpur 20 111 0 0 0 0 0 2. Minnora 24 136 0 3 0 0 0 3. Charpua 37 202 0 0 0 0 0 Adopted Village 81 449 0 3 0 0 0
4. Sujanpura 6 29 0 0 0 0 0 5. Papawani 34 186 0 0 0 0 0 6. Bori 37 196 0 0 0 0 0 7. Khiriya 21 119 0 0 0 0 0 8. Ganesh Ganj 34 196 1 2 0 0 0 9. Manikpura 33 191 0 0 0 0 0 Cluster Village 165 917 1 2 0 0 0
10 Neemkhera 10 68 0 4 0 0 0 Control Village 10 68 0 4 0 0 0
Total 256 1434 1 9 0 0 0
9.114 One of the mandates of K.V.K. is to encourage the activities allied to agriculture particularly
that of animal husbandry and fisheries as alternate sources of rural income with immense advantage of reducing pressure on land. The above table shows the pursuance by 9 persons the activity of livestock rearing, as main occupation is an encouraging trend as in case of other K.V.Ks. covered under the study, the performance for this activity is either missing or negligible.

557
OCCUPATIONS RELATING TO SECONDARY AND TERTIARY SECTORS 9.115 The table below shows the details;
Table No. 9.41 Main Occupation – Secondary and Tertiary Sectors
Secondary sector Tertiary Sector S. No
Name of The Village
No. of families selected
No. of family
members Manufac-turing of by- Product
Servicing and repairs
Const-ruction work
Govt. Service
Service in Pvt. Sector
Others
1. Surajpur 20 111 0 0 0 0 0 0 2. Minnora 24 136 0 1 0 0 0 0 3. Charpua 37 202 0 3 0 0 0 0 Adopted Village 81 449 0 4 0 0 0 0
4. Sujanpura 6 29 0 0 0 0 0 0 5. Papawani 34 186 0 0 0 0 0 0 6. Bori 37 196 0 0 0 0 0 0 7. Khiriya 21 119 0 1 0 0 0 0 8. Ganesh Ganj 34 196 0 0 0 0 0 0 9. Manikpura 33 191 0 1 0 0 0 0 Cluster Village 165 917 0 2 0 0 0 0
10 Neemkhera 10 68 0 0 0 0 0 0 Control Village 10 68 0 0 0 0 0 0
Total 256 1434 0 6 0 0 0 0 9.116 The involvement of six numbers of family members in secondary sector particularly in
servicing and repairs can hardly be termed as satisfactory. One of the important causes of rural poverty is the absence of secondary sector occupations in the rural areas.
OCCUPATIONAL DISTRIBUTION OF HOUSEHOLDS IN SUBSIDIUARY OCCUPATIONS 9.117 Out of total of 1434 persons, 23 persons are engaged in various subsidiary occupations that
constitute 1.60 percent to total household members of our sample area. The picture is hardly of any use.
SUBSIDIARY OCCUPATIONS – AGRICULTURE 9.118 The table below shows the details;
Table No. 9.42 Subsidiary Occupation – Agriculture
S. No.
Name of The Village
No. of families selected
No. of family members
Small Farmer
Marginal Farmer
Farmer Agriculture Labour
1. Surajpur 20 111 0 0 0 0 2. Minnora 24 136 0 0 1 0 3. Charpua 37 202 1 0 0 0 Adopted Village 81 449 1 0 1 0
4. Sujanpura 6 29 0 0 0 0 5. Papawani 34 186 0 0 0 0 6. Bori 37 196 0 0 0 0 7. Khiriya 21 119 0 0 0 5 8. Ganesh Ganj 34 196 1 0 0 2 9. Manikpura 33 191 0 0 1 0 Cluster Village 165 917 1 0 1 7
10 Neemkhera 10 68 0 0 0 0 Control Village 10 68 0 0 0 0
Total 256 1434 2 0 2 7

558
9.119 The above table shows the involvement of only 4 persons in agricultural occupations which is hardly a meaningful affair.
SUBSIDIARY OCCUPATIONS – ALLIED TO AGRICULTURE 9.120 The table below shows the details;
Table No. 9.43 Subsidiary Occupation – Allied to Agriculture
S. No.
Name of The Village No. of families selected
No. of family
members
Minor Forest
Produce Collection
Live stock
activities
Fishing Activities
Hunting Activities
Mining and
Quarying
1 2 3 4 5 6 7 8 9 1. Surajpur 20 111 0 0 0 0 0 2. Minnora 24 136 0 4 0 0 0 3. Charpua 37 202 0 0 0 0 0 Adopte d Village 81 449 0 4 0 0 0
4. Sujanpura 6 29 0 0 0 0 0 5. Papawani 34 186 0 0 0 0 0 6. Bori 37 196 0 5 0 0 0 7. Khiriya 21 119 0 1 0 0 0 8. Ganesh Ganj 34 196 0 0 0 0 0 9. Manikpura 33 191 0 0 0 0 0 Cluster Village 165 917 0 6 0 0 0
10 Neemkhera 10 68 0 0 0 0 0 Control Village 10 68 0 0 0 0 0 Total 256 1434 0 10 0 0 0
9.121 The above table shows the involvement of 10 persons for the occupation relating to
livestock activities as subsidiary occupation which is 0.70 percent to total family members. SUBSIDIARY OCCUPATION – SECONDARY AND TERTIARY SECTORS 9.122 The table below shows the details;
Table No. 9.44 Subsidiary Occupations – Secondary and Tertiary Sectors
S. No.
Name of The Village
No. of families selected
No. of family
members
Manufacturing of by Product
Servi-cing and repairs
Const-ruction work
Govt. Service
Service in Pvt.
Sector 1 2 3 4 5 6 7 8 9
1. Surajpur 20 111 0 0 0 0 0 2. Minnora 24 136 0 0 0 0 0 3. Charpua 37 202 0 0 0 0 0 Adopted Village 81 449 0 0 0 0 0 4. Sujanpura 6 29 0 0 0 0 0 5. Papawani 34 186 0 0 0 0 0 6. Bori 37 196 0 0 0 0 0 7. Khiriya 21 119 0 2 0 0 0 8. Ganesh Ganj 34 196 0 0 0 0 0 9. Manikpura 33 191 0 0 0 0 0 Cluster Village 165 917 0 2 0 0 0 10 Neemkhera 10 68 0 0 0 0 0 Control Village 10 68 0 0 0 0 0 Total 256 1434 0 2 0 0 0 9.123 Again there are only two persons engaged in secondary sector which is far from being
satisfactory.

559
AVERAGE MONTHLY INCOME 9.124 The table below shows the details;
Table No. 9.45
Average Monthly Income S.
No. Name of The Village No. of
families selected
No. of family
members
Below Rs. 500
Rs. 501 to
Rs. 600
Rs. 601 to
Rs. 700
Rs. 701 to
Rs. 800
Rs. 801 to
Rs. 900
Rs. 901 to
Rs. 1000
Rs. 1001 & above
1 2 3 4 5 6 7 8 9 10 11 1. Surajpur 20 111 20 0 0 0 0 0 91 2. Minnora 24 136 27 0 0 0 0 1 108 3. Charpua 37 202 36 0 0 2 0 3 161 Adopted Village 81 449 83 0 0 2 0 4 360
4. Sujanpura 6 29 6 0 0 0 0 0 23 5. Papoura (Mondu Bhak) 34 186 34 0 0 0 0 1 151 6. Bori 37 196 37 0 0 0 0 0 159 7. Khiriya 21 119 20 0 0 0 0 1 98 8. Ganesh Ganj 34 196 34 0 0 0 0 1 161 9. Manikpura 33 191 34 0 0 0 0 1 156 Cluster Village 165 917 165 0 0 0 0 4 748
10 Neemkhera 10 68 13 0 0 0 0 1 54 Control Village 10 68 0 0 0 0 0 1 54
Total 256 1434 261 0 0 2 0 9 1162
9.125 The above table shows that 81.03 percent family members against the 1434 persons are
within the average income range of below Rs.1001.00 and above per month which seems obvious as the farming activities in our sample area is done on viable scale.
AVERAGE MONTHLY EXPENDITURE 9.126 The table shows the details;
Table No. 9.46 Average Monthly Expenditure
S. No.
Name of The Village No. of families selected
No. of family
members
Below Rs. 500
Rs. 501 to
Rs. 600
Rs. 601 to
Rs. 700
Rs. 701 to
Rs. 800
Rs. 801 to
Rs. 900
Rs. 901 to
Rs. 1000
Rs. 1001 and
Above 1 2 3 4 5 6 7 8 9 10 11 1. Surajpur 20 111 20 0 0 0 0 0 91 2. Minnora 24 136 22 0 0 1 0 4 109 3. Charpua 37 202 36 1 0 0 0 1 164 Adopted Village 81 449 78 1 0 1 0 5 364
4. Sujanpura 6 29 5 0 0 0 0 0 24 5. Papawani 34 186 32 0 0 0 0 0 154 6. Bori 37 196 35 0 0 0 0 1 160 7. Khiriya 21 119 19 0 0 0 0 1 99 8. Ganesh Ganj 34 196 32 0 0 0 0 2 162 9. Manikpura 33 191 31 0 0 0 0 1 159 Cluster Village 165 917 154 0 0 0 0 5 758
10 Neemkhera 10 68 10 0 0 0 0 0 58 Control Village 10 68 0 0 0 0 0 0 58
Total 256 1434 242 1 0 1 0 10 1180

560
9.127 In line with information pertaining to income, 82.29 percent of family members are within the average expenditure range of Rs. 1001.00 and above.
9.128 To sum up - To premise of this part of write-up is 256 households which is around 25 percent of
1020 number of households. - Out of the total of 1434 number of persons from 256 households males constitute 51.60
percent while females constitute 48.40 percent. - The percentage of males within the age group of 20 to 60 years representing labour
force is 42.43 while for females it is 45.39 that underlines one fact that in case of technology transfer relating to agriculture more number of persons may be benefited.
- The percentage of dependent population among males is 28.92 and for females 29.68, is within fair limit, which is a positive indicator.
- Against the total of 1434 persons among sample households the percentage literacy is 73.85, far above than the district average of 55.80 percent and the state average of 64.11 percent.
- The percentage of children in the levels of elementary education is 50.77 that vouches for the fair impact of the programme of Universalisation of Elementary Education over our area of study.
- The bulk of 16.74 percent of farming community is constituted by small farmers and farmers having sizeable land holdings.
- The pursuance of secondary and tertiary sector activities, in our area of study, is negligible.
- The involvement of 10 persons for activity relating to livestock as subsidiary occupation is somewhat encouraging.
- There are only 2 persons engaged in secondary sector as subsidiary occupation which is far from being satisfactory.
- The incorporation of 81.03 percent family members within the average monthly income range of Rs. 1001 and above and similar percentage of 82.29 family members within the average monthly expenditure of Rs. 1001.00 and above is the sure indication of the affluence level of the area.
RESULTS OF SURVEY SUBJECTS OF TRAINING RECEIVED– ADOPTED AND CLUSTER VILLAGES 9.129 At the outset it is necessary to clarify the point that there are 246 number of families out of
the total number of 256 families [96.09 percent] who took part in vocational training, front line demonstration and on farm testing which are the three basic mandates of K.V.K. Therefore, the total of responding families from vocational training, front line demonstration and on farm testing will not tally with the figure of 246 as from this basic figure the families participated in three fundamental activities. The entire analysis is based upon family approach as normally one member from each family from adopted and cluster villages where there is direct intervention of K.V.K. takes part in various training programmes. In what follows an attempt has been made to present the item wise details of various initiatives adopted by K.V.K. in the fields of vocational training, front line demonstrations and on farm testing.
VOCATIONAL TRAINING 9.130 The table below shows the details;

561
Table No. 9.47 Subjects of Training Received – Vocational Training.
Subject on Which Training Received S. No.
Name of Village No. of Respon-
dents Crop Prod Agronomy
Horticulture Livestock Dairying Poultry
Fisheries Home Science
Organic Farming
1 2 3 4 5 6 7 8 9 1 Surajpur 20 20 10 0 0 12 5 2 Minnora 24 24 7 3 0 10 5 3 Charpua 37 37 10 0 1 15 9 I Adopted Village 81 81 27 3 1 37 19
4 Sujanpura 6 6 6 0 0 6 6 5 Papawani 33 33 5 0 0 5 5 6 Bori 37 37 7 4 0 12 6 7 Khiriya 21 20 7 1 0 8 3 8 Ganesh Ganj 34 34 12 0 1 11 7 9 Manikpura 34 34 8 0 0 0 2 II Cluster Village 165 164 45 5 1 42 29
Total All Villages 246 245 72 8 2 79 48 9.131 The response of 245 families which is 99.59 percent to 246 responding families seems
obvious as the traditional crops are still in vogue in our area of study followed by home science activities by 79 families [32.11 percent to totalof 246 responding families] that indicates the involvement mainly of women to adopt occupation for augmentation of family income. The participation of 72 and 48 families for subjects like horticulture and organic farming is an encouraging deviation. The involvement of 8 and 2 number of family representatives for occupations like livestock, dairying, poultry and fisheries respectively is quite encouraging as in most of the K.V.Ks. the families have hardly shown any inclination for these activities.
FRONT LINE DEMONSTRATION 9.132 The main objective of the front line demonstration is to demonstrate newly released crop
production and protection technologies and its management practices in the farmer’s fields. However, in front line demonstrations, the interactions regarding home science activities, training of rural youth and all the other items as specified for vocational training are done to educate and support the farmers for augmentation of income. The table below shows the details;
Table No. 9.48 Subjects of Training Received – Front Line Demonstration
Subject on Which Training Received S. No
Name of The Village No. of Respondents Crop Prod
Agronomy Horticulture Live Stock, Dairying
Poultry 1 2 3 4 5 6 1 Surajpur 8 8 0 0 2 Minnora 7 7 0 0 3 Charpua 10 10 0 0 I Adopted Village 25 25 0 0
4 Sujanpura 2 2 0 0 5 Papawani 8 8 0 0 6 Bori 6 6 0 0 7 Khiriya 3 3 0 0 8 Ganesh Ganj 7 7 0 0 9 Manikpura 2 2 0 0 II Cluster Village 28 28 0 0
Total All Villages 53 53 0 0

562
9.133 The above table shows that out of total number of 246 responding families 53 households i.e. 21.54 percent have responded to front line demonstrations for agronomical production only. A total gap in participation in subjects like fisheries, home science, training of rural youth, agro-forestry, organic farming and watershed activities shows that cultivators are basically interested in enhancing their agriculture related productivity with basic understanding that once the income from agriculture is enhanced the other activities allied to agriculture will gradually develop. However, the efforts may be made by the K.V.K. scientists to arrange a few vocational training on livestock activities, agro forestry and watershed activities as these are very relevant occupations for rural economy.
ON FARM TESTING 9.134 In this practice the farmers participate in identifying problems and priorities and managing
experiment and evaluating results. It is, therefore, an adaptive research with farmers perspective. The basic objective of on farm testing is to identify existing inputs or practices that might help to solve major problems of many farmers in a defined study area. The table below shows the details;
Table No. 9.49
Subjects of Training Received – On Farm Testing Subject On Which Training Received S.
No. Name of The Village No. of
Respondents Crop Prod Agronomy
Horticulture
Live Stock Dairying Poultry
1 2 3 4 5 6 1 Surajpur 4 4 0 0 2 Minnora 4 4 0 0 3 Charpua 4 4 0 0 I Adopted Village 12 12 0 0 4 Sujanpura 0 0 0 0 5 Papawani 0 0 0 0 6 Bori 0 0 0 0 7 Khiriya 0 0 0 0 8 Ganesh Ganj 0 0 0 0 9 Manikpura 0 0 0 0 II Cluster Village 0 0 0 0 Total All Villages 12 12 0 0
9.135The above table shows that out of the total of 246 responding families, only 12 households
[4.88%] have responded to the programme that too for agronomy in adopted villages. A large participation is not also expected as only bigger cultivators can afford getting such activity organised on their field. However, a few more O.F.Ts. covering subjects like horticulture, livestock, organic farming should have been organised as the response of these subjects for vocational training is substantial.
9.136 The basic facts as revealed by above narration are that most of the cultivators are
interested in training programmes relating to crop production, horticulture and home science which have direct relevance to their income. Livestock and poultry activities and fisheries are the areas where the villagers have hardly only marginal interest.

563
IMPACT OF K.V.K. 9.137 In the foregoing paragraphs the analysis of subject wise training received was presented. In
what follows an attempt has been made to present the impact of individual items of training in the broad categories of;
- Vocational Training - Front Line Demonstration - On Farm Testing
both before and after training [BT, AT] situations. This is the most important part of the report that clearly indicates the impact of K.V.Ks. intervention on agronomy, horticulture, livestock and dairying, fisheries, home science etc.
VOCATIONAL TRAINING – AGRONOMY - CEREALS 9.138 The table below shows the impact of K.V.K’s. intervention over cereal crops;
Table No. 9.50 Agronomy – Cereals
Yield Per- Hectare - Kg. Wheat Paddy
S. No.
Name of The Village
No. of Respon-
dents
BT No. of Respon-
dents
BT No. of Respon-
dents
BT
1 2 3 4 5 6 7 8 1 Surajpur 15 4300 4580 0 0 0 2 Minnora 17 4135 4353 8 2360 2540 3 Charpua 37 3773 4084 12 3670 4100
I Adopted Village 69 20
4 Sujanpura 6 3617 3883 2 3140 4051 5 Papawani 33 3715 4018 9 2580 2970 6 Bori 37 3622 3962 16 3151 4011 7 Khiriya 20 3345 3660 8 2610 2840 8 Ganesh Ganj 29 4283 4555 0 0 0 9 Manikpura 24 4100 4492 0 0 0
II Cluster Village 149 35
Total All Villages 218 55

564
Table No. 9.50 [Contd…]
Agronomy – Cereals Yield Per- Hectare - Kg.
Maize Jowar S.
No. Name of The Village
No. of Respon-
dents
BT AT No. of Respon-
dents
BT AT
1 2 3 4 5 6 7 8 1 Surajpur 0 0 0 1 1500 0 2 Minnora 0 0 0 0 0 0 3 Charpua 13 9 1144 1389
I Adopted Village 13 1862 2115 10
4 Sujanpura 6 1717 1967 2 900 1300
5 Papawani 9 1833 2100 10 990 1200
6 Bori 12 1667 1975 9 978 1122
7 Khiriya 12 1708 2017 7 957 1143
8 Ganesh Ganj 0 0 0 1 1300 1500 9 Manikpura 0 0 0 1 0 2100
II Cluster Village 39 30
Total All Villages 52 40 9.139 Regarding wheat crop the responding family representatives are 218 which is 88.62 to total
of 246 number of responding families who have shown interest in vocational training regarding wheat crop. The after training [A.T.] scenario is much better than before training situation wherein the per hectare yield ranged between 2883 kg per hectare for village Sujanpura [cluster village] to 4580 kg per hectare for village Surajpur [adopted village] – obviously much higher than the district and State average per hectare yield rates of 2162 and 1867 kg respectively. The above fact clearly indicates the positive effects of vocational training imparted by the K.V.K. over the wheat crop.
9.140 Regarding paddy crop the per-hectare yield in after training situation for every village is
higher than before training situation that ranged between 2840 kg for village Khiriya [cluster village] to 4100 kg for villge Charpua [adopted village] much higher than district and state average figures of 887 kg and 1058 kg respectively.
9.141 Regarding maize, 52 number of families [21.14 percent] have participated in the vocational
training programme with yield rates in A.T. situations ranging between 1967 kg per hectare for village Sujanpura [cluster village] to 2115 kg for village Charpua [adopted village], higher than district average of 1379 kg. and state average productivity of 1342 Kg.
9.142 Regarding Jowar, 40 number of family members have responded to the training programme with yield rates higher in AT situations as compared to BT situations. VOCATIONAL TRAINING – AGRONOMY – PULSES 9.143 The table below shows the details

565
Table No. 9.51 Agronomy – Pulses
Yield Per- Hectare - Kg. Gram Arhar Lentil
S. No
Name of The Village
No. of Respondents
BT AT No. of Respond
ents
BT AT No. of Respondents
BT AT
1 2 3 4 5 6 7 8 9 10 11 1 Surajpur 12 1850 2100 9 1389 1678 7 991 1190 2 Minnora 18 2810 3190 8 1450 1588 9 1400 1570 3 Charpua 11 1670 1960 12 1542 1783 5 1516 1591
I Adopted Village 41 29 21
4 Sujanpura 4 2145 3212 4 1575 1800 0 0 0 5 Papawani 8 1200 1430 8 1588 1788 0 0 0
6 Bori 12 1630 1920 8 1438 1738 0 0 0
7 Khiriya 12 1770 2070 14 1514 1671 0 0 0
8 Ganesh Ganj 23 2512 3141 18 1428 1544 8 1180 1430 9 Manikpura 25 2914 3012 12 1325 1608 4 1158 1970
II Cluster Village 84 64 12
Total All Villages 125 93 33 9.144 In pulses group Gram, Arhar and Lentil are the important crops of Tikamgarh district.
Regarding Gram, against the total of 246 households, 125 households [50.81 percent] have participated in vocational training. The after training performance that resulted in per hectare yield ranging between 1430 kg for village Sujanpura [cluster village] to 3141 kg for village Ganesh Ganj [cluster village] is much higher than district and State average figures of 1473 kg and 932 kg per hectare respectively.
9.145 Regarding Arhar crop, 43 households [37.80 percent] have responded to vocational training
which is reflected in enhanced productivity in after training situations that ranged between 1544 kg per hectare for village Ganesh Ganj [cluster village] to 1800 kg for village Sujanpura [cluster village] far above than district and state average productivity of 582 kg and 825 kg per hectare respectively.
9.146 Regarding Lentil crop, 33 number of households [13.41 percent] have responded to the
vocational training resulting in higher yield per hectare in after training situations as compared to before training conditions that ranged between 1430 kg per hectare for village Ganesh Ganj [cluster village] to 1970 kg per hectare for village Manikpura [cluster village] exceeding the district and state average productivity of 576 kg and 506 kg respectively.
VOCATIONAL TRAINING – AGRONOMY – OIL SEEDS 9.147 The table below shows the details;

566
Table No. 9.52 Agronomy – Oil Seeds
Yield Per- Hectare - Kg. Soyabeen Mustard Linseed
S. No
Name of The Village
No. of Respondents
BT AT No. of Respondents
BT AT No. of Respondents
BT AT
1 2 6 6 6 6 7 8 9 10 11 1 Surajpur 19 1950 2651 10 1440 1500 0 0 0 2 Minnora 20 1189 3121 9 1511 1656 0 0 0 3 Charpua 26 1996 3559 12 1600 1833 0 0 0
I Adopted Village 65 31 0
4 Sujanpura 0 0 0 0 0 0 0 0 0
5 Papawani 15 2450 2810 10 1380 1700 0 0 0
6 Bori 21 1971 2951 10 1470 1660 0 0 0
7 Khiriya 12 2140 2480 9 1133 1311 0 0 0
8 Ganesh Ganj 27 2159 2991 12 1442 1717 4 2159 3001 9 Manikpura 19 2168 3003 12 1433 1708 0 0 0
II Cluster Village 94 53 4
Total All Villages 159 84 4 9.148 Regarding Soybean crop 159 households [64.63 percent to total of 246 responding
families] took part in vocational training programme resulting in the yield rate ranging between 2651 kg for village Surajpur [adopted village] to 3559 kg for village Charpua [adopted village] in after training situation which is higher than district and state average figures of 1462 kg and 1132 kg per hectare respectively.
9.149 Regarding Mustard crop 84 households [31.15 percent] have taken part in vocational
training with yield rates in A.T. situations higher than B.T. situations that ranged between 1311 kg per hectare for village Khiriya [cluster village] to 1833 kg per hectare for village Charpua [adopted village], higher than the district and state average productivities of 567 kg and 1009 kg respectively.
9.150 As regards Linseed crop only 4 number of households [1.63 percent] from village Ganesh
ganj [cluster village] have taken part in vocational training with 3001 kg per hectare production in after training situations, higher than average productivity of 468 kg and 452 kg at district and state levels respectively.
9.151 The participation of households for receiving training on crops like sugarcane and cotton is
nil that clearly indicates the lack of interest of cultivators of Tikamgarh district in pursuing the cultivation of these crops. The impact of vocational training, thus, will not be visible over such crops.
HORTICULTURE 9.152 Horticulture crops are important from the view points of employment generation, checking
of soil erosion and providing high density green cover to the soil. Being tough, many of these crops may be successfully grown on waste land not suitable for traditional crop cultivation. The table below shows the status of horticulture crop production in the sample area of our study;

567
Table No. 9.53 Horticulture Crops
Yield Per- Hectare - Quintal Potato Onion
S. No.
Name of The Village
No. of Respondents
BT AT No. of Respondents
BT AT
1 2 3 4 5 6 7 8 1 Surajpur 10 269 288 6 106 117 2 Minnora 8 254 276 3 119 291 3 Charpua 6 198 232 0 0 0
I Adopted Village 24 9
4 Sujanpura 2 190 205 0 0 0 5 Papawani 2 190 215 0 0 0 6 Bori 5 203 214 0 0 0 7 Khiriya 7 200 210 0 0 0 8 Ganesh Ganj 12 267 287 4 106 115 9 Manikpura 8 224 254 3 115 214
II Cluster Village 36 7
Total All Villages 60 16 Table No. 9.53 [Contd…]
Horticulture Crops Yield Per- Hectare - Quintal
Tomato Brinjal S.
No. Name of The
Village No. of
Respondents BT AT No. of
Respondents BT AT
1 2 9 10 11 12 13 14 1 Surajpur 3 190 230 4 180 310 2 Minnora 4 203 203 0 0 0 3 Charpua 6 198 231 3 211 350
I Adopted Village 13 7
4 Sujanpura 2 205 208 2 301 381 5 Papawani 3 210 225 2 297 299 6 Bori 5 216 228 1 180 200 7 Khiriya 7 196 211 6 129 132 8 Ganesh Ganj 4 200 223 2 216 305 9 Manikpura 3 193 210 1 180 210
II Cluster Village 24 14
Total All Villages 37 21 Table No. 9.53 [Contd…]
Horticulture Crops Yield Per- Hectare - Kg.
Papaya Chilly Bhindi S. No
Name of The Village
No. of Respondents
BT AT No. of Respondents
BT AT No. of Respondents
BT AT
1 2 15 16 17 18 19 20 21 22 23 1 Surajpur 0 0 0 4 148 175 2 130 170 2 Minnora 0 0 0 4 170 193 1 100 100 3 Charpua 3 0 105 1 220 220 1 100 110
I Adopted Village 3 9 4
4 Sujanpura 0 0 0 1 215 210 1 100 108 5 Papawani 0 0 0 1 240 248 2 200 225 6 Bori 0 0 0 1 200 210 1 100 110
7 Khiriya 0 0 0 2 225 248 0 0 0
8 Ganesh Ganj 0 0 0 7 199 226 4 189 286 9 Manikpura 0 0 0 5 168 176 2 150 200
II Cluster Village 0 17 10
Total All Villages 3 26 14

568
9.153 The above table shows that in case of Potato 60 number of families have participated in the vocational training which is 24.39 percent to total of 246 responding families. For every village the per-hectare yield in after training situation is higher than before training conditions that ranged between 205 quintal per hectare for village Sujanpura [cluster village] to 288 quintal per hectare for village Surajpur [adopted village]. These yield rates are much higher than the State average figure of 119 quintal per hectare. The positive impact of the efforts of the K.V.K., is, thus, obvious.
9.154 Regarding Onion, 16 number of households [6.50 percent] have responded to the vocational
training, resulting in enhanced per-hectare yield in after training situations as compared to before training conditions that ranged between 115 quintal per-hectare for village Ganesh Ganj [cluster village] to 291 quintal per hectare for village Minnora [adopted village] which are much higher than State average figure of 140 quintal per hectare.
9.155 Tomato is yet another crop which is gradually picking-up at Tikamgarh as 37 families have
participated in the vocational training constituting 15.04 percent to total of 246 responding families. The yield rates in after training conditions ranged between 203 quintal per hectare for village Minnora [adopted village] to 231 quintal per-hectare for village Charpua [adopted village].
9.156 Brinjal too is a crop getting popular at Tikamgarh as 21 number of families [8.54 percent]
have shown interest in training programme, the positive effects of which have been reflected in the form of enhanced per-hectare yield in after training situations as compared to before training conditions that ranged between 210 quintal per-hectare for village Manikpura [cluster village] to 381 quintal per-hectare for village Sujanpura [cluster village].
9.157 For Chilly crop, 26 families have taken part in vocational training with yield rates that
ranged between 175 quintal per hectare is village Surajpur [adopted village] to 248 quintal per hectare in village Khiriya [cluster village] in after training situation.
9.158 Similarly for Bhindi crop, 14 number of families [5.69 percent] have taken part in
vocational training programme resulting in enhanced productivity in after training situations as compared to before training status that ranged between 100 quintal per-hectare for village Minnora [adopted village] to 286 quintal per-hectare for village Ganesh Ganj [cluster village].
9.159 As regards Papaya, only 3 household from village Charpua [adopted village] has taken part
in the vocational training programme resulting in output of 105 quintal per hectare in after training conditions.
9.160 For crops like Cucerbits, Spices, Mango, Banana and Citrus, no vocational training
programmes have been organised as the cultivators were not interested in producing such crops.
VOCATIONAL TRAINING – LIVESTOCK AND DAIRY 9.161 Though these functions are important from the view points of both income augmentation
and diversification of agriculture for reducing pressure on land in rural areas but in general such functions are not taken-up on viable scale with proper organizational skill as is evident from the information contained in the following table;

569
Table No. 9.54 Live Stock and Dairying
Improved Breed (No.) Milk production (Liters)
S. No.
Name of The Village
No. of Respondents
BT AT No. of Respondents
BT AT
1 2 3 4 5 6 7 8 1 Surajpur 0 0 0 0 0 0 2 Minnora 1 0 5 3 13 12 3 Charpua 0 0 0 0 0 0
I Adopted Village 1 0 5 3 13 12
4 Sujanpura 0 0 0 0 0 0 5 Papawani 0 0 0 0 0 0 6 Bori 2 0 6 2 9 16 7 Khiriya 1 0 4 1 10 15 8 Ganesh Ganj 0 0 0 0 0 0 9 Manikpura 0 0 0 0 0 0
II Cluster Village 3 0 10 3 19 31
Total All Villages 4 0 15 6 32 43
Table No. 9.54 [Contd…] Live Stock and Dairying
Artificial Insemination
(No. of animals) Improved Feeding
Management Vaccination
(No. of animals)
S. No
Name of The Village
No. of Respondents
BT AT No. of Respondents
BT AT No. of Respondents
BT AT
1 2 3 4 5 6 7 8 9 10 11 1 Surajpur 0 0 0 0 0 0 0 0 0 2 Minnora 1 8 0 3 2 1 0 0 0 3 Charpua 0 0 0 0 0 0 0 0 0
I Adopted Village 1 8 0 3 2 1 0 0 0
4 Sujanpura 0 0 0 0 0 0 0 0 0
5 Papawani 0 0 0 0 0 0 0 0 0
6 Bori 2 0 6 2 2 0 0 0 0 7 Khiriya 0 0 0 1 4 0 1 1 4 8 Ganesh Ganj 0 0 0 0 0 0 0 0 0 9 Manikpura 0 0 0 0 0 0 0 0 0
II Cluster Village 2 0 6 3 6 0 1 1 4
Total All Villages 3 8 6 6 8 1 1 1 4
9.162 The performance in this field is on the low key as only 4,6,3,6, and 1 number of households have taken part in vocational training regarding improved breeding practices, milk production, artificial insemination, improved feeding management and vaccination respectively with not much physical results. However, the picture that emerges is encouraging as in other five K.V.Ks. the vocational training regarding livestock and dairying is either entirely missing or performed very marginally.
VOCATIONAL TRAINING – POULTRY 9.163 Poultry is yet another activity which is relevant to rural economy for augmentation of family
income. The table below shows the details;

570
Table No. 9.55 Poultry Activities - Broiler Production
Broiler Production S. No Name of The Village No. of Respondents Yes No
1 2 3 4 5 1 Surajpur 0 0 0 2 Minnora 0 0 0 3 Charpua 0 0 0 I Adopted Village 0 0 0 4 Sujanpura 0 0 0 5 Papawani 0 0 0 6 Bori 0 0 0 7 Khiriya 0 0 0 8 Ganesh Ganj 1 0 1 9 Manikpura 0 0 0 II Cluster Village 1 0 1
Total All Villages 1 0 1 9.164 For broiler production, only one number of household from village Ganesh ganj [cluster
village] has taken part in vocational training without any tangible result in after training situation.
VOCATIONAL TRAINING – HOME SCIENCE 9.165 Vocational training in Home Science activities like toy making, preparation of pickles and
jute items, preparation of papad/bari/jam/jelly etc. are important from both income support and employment generation point of views engaging women and old people in rural areas. The table below shows the details;
Table No. 9.56
Home Science Activities Toy making Pickle, Kg. Papad/Badi/Jam/Jelly,
Kg. S. No
Name of The Village
No. of Respondents
BT AT No. of Respond
ents
BT AT No. of Responde
nts
BT AT
1 2 3 4 5 6 7 8 9 10 11 1 Surajpur 0 0 0 12 26 91 8 1 16 2 Minnora 0 0 0 8 16 52 5 1 9 3 Charpua 0 0 0 13 15 53 13 3 54
I Adopted Village 0 0 0 33 57 196 26 5 79
4 Sujanpura 0 0 0 6 7 28 6 3 17
5 Papawani 0 0 0 5 3 22 5 5 21
6 Bori 0 0 0 10 11 45 10 2 30
7 Khiriya 0 0 0 7 3 28 6 3 19 8 Ganesh Ganj 3 0 10 11 65 41 11 7 28 9 Manikpura 0 0 0 0 0 0 0 0 0
II Cluster Village 3 0 10 39 89 164 38 20 115
Total All Villages 3 0 10 72 146 360 64 25 194 9.166 Preparation of Pickles is an item getting popular in rural areas as 72 number of family
representatives have taken part in the vocational training constituting 29.27 percent of total of 246 responding families with production of 360 kgs of pickle in after training situation as compared to 146 kgs of pickle in before training conditions. The impact of K.V.Ks. effort is clearly visible.

571
9.167 Regarding Toy making which is not very popular in our sample area of study, only 3 number of households from village Ganesh Ganj [cluster village] have taken part in vocational training with making of only 10 toys in after training conditions.
9.168 Regarding preparation of paper/badi/jam/jelly etc., which is becoming popular activity
in our area of study mainly due to portability of the product, 64 household [26.02 percent] have taken part in vocational training organised by the K.V.K. with production of 194 kg in after training situation as compared to 25 Kg. production in before training conditions that underlines the positive impact of the K.V.Ks. efforts.
VOCATIONAL TRAINING – TRAINING OF RURAL YOUTH 9.169 Training of rural youth, though do not have any direct relevance to transfer of agriculture
related technology, but has immense impact on employment generation. The table below shows the details;
Table No. 9.57
Training of Rural Youth Motor binding Engine repair S.
No Name of The Village
No. of Respondents
BT AT No. of Respondents
BT AT
1 2 3 4 5 6 7 8 1 Surajpur 1 0 1 0 0 0 2 Minnora 0 0 0 0 0 0 3 Charpua 0 0 0 0 0 0
I Adopted Village 1 0 1 0 0 0
4 Sujanpura 0 0 0 0 0 0 5 Papawani 0 0 0 0 0 0 6 Bori 0 0 0 0 0 0 7 Khiriya 1 0 2 1 1 0 8 Ganesh Ganj 0 0 0 0 0 0 9 Manikpura 0 0 0 0 0 0
II Cluster Village 1 0 2 1 1 0
Total All Villages 2 0 3 1 1 0
9.170 Regarding motor binding activity two family members from village Surajpur [adopted village] and village Khiriya [cluster village] have taken part in the training with placement.
9.171 Similarly for tractor, diesel engine repair only one number of family member from village
Khiriya [cluster village] has undergone the training and got placement. VOCATIONAL TRAINING – ORGANIC FARMING 9.172 The table below shows the details;

572
Table No. 9.58 Organic Farming
Bio-Pesticide, Kg. S. No. Name of The Village No. of Respondents BT AT
1 2 6 7 8 1 Surajpur 4 10 130 2 Minnora 3 0 60 3 Charpua 8 1 11
I Adopted Village 15 11 201
4 Sujanpura 0 0 0 5 Papawani 4 0 7 6 Bori 4 0 6 7 Khiriya 2 0 6 8 Ganesh Ganj 0 0 0 9 Manikpura 0 0 0
II Cluster Village 10 0 19
Total All Villages 25 11 220
9.173 The practice of organic farming is gradually picking up in our area of study as 25 number of households have participated in the training programme relating to Bio-pesticide with production of 220 liters of bio-pesticide in after training situation as compared to 11 liters in before training conditions.
9.174 No vocational training has been organised on subjects like fishery development, agro
forestry and watershed activities which are important functions from the view point of income augmentation in rural areas. The impact of vocational training over such activities will not visible.
9.175 In the following paragraphs an attempt has been made to sum-up the efforts of vocational
training imparted by the K.V.K. - Regarding the yield per hectare both for agronomical and horticutlral crops, the after
training situation is better than before training conditions that clearly shows the positive impact of vocational training imparted by the K.V.K.
- Regarding wheat crop 88.62 percent households to total of 246 responding families have taken part in vocational training with per-hectare yield higher than the district and state leel average productivity.
- Similarly for paddy crop the productivity is much higher than the average productivity levels prevailing in district and in state.
- Regarding maize crop 21.14 percent households have taken part in vocational training with yield rates in after training situations higher than average productivity both at district and state levels.
- Regarding gram crop 50.81 percent households to total of 246 responding households have taken part in vocational training with yield rates much higher than average productivity at district and state levels in after training situation.
- Similarly for arhar and lentil crops 37.80 percent and 13.41 percent households respectively have taken part in vocational training with yield rates exceeding as compared to average productivity both at district and state levels in after training conditions.
- As regards soybean, 64.63 percent households have taken part in vocational training with yield rates much higher in after training situations as compared to average productivity both at district and state levels.
- Similarly for mustard and linseed crops the yield per-hectare in after training ituation is higher than the average productivity both at district and state levels.
- Regarding horticulture crops, the vocational trainings have been organised for crops like potato, onion, tomato, brinjal, chilly, bhindi and papaya with rate of participation

573
of 24.39 percent, 6.50 percent, 15.04 percent, 8.54 percent, 10.60 percent, 5.69 percent and 1.22 percent respectively with yield rates higher in A.T. situations as compared to B.T. conditions. This is no doubt a very bright picture indicating the desire of farming community to deviate from producing traditional crops.
- In case of livestock, dairy and poultry though the response is marginal, but, somehow, the picture is encouraging.
- Response to home science activities is quite encouraging particularly for items like preparation of pickles and papad/bari/jam/jelly etc.
- The response to training of rural youth is only marginal but for organic farming which is encouraging.
- No vocational trainings have been organised for subjects like fishery, agro-forestry and watershed activities which are important functions from the view points of income augmentation in rural areas.
FRONT LINE DEMONSTRATION – AGRONOMY CEREALS 9.176 Front line demonstrations [FLD] are organized on farmer’s field with the result the response
is bound to be low as compared to vocational training. The table below shows the impact of front line demonstrations on cereal crops.
Table No. 9.59
Agronomy – Cereals Wheat Paddy Maize S.
No Name of The Village
No. of Responde
nts
BT AT No. of Respond
ents
BT AT No. of Responde
nts
BT AT
1 2 3 4 5 6 7 8 9 10 11 1 Surajpur 3 4267 4800 0 0 0 0 0 0 2 Minnora 2 4050 4700 0 0 0 0 0 0 3 Charpua 8 3913 4200 2 2140 2598 0 0 0
I Adopted Village 13 2 0
4 Sujanpura 1 3500 4000 0 0 0 0 0 0
5 Papawani 5 3680 4200 1 3000 3400 0 0 0
6 Bori 3 3667 4133 0 0 0 2 1700 2000
7 Khiriya 2 3700 4005 0 0 0 0 0 0 8 Ganesh Ganj 2 4200 4850 0 0 0 0 0 0 9 Manikpura 0 0 0 0 0 0 0 0 0
II Cluster Village 13 1 2
Total All Villages 26 3 2 9.177 The front line demonstrations for the wheat crop have been organized on the fields of 26
cultivators which is 10.57 percent to total of 246 responding families. The per hectare yield in after training situation is much higher than before training conditions that ranged between 4000 kg. per hectare for the village Sujanpura [cluster village] to 4850.00 kg per hectare for village Ganesh Ganj [cluster village] far in excess of district average of 2162 kg and state average of 1867 kg. The positive impact of the efforts of K.V.K. is clearly visible.
9.178 Regarding paddy crop only 3 F.L.D. have been organised that ranged between 2140 kg. for
village Charpua [adopted village] to 3000 kg per hectare for village Papawani [cluster village] in after training situation which is much higher than district and state average productivities of 887 kg and 1058 kg respectively.
9.179 Regarding Maize crop only 2 demonstration has been organised in village Bori [cluster
village] with per hectare yield of 2000 kg in after training situation which is not only higher than the productivity in before training situation but in excess of district average

574
productivity of 1226 kg and less than state average 2072 kg per hectare. However matching to vocational training, a few more F.L.Ds. should have been organised.
9.180 No F.L.Ds. have been organised for crop like Jowar which is usually grown by poor
cultivators. AGRONOMY - PULSES 9.181 The table below shows the details;
Table No. 9.60
Agronomy – Pulses Gram Arhar Lentil S.
No Name of The Village
No. of Respondents
BT AT No. of Respond
ents
BT AT No. of Responde
nts
BT AT
1 2 3 4 5 6 7 8 9 10 11 1 Surajpur 1 1400 1900 1 1400 1700 0 0 0 2 Minnora 1 1900 2000 1 1700 1800 1 1300 1900 3 Charpua 1 1400 1600 1 1400 1600 0 0 0
I Adopted Village 3 3 1
4 Sujanpura 0 0 0 1 1400 1600 0 0 0 5 Papawani 0 0 0 0 0 0 0 0 0
6 Bori 0 0 0 0 0 0 0 0 0
7 Khiriya 0 0 0 0 0 0 0 0 0 8 Ganesh Ganj 2 3200 3900 1 1400 1800 0 0 0 9 Manikpura 1 1700 2000 0 0 0 0 0 0
II Cluster Village 3 2 0
Total All Villages 6 5 1
9.182 Gram being one of the important crops of Tikamgarh district, 6 number of front line demonstration [F.L.Ds.] have been organised which is 2.44 percent to total of 246 responding families with better performance in after training situation as compared to before training conditions. The per hectare yield in after training situation ranged between 1600 Kg for Charpua [adopted village] to 3900 kg for Ganesh Ganj [cluster village] which are higher than the district average productivity figure of 1473 kg and state level figure of 932 kg.
9.183 Regarding Arhar crop only 5 number of F.L.Ds. have been organised resulting in crop
productivity which is higher in after training situation as compared to before training conditions and far in excess of average district and state level productivity per hectare accounting for 582 kg and 825 kg respectively.
9.184 Regarding Lentil crop only one number of F.L.D. has been organised for village Minora
with per hectare yield of 1900 kg in after training situation which is higher than the district and state average productivity of 576 kg and 506 kg respectively.
FLD – AGRONOMY – OIL SEEDS 9.185 The table below shows the details;

575
Table No. 9.61 Agronomy – Oil Seeds
Yield Per- Hectare - Kg. Soybean Mustard
S. No.
Name of The Village
No. of Respondents
BT AT No. of Respondents
BT AT
1 2 3 4 5 6 7 8 1 Surajpur 1 1700 2300 2 1650 2150 2 Minnora 1 2000 2100 1 1600 1805 3 Charpua 2 2151 3001 1 1700 1800 I Adopted Village 4 4 4 Sujanpura 0 0 0 0 0 0
5 Papawani 1 1900 2300 1 1600 1900
6 Bori 1 2100 2300 1 1900 2200
7 Khiriya 1 1800 2400 0 0 0 8 Ganesh Ganj 2 2589 3145 0 0 0 9 Manikpura 1 2000 2300 0 0 0 II Cluster Village 6 2 Total All Villages 10 6
9.186 Soybean being one of the important crops of district Tikamgarh 10 number of F.L.Ds. have
been organised which 4.07 percent to total of 246 responding families. The yield per hectare in after training situation is much higher than before training conditions that ranged between 2100 kg per hectare for village Minnora [adopted village] to 3145 kg per hectare for village Ganeshganj [cluster village] higher than both district and state average productivity of 1462 kg and 1132 kg respectively.
9.187 Regarding Mustard 6 number of F.L.Ds. have been organised [2.44 percent] with the yield
rates higher in AT situations that ranged between 1800 kg per hectare for village Charpua [adopted village] to 2200 kg per hectare for village Bori [cluster village] which are higher than district and state average productivities of 567 kg and 1009 kg respectively.
9.188 No FLDs have been organized for crops like Jowar, cotton, sugarcane and linseed with the
result the impact of F.L.Ds. over these crops will not be visible. FLD – HORTICULTURE 9.189 No F.L.Ds. have been organised for any of the crops regarding horticulture which is a
definite gap that indicates that no technology has been transferred to such crops despite good response of vocational training.
9.190 Regarding subjects like Horticulture, livestock and dairying, poultry, fisheries
development, home science, training of rural youth, agro-forestry, organic farming and watershed activities no F.L.Ds. have been organised. All the above mentioned activities are important for any rural economy. Particularly the subjects like livestock, agro forestry and watershed activities are important from the view points of income augmentation and enhancement of agriculture production. F.L.Ds, therefore, should have been organised for such activities.
9.191 To sum-up - Front Line Demonstrations organised in our area of study has lead to enhancement in
productivity of most of agronomical and horticultural crops in after training situations as compared to before training conditions which show the positive impact of K.V.Ks. efforts.

576
- In case of wheat 26 number of F.L.Ds. have been organised which is 10.57 percent to total of 246 responding families with yield per hectare far in excess of average productivity of district and state levels.
- Similarly for paddy and maize crops 3 and 2 F.L.Ds. respectively have been organised with higher yield rates as compared to district and state level averages.
- Gram being one of the important crops of Tikamgarh district 6 number of F.L.Ds. have been organised which is 2.44 percent to total of 246 number of responding families with higher productivity as compared to prevailing rates at both district and state levels.
- Similarly for Arhar crop 5 number of F.L.Ds. have been organised [2.03 percent] with per hectare yield far in excess of average district and state level productivity.
- Regarding Lentil crop 6 number of F.L.Ds. have been organised with yield per hectare higher than the average productivity prevailing at district and state levels.
- Regarding soybean and mustard 10 and 6 number of F.L.Ds. respectively have been organised with yield per hectare higher than the average productivity prevailing both at district and state levels.
- Since no F.L.Ds. have been organised on subjects like horticulture, livestock and dairying, fisheries development, home science, training of rural youth, agro forestry, organic farming and watershed activities the impact of F.L.D. for these subjects will not be visible.
ON FARM TESTING [OFT] - CEREALS 9.192 In case of On Farm Testing, recommended new technologies are tested on farmer’s fields
leading to the solution of group of farming problems. The extent of response is bound to be low as the new technologies are always limited in numbers.
9.193 The table below shows the details;
Table No. 9.62 Cereal Crops
Yield Per- Hectare - Kg. Wheat
S. No.
Name of The Village
No. of Respondents BT AT 1 Surajpur 1 4200 4800 2 Minnora 0 0 0 3 Charpua 3 3933 4233
I Adopted Village 4
4 Sujanpura 0 0 0 5 Papawani 0 0 0 6 Bori 0 0 0 7 Khiriya 0 0 0 8 Ganesh Ganj 0 0 0 9 Manikpura 0 0 0
II Cluster Village 0
Total All Villages 4
9.194 In case of Wheat, 4 number of on farm testing activities [1.63 percent] have been organised with substantial yield per hectare in after training situation that ranged between 4233 kg per hectare for village Charpua to 4800 kg per-hectare for village Surajpur which are much higher than the district average per hectare productivity of 2162 kg and state average figure of 1867 kg. All the O.F.Ts. have been organised at adopted villges leaving completely the cluster villages, which undoubtedly is a gap in performance.
9.195 In non other cereal crops like Maize, Paddy and Jowar the O.F.Ts. have been organised.

577
ON FARM TESTING – PULSES CROP 9.196 The table below shows the details;
Table No. 9.63
Pulses Crop Gram Arhar Lentil S.
No Name of The
Village No. of Respondents
BT AT No. of Respondents
BT AT No. of Respondents
BT AT
1 2 3 4 5 6 7 8 9 10 11 1 Surajpur 1 1400 2000 0 0 0 0 0 0 2 Minnora 1 1900 2000 1 1700 1800 1 1300 1900 3 Charpua 0 0 0 0 0 0 0 0 0
I Adopted Village 2 1 1
4 Sujanpura 0 0 0 0 0 0 0 0 0 5 Papawani 0 0 0 0 0 0 0 0 0
6 Bori 0 0 0 0 0 0 0 0 0
7 Khiriya 0 0 0 0 0 0 0 0 0 8 Ganesh Ganj 0 0 0 0 0 0 0 0 0 9 Manikpura 0 0 0 0 0 0 0 0 0
II Cluster Village 0 0 0
Total All Villages 2 1 1 9.197 Gram through one of the important crops of Tikamgarh district but only 2 O.F.Ts. have been
organised [all in adopted villages] with productivity of 2000 kg per hectare for both Surajpur and Minnora villages in after training situations which are higher than before training conditions and in excess of district average productivity of 1473 kg per hectare and state average productivity of 932 kg per hectare.
9.198 Similarly, for Arhar and Lentil crops one number each of O.F.Ts. have been organised in
villages Minnora [adopted village] with yields per hectare in after training situations which are far in excess of district level and state level per hectare yields of 501 and 576 kg and 825 kg, 506 kg respectively.
ON FARM TESTING – OIL SEED CROP 9.199 The table below shows the details;
Table No. 9.64 Oil Seed Crop
Yield Per- Hectare - Kg. Soybean Mustard
S. No.
Name of The Village
No. of Respondents
BT AT No. of Respondents
BT AT
1 2 3 4 5 6 7 8 1 Surajpur 1 1800 2500 1 1500 1900 2 Minnora 1 2000 2400 0 0 0 3 Charpua 1 1800 2400 0 0 0 I Adopted Village 3 1
4 Sujanpura 0 0 0 0 0 0
5 Papawani 0 0 0 0 0 0
6 Bori 0 0 0 0 0 0 7 Khiriya 0 0 0 0 0 0 8 Ganesh Ganj 0 0 0 0 0 0 9 Manikpura 0 0 0 0 0 0 II Cluster Village 0 0 Total All Villages 3 1

578
9.200 Soybean and Mustard being important crops of Tikamgarh district only 3 number and 1 number of O.F.Ts. have been organised with much higher yield rates in after training situations as compared to district and state level per hectare yields.
9.201 No O.F.Ts. have been organised for crops like paddy, maize, jowar, cotton, sugarcane and
linseed. 9.202 Surprisingly, no O.F.T. has been organised for any of the horticulture crops which
obviously is a gap in performance. The O.F.Ts. should have been organised for crops like Potato, Onion, Tomato and Brinjal for which there is good response in vocational training courses. Besides, horticultural crops are good source of income which are gradually becoming popular in Tikamgarh district. The measures of O.F.Ts. would have boosted-up the productivity levels of such crops along with enhancement in family income.
9.203 No. O.F.Ts. have been organised for subjects like horticulture, livestock and dairying,
poultry, fishery development, home science, training of rural youth, agro-forestry, organic farming and watershed activities. A few O.F.Ts. should have been organised for livestock and dairying, agro forestry and watershed activities which have scope in our sample area of study.
9.204 In the following paragraphs summing-up efforts have been made for the results of
O.F.T. - In case of O.F.T., the yield per-hectare in after training situation is more than before
training conditions as has occurred for both vocational training and front line demonstrations which shows the positive impact of K.V.Ks. efforts.
- No O.F.T. has been organised for any of the horticulture crops which certainly shows the deficiency in performance. A few O.F.Ts. must have been organised for horticulture crops like potato, onion and and tomato etc. which are common items of consumption.
- Since no O.F.Ts. have been organised on subjects like livestock and da irying, poultry, fishery development, home science, training of rural youth, agro-forestry, organic farming and watershed activities, the impact of O.F.T. relating to such subjects is obviously not visible.
STATUS OF ACTIVITIES IN CONTROL VILLAGE – NEEMKHERA 9.205 The study has identified one control village i.e. Neemkhera with 10 number of sample
households and 68 sample family members where there is no interventions of K.V.K. The information regarding common items of agronomical and horticulture crops have been collected to show the comparative status in areas of intervention and non- intervention. However, in case of control village before and after training situations have not been shown as there is no effort of K.V.K. in this village. For comparison the average performance of vocational training in after training situation has been taken as the participation regarding all subjects is maximum in case of vocational training. The table below shows the comparative status of control village on one side and adopted and cluster villages on other side.

579
Table No. 9.65 Comparative Status of Performance Among Control Village and Adopted and Cluster Villages
Sl. No.
Item Control Village Adopted and cluster villages (average)
Difference [+ or -] over col. 3
1 2 3 4 5 PER HECTARE YIELD – KG
CEREALS 1 Wheat 4060.00 4176.33 (+) 116.33 2 Paddy 3240.00 3418.67 (+) 178.67 3 Maize 2028.00 2034.80 (+) 6.80 4 Jowar - 1393.43 - PULSES 5 Gram 1800.00 2448.33 (+) 648.33 6 Arhar 1629.00 1688.67 (+) 59.67 7 Lentil 1500.00 1550.20 (+) 50.20 OIL SEEDS 2945.75 (+) 975.75 8 Soybean 1970.00 2945.75 (+) 975.75 9 Mustard 1606.00 1635.63 (+) 29.63 10 Linseed 3000.00 3001.00 (+) 1.00
HORTICULTURE CROPS – QUINTAL 11 Potato 240.00 242.33 (+) 2.33 12 Onion 179.00 184.25 (+) 5.25 13 Tomato 210.00 218.78 (+) 8.78 14 Brinjal 200.00 273.38 (+) 73.38 15 Chilly 210.00 212.22 (+) 76.63 16 Bhindi 87.00 163.63 (+) 114.60 17 Papaya - 105.00 -
9.206 Except for the crops like Gram, Soybean, Wheat and Paddy where there is substantial gap in
per hectare yield between adopted and cluster villages and control village in rest of the crops the diference is only marginal that shows the overall situation of agriculture is good in district Tikamgarh.
9.207 In the field of home science activities particularly for activities like preparation of
pickles and papad/badi/jam/jelly etc. substantial work has been done in adopted and cluster villages through the intervention of K.V.K. whereas such activities are very marginal in control village. These activities are important both form income augmentation and employment point of views.
RESULTS OF SURVEY – INDIVIDUAL PARTICULARS ADOPTED AND CLUSTER VILLAGES 9.208 In the following paragraphs an attempt has been made to highlight the various reactions of
25 percent of individuals taken from the sample family members. The table below shows the details;
Table No. 9.66 Basic Details
Sl. No.
Item Total number of family members of 25% of households
25 % of individuals taken from 25% of households
1 2 3 4 1 Adopted Villages 449 109 2 Cluster Villages 917 231 3 Control Village 68 16 Total 1434 356

580
9.209 Though the 25 percent of 1434 comes to 358 but we have taken figures of 356 because of certain demographic particulars. However, a few figures plus or minus is hardly meaningful so long it does not vitiate the survey results.
9.210 In the following paragraphs an attempt has been made to highlight the individual reactions
in adopted and cluster villages i.e. for 340 individuals. 9.211 The criteria for selection of individuals are as follows; - The individual should be the adult member of the family. - He should be associated with any programme of K.V.K. For individuals of control village,
this criterion is not applicable. - He/She should be literate, may be without having any formal education. SOCIAL CLASSIFICATION OF INDIVIDUALS 9.212 The table below shows the details;
Table No. 9.67
Social Classification Social classification S.
No. Name of the Village No. of
Individual S.T. S.C. O.B.C. GENERAL 1 2 3 4 5 6 7 1. Surajpur 28 3 3 22 0 2. Minnora 57 2 19 26 10 3. Charpua 24 0 7 8 9 Adopted Village 109 5 29 56 19
4. Sujanpura 7 0 7 0 0 5. Papawani 47 2 22 16 7 6. Bori 49 0 3 39 7 7. Khiriya 30 0 9 8 13 8. Ganesh Ganj 48 0 20 17 11 9. Manikpura 50 1 5 38 6 Cluster Village 231 3 66 118 44
Total 340 8 95 174 63 9.213 The above table shows that the majority of 269 individuals are from S.C. and O.B.C.
communities that accounts for 79.12 percent to total of 340 individuals from adopted and cluster villages. The combined percentage of S.T. and General communities is 20.88. Thus the entire area of adopted and cluster villages is predominated by S.C. and O.B.C. population that throws a challenge to K.V.K. Scientists to achieve tangible results for bringing these vulnerable communities to main streatm of development.
INDIVIDUALS CLASSIFIED ON THE BASIS OF RELIGION 9.214 The following table gives the details;

581
Table No. 9.68 Classification on the Basis of Religion
Religion S. No.
Name of the Village No. of Individual Hindu Muslim Sikh Christian Nauabudh Others
1 2 3 4 5 6 7 8 9 1. Surajpur 28 28 0 0 0 0 0 2. Minnora 57 57 0 0 0 0 0 3. Charpua 24 24 0 0 0 0 0 Adopted Village 109 109 0 0 0 0 0
4. Sujanpura 7 7 0 0 0 0 0 5. Papawani 47 47 0 0 0 0 0 6. Bori 49 49 0 0 0 0 0 7. Khiriya 30 30 0 0 0 0 0 8. Ganesh Ganj 48 48 0 0 0 0 0 9. Manikpura 50 50 0 0 0 0 0 Cluster Village 231 231 0 0 0 0 0 Total 340 340 0 0 0 0 0
9.215 The above table shows that cent-percent individuals are the followers of Hindu religion. AWARENESS ABOUT THE K.V.K. 9.216 The table below shows the details;
Table No. 9.69 Awareness About the K.V.K.
Awareness about existence
of K.V.K.
If 'yes' knowledge about its location
Awareness about services rendered by the
K.V.K.
S. No
Name of the Village No. of Individual
Yes No
Yes
No
Yes
No
1 2 3 4 5 6 7 8 9 1. Surajpur 28 28 0 28 0 28 0 2. Minnora 57 57 0 57 0 57 0 3. Charpua 24 24 0 24 0 24 0 Adopted Village 109 109 0 109 0 109 0
4. Sujanpura 7 7 0 7 0 7 0 5. Papawani 47 47 0 47 0 47 0 6. Bori 49 48 1 49 0 49 0 7. Khiriya 30 30 0 30 0 30 0 8. Ganesh Ganj 48 48 0 48 0 48 0 9. Manikpura 50 50 0 50 0 50 0 Cluster Village 231 230 1 231 0 231 0
Total 340 339 1 340 0 340 0
9.217 The cent percent awareness about K.V.K. in terms of its location and more importantly the services rendered by it is undoubtedly an encouraging indiction that indicats the fruitful efforts of K.V.K. scientists in their stride to populerise the functions of K.V.K.

582
KNOWLEDGE ABOUT SPECIFIC SERVICES RENDERED BY K.V.K. 9.218 The table below shows the details;
Table No. 9.70 Knowledge about Specific Services Rendered by the K.V.K.
Knowledge about
vocational training
Knowledge about front line demonstration
Knowledge about on farm
testing
S. No
Name of the Village No. of Individual
Yes No Yes No Yes No 1 2 3 4 5 6 7 8 9 1. Surajpur 28 28 0 28 0 28 0 2. Minnora 57 57 0 57 0 57 0 3. Charpua 24 24 0 24 0 24 0 Adopted Village 109 109 0 109 0 109 0
4. Sujanpura 7 7 0 7 0 7 0 5. Papawani 47 47 0 45 2 47 0 6. Bori 49 49 0 49 0 49 0 7. Khiriya 30 30 0 29 1 30 0 8. Ganesh Ganj 48 48 0 48 0 48 0 9. Manikpura 50 50 0 48 2 50 0 Cluster Village 231 231 0 226 5 231 0
Total 340 340 0 335 5 340 0
9.219 Regarding Vocational Training the cent percent awareness of the individuals from adopted
and cluster villages seems obvious as participation of households in such training programmes is maximum.
9.220 Knowledge of 335 individuals [98.53 percent] about F.L.D. is encouraging that shows
impact of the positive efforts of K.V.K. Scientists. 9.221 Similarly cent percent awareness about O.F.T. is, somewhat, encouraging. FIELD VISITS OF K.V.K. SCIENTISTS 9.222 Regular field visits by the K.V.K. scientists are necessary pre-requisites for implematation
of agriculture related technology and also to keep alive the confidence level of the farming community. The table below shows the extent of such visits.

583
Table No. 9.71 Field Visits of K.V.K. Scientists
The duration gap S. No
Name of the Village No. of Individual One month
Two
months More than
two months Never
1 2 3 4 5 6 7 1. Surajpur 28 0 0 0 28 2. Minnora 57 2 0 0 55 3. Charpua 24 0 0 0 24 Adopted Village 109 2 0 0 107
4. Sujanpura 7 0 0 0 7 5. Papoura (Mondu Bhak) 47 5 0 0 42 6. Bori 49 1 0 0 48 7. Khiriya 30 2 1 0 27 8. Ganesh Ganj 48 3 0 0 45 9. Manikpura 50 4 2 0 44 Cluster Village 231 15 3 0 213
Total 340 17 3 0 320
9.223 Out of total of 340 individuals, cent percent persons have informed about irregular visits of
K.V.K. scientists which seems rather an inflated information, which is contradicted by the fact of cent-percent awareness level of the farmers about services rendered by the K.V.K. The high degree of absence of K.V.K. scientists would have not lead to such type of positive results. May be the individuals might have vented out their regrets caused due to some other factors by informing about irregular visits by K.V.K. scientists. Even if half the information is taken to be correct, the picture remains to be grim. At least a fortnightly visit by K.V.K. scientists is necessary to keep-up the confidence level of the farmers. The authorities of K.V.K., Tikamgarh may sort out this issue to avoid such regrets from farming communities for whom they work.
THE STATUS OF REGULAR CONTACT WITH K.V.K. 9.224 The regular contact of the farmes with the K.V.K. is one of the determining factors for
implementation of agriculture related technologies in the field. The table below shows the details;
Table No. 9.72 Status of Regular Contact with K.V.K.
Are you regular touch with KVK
If yes reason if 'no' the reason S. No
Name of the Village
No. of Indivi-dual Yes
No
For
seed
Plant protection
New technology
Distance
Do not feel the
necessity 1 2 3 4 5 6 7 8 9 10
1. Surajpur 28 26 2 2 2 24 2 0 2. Minnora 57 55 2 0 2 55 2 0 3. Charpua 24 24 0 0 0 24 0 0 Adopted Village 109 105 4 2 4 103 4
4. Sujanpura 7 7 0 0 0 7 0 0 5. Papawani 47 42 5 2 3 42 3 4 6. Bori 49 48 1 1 0 29 0 0 7. Khiriya 30 28 2 0 2 28 2 0 8. Ganesh Ganj 48 45 3 2 1 45 1 0 9. Manikpura 50 46 4 2 4 44 5 0 Cluster Village 231 216 15 7 10 195 11 4
Total 340 321 19 9 14 298 15 4

584
9.225 Out of total of 340 individuals, 321 individuals [94.41 percent] are in regular contact with K.V.K. mainly because of the desire for adopting new technology. A total number of 19 individuals are not in regular contact with K.V.K. which is 5.59 percent to total individuals. The main reason is the distance factor due to which such individuals can not keep a regular contact.
STATUS OF IMPLEMENTATION OF THE SERVICES OF THE K.V.K. 9.226 The table below shows the details;
Table No. 9.73 Implementation of the Services of K.V.K.
Implementation of the services of
K.V.K.
If yes in what fields S No
Name of the Village
No. of Indivi-
dual Yes
No
Agronomy Horticu-
lture Animal
husbandry Fisheries Poultry
1 2 3 4 5 6 7 8 9 10 1. Surajpur 28 26 2 28 0 0 0 0 2. Minnora 57 57 0 53 0 0 0 0 3. Charpua 24 24 0 24 0 0 0 0 Adopted Village 109 107 2 105 0 0 0 0
4. Sujanpura 7 7 0 7 0 0 0 0 5. Papawani 47 45 2 46 0 0 0 0 6. Bori 49 48 1 49 0 0 0 0 7. Khiriya 30 30 0 28 2 0 0 0 8. Ganesh Ganj 48 46 2 48 0 0 0 0 9. Manikpura 50 50 0 50 0 0 0 0 Cluster Village 231 226 5 228 2 0 0 0
Total 340 333 7 233 2 0 0 0
Table No. 9.73 [Contd…]
Implementation of the Services of K.V.K If yes in what fields If no the reason S.
No. Name of the
Village Home science
Agro forestry
Organic farming
Water shed
Training of rural youth
Not satisfied with new
technology
Problem of resources
Satisfied with
present status
1 2 11 12 13 14 15 16 17 18 1. Surajpur 19 0 0 0 0 0 0 0 2. Minnora 18 0 7 0 1 0 0 0 3. Charpua 13 0 0 0 0 0 0 0 Adopted Village 50 0 7 0 1 0 0 0
4. Sujanpura 7 0 0 0 0 0 7 0 5. Papawani 8 0 0 0 0 0 0 0 6. Bori 18 0 5 0 0 0 0 0 7. Khiriya 14 0 0 0 0 0 0 0 8. Ganesh Ganj 17 0 3 0 0 0 0 0 9. Manikpura 0 0 2 0 0 0 0 0 Cluster Village 64 0 10 0 0 0 7 0
Total 114 0 17 0 1 0 7 0
9.227 The above table shows that out of 340 individuals, 333 individuals have implemented the
services of K.V.K.which is 97.94 percent to total respondents. This is an achievement by itself. It is worth mentioning here that the figures of itemwise coverage will not tally with the figure of 333 as the same person from agronomy might have implemented the improved techniques in the fields of horticulture, animal husbandry, home science etc.

585
9.228 The subject wise coverage figures show that the highest number of 333 individuals [97.94 percent to total individuals] have implemented the improved techniques relating to agronomy followed by 114 individuals [33.53 percent] implementing the improved techniques relating to home science. In subjects like animal husbandry, fishery, poultry, agro-forestry, watershed activities and training of rural youth no implementation efforts have been done by the sample individuals as for these activities even vocational trainings have hardly been organised. Intensive efforts are required in the fields like animal husbandry, agro-forestry and watershed activities as these fields have extensive scope for employment and income generation.
9.229 Only 7 individuals from village Sujanpura [cluster village] have not implemented the
services of K.V.K., mainly because of the problems of resources. SATISFACTION LEVEL OF THE INDIVIDUALS ABOUT THE SERVICES OF K.V.K. 9.230 The level of satisfaction derived from the services of K.V.K. is important to sustain the
efforts of K.V.K. over a period of time. The table below shows the details;
Table No. 9.74 Satisfaction Level of the Individuals
Satisfied with the impact
If yes in what fields S. No
Name of the Village No. of Individual
Yes
No
Agronomy Horticulture
Animal husban-dry
Fisheries Poultry
1 2 3 4 5 6 7 8 9 10 1. Surajpur 28 28 0 28 0 0 0 0 2. Minnora 57 56 1 55 0 0 0 0 3. Charpua 24 24 0 24 0 0 0 0 Adopted Village 109 108 1 107 0 0 0 0
4. Sujanpura 7 7 0 7 0 0 0 0 5. Papawani 47 46 1 46 0 0 0 0 6. Bori 49 49 0 45 0 0 0 0 7. Khiriya 30 30 0 28 2 0 0 0 8. Ganesh Ganj 48 48 0 48 0 0 0 0 9. Manikpura 50 50 0 50 0 0 0 0 Cluster Village 231 230 1 224 2 0 0 0
Total 340 338 2 331 2 0 0 0
Table No. 9.74 [Contd…]
Satisfaction Level of the Individuals If yes in what fields If no the reason S.
No. Name of the
Village Home science
Agro forestry
Organic farming
Water shed
Training of rural youth
Techn-ique is difficult to follow
Inputs are not easily available
Non-availability of advice in the
time 1 2 11 12 13 14 15 16 17 18 1. Surajpur 17 0 2 0 0 0 0 0 2. Minnora 17 0 6 0 0 0 0 0 3. Charpua 13 0 0 0 0 0 0 0 Adopted Village 47 0 8 0 0 0 0 0
4. Sujanpura 7 0 0 0 0 0 0 0 5. Papawani 8 0 0 0 0 0 2 0 6. Bori 18 0 4 0 0 0 0 0 7. Khiriya 13 0 0 0 0 0 0 0 8. Ganesh Ganj 17 0 3 0 0 0 0 0 9. Manikpura 0 0 2 0 0 0 0 0 Cluster Village 63 0 9 0 0 0 2 0
Total 110 0 17 0 0 0 2 0

586
9.231 The above table shows the 99.41 percent level of satisfaction of sample individuals for the services rendered by the K.V.K., which in itself is a startling achievement.
9.232 Agronomy and Home Science are the subjects for which satisfaction level is
substantial. In subjects like animal husbandry, fishery, poultry, agro-forestry, watershed activities and training of rural youth the satisfaction level is nil because of the basic fact that for these subjects no substantial number of vocational training has been initiated nor much of the FLDs or OFTs have been organised. Moreover, the cultivators of our sample area are not much interested in these activities, as they do not contribute substantially to their family income. However, efforts must be made to popularize the activities like animal husbandry, agro-forestry and watershed activities, as these subjects are important for rural economy.
IMPACT ON INCOME ENHANCEMENT 9.233 The validity of any effort is ultimately measured by its impact over income enhancement
whether directly or indirectly. The table below shows the details;
Table No. 9.75 Impact on Income Enhancement Income
enhancement If yes the fields S.
No. Name of the
Village No. of Individ
-ual Yes No Agronomy Horticulture Animal husbandry Fisheries Poultry 1 2 3 4 5 6 7 8 9 10
1. Surajpur 28 28 0 28 0 0 0 0 2. Minnora 57 57 0 55 0 0 0 0 3. Charpua 24 24 0 23 0 0 0 0 Adopted Village 109 109 0 106 0 0 0 0
4. Sujanpura 7 7 0 7 0 0 0 0 5. Papawani 47 46 1 44 0 0 0 0 6. Bori 49 49 0 44 0 0 0 0 7. Khiriya 30 30 0 24 2 0 0 0 8. Ganesh Ganj 48 48 0 45 0 0 0 0 9. Manikpura 50 50 0 48 0 0 0 0 Cluster Village 231 230 1 212 2 0 0 0
Total 340 339 1 318 2 0 0 0
Table No. 9.75 [Contd…]
Impact on Income Enhancement If no the reasons S.
No. Name of the
Village Home science
Agro forestry
Organic farming
Water shed
Training of rural youth
Could not follow the instruction
Problem of
resourse
Non- availability technical advice
in time 1 2 11 12 13 14 15 16 17 18
1. Surajpur 17 0 2 0 0 0 0 0 2. Minnora 17 0 4 0 0 0 0 0 3. Charpua 13 0 0 0 0 0 0 0 Adopted Village 47 0 6 0 0 0 0 0
4. Sujanpura 7 0 0 0 0 0 0 0 5. Papawani 6 2 0 0 0 0 0 0 6. Bori 18 0 4 0 0 0 0 0 7. Khiriya 11 0 0 0 0 0 0 0 8. Ganesh Ganj 17 0 3 0 0 0 0 0 9. Manikpura 0 0 2 0 0 0 0 0 Cluster Village 59 2 9 0 0 0 0 0
Total 106 2 15 0 0 0 0 0

587
9.234 From the aove table 99.71 percent positive response regarding impact of K.V.K. services over income enhancement is visualized which is creditable to the efforts of the K.V.K. in various fields of its operation.
9.235 As is expected, maximum number of 318 individuals i.e. 93.53 percent to total of 340
individuals have expressed the positive impact on income enhancement through practice of agronomy followed by home science [106 individuals].
EXTENT OF INCOME ENHANCEMENT 9.236 Assessment of income level of individuals is one of the most difficult aspects of primary
data collection as the persons are usually shy of giving the correct information. However, through indirect approach, information regarding income has been collected which is given in the following table;
Table No. 9.76
Extent of Income Enhancement Percentage increase in Income S.
No Name of the Village
1to 10%
11 to
20%
21 to
30%
31 to
50%
51 to 60%
61 to
70%
71 to
80%
81 to
90%
91 to 100%
1 2 3 4 5 6 7 8 9 10 11 1. Surajpur 28 0 5 0 0 0 0 0 0 2. Minnora 51 6 5 0 0 0 0 0 0 3. Charpua 24 0 0 0 0 0 0 0 0 Adopted Village 103 6 10 0 0 0 0 0 0
4. Sujanpura 7 0 0 0 0 0 0 0 0 5. Papoura (Mondu Bhak) 46 0 0 0 0 0 0 0 0 6. Bori 46 0 0 0 0 0 0 0 0 7. Khiriya 19 9 0 0 0 0 0 0 0 8. Ganesh Ganj 36 10 0 0 0 0 0 0 0 9. Manikpura 44 4 0 0 0 0 0 0 0 Cluster Village 198 23 0 0 0 0 0 0 0 Total 301 29 10 0 0 0 0 0 0
9.237 The above table shows that out of 340 individuals, 301 individuals [88.53 percent to total
individuals] have reported about 9 to 10 percent enhancement in income due to the impact of various services of K.V.K. while 39 individuals [11.47 percent] reported about 11 to 30 percent income enhancement. The impact of the K.V.Ks. efforts over income enhancement is, somewhat, stratling.
OPINION ABOUT CONTINUANCE OF THE SERVICES OF K.V.K. 9.238 The table below shows the details;

588
Table No. 9.77 Opinion about Continuance of K.V.K. Services
Continuation of the services of K.V.K.
S. No.
Name of the Village No. of Individual
Yes No 1 2 3 4 5 1. Surajpur 28 28 0 2. Minnora 57 57 0 3. Charpua 24 24 0 Adopted Village 109 109 0
4. Sujanpura 7 7 0 5. Papawani 47 46 1 6. Bori 49 49 0 7. Khiriya 30 30 0 8. Ganesh Ganj 48 48 0 9. Manikpura 50 50 0 Cluster Village 231 230 1
Total 340 339 1 9.239 The above table shows that out of 340 individuals, 339 individuals [99.71 percent to total
individuals] have reported for continuance of the services by K.V.K. particularly for subjects like home science and agronomy, agro-forestry and organic forming. Only 1 number of individuals have given negetive opinion which seems natural in the context of large number of respondents. Viewing things from the positive angle, the performance of the K.V.K. seems laudable, as the efforts have won the confidence of the farming community of our area of study.
SUGGESTIONS FOR ADDITIONAL SERVICES TO BE RENDERED BY THE K.V.K. 9.240 Information regarding suggestions for additional services to be rendered by the K.V.K. has
been collected from the individuals. The table below shows the details;
Table No. 9.78 Suggestions for Additional Services to be Rendered by K.V.K.
Suggestions for additional services by KVK S. No.
Name of the Village No. of Individual Production of
by product Marketing strategy
Weather forecasting
Availability of agri. inputs at
panchayat level 1 2 3 4 5 6 7 1. Surajpur 28 15 7 0 4 2. Minnora 57 20 23 2 12 3. Charpua 24 11 5 0 8 Adopted Village 109 46 35 2 24
4. Sujanpura 7 1 6 0 0 5. Papawani 47 15 11 0 18 6. Bori 49 24 19 0 6 7. Khiriya 30 14 8 3 5 8. Ganesh Ganj 48 22 21 1 4 9. Manikpura 50 15 22 2 11 Cluster Village 231 91 87 6 44
Total 340 137 122 8 68

589
9.241 Out of 340 individuals 335 individuals [98.53 percent] have given their useful suggestions about introduction of additional services to be rendered by the K.V.K. Important among these are regarding suggestions about production of by-product of crops, development of marketing strategy for fair return of the product and making available agricultural inputs at Gram Panchayat Level wherein 127, 122 and 68 individuals respectively have given their useful suggestions.
9.242 Regarding production of by-product, that may lead to some processing activities, the work
may be initiated in liaison with Industries Department of the district. 9.243 Marketing of agriculture produce is gaining importance to avoid the exploitation of farmers
by brokers. The intervention of K.V.K. personnel will be very useful if some sort of training is organised for beneficiary cultivators in liaison with Mandi Committees.
9.244 Regarding availability of agriculture inputs at Gram Panchayat level, the K.V.K Scientists
may bring home the solution in consultation with the Chief Executive Officer of Zila Panchayat by developing modalities for making available things at Gram Panchayat level.
9.245 It is, therefore, worth considering to incorporte in the mandate of K.V.K. the subjects
like production of by-products and development of marketing strategy of the product of the cultivators.
UTILIZATION OF THE ENHANCED INCOME 9.246 Proper utilization of enhanced income is equally important as compared to its generation.
The table below shows the utilization of enhanced income of sample individuals for purchase of various agriculture inputs;
Table No. 9.79
Utilization of Enhanced Income Enhanced income led to purchase of
Tractor Harvester Thresher S. No.
Name of the Village No. of Individual
Yes (1)
No (2)
Yes (1)
No (2)
Yes (1)
No (2)
1 2 3 4 5 6 7 8 9 1. Surajpur 28 0 28 0 28 0 28 2. Minnora 57 0 57 0 57 0 57 3. Charpua 24 0 24 3 21 0 24 Adopted Village 109 0 109 3 106 0 109
4. Sujanpura 7 0 7 0 7 1 6 5. Papawani 47 0 47 0 47 0 47 6. Bori 49 0 49 0 49 1 48 7. Khiriya 30 0 30 0 30 7 23 8. Ganesh Ganj 48 0 48 0 48 2 46 9. Manikpura 50 0 50 0 50 0 50 Cluster Village 231 0 231 0 231 11 220 Total 340 0 340 3 337 11 329

590
Table No. 9.79 [Contd…] Utilization of Enhanced Income
Plough Seed drill Bullock pair
S. No.
Name of the Village No. of Individual
Yes (1)
No (2)
Yes (1)
No (2)
Yes (1)
No (2)
1 2 3 10 11 12 13 14 15 1. Surajpur 28 0 28 0 28 5 23 2. Minnora 57 31 26 0 57 5 52 3. Charpua 24 8 16 0 24 3 21 Adopted Village 109 39 70 0 109 13 96
4. Sujanpura 7 3 4 0 7 0 7 5. Papawani 47 5 42 0 47 9 38 6. Bori 49 7 42 0 49 6 43 7. Khiriya 30 21 9 0 30 2 28 8. Ganesh Ganj 48 25 23 0 48 5 43 9. Manikpura 50 16 34 0 50 9 41 Cluster Village 231 77 154 0 231 31 200
Total 340 116 224 0 340 44 296
Table No. 9.79 [Contd…] Utilization of Enhanced Income
Power/Knapsa
c sprayer Handhoe Storage
facility
S. No.
Name of the Village No. of Individual
Yes (1)
No (2)
Yes (1)
No (2)
Yes (1)
No (2)
1 2 3 16 17 18 19 20 21 1. Surajpur 28 0 28 0 28 0 28 2. Minnora 57 0 57 5 52 0 57 3. Charpua 24 0 24 4 20 0 24 Adopted Village 109 0 109 9 100 0 109
4. Sujanpura 7 0 7 0 7 0 7 5. Papawani 47 0 47 1 46 0 47 6. Bori 49 0 49 1 48 0 49 7. Khiriya 30 0 30 6 24 0 30 8. Ganesh Ganj 48 0 48 8 40 0 48 9. Manikpura 50 4 46 9 41 0 50 Cluster Village 231 4 227 25 206 0 231 Total 340 4 336 34 306 0 340

591
Table No. 9.79 [Contd…] Utilization of Enhanced Income
Tube well /Dug well Electric/diesel motor Yes (1) No (2) Yes (1) No (2)
S. No.
Name of the Village No. of Individual
22 23 24 25 1. Surajpur 28 0 28 1 27 2. Minnora 57 0 57 4 53 3. Charpua 24 0 24 0 24 Adopted Village 109 0 109 5 104
4. Sujanpura 7 0 7 0 7 5. Papawani 47 0 47 0 47 6. Bori 49 0 49 1 48 7. Khiriya 30 0 30 2 28 8. Ganesh Ganj 48 0 48 2 46 9. Manikpura 50 0 50 4 46 Cluster Village 231 0 231 9 222
Total 340 0 340 14 326
9.247 The above table shows that 226 individuals have utilized their enhanced income for
purchase of various agriculture inputs which constitutes 66.47 percent to total number of 340 sample individuals. The purchases are mainly limited on items like harvester, thresher, plough, bullock pairs and power knapsac sprayer and hand hoe. The utilization level of enhanced income for purchase of agriculture input is quite impressive.
IMPACT OF ENHANCED INCOME OVER EDUCATION LEVELS 9.248 The table below shows the impact of enhanced income over levels of education in our area
of study; Table No. 9.80
Impact of Enhanced Income Over Levels of Education Impact on education
due to enhanced
income
If yes in what manner S. No.
Name of the Village
No. of Individual
Yes (1)
No (2)
More Male
Children go to
primary/middle
(1)
More Female Children
go to primary/middle
(2)
More male children attend
secondary level
education (3)
More female
children attend
secondary level
education (4)
Male Female children go for
higher education non
(5)
1 2 3 4 5 6 7 8 9 10 1. Surajpur 28 22 6 16 5 0 0 0 2. Minnora 34 32 2 16 9 5 0 2 3. Charpua 47 37 10 14 4 8 3 0 Adopted Village 109 91 18 46 18 13 3 2
4. Sujanpura 7 7 0 4 0 0 0 0 5. Papawani 47 40 7 21 12 0 0 0 6. Bori 49 43 6 31 9 0 0 0 7. Khiriya 30 29 1 20 4 3 2 0 8. Ganesh Ganj 47 45 2 22 13 6 4 0 9. Manikpura 51 47 4 27 14 3 2 1 Cluster Village 231 211 20 125 52 12 8 1
Total 340 302 38 171 70 25 11 3

592
Table No. 9.80 [Contd…] Impact of Enhanced Income Over Levels of Education
If no the reasons S. No
Name of the Village No. of Individual Educa-
tion is no
priority (1)
Purchase of agr. inputs
(2)
Exp. on religious/social rituals
(3)
Purchase of luxutry items
like TV fridge two
wheeler etc. (4)
Consump - tion of
intoxicants (5)
Deposi-ted in
the bank (6)
Debt repay-ment (7)
1 2 3 11 12 13 14 15 16 17 1. Surajpur 28 0 4 0 0 0 0 0 2. Minnora 34 4 0 0 0 0 0 0 3. Charpua 47 8 0 0 0 0 0 0 Adopted Village 109 12 4 0 0 0 0 0
4. Sujanpura 7 0 1 0 0 0 0 0 5. Papawani 47 5 4 0 0 0 0 0 6. Bori 49 0 7 0 0 0 0 0 7. Khiriya 30 1 0 0 0 0 0 0 8. Ganesh Ganj 47 0 0 0 0 0 0 0 9. Manikpura 51 4 0 0 0 0 0 0 Cluster Village 231 10 12 0 0 0 0 0
Total 340 22 16 0 0 0 0 0
9.249 Out of 340 individuals, 279 individuals [82.06 percent] have reported positive impact of
enhanced income over levels of education while 38 number of individuals [11.18 percent] have refused about such impact. The positive impact is predominant in case of primary and middle level education for both boys and girls wherein 241 individuals [70.88 percent to total individuals] have reported that due to enhanced income more number of boys and girls are being sent to attend elementary level [primary + middle] of education. The positive impact of enhanced income on levels of education shows the awareness of the sample individuals about value of education.
9.250 Regarding negetive responses by 38 individuals, 22 individuals [6.47 percent to total of 340
individuals] have reported that education is no priority to them while 16 individuals [4.71 percent] have said that due to purchase of agriculture inputs the emphases on education has been reduced.
IMPACT OF ENHANCED INCOME OVER HEALTH STATUS 9.251 Health is again an important social factor that accounts for efficiency in pursuance of any
occupation. The table below shows the impact of enhanced income over health status of sample population.

593
Table No. 9.81 Impact of Enhanced Income over Health Conditions
Impact on Health
If yes in what manner S. No.
Name of the Village No. of Individual
Yes (1)
No (2)
Services of
medical personnel
(1)
Vaccination of
children/ women done (2)
Child nutrition
(3)
Female nutrition during
gestation (4)
Adoption of Family
welfare measuries
1 2 3 4 5 6 7 8 9 10 1. Surajpur 28 28 0 9 14 2 3 0 2. Minnora 34 29 5 1 13 6 2 7 3. Charpua 47 47 0 28 15 3 0 0 Adopted Village 109 104 5 38 42 11 5 7
4. Sujanpura 7 7 0 1 5 0 0 1 5. Papawani 47 44 3 16 19 11 0 0 6. Bori 49 48 1 8 36 5 0 0 7. Khiriya 30 28 2 2 14 5 0 7 8. Ganesh Ganj 47 33 14 3 10 11 3 3 9. Manikpura 51 42 9 10 20 2 1 10 Cluster Village 231 202 29 40 104 34 4 21
Total 340 306 34 78 146 45 9 28
Table No. 9.81 [Contd…]
Impact of Enhanced Income over Health Conditions If no the reasons S.
No Name of the Village No. of
Individual Health is no
priority
Believe in local healing methods
Purchase of agri. inputs
Exp. on religious functions
Luxury items TV Fridge,
Two wheeler,
Four wheeler
Consumption of
intoxicants
Deposited in bank
1 2 3 11 12 13 14 15 16 17 1. Surajpur 28 0 0 0 0 0 0 0 2. Minnora 34 3 1 0 0 0 0 0 3. Charpua 47 0 0 0 0 0 0 0 Adopted Village 109 3 1 0 0 0 0 0
4. Sujanpura 7 0 0 0 0 0 0 0 5. Papawani 47 0 0 0 0 0 0 0 6. Bori 49 0 0 0 0 0 0 0 7. Khiriya 30 2 0 0 0 0 0 0 8. Ganesh Ganj 47 13 8 0 0 0 0 0 9. Manikpura 51 7 0 0 0 0 0 0 Cluster Village 231 22 8 0 0 0 0 0
Total 340 25 9 0 0 0 0 0
9.252 The above table shows that out of 340 individuals, 306 individuals [90.00 percent to total of
340 individuals] have reported about positive impact of enhanced income over health status which shows the awareness of the sample population about value of keeping good health. The items of positive responses like hiring of the services of medical personnel [78 individuals], vaccination of children/women [146 individuals]. Child nutrition [45 individuals] female nutrition during gestation [9 indivuduals] and adoption of family welfare measures [28 individuals] are indicative of healthy trend since the individuals are more concerned particularly about, the health status of women and children.

594
9.253 Though the number of individuals with negetive response is only 34 [10.00 percent to total of 340 individuals] but the opinion like health is no priority by 25 number of individuals is a sort of red alert to K.V.K. scientists who must uproot such attitude lest they go deep into the thinking of more individuals.
IMPACT OF ENHANCED INCOME OVER POTABLE DRINKING WATER SUPPLY 9.254 The table below shows the details;
Table No. 9.82
Impact of Enhanced Income over Potable Drinking Water Supply Improvement in potable
drinking water S. No
Name of the Village No. of Individual
Yes
No
1 2 3 4 5 1. Surajpur 28 2 26 2. Minnora 34 0 34 3. Charpua 47 8 39 Adopted Village 109 10 99
4. Sujanpura 7 0 7 5. Papawani 47 1 46 6. Bori 49 7 42 7. Khiriya 30 2 28 8. Ganesh Ganj 47 0 47 9. Manikpura 51 0 51 Cluster Village 231 10 221
Total 340 20 320 9.255 The above tabke shows a reverse situation where the negetive response is to the tune of 320
individuals which is 94.12 percent to total of 340 individuals while the positive response is by only 20 individuals [5.88 percent]. These facts show that availability of potable drinking water is no priority in rural areas. The majority of positive respondents have indicated the spending of portion of enhanced income over installation of hand pumps. The solution to this problem of neglect of protable drinking water lies in enhancement of agricultural income of the rural population which if achieved will solve the problem of drinking water and also sanitation as the enhanced income induces the individuals to take care of the finer details of life.
IMPACT OF ENHANCED INCOME OVER HOUSING CONDITIONS 9.256 The table below shows the details;

595
Table No. 9.83 Impact of Enhanced Income over Housing Conditions
Enhancement in income resulted in improved housing contentions
S. No
Name of the Village No. of Individual
Yes No 1 2 3 4 5 1. Surajpur 28 18 10 2. Minnora 34 12 22 3. Charpua 47 19 28 Adopted Village 109 49 60
4. Sujanpura 7 1 6 5. Papawani 47 8 39 6. Bori 49 22 27 7. Khiriya 30 11 19 8. Ganesh Ganj 47 10 37 9. Manikpura 51 4 47 Cluster Village 231 56 175
Total 340 105 235
9.257 The above table shows that out of 340 individuals, 105 individuals [30.88 percent] have
positive respons while 235 individuals [69.12 percent] have refused spending of any amount of enhanced income over improving the housing conditions. The status seems obvious as frequent expenditure over improving the houseing condition is not usually done.
AWARENESS ABOUT WELFARE SCHEMES INITIATED BY THE STATE GOVERNMENT WITH ASSISTANCE FROM GOVERNMENT OF INDIA 9.258 The basic objectives of various welfare schemes initiated by the government are providing
employment opportunities to the target group for augmentation of income thereby improving the quality of life of the individuals/community. Though this information has no direct relevance to the functioning of K.V.K., but its personnel are supposed to popularize such schemes among villagers for taking financial support from such programmes. In the following paragraphs the details of a few important schemes have been given which have direct impact over the livelihoods of sample population.
JAWAHAR GRAM SAMRIDHI YOJANA 9.259 The former scheme of Jawahar Rojgar Yojna renamed as Jawahar Gram Samridhi Yojna
was started from the year 1999-2000 with the basic objective of creating community assets of permanent nature, thereby providing employment to local labour. The survey results show that out of 340 individuals 161 individuals [47.35 percent] are aware of the scheme while rest of 179 individuals [52.65 percent] have no knowledge about the scheme. The scheme is important from the view point of creating community asset that results in availability of employment opportunities. Awareness about this scheme will induce the villagers to assert their demand through Gram Panchayat to develop their area. The K.V.K. personnel may, during their field visits, publicize the utility of the scheme among the villagers.
EMPLOYMENT ASSURANCE SCHEME 9.260 Started from the year 1997-98, the scheme aims at providing employment to rural
population during lean season of agriculture thereby creating community assets. The response to this scheme is somewhat encouraging as 132 individuals [38.82 percent] are aware about the scheme.
ESTABLISHMENT OF HAND LOOM UNITS

596
9.261 Under this scheme, the units having 5 to 10 looms are registered and loom-shed subsidy and margin money subsidy are given. Only 20 person of our sample area is aware of the scheme which is 5.88 percent to total 340 individuals. When much awareness is not there, there can hardly be any possibility of its implementation in our area of study.
ESTABLISHMENT OF SERICULTURE UNITS 9.262 Under this scheme the beneficiaries are given training on various aspects of sericulture
activities to supplement their income. For this purpose Resham Kendras spread over in districts assume nodal responsibilities to train the beneficiaries and augment their infrastructure. Only 16 individuals from our area of study are aware of the existence of such scheme [what to say of its implementation] when the scheme is so important for rural economy. The K.V.K. personnel in liaison with concerned district authorities may take-up a compaign for making villagers aware about the benefits of the scheme.
ESTABLISHMENT OF FAMILY BASED RURAL INDUSTRIAL UNITS 9.263 The scheme is implemented by the Madya Pradesh Khadi and Gramodoyog Board. Under
this scheme the units pertaining to SC, ST and OBCs are given 90 percent subsidy on capital loan and remaining 10 percent loan is given by the banks. The level of awareness about this scheme is 21 individuals [6.18 percent to total of 340 individuals].
MID DAY MEALS 9.264 The programme has proved to be an effective incentive for retention of school going
children relating to primary education, specially the children coming from low income group. Under this programme, cooked meals are provided to the school going children. The level of awareness of this scheme is encouraging as 321 individuals, which is 91.41 percent to total of 340 individuals, are aware about this scheme.
FREE SUPPLY OF TEXT BOOKS 9.265 Under this scheme all the students of primary standard [classes 1st to 5th] belonging to SC,
ST and OBCs and students of classes 1st to 3rd standards belonging to general communities are given text books free of cost. As per our survey results 208 individuals [61.18 percent] are aware about the scheme while 132 individuals [38.82 percent] are not aware of the scheme. Since the supply of text books free of cost is mandatory, the individuals unaware of the scheme are either persons having their wards above primary standards of education or the rate of drop-out is so high that they are not particular about the scheme. However, efforts both by persons of school education department and K.V.K. may reduce such extent of unawareness.
WOMEN SELF HELP GROUP 9.266 With view to ensure social and economic empowerment of women, self help groups
[S.H.Gs.] are formed for making the women confident to face challenges on all fronts, be it social or economic. In this scheme, the members of the group deposit a part of their saving in the fund raised by the group and may take loan to meet their various social and economic obligations, subject to return of the amount with interest. In our area of study 282 individuals [82.84 percent] are aware of this scheme which, ofcourse, is very encouraging that indicates the awareness of individuals about the value of such institution. Unawareness aspect for 58 individuals may easily be overcome by little more extension efforts by concerned government officials and persons of K.V.K.
GRAMYA YOJNA

597
9.267 Under this scheme the poor women are given interest free loan upto Rs. 500.00 towards starting a small business. After repayment of the first loan within one year, second loan to the tune of Rs. 1500.00 is given. In our area of study, 211 number of individuals [62.06 percent] are aware of this scheme which is satisfactory.
AUSMATI YOJNA 9.268 With the objective of providing better medical assistance to the women belonging to the
families living below the poverty line in rural areas, this scheme was started in the year 1999. For this scheme also the extent of awareness by 209 individuals [61.07 percent] is quite satisfactory.
9.269 In what follows an attempt has been made to summarise the details of individual
particulars of adopted and cluster villages. - The frame of the present part of the narration is 340 individuals which is 25 percent of
the family members of 25 percent sample households belonging to adopted and cluster villages.
- The criteria for selection of individuals are – the persons should be the adult member of the family, he/she should be associated with any programme of the K.V.K., he/she should be literate – may be without having any formal education.
- The majority of 269 individuals are from S.C. and O.B.C. communities accounting for 79.12 percent to total of 340 individuals from adopted and cluster villages.
- The cent-percent sample individuals from our area of study are the followers of Hindu religion.
- The cent-percent awareness of the individuals about the K.V.K. in terms of its location and more importantly the services rendered by it is an important achievement of the K.V.K.
- Regarding knowledge about specific services, cent-percent sample individuals are aware of the vocational training while 98.53 percent individuals are aware of F.L.D. and cent percent individuals know about O.F.T. The impact of the K.V.K. services are obvious.
- Out of total of 340 individuals, 321 individuals [94.41 percent] are in regular contact with K.V.K. mainly because of the desire for adopting new technology.
- Regarding implementation, 97.94 percent individuals have implemented the services of K.V.K. This is an achievement by it self.
- Except for the subjects like agronomy and home science where 97.94 percent and 33.53 percent individuals have implemented the services rendered by K.V.K., in rest of the subjects viz. animal husbandry, fishery, poultry, agro-forestry, watershed activities and training of rural youth no implementation efforts have been done by the sample individuals.
- Agronomy and the home science are the subjects for which satisfaction level is substantial. In subjects like animal husbandry, poultry, fishery, watershed activities and training of rural youth the satisfaction level is nil.
- Regarding impact of K.V.K’s. efforts over income enhancement, cent percent individuals have given positive response which is an achievement in itself.
- Regarding continuance of the services of K.V.K. 99.71 percent individuals have given positive response that justifies the laudable performance of the K.V.K.
- It is worth considering to incorporate in the mandate of the K.V.K. the new subjects like production of by-products and marketing strategy of the product.
- As regards utilization of enhanced income, 66.47 percent individuals have spent their enhanced income over purchase of agriculture implements.

598
- Regarding impact of enhanced income over levels of education, 82.06 percent individuals have given positive response particularly in case of elementary education for both boys and girls, which, no dubt is an encouraging trend.
- 90.00 percent to total of 340 individuals have reported about positive impact of enhanced income over health status that shows the awareness of sample population about value of keeping good health.
RESULTS OF SURVEY–INDIVIDUAL PARTICULARS–CONTROL VILLAGE 9.270 In the following paragraphs an attempt has been made to record the reactions of 25 percent
of individuals taken from control village of Neemkhera where there is no intervention of KVK. The Total number of family members of the 25 percent of the households in village is 68, the twenty five percent of which is 16 individuals. Therefore, the reactions of 16 number of individuals have been recorded to have a comparison with the reactions of individuals of adopted and cluster villages having direct intervention of KVK. The criteria for selection of individuals for control village are similar to that for adopted and cluster villages.
9.271 All the 16 individuals are from O.B.C. community. Non of the persons are from S.C., S.T.
and General Community. Cent-percent individuals are followers of Hindu religion. 9.272 Regarding awareness about the existence of KVK, 9 number of individuals [56.25 percent]
of Neemkhera village are aware of the its existence against the cent-percent awareness about K.V.K. in-terms of its location and services rendered by it by the individuals of adopted and cluster villages which seems obvious as in such cases the interventiojn of K.V.K. is direct. Awareness is the basic paramter that leads to positive impact of any activity over a long period of time. The ultimate aim of any K.V.K. is to cover the entire district in terms of implementation of prevailing and new technology relating to agriculture and its allied activities that presupposes awareness about this organisation by the farming community of the district. For this purpose the K.V.K. personnel of district Tikamgarh may organize meetings at Gram Panchayat level at least twice in a year inviting one representative from villages where there is no intervention of K.V.K. to make them aware about the utility of services rendered by the K.V.K.
9.273 Regarding satisfaction derived from per hectare yield of agronomical and horticulture
crops, 12 number of individuals 75.00 percent of control village Neemkhera have expressed their satisfaction while for adopted and cluster villages this satisfaction level is 99.41 percent to total of 340 individuals. However for improving the per-hectare yield, 2 number of individuals from control village which is 12.5 percent to total of 16 individuals have suggested for organizing training for application of inputs, followed by 1 individuals each for organizing training on water consrvation, crop rotation and organic farming.
9.274 Regarding satisfaction level of livestock and dairy activities 10 number of individuals [62.50
percent] have expressed their satisfaction. The suggestions forwarded are making available the improved breed production facilities by 1 individuals [6.25 percent] followed by training on artificial insemination by 5 individuals [31.25 percent] and one individual [6.25 percent] has opined for making available the improved feed facilities. It will be worth mentioning that even in cases of adopted and cluster villages the satisfaction level for livestock and poultry activities is negligible.
9.275 As for poultry development 8 number of individuals [50.00 percent] have expressed
satisfaction. The important suggestion forwarded is arrangement of improved breeding facilities by 2 individual [12.50 percent], broiler production facilities [3 individuals] improved caging facilities [2 individuals] and improved feed management [1individuals]. In case of adopted and cluster villages also the satisfaction level for this activity is not substantial.

599
9.276 Regarding fishery development, again the level of dissatisfaction is cent-percent supported by the suggestions like supply of improved feed by 7 individuals [43.75 percent] followed by arranging training about use of improved implements by 2 individuals [12.50 percent] It is worth mentioning again that for adopted and cluster villages the level of satisfaction for this activity is nil.
9.277 Important information has been collected about adoption of home science activities for
augmentation of family income. Toy making is one such activity where 2 number of individuals have asked for training facility followed by pickle prepartion by 1 individuals [6.25 percent]. Training regarding backing activities have been supported by 1 individuals [6.25 percent], followed by papad/bari/jam/jelly by 1 individuals [6.25 percent] and food processing by 2 pesons [12.50 percent]. It is worth mentioning that in case of adopted and cluster villages the positive response in favour of home science activities is substantial.
9.278 Regarding training of rural youth for self employment, 7 number of individuals have
suggested for organizing training programme for motor binding which is very relevant for performing agricultural activities followed by 4 individuals in favour of training courses for repair of cycle scooter that accounts for 25.00 percent to total of 16 sample individuals. For activities like black smithy, carpentry and masonary, individuals to the tune of 1 [6.25 percent], 3 [18.75 percent], 1 [6.25 percent], respectively have suggested for organizing training courses. It will not be out of place to mention here that in case of adopted and cluster villages, no individual has shown any inclination for such activities regarding training of rural youth.
9.279 Regarding educational status of the sample individuals of control village, the survey results
show that out of 16 individuals, 9 persons [56.25 percent] have reported positively about their male children attending the elementary level of education [primary + middle i.e. classes 1st to 8th standards] while the response from 7 individuals [43.75 percent] for this item is negetive. More or less similar is the situation with girls wherein 5 number of individuals [31.25 percent] have given positive response while 11 number of individuals [68.75 percent] were negetive in their responses. Similarly regarding boys and girls students of secondary level of education, i.e. from from classes 9th to 12th the 2 and 8 individuals respectively have given positive response.
9.280 Regarding health status, the following table presents a comparitive picture between adopted
and cluster villages on one side and the control village on the other; Table No. 9.84
Compartive Status of Health Facilities Among Sample Individuals Sl. No.
Item Status of control village –percentage to total 16 sample
individuals
Status of adopted and cluster villages percentage to 113
sample individuals 1 Hiring of services of
medical personnel 25.00 22.94
2 Vaccination of children/ pregnant mother
43.75 42.94
3 Child nutrition 56.25 13.24 4 Female nutrition during
gestation period 62.50 2.65
5 Adoption of family welfare measures
37.50 8.24
Note – Only positive responses have been taken into account.

600
9.281 In all the health parameters the percentage positive responses of the individuals of control village are higher than that of adopted and cluster villages that shows the relatively higher level of awareness among the sample individuals of control village regarding various health parameters as compared to adopted and cluster villages.
9.282 Regarding status of drinking water facilities, cent percent individuals have responded
positively about availability of hand pumps as main source of drinking water. Piped water supply is not in existence in the sample village which seems obvious as in villages in general this facility is seldom available. In case of adopted and cluster villages also the majority of respondents have informed about hand pums as main source of drinking water in their villages.
9.283 The table below shows the comparative level of awareness about the various welfare
schemes between adopted/cluster villages and control village;
Table No. 9.85 Comparative Levels of Awareness
Sl. No.
Name of the Scheme Level of awareness in percentage for adopted/cluster villages [percent to total of 340
individuals]
Level of awareness in percentage for control
village [percent to total of 16 individuals]
1 Jawahar Gram Samridhi Yojna 47.35 43.75 2 Employment Assurance Scheme 38.82 68.75 3 Establishment of Hand Loom Units 5.88 12.50 4 Establishment of Sericulture Units 4.71 - 5 Establishment of family based rural
industrial Units 6.18 -
6 Mid-day Meals 91.41 93.75 7 Free supply of Text Books 61.18 31.25 8 Women Self Help Group 82.84 81.25 9 Gramya Yojna 61.06 56.25 10 Ausmati Yojna 61.47 75.00 9.284 The above table shows that except for schemes like Employment Assurance Scheme
and Mid-day meals, Establishment of hand loom units and ausmati yojna the level of awareness about other schemes is higher in adopted/cluster villages as compared to control village. Regarding schemes like Establishment of Sericulture Units and Establishment of family based rural industrial Units the level of awareness among individuals of control village is nil while that for adopted and cluster villages the level of awareness is marginal. The validity of such schemes, therefore, is doubtful as since the awareness about these schemes are missing, the plight of their implementation may well be imagined.
9.285 In what follows an attempt has been made to summarise the findings of individual
particulars of the control village; - The cent percent individuals are from O.B.C. community. Cent percent individuals are
followers of Hindu religion. - Regarding awareness about existence of K.V.K. 56.25 percent individuals are aware of
its existence. - Regarding satisfaction derived from per hectare yield of agronomical and horticulture
crops the 75.00 percent individuals from control village have expressed their satisfaction.

601
- Regarding satisfaction level for activities like livestock and dairy and poultry 62.50 percent and 50.00 percent individuals have expressed their satisfaction. For fishery development the dissatisfaction level is cent percent.
- Regarding home science activities the positive response from individuals of control village is substantial.
- Similarly for training of rural youth the positive response of the individuals of control village is substantial.
- Regarding educational status 56.25 percent individuals have reported positively about their male children attenditng the elementary level of education. More or less similar is the situation for girls wherein 31.25 percent individuals have given positive response.
- Regarding health status the positive response from individuals is substantial. - Regarding status of drinking water facilities cent percent individuals have responded
positively about availability of hand pumps as main source of drinking water. - As regards awareness about various welfare schemes the level of awareness for
schemes like Jawahar gram Samridhi Yojna, Employment Assurance Scheme, Mid-day Meals, Women Self Help Group and Ausmati Yojana is substantial.

602
Chapter Ten
The Wrap-up
10.1 This presentation has been necessitated due to large volume of the report dealing with six K.V.Ks. covering multiple of agro-climatic zones of the State of Madhya Pradesh. An attempt, therefore, has been made in this presentation to highlight pointedly the impact of the K.V.Ks. covered under the study over the broad categories of : -
- Impact over Farm Activities – Agriculture Production
- Impact over Farm Activities – Other than Agriculture Production
- Impact over Non- Farm Activities
All the aforesaid parameters are the basic determinants of the status of any rural economy controlling thereby the social aspects as well through various forward linkages.
IMPACT OVER FARM ACTIVITIES – AGRICULTURE PRODUCTION
10.2 For assessing the impact, the comparative performances between control village and adopted and
cluster villages have been taken. The average productivity figures of adopted and cluster villages
pertaining to vocational training in after training situations have been taken into account as the
maximum participation of cultivators are in vocational training which is one of the most
important training programmes of K.V.K., besides Front Line Demonstration and On Farm
Testing. However, it has been observed after analysis of survey results that the difference in yield
per-hectare is not much due to the efforts of vocational training, front line demonstrations and on-
farm testing in after training (AT) situations. Therefore, the results of vocational training in after
training situations have been considered to present a comparative status of yield per hectare between
control village where there is no intervention of K.V.K. on one side and average performance of
adopted and cluster village where there is intervention of K.V.K. on other side. We might reiterate
that for every K.V.K. three adopted villages, six cluster villages and one control village have
been identified for detailed analysis.
10.3 In the following table, K.V.K. wise analysis of yield per hectare [crop wise] have been attempted by
arraying the K.V.Ks. according to their host organisation, i.e. K.V.Ks. run by N.G.Os. Jawahar Lal
Nehru Krishi Vishwa Vidayalaya [J.N.K.V.V.], Jabalpur and Central Institute of Agriculture
Engineering, GoI, with the objective of presenting relative efficiency among such institutions. The
table below shows the details;

603
Table No. 10.1 [Farm Activities – Agriculture Production] Sl. No.
Name of the K.V.K., Host orgnisation,
Item of performance
Unit Control Village
Adopted and cluster village - Vocational Training [Average]
Percentage variation over col. 4 (+) (-)
Distt. average
productivity
State average
productivity 1 2 3 4 5 6 7 8
K.V.K. SATNA [N.G.O.] Agronomical Crops Cereals
1 Wheat Kg/ha 3175.00 3379.56 +6.44 1305.00 1867.00 2 Paddy Kg/ha 2443.00 3085.50 +26.40 1000.00 1058.00 3 Maize Kg/ha 1600.00 1809.00 +13.06 1344.00 2072.00 4 Jowar Kg/ha 500.00 - - 945.00 1342.00 Pulses 5 Gram Kg/ha 3100.00 3128.44 +0.92 698.00 932.00 6 Arhar Kg/ha 1250.00 1130.11 -9.59 501.00 825.00 7 Lentil Kg/ha 1600.00 - - 533.00 506.00 Oil Seeds 8 Soybean Kg/ha - - - 634.00 1132.00 9 Mustard Kg/ha 780.00 1058.67 +35.73 385.00 1009.00 10 Linseed Kg/ha - - - 343.00 452.00
Horticulture Crops 11 Potato Q/ha 187.00 212.56 +13.67 - N.A. 12 Onion Q/ha 158.00 241.20 +52.66 - N.A. 13 Tomato Q/ha 100.00 184.88 +84.88 - N.A. 14 Brinjal Q/ha 150.00 196.75 +31.17 - N.A. 15 Chilly Q/ha 80.00 168.75 +110.94 - N.A. 16 Bhindi Q/ha 75.00 189.60 +152.80 - N.A. 17 Cucerbits Q/ha 40.00 - - - N.A. 18 Spices Q/ha 50.00 - - - N.A. 19 Papaya Q/ha - - - - N.A. 20 Citrus Q/ha - - - - N.A.
Q = Quintal Table No. 10.1 [Contd…] [Farm Activities – Agriculture Production]
Sl. No.
Name of the K.V.K., Host orgnisation,
Item of performance
Unit Control Village
Adopted and cluster village Vocational Training [Average]
Percentage varieties over col. 4 (+) (-)
Distt. Average
productivity
State average productivity
1 2 3 4 5 6 7 8 K.V.K. INDORE [N.G.O.] Agronomical Crops Cereals
1 Wheat Kg/ha 3294.00 3993.22 +21.23 2698.00 1867.00 2 Paddy Kg/ha - - - 667.00 1058.00 3 Maize Kg/ha 1688.00 2344.00 +38.86 1525.00 2072.00 4 Jowar Kg/ha 738.00 1806.75 +144.82 1354.00 1342.00 Pulses 5 Gram Kg/ha 1005.00 1093.89 +8.84 920.00 932.00 6 Arhar Kg/ha 1038.00 1542.80 +48.63 656.00 825.00 7 Lentil Kg/ha - 1005.00 - 361.00 506.00 Oil Seeds 8 Soybean Kg/ha 1091.00 1180.22 +8.18 1070.00 1132.00 9 Mustard Kg/ha - 1700.00 - 925.00 1009.00 10 Linseed Kg/ha - - - 800.00 452.00
Horticul ture Crops 11 Potato Q/ha 197.00 284.50 +44.41 N.A. N.A. 12 Onion Q/ha 197.00 261.67 +32.83 N.A. N.A. 13 Tomato Q/ha 164.00 228.13 +39.10 N.A. N.A. 14 Brinjal Q/ha 183.00 220.63 +20.56 N.A. N.A. 15 Chilly Q/ha - 252.50 - N.A. N.A. 16 Bhindi Q/ha 100.00 162.50 +62.50 N.A. N.A. 17 Cucerbits Q/ha 85.00 - N.A. N.A. 18 Spices Q/ha - - N.A. N.A. 19 Papaya Q/ha - - N.A. N.A. 20 Citrus Q/ha - - N.A. N.A.

604
Table No. 10.1 [Contd…] [Farm Activities – Agriculture Production] Sl. No.
Name of the K.V.K., Host orgnisation,
Item of performance
Unit Control Village
Adopted and cluster village Vocational Training [Average]
Percentage varieties over col. 4 (+) (-)
Distt. Average
productivity
State average
productivity 1 2 3 4 5 6 7 8
K.V.K. CHHINDWARA, J.N.K.V.V., JABALPUR Agronomical Crops Cereals
1 Wheat Kg/ha 3850.00 4014.00 +4.26 2096.00 1867.00 2 Paddy Kg/ha 2200.00 2433.00 +10.59 914.00 1058.00 3 Maize Kg/ha 2264.00 2287.00 +1.02 2949.00 2072.00 4 Jowar Kg/ha 1045.00 1097.00 +4.98 986.00 1342.00 Pulses 5 Gram Kg/ha 1500.00 2087.00 +39.13 1344.00 932.00 6 Arhar Kg/ha 1200.00 1455.00 +18.75 1679.00 825.00 7 Lentil Kg/ha 750.00 761.00 +1.47 434.00 506.00 Oil Seeds 8 Soybean Kg/ha 1569.00 2198.00 +40.09 1464.00 1132.00 9 Mustard Kg/ha 1000.00 1521.00 +52.10 714.00 1009.00 10 Linseed Kg/ha 1000.00 2486.00 +148.60 534.00 452.00
Horticulture Crops 11 Potato Q/ha 287.00 316.00 +8.72 N.A. N.A. 12 Onion Q/ha 203.00 252.00 +24.14 N.A. N.A. 13 Tomato Q/ha 219.00 228.00 +4.11 N.A. N.A. 14 Brinjal Q/ha 240.00 247.00 +2.92 N.A. N.A. 15 Chilly Q/ha 176.00 183.00 +3.98 N.A. N.A. 16 Bhindi Q/ha 100.00 155.00 +5.00 N.A. N.A. 17 Cucerbits Q/ha - 142.00 - N.A. N.A. 18 Spices Q/ha 100.00 130.00 +30.00 N.A. N.A. 19 Papaya Q/ha 120.00 198.00 +65.00 N.A. N.A. 20 Citrus Q/ha - 148.00 - N.A. N.A.
J.N.K.V.V. : Jawaharlal Nehru Krishi Vishwa Vidyalaya
Table No. 10.1 [Contd…] [Farm Activities – Agriculture Production] Sl. No
Name of the K.V.K., Host orgnisation,
Item of performance
Unit Control Village
Adopted and cluster village Vocational Training [Average]
Percentage varieties over col. 4 (+) (-)
Distt. Average
productivity
State average
productivity 1 2 3 4 5 6 7 8
K.V.K. SHAHDOL, J.N.K.V.V., JABALPUR Agronomical Crops Cereals 1 Wheat Kg/ha 3033.00 3213.67 +5.96 771.00 1867.00 2 Paddy Kg/ha 2291.00 2303.00 +0.52 997.00 1058.00 3 Maize Kg/ha 1417.00 1456.00 +2.75 1299.00 2072.00 4 Jowar Kg/ha 533.00 850.00 +59.47 1134.00 1342.00 Pulses 5 Gram Kg/ha 900.00 2300.89 +155.56 452.00 932.00 6 Arhar Kg/ha 800.00 1022.56 +27.82 567.00 825.00 7 Lentil Kg/ha - 700.00 - 439.00 506.00 Oil Seeds 8 Soybean Kg/ha - - - 509.00 1132.00 9 Mustard Kg/ha 733.00 819.00 +11.77 315.00 1009.00 10 Linseed Kg/ha - - - 295.00 452.00 Horticulture Crops 11 Potato Q/ha - 216.20 - N.A. N.A. 12 Onion Q/ha 200.00 248.33 +24.17 N.A. N.A. 13 Tomato Q/ha 170.00 187.88 +10.52 N.A. N.A. 14 Brinjal Q/ha 180.00 271.44 +50.80 N.A. N.A. 15 Chilly Q/ha - 185.14 - N.A. N.A. 16 Bhindi Q/ha - 163.33 - N.A. N.A. 17 Cucerbits Q/ha - 190.00 - N.A. N.A.
J.N.K.V.V. : Jawaharlal Nehru Krishi Vishwa Vidyalaya

605
Table No. 10.1 [Contd…] [Farm Activities – Agriculture Production] Sl. No.
Name of the K.V.K., Host orgnisation,
Item of performance
Unit Control Village
Adopted and cluster village Vocational Training [Average]
Percentage varieties over col. 4 (+) (-)
Distt. Average
productivity
State average
productivity 1 2 3 4 5 6 7 8
K.V.K. TIKAMGARH, J.N.K.V.V., JABALPUR Agronomical Crops Cereals
1 Wheat Kg/ha 4060.00 4176.33 +2.86 2162.00 1867.00 2 Paddy Kg/ha 3240.00 3418.67 +5.51 887.00 1058.00 3 Maize Kg/ha 2028.00 2034.00 +0.33 1226.00 2072.00 4 Jowar Kg/ha - 1393.43 - 1379.00 1342.00 Pulses 5 Gram Kg/ha 1800.00 2448.33 +36.02 1473.00 932.00 6 Arhar Kg/ha 1629.00 1688.67 +3.50 1582.00 825.00 7 Lentil Kg/ha 1500.00 1550.20 +3.35 576.00 506.00 Oil Seeds 8 Soybean Kg/ha 1970.00 2945.75 +49.53 1462.00 1132.00 9 Mustard Kg/ha 1606.00 1635.63 +1.84 567.00 1009.00 10 Linseed Kg/ha 3000.00 3001.00 +0.03 468.00 452.00
Horticulture Crops 11 Potato Q/ha 240.00 242.33 +0.97 N.A. N.A. 12 Onion Q/ha 179.00 184.25 +2.93 N.A. N.A. 13 Tomato Q/ha 210.00 218.78 +4.18 N.A. N.A. 14 Brinjal Q/ha 200.00 273.38 +36.69 N.A. N.A. 15 Chilly Q/ha 210.00 212.22 +36.49 N.A. N.A. 16 Bhindi Q/ha 87.00 163.63 +131.72 N.A. N.A. 17 Cucerbits Q/ha - - - N.A. N.A. 18 Spices Q/ha - - - N.A. N.A. 19 Papaya Q/ha - 105.00 - N.A. N.A. 20 Citrus Q/ha - - - N.A. N.A.
J.N.K.V.V. : Jawaharlal Nehru Krishi Vishwa Vidyalaya
Table No. 10.1 [Contd…] [Farm Activities – Agriculture Production] Sl. No.
Name of the K.V.K., Host orgnisation, Item
of performance
Unit Control Village
Adopted and cluster village Vocational Training [Average]
Percentage varieties over col. 4 (+) (-)
Distt. Average productivity
State average productivity
1 2 3 4 5 6 7 8 K.V.K., CENTRAL INSTITUTE OF AGRICULTURE ENGINEERING, BHOPAL Agronomical Crops Cereals
1 Wheat Kg/ha 1971.00 2076.00 +5.33 1837.00 1867.00 2 Paddy Kg/ha 576.00 700.00 +21.53 727.00 1058.00 3 Maize Kg/ha 1492.00 1975.00 +32.37 1566.00 2072.00 4 Jowar Kg/ha 596.00 1002.00 +68.12 1216.00 1342.00 Pulses 5 Gram Kg/ha 1059.00 1252.00 +18.22 1002.00 932.00 6 Arhar Kg/ha 1115.00 1455.00 +30.49 550.00 825.00 7 Lentil Kg/ha 811.00 1003.00 +23.67 484.00 506.00 Oil Seeds 8 Soybean Kg/ha 1127.00 1156.00 +2.57 1076.00 1132.00 9 Mustard Kg/ha 857.00 1216.00 +41.89 818.00 1009.00 10 Linseed Kg/ha 457.00 - - 781.00 452.00
Horticulture Crops 11 Potato Q/ha 100.00 181.00 +81.00 N.A. N.A. 12 Onion Q/ha - 151.67 - N.A. N.A. 13 Tomato Q/ha - 178.44 - N.A. N.A. 14 Brinjal Q/ha 100.00 197.00 +97.00 N.A. N.A. 15 Chilly Q/ha 160.00 201.00 +25.63 N.A. N.A. 16 Bhindi Q/ha 50.00 113.00 126.00 N.A. N.A. 17 Cucerbits Q/ha - 127.75 - N.A. N.A. 18 Spices Q/ha - - - N.A. N.A. 19 Papaya Q/ha - 200.50 - N.A. N.A. 20 Citrus Q/ha - 30.00 - N.A. N.A.

606
FARM ACTIVITIES–AGRICULTURE PRODUCTION–K.V.K. SATNA, RUN BY AN N.G.O. 10.4 Compared to control village the per-hectare yield of all the crops is higher in adopted and cluster
villages [except for arhar crop where a reverse trend is true]. The percentage increase is maximum for Bhindi crop [110.94 percent] and minimum for Gram [0.92 percent].
10.5 For all the agronomical crops under report, the per-hectare yield in adopted and cluster villages is
higher than district and state average productivity [except for the maize crop where State level productivity is higher].
10.6 Viewed from the basic agriculture related indicator of percentage of gross irrigated area to gross cropped area which is only 7.19 percent in all the identified 10 villages covered under the study [much lower than district average of 23.27 percent and state average of 28.54 percent] the enhanced yield per hectare in adopted and cluster villages is a valuable contribution doubly justifying the positive role of K.V.K. functionaries.
10.7 The above analysis clearly indicates the impact of the efforts of the K.V.Ks. intervention
through transfer of technology for enhancing yield rates of both agronomical and horticultural crops.
FARM ACTIVITIES–AGRICULTURE PRODUCTION–K.V.K. INDORE RUN BY AN N.G.O. 10.8 Similar to K.V.K. Satna, in Indore K.V.K. also per hectare yield of all the agronomical and
horticulture crops is higher in adopted and cluster villages in after training situations as compared to yield rates prevailing in control village where there is no intervention of K.V.K. The percentage increase ranged between maximum of 144.82 for Jowar crop to minimum of 8.18 for Soybean. Among horticulture crops the impact of K.V.Ks. effort is laudable for Bhindi where percentage increase in per-hectare yield is 62.50 as compared to the per-hectare yield of control village.
10.9 For all the agronomical crops, the per-hectare yield prevailing in adopted and cluster villages in after
training situations is much higher than the average productivities in vogue at both district and State levels.
10.10 The above performance in all the ten identified villages covered under the study is supported by
availability of irrigation facilities as the percentage of gross irrigated area to gross cropped area is 54.23, much higher than the district average of 36.70 percent and State average of 28.54 percent.
10.11 From the aforesaid analysis the positive impact of the efforts of the K.V.K. over crop
production may safely be concluded. FARM ACTIVITIES – AGRICULTURE PRODUCTION – K.V.K. CHHINDWARA RUN BY JAWAHARLAL NEHRU KRISHI VISHWA VIDYALAYA [J.N.K.V.V.], JABALPUR 10.12 The above table shows a status of enhanced productivity relating to all agronomical and horticulture
crops in adopted and cluster villages in after training situations as compared to the crop productivities prevailing in control village. The percentage increase in productivity is highest for Linseed [148.60 percent] and lowest for Maize [1.02 percent]. One of the remarkable features of the K.V.K. Chhindwara is the awareness of the cultivators about value of horticulture crops as is evident from the fact that vocational trainings have been organised for almost all the crops with substantial percentage enhancement in productivities of Spices and Papaya crops as compared to the productivity status of control village.
10.13 For all the agronomical crops, in general, the per-hectare yield in adopted and cluster villages in after
training situations, is higher than average productivities both at district and State levels except for the crops like Maize and Arhar where the district average productivities are more than adopted and cluster villages.

607
10.14 One of the important contributory factors for enhanced crop productivity is the availability of
irrigation sources as the percentage of gross irrigated area to gross cropped area is 35.76 for all the ten number of villages identified for the study, which is more than the district and State average figures of 22.51 percent and 28.54 percent respectively.
10.15 Viewing things from crop productivity angle, in which culminates all the efforts regarding
improved agriculture practices including technology transfer, the positive impact of the efforts of the K.V.K. is evident.
FARM ACTIVITIES – AGRICULTURE PRODUCTION – K.V.K. SHAHDOL RUN BY JAWAHARLAL NEHRU KRISHI VISHWA VIDYALAYA [J.N.K.V.V.], JABALPUR 10.16 The basic fact revealed by the above table is that for all the crops under report, for which vocational
training programmes have been organised, the per-hectare yield for adopted and cluster villages in after training situations is higher than those prevailing in control village with percentage increase variation of 0.52 for Paddy to 155.56 for Gram. Regarding horticulture crops which is gradually picking-up in K.V.K. Shahdol, the performance for Brinjal crop is encouraging with enhancement of 50.80 percent in per-hectare yield in adopted and cluster villages having direct intervention of K.V.K. compared to control village, in after training conditions.
10.17 Except for the Jowar crop for which average productivity both at district and State levels is higher
than per-hectare yield prevailing in adopted and cluster villages in after training situations, for rest of the crops, in general, the per hectare yield for adopted and cluster villages is higher than the average productivities in vogue for both district and State levels.
10.18 Since the percentage of gross irrigated area to gross cropped area is only 3.90 for all the ten villages
covered under the study, the efforts to enhance the agricultural productivity by the personnel of K.V.K., Shahdol against such depleted irrigation facility is laudable.
10.19 It hardly needs any reiteration to say that the impact of K.V.Ks. efforts for enhancing agriculture
production is impressive. FARM ACTIVITIES – AGRICULTURE PRODUCTION – K.V.K. TIKAMGARH RUN BY JAWAHARLAL NEHRU KRISHI VISHWA VIDYALAYA [J.N.K.V.V.], JABALPUR 10.20 Like other K.V.Ks. as detailed-out in foregoing paragraphs, the yield per-hectare in adopted and
cluster villages of K.V.K. Tikamgarh in after training conditions, as a result of vocational training, is more than the yield rates prevailing in control village for all the agronomical and horticulture crops. The percentage increase in yield rates for adopted and cluster villages in after training situations as compared to yield rates prevailing in control village ranged between 0.33 for Maize crop to 131.72 for Bhindi crop. However, substantial percentage increase in per-hectare yield of crops like Gram, Soybean, Brinjal and Chilly is also seen.
10.21 For all the agronomical crops [except Maize where average productivity at State level is more than
per hectare yield of adopted and cluster villages] the per hectare yield prevailing in adopted and cluster villages in after training situation is more than the average productivity prevailing at district and State levels.
10.22 The fair performance in agriculture production is also supported by availability of irrigational
facilities as the percentage of gross irrigated area to gross cropped area is 64.20 for all the identified ten number of villages covered under the study which is much above the district average of 53.56 percent and state average of 28.54 percent.
10.23 The conclusion that can be drawn from the above narration is that in the field of agriculture
production the impact of K.V.Ks. effort is fairly satisfactory.

608
FARM ACTIVITIES – AGRICULTURE PRODUCTION – K.V.K. BHOPAL RUN BY CENTRAL INSTITUTE OF AGRICULTURE ENGINEERING, GOVT. OF INDIA 10.24 In case of K.V.K., Bhopal also the per-hectare yield of all the agronomical and horticulture crops
under report is higher for adopted and cluster villages as compared to yield rates of control village in after training situations. The percentage increase in yield varied between 2.57 for Soybean crop to 126.00 for Bhindi crop. Particularly for horticulture crops the percentage increase in productivity in adopted and cluster villages as compared to control village is remarkable.
10.25 For most of the agronomical crops like Wheat, Gram, Arhar, Lentil Soybean and Mustard the per-
hectare yield prevailing in adopted and cluster villages in after training situations is higher than average productivity prevailing at district and State levels.
10.26 One of the contributory factors for fair performance in the sphere of agriculture production is the high
percentage of gross irrigated area to gross cropped area which is 37.18 for ten identified villages more than the district average of 33.19 percent and State average of 28.54 percent.
10.27 The above analysis clearly indicates the impact of the efforts of the K.V.K’s. intervention
through transfer of technology for enhancing yield rates of both agronomical and horticultural crops.
10.28 In what follows an attempt has been made to present a comparative analysis of percentage increase in
per-hectare yield over the six K.V.Ks. in tabular form.
Table No. 10.2 Comparative Information Regarding Percentage Increase in Per Hectare Yield in Adopted and Cluster
Villages Compared to Control Village K.V.K. wise percentage increase in per-hectare yield of crops Sl.
No. Name of the
Crop K.V.K. Satna
N.G.O.
K.V.K. Indore N.G.O.
K.V.K. Chhindwara J.N.K.V.V.
K.V.K. Shahdol
J.N.K.V.V.
K.V.K. Tikamgarh J.N.K.V.V.
K.V.K. Bhopal CIAE, GoI
1 2 3 4 5 6 7 8 AGRONOMICAL CROPS Cereals
1 Wheat 6.44 21.23 4.26 5.96 2.86 5.33 2 Paddy 26.40 - 10.59 0.52 5.51 21.53 3 Maize 13.06 38.86 1.02 2.75 0.33 32.37 4 Jowar - 144.82 4.98 59.47 - 68.12 Pulses 5 Gram 0.92 8.84 39.13 155.56 36.02 18.22 6 Arhar 9.59 48.63 18.75 27.82 3.50 30.49 7 Lentil - - 1.47 - 3.35 23.67 Oil Seeds 8 Soybean - 8.18 40.09 - 49.53 2.57 9 Mustard 35.73 - 52.10 11.77 1.84 41.89 10 Linseed - - 148.60 - 0.03 -
HORTICULTURE CROPS 11 Potato 13.67 44.42 8.72 - 0.97 81.00 12 Onion 52.66 32.83 24.14 24.17 2.93 - 13 Tomato 84.88 39.10 4.11 10.52 4.18 - 14 Brinjal 31.17 20.56 2.92 50.80 36.69 97.00 15 Chilly 110.94 - 3.98 - 36.49 25.63 16 Bhindi 152.80 62.50 5.00 - 131.72 126.00 17 Cucerbits - - - - - - 18 Spices - - 30.00 - - - 19 Papaya - - 65.00 - - - 20 Citrus - - - - -

609
10.29 The above table shows that out of total of maximum of 18 number of crops for which vocational trainings have been organised, for 8 number of crops viz Paddy, Maize, Jowar, Arhar, Potato, Onion, Tomato, Chilly and Bhindi the percentage increase in per- hectare yield is higher in K.V.Ks. [Satna, Indore] run by the N.G.Os. while for four number of crops viz Wheat, Gram, Mustard and Linseed the performance of K.V.Ks. Chhindwara, Shahdol and Timamgarh run by J.N.K.V.V., Jabalpur is comparatively better. For four number of crops viz. Maize, Lentil, Potato and Brinjal the percentage increase in per-hectare yield in adopted and cluster villages as compared to control village for K.V.K., Bhopal run by C.I.A.E., GoI is better. The overall performance of K.V.Ks. run by N.G.Os. is thus comparatively better so for the percentage yield per-hectare is concerned.
IMPACT OVER FARM ACTIVITIES – OTHER THAN AGRICULTURE PRODUCTION 10.30 In what follows an attempt has been made to analyse the following functions performed by the
K.V.Ks. which support the farm activities :- - Agro Forestry - Organic Farming - Watershed Activities 10.31 These activities are supposed to be performed by the K.V.Ks. as a part of their mandate. 10.32 For this purpose also vocational training efforts have been taken into consideration as the response to such trainings is maximum. Moreover, since the results of front line demonstrations and on- farm testing are not in much variation with the results of vocational training, it has been felt appropriate to take the results of vocational training for wrap-up purposes. 10.34 For the sake of analysis, adopted and cluster villages have been taken, in the performance categories
of Before Training [B.T.] and After Training [A.T.] conditions. Before Training conditions may be taken as conditions prevailing in control villages as in control villages such activities are generally missing. However a comparison between B.T. and A.T. situations will show the impact of K.V.Ks. effort.
10.35 The table below shows the details;
Table No. 10.3 Farm Activities – Other than Agriculture Production
Vocational Training Adopted Villages Cluster Villages
Sl. No.
Name of the KVK, Host Organisation Item of performance
BT AT Percentage increase over B.T.
BT AT Percentage increase over B.T.
1 2 3 4 5 6 7 8 1 On Farm Plantation (Hec.) - - - - - - 2 Preparation of farm yard manures - - - - - - 3 Compost of NADEP - 858 - - - - 4 Bio-fertilizer 0 360 858 - 498 85850% 5 Bio-pesticide - - - - - - 6 Nallah bunding - - - - - - 7 Check dams - - - - - - 8 Counter trenches - - - - - - 9 Soak pits - - - - - - 10 Farm ponds - - - - - -
B.T. = Before Training, A.T. After Training

610
Table No. 10.3 [Contd…] Farm Activities – Other than Agriculture Production
Vocational Training Adopted Villages Cluster Villages
Sl. No.
Name of the KVK, Host Organisation Item of
performance
Unit
BT AT Percentage increase over B.T.
BT AT Percentage increase over B.T.
1 2 3 4 5 6 7 8 9 K.V.K. Indore [N.G.O.] AGRO-FORESTRY
1 On Farm Plantation Hect. - - - - - - ORGANIC FARMING
2 Preparation of farm yard manures Kg. 0 6 - - - - 3 Compost of NADEP No. - 5 600 - 1 - 4 Bio-fertilizer Kg. - - - - - - 5 Bio-pesticide Liter - - - - 8 -
WATERSHED ACTIVITIES 6 Nallah bunding No. - - - - - - 7 Check dams No. - - - - - - 8 Counter trenches No. - - - - - - 9 Soak pits No. - - - - - - 10 Farm ponds No. - - - - - -
B.T. = Before Training, A.T. After Training
Table No. 10.3 [Contd…]
Farm Activities – Other than Agriculture Production Vocational Training
Adopted Villages Cluster Villages Sl. No.
Name of the KVK, Host Organisation Item of performance
Unit
BT AT Percentage increase over B.T.
BT AT Percentage increase over B.T.
1 2 3 4 5 6 7 8 9 K.V.K. Chhindwara, J.N.K.V.V. AGRO-FORESTRY
1 On Farm Plantation Hect. - 5 - - - - ORGANIC FARMING
2 Preparation of farm yard manures Kg. - - - - - - 3 Compost of NADEP No. - 17 - 1 11 1000.00 4 Bio-fertilizer Kg. - 880 - 50 4270 8440.00 5 Bio-pesticide Liter - - - 70 550 685.71
WATERSHED ACTIVITIES 6 Nallah bunding No. - - - - - - 7 Check dams No. - - - - - - 8 Counter trenches No. - - - - - - 9 Soak pits No. - - - - - - 10 Farm ponds No. - - - - - -
B.T. = Before Training, A.T. After Training

611
Table No. 10.3 [Contd…] Farm Activities – Other than Agriculture Production
Vocational Training Adopted Villages Cluster Villages
Sl. No.
Name of the KVK, Host Organisation Item of performance
Unit
BT AT Percentage increase over B.T.
BT AT Percentage increase over B.T.
1 2 3 4 5 6 7 8 9 K.V.K. Shahdol, J.N.K.V.V., JABALPUR AGRO-FORESTRY
1 On Farm Plantation Hect. - - - - - - ORGANIC FARMING
2 Preparation of farm yard manures Kg. - - - - - - 3 Compost of NADEP No. - - - - - - 4 Bio-fertilizer Kg. 40 415 937.50 - 225 - 5 Bio-pesticide Liter - - - - - -
WATERSHED ACTIVITIES 6 Nallah bunding No. - - - - - - 7 Check dams No. - - - - - - 8 Counter trenches No. - - - - - - 9 Soak pits No. - - - - - - 10 Farm ponds No. - - - - - -
B.T. = Before Training, A.T. After Training
Table No. 10.3 [Contd…] Farm Activities – Other than Agriculture Production
Vocational Training Adopted Villages Cluster Villages
Sl. No.
Name of the KVK, Host Organisation Item of performance
Unit
BT AT Percentage increase over B.T.
BT AT Percentage increase over B.T.
1 2 3 4 5 6 7 8 9 K.V.K. Tikamgarh, J.N.K.V.V. JABALPUR AGRO-FORESTRY
1 On Farm Plantation Hect. - - - - - - ORGANIC FARMING
2 Preparation of farm yard manures Kg. - - - - - - 3 Compost of NADEP No. - - - - - - 4 Bio-fertilizer Kg. - 1870 - - 1675 - 5 Bio-pesticide Liter 11 201 1727.27 - 19 -
WATERSHED ACTIVITIES 6 Nallah bunding No. - - - - - - 7 Check dams No. - - - - - - 8 Counter trenches No. - - - - - - 9 Soak pits No. - - - - - - 10 Farm ponds No. - - - - - -
B.T. = Before Training, A.T. After Training

612
Table No. 10.3 [Contd…] Farm Activities – Other than Agriculture Production
Vocational Training Adopted Villages Cluster Villages
Sl. No.
Name of the KVK, Host Organisation Item of performance
Unit
BT AT Percentage increase over B.T.
BT AT Percentage increase over B.T.
1 2 3 4 5 6 7 8 9 K.V.K. Bhopal, C.I.A.E., GOI AGRO-FORESTRY
1 On Farm Plantation Hect. 15 25 66.67 4 39 875.00 ORGANIC FARMING
2 Preparation of farm yard manures Kg. - - - - - - 3 Compost of NADEP No. - - - - - - 4 Bio-fertilizer Kg. - - - - - - 5 Bio-pesticide Liter - - - - - -
WATERSHED ACTIVITIES 6 Nallah bunding No. - - - - - - 7 Check dams No. - - - - - - 8 Counter trenches No. - - - - - - 9 Soak pits No. 6 227 3683.33 6 154 2466.67 10 Farm ponds No. - - - - - -
B.T. = Before Training, A.T. After Training FARM ACTIVITIES – OTHER THAN AGRICULTURE PRODUCTION – K.V.K. SATNA RUN BY AN N.G.O. 10.38 The information contained in the above table shows that in the category of organic farming, vocational
training regarding preparation of bio-fertilizer has been organised in the sample adopted and cluster villages with preparation of 360 and 498 kgs of bio- fertilizer in adopted and cluster villages respectively in A.T. situations with nil production in B.T. situations. The impact of the K.V.Ks. effort is obvious, though on a very limited scale.
FARM ACTIVITIES – OTHER THAN AGRICULTURE PRODUCTION – K.V.K. INDORE RUN BY AN N.G.O. 10.39 Here again the vocational trainings have been organised for preparation of compost by NADEP
method and bio-fertilizer with nil performance in B.T. situations. However, physical performance in AT situation is marginal as 5 and 1 number of compost pits have been constructed in adopted and cluster villages respectively and 8 liters of bio-pesticide have been prepared in cluster villages. The marginal impact of the K.V.Ks. effort is obviously visible.
FARM ACTIVITIES – OTHER THAN AGRICULTURE PRODUCTION – K.V.K. CHHINDWARA RUN BY J.N.K.V.V., JABALPUR 10.40 In the category of agro-forestry, vocational trainings have been organised for on farm plantation by
K.V.K. Chhindwara with five hectare of area covered under it in adopted villages as a result of imparting vocational training. The performance in cluster villages is nil along with nil performance in B.T. situations for both adopted and cluster villages.
10.41 Regarding Organic farming, 17 number of NADEP pits have been constructed in adopted villages in
AT situation as against nil performance in B.T. conditions. In cluster villages 11 number of such pits have been constructed in A.T. conditions as against only one pit in B.T. conditions. Similarly for bio-fertilizer 880 kgs have been produced in AT conditions against nil performance in B.T. situation for adopted villages, while for cluster villages the preparation of 4270 kgs of bio-fertilizer in after training situation as compared to preparation of only 50 kgs in B.T. situation is a definite indication of the impact of the K.V.Ks. efforts. Regarding bio-pesticide the preparation 550 liters in cluster

613
villages in A.T. situations as against preparation of 70 liters of bio-fertilizer in B.T. conditions is definite indication of the impact of K.V.Ks. efforts through imparting vocational training.
10.42 Since no vocational trainings have been organised for watershed activities the impact of this
activity is nil as revealed by the results of the survey. FARM ACTIVITIES – OTHER THAN AGRICULTURE PRODUCTION – K.V.K. SHAHDOL RUN BY J.N.K.V.V., JABALPUR 10.43 In case of K.V.K. Shahdol, vocational trainings have been organised for preparation of bio-fertilizer
falling in the category of organic farming with production of 415 kgs of bio-fertilizer in adopted villages in after training conditions as compared to 40 kgs in B.T. situations while for cluster villages the production is 225 kg in after training conditions with nil production B.T. situations. The impact of the K.V.Ks. effort is visible in limited scale.
10.44 Since no vocational trainings have been organised on subjects like agro-forestry and watershed
activities the impact of such activities will not be visible. FARM ACTIVITIES – OTHER THAN AGRICULTURE PRODUCTION – K.V.K. TIKAMGARH RUN BY J.N.K.V.V., JABALPUR 10.45 In case of K.V.K. Shahdol, vocational trainings have been organised for preparation of bio-fertilizer
and bio-pesticide. Regarding bio-fertilizer 1870 kg and 1675 kg of production occurred in after training conditions for adopted and cluster village respectively with nil performance in before training situations. Similarly for bio- pesticide 201 liter and 19 liter of production has been accomplished in after training conditions for adopted and cluster villages respectively.
FARM ACTIVITIES – OTHER THAN AGRICULTURE PRODUCTION – K.V.K. BHOPAL RUN BY CENTRAL INSTITUTE OF AGRICULTURE ENGINEERING, GOI 10.46 Regarding on farm plantation covered under the category of agro-forestry the performance in A.T.
conditions is better for adopted and cluster villages as the physical performance is 25 hectare and 39 hectare respectively as against 15 hectare and 4 hectare respectively in B.T. conditions.
10.47 Regarding construction of soak-pits covered under the category of watershed activity, the
performance in after training conditions is remarkable in both adopted and cluster villages as 227 and 154 number of soak-pits respectively have been constructed against the 6 and 6 number of soak-pits respectively constructed in B.T. conditions.
10.48 In what follows an attempt has been made to present a summary table incorporating the information
regarding B.T., A.T. situations of all the six K.V.Ks. to have a bird eye view of the activities other than agriculture production. Normally the figures pertaining to adopted villages have been taken as there is not much difference in performance between adopted and cluster villages with almost covering identical subjects.

614
Table No. 10.4
Summary Table Regarding Activities other than Agriculture Production in Before Training and After Training Conditions
K.V.K. Satna [NGO] K.V.K. Indore [NGO] K.V.K. Chhindwara J.N.K.V.V.
Sl. No.
Item Unit
BT AT % increase
BT AT % increase
BT AT % increase
1 2 3 4 5 6 7 8 9 10 11 12 AGRO-FORESTRY
1 On Farm Plantation Hect - 5 - ORGANIC FARMING
2 Preparation of farm yard manure
Kg. 5
3 Compost by NADEP No. - 5 - - 17 - 4 Bio-fertilizer Kg. - 360 - - 880 - 5 Bio-pesticide Ltr. - 8 - 70 550 685.71
WATERSHED ACTIVITIES 6 Nallah bunding No. 7 Check dams No. 8 Counter trenches No. 9 Soak pits No. 10 Farm Ponds No.
Table No. 10.4 [Contd…] Summary Table Regarding Activities other than Agriculture Production in Before Training and After
Training Conditions K.V.K. Shahdol
[J.N.K.V.V.] K.V.K. Tikamgarh
[J.N.K.V.V.] K.V.K. Bhopal [CIAE, GOI]
Sl. No.
Item Unit
BT AT % increase
BT AT % increase
BT AT % increase
1 2 3 13 14 15 16 17 18 19 20 21 AGRO-FORESTRY
1 On Farm Plantation Hect 15 25 66.67 ORGANIC FARMING
2 Preparation of farm yard manure
Kg.
3 Compost by NADEP No. 4 Bio-fertilizer Kg. 48 415 937.50 - 1870 - 5 Bio-pesticide Ltr. 11 201 1727.27
WATERSHED ACTIVITIES 6 Nallah bunding No. 7 Check dams No. 8 Counter trenches No. 9 Soak pits No. 6 227 3683.33 10 Farm Ponds No.
10.49 The above table clearly shows that in our area of study, compared to agriculture production the
number of vocational trainings organised for subjects other than agriculture production is almost sketchy. One of the basic reasons is the concentrated interest of the farming communities to enhance agriculture production without tying up of funds in activities other than agriculture. Moreover, the nature of vocational training for subjects referred above is suggestive, the acceptance of which by participating cultivators is mainly dependent on resource availability. A normal cultivator with average size of holding hardly have any inclination for taking up any watershed activity or agro- forestry as their basic interest lies in enhancement in agriculture production.

615
10.50 However, the performance regarding bio-fertilizer and bio-pesticide is encouraging as the results of after training situation is impressive, though on limited scale. The only silver lining lies in the fact that cultivators of sample area have started understanding the value of the use of bio-fertilizer and bio-pesticide against the hazards of excessive chemical fertilization. The things are, really, picking-up.
IMPACT OVER NON-FARMING ACTIVITIES 10.51 Non-farming activities are important for any rural economy for their immense potentiality in creating
employment opportunities, augmentation of income, thereby reducing pressure on land. Most of the target oriented welfare programmes of the government are related to non-farm activities, encouraging the rural population to take-up other activities, even on marginal basis for enhancement in family income. Because of these reasons the K.V.K. personnel are required to hold training to boost-up non-farming activities in the villages. The table below shows the details;
Table No. 10.5
Non Farm Activities Vocational Training
Adopted Villages Cluster Villages Sl. No.
Name of the KVK, Host Organisation Item of
performance
Unit
BT AT Percentage increase over B.T.
BT AT Percentage increase over B.T.
1 2 3 4 5 6 7 8 9 K.V.K. Satna, N.G.O. LIVESTOCK AND DAIRYING
1 Improved breed No. - - - - - - 2 Milk production Liters - - - - - - 3 Artificial insemination No. - - - - - - 4 Vaccination No. - - - - - -
POULTRY 5 Improved breed No. - 38 - - - - 6 Broilers No. - - - - - - 7 Egg production No. - - - - - - 8 Vaccination No. 21 4 -80.95 - - -
FISHERY DEVELOPMENT 9 Fish seed production Qntl. - - - - - - 10 Fish production Qntl. - - - - - -
HOME SCIENCE 11 Toy making No. - - - - - - 12 Pickles Kg. 5 107 2040 17 174 923.53 13 Bakery Kg. - 3 - - - - 14 Jute items No. - - - - - - 15 Papad/Bari/Jam/Jelly Kg. - 40 - - 66 -
TRAINING OF RURAL YOUTH 16 Motor binding Placement No. - - - - 1 - 17 Engine repair ” - - - - 2 - 18 Black smithy ” - - - - - - 19 Carpentry ” - - - - - - 20 Masonary ” - - - - - -
BT = Before Training, AT = After Training

616
Table No. 10.5 [Contd…] [Non Farm Activities] Vocational Training
Adopted Villages Cluster Villages Sl. No.
Name of the KVK, Host Organisation Item
of performance
Unit
BT AT Percentage increase over B.T.
BT AT Percentage increase over B.T.
1 2 3 4 5 6 7 8 9 K.V.K. Indore [N.G.O.] LIVESTOCK AND DAIRYING
1 Improved breed No. - - - - - - 2 Milk production Liters 11 17 54.55 - - - 3 Artificial insemination No. - 7 - - - - 4 Vaccination No. - 6 - - - -
POULTRY 5 Improved breed No. - - - - - - 6 Broilers No. - - - - - - 7 Egg production No. - - - - - - 8 Vaccination No. - - - - - -
FISHERY DEVELOPMENT 9 Fish seed production Qntl. - - - - - - 10 Fish production Qntl. - - - - - -
HOME SCIENCE 11 Toy making No. - - - - - - 12 Pickles Kg. 33 209 533.33 82 480 485.36 13 Bakery Kg. 4 - - 5 - - 14 Jute items No. - - - - - - 15 Papad/Bari/Jam/Jelly Kg. 3 107 3466.61 17 250 1370.51
TRAINING OF RURAL YOUTH 16 Motor binding Placement
No. - - - - - -
17 Engine repair ” - - - - - - 18 Black smithy ” - - - - - - 19 Carpentry ” - - - - - - 20 Masonary ” - - - - - -
BT = Before Training, AT = After Training Table No. 10.5 [Contd…] [Non Farm Activities]
Vocational Training Adopted Villages Cluster Villages
Sl. No.
Name of the KVK, Host Organisation
Item of performance
Unit
BT AT Percentage increase over B.T.
BT AT Percentage increase over B.T.
1 2 3 4 5 6 7 8 9 K.V.K. Chhindwara [J.N.K.V.V.] LIVESTOCK AND DAIRYING
1 Improved breed No. - 2 - - - - 2 Milk production Liters 6 21 - - - - 3 Artificial insemination No. - 2 - - - - 4 Vaccination No. - 2 - - - -
POULTRY 5 Improved breed No. - - - - - - 6 Broilers No. - - - - - - 7 Egg production No. - - - - - - 8 Vaccination No. - - - - - -
FISHERY DEVELOPMENT 9 Fish seed production Qntl. - - - - - - 10 Fish production Qntl. - - - - - -
HOME SCIENCE 11 Toy making No. - 10 - - - - 12 Pickles Kg. 47 55 17.02 47 172 265.95 13 Bakery Kg. - - - 5 - - 14 Jute items No. - - - - 3 - 15 Papad/Bari/Jam/Jelly Kg. 5 10 50.00 18 34 88.89
TRAINING OF RURAL YOUTH 16 Motor binding Placement
No. - - - - - -

617
17 Engine repair ” - - - - - - 18 Black smithy ” - - - - - - 19 Carpentry ” - - - - - - 20 Masonary ” - - - - - -
BT = Before Training, AT = After Training
Table No. 10.5 [Contd…] Non Farm Activities
Vocational Training Adopted Villages Cluster Villages
Sl. No.
Name of the KVK, Host Organisation Item of
performance
Unit
BT AT Percentage increase over B.T.
BT AT Percentage increase over B.T.
1 2 3 4 5 6 7 8 9 K.V.K. Shahdol, J.N.K.V.V. LIVESTOCK AND DAIRYING
1 Improved breed No. - - - - - - 2 Milk production Liters - - - - - - 3 Artificial insemination No. - - - - - - 4 Vaccination No. - - - - - -
POULTRY 5 Improved breed No. - - - - - - 6 Broilers No. - - - - - - 7 Egg production No. - - - - - - 8 Vaccination No. - - - - - -
FISHERY DEVELOPMENT 9 Fish seed production Qntl. - - - - - - 10 Fish production Qntl. - - - - - -
HOME SCIENCE 11 Toy making No. 4 5 25.00 - - - 12 Pickles Kg. 30 92 206.67 16 76 375.00 13 Bakery Kg. - 2 - - 4 - 14 Jute items No. - - - - - - 15 Papad/Bari/Jam/Jelly Kg. 1 21 2000.00 1 37 3600.00
TRAINING OF RURAL YOUTH 16 Motor binding Placement No. 2 3 50.00 1 2 100.00 17 Engine repair ” - - - - - - 18 Black smithy ” - - - - - - 19 Carpentry ” - - - - - - 20 Masonary ” - - - - - -
BT = Before Training, AT = After Training

618
Table No. 10.5 [Contd…]
Non Farm Activities Vocational Training
Adopted Villages Cluster Villages Sl. No.
Name of the KVK, Host Organisation Item of
performance
Unit
BT AT Percentage increase over B.T.
BT AT Percentage increase over B.T.
1 2 3 4 5 6 7 8 9 K.V.K. Tikamgarh, J.N.K.V.V. LIVESTOCK AND DAIRYING
1 Improved breed No. - 5 - - 10 - 2 Milk production Liters 13 12 7.69 19 31 63.16 3 Artificial insemination No. 8 - - - 6 - 4 Vaccination No. - - - 1 4 300.00
POULTRY 5 Improved breed No. - - - - - - 6 Broilers No. - - - - 1 - 7 Egg production No. - - - - - - 8 Vaccination No. - - - - - -
FISHERY DEVELOPMENT 9 Fish seed production Qntl. - - - - - - 10 Fish production Qntl. - - - - - -
HOME SCIENCE 11 Toy making No. - - - - 10 - 12 Pickles Kg. 57 196 243.86 89 164 84.27 13 Bakery Kg. - - - - - - 14 Jute items No. - - - - - - 15 Papad/Bari/Jam/Jelly Kg. 5 79 1480.00 20 115 475.00
TRAINING OF RURAL YOUTH 16 Motor binding Placement No. - 1 - - 2 - 17 Engine repair ” - - - 1 - - 18 Black smithy ” - - - - - - 19 Carpentry ” - - - - - - 20 Masonary ” - - - - - -
BT = Before Training, AT = After Training

619
Table No. 10.5 [Contd…]
Non Farm Activities Vocational Training
Adopted Villages Cluster Villages Sl. No.
Name of the KVK, Host Organisation Item of
performance
Unit
BT AT Percentage increase over B.T.
BT AT Percentage increase over B.T.
1 2 3 4 5 6 7 8 9 K.V.K. Bhopal [CIAE] LIVESTOCK AND DAIRYING
1 Improved breed No. - 17 - 7 26 271.63 2 Milk production Liters 14 36 157.14 48 117 143.75 3 Artificial insemination No. - 6 - 1 18 1700.00 4 Vaccination No. - 12 - 15 33 120.00
POULTRY 5 Improved breed No. - 1000 - - - - 6 Broilers No. - 1000 - - - - 7 Egg production No. - - - - - - 8 Vaccination No. - 1000 - - - -
FISHERY DEVELOPMENT 9 Fish seed production Qntl. - - - - - - 10 Fish production Qntl. - - - - - -
HOME SCIENCE 11 Toy making No. - 2 - - - - 12 Pickles Kg. 70 141 101.43 32 104 225.00 13 Bakery Kg. 54 112 107.41 2 8 300.00 14 Jute items No. - - - - - - 15 Papad/Bari/Jam/Jelly Kg. 5 98 1960 8 43 437.50
TRAINING OF RURAL YOUTH 16 Motor binding Placement No. - 6 - - 4 - 17 Engine repair ” - 2 - - 2 - 18 Black smithy ” - - - - - - 19 Carpentry ” - - - - - - 20 Masonary ” - - - - - -
BT = Before Training, AT = After Training 10.52 The sequence of tabular presentation as well as write-up are the same as adopted for Agriculture
Production. NON FARM ACTIVITIES – K.V.K., Satna, run by an N.G.O. 10.53 The above table shows that regarding poultry activities the performance is only marginal as for
improved breed only 38 number of improved variety of birds have been produced in after training situations in adopted villages while vaccination of only 4 animals have been done.
10.54 Regarding home science activities substantial physical output in seen in case of preparation of
pickles in after training situations in both adopted and cluster villages wherein percentage increase in output in after training situations is 2040.00 and 923.53 respectively.
10.55 An regards training of rural youth, one and two persons respectively have got placement in after
training situation in cluster villages pertaining to trades like motor binding and engine repairs respectively.

620
10.56 No vocational trainings on livestock and dairy and fishery have been organised with the result the impact of K.V.Ks. effort is not visible.
NON FARM ACTIVITIES – K.V.K., Indore, run by an N.G.O. 10.57 The above table shows a marginal performance in case of livestock and dairy activities wherein
milk production to the tune of 17 liters have been recorded in after training situations as compared to 11 liters in B.T. situations in adopted villages of K.V.K. Indore covered under the study. Insignificant performance is visualized in case of artificial insemination and vaccination.
10.58 Regarding home science activities substantial work has been done in case of pickles wherein
percentage increase in pickle preparation in case of A.T. situations in adopted and cluster villages is compared to B.T. situations is 533.33 and 485.36 respectively while in case of preparation of papad/bari/jam/jelly the percentage increase is 3466.61 and 1370.51 respectively.
10.59 No vocational trainings have been organised on subjects like poultry, fishery development and training of rural youth, with the result the impact of K.V.Ks. effort will not be visible. NON FARM ACTIVITIES – K.V.K., CHHINDWARA, run by J.N.K.V.V., Jabalpur 10.60 In the field of non-farm activities concentration of K.V.K.Chhindwara is more on home science
activities, particularly for the preparation of pickles and papad/bari/jam/jelly etc. where the percentage increase in physical output is, 65.95 for pickles in after training situations of cluster villages compared to B.T. situations and 88.89 for papad/bari/jam/jelly in after training situations of cluster villages compared to B.T. situations. For adopted villages also the performance regarding these products is fairly good.
10.61 The above table further reveals a sketchy performance for livestock and dairy activities with not
much tangible results. 10.62 No vocational trainings have been organised on subjects like poultry, fishery development, and
training of rural youth as revealed by the survey results. NON FARM ACTIVITIES – K.V.K., Shahdol, run by an N.G.O. 10.63 The above table shows that again in case of K.V.K., Shahdol the concentration over home
science activities is foremost specially over preparation of pickles and papad/bari/jam/jelly for which physical performance in after training conditions for both adopted and cluster villages as compared to before training conditions is fairly substantial.
10.64 Only marginal results of vocational training regarding training of rural youth is visible as in motor binding trade placements have been recorded for adopted and cluster villages. 10.65 No vocational trainings have been organised on subjects like livestock and dairying, poultry
and fishery development. NON FARM ACTIVITIES – K.V.K., TIKAMGARH, RUN BY AN J.N.K.V.V., Jabalpur 10.66 In case of K.V.K. Tikamgarh, vocational training on limited scale has been organised for
livestock and dairy activities with visible results regarding milk production and vaccination with 12 and 31 liters of milk production respectively in adopted and cluster villages in A.T. situations. The result, however is not impressive.

621
10.67 Regarding home science activities substantial work has been done in case of preparation of pickles and papad/bari/jam/jelly etc with tangible results in after training situations both for adopted and cluster villages, though on limited scale.
10.68 Regarding training of rural youth, vocational training resulting in marginal placement of one and
two persons respectively for adopted and cluster villages have been achieved for motor binding trade.
10.69 No vocational trainings have been organised for subjects like poultry and fishery. NON FARM ACTIVITIES – K.V.K., BHOPAL, RUN BY C.I.A.E., GOVT. OF INDIA 10.70 Regarding livestock and dairy, impressive results are visualized as a result of vocational training
in the fields of improved breed production, milk production and vaccination particularly in cluster villages where the physical results are far in excess in A.T. situation as compared to B.T. conditions.
10.71 In adopted villages vocational trainings have been organised for poultry activities relating to
improved breed and broiler production and vaccination with tangible results in after training situations with nil performance in B.T. conditions.
10.72 Regarding home science activities, tangible results have been achieved as a result of vocational
training, particularly for products like pickles, backery items and preparation of papad/bari/jam/jelly etc. wherein the after training results are far in excess of before training results both for adopted and cluster villages.
10.73 No vocational trainings have been organised for any of the activities relating to fishery development. 10.74 The conclusion that can be drawn from above narration is that in all the 6 number of
K.V.Ks. covered under the study the vocational trainings for home science activities have been organised with fair results. Very marginal results have been derived from vocational trainings organised for livestock and dairying that too not from all the K.V.Ks. Similar are the results of poultry and training of rural youth vocational trainings have not at all been organised or marginally organised with not much tangible results. For fishery related activities no vocational trainings have been organised for any of six K.V.Ks. covered under the study.
10.75 In the following table an attempt has been made to present the performance regarding home
science activities in summary form to facilitate a view of relative performance among all the six K.V.Ks. under study. Separate performances in the categories of adopted and cluster villages have not be given as it has already been presented in table no. 10.5. Tangible results in physical terms from adopted and cluster villages have been taken for before and after training situations.

622
Table No. 10.6 Home Science Activities – Comparative Performance Adopted/Cluster Villages
K.V.K. Satna [NGO] K.V.K. Indore [NGO]
K.V.K. Chhindwara J.N.K.V.V.
Sl. No
Item Unit
BT AT % increase
over B.T.
BT AT % increase over B.T.
BT AT % increase
over B.T.
1 2 3 4 5 6 7 8 9 10 11 12 1 Toy making No. 10 2 Pickles Kg. 17 174 923.53 82 480 485.36 47 172 265.95 3 Backery Kg. - 3 - 5 - - - - - 4 Jute items No. - - - - - - - 3 - 5 Papad/Bari/Jam/Jelly Kg. - 66 - 17 250 1370.51 18 34 88.89
Table No. 10.6 [Contd…] Home Science Activities – Comparative Performance Adopted/Cluster Villages
K.V.K. Shahdol [J.N.K.V.V.]
K.V.K. Tikamgarh [J.N.K.V.V.]
K.V.K. Bhopal [C.I.A.E., GoI]
Sl. No
Item Unit
BT AT % increase
over B.T.
BT AT % increase over B.T.
BT AT % increase
over B.T.
1 2 3 13 14 15 16 17 18 19 20 21 1 Toy making No. 4 5 25.00 10 - - 2 - 2 Pickles Kg. 30 92 206.67 57 196 243.86 32 104 225.00 3 Backery Kg. - 4 - - - - 54 112 107.41 4 Jute items No. 1 37 3600.00 - - - - - - 5 Papad/Bari/Jam/Jelly Kg. 20 115 475.80 5 98 1960.00
10.76The above table clearly shows that in activities like preparation of pickles and
papad/bari/jam/jelly the results of the vocational training are clearly visible as the persons of the sample villages have shown considerable interest in such activities. After formation of Self Help Groups in villages in Madhya Pradesh through government initiatives, have brought an awareness among the women which is evident from the fact that women are coming forward for performing economic activities for family income augmentation resulting in performance of activities like preparation of pickles, papad etc as revealed by the information contained in the above table.

623
Chapter Eleven The Recommendations
Equity and social justice being the important destinations of the Tenth Plan, the agriculture development has been viewed as the core element of growth process since the growth in this sector is likely to lead to widest spread of benefits, especially the rural poor, including agriculture labour. Also since the majority of woman workers are engaged in agriculture, investments in this sector have enormous implications for gender equality as well. K.V.Ks. being grass root institutions for transfer of agriculture and related technology covering poorest of the poor, their importance therefore, can not be over emphasized. It is, possible, that a few of the K.V.Ks. may not have come-up as per expectations but their set-backs can not be termed as failures as these institutions have to grapple with both farming and non-farming activities of every sort where the existence of regret is obvious because of poverty. The only way to improve their efficiency is to guide them, keeping in view the operational difficulties they face. In what follows an attempt has been made to list out certain recommendations based on the results of the study in the categories of; 1. Recommendations Regarding Technical Functions 2. Recommendations Regarding Administrative Functions 1. RECOMMENDATIONS REGARDING TECHNICAL FUNCTIONS - The basic mandates of the K.V.Ks. are : Vocational Training, Front Line
Demonstration and On Farm testing [We are not defining these functions as these have been defined in the main text of the report] through which agriculture and its allied services related technologies are transferred to farming communities. It has been seen during the field visits that not much logical sequence is being followed for imparting such trainings. It is therefore, recommended that vocational training normally attended by the large group of farmers may constitute the frame of the subsequent trainings i.e. from the group of persons receiving vocational training we may identify individuals on whose fields Front Line Demonstrations and On Farm Testings are to be organised. While selecting the farms, proper care must be given to incorporate large, medium, small and marginal farmers from sample communities of S.C., S.T., O.B.Cs. and others with proper selection of technologies so that farming groups of all the sections of the society are covered and benefited. May be some of the K.V.Ks. might be following such practice but a proper guide line from the I.C.A.R. will definitely stream line the procedure on uniform basis with instructions of following up functions by Zonal Coordination Officer [Z.Cs.] at least on sample basis. During the course of survey, it has been seen that a few of K.V.Ks. have not organised F.L.Ds. and O.F.Ts. in cluster group of villages which are, basically, percolating agents. It is, therefore, necessary that all the aforesaid three training programmes must be organised in both adopted and cluster group of villages to assure wide spread forward linkages of

624
such training activities. What is, therefore, required is the preparation of annual calendar of training programmes to be imparted by K.V.Ks. with proper inter linkages and may be forwarded to the respective Zonal Coordination Offices facilitating them to perform following-up of such activities. While preparing the calendar the K.V.K. scientists should take the opinion of Dy. Director Agriculture of the district so that overlapping of activities is avoided.
- The K.V.Ks. are supposed to cover the farming communities of the entire
district in terms of transfer of agriculture and its allied services related technologies. In Madhya Pradesh where an average of around 400 villages exist in every district, the entire coverage of the district by seven or eight odd technical personnel will take ages. It is, therefore, necessary to evolve a set method to cover the areas where there is no direct intervention of K.V.K. For this purpose, it would, perhaps, be desirable to organize work-shops twice in a year, at Development Block level where farmers from areas of non-intervention [preferably two representatives from each village] may participate where the farmers from adopted and cluster villages, benefited by the trainings of K.V.K. will also be present. A frank interaction between such group of farmers will certainly induce the cultivators of non-intervention area to adopt the improved practices of cultivation. Such interactions may be organised in batches where the presence of the officials of line departments of the district viz. Agriculture, Horticulture, Animal Husbandry, Fishery, Rural Development etc. will be useful. The modalities for organisation of such workshops may be sorted out by the I.C.A.R. and uniform instructions may flow from the top to be percolated to K.V.Ks. through Z.Cs.
- During the course of survey the respondents have very strongly argued for
arranging training on marketing of agricultural produce to fetch fair return of the product. For this purpose it will be worthwhile on the part of the K.V.K. personnel to organize such trainings in liaison with the Krishi Upaj Mandies which are normally located at district/tahsil headquarters. The I.C.A.R. may think it proper to include the subject of ‘Marketing of Agriculture Produce’ in the mandates of K.V.K. Suggestions have also come to introduce a subject on production of by-products of crops. Though the suggestion is important, its implementation will require processing activities requiring specific knowledge. The I.C.A.R. may keep an option with K.V.Ks. having knowledge of processing activities to arrange training on this subject.
- The survey results have clearly shown that the rate of participation in trainings
is maximum for agronomical and horticulture crops and for home science activities in which female participation is substantial for augmentation of household income. The participation in subjects like animal husbandry and

625
dairying, fisheries, agro-forestry, organic farming, training of rural youth and watershed activities is either marginal or nil, though these functions are very important for any rural economy. The survey results clearly, thus, shows that cultivators of our sample area are not very confident about activities allied to agriculture and are inclined to enhance income through direct participation in crop production. Since the activities other than agriculture production can also not be neglected what is required is prioritization of activities by each K.V.K. and arrange trainings accordingly. The priority list of the individual K.V.Ks. will differ and therefore, they should be given sufficient latitude to pursue their activities with an eye over the fact that trainings regarding animal husbandry and dairying, agro-forestry and watershed activities should not be altogether left as these are the basic supportive functions of agriculture though having low place in their priority ladder. The low response to animal husbandry and dairying is mainly due to the fact that in villages in general the milch animals are reared mainly for household requirements as higher production is constrained by road connectivity. Therefore, the villagers are usually not interested in getting training regarding animal husbandry and dairying though extremely important parameters of agricultural diversification. So what is required basically is the development of road infrastructure for development of horticulture and dairy etc the product of which are perishable in nature.
- It has been experienced over the years that land and water are the crucial
constraints on our effort to expand agriculture production. It will, therefore, be worthwhile to cover under cultivation the waste land or cultivable land excluding fallow land with non-conventional crops mainly horticultural which can be grown over such areas. The K.V.K. scientists may concentrate over this issue and organize trainings involving technologies suited for such areas. The I.C.A.R. may expand the mandates of K.V.K. to cover, particularly, the development of waste land area.
- The K.V.K. may play an important role in imparting training to Self Help
Groups particularly for subjects regarding Home Science. For this purpose also the Chief Executive Officer of Zila Panchayat may keep a track of K.V.Ks. for inviting them in such meetings.
- To intensify the spread effects of K.V.Ks efforts, an inter village interaction
on quarterly basis may be organised where the role of the K.V.K. scientists may be that of a coordinator for disseminating the technological achievements of not only K.V.K. but that of other line departments having substantial impact over efficient functioning of agriculture and its allied activities. This function may be made mandatory by the I.C.A.R. through necessary executive instructions taking into consideration the probable role of Gram Panchayat.

626
- A modal village at each Development Block level may be identified by the K.V.K. on permanent basis where the impact of all the technological advancement on the fields may be disseminated covering the efforts of K.V.K. and line departments with placement of knowledgeable person who can explain the mode of implementation of such technologies to the farming community who visit the village. A proper publicity through print and electronic media should precede before opening-up of such villages for visits of the cultivators. The I.C.A.R. may take-up the issue along with State Government for sorting out the modalities. Here again the role of the K.V.K. scientists will be that of a coordinator.
- It has been realized over the years that there exists a substantial time-lag
between creation of tested technology and its application in fields. A proper net work must, therefore, be developed for immediate flow of the contents of such technologies from the research institutes to the K.V.Ks. and line departments as well for faster implementation. The modalities in this regard may be sorted out by I.C.A.R. in consultation with research institutions.
- It has been seen during the course of survey that women are mainly engaged in
agriculture for performing manual work. The K.V.Ks. should organize special vocational training for such women workers to facilitate them in performing manual functions.
- It has been felt that the K.V.K. scientists do not have any target in physical
sense to be achieved on the basis of which their efforts can be evaluated and can be made answerable for gap in attainment of results. For this purpose, before sanctioning any new K.V.K., Development Block wise socio-economic indicators covering basic mandates of the K.V.K. may be compiled which will serve as base line data showing the socio-economic status of a Development Block at a point of time. Subsequently a Five Year Plan in annual break-ups may be prepared in consultation with Z.Cs. showing the level of targets to be achieved by the K.V.Ks. in annual break-ups. The work is complex as indices both farming and no-farming activities shall have to be prepared on the basis of availability of secondary information For this purpose the services of the N.G.Os. can be utilized for collection of base line information and preparation of Five Year Plans.
2. RECOMMENDATIONS REGARDING ADMINISTRATIVE FUNCTIONS - The budget structure of the K.V.Ks. perhaps, required to be changed by
allocation of sufficient provisions for performance of technical functions including area specific research. The share of P.O.L. also needs to be enhanced for constant contact with farming community to keep-up their level of confidence which is the most important factor for success of K.V.K. programme.

627
- Part sanction of the posts, as far as possible, be avoided. It is desirable,
therefore, to equip completely any K.V.K. at the time of its sanction, both personnel and equipment wise, so that the institution may start functioning with full vigour. A dilapidated K.V.K. sends wrong signals to the farming community who lose confidence about the organisation because of lack of timely assistance, the regaining of which is very difficult, even with every facility, subsequently provided. Moreover, since the K.V.K. has to cover the entire district, a niggardly provision in the beginning will only stagger the achievement of targeted objectives.
- At times a vaccum is created in K.V.Ks. because of sudden resignations of
technical personnel. In such cases the K.V.Ks. may be allowed to employ the personnel immediately with a clause of subject to confirmation by the Interview Board. This will immensely facilitate the continuous functioning of K.V.K. as minimum of three months are required to fill-in the posts by following laid down procedures. Till that time, if immediate appointment is not allowed, the working of any K.V.K. is awfully hampered.
- The K.V.K. scientists are supposed to function in liaison with link offices
located at district level. For this purpose, it is perhaps necessary that the K.V.K. should be a member of District Planning Committee, where the Annual/Five Yearly plan proposals are prepared for district sector schemes covering wide range of subjects including agriculture and allied activities. Since K.V.K. scientists have the feel of grass root realities, their contribution in preparing district plan proposals will be immense particularly for preparation of area specific locational plan for economic and social infrastructure. The initiative, in this case, may be mooted by I.C.A.R. by sending request to the State Government of Madhya Pradesh in Planning Department from where the instructions may flow to the district administrations.
- Any training programme pertaining to agriculture and its allied activities
organised at district level must be attended by the K.V.K. scientists to have holistic knowledge about training activities being pursued by district administration. For this purpose the line departments at district level may keep the name of the K.V.K. in their mailing list.

628
ADDENDUM
This write up has been added after the
power point presentation containing a
few recommendations of Planning
Commission.

629
IMPACT STUDY ON DEVELOPMENT OF AGRICULTURE AND ALLIED ACTIVITIES THROUGH KRISHI VIGYAN KENDRA IN MADHYA PRADESH.
Indian council of Agriculture Research introduced the concept of establishing the krishi vigyan Kendra in the rural area of the country during the fifth five Year plan. There were 18 KVK established in the country during the fifth five Year plan period and the number of KVKs increased to 261 by the end of the 1999.The number of the KVKs in Madhya Pradesh was 34 as on 2003-04. The KVKs have been introduced as per the recommendation of Dr. Mohan Sinha Mehta committees, 1974. The Planning Commission GOI have assigned a study to assess the impact of KVKs on development of the Agriculture and allied activities in Madhya Pradesh to the Centre For Rural Development and Environment (CRDE) Bhopal. The CRDE have conducted this study and submitted its report to the Planning Commission GOI in the year 2006.Further at the time of power point presentation of study report the officers of the Planning Commission GOI have suggested the CRDE to collect some additional information related to the working of these KVKs. The CRDE have collected the additional information as per the questionnaires approved by the P.C. GOI. During power point presentation the committee have suggested to collect the information on the following points.
1. Selection of the beneficiaries 2. Selection of site for demonstration 3. Do the KVKs incorporate the need of line department in their action plan? 4. Participation of line department in Scientific Advisory Committee meeting. 5. The role and responsibilities of the KVK in extending of the improved agricultural
practices. 6. The linkage of the scientist of the KVK with other departments. 7. Basis of the evolution of the KVK. 8. Do KVK and ATMA have any linkage? 9. Role of the KVK in providing consultancy to the groups of farmers developed by the
ATMA. 10. Development and demonstration of Agriculture technique by KVK. 11. The Role of the KVK in preparing the composite plans according to sub- climatic zones
of the M.P. ,Do the KVK makes any effort to prepare a converged Programme of Agriculture technique as per sub climatic Zones.
12. Do the KVK propagate their success stories on agenda basis?
13. Inclusion of marginal farmer /small farmer and women in KVK activities?
The outcomes of this supplementary survey are high lighted below. 1. Selection of the beneficiaries-: 1.1 In all the surveyed KVKs, except in Satna KVK, they obtained the opinion of the line
department such as Agriculture, Horticulture, Animal Husbandry, Poultry development, Sericulture, Fisheries, women and child development department, Zila Panchayat etc., in

630
selection of beneficiaries to train them in the activities of the KVKs. like vocational training, Front line demonstration and On Farm Testing/ training etc.
1.2 Out of the six surveyed KVKs only four KVKs i.e. Indore, Chhindwada, Tikamgarh and Shahdol used to obtain the opinion of Agriculture department. As regards the opinion of Animal husbandry and Horticulture department only three KVKs i.e. Indore, Tikamgarh and Shahdol takes the opinion. Only one KVK i.e. Tikamgarh takes the opinion of women and child development department and only shahdol KVK consulted the Zila Pnchayat for their opinion. None of the KVK consulted the other remaining departments.
1.3 The five KVK obtained the opinion of the line department on the activities regarding vocational training except KVK, Satna. As regards opinion on front line demonstration only four KVK i.e. Bhopal, Indore, Chhindwada and Tikamgarh are found serious. Out of Six surveyed KVK only three KVK (50 percent) Bhopal, Indore and Chhindwada obtained the opinion regarding On Farm Testing activities. As regards other activities like farmer fair, farmer symposium, farmers day etc., except Satna KVK all the surveyed KVK obtained the opinion of the line department .The reason of not obtaining the opinion of the departments the KVK at Satna informed that there is no need to take opinion of the line department.
2. Selection of site for demonstration -: 2.1 In response of the question that while selecting the site for FLD and OFT, whether the
opinion of the line department is taken or not, the KVK at Bhopal and Satna said No, they do not obtained the opinion of the line department, whereas the other four KVK (65 percent) have obtained the opinion.
2.2 The four KVKs who obtained the opinion of the department have informed that such departments are Agriculture, Horticulture, Animal Husbandry and women and child development department. The opinion from other line department has not been obtained.
2.3 The four KVKs who have obtained the opinion of the departments informed that they obtained the opinion on FLD, Farmers fair, Farmer symposium and on Farmers day activities only. Nobody obtained the opinion of the department regarding On Field Testing activities.
2.4 The KVK Bhopal and Satna who have not obtained the opinion of the department informed the reason that there is no need of taking the opinion of the line department on the activities of KVK. The Bhopal KVK, however, added that the concerned department does not cooperate in time.
3. Do the KVKs incorporate the need of line department in their action plan? 3.1 Except KVK Satna all the other five KVK informed that they include the needs of the
line departments in their action plan. Their percentage is 85percent. KVK Satna informed that they follow their own mandates.

631
3.2 All the five KVKs included the needs of Agriculture and Horticulture department and only Indore and Tikamgarh KVK included he needs of Animal husbandry department, whereas only Indore KVKs includes the needs of poultry and women and child development department needs also and KVK Shahdol includes the needs of Zila Panchayat also.
3.3 In response to the question whether the inclusion is sufficient or not, only two KVK
Indore and Tikamgarh informed that it is sufficient, whereas other four KVK do not agree with this.
3.4 The reason for insufficient inclusion is reported to be the limitation of manpower in KVKs.
4. Participation of line department in Scientific Advisory Committee meeting -: 4.1 All the surveyed KVKs informed that the SAC meeting is conducted regularly but only
once in the year. 4.2 In KVK Shahdol all of the nine-line department participate in the SAC meeting. In KVK
Satna and Tikamgarh except the sericulture department, the other entire line department attends the SAC meeting .In Indore KVK except Fisheries, sericulture and Zila panchayat department, all the other department attended the SAC meeting. In Bhopal KVK except Poultry Development Department, Fisheries, Sericulture and Zila Panchayat, all the other 5 department attended the SAC meeting. In Chhindwada KVK only Agriculture Animal husbandry, poultry development department and Horticulture department attended the SAC meeting; the other 5 departments do not attend the SAC meeting. Agriculture Animal husbandry and Horticulture are such departments who attend the SAC meeting held by all the surveyed KVKs.
4.3 As regards non-participation of the department in the SAC meeting, the KVK at Chhindwada informed that the concerned department do not give importance to the meeting .The views of the other KVKs like Bhopal and Indor are also almost the same.
5. The role and responsibilities of the KVK in extending the improved agricultural
practices -: 5.1 In response to the question whether the scientists of KV K feel their responsibilities to
extend the improved Agricultural practices. All the KVK informed it positive. It seems that the Scientists of the KVK are responsible to perform their duties. The KVKs informed that they fulfill their responsibilities through various activities of the KVK, like training of the farmers, demonstration, meeting, field day exhibition etc.
5.2 In response to the question whether it is sufficient or not, out of six surveyed KVK three (50 percent) says it is sufficient and other three says it is insufficient.
5.3 The three KVK accepted that they face the problem of budget and staff provided to them and the other reason is socioeconomic variables of the respondents.
6. The linkage of the scientists of the KVK with other departments.

632
6.1 In response to the question whether the departments invited KVK scientists as resource person in their programmes, all the surveyed KVK informed that the department invite them as resource person in their activities. Mostly the department like Agriculture, Horticulture, Animal husbandry, Neharu yuva Kendra and the banks etc. invited the scientist in their programme.
7. Basis of the evolution of the KVK -: 7.1 Staff – Whether there is sufficient staff or not in the KVK?
The KVK Bhopal, Indore, and Tikamgarh informed that the staff is sufficient as per the mandate of the KVK, but in the practice the staff is insufficient, looking to the activities of the KVK .The other KVK chhindwada, Satna and Shahdol informed that they do not have sufficient staff. It shows that only 50 percent KVK have the sufficient staff for their activities.
7.2 Whether the working hours is fixed or not ? Out of six-surveyed KVK four KVKs have responded that they have fixed the working hours of the staff and the remaining two KVKs Satna and Shahadol have not fixed the working hours for the staff.
7.3 Whether any programme is chalked out for the scientists regarding their office time and field visit. In response to the question all the KVK informed that they have fixed the time schedule for the scientists. It shows that all the 100 percent KVK used to chalk out the schedule of office working as well as of field visit.
7.4 Whether the meeting of KVK is regularly held to review the working of the KVK? All the surveyed KVK informed that the review meeting is regularly held by the KVK.
7.5 Whether the technical works done as per the working plan ? The 100 percent surveyed KVK responded that all the technical works carried out as per the working plan of the KVK .
7.6 The linkage of the scientist of the KVK with other departments. On this point all the surveyed KVK informed that their scientist have good relation with other departments. 7.7 Whether PRA technique is used in preparing the working plan?
In response to this question all the surveyed KVK have accepted that they use, the PRA technique in preparing their action plan.
7.8 Which of the techniques are utilized in making propaganda and publicity of the Agriculture technology?
Almost all the surveyed KVK informed that apart from utilizing the methods of Vocational Training, FLD, OFT, Farmers fair, Farmers day, Symposium of farmer, radio talk, TV broadcasting etc., they adopted the techniques of Farmer tour,Farmers meeting, distribution of literature in local language to the farmers, and efforts through the personal relation with farmers. Agriculture clinic and displaying of cassatas on developed Agriculture techniques are also adopted.

633
7.9 Do the scientists have right to take decision for the better performance of their function?
In response to the question all the surveyed KVK informed that the scientists have the right to take decision regarding better performance of their functions.
8. Do KVK and ATMA have any linkage? 8.1 Only three KVKs i.e. Chhindwada, Tikamgarh and Shahdol accepted that they have
the linkage with ATMA . The remaining other KVK informed that ATMA is not functioning in their district .KVK Chhindwada informed that they have the linkage with the activities of the ATMA through the exhibition and demonstration, KVK Tikamgarh informed that they have linkage through SREP (Strategic Research Extension programme ) and Shahdol KVK informed that the activities of the ATMA have recently started in Shahdol district the KVK have given the training to the farmer groups of ATMA.
9. Role of the KVK in providing consultancy to the groups of farmers developed by
the ATMA .
9.1 In districts of Bhopal, Satna and Indore there is no ATMA activities so has far been started. In the other three district where the ATMA is functioning or have recently started, the farmers groups are under processing and where the groups have been formed, the KVK started demonstration to the groups. They are given the on spot advice during field visit and through demo.
10. Development and demonstration of Agriculture technique by KVK. 10.1 Whether the KVK demonstrate the Agriculture technique ?
In response to the question all the surveyed KVK accepted that they do it through the demonstration ,OFT, Farmer fair and through Symposium etc..
11 The Role of the KVK in preparing the composite plans according to sub- climatic zones of the M.P. ,Do the KVK makes any effort to prepare a converged Programme of Agriculture technique as per sub climatic Zones ? 11.1 All the surveyed KVK accepted that they do the conservation of Agri- Techniques according to composite plan and sub climate Zone of M.P. 11.2 KVK Bhopal told that they do it through selection of techniques according to the
variables of climate Zone .The KVK Indore informed that they do it by OFT, and by cropping Patterns according to climate. The Chhindwada KVK informed that they do it according to the need of the soil and the crop through demonstration. The KVK Tikamgarh told that they perform it on major crops of rabi season like gram, wheat and linseed and of the kharif season on soybean sesame etc.and in horticulture on zinger,

634
groundnut ,sweet potato and potato colocarchia .KVK satna informed that they perform the conservation techniques according to the programme based on regional requirement. The KVK shahadol informed that they do the conservation according to soil and climate and the infrastructure facilities available with the farmers.
12. Do the KVK propagate their success stories on agenda basis? 12.1 In response to this question all the KVK agreed that they do the propaganda and the
publicity of their success stories on regular basis through electronic media, print media and documentation .Some of the KVK prepare the C.D. also of their success stories .
13. Inclusion of marginal farmer /small farmer and women in KVK activities? 13.1 All the surveyed KVK agreed that they include the marginal farmer small farmer and
women in their activities through the Vocational Training FLD, OFT and other programme like farmer day, farmer symposium etc.. Although there is no any ratio is fixed for this. Sometimes the farmers male as well as female do not participate in these activities due to socio-economic barriers. On the other hand it appears that the KVKs also do not make sincere efforts in this connection
The investigators of the CRDE consulted the KVK I/c officers on some extra points other that the questionnaire. Their remarks are highlight below. KVK Bhopal – Other department do not help KVK except Agriculture and Horticulture
who help in FLD .The KVK require more staff than sanctioned by ICAR. KVK Indore - Deputy Director Horticulture has expressed the views that in selection of
villages and implementation of Horticulture, the KVK should cooperate enough which is not being done at present. DDA told that the participation of female farmers should be increased in KVK activities. Deputy Director, Animal Husbandry told that the KVK invite them as per their need or on the occasion of some key activities. The representative of the Deputy Director, Animal Husbandry attends the KVK programme. But the KVK do not invite them in FLD & OFT and while selecting the village / beneficiaries.
KVK Chhindwada – Agriculture department cooperates properly in the OFT activities. The
rural agriculture extention officer and the scientists of the KVK used to go togather in the demo. In the monthly workshop of Agriculture department they discuss the problem with KVK Scientists, whenever the necessity arises they organize the joint tour to the farmer’s fields. While organizing the agriculture fair (Krishak mela) and exhibition the KVK and the department organize the activities jointly . The KVK scientist attends the activities as a subject matter specialist. In the SAC meeting of theKVK the officer of the departments do participate. ATMA has recently started in the district. The KVK scientist in the activities of ATMA organized the demos. They will provide the training to the farmers in the ATMA activities. After farming the groups the scientist of KVK

635
participates in the farmers training programme organized by the Agriculture Department. The opinion of the department is that the scientist of the KVK do not go to field area until and unless they are called for .The Department have suggested that the scientists of KVK should go in to field regularly. Deputy Director, A.H. told that they participate in the activities of the KVK. The doctor of the department goes to teach internee trainees in the KVK. They also participate in kisan mela and the Animal husbandry camp organized jointly by the Department and the KVK. The representative of the department attends the SAC meeting of the KVK regularly.Asstt. Director, Horticulture told that the scientist of KVK participated as an expert in the farmers training and kisan mela programme. The department is not aware of the FLD and OFT activities of the KVK. They attend the SAC meeting.
KVK Tikamgarh – Deputy Director, Agriculture told that they participate in the activities
of KVK at their own interest. The KVK do not call them. There is no linkage with Deputy Director, Agriculture. The training of RA E O is organized by the KVK . A.H./ Vet. Department told that the KVK call them to attend the activities.
Fisheries – The KVK do not call them in their activities, even in the SAC meeting also they
are not invited. Horticulture – KVK invites the officers of Horticulture department. But they do not call them in
selection of villages or in the FLD of Zinger crop. KVK Satna - The opinion of the Agriculture department is not fair regarding the KVK. They
have no much interaction in between their activities. But whenever the scientist of the KVK are called for they attended the department activities. But KVK do not call them to participate in KVK programme.
KVK Shahdol – Animal Husbandry Department officer attended the meeting of the KVK. They were present in farmers training programme and kisan mela ,but they do not know about FLD or OFT or any other activities of KVK.

636
CONCLUSION OF THE STUDY AND RECOMMENDATION
1. All the surveyed KVKs do not obtained the opinion of all the line department while selecting the beneficiaries to impart them the vocational training in KVK activities. Since the KVK activities are is mostly dependent on the line department cooperation, hence their cooperation and opinion is very important. It is, therefore, suggested that the ICAR may instruct all the KVKs in Madhya pradesh in this connection. Secondly, the state Govt. may also be requested to instruct all the line department at the district level whose activities are corelated to the activities of the KVKs, so that the rural poors marginal as well as small farmers in the area could be benefited in more numbers.
2. While selecting the site for FLD and OFT activities of the KVKs, the study revealed that only 65 percent KVKs obtained the opinion of the line department regarding this activity. The FLD and OFT are the important activities of the KVKs, the cooperation of the line department must be secured so that the farmer could also be impressed with these activities. For this purpose instruction may be issued to the KVKs.
3. It has been found through the study that about 85 percent of the surveyed KVKs include the needs of the line department while formulating the action plan. Efforts should be made that all the KVKs follow the mandates of the ICAR.
4. The scientific Advisory committee meeting is one of the key function of the KVKs. During the survey it has been found that all the surveyed KVKs organized the SAC meeting once in a year only, which seems to be insufficient, because in the SAC meeting the function of the KVKs are assessed as well as the suggestions of the line departments are also reflected in this meeting regarding the activities of the KVKs. It is, therefore, suggested that this meeting may kindly be held at least twice in a year. One before making preparation for kharif crop and another before the Rabi crop so that the suggestions of the line department could be kept in view, while implementing both the cropping season patterns. It is therefore requested that instructions may kindly be issued to the state govt. that in the SAC meeting of the KVKs, all the district level line department officers must attend the meeting.
5. While extending the improved agricultural technique through the KVKs it is found that the scientists of all the KVKs felt their responsibilities in providing these techniques, but in the 50 percent KVKs the scientists feel that still more efforts in this direction is to be done. For this purpose both the budget and staff of the KVKs should be increased. If the staffing patterns in the KVKs is not possible to be increased, the KVKs may be permitted to appoint some technical persons /passed out unemployed students of Agriculture collages on contract basis with a view to enhance the activities of KVKs, because at present in a district only one KVK is working and looking to the vast area of a district, the staff provided at present to the KVKs is too much insufficient. For this purpose only the budget of the KVKs could be increased. In the surveyed 50 percent KVKs they felt the need of additional staff.

637
6. At present the linkage of the scientists of the KVKs with the line departments is found to be satisfactory but they should be asked to interact more sincerely in the activities of the line department so that the importance of the KVKs could be established as like as mini Agriculture University in the district.
7. As regards the propaganda and publicity of the activities of the KVKs it is suggested that through the local print media and the T.V. channels, the activities of the KVKs could be broadcasted every monthly. The scientists of the KVKs could be encouraged to publish their activities in the local news paper frequently, so that more and more farmers could be benefited with the activities of the KVKs. The Zonal Coordinator of the ICAR could be given the responsibilities to keep a watch on the scientists of the KVKs.
8. The activities of ATMA have not yet started in all districts in Madhya Pradesh state. In some of the district where it has been stated, it is still in the prenatal stage.
9. As regards inclusion of marginal farmers, small farmers and farm women in KVK activities, sometimes they do not participate in these activities due to reason more than one, either they remain busy in some of the other economic activities or in some socio culture economic activities . It has also been found that the KVKs also do not make sincere efforts to motivate the farmer properly due to shortage of staff. Since this is one of the important activity of the KVKs, serious efforts should be done to find out the proper reasons behind this. Provision of some cases incentives could also be thought out to enhance the presence of the poor farmers in there activities.
10. During the course of survey the investigators of all SRDE discussed with the incharge officer of the KVKs &line departments regarding the overall functioning of the KVKs. While at discussions most of the district level officer of the various department told that the KVKs don’t consult them properly before launching their activities, where as incharge officer of the KVKs told that the district level Govt. functionaries do not give much importance to the activities of the KVKs. It seems that there is too much gap in the understanding in between the KVKs and the line department, which could be avoided. In this direction some sincere efforts would be welcome.