Annual-Report-2012-min.pdf - Allied Bank Limited
248
Dreaming a dream together Annual Report for the year ended December 31, 2012
-
Upload
khangminh22 -
Category
Documents
-
view
1 -
download
0
Transcript of Annual-Report-2012-min.pdf - Allied Bank Limited

Dreaming a dream together
Annual Report for the year ended December 31, 2012


Deposits
Up by 29 %
Rs. 514.7 billion (2011: Rs. 399.6 billion)
Loans & Investments Up by 22 %
Rs. 538.5 billion (2011: Rs. 440.1 billion)
Total Assets
Up by 23 %
Rs. 631.9 billion (2011: Rs. 515.7 billion)
Profit (After Tax)
Up by 15 %
Rs. 11.7 billion (2011: Rs. 10.1 billion)
EPS (Rs.)
12.34
(2011: Rs. 10.71)
ROA
2 %
(2011: 2 %)
Performance 2012

Contents
04 Vision06 Mission08 Core Values10 Company Information12 Board of Directors14 Profile of the Directors18 Board Committees20 Chairman’s Message22 Directors’ Report28 The Management30 Management Committees31 Corporate Structure32 Chief Executive Officer’s Review49 Entity Ratings of the Bank50 Performance Highlights54 Horizontal Analysis56 Vertical Analysis58 Statement of Value Addition59 Cash Flow - Direct Method60 Concentration & Maturity Profile61 Quarterly Comparison of Financial Results62 Product & Services64 Corporate Sustainability69 Notice of 67th Annual General Meeting71 Statement of Compliance with Code of Corporate
Governance (CCG)72 Auditors’ Review Report to the Members on
Statement of Compliance with CCG73 Statement of Ethics and Business Practices75 Statement of Internal Controls76 Whistle Blowing Policy
Unconsolidated Financial Statements of Allied Bank Limited
79 Auditors’ Report to the Members80 Statement of Financial Position81 Profit and Loss Account82 Statement of Comprehensive Income83 Statement of Cash Flow84 Statement of Changes in Equity85 Notes to the Financial Statements153 Annexures I159 Annexures II
Consolidated Financial Statements of Allied Bank Limited and its Subsidiary
162 Directors’ Report on Consolidated Financial Statements
163 Auditors’ Report to the Members164 Statement of Financial Position165 Profit and Loss Account166 Statement of Comprehensive Income167 Statement of Cash Flows168 Statement of Changes in Equity169 Notes to the Financial Statements237 Pattern of Shareholding240 Glossary of Financial & Banking Terms243 Form of Proxy
2

Annual Report of Allied Bank Limited for the year 2012
3

Vision
4

To become a dynamic and
efficient bank providing integrated
solutions in order to be the first
choice bank for the customers.
Annual Report of Allied Bank Limited for the year 2012
5

Mission
6

• Toprovidevalueaddedservicestoourcustomers
• Toprovidehightechinnovativesolutionstomeet customers’ requirements
• Tocreatesustainablevaluethroughgrowth,efficiency and diversity for all stakeholders
• Toprovideachallengingworkenvironmentand reward dedicated team members according to their abilities and performance
• Toplayaproactiveroleincontributingtowards the society
Annual Report of Allied Bank Limited for the year 2012
7

Core Values
8

Integrity
Excellence in Service
High Performance
Innovation and Growth
Annual Report of Allied Bank Limited for the year 2012
9

Company Information
Board of Directors Mohammad Naeem Mukhtar Sheikh Mukhtar Ahmad
Muhammad Waseem Mukhtar
Abdul Aziz Khan
Mubashir A. Akhtar
Pervaiz Iqbal Butt
A. Akbar Sharifzada
Sheikh Jalees Ahmed
Khalid A. Sherwani
Audit Committee ofBoardMubashir A. Akhtar (Chairman)
Pervaiz Iqbal Butt
A. Akbar Sharifzada
Human Resource & Remuneration CommitteeAbdul Aziz Khan (Chairman)
Muhammad Waseem Mukhtar
Pervaiz Iqbal Butt
Khalid A. Sherwani
Company SecretaryMuhammad Raffat
Auditors Ernst & Young Ford Rhodes Sidat HyderChartered Accountants
KPMG Taseer Hadi & Co.Chartered Accountants
Legal Adviser Haidermota & Co.Barrister-at-Law & Corporate Counselors
Shares RegistrarTechnology Trade (Pvt.) Limited
Registered & Head Office3TipuBlock,MainBoulevardNew Garden TownLahore - Pakistan (9242) 35880043Postal Code 54000
Website & [email protected] Free Number 0800-22522
10

Annual Report of Allied Bank Limited for the year 2012
11

Board of Directors
12

(Sitting Left to Right)Sheikh Mukhtar AhmadMohammad Naeem MukhtarAbdul Aziz KhanKhalid A. SherwaniMuhammad Waseem Mukhtar
(Standing Left to Right)Sheikh Jalees AhmedPervaiz Iqbal ButtMubashir A. AkhtarA. Akbar Sharifzada
Annual Report of Allied Bank Limited for the year 2012
13

Profile of the Directors
Mohammad Naeem MukhtarChairman / Non Executive Sponsor Director
He is Chairman of the Board of Allied Bank since 2004. He has done his MBA fromCardiffBusinessSchoolU.K.,PostGraduatediplomainTextilesfromU.K. and Chartered Textile Engineer (CText ATI) from The Textile Institute in Manchester,U.K.Hehas27yearsofexperienceofFinanceandIndustry.BesidesChairmanofBoardofDirectorsofAlliedBank,heisalsotheChiefExecutiveOfficerofM/sIbrahimFibresLimited,DirectorofM/sIbrahimAgencies(Pvt.) Limited and Pakistan Business Council and Member Board of Governors ofNationalManagementFoundation,theparentbodyofLahoreUniversityofManagement Sciences (LUMS).
Muhammad Waseem MukhtarNon Executive Sponsor Director
He holds Master’s degree in Total Quality Management (TQM) from University of Glamorgan,Wales,U.K.,andhasdiversified15yearsofexperienceofFinance,ITandIndustry. His strategic guidance played a vital role in technological up-gradation of the Bank.
He has been on the Board of Directors of Allied Bank Limited since 2004 and is a “Certified Director” from Pakistan Institute of Corporate Governance. He is also a Director ontheBoardsofM/sIbrahimFibresLimited,IbrahimAgencies(Pvt.)Limited,ABLAssetManagement Company and Arabian Sea Country Club.
Sheikh Mukhtar AhmadNon Executive Sponsor Director
He had started his business career immediately after migrating from India at the time of Independence of Pakistan in 1947 and contributed to the industrial and business growth of Pakistan through his entrepreneurship skills and business acumen. He has over 51 years of experience in establishing and successfully managing various industrial and financial companies.
He has been on the Board of Directors of Allied Bank Limited since 2005 and is a “Certified Director” from Pakistan Institute of Corporate Governance. He is also Chairman of the Board of Directors of M/s Ibrahim FibresLimited,IbrahimAgencies(Pvt.)Limited and ABL Asset Management Company Limited.
14

Abdul Aziz Khan Independent Director
He has enriched and diversified experience of more than 49 years in the fields of General Banking,Credit,LeaseFinance,BusinessDevelopment and Administration including 9 years international banking holding key positions in different countries including Switzerland. He is on the Board of Allied Bank Limited since 2004.
Mubashir A. AkhtarIndependent Director
He is a law graduate and has 46 years of banking experience in local and international markets. His extensive international banking experienceincludeskeyassignmentsinTurkey,Qatar and UK. He is a Financial Consultant of Asian Development Bank (ADB) and remained actively involved in various assignments of ADB especially on capital markets development and reforms of NBFIs in Pakistan.
He has been on the Board of Directors of Allied Bank Limited since 2006 and is a “Certified Director” from Pakistan Institute of Corporate Governance.
Pervaiz Iqbal ButtIndependent Director
He is an Electrical Engineer and has 43 years of experience in marine engineering and other heavy industries. His extensive and diversified exposure of Industrial Management effectively compliments the decision making process at the board level.
He has been on the Board of Directors of Allied Bank Limited since 2007 and is a “Certified Director” from Pakistan Institute of Corporate Governance.
Annual Report of Allied Bank Limited for the year 2012
15

A. Akbar SharifzadaGovernment Nominee Director
He has 26 years Civil Service career in the Government of Pakistan and has remained posted in different ministries gaining wide ranging policy making and administrative experience. Presently he is a Joint Secretary and functioning as Special Assistant to the Federal Finance Minister. He holds a Masters degree in English Literature and Economics.He has also attended multiple courses within the country and abroad.
He has been nominated as Director on the Board of Allied Bank Limited by the Government of Pakistan since January 2012.
Khalid A. SherwaniChief Executive Officer
He is a seasoned professional with management experience of over 40 years in the areas of operations,finance,marketing,andinformationtechnologywithinthefinancialservicesindustry.HistrackrecordincludesrestructuringUBLduring1996-2000,restructuringandrecapitalization of ABL during 2000-04 and leading its turnaround during 2004-07.
He holds a Masters degree from the University of Karachi and is a ”Certified Director” fromPakistanInstituteofCorporateGovernance.Duringhiscareer,hehasworkedintopmanagementpositionsasSeniorExecutiveVicePresident/President,UBLandManagingDirectorHBFC,AdministratorIIBLandPresident/CEOABL.
HejoinedABLinJune,2010afterhavingservedearlierinthesamecapacityfor7years.HecurrentlyalsoservesontheBoardsofDirectorsofHabibAlliedInternationalBankU.K.,ABLAssetManagementCompanyLimited,1linkGuaranteeLimitedandtheCancerFoundation.
Sheikh Jalees AhmedExecutive Director
He has more than 37 years of diverse experience in the fields of Financial and Industrial Management. Allied Bank benefits from his professional expertise particularly in theareasofstrategicandfinancialplanning,systems and controls and Human Resource Management.
He has been on the Board of Directors of Allied Bank Limited since 2004 and is a “Certified Director” from Pakistan Institute of Corporate Governance.
Profile of the Directors
16

Annual Report of Allied Bank Limited for the year 2012
17

Board Committees
Terms of Reference
Primary responsibilities of the Audit Committee of Board (ACOB) are to determine appropriateness of measures taken by the Management to safeguard Bank’sassets,ensureconsistencyofaccountingpolicies,reviewfinancialstatementsand recommend appointment of the external auditors and close coordination with them to fulfill statutory and Code of Corporate Governance requirements. ACOB is inter-alia responsible to ascertain the effectiveness of the Internal ControlSystemincludingfinancialandoperationalcontrols,ensuringadequateandeffective accounting and reporting structure and monitoring compliance with the best practices of the corporate governance. The other function of ACOB includes assurance that an independent and effective internal audit function is in place.
Terms of Reference
One of the key missions of the e-Vision Committee is to provide strategic direction for e-banking and adoption of evolving technologies. Review of strategic plans to improve IT infrastructure and automation of processes and systems including alternate delivery channels are also with in the scope of the responsibilities of the e-Vision Committee. The Committee provides assistance to the Board with insights regarding adoption of international developments in the field of e-banking keeping in view of the domestic requirements. It also oversees performance of Information Technology Group and Business Systems & Implementation Group.
Audit Committee of BoardConstitution:
Mubashir A. AkhtarChairman
Pervaiz Iqbal Butt
A. Akbar Sharifzada
Terms of Reference
The primary functions of Board Risk Management Committee (BRMC) are themonitoringofManagement’sadherencetoprudentandsoundriskpolicies,assessing the ever changing risk profile and providing risk appetite to the business units. It also ensures development of risk management principles to build stakeholdersconfidence,safeguardandenhancereputation.BRMCalsomonitorsquality of asset portfolio and suggest measures to keep the infected portfolio at theminimumlevel.BRMCapprovesrisklimitsforcredit,marketandoperationalrisks,creditapprovalgridandproposalsregardingwrite-offsabovecertainlimits.Overseeing of certain management committees and groups is also undertaken by the BRMC. It also monitors the initiatives pertaining to Basel requirements and up gradation of Risk Management Systems.
Board Risk Management CommitteeConstitution:
Sheikh Mukhtar Ahmad Chairman
Muhammad Waseem Mukhtar Abdul Aziz Khan
Khalid A. Sherwani
e-Vision CommitteeConstitution:
Mohammad Naeem Mukhtar Chairman
Muhammad Waseem Mukhtar
Mubashir A. Akhtar
Khalid A. Sherwani
18
Terms of Reference
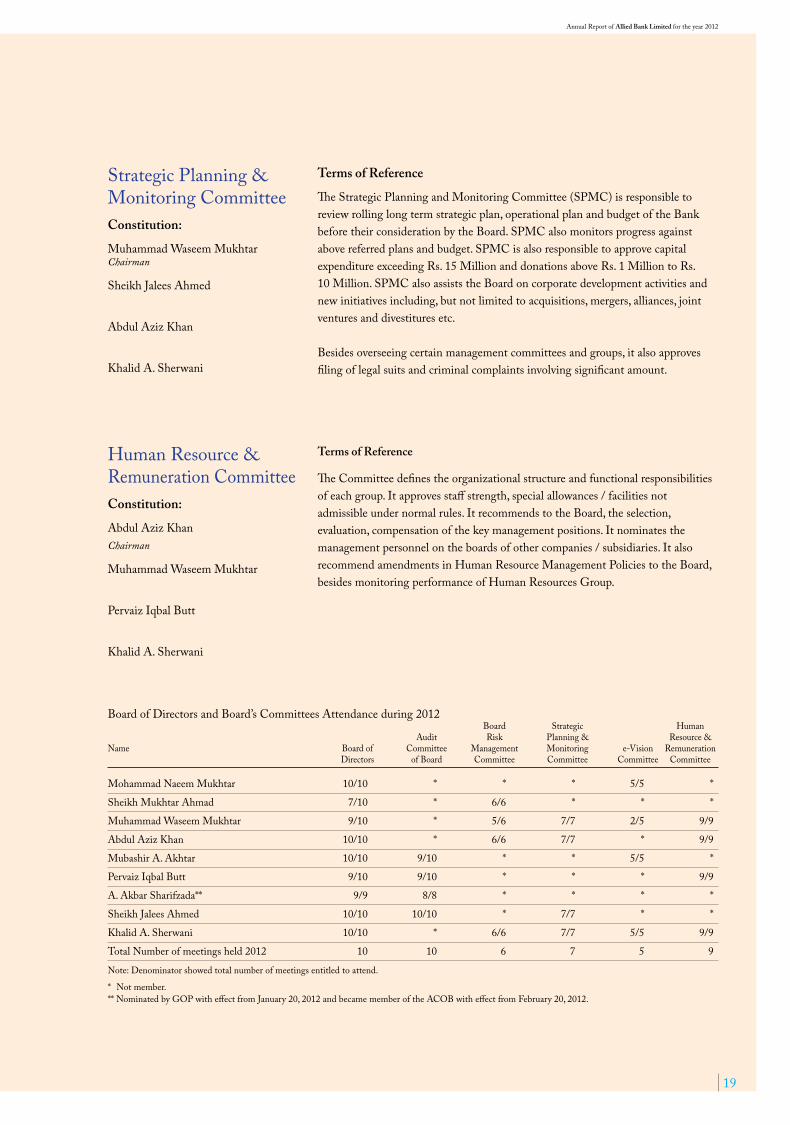
The Strategic Planning and Monitoring Committee (SPMC) is responsible to reviewrollinglongtermstrategicplan,operationalplanandbudgetoftheBankbefore their consideration by the Board. SPMC also monitors progress against above referred plans and budget. SPMC is also responsible to approve capital expenditure exceeding Rs. 15 Million and donations above Rs. 1 Million to Rs. 10 Million. SPMC also assists the Board on corporate development activities and newinitiativesincluding,butnotlimitedtoacquisitions,mergers,alliances,jointventures and divestitures etc.
Besidesoverseeingcertainmanagementcommitteesandgroups,italsoapprovesfiling of legal suits and criminal complaints involving significant amount.
Terms of Reference
The Committee defines the organizational structure and functional responsibilities ofeachgroup.Itapprovesstaffstrength,specialallowances/facilitiesnotadmissibleundernormalrules.ItrecommendstotheBoard,theselection,evaluation,compensationofthekeymanagementpositions.Itnominatesthemanagement personnel on the boards of other companies / subsidiaries. It also recommendamendmentsinHumanResourceManagementPoliciestotheBoard,besides monitoring performance of Human Resources Group.
Strategic Planning & Monitoring Committee Constitution:
Muhammad Waseem Mukhtar Chairman
Sheikh Jalees Ahmed
Abdul Aziz Khan
Khalid A. Sherwani
Human Resource & Remuneration Committee Constitution:
Abdul Aziz Khan Chairman
Muhammad Waseem Mukhtar
Pervaiz Iqbal Butt
Khalid A. Sherwani
Board of Directors and Board’s Committees Attendance during 2012 Board Strategic Human Audit Risk Planning & Resource &Name Board of Committee Management Monitoring e-Vision Remuneration Directors of Board Committee Committee Committee Committee
Mohammad Naeem Mukhtar 10/10 * * * 5/5 *
Sheikh Mukhtar Ahmad 7/10 * 6/6 * * *
Muhammad Waseem Mukhtar 9/10 * 5/6 7/7 2/5 9/9
Abdul Aziz Khan 10/10 * 6/6 7/7 * 9/9
Mubashir A. Akhtar 10/10 9/10 * * 5/5 *
Pervaiz Iqbal Butt 9/10 9/10 * * * 9/9
A. Akbar Sharifzada** 9/9 8/8 * * * *
Sheikh Jalees Ahmed 10/10 10/10 * 7/7 * *
Khalid A. Sherwani 10/10 * 6/6 7/7 5/5 9/9
Total Number of meetings held 2012 10 10 6 7 5 9
Note: Denominator showed total number of meetings entitled to attend.
* Not member. **NominatedbyGOPwitheffectfromJanuary20,2012andbecamememberoftheACOBwitheffectfromFebruary20,2012.
Annual Report of Allied Bank Limited for the year 2012
19

Chairman’s Message
Amidst testing times for the
global economy and persistent
challenges and constrained
operating environment on the
domesticfront,YourBank’s
strategicfocusoninnovation,
commitment to deliver
customer centric solutions
with coordinated action
and teamwork continues to
deliver positive results and
has translated into sustained
growth and value creation for
all the stakeholders.
20

Technological advancements and innovations are the key enablers of Your Bank’s strategy in pursuit of achieving service excellence. Your Bank has continued to strengthen delivery channels by deploying cutting edge technologies with a vision to provide outstanding customer services.
Having one of the largest network of ATMs,deliveringextensiveoutreach,internet banking solutions and CallCenterServices,YourBankisvigorously active in deploying mobile banking in the near future. Besides offering a value creation opportunity to tap the large proportion of unbanked population,thisnewinitiativewillserve as a step towards greater financial inclusion for the masses who are currently deprived of the ability to participate in economic activities due to minimal or no access to the financial services system of the country.
Tocomplementtheoverallinitiatives,Your Bank is continuously focusing on expanding geographical footprint and improving the existing network infrastructure. In line with our commitment to provide enriched customerexperience,ServiceQualityhas been active as the key facilitator and change agent in Your Bank. Strong emphasis and concerted efforts are being made to transform the service culture across all segments of Your Bank.
The changing dynamics of the banking industry and turbulent global and local market conditions have once again brought to limelight the importance of sound risk architecture and control environment in ensuring long-term viability of financial institutions across the globe. The need of the hour is to learn from past experiences and build on systems and processes better equipped to tackle emerging risks. Your Bank has made significant headway onthisfrontduringthepastfewyears,with new initiatives complementing this progress in 2012. This involved critical review and assessment of the loansevaluationcriteria,greaterinsightand depth into understanding the
borrowers’ businesses and industry risks and improving loans monitoring mechanism so that stressed borrowers are identified at an early stage. As a result,extensivefunctionalitieshavebeen built into a state of the art Loan Origination System and borrowers’ evaluation criteria methodology. More weightage is now given to borrowers’ qualitativeattributes,includingCorporate Governance which includes existenceofprofessionalmanagement,legalcorporatestructures,soundbusiness systems and processes etc. This is an important aspect of loan evaluation often neglected across the industry in the past. Emphasis is now placed on borrowers’ capabilities in managing their projects technically and responsiveness to changes in marketconditions.Asapolicy,financing to a class of borrowers having technologically obsolete machinery and equipment is discouraged. Own warehouses are being built for enhancing Your Bank’s control over the underlying collateral. These steps while helping to better assess the underlying risks,wouldalsoresultincreatingawareness amongst the industry players and borrowers in managing their businessandfinancialrisks,therebyenhancing the effectiveness of financial intermediary function and contribution to the economic development of the country.
Your Bank recognizes the pivotal role of itsmostvaluableassets,itspeople.Weremain fully committed in providing acomprehensiverangeoftraining,development and growth opportunities forouremployees,whichmakesYourBank first choice institution for young professionals.
Inrecognitionofthefinancialstrength,businessprospects,marketpositioningand up-gradation in risk management framework,thePakistanCreditRatingAgency Limited (PACRA) upgraded Your Bank’s long-term entity rating to‘AA+’,rankingamongstthebestin the industry. The JCR-VIS Credit RatingCompanyLimited( JCR-VIS),the other domestic rating agency also upgraded the rating of Your Bank’s
earlier raised TFC issue. In appreciation of the efforts and commitment of the Board and Management to instill a sound governance culture and frameworkatAlliedBank,JCR-VIShas upgraded Your Bank’s Corporate Governance rating to ‘CGR- 8++’ from ‘CGR- 8+’ assigned earlier.
Going ForwardIntheyear2013,wewouldcontinuetofocus on our vision and aim to continue building on solid foundations and setting high standards of performance all round. Your Bank will continue toinvestinitshumancapital,riskmanagement and technological infrastructure platforms. Emphasis would be to deepen existing client relationships,besidesexploringnewmarkets and business avenues including Islamic Banking to diversify revenue streams. Product innovations and superior service quality would remain our key objectives. Our endeavor would be to effectively balance the objectives ofgrowth,profitabilityandriskmanagement.
I want to communicate my appreciation and thanks to the entire team of Allied Bank for their accomplishments during the current challenging times. I thank our customers for entrusting us with more of their business and continuing relationship with us. My thanks go to the State Bank of Pakistan and the Securities and Exchange Commission ofPakistanfortheirsupport,trustandguidance.Andlast,butnottheleast,Ithanktheshareholders,fortheircontinued confidence in Allied Bank Limited.
Mohammad Naeem MukhtarChairman
Annual Report of Allied Bank Limited for the year 2012
21
Directors’ Report
Your Bank posted profit before tax ofRs.15,870millionduring2012comparedtoRs.15,108millionin2011,registering a growth of 5%. Profit after tax for the same year grew by 15.2% to reachatRs.11,676millionover Rs.10,140millioninthecorrespondingyear.Asaresult,EPSofYourBankincreased to Rs. 12.34 in 2012 compared to Rs. 10.71 in 2011. Despite toughbusinessenvironment,ROAandROE of Your Bank almost remained at the same level of last year and stood at 2%and29%,respectively.
Deposits of Your Bank increased to Rs.514,707millionasatDecember31,2012comparedtoRs.399,562millionasatDecember31,2011,ayearonyear (YoY) growth of 28.8%. Gross Advancesregisteredagrowthof10.2%,increasingtoRs.288,889millionasatDecember31,2012comparedto Rs.262,137millionasatDecember31,2011.GrossInvestmentsincreasedtoRs.269,351millionasatDecember31,2012,ariseof35.8%overRs.198,398millionasatDecember31,2011. The Balance Sheet Size of Your Bank registered a YoY growth of 22.5% toreachatRs.631,915millionasatDecember31,2012.TheCoreEquity
Dear Shareholders OnbehalfoftheBoard,weare
pleased to present the annual report
of your Bank for the year ended
December31,2012.
The operating results and
appropriations,asrecommendedby
the Board are included in the table:
The Board of Directors has
proposed a final cash dividend of
Rs. 2 per share (aggregate cash
dividend of Rs. 6.5 per share
including interim dividends)
and to issue bonus shares in the
proportion of 1 share for every
10sharesheld,i.e.,10%forthe
year2012.This,togetherwith
the interim dividends declared
during2012,willbeapprovedin
the forthcoming Annual General
Meeting.
consequently increased by 14.11% toreachatRs.42,928millionasatDecember31,2012comparedtoRs.37,620millionasatDecember31,2011.
Net Mark-up / Interest Income during 2012 decreased by 27.1% over 2011 to Rs.18,361million,attributablemainlyto higher deployment of funds towards dividend bearing investment activities. This is also reflected by 98.5% growth in Non Mark-up / Interest Income to Rs.13,794millionin2012comparedtoRs.6,950millionin2011.TheAdministrative Expenses increased by 10.5%toRs.14,546millionin2012comparedtoRs.13,166millionin2011.
Theprovisionagainstloans,investments and lending to FIs reduced by 78.4% to Rs. 651 million in 2012 comparedtoRs.3,009millionduring2011. The provision coverage against non-perming loan remained at 85.9% asatDecember31,2012.NobenefitofFSV has been taken while determining the provision against NPLs as allowed under BSD Circular No. 02 of 2010 datedJune03,2010.
Performance Review
22

(Rupees in million) YearendedDecember31, 2012 2011 Growth
Profit after tax for the year 11,676 10,140 15%
Accumulated profits brought forward 20,255 15,829 28%
Transfer from surplus on revaluation of fixed assets - net of tax 31 29 7%
Profit available for appropriation 31,962 25,998 23%
FinalcashdividendfortheyearendedDecember31,2011atRs.2.5pershare(2011:YearendedDecember31,2010 at Rs. 2 per share) (2,151) (1,564) 38%
1st interim cash dividend for the year ended December31,2012atRs.2pershare(2011:YearendedDecember31,2011atRs.2.5pershare) (1,893) (2,151) -12%
2nd interim cash dividend for the year ended December31,2012atRs.1.5pershare(2011:Nil) (1,420) - -
3rd interim cash dividend for the year ended December31,2012atRs.1pershare(2011:Nil) (946) - -
BonussharesfortheyearendedDecember31,2011@10%(2011:YearendedDecember31,2010@10%*) (658)
Transfer to statutory Reserves (2,335) (2,028) 15%
Accumulated profits carried forward 22,559 20,255 11%
Earning Per Share (EPS) (Rs.) 12.34 10.71 15%
* Appropriation out of Share Premium Account
Annual Report of Allied Bank Limited for the year 2012
23
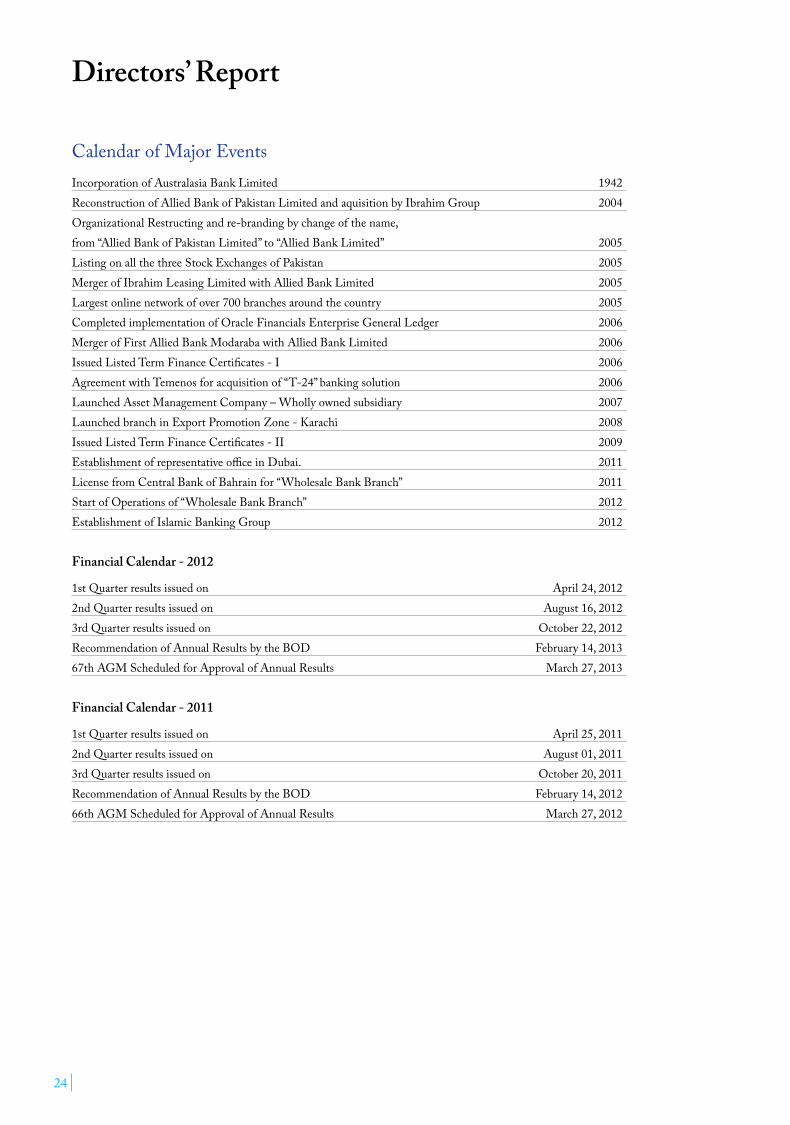
Calendar of Major EventsIncorporation of Australasia Bank Limited 1942Reconstruction of Allied Bank of Pakistan Limited and aquisition by Ibrahim Group 2004OrganizationalRestructingandre-brandingbychangeofthename,from “Allied Bank of Pakistan Limited” to “Allied Bank Limited” 2005Listing on all the three Stock Exchanges of Pakistan 2005Merger of Ibrahim Leasing Limited with Allied Bank Limited 2005Largest online network of over 700 branches around the country 2005Completed implementation of Oracle Financials Enterprise General Ledger 2006Merger of First Allied Bank Modaraba with Allied Bank Limited 2006Issued Listed Term Finance Certificates - I 2006Agreement with Temenos for acquisition of “T-24” banking solution 2006Launched Asset Management Company – Wholly owned subsidiary 2007Launched branch in Export Promotion Zone - Karachi 2008Issued Listed Term Finance Certificates - II 2009Establishment of representative office in Dubai. 2011License from Central Bank of Bahrain for “Wholesale Bank Branch” 2011Start of Operations of “Wholesale Bank Branch” 2012Establishment of Islamic Banking Group 2012
Financial Calendar - 2012
1stQuarterresultsissuedon April24,20122ndQuarterresultsissuedon August16,20123rdQuarterresultsissuedon October22,2012RecommendationofAnnualResultsbytheBOD February14,201367thAGMScheduledforApprovalofAnnualResults March27,2013
Financial Calendar - 2011
1stQuarterresultsissuedon April25,20112ndQuarterresultsissuedon August01,20113rdQuarterresultsissuedon October20,2011RecommendationofAnnualResultsbytheBOD February14,201266thAGMScheduledforApprovalofAnnualResults March27,2012
Directors’ Report
24

• We have criteria for nomination of Bank’s executives on the Boards of other companies where Allied Bank is an investor company. The Human Resource & Remuneration Committee of the Board decides these nominations.
• The Committees of Board of Directors along with their terms of reference / charter have been separately disclosed in the Annual Report.
• The detail of the meetings held during the year for the Board and its respective Committees along with attendance record of each director has been separately disclosed in the Annual Report.
Chief Executive Officer’s ReviewThe Board of Directors fully endorse the Chief Executive Officer’s Review on Your Bank’s performance for the yearendedDecember31,2012.
Statement under Code of Corporate GovernanceThe Board of Directors is aware of its responsibilities under the Code of Corporate Governance and is pleased to report that:
• Thefinancialstatements,prepared by the management of theBank,presentfairlyitsstateofaffairs,theresultofitsoperations,cashflows and changes in equity.
• Proper books of account of the Bank have been maintained.
• Appropriate accounting policies have been consistently applied in preparation of financial statements. Accounting estimates are based on reasonable and prudent judgment.
• International Accounting Standards,asapplicableinPakistan,havebeenfollowedinpreparation of financial statements and any departure there from has been adequately disclosed in the Annual Accounts.
• The system of internal control is sound in design and has been effectively implemented and monitored.
• There are no significant doubts upon the Bank’s ability to continue as a going concern.
• There has been no material departure from the best practices of corporate governance.
• Performance highlights for the last six year are attached.
• The book value of investment of PensionFund,ProvidentFundandGratuityFundisRs.5,965million,Rs.4,190millionandRs.1,072millionrespectively,asperaudited accounts of these funds fortheyearendedDecember31,2012.
• PatternofShareholding,complying with the requirements prescribed by the code is annexed.
• Statement of Compliance with Code of Corporate Governance is included in the Annual Report.
Annual Report of Allied Bank Limited for the year 2012
25

• Upgraded the Loan Origination System (LOS) by automating various credit application workflows of SME and Seasonal FinancingObligors,toenhancethe efficiency and effectiveness of credit assessment process.
• Your Bank devotes considerable resources in managing the risks to which it is exposed. The momentum attained thus far will be continued in the future through significant investments in human resources,technologyandtraining.
Entity & TFC RatingsThe Pakistan Credit Rating Agency Limited (PACRA) has upgraded the long-term rating of Allied Bank to ‘AA+’ (Double A Plus). The short-term rating of the Bank is already at the highest level of ‘A1+’ (A One Plus). The rating of TFC Issue of Rs. 3,000million(IssueDate:August28,2009)has also been upgraded to ‘AA’ (Double A) by PACRA. The ratings denote very low expectation of credit risk emanating from a very strong
Statement of Internal ControlsThe Board is pleased to endorse the statement made by management relating to internal controls. The Management’s Statement on Internal Controls is included in the Annual Report.
Corporate SustainabilityThe Board is pleased to endorse the Corporate Sustainability initiatives takenbyYourBank,includedintheAnnual Report.
Risk Management FrameworkYour Bank manages risk through a framework of sound risk principles which includes an optimum organizationalstructure,riskassessment and monitoring processes. The Risk Management Group (RMG) is mandated to implement this frameworkasafunction,independentofcommerciallinesofbusiness,
working under the guidance of Board Risk Management Committee (BRMC). RMG took several steps in 2012 to further strengthen the Risk ManagementFramework,whichinclude:
• Achieved permission from SBP to initiate Parallel Run for Alternate Standardized Approach (ASA) for Basel II – Operational Risk CapitalChargeReporting,whichsignifies readiness of the Bank to move to the advance approach of Basel II framework.
• Developed a comprehensive Reputational Risk Management Framework in order to initiate and implement a Reputational Risk Assessment process at Your Bank,andcomplywithBaselIIrequirements.
• Initiated and implemented the Pilot Project of introducing Bank controlled and operated warehouse for Pledge Financing against Seasonal Commodities.
Directors’ Report
26

capacity for timely payment of financial commitments.Meanwhile,theratingofBank’searlierTFCIssueofRs.2,500million(IssueDate:December06,2006) has also been upgraded to ‘AA’ (Double A) by JCR-VIS Credit Rating Company Limited ( JCR-VIS).
Corporate Governance RatingJCR-VIS has upgraded Your Bank’s Corporate Governance to ‘CGR- 8++’ from ‘CGR- 8+’ assigned earlier. The rating denotes a high level of corporate governance. The rating action takes into consideration the continued commitment of the Board andManagementofYourBank,to maintain a sound governance framework.
AuditorsThe present auditors Messrs KPMG TaseerHadi&Co.,CharteredAccountants and Messrs Ernst & YoungFordRhodesSidatHyder,Chartered Accountants retire. Messrs KPMGTaseerHadi&Co.,Chartered
Accountants has completed the term of five years in pursuance of the Code of Corporate Governance. Whereas Messrs Ernst & Young Ford Rhodes SidatHyder,CharteredAccountantsbeing eligible have offered themselves for re-appointment till the conclusion of next AGM.
The Board of Directors on the recommendation of the Audit Committee has recommended Messrs Ernst & Young Ford Rhodes Sidat Hyder,CharteredAccountants,asstatutory auditor for the next term; in place of retiring auditors Messers KPMGTaseerHadi&Co.,CharteredAccountants and Messrs Ernst & YoungFordRhodesSidatHyder,Chartered Accountants.
Events after the Balance Sheet dateThere have not been any material events that occurred subsequent to the date of the Balance Sheet that require adjustments to the enclosed financial statements,exceptthosewhichhavealready been made or disclosed.
AcknowledgementsOn behalf of the Board and Management,wewouldliketoexpress our sincere appreciation to our customers and shareholders for their patronage,StateBankofPakistan,Securities and Exchange Commission of Pakistan and other regulatory bodies for their continuous guidance and support,andemployeesforalltheircontinueddedication,enthusiasmandloyalty.
ForandonbehalfoftheBoard,
Khalid A. SherwaniChief Executive Officer
Dated:February14,2013Place: Lahore
Annual Report of Allied Bank Limited for the year 2012
27

The Management
Khalid A. SherwaniChief Executive Officer
Sheikh Jalees AhmedExecutive Director, Strategic Planning
Muhammad Jawaid IqbalChief, Corporate and Investment Banking
Mohammad Abbas SheikhAdvisor to Chief Executive Officer
Khawaja Mohammad AlmasChief, Commercial & Retail Banking
Rizwan AtaChief, Islamic Banking
Ahmad Faheem KhanActing Chief, Treasury
Muhammad Shahzad SadiqChief, Risk Management
28

Zia Ijaz Chief, Banking Services
Tahir Hassan QureshiChief Financial Officer
Mujahid Ali Chief, Information Technology
Saif ul IslamChief, Special Assets Management
Shafique Ahmed UqailiChief, Human Resource
Tariq MahmoodChief, Banking Systems & Implementation
Abdul Hafeez ButtChief, Compliance
Muhammad RaffatCompany Secretary
Fareed VardagChief, Audit & Risk Review
Annual Report of Allied Bank Limited for the year 2012
29

Management Committees
Asset LiabilityCommittee
(ALCO)
ManagementCommittee(MANCO)
Strategy & BusinessDevelopment Committee
(SBDC)
Operations & ServicesCommittee
(OSC)
Human ResourceCommittee
(HRC)
Central AdministrativeAction Committee
(CAAC)
Risk ManagementCommittee
(RMC)
30

Corporate Structure
Board of Directors
Audit Committeeof the Board
Audit & RiskReview
President & CEO
Commercial & Retail Banking
Corporate & Investment Banking
Treasury
Risk Management
Banking Services
Special Assets Management
Islamic Banking Banking Systems & Implementation
Strategic Planning
Corporate Affairs
Finance
Human Resource
Compliance
Information Technology
Annual Report of Allied Bank Limited for the year 2012
31

Duringtheyear2012,Pakistan’seconomy remained confronted with numerous structural challenges impeding the pace of economic recovery and contributing in macro-economic instability. Fiscal imbalances,worrisomeexternalaccountdeficit,prolongedenergyshortages and dismal law and order situation were the key factors that resulted in gloomy economic conditions.Asaresult,ForeignDirect Investment (FDI) inflows witnessed significant reduction and the exchange rate parity remained under increased pressure. The slow pace of global economic recovery and high oil prices further escalated the structural challenges on the macroeconomic front.
Chief Executive Officer’s Review
32

The growth in real Gross Domestic Product (GDP) has remained below 4%duringthelast5years,whichisinsufficient to cater to the growing needs of a developing nation. During fiscalyear2012,industrialsectoremerged from the aftermath of floods of previous year but posted only a marginalgrowth.However,resiliencein both agricultural and services sectors helped real GDP grow by 3.7% during fiscal year 2012.
The country’s fiscal situation remains in quandary with deficit running as high as 8.5% (including power/commodity arrears) of GDP in fiscal year 2012. Duringthefirsthalfoffiscalyear2013,inflow of Coalition Support Fund (CSF) contained the fiscal deficit in line with the stipulated annual target of4.7%.Nonetheless,highsubsidyexpenditure and low revenues have stretched the budget deficit above target. With bulk of non-tax inflows including3Glicenses,EtisalatarrearsandEurobondofferinginquestion,theburden of heavy budgetary financing fallsupondomesticsources,puttingfurther demands on borrowing from the banking system and also increasing inflationary pressures in the economy.
The country’s external account remained fragile throughout the fiscal year 2012 with current account deficit of USD 4.6 billion compared toasurplusinpreviousyear,mainlydue to huge trade deficit. Although law and order situation and political uncertainty restricted Foreign Direct Investment (FDI) and Foreign PortfolioInvestment(FPI),healthygrowth in inward workers’ remittances supplied some cushion. Though robust workers’ remittances continue to supportcountry’sexternalaccount,thereimbursement of CSF arrears turned current account in surplus during first
halfoffiscalyear2013.Nonetheless,heavy burden of loan repayments to International Monetary Fund (IMF) have led to a decline of USD 1.5 billion in foreign exchange reserves by December 2012 from USD 15.3 billionattheendofJune2012,exertingpressure on the exchange rate.
After hitting a bottom at 6.9% year-on-year(YoY)inNovember2012,theConsumer Price Index (CPI) increased during December 2012 to settle at 7.9%,butremainsonthelowersidefrom 10.1% in January 2012 on the back of lower food and notified gas prices. Core inflation (non-food & non-energy) remained higher than generalCPI,at10.6%YoYin2012.Further,CPIinflationisexpectedtomove upwards going forward on the
back of an expansionary fiscal and monetary policy and a weaker exchange rate. Heavy government borrowings have resulted in average broad money (M2) growth of 14.5% YoY in 2012. Theprivatesectorcredit,thoughrecentlyimprovedslightly,remainedsubdued. The recent downward trend in CPI inflation along with muted private sector credit provided State Bank of Pakistan (SBP) with the impetus to reduce discount rate by 250bps during first half of fiscal year 2013,bringingittosingledigitat9.5%.
Recent IMF commentary regarding monetaryandfiscalpolicyissues,lowforeignexchangereserves,highinflationary expectations and lack of progress on structural issues including energy sector would steer future monetary policy decisions.
Interest Rates(2012)
Jan Feb Mar Apr May Jun Jul Aug Sep Oct Nov Dec
KIBORTbillsDiscount Rate 9
10
11
12
13
2008 2009 2010 2011 2012 2013
GDP Growth(Percentage)
* Source: State Bank of Pakistan 0
1
2
3
4
5
3.7%
1.7%
3.8%
2.4%
3.7% 3.7%*
2008 2009 2010 2011 2012 2013(E)
Annual Report of Allied Bank Limited for the year 2012
33

However,nomajormonetarypolicyshift is expected till a newly elected government is in place.
Aggregate deposits of scheduled banks increased at an average rate of13.8%YoYtoreachRs.6,683billion during 2012 while advances registered YoY growth of 10.4% to reachRs.3,857billiononconsolidatedbasis. Private sector credit growth remainedconstrained,incontrastto Investment book of banks which exhibited YoY average growth of 30.9% toacumulativebalanceofRs.3,889billion during 2012. Banking sector’s Non-Performing Loans (NPLs) have marginally increased by 0.6% YoY to Rs. 617 billion as at September 2012 against Rs. 613 billion as at the end ofSeptember2011,withportfolioinfection ratio (as measured by Gross NPLs / Gross Loans) slightly down to 16.6% from 16.7% during the corresponding period last year.
Banking sector spreads remained under pressure due to interest rate reduction of 450 BPS since August 2011 and Saving Accounts minimum rate fixation by State Bank of Pakistan (SBP)at6%fromMay2012,adverselyimpacting the banking sector’s
profitability during the outgoing calendaryear.However,thesector’searnings growth was assisted by the increasing non-interest income. Any further reduction in discount rate will put additional downward pressure on banking sector margins and almost erode the profitability of the lower tier banks. Continuous focus on enhancing non-interest income and balance sheet volume growth will be required by the sector to offset impact of margin compression. On the macro-economic front,electioneeringandlimitedforeign flows will force the government tocontinueborrowingfrombanks,reducing credit availability to the private sector and further worsening the country’s borrowing to GDP ratio.
Under the above mentioned tough businessenvironment,ourgoalremains focused on ensuring steady profitability stream. Your Bank continued to strengthen branch and alternate delivery channel infrastructure and also simultaneously focused on enhancingcontrolenvironment,toenable Your Bank to operate under the increasingly tough and competitive operating environment. At the same time,continuouseffortsweredirectedtowards ensuring and improving the
asset quality in light of the constrained private credit growth environment and difficult economic conditions. Duringtheyear2012,YourBankwas able to successfully utilize its expanded branch network outreach for achieving substantial growth indeposits.However,inviewoftheprevailingmacro-economicissues,Your Bank focused on cautious growth initsadvancesportfolio.Further,duringtheyear2012,strategicfocuson continuously strengthening our corebankingsystems,creditandother allied financial control systems remained Your Bank’s top priority. Your Bank has also implemented state-of-art Anti Money Laundering (AML) and Know Your Customer (KYC) automated systems during 2012. Your Bank will also continue to strive towards further improving and enhancingcustomerserviceexperience,productinnovationanddevelopment,efficiency in processes and delivery channels and continuous upgrade of policies and procedures in light of the latest COSO and Internal Controls over Financial Reporting (ICFR) framework.
Chief Executive Officer’s Review
34

Commercial & Retail BankingDespite numerous challenges both on economicaswellaspoliticalfronts,year 2012 was a significant year for Commercial & Retail Banking Group (CRBG) in terms of deposit mobilization. The overall deposit book of Your Bank increased to Rs 515 billionfromRs400billionin2011,showing a growth of 29%. This growth is considerably higher than the industry average of 14%. In addition to the accomplishment of core objectives of high volume growth and improvement inmarketshare,CRBG’sstrategicfocus has been on continuously developing new and personalized banking products and services. During theyear,YourBanklaunchedanew‘Platinum’ deposit product which caters to the entire needs of all customer segments. It is available with an option of either term deposit or chequing account and received a very positive response from our target market. Your Bank also launched its pilot projects of ‘Extended Hours’ and ‘Saturday Banking’ during the year.
Your Bank extended countrywide footprint by adding 38 new branches and 17 more ATMs during the year 2012 to reach a total of 875 branches and 618 ATMs. In addition to the newbranches,extensivebranchimprovements are being continuously carried out to provide a pleasant ambiancetoourcustomers.Besides,the group is continuously monitoring the network performance and wherever deemednecessary,relocationof
branches is being pursued to enhance networkaccess,conveniencetothecustomers and Your Bank’s profitability.
Considering the significance and role of Agriculture and SME sectors intheeconomy,YourBankoffersawide range of products and services to this segment. Having the best availabletechnology,structuredproduct programs and a network spreadacrossthecountry,YourBankiswell positioned to become a preferred provider of total banking solutions to these vital segments. In order to meet the challenges associated with agriculturelending,YourBankhasadedicated and qualified field force of Agriculture Credit Officers and more than 150 designated branches. Your Bank continues to adopt a cautious approach towards its consumer lending segment and actively markets
its consumer finance products to its existing customers having acceptable track record via cross sell. During the year,YourBankalsolaunchedanewconsumerlendingproduct,‘AlliedPersonalFinance’,targetedmainlytowards corporate and institutional employees. This product is very helpful in cementing our existing institutional relationships. Your Bank has also re-branded its credit card powered by VISA. The product is being offered at a mark-up rate far lower than the competition thus facilitating the customers.
CRBG has further enhanced the niche customer volumes by extending our unique concept models such as ‘Women Branches’ and ‘Youth Branches’. CRBG remains committed to the overall vision of Your Bank including financial inclusion of the
Business Performance
Annual Report of Allied Bank Limited for the year 2012
35

large unbanked population in the country in a phased manner.
The year 2012 also witnessed the launch of Your Bank’s newly upgraded corporate website to enhance customers’ online experience. Being an interactive electronictouch-point,thewebsitefurtherimprovesend-userexperience,introduces interactive segmentation and provides comprehensive information on our products and services. It further builds network of online visitors by incorporating social media channels. Your Bank’s engagement on Social Media platforms like Facebook and Twitter has contributed to deliver a coherent and diversified communication with online traffic coming from within and outside Pakistan. This real-time interactivity is further augmented by the integration ofAlliedLiveChatfacility,forcustomerfeedback,intothewebsite.Another key initiative during 2012 was of repositioning Your Bank’s brand identity.
Goingforward,theentireCRBGteam is geared towards enhancing its customerbase,bringingconsiderableimprovementinitsdepositsmix,higher service quality standards and developing innovative products and services to cater to banking needs of its target market.
Corporate &Investment BankingThe Corporate and Investment Banking Group (CIBG) maintained its position as one of the leading player of the industry for providing structured financial solutions and advisory services to premier corporate entities.
Duringtheyear2012,YourBankwonnumerous international and domestic awards for its superior performance in the industry. These include: Best Investment Bank in Pakistan – 2012 by EUROMONEYMagazine,UK;BestDomesticInvestmentBank,Pakistan
–2012;BestDebtHouse,Pakistan–2012andBestDeal,Pakistan–2012bytheAssetMagazine,HongKong;Deal of the Year (Infrastructure and Project Finance) – 2012 by The Banker Magazine,UKandTransactionoftheYear–2011byCFASociety,Pakistan.These awards are recognition of CIBG’s endeavors in providing valuable solutions to our corporate clientele.
Considering the difficult environment athand,theGroup’sfocusremainedonthequalityofitsloanbook,gearingup of portfolio monitoring efforts to identify issues with the borrowers at an early stage and speeding up recovery efforts in respect of the infected portfolio. CIBG followed a strategy of increasing exposure to premier corporateclientele,havingstrongbusiness fundamentals and tested re-payment track record by extending further facilities while exiting from or reducing exposure to weak borrowers.
Chief Executive Officer’s Review
36

The Capital Markets business substantially grew during the year as capital gains realized on sale of listed shares increased from Rs 846 million in2011toRs2,002millionin2012,showing an increase of over 136%. Similarly,dividendincomefromthelisted shares portfolio increased from Rs1,152millionin2011toRs1,769millionin2012,showinganincreaseof 53%.
Our Home Remittance business saw a 27% growth in volumes disbursed on behalf of international and local partners,andwehavecontinuedto focus on service excellence by undertaking major upgrades to our existing systems in order to deliver better efficiency and controls in this highly competitive segment. The Financial Institutions & Cash Management (FI & CM ) Division maintained a strong transaction banking capability both domestically andinternationally,usingsophisticated,customizable technology as our key differentiator. Our Cash Management team has maintained its strong growth trend in the corporate and institutional segments,withmarket-leadingreceivablesmanagement,disbursementand reconciliation services. We have harnessed the capabilities of our advanced delivery systems and our nationwide real-time online branch network to enhance our market share in the existing portfolio . The Financial Institutions business has continued to build and develop ABL’s global institutional banking
relationships,tofacilitateourTrade,Treasury,Guaranteesandpaymentsrequirements. Your Bank has initiated it’s international presence through launch of Representative Office in Dubai and a Wholesale Banking Branch in Bahrain during the year. These initiatives shall provide key links to the burgeoning economic opportunities in the Gulf region.
Treasury & FX ManagementBeing cognizant of the developments oneconomicfrontduringtheyear,Treasury played a pivotal role to ensure optimum profitable utilization of Your Bank’s funds both in money market and foreign exchange. In collaboration withothergroups,Treasuryalsoplayedits part in growing volumes of trade related business activities.
The year 2012 witnessed continued volatility in the foreign exchange market as Rupee depreciated by the same 5.03% in 2012 as it depreciated in2011.Duringtheyear,Treasurycontinued to serve Your Bank’s clientele,advisingthemaboutmarket
trends and expectations resulting in volume growth for Your Bank and also further strengthening the relationship with the customers.
Further,majorshiftsoccurredinSBP’sMonetary Policy stance for managing the challenges faced by the economy. Treasury took a proactive approach and re-profiled Your Bank’s investment portfolio to hedge future earnings against downward shift in the yield curve,therebylockinghigherreturnonYour Bank’s investment portfolio.
Special Assets Management (SAMG)Thenegativeeconomicindicators,internal security threats and energy crises were the major factors contributing to burgeoning bad loans in Pakistan during the last few years. These factors continued to adversely impact business and industry in particular and banks in general during 2012.
Annual Report of Allied Bank Limited for the year 2012
37

However,themanagementadapteda focused approach during the year 2012 to keep the Non-Performing Loans (NPL) to a minimum level. The coherence and team work amongst the Business Groups and SAMG enabled Your Bank to make recoveries and regularization of over Rs 3 billion for the fourth consecutive year and retaining its position among the banks with the lowest infection ratio amongst the peers and far below the industry average. Goingforward,alltheBusinessGroupsin coordination with the SAMG are monitoring the weaker sectors in the economy to remain vigilant against future NPLs in any industry or business within the economy. We expect to further reduce the loan portfolio infection ratio in the coming years.
Islamic BankingOne of the basic features of Islamic economics system is an equitable distribution of wealth among the differentfactorsofproductions,therebydiscouraging concentration of wealth in few hands and efficient flow of money within the economy. Islamic Banking is,therefore,seenasapivotalsteptoachieve the economic and social goals under Islamic Shariah.
Islamic banking industry in Pakistan has witnessed substantial growth from its launch in 2002 to achieve a networkofabout1,000branchesandover 500 windows across the country by 2012. Its assets share constitutes 8% of the country’s entire banking system (September 2012). The future outlook of Islamic Banking is also quite positive with its rapidly growing acceptability both amongst the providers and users of financial services and is projected
to further increase its share in the banking system in the coming years. Consequently,YourBankhasdecidedto actively participate in the overall growth of Islamic banking industry.
Your Bank has recently established its Islamic Banking Group (IBG) with a vision “To be the first choice Sharia Compliant Financial Services Provider for the customers”. With this vision andprospects,awellexperiencedteam has been formed. IBG setup will not only provide Sharia compliant value added banking solutions to our existing customers but will also focus on establishing new relationships for Your Bank.
Islamic banking is expected to start full-fledgedoperationsin3rdquarter,2013 and our long term strategy is to gradually invest and expand our Islamic banking outreach and become a major player in this business segment.
Human ResourceYour Bank recognizes importance of its human capital and considers it a key asset and an essential contributor in fulfilling its growth strategy. Human Resource Group (HRG) remained actively involved to ensure that Your Bank remains as one of the best places to work in Pakistan by providing achallengingworkenvironment,rewarding the dedicated team members for their performance and assisting the organization towards accomplishment of its vision. HRG continued to induct fresh post-graduates in the disciplines ofbanking,economicsandinformationtechnology through induction of fresh batch of management trainee officers. Similarly,trainingofcurrentemployees remained one of the focus areasofHRGbyofferingbanking,general management and soft skills programs at our three Management Development Centers (MDCs)
IslamicBanking
Chief Executive Officer’s Review
38

Annual Report of Allied Bank Limited for the year 2012
39

atKarachi,LahoreandIslamabadthroughouttheyear.Atotalof12,578participants attended 801 courses in different batches throughout the year. Selected employees were also provided opportunity to attend overseas training programs in different countries. Your Bank also launched an e-Learning Portal providing an open gateway to a world of continuous learning and development for all of its employees. It shall encourage employees to enhance their understanding in a variety of functional and professional development areas via online programs. Total training investment made on employee development in 2012 is over Rs: 81 million. In2012,HRG’smainfocuswastostrengthen Your Bank’s human capital base by acquiring best available human resource talent and providing them fast career growth opportunities. This is in line with Your Bank’s aim to become an ‘employer of choice’ by offering market
basedcompetitivesalarypackages,impartingbesttraining,providingcrossfunctional rotation and entrusting young leadership by assigning them key responsibilities. Your Bank has introduced revised Career Paths for thecorepositions,especiallyatretailbranches where almost 70% population of overall employees exists. These positions include Management Trainee Officers(MTOs),Tellers,andBusinessDevelopment Officers (BDOs). Consistent with HRG’s efforts to improve process efficiency and streamlineemployeebenefitstructure,theEmployeeServiceRules,CodeofConduct,LeaveandTravelRulesandCar Benefit Allowance policies were revised during the year.
In order to automate performance appraisalprocess,HRGimplementeda new Online Appraisal Management System (OPAMS) with an aim to improve the process efficiency and
accuracy. OPAMS is a work flow based process which runs on Your Bank’s existing Share Point Portal in true onlineenvironment.Further,inlinewith Your Bank’s corporate strategy to prepare organization for the future andbuilditsinfrastructure,HRGhasacquiredlicensetouseHarmony,anewHuman Capital Management System (HCM). HCM application is a robust Human Resource Information System (HRIS) with dynamic features. Beinganequalopportunityemployer,Your Bank persisted with its commitment to gender equality and making female employees an effective contributor in the economic activities. Female employment ratio at Your Bank reached to 13% of the total employees in the year 2012. A comprehensive organization wide exercise of organizational restructuring was carried out in 2012. Accordingly organizational structures of all
Chief Executive Officer’s Review
40

business and support groups have been revised. A comprehensive exercise of standardization of functional titles across the Bank has also been completed during the year.
Service QualityTo ensure the implementation of YourBank’sservicemission,thecoreobjective of Service Quality (SQ) istostrengthenserviceculture,byensuring that services at all customer touch points are delivered above the prescribed bench marks. Being a changeagent,SQ playsapivotalrolein building a strong relationship with our customers. SQ’s Quality Assurance team plays an important role in facilitating business and support segments. Their aim is to build a service culture across all segments of Your Bank by institutionalizing and monitoring service standards to reduce service
delivery turnaround time not only to meet the regulatory requirements but to surpass customers’ expectation. Our Service Excellence unit is responsible for gauging ‘voice of customer’ through satisfaction surveys and mystery shoppingexercises,bothin-houseandthrough external agencies.
To ensure that customers are provided with superior services and to assess firsthandcustomerexperience,anewplatform of ‘Web Based Satisfaction Survey’ has also been made available on thecorporatewebsite,wherecustomerscan provide feedback on their overall banking experience. In line with Your Bank’s desire to exceedcustomerexpectations,SQhasa dedicated Complaint Management team,whichisresponsibletoaddresscustomer grievances proficiently and identify areas needing improvement.
Your Bank has provided its customers with different channels to voice their concerns. A new platform i.e. Complaint & Suggestion Form has recently been introduced and placed at all branches. It provides customers with a convenient mode for registration of their complaints and suggestions.
Our service channel of Allied Phone Banking,available24/7,isalsoproviding a host of personalized and secured banking services to our customers.
Risk ManagementRisk Management involves setting the most appropriate course of action under uncertaintybyidentifying,assessing,understanding,communicatingandaddressing risk issues. We recognize management of risks as a vital component of our strategy. Your Bank’s Risk Management Group (RMG) isactivelymeasuring,monitoring,
Annual Report of Allied Bank Limited for the year 2012
41

controlling,reportingandmanagingrisks. Modern analytical tools are used in combination with conventional practicestoassesscredit,operational,market and liquidity risks. Risk appetite in the form of regulatory capital allocation has been determined for the above mentioned risk components.
Duringtheyearunderreview,RMGfocused on automation of key processes and robust implementation of policies and procedures to reinforce risk management practices in all domains.
RMG has been cognizant of newly emerging domains of risk components and putting its best efforts for managing the same most effectively. In this perspective Your Bank has successfully achieved permission from SBP to initiate Parallel Run for Alternate Standardized Approach (ASA) for Basel II – Operational Risk CapitalChargeReporting,whichsignifies readiness of the Bank to move to advanced approach of Basel II framework.Further,RMGdevelopeda comprehensive Reputational Risk Management Framework in order to initiate and implement a Reputational RiskAssessmentprocessatYourBank,and comply with Basel II requirements.
Considering the inherent risks involved in financing against pledge of seasonal commodities,RMGhasalsoinitiatedand implemented a pilot project of Bank controlled and operated warehouse for Pledge Financing.
Automation of credit approval processesalsoremainedonpriority,andinlinewiththisobjective,ourLoan Origination System (LOS) has been upgraded by automating various credit application workflows for SME and Seasonal Financing Obligors to enhance the efficiency and effectiveness of credit assessment process.
TechnologyInlinewithourstrategicfocus,YourBank is continuously embarking on various initiatives to optimally utilize the core banking and other operating systems to provide the most efficient customer service experience. In line withthisstrategy,YourBankhad272branches operating on Temenos (T-24) Core Banking solution as at the close of 2011 and targeted to migrate additional 300 Unibank branches to the new T-24 system by the end of 2012. Your Bank surpassed the target and successfully
implemented the T-24 Core Banking solution at additional 383 branches during 2012. Your Bank at the close of 2012 has migrated 655 branches on the new T-24 system and through thiscontinuingtransformationprocess,T24 system will be implemented on the remaining branches during 2013. In ordertofacilitatecustomers,YourBankhas taken the initiative to upgrade the existing infrastructure to ensure smooth running of branch operations. As of 31December2012,infrastructureofapproximately 765 locations has been upgraded with dual communication infrastructure by utilizing industry’s best available communication media.
To protect against Money Laundering activities,YourBankhasimplementeda state of the art Anti Money Laundering solution to comply with the internal and external requirements. In order to strengthen the internal processes and to shorten the decision makingprocess,YourBankhasautomated various approval processes andworkflows,bringingefficienciesinthe system. An automated system and applicationmonitoringmechanism,inadditiontonetworkmonitoringsystem,hasalsobeenimplemented,whichgeneratesalertstotheconcernedstaff,
Chief Executive Officer’s Review
42

Annual Report of Allied Bank Limited for the year 2012
43

before reaching critical level. This has been helping Your Bank to keep the uptime of the system and services as high as possible.
Alternate Delivery ChannelsIn pursuit to enhance technological savvyimage,YourBankhasbeenkeenly involved in putting efforts to add new channels to its existing Alternate Delivery Channels. Your Bank maintained its ATM network performance by achieving industry’s highest ATM Uptime and by extending Cash withdrawal acquiring facility to other banks’ customers to the tune of 42% of total ATM cash
disbursement through an extensive network of 618 ATMs located across the country. This has not only resulted in higher fee based income stream but has further strengthened the Bank’s strong standing as the top acquirer in the industry.
Another landmark has been achieved by Your Bank with a growth of 23% during 2012 to reach a total number of 1,080,429DebitCardsincirculation.
Banking Services Banking Services Group (BSG) continued to enhance systems and processes aimed at bringing further improvements in customer services
and internal controls. Centralized end to end Account Opening was further extended,bringing643branchesunderthe process.
BSG was also engaged in continuous efforts to increase Your Bank’s network outreach by completing various infrastructure projects in addition to the standardized offices and branches with consistent corporate outlook and modern working environment. Completion of the new Head Office building and shifting of all offices to one location was a land mark achievement for Your Bank during the year.
Chief Executive Officer’s Review
44
Your Bank was amongst the first few banks in Pakistan to migrate its SWIFT infrastructure to Release 7 in order to execute more secure and stable financial transfers for its customers. Your Bank is actively pursuing various energyconservationobjectives,including enforcement of strict discipline on energy consumption; substitution from high to low energy consuming equipment e.g. LED lights,activeexplorationofalternateenergysolutionslikesolarenergy,and proper insulation of all new buildings to reduce heating and cooling requirements. The above objectives are being accomplished without compromising on customer service and efficiency.
ComplianceThe Compliance Group worked diligently in ensuring strict adherence to the regulatory requirements and the Bank’s internal policies and procedures. Specific training sessions were held to apprise the field functionaries as to Anti Money Laundering (AML) and Know Your Customer (KYC) policies and procedures. To further enhanceitscapabilities,theGrouphasimplemented the most advanced AML and KYC modules of Financial Crime & Compliance Management (FCCM) System during 2012 to replace the legacy system.
Ratings Entity Ratings
The Pakistan Credit Rating Agency Limited (PACRA) has upgraded long-term rating of Your Bank to “AA+”from“AA”,whileshort-termrating has been maintained at the highest possible level of “A1+”. These ratings denote a very low expectation of credit risk emanating from a very
strong capacity for timely payment of financial commitments and not being significantly vulnerable to foreseeable events.
TFCs Issues
JCR-VIS Credit Rating Company Limited ( JCR-VIS) has upgraded rating of Your Bank’s 1st TFC Issue (issuedate:December06,2006)to“AA (Double A) with Stable Outlook” from “AA- (Double A Minus)”. Rating of the Bank’s second TFC Issue (issue date:August28,2009)hasalsobeenupgraded to “AA (Double A)” from “AA- (Double A Minus)” by PACRA. These ratings denote a very strong capacity for timely payment of financial commitments there by reflecting the high credit quality of Your Bank.
Corporate Governance Rating
JCR-VIS has upgraded Corporate Governance Rating (CGR) rating of Your Bank to “CGR- 8++” from “CGR-8+”,whichdenotes‘highlevelof corporate governance’.
CGRs are based on evaluation of key governance areas of the rated institution,whichincluderegulatorycompliance; board oversight; management profile; self-regulation; financial transparency and relationship with stakeholders. The rating takes into consideration the continued commitment of the Board and Management of Your Bank to maintain a sound governance framework.
As part of our initiatives to constantly improve and compare ourselves against best international practices and bench-marks,YourBankvoluntarilygetsitselfratedfromMoody’s’InvestorServices,one of the premier International Rating Agency. The ratings [Bank Deposits - Foreign Currency: Caa2/ NP; Bank
Deposits - Local Currency: B3/NP; BankFinancialStrength:E],thoughheavily influenced by the Sovereign RatingsofPakistan,areatparwiththeinternational ratings of Tier-1 Peer Banks in Pakistan as well as important regional players.
Asset Management Company The ABL Asset Management CompanyLimited(AMC),awhollyownedsubsidiaryofYourBank,hasestablished itself as a prominent player in the asset management industry of Pakistan. The AMC is now managing six open end funds and these provided impressive returns and were consistently ranked in the top quartile throughout 2012 in their respective categories.Goingforward,theAMCintends to launch three new funds.
Duringtheyear,AMChasbecomean ISO/IEC 27001:2005 certified company. The Information Security Management System (ISMS) covers the activities of the AMC’s Information Technology department forthebusinessapplications,relatingtotheoperation,maintenanceandmanagementofserver,routers,firewalls,applications,networks,electroniccommunication and web access.
JCR – VIS has also upgraded its outlook to Positive from Stable while maintaining the Management Quality Rating of ABL Asset Management Company Limited at AM2-.
The AMC has also adopted the Global Investment Performance Standards (GIPS),developedbytheCFAInstitute,USA,fortheperformancepresentation of the Funds under its management. GIPS are a set of ethical standards for the presentation and
Annual Report of Allied Bank Limited for the year 2012
45

calculationofinvestmentperformance,designed to ensure fair representation and full disclosure of a fund manager’s performance information.
Financial AnalysisBalance Sheet Growth & Mix
Asset base of Your Bank registered a YoY growth of 22.54% to reach at Rs.631,915millionasatDecember31,2012.Atthesametime,theriskabsorption capacity of Your Bank strengthened,asequitybaseincreasedby17.5%toreachRs.50,916millionasatDecember31,2012comparedtoRs.43,340millionasatDecember31,2011. The total equity to asset ratio of Your Bank stood at 8.1% at December 31,2012.TheregulatoryCapitalAdequacy Ratio of Your Bank as at December31,2012standsat16.17%.
Despite the challenging environment athand,advancesregistereda10.9%increase from last year’s level to stand atRs.271,084millionasatDecember31,2012withtheirshareinassetmixdroppingto42.9%.Resultantly,theAdvance Deposits Ratio declined to 52.7%atDecember31,2012from61.2%atDecember31,2011.
2008 2009 2010 2011 2012 2013
Size of Financial Position(Rs. in billion)
CAGR: 14.58% 0
100
200
300
400
500
600
700
800
320367
418450
516
632
2007 2008 2009 2010 2011 2012
Segmental Advances – Performing(Percentage)
CIBG CRBG Others
82%
16%
3%
Average Deposit Composition(Percentage)
Current SavingCurrent Remunerative Term
29%
25% 30%
16%
Investments(Percentage)
Market treasury bills & PIBS Others
Shares
Open end Mutual Fund Units
TFC & Sukuk
88%
4%
1%
0%
6%
The prudent lending strategy backed byasoundriskinfrastructure,rigorousremedial and recovery efforts has enabled Your Bank to contain the rise in quantum of Non-Performing Portfolio. Your Bank’s NPLs ratio improved to 7.2% as at December 31,2012comparedto7.8%asatDec31,2011,andissubstantiallylowercompared to the industry average of 16.6% (September 2012). The coverage of the infected portfolio also remained strongat86%atDecember31,2012compared to an industry average of 70.5% ( September 2012). Investments with 36.64% YoY growth reachedalevelofRs.267,403millionasatDecember31,2012andtheirshare in the total asset mix increased to 42.3% compared to 37.9% as at December31,2011.Thebulkoftheinvestments are dominated by short-
term risk free government securities.
The deposits base expanded by 28.8% during2012toreachatRs.514,707millionasatDecember31,2012comparedtoRs.399,561millionasatDecember31,2011.Thecurrentandlow cost Savings Deposits mix stood at 52.8%.
Profitability
Your Bank maintained its strategic focus of increasing the shareholders’ value and maintained healthy profitability despite operating under an increasing tough business environment and managing all these challenges on a proactive basis. The Profit Before Tax and After Tax during 2012 rose by 5.04%and15.2%,respectivelyoverthepreviousyear.Consequently,theEPS
Chief Executive Officer’s Review
46

Pro�t and Loss Composition(Rs. in billion)
0
10
20
30
40
50
60
InterestIncome
InterestExpense
Non-InterestIncome
Provision &Write O�
OperatingExpenses
Taxation Pro�t After Tax
20112012
51.8
1
26.6
4 31.1
4
3.27
1.36
6.95
13.7
9
13.6
814
.92
4.97
4.19 10
.14
11.6
8
49.5
020082007 2009 2010 2011 2012
Gross Income Composition(Rs. in million)
0
5,000
10,000
15,000
20,000
25,000
30,000
Net Interest IncomeNon-Interest Income
11,1
083,
920
13,2
984,
897
18,7
005,
958
22,5
655,
672
25,1
716,
950
18,3
6113
,794
2007 2008 2009 2010 2011 2012
20082007 2009 2010 2011 2012
ROE & ROA(Percentage)
0
5
10
15
20
25
30
35
ROEROA
23.5
1.42
1.21 1.81
1.89 2.10
2.03
21.2
30.5
28.8 29
.5
29.0
2007 2008 2009 2010 2011 2012
20082007 2009 2010 2011 2012
Operating Income beforeProvision and Tax(Rs. in million)
CAGR 14.32% 0
2,000
4,000
6,000
8,000
10,000
12,000
14,000
16,000
18,000
20,000
8,82
7 9,68
2
14,9
52 16,6
69 18,3
76
17,2
33
2007 2008 2009 2010 2011 2012
improved from Rs. 10.71 in 2011 to Rs. 12.34 in 2012. The average ROA and ROE of Your Bank almost remained at the same level of last year and stood at 2% and 29% respectively.
Net Mark-up / Interest earned decreased byRs.6,810millionover2011toRs.18,360million,attributablemainlytohigher deployment of funds towards dividend bearing investment activities. Consequently,NonMark-up / InterestIncome increased by 98.5% over 2011 to reachatRs.13,794millionduring2012,includingdividendincome,whichsurgedby an impressive 214% to peak at Rs. 8,433million.Despitetoughcompetitiveenvironment and slow pace of business activities,themanagementisendeavoringto further optimize the contribution of fee and commission in the overall income of Your Bank in coming years through leveraging strong technology platform and offering new innovative products and services to satisfy customers’ needs.
Your Bank’s Administrative Expenses increasedby10.5%toRs.14,546million.The rise is broadly in line with the inflationary trends prevailing during the year,increasingoutlaysoninfrastructurestrengthening,technologicalupgradationand rising utility costs.
The provisions against advances and investmentsreducedbyRs.2,538millionto Rs 650 million during 2012 compared tothepreviousyear,attributabletoactive monitoring to curb the growth in Non-Performing Loans (NPLs) and consistent recovery efforts against NPLs. The provision coverage against advances stood strong at 86% at end-Dec 2012. No benefit of FSV has been taken while determining the provision against NPLs also in 2012 as allowed under BSD CircularNo.02of2010datedJune03,2010.
Annual Report of Allied Bank Limited for the year 2012
47

Future OutlookGoingtowards2013,thereareconsiderableeconomic,politicalandsocial challenges surrounding Pakistan. Theexternalaccountpressures,highratioofunemploymentandilliteracy,severeenergycrisis,worseninglawand order situation had an extremely adverse impact on short term growth prospects,revivalofthebusinessenvironment in particular and overall economyingeneral.However,positiveeconomic factors like continuous rise inforeignremittances,reductioninConsumer Price Inflation (CPI) and thrivingagrarianeconomy,signifythat
there is no doubt that Pakistan has tremendous economic potential and its economy can turn around quickly in the future.
Considering the overall macro-economicandgeo-politicaloutlook,significant pressure is expected on banking sector margins in the wake of low benchmark rates and limited financing opportunities. Accordingly Your Bank intends to focus on building and maintaining quality advances portfolio and to enhance its focus on customer service quality and major cost rationalization initiatives through continuous improvement in automation
andproductinnovations.Similarly,Your Bank intends to focus on low cost core deposit mix in future by effectively utilizing our extensive branch network and new upcoming initiatives like the launchofMobileBanking,BranchlessBanking and Islamic Banking. Your Bank is confident that the above initiatives shall enable it to maintain a stable performance trend going forward.
Khalid A. SherwaniChief Executive Officer
Dated:February14,2013
Chief Executive Officer’s Review
48

Entity Rating of Allied Bankby PACRA and JCR - VIS
Long Term: AA+ Very high credit quality. ‘AA+’ ratings denote a very low expectation of credit risk with a very strong capacity for timely payment of financial commitments. This capacity is not significantly vulnerable to foreseeable events
Short Term: A1+ Obligations supported by the highest capacity for timely repayment.
Corporate Governance Rating CGR8 ++ High level of Corporate Governance.
TFC – I “AA” TFC – II “AA”
Annual Report of Allied Bank Limited for the year 2012
49

Performance Highlights
December 31 2012 2011 2010 2009 2008 2007
BALANCE SHEET
ASSETS Cashandbalanceswithtreasuryandotherbanks 44,381 38,159 31,845 27,716 25,751 30,408Lendingtofinancialinstitutions 10,721 1,362 11,489 28,123 15,793 18,419Investments-Gross 269,351 198,398 123,855 96,975 84,602 84,151Advances-Gross 288,889 262,137 267,776 249,887 223,640 178,524OperatingFixedassets 19,871 18,087 15,360 12,447 11,134 7,549Otherassets 18,455 17,964 17,719 17,955 18,399 11,367Totalassets-Gross 651,668 536,107 468,044 433,103 379,319 330,418Provisionsagainstnon-performingadvances (17,805) (17,704) (15,431) (12,543) (10,668) (10,117)Provisionsagainstdiminutioninvalueofinvestment (1,948) (2,704) (2,682) (2,186) (1,956) (192)Totalassets-netofprovision 631,915 515,699 449,931 418,374 366,695 320,109 LIABILITIES Customerdeposits 514,707 399,562 371,284 328,875 297,475 263,972Interbankborrowings 38,916 49,993 20,774 39,819 27,778 22,934Billspayable 6,203 4,015 4,119 3,162 2,952 3,494Otherliabilities 15,684 13,296 12,284 11,061 13,636 7,332Sub-ordinatedloans 5,490 5,493 5,495 5,497 2,498 2,499Total Liabilities 581,000 472,359 413,956 388,414 344,339 300,231NET ASSETS 50,915 43,340 35,975 29,960 22,356 19,878Sharecapital 9,463 8,603 7,821 7,110 6,464 5,386Sharepremium - 202 984 1,695 2,341 3,419Reserves 10,906 8,561 6,533 4,888 3,464 2,632Un-appropriatedprofit 22,558 20,255 15,829 12,198 8,537 6,971Equity-TierI 42,927 37,621 31,167 25,891 20,806 18,408Surplusonrevaluationofassets 7,988 5,719 4,808 4,069 1,550 1,470TotalEquity 50,915 43,340 35,975 29,960 22,356 19,878 PROFITABILITY Markup/Rerurn/Interestearned 49,503 51,814 44,993 41,122 30,571 21,201Markup/Rerurn/Interestexpensed (31,142) (26,643) (22,428) (22,422) (17,273) (10,093)Net Markup / Interest income 18,361 25,171 22,565 18,700 13,298 11,108Fee,Commission,BrokerageandExchangeincome 3,169 3,395 2,910 3,470 3,266 2,258Capitalgain&Dividendincome 10,353 3,507 2,511 2,452 1,571 1,585Other income 272 48 251 36 59 77 Non interest income 13,794 6,950 5,672 5,958 4,896 3,920Gross income 32,155 32,121 28,237 24,658 18,194 15,028Operatingexpenses (14,818) (13,684) (11,529) (9,609) (8,431) (6,173)Profitbeforeprovisions 17,337 18,437 16,708 15,049 9,763 8,855Donations (104) (61) (38) (97) (82) (28) Provisions-(charge)/reversal (1,362) (3,267) (4,326) (4,416) (3,561) (2,874)Profit before taxation 15,871 15,109 12,344 10,536 6,120 5,953Taxation (4,195) (4,969) (4,118) (3,414) (1,964) (1,877)Profit after taxation 11,676 10,140 8,226 7,122 4,156 4,076 CASH FLOW STATEMENT - SUMMARY CashFlowfromOperatingActivities 75,479 86,807 36,200 10,811 564 46,350CashFlowfromInvestingActivities (62,844) (76,727) (28,822) (10,000) (3,544) (38,461)CashFlowfromFinancingActivities (6,379) (3,706) (2,982) 926 (1,755) (1,904) Cash & Cash equivalent at the Beginning of the Year 37,944 31,725 27,276 25,190 29,842 24,303Effect of Exchange Rate changes on Cash & Cash equivalent 181 26 79 428 511 65 Cash & Cash equivalent at the End of the Year 44,381 38,125 31,751 27,355 25,618 30,353
Rs. in Millions
50

December 31 2012 2011 2010 2009 2008 2007
FINANCIAL RATIOS Return on equity 29.0% 29.5% 28.8% 30.5% 21.2% 23.5%Return on assets 2.03% 2.10% 1.89% 1.81% 1.21% 1.42%Profit before tax ratio 49.4% 47.0% 43.7% 42.7% 33.6% 39.6%Gross spread ratio (Net markup income / Gross markup income) 37.1% 48.6% 50.2% 45.5% 43.5% 52.4%Return on Capital employed 26.5% 26.7% 25.6% 28.0% 19.8% 21.6%Advances to deposits ratio (ADR) - Gross 56.1% 65.6% 72.3% 76.0% 75.2% 67.6%Advances to deposits ratio (ADR) - Net 52.7% 61.2% 68.2% 72.2% 71.6% 63.8%Income / Expense ratio 2.2 2.3 2.4 2.6 2.2 2.4 Cost to revenue ratio 46.1% 42.6% 40.8% 39.0% 46.3% 41.1%Growth in gross income 0.1% 14% 15% 36% 21% 17%Growth in net profit after tax 15% 23% 15% 71% 2% -7%Total assets to shareholders’ funds (Tier 1) - Times 14.7 13.7 14.4 16.2 17.6 17.4 Total assets to shareholders’ funds (Tier 2) - Times 12.4 11.9 12.5 14.0 16.4 16.1 Intermediation cost ratio 3.2% 3.6% 3.3% 3.1% 3.0% 2.6%NPL ratio 7.2% 7.8% 7.0% 6.5% 6.2% 6.4%Net infection ratio 1.1% 1.1% 1.3% 1.6% 1.5% 0.7%Weighted average cost of debt 6.39% 6.35% 6.13% 6.84% 5.53% 4.21%Capital Adequacy ratio 16.17% 13.43% 13.84% 13.47% 10.90% 10.26%Breakup value per share without Surplus on Revaluation of Fixed Assets** - Rupees per share 50.1 42.0 35.1 28.7 20.6 19.4Breakup value per share including the effect of Surplus on Revaluation of Fixed Assets** - Rupees per share 53.8 45.8 38.0 31.7 23.6 21.0Weighted Average cost of deposit 5.39% 5.38% 5.15% 6.10% 5.10% 3.98%Earning asset to total asset ratio 86.91% 85.61% 85.74% 86.11% 84.92% 84.59% SHARE INFORMATION Cash Dividend Per Share - Rupees per share 6.50 5.00 4.00 4.00 2.50 3.00 Bonus Shares issues 10% 10% 10% 10% 10% 20%Dividend Yield Ratio (based on cash dividend) 8.8% 9.3% 5.7% 6.8% 8.0% 2.3%Dividend payout ratio (Total payout) 61% 51% 48% 50% 54% 66%Earning Per Share (EPS)* - Rupees per share 12.34 10.71 8.69 7.53 4.39 4.31 Price to earning ratio* (PE x) - Times 6.0 4.6 6.7 5.9 4.9 17.2 Price to book value ratio - Times 1.37 1.07 1.53 1.39 0.91 3.53 Market value per share - at the end of the year 73.5 53.9 70.5 58.7 31.3 130.2 Market value per share - highest / lowest during the year 76.00 / 52.00 74.00 / 53.35 71.11 / 48.51 66.30 / 19.85 156.45 / 31.32 145.45 / 93.00Net assets per share - Rupees per share 53.8 50.4 46.0 42.1 34.6 36.9 MarketCapitalisation-RupeesinMillion 69,547 46,345 55,138 41,757 20,244 70,104 INDUSTRY SHARE Deposits 7.7% 6.8% 7.2% 7.5% 7.7% 7.3%Advances 8.6% 8.4% 7.7% 7.5% 7.1% 6.7%Total Assets 7.0% 6.6% 6.6% 6.9% 7.0% 6.6% OTHER INFORMATION Non-performingloans(NPLs)-RupeesinMillion 20,668 20,452 18,688 16,281 13,772 11,355ImportsandExportsbusiness-RupeesinMillion 279,548 249,573 192,973 196,211 194,186 150,698Numberofemployees-Permanent 9,291 9,496 8,947 8,713 8,325 8,181Numberofemployees-Total 13,059 13,029 12,588 11,690 11,108 10,297Number of branches 875 837 806 779 766 757 Number of ATMs 618 601 574 530 489 397 * EPS for prior years has been adjusted to affect bonus shares issue during 2012. ** Adjusted for prior years to affect bonus shares issued during 2012.
Annual Report of Allied Bank Limited for the year 2012
51

Performance Highlights
Cash Flow Analysis(Rs. in million)
2007 2008 2009 2010 2011 2012-80000
-60000
-40000
-20000
0
20000
40000
60000
80000
100000 Operating Activites Investing Activities Financing Activities
20082007 2009 2010 2011 2012
Advances & Deposits(Rs. in million)
0
100,000
200,000
300,000
400,000
500,000
600,000
DepositsAdvances
2007 2008 2009 2010 2011 2012
263,
972
178,
524
297,
475
223,
640 32
8,87
524
9,88
7
371,
284
267,
776
399,
562
262,
137
514,
707
288,
889
2008 2009 2010 2011 2012 2013
Pro�t after Tax(Rs. in million) CAGR: 23.43%
0
2,000
4,000
6,000
8,000
10,000
12,000
2007
4,07
6
4,15
6
7,12
2 8,22
6 10,1
40 11,6
76
2008 2009 2010 2011 2012
2008 2009 2010 2011 2012 2013
Earnings per Share - Historical(Rupees) CAGR: 10.27%
0
3
6
9
12
15
2007 2008 2009 2010 2011 2012
7.57
6.43
10.0
2
10.5
2 11.7
9
12.3
4
2008 2009 2010 2011 2012 2013
Break-up-Value(Rupees per share) CAGR: 20.87%
0
10
20
30
40
50
60
2007 2008 2009 2010 2011 2012
19.4
1
20.6
3 28.7
0 35.0
9 41.9
6 50.0
8
2008 2009 2010 2011 2012 2013
Cash Dividend(Rupees per share)
0
1
2
3
4
5
6
7
2007 2008 2009 2010 2011 2012
3
2.5
4 4
5
6.5
ABL Share Price Movement(Rupees)
Year Share Price +/-% Highest Lowest AVG
2012 73.49 36.42% 76.00 52.00 66.53
2011 53.87 -23.59% 74.00 53.35 62.81
2010 70.50 19.44% 71.24 48.51 59.13
2009 58.73 87.52% 66.30 19.85 43.67
2008 31.32 -75.94% 161.50 31.32 90.90
2007 130.15 39.20% 147.50 92.05 116.93
52

Total Shareholders Equity(Rs. in million) CAGR: 20.70%
2007
2008
2009
2010
2011
2012
0 10,000 20,000 30,000 40,000 50,000 60,000
50,915
43,340
35,975
29,960
22,356
19,878
Gross Income(Rs. in million) CAGR: 16.43%
2007
2008
2009
2010
2011
2012
0 5,000 10,000 15,000 20,000 25,000 30,000 35,000
32,155
32,121
28,237
24,658
18,194
15,028
Net Interest Income(Rs. in million) CAGR: 10.57%
2007
2008
2009
2010
2011
2012
0 5,000 10,000 15,000 20,000 25,000 30,000
18,361
25,171
22,565
18,700
13,298
11,108
Composition of Statement of Financial Position(Rs. in million) CAGR
Assets: 14.57%, Liabilities: 14.12%, Equity: 20.70%
2007
2008
2009
2010
2011
2012
0 100,000 200,000 300,000 400,000 500,000 600,000 700,000
Annual Report of Allied Bank Limited for the year 2012
53

Horizontal Analysis
2012 12 Vs 11 2011 11 Vs 10 2010 10 Vs 09 2009 09 Vs 08 2008 08 Vs 07 2007 07 Vs 06 Rs. M % Rs. M % Rs. M % Rs. M % Rs. M % Rs. M %
STATEMENT OF FINANCIAL POSITION
ASSETSCashandbalanceswithtreasuryandotherbanks 44,381 16% 38,159 20% 31,845 15% 27,716 8% 25,751 -15% 30,408 23%Lendingtofinancialinstitutions 10,721 687% 1,362 -88% 11,489 -59% 28,123 78% 15,793 -145% 18,419 -3%Investments-Net 267,403 37% 195,694 61% 121,173 28% 94,789 15% 82,646 -2% 83,958 79%Advances-Net 271,084 11% 244,433 -3% 252,345 6% 237,344 11% 212,972 26% 168,407 17%OperatingFixedassets 19,871 10% 18,087 18% 15,360 23% 12,447 12% 11,134 47% 7,549 17%Otherassets 18,455 3% 17,964 1% 17,719 -1% 17,955 -2% 18,399 62% 11,368 5%Total assets 631,915 23% 515,699 15% 449,931 8% 418,374 14% 366,695 15% 320,109 27%
LIABILITIES & EQUITYCustomerdeposits 514,707 29% 399,562 8% 371,284 13% 328,875 11% 297,475 13% 263,972 28%Interbankborrowings 38,916 -22% 49,993 141% 20,774 -48% 39,819 43% 27,778 21% 22,934 25%Billspayable 6,203 54% 4,015 -3% 4,119 30% 3,162 7% 2,952 -16% 3,494 53%Otherliabilities 15,684 18% 13,296 8% 12,284 11% 11,061 -19% 13,636 86% 7,332 43%Sub-ordinatedloans 5,490 0% 5,493 0% 5,495 0% 5,497 120% 2,498 0% 2,499 0%Total Liabilities 581,000 23% 472,359 14% 413,956 7% 388,414 13% 344,339 15% 300,231 28%Sharecapital 9,463 10% 8,603 10% 7,821 10% 7,110 10% 6,464 20% 5,386 20%Reserves 10,906 24% 8,763 17% 7,517 14% 6,583 13% 5,805 -4% 6,051 -1%Un-appropriatedprofit 22,558 11% 20,255 28% 15,829 30% 12,198 43% 8,537 22% 6,971 24%Equity - Tier I 42,927 14% 37,621 21% 31,167 20% 25,891 24% 20,806 13% 18,408 13%Surplusonrevaluationofassets 7,988 40% 5,719 19% 4,808 18% 4,069 163% 1,550 5% 1,470 1%Total Equity 50,915 17% 43,340 20% 35,975 20% 29,960 34% 22,356 12% 19,878 12% PROFIT & LOSS ACCOUNT Interest / Return / Non Interest Income earned Markup/Return/Interestearned 49,503 -4% 51,814 15% 44,993 9% 41,122 35% 30,571 44% 21,201 23%Fee,Commission,BrokerageandExchangeincome 3,169 -7% 3,395 17% 2,910 -16% 3,470 6% 3,266 45% 2,258 38%Capitalgain&Dividendincome 10,353 195% 3,507 40% 2,511 2% 2,452 56% 1,571 -1% 1,585 194%Other income 272 467% 48 -81% 251 597% 36 -39% 59 -24% 77 -72%Total 63,297 8% 58,764 16% 50,665 8% 47,080 33% 35,467 41% 25,121 28% Markup / Return / Interest and Non Interest Expense Markup/Return/Interestexpensed (31,142) 17% (26,643) 19% (22,428) 0% (22,422) 30% (17,273) 71% (10,093) 49%Operatingexpenses (14,922) 9% (13,745) 19% (11,567) 19% (9,706) 14% (8,513) 37% (6,201) 17%Provisions (1,362) -58% (3,267) -24% (4,326) -2% (4,416) 24% (3,561) 24% (2,874) 215%Taxation (4,195) -16% (4,969) 21% (4,118) 21% (3,414) 74% (1,964) 5% (1,877) -17%Total expense (51,621) 6% (48,624) 15% (42,439) 6% (39,958) 28% (31,311) 49% (21,045) 38% Profit after taxation 11,676 15% 10,140 23% 8,226 16% 7,122 71% 4,156 2% 4,076 -7%
54
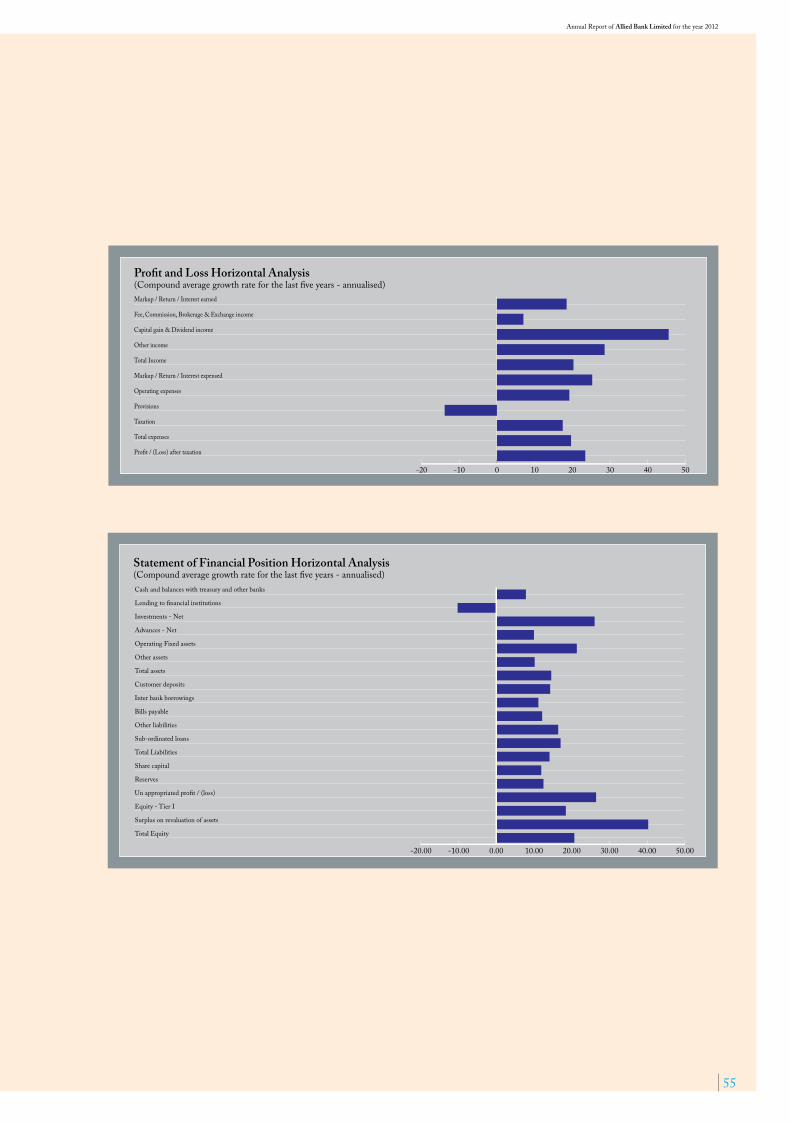
Pro�t and Loss Horizontal Analysis(Compound average growth rate for the last �ve years - annualised)
-20 -10 0 10 20 30 40 50
Markup / Return / Interest earned
Fee, Commission, Brokerage & Exchange income
Capital gain & Dividend income
Other income
Total Income
Markup / Return / Interest expensed
Operating expenses
Provisions
Taxation
Total expenses
Pro�t / (Loss) after taxation
Statement of Financial Position Horizontal Analysis(Compound average growth rate for the last �ve years - annualised)
-20.00 -10.00 0.00 10.00 20.00 30.00 40.00 50.00
Cash and balances with treasury and other banks
Lending to �nancial institutions
Investments - Net
Advances - Net
Operating Fixed assets
Other assets
Total assets
Customer deposits
Inter bank borrowings
Bills payable
Other liabilities
Sub-ordinated loans
Total Liabilities
Share capital
Reserves
Un appropriated pro�t / (loss)
Equity - Tier I
Surplus on revaluation of assets
Total Equity
Annual Report of Allied Bank Limited for the year 2012
55

Vertical Analysis
2012 2011 2010 2009 2008 2007 Rs. M % Rs. M % Rs. M % Rs. M % Rs. M % Rs. M %
STATEMENT OF FINANCIAL POSITION
ASSETSCashandbalanceswithtreasuryandotherbanks 44,381 7% 38,159 7% 31,845 7% 27,716 7% 25,751 7% 30,408 9%Lendingtofinancialinstitutions 10,721 2% 1,362 0% 11,489 3% 28,123 6% 15,793 4% 18,419 6%Investments-Net 267,403 42% 195,694 38% 121,173 27% 94,789 23% 82,646 23% 83,958 26%Advances-Net 271,084 43% 244,433 47% 252,345 56% 237,344 57% 212,972 58% 168,407 53%OperatingFixedassets 19,871 3% 18,087 4% 15,360 3% 12,447 3% 11,134 3% 7,549 2%Otherassets 18,455 3% 17,964 4% 17,719 4% 17,955 4% 18,399 5% 11,368 4%Total assets 631,915 100% 515,699100% 449,931 100% 418,374 100% 366,695 100% 320,109 100%
LIABILITIES & EQUITYCustomerdeposits 514,707 81% 399,562 77% 371,284 82% 328,875 79% 297,475 81% 263,972 83%Interbankborrowings 38,916 6% 49,993 10% 20,774 5% 39,819 9% 27,778 7% 22,934 7%Billspayable 6,203 1% 4,015 1% 4,119 1% 3,162 1% 2,952 1% 3,494 1%Otherliabilities 15,684 3% 13,296 3% 12,284 3% 11,061 3% 13,636 4% 7,332 2%Sub-ordinatedloans 5,490 1% 5,493 1% 5,495 1% 5,497 1% 2,498 1% 2,499 1%Total Liabilities 581,000 92% 472,359 92% 413,956 92% 388,414 93% 344,339 94% 300,231 94% Net assets 50,915 8% 43,340 8% 35,975 8% 29,960 7% 22,356 6% 19,878 6% Represented bySharecapital 9,463 1% 8,603 2% 7,821 2% 7,110 2% 6,464 2% 5,386 2%Reserves 10,906 2% 8,763 2% 7,517 2% 6,583 1% 5,805 2% 6,051 2%Un-appropriatedprofit 22,558 4% 20,255 3% 15,829 3% 12,198 3% 8,537 2% 6,971 2%Equity - Tier I 42,927 7% 37,621 7% 31,167 7% 25,891 6% 20,806 6% 18,408 6%Surplusonrevaluationofassets 7,988 1% 5,719 1% 4,808 1% 4,069 1% 1,550 0% 1,470 0%Total Equity 50,915 8% 43,340 8% 35,975 8% 29,960 7% 22,356 6% 19,878 6% PROFIT & LOSS ACCOUNT
Interest / Return / Non Interest Income earnedMarkup/Return/Interestearned 49,503 78% 51,814 88% 44,993 89% 41,122 88% 30,571 86% 21,201 85%Fee,Commission,BrokerageandExchangeincome 3,169 5% 3,395 6% 2,910 6% 3,470 7% 3,266 9% 2,258 9%Capitalgain&Dividendincome 10,353 17% 3,507 6% 2,511 5% 2,452 5% 1,571 5% 1,585 6%Other income 272 0% 48 0% 251 0% 36 0% 59 0% 77 0%Total 63,297 100% 58,764100% 50,665 100% 47,080 100% 35,467 100% 25,121 100%
Markup / Return / Interest and Non Interest ExpenseMarkup/Return/Interestexpensed (31,142) -49% (26,643) -45% (22,428) -44% (22,422) -48% (17,273) -49% (10,093) -40%Operatingexpenses (14,922) -24% (13,745) -23% (11,567) -23% (9,706) -21% (8,513) -24% (6,201) -25%Provisions (1,362) -2% (3,267) -6% (4,326) -9% (4,416) -9% (3,561) -10% (2,874) -11%Taxation (4,195) -7% (4,969) -9% (4,118) -8% (3,414) -7% (1,964) -5% (1,877) -8%Total expense - percentage of total income (51,621) -82% (48,624) -83% (42,439) -84% (39,958) -85% (31,311) -88% (21,045) -84% Profit after taxation 11,676 18% 10,140 17% 8,225 16% 7,122 15% 4,156 12% 4,076 16%
56

Pro�t & Loss Vertical Analysis – Income(Composition for the last six years) - Percentage
2011
2012
2010
2009
2008
20070 20 40 60 80 100
Markup/Return/Interest earned Fee, Commission, Brokerage and ExchangeIncome
Capital gain & Dividend Income Other Income
Pro�t & Loss Vertical Analysis – Expense & Pro�t after Tax(Composition for the last six years) - Percentage
2011
2012
2010
2009
2008
20070 20 40 60 80 100
Markup/Return/Interest expensed Operating expenses Provisions
Taxation Pro�t after taxation
Statement of Financial Position Vertical Analysis – Assets(Composition for the last six years) - Percentage
2011
2012
2010
2009
2008
20070 20 40 60 80 100
Cash and balances with treasury and other banks Lending to �nancial institutions Investments - Net Advances - Net Operating Fixed assets Other assets
Statement of Financial Position Vertical Analysis – Liabilities & Equity(Composition for the last six years) - Percentage
2011
2012
2010
2009
2008
20070 20 40 60 80 100
Costomer deposits Inter bank Borrowings Bills payable Other LiabilitiesSub-ordinated Loans Share Capital Surplus on revaluation of assets Total Reserves
Annual Report of Allied Bank Limited for the year 2012
57

Statement of Value Addition
2012 % 2011 %
Value Added
Incomefrombankingservices 32,126,692 32,118,284Costofservices (5,352,369) (5,100,012)Valueaddedbybankingservices 26,774,323 27,018,272
Non-bankingincome 27,850 2,568Provisionagainstnon-performingassets (1,362,424) (3,267,450) (1,334,574) (3,264,882) Total Value Added 25,439,749 23,753,390
Value Allocated to employees Salaries,allowancesandotherbenefits 8,224,012 32.3% 7,553,145 31.8% to Government Incometax 4,194,538 16.5% 4,968,801 20.9% to providers of capital asdividends 6,409,316 25.2% 3,714,979 15.6% to Society asdonation 103,515 0.4% 61,295 0.3% to expansion and growth Depreciation/Amortization 1,241,870 4.9% 1,030,468 4.3%Retainedinbusiness 5,266,498 20.7% 6,424,702 27.1% 6,508,368 25.6% 7,455,170 31.4%
Total Value Allocated 25,439,749 100.0% 23,753,390 100.0%
2011
Employees Government
Providers of Capital Society
Expansion and growth
31.8% 20.9%
15.6%
0.3%31.4%
2012
Employees Government
Providers of Capital Society
Expansion and growth
32.3% 16.5%
25.2%
0.4%
25.6%
(Rs. in “000”)
58

Cashflow - Direct Method
2012 2011 Rupees in ‘000
Cash flow from operating activities Mark-up/return/interestandcommissionreceipts 56,595,637 56,423,448Mark-up/return/interestpayments (30,766,992) (25,366,521)Cashpaymentstoemployees,suppliersandothers (13,299,272) (12,215,461) 12,529,373 18,841,466
Decrease / (increase) in operating assets Lendingstofinancialinstitutions (9,359,181) 10,057,190Heldfortradingsecurities - 842,169Advances (27,924,702) 5,201,926Otherassets(excludingadvancetaxation) (1,008,185) 11,597 (38,292,068) 16,112,882
(Decrease) / increase in operating liabilities Billspayable 2,187,734 (103,474)Borrowings (11,043,116) 29,279,026Deposits 115,145,379 28,277,408Otherliabilities(excludingcurrenttaxation) 1,164,884 (802,092) 107,454,881 56,650,868 Cash flow before tax 81,692,186 91,605,216 Incometaxpaid (6,213,290) (4,798,475)Net cash flow from operating activities 75,478,896 86,806,741 Cash flow from investing activities
Netinvestmentsin‘available-for-sale’securities (69,255,704) (54,829,878)Netinvestmentsin‘held-to-maturity’securities 948,958 (20,915,102)Dividendincomereceived 8,565,057 1,961,759Investmentsinoperatingfixedassets (3,141,314) (2,953,523)Proceedsfromsaleoffixedassets 29,097 10,094Effectoftranslationofnetinvestmentinforeignwholesalebranch 10,198 -Net cash used in investing activities (62,843,708) (76,726,650) Cash flow from financing activities
Repaymentofsub-ordinatedloan (2,200) (2,200)Dividendspaid (6,377,000) (3,703,935)Net cash used in financing activities (6,379,200) (3,706,135)
Increaseincashandcashequivalentsduringtheyear 6,255,988 6,373,956Cashandcashequivalentsatbeginningoftheyear 37,944,183 31,725,190Effectofexchangeratechangesonopeningcashandcashequivalents 180,768 25,805Cash and cash equivalents at end of the year 44,380,939 38,124,951
Annual Report of Allied Bank Limited for the year 2012
59

Concentration of Advances, Deposits and Off-Balance Sheet Items - December 31, 2012
Advances (Gross) Classified Advances Deposits Off-balance sheet itemsDescription Rs. in Mn % Rs. in Mn % Rs. in Mn % Rs. in Mn %
Agriculture,ForestryandHunting 2,559 0.89% 351 1.70% 23,119 4.49% 842 0.61%Basicmetals(iron,steel) 2,536 0.88% 20 0.10% 3,544 0.69% 787 0.57%Beverages 423 0.15% 413 2.00% 62 0.01% 78 0.06%Cement/clay&ceramics 9,372 3.24% 40 0.19% 1,626 0.32% 1,450 1.05%Chemical&pharmaceutical 20,429 7.07% 405 1.96% 1,020 0.20% 838 0.60%Construction 4,402 1.52% 103 0.50% 25,000 4.86% 10,415 7.52%Education 40 0.01% - - 11,639 2.26% 4 0.00%Financial 5,707 1.98% 82 0.39% 4,852 0.94% 45,886 33.11%FinishingofTextile 10,954 3.79% 6,011 29.09% 2,356 0.46% 459 0.33%Fishing 17 0.01% - - - 0.00% - 0.00%Footware & leather garments 455 0.16% 132 0.64% 287 0.06% 71 0.05%Furniture&sportsgoods 567 0.20% 73 0.36% 1,165 0.23% 103 0.07%Grains&related 6,844 2.37% - - 4,767 0.93% - 0.00%Health&socialwelfare 45 0.02% - - 3,199 0.62% 25 0.02%Hotel,restaurant&clubs 768 0.27% 7 0.04% 2,930 0.57% - 0.00%Machinery&equipment 2,630 0.91% 1,275 6.17% 2,848 0.55% 5,451 3.93%Manufactureofmadeup&readymadegarments 3,154 1.09% - - 837 0.16% 13 0.01%Manufacture of transport equipment 452 0.16% 246 1.19% 295 0.06% 171 0.12%Paper&paperboards 8,890 3.08% 22 0.10% 21 0.00% 364 0.26%Petroleumproducts 1,976 0.68% 5 0.03% 6,650 1.29% 825 0.60%Power,gas,water&sanitary 45,509 15.75% 240 1.16% 3,615 0.70% 5,077 3.66%Printing,publishing&allied 119 0.04% 6 0.03% 45 0.01% 53 0.04%Realestate,renting,andbusinessactivities 3,421 1.18% 156 0.75% 83,417 16.21% 9 0.01%Rubber&plastic 459 0.16% 42 0.20% 1,580 0.31% 298 0.21%Spinning 26,305 9.11% 2,041 9.88% 9,732 1.89% 318 0.23%Sugar 5,511 1.91% - - 2,391 0.46% 334 0.24%Transport,storage&communication 5,554 1.92% 6 0.03% 2,049 0.40% 1,066 0.77%Weaving 4,133 1.43% 1,467 7.10% 4,632 0.90% 75 0.05%Wholesale&retailtrade 11,022 3.82% 478 2.31% 46,837 9.10% 1,796 1.30%Individuals 7,658 2.65% 358 1.73% 131,636 25.57% 6,964 5.03%Others 96,979 33.57% 6,688 32.36% 132,558 25.75% 54,796 39.55%
Total 288,889 100% 20,668 100% 514,707 100% 138,567 100%
MaturitiesofAssetsandLiabilities-December31,2012 (Rupees in ‘000) Total Upto 3M 3M to 1Y 1Y to 3Y 3Y to 5Y 5Y & aboveAssets Cashandbalanceswithtreasurybanks 43,351,653 35,050,448 23,335 5,518,580 2,759,290 -Balanceswithotherbanks 1,029,286 1,029,286 - - - -Lendingstofinancialinstitutions 10,720,935 10,720,935 - - - -Investments-net 267,403,346 66,104,144 159,594,112 3,887,353 26,671,428 11,146,309Advances-net 271,084,275 69,243,341 68,821,437 57,140,643 38,342,388 37,536,466Operatingfixedassets 19,871,173 637,766 1,913,292 2,474,131 961,341 13,884,643Deferred tax assets - - - - - - Otherassets-net 18,454,814 6,555,291 8,935,176 1,156,267 - 1,808,080 Liabilities Billspayable 6,203,051 4,348,297 315,118 1,026,424 513,212 -Borrowings 38,916,192 27,830,244 8,058,096 1,009,284 1,009,284 1,009,284Depositsandotheraccounts 514,707,055 147,280,182 137,053,409 51,360,765 30,365,065 148,647,634Deferredtaxliabilities 64,584 47,330 (180,422) (374,723) (106,471) 678,870Sub-ordinatedloan 5,490,400 600 1,872,300 625,900 2,991,600 -Otherliabilities 15,618,340 11,532,350 964,545 830,749 717,800 1,572,896 * Maturities of deposits are based on the working prepared by the Assets and Liabilities Management Committee (ALCO) of the Bank.
60
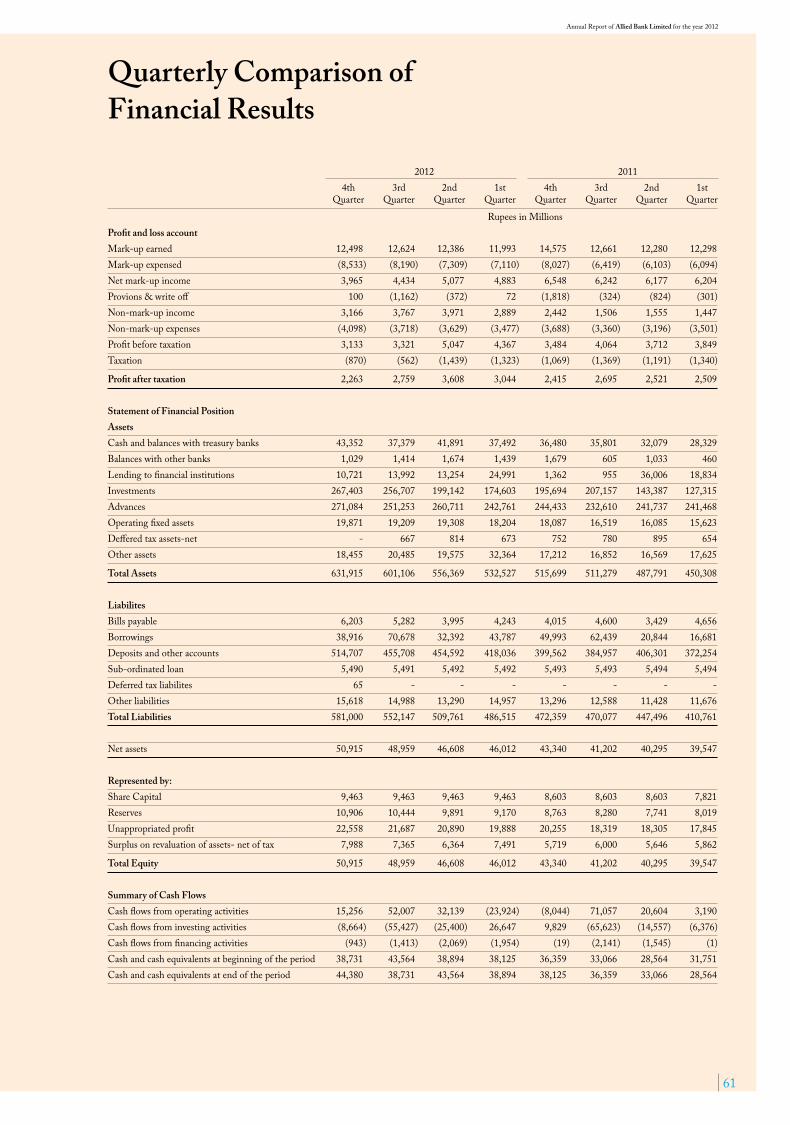
Quarterly Comparison of Financial Results
2012 2011 4th 3rd 2nd 1st 4th 3rd 2nd 1st Quarter Quarter Quarter Quarter Quarter Quarter Quarter Quarter
Rupees in Millions Profit and loss account Mark-upearned 12,498 12,624 12,386 11,993 14,575 12,661 12,280 12,298Mark-upexpensed (8,533) (8,190) (7,309) (7,110) (8,027) (6,419) (6,103) (6,094)Netmark-upincome 3,965 4,434 5,077 4,883 6,548 6,242 6,177 6,204Provions&writeoff 100 (1,162) (372) 72 (1,818) (324) (824) (301)Non-mark-upincome 3,166 3,767 3,971 2,889 2,442 1,506 1,555 1,447Non-mark-upexpenses (4,098) (3,718) (3,629) (3,477) (3,688) (3,360) (3,196) (3,501)Profitbeforetaxation 3,133 3,321 5,047 4,367 3,484 4,064 3,712 3,849Taxation (870) (562) (1,439) (1,323) (1,069) (1,369) (1,191) (1,340)
Profit after taxation 2,263 2,759 3,608 3,044 2,415 2,695 2,521 2,509 Statement of Financial Position Assets Cashandbalanceswithtreasurybanks 43,352 37,379 41,891 37,492 36,480 35,801 32,079 28,329Balanceswithotherbanks 1,029 1,414 1,674 1,439 1,679 605 1,033 460Lendingtofinancialinstitutions 10,721 13,992 13,254 24,991 1,362 955 36,006 18,834Investments 267,403 256,707 199,142 174,603 195,694 207,157 143,387 127,315Advances 271,084 251,253 260,711 242,761 244,433 232,610 241,737 241,468Operatingfixedassets 19,871 19,209 19,308 18,204 18,087 16,519 16,085 15,623Deffered tax assets-net - 667 814 673 752 780 895 654 Otherassets 18,455 20,485 19,575 32,364 17,212 16,852 16,569 17,625
Total Assets 631,915 601,106 556,369 532,527 515,699 511,279 487,791 450,308
Liabilites Billspayable 6,203 5,282 3,995 4,243 4,015 4,600 3,429 4,656Borrowings 38,916 70,678 32,392 43,787 49,993 62,439 20,844 16,681Depositsandotheraccounts 514,707 455,708 454,592 418,036 399,562 384,957 406,301 372,254Sub-ordinatedloan 5,490 5,491 5,492 5,492 5,493 5,493 5,494 5,494Deferred tax liabilites 65 - - - - - - - Otherliabilities 15,618 14,988 13,290 14,957 13,296 12,588 11,428 11,676Total Liabilities 581,000 552,147 509,761 486,515 472,359 470,077 447,496 410,761 Netassets 50,915 48,959 46,608 46,012 43,340 41,202 40,295 39,547 Represented by: ShareCapital 9,463 9,463 9,463 9,463 8,603 8,603 8,603 7,821Reserves 10,906 10,444 9,891 9,170 8,763 8,280 7,741 8,019Unappropriatedprofit 22,558 21,687 20,890 19,888 20,255 18,319 18,305 17,845Surplusonrevaluationofassets-netoftax 7,988 7,365 6,364 7,491 5,719 6,000 5,646 5,862
Total Equity 50,915 48,959 46,608 46,012 43,340 41,202 40,295 39,547 Summary of Cash Flows Cashflowsfromoperatingactivities 15,256 52,007 32,139 (23,924) (8,044) 71,057 20,604 3,190Cashflowsfrominvestingactivities (8,664) (55,427) (25,400) 26,647 9,829 (65,623) (14,557) (6,376)Cashflowsfromfinancingactivities (943) (1,413) (2,069) (1,954) (19) (2,141) (1,545) (1)Cashandcashequivalentsatbeginningoftheperiod 38,731 43,564 38,894 38,125 36,359 33,066 28,564 31,751Cashandcashequivalentsatendoftheperiod 44,380 38,731 43,564 38,894 38,125 36,359 33,066 28,564
Annual Report of Allied Bank Limited for the year 2012
61

Products and Services
Allied Advance Profit SchemeAllied Bank was the first Bank of Pakistan which introduced such a unique product in the industry. It is a term deposit scheme that does not make the account holder to wait for the reward; it gives the entire profit upfront on the date of account opening. The customers can choose 15-months and 18-months tenor options.
Allied Business AccountTo cater to the unique financial needs of businessmen,AlliedBankhasintroducedAllied Business current account. On maintaining a certain monthly average balance,ourbusinesscustomerscanavailfree facilities like issuance of banker’s cheques,DemandDraft,fundstransfer,intercityclearing,telephonictransfer,InternetBanking,chequereturnsandNationwide Real Time online Banking to meet their day-to-day business requirements.
Current Account ABL offers current account to cater the needs of various customer segments. On maintaining a daily minimum balance ofRs0.5million,arangeoffreeserviceslike issuance of Pay Order and free online transactionsetc.,canbeavailed.
ABL BancassuranceABL Bancassurance offers Investments and Protection plans for child education / marriage,accidentalandterrorism.
Theme BranchesModern technology and signature themes are adopted for attaining a significant position as a preferred Bank. We have six women branches located across Pakistan which offer exclusive services and provides a conducive environment for the female customers to conveniently do banking with us. We have also launched youth branches with an aim to specifically provide banking services to the younger generation as per their life style and a youth friendly environment.
Extended Hours BankingExtended Hours Banking facility at selected branches is offered to enable our customers to do banking at their convenience.
E-BankingAllied DirectBanking at your fingertips - Allied Direct (Internet Banking) offers convenience from the desk to manage your bank account fromanywhere,anytime.Itoffersfeatureslikefundtransfers,Utilitybillpayments,Mobiletop-ups,Donations,e-shoppingandmuch more. Allied Direct is also available on mobile so that wherever our customers move,theaccountstayswiththem.
ABL ATMs and CCDMs (Cash & Cheque Deposit Machines)
A vast network of 618 ATMs across the country gives 24/ 7 access to cash withdrawals,ministatement,billpayments,fund transfers and much more.
Allied Cash+Shop VISA Debit CardAllied Cash+Shop Visa Debit Card is Allied Bank’s flagship retail product that gives our customers access to their bank accounts and alsoatover30,000retailersinPakistanandover27millionretailersallovertheworld,without the worry to carry physical cash in hand. It also gives our cardholders’ access to over 1 million ATMs worldwide and over 5,900ATMsinPakistan,includingABL’sown large network of ATMs.
Allied Bank Visa Credit Card
Allied Bank’s Gold and Platinum Visa CreditCardoffersworldofprivileges,benefits and savings. In order to cater to growingfinancialneedsofcustomers,Allied Bank has launched credit card that offers attractive service charge with a free credit period of up to 50 days. It offers comprehensive protection against loss/stolencards,SMS/e-mailalerts,cashadvance,balancetransferfacilityandaccessto international lounges for platinum card holders,thusprovidinguniqueexperiencetothe customers.
Allied Bank offers a full suite of products andservices,tailor-madetocatertothe requirements of each segment of its customer base. We aim to provide comprehensive solutions for all our customers,wherevertheyarelocatedontheir financial graph. From customers just beginning a banking relationship to those withmoresophisticatedbankingneeds,wecan bring the full capability of Allied Bank to their doorstep. Our customers have the advantage of nationwide network of over 873 online branches with well informed andfriendlystaff,aswellas618ATMsstrategically located to help provide ease of banking.AtAlliedBank,we’realways“aapkay sath sath”
Branch BankingWithavastnetworkof873branches,ABLis committed to provide real time online banking solutions to its customers in an efficient and convenient manner.
Banking on SaturdayForconvenienceofcustomers,fullrangeofnon-stop Banking Services are being offered to the customers on Saturday from 10:00 AMto02:00PM.Atpresent,around300branches operate on Saturday for public dealings.
Allied Rising Star – Youth 1st Bank AccountAllied Rising Star is a profit based account product,designedexclusivelyforchildrenunder 18 with the purpose of instilling the habit of savings amongst them. The product offers one of its kind daily profit feature and is bundled with various exciting features like game/diningvoucher,lifeinsurancecoverand cash box.
Platinum Allied Ba’ IkhtiarPlatinum Allied Ba’Ikhtiar is a distinctive 12-monthtermdepositscheme,tailoredtomeet the customer’s needs and requirements with an option to earn profit on investment onmonthly,quarterly,halfyearlyoryearlybasis.
62

Allied Personal FinanceABL has also launched a Personal Loan Product,AlliedPersonalFinance,targetedmainly towards the employees of bank’s institutional customers. Allied Personal Finance is a demand finance facility with equal monthly instalments spread over the term of the finance. With a low mark-up rate the product is offered to individuals associated with corporate/institutional customers.
Allied Pay anyoneA unique product in which ABL customers can send cash /cheque to any individual in Pakistan even if the beneficiary doesn’t have a bank account. All it takes is just a click of a button (Allied Direct).
Interactive Touchpointwww.abl.com - is a newly upgraded corporate website launched in mid 2012 to enhance customers’ online experience. Being an interactive electronic touch-point,thewebsitefurtherimprovesend-userexperience,introducesinteractivesegmentation,providescomprehensiveinformation on valuable products and services. It further builds network of online visitors by incorporating social media channels. This real-time interactivity is further orchestrated by the integration of Allied Live Chat facility into the website.
SMEABL has realigned its focus towards SME Business with a vision to capitalize on the bank’s countrywide footprint and long-standing customer loyalty to become a preferred and prudent provider of a “Total Banking Solution” to the Small & Medium Market segment.Withthisrenewedfocusandstrategy,ABLoffers its customers a wide range of funded andnon-fundedproductsandservices,meeting the entire needs of various types of SME businesses.
Allied Business FinanceWhetheracustomerisatrader,serviceprovider or manufacturer with funding requirementofuptoRs.10million,ABL’sAllied Business Finance is an ideal fit to
cater to his/her financial / working capital needs. ABL offers speedy loan approval at a competitive pricing.
Allied Fast FinanceAllied FAST Finance (AFF) enables its customers to meet their personal and business needs without liquidating theirsavings.WithAFF,customerscanutilize existing investments and deposits as collateral and avail financing at very competitive rates with a very quick turnaround time.
AgricultureAllied Bank Limited is also involved in agricultural financing across the country and offers vast range of agricultural financial facilities through more than 150 Agri designated branches. Allied Bank offers multiple and diversified range of Agri Products for both Farm & Non-Farm sectors.
Allied Bank LockersBank Lockers provide high-security protection for your valuables. Lockers of different capacities are available nationwide at conveniently located ABL branches.
Allied Bank Call CenterWithourCallCentrefacility,younolongerhave to take time out to visit your branch for your everyday banking needs. By simply dialingourtoll-freenumber0800-22522,you get access to a wide range of Tele-banking solutions and personalized banking. Youcanalsoaccessourself-servicebanking,where you will be guided and assisted in all transactions by our Interactive Voice Response System (IVR).
Corporate BankingThe Corporate Banking works on a long-term relationship based on a business model to provide a single point within the Bank for meeting all business requirements of ourcorporateandinstitutionalcustomers,includingpublicsectorenterprises,withtheprimary objective of enhancing customer service.Dedicated relationship managers for each of our corporate client ensure customer
satisfaction,whichremainsourtoppriority.Our relationship oriented outlook focuses upon providing a complete array of tailored financing solutions that are practical and cost effective. Our main products include WorkingCapitalFacilities,TermLoans,StructuredTradeFinanceFacilities,LettersofGuarantee,LettersofCredit,FundTransfers/Remittances,BillDiscounting,Export Financing and Receivable Discounting.
Investment BankingThe Investment Banking (IB) arm of the Bank is a multifaceted business unit geared towards meeting the complex financing needs of its clientele by providing a full suite of financing solutions to corporate clients which includes debt syndications and capitalmarkets,projectfinanceandadvisoryservices. The debt syndication desk’s forte is executing big ticket debt arrangement transactions on full / partial recourse basis for our corporate clientele. The Syndications Desk seeks to create value for its clientele by offering cost effective and customized corporate financing solutions. Project Finance desk offers services to project sponsors for development of a credit-worthy and bankable financial structure for the project with appropriate risk allocation. It also extends syndicated project finance solutions to project sponsors desirous of setting up green field projects. The Advisory Desk offers a broad array of services/products ranging from advising on IPOs,Underwritings,Divestments,DebtRestructurings,PrivatizationandM&ADeals. Within these broad service areas a full suite of solutions is available with Allied Bank Investment Banking.
Home RemittencesThe Home Remittance provides a seamless inflow of foreign remittance credited in the beneficiary accounts in minutes.
Cash ManagementABL Cash Management is a state-of-the-art,real-timesystemofferingitsclientsefficientLiquidityManagementSolutions,across the entire ABL network of 875 branches.
Annual Report of Allied Bank Limited for the year 2012
63

Corporate Sustainability
Corporate Social Responsibility (CSR) Our philosophy of CSR is simple: As one of the most successful organizationsinPakistan,itisourmoral and ethical responsibility to give back to the communities regardless oftheirgeographicallocations,ethnicorigins,cast,colororcreed.Weareoneof the few organizations in Pakistan with a clearly defined CSR and Donations Policy.
Our CSR philosophy is focused aroundeducation,healthcare,sports,environment,promotionofthearts,staff welfare and engagement activities.
CSR Track Record
Our CSR objectives are to behave ethically,followbestpracticesandcontribute to economic development while improving the quality of life of theworkforce,theirfamilies,thelocalcommunity and the society at large. Some of our key CSR initiatives are as follows:
Reconstruction in flood affected areas
Allied Bank has always been among the first to respond in times of national crises. Following the catastrophic nationwide floods in 2009 and 2010 wherein thousands of families were rendered homeless in Khyber Pakhtunkhwa,SouthernPunjabandSindh,AlliedBankundertookthetask
of rebuilding homes in the affected areas. We completed the project and handed over more than 250 homes to the affected families.
Education
We believe that a nation’s progress is relative to the level of its investment in education. We realize our responsibility to contribute significantly to help impart quality education to the young men and women of our society who may have financial constraints. Allied Bank has been furthering the cause of education through sponsorships and donations to leading educational institutions. Some of the noteworthy contributions made during 2012 are:
• InstituteofBusinessAdministration
64

• KarachiSchoolforBusiness&Leadership
• NamalEducationFoundation
• KaghanMemorialTrust
• SargodhianSpiritTrust
Some of the other contributions in shape of sponsorships were made to LahoreGrammarSchool,BeaconhouseSchoolSystem,GCUniversityLahore,Szabist University and the Faran Writers’ Guild.
Healthcare
We believe that healthy individuals make healthy nation. In line with thatbelief,wehavebeencontributingsubstantial amounts to leading healthcare institutions over the years. The list of institutions supported
during the year includes:
• ShaukatKhanumMemorialCancer Hospital
• LiverCenter,CivilHospital,Faisalabad
• BakhtawarAminMemorialTrustHospital
• LaeeqRafiqFoundation,Multan
• LahoreBusinessAssociationfor Rehabilitation of Disabled (LABARD)
• AzizJehanBegumTrustfortheBlind
• ImranKhanFoundation
• BaitulSukoonTrust
• AlMustafaTrust
Sports
It would be fair to say that the field of sports has been one key area which earns a country enormous amount of respect worldwide and also acts as a major source of forming favorable perception on international level. A few of Pakistani sportsmen and sportswomen have made their mark in sporting history and record books. Allied Bank believes that contribution towards Sports is an investment in our talented youth.The Bank has been a regular contributor towards promotion of various prominent sports including Golf,PoloandCricket.
Annual Report of Allied Bank Limited for the year 2012
65

Staff Engagement
Allied Bank aims at having one of the bestinclasshumanresource,consistingof youth and experience. The Bank’s growth and success can be attributed to the dedicated workforce whose exemplaryworkethics,attitudetowardscollective growth and sheer sense of belonging has made this organization one of the top banks in Pakistan. The Management believes in looking after its employees in terms of their physical,spiritualandemotionalwellbeing as well as their financial needs at all times. Following global bestpractices,theManagementhassetup a dedicated department to engage the employees in positive and fun-filled activities. As part of our Staff EngagementPlan,inter-departmentalCricket Tournaments were organized for employees and their families in Karachi,LahoreandIslamabad.Thesetournaments were unique in the sense
that male and female colleagues took partside-by-sideasplayers,makingthetournaments,trulyfamilyorientedevents. Energy ConservationConsidering our responsibility towards our valued shareholder for effective utilization of resources and energy crisesbeingfacedbytheCountry,themanagement of the Bank is actively pursuing ways to conserve energy without compromising on customer service and efficiency. Areas under focus of the management include:
• Maximumpossiblecontrolsover the consumption of energy with strict emphasis on energy conservation across the Bank;
• In-depthstudyofalternateorrenewable energy solutions like solar energy and explore its possible usage as additional source
of electricity;
• UsageofenergyconservingLightEmitting Diode (LED) based lighting instead of conventional lighting sources; and
• Maintainingacceptabletemperatures in buildings (by heating and cooling) uses a large proportion of global energy consumption. All new buildings of the Bank are being well insulated to reduce heating and cooling requirements. It is not only energy-efficient but also provides uniform temperature throughout the building.
Environmental Protection MeasuresPrevailing energy crises in the country has led to much higher usage of generators,whichnotonlyproducenoise pollution but also adds harmful
Corporate Sustainability Report
66

carbon-dioxide and carbon mono-oxide to the environment. Management of the Bank is evaluating the use of inverter technology to replace the use ofgenerators,sothattheirharmfuleffects on the environment can be mitigated.Moreover,toreaptheoptimum benefits of the investment intechnology,mostoftheapprovalsprocesses have been transferred to online approvals; which will not only add to the workflow efficiency but also reduce the use of paper across the Bank.
Employment of Special PersonsAllied Bank is an equal opportunity andaffirmativeactionemployer,initstruespirit.Weencourageminorities,females and also the special persons to apply for jobs in the Bank. At AlliedBank,specialpersonsarenotdiscriminated on the basis of their handicaps.Onthecontrary,special
persons are encouraged and are selected on merit. Allied Bank is fully compliant of the law related to the statutory requirements regarding the hiring of special persons.
Occupational Safety & HealthRecognizing the responsibility of safety ofourvaluedstaffmembers,whoseefforts are translated as healthy return toourshareholders,ABLhasinstitutedgroup life insurance along with medicalreimbursement.Moreover,allsites of the Bank are fitted with fire extinguishers and fire hydrant system is deployed at multi-story buildings. Mock firefighting drills are carried out to enhance the co-ordination of the staff members and also to ensure prevention of human losses in case of an actual event.
Contribution to National ExchequerDuring the year Allied Bank has directly contributed Rs 6.2 billion and acting as an agent of the Federal Board of Revenue Rs 4.3 billion on account of withholding income tax and Rs 339 million on account of Federal Excise Duty to the national exchequer.
Annual Report of Allied Bank Limited for the year 2012
67

68

Annual Report of Allied Bank Limited for the year 2012
69
Notice of 67th Annual General Meeting
Notice is hereby given that the 67th Annual General Meeting of Allied Bank Limited will be held at Hotel Avari, Lahore on Wednesday, March 27, 2013 at 11:00 a.m. to transact the following business:
Ordinary Business:1. To confirm minutes of the Extra Ordinary Annual General
Meeting of Allied Bank Limited held on August 23, 2012
2. To receive, consider and adopt the Annual Audited Accounts of the Bank (consolidated and unconsolidated) for the year ended December 31, 2012 together with the Directors’ and Auditors’ Reports thereon.
3. To consider and approve Cash Dividend @ 20% (i.e. Rs. 2.00 per share) as recommended by the Board of Directors in addition to 45% Interim Cash Dividends i.e. Rs. 4.50 per share already paid for the year ended December 31, 2012.
4. To appoint auditors for the year 2013 and fix their remuneration. The Board of Directors has proposed the name of M/S Ernst & Young Ford Rhodes Sidat Hyder, Chartered Accountants being sole auditors in place of retiring auditors M/S Ernst & Young Ford Rhodes Sidat Hyder, Chartered Accountants and M/S KPMG Taseer Hadi & Company, Chartered Accountants ( Joint auditors). M/S Ernst & Young Ford Rhodes Sidat Hyder, Chartered Accountants being eligible have offered themselves for reappointment.
5. To appoint and fix remuneration of auditors for audit of Bank’s Bahrain Branch for the year 2013. M/s Ernst & Young, Bahrain being eligible have offered themselves for the reappointment.
Special Business:6. To consider and approve issuance of Bonus Shares for Rs.
946,342,000/- from un-appropriated profits of the Bank, in the proportion of one (01) share for every ten (10) shares held i.e. 10%.
Note: Statements under section 160 (1) (b) of the Companies
Ordinance, 1984 is appended below.
Other Business: 7. To transact any other business with the permission of the
Chair.
Date: March 05, 2013 By Order of the BoardPlace: Lahore Muhammad RaffatRegistered Office: Company Secretary3 Tipu Block, Main BoulevardNew Garden Town, Lahore.
Statements under Section 160 (1) (b) of the Compa-nies Ordinance, 1984ITEM NO 6: ISSUANCE OF BONUS SHARESThe Board of Directors of Allied Bank Limited has proposed issuance of 10% bonus shares. In this regard, the Board has proposed capitalization of a sum of Rs. 946,342,000/- (Rupees Nine Hundred Forty Six Million, Three Hundred Forty Two Thousand Only) from un-appropriated profits of the Bank for the issuance of bonus shares (B-9) in the proportion of one (01) share for every ten (10) shares and approve the following resolution by way of Ordinary Resolution:
“Resolved that:a) A sum Rs. 946,342,000/- from un-appropriated profits of the
Bank be capitalized and applied for the issuance of 94,634,200 Ordinary shares of Rs. 10/- each in the proportion of one (01) Ordinary Share for every ten (10) Ordinary Shares held, allotted as fully paid-up Bonus Shares to the members of the Bank whose names appear on the Register of Members of the Bank as at close of business on March 20, 2013.
b) The bonus shares shall rank pari passu in all respects with the existing shares.
c) The bonus shares entitlement in fraction be consolidated into whole shares and the Company Secretary is hereby authorize to sell the same in the Stock Market and proceeds when realized be given to a charitable institution with the consent of the Chief Executive Officer.
d) The CEO and the Company Secretary of the Bank be and are hereby authorized and empowered to give effect to this resolution and to do or cause to be done all acts, deeds and things that may be necessary or required for issuance, allotment and distribution of Bonus Shares.”
The Directors of the Bank have no interest in the property or profits of the Bank other than that as holders of the ordinary shares in the capital of the Bank and dividends, if any declared by the Bank according to their shareholding.

70
NOTES:i) All members are entitled to attend and vote at the Meeting.
ii) A member entitled to attend and vote is entitled to appoint a proxy under his / her own hand or through his/ her duly authorized attorney to attend and vote instead of himself / herself and the proxy must be a member of Allied Bank Limited.
iii) The instrument of proxy and the power of attorney or other authority (if any) under which it is signed, or a notarially certified copy of that power of attorney or authority in order to be effective must be deposited at the Registered Office of Allied Bank Limited not less than 48 hours before the time for holding the Meeting.
iv) Share Transfer Books of Allied Bank Limited will remain closed from 21st March, 2013 to 27th March, 2013 (both days inclusive). Share transfers requests received at M/s Technology Trade (Pvt.) Limited, Dagia House, 241-C, Block-2, PECHS, Karachi, the Registrar and Share Transfer Office of the Bank at the close of business on 20th March, 2013 will be treated as being in time for the purpose of entitlement of cash dividend and bonus shares to the transferees.
v) Members are requested to immediately notify the changes, if any, in their registered addresses to Bank’s Share Registrar M/S Technology Trade (Pvt) Limited, Dagia House, 241-C, Block-2, PECHS, Karachi before book closure so that entitlements, if any, be dispatched at the correct addresses.
vi) CDC Account Holders will have to follow the under mentioned guidelines as laid down by the Securities and Exchange Commission of Pakistan.
A. For Attending the Meeting:i) In case of individuals, the Account Holder or Sub-account
Holder and / or the person whose securities are in group account and their registration details are uploaded as per the Regulations, shall authenticate his /her identity by showing his/her valid original Computerized National Identity Card (CNIC) or original passport at the time of attending the Meeting.
ii) In case of corporate entity, the Board of Directors’ resolution / power of attorney with specimen signature of the nominee shall be produced (if it has not been provided earlier) at the time of the Meeting.
B. For Appointing Proxies:i) In case of individuals, the Account Holder or Sub-account
Holder and / or the person whose securities are in group account and their registration details are uploaded as per the Regulations, shall submit the proxy form as per the above requirement.
ii) The proxy form shall be witnessed by two persons whose names, addresses and CNIC numbers shall be mentioned on the form.
iii) Attested copies of valid CNIC or the passport of the beneficial owners and the proxy shall be furnished with the proxy form.
iv) The proxy shall produce his / her valid original CNIC or original passport at the time of the Meeting.
v) In case of corporate entity, the Board of Directors’ resolution / power of attorney with specimen signature shall be submitted (if it has not been provided earlier) along with the proxy form of the Company.

Annual Report of Allied Bank Limited for the year 2012
71
Statement of Compliancewith Code of Corporate GovernanceThis statement is being presented to comply with the terms of the Code of Corporate Governance as contained in Prudential Regulation No. G-1, and Listing Regulations of Karachi, Lahore & Islamabad Stock Exchanges Ltd. for the purpose of establishing a framework of good governance, whereby a listed company is managed in compliance with the best practices of Corporate Governance.
The Bank has adopted the Code of Corporate Governance and applied the principles contained in the Code in the following manner:
1. The directors have confirmed that none of them is serving as a director in more than seven listed companies including the Bank.
2. The Bank encourages representation of independent directors on its Board of Directors. At present, the Board comprises of 3 independent directors, 3 non-executive sponsors’ directors, 1 executive director in addition to the Chief Executive Officer and 1 Government nominee director. Independent directors meets the criteria of independence under clause i(b) of the Code of Corporate Governance.
3. All the directors of the Bank have confirmed that they are registered tax payers and none of them has defaulted in payment of any loan to a banking company, a DFI and NBFC.
4. Last Election of the Directors of the Bank was held on August 23, 2012 for a next term of three years.
5. The Bank has adopted a “Code of Conduct” and disseminates
the same. 6. The mission / vision statement, overall corporate strategy and
significant policies have been approved by the Board. The Bank maintains a complete record of the particulars of significant policies along with the dates on which these were approved or amended.
7. All the powers of the Board have been duly exercised and decision on material transactions, including appointment and determination of remuneration and terms and conditions of employment of the CEO, CFO, Head of Internal Audit and the Company Secretary are taken by the Board.
8. Related party transactions were carried on “Arm’s Length Basis” in accordance with the Related Party Transaction Policy and placed before Audit Committee of the Board and Board of Directors for their approval.
9. The meetings of the Board were presided over by the Chairman. The Chairman of the Board is a non-executive director. The Board met at least once in every quarter and written notices along with agenda and working papers were circulated at least seven days before the meetings. The minutes of the meetings were appropriately recorded and circulated.
10. Appropriate arrangements were made for Orientation of Directors to acquaint them with their duties and responsibilities. Pakistan Institute of Corporate Governance (PICG) had awarded six of the Board members title of “Certified Director”. Whereas two directors (GoP Nominee) are exempt from such course on account of the experience and qualification and one director is in process of completion of
course. The Bank also encourages participation of members of Board to attend seminars / workshops conducted by various forums.
11. The Directors’ Report for the year ended December 31, 2012 has been prepared in compliance with the requirements of the Code and fully describes the salient matters required to be disclosed.
12. The financial statements of the Bank were duly endorsed by the Chief Executive Officer and Chief Financial Officer before their approval by the Board.
13. The Directors, Chief Executive Officer and Executives do not hold any interest in the shares of the Bank other than that disclosed in the pattern of shareholding.
14. The Bank has complied with all the corporate and financial reporting requirements of the Code.
15. The Board has formed an Audit Committee which comprises three members; and Chairman of the Committee and members are independent directors.
16. The meetings of the Audit Committee are held at least once in every quarter, prior to the approval of interim and the annual financial statements of the Bank as required by the Code.
17. The Board has approved the Charter of the Audit Committee.
18. The Board has formed Human Resource & Remuneration Committee which comprises four members including the CEO; the Chairman of the Committee is an independent director.
19. The Board has setup an effective and independent internal audit group.
20. The statutory joint auditors of the Bank have confirmed that they have been given a satisfactory rating under the Quality Control Review Program of the Institute of Chartered Accountants of Pakistan, that they or any of the partners of the firm, their spouses and minor children do not hold shares of the Bank and that the firm and all its partners are in compliance with International Federation of Accountants (IFAC) guidelines on Code of Ethics as adopted by the Institute of Chartered Accountants of Pakistan.
21. The statutory joint auditors or the persons associated with them have not been appointed to provide services other than approved services and the auditors have confirmed that they have observed IFAC guidelines in this regard.
22. We confirm that all other material principles contained in the Code have been complied with.
For and on behalf of the Board.
Khalid A. SherwaniChief Executive OfficerPlace & Date: Lahore, February 14, 2013

72
Review Report to the MembersOn Statement of Compliance With Best Practices of Code of Corporate Governance
ERNST & YOUNG FORD RHODES SIDAT HYDER Chartered AccountantsMall View Building4 – Bank SquareLahore
Ernst & Young Ford Rhodes Sidat Hyder Chartered Accountants
Engagement Partner:Naseem Akbar
LahoreDate: February 14, 2013
We have reviewed the Statement of Compliance with the best practices (the “Statement”) contained in the Code of Corporate Governance prepared by the Board of Directors of Allied Bank Limited (the Bank) to comply with Regulation G-1 of the Prudential Regulations for Corporate/Commercial Banking issued by the State Bank of Pakistan, Listing Regulation No. 35 of the Karachi Stock Exchange, Listing Regulation No. 35 of the Lahore Stock Exchange and Chapter XI of the Listing Regulations of the Islamabad Stock Exchange, where the Bank is listed.
The responsibility for compliance with the Code of Corporate Governance is that of the Board of Directors of the Bank. Our responsibility is to review, to the extent where such compliance can be objectively verified, whether the Statement of Compliance reflects the status of the Bank’s compliance with the provisions of the Code of Corporate Governance and report if it does not. A review is limited primarily to inquiries of the Bank’s personnel and review of various documents prepared by the Bank to comply with the Code.
As part of our audit of financial statements we are required to obtain an understanding of the accounting and internal control systems sufficient to plan the audit and develop an effective audit approach. We are not required to consider whether the Board’s statement on internal control covers all risks and controls, or to form an opinion on the effectiveness of such internal controls, the Bank’s corporate governance procedures and risks.
Further, Listing Regulations of Karachi, Lahore and Islamabad Stock Exchanges require the Bank to place before the Board of Directors for their consideration and approval related party transactions, distinguishing between transactions carried out on terms equivalent to those that prevail in arm’s length transactions and transactions which are not executed at arm’s length price while recording proper justification for using such alternate pricing mechanism. Further, all such transactions are also required to be separately placed before the audit committee. We are only required and have ensured compliance of requirement to the extent of approval of related party transactions by the Board of Directors and placement of such transactions before the audit committee. We have not carried out any procedures to determine whether the related party transactions were undertaken at arm’s length price or not.
Based on our review, nothing has come to our attention, which causes us to believe that the Statement does not appropriately reflect the Bank’s compliance, in all material respects, with the best practices contained in the Code of Corporate Governance as applicable to the Bank for the year ended 31 December 2012.
KPMG TASEER HADI & Co.Chartered Accountants53-L, Gulberg IIILahore
KPMG Taseer Hadi & Co.Chartered Accountants
Engagement Partner:Kamran I. Yousafi

Annual Report of Allied Bank Limited for the year 2012
73
Statement of Ethics and Business PracticesCode of Ethics
All employees of Allied Bank Limited, hereafter called ABL, are required to follow a Code of Ethics and Business Practices in all areas of professional conduct. They must abide by the following:
Laws and Rules
• All the employees are required to comply with all the laws, rules and regulations governing ABL, including the Bank’s policies, procedures and standards, the State Bank of Pakistan and the Security and Exchange Commission of Pakistan’s regulations applicable to the Bank.
• All employees must function with integrity within the scope of their authorities and follow directives given by the person(s) under whose jurisdiction they are deputed with complete honesty.
• Core value of ‘Integrity’ must be promoted by upholding fairness, equality and respect for all team members. Discrimination, harassment of all types, intimidation and other negative practices are strictly prohibited.
• Harassment includes any unwanted, immoral act or attitude, including abuse of authority, creating a hostile environment and retaliation to non compliance with unethical demands, which is demeaning or detrimental to work performance or the career of any employee in any capacity.
• Adherence to designated time schedules is imperative. The Bank is entitled to take disciplinary action in case of unauthorised absences.
• Employees in workmen cadre (clerical/non-clerical) are not authorized to indulge into unfair labour practices.
• Employees are not authorized to use Bank’s facilities to promote trade union or officer’s association activities, or carry weapons into Bank premises unless so authorized. They must not carry on above mentioned activities during office hours.
• No employee shall indulge in any political activity, including forming or joining a political, ethnic or linguistic association; get elected to a legislative body, in Pakistan or elsewhere, or indulge in any activity detrimental to the ideology of Pakistan.
• All full-time employees must devote their entire business day to their work; avoid any outside activity that interferes with their judgement in the best interest of the Bank and its clients. The Human Resource Group must be informed in case an employee:– Holds an outside directorship; carries on business activity
outside; holds majority shares/interest in a public or private business; takes direct advantage of securities of a public listed company, or serves as a client’s personal representative.
• No employee shall bring political or other outside pressure/influence to bear on the authorities/superior officers or use the media with intent to induce them to act in a manner inconsistent with rules in any matter relating to the Bank.
• Employees are prohibited from any engagement outside the Bank without prior approval from the Human Resource Group. Employees with financial or other interest in any family business, must declare in advance by writing and seek no objection.
• Employees shall not borrow from or lend personal funds or property to any Client or Vendor who has a relationship with the Bank except on market terms and conditions from financial institutions. Borrowing or lending in personal capacity within the Bank is prohibited.
• Employees shall be alert and vigilant with respect to frauds, thefts or significant illegal activity committed within the office, reporting them immediately in writing to higher authority for appropriate action to be taken. Employment or Internship Certificates can only be issued by the Human Resource Group. Receipts of funds can only be issued on prescribed forms.
• Disciplinary action may be taken in case of misconduct or unsatisfactory performance including:– Breach of above mentioned rules; wilful insubordination;
breach of confidential material; use of drugs or alcohol; falsification of documents; violation of safety/health rules; insider trading; parallel banking; money laundering and any act detrimental to the Bank’s business.
Workplace Environment
• The Bank is committed to creating and maintaining a working, learning and customer care environment, which is free from violence and has zero tolerance for violence against any employee or its property.
• Employees are not allowed to play practical jokes or pranks on each other, indulge in horseplay, or share immoral jokes with other employees, or the outside world, through Allied Bank email server or computer, or cell phones.
• Employees are prohibited to use, exchange, or sell intoxicants or drugs in the work place or come to work under their influence. Smoking is allowed only in designated areas.
• Employees are required to maintain proper dress code, appear well groomed and presentable at all the time. Livery staff should be in their proper uniform. High standards of behaviour and tidy work areas are to be maintained at all times.

74
Responsibilities towards Employer (ABL)
• Employees must raise concerns and suspicions, in confidence, about any actual or potential illegal activity or misconduct according to the process in Whistle Blowing Policy and the Anti Harassment Policy. Failure to do so will result in employee being deemed a party to the irregularity.
• Guidance must be sought from relevant Group in case any employee receives any demand or request for information from outside party including law enforcement agencies.
• Every employee must protect the Bank’s assets, physical and intellectual, and adhere to its Email and Internet Usage Policy and Acceptable Use Policy.
• Employees must maintain all records accurately and are prohibited from making any false or misleading entries, forging or tampering with signatures to compromise integrity of Bank’s record.
• Employees are required to identify all conflicts of interest and declare them immediately, including all matters expected to interfere with their duty to the Bank or ability to make unbiased and objective recommendations.
Information Management
• All employees shall regard as strictly confidential any information concerning the business of the Bank which is not intended to be made public unless required to do so under the law, consulting the Human Resource Group in case of ambiguity about a required disclosure. Confidential information must only be shared with employees on a need to know basis consistent with their job assignments as set out in Information Security and Governance Policies.
• All customers’ related information should be kept secret, used for intended purpose only and any further use should be allowed only after prior consent of the concerned customer.
• Employees should protect the privacy and confidentiality of personnel records, not sharing them inside or outside the Bank except after approval by Human Resource Group.
• Employees should not use Bank’s facilities to access, download or distribute personal or social information, including any material that may pose reputational risk to the Bank. Secrecy of passwords must be maintained to prevent unauthorized access to Bank’s systems. Personal use of internet and email is deemed inappropriate in the workplace. Private telephone conversations must be kept at a minimum during office hours.
• Only officially designated spokesperson, as provided under the Bank’s Media Policy, may provide comments about the Bank to the media.
Relationship with and Responsibilities to Customers, Prospects and other External Constituencies
• Employees must always act fairly, equitably and objectively with all customers, prospects, suppliers and other external constituencies. Highest degree of integrity, honesty, proprietary and loyalty, towards the interest of the Bank, its customers and regulators is a must.
• Employees are not authorized to accept or agree to accept any gifts or conveyance of anything of value from any current or prospective Allied Bank customers or vendors or any person who has a business relationship with the Bank with exception of the following:
• Gifts that relate to commonly recognized events or occasions such as a promotion, new job, wedding, retirement etc. provided those gifts are of reasonable value.
• Gifts from a person who has a business relationship with the Bank, provided the acceptance is based on relationship existing independent of the business of the Bank and reported to the Human Resource Group.
• Benefits available to the general public e.g. advertising or promotional materials, and discount or rebates on merchandise or services
• Civic, charitable, educational or religious organizational awards for recognition of service or accomplishment.
Other Key Legal/Compliance Rules and Issues
• Employees are strictly prohibited to engage in insider trading, buying or selling Bank’s common stocks or otherwise benefitting from sharing inside information, whether obtained through workplace or outside sources.
• ABL fully supports the intended drive against serious crime and is committed to assisting the authorities to identify money laundering transactions and where appropriate to confiscate the proceeds of crime. Employees must follow the Anti Money Laundering Policy and Procedures.
• Violation of any of the clauses of this ‘Code of Ethics’ by any employee, may lead to disciplinary proceedings culminating in punishment as per merits of the case.

Annual Report of Allied Bank Limited for the year 2012
75
Statement of Internal Controls
The Bank’s management is responsible to establish and maintain an
adequate and effective system of internal controls and procedures.
The management is also responsible for evaluating the effectiveness
of the Bank’s internal control system that covers material matters by
identifying control objective and reviewing significant policies and
procedures.
The scope of Audit and Risk Review (A&RR), independent from
line management, inter-alia includes, review and assessment of the
adequacy and effectiveness of the control activities across the Bank
as well as implementation of and compliance with all the prescribed
policies and procedures. All significant and material findings of
the internal audit reviews are reported to the Audit Committee of
the Board of Directors. The Audit Committee actively monitors
implementations, to ensure that identified risks are mitigated to
safeguard the interest of the Bank.
Banking Services is entrusted with the responsibility of expediting
rectification of irregularities and control lapses in branches’
operations and various controlling offices pointed out through audit
reviews. Vigorous efforts are made by Business Services to improve
the Control Environment at grass root level by continuous review
& streamlining of procedures to prevent & rectify control lapses as
well as imparting training at various levels. The Compliance ensures
adherence to the regulatory requirements and Bank’s internal policies
and procedures with specific emphasis on KYC/AML.
The Bank’s internal control system has been designed to provide
reasonable assurance to the Bank’s management and Board of
Directors. All Internal Control Systems, no matter how well
designed, have inherent limitations that they may not entirely
eliminate misstatements. Also projections of evaluation of
effectiveness to future periods, are subject to the risk that controls
may become inadequate because of changes in conditions or that
the degree of compliance with the policies or procedures may
deteriorate. However, control activities are ongoing process that
includes identification, evaluation and management of significant
risks faced by the Bank.
Recognizing the same, the Management of Allied Bank has adopted
an internationally accepted COSO Integrated Framework-1992, in
accordance with the guidelines on Internal Controls from the State
Bank of Pakistan and has completed all stages of Internal Control
Over Financial Reporting (ICFR). In addition, Bank has formulated
comprehensive guidelines for adherence to COSO framework on
continuing basis.
For and on behalf of the Board.
Khalid A. Sherwani
Chief Executive Officer
Date: February 14, 2013
76
Whistle Blowing Policy
Preamble
The purpose of this Policy is to create an environment at Allied
Bank Limited (the Bank) where the Bank’s staff is encouraged and
feels confident to reveal and report, without any fear of retaliation,
subsequent discrimination and of being disadvantaged in any way,
about any activity or conduct of employees, which in their opinion
may cause financial or reputational loss to the Bank.
Objectives
The intended objectives of this policy are:
• Todevelopacultureofopenness,accountabilityandintegrity;
• ToprovideanenvironmentwherebyemployeesoftheBank
are encouraged to report any immoral, unethical, fraudulent
act of any current or former employees, vendors, contractors,
service providers and customers which may cause financial or
reputation risk to the Bank;
• Tocreateawarenessamongstemployeesandstakeholders
regarding the Whistle Blowing Function; and
• Toenablemanagementtobeinformedatanearlystageabout
fraudulent, immoral, unethical or malicious activities or
misconduct and take appropriate actions.
Scope
The scope of this policy includes, without limitation, disclosure for
all types of unlawful acts, orders, fraud, corruption, misconduct,
collusive practices or any other activity which undermines the Bank’s
operations, financial position, reputation and mission.
Protection of Whistleblowers
All matters will be dealt with confidentially and the identification
of the Whistleblower will be kept completely confidential.
However, in inevitable situations, where disclosure of identity of
the Whistleblower is essential, the matter will be discussed with the
Whistleblower prior to making such disclosure. The Bank stands
committed to protect Whistleblowers for whistle blowing and any
subsequent harassment or victimization of the Whistleblower will
not be tolerated.
In case the Whistleblower feels that at his / her existing place of
posting, he / she may be subjected to victimization or harassed by
the alleged officials after the Whistle Blowing, the management will
consider request to transfer him/her to another suitable place subject
to verification by Audit & Risk Review and Human Resources.
Incentives for Whistle Blowing
On the recommendation of the ACOB, the Whistleblower, who
brings to the notice of the management or report any fraudulent,
immoral, unethical or malicious activities, which may have led to
financial or reputational losses or legal threats to the Bank, will be
suitably awarded according to the significance of the information he
/ she had provided and impact of losses averted as a result.
Process of Whistle Blowing
1. The Whistleblower should send communication under
this policy duly marked “UNDER THE CORPORATE
WHISTLE BLOWING POLICY’ and should also be marked
“CONFIDENTIAL’. The communication should be sent
to any of the following competent authorities by using any
communication media;
a. Chairman, Audit Committee of the Board;
b. Chief Executive Officer; or
c. Chief, Audit & Risk Review.
Number of instances reported to ACOB
Number of whistle blowing incidences reported to ACOB in Year
2012: Four.

for the year ended December 31, 2012
Unconsolidated Financial Statements
Allied Bank Limited

78

Annual Report of Allied Bank Limited for the year 2012
79
Auditors’ Reportto the Members
ERNST & YOUNG FORD RHODES SIDAT HYDERChartered AccountantsMall View Building4 - Bank SquareLahore
KPMG TASEER HADI & CO.Chartered Accountants53 - L, Gulberg IIILahore
We have audited the annexed unconsolidated statement of financial position of Allied Bank Limited (“the Bank”) as at 31 December 2012 and the related unconsolidated profit and loss account, unconsolidated statement of comprehensive income, unconsolidated statement of cash flow and unconsolidated statement of changes in equity together with the notes forming part thereof (here-in-after referred to as the ‘financial statements’) for the year then ended, in which are incorporated the unaudited certified returns from the branches except for 20 branches which have been audited by us and one branch audited by auditors abroad and we state that we have obtained all the information and explanations which, to the best of our knowledge and belief, were necessary for the purposes of our audit.
It is the responsibility of the Bank’s Board of Directors to establish and maintain a system of internal control, and prepare and present the financial statements in conformity with approved accounting standards and the requirements of the Banking Companies Ordinance, 1962 (LVII of 1962), and the Companies Ordinance, 1984 (XLVII of 1984). Our responsibility is to express an opinion on these financial statements based on our audit.
We conducted our audit in accordance with the International Standards on Auditing as applicable in Pakistan. These standards require that we plan and perform the audit to obtain reasonable assurance about whether the financial statements are free of any material misstatement. An audit includes examining, on a test basis, evidence supporting amounts and disclosures in the financial statements. An audit also includes assessing accounting policies and significant estimates made by management, as well as, evaluating the overall presentation of the financial statements. We believe that our audit provides a reasonable basis for our opinion and after due verification, which in the case of loans and advances covered more than 60% of the total loans and advances of the bank, we report that:-
a) in our opinion, proper books of accounts have been kept by the Bank as required by the Companies Ordinance, 1984 (XLVII of 1984), and the returns referred to above received from the branches have been found adequate for the purposes of our audit;
b) in our opinion-i) the unconsolidated statement of financial
position and unconsolidated profit and loss account together with the notes thereon have been drawn up in conformity with the Banking Companies Ordinance, 1962 (LVII of 1962), and the Companies Ordinance, 1984 (XLVII of 1984), and are in agreement with the books of account and are further in accordance with
accounting policies consistently applied;
ii) the expenditure incurred during the year was for the purpose of the Bank’s business; and
iii) the business conducted, investments made and the expenditure incurred during the year were in accordance with the objects of the Bank and the transactions of the Bank which have come to our notice have been within the powers of the Bank;
c) in our opinion and to the best of our information and according to the explanations given to us, the unconsolidated statement of financial position, unconsolidated profit and loss account, unconsolidated statement of comprehensive income, unconsolidated statement of cash flow and unconsolidated statement of changes in equity together with the notes forming part thereof conform with approved accounting standards as applicable in Pakistan, and give the information required by the Banking Companies Ordinance, 1962 (LVII of 1962), and the Companies Ordinance, 1984 (XLVII of 1984), in the manner so required and give a true and fair view of the state of the Bank’s affairs as at 31 December 2012 and its true balance of the profit, its comprehensive income, its cash flow and changes in equity for the year then ended; and
d) in our opinion Zakat deductible at source under the Zakat and Ushr Ordinance, 1980 (XVIII of 1980), was deducted by the Bank and deposited in the Central Zakat Fund established under section 7 of that Ordinance.
Ernst & Young KPMG Ford Rhodes Sidat Hyder Taseer Hadi & Co.Chartered Accountants Chartered Accountants
Engagement partner: Engagement partner:Naseem Akbar Kamran I. Yousafi Date: February 14, 2013Place: Lahore

80
Assets 446,236 375,500 Cash and balances with treasury banks 6 43,351,653 36,479,758 10,595 17,283 Balances with other banks 7 1,029,286 1,679,085 110,355 14,017 Lendings to financial institutions 8 10,720,935 1,361,754 2,752,488 2,014,356 Investments 9 267,403,346 195,694,122 2,790,377 2,516,050 Advances 10 271,084,275 244,433,474 204,542 186,177 Operating fixed assets 11 19,871,173 18,087,011 - 7,740 Deferred tax assets 12 - 751,908 189,963 177,168 Other assets 13 18,454,814 17,211,827 6,504,556 5,308,291 631,915,482 515,698,939 Liabilities 63,850 41,331 Bills payable 15 6,203,051 4,015,317 400,580 514,600 Borrowings 16 38,916,192 49,993,200 5,298,082 4,112,845 Deposits and other accounts 17 514,707,055 399,561,676 56,515 56,537 Sub-ordinated loans 18 5,490,400 5,492,600 - - Liabilities against assets subject to finance lease - - 665 - Deferred tax liabilities 12 64,584 - 160,767 136,864 Other liabilities 19 15,618,340 13,296,342 5,980,459 4,862,177 580,999,622 472,359,135 524,097 446,114 Net assets 50,915,860 43,339,804 Represented by 97,411 88,555 Share capital 20 9,463,421 8,603,110 112,262 90,198 Reserves 10,906,250 8,762,745 232,203 208,488 Unappropriated profit 22,558,411 20,254,503 441,876 387,241 42,928,082 37,620,358 82,221 58,873 Surplus on revaluation of assets - net of tax 21 7,987,778 5,719,446 524,097 446,114 50,915,860 43,339,804 Contingencies and commitments 22 The annexed notes 1 to 46 and annexures I to II form an integral part of these unconsolidated financial statements.
December 31, December 31, Note December 31, December 31, 2012 2011 2012 2011 US $ in ‘000 Rupees in ‘000
Chief Financial Officer President and Chief Executive Director
Director Chairman
Unconsolidated Statement of Financial Positionas at December 31, 2012
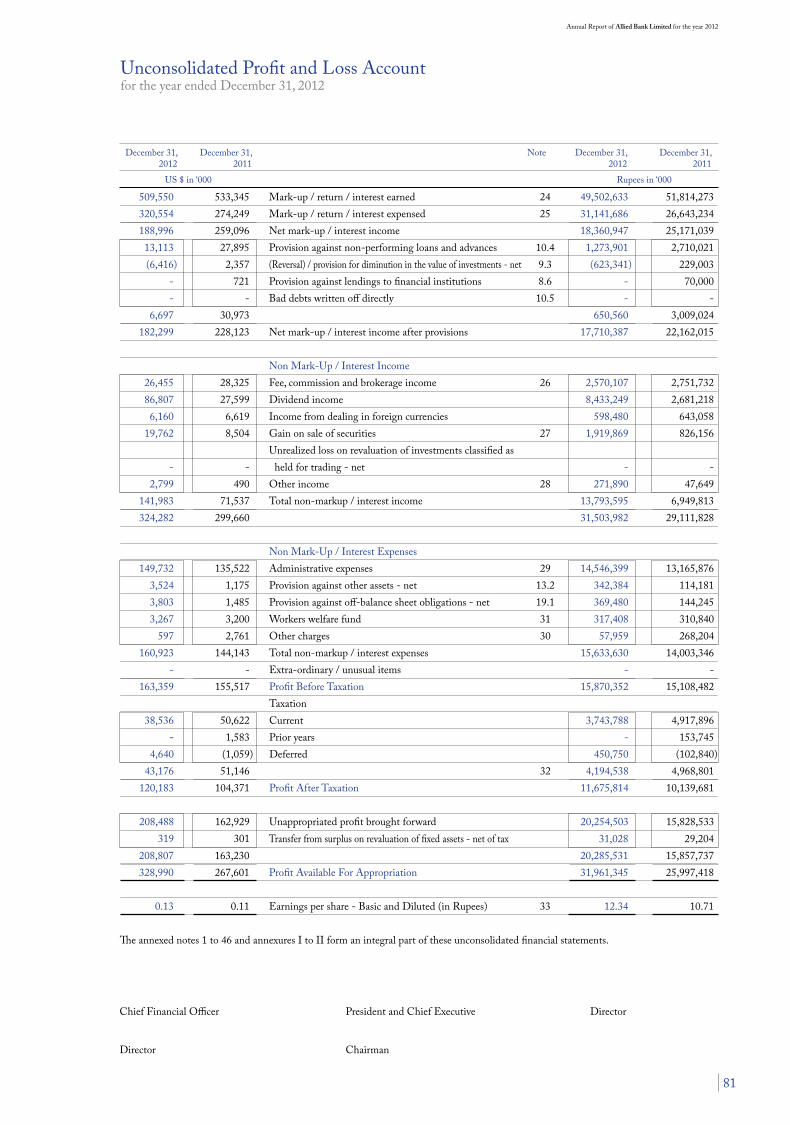
Annual Report of Allied Bank Limited for the year 2012
81
509,550 533,345 Mark-up / return / interest earned 24 49,502,633 51,814,273 320,554 274,249 Mark-up / return / interest expensed 25 31,141,686 26,643,234 188,996 259,096 Net mark-up / interest income 18,360,947 25,171,039 13,113 27,895 Provision against non-performing loans and advances 10.4 1,273,901 2,710,021 (6,416) 2,357 (Reversal) / provision for diminution in the value of investments - net 9.3 (623,341) 229,003 - 721 Provision against lendings to financial institutions 8.6 - 70,000 - - Bad debts written off directly 10.5 - - 6,697 30,973 650,560 3,009,024 182,299 228,123 Net mark-up / interest income after provisions 17,710,387 22,162,015 Non Mark-Up / Interest Income 26,455 28,325 Fee, commission and brokerage income 26 2,570,107 2,751,732 86,807 27,599 Dividend income 8,433,249 2,681,218 6,160 6,619 Income from dealing in foreign currencies 598,480 643,058 19,762 8,504 Gain on sale of securities 27 1,919,869 826,156 Unrealized loss on revaluation of investments classified as - - held for trading - net - - 2,799 490 Other income 28 271,890 47,649 141,983 71,537 Total non-markup / interest income 13,793,595 6,949,813 324,282 299,660 31,503,982 29,111,828 Non Mark-Up / Interest Expenses 149,732 135,522 Administrative expenses 29 14,546,399 13,165,876 3,524 1,175 Provision against other assets - net 13.2 342,384 114,181 3,803 1,485 Provision against off-balance sheet obligations - net 19.1 369,480 144,245 3,267 3,200 Workers welfare fund 31 317,408 310,840 597 2,761 Other charges 30 57,959 268,204 160,923 144,143 Total non-markup / interest expenses 15,633,630 14,003,346 - - Extra-ordinary / unusual items - - 163,359 155,517 Profit Before Taxation 15,870,352 15,108,482 Taxation 38,536 50,622 Current 3,743,788 4,917,896 - 1,583 Prior years - 153,745 4,640 (1,059) Deferred 450,750 (102,840) 43,176 51,146 32 4,194,538 4,968,801 120,183 104,371 Profit After Taxation 11,675,814 10,139,681 208,488 162,929 Unappropriated profit brought forward 20,254,503 15,828,533 319 301 Transfer from surplus on revaluation of fixed assets - net of tax 31,028 29,204 208,807 163,230 20,285,531 15,857,737 328,990 267,601 Profit Available For Appropriation 31,961,345 25,997,418 0.13 0.11 Earnings per share - Basic and Diluted (in Rupees) 33 12.34 10.71 The annexed notes 1 to 46 and annexures I to II form an integral part of these unconsolidated financial statements.
Chief Financial Officer President and Chief Executive Director
Director Chairman
Unconsolidated Profit and Loss Accountfor the year ended December 31, 2012
December 31, December 31, Note December 31, December 31, 2012 2011 2012 2011 US $ in ‘000 Rupees in ‘000

82
120,183 104,371 Profit after taxation for the year 11,675,814 10,139,681 Other comprehensive income Exchange differences on translation of net investment 105 - in foreign wholesale branch 10,198 - 120,288 104,371 Total comprehensive income for the year 11,686,012 10,139,681 Surplus / (deficit) on revaluation of ‘available for sale’ securities and ‘operating fixed assets’ are presented under a separate head below equity as ‘surplus / (deficit) on revaluation of assets’ in accordance with the requirements specified by the State Bank of Pakistan vide its BSD Circular No. 20 dated 04 August 2000 and BSD Circular No. 10 dated 13 July 2004 respectively and Companies Ordinance, 1984. The annexed notes 1 to 46 and annexures I to II form an integral part of these unconsolidated financial statements.
Chief Financial Officer President and Chief Executive Director
Director Chairman
December 31, December 31, December 31, December 31, 2012 2011 2012 2011 US $ in ‘000 Rupees in ‘000
Unconsolidated Statement of Comprehensive Incomefor the year ended December 31, 2012

Annual Report of Allied Bank Limited for the year 2012
83
Cash Flow From Operating Activities 163,359 155,517 Profit before taxation 15,870,352 15,108,482 (86,807) (27,599) Less: Dividend income (8,433,249) (2,681,218) 76,552 127,918 7,437,103 12,427,264 Adjustments for non-cash items: 12,783 10,607 Depreciation / amortization 1,241,870 1,030,468 13,113 27,895 Provision against non-performing loans, advances and general provision - net 1,273,901 2,710,021 (6,416) 2,357 (Reversal) / provision for diminution in the value of investments - net (623,341) 229,003 - 721 Provision against lendings to financial institutions - 70,000 3,803 1,485 Provision against off balance sheet obligations - net 369,480 144,245 3,524 1,175 Provision against other assets - net 342,384 114,181 - 1,204 Operating fixed assets written off - 116,920 (287) (26) Gain on sale of fixed assets (27,850) (2,568) 26,520 45,418 2,576,444 4,412,270 103,072 173,336 10,013,547 16,839,534 (Increase) / Decrease in operating assets (96,337) 103,521 Lendings to financial institutions (9,359,181) 10,057,190 - 8,669 Net realizations in ‘held for trading’ securities - 842,169 (287,440) 53,545 Advances - net (27,924,702) 5,201,926 7,744 3,652 Other assets (excluding advance taxation) - net 752,323 354,745 (376,033) 169,387 (36,531,560) 16,456,030 Increase / (Decrease) in operating liabilities 22,519 (1,065) Bills payable 2,187,734 (103,474) (113,671) 301,381 Borrowings from financial institutions (11,043,116) 29,279,026 1,185,237 291,070 Deposits and other accounts 115,145,379 28,277,408 19,765 8,818 Other liabilities 1,920,202 856,692 1,113,850 600,204 108,210,199 58,309,652 840,889 942,927 81,692,186 91,605,216 (63,956) (49,393) Income tax paid - net (6,213,290) (4,798,475) 776,933 893,534 Net cash flow genereated from operating activities 75,478,896 86,806,741 Cash Flow From Investing Activities (712,876) (564,385) Net investments in ‘available-for-sale’ securities (69,255,704) (54,829,878) 9,768 (215,287) Net investments in ‘held-to-maturity’ securities 948,958 (20,915,102) 88,163 20,193 Dividend income received 8,565,057 1,961,759 (32,335) (30,402) Investments in operating fixed assets (3,141,314) (2,953,523) 300 104 Proceeds from sale of fixed assets 29,097 10,094 105 - Effect of translation of net investment in foreign wholesale branch 10,198 - (646,875) (789,777) Net cash used in investing activities (62,843,708) (76,726,650) Cash Flow From Financing Activities (23) (23) Repayment of sub-ordinated loan (2,200) (2,200) (65,641) (38,126) Dividends paid (6,377,000) (3,703,935) (65,664) (38,149) Net cash used in financing activities (6,379,200) (3,706,135) 64,394 65,608 Increase in cash and cash equivalents during the year 6,255,988 6,373,956 390,574 326,560 Cash and cash equivalents at beginning of the year 37,944,183 31,725,190 1,861 266 Effect of exchange rate changes on opening cash and cash equivalents 180,768 25,805 456,829 392,434 Cash and cash equivalents at end of the year 34 44,380,939 38,124,951 The annexed notes 1 to 46 and annexures I to II form an integral part of these unconsolidated financial statements.
Chief Financial Officer President and Chief Executive Director
Director Chairman
Unconsolidated Statement of Cash Flowfor the year ended December 31, 2012
December 31, December 31, Note December 31, December 31, 2012 2011 2012 2011 US $ in ‘000 Rupees in ‘000

84
Capital Reserve Revenue Reserves
Share Share Exchange Bouns Issue Special Merger Statutory General Un- Capital Premium Translation Reserve Reserve* Reserve* Reserve Reserve appropriated Total Reserve Profit
Rupees in ‘000 Balance as at January 01, 2011 7,821,009 983,957 - - 67,995 333,864 6,125,094 6,000 15,828,533 31,166,452
Changes in equity during the year ended
December 31, 2011
Total comprehensive income for the year ended
December 31, 2011
Net profit for the year ended December 31, 2011 - - - - - - - - 10,139,681 10,139,681
- Effect of translation of net investment in
foreign wholesale bank branch - - - - - - - - - -
- - - - - - - - 10,139,681 10,139,681
Transactions with owners recognized directly in equity
Transfer to reserve for issue of bonus shares
for the year ended December 31, 2010 @ 10% - (782,101) - 782,101 - - - - - -
Issue of bonus shares 782,101 - - (782,101) - - - - - -
Final cash dividend for the year ended December
31, 2010 (Rs. 2.00 per ordinary share) - - - - - - - - (1,564,202) (1,564,202)
Interim cash dividend for the year ended December -
31, 2011 (Rs. 2.50 per ordinary share) - - - - - - - - (2,150,777) (2,150,777)
782,101 (782,101) - - - - - - (3,714,979) (3,714,979)
Transferred from surplus on revaluation of fixed assets
to un-appropriated profit - net of tax - - - - - - - - 29,204 29,204
Transfer to statutory reserve - - - - - - 2,027,936 - (2,027,936) -
Balance as at December 31, 2011 8,603,110 201,856 - - 67,995 333,864 8,153,030 6,000 20,254,503 37,620,358
Changes in equity during the year ended
December 31, 2012
Total comprehensive income for the year ended
December 31, 2012
Net profit for the year ended December 31, 2012 - - - - - - - - 11,675,814 11,675,814
- Effect of translation of net investment in
foreign wholesale bank branch - - 10,198 - - - - - - 10,198
- - 10,198 - - - - - 11,675,814 11,686,012
Transactions with owners recognized directly in equity
Transfer to reserve for issue of bonus shares for the
year ended December 31, 2011 @ 10% - (201,856) - 860,311 - - - - (658,455) -
Issue of bonus shares 860,311 - - (860,311) - - - - - -
Final cash dividend for the year ended December
31, 2011 (Rs. 2.50 per ordinary share) - - - - - - - - (2,150,777) (2,150,777)
First interim cash dividend for the year ended
December 31, 2012 (Rs. 2.00 per ordinary share) - - - - - - - - (1,892,684) (1,892,684)
Second interim cash dividend for the year ended
December 31, 2012 (Rs. 1.50 per ordinary share) - - - - - - - - (1,419,513) (1,419,513)
Third interim cash dividend for the year ended
December 31, 2012 (Re. 1 per ordinary share) - - - - - - - - (946,342) (946,342)
860,311 (201,856) - - - - - - (7,067,771) (6,409,316)
Transferred from surplus on revaluation of fixed assets
to un-appropriated profit - net of tax - - - - - - - - 31,028 31,028
Transfer to statutory reserve - - - - - - 2,335,163 - (2,335,163) -
Balance as at December 31, 2012 9,463,421 - 10,198 - 67,995 333,864 10,488,193 6,000 22,558,411 42,928,082
* These were created as a result of merger of Ibrahim Leasing Limited and First Allied Bank Modaraba into Allied Bank Limited.
The annexed notes 1 to 46 and annexures I to II form an integral part of these unconsolidated financial statements.
Unconsolidated Statement of Changes in Equityfor the year ended December 31, 2012
Chief Financial Officer President and Chief Executive Director
Director Chairman

Annual Report of Allied Bank Limited for the year 2012
85
1. STATUS AND NATURE OF BUSINESS
Allied Bank Limited (“the Bank”), incorporated in Pakistan, is a scheduled Bank, engaged in commercial banking and related services. The Bank is listed on all stock exchanges in Pakistan. The Bank operates a total of 873 (2011: 836) branches in Pakistan, 1 branch (2011:1) in Karachi Export Processing Zone Branch, and 1 wholesale banking branch (2011: Nil) in Bahrain. The long term credit rating of the Bank assigned by The Pakistan Credit Rating Agency Limited (PACRA) is ‘AA+’. Short term rating of the Bank is ‘A1+’. The Bank is the holding company of ABL Asset Management Company Limited.
The registered office of the Bank is situated at 3 Tipu Block, Main Boulevard, New Garden Town, Lahore. 2. (a) BASIS OF PRESENTATION
- These unconsolidated financial statements represent separate financial statements of the Bank. The consolidated financial statements of the Bank and its subsidiary company are being issued separately.
- In accordance with the directives of the Federal Government regarding the shifting of the banking system to
Islamic modes, the State Bank of Pakistan (SBP) has issued various circulars from time to time. Permissible forms of trade-related modes of financing include purchase of goods by banks from their customers and immediate resale to them at appropriate mark-up in price on deferred payment basis. The purchases and sales arising under these arrangements are not reflected in these unconsolidated financial statements as such but are restricted to the amount of facility actually utilized and the appropriate portion of mark-up thereon.
- These unconsolidated financial statements have been presented in Pakistan Rupees (PKR), which is the Bank’s
functional and presentation currency. The amounts are rounded to nearest thousand. - The US Dollar amounts reported in the statement of financial position, profit and loss account, statement of
comprehensive income and statement of cash flow are stated as additional information, solely for the convenience of the users of financial statements. For the purpose of translation to US Dollar, spot rate of Rs 97.1497 per US Dollar has been used for 2012 and 2011, as it was the prevalent rate as on date of statement of financial position.
(b) BASIS OF MEASUREMENT
These unconsolidated financial statements have been prepared under the historical cost convention except the following are stated at revalued amounts / fair values:
- Investments (Note 5.3) - Operating fixed assets (Note 5.5) - Derviatives (Note 4) 3. STATEMENT OF COMPLIANCE
3.1 These unconsolidated financial statements have been prepared in accordance with approved accounting standards as applicable in Pakistan. Approved Accounting Standards comprise of such International Financial Reporting Standards (IFRSs) issued by the International Accounting Standards Board (IASB) as are notified under the Companies Ordinance, 1984, provisions of and directives issued under the Banking Companies Ordinance, 1962, the Companies Ordinance, 1984 and the directives issued by SBP. In case requirements of provisions and directives issued under the Banking Companies Ordinance, 1962, Companies Ordinance, 1984 and the directives issued by State Bank of Pakistan differ from requriements of IFRSs, the provisions of and directives issued under the Banking Companies Ordinance, 1962, the Companies Ordinance, 1984 and the directives issued by SBP shall prevail.
3.2 The SBP, vide BSD Circular No. 10, dated August 26, 2002 has deferred the applicability of International Accounting Standard
39, Financial Instruments: Recognition and Measurement (IAS 39) and International Accounting Standard 40, Investment Property (IAS 40) for banking companies till further instructions. Further, according to a notification of Securities and Exchange Commission of Pakistan (SECP) dated April 28, 2008, International Financial Reporting Standard (IFRS) 7 “Financial Instruments Disclosure” has not been made applicable for banks. Accordingly, the requirements of these standards have not been considered in the preparation of these unconsolidated financial statements. However, investments have been classified and disclosed in accordance with the requirements prescribed by SBP through various circulars.
3.3 New and amended standards and interpretations became effective during the year
During the year, following new / revised standards, amendments and interpretations to accounting standards became effective:
Notes to the Unconsolidated Financial Statementsfor the year ended December 31, 2012
86
Notes to the Unconsolidated Financial Statementsfor the year ended December 31, 2012
IFRS 7 – Financial Instruments : Disclosures – (Amendments)
The amendment requires additional disclosure about financial assets that have been transferred but not derecognised to enable the user of the Bank’s financial statements to understand the relationship with those assets that have not been derecognised along with their associated liabilities. In addition, the amendment requires disclosures about continuing involvement in derecognised assets to enable the user to evaluate the nature of, and risks associated with, the entity’s continuing involvement in those derecognised assets. The amendment becomes effective for annual periods beginning on or after 1 July 2011. However according to a notification of Securities and Exchange Commission of Pakistan (SECP) dated April 28, 2008, International Financial Reporting Standard (IFRS) 7 “Financial Instruments Disclosure” has not been made applicable for banks.
IAS 1 Financial Statement Presentation – Presentation of Items of Other Comprehensive Income (OCI)
The amendments to IAS 1 change the grouping of items presented in other comprehensive income. Items that could be reclassified (or ‘recycled’) to profit or loss at a future point in time (for example, upon derecognition or settlement) would be presented separately from items that will never be reclassified. The requirements of other IFRSs continue to apply in this regard. The amendment affects presentation only and has no impact on the bank’s financial position or performance. The amendment becomes effective for annual periods beginning on or after 1 July 2012.
IAS 12 Income Taxes – Recovery of Underlying Assets
Amendments to IAS 12 – deferred tax on investment property (effective for annual periods beginning on or after January 01, 2012). The 2010 amendment provides an exception to the measurement principle in respect of investment property measured using the fair value model in accordance with IAS 40 Investment Property. The measurement of deferred tax assets and liabilities, in this limited circumstance, is based on a rebuttable presumption that the carrying amount of the investment property will be recovered entirely through sale. The presumption can be rebutted only if the investment property is depreciable and held within a business model whose objective is to consume substantially all of the asset’s economic benefits over the life of the asset. The amendment has no impact on financial statements of the Bank.
In May 2010, International Accounting Standards Board issued amendments to various standards primarily with a view to
removing inconsistencies and clarifying wording. These improvements are listed below: IFRS 3 – Business Combinations - Transition requirements for contingent consideration from a business combination that occurred before the effective date of
the revised IFRS - Measurement of non-controlling interests (NCI) - Un-replaced and voluntarily replaced share-based payment awards IAS 1 – Presentation of Financial Statements - Clarification of statement of changes in equity IAS 27 – Consolidated and Separate Financial Statements - Transition requirements for amendments made as a result of IAS 27 Consolidated and Separate Financial Statements IAS 34 – Interim Financial Reporting - Significant events and transactions IFRIC 13 – Customer Loyalty Programmes - Fair value of award credits Adoption of the above standards, amendments and interpretations did not affect the accounting policies of the Bank. Certain
amendments introduced in IAS 32, IFRS 7 and IFRIC 19 do not have any impact on accounting policies as the applicability of such standard and interpretations have been deferred by SBP as disclosed in note 3.2.
3.4 Standards, Interpretations and Amendments to Published Approved Accounting Standards that are not yet effective
The following standards, amendments and interpretations of approved accounting standards will be effective for accounting periods beginning on or after January 01, 2012. These standards are either not relevant to the Bank’s operations or are not expected to have a significant impact on the Bank’s financial statements except to the extent of effect of amendments in IAS 19 “Employee Benefits”, when they will become effective.

Annual Report of Allied Bank Limited for the year 2012
87
Notes to the Unconsolidated Financial Statementsfor the year ended December 31, 2012
IFRS 7 – Financial Instruments : Disclosures – (Amendments)
The amendment requires enhance the disclosures regarding off setting of financial assets to enable the users to understand and evaluate the effect of off-setting on the financial statements. The amendment becomes effective for annual periods beginning on or after January 01, 2013.
However, the amendment will not have any impact on financial position as the applicability of such standard and interpretation have been deferred by SBP as mentioned in note 3.2.
IAS 19 – Employee Benefits –(Amendment)
IAS 19 Employee benefits (amended 2011)-(effective for annual periods beginning January 01, 2013). The amendments fundamental changes to simple clarification and re-wording. The significant changes include the following:
For defined benefit plans, the ability to defer recognition of actuarial gains and losses (i.e., the corridor approach) has been
removed. As revised, actuarial gains and losses are recognized in other comprehensive income when they occur. Amounts recorded in profit and loss are limited to current and past service costs, gains or losses on settlements, and net interest income (expense). All other changes in the net defined benefit asset (liability) are recognized in other comprehensive income with no subsequent recycling to profit and loss.
The distinction between short-term and other long-term employee benefits will be based on the expected timing of settlement
rather than the employee’s entitlement to the benefits. Objectives for disclosures of defined benefit plans are explicitly stated in the revised standard, along with new or revised
disclosure requirements. These new disclosures include quantitative information of the sensitivity of the defined benefit obligation to a reasonably possible change in each significant actuarial assumption.
While the Bank is currently assessing the full impact of the above amendments which are effective from January 01, 2013 on the
financial statements, it is expected that the adoption of the said amendments will result in change in the Bank’s accounting policy related to recognition of actuarial gains and losses as referred to in note 36.4 to recognize actuarial gains and losses in total in other comprehensive income in the period in which they occur. The potential impact of the said changes on the financial position and performance for the year 2013 is estimated as under:
Rupees in ‘000 Net decrease in employees’ benefits liability (1,691,667) Net increase in comprehensive income 1,691,667 IAS 28 - Investments in Associates and Joint Ventures
IAS 28 Investments in Associates and Joint Ventures (2011) - (effective for annual periods beginning on or after January 01, 2013). IAS 28 (2011) makes the amendments to apply IFRS 5 to an investment, or a portion of an investment, in an associate or a joint venture that meets the criteria to be classified as held for sale; and on cessation of significant influence or joint control, even if an investment in an associate becomes an investment in a joint venture. The amendments have no impact on financial statements of the Bank.
IAS 32 - Offsetting Financial Assets and Financial Liabilities (Amendments)
Offsetting Financial Assets and Financial Liabilities (Amendments to IAS 32) – (effective for annual periods beginning on or after January 01, 2014). The amendments address inconsistencies in current practice when applying the offsetting criteria in IAS 32 Financial Instruments: Presentation. The amendments clarify the meaning of ‘currently has a legally enforceable right of set-off ’; and that some gross settlement systems may be considered equivalent to net settlement.
In addition to the above, the following new standards have been issued by IASB which are yet to be notified by the SECP / SBP
for the purpose of applicability in Pakistan. IFRS 9 Financial Instruments: Classification and Measurement
IFRS 9 “Financial Instruments: Classification and Measurement” as issued reflects the first phase of the IASB’s work on the replacement of IAS 39 “Financial Instruments: Recognition and Measurement” and applies to classification and measurement of financial assets and financial liabilities as defined in IAS 39 “Financial Instruments: Recognition and Measurement”. The standard is mandatorily effective for annual periods beginning on or after January 01, 2015.
88
Notes to the Unconsolidated Financial Statementsfor the year ended December 31, 2012
IFRS 10 Consolidated Financial Statements
IFRS 10 “Consolidated Financial Statements” replaces the portion of IAS 27 “Consolidated and Separate Financial Statements” that addresses the accounting for consolidated financial statements. It also includes the issues raised in SIC-12 “Consolidation-Special Purpose Entities”.
IFRS 10 establishes a single control model that applies to all entities including special purpose entities. The changes introduced by IFRS 10 will require management to exercise significant judgment to determine which entities are controlled, and therefore, are required to be consolidated by a parent, compared with the requirements that were in IAS 27.
This standard becomes effective for annual periods beginning on or after January 01, 2013. IFRS 11 Joint Arrangements
IFRS 11 “Joint Arrangements” replaces IAS 31 “Interests in Joint Ventures” and SIC-13 “Jointly-Controlled Entities- Non-Monetary Contributions by Ventures”.
IFRS 11 removes the option to account for jointly controlled entities ( JCEs) using proportionate consolidation. Instead, JCEs that meet the definition of a joint venture must be accounted for using the equity method.
The application of this new standard will not impact the financial position of the Bank . This standard becomes effective for annual periods beginning on or after January 01, 2013.
IFRS 12 Disclosure of Involvement with Other Entities
IFRS 12 “Disclosure of Involvement with Other Entities” includes all disclosures that were previously in IAS 27 “Consolidated and Separate Financial Statements” related to consolidated financial statements, as well as all of the disclosures that were previously included in IAS 31 “Interest in Joint Ventures” and IAS 28 “Investments in Associates”. These disclosures relate to an entity’s interests in subsidiaries, joint arrangements, associates and structured entities. A number of new disclosures are also required. This standard becomes effective for annual periods beginning on or after 1 January 2013.
IFRS 13 Fair Value Measurement
IFRS 13 “Fair Value Measurement” establishes a single source of guidance under IFRS for all fair value measurements. IFRS 13 does not mandate when an entity is required to use fair value, but rather provides guidance on how to measure fair value under IFRS when fair value is required or permitted. The Bank is currently assessing the impact of this standard on its financial position and performance. This standard becomes effective for annual periods beginning on or after January 01, 2013.
4. CRITICAL ACCOUNTING JUDGMENTS AND KEY SOURCES OF ESTIMATION UNCERTAINTY
The preparation of financial statements in conformity with the approved accounting standards requires the use of certain critical accounting estimates that affect the reported amounts of assets, liabilities, income and expenses. It also requires the management to exercise its judgment in the process of applying the Bank’s accounting policies. Estimates and judgments are continually evaluated and are based on historical experience, including expectations of future events that are believed to be reasonable under the circumstances. The areas where various assumptions and estimates are significant to the Bank’s financial statements or where judgment was exercised in application of accounting policies are as follows:
i) Classification of investments
- In classifying investments as “held-for-trading” the Bank has determined securities which are acquired with the intention to trade by taking advantage of short term market / interest rate movements and are to be sold within 90 days.
- In classifying investments as “held-to-maturity” the Bank follows the guidance provided in SBP circulars on
classifying non-derivative financial assets with fixed or determinable payments and fixed maturity. In making this judgment, the Bank evaluates its intention and ability to hold such investments to maturity.
- The investments which are not classified as held for trading or held to maturity are classified as available for sale.

Annual Report of Allied Bank Limited for the year 2012
89
Notes to the Unconsolidated Financial Statementsfor the year ended December 31, 2012
ii) Provision against non performing loans and advances and debt securities classified as investments
The Bank reviews its loan portfolio and debt securities classified as investments to assess amount of non-performing loans and advances and debt securities and provision required there-against. While assessing this requirement various factors including the delinquency in the account, financial position of the borrower, the forced sale value of the securities and the requirements of the Prudential Regulations are considered. For portfolio provision on consumer advances, the Bank follows, the general provision requirement set out in Prudential Regulations. These provisions change due to changes in requirements.
iii) Valuation and impairment of available for sale equity investments
The Bank determines that available-for-sale equity investments are impaired when there has been a significant or prolonged decline in the fair value below its cost. This determination of what is significant or prolonged requires judgment. In making this judgment, the Bank evaluates among other factors, the normal volatility in share price. In addition, impairment may be appropriate when there is evidence of deterioration in the financial health of the investee, industry and sector performance, changes in technology and operational and financing cash flows.
iv) Income taxes
In making the estimates for income taxes currently payable by the Bank, the management looks at the current income tax laws and the decisions of appellate authorities. In determination of deferred taxes, estimates of the Bank’s future taxable profits are taken into account.
v) Fair value of derivatives
The fair values of derivatives which are not quoted in active markets are determined by using valuation techniques. The valuation techniques take into account the relevant interest rates in effect at the statement of financial position date and the rates contracted.
vi) Fixed assets, depreciation and amortisation
In making estimates of the depreciation / amortisation, the management uses method which reflects the pattern in which economic benefits are expected to be consumed by the Bank and estimates the useful life. The method applied and useful lives estimated are reviewed at each financial year end and if there is a change in the expected pattern or timing of consumption of the future economic benefits embodied in the assets, the estimate would be changed to reflect the change in pattern. Such a change is accounted for as change in accounting estimates in accordance with International Accounting Standard - 8, “Accounting Policies, “Changes in Accounting Estimates and Errors”.
vii) Defined benefits plan
Liability is determined on the basis of actuarial advice using the Projected Unit Credit Method. The actuarial assumptions used to determine the liability and related expense are disclosed in note 36.
5. SUMMARY OF SIGNIFICANT ACCOUNTING POLICIES
The accounting policies adopted in the preparation of these unconsolidated financial statements are the same as those applied in the preparation of the unconsolidated financial statements of the Bank for the year ended December 31, 2011 except as stated in Note 3.3. Significant accounting policies are enumerated as follows:
5.1 Cash and cash equivalents
For the purpose of cash flow statement, cash and cash equivalents include cash and balances with treasury banks and balances with other banks (net of overdrawn Nostro balances) in current and deposit accounts.
5.2 Lendings to / borrowings from financial institutions
The Bank enters into transactions of borrowing (re-purchase) from and lending (reverse re-purchase) to financial institutions, at contracted rates for a specified period of time. These are recorded as under:
(a) Sale under re-purchase agreements
Securities sold subject to a re-purchase agreement are retained in the financial statements as investments and the counter party liability is included in borrowings from financial institutions. The differential in sale and re-purchase value is accrued on a prorata basis and recorded as interest expense.

90
Notes to the Unconsolidated Financial Statementsfor the year ended December 31, 2012
(b) Purchase under resale agreements
Securities purchased under agreement to resell (reverse re-purchase) are included in lendings to financial institutions. The differential between the contracted price and resale price is amortised over the period of the contract and recorded as interest income.
Securities held as collateral are not recognized in the financial statements, unless these are sold to third parties, in
which case the obligation to return them is recorded at fair value as a trading liability under borrowings from financial institutions.
Other borrowings including borrowings from SBP are recorded at the proceeds received. Mark-up on such borrowings is charged
to the profit and loss account on a time proportion basis. Lendings are stated net of provision. Mark-up on such lending is charged to the profit and loss account on a time proportion basis
except mark-up on impaired / delinquent lendings, which is recognized on receipt basis. 5.3 Investments
5.3.1 The Bank at the time of purchase classifies its investment portfolio into the following categories, which are initially recognized at fair value plus the acquisition cost, except in case of held for trading investments, in which cases, these are charged off to the profit and loss account.
5.3.1.1 Investments in subsidiaries are stated at cost less impairment. 5.3.1.2 Other investments are classified as follows: (a) Held for trading
These are securities which are either acquired for generating a profit from short-term fluctuations in market prices, interest rate movements, dealer’s margin or are securities included in a portfolio in which a pattern of short-term profit taking exists.
(b) Held to maturity
These are securities with fixed or determinable payments and fixed maturity that the Bank has the positive intent and ability to hold to maturity.
(c) Available for sale
These are investments, other than those in subsidiary, that do not fall under the held for trading or held to maturity categories.
5.3.2 In accordance with the requirements of the SBP, quoted securities, other than those classified as held to maturity and investments in
subsidiaries, are carried at market value. Investments classified as held to maturity are carried at amortized cost whereas investments in subsidiaries are carried at cost less impairment losses, if any.
Unrealized surplus / (deficit) arising on revaluation of the Bank’s held for trading investment portfolio is taken to the profit and
loss account. Surplus / (deficit) arising on revaluation of quoted securities classified as available for sale is kept in a separate account shown in the statement of financial position below equity. The surplus / (deficit) arising on these securities is taken to the profit and loss account when actually realised upon disposal or when the investment is considered to be impaired.
Unquoted equity securities are valued at the lower of cost and break-up value. Subsequent increases or decreases in the carrying
value are credited / charged to profit and loss account. Break-up value of equity securities is calculated with reference to the net assets of the investee company as per the latest available audited financial statements. Investments in other unquoted securities are valued at cost less impairment losses, if any.
Provision for diminution in the value of securities (except for debentures, participation term certificates and term finance certificates)
is made after considering impairment, if any, in their value. Provision for diminution in value of debentures, participation term certificates and term finance certificates are made in accordance with the requirements of Prudential Regulations issued by SBP.
Associates as defined under local statutes but not under IAS are accounted for as ordinary investments.

Annual Report of Allied Bank Limited for the year 2012
91
Notes to the Unconsolidated Financial Statementsfor the year ended December 31, 2012
All “regular way” purchases and sales of investments are recognized on the trade date, i.e., the date that the Bank commits to purchase or sell the asset. Regular way purchases or sales are purchases or sales of investments that require delivery of assets within the time frame generally established by regulation or convention in the market place.
5.4 Advances (including net investment in finance lease)
Advances are stated net of general and specific provisions. Specific provision against funded loans is determined in accordance with the requirements of the Prudential Regulations issued by the SBP and charged to the profit and loss account. General provision is maintained on consumer portfolio in accordance with the requirements of Prudential Regulations issued by SBP and charged to the profit and loss account.
Leases, where the Bank transfers substantially all the risks and rewards incidental to the ownership of an asset to the lessee are
classified as finance leases. A receivable is recognized at an amount equal to the present value of the minimum lease payments, including un-guaranteed residual value, if any. Finance lease receivables are included in advances to the customers.
Advances are written off when there are no realistic prospects of recovery. 5.5 Operating fixed assets and depreciation
Tangible assets
Property and equipment owned by the Bank, other than land which is not depreciated, are stated at cost or revalued amount less accumulated depreciation and impairment losses, if any. Land is carried at revalued amount.
Depreciation is calculated using the straight line method, except buildings which are depreciated using the reducing balance
method, to write down the cost of property and equipment to their residual values over their estimated useful lives. The rates at which the fixed assets are depreciated are disclosed in note 11.2. The residual values, useful lives and depreciation methods are reviewed and changes, if any, are treated as change in accounting estimates, at the date of statement of financial position.
Depreciation on additions is charged from the month the assets are available for use, while no depreciation is charged in the month
in which the assets are disposed off. Surplus arising on revaluation of fixed assets is credited to surplus on revaluation of fixed assets account. Deficit arising on
subsequent revaluation of fixed assets is adjusted against the balance in the above mentioned surplus account as allowed under the provisions of the Companies Ordinance, 1984. The surplus on revaluation of fixed assets to the extent of incremental depreciation charged on the related assets, is transferred directly to unappropriated profit (net of deferred tax).
Revaluation is carried out with sufficient regularity to ensure that the carrying amount of assets does not differ materially from
their fair value. An item of property and equipment is derecognized upon disposal or when no future economic benefits are expected from its
use or disposal. Any gain or loss arising on derecognition of the asset is recognized in the profit and loss account in the year the asset is derecognized, except that the related surplus on revaluation of fixed assets (net of deferred tax) is transferred directly to unappropriated profit.
Subsequent costs are included in the asset’s carrying amount only when it is probable that future economic benefits associated with
the item will flow to the Bank and the cost of the item can be measured reliably. All other repairs and maintenance are charged to the profit and loss account.
Intangible assets
Intangible assets are carried at cost less any accumulated amortization and impairment losses, if any. The cost of intangible assets is amortized over their estimated useful lives, using the straight line method. Amortization is charged from the month the assets are available for use at the rate stated in note 11.3. The useful lives are reviewed and adjusted, if appropriate, at the date of statement of financial position.
Capital work-in-progress
Capital work- in- progress is stated at cost less impairment losses, if any.

92
5.6 Taxation
Current
Provision for current taxation is based on taxable income for the year determined in accordance with the prevailing laws for taxation on income earned. The charge for current tax is calculated using the prevailing tax rates or tax rates expected to apply to the profits for the year. The charge for current tax also includes adjustments, where considered necessary relating to prior years, arising from assessments finalised during the year for such years.
Deferred
Deferred tax is recognized using the balance sheet liability method on all temporary differences, at the reporting date between the amounts attributed to assets and liabilities for financial reporting purpose and amounts used for taxation purposes. Deferred tax is calculated at the rates that are expected to apply to the periods when the difference will reverse, based on tax rates that have been enacted or substantially enacted at the reporting date.
Deferred tax assets are recognized only to the extent that it is probable that future taxable profits will be available against which the
assets can be utilized. Deferred tax assets are reduced to the extent that it is no longer probable that the related tax benefit will be realised.
“The Bank also recognizes a deferred tax asset / liability on deficit / surplus on revaluation of fixed assets and securities which is
adjusted against the related deficit / surplus in accordance with the requirements of IAS-12 “Income Taxes”. 5.7 Staff retirement and other benefits
5.7.1 Staff retirement schemes
a) For employees who opted for the new scheme introduced by the management:
An approved pension scheme (defined benefit scheme) under which the benefits on the basis of frozen basic salary service and age as on June 30, 2002 are payable to all employees whose date of joining the Bank is on or before July 01, 1992 i.e., who have completed 10 years of service as on June 30, 2002; and
An approved gratuity scheme (defined benefit scheme) under which the benefits are payable as under: i) For members whose date of joining the Bank is on or before July 01, 1992, their services would be calculated
starting from July 01, 2002 for gratuity benefit purposes. ii) For members whose date of joining the Bank is after July 01, 1992 their services would be taken at actual for the
purpose of calculating the gratuity benefit. A Contributory Provident Fund scheme to which equal contribution are made by the Bank and the employees (defined
contribution scheme). b) For employees who did not opt for the new scheme:
An approved pension scheme (defined benefit scheme) under which the benefits on the basis of frozen basic salary as on June 30, 2002 are payable to all employees opting continuation of the previous scheme and whose date of joining the Bank is on or before July 01, 1992, i.e., who had completed ten years of service as on June 30, 2002.
Until December 31, 2008, the bank operated a contributory benevolent fund, which was discontinued for active
employees. Existing employees were also given an option to settle their monthly grant with a lump sum payment. Those who have not opted for the lump sum option will continue to receive benevolent grant (defined benefit scheme).
c) Post retirement medical benefits
The Bank provides post retirement medical benefits to eligible retired employees. Provision is made annually to meet the cost of such medical benefits on the basis of actuarial valuation carried out using the Projected Unit Credit Method.
Annual contributions towards the defined benefit schemes are made on the basis of actuarial valuation carried out using the
Projected Unit Credit Method. Actuarial gains/losses arising from experience adjustments and changes in actuarial assumptions are amortized over the future expected remaining working lives of the employees, to the extent of the greater of ten percent of the
Notes to the Unconsolidated Financial Statementsfor the year ended December 31, 2012

Annual Report of Allied Bank Limited for the year 2012
93
present value of the defined benefit obligations at that date (before deducting plan assets) and ten percent of the fair value of any plan assets at that date.
5.7.2 Other benefits
Employees’ compensated absences
Employees’ entitlement to annual leave is recognised when they accrue to employees. A provision is made for estimated liability for annual leaves as a result of services rendered by the employee against unavailed leaves, as per terms of service contract, up to the reporting date, based on actuarial valuation using Projected Unit Credit Method.
5.8 Assets acquired in satisfaction of claims
The Bank occasionally acquires assets in settlement of certain advances. These are stated at lower of the carrying value of the related advances and the current fair value of such assets.
5.9 Deposits
Deposits are initially recorded at the amount of proceeds received. Mark-up accrued on deposits is recognized separately as part of other liabilities and is charged to the profit and loss account on a time proportion basis.
5.10 Subordinated loans
Subordinated loans are initially recorded at the amount of proceeds received. Mark-up accrued on these loans is recognized separately as part of other liabilities and is charged to the profit and loss account on a time proportion basis.
5.11 Impairment
At each reporting date, the Bank reviews the carrying amount of its assets (other then deferred tax assets) to determine whether there is an indication that those assets have suffered an impairment loss. If any such indication exists, the recoverable amount of assets is estimated in order to determine the extent of the impairment loss, if any. Recoverable amount is the greater of net selling price and value in use. If the recoverable amount of an asset is estimated to be less than its carrying amount, the carrying amount of the assets is reduced to its recoverable amount. The resulting impairment loss is recognized as an expense immediately, except for the impairment loss on revalued fixed assets which is adjusted against the related revaluation surplus to the extent that the impairment loss does not exceed the surplus on revaluation of those assets.
For assets excluding goodwill, an assessment is made at each reporting date as to whether there is any indication that previously
recognised impairment losses may no longer exist or may have decreased. If such indication exists, the Bank estimates the asset’s or cash-generating unit’s recoverable amount. A previously recognized impairment loss is reversed only if there has been a change in the assumptions used to determine the asset’s recoverable amount since the last impairment loss was recognised. The reversal is limited so that the carrying amount of the asset does not exceed its recoverable amount, nor exceed the carrying amount that would have been determined, net of depreciation, had no impairment loss been recognised for the asset in prior years. Such reversal is recognised in the profit and loss account unless the asset is carried at a revalued amount, in which case the reversal is treated as a revaluation increase.
5.12 Provisions
Provisions are recognized when the Bank has a present obligation (legal or constructive) as a result of past events and it is probable that an outflow of resources embodying economic benefits will be required to settle the obligation and a reliable estimate of the amount can be made.
Provision against identified non-funded losses is recognized when intimated and reasonable certainty exists for the Bank to
settle the obligation. The loss is charged to the profit and loss account net of expected recovery and is classified under other liabilities.
Provisions are reviewed at the reporting date and are adjusted to reflect the current best estimate. 5.13 Dividend distribution and appropriations
Bonus and cash dividend and other appropriations (except for the appropriations required by law), declared / approved subsequent to the reporting date are considered as non-adjusting event and are not recorded in unconsolidated financial statements of the current year. These are recognized in the period in which these are declared / approved.
Notes to the Unconsolidated Financial Statementsfor the year ended December 31, 2012

94
5.14 Foreign currencies
a) Foreign currency transactions
Transactions in foreign currencies are translated into rupees at the foreign exchange rates ruling on the transaction date. Monetary assets and liabilities in foreign currencies are expressed in rupee terms at the rates of exchange ruling on the reporting date. Foreign bills purchased are valued at spot rate and forward foreign exchange contracts are valued at forward rates applicable to their respective maturities.
b) Foreign operations
The assets and liabilities of foreign wholesale bank branch are translated to Pakistan Rupee at exchange rates prevailing at reporting date. The results of foreign operations are translated at the average rate of exchange.
c) Translation gains and losses
Translation gains and losses arising on revaluation of net investments in foreign operations are taken to equity under “Exchange Translation Reserve” through Other Comprehensive Income and on disposal are recognised in profit and loss account.
d) Commitments
Commitments for outstanding forward foreign exchange contracts disclosed in these financial statements are translated at forward rates applicable to their respective maturities. Contingent liabilities / commitments for letters of credit and letters of guarantee denominated in foreign currencies are expressed in rupee terms at the rates of exchange ruling on the reporting date.
5.15 Financial instruments
5.15.1 Financial assets and liabilities
Financial assets and financial liabilities are recognised at the time when the Bank becomes a party to the contractual provision of the instrument. Financial assets are de-recognised when the contractual right to future cash flows from the asset expires or is transferred along with the risk and reward of the asset. Financial liabilities are de-recognised when obligation specific in the contract is discharged, cancelled or expired. Any gain or loss on de-recognition of the financial asset and liability is recognised in the profit and loss account of the current period. The particular recognition and subsequent measurement methods adopted for significant financial assets and financial liabilities are disclosed in the individual policy statements associated with them.
5.15.2 Derivative financial instruments
Derivative financial instruments are initially recognized at fair value on the date on which the derivative contract is entered into and are subsequently re–measured at fair value using appropriate valuation techniques. All derivative financial instruments are carried as assets when fair value is positive and liabilities when fair value is negative. Any change in the fair value of derivative financial instruments is taken to the profit and loss account.
5.16 Off setting
Financial assets and financial liabilities are set off and the net amount is reported in the financial statements when there is a legally enforceable right to set off and the Bank intends to either settle on a net basis, or to realize the assets and to settle the liabilities simultaneously.
5.17 Revenue recognition
Revenue is recognized to the extent that the economic benefits will flow to the Bank and the revenue can be reliably measured. These are recognised as follows:
a) Advances and investments
Mark-up/return on regular loans / advances and investments is recognized on a time proportion basis. Where debt securities are purchased at premium or discount, the same is amortized through the profit and loss account using the effective interest rate method.
Interest or mark-up recoverable on classified loans and advances and investments is recognized on receipt basis. Interest / return / mark-up on classified rescheduled / restructured loans and advances and investments is recognized as permitted by the regulations of the SBP.
Notes to the Unconsolidated Financial Statementsfor the year ended December 31, 2012

Annual Report of Allied Bank Limited for the year 2012
95
Notes to the Unconsolidated Financial Statementsfor the year ended December 31, 2012
Dividend income is recognized when the right to receive the dividend is established. Gains and losses on sale of investments are recognized in the profit and loss account. b) Lease financing
Financing method is used in accounting for income from lease financing. Under this method, the unearned lease income (excess of the sum of total lease rentals and estimated residual value over the cost of leased assets) is deferred and taken to income over the term of the lease period so as to produce a constant periodic rate of return on the outstanding net investment in lease. Unrealised income on classified leases is recognized on receipt basis.
Gains / losses on termination of lease contracts and other lease income are recognized when realized. c) Fees, brokerage and commission
Fees, brokerage and commission on letters of credit / guarantee and other services are amortized over the tenure of the respective facility, whereas account maintenance and service charges are recognized when realized.
5.18 Segment reporting
A segment is a distinguishable component of the Bank that is subject to risks and rewards that are different from those of other segments. A business segment is one that is engaged either in providing certain products or services, whereas a geographical segment is one engaged in providing certain products or services within a particular economic environment. Segment information is presented as per the Bank’s functional structure and the guidance of State Bank of Pakistan. The Bank comprises of the following main business segments:
5.18.1 Business segments
a) Corporate finance
This includes investment banking activities such as mergers and acquisitions, underwriting, privatization, securitization, Initial Public Offers (IPOs) and secondary private placements.
b) Trading and sales
This segment undertakes the Bank’s treasury, money market and capital market activities. c) Retail banking
Retail banking provides services to small borrowers i.e. consumers, small and medium enterprises (SMEs) and borrowers’ agriculture sector. It includes loans, deposits and other transactions with retail customers.
d) Commercial banking
This includes loans, deposits and other transactions with corporate customers. e) Payment and settlement
This includes payments and collections, funds transfer, clearing and settlement with the customers. 5.18.2 Geographical segments
The Bank operates in three geographical regions being: - Pakistan - Karachi Export Processing Zone - Middle East 5.19 Earnings per share
The Bank presents earnings per share (EPS) data for its ordinary shares. EPS is calculated by dividing the profit or loss attributable to ordinary shareholders of the Bank by the weighted average number of ordinary shares outstanding during the year.

96
Note December 31, December 31, 2012 2011
Rupees in ‘000
6. CASH AND BALANCES WITH TREASURY BANKS
In hand
Local currency 7,331,861 6,160,181 Foreign currencies 477,152 373,486 7,809,013 6,533,667 Remittances in transit 549,050 608,439 With State Bank of Pakistan (SBP) in Local currency current accounts 6.1 18,172,815 15,036,087 Foreign currency current account 6.2 4,382 2,040 18,177,197 15,038,127 Foreign currency deposit accounts - Non remunerative 6.3 1,900,744 1,778,924 - Remunerative 6.3 & 6.4 5,702,231 5,336,771 7,602,975 7,115,695 With National Bank of Pakistan in Local currency current accounts 9,143,240 7,138,145 National Prize Bonds 70,178 45,685 43,351,653 36,479,758 6.1 Deposits with the SBP are maintained to comply with the statutory requirements issued from time to time. 6.2 This represents US Dollar settlement account maintained with SBP. 6.3 This represents cash reserve and special cash reserve maintained with the SBP to comply with their statutory requirements issued
from time to time. 6.4 This represents special cash reserve requirement maintained with the SBP. The return on this account is declared by the SBP on a
monthly basis and, as at December 31, 2012, carries mark-up at the rate of 0% (2011: 0%) per annum.
Note December 31, December 31, 2012 2011
Rupees in ‘000
7. BALANCES WITH OTHER BANKS
In Pakistan
On current accounts 284 284
Outside Pakistan
On current accounts 7.1 609,477 682,349
On deposit accounts 419,525 996,452
1,029,286 1,679,085
7.1 Included in Nostro accounts are balances, aggregating to Rs. 136.808 million (2011: Rs. 131.749 million), representing balances held
with a related party outside Pakistan.
Note December 31, December 31, 2012 2011
Rupees in ‘000
8. LENDINGS TO FINANCIAL INSTITUTIONS Repurchase agreement lendings (Reverse Repo) 8.1 & 8.5 8,270,935 1,361,754 Certificates of investment 8.2 520,000 70,000 Call money lendings 8.3 2,000,000 - 8.4 10,790,935 1,431,754 Provision against lendings to financial institutions 8.5 (70,000) (70,000) 10,720,935 1,361,754
Notes to the Unconsolidated Financial Statementsfor the year ended December 31, 2012

Annual Report of Allied Bank Limited for the year 2012
97
8.1 These are short-term lendings to various financial institutions against the government securities shown in note 8.5 below. These carry mark-up at rates ranging from 8.99% to 9.95% (2011: 11.90%) per annum and will mature on various dates, latest by February 4, 2013.
8.2 This represents certificate of investment of financial institution carrying markup at the rate of 9.35% (2011: Nil) and will mature on
February 6, 2013. This also includes a classified Certificate of Investment amounting to Rs. 70 million. 8.3 These call money lendings carry markup at rate of 9.75% (2011: Nil) and will mature on various dates latest by February 1, 2013.
December 31, December 31, 2012 2011
Rupees in ‘000
8.4 Particulars of lending
In local currency 10,790,935 1,431,754 In foreign currencies - -
10,790,935 1,431,754
8.5 Securities held as collateral against lending to Financial Institutions
December 31, 2012 December 31, 2011 Further Further Held by given as Held by given as Bank collateral Total Bank collateral Total
Rupees in ‘000
Market Treasury Bills 8,270,935 - 8,270,935 1,361,754 - 1,361,754 8,270,935 - 8,270,935 1,361,754 - 1,361,754
December 31, December 31, 2012 2011
Rupees in ‘000
8.6 Particulars of provision
Opening balance 70,000 - Charge for the year - 70,000 Reversal - - Net charge - 70,000 Closing balance 70,000 70,000
Notes to the Unconsolidated Financial Statementsfor the year ended December 31, 2012
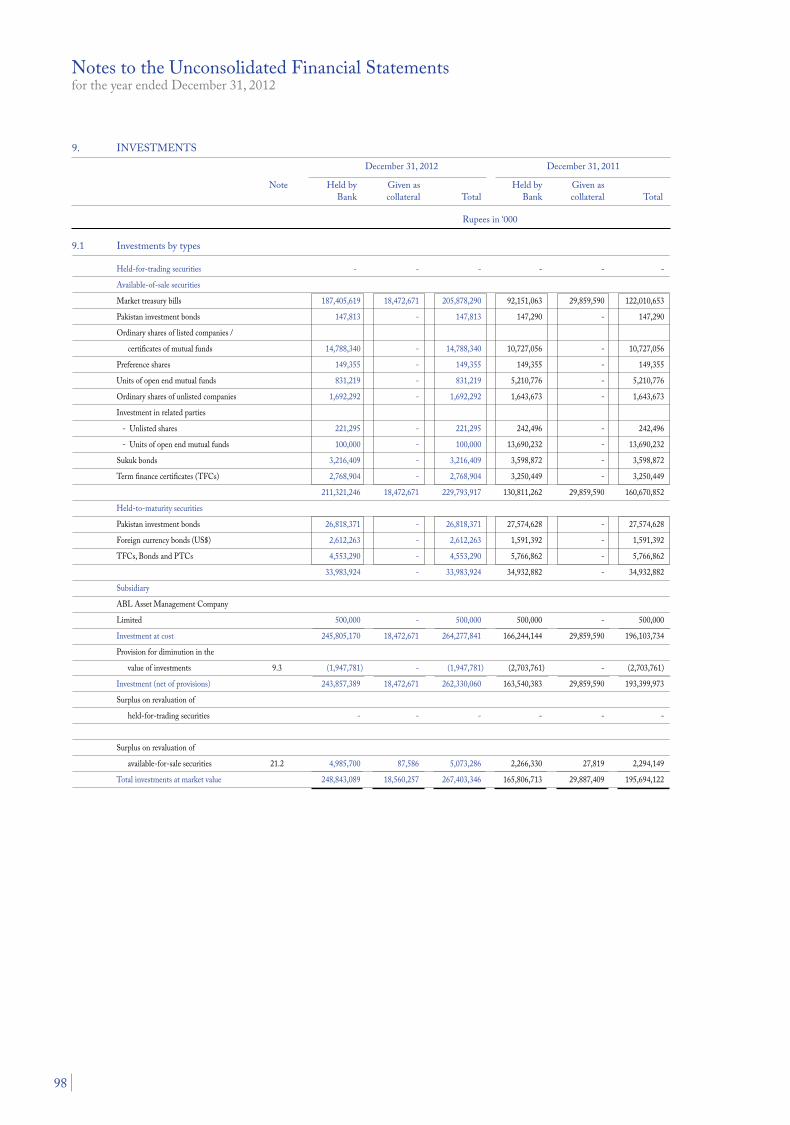
98
9. INVESTMENTS December 31, 2012 December 31, 2011
Note Held by Given as Held by Given as Bank collateral Total Bank collateral Total
Rupees in ‘000
9.1 Investments by types
Held-for-trading securities - - - - - -
Available-of-sale securities
Market treasury bills 187,405,619 18,472,671 205,878,290 92,151,063 29,859,590 122,010,653
Pakistan investment bonds 147,813 - 147,813 147,290 - 147,290
Ordinary shares of listed companies /
certificates of mutual funds 14,788,340 - 14,788,340 10,727,056 - 10,727,056
Preference shares 149,355 - 149,355 149,355 - 149,355
Units of open end mutual funds 831,219 - 831,219 5,210,776 - 5,210,776
Ordinary shares of unlisted companies 1,692,292 - 1,692,292 1,643,673 - 1,643,673
Investment in related parties
- Unlisted shares 221,295 - 221,295 242,496 - 242,496
- Units of open end mutual funds 100,000 - 100,000 13,690,232 - 13,690,232
Sukuk bonds 3,216,409 - 3,216,409 3,598,872 - 3,598,872
Term finance certificates (TFCs) 2,768,904 - 2,768,904 3,250,449 - 3,250,449
211,321,246 18,472,671 229,793,917 130,811,262 29,859,590 160,670,852
Held-to-maturity securities
Pakistan investment bonds 26,818,371 - 26,818,371 27,574,628 - 27,574,628
Foreign currency bonds (US$) 2,612,263 - 2,612,263 1,591,392 - 1,591,392
TFCs, Bonds and PTCs 4,553,290 - 4,553,290 5,766,862 - 5,766,862
33,983,924 - 33,983,924 34,932,882 - 34,932,882
Subsidiary
ABL Asset Management Company
Limited 500,000 - 500,000 500,000 - 500,000
Investment at cost 245,805,170 18,472,671 264,277,841 166,244,144 29,859,590 196,103,734
Provision for diminution in the
value of investments 9.3 (1,947,781) - (1,947,781) (2,703,761) - (2,703,761)
Investment (net of provisions) 243,857,389 18,472,671 262,330,060 163,540,383 29,859,590 193,399,973
Surplus on revaluation of
held-for-trading securities - - - - - -
Surplus on revaluation of
available-for-sale securities 21.2 4,985,700 87,586 5,073,286 2,266,330 27,819 2,294,149
Total investments at market value 248,843,089 18,560,257 267,403,346 165,806,713 29,887,409 195,694,122
Notes to the Unconsolidated Financial Statementsfor the year ended December 31, 2012

Annual Report of Allied Bank Limited for the year 2012
99
Note December 31, December 31, 2012 2011
Rupees in ‘000
9.2. INVESTMENTS BY SEGMENTS:
Federal Government Securities: - Market Treasury Bills 9.2.1 - 9.2.3 205,878,290 122,010,653 - Pakistan Investment Bonds 9.2.1 26,966,184 27,721,918 - Foreign Currency Bonds (US$) 9.2.4 2,612,263 1,591,392 Fully paid up ordinary shares of listed companies / certificates of mutual funds 9.4 14,788,340 10,727,056 Fully paid up ordinary shares of unlisted companies 9.5 1,913,587 1,886,169 Investment in units of open end mutual funds 9.6 931,219 18,901,008 Fully paid up preference shares 9.7 149,355 149,355 Term Finance Certificates (TFCs), Bonds and Participation Term Certificates: Term Finance Certificates - Listed 9.8 1,842,078 2,070,897 - Unlisted 9.8 2,127,734 3,409,231 Sukuk Bonds 9.9 6,568,791 7,135,252 Participation Term Certificates 9.10 - 803 Subsidiary 9.5 500,000 500,000 Total investments at cost 264,277,841 196,103,734 Less: Provision for diminution in the value of investments 9.3 (1,947,781) (2,703,761) Investments (net of provisions) 262,330,060 193,399,973 Surplus on revaluation of available-for-sale securities 21.2 5,073,286 2,294,149 Total investments at market value 267,403,346 195,694,122
9.2.1 Principal terms of investments in Federal Government Securities
Name of investment Maturity Redemption Period Coupon
Market Treasury Bills January, 2013 To November, 2013 On maturity At maturity Foreign Currency Bonds (US$) March, 2016 To June, 2017 On maturity Half Yearly Pakistan Investment Bonds 30 June, 2013 To 18 Aug, 2016 On maturity Half Yearly 9.2.2 Included herein are Market Treasury Bills having a book value of Rs.18,132.871 million (2011: Rs. 29,519.79 million), given as
collateral against repurchase agreement borrowings from financial institutions. 9.2.3 Included herein are Market Treasury Bills having a face value of Rs. 339.80 million (2011: Rs 339.80 million), held by the SBP and
National Bank of Pakistan against Demand Loan and TT / DD discounting facilities sanctioned to the Bank.
Notes to the Unconsolidated Financial Statementsfor the year ended December 31, 2012
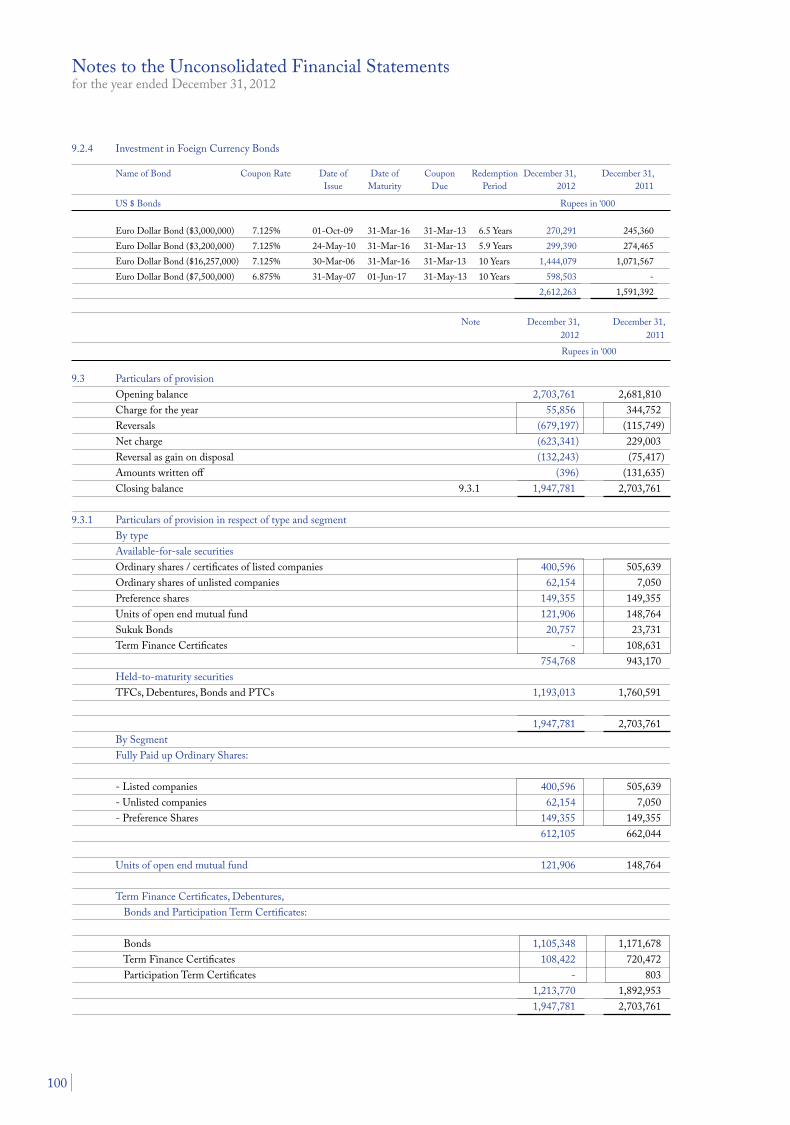
100
9.2.4 Investment in Foeign Currency Bonds
Name of Bond Coupon Rate Date of Date of Coupon Redemption December 31, December 31, Issue Maturity Due Period 2012 2011
US $ Bonds Rupees in ‘000
Euro Dollar Bond ($3,000,000) 7.125% 01-Oct-09 31-Mar-16 31-Mar-13 6.5 Years 270,291 245,360 Euro Dollar Bond ($3,200,000) 7.125% 24-May-10 31-Mar-16 31-Mar-13 5.9 Years 299,390 274,465 Euro Dollar Bond ($16,257,000) 7.125% 30-Mar-06 31-Mar-16 31-Mar-13 10 Years 1,444,079 1,071,567 Euro Dollar Bond ($7,500,000) 6.875% 31-May-07 01-Jun-17 31-May-13 10 Years 598,503 - 2,612,263 1,591,392
Note December 31, December 31, 2012 2011
Rupees in ‘000
9.3 Particulars of provision Opening balance 2,703,761 2,681,810 Charge for the year 55,856 344,752 Reversals (679,197) (115,749) Net charge (623,341) 229,003 Reversal as gain on disposal (132,243) (75,417) Amounts written off (396) (131,635) Closing balance 9.3.1 1,947,781 2,703,761 9.3.1 Particulars of provision in respect of type and segment By type Available-for-sale securities Ordinary shares / certificates of listed companies 400,596 505,639 Ordinary shares of unlisted companies 62,154 7,050 Preference shares 149,355 149,355 Units of open end mutual fund 121,906 148,764 Sukuk Bonds 20,757 23,731 Term Finance Certificates - 108,631 754,768 943,170 Held-to-maturity securities TFCs, Debentures, Bonds and PTCs 1,193,013 1,760,591 1,947,781 2,703,761 By Segment Fully Paid up Ordinary Shares: - Listed companies 400,596 505,639 - Unlisted companies 62,154 7,050 - Preference Shares 149,355 149,355 612,105 662,044 Units of open end mutual fund 121,906 148,764 Term Finance Certificates, Debentures, Bonds and Participation Term Certificates: Bonds 1,105,348 1,171,678 Term Finance Certificates 108,422 720,472 Participation Term Certificates - 803 1,213,770 1,892,953 1,947,781 2,703,761
Notes to the Unconsolidated Financial Statementsfor the year ended December 31, 2012

Annual Report of Allied Bank Limited for the year 2012
101
9.4 Investments in Listed Shares / Certificates of Mutual Funds
Cost 2012 2011
Name of Company / Mutual Fund per share / No. of shares / No. of shares / certificates certificates Total Cost certificates Total Cost
Rupees Rupees in ‘000 Rupees in ‘000 Available-for-Sale Agritech Limited 12.59 13,961,851 175,755 - - Attock Petroleum Limited 489.40 975,000 477,161 760,179 297,164 D.G.Khan Cement Limited 37.43 12,326,141 461,368 11,859,786 278,093 Fatima Fertilizer Company 21.27 54,995,000 1,169,939 50,000,000 927,047 Fauji Fertilizer Company 79.18 29,999,275 2,375,261 27,241,010 2,523,073 First Equity Modaraba 1.24 519,914 645 519,914 645 Habib Bank Limited - - - 2,319,067 242,587 Hub Power Company Limited 36.51 112,000,000 4,089,011 53,372,029 1,856,665 Lucky Cement Limited 146.34 3,450,000 504,884 10,015,000 822,101 MCB Bank Limited - - - 1,308,721 209,980 Namco Balanced Fund 4.37 2,205,360 9,640 2,160,000 9,640 National Refinery Limited - - - 784,960 241,464 Nishat (Chunian) Limited 18.12 17,560,603 318,244 15,964,185 256,353 Nishat Chunian Power Limited 10.00 30,000,000 300,000 30,000,000 300,000 Nishat Chunian Power Limited (underwriting) - - - 6,700,000 96,480 Nishat Mills Limited - - - 5,000,000 232,681 Nishat Power Limited 10.72 34,813,894 373,302 30,000,000 300,000 Otsuka Pakistan Limited 34.92 95,517 3,335 95,517 3,335 Pakistan International Containers Limited - - - 57,734 577 Pakistan Oil field Limited 380.28 8,876,000 3,375,364 5,170,307 1,527,373 Pakistan Petroleum Limited 159.35 1,556,500 248,029 1,249,714 225,708 PICIC Growth Mutual Fund 13.48 27,577,717 371,851 26,765,844 361,635 Pioneer Cement Limited 5.97 106,784 638 106,784 638 Safe Way Mutual Funds 8.63 1,601,045 13,817 1,601,045 13,817 United Bank limited 74.30 7,000,000 520,096 - - 14,788,340 10,727,056
Notes to the Unconsolidated Financial Statementsfor the year ended December 31, 2012
9.5 Investment in Un-Listed Shares Name of Company Percentage of No. of Break-up Value Paid up Value Cost Based on audited Name of Chief
Holding shares per shares per share accounts Executive/Managing as at Agent Rupees ‘000
Arabian Sea Country Club Limited - related party 6.45% 500,000 8.72 10 5,000 30-Jun-12 Mr. Arif Ali Khan Abbasi Atlas Power Limited 7.49% 35,500,000 17.06 10 355,000 30-Jun-12 Mr. Maqsood Ahmed Basraa Burj Bank Limited 2.00% 14,833,333 7.83 10 148,333 31-Dec-11 Mr. Ahmed Khizer Khan Central Depository Company 1.00% 650,000 26.05 10 40,300 30-Jun-12 Mr. Muhammad Hanif Jakhura First Women Bank Limited 7.16% 7,734,926 15.92 10 21,200 31-Dec-11 Ms. Shafqat Sultana Habib Allied International Bank - related party 9.50% 2,375,000 310.23 157 214,769 31-Dec-11 Mr. Anwar M. Zaid Islamabad Stock Exchange* 0.83% 3,034,603 10.65 10 30,346 30-Jun-12 Mr. Mian Ayyaz Afzal Lahore Stock Exchange* 0.66% 843,975 11.32 10 8,440 31-Dec-12 Mr. Aftab Ahmed Ch. National Institutional Facilitation Technologies (Private) Limited (NIFT) - related party 13.57% 1,478,228 62.01 10 1,527 30-Jun-12 Mr. Muzaffar M khan Pakistan Agricultural Storage and Services Corporation Limited (PASSCO) 3.33% 1,000 - 1,000 1,000 31-Mar-12 Maj. Gen M. Tauqeer Ahmed Security General Insurance Life 18.22% 12,401,871 104.81 10 1,075,652 31-Dec-11 Mr. Nabiha Shahnawaz SME Bank Limited. 0.32% 774,351 7.80 10 5,250 31-Dec-11 Mr. Ihsan Ul Haq Khan SWIFT 9.00% 10 336,201 176,591 1,770 31-Dec-11 Mr. Gottfried Leibbrandt Eastern Capital Limited - 500,000 - - 5,000 30-Jun-07 Under liquidation ABL AMC - subsidiary 100.00% 50,000,000 16.95 10 500,000 31-Dec-12 Mr. Farid Ahmed Khan 2,413,587 *These shares have been acquired according to the requirments of “The Stock Exchanges (Coporation, Demutualization and integration) Act, 2012” (“The Act”).

102
Notes to the Unconsolidated Financial Statementsfor the year ended December 31, 2012
9.6 Detail of Investment in Open Ended Mutual Funds
Name of Company No. of Units Paid-up Total Cost value per 2012 2011 Certificate 2012 2011 Rupees Rupees in ‘000
ABL Cash Fund- related party - 925,520,133 10 - 9,340,232
ABL Government Securites Fund- related party - 50,000,000 10 - 500,000
ABL Income Fund- related party - 374,529,738 10 - 3,750,000
ABLStock Fund- related party 10,000,000 10,000,000 10 100,000 100,000
AH Dow Jones Safe Pak Titans - 400,000 50 - 20,000
Atlas Money Market Fund - 99,502 500 - 50,000
AMZ Plus Income Fund - 108,786 100 - 10,707
Crosby Phoenix Fund - 192,381 100 - 20,000
HBL Money market Fund - 9,645,387 100 - 1,000,000
JS Aggressive Income Fund - 1,015 100 - -
KASB Income Opportunity Fund 1,345,614 3,468,894 100 121,906 325,019
KASB Cash Fund 1,459,700 - 100 150,000 -
Lakson Money Market Fund - 2,490,957 100 - 250,000
MCB Cash Optimizer Fund - 14,908,432 100 - 1,500,000
Meezan Cash Fund - 9,972,078 100 - 500,000
NAFA Income Opportunity Fund 58,950,235 82,680,350 10 559,313 785,050
UBL Liquidity Plus Fund - 7,433,989 100 - 750,000
931,219 18,901,008
First Dawood Investment Bank Ltd 9.7.1 13.88% 9,935,500 10 99,355 99,355 30 June 12 Mr. Rasheed Y. Chinoy Trust Investment Bank Ltd 9.7.2 16.31% 5,000,000 10 50,000 50,000 30 June 12 Mr. Shahid Iqbal 149,355
9.7.1 These preference shares issued in June 09, carry preference dividend @ 4% on cumulative basis and are redeemable at par after
five years, non-voting, non-participatory and have a call option available to the issuer after two years from the date of issue and conversion option available to the bank, into ordinary shares at par value of Rs. 10 along with cumulative dividend at any time after issuance.
9.7.2 These prefernce shares carry dividend @ 1 Year KIBOR plus 100 BPS on cumulative basis, and are non-voting with call option
available to the issuer and conversion option available to the Bank, after completion of three years from the date of issue.
Percentage of No. of Paid-up Total paid- Total Cost Based on Name of Chief Name of Company Note Holding certificates Value per up value December audited Executive/ certificate 31, 2012 accounts Managing as at Agent
Rupees Rupees in ‘000
9.7 Detail of Investment in Preference Shares

Annual Report of Allied Bank Limited for the year 2012
103
9.8 Detail of Investment in TFCs Name of Company No. of Units Paid-up Total Cost value per 2012 2011 Certificate 2012 2011
Rupees Rupees in ‘000
Listed Standard Chartered Bank (Pakistan) Limited 10,000 10,000 5,000 12,500 34,960 Faysal Bank Limited 70,000 70,000 5,000 349,720 349,860 United Bank Limited-3rd Issue 10,000 10,000 5,000 33,267 49,900 United Bank Limited -4th Issue 37,000 37,000 5,000 184,667 184,741 PakArab Fertilizers Limited 84,080 84,080 5,000 126,120 311,096 Azgard Nine Limited 1,300 1,300 5,000 1,573 4,327 Orix Leasing Pakistan Limited 1,500 1,500 5,000 - 1,230 NIB Bank Limited 76,789 76,789 5,000 383,254 383,407 United Bank Limited-PPTFC 122,558 122,558 5,000 611,687 611,932 Telecard Limited 75,888 75,888 5,000 139,290 139,444 1,842,078 2,070,897 Unlisted Askari Bank Limited 20,000 20,000 5,000 99,880 99,920 (Chief Executive: Mr. M. R. Mehkari) Faysal Bank Limited (Royal Bank Of Scotland) 7,000 7,000 5,000 8,729 17,465 (Chief Executive: Mr. Naved A. Khan) Orix Leasing Pakistan Limited 23,000 23,000 100,000 383,333 1,150,000 (Chief Executive: Mr. Teizoon Kissat) Escort Investment Bank Limited 20,000 20,000 5,000 19,984 29,976 (Chief Executive: Ms. Shazia Bashir) Financial Receivable Securitization Company Limited - A 14,579 14,579 100,000 18,216 30,360 (Chief Executive: Mr. Munaf Ibrahim) Financial Receivable Securitization Company Limited - B 6,421 6,421 5,000 12,025 20,042 (Chief Executive: Mr. Munaf Ibrahim) Dewan Farooque Spinning Mills Limited 25,000 25,000 5,000 30,274 31,250 (Chief Executive: Mr. Dewan Abdul Baqi Farooqui) Al-Abbas Sugar Industries 25,000 25,000 5,000 24,950 49,950 (Chief Executive: Mr. Shunaid Qureshi) Javedan Cement Limited (Formerly Al-Abbas Holding (Private) Limited) - 5,750 100,000 - 499,702 (Chief Executive: Mr. Samad A. Habib) Javedan Cement Limited (Formerly Ghani Holding (Private) Limited) - 5,750 100,000 - 499,702 (Chief Executive: Mr. Samad A. Habib) Javedan Cement Limited - 2,500 100,000 - 217,262 (Chief Executive: Mr. Samad A. Habib) Khairpur Sugar Mills Limited 13 13 55,536 (Chief Executive: Muhammad Mubeen Jumani) 1 1 55,538 5 5 337,000 1 1 337,077 454 670 Bachani Sugar Mills Limited 23 23 135,227 (Chief Executive: Mr. Najmuddin Ansari) 1 1 135,236 14 14 1,526,874 13 13 655,656 1 1 655,657 10,999 12,667 Frontier Ceramics Limited - 15 117,000 (Chief Executive: Mr. Omer Khalid) - 1 118,846 - 13 224,000 - 1 217,221 - 13 113,000 - 1 113,960 - 955
Notes to the Unconsolidated Financial Statementsfor the year ended December 31, 2012

104
Notes to the Unconsolidated Financial Statementsfor the year ended December 31, 2012
Name of Company No. of Units Paid-up Total Cost value per 2012 2011 Certificate 2012 2011
Rupees Rupees in ‘000
9.10 Detail of Investment in Participation Term Certificates - (fully provided) Name of the Borrower No. of Certificates Value per Cost
2012 2011 Certificate 2012 2011
Rupees in ‘000
Pangrio Sugar Mills Limited - 15 236,000 (Chief Executive: Mr. Sajid Hussain Naqvi) - 1 240,000 - 1 168,000 - 13 169,000 - 803 - 803
9.9 Detail of Investment in Bonds
Name of Bond / Sukuk Coupon Rate Date of Issue Date of Coupon Coupon Cost
Maturity Due Date Frequency 2012 2011
Rupees in ‘000
Sukuk Bonds
Security Leasing Corporation Limited 6 MK+2% 06-Jan-07 01-Jan-22 01-Jan-13 Monthly 83,027 94,922
Last 5 Days
Century Paper & Board Mills Limited 6 Month avg 25-Sep-07 25-Sep-14 25-Mar-13 Half Yearly 460,000 690,000
K+1.35%
K.S. Sulemanji Esmailji & Sons Limited 3 MK+2.4% 30-Jun-08 30-Jun-18 01-Jan-13 Quarterly 79,760 79,760
Liberty Power Technology Limited 3 MK+3% 31-Mar-09 01-Jan-21 01-Jan-13 Half Yearly 2,297,047 2,689,191
Liberty Power Technology Limited 3 MK+3% 30-Nov-10 01-Jan-21 30-Jan-13 Half Yearly 256,575 -
Al-Zamin Leasing Modaraba 6 MK+1.9% 12-May-08 12-May-12 12-May-13 Half Yearly 128,661 151,802
Quetta Textile Mills Limited 6 MK+1.5% 27-Sep-08 27-Sep-15 27-Mar-13 Half Yearly 40,000 45,000
Shahraj Fabrics Private Limited 6 MK +2.10% 08-Mar-08 08-Mar-13 08-Mar-13 Half Yearly 200,000 200,000
Maple Leaf Cement Factory Limited 3 MK + 1.0% 03-Dec-07 03-Dec-18 12-Mar-13 Quarterly 3,023,721 3,184,577
6,568,791 7,135,252
Bank Al-Habib Limited 3rd Issue 60,000 60,000 5,000 299,160 299,400 (Chief Executive: Mr. Abbas D. Habib) Bank Al-Habib Limited 4th Issue 90,000 90,000 5,000 449,730 449,910 (Chief Executive: Mr. Abbas D. Habib) Standard Chartered Bank (Pakistan) Limited 3rd Issue 75,000 - 5,000 375,000 - (Chief Executive: Mr. Mohsin Ali Nathani) Jahangir Siddiqi & Company Limited 30,000 - 5,000 150,000 - (Chief Executive: Mr. Munaf Ibrahim) Bank Al Falah Limited 49,000 - 5,000 245,000 - (Chief Executive: Mr. Atif Bajwa) Total 2,127,734 3,409,231

Annual Report of Allied Bank Limited for the year 2012
105
Notes to the Unconsolidated Financial Statementsfor the year ended December 31, 2012
9.11 Quality of Available for Sale Securities 2012 2011 Market Market Name of Security value / Book Rating value / Book Rating Value Value
Rupees ‘000 Rupees ‘000 Government Securities Market Treasury Bills 206,138,340 Un Rated 121,943,007 Un Rated Pakistan Investment Bonds 145,735 Un Rated 134,267 Un Rated Listed TFCs Standard Chartered Bank (Pakistan) Limited (Union Bank) 12,760 AAA 35,790 AAA Faysal Bank Limited 354,091 AA- 329,803 AA- United Bank Limited 3rd Issue 33,755 AA 50,632 AA United Bank Limited 4th Issue 188,518 AA 184,176 AA Pak Arab Fertilizers Limited 126,251 AA 311,096 AA Azgard Nine Limited 1,479 D 4,067 D ORIX Leasing Pakistan Limited - - 1,224 AA+ Unlisted TFCs Askari Bank Limited 99,880 AA- 99,960 AA- Faysal Bank Limited (Royal Bank Of Scotland) 8,729 AA- 17,465 AA- ORIX Leasing Pakistan Limited 383,333 AA+ 1,150,000 AA+ Escort Investment Bank Limited 19,984 BB 29,976 BB Financial Receivable Securitization Company Limited-A 18,216 A+ 30,361 A+ Financial Receivable Securitization Company Limited-B 12,025 A+ 20,042 A+ Javedan Cement Limited - - 217,262 ** Bank Al-Habib Limited TFC 3rd Issue 299,160 AA 299,400 AA Bank Al-Habib Limited TFC 4th Issue 449,730 AA 449,910 AA Standard Chartered Bank (Pakistan) Limited 375,000.0 AAA - - Jahangir Siddiqi & Company Limited 150,000 AA+ - - Bank Alfalah Limited 245,000 AA- - - Shares Unlisted Arabian Sea Country Club Limited* 5,000 ** 5,000 ** Atlas Power Limited* 355,000 A+&A1 355,000 AA&A1+ Burj Bank Limited 148,333 A&A-1 - - Central Depository Committee 40,300 ** - - Eastern Capital Limited* 5,000 ** 5,000 ** First Women Bank Limited* 21,200 A-&A2 21,200 BBB+&A2 Habib Allied International Bank Limited* 214,769 ** 214,769 ** Islamabad Stock Exchange 30,346 ** - - Lahore Stock Exchange 8,440 ** - - Khushhali Bank Limited - - 200,000 A&A-1 NIFT* 1,526 ** 1,526 ** PASSCO* 1,000 ** 1,000 ** Security General Insurance Life 1,075,653 A+ 1,075,653 A+ SME Bank Limited* 5,250 BBB&A-3 5,250 BBB&A-3 SWIFT 1,771 ** 1,771 ** Shares / Certificates Listed Agritech Limited* 162,935 D - - Attock Petroleum Limited 499,190 ** 313,574 AA&A1+ D.G. Khan Cement Limited 672,761 ** 225,692 ** Fatima Fertilizer Company Limited 1,451,868 A+&A1 1,146,000 A & A1 Fauji Fertilizer Company Limited* 1,366,693 ** 2,326,279 ** Fauji Fertilizer Company Limited 2,147,422 ** 1,747,342 ** First Equity Modaraba 1,664 ** 390 ** Habib Bank Limited - - 246,007 AA+&A-1+ Hub Power Company Limited* 2,755,116 AA+&A1+ 1,065,929 AA+&A1+ Hub Power Company Limited 2,311,764 AA+&A1+ 759,395 AA+&A1+ Lucky Cement Limited 522,813 ** 751,526 ** MCB Bank Limited - - 176,154 AA+&A1+ Namco Balanced Fund 10,475 ** 10,908 ** National Refinery Limited - - 190,502 AAA&A1+ Nishat (Chunian) Limited 615,324 A-&A-2 285,120 **

106
Notes to the Unconsolidated Financial Statementsfor the year ended December 31, 2012
2012 2011 Market Market Name of Security value/Book Rating value/Book Rating Value Value Rupees ‘000 Rupees ‘000
Nishat Chunian Power Limited* 630,300 A&A-2 382,500 AA-&A1+ Nishat Chunian Power Limited - - 85,425 AA-&A1+ Nishat Mills Limited - - 202,250 AA-&A1+ Nishat Power Limited* 585,000 A+&A1 388,500 AA-&A1+ Nishat Power Limited 93,871 A+&A1 - - Otsuka Pakistan Limited 3,606 ** 3,133 ** Pakistan International Containers Limited - - 519 A+ & A1 Pakistan Oilfield Limited* 1,544,079 ** 1,791,253 ** Pakistan Oilfield Limited 2,339,526 ** - - Pakistan Petroleum Limited 275,174 ** 210,352 ** PICIC Growth Mutual Fund 452,275 ** 333,502 ** Pioneer Cement Limited 1,926 ** 352 ** Safe Way Mutual Fund 17,611 ** 8,470 AM4+ United Bank Limited 585,690 AA+&A-1+ - - Preference Shares Trust Investment Bank Limited 50,000 ** 50,000 BBB & A3 First Dawood Investment Bank 99,355 ** 99,355 D Investment in Mutual Funds ABL Cash Fund - - 9,272,601 AA+(f ) ABL Government Securites Fund - - 501,295 A+(f ) ABL Income Fund - - 3,751,177 A+(f ) ABL Stock Fund 121,115 MFR 5-Star 97,021 MFR 5-Star AH Dow Jones Safe Pak Titans - - 19,804 ** Atlas Money Market Fund - - 50,107 AA+(f ) AMZ Plus Income Fund - - 6,873 ** Crosby Phoenix Fund - - 20,567 A(f ) HBL Money Market Fund - - 995,225 AA+(f ) JS Aggressive Income Fund - - 106 - KASB Income Opportunity Fund 97,419 ** 186,962 BBB(f ) KASB Cash Fund 149,707 AA+(f ) - - Lakson Money Market Fund - - 249,344 AA(f ) MCB Cash Optimizer Fund - - 1,533,863 AA+(f ) Meezan Cash Fund - - 500,003 AA(f ) NAFA Cash Fund 588,040 ** 791,656 A(f ) UBL Liquidity Plus Fund - - 747,001 AA+(f ) Sukuk Bonds Security Leasing Corporation Limited 83,027 ** 94,922 ** Century Paper & Board Mills Limited 460,000 A+ 690,000 A+ K.S.Sulemanji Esmailji & Sons 79,760 ** 79,760 ** Liberty Power Technology Limited 1st Issue 2,297,047 A+ 2,689,191 AA- Liberty Power Technology Limited 2nd Issue 256,575 A+ - - Quetta Textile Mills Limited 40,000 ** 45,000 ** * Strategic investments of the Bank ** Ratings are not available

Annual Report of Allied Bank Limited for the year 2012
107
Notes to the Unconsolidated Financial Statementsfor the year ended December 31, 2012
Note December 31, December 31, 2012 2011
Rupees in ‘000
10. ADVANCES Loans, cash credits, running finances, etc. - in Pakistan 283,032,567 256,549,230 Net investment in finance lease - in Pakistan 10.2 1,815,004 1,748,858 Bills discounted and purchased (excluding treasury bills) Payable in Pakistan 2,390,263 1,769,188 Payable outside Pakistan 1,651,473 2,069,915 4,041,736 3,839,103 Advances - gross 288,889,307 262,137,191 Provision for non-performing advances 10.4 (17,752,942) (17,671,070) General provision for consumer financing 10.4 (52,090) (32,647) (17,805,032) (17,703,717) Advances - net of provision 271,084,275 244,433,474 10.1 Particulars of advances (Gross) 10.1.1 In local currency 286,429,257 258,292,731 In foreign currencies 2,460,050 3,844,460 288,889,307 262,137,191 10.1.2 Short term (for upto one year) 168,005,009 165,334,959 Long term (for over one year) 120,884,298 96,802,232 288,889,307 262,137,191
10.2 Net investment in Finance Lease December 31, 2012 December 31, 2011
Not later Later than one Not later Later than one than one and less than Over five than one and less than Over five year five years years Total year five years years Total
Rupees in ‘000
Lease rentals receivable 394,697 675,658 563,965 1,634,320 404,737 722,438 511,106 1,638,281 Residual value 74,614 243,008 128,548 446,170 45,621 221,157 128,082 394,860 Minimum lease payments 469,311 918,666 692,513 2,080,490 450,358 943,595 639,188 2,033,141 Financial charges for future periods (75,280) (87,307) (102,899) (265,486) (96,234) (104,188) (83,861) (284,283) Present value of minimum lease payments 394,031 831,359 589,614 1,815,004 354,124 839,407 555,327 1,748,858
December 31, 2012
Category of Classified Advances Provision Required Provision Held Classification Domestic Overseas Total Domestic Overseas Total Domestic Overseas Total
Rupees in ‘000
Other Assets Especially Mentioned 62,814 - 62,814 - - - - - - Substandard 608,677 - 608,677 151,422 - 151,422 151,422 - 151,422 Doubtful 4,750,195 - 4,750,195 2,405,112 - 2,405,112 2,405,112 - 2,405,112 Loss 15,245,875 - 15,245,875 15,196,408 - 15,196,408 15,196,408 - 15,196,408 20,667,561 - 20,667,561 17,752,942 - 17,752,942 17,752,942 - 17,752,942
10.3 Advances include Rs. 20,667.561 million (2011: Rs. 20,452.465 million) which have been placed under non-performing status as detailed below:

108
December 31, 2011
Category of Classified Advances Provision Required Provision Held Classification Domestic Overseas Total Domestic Overseas Total Domestic Overseas Total
Rupees in ‘000
Other Assets Especially Mentioned 63,380 - 63,380 - - - - - - Substandard 1,780,543 - 1,780,543 444,292 - 444,292 444,292 - 444,292 Doubtful 2,711,866 - 2,711,866 1,331,198 - 1,331,198 1,331,198 - 1,331,198 Loss 15,896,676 - 15,896,676 15,895,580 - 15,895,580 15,895,580 - 15,895,580 20,452,465 - 20,452,465 17,671,070 - 17,671,070 17,671,070 - 17,671,070
Notes to the Unconsolidated Financial Statementsfor the year ended December 31, 2012
December 31, 2012 December 31, 2011
Note Specific General Total Specific General Total
Rupees in ‘000
Opening balance 17,671,070 32,647 17,703,717 15,420,788 9,474 15,430,262 Charge for the year 3,233,567 19,443 3,253,010 4,354,209 23,173 4,377,382 Reversals (1,979,109) - (1,979,109) (1,667,361) - (1,667,361) Charged to profit and loss account 1,254,458 19,443 1,273,901 2,686,848 23,173 2,710,021 Amounts written off 10.5.1 (1,172,586) - (1,172,586) (436,566) - (436,566) Closing balance 17,752,942 52,090 17,805,032 17,671,070 32,647 17,703,717
10.4.1 In local currency 17,752,942 52,090 17,805,032 17,671,070 32,647 17,703,717 In foreign currencies - - - - - - 17,752,942 52,090 17,805,032 17,671,070 32,647 17,703,717
10.4 Particulars of provision against non-performing advances
10.6 Details of loan write off of Rs. 500,000/- and above
In terms of sub-section (3) of Section 33A of the Banking Companies Ordinance, 1962, the Statement in respect of written-off loans or any other financial relief of five hundred thousand rupees and above allowed to a person(s) during the year ended December 31, 2012 is given in Annexure “I”. However, these write offs do not affect the Bank’s right to recover debts from these customers.
Note December 31, December 31, 2012 2011
Rupees in ‘000
10.5 Particulars of write offs
10.5.1 Against provisions 1,172,586 436,566 Directly charged to Profit and Loss account - - 1,172,586 436,566
10.5.2 Write Offs of Rs. 500,000 and above 10.6 1,171,410 414,337 Write Offs of Below Rs 500,000 1,176 22,229 1,172,586 436,566

Annual Report of Allied Bank Limited for the year 2012
109
Notes to the Unconsolidated Financial Statementsfor the year ended December 31, 2012
Note December 31, December 31, 2012 2011
Rupees in ‘000
10.7 Particulars of loans and advances to directors, related parties, etc. Debts due by directors, executives or officers of the Bank or any of them either severally or jointly with any other persons Balance at beginning of the year 5,559,657 5,523,885 Loans granted during the year 1,900,671 1,263,014 Repayments (1,500,716) (1,227,242) Balance at end of the year 5,959,612 5,559,657 Details of loans and advances to associates, subsidiary and other related parties are given in note 41.
11. OPERATING FIXED ASSETS Capital work-in-progress 11.1 1,597,878 4,511,356 Property and equipment 11.2 17,287,883 13,409,560 Intangible assets 11.3 985,412 166,095 19,871,173 18,087,011
11.1 Capital work-in-progress Civil works 938,326 3,297,410 Equipment 129,020 325,324 Advances to suppliers and contractors 530,532 888,622 1,597,878 4,511,356

110
Notes to the Unconsolidated Financial Statementsfor the year ended December 31, 201211
.2
Prop
erty
and
equi
pmen
t
C
ost /
Rev
aluat
ion
Acc
umul
ated
Dep
recia
tion
Cha
nge f
or
N
et b
ook
Ann
ual
A
t
At
At
the y
ear /
A
t va
lue a
t ra
te o
f
Janu
ary 1
, A
dditi
ons /
Re
valu
atio
n
Dec
embe
r 31,
Ja
nuar
y 1,
(Dep
recia
tion
Reva
luat
ion
D
ecem
ber 3
1, D
ecem
ber 3
1, de
prec
iatio
n
Des
crip
tion
Not
e 20
12
(Dele
tions
) Su
rplu
s W
rite-
off
2012
20
12
on d
eletio
ns)
defi
cit /
(Sur
plus
) W
rite-
off
2012
20
12
%
R
upee
s in
‘000
La
nd-F
reeh
old
11.4
5
,430
,494
4
61,1
65
3,8
58
-
5,8
95,5
17
-
-
-
-
-
5
,895
,517
-
La
nd-L
ease
hold
11
.4
1,7
57,9
77
206
,159
-
-
1
,964
,136
-
-
-
-
-
1,9
64,1
36
-
Build
ings
-Fre
ehol
d 11
.4
1,8
41,5
33
2,3
83,8
44
-
-
4,2
25,3
77
159
,204
1
23,0
28
117
,892
-
4
00,1
24
3,8
25,2
53
5
Build
ings
-Lea
seho
ld
11.4
2
,118
,328
9
,982
-
-
2
,128
,310
2
60,3
70
93,
844
-
-
3
54,2
14
1,7
74,0
96
5
Build
ing
impr
ovem
ents
1,0
36,7
27
188
,865
-
-
1
,225
,592
4
22,0
81
211
,045
-
-
6
33,1
26
592
,466
2
0
(re
nted
pre
mise
s)
Fu
rnitu
re
6
27,1
52
159
,362
-
-
7
84,9
44
241
,393
5
8,16
5
-
-
298
,031
4
86,9
13
10
a
nd fi
xtur
es
(1,5
70)
(1,
527)
Elec
trica
l, offi
ce
3
,727
,066
1
,472
,090
-
-
5
,196
,056
2
,120
,912
6
54,3
36
-
-
2,7
72,2
35
2,4
23,8
21
14.
28 -
50
and
com
pute
r equ
ipm
ents
(3,
100)
(
3,01
3)
Vehi
cles
2
70,2
43
304
,290
-
-
5
43,5
97
196
,000
5
1,73
5
-
-
217
,916
3
25,6
81
20
(30
,936
)
(
29,8
19)
Tota
l
16,
809,
520
5
,185
,757
3
,858
-
2
1,96
3,52
9
3,3
99,9
60
1,1
92,1
53
117
,892
-
4
,675
,646
1
7,28
7,88
3
(
35,6
06)
(34
,359
)

Annual Report of Allied Bank Limited for the year 2012
111
C
ost /
Rev
aluat
ion
Acc
umul
ated
Dep
recia
tion
Cha
nge f
or
N
et b
ook
Ann
ual
A
t
At
At
the y
ear /
A
t va
lue a
t ra
te o
f
Janu
ary 1
, A
dditi
ons /
Re
valu
atio
n
Dec
embe
r 31,
Ja
nuar
y 1,
(dep
recia
tion
Reva
luat
ion
D
ecem
ber 3
1, D
ecem
ber 3
1, de
prec
iatio
n
Des
crip
tion
Not
e 20
11
(Dele
tions
) Su
rplu
s W
rite-
off
2011
20
11
on d
eletio
n)
defic
it / (
Surp
lus)
Writ
e-off
20
11
2011
%
R
upee
s in
‘000
La
nd-F
reeh
old
11.4
4
,317
,291
3
58,9
34
754
,269
-
5
,430
,494
-
-
-
-
-
5,4
30,4
94
-
Land
-Lea
seho
ld
11.4
1
,683
,382
1
,292
7
3,30
3
-
1,7
57,9
77
-
-
-
-
-
1
,757
,977
-
Bu
ildin
gs-F
reeh
old
11.4
1
,742
,072
9
9,46
1
-
-
1,8
41,5
33
165
,379
8
2,67
9
(88,
854)
-
1
59,2
04
1,6
82,3
29
5
Build
ings
-Lea
seho
ld
11.4
2
,038
,518
7
9,81
0
-
-
2,1
18,3
28
175
,809
9
6,79
5
(12,
234)
-
2
60,3
70
1,8
57,9
58
5
Build
ing
impr
ovem
ents
837
,024
1
99,7
50
-
-
1,0
36,7
27
235
,426
1
86,7
01
-
-
422
,081
6
14,6
46
20
(
rent
ed p
rem
ises)
(47
)
(
46)
Fu
rnitu
re
5
26,6
51
103
,971
-
-
6
27,1
52
195
,052
4
9,72
1
-
-
241
,393
3
85,7
59
10
and
fixtu
res
(3,
470)
(
3,38
0)
El
ectri
cal, o
ffice
3,0
38,4
87
704
,870
-
-
3,7
27,0
66
1,5
98,5
45
536
,517
-
-
2
,120
,912
1
,606
,154
1
4.28
- 50
and
com
pute
r equ
ipm
ent
(16
,291
)
(
14,1
50)
Vehi
cles
2
44,6
61
34,
834
-
-
270
,243
1
60,4
87
39,
471
-
-
1
96,0
00
74,
243
2
0
(
9,25
2)
(3,
958)
To
tal
1
4,42
8,08
6
1,5
82,9
22
827
,572
-
1
6,80
9,52
0
2,5
30,6
98
991
,884
(1
01,0
88)
-
3,3
99,9
60
13,
409,
560
(29
,060
)
(
21,5
34)
Notes to the Unconsolidated Financial Statementsfor the year ended December 31, 2012
11.3
In
tang
ible
asse
ts
Cos
t A
ccum
ulat
ed A
mor
tizat
ion
D
escr
iptio
n
At Ja
nuar
y 1,
Addi
tions
At
Dec
embe
r 31,
At Ja
nuar
y Am
ortiz
ation
At
Dec
embe
r N
et bo
ok va
lue
Rate
of
2012
2012
1,
2012
31, 2
012
at D
ecem
ber
amor
tizati
on
31, 2
012
%
R
upee
s in
‘ 000
Com
puter
softw
are
3
12,6
74
869,
034
1,18
1,70
8 14
6,57
9 49
,717
19
6,29
6
985,
412
14.2
8
C
ost
Acc
umul
ated
Am
ortiz
atio
n
Des
crip
tion
At
Janu
ary 1
, Ad
ditio
ns
At D
ecem
ber 3
1, At
Janu
ary
Amor
tizati
on
At D
ecem
ber
Net
book
value
Ra
te of
20
11
20
11
1, 20
11
31
, 201
1 at
Dec
embe
r am
ortiz
ation
31
, 201
1 %
(Rup
ees i
n ‘ 0
00)
C
ompu
ter so
ftware
290,3
55
22,31
9 31
2,674
10
7,995
38
,584
146,5
79
166,0
95
14.28

112
Notes to the Unconsolidated Financial Statementsfor the year ended December 31, 2012
11.4 Bank arranged for valuation of properties as at December 31, 2011 from three independent valuers (Akbani & Javed , Asif Associates and Harvester Services). The revalued amounts of properties have been determined on the basis of Fair Value Model. The revaluation resulted in net increase in the carrying values of the properties by Rs. 928.659 million. During the year the bank arranged for revaluation of Head office building from independent valuer, Indus surveyor. As a result net increase in the carrying values of properties comes to Rs. 814.625 million as at Dec 31, 2012. Had there been no revaluation, the carrying amount of revalued assets would have been as follows:
Note December 31, December 31, 2012 2011
Rupees in ‘000
11.6 Incremental depreciation charged during the year transferred to profit & loss account 21.1 47,736 44,932
11.7 Restriction / discrepancy in the title of property having a net book value of 73,726 76,112
11.8 Carrying amount of temporarily idle property and equipment 54,500 54,500
11.9 The gross carrying amount of fully depreciated / amortized assets that are still in use: Furniture and fixtures 115,759 110,201 Electrical, office and computer equipments 1,240,959 875,141 Vehicles 129,088 138,207 Intangible assets - software 47,135 38,056 11.10 The carrying amount of property and equipment that have retired from active use and are held for disposal 353,026 334,858
11.11 The details of disposals of assets whose original cost or book value exceeds one million rupees or two hundred and fifty thousand
rupees respectively, whichever is lower, are given in Annexure “II”.
11.12 Information relating to sale of fixed assets (otherwise than through a regular auction) made to chief executive or a director or an executive or a shareholder holding not less than ten percent of the voting shares of the Bank or any related party, as required by SBP’s BSD circular no. 4 dated February 17, 2006, is given in Annexure “II”.
December 31, December 31, 2012 2011
Rupees in ‘000 - Land 4,537,289 3,869,965 - Building 3,379,155 1,202,201
11.5 Fair value of property and equipment excluding land and buildings is not expected to be materially different from their carrying amount. Land and Buildings were revalued as stated above in note 11.4 and are carried at fair value.

Annual Report of Allied Bank Limited for the year 2012
113
Notes to the Unconsolidated Financial Statementsfor the year ended December 31, 2012
12.1 Reconciliation of deferred tax Balance as at Recognised in Recognised in Balance as at Recognised in Recognised in Balance as at January 01, Profit and Loss Equity December 31, Profit and Loss Equity December 31, 2011 Account 2011 Account 2012
(Rupees in ‘000)
Deferred debits arising in respect of: Compensated leave absences 153,605 (64,726) - 88,879 (88,182) - 697 Provision against: Investments 79,098 (6,399) - 72,699 (728) - 71,971 Other assets 275,847 (63,463) - 212,384 (45,690) - 166,694 Off balance sheet obligations 169,525 (60,093) - 109,432 (17,393) - 92,039 Advances 1,025,795 258,203 - 1,283,998 13,870 - 1,297,868 Post retirement medical benefits 276,249 (51,535) - 224,714 (59,568) - 165,146 Worker’s welfare fund 86,455 108,794 - 195,249 111,093 - 306,342 2,066,574 120,781 - 2,187,355 (86,598) - 2,100,757 Deferred credits arising due to: Surplus on revaluation of fixed assets (314,611) 15,728 (35,381) (334,264) 16,708 41,260 (276,296) Surplus on revaluation of investments (403,875) - 200,062 (203,813) - (407,002) (610,815) Accelerated tax depreciation / amortization (845,185) (35,753) - (880,938) (386,601) - (1,267,539) Excess of investment in finance lease over written down value of leased assets (18,516) 2,084 - (16,432) 5,741 - (10,691) (1,582,187) (17,941) 164,681 (1,435,447) (364,152) (365,742) (2,165,341) 484,387 102,840 164,681 751,908 (450,750) (365,742) (64,584)
Note December 31, December 31, 2012 2011
Rupees in ‘000
12. DEFERRED TAX ASSET (LIABILITY) / ASSET - NET Deferred debits arising in respect of: Compensated leave absences 12.1 697 88,879 Provision against: 12.1 Investments 71,971 72,699 Other assets 166,694 212,384 Off balance sheet obligations 92,039 109,432 Provision against advances 1,297,868 1,283,998 Post retirement medical benefits 12.1 165,146 224,714 Worker’s welfare fund 306,342 195,249 2,100,757 2,187,355 Deferred credits arising due to: Surplus on revaluation of fixed assets 21.1 (276,296) (334,264) Surplus on revaluation of investments (610,815) (203,813) Accelerated tax depreciation / amortization (1,267,539) (880,938) Excess of investment in finance lease over written down value of leased assets (10,691) (16,432) (2,165,341) (1,435,447) (64,584) 751,908

114
Note December 31, December 31, 2012 2011
Rupees in ‘000
13. OTHER ASSETS
Income / mark-up accrued on advances, investments and lending to financial institutions: - in local currency 9,136,885 10,950,120 - in foreign currencies 84,750 32,023 Advances, deposits, advance rent and other prepayments 999,893 1,322,089 Advance taxation (payments less provisions) 4,060,026 1,590,524 Stationery and stamps on hand 122,598 41,439 Prepaid exchange risk fee - 53 Unrealized gain on forward foreign exchange contracts 15,004 162,279 Due from the employees’ retirement benefit schemes 36.4 1,808,080 1,562,389 Excise duty 11 11 Receivable from SBP - customers encashments 12,050 9,222 Non banking assets acquired in satisfaction of claims 13.1 2,787,866 1,974,266 Others 832,458 666,004 19,859,621 18,310,419 Less: Provision held against other assets 13.2 (1,404,807) (1,098,592) Other assets (net of provision) 18,454,814 17,211,827 13.1 Market value of non banking assets acquired in satisfaction of claims 2,211,578 1,820,550
13.2 Provision against Other Assets:
Opening balance 1,098,592 1,062,781 Charge for the year 472,926 308,815 Reversals (130,542) (194,634) Net charge 342,384 114,181 Written off / adjusted (36,169) (78,370) Closing balance 1,404,807 1,098,592
14. CONTINGENT ASSETS
There were no contingent assets of the Bank as at December 31, 2012 and December 31, 2011.
15. BILLS PAYABLE
In Pakistan 6,203,051 4,015,317
Notes to the Unconsolidated Financial Statementsfor the year ended December 31, 2012
12.2 Through Finance Act 2007, a new section 100A read with the 7th Schedule (the Schedule) was inserted in the Income Tax Ordinance, 2001 for the taxation of banking companies. The Schedule seeks to simplify the taxation of banking companies and is applicable from the tax year 2009 (financial year ending on December 31, 2008).
The deferred tax asset on the deductible temporary differences disallowed as a deduction in the past up to December 31, 2007, for which transitory provisions are not available, is being kept as an asset as the Bank is confident that transitory provisions would be introduced to set out the mechanism of claiming where benefit of these allowances can be claimed.

Annual Report of Allied Bank Limited for the year 2012
115
Note December 31, December 31, 2012 2011
Rupees in ‘000
16. BORROWINGS
In Pakistan 38,469,303 49,959,308 Outside Pakistan 446,889 33,892 38,916,192 49,993,200
16.1 Particulars of borrowings with respect to currencies
In local currency 38,362,235 48,043,881 In foreign currencies 553,957 1,949,319 38,916,192 49,993,200 16.2 Details of borrowings (Secured / Unsecured)
Secured
Borrowings from State Bank of Pakistan Under export refinance scheme 16.3 15,179,074 14,162,420 Long term financing facility - Export oriented projects 16.4 908,543 1,418,190 Long term financing facility 16.5 2,623,950 2,673,844 Modernization of SMEs 16.6 7,222 154,240 Financing Facility for Storage of Agriculture Produce (FFSA) 16.7 60,290 71,249 Revival of SMEs & Agricultural activities in flood affected areas 16.8 112,650 89,450 18,891,729 18,569,393 Repurchase agreement borrowings 16.9 18,220,505 29,474,488 Unsecured
Call borrowings 16.10 1,553,957 1,915,427 Overdrawn nostro accounts - 33,892 Other Borrowings 250,001 - 1,803,958 1,949,319 38,916,192 49,993,200 16.3 The Bank has entered into various agreements for financing with the State Bank of Pakistan (SBP) for extending export finance to
customers. As per agreements, the Bank has granted to SBP the right to recover the outstanding amount from the Bank at the date of maturity of the finance by directly debiting the current account maintained by the Bank with the SBP. The loan carries mark-up at rates ranging from 8.5 % to 10% (2011: 10%) per annum. These borrowings are repayable within six months from the deal date.
16.4 This represents Long Term Financing against export oriented projects availed by the Bank for further extending the same to its
customers for export oriented projects, for a maximum period of 10 years. The loan repayments to SBP correspond the respective repayment from customers. The loan carries mark-up at the rate of 5% (2011: 5%) per annum.
16.5 This represents Long Term Financing Facility availed by the Bank for further extending the same to its customers for balancing, modernization and replacement (BMR) of existing units / projects, for a maximum period of 10 years. The loan carries mark-up at rates ranging from 8.20% to 9.50% (2011: 8.20% to 9.50%) per annum.
16.6 This represents Long Term Financing facility availed by the Bank for extending the same to its customers establishment, expansion and balancing, modernization & replacement (BMR) of steel / metal / concrete silos, warehouses & cold storage facilities for storing agricultural produce, for a maximum period of 5 years. These carry mark-up at the rates ranging from 6.5% (2011: 5% - 8%) per annum.
Notes to the Unconsolidated Financial Statementsfor the year ended December 31, 2012

116
Notes to the Unconsolidated Financial Statementsfor the year ended December 31, 2012
December 31, December 31, 2012 2011
Rupees in ‘000
17. DEPOSITS AND OTHER ACCOUNTS
Customers
Fixed deposits 158,249,920 110,061,707 Savings deposits 125,840,130 106,783,680 Current accounts - Remunerative 80,053,817 57,667,849 - Non - remunerative 145,711,361 124,121,553 509,855,228 398,634,789 Financial Institutions Remunerative deposits 4,463,515 560,816 Non - remunerative deposits 388,312 366,071 514,707,055 399,561,676 17.1 Particulars of deposits In local currency 475,361,565 362,079,526 In foreign currencies 39,345,490 37,482,150 514,707,055 399,561,676 18. SUB-ORDINATED LOANS
Term Finance Certificates - I 2,494,000 2,495,000 Term Finance Certificates - II 2,996,400 2,997,600 5,490,400 5,492,600
The Bank has issued following unsecured sub-ordinated Term Finance Certificates to improve the Bank’s capital adequacy. Liability to the TFC holders is subordinated to and rank inferior to all other debts of the Bank including deposits. The salient features of the issues are as follows:
Term Finance certificate - I Term Finance certificate - II Outstanding Amount- (Rupees in thousand) 2,494,000 2,996,400 Issue date December 06, 2006 August 28, 2009 Total issue 2,500,000 3,000,000 Rating AA AA Listing Karachi Stock Exchange Limited Karachi Stock Exchange Limited Mark up repayment Payable semi annually Payable semi annually Rate Six months KIBOR plus 1.90% - Six months KIBOR plus 0.85% for first 5 years - Six months KIBOR plus 1.30% from start of 6th year Call Option Call option is not available to the issuer Issuer has the right to seek redemption after
the eleventh redemption date of the entire TFC issue, prior to its stated maturity.
Repayment 8 Years (2007 - 2014) 10 Years (2009 - 2019)
16.7 This represents long term financing facility availed by the Bank for establishment, expansion and balancing modernization and replacement (BMR) of steel/Metal.Concrete Silos, Warehouses and Cold Storage. The financing is available for a maximum period of 7 years. The loan carries mark-up at the rate of 5% (2011: 5% to 6.5%) per annum.
16.8 This represents Production / Working capital financing facility availed by the Bank for extending the same to farmers and Small & Medium Enterprises (SMEs) in districts affected by recent flood as notified by National Disaster Management Authority. The loan carries mark-up at the rate of 5% (2011: 5%) per annum.
16.9 These represent funds borrowed from the local interbank market against government securities, carrying mark-up at the rates ranging from 6.49% to 9% (2011: 11.7% to 11.95%) per annum maturing on various dates, latest by January 09, 2013.
16.10 These represent unsecured borrowings in local and foreign currency from the local interbank market, carrying mark-up at rates ranging from 8.25% to 9% (2011: 11.75% to 11.85%) for local currency borrowing , and at rates ranging from 0.16% to 0.40 %(2011: 0.50% to 1%) for foreign currency borrowing per annum maturing on various dates, latest by March 11, 2013.

Annual Report of Allied Bank Limited for the year 2012
117
Note December 31, December 31, 2012 2011
Rupees in ‘000
19. OTHER LIABILITIES Mark-up / return / interest payable in local currency 5,227,681 4,824,619 Mark-up / return / interest payable in foreign currency 569,242 597,610 Accrued expenses 1,483,162 1,102,538 Branch adjustment account 670,232 485,125 Provision for: - gratuity 36.4 104,013 131,413 - employees’ medical benefits 36.4 1,864,778 1,771,930 - employees’ compensated absences 36.4 1,020,459 962,292 Unclaimed dividends 87,695 57,502 Dividend payable 13,107 10,984 Provision against off-balance sheet obligations 19.1 884,489 515,009 Retention money payable 139,544 113,644 Security deposits against lease 451,206 397,171 Sundry deposits 895,873 914,860 Workers Welfare Fund payable 891,065 573,657 Others 1,315,794 837,988 15,618,340 13,296,342 19.1 Provision against off-balance sheet obligations Opening balance 515,009 370,764 Charge for the year 419,173 182,304 Reversals (49,693) (38,059) Net charge 369,480 144,245 Closing balance 884,489 515,009 The above provision has been made against letters of guarantee issued by the Bank. 19.2 Particulars of other liabilities In local currency 15,047,727 12,698,732 In foreign currencies 570,613 597,610 15,618,340 13,296,342
Notes to the Unconsolidated Financial Statementsfor the year ended December 31, 2012

118
Notes to the Unconsolidated Financial Statementsfor the year ended December 31, 2012
Note December 31, December 31, 2012 2011
Rupees in ‘000
21. SURPLUS ON REVALUATION OF ASSETS - NET OF TAX Surplus arising on revaluation of: - fixed assets 21.1 3,525,308 3,629,110 - securities 21.2 4,462,470 2,090,336 Surplus on revaluation of assets - net of tax 7,987,778 5,719,446 21.1 Surplus on revaluation of fixed assets Surplus on revaluation as at January 1, 2012 3,963,374 3,079,647
(Deficit) / surplus on revaluation during the year (114,034) 928,659 Transferred to unappropriated profit in respect of incremental depreciation charged during the year - net of deferred tax (31,028) (29,204) Related deferred tax liability 12.1 (16,708) (15,728) 11.6 (47,736) (44,932) Surplus on revaluation as at December 31, 2012 3,801,604 3,963,374 Less: Related deferred tax liability on : Revaluation as at January 1, 2012 334,264 314,611 Deferred tax liability on surplus on revaluation of fixed assets (41,260) 35,381 Incremental depreciation charged during the year transferred to profit and loss account 12.1 (16,708) (15,728) 276,296 334,264 3,525,308 3,629,110
20.2 Issued, subscribed and paid-up capital Fully paid-up Ordinary shares of Rs. 10/- each December 31, December 31, Ordinary shares December 31, December 31, 2012 2011 2012 2011
No. of shares Rupees in ‘000 406,780,094 406,780,094 Fully paid in cash 4,067,801 4,067,801 522,013,365 435,982,273 Issued as bonus shares 5,220,134 4,359,823 928,793,459 842,762,367 9,287,935 8,427,624 18,348,550 Ordinary shares of Rs. 10 each, determined pursuant to the Scheme of Amalgamation in accordance with the swap ratio stipulated therein less 9,200,000 Ordinary shares of Rs. 10 each, held by Ibrahim Leasing 9,148,550 9,148,550 Limited on the cut-off date (September 30, 2004) 91,486 91,486 8,400,000 Ordinary shares of Rs. 10 each, determined pursuant to the Scheme of Amalgamation of First Allied Bank Modaraba with Allied Bank Limited 8,400,000 8,400,000 in accordance with the share swap ratio stipulated therein 84,000 84,000 946,342,009 860,310,917 9,463,421 8,603,110 Ibrahim Fibers Limited, related party of the Bank, holds 226,365,220 (23.92%) [December 31, 2011: 270,786,564 (31.4%)] ordinary
shares of Rs.10 each, as at reporing date.
20. SHARE CAPITAL 20.1 Authorized capital December 31, December 31, December 31, December 31, 2012 2011 2012 2011
No. of shares Rupees in ‘000
1,500,000,000 1,500,000,000 Ordinary shares of Rs.10/- each 15,000,000 15,000,000

Annual Report of Allied Bank Limited for the year 2012
119
Notes to the Unconsolidated Financial Statementsfor the year ended December 31, 2012
Note December 31, December 31, 2012 2011
Rupees in ‘000
21.2 Surplus / (deficit) on revaluation of available-for-sale securities Federal Government Securities Market Treasury Bills 260,050 (67,646) Pakistan Investment Bonds (2,078) (13,023) Term Finance Certificates 9,007 (19,326) Shares / Certificates - Listed 4,659,338 2,429,655 Open end mutual funds 146,968 (35,511) 9.1 5,073,286 2,294,149 Less : Related deferred tax (liability) 12.1 (610,815) (203,813) 4,462,470 2,090,336
22. CONTINGENCIES AND COMMITMENTS 22.1 Direct credit substitutes Guarantees in favour of: Banks and financial institutions 473,823 611,478 22.2 Transaction-related contingent liabilities Guarantees in favour of: Government 18,513,854 14,010,962 Others 12,703,025 21,208,164 31,216,879 35,219,126 22.3 Trade-related contingent liabilities 54,546,360 52,324,035 22.4 Claims against the bank not acknowledged as debt 5,929,382 4,210,600 22.5 The Bank makes commitments to extend credit in the normal course of its business but these being revocable commitments do not
attract any significant penalty or expense if the facility is unilaterally withdrawn.
December 31, December 31, 2012 2011
Rupees in ‘000
22.6 Commitments in respect of forward foreign exchange contracts Purchase 35,605,257 49,580,813 Sale 9,400,993 25,543,543
22.7 Commitments in respect of: Civil works 495,414 1,496,831 Acquisition of operating fixed assets 706,733 504,141 1,202,147 2,000,972 22.8 Commitments in respect of lease financing 192,274 110,472 22.9 Commitments in respect Market Treasury Bills - 3,926,578 22.10 Other Contingencies
22.10.1 The income tax assessments of the Bank have been finalized up to and including tax year 2011 for local and Azad Kashmir operations. While finalizing income tax assessments up to tax year 2011, income tax authorities made certain add backs with aggregate tax impact of Rs.11,471 million. As a result of appeals filed by the Bank before appellate authorities, most of the add backs have been deleted. However, the Bank and Tax Department are in appeals / references before higher appellate forums against unfavorable decisions. Pending finalization of appeals no provision has been made by the Bank on aggregate sum of Rs.11,471 million. The management is confident that the outcome of these appeals will be in favor of the Bank.

120
During the year, the Tax Authorities conducted proceedings of withholding tax audit under section 161/205 of Income Tax Ordinance, 2001 for tax year 2006 and tax year 2008 to 2012 and created an arbitrary demand of Rs. 219 million. The Bank has filed appeals against these orders. The management is confident that these appeals will be decided in favor of the Bank and therefore, no provision has been made agaisnt the said demand of Rs. 219 million.
Tax authorities have also issued an order under Federal Excise Act, 2005 thereby creating an arbitrary demand of Rs. 110 million.
The bank has filed an appeal before Commissioner Inland Revenue (appeals). The management is confident that aforesaid demand will be deleted by appellate authorities and therefore no provision has been made against the said demand of Rs. 110 million.
22.10.2 As a result of a compromise decree granted by the Honorable High Court of Sindh in August 2002, Fateh Textile Mills Limited
pledged 16,376,106 shares of ABL with the Bank as security consequent to the default by Fateh Textile Mills Limited on the terms of the decree. The Bank published a notice on June 23, 2004 in accordance with the requirements of section 19(3) of the Financial Institutions (Recovery of Finances) Ordinance, 2001 and invited sealed bids from interested parties to purchase the pledged shares. The bidding process was scheduled for July 23, 2004 and the Bank had fixed a reserve price of Rs. 25 per share. On the bid date, the highest offer for these shares was received at a rate of Rs. 25.51 per share. The bid was approved and the successful bidder had deposited an amount of Rs. 417.75 million with the Bank.
Fateh Textile Mills Limited had filed a suit against the Bank in the High Court of Sindh challenging the sale of the above shares.
The High Court had not granted a stay order on the process of sale of shares. However, the matter is still pending in the Court. 23. DERIVATIVE INSTRUMENTS
The Bank at present does not offer structured derivative products such as Interest Rate Swaps, Forward Rate Agreements or FX Options. However, the Bank’s Treasury Group buys and sells derivative instruments such as:
• Forward Exchange Contracts • Foreign Exchange Swaps • Equity Futures Forward Exchange Contracts
Forward Exchange Contract (FEC) is a product which is offered to the obligor who transact internationally. These traders use this product to hedge themselves from unfavorable movements in a foreign currency, however, by agreeing to fix the exchange rate, they do not benefit from favorable movements in that currency.
An FEC is a contract between the Obligor and the Bank in which both agree to exchange an amount of one currency for another
currency at an agreed forward exchange rate for settlement over more than two business days after the FEC is entered into (the day on which settlement occurs is called the value date). FEC is entered with those Obligors whose credit worthiness has already been assessed, and they have underlined trade transactions.
If the relevant exchange rate moves un-favourably, the Bank will loose money, and Obligor will benefit from that movement
because the Bank must exchange currencies at the FEC rate. In order to mitigate this risk of adverse exchange rate movement, the Bank hedges its exposure by taking forward position in inter-bank FX.
Foreign Exchange Swaps
A Foreign Exchange Swap (FX Swap) is used by the Bank if it has a need to exchange one currency for another currency on one day and then re-exchange those currencies at a later date. Exchange rates and forward margins are determined in the “interbank” market and fluctuate according to supply and demand.
An FX Swap prevents the Bank from gaining any benefit resulting from a favourable exchange rate movement in the relevant
currency pair between the time Bank enters into the transaction deal and when settlement occurs. Cancellation of the swap may also result in exposure to market movements. The key advantage of an FX swap is that it provides the Bank with protection against unfavourable currency movements between the time it enters into the transaction and settlement. The term and amounts for FX Swap can also be tailored to suit the Bank’s particular needs.
Equity Futures
An equity futures contract is a standardized contract, traded on a futures counter of the stock exchange, to buy or sell a certain underlying scrip at a certain date in the future, at a specified price.
The Bank uses equity futures as a hedging instrument to hedge its equity portfolio, in both held for trading and available for sale,
against equity price risk. Only selected shares are allowed to be traded on futures exchange. Equity futures give flexibility to the Bank either to take delivery on the future settlement date or to settle it by adjusting the notional value of the contract based on the current market rates. Maximum exposure limit to the equity futures is 10% of Tier I Capital of the Bank, based on prevailing SBP regulations.
The accounting policies used to recognize and disclose derivatives are given in note 5.15.2. The risk management framework of
derivative instruments is given in note 43.
Notes to the Unconsolidated Financial Statementsfor the year ended December 31, 2012

Annual Report of Allied Bank Limited for the year 2012
121
Notes to the Unconsolidated Financial Statementsfor the year ended December 31, 2012
December 31, December 31, 2012 2011
Rupees in ‘000
24. MARK-UP / RETURN / INTEREST EARNED On loans and advances: Customers 31,457,248 32,634,596 On investments in: Available for sale securities 12,897,039 16,014,917 Held to maturity securities 4,036,826 1,283,302 Held for Trading 41,990 4,349 16,975,855 17,302,568
On deposits with financial institutions 9,018 4,011 On securities purchased under resale agreements 996,522 1,796,144 On certificates of investment 6,571 6,929 On letters of placement 7,088 13,864 On call money lending 50,331 56,161 49,502,633 51,814,273
25. MARK-UP / RETURN / INTEREST EXPENSED Deposits 23,054,577 20,139,873 Long term borrowing 248,400 297,379 Securities sold under repurchase agreements 3,261,106 1,952,036 Call money borrowing 431,967 338,396 Brokerage and commission 154,232 156,236 Markup on sub-ordinated loans 716,980 814,737 Other short term borrowings 3,274,424 2,944,577 31,141,686 26,643,234 26. FEE, COMMISSION AND BROKERAGE INCOME Core fees, commission and brokerage 2,450,527 2,575,091 Account maintenance charges 119,580 176,641 2,570,107 2,751,732 27. GAIN / (LOSS) ON SALE OF SECURITIES Shares - listed 2,002,399 845,570 - unlisted 208,715 - Open end mutual funds (953,571) (149,933) Market treasury bills 660,944 130,660 Term finance certificates - (141) Sukuk Bonds 1,382 - 1,919,869 826,156 28. OTHER INCOME Gain on sale of operating fixed assets 27,850 2,568 Profit on sale of other assets 5,273 676 Management fee 71,737 36,280 Recovery from written off Loans 128,245 8,125 Gain on Demutuallizaton of Lahore and Islamabad Stock Exchange 38,785 - 271,890 47,649

122
Notes to the Unconsolidated Financial Statementsfor the year ended December 31, 2012
29.1 Auditors’ remuneration
December 31, 2012 December 31, 2011
KPMG Ernst & Young Total KPMG Ernst & Young Total Taseer Hadi Ford Rhodes Taseer Hadi Ford Rhodes
& Co Sidat Hyder & Co Sidat Hyder
Rupees in ‘000
Annual Audit 2,925 2,925 5,850 2,925 2,925 5,850 Annual audit oversees bussiness unit 53 2,361 2,414 53 - 53 Half year review 1,180 1,180 2,360 1,180 1,180 2,360 Special certifications and miscellaneous services 2,094 2,175 4,269 1,925 2,220 4,145 Out-of-pocket expenses 545 538 1,083 771 737 1,508
6,797 9,179 15,976 6,854 7,062 13,916
Note December 31, December 31, 2012 2011
Rupees in ‘000
29. ADMINISTRATIVE EXPENSES Salaries, allowances, etc. 29.3 7,531,588 6,861,704 Charge for defined benefit plan - net 36 442,808 470,155 Contribution to defined contribution plan - provident fund 242,066 217,061 Non-executive directors’ fees, allowances and other expenses 7,550 4,225 Rent, taxes, insurance, electricity, etc. 1,815,076 1,519,574 Legal and professional charges 74,812 96,914 Communications 327,944 404,208 Repairs and maintenance 308,050 252,884 Stationery and printing 228,248 280,018 Advertisement and publicity 355,139 284,650 Auditors’ remuneration 29.1 15,976 13,916 Depreciation / Amortization 11.2 & 11.3 1,241,870 1,030,468 Security service charges 623,191 552,343 Travelling, conveyance and fuel expenses 266,838 270,007 Entertainment 117,034 137,195 Computer expenses 556,963 423,458 Subscription 247,457 256,156 Donations 29.2 103,515 61,295 Others 40,274 29,645 14,546,399 13,165,876

Annual Report of Allied Bank Limited for the year 2012
123
Notes to the Unconsolidated Financial Statementsfor the year ended December 31, 2012
December 31, December 31, 2012 2011
Rupees in ‘000
Allied fund for flood relief account - 15,000 Al-Mustafa Trust 1,500 - Aziz Jehan Begum Trust 1,000 - Bait ul Sakoon Karachi 100 - Bakhtawar Amin Memorial Trust Hospital 3,000 1,000 Construction of Houses at Flood Effected Areas 51,315 - GCU Endowment Fund Trust - 1,000 Imran Khan Foundation 100 100 Institute of Business Administration 15,000 20,000 Kaghan Memorial Trust 2,000 - Karachi Center for Dispute Resolution - 450 Karachi School For Business and Leadership 20,000 - Khoja Society for People’s Education - 600 Laeeq Rafique Foundation 2,000 - Lahore Business Association - 500 Lahore Businessmen Association for Rehabilitation of the Disabled 500 - Liver Center, Civil Hospital Faisalabad 3,000 - Marie Adelaide leprosy center - 1,000 Mayo Hospital Lahore - 1,200 Memon Medical Institute - 1,200 Namal Education Foundation 1,000 - Pakistan Hindu Council - 100 Patient Welfare Society Allied Hospital Faisalabad - 596 Patients welfare association, DMC & Civil hospital Karachi - 500 Patients welfare society Shaikh Zayed hospital Lahore - 1,000 Pink Ribbon Pakistan - 500 Sargodhian Spirit Trust 1,000 - Say Trust - 100 Shaukat khanum Memorial Cancer Hospital & Research Centre 2,000 2,000 Society for education technology - 500 Suleman Dawood School of Business - 10,000 Sundus Foundation - 800 Tamir Welfare Organization - 2,849 University of Karachi - 300 103,515 61,295
29.3 During the year, the Bank announced the Voluntary Retirement Scheme (VRS) for its employees. Ninety One (91) employees
(2011: 183) of the Bank opted for retirement under this scheme. In accordance with the actuary recommendations, the Bank has recognized an amount of Rs. 104 million (2011: Rs. 265 million) to cover additional retirement benefits in respect of such employees.
December 31, December 31, 2012 2011
Rupees in ‘000
30. OTHER CHARGES Penalties imposed by SBP 39,062 117,986 SBP prism service charges 5,828 3,194 Education cess 12,100 12,046 Provision against write off of fixed assets - 116,920 Other assets written off 969 18,058 57,959 268,204
31. WORKERS WELFARE FUND
Under the Worker’s Welfare Fund Ordinance (WWF), 1971, WWF is applicable @ 2% of profit before tax as per accounts or de-clared income as per income tax return, whichever is higher.
29.2 None of the directors, executives and their spouses had any interest in the donations disbursed during the year.

124
Note December 31, December 31, 2012 2011
Rupees in ‘000
32. TAXATION Current - for the year 3,743,788 4,917,896 - for prior years - 153,745 3,743,788 5,071,641 Deferred 450,750 (102,840) 4,194,538 4,968,801 32.1 Relationship between tax expense and accounting profit Accounting profit for the year 15,870,352 15,108,482 Tax on income @ 35% (2011: 35%) 5,554,623 5,287,969 Effect of permanent differences 20,477 49,405 Adjustments in respect of tax at reduced rates (1,539,454) (875,644) Others 158,892 507,071 Tax charge for the year 4,194,538 4,968,801
33. EARNINGS PER SHARE - BASIC AND DILUTED Profit after taxation 11,675,814 10,139,681
Number of Shares
Restated
Weighted average number of ordinary shares outstanding during the year 33.1 946,342,009 946,342,009
Rupees Restated
Earnings per share - basic and diluted 33.1 12.34 10.71
There is no dilution effect on basic earnings per share.
33.1 The corresponding figure of weighted average number of shares outstanding and earning per share have been restated to include the effect of bonus shares issued by the Bank during the year.
Note December 31, December 31, 2012 2011
Rupees in ‘000
34. CASH AND CASH EQUIVALENTS Cash and balances with treasury banks 6 43,351,653 36,479,758 Balances with other banks 7 1,029,286 1,679,085 Overdrawn nostro accounts 16.2 - (33,892) 44,380,939 38,124,951 35. STAFF STRENGTH Numbers Permanent 9,291 9,496 Temporary / on contractual basis / trainee 276 276 Bank’s own staff strength at the end of the year 9,567 9,772 Outsourced 3,492 3,257 Total staff strength 13,059 13,029 36 DEFINED BENEFIT PLANS
36.1 General description
The Bank operates a funded gratuity scheme for all employees who opted for the new staff retirement benefit scheme introduced by the management with effect from July 1, 2002. For those employees who did not opt for the new scheme, the Bank continues to operate a funded pension scheme.
The Bank also operates a contributory benevolent fund (defined benefit scheme - funded) and provides post retirement medical
benefits (unfunded scheme) to eligible retired employees.
Notes to the Unconsolidated Financial Statementsfor the year ended December 31, 2012

Annual Report of Allied Bank Limited for the year 2012
125
December 31, December 31, 2012 2011
Numbers
36.2 Number of Employees under the schemes The number of employees covered under the following defined benefit scheme/plans are: - Gratuity fund 9,567 9,772 - Pension fund 6,603 6,797 - Benevolent fund 201 213 - Employees’ compensated absences 9,291 9,496 - Post retirement medical benefits 9,291 9,496
Notes to the Unconsolidated Financial Statementsfor the year ended December 31, 2012
36.3 Principal actuarial assumptions
The actuarial valuations were carried out on December 31, 2012 based on the Projected Unit Credit Method, using the following significant assumptions:
Sources of estimation December 31, December 31, 2012 2011 Discount rate Yield on investments in Government Bonds 12.00% 13.00% Expected rate of return on plan assets: Pension fund Yield on investments in Government Bonds 12.00% 13.00% Gratuity fund Yield on investments in Government Bonds 12.00% 13.00% Benevolent fund Yield on investments in Government Bonds 12.00% 13.00% Expected rate of salary increase Rate of salary increase 10.00% 11.00%
36.4 Reconciliation of (receivable from) / payable to defined benefit plans
December 31, 2012
Note Pension Gratuity Benevolent Post Leave fund fund fund retirement Encashment
medical
Rupees in ‘000
Present value of defined benefit obligations 36.6 2,873,602 1,384,215 12,992 1,381,400 1,020,459 Fair value of plan’s/scheme’s assets 36.7 (5,993,598) (1,082,001) (161,107) - - Net actuarial gains / (losses) not recognized 1,365,453 (198,201) 41,039 483,378 - (1,754,543) 104,013 (107,076) 1,864,778 1,020,459 Benefit of the surplus not available to the Bank - - 53,539 - - Net (asset) / liability (1,754,543) 104,013 (53,537) 1,864,778 1,020,549
December 31, 2011
Note Pension Gratuity Benevolent Post Leave fund fund fund retirement Encashment
medical
Rupees in ‘000
Present value of defined benefit obligations 36.6 4,239,314 1,193,848 19,561 1,656,505 962,292 Fair value of plan’s/scheme’s assets 36.7 (5,985,286) (918,453) (160,816) - - Net actuarial (losses) / gains not recognized 224,746 (143,982) 58,928 115,425 - (1,521,226) 131,413 (82,327) 1,771,930 962,292 Benefit of the surplus not available to the Bank - - 41,164 - - Net (asset) / liability (1,521,226) 131,413 (41,163) 1,771,930 962,292

126
36.5 Movement in (receivable from) / payable to defined benefit plans
December 31, 2012
Note Pension Gratuity Benevolent Post Leave fund fund fund retirement Encashment
medical
Rupees in ‘000
Opening balance (1,521,226) 131,413 (41,163) 1,771,930 962,292 (Reversal) / charge for the year 36.9 (233,317) 195,483 (12,374) 260,616 298,872 Contribution to the fund / benefits paid - (222,883) - (167,768) (240,705) Closing balance (1,754,543) 104,013 (53,537) 1,864,778 1,020,459
December 31, 2011
Note Pension Gratuity Benevolent Post Leave fund fund fund retirement Encashment
medical
Rupees in ‘000
Opening balance (1,474,259) 94,917 (30,679) 1,632,793 872,705 Charge / (reversal) for the year 36.9 (46,967) 183,090 (10,484) 265,446 267,115 Contribution to the fund / benefits paid - (146,594) - (126,309) (177,528) Closing balance (1,521,226) 131,413 (41,163) 1,771,930 962,292
36.6 Reconciliation of present value of defined benefit obligations
December 31, 2012
Pension Gratuity Benevolent Post Leave fund fund fund retirement Encashment
medical
Rupees in ‘000
Opening balance 4,239,314 1,193,848 19,561 1,656,505 962,292 Current service cost - 160,654 - 63,223 77,914 Interest cost 512,528 143,615 1,512 204,441 162,627 Benefits paid (593,575) (178,236) (15,858) (167,769) (240,705) VRS loss 35,000 6,000 - 1,000 19,000 Actuarial (gains) / losses (1,319,665) 58,334 7,777 (376,000) 39,331 Closing balance 2,873,602 1,384,215 12,992 1,381,400 1,020,459
December 31, 2011
Pension Gratuity Benevolent Post Leave fund fund fund retirement Encashment
medical
Rupees in ‘000
Opening balance 4,237,829 941,933 22,819 1,752,683 872,705 Current service cost - 173,408 - 63,963 77,550 Interest cost 518,408 115,255 2,755 196,898 113,452 Benefits paid (500,153) (110,708) (4,747) (126,309) (177,528) VRS loss 106,000 2,000 - 8,000 34,000 Actuarial (gains) / losses (122,770) 71,960 (1,266) (238,730) 42,113 Closing balance 4,239,314 1,193,848 19,561 1,656,505 962,292
Notes to the Unconsolidated Financial Statementsfor the year ended December 31, 2012

Annual Report of Allied Bank Limited for the year 2012
127
36.7 Reconcillation of fair value of plan assets
December 31, 2012
Pension Gratuity Benevolent Post Leave fund fund fund retirement Encashment
medical
Rupees in ‘000
Opening balance 5,985,286 918,453 160,816 - - Expected return on plan assets 739,505 122,301 20,906 - - Bank’s contribution - 222,883 - - - Benefits paid (593,575) (178,236) (15,858) - - Actuarial gains / (losses) (137,618) (3,400) (4,757) - - Closing balance 5,993,598 1,082,001 161,107 - -
December 31, 2011
Pension Gratuity Benevolent Post Leave fund fund fund retirement Encashment
medical
Rupees in ‘000
Opening balance 5,368,825 849,433 143,814 - - Expected return on plan assets 665,437 112,759 18,696 - - Bank’s contribution - 146,594 - - - Benefits paid (500,153) (110,708) (4,747) - - Actuarial gains / (losses) 451,177 (79,625) 3,053 - - Closing balance 5,985,286 918,453 160,816 - -
Notes to the Unconsolidated Financial Statementsfor the year ended December 31, 2012
36.8 Composition of fair value of plan assets
December 31, 2012
Pension Gratuity Benevolent Post Leave fund fund fund retirement Encashment
medical
Rupees in ‘000
Government securities 1,268,867 382,691 115,243 - - Listed shares * 1,648,135 370,182 43,261 - - TDR’s 3,061,217 311,170 1,116 - - Bank balances * 15,379 17,958 1,487 - - 5,993,598 1,082,001 161,107 - - * Fair value of Bank’s financial instruments included in plan assets Shares of ABL 1,123,378 370,182 16,839 - - Bank balances with ABL 15,379 17,958 1,487 - - 1,138,757 388,140 18,326 - - December 31, 2011
Pension Gratuity Benevolent Post Leave fund fund fund retirement Encashment
medical
Rupees in ‘000
Government securities 4,578,616 618,646 118,478 - - Listed shares * 1,195,928 246,684 30,090 - - Bank balances * 210,742 53,123 12,248 - - 5,985,286 918,543 160,816 - - * Fair value of Bank’s financial instruments included in plan assets Shares of ABL 748,603 246,684 11,221 - - Bank balances with ABL 210,742 53,123 12,248 - - 959,345 299,807 23,469 - -

128
Notes to the Unconsolidated Financial Statementsfor the year ended December 31, 2012
36.9 Charge for definded benefit plan
December 31, 2012
Pension Gratuity Benevolent Post Leave fund fund fund retirement Encashment
medical
Rupees in ‘000
Current service cost - 160,654 - 63,223 77,914 Interest cost 512,528 143,615 1,512 204,441 162,627 Expected return on plan assets (739,505) (122,301) (20,906) - - Actuarial (gain) / losses recognised (41,340) 7,515 (5,355) (8,048) 39,331 VRS Loss 35,000 6,000 - 1,000 19,000 Benefit of the surplus not available to the bank - - 12,375 - - (233,317) 195,483 (12,374) 260,616 298,872
December 31, 2011
Pension Gratuity Benevolent Post Leave fund fund fund retirement Encashment
medical
Rupees in ‘000
Current service cost - 173,408 - 63,963 77,550 Interest cost 518,408 115,255 2,755 196,898 113,452 Expected return on plan assets (665,437) (112,759) (18,696) - - Actuarial (gain) / losses recognised (5,938) 5,186 (5,028) (3,415) 42,113 VRS Loss 106,000 2,000 - 8,000 34,000 Benefit of the surplus not available to the bank - - 10,485 - - (46,967) 183,090 (10,484) 265,446 267,115
December 31, December 31, 2012 2011
Rupees in ‘000
36.10 Actual return on plan assets - Pension fund 601,886 1,116,614 - Gratuity fund 118,901 33,133 - Benevolent fund 16,148 21,749

Annual Report of Allied Bank Limited for the year 2012
129
Notes to the Unconsolidated Financial Statementsfor the year ended December 31, 2012
36.11 Five year data of defined benefit plan and experience adjustments
Pensioin fund
2012 2011 2010 2009 2008
Rupees in ‘000
Present value of defined benefit obligation 2,873,602 4,239,314 4,237,829 4,040,811 3,400,000 Fair value of plan assets (5,993,598) (5,985,286) (5,368,825) (5,138,070) (4,319,903) Surplus (3,119,996) (1,745,972) (1,130,996) (1,097,259) (919,903) Experience adjustments on plan obligations / assets Actuarial gains / (losses) on obligation 1,319,665 122,770 (191,900) (491,912) (117,235) Actuarial gains / (losses) on assets (137,618) 451,177 211,328 540,483 (1,264,567)
Gratuity fund
2012 2011 2010 2009 2008
Rupees in ‘000
Present value of defined benefit obligation 1,384,215 1,193,848 941,933 766,547 557,547 Fair value of plan assets (1,082,001) (918,453) (849,433) (593,567) (304,031) Deficit 302,214 275,395 92,500 172,980 253,516 Experience adjustments on plan obligations / assets Actuarial gains / (losses) on obligation (58,334) (71,960) (41,223) (60,758) 60,479 Actuarial gains / (losses) on assets (3,400) (79,625) 125,349 131,570 (216,667)
Benevolent fund
2012 2011 2010 2009 2008
Rupees in ‘000
Present value of defined benefit obligation 12,992 19,561 22,819 60,968 474,679 Fair value of plan assets (161,107) (160,816) (143,814) (143,594) (617,643) Surplus (148,115) (141,255) (120,995) (82,626) (142,964) Experience adjustments on plan obligations / assets Actuarial gains / (losses) on obligation (7,777) 1,266 25,350 6,697 94,790 Actuarial gains / (losses) on assets (4,757) 3,053 (202) 40,916 (153,801)
Post retirement fund
2012 2011 2010 2009 2008
Rupees in ‘000
Present value of defined benefit obligation 1,381,400 1,656,505 1,752,683 1,681,204 1,521,833 Fair value of plan assets - - - - - Deficit 1,381,400 1,656,505 1,752,683 1,681,204 1,521,833 Experience adjustments on plan obligations Actuarial gains / (losses) on obligation 376,000 238,730 68,829 40,340 153,494
Leave Encashment
2012 2011 2010 2009 2008
Rupees in ‘000
Present value of defined benefit obligation 1,020,459 962,292 872,705 838,005 832,215 Fair value of plan assets - - - - - Deficit 1,020,459 962,292 872,705 838,005 832,215 Experience adjustments on plan obligations Actuarial gains / (losses) on obligation - - - - -

130
Notes to the Unconsolidated Financial Statementsfor the year ended December 31, 2012
36.12 Expected contributions to be paid to the funds in the next financial year
The Bank contributes to the gratuity fund as per actuarial’s expected charge for the next financial year. Contribution to the benevo-lent fund is made by the Bank as per rates set out in the benevolent scheme. No contributions are being made to pension fund due to surplus of fair value of plan’s assets over present value of defined obligation. Based on actuarial advice, management estimates that the charge / reversal in respect of defined benefit plans for the year ending December 31, 2013 would be as follows:
Pension Gratuity Benevolent Post Leave fund fund fund retirement Encashment medical
Rupees in ‘000
Expected (reversal) / charge for the next year (374,400) 231,309 (8,887) 243,708 183,396
37 DEFINED CONTRIBUTION PLANS
The Bank operates a contributory provident fund scheme for employees who are covered under the new gratuity scheme. The employer and employee both contribute 8.33% of the basic salaries to the funded scheme every month. Number of employees covered under this plan are 9,567 (2011: 9,093) as on December 31, 2012. During the year, employees made a contribution of Rs. 242.066 million (2011: 217.061 million) to the fund. The Bank has also made a contribution of equal amount to the fund.
38. COMPENSATION OF DIRECTORS AND EXECUTIVES President/Chief Independent / Non- Executive Director Executives Executive Executive Directors
Note December 31, December 31 December 31, December 31 December 31, December 31, December 31, December 31, 2012 2011 2012 2011 2012 2011 2012 2011
Rupees in ‘000
Fees 38.1 - - 7,550 4,225 - - - - Managerial remuneration 28,028 24,365 - - 15,353 13,350 1,146,135 996,419 Charge for defined benefit plans 1,667 1,614 - - 913 884 281,329 240,140 Contribution to defined contribution plan - - - - 1,279 1,112 96,551 84,840 Rent and house maintenance 12,615 10,973 - - 6,909 6,008 515,413 448,040 Utilities 2,803 2,443 - - 1,535 1,335 114,611 99,642 Medical 31 360 - - 190 196 143,997 127,023 Bonus 19,207 17,099 - - 14,661 13,150 367,495 399,092 Conveyance and others 219 285 - - 803 511 196,348 157,232 64,570 57,139 7,550 4,225 41,643 36,546 2,861,879 2,552,428 Number of persons 1 1 4 3 1 1 1,236 1,098
38.1 This represents meeting fees paid to independent / Non-Executive Directors excluding Sponsor Directors for attending meetings of the Board of Directors, Audit Committee and other Board Committees held during the year. During the year Board of Directors in their meeting held on June 04, 2012 recommended an increase in meeting fee from Rs. 50,000 to Rs. 100,000, which was subsequently approved in Extra Ordinary General Meeting held on August 23, 2012.

Annual Report of Allied Bank Limited for the year 2012
131
Notes to the Unconsolidated Financial Statementsfor the year ended December 31, 2012
39. FAIR VALUE OF FINANCIAL INSTRUMENTS The fair value of traded investments is based on quoted market prices, and have been disclosed in note 9. Fair value of fixed term loans, other assets, other liabilities and fixed term deposits cannot be calculated with sufficient reliability due
to the absence of current and active market for such assets and liabilities and reliable data regarding market rates for similar instru-ments. The provision for impairment of loans and advances has been calculated in accordance with the Bank’s accounting policy as stated in note 5.4.
The maturity and repricing profile and effective rates are stated in notes 43.3.1 and 43.2.4 respectively. In the opinion of the management, the fair value of the remaining financial assets and liabilities are not significantly different from
their carrying values since assets and liabilities are either short-term in nature or in the case of customer loans and deposits are frequently repriced.
40. SEGMENT DETAILS WITH RESPECT TO BUSINESS ACTIVITIES
The segment analysis with respect to business activity is as follows:-
For the Year Ended December 31, 2012
Corporate Trading & Retail Commercial Payment & Eliminations Total Finance Sales Banking Banking Settlement
Rupees in ‘000
Total income 501,703 3,185,436 39,576,232 55,836,450 592,932 (36,396,525) 63,296,228
Total expenses (231,989) (4,411,095) (31,349,285) (51,733,839) (290,731) 36,396,525 (51,620,414)
Net income / (loss) 269,714 (1,225,659) 8,226,947 4,102,611 302,201 - 11,675,814
Segment assets (gross) 317,997 9,478,602 121,091,387 521,918,500 336,616 - 653,143,102
Segment non performing loans - - 7,150,202 13,517,359 - - 20,667,561
Segment provision required - - 6,168,891 11,636,141 - - 17,805,032
Segment liabilities 272,124 18,599,234 503,841,209 51,781,198 6,505,857 - 580,999,622
Segment return on net assets (ROA) (%) 84.82% -12.93% 7.16% 0.80% 89.78% - -
Segment cost of funds (%) -0.02% 28.54% 6.87% 9.63% 0.00% - -
For the Year Ended December 31, 2011
Corporate Trading & Retail Commercial Payment & Eliminations Total Finance Sales Banking Banking Settlement
Rupees in ‘000
Total income 400,890 2,197,570 33,139,197 49,517,619 720,216 (27,211,406) 58,764,086
Total expenses (210,455) (3,051,358) (27,196,204) (44,964,051) (413,743) 27,211,406 (48,624,405)
Net income / (loss) 190,435 (853,788) 5,942,993 4,553,568 306,473 - 10,139,681
Segment assets (gross) 218,401 559,815 109,238,971 426,931,605 326,217 - 537,275,009
Segment non performing loans - - 6,860,243 13,592,222 - - 20,452,465
Segment provision required - - 5,526,915 12,176,802 - - 17,703,717
Segment liabilities 196,172 30,641,723 386,210,738 50,982,299 4,328,203 - 472,359,135
Segment return on net assets (ROA) (%) 86.37% -13.18% 5.80% 1.21% 113.45% - -
Segment cost of funds (%) 0.00% 22.34% 9.51% 9.40% 0.00% - -

132
Notes to the Unconsolidated Financial Statementsfor the year ended December 31, 2012
December 31, 2012 December 31, 2011
Key Key Associated Subsidiary management Other related Associated Subsidiary management Other related Directors Companies* personnel parties Directors Companies* personnel parties
Rupees in ‘000
Nature of related party transactions Loans Loans at the beginning of the year 49,969 - - 203,005 - 61,581 - - 200,035 16,061,896 Loans given during the year 14,847 2,000,000 - 76,199 3,185 23,757 - - 37,765 464,087 Loans repaid / adjustment during the year (20,974) (166,667) - (117,188) (2,985) (35,369) - - (34,795) (16,525,983) Loans at the end of the year 43,842 1,833,333 - 162,016 200 49,969 - - 203,005 - Deposits Deposits at the beginning of the year 17,270 48,985 5,710 13,556 230,430 9,821 93,965 3,241 16,128 3,042,357 Deposits received during the year 6,532,379 13,700,859 935,661 310,582 327,706,930 4,147,530 13,513,467 697,925 191,103 14,937,123 Deposits repaid during the year (6,515,996) (13,708,833) (935,691) (296,498) (322,261,546) (4,140,081) (13,558,447) (695,456) (193,675) (17,749,050) Deposits at the end of the year 33,653 41,011 5,680 27,640 5,675,814 17,270 48,985 5,710 13,556 230,430 Nostro balances - 136,808 - - - - 131,749 - - - Borrowings - - - - - - 1,204,313 - - - Lending - 1,479,252 - - - Investments in shares / open end mutual funds - 219,130 500,000 - 122,642 - 240,969 500,000 - 13,623,621 Other receivables - - 3,186 - - - - 3,656 - - Net receivable from staff retirement benefit funds - - - - 1,704,067 - - - - 1,430,976
December 31, 2012 December 31, 2011
Key Key Associated Subsidiary management Other related Associated Subsidiary management Other related Directors Companies* personnel parties Directors Companies* personnel parties
Rupees in ‘000
Mark-up earned 1,729 162,624 - 10,627 - 2,234 - - 12,556 256,504 Income on Placements - 118 - - - - 4 - - - Income on lendings - 1,775 - - - - 111 - - - Dividend Income - - - - 6,066,277 - - - - 1,204,410 Capital Gain / (Loss) - - - - (899,779) - - - - (60,225) Sales commission /management fee sharing - - 48,885 - - - - 36,280 - 11,102 Mark-up expense on deposits 2,032 6 934 224 176,366 559 29 615 82 220,873 Fee commission / bank charges 19 1,062 18 15 168 - - 18 - - Interest expense on borrowings - - - - - - 2,578 - - - Directors’ meeting fee 7,550 - - - - 4,225 - - - - Remuneration - - - 223,712 - - - - 224,880 - NIFT charges - - - - 80,720 - - - - 81,337 Rent Expense - 5,868 - - - - 5,856 - - - Charge / (reversal) in respect of staff retirement benefit funds - - - - 191,858 - - - - 342,699 Other balances, held with related parties, outstanding at the end of the current year and transactions made during the year are
included in notes 7.1, 9.4, 9.5, 20.2 and 38 to these unconsolidated financial statements.
* Associated Company on basis of common directorship.
41. RELATED PARTY TRANSACTIONS
The Bank has related party relationships with its subsidiary, companies with common directorship, directors, employee benefit plans and key management personnel.
Contributions to the accounts in respect of staff retirement benefits are made in accordance with actuarial valuation / terms of the contribution plan.
Remuneration of the key management personnel are in accordance with the terms of their employment. Other transactions are at agreed terms.

Annual Report of Allied Bank Limited for the year 2012
133
Notes to the Unconsolidated Financial Statementsfor the year ended December 31, 2012
42. CAPITAL ASSESSMENT AND ADEQUACY
42.1 Scope of Applications
The Basel II Framework is applicable to the Bank both at the consolidated level (comprising of wholly owned subsidiary - ABL Asset Management Company Limited) and also on a stand alone basis.
42.2 Capital Structure
Bank’s regulatory capital is analyzed into two tiers: Tier 1 capital, which includes fully issued, subscribed and paid up capital, balance in share premium account, reserve for bonus issue,
general reserves as per the financial statements and net un-appropriated profits, etc after deductions for investments in the equity of subsidiary companies engaged in banking and financial activities and deficit on revaluation of available for sale investments.
Tier 2 capital, which includes general provisions for loan losses (up to a maximum of 1.25 % of risk weighted assets), reserves on the
revaluation of fixed assets and equity investments (up to a maximum of 45% of the balance in the related revaluation reserves) and subordinated debt (up to a maximum of 50% of Tier 1 capital).
The Bank has issued unsecured subordinated Term Finance Certificates, which contributes towards Tier II capital for minimum
capital requirements (MCR) to support the Bank’s growth. The regulatory approval for TFC I and TFC II was obtained in December 2006 and August 2009 respectively.
Liability to the TFC holders is subordinated to and ranked inferior to all other debts of the bank including deposits. TFC I is not
redeemable before maturity without prior approval of the SBP, where as TFC II can be redeemed after the 11th redemption date of the entire TFC issue.
The salient features of the issue are as follow: Term Finance Certificate-I Term Finance Certificate-II
Outstanding Amount- (Rupees in thousand) 2,494,000 2,996,400 Issue date December 06, 2006 August 28, 2009 Total issue 2,500,000 3,000,000 Rating AA AA Listing Karachi Stock Exchange Limited Karachi Stock Exchange Limited Rate Payable semi annually Payable semi annually - Six months KIBOR plus 1.9% - Six months KIBOR plus 0.85% for first 5 years - Six months KIBOR plus 1.30% from start of 6th year Call Option Call option is not available to the issuer Issuer has the right to seek redemption after the eleventh redemption date of the entire TFC issue, prior to its stated maturity. Repayment 8 Years (2007 - 2014) 10 Years (2009 - 2019) Tier 3 Capital has also been prescribed by the SBP for managing market risk; however the Bank does not have any Tier 3 capital. The required capital is achieved by the Bank through: (a) enhancement in the risk profile of asset mix at the existing volume level; (b) ensuring better recovery management; and (c) maintain acceptable profit margins.

134
Notes to the Unconsolidated Financial Statementsfor the year ended December 31, 2012
Detail of the Bank’s eligible capital (on an Unconsolidated basis) is as follows:
December 31, December 31, 2012 2011
Rupees in ‘000
Tier I Capital Shareholders’ equity /Assigned Capital 9,463,421 8,603,110 Share premium - 201,856 Reserves 10,896,052 8,560,889 Unappropriated profits (Net of Losses) 22,558,413 20,254,503 Total Tier I Capital 42,917,886 37,620,358 Less: Book value of intangibles (985,412) (853,004) Shortfall in provisions required against classified assets irrespective of relaxation allowed (1,939,887) (1,698,881) Reciprocal investment - - Other deductions (represents 50% of investment in subsidiary) (250,000) (250,000) (3,175,299) (2,801,885) Eligible Tier I Capital 39,742,587 34,818,473 Tier II Capital Subordinated Debt (upto 50% of total Tier 1 Capital) 2,946,964 3,293,365 General Provisions subject to 1.25% of Total Risk Weighted Assets 52,090 32,647 Foreign Exchange Translation Reserves 10,198 - Revaluation Reserve (upto 45%) 3,993,699 2,815,885 Total Tier II Capital 7,002,951 6,141,897 Less: Investment in a subsidiary company (50%) (250,000) (250,000) Eligible Tier II Capital 6,752,951 5,891,897 Eligible Tier III Capital - - Total Regulatory Capital Base 46,495,538 40,710,370 42.3 Capital Adequacy
Objectives of Managing Capital
Capital Management aims to ensure that there is sufficient capital to meet the capital requirements of the Bank as determined by the underlying business strategy and the minimum requirements of the SBP. The Capital Management process is governed by the Bank’s Asset & Liability Committee (ALCO) and Management Committee (MANCO). Further, capital adequacy and management is overseen by the Board’s Risk Management Committee (BRMC) and Strategic Planning and Monitoring Committee (SPMC).
Bank’s capital management seeks:
- to comply with the capital requirements set by the regulators and comparable to the peers; - to actively manage the supply of capital costs and increase capital velocity; - to increase strategic and tactical flexibility in the deployment of capital to allow for the timely reallocation of capital; - to improve the liquidity of the Bank’s assets to allow for an optimal deployment of the Bank’s resources; - to protect the Bank against unexpected events and maintain strong ratings; - to safeguard the Bank’s ability to continue as a going concern so that it can continue to provide adequate return to shareholders; - availability of adequate capital (including the quantum) at a reasonable cost so as to enable the Bank to expand; and - to achieve low overall cost of capital with appropriate mix of capital elements. Externally Imposed Capital Requirements
In order to strengthen the solvency of Banks / Development Financial Institutions (DFI), SBP through its BSD Circular No. 07 of 2009 dated April 15, 2009 has asked the Banks to raise their minimum paid up capital to Rs. 9 billion free of losses by the end of financial year 2012. Furthermore the Banks are required to increase their minimum paid up capital to Rs 10 billion in a phased manner by the end of financial year 2013.
SBP through its BSD Circular No. 09 dated April 15, 2009 has asked Banks to achieve the minimum Capital Adequacy Ratio
(CAR) of 10% on standalone as well as on consolidated basis latest by December 31, 2010. The paid up capital and CAR of the Bank stands at Rs. 9.463 billion and 16.17% of its risk weighted exposure as at December 31,
2012. The Bank has complied with all externally imposed capital requirements as at year end.
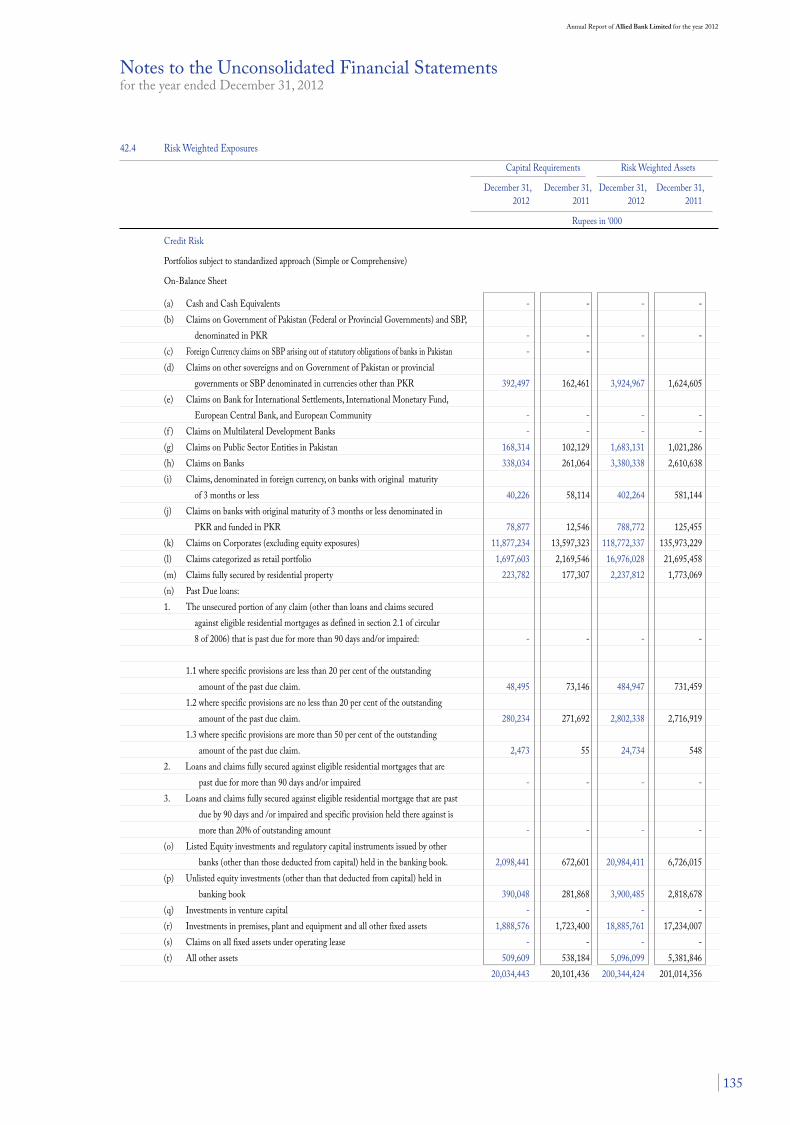
Annual Report of Allied Bank Limited for the year 2012
135
Notes to the Unconsolidated Financial Statementsfor the year ended December 31, 2012
42.4 Risk Weighted Exposures
Capital Requirements Risk Weighted Assets
December 31, December 31, December 31, December 31, 2012 2011 2012 2011
Rupees in ‘000
Credit Risk
Portfolios subject to standardized approach (Simple or Comprehensive)
On-Balance Sheet
(a) Cash and Cash Equivalents - - - - (b) Claims on Government of Pakistan (Federal or Provincial Governments) and SBP, denominated in PKR - - - - (c) Foreign Currency claims on SBP arising out of statutory obligations of banks in Pakistan - - (d) Claims on other sovereigns and on Government of Pakistan or provincial governments or SBP denominated in currencies other than PKR 392,497 162,461 3,924,967 1,624,605 (e) Claims on Bank for International Settlements, International Monetary Fund, European Central Bank, and European Community - - - - (f ) Claims on Multilateral Development Banks - - - - (g) Claims on Public Sector Entities in Pakistan 168,314 102,129 1,683,131 1,021,286 (h) Claims on Banks 338,034 261,064 3,380,338 2,610,638 (i) Claims, denominated in foreign currency, on banks with original maturity of 3 months or less 40,226 58,114 402,264 581,144 (j) Claims on banks with original maturity of 3 months or less denominated in PKR and funded in PKR 78,877 12,546 788,772 125,455 (k) Claims on Corporates (excluding equity exposures) 11,877,234 13,597,323 118,772,337 135,973,229 (l) Claims categorized as retail portfolio 1,697,603 2,169,546 16,976,028 21,695,458 (m) Claims fully secured by residential property 223,782 177,307 2,237,812 1,773,069 (n) Past Due loans: 1. The unsecured portion of any claim (other than loans and claims secured against eligible residential mortgages as defined in section 2.1 of circular 8 of 2006) that is past due for more than 90 days and/or impaired: - - - -
1.1 where specific provisions are less than 20 per cent of the outstanding amount of the past due claim. 48,495 73,146 484,947 731,459 1.2 where specific provisions are no less than 20 per cent of the outstanding amount of the past due claim. 280,234 271,692 2,802,338 2,716,919 1.3 where specific provisions are more than 50 per cent of the outstanding amount of the past due claim. 2,473 55 24,734 548 2. Loans and claims fully secured against eligible residential mortgages that are past due for more than 90 days and/or impaired - - - - 3. Loans and claims fully secured against eligible residential mortgage that are past due by 90 days and /or impaired and specific provision held there against is more than 20% of outstanding amount - - - - (o) Listed Equity investments and regulatory capital instruments issued by other banks (other than those deducted from capital) held in the banking book. 2,098,441 672,601 20,984,411 6,726,015 (p) Unlisted equity investments (other than that deducted from capital) held in banking book 390,048 281,868 3,900,485 2,818,678 (q) Investments in venture capital - - - - (r) Investments in premises, plant and equipment and all other fixed assets 1,888,576 1,723,400 18,885,761 17,234,007 (s) Claims on all fixed assets under operating lease - - - - (t) All other assets 509,609 538,184 5,096,099 5,381,846 20,034,443 20,101,436 200,344,424 201,014,356

136
Notes to the Unconsolidated Financial Statementsfor the year ended December 31, 2012
Capital Requirements Risk Weighted Assets
December 31, December 31, December 31, December 31, 2012 2011 2012 2011
Rupees in ‘000
Off- Balance Sheet - Non Market related Exposures Direct Credit Substitutes / Lending of securities or posting of securities as collateral 2,546,572 2,959,326 25,465,724 29,593,260 Performance related contingencies 141,284 - 1,412,847 - Trade Related contingencies /Other Commitments with original maturity of one year or less 355,962 302,599 3,559,626 3,025,998 3,043,818 3,261,925 30,438,197 32,619,258 Off- Balance Sheet - Market related Exposures 33,869 56,159 338,691 561,588 Total Credit Risk (A) 23,112,130 23,419,520 231,121,312 234,195,202 Market Risk Capital requirement for portfolios subject to standardized approach Interest rate risk - - - - Equity position risk etc. - 1,720,938 - 17,209,378 - 1,720,938 - 17,209,378 Capital requirement for portfolios subject to internal models approach Interest rate risk - - - - Foreign exchange risk etc. 93,291 38,017 932,914 380,175 93,291 38,017 932,914 380,175 Total Market Risk (B) 93,291 1,758,955 932,914 17,589,553 Operational Risk Basic Indicator Approach-Total of operational risk (C ) 5,548,216 5,129,784 55,482,153 51,297,831 TOTAL of A + B + C 28,753,637 30,308,259 287,536,379 303,082,586
December 31, December 31, 2012 2011
Capital Adequacy Ratio
Total eligible regulatory capital held (Note 42.2) (a) 46,495,538 40,710,370
Total Risk Weighted Assets (Note 42.4) (b) 287,536,379 303,082,586
Capital Adequacy Ratio (a) / (b) 16.17% 13.43%
43. RISK MANAGEMENT
The Risk Management Framework (the Framework) provides principles for identifying, assessing, and monitoring risk within the Bank. The Framework specifies the key elements of the risk management process in order to maximize opportunities, to minimize adversity and to achieve improved outcomes and outputs based on informed decision making.
Categories of Risk The Bank generates most of its revenues by accepting Credit, Country, Liquidity and Market Risk. Effective management of these
four risks is the decisive factor in our profitability. In addition, the Bank is subject to certain consequential risks that are common to all business undertakings. These risks are grouped under two headings: Operational and Reputational Risk. The Framework is organized with reference to these five risk categories, as detailed below:
Credit Risk This risk is defined as the possibility of loss due to unexpected default or a deterioration of credit worthiness of a business partner.
Credit Risk includes Country Risk i.e., the risks that counterparty is unable to meet its foreign currency obligations as a
result of adverse economic conditions or actions taken by governments in the relevant country. Market Risk The risk of loss generated by adverse changes in the price of financial assets or contracts currently held by the Bank (this
risk is also known as price risk).

Annual Report of Allied Bank Limited for the year 2012
137
Notes to the Unconsolidated Financial Statementsfor the year ended December 31, 2012
Liquidity Risk The risk that the Bank is unable to meet its payment obligations when they fall due and to replace funds when they are withdrawn; the consequences of which may be the failure to meet obligations to repay depositors and fulfill commitments to lend.
Operational Risk Operational Risk is the risk of loss resulting from inadequate or failed internal processes, people, and systems or from external
events. The definition excludes reputational risk. Reputational Risk The risk of failing to meet the standards of performance or behavior required or expected by stakeholders in commercial
activities or the way in which business is conducted.
Risk Responsibilities
- The Board of Directors is accountable for overall supervision of the risk management process. This is discharged by distributing responsibilities at Board level for their management and determining the manner in which risk authorities are set. The Board is also responsible for approval of all risk policies and ensuring that these are properly implemented. Further, the Board shall also seek appointment of senior management personnel capable of managing the risk activities conducted by the Bank.
- The Board Risk Management Committee (BRMC) is responsible for ensuring that the overall risk strategy and appetite
of the Bank is appropriately defined in the Strategic Plan and recommend the same to the Board of Directors. - The BRMC recommends for approval to the Board of Directors the policies proposed by MANCO (Management
Committee of the Bank) or ALCO (Assets and Liability Committee) which discharges various responsibilities assigned to it by the BRMC.
- The CEO and Group Chiefs are accountable for the management of risk collectively through their membership of
risk committees, i.e., Management Committee and the Asset & Liability Committee. Independent supervision of risk management activities is provided by the Audit Committee.
- The Risk Management Group is headed by a Group Chief responsible to set-up and implement the Framework of the
Bank. Risk Management Group Organization
Risk management functions have been segregated by business specialization, i.e., Credit Risk, Credit Administration, Risk Architecture, Risk Analytics, Operational Risk and Market Risk. All these functions are operating in tandem to improve and maintain the health of assets and liabilities.
43.1 Credit Risk Credit risk, the potential default of one or more debtors, is the largest source of risk for the Bank. The Bank is exposed to credit risk
through its lending and investment activities. The Bank’s credit risk function is divided into Corporate and Financial Institutions Risk, Commercial and Retail Risk, and Consumer Risk. The functions operate within an integrated framework of credit policies, guidelines and processes. The credit risk management activities are governed by the Credit Risk Framework of the Bank that defines the respective roles and responsibilities, the credit risk management principles and the Bank’s credit risk strategy. Further Credit Risk Management is supported by a detailed Credit Policy and Procedural Manual.
The Bank manages three principal sources of credit risk: i) Sovereign credit risk on its public sector advances ii) Non-sovereign credit risk on its private sector advances iii) Counterparty credit risk on interbank limits Sovereign Credit Risk When the Bank lends to public sector borrowers, it prefers obtaining a full sovereign guarantee or the equivalent from the
Government of Pakistan (GOP). However, certain public sector enterprises have a well defined cash flow stream and appropriate business model, based on which the lending is secured through collaterals other than GOP guarantee.
Non-Sovereign Credit Risk When the Bank lends to private sector borrowers it does not benefit from sovereign guarantees or the equivalent. Consequently, each
borrower’s credit worthiness is analyzed on the Credit Application Package that incorporates a formalized and structured approach for credit analysis and directs the focus of evaluation towards a balanced assessment of credit risk with identification of proper mitigates. These risks include Industry Risk, Business Risk, Financial Risk, Security Risk and Account Performance Risk. Financial analysis is further strengthened through use of separate financial spreadsheet templates that have been designed for manufacturing/trading concerns, financial institutions and insurance companies.
Counter Party Credit Risk on Interbank Limits In the normal course of its business, the Bank’s Treasury utilizes products such as Reverse REPO and call lending to meet the
needs of the borrowers and manage its exposure to fluctuations in market, interest and currency rates and to temporarily invest its liquidity prior to disbursement. All of these financial instruments involve, to varying degrees, the risk that the counterparty in the transaction may be unable to meet its obligation to the Bank.

138
Reflecting a preference for minimizing exposure to counterparty credit risk, the Bank maintains eligibility criteria that link the exposure limits to counterparty credit ratings by external rating agencies. For example, the minimum rating for counterparties to be eligible for a banking relationship with the Bank is A-.
Country Risk The Bank has in place a Country Risk Management Framework which has been approved by the Board. This framework
focuses on providing detailed roles and responsibilities with respect to country risk assessment as well as limit setting, exposure management and reporting of cross border exposure undertaken by the Bank. The Bank utilizes Export Credit Assessment (ECA) Scores published by The Organization for Economic Co-operation and Development (OECD) as well as country risk rating assessment reports published by Dun & Bradstreet Limited (an international credit rating agency) which uses political, commercial, macroeconomic and external risk factors in assigning a country risk rating. The country risk limits used by the Bank are linked to the ECA Scores and Dun & Bradstreet ratings and FID is responsible for monitoring of country exposure limits.
Credit Administration Credit Administration is involved in minimizing losses that could arise due to security and documentation deficiencies. The Credit
Administration Division constantly monitors the security and documentation risks inherent in the existing credit portfolio through six regional credit administration departments located all over the country.
Risk Analytics To ensure a prudent distribution of asset portfolio, the Bank manages its lending and investment activities within a framework of
Borrower, Group and Sector exposure limits and risk profile benchmarks. Internal Risk Rating Models The Bank has developed internal risk rating models to assign credit risk ratings to its Corporate, Institutional, SME and Consumer
borrowers. These models are based on expert judgment, comprising of both quantitative and qualitative factors. The rating models are being automated through the Bank’s Loan Origination System, and are given due weightage while extending credit to these asset classes. The Bank intends to comply with the requirements of Foundation Internal Ratings Based approach for credit risk measurement under Basel II, for which services of a consultant have been solicited to assist the Bank in carrying out statistical testing and validation of the rating models.
Stress Testing The Bank is also conducting stress testing of its existing portfolio, which includes all assets, i.e., advances as well as investments.
This exercise is conducted on a quarterly basis through assigning shocks to all assets of the Bank and assessing its resulting affect on capital adequacy.
Early Warning System In order to ensure that monitoring of the regular lending portfolio focuses on problem recognition, an early warning system in the
form of a ‘Watch-List’ category has been instituted to cover the gap between Regular and Substandard categories. Identification of an account on the said ‘Watch-List’ influences the lending branch to carry out an assessment of the borrower’s ability to rectify the identified problem / weakness within a reasonable time-frame, consider tighter structuring of facilities, confirm that there are no critical deficiencies in the existing security position and, if possible, arrange for strengthening of the same through obtaining additional collateral. It should however, be noted that the Watch-List category of accounts is part of the Bank’s Regular portfolio and does not require any provisioning.
In some cases, an account may even be downgraded directly from a Regular to Sub-Standard or worse on subjective basis based on
the severity of the trigger involved. Management of Non Performing Loans The Bank has a Special Asset Management Group (SAMG), which is responsible for management of non performing loans.
SAMG undertakes restructuring / rescheduling of problem loans, as well as litigation both civil and criminal for collection of debt. For the non-performing loan portfolio, the Bank makes a specific provision based on an assessment of the credit impairment of
each loan. At the end of 2012, the specific provisioning rate was 85.93% of the non-performing loan portfolio. The accounting policies and methods used to determine specific and general provision are given in the note numbers 5 and
10 to these financial statements. The movement in specific and general provision held is given in note 10.4 to these financial statements.
Portfolio Diversification During the year 2012, the Bank’s focus remained on pruning and consolidation of advances portfolio, while concomitantly
channelizing the available liquidity towards risk free assets i.e. Treasury Bills and PIBs. In line with this strategy, the advances show an overall increase by 10.21%, which has resulted in a healthy Advances to Deposit Ratio and Capital Adequacy Ratio.
Efficient diversification has been a key consideration for maintaining healthy advances portfolio. The diversification takes into
account the volatility of various sectors by placing concentration limits on lending to these sectors thereby ensuring a diversified advances portfolio. Composition of the Bank’s advance’s portfolio is significantly diversified. Agriculture, Textile, Cement, and Electric Generation are major contributors to the advances portfolio. These sectors are considered to be the biggest contributors towards country’s GDP as well.
Notes to the Unconsolidated Financial Statementsfor the year ended December 31, 2012

Annual Report of Allied Bank Limited for the year 2012
139
Notes to the Unconsolidated Financial Statementsfor the year ended December 31, 2012
43.1.1 Segmental Information
43.1.1.1 Segments by class of business
December 31, 2012
Advances (Gross) Deposits Contingencies and Commitments
Rupees Percent Rupees Percent Rupees Percent in ‘000 in ‘000 in ‘000
Agriculture, Forestry and Hunting 2,559,243 0.89% 23,119,213 4.49% 842,382 0.61% Basic metals (iron, steel) 2,535,624 0.88% 3,543,778 0.69% 786,616 0.57% Beverages 423,153 0.15% 61,538 0.01% 77,916 0.06% Cement / clay & ceramics 9,371,536 3.24% 1,626,253 0.32% 1,449,678 1.05% Chemical & pharmaceutical 20,428,684 7.07% 1,019,857 0.20% 837,597 0.60% Construction 4,401,714 1.52% 25,000,280 4.86% 10,415,008 7.52% Education 40,367 0.01% 11,639,094 2.26% 3,727 0.00% Financial 5,707,416 1.98% 4,851,827 0.94% 45,885,687 33.11% Finishing of Textile 10,953,823 3.79% 2,355,769 0.46% 459,140 0.33% Fishing 16,996 0.01% - 0.00% - 0.00% Footware & leather garments 455,457 0.16% 287,124 0.06% 71,063 0.05% Furniture & sports goods 567,305 0.20% 1,164,671 0.23% 102,785 0.07% Grains & related 6,844,285 2.37% 4,766,924 0.93% - 0.00% Health & social welfare 44,708 0.02% 3,199,003 0.62% 24,788 0.02% Hotel, restaurant & clubs 768,465 0.27% 2,930,115 0.57% - 0.00% Machinery & equipment 2,629,838 0.91% 2,847,663 0.55% 5,450,854 3.93% Manufacture of made up & ready made garments 3,153,672 1.09% 836,698 0.16% 13,026 0.01% Manufacture of transport equipment 452,360 0.16% 294,525 0.06% 170,911 0.12% Paper & paper boards 8,889,859 3.08% 20,503 0.00% 364,062 0.26% Petroleum products 1,976,112 0.68% 6,649,988 1.29% 825,322 0.60% Power, gas, water & sanitary 45,508,739 15.75% 3,615,350 0.70% 5,076,852 3.66% Printing, publishing & allied 118,821 0.04% 44,752 0.01% 53,245 0.04% Real estate, renting, and business activities 3,421,312 1.18% 83,416,781 16.21% 9,202 0.01% Rubber & plastic 458,701 0.16% 1,580,473 0.31% 297,634 0.21% Spinning 26,304,775 9.11% 9,732,133 1.89% 318,062 0.23% Sugar 5,511,440 1.91% 2,390,525 0.46% 334,000 0.24% Transport, storage & communication 5,553,689 1.92% 2,048,743 0.40% 1,065,651 0.77% Weaving 4,132,666 1.43% 4,632,180 0.90% 75,228 0.05% Wholesale & retail trade 11,021,755 3.82% 46,836,911 9.10% 1,795,936 1.30% Individuals 7,657,669 2.65% 131,635,979 25.57% 6,964,275 5.03% Others 96,979,123 33.57% 132,558,405 25.75% 54,796,468 39.55% 288,889,307 100.00% 514,707,055 100.00% 138,567,115 100.00%
43.1.1.2 Segments by sector
December 31, 2012
Advances (Gross) Deposits Contingencies and Commitments
Rupees Percent Rupees Percent Rupees Percent in ‘000 in ‘000 in ‘000
Public / Government 77,366,348 26.78% 57,904,113 11.25% 25,222,611 18.20% Private 211,522,959 73.22% 456,802,942 88.75% 113,344,504 81.80% 288,889,307 100.00% 514,707,055 100.00% 138,567,115 100.00%

140
Notes to the Unconsolidated Financial Statementsfor the year ended December 31, 2012
43.1.1.3 Details of non-performing advances and specific provisions by class of business segment
December 31, 2012 December 31, 2011
Classified Specific Classified Specific Advances Provisions Advances Provisions Held Held
Rupees in ‘000
Agriculture, Forestry and Hunting 350,569 249,890 191,594 117,701
Food & Beverages 412,574 408,880 742,356 677,453 Spinning 2,041,246 1,823,545 3,124,538 2,306,832 Weaving 1,466,767 857,692 9,040 9,040 Finishing of Textile 6,011,402 5,389,845 1,936,749 2,050,251 Footware & leather garments 131,685 96,238 55,964 55,964 Paper & paper boards 21,508 21,508 2,559 2,559 Printing, publishing & allied 5,846 5,846 31,677 31,677 Petroleum products 5,497 4,248 6,062 4,939 Chemical & pharmaceutical 405,028 341,872 373,525 353,898 Rubber & plastic 42,146 38,900 2,680 2,403 Cement / clay & ceramics 39,880 19,940 119,625 31,156 Basic metals (iron, steel) 20,383 20,383 866,035 816,727 Machinery & equipment 1,274,679 1,274,679 1,292,141 1,283,410 Power, gas, water & sanitary 239,916 239,916 839,515 839,515 Manufacture of transport equipment 246,449 236,949 83,410 75,118 Financial 81,516 40,759 343,808 233,925 Real estate, renting, and business activities 155,724 155,724 1,745,401 1,659,885 Transport, storage & communication 6,100 6,100 361,199 350,232 Hotel, restaurant & clubs 7,414 7,167 63,319 59,532 Construction 103,478 90,888 625,067 590,694 Furniture & sports goods 73,409 72,059 215,210 112,077 Wholesale & retail trade 478,295 448,307 2,206,086 1,988,895 Individuals 358,248 347,126 36,966 36,966 Others 6,687,802 5,554,481 5,177,939 3,980,221 20,667,561 17,752,942 20,452,465 17,671,070
43.1.1.4 Details of non-performing advances and specific provisions by sector. December 31, 2012 December 31, 2011
Classified Specific Classified Specific Advances Provisions Advances Provisions Held Held
Rupees in ‘000
Public/Government 138,681 138,681 144,565 72,283 Private 20,528,880 17,614,261 20,307,900 17,598,787 20,667,561 17,752,942 20,452,465 17,671,070
43.1.1.5 Geographical Segment Analysis December 31, 2012
Profit Total Net Contingencies before assets assets and taxation employed employed Commitments
Rupees in ‘000
Pakistan operation 15,649,566 627,722,261 48,153,489 138,076,927 Middle East 13,094 1,376,126 120,662 487,691 Karachi Export Processing Zone 207,692 2,817,095 2,641,709 2,497 220,786 4,193,221 2,762,371 490,188 15,870,352 631,915,482 50,915,860 138,567,115

Annual Report of Allied Bank Limited for the year 2012
141
Notes to the Unconsolidated Financial Statementsfor the year ended December 31, 2012
43.1.2 Credit Risk - General Disclosures
The Bank is following standardized approach for all its Credit Risk Exposures.
43.1.2.1 Credit Risk: Disclosures for portfolio subject to Standardized Approach and supervisory risk weights in IRB approach Basel II specific
Under standardized approach, the capital requirement is based on the credit rating assigned to the counterparties by the External Credit Assessment Institutions (ECAIs) duly recognized by SBP for capital adequacy purposes. In this connection, the Bank utilizes the credit ratings assigned by ECAIs and has recognized agencies such as PACRA (Pakistan Credit Rating Agency), JCR-VIS ( Japan Credit Rating Company – Vital Information Systems), Fitch, Moody’s and Standard & Poors which are also recognized by the SBP. The Bank also utilizes rating scores of Export Credit Agencies (ECA) participating in the “Arrangement on Officially Supported Export Credits”
The Standardized Approach to credit risk sets out fixed risk weights corresponding, where appropriate, to external credit assessment
levels or for unrated claims. Selection of ECAIs
The Bank selects particular ECAI(s) for each type of claim. Amongst the ECAIs that have been recognised as eligible by SBP, the following are being used against each respective claim type.
Sovereigns Exposures: For foreign currency claims on sovereigns, the Bank uses country risk scores of Export Credit Agencies
(ECA) participating in the “Arrangement on Officially Supported Export Credits” available on OECD’s website. Exposures to Multilateral Development Banks (MDBs): For exposures on MDBs not eligible for a 0% risk weight, ratings of
Moody’s, S&P and Fitch are being used to calculate risk-weighted assets. Exposures to Public Sector Entities (PSEs): For PSE exposures, ratings of PACRA and JCR-VIS are used to arrive at risk
weights. Bank Exposures: For foreign banks (i.e., incorporated outside Pakistan), ratings of Moody’s, S&P and Fitch is being used to arrive
at risk weights. However, for local banks (i.e., incorporated in Pakistan) ratings of PACRA and JCR-VIS are used. Corporate Exposures: Ratings assigned by PACRA and JCR-VIS are used for claims on Corporates (excluding equity
exposures). Use of ECAI Ratings The Bank prefers solicited ratings over unsolicited ratings at all times, owing to the greater degree of accuracy (in general) associated
with solicited ratings as compared to unsolicited ratings. Unsolicited ratings may only be used in cases where a solicited rating is not available.

142
Notes to the Unconsolidated Financial Statementsfor the year ended December 31, 2012
Mapping to SBP Rating Grades The selected final ratings (after application of the principles stated above) for all exposures need to be translated to the standard
rating grades given by the SBP. In this regard, the mapping tables to be used for converting ECAI ratings to SBP rating grades are given below:
Long – Term Rating Grades Mapping SBP Rating Fitch Moody’s S & P PACRA JCR-VIS ECA grade Scores
1 AAA Aaa AAA AAA AAA 0 AA+ Aa1 AA+ AA+ AA+ 1 AA Aa2 AA AA AA AA- Aa3 AA- AA- AA-
2 A+ A1 A+ A+ A+ 2 A A2 A A A A- A3 A- A- A-
3 BBB+ Baa1 BBB+ BBB+ BBB+ 3 BBB Baa2 BBB BBB BBB BBB- Baa3 BBB- BBB- BBB-
4 BB+ Ba1 BB+ BB+ BB+ 4 BB Ba2 BB BB BB BB- Ba3 BB- BB- BB-
5 B+ B1 B+ B+ B+ 5 B B2 B B B 6 B- B3 B- B- B-
6 CCC+ and Caa1 and CCC+ and CCC CCC 7 below below below CC CC C C D Short – Term Rating Grades Mapping SBP Rating Fitch Moody’s S & P PACRA JCR-VIS Grade
S1 F1 P-1 A-1+ A-1+ A-1+ A-1 A-1 A-1
S2 F2 P-2 A-2 A-2 A-2
S3 F3 P-3 A-3 A-3 A-3
S4 Others Others Others Others Others
Types of exposures and ECAI’s used December 31, 2012
Exposures Fitch Moody’s S & P PACRA JCR-VIS Corporate - - - Yes Yes Banks Yes Yes Yes Yes Yes Sovereigns - - - - - SME’s - - - - - Securitizations - - - - - Public sector enterprises - - - Yes Yes

Annual Report of Allied Bank Limited for the year 2012
143
Notes to the Unconsolidated Financial Statementsfor the year ended December 31, 2012
December 31, 2012 December 31, 2011 Rupees in ‘000 Exposures Rating Amount Deduction Net Amount Deduction Net Category Outstanding CRM Amount Outstanding CRM Amount Corporate 1 26,920,833 - 26,920,833 54,882,506 - 54,882,506 2 46,847,514 - 46,847,514 20,519,079 - 20,519,079 3 , 4 - - - 609,742 - 609,742 5 , 6 3,023,898 - 3,023,898 3,460,473 - 3,460,473 Claims on banks with original maturity of - 29,480,864 25,197,253 4,283,611 31,576,266 30,563,891 1,012,375 3 months or less Retail - 29,255,945 4,743,104 24,512,841 35,432,286 2,718,177 32,714,109 Public sector entities 1 9,223,044 - 9,223,044 6,596,571 - 6,596,571 Others - 380,429,798 - 380,429,798 269,708,902 - 269,708,902 Unrated - 174,280,050 64,640,525 109,639,525 173,364,548 27,840,637 145,523,911
Credit exposures subject to Standardized Approach
43.1.2.2 Credit Risk: Disclosures with respect to Credit Risk Mitigation for Standardized Approach
The Bank has adopted the Simple Approach of Credit Risk Mitigation for the Banking Book. Since, the trading book of the Bank only comprises equity investments, and units in open ended mutual funds, therefore no Credit Risk Mitigation benefit is taken in the trading book. In instances where the Bank’s exposure on an obligor is secured by collateral that conforms with the eligibility criteria under the Simple Approach of CRM, then the Bank reduces its exposure under that particular transaction by taking into account the risk mitigating effect of the collateral for the calculation of capital requirement i.e. risk weight of the collateral instrument securing the exposure is substituted for the risk weight of the counter party.
The Bank accepts cash, lien on deposits, government securities and eligible guarantees etc. under the simple approach of Credit
Risk Mitigation. The Bank has in place detailed guidelines with respect to valuation and management of various collateral types. In order to obtain the credit risk mitigation benefit, the Bank uses realizable value of eligible collaterals to the extent of outstanding exposure.
Since no specific asset is available by way of security in the context of unfunded credit protection, the creditworthiness and reliability
of the provider and the validity and enforceability of that party’s obligations is of paramount importance. Therefore, unfunded credit protection is only “eligible” if it is provided by an appropriate counterparty which may include National Government, Central Bank and other reputable financial institutions etc.
43.2 Equity Position Risk in the Banking Book
The Bank makes investment for variety of purposes. Some of the investment positions of equity holding are made for revenue generation as part of strategic initiatives, while other equity holdings are held to earn capital gain and dividend to support the Bank’s business activities.
Classification of investments
Under SBP’s directives, equity investment may be classified as “Held For Trading (HFT)”, “Available for Sale (AFS)” or “Investment in Subsidiaries and Associates”. Some of the equity investments are listed and traded in public through stock exchanges, while other investments are unlisted.
Policies, valuation and accounting of equity investments
In accordance with the requirements of the SBP, quoted securities are carried at market value whereas investments in subsidiaries are accounted for in accordance with the relevant International Accounting Standard as applicable in Pakistan.
The unrealized surplus / (deficit) arising on revaluation of the Bank’s held for trading investment portfolio is taken to the profit
and loss account. The surplus / (deficit) arising on revaluation of quoted securities classified as available for sale is kept in a separate account shown in the balance sheet below equity. The surplus / (deficit) arising on these securities is taken to the profit and loss account when actually realised upon disposal.
Unquoted equity securities are valued at the lower of cost and break-up value. Subsequent increases or decreases in the carrying
value are credited / charged to profit and loss account. Break-up value of equity securities is calculated with reference to the net assets of the investee company as per the latest available audited financial statements. Investments in other unquoted securities are valued at cost less impairment losses, if any. Provision for diminution in the value of securities is made after considering impairment, if any, in their value.
Profit and loss on sale of investments is included in income currently.

144
Notes to the Unconsolidated Financial Statementsfor the year ended December 31, 2012
Composition of equity investments
Held-for- Available-for- Investment in trading sale Subsidiary
Rupees in ‘000
Equity Investments - Publicly Traded - 19,047,082 - Equity Investments - Others - 1,842,993 500,000 Total Value - 20,890,075 500,000 The cumulative realized gain arose of Rs. 1,257.543 million (2011: 695.637 million) from sale of equity securities / certificates of
mutual funds and units of open end mutual funds; however unrealized gain of Rs. 5,073.285 million (2011: 2,294.149 million) was recognized in the statement of financial position in respect of “AFS” securities.
43.2.1 Market Risk
The Bank is exposed to Foreign Exchange Rate Risk, Interest Rate Risk and Equity Price Risk. Market Risk performs risk measurement, monitoring and control functions through use of various risk procedures and models. To
give it a formal structure, all the policies and guidelines are approved by the Board and relevant management committees. The Bank appointed services of a foreign risk advisory firm for assistance in establishment of Market Risk Management Framework.
Market Risk Pertaining to the Trading Book
Trading Book
A trading book consists of positions in financial instruments held either with trading intent or in order to hedge other elements of the trading book. To be eligible for trading book, financial instruments must be held with the intent of trading and free of any restrictive covenants on their tradability. In addition, positions need to be frequently and accurately valued and the portfolio should be actively managed.
The Bank’s trading book includes securities classified as ‘Held for Trading’. These positions are actively managed by the Bank and
are exposed to all forms of market risks. Risk Pertaining to Banking Book Investment Portfolio
All investments excluding trading book are considered as part of banking book. Banking book includes: i) Available for sale securities - Strategic & Non Strategic Portfolio ii) Held to maturity securities iii) Other strategic investments Treasury investments parked in the banking book include: i) Government securities ii) Capital market investments iii) Strategic investments iv) Investments in bonds, debentures, etc Due to the diversified nature of investments in banking book, it is subject to interest rate and equity price risk. Interest Rate Risk – Banking Book
Government securities (PIBs & T-Bills), Bonds, Debentures, etc. and other money market investments are subject to interest rate risk. To capture the risk associated with these securities extensive modeling is being done with respect to duration analysis. Stress testing and scenario models are also in place to capture the sensitivity of the portfolio to adverse movement in interest rates. For prudent risk management, all money market investments are marked to market to assess changes in the market value of investments due to interest rate movements.
Equity Position Risk – Banking Book
The Bank’s portfolio of equity securities categorized under ‘Available for Sale’ and ‘Strategic Investments’ are parked in the banking book. These investments expose the Bank to equity price risk.
Stress Testing
The Bank also conducts Stress Testing of the Bank’s investment portfolio to ascertain the impact of various scenarios on the capital adequacy and sustainability of the Bank. The exercise assumes various stress conditions, with respect to Market Risk (Rise or Fall in Interest Rates, leading to interest rate risk), Equity Price Risk resulting from Stock Market movements, FX Rate Risk leading from adverse movements in exchange rates and Liquidity Risk (ability to meet short-term obligations if there is a run on

Annual Report of Allied Bank Limited for the year 2012
145
Notes to the Unconsolidated Financial Statementsfor the year ended December 31, 2012
December 31, 2012
Assets Liabilities Off-balance Net currency sheet items exposure
Rupees in ‘000 Pakistani Rupee 613,952,966 537,464,990 (10,626,746) 65,861,230 United States Dollar 17,016,159 38,604,175 6,601,389 (14,986,627) Great Britain Pound 360,136 2,938,989 2,604,233 25,380 Japanese Yen 21,035 6,267 (22,887) (8,119) Euro 536,416 1,981,270 1,459,852 14,998 Other Currencies 28,770 3,931 (15,841) 8,998 17,962,516 43,534,632 10,626,746 (14,945,370) 631,915,482 580,999,622 - 50,915,860
December 31, 2011
Assets Liabilities Off-balance Net currency sheet items exposure
Rupees in ‘000 Pakistani Rupee 499,365,414 432,368,422 (24,037,360) 42,959,632 United States Dollar 15,513,687 35,071,053 19,882,654 325,288 Great Britain Pound 278,730 2,497,583 2,238,347 19,494 Japanese Yen 14,241 627 (11,689) 1,925 Euro 512,190 2,417,154 1,933,335 28,371 Other Currencies 14,677 4,296 (5,287) 5,094 16,333,525 39,990,713 24,037,360 380,172 515,698,939 472,359,135 - 43,339,804
43.2.3 Equity Position Risk
The Board, based on the recommendations of ALCO, approves exposure limits applicable to investments in Trading and Banking Book. Equity securities are perpetual assets and are classified under either Held for Trading Portfolio or Available for Sale Portfolio.
Concentration Risk
ALCO is responsible for making investment decisions in the capital market and setting limits that are a component of the risk management framework. Portfolio, Sector and Scrip wise limits are assigned by the ALCO to guard against concentration risk and these limits are reviewed and revised periodically. The capital market desk ensures compliance of concentration limits set by ALCO. Limit monitoring is done on a daily basis. Limit breaches if any are promptly reported to ALCO with proper reason and justification.
Price Risk Trading and investing in equity securities give rise to price risk. ALCO and Treasury’s Capital Market Unit both ensure that
through prudent trading strategy and use of equity futures, the equity price risk is mitigated, albeit to a certain extent.
deposits). 43.2.2 Foreign Exchange Risk
Foreign Exchange Risk is the risk of loss arising from fluctuations of exchange rates. Our FX Risk is first controlled through substantially matched funding policy. On the mismatched exposures, the Bank utilizes appropriate derivative instruments such as Forwards and Swaps.
The majority of net foreign currency exposure is in US Dollars. The Bank is carefully monitoring the net foreign currency exposure
and the effect of exchange rate fluctuations by conducting sensitivity analysis and stress testing, as well as utilizing the currency forwards and swaps to hedge the related exposure.

146
Notes to the Unconsolidated Financial Statementsfor the year ended December 31, 201243
.2.4
M
ismat
ch o
f Int
eres
t Rat
e Sen
sitiv
e Ass
ets a
nd L
iabi
litie
s
Y
ield
/ in
tere
st ra
te se
nsiti
vity
pos
ition
for o
n-ba
lance
shee
t ins
trum
ents
is ba
sed
on th
e ear
lier o
f con
tract
ual r
e-pr
icing
or m
atur
ity d
ate a
nd fo
r off-
balan
ce sh
eet i
nstru
men
ts is
base
d on
settl
emen
t dat
e.
D
ecem
ber 3
1, 20
12
Effe
ctiv
e
Exp
osed
to Y
ield
/ Int
eres
t risk
N
ot ex
pose
d
Y
ield
/ To
tal
Up
to
Ove
r 1
Ove
r 3
Ove
r 6
Ove
r 1
Ove
r 2
Ove
r 3
Ove
r 5
Abo
ve
to Y
ield
/
In
tere
st
1 m
onth
to
3
to 6
m
onth
s to
to 2
to
3
to 5
to
10
10 ye
ars
Inte
rest
rate
m
onth
s m
onth
s 1
year
ye
ars
year
s ye
ars
year
s
Risk
Ru
pees
in ‘00
0
On
-bala
nce s
heet
finan
cial in
strum
ents
Asset
s
Ca
sh an
d bala
nces
with
treasu
ry ba
nks
0.00%
43
,351,6
53
5,70
2,231
-
-
-
-
-
-
-
-
37
,649,4
22
Ba
lances
with
othe
r ban
ks
1,02
9,286
-
-
-
-
-
-
-
-
-
1,
029,2
86
Le
nding
s to fi
nanc
ial in
stitut
ions
9.27%
10
,720,9
35
9,07
7,310
1,
643,6
25
-
-
-
-
-
-
-
-
In
vestm
ents
- net
11.63
% 26
7,403
,346
33,96
3,046
38
,858,2
71
57,23
9,999
88
,386,3
37
5,80
8,990
-
22
,005,6
76
-
-
21,14
1,027
Advan
ces -
net
12.61
% 27
1,084
,275
43,14
8,569
18
4,576
,910
27,53
6,184
3,
289,1
02
6,00
8,032
87
0,182
1,
700,8
02
1,03
9,875
-
2,
914,6
19
Ot
her a
ssets
- net
11
,111,9
06
-
-
-
-
-
-
-
-
-
11,11
1,906
604,7
01,40
1 91
,891,1
56
225,0
78,80
6 84
,776,1
83
91,67
5,439
11
,817,0
22
870,1
82
23,70
6,478
1,
039,8
75
-
73,84
6,260
Liab
ilities
Bills
paya
ble
6,
203,0
51
-
-
-
-
-
-
-
-
-
6,20
3,051
Borro
wing
s 8.6
9%
38,91
6,192
22
,269,3
22
5,31
0,921
7,
805,7
78
252,3
18
504,6
42
504,6
42
1,00
9,284
1,
009,2
84
-
250,0
01
De
posit
s and
othe
r acco
unts
5.86%
51
4,707
,055
20,44
3,368
36
,287,8
55
250,0
23,46
5 9,
139,6
58
5,39
0,952
1,
651,7
85
819,7
12
685,1
04
44,55
3,794
14
5,711
,362
Su
b-ord
inated
loan
11
.39%
5,49
0,400
-
2,
996,4
00
2,49
4,000
-
-
-
-
-
-
-
Othe
r liab
ilities
12,71
8,867
-
-
-
-
-
-
-
-
-
12
,718,8
67
57
8,035
,565
42,71
2,690
44
,595,1
76
260,3
23,24
3 9,
391,9
76
5,89
5,594
2,
156,4
27
1,82
8,996
1,
694,3
88
44,55
3,794
16
4,883
,281
On
-bala
nce s
heet
gap
26
,665,8
36
49,17
8,466
18
0,483
,630
(175
,547,0
60)
82,28
3,463
5,
921,4
28
(1,28
6,245
) 21
,877,4
82
(654
,513)
(44,5
53,79
4) (9
1,037
,021)
Off
-bala
nce s
heet
finan
cial in
strum
ents
Co
mmitm
ents
in res
pect
of for
ward
exch
ange
contr
acts -
purch
ase
35
,605,2
57
17,80
8,898
12
,574,2
88
4,65
4,141
56
7,930
-
-
-
-
-
-
Comm
itmen
ts in
respe
ct of
forwa
rd
e
xchan
ge co
ntract
s - sa
le
(9,40
0,993
) (3
,758,7
13)
(2,47
7,231
) (1
,387,0
07)
(1,77
8,042
) -
-
-
-
-
-
Off-b
alanc
e she
et ga
p
26,20
4,264
14
,050,1
85
10,09
7,057
3,
267,1
34
(1,21
0,112
) -
-
-
-
-
-
Total
yield
/ inte
rest r
isk se
nsitiv
ity ga
p
52,87
0,100
63
,228,6
51
190,5
80,68
7 (1
72,27
9,926
) 81
,073,3
51
5,92
1,428
(1
,286,2
45)
21,87
7,482
(6
54,51
3) (4
4,553
,794)
Cu
mulat
ive yi
eld / i
nteres
t risk
sens
itivity
gap
52
,870,1
00
63,22
8,651
25
3,809
,338
81,52
9,412
16
2,602
,763
168,5
24,19
1 16
7,237
,946
189,1
15,42
8 18
8,460
,915
143,9
07,12
1

Annual Report of Allied Bank Limited for the year 2012
147
Notes to the Unconsolidated Financial Statementsfor the year ended December 31, 2012
M
ismat
ch o
f Int
eres
t Rat
e Sen
sitiv
e Ass
ets a
nd L
iabi
litie
s
Y
ield
/ in
tere
st ra
te se
nsiti
vity
pos
ition
for o
n-ba
lance
shee
t ins
trum
ents
is ba
sed
on th
e ear
lier o
f con
tract
ual r
e-pr
icing
or m
atur
ity d
ate a
nd fo
r off-
balan
ce sh
eet i
nstru
men
ts is
base
d on
settl
emen
t dat
e.
Dec
embe
r 31,
2011
Effe
ctiv
e
Exp
osed
to Y
ield
/ Int
eres
t risk
N
ot ex
pose
d
Y
ield
/ To
tal
Up
to
Ove
r 1
Ove
r 3
Ove
r 6
Ove
r 1
Ove
r 2
Ove
r 3
Ove
r 5
Abo
ve
to Y
ield
/
In
tere
st
1 m
onth
to
3
to 6
m
onth
s to
to 2
to
3
to 5
to
10
10 ye
ars
Inte
rest
rate
m
onth
s m
onth
s 1
year
ye
ars
year
s ye
ars
year
s
Risk
Ru
pees
in ‘00
0
On
-bala
nce s
heet
finan
cial in
strum
ents
Asset
s
Cash
and b
alanc
es wi
th tre
asury
bank
s 0.0
% 36
,479,7
58
5,33
6,771
-
-
-
-
-
-
-
-
31
,142,9
87
Ba
lances
with
othe
r ban
ks
1,67
9,085
-
-
-
-
-
-
-
-
-
1,
679,0
85
Le
nding
s to fi
nanc
ial in
stitut
ions
11.90
% 1,
361,7
54
1,36
1,754
-
-
-
-
-
-
-
-
In
vestm
ents
- net
12.69
% 19
5,694
,122
5,27
5,729
22
,231,4
93
30,62
3,145
74
,946,0
26
6,58
1,314
2,
293,4
99
21,84
2,601
-
-
31
,900,3
15
Ad
vances
- ne
t 12
.73%
244,4
33,47
4 4
5,290
,221
149,8
04,03
2 31
,164,6
85
3,35
8,478
2,
257,9
20
955,1
99
2,35
5,192
2,
481,4
26
2,48
1,218
4,
285,1
03
Ot
her a
ssets
- net
12
,635,4
10
-
-
-
-
-
-
-
-
-
12,63
5,410
492,2
83,60
3 57
,264,4
75
172,0
35,52
5 61
,787,8
30
78,30
4,504
8,
839,2
34
3,24
8,698
24
,197,7
93
2,48
1,426
2,
481,2
18
81,64
2,900
Liab
ilities
Bills
paya
ble
4,01
5,317
-
-
-
-
-
-
-
-
-
4,
015,3
17
Bo
rrowi
ngs
9.90%
49
,993,2
00
33,78
3,850
5,
024,7
81
7,38
4,824
29
2,290
58
4,576
58
4,576
2,
338,3
03
-
-
-
De
posit
s and
othe
r acco
unts
5.81%
39
9,561
,676
60,82
8,209
41
,747,8
38
31,35
7,226
13
2,923
,626
4,64
3,369
94
8,625
1,
205,3
48
526,4
47
332,5
49
125,0
48,43
9
Sub-
ordina
ted lo
an
14.42
% 5,
492,6
00
-
2,
495,0
00
2,99
7,600
-
-
-
-
-
-
-
Othe
r liab
ilities
11,32
5,079
-
-
-
-
-
-
-
-
-
11
,325,0
79
47
0,387
,872
94,61
2,059
49
,267,6
19
41,73
9,650
13
3,215
,916
5,22
7,945
1,
533,2
01
3,54
3,651
52
6,447
33
2,549
14
0,388
,835
On
-bala
nce s
heet
gap
21
,895,7
31
(37,3
47,58
4) 12
2,767
,906
20,04
8,180
(5
4,911
,412)
3,61
1,289
1,
715,4
97
20,65
4,142
1,
954,9
79
2,14
8,669
(5
8,745
,935)
Off
-bala
nce s
heet
finan
cial in
strum
ents
Co
mmitm
ents
in res
pect
of for
ward
exc
hang
e con
tracts
- pu
rchase
49,58
0,812
17
,456,5
77
20,42
2,754
11
,686,9
10
14,57
1 -
-
-
-
-
Comm
itmen
ts in
respe
ct of
forwa
rd
excha
nge c
ontra
cts -
sale
(2
5,543
,453)
(9,69
6,506
) (1
1,705
,161)
(4,14
1,786
) -
-
-
-
-
-
(5
1,086
,906)
Off
-bala
nce s
heet
gap
24
,037,3
59
7,76
0,071
8,
717,5
93
7,54
5,124
14
,571
-
-
-
-
-
(51,0
86,90
6)
Total
yield
/ inte
rest r
isk se
nsitiv
ity ga
p
45,93
3,091
(2
9,587
,513)
131,4
85,49
9 27
,593,3
04
(54,8
96,84
1) 3,
611,2
89
1,71
5,497
20
,654,1
42
1,95
4,979
2,
148,6
69
Cu
mulat
ive yi
eld / i
nteres
t risk
sens
itivity
gap
45
,933,0
91
(29,5
87,51
3) 10
1,897
,986
129,4
91,29
0 74
,594,4
49
78,20
5,738
79
,921,2
35
100,5
75,37
7 10
2,530
,356
104,6
79,02
5
Yield
risk
is the
risk
of de
cline
in ea
rning
s due
to ad
verse
movem
ent o
f the
yield
curve
.
Inter
est ra
te ris
k is t
he ri
sk tha
t the
value
of th
e fina
ncial
instr
umen
t will
fluctu
ate du
e to c
hang
es in
the m
arket
intere
st rat
es.
43.2
.4.1
R
econ
cilia
tion
of A
sset
s and
Lia
bilit
ies e
xpos
ed to
Yie
ld/I
nter
est R
ate R
isk w
ith T
otal
Ass
ets a
nd L
iabi
litie
s
Dec
embe
r 31,
Dec
embe
r 31,
D
ecem
ber 3
1, D
ecem
ber 3
1,
Rec
oncil
iatio
n to
tota
l ass
ets
2012
20
11
Rec
oncil
iatio
n to
tota
l lia
bilit
ies
2012
20
11
(Rup
ees i
n ‘0
00)
(Rup
ees i
n ‘0
00)
Ba
lance
as p
er S
tate
men
t of F
inan
cial P
ositi
on
631,
915,
482
51
5,69
8,93
9
Balan
ce as
per
Stat
emen
t of F
inan
cial P
ositi
on
580,
999,
622
4
72,3
59,1
35
Le
ss: N
on fi
nanc
ial a
sset
s
Le
ss: N
on fi
nanc
ial l
iabi
litie
s
Ope
ratin
g fix
ed as
sets
1
9,87
1,17
3
18,
087,
011
Def
erre
d ta
x as
set
-
751
,908
D
efer
red
tax
liabi
lity
6
4,58
4
-
O
ther
asse
ts
7,3
42,9
08
4,5
76,4
17
Oth
er li
abili
ties
2,8
99,4
73
1,9
71,2
63
27,2
14,0
81
23,
415,
336
2,9
64,0
57
1,9
71,2
63
T
otal
finan
cial a
sset
s 60
4,70
1,40
1
492
,283
,603
T
otal
finan
cial l
iabi
litie
s 57
8,03
5,56
5
470,
387,
872

148
Notes to the Unconsolidated Financial Statementsfor the year ended December 31, 2012
43.3
.1
Mat
uriti
es o
f Ass
ets a
nd L
iabi
litie
s - B
ased
on
cont
ract
ual m
atur
ity o
f the
asse
ts an
d lia
bilit
ies o
f the
Ban
k
D
ecem
ber 3
1, 20
12
To
tal
Up
to 1
O
ver 1
O
ver 3
O
ver 6
O
ver 1
O
ver 2
O
ver 3
O
ver 5
A
bove
m
onth
to
3
to 6
m
onth
s to
to
2
to 3
to
5
to 1
0
10 ye
ars
m
onth
s m
onth
s 1
year
ye
ars
year
s ye
ars
year
s
Ru
pees
in ‘00
0
As
sets
C
ash
and
balan
ces w
ith tr
easu
ry b
anks
4
3,35
1,65
3
43,
351,
653
-
-
-
-
-
-
-
-
Ba
lance
s with
oth
er b
anks
1
,029
,286
1
,029
,286
-
-
-
-
-
-
-
-
Lend
ings
to fi
nanc
ial i
nstit
utio
ns
10,
720,
935
9
,077
,310
1
,643
,625
-
-
-
-
-
-
-
Inve
stmen
ts - n
et
267,
403,
346
31
,070
,929
35
,033
,215
5
5,84
1,40
9
103
,752
,703
3
,191
,077
6
96,2
76
26,
671,
428
1
1,14
6,30
9
-
A
dvan
ces -
net
27
1,08
4,27
5 69
,459
,294
2
6,16
4,86
8
34,
418,
731
3
4,40
1,10
4
20,
651,
977
1
8,90
2,18
5
29,
549,
650
3
3,40
0,07
2
4,1
36,3
94
O
pera
ting
fixed
asse
ts 1
9,87
1,17
3
212
,590
4
25,1
76
637
,764
1
,275
,528
1
,729
,100
7
45,0
31
961
,341
1
,074
,574
1
2,81
0,06
9
Def
erre
d ta
x as
sets
-
- -
- -
- -
- -
-
Oth
er as
sets
- net
1
8,45
4,81
4
2,3
69,4
63
4,1
85,8
28
7,7
90,3
57
1,1
44,8
19
1,1
56,2
67
-
-
-
1,8
08,0
80
631,
915,
482
156,
570,
525
67,4
52,7
12
98,
688,
261
1
40,5
74,1
54
26,
728,
421
2
0,34
3,49
2
57,
182,
419
4
5,62
0,95
5
18,
754,
543
Li
abili
ties
Bi
lls p
ayab
le 6
,203
,051
6
,203
,051
-
-
-
-
-
-
-
-
Borro
wing
s 3
8,91
6,19
2
22,
519,
323
5
,310
,921
7
,805
,778
2
52,3
18
504
,642
5
04,6
42
1,0
09,2
84
1,0
09,2
84
-
D
epos
its an
d ot
her a
ccou
nts
514,
707,
055
376,
900,
501
36,
287,
854
3
9,27
7,69
2
9,1
39,6
59
5,3
90,9
52
1,6
51,7
85
819
,713
6
85,1
04
44,
553,
795
D
efer
red
tax
liabi
litie
s 64
,584
15
,320
3
2,01
0
48,
015
(2
28,4
37)
(113
,231
) (2
61,4
92)
(106
,471
) 5
48,0
19
130
,851
Sub-
ordi
nate
d lo
an
5,4
90,4
00
-
600
6
23,5
00
1,2
48,8
00
624
,700
1
,200
2
,991
,600
-
-
Oth
er li
abili
ties
15,
618,
340
4
,961
,871
6
,570
,479
3
30,2
97
634
,248
3
78,9
38
451
,811
7
17,8
00
1,5
72,8
96
-
580,
999,
622
41
0,60
0,06
6 48
,201
,864
4
8,08
5,28
2
11,
046,
588
6
,786
,001
2
,347
,946
5
,431
,926
3
,815
,303
4
4,68
4,64
6
Net
asse
ts / (
liabi
litie
s) 50
,915
,860
(2
54,0
29,5
41)
19,
250,
848
5
0,60
2,97
9
129
,527
,566
1
9,94
2,42
0
17,
995,
546
5
1,75
0,49
3
41,
805,
652
(2
5,93
0,10
3)
Shar
e cap
ital
9,4
63,4
21
R
eser
ves
10,
906,
250
Una
ppro
pria
ted
profi
t 22
,558
,411
42,9
28,0
82
Surp
lus o
n re
valu
atio
n of
asse
ts `
-
net o
f tax
7,
987,
778
50,9
15,8
60
43.3
Li
quid
ity R
isk
Liqu
idity
risk
is th
e risk
that
the B
ank
is un
able
to fu
nd it
s cur
rent
obl
igat
ions
and
oper
atio
ns in
the m
ost c
ost e
fficie
nt m
anne
r. A
LCO
is th
e for
um to
ove
rsee
liqu
idity
man
agem
ent.
The o
vera
ll Ba
nk’s
prin
ciple
is th
at th
e ALC
O h
as th
e res
pons
ibili
ty fo
r ens
urin
g th
at B
ank’s
pol
icy
for l
iqui
dity
man
agem
ent i
s adh
ered
to o
n a c
ontin
ual b
asis.
Oth
er th
an cu
stom
er’s
depo
sits,
the
Bank
’s fu
ndin
g so
urce
is th
e in
ter-
bank
mon
ey m
arke
t. C
hang
e in
the g
over
nmen
t mon
etar
y po
licy
and
mar
ket e
xpec
tatio
ns o
f int
eres
t rat
e are
all
impo
rtant
fact
ors t
hat c
an ad
vers
ely
affec
t our
key
fund
ing
sour
ce. E
fficie
nt a
nd
accu
rate
plan
ning
play
s a cr
itica
l rol
e in
liqui
dity
man
agem
ent.
Our
MIS
pro
vide
s inf
orm
atio
n on
expe
cted
cash
inflo
ws/o
ut fl
ows w
hich
allo
w th
e Ban
k to
take
tim
ely
decis
ions
bas
ed o
n th
e fut
ure r
equi
rem
ents.
Gap
anal
ysis,
stre
ss te
sting
and
scen
ario
anal
ysis
is do
ne o
n pe
riodi
c bas
is to
capt
ure a
ny ad
vers
e effe
ct o
f mar
ket m
ovem
ents
on li
quid
ity p
ositi
on. B
ased
on
the r
esul
ts pr
oduc
ed, A
LCO
dev
ise th
e liq
uidi
ty m
anag
emen
t stra
tegy
to m
aint
ain
suffi
cient
liqu
idity
to d
eal
with
any
relat
ed ca
tastr
ophe
.

Annual Report of Allied Bank Limited for the year 2012
149
M
atur
ities
of A
sset
s and
Lia
bilit
ies -
Bas
ed o
n co
ntra
ctua
l mat
urity
of t
he as
sets
and
liabi
litie
s of t
he B
ank
D
ecem
ber 3
1, 20
11
To
tal
Up
to 1
O
ver 1
O
ver 3
O
ver 6
O
ver 1
O
ver 2
O
ver 3
O
ver 5
A
bove
m
onth
to
3
to 6
m
onth
s to
to
2
to 3
to
5
to 1
0
10 ye
ars
m
onth
s m
onth
s 1
year
ye
ars
year
s ye
ars
year
s
Ru
pees
in ‘00
0
As
sets
C
ash
and
balan
ces w
ith tr
easu
ry b
anks
3
6,47
9,75
8
36,
479,
758
-
-
-
-
-
-
-
-
Ba
lance
s with
oth
er b
anks
1
,679
,085
1
,679
,085
-
-
-
-
-
-
-
-
Le
ndin
gs to
fina
ncia
l ins
titut
ions
1
,361
,754
1
,361
,754
-
-
-
-
-
-
-
-
In
vestm
ents
1
95,6
94,1
22
2,8
83,9
55
17,
311,
551
3
0,09
3,33
9
104
,627
,821
3
,216
,722
3
,985
,029
2
5,24
6,16
9
8,3
29,5
36
-
A
dvan
ces
244
,433
,474
1
16,6
51,0
69
14,
252,
677
2
2,61
8,66
7
8,2
71,8
08
12,
131,
151
1
1,68
2,84
5
15,
815,
551
3
9,27
8,39
5
3,7
31,3
11
O
pera
ting
fixed
asse
ts 1
8,08
7,01
1
145
,304
2
90,6
08
435
,912
8
71,8
24
911
,343
4
74,4
66
446
,137
6
91,8
89
13,
819,
528
D
efer
red
tax
asse
ts
751
,908
(8
,958
) (5
4,28
7)
(42,
502)
1
31,1
50
758
,338
4
15,7
27
(5,5
19)
(442
,041
) -
O
ther
asse
ts
17,
211,
827
9
,187
,024
2
,579
,214
2
,106
,018
2
30,5
60
(549
,296
) -
4
0,57
0
2,0
55,4
05
1,5
62,3
32
515
,698
,939
16
8,37
8,99
1
34,
379,
763
5
5,21
1,43
4
114
,133
,163
1
6,46
8,25
8
16,
558,
067
4
1,54
2,90
8
49,
913,
184
1
9,11
3,17
1
Li
abili
ties
Bi
lls p
ayab
le 4
,015
,317
4
,015
,317
-
-
-
-
-
-
-
-
Bo
rrowi
ngs
49,
993,
200
3
3,78
3,85
1
5,0
24,7
81
7,3
84,8
23
292
,288
5
84,5
76
584
,576
2
,338
,305
-
-
D
epos
its an
d ot
her a
ccou
nts
399
,561
,676
3
03,3
85,7
31
37,
540,
947
3
0,36
0,88
9
20,
617,
771
4
,643
,369
9
48,6
25
1,2
05,3
48
526
,447
3
32,5
49
D
efer
red
tax
liabi
litie
s -
-
-
-
-
-
-
-
-
-
Su
b-or
dina
ted
loan
5
,492
,600
-
600
5
00
1,1
00
1,2
48,2
00
1,2
48,2
00
3,6
00
2,9
90,4
00
-
O
ther
liab
ilitie
s 1
3,29
6,34
2
3,6
91,7
16
5,6
38,2
40
345
,732
6
79,8
12
355
,025
4
19,1
71
674
,777
1
,491
,869
-
472,
359,
135
3
44,8
76,6
15
48,
204,
568
3
8,09
1,94
4
21,
590,
971
6
,831
,170
3
,200
,572
4
,222
,030
5
,008
,716
3
32,5
49
N
et as
sets
/ (lia
bilit
ies)
43,
339,
804
(
176,
497,
624)
(1
3,82
4,80
5)
17,
119,
490
9
2,54
2,19
2
9,6
37,0
88
13,
357,
495
3
7,32
0,87
8
44,
904,
468
1
8,78
0,62
2
Sh
are c
apita
l 8
,603
,110
R
eser
ves
8,7
62,7
45
U
napp
ropr
iate
d pr
ofit
20,
254,
503
37,
620,
358
Su
rplu
s on
reva
luat
ion
of as
sets
-
net o
f tax
5
,719
,446
43,
339,
804
43.3
.1.1
W
hen
an as
set o
r lia
bilit
y do
es n
ot h
ave a
ny co
ntra
ctua
l mat
urity
dat
e, th
e per
iod
in w
hich
thes
e are
assu
med
to m
atur
e has
bee
n ta
ken
as th
e exp
ecte
d da
te o
f m
atur
ity.
Notes to the Unconsolidated Financial Statementsfor the year ended December 31, 2012

150
Notes to the Unconsolidated Financial Statementsfor the year ended December 31, 201243
.4
Mat
uriti
es o
f Ass
ets a
nd L
iabi
litie
s - B
ased
on
the w
orki
ng p
repa
red
by th
e Ass
et an
d Li
abili
ties M
anag
emen
t Com
mitt
ee (A
LCO
) of t
he B
ank
E
xpec
ted
mat
uriti
es o
f non
-con
tract
ual a
sset
s and
liab
ilitie
s has
bee
n co
mpu
ted
usin
g vo
latili
ty ap
proa
ch. U
nder
this
appr
oach
max
imum
volat
ility
of n
on co
ntra
ctua
l ass
ets a
nd li
abili
ties i
s calc
ulat
ed o
ver a
per
iod
and
class
ified
into
core
and
non-
core
porti
on.
D
ecem
ber 3
1, 20
12
To
tal
Up
to 1
O
ver 1
O
ver 3
O
ver 6
O
ver 1
O
ver 2
O
ver 3
O
ver 5
A
bove
m
onth
to
3
to 6
m
onth
s to
to
2
to 3
to
5
to 1
0
10 ye
ars
m
onth
s m
onth
s 1
year
ye
ars
year
s ye
ars
year
s
Ru
pees
in ‘00
0
A
sset
s
Cas
h an
d ba
lance
s with
trea
sury
ban
ks
43,
351,
653
3
4,85
2,61
3
197
,835
2
3,33
5
-
2,7
59,2
90
2,7
59,2
90
2,7
59,2
90
-
-
Ba
lance
s with
oth
er b
anks
1
,029
,286
1
,029
,286
-
-
-
-
-
-
-
-
Lend
ings
to fi
nanc
ial i
nstit
utio
ns
10,
720,
935
9
,077
,310
1
,643
,625
-
-
-
-
-
-
-
Inve
stmen
ts - n
et
267,
403,
346
31,0
70,9
29
35,
033,
215
5
5,84
1,40
9
103
,752
,703
3
,191
,077
6
96,2
76
26,
671,
428
1
1,14
6,30
9
-
A
dvan
ces -
net
27
1,08
4,27
5 43
,077
,198
2
6,16
6,14
3
34,
419,
485
3
4,40
1,95
2
29,
445,
500
2
7,69
5,14
3
38,
342,
388
3
3,40
0,07
2
4,1
36,3
94
O
pera
ting
fixed
asse
ts 1
9,87
1,17
3
212
,590
4
25,1
76
637
,764
1
,275
,528
1
,729
,100
7
45,0
31
961
,341
1
,074
,574
1
2,81
0,06
9
Def
erre
d ta
x as
sets
-
-
-
-
-
-
-
-
-
-
O
ther
asse
ts - n
et
18,
454,
814
2
,369
,463
4
,185
,828
7
,790
,357
1
,144
,819
1
,156
,267
-
-
-
1
,808
,080
63
1,91
5,48
2 12
1,68
9,38
9 6
7,65
1,82
2
98,
712,
350
1
40,5
75,0
02
38,
281,
234
3
1,89
5,74
0
68,
734,
447
4
5,62
0,95
5
18,
754,
543
Li
abili
ties
Bi
lls p
ayab
le 6
,203
,051
4
,177
,269
1
71,0
28
315
,118
-
5
13,2
12
513
,212
5
13,2
12
-
-
Bo
rrowi
ngs
38,
916,
192
2
2,51
9,32
3
5,3
10,9
21
7,8
05,7
78
252
,318
5
04,6
42
504
,642
1
,009
,284
1
,009
,284
-
Dep
osits
and
othe
r acc
ount
s 51
4,70
7,05
5 65
,717
,848
8
1,56
2,33
4
83,
595,
721
5
3,45
7,68
8
27,
549,
966
2
3,81
0,79
9
30,
365,
065
5
9,77
5,81
0
88,
871,
824
D
efer
red
tax
liabi
litie
s 64
,584
15
,320
3
2,01
0
48,
015
(2
28,4
37)
(113
,231
) (2
61,4
92)
(106
,471
) 5
48,0
19
130
,851
Sub-
ordi
nate
d lo
an
5,4
90,4
00
-
600
6
23,5
00
1,2
48,8
00
624
,700
1
,200
2
,991
,600
-
-
Oth
er li
abili
ties
15,
618,
340
4
,961
,871
6
,570
,479
3
30,2
97
634
,248
3
78,9
38
451
,811
7
17,8
00
1,5
72,8
96
-
580,
999,
622
97,3
91,6
31
93,
647,
372
9
2,71
8,42
9
55,
364,
617
2
9,45
8,22
7
25,
020,
172
3
5,49
0,49
0
62,
906,
009
8
9,00
2,67
5
Net
asse
ts 50
,915
,860
24
,297
,758
(2
5,99
5,55
0)
5,9
93,9
21
85,
210,
385
8
,823
,007
6
,875
,568
3
3,24
3,95
7
(17,
285,
054)
(7
0,24
8,13
2)
Shar
e cap
ital
9,4
63,4
21
R
eser
ves
10,
906,
250
Una
ppro
pria
ted
profi
t 22
,558
,411
42,9
28,0
82
Surp
lus o
n re
valu
atio
n of
asse
ts
- ne
t of t
ax
7,9
87,7
78
50,9
15,8
60

Annual Report of Allied Bank Limited for the year 2012
151
Notes to the Unconsolidated Financial Statementsfor the year ended December 31, 2012
43.
4.1
Mat
uriti
es o
f Ass
ets a
nd L
iabi
litie
s - B
ased
on
the w
orki
ng p
repa
red
by th
e Ass
et an
d Li
abili
ties M
anag
emen
t Com
mitt
ee (A
LCO
) of t
he B
ank
E
xpec
ted
mat
uriti
es o
f non
-con
tract
ual a
sset
s and
liab
ilitie
s has
bee
n co
mpu
ted
usin
g vo
latili
ty ap
proa
ch. U
nder
this
appr
oach
max
imum
volat
ility
of n
on co
ntra
ctua
l ass
ets a
nd li
abili
ties i
s calc
ulat
ed o
ver a
per
iod
and
class
ified
into
core
and
non-
core
porti
on.
D
ecem
ber 3
1, 20
11
To
tal
Up
to 1
O
ver 1
O
ver 3
O
ver 6
O
ver 1
O
ver 2
O
ver 3
O
ver 5
A
bove
m
onth
to
3
to 6
m
onth
s to
to
2
to 3
to
5
to 1
0
10 ye
ars
m
onth
s m
onth
s 1
year
ye
ars
year
s ye
ars
year
s
Ru
pees
in ‘00
0
Ass
ets
C
ash
and
balan
ces w
ith tr
easu
ry b
anks
3
6,47
9,75
8
26,
081,
460
7
23,1
87
21,
840
-
3
,217
,757
3
,217
,757
3
,217
,757
-
-
Ba
lance
s with
oth
er b
anks
1
,679
,085
1
,478
,380
3
1,06
7
6,2
76
-
54,
454
5
4,45
4
54,
454
-
-
Le
ndin
gs to
fina
ncia
l ins
titut
ions
1
,361
,754
1
,361
,754
-
-
-
-
-
-
-
-
In
vestm
ents
- net
1
95,6
94,1
22
2,8
83,9
54
17,
311,
551
3
0,09
3,33
9
104
,627
,821
3
,216
,722
3
,985
,029
2
5,24
6,16
9
8,3
29,5
37
-
A
dvan
ces -
net
2
44,4
33,4
74
39,
946,
245
2
3,06
0,89
6
32,
934,
717
2
7,92
5,40
3
24,
761,
334
2
4,31
3,02
8
28,
457,
871
3
9,30
2,67
2
3,7
31,3
08
O
pera
ting
fixed
asse
ts 1
8,08
7,01
1
145
,304
2
90,6
09
435
,913
8
71,8
26
911
,343
4
74,4
66
446
,133
6
91,8
89
13,
819,
528
D
efer
red
tax
asse
ts
751
,908
(8
,958
) (5
4,28
7)
(42,
502)
13
1,15
0
758
,338
415
,727
(5
,519
) (4
42,0
41)
-
O
ther
asse
ts - n
et
17,
211,
827
9
,187
,024
2
,579
,214
2
,106
,018
2
30,5
60
(549
,296
) -
4
0,57
0
2,0
55,4
05
1,5
62,3
32
515
,698
,939
8
1,07
5,16
3
43,
942,
237
6
5,55
5,60
1
133
,786
,760
3
2,37
0,65
2
32,
460,
461
5
7,45
7,43
5
49,
937,
462
1
9,11
3,16
8
Li
abili
ties
Bi
lls p
ayab
le 4
,015
,317
4
,015
,317
-
-
-
-
-
-
-
-
Bo
rrowi
ngs
49,
993,
200
3
3,78
3,85
1
5,0
24,7
81
7,3
84,8
23
292
,288
5
84,5
76
584
,576
2
,338
,305
-
-
D
epos
its an
d ot
her a
ccou
nts
399
,561
,676
5
0,82
2,43
1
74,
477,
614
6
6,29
8,66
1
56,
555,
543
2
2,61
2,25
5
18,
917,
511
2
5,16
3,86
3
48,
443,
477
3
6,27
0,32
1
D
efer
red
tax
liabi
litie
s -
-
-
-
-
-
-
-
-
-
Su
b-or
dina
ted
loan
5
,492
,600
-
6
00
500
1
,100
1
,248
,200
1
,248
,200
3
,600
2
,990
,400
-
O
ther
liab
ilitie
s 1
3,29
6,34
2
3,6
91,7
16
5,6
38,2
40
345
,732
6
79,8
13
355
,025
4
19,1
71
674
,775
1
,491
,870
-
472
,359
,135
9
2,31
3,31
5
85,
141,
235
7
4,02
9,71
6
57,
528,
744
2
4,80
0,05
6
21,
169,
458
2
8,18
0,54
3
52,
925,
747
3
6,27
0,32
1
N
et as
sets
43,
339,
804
(1
1,23
8,15
2)
(41,
198,
998)
(8
,474
,115
) 7
6,25
8,01
6
7,5
70,5
96
11,
291,
003
2
9,27
6,89
2
(2,9
88,2
85)
(17,
157,
153)
Sh
are c
apita
l 8
,603
,110
R
eser
ves
8,7
62,7
45
U
napp
ropr
iate
d pr
ofit
20,
254,
503
37,
620,
358
Su
rplu
s on
reva
luat
ion
of as
sets
-
net o
f tax
5
,719
,446
43,
339,
804

152
Notes to the Unconsolidated Financial Statementsfor the year ended December 31, 2012
43.5 Operational Risk
The Bank, like all financial institutions, is exposed to many types of operational risks, including the potential losses arising from internal activities or external events caused by breakdowns in information, communication, physical safeguards, business continuity, supervision, transaction processing, settlement systems and procedures and the execution of legal, fiduciary and agency responsibilities.
The Bank has in place a BOD approved Operational Risk Framework. Various policies and procedures with respect to this
framework are currently being implemented across the Bank. The Bank maintains a system of internal controls designed to keep operational risk at appropriate levels, in view of the bank’s
financial strength and the characteristics of the activities and market in which it operates. These internal controls are periodically updated to conform to industry best practice.
The Bank has also developed a Business Continuity Plan applicable to all its functional areas, with assistance of a consultant. The Bank is currently in the process of implementing internationally accepted Internal Control-Integrated Framework published
by the Committee of Sponsoring Organizations of the Tread way Commission (COSO), with a view to consolidate and enhance the existing internal control processes.
During 2012, the Bank Achieved permission from SBP to initiate Parallel Run for Alternate Standardized Approach (ASA) for
Basel II –Operational Risk Capital Charge Reporting, which signifies readiness of the Bank to move to advance approach. 44. NON ADJUSTING EVENT AFTER THE REPORTING DATE
The Board of Directors of the Bank in its meeting held on February 14, 2013 has proposed a cash dividend in respect of 2012 of Rs. 2 per share (2011: cash dividend Rs. 2.5 per share). In addition, the directors have also announced a bonus issue of 10% (2011: 10%). These appropriations will be approved in the forthcoming Annual General Meeting. The unconsolidated financial statements of the Bank for the year ended December 31, 2012 do not include the effect of these appropriations which will be accounted for in the unconsolidated financial statements for the year ending December 31, 2013.
45. GENERAL
45.1 These accounts have been prepared in accordance with the revised forms of annual financial statements of the banks issued by the State Bank of Pakistan through its BSD Circular No. 04 dated February 17, 2006.
45.2 Corresponding figures have been re-arranged and re-classified to reflect more appropriate presentation of events and transactions
for the purpose of comparison. 46. DATE OF AUTHORIZATION FOR ISSUE
These financial statements were authorized for issue on February 14, 2013 by the Board of Directors of the Bank.
Chief Financial Officer President and Chief Executive Director
Director Chairman

Annual Report of Allied Bank Limited for the year 2012
153
ANNEXURE I
STAT
EMEN
T S
HO
WIN
G W
RIT
TEN
OFF
LO
AN
S O
R A
NY
OT
HER
FIN
AN
CIA
L RE
LIEF
OF
FIV
E H
UN
DRE
D T
HO
USA
ND
OR
ABO
VE
FRO
M (0
1 JA
NU
ARY
201
2 T
O 3
1 D
EC
EMBE
R, 2
012)
Sr
. N
ame A
nd A
ddre
ss O
f The B
orro
wer
Nam
e Of I
ndiv
idua
ls/Pa
rtner
s/D
irect
ors
Out
stand
ing
Liab
ilitie
s at t
he B
egin
ning
of t
he Y
ear
Oth
er
N
o.
Inte
rest
/ Fi
nanc
ial
Tota
l
Inte
rest
/
Pr
incip
al M
ark
- up
Reli
ef
N
ame o
f Dire
ctor
s N
IC N
os.
Fath
er’s /
Hus
band
’s Nam
e Pr
incip
al M
ark
- up
Oth
er
Tota
l W
ritte
n - o
ff W
ritte
n - o
ff Pr
ovid
ed
9+10
+11
1 2
3
4 5
6 7
8 9
10
11
12
1
Ram
esh
Kum
ar
Ba
rani
Roa
d, T
ando
Ada
m
Ram
esh
Kum
ar
4420
6-38
3731
5-3
Lekh
u M
al 0.
569
0.16
4 0.
231
0.96
4 0.
200
- 0.
395
0.59
5
2
Japa
n Po
wer G
ener
atio
n Lt
d.,
Jia B
agga
, Off
Rai
wind
Roa
d, L
ahor
e Ja
hang
ir Sh
ah
4230
1-43
6420
9
- 63
5.57
0 11
6.94
7 91
.023
84
3.54
0 63
5.57
0 -
207.
970
843.
540
K
han
A. S
aleem
61
1011
9722
751
3
Mak
ma S
teel
Cra
fts,
Man
zoor
Ali
Kha
n 26
6-54
-075
801
Sham
sher
Ali
104.
408
18.4
35
54.0
35
176.
878
104.
408
- 72
.470
17
6.87
8
21
5, La
nda B
azar
, Lah
ore
Gha
zarfa
r Ali
4
Alli
ed M
ultip
le In
dustr
ies L
td.,
Fahm
eeda
N
/A
Late
Abd
ul M
ajeed
97
.043
3.
640
76.5
54
177.
237
97.0
43
- 80
.194
17
7.23
7
13
7, La
xim
anda
s Stre
et, O
pp. G
ordh
anda
s
M
arke
t, O
ff: M
.A. J
inna
h R
oad,
Kar
achi
5
Irfa
n Se
amles
s Pip
e Ind
.(Pvt
) Ltd
.,
Seth
Nisa
r Ahm
ed
3520
2-27
9270
9-9
Muh
amm
ad L
atif
73.7
09
9.77
9 76
.770
16
0.25
8 73
.709
-
86.5
49
160.
258
338-
G.T
. Roa
d, S
alam
at P
ura,
Laho
re
Mst.
Nai
la N
isar
2620
2-26
3485
3-0
Seth
Nisa
r Ahm
ed
Haji
Moh
amm
ad Iq
bal
3520
2-25
5707
3-5
Muh
amm
ad L
atif
M
st. M
usar
rat I
qbal
267-
54-4
1538
0 H
aji M
oham
mad
Iqba
l
6 M
ian
Text
ile In
dustr
ies L
td.,
M
ian
Moa
hmm
ad Ja
hang
ir 35
202-
8650
281-
1 C
h. D
in M
uham
mad
15
.060
0.
568
0.55
1 16
.179
5.
180
- 1.
119
6.29
9
29
-B/7
, Mod
el To
wn, L
ahor
e M
ian
Khu
rshi
d 35
202-
5249
783-
5 M
ian M
uham
mad J
ehan
gir
Mia
n W
ahee
d A
hmed
35
202-
2771
296-
7
Mia
n M
uham
mad
Naw
az
3520
2-29
8700
1-1
M
ian
Waq
ar A
hmed
35
202-
3351
966-
9
Mia
n K
hurra
m Ja
hang
ir 35
202-
2887
796-
1
Nar
gis J
ahan
gir
3520
2-31
8667
5-6
7
Am
jad N
asim
Spi
nnin
g M
ills (
Pvt)
Ltd.
, Q
amar
zam
an
3520
1-14
7173
9-5
Ghu
lam M
usta
fa
0.50
0 1.
776
1.54
3 3.
819
0.50
0 -
3.31
9 3.
819
S-6,
7,8,
Ijaz C
entre
, Mai
n Bo
ulev
ard,
M
uzam
il M
usta
fa
- D
o -
Gul
berg
III,
Laho
re
Shah
zad
Mus
tafa
- Do
-
Ran
a Nad
eem
Mus
tafa
- Do
-
8
Bita
Tex
tile M
ills (
Pvt)
Ltd.
, Ar
shad
Zah
eeru
ddin
Kha
n 42
201-
2687
048-
1 Z
ahee
rudd
in K
han
Suit
No.
40-4
1, A
bid
Cha
mbe
rs,
Asa
d Z
ahee
rudd
in K
han
4220
1-08
6751
8-9
- Do
-
Sh
ahra
h-e-
Liaq
uat,
New
Cha
lli, K
arac
hi
Sum
air Z
ahee
rudd
in K
han
4220
1-45
5232
4-9
- Do
-
Zah
eeru
ddin
Kha
n 42
201-
4541
779-
9 A
bdul
Wah
ab K
han
178.
052
7.39
4 17
.532
20
2.97
8 53
.976
-
24.9
26
78.9
02
9
Faiz
Muh
amm
ad
R
-453
, Sec
tor 1
1-I,
Nor
th K
arac
hi
Faiz
Muh
amm
ad
4210
1-72
5738
2-5
Fayy
az M
uham
med
0.
797
0.15
5 0.
154
1.10
6 0.
447
- 0.
309
0.75
6
10
D
ewan
Fer
tiliz
er A
genc
y K
akoo
Mal
435-
34-0
1212
5 H
asoo
Mal
1.19
8 0.
000
0.38
7 1.
585
0.38
9 -
0.38
7 0.
776
Shah
Baz
ar, K
azi A
hmed
Am
ount
in M
illio
n

154
ANNEXURE IST
ATEM
ENT
SH
OW
ING
WRI
TT
EN O
FF L
OA
NS
OR
AN
Y O
TH
ER F
INA
NC
IAL
RELI
EFO
F FI
VE
HU
ND
RED
TH
OU
SAN
D O
R A
BOV
E F
ROM
(01
JAN
UA
RY 2
012
TO
31
DE
CEM
BER
, 201
2)
Sr
. N
ame A
nd A
ddre
ss O
f The B
orro
wer
Nam
e Of I
ndiv
idua
ls/Pa
rtner
s/D
irect
ors
Out
stand
ing
Liab
ilitie
s at t
he B
egin
ning
of t
he Y
ear
Oth
er
N
o.
Inte
rest
/ Fi
nanc
ial
Tota
l
Inte
rest
/
Pr
incip
al M
ark
- up
Reli
ef
N
ame o
f Dire
ctor
s N
IC N
os.
Fath
er’s /
Hus
band
’s Nam
e Pr
incip
al M
ark
- up
Oth
er
Tota
l W
ritte
n-off
W
ritte
n-off
Pr
ovid
ed
9+10
+11
1 2
3
4 5
6 7
8 9
10
11
12
11
K
irori
Mal
Kiro
ri M
al 45
502-
6467
571-
7 H
olo
Mal
0.78
5 0.
304
0.13
8 1.
227
0.28
5 -
0.44
2 0.
727
367/
2, Th
atha
r Old
Fish
Mar
ket,
Roh
ri
12
Q
uice
Foo
d In
d. L
td.,
Akh
tar R
ashe
ed
4220
1-37
4144
4-3
Muh
amm
ad A
shfa
q 4
3.00
2
22.
106
26
.566
91
.674
30
.002
-
48.6
72
78.6
74
W
S7, M
adin
a Pala
ce, M
ezza
nine
Flo
or,
Muh
amm
ad A
faq
Sham
si 42
201-
7762
602-
3 - D
o -
Fara
n C
o-op
erat
ive S
ocie
ty, D
hora
ji
Muh
amm
ad F
aroo
q 42
201-
8514
664-
7 - D
o -
Col
ony,
Kar
achi
” M
uham
mad
Ahm
ed
4220
1-50
0638
4-5
- Do
-
Farz
ana A
khta
r 42
201-
6901
726-
4 A
khta
r Ras
heed
A
mna
Kha
toon
42
201-
0207
321-
0 M
uham
mad
Afaq
Sha
msi
13
R
ehm
an T
radi
ng,
Kha
lid M
unaw
ar
502-
90-0
9844
4 M
unaw
ar A
li 1.
442
0.00
0 3.
350
4.79
2 1.
442
- 3.
350
4.79
2
3/
G, B
lock
-8, K
DA
Sch
eme N
o.5,
Keh
kash
an, C
lifto
n, K
arac
hi
14
C
rysta
l Spi
nnin
g M
ills (
Pvt)
Ltd.
A
mjad
Taj
Kha
n 35
201-
5400
467-
3 Ta
j Muh
amm
ad K
han
0.50
0 2.
545
2.71
2 5.
757
0.50
0 -
5.25
7 5.
757
H.N
O.2
03, S
t. N
o.10
, Zul
fiqar
Lan
e,
Azh
ar T
aj K
han
Cav
alary
Gro
und
(Ext
), La
hore
Can
tt.
Asd
Taj
Kha
n
15
A
dnan
Mali
k A
dnan
Mali
k 26
9-89
-040
5723
N
oor M
uham
mad
0.
204
0.24
3 0.
106
0.55
3 0.
204
- 0.
349
0.55
3
R
/o V
illag
e & P
.O. A
hadi
an T
ehsil
Fer
ozew
ala D
istt:
Shei
khup
ura”
16
A
hmed
Far
ooq
Ahm
ed F
aroo
q 29
5-72
-024
517
Ch.
Muh
amm
ad A
bdul
0.
199
0.24
0 0.
097
0.53
6 0.
199
- 0.
337
0.53
6
V
illag
e Asd
ian,
Teh
sil F
eroz
ewala
,
M
alik
Dist
t: Sh
eikh
upur
a”
17
H
abib
ullah
H
abib
ulah
28
6-86
-211
827
Alla
h R
akha
0.
371
0.15
5 0.
259
0.78
5 0.
371
- 0.
414
0.78
5
R
/O S
t.No.
2, M
ohall
ah Is
lampu
ra,
Sidd
ique
-E-A
kbar
Tow
n, D
hulla
y G
ujra
nwala
18
M
uham
mad
Iqba
l M
uham
mad
Iqba
l 27
6-63
-017
314
Ch.
Sala
h U
d D
in
0.49
5 0.
342
0.34
6 1.
183
0.49
5 -
0.68
8 1.
183
Kas
hana
-E-S
alah-
Ud-
Din
, Haji
Yah
ya
Col
ony.2
, Gho
rey
Shah
Roa
d, L
ahor
e
19
M
uham
mad
Um
ar F
aroo
q M
uham
mad
Um
ar F
aroo
q 28
5-74
-757
642
Akh
tar I
qbal
0.47
9 0.
220
0.28
5 0.
984
0.47
9 -
0.50
5 0.
984
Moh
allah
Ros
han
Pura
Hou
se N
o.Fg
-116
5,
G
ali M
ian
Kha
n W
ali, G
ujra
nwala
”
20
Sa
fdar
Mun
ir M
alik
Safd
ar M
unir
Mali
k 32
5-92
-058
027
Mun
ir A
hmed
0.
408
0.00
2 0.
239
0.64
9 0.
408
- 0.
241
0.64
9
R
ath
Mum
mar
P.O
. 110
-W-B
, Teh
sil
Mai
lsi, D
istta
; Veh
ari”
Am
ount
in M
illio
n

Annual Report of Allied Bank Limited for the year 2012
155
ANNEXURE I
STAT
EMEN
T S
HO
WIN
G W
RIT
TEN
OFF
LO
AN
S O
R A
NY
OT
HER
FIN
AN
CIA
L RE
LIEF
OF
FIV
E H
UN
DRE
D T
HO
USA
ND
OR
ABO
VE
FRO
M (0
1 JA
NU
ARY
201
2 T
O 3
1 D
EC
EMBE
R, 2
012)
Sr
. N
ame A
nd A
ddre
ss O
f The B
orro
wer
Nam
e Of I
ndiv
idua
ls/Pa
rtner
s/D
irect
ors
Out
stand
ing
Liab
ilitie
s at t
he B
egin
ning
of t
he Y
ear
Oth
er
N
o.
Inte
rest
/ Fi
nanc
ial
Tota
l
Inte
rest
/
Pr
incip
al M
ark
- up
Reli
ef
N
ame o
f Dire
ctor
s N
IC N
os.
Fath
er’s /
Hus
band
’s Nam
e Pr
incip
al M
ark
- up
Oth
er
Tota
l W
ritte
n-off
W
ritte
n-off
Pr
ovid
ed
9+10
+11
1 2
3
4 5
6 7
8 9
10
11
12
21
Ta
usee
f Meh
moo
d Bu
tt Ta
usee
f Meh
moo
d Bu
tt 27
6-59
-147
789
Moh
amm
ad S
adiq
But
t 0.
412
0.04
7 0.
496
0.95
5 0.
412
- 0.
543
0.95
5
54
6/G
, Gul
shan
-E-R
avi,
Laho
re”
22
A
ladin
Car
pets
(Pvt
) Ltd
., A
laudd
in S
haik
h N
/A
Nas
eer U
ddin
Sh.
Serv
ices C
lub,
Mer
ewet
her R
oad,
Kar
achi
Si
ddiq
ue B
egum
Nas
eer U
ddin
Sh
A
isha B
egum
Alau
ddin
Sha
ikh
0.9
98
1.4
73
1.94
2 4.
413
0.99
8 -
3.41
5 4.
413
23
H
ina I
nter
natio
nal
Syed
Mas
roor
Has
san
N/A
S.
Muz
affar
Has
san
0.6
79
0.2
36
0.54
4 1.
459
0.67
9 -
0.78
0 1.
459
105-
106/
D, N
urse
ry C
omm
ercia
l M
usht
aq A
hmed
Kish
war A
li
A
rea,
Kar
achi
Sy
ed A
sad
Has
eeb
S.
Has
eeb
Raz
a
Muh
amm
ed H
ussa
in
K
aram
Ali
Tar
24
K
& N
Inte
rnat
iona
l A
dnan
Ham
eed
101-
63-5
1577
6 A
bdul
Ham
eed
0.7
68
0.0
90
0.48
8 1.
346
0.76
8 -
0.57
8 1.
346
C-3
8-D
, 26Th
Stre
et, T
auhe
ed C
omm
ercia
l
A
rea,
Phas
e-V,
Dha
, Kar
achi
25
Sy
ed R
iaz S
hahi
d Jil
ani
Syed
Ria
z Sha
hid
Jilan
i 42
301-
0848
188-
3 Sy
ed S
hah
0.6
46
0.02
5 0.
258
0.92
9 0.
646
- 0.
283
0.92
9
Pl
ot N
o.5,
Sect
or 2
0/B,
KD
A S
chem
e
N
o.25
, Sha
h La
tif T
own,
Kar
achi
26
Fr
iend
s Tra
ders
Sa
mi U
llah
3230
3-48
6966
1-7
Haji
Bas
hir A
hmed
2
.483
0
.458
1.
435
4.37
6 2.
483
- 1.
893
4.37
6
W
ard
No.
11, H
ouse
No.
986,
Moh
alla
Ara
inwa
la, K
ot A
ddu,
Dist
t: M
uzaff
arga
rh
27
M
akka
h C
orpo
ratio
n G
hulam
Qad
ir 36
101-
0948
395-
3 A
llah
Ditt
a 0
.758
0
.133
0.
455
1.34
6 0.
758
- 0.
588
1.31
6
C
hak
No.
109/
10-R
, Jeh
ania
n, T
ehsil
Ja
hani
an, D
istt:
Kha
newa
l
28
H
abib
Ent
erpr
ises
Rao
Saa
dat A
li 36
101-
0247
460-
3 Sa
daqa
t Ali
0.8
91
0.0
30
0.55
5 1.
476
0.89
1 -
0.58
5 1.
476
711-
C, G
ulga
sht C
olon
y, M
ulta
n Su
leman
Ras
hid
322-
77-9
5872
6 R
ashi
d A
li
Irfa
n A
li 32
2-92
-420
529
Usm
an A
li
29
A
shra
f Rice
Mill
s M
uham
mad
Ash
raf
3530
2-20
3673
0-1
Ghu
lam M
uham
mad
2
.882
-
1.77
9 4.
661
2.8
82
- 1.
779
4.66
1
E
idga
h R
oad,
Jalal
Din
Roa
d, H
adi J
or
Hos
pita
l, Sh
amsia
Col
ony,
Oka
ra
30
C
otto
n Li
nks,
Muh
amm
ad Iq
bal K
han
3660
3-14
6145
2-3
Jhan
dey
Kha
n 0
.795
0
.156
0.
454
1.40
5 0.
795
- 0.
610
1.40
5
43
-B, G
rain
Mar
ket,
Basti
Mar
i Was
eera
n,
Cha
k N
o.79
/W.B
. Dist
t: Ve
hari
Am
ount
in M
illio
n

156
ANNEXURE IST
ATEM
ENT
SH
OW
ING
WRI
TT
EN O
FF L
OA
NS
OR
AN
Y O
TH
ER F
INA
NC
IAL
RELI
EFO
F FI
VE
HU
ND
RED
TH
OU
SAN
D O
R A
BOV
E F
ROM
(01
JAN
UA
RY 2
012
TO
31
DE
CEM
BER
, 201
2)
Sr
. N
ame A
nd A
ddre
ss O
f The B
orro
wer
Nam
e Of I
ndiv
idua
ls/Pa
rtner
s/D
irect
ors
Out
stand
ing
Liab
ilitie
s at t
he B
egin
ning
of t
he Y
ear
Oth
er
N
o.
Inte
rest
/ Fi
nanc
ial
Tota
l
Inte
rest
/
Pr
incip
al M
ark
- up
Reli
ef
N
ame o
f Dire
ctor
s N
IC N
os.
Fath
er’s /
Hus
band
’s Nam
e Pr
incip
al M
ark
- up
Oth
er
Tota
l W
ritte
n-off
W
ritte
n-off
Pr
ovid
ed
9+10
+11
1 2
3
4 5
6 7
8 9
10
11
12
31
H
anif
Brot
hers
M
uahm
mad
Han
if 36
302-
2552
373-
3 H
aji M
uham
mad
Um
ar
2.5
00
0.6
42
1.72
8 4.
870
2.50
0 -
2.37
0 4.
870
Hou
se N
o.23
29, B
aron
Deh
li G
ate C
ircul
ar
Din
Roa
d, It
teha
d C
ham
bers
, Moh
ala A
gha
Pura
, Mul
tan
32
R
iaz A
hmed
She
ikh
Ria
z Ahm
ed S
heik
h 43
9-67
-031
055
Muh
amm
ad Id
rees
0.
700
0.00
0 0.
543
1.24
3 0.
421
- 0.
543
0.96
4
G
over
nmen
t Con
tract
or, M
ir A
li Ba
zar,
Kha
irpur
Mirs
33
A
eco
Inte
rnat
iona
l M
uham
mad
Zah
id
3520
2-30
9307
1-7
Meh
moo
d A
hmad
0.
870
3.62
1 2.
561
7.05
2 0.
870
- 6.
182
7.05
2
21
Lak
e Roa
d, C
houb
urji
Aut
o
Meh
moo
d K
han
Mar
ket,
Laho
re
34
A
l-Sad
iq F
ive S
tar S
titch
ing
Rao
Muh
amm
ad S
adiq
34
0-45
-279
513
Taj M
uham
mad
4.
850
0.70
0 2.
882
8.43
2 4.
850
- 3.
582
8.43
2
21
km
, Fer
ozep
ur R
oad,
Lah
ore
Muh
amm
ad A
slam
34
0-91
-279
515
Muh
amm
ad S
adiq
M
uham
mad
Ikra
m P
irzad
a 34
0-88
-279
516
Rao
Muh
amm
ad S
adiq
M
uham
mad
Am
in S
h.
287-
88-0
0331
2 Sh
. Sha
heer
Ahm
ed
Muh
amm
ad S
aleem
Sad
iq
340-
75-5
8410
4 M
uham
mad
Sad
iq
35
A
nwar
Ass
ocia
tes
Muh
amm
ad A
nwar
She
ikh
3520
1-86
9720
6-5
Haji
Imam
Din
2.
108
0.30
3 2.
195
4.60
6 2.
108
- 2.
498
4.60
6
9-
Meh
ta M
ansio
n, H
ide M
arke
t,
Abd
ul R
ahim
26
6-70
-027
209
Muh
amma
d Anw
ar Sh
eikh
Sulta
npur
a, La
hore
A
bdul
Azi
z 26
6-90
-027
210
Muh
amma
d Anw
ar Sh
eikh
M
st. S
hahn
az If
za
266-
48-0
2721
1 W
/O M
uham
mad A
nwar
Sheik
h
36
Stap
le Sp
orts
Nad
eem
Nisa
r 30
0-90
-192
995
Nisa
r Ahm
ed
1.60
2 0.
683
1.24
4 3.
529
1.60
2 -
1.92
7 3.
529
19/3
13, D
odhy
Stre
et, M
iana
pura
, Sia
lkot
37
M
.M. T
rade
Lin
kers
(Pvt
) Ltd
. M
ohsin
Mun
awar
27
2-66
-408
973
Mun
awar
-ud-
din
1.09
9 0.
092
1.19
2 2.
383
1.09
9 -
1.28
4 2.
383
154-
1st F
loor
, Soh
rwar
di A
rcad
e, M
ain
M
ubas
hir M
unaw
ar-u
d-di
n 27
2-69
-408
974
- Do
-
M
arke
t, Sa
man
abad
, Lah
ore
Raz
ia S
ulta
na
272-
49-4
0297
2 W
/o -
Do
-
Uzm
a Moh
sin
272-
93-5
5315
8 W
/o M
uslim
Mun
awar
M
oazz
am M
unaw
ar
272-
88-4
0897
5 M
unaw
ar-u
d-di
n
Man
soor
Mun
awar
-ud-
din
272-
93-4
0897
6 M
unaw
ar-u
d-di
n
38
Su
npak
Fib
res L
td.,
Muh
amm
ad A
shra
f She
ikh
285-
86-1
2868
1 Ha
ji Elah
i Buks
h Muha
mmad
Hussai
n 7.
911
0.00
0 7.
061
14.9
72
7.91
1 -
7.06
1 14
.972
i) H
atta
r Ind
ustri
al E
state
, Har
ripur
, Haz
ara
Shei
kh M
uham
mad
War
is 28
5-86
-019
238
Sh. M
uham
mad
War
is
R
oad,
Hat
tar
Shak
eel A
mir
285-
92-6
8810
3 M
uham
mad A
shraf
She
ikh
ii)
Dila
war I
ndus
tries
, Mus
lim T
own,
N
abee
l Ash
raf
3410
1-25
1657
1-1
Haji
Elah
i Muh
amm
ad
G
ujra
nwala
D
ilawa
r Meh
moo
d 34
101-
8855
4004
-3
Sh. M
uham
mad
War
is
Ade
el W
aris
Am
ount
in M
illio
n

Annual Report of Allied Bank Limited for the year 2012
157
ANNEXURE I
STAT
EMEN
T S
HO
WIN
G W
RIT
TEN
OFF
LO
AN
S O
R A
NY
OT
HER
FIN
AN
CIA
L RE
LIEF
OF
FIV
E H
UN
DRE
D T
HO
USA
ND
OR
ABO
VE
FRO
M (0
1 JA
NU
ARY
201
2 T
O 3
1 D
EC
EMBE
R, 2
012)
Sr
. N
ame A
nd A
ddre
ss O
f The B
orro
wer
Nam
e Of I
ndiv
idua
ls/Pa
rtner
s/D
irect
ors
Out
stand
ing
Liab
ilitie
s at t
he B
egin
ning
of t
he Y
ear
Oth
er
N
o.
Inte
rest
/ Fi
nanc
ial
Tota
l
Inte
rest
/
Pr
incip
al M
ark
- up
Reli
ef
N
ame o
f Dire
ctor
s N
IC N
os.
Fath
er’s /
Hus
band
’s Nam
e Pr
incip
al M
ark
- up
Oth
er
Tota
l W
ritte
n-off
W
ritte
n-off
Pr
ovid
ed
9+10
+11
1 2
3
4 5
6 7
8 9
10
11
12
39
Sa
itex
Spin
ning
Mill
s Ltd
., C
h. Q
asim
Ali
N/A
C
h. G
hulam
Ras
ool
2nd
Floo
r, 10
Civ
ic C
entre
, New
Gar
den
Ra
i Sha
hruk
h M
asoo
d Kh
an
Ra
i Mas
ood
Ahm
ed K
han
Town
, Lah
ore
Ch.
Abd
ul Ja
bbar
Ch.
Ghu
lam R
asoo
l
Rai
Mas
ood
Ahm
ed K
han
Ra
i Muh
amm
ad A
li Kh
an
3.60
0 8.
922
5.11
9 17
.641
3.
600
- 14
.041
17
.641
40
H
afiz S
alman
Aut
os
Mia
n M
uham
mad
Bas
hir
3520
1-13
7641
8-0
Haji
Hus
sain
Buk
hsh
0.29
1 0.
119
0.86
4 1.
274
0.29
1 -
0.98
3 1.
274
Shop
No.
28, 2
9, M
oder
n H
otel
Cho
wk,
Rai
lway
Sta
tion,
Lah
ore
41
R
izwa
na M
usht
aq
Riz
wana
Mus
htaq
31
5-88
-140
274
W/o
Mus
htaq
Ali
0.49
0 0.
193
0.36
1 1.
044
0.49
0 -
0.55
4 1.
044
33/T
, Def
ence
Hou
sing
Aut
horit
y,
La
hore
Can
tt.
42
Z
eesh
an H
aide
r Z
eesh
an H
aide
r Sye
d 34
603-
0269
098-
3 Sa
hibz
ada F
urqa
n Sy
ed
0.46
5 0.
459
0.46
7 1.
391
0.46
5 -
0.92
6 1.
391
R/O
1, W
azira
Aba
d R
oad,
Pak
ka
Gar
ha, S
ialk
ot
43
M
rs. R
azia
Nas
eer
Raz
ia S
ulta
na
287-
61-0
0163
0 Si
raj D
in
0.45
6 0.
303
0.33
3 1.
092
0.45
6 -
0.63
6 1.
092
Jam
il To
wn, E
min
abad
, Dist
t:
G
ujra
nwala
44
U
nico
n E
nter
prise
s M
uham
mad
Tar
iq F
aroo
qi
N/A
M
uham
mad
Hafi
z 0.
586
0.28
9 0.
580
1.45
5 0.
586
- 0.
869
1.45
5
A
l-Kaz
imia
Mar
ket,
V-C
, 2/1
6,
Faro
oqi
Naz
imab
ad, K
arac
hi
45
Ju
naid
Flo
ur G
ener
al M
ills
Agh
a Asa
d ab
bas
414-
59-1
4548
4 M
uham
mad
Ram
zan
8.49
9 2.
405
4.56
0 15
.464
8.
499
- 6.
965
15.4
64
Pl
ot N
o.42
1-42
2, M
ain
Kor
angi
Cre
e
R
oad,
Kar
achi
46
C
lassic
Inte
rnat
iona
l Sa
eed
Ahm
ed K
han
519-
56-2
8796
5 M
uham
mad
Sik
anda
r 0.
780
0.00
0 0.
459
1.23
9 0.
780
- 0.
459
1.23
9
68
0/68
1, C
.C. A
rea,
PEC
HS.
, Kar
achi
47
Al-H
amad
Inte
rnat
iona
l Z
aki-u
r-R
ehm
an
501-
43-3
8457
3 M
ehbo
ob-u
r-R
ehm
an
2.33
0 3.
466
4.17
0 9.
966
2.33
0 -
7.63
6 9.
966
Bung
low
No.
40/1
1, M
ain
Kha
yaba
n-
e-
Tanz
eem
, Pha
se V
, DH
A, K
arac
hi
48
A
sia P
acifi
c Hot
el Iq
bal A
hmed
Kha
n 50
1-81
-485
843
M. Y
. Kha
n 46
.451
16
.222
34
.345
97
.018
46
.451
-
50.5
67
97.0
18
12
/20t
h St
reet
, Kha
yaba
n-e-
Tauh
eed,
A
dnan
Iqba
l Kha
n Bri
tish Pa
ssport
No.70
106862
9 Iq
bal A
hmed
Kha
n
Ph
ase-
V, D
HA
, Kar
achi
H
umay
un Iq
bal K
han
4230
1-72
5554
3-7
- Do
-
Faisa
l Iqb
al K
han
501-
66-4
8584
6”
- Do
-
Am
ount
in M
illio
n

158
ANNEXURE IST
ATEM
ENT
SH
OW
ING
WRI
TT
EN O
FF L
OA
NS
OR
AN
Y O
TH
ER F
INA
NC
IAL
RELI
EFO
F FI
VE
HU
ND
RED
TH
OU
SAN
D O
R A
BOV
E F
ROM
(01
JAN
UA
RY 2
012
TO
31
DE
CEM
BER
, 201
2)
Sr
. N
ame A
nd A
ddre
ss O
f The B
orro
wer
Nam
e Of I
ndiv
idua
ls/Pa
rtner
s/D
irect
ors
Out
stand
ing
Liab
ilitie
s at t
he B
egin
ning
of t
he Y
ear
Oth
er
N
o.
Inte
rest
/ Fi
nanc
ial
Tota
l
Inte
rest
/
Pr
incip
al M
ark
- up
Reli
ef
N
ame o
f Dire
ctor
s N
IC N
os.
Fath
er’s /
Hus
band
’s Nam
e Pr
incip
al M
ark
- up
Oth
er
Tota
l W
ritte
n-off
W
ritte
n-off
Pr
ovid
ed
9+10
+11
1 2
3
4 5
6 7
8 9
10
11
12
49
Sh
ahid
Per
vaiz
Ans
ari
Shah
id P
erva
iz A
nsar
i 41
306-
4852
686-
7 R
ehm
anul
lah A
nsar
i 0.
536
0.08
8 0.
305
0.92
9 0.
536
- 0.
393
0.92
9
Fl
at N
o.12
, Kha
waja
Man
sion,
Dar
ya-a
bad,
Pl
ot N
o.29
86, L
ayar
i Qua
rters
, Kar
achi
50
Fa
zal E
lahi
Faza
l Ella
hi
225-
86-0
1959
6 M
uham
md
Hay
at
0.54
2 0.
156
0.40
7 1.
105
0.54
2 -
0.56
3 1.
105
Hou
se N
o.10
, Ban
gali
Para
, Kor
angi
2
1/2,
Kar
achi
51
M
rs. R
azia
Nas
ir R
azia
Nas
ir 45
2-54
-148
994
N
asir
Kha
n 0.
741
0.19
1 0.
327
1.25
9 0.
741
- 0.
518
1.25
9
Fl
at N
o.5,
1st F
loor
, Afsh
an M
ansio
n,
Naw
abad
, Lya
ri Q
uarte
rs, K
arac
hi
52
Q
ualit
y Pr
inte
rs
Syed
Meh
mood
Hus
sain Z
aidi
519-
51-1
6556
5 Sy
ed S
hara
fat H
ussa
in
0.48
2 0.
199
0.42
1 1.
102
0.48
2 -
0.62
0 1.
102
A-4
, Ras
hid
Squa
re, B
lock
-M, N
orth
N
azim
abad
, Kar
achi
53
W
orld
Wid
e Exp
orte
rs
S. H
assa
n K
azm
i N
/A
- 0.
800
0.64
6 1.
412
2.85
8 0.
800
- 2.
058
2.85
8
5-
Gre
en H
ouse
, Mac
lean
Stre
et, P
laza
Saki
na K
azm
i
Sq
uare
, M.A
. Jin
nah
Roa
d, K
arac
hi
Sulta
na P
arve
en
54
M
uham
mad
Ram
zan
Muh
amm
ad R
amza
n 37
405-
1933
102-
7 M
uham
mad
You
nas
0.27
3 0.
202
0.11
3 0.
588
0.27
3 -
0.31
5 0.
588
H.N
o.N
E-3
901/
A, S
treet
No.
30, M
ohall
ah
Sulta
npur
a (C
hah
Sulta
n), R
awalp
indi
55
A
li Tr
ansp
ort C
ompa
ny
Hab
ib T
rans
port
- -
- -
6.52
1 6.
521
- -
6.52
1 6.
521
Def
ence
Tra
nspo
rt C
ompa
ny
56
Lu
cky
Stee
l Fou
ndry
Wor
ks P
vt L
td.
Talla
t Meh
moo
d Bu
tt 35
202-
1660
156-
9 M
uham
mad
Ilya
s But
t 23
.962
10
.608
2.
768
37.3
38
- -
10.0
69
10.0
69
M
ehm
ood
Boot
i bun
d R
oad,
Cro
l Gha
ti
Ars
had
Butt
3520
2-01
3313
-5
In
dustr
ial A
rea ,
Lah
ore
57
R
achn
a Doa
b R
ice M
ills,
Shei
khup
ura
Ifikh
ar A
hmed
Bho
on
3430
1-17
6519
7-7
Iftik
har A
hmed
Bho
on
49.6
60
11.1
23
0.00
0 60
.783
-
- 19
.410
19
.410
Roa
d, H
afiza
bad.
M
anzo
or A
hmed
34
301-
1734
572-
9 S
/O M
anzo
or A
hmed
.
58
Fa
izan
Far
eed
Cor
pora
tion,
Ir
fan
Zaff
ar
3430
2-12
2464
3-9
Zaff
ar U
llah.
2.
049
1.37
5 0.
095
3.51
9 -
- 1.
130
1.13
0
G
halla
h M
andi
, Jala
lpur
Bha
ttian
.
59
D
S Te
xtile
s Ltd
- 20
K G
ulbe
rg II
Lah
ore
Perv
ez A
hmad
3520
2-56
3783
2-7
Mr.
S.K
.Ahm
ad
121.
190
0.00
0 0.
000
121.
190
65.6
08
- 0.
000
65.6
08
Ali
Perv
ez
352
02-8
6337
84-5
Mr.
Perv
ez A
hmad
H
assa
n Ib
rahi
m
3520
2-01
0413
6-7
Mr.
Perv
ez A
hmad
60
A
l Abi
d Si
lk M
ills L
imite
d N
asee
m A
hmed
Sat
tar
4230
1084
0043
1.00
0 Sh
eikh
Abd
ul S
atta
r 75
.000
0.
000
0.00
0 75
.000
0.
000
-
3.01
4 3.
014
A
zim
Ahm
ed
4230
1091
2143
9.00
0 N
asee
m A
hmed
Sat
tar
Z
arin
a Nas
eem
42
3010
8296
190.
000
Nas
eem
Ahm
ed S
atta
r
Adi
a Nas
eem
42
3010
7833
844.
000
Nas
eem
Ahm
ed S
atta
r
Sada
f Nad
eem
42
3010
8788
868.
000
Nad
eem
You
nus
R
eena
Azi
m
4230
1083
1483
6.00
0 A
zim
Ahm
ed
A
sra A
mir
42
3010
7858
132.
000
Aam
ir N
asee
m
Sy
ed R
aza A
bbas
Jaffa
ri 42
2010
2156
851.
000
Syed
Sha
haba
t Hus
sain
1526
.926
25
0.67
44
4.31
7 22
21.9
13
1171
.410
-
702.
641
1874
.051
Am
ount
in M
illio
n

Annual Report of Allied Bank Limited for the year 2012
159
ANNEXURE IIAs at December 31, 2012
As referred to in notes 11.11 & 11.12 to the financial statements
DETAIL OF DISPOSAL OF FIXED ASSETS Rupees in ‘000
Particulars Original cost/ Accumulated Book value Sale Mode of Particulars of revalued depreciation Proceeds Disposal purchaser amount
Vehicles Items having book value of more than Rs.250,000 or cost of more than Rs.1,000,000 Motor Vehicle 1,276 1,276 - 886 As Per Bank Policy Mr. Farrukh Ahmed Motor Vehicle 1,005 653 352 1,087 As Per Bank Policy Mr. Azbar Khan Motor Vehicle 1,521 986 535 1,269 As Per Bank Policy Mr. Zahid Qadri Motor Vehicle 2,330 2,330 - 539 As Per Bank Policy Mr. Khalid Khan Total 6,132 5,245 887 3,781 Other Disposals 29,474 29,114 360 25,316 As Per Bank Policy Miscellaneous 31 December, 2012 35,606 34,359 1,247 29,097

160

for the year ended December 31, 2012
Consolidated Financial Statements
Allied Bank Limited

162
On behalf of the Board, we are pleased to present the consolidated annual report of Allied Bank Limited (holding company) and ABL Asset Management Company Limited (subsidiary company).
The operating results and appropriations, as recommended by the Board are given below:
2012 2011 Growth
Rs. In million %
Profit after tax for the year 11,882 10,256 16%
Accumulated profits brought forward 20,395 15,853 29%
Transfer from surplus on revaluation of fixed assets - net of tax 31 29 7%
Profit available for appropriation 32,308 26,138 24%
Final cash dividend for the year ended December 31, 2011 at Rs. 2.5
per share (2011: Year ended December 31, 2010 at Rs. 2 per share) (2,151) (1,564) 38%
1st interim cash dividend for the year ended
December 31, 2012 at Rs. 2 per share (2011: Year ended
December 31, 2011 at Rs. 2.5 per share) (1,893) (2,151) -12%
2nd interim cash dividend for the year ended
December 31, 2012 at Rs. 1.5 per share (2011: Year ended
December 31, 2011 at Rs. 1 per share) (1,420) - 100%
3rd interim cash dividend for the year ended
December 31, 2012 at Rs. 1 per share (2011: Year ended
December 31, 2011 Nil) (946) - 100%
Bonus shares for the year ended
December 31, 2011 @ 10% (2011: Year ended December 31, 2010 @ 10%*) (658) - 100%
Transfer to statutory Reserves (2,335) (2,028) 15%
Accumulated profits carried forward 22,905 20,395 12%
Earning Per Share (EPS) (Rs.) 12.56 10.84 16%
* Appropriation out of Share Premium Account
Pattern of Shareholding
The pattern of shareholding as at December 31, 2012 is included in the Annual Report.
For and on behalf of the Board,
Khalid A. Sherwani Chief Executive Officer
Dated: February 14, 2013 Place: Lahore
Directors’ Report on Consolidated Financial StatementFor the year ended December 31, 2012

Annual Report of Allied Bank Limited for the year 2012
163
Auditors’ Reportto the Members
We have audited the annexed consolidated financial statements comprising consolidated statement of financial position of Allied Bank Limited (“the Bank”) and its subsidiary company as at 31 December 2012 and the related consolidated profit and loss account, consolidated statement of comprehensive income, consolidated statement of cash flow and consolidated statement of changes in equity together with the notes forming part thereof, for the year then ended. These consolidated financial statements include unaudited certified returns from the branches except for twenty branches which have been audited by us and one branch audited by auditors abroad. We have also expressed separate opinion on the financial statements of Allied Bank Limited. The financial statements of subsidiary company ABL Asset Management Company Limited were audited by Ernst & Young Ford Rhodes Sidat Hyder, whose report has been furnished to us and our opinion, in so far as it relates to the amounts included for such company, is based solely on the report of Ernst & Young Ford Rhodes Sidat Hyder. These financial statements are the responsibility of the Holding Company’s management. Our responsibility is to express an opinion on these financial statements based on our audit.
Our audit was conducted in accordance with the International Standards on Auditing and accordingly included such tests of accounting records and such other auditing procedures as we considered necessary in the circumstances.
In our opinion, the consolidated financial statements present fairly the financial position of Allied Bank Limited and its subsidiary company as at 31 December 2012 and the results of their operations for the year then ended.
Ernst & Young Ford Rhodes Sidat Hyder KPMG Taseer Hadi & Co.Chartered Accountants Chartered Accountants
Engagement partner: Engagement partner:Naseem Akbar Kamran I. Yousafi
Date: February 14, 2013Place: Lahore
ERNST & YOUNG FORD RHODES SIDAT HYDERChartered AccountantsMall View Building4 - Bank SquareLahore
KPMG TASEER HADI & CO.Chartered Accountants53 - L, Gulberg IIILahore

164
Assets 446,236 375,501 Cash and balances with treasury banks 6 43,351,703 36,479,765 10,595 17,284 Balances with other banks 7 1,029,292 1,679,121 110,355 14,017 Lendings to financial institutions 8 10,720,935 1,361,754 2,755,363 2,015,340 Investments 9 267,682,679 195,789,638 2,790,700 2,516,115 Advances 10 271,115,683 244,439,837 204,656 186,260 Operating fixed assets 11 19,882,246 18,095,123 - 7,730 Deferred tax assets 12 - 750,972 190,625 177,997 Other assets 13 18,519,168 17,292,402 6,508,530 5,310,244 632,301,706 515,888,612 Liabilities 63,850 41,331 Bills payable 15 6,203,051 4,015,317 400,580 514,600 Borrowings 16 38,916,192 49,993,200 5,298,034 4,112,836 Deposits and other accounts 17 514,702,444 399,560,790 56,515 56,537 Sub-ordinated loans 18 5,490,400 5,492,600 - - Liabilities against assets subject to finance lease - - 673 - Deferred tax liabilities 12 65,419 - 161,202 137,390 Other liabilities 19 15,660,646 13,347,347 5,980,854 4,862,694 581,038,152 472,409,254 527,676 447,550 Net assets 51,263,554 43,479,358 Represented by 97,411 88,555 Share capital 20 9,463,421 8,603,110 112,262 90,198 Reserves 10,906,250 8,762,745 235,782 209,941 Unappropriated profit 22,906,178 20,395,717 445,455 388,694 43,275,849 37,761,572 82,221 58,856 Surplus on revaluation of assets - net of tax 21 7,987,705 5,717,786 527,676 447,550 51,263,554 43,479,358 Contingencies and commitments 22 The annexed notes 1 to 46 and annexures I to II form an integral part of these consolidated financial statements.
December 31, December 31, Note December 31, December 31, 2012 2011 2012 2011 US $ in ‘000 Rupees in ‘000
Chief Financial Officer President and Chief Executive Director
Director Chairman
Consolidated Statement of Financial Positionas at December 31, 2012

Annual Report of Allied Bank Limited for the year 2012
165
509,647 533,495 Mark-up / return / interest earned 24 49,512,005 51,828,897 320,958 274,794 Mark-up / return / interest expensed 25 31,180,990 26,696,185 188,689 258,701 Net mark-up / interest income 18,331,015 25,132,712 13,113 27,895 Provision against non-performing loans and advances 10.4 1,273,901 2,710,021 (6,416) 2,357 (Reversal) / provision for diminution in the value of investments - net 9.3 (623,341) 229,003 - 721 Provision against lendings to financial institutions 8.6 - 70,000 - - Bad debts written off directly 10.5 - - 6,697 30,973 650,560 3,009,024 181,992 227,728 Net mark-up / interest income after provisions 17,680,455 22,123,688 Non mark-up / interest income 30,285 31,050 Fee, commission and brokerage income 26 2,942,192 3,016,472 86,807 27,599 Dividend income 8,433,249 2,681,218 6,160 6,619 Income from dealing in foreign currencies 598,480 643,058 19,861 8,949 Gain on sale of securities 27 1,929,474 869,361 - - Unrealized gain on revaluation of investments classified as 717 62 held for trading - net 9.12 69,700 6,030 2,798 491 Other income 28 271,802 47,657 146,628 74,770 Total non-markup / interest income 14,244,897 7,263,796 328,620 302,498 31,925,352 29,387,484 Non mark-up / interest expenses 151,169 136,790 Administrative expenses 29 14,686,046 13,289,101 3,524 1,175 Provision against other assets - net 13.2 342,384 114,181 3,803 1,485 Provision against off-balance sheet obligations - net 19.1 369,480 144,245 3,325 3,231 Workers welfare fund 31 323,042 313,888 597 2,761 Other charges 30 57,959 268,204 162,418 145,442 Total non-markup / interest expenses 15,778,911 14,129,619 - - Extra-ordinary / unusual items - - 166,202 157,056 Profit before taxation 16,146,441 15,257,865 Taxation 39,242 50,939 Current 3,812,352 4,948,719 11 1,607 Prior years 1,073 156,112 4,639 (1,062) Deferred 450,649 (103,139) 43,892 51,484 32 4,264,074 5,001,692 122,310 105,572 Profit after taxation 11,882,367 10,256,173 209,941 163,184 Unappropriated profit brought forward 20,395,717 15,853,255 319 301 Transfer from surplus on revaluation of fixed assets - net of tax 31,028 29,204 210,260 163,485 20,426,745 15,882,459 332,570 269,057 Profit available for appropriation 32,309,112 26,138,632 0.13 0.11 Earnings per share - Basic and Diluted (in Rupees) 33 12.56 10.84 The annexed notes 1 to 46 and annexures I to II form an integral part of these consolidated financial statements.
Chief Financial Officer President and Chief Executive Director
Director Chairman
Consolidated Profit and Loss Accountfor the year ended December 31, 2012
December 31, December 31, Note December 31, December 31, 2012 2011 2012 2011 US $ in ‘000 Rupees in ‘000

166
122,310 105,572 Profit after taxation for the year 11,882,367 10,256,173 Other comprehensive income Exchange differences on translation of net investment 105 - in foreign wholesale branch 10,198 - 122,415 105,572 Total comprehensive income for the year 11,892,565 10,256,173 Surplus / (deficit) on revaluation of ‘available for sale’ securities and ‘operating fixed assets’ are presented under a separate head below equity as ‘surplus / (deficit) on revaluation of assets’ in accordance with the requirements specified by the State Bank of Pakistan vide its BSD Circular No. 20 dated 04 August 2000 and BSD Circular No. 10 dated 13 July 2004 respectively and Companies Ordinance, 1984. The annexed notes 1 to 46 and annexures I to II form an integral part of these consolidated financial statements.
Chief Financial Officer President and Chief Executive Director
Director Chairman
December 31, December 31, December 31, December 31, 2012 2011 2012 2011 US $ in ‘000 Rupees in ‘000
Consolidated Statement of Comprehensive Incomefor the year ended December 31, 2012

Annual Report of Allied Bank Limited for the year 2012
167
Cash Flow From Operating Activities 166,202 157,056 Profit before taxation 16,146,441 15,257,865 (86,807) (27,599) Less: Dividend income (8,433,249) (2,681,218) 79,395 129,457 7,713,192 12,576,647 Adjustments for non-cash items: 12,818 10,655 Depreciation / amortization 1,245,227 1,035,096 13,113 27,895 Provision against non-performing loans, advances and general provision - net 1,273,901 2,710,021 (6,416) 2,357 (Reversal) / provision for diminution in the value of investments - net (623,341) 229,003 - 721 Provision against lendings to financial institutions - 70,000 (717) (62) Unrealized loss on revaluation of held for trading securities (69,700) (6,030) 3,803 1,485 Provision against off balance sheet obligations - net 369,480 144,245 3,524 1,175 Provision against other assets - net 342,384 114,181 - 1,204 Operating fixed assets written off - 116,920 (286) (27) Gain on sale of fixed assets (27,762) (2,576) 25,839 45,403 2,510,189 4,410,860 105,234 174,860 10,223,381 16,987,507 (Increase) / Decrease in operating assets (96,338) 103,523 Lendings to financial institutions (9,359,181) 10,057,190 (2,496) 8,196 Net realizations in ‘held for trading’ securities (242,529) 796,286 (287,698) 61,275 Advances - net (27,949,747) 5,952,852 7,948 (4,616) Other assets (excluding advance taxation) - net 772,152 (448,408) (378,584) 168,378 (36,779,305) 16,357,920 Increase / (Decrease) in operating liabilities 22,519 (1,065) Bills payable 2,187,734 (103,474) (113,671) 301,381 Borrowings from financial institutions (11,043,116) 29,279,026 1,185,198 291,096 Deposits and other accounts 115,141,654 28,279,842 19,676 9,102 Other liabilities 1,911,504 884,268 1,113,722 600,514 108,197,776 58,339,662 840,372 943,752 81,641,852 91,685,089 (64,710) (49,688) Income tax paid - net (6,286,535) (4,827,151) 775,662 894,064 Net cash flow generated from operating activities 75,355,317 86,857,938 Cash Flow From Investing Activities (711,538) (564,900) Net investments in ‘available-for-sale’ securities (69,125,706) (54,879,871) 9,768 (215,287) Net investments in ‘held-to-maturity’ securities 948,958 (20,915,102) 88,163 20,193 Dividend income received 8,565,057 1,961,759 (32,401) (30,416) Investments in operating fixed assets (3,147,719) (2,954,916) 299 104 Proceeds from sale of fixed assets 29,096 10,131 105 - Effect of translation of net investment in foreign wholesale bank branch 10,198 - (645,604) (790,306) Net cash used in investing activities (62,720,116) (76,777,999) Cash Flow From Financing Activities (23) (23) Repayment of sub-ordinated loan (2,200) (2,200) (65,641) (38,126) Dividends paid (6,377,000) (3,703,935) (65,664) (38,149) Net cash used in financing activities (6,379,200) (3,706,135) 64,394 65,609 Increase in cash and cash equivalents during the year 6,256,001 6,373,804 390,575 326,562 Cash and cash equivalents at beginning of the year 37,944,226 31,725,385 1,861 266 Effect of exchange rate changes on opening cash and cash equivalents 180,768 25,805 456,830 392,437 Cash and cash equivalents at end of the year 34 44,380,995 38,124,994
The annexed notes 1 to 46 and annexures I to II form an integral part of these consolidated financial statements.
Chief Financial Officer President and Chief Executive Director
Director Chairman
Consolidated Statement of Cash Flowfor the year ended December 31, 2012
December 31, December 31, Note December 31, December 31, 2012 2011 2012 2011 US $ in ‘000 Rupees in ‘000

168
Capital Reserve Revenue Reserves
Share Share Exchange Bouns Issue Special Merger Statutory General Un- Capital Premium Translation Reserve Reserve* Reserve* Reserve Reserve appropriated Total Reserve Profit
Rupees in ‘000 Balance as at January 01, 2011 7,821,009 983,957 - - 67,995 333,864 6,125,094 6,000 15,853,255 31,191,174
Changes in equity during the year ended
December 31, 2011
Total comprehensive income for the year ended
December 31, 2011
Net profit for the year ended December 31, 2011 - - - - - - - - 10,256,173 10,256,173
- Effect of translation of net investment in
foreign wholesale bank branch - - - - - - - - - -
- - - - - - - - 10,256,173 10,256,173
Transactions with owners recognized directly in equity
Transfer to reserve for issue of bonus shares -
for the year ended December 31, 2010 @ 10% - (782,101) - 782,101 - - - - - -
Issue of bonus shares 782,101 - - (782,101) - - - - - -
Final cash dividend for the year ended December -
31, 2010 (Rs. 2.00 per ordinary share) - - - - - - - - (1,564,202) (1,564,202)
Interim cash dividend for the year ended December -
31, 2011 (Rs. 2.50 per ordinary share) - - - - - - - - (2,150,777) (2,150,777)
782,101 (782,101) - - - - - - (3,714,979) (3,714,979)
Transferred from surplus on revaluation of fixed assets
to un-appropriated profit - net of tax - - - - - - - - 29,204 29,204
Transfer to statutory reserve - - - - - - 2,027,936 - (2,027,936) -
Balance as at December 31, 2011 8,603,110 201,856 - - 67,995 333,864 8,153,030 6,000 20,395,717 37,761,572
Changes in equity during the year ended
December 31, 2012
Total comprehensive income for the year ended
December 31, 2012
Net profit for the year ended December 31, 2012 - - - - - - - - 11,882,367 11,882,367
- Effect of translation of net investment in
foreign wholesale bank branch - - 10,198 - - - - - - 10,198
- - 10,198 - - - - - 11,882,367 11,892,565
Transactions with owners recognized directly in equity
Transfer to reserve for issue of bonus shares for the
year ended December 31, 2011 @ 10% - (201,856) - 860,311 - - - - (658,455) -
Issue of bonus shares 860,311 - - (860,311) - - - - - -
Final cash dividend for the year ended
December 31, 2011 (Rs. 2.50 per ordinary share) - - - - - - - - (2,150,777) (2,150,777)
First interim cash dividend for the year ended
December 31, 2012 (Rs. 2.00 per ordinary share) - - - - - - - - (1,892,684) (1,892,684)
Second interim cash dividend for the year ended
December 31, 2012 (Rs. 1.50 per ordinary share) - - - - - - - - (1,419,513) (1,419,513)
Third interim cash dividend for the year ended
December 31, 2012 (Re. 1 per ordinary share) - - - - - - - - (946,342) (946,342)
860,311 (201,856) - - - - - - (7,067,771) (6,409,316)
Transferred from surplus on revaluation of fixed assets
to un-appropriated profit - net of tax - - - - - - - 31,028 31,028
Transfer to statutory reserve - - - - - - 2,335,163 - (2,335,163) -
Balance as at December 31, 2012 9,463,421 - 10,198 - 67,995 333,864 10,488,193 6,000 22,906,178 43,275,849 * These were created as a result of merger of Ibrahim Leasing Limited and First Allied Bank Modaraba into Allied Bank Limited. The annexed notes 1 to 46 and annexures I to II form an integral part of these consolidated financial statements.
Consolidated Statement of Changes in Equityfor the year ended December 31, 2012
Chief Financial Officer President and Chief Executive Director
Director Chairman

Annual Report of Allied Bank Limited for the year 2012
169
1. STATUS AND NATURE OF BUSINESS
The “Group” consists of:
Holding Company
Allied Bank Limited (“the Bank”), incorporated in Pakistan, is a scheduled Bank, engaged in commercial banking and related services. The Bank is listed on all stock exchanges in Pakistan. The Bank operates a total of 873 (2011: 836) branches in Pakistan, 1 branch (2011:1) in Karachi Export Processing Zone Branch, and 1 wholesale banking branch (2011: Nil) in Bahrain. The long term credit rating of the Bank assigned by The Pakistan Credit Rating Agency Limited (PACRA) is ‘AA+’. Short term rating of the Bank is ‘A1+’. The Bank is the holding company of ABL Asset Management Company Limited.
The registered office of the Bank is situated at 3-4 Tipu Block, Main Boulevard, New Garden Town, Lahore.
Subsidiary Company
ABL Asset Management Company Limited, a wholly owned subsidiary of the Bank, is a public unlisted company incorporated in Pakistan as a limited liability company on October 12, 2007 under the Companies Ordinance, 1984. The subsidiary company has obtained licenses from the Securities and Exchange Commission of Pakistan (SECP) to carry out Asset Management Services and Investment Advisory Services as a Non-Banking Finance Company (NBFC) under Non-Banking Finance Companies (Establishment and Regulation) Rules, 2003 as amended through S.R.O.1131[I] 2007 (the NBFC Rules, 2003). The subsidiary company received certificate of commencement of business on December 31, 2007. The registered office of the subsidiary company is situated at 11-B Lalazar, M.T. Khan Road, Karachi. The Management quality rating of the company, as assigned by JCR-VIS credit rating company limited, is AM2-.
ABL Asset Management company is managing following open ended funds: - ABL-Income Fund Launched on September 20, 2008 - ABL-Stock Fund Launched on June 28, 2009 - ABL-Cash Fund Launched on July 31, 2010 - ABL-Islamic Income Fund Launched on July 31, 2010 - ABL-Government securities Fund Launched on November 30, 2011 - ABL-AMC Capital Protected Fund Launched on June 01, 2012 2. (a) BASIS OF PRESENTATION
- These consolidated financial statements consist of holding company and its subsidiary company, for the year ended December 31, 2012.
- In accordance with the directives of the Federal Government regarding the shifting of the banking system to
Islamic modes, the State Bank of Pakistan (SBP) has issued various circulars from time to time. Permissible forms of trade-related modes of financing include purchase of goods by banks from their customers and immediate resale to them at appropriate mark-up in price on deferred payment basis. The purchases and sales arising under these arrangements are not reflected in these consolidated financial statements as such but are restricted to the amount of facility actually utilized and the appropriate portion of mark-up thereon.
- These consolidated financial statements have been presented in Pakistan Rupees (PKR), which is the Group’s
functional and presentation currency. The amounts are rounded to nearest thousand. - The US Dollar amounts reported in the consolidated statement of financial position, consolidated profit and
loss account, consolidated statement of other comprehensive income and consolidated statement of cash flow are stated as additional information, solely for the convenience of the users of financial statements. For the purpose of translation to US Dollar, spot rate of Rs 97.1497 per US Dollar has been used for 2012 and 2011, as it was the prevalent rate as on date of statement of financial position.
(b) BASIS OF CONSOLIDATION
The assets and liabilities of subsidiary company have been consolidated on a line by line basis and the carrying value of investment in subsidiary held by the Bank is eliminated against the shareholders’ equity in the consolidated financial statements.
Material intra-group balances and transactions have been eliminated. (c) BASIS OF MEASUREMENT
These consolidated financial statements have been prepared under the historical cost convention except the following are stated at revalued amounts / fair values:
- Investments (Note 5.3) - Operating fixed assets (Note 5.5) - Derviatives (Note 4)
Notes to the Consolidated Financial Statementsfor the year ended December 31, 2012
170
Notes to the Consolidated Financial Statementsfor the year ended December 31, 2012
3. STATEMENT OF COMPLIANCE
3.1 These consolidated financial statements have been prepared in accordance with approved accounting standards as applicable in Pakistan. Approved Accounting Standards comprise of such International Financial Reporting Standards (IFRSs) issued by the International Accounting Standards Board (IASB) as are notified under the Companies Ordinance, 1984, provisions of and directives issued under the Banking Companies Ordinance, 1962, the Companies Ordinance, 1984 and the directives issued by SBP. In case requirements of provisions and directives issued under the Banking Companies Ordinance, 1962, Companies Ordinance, 1984 and the directives issued by State Bank of Pakistan differ from requriements of IFRSs, the provisions of and directives issued under the Banking Companies Ordinance, 1962, the Companies Ordinance, 1984 and the directives issued by SBP shall prevail.
3.2 The SBP, vide BSD Circular No. 10, dated August 26, 2002 has deferred the applicability of International Accounting Standard 39, Financial Instruments: Recognition and Measurement (IAS 39) and International Accounting Standard 40, Investment Property (IAS 40) for banking companies till further instructions. Further, according to a notification of Securities and Exchange Commission of Pakistan (SECP) dated April 28, 2008, International Financial Reporting Standard (IFRS) 7 “Financial Instruments Disclosure” has not been made applicable for banks. Accordingly, the requirements of these standards have not been considered in the preparation of these consolidated financial statements. However, investments have been classified and disclosed in accordance with the requirements prescribed by SBP through various circulars.
3.3 New and amended standards and interpretations became effective during the year
During the year, following new / revised standards, amendments and interpretations to accounting standards became effective:
IFRS 7 – Financial Instruments : Disclosures – (Amendments)
The amendment requires additional disclosure about financial assets that have been transferred but not derecognised to enable the user of the Group’s financial statements to understand the relationship with those assets that have not been derecognised along with their associated liabilities. In addition, the amendment requires disclosures about continuing involvement in derecognised assets to enable the user to evaluate the nature of, and risks associated with, the entity’s continuing involvement in those derecognised assets. The amendment becomes effective for annual periods beginning on or after 1 July 2011. However according to a notification of Securities and Exchange Commission of Pakistan (SECP) dated April 28, 2008, International Financial Reporting Standard (IFRS) 7 “Financial Instruments Disclosure” has not been made applicable for banks.
IAS 1 Financial Statement Presentation – Presentation of Items of Other Comprehensive Income (OCI)
The amendments to IAS 1 change the grouping of items presented in other comprehensive income. Items that could be reclassified (or ‘recycled’) to profit or loss at a future point in time (for example, upon derecognition or settlement) would be presented separately from items that will never be reclassified. The requirements of other IFRSs continue to apply in this regard. The amendment affects presentation only and has no impact on the Group’s financial position or performance. The amendment becomes effective for annual periods beginning on or after 1 July 2012.
IAS 12 Income Taxes – Recovery of Underlying Assets
Amendments to IAS 12 – deferred tax on investment property (effective for annual periods beginning on or after January 01, 2012). The 2010 amendment provides an exception to the measurement principle in respect of investment property measured using the fair value model in accordance with IAS 40 Investment Property. The measurement of deferred tax assets and liabilities, in this limited circumstance, is based on a rebuttable presumption that the carrying amount of the investment property will be recovered entirely through sale. The presumption can be rebutted only if the investment property is depreciable and held within a business model whose objective is to consume substantially all of the asset’s economic benefits over the life of the asset. The amendment has no impact on financial statements of the Group.
In May 2010, International Accounting Standards Board issued amendments to various standards primarily with a view to removing inconsistencies and clarifying wording. These improvements are listed below:
IFRS 3 – Business Combinations
- Transition requirements for contingent consideration from a business combination that occurred before the effective date of the revised IFRS
- Measurement of non-controlling interests (NCI)- Un-replaced and voluntarily replaced share-based payment awards
IAS 1 – Presentation of Financial Statements
- Clarification of statement of changes in equity IAS 27 – Consolidated and Separate Financial Statements
- Transition requirements for amendments made as a result of IAS 27 Consolidated and Separate Financial Statements

Annual Report of Allied Bank Limited for the year 2012
171
Notes to the Consolidated Financial Statementsfor the year ended December 31, 2012
IAS 34 – Interim Financial Reporting- Significant events and transactions
IFRIC 13 – Customer Loyalty Programmes
- Fair value of award credits Adoption of the above standards, amendments and interpretations did not affect the accounting policies of the Group. Certain
amendments introduced in IAS 32, IFRS 7 and IFRIC 19 do not have any impact on accounting policies as the applicability of such standard and interpretations have been deferred by SBP as disclosed in note 3.2.
3.4 Standards, Interpretations and Amendments to Published Approved Accounting Standards that are not yet effective
The following standards, amendments and interpretations of approved accounting standards will be effective for accounting periods beginning on or after January 01, 2013. These standards are either not relevant to the Group’s operations or are not expected to have a significant impact on the Group’s financial statements except to the extent of effect of amendments in IAS 19 “Employee Benefits”, when they will become effective.
IFRS 7 – Financial Instruments : Disclosures – (Amendments)
The amendment requires enhance the disclosures regarding off setting of financial assets to enable the users to understand and evaluate the effect of off-setting on the financial statements. The amendment becomes effective for annual periods beginning on or after January 01, 2013.
However, the amendment will not have any impact on financial position as the applicability of such standard and interpretation have been deferred by SBP as mentioned in note 3.2.
IAS 19 – Employee Benefits –(Amendment)
IAS 19 Employee benefits (amended 2011)-(effective for annual periods beginning January 01, 2013). The amendments fundamental changes to simple clarification and re-wording. The significant changes include the following:
For defined benefit plans, the ability to defer recognition of actuarial gains and losses (i.e., the corridor approach) has been removed. As revised, actuarial gains and losses are recognized in other comprehensive income when they occur. Amounts recorded in profit and loss are limited to current and past service costs, gains or losses on settlements, and net interest income (expense). All other changes in the net defined benefit asset (liability) are recognized in other comprehensive income with no subsequent recycling to profit and loss.
The distinction between short-term and other long-term employee benefits will be based on the expected timing of settlement rather than the employee’s entitlement to the benefits.
Objectives for disclosures of defined benefit plans are explicitly stated in the revised standard, along with new or revised disclosure requirements. These new disclosures include quantitative information of the sensitivity of the defined benefit obligation to a reasonably possible change in each significant actuarial assumption.
While the Group is currently assessing the full impact of the above amendments which are effective from January 01, 2013 on the financial statements, it is expected that the adoption of the said amendments will result in change in the Group’s accounting policy related to recognition of actuarial gains and losses as referred in note 36.4 to recognize actuarial gains and losses in total in other comprehensive income in the period in which they occur. The potential impact of the said changes on the financial position and performance for the year 2013 is estimated as under:
Rupees in ‘000 Net decrease in employees’ benefit liability (1,691,667) Net increase in other comprehensive income 1,691,667 IAS 28 - Investments in Associates and Joint Ventures
IAS 28 Investments in Associates and Joint Ventures (2011) - (effective for annual periods beginning on or after January 01, 2013). IAS 28 (2011) makes the amendments to apply IFRS 5 to an investment, or a portion of an investment, in an associate or a joint venture that meets the criteria to be classified as held for sale; and on cessation of significant influence or joint control, even if an investment in an associate becomes an investment in a joint venture. The amendments have no impact on financial statements of the Group.

172
Notes to the Consolidated Financial Statementsfor the year ended December 31, 2012
IAS 32 - Offsetting Financial Assets and Financial Liabilities (Amendments)
Offsetting Financial Assets and Financial Liabilities (Amendments to IAS 32) – (effective for annual periods beginning on or after January 01, 2014). The amendments address inconsistencies in current practice when applying the offsetting criteria in IAS 32 Financial Instruments: Presentation. The amendments clarify the meaning of ‘currently has a legally enforceable right of set-off ’; and that some gross settlement systems may be considered equivalent to net settlement.
In addition to the above, the following new standards have been issued by IASB which are yet to be notified by the SECP/SBP for the purpose of applicability in Pakistan.
IFRS 9 Financial Instruments: Classification and Measurement
IFRS 9 “Financial Instruments: Classification and Measurement” as issued reflects the first phase of the IASB’s work on the replacement of IAS 39 “Financial Instruments: Recognition and Measurement” and applies to classification and measurement of financial assets and financial liabilities as defined in IAS 39 “Financial Instruments: Recognition and Measurement”. The standard is mandatorily effective for annual periods beginning on or after January 01, 2015.
IFRS 10 Consolidated Financial Statements
“IFRS 10 Consolidated Financial Statements” replaces the portion of IAS 27 Consolidated and Separate Financial Statements that addresses the accounting for consolidated financial statements. It also includes the issues raised in SIC-12 Consolidation-Special Purpose Entities .
IFRS 10 establishes a single control model that applies to all entities including special purpose entities. The changes introduced by IFRS 10 will require management to exercise significant judgment to determine which entities are controlled, and therefore, are required to be consolidated by a parent, compared with the requirements that were in IAS 27.
This standard becomes effective for annual periods beginning on or after January 01, 2013.
IFRS 11 Joint Arrangements
“IFRS 11 Joint Arrangements” replaces IAS 31 Interests in Joint Ventures and SIC-13 Jointly-Controlled Entities- Non-Monetary Contributions by Ventures.
IFRS 11 removes the option to account for jointly controlled entities ( JCEs) using proportionate consolidation. Instead, JCEs that meet the definition of a joint venture must be accounted for using the equity method.
The application of this new standard will not impact the financial position of the Group. This standard becomes effective for annual periods beginning on or after January 01, 2013.
IFRS 12 Disclosure of Involvement with Other Entities
IFRS 12 “Disclosure of Involvement with Other Entities” includes all disclosures that were previously in IAS 27 “Consolidated and Separate Financial Statements” related to consolidated financial statements, as well as all of the disclosures that were previously included in IAS 31 “Interest in Joint Ventures” and IAS 28 “Investments in Associates”. These disclosures relate to an entity’s interests in subsidiaries, joint arrangements, associates and structured entities. A number of new disclosures are also required. This standard becomes effective for annual periods beginning on or after 1 January 2013.
IFRS 13 Fair Value Measurement
IFRS 13 “Fair Value Measurement” establishes a single source of guidance under IFRS for all fair value measurements. IFRS 13 does not mandate when an entity is required to use fair value, but rather provides guidance on how to measure fair value under IFRS when fair value is required or permitted. The Group is currently assessing the impact of this standard on its financial position and performance. This standard becomes effective for annual periods beginning on or after January 01, 2013.
4. CRITICAL ACCOUNTING JUDGMENTS AND KEY SOURCES OF ESTIMATION UNCERTAINTY
The preparation of financial statements in conformity with the approved accounting standards requires the use of certain critical accounting estimates that affect the reported amounts of assets, liabilities, income and expenses. It also requires the management to exercise its judgment in the process of applying the Group’s accounting policies. Estimates and judgments are continually evaluated and are based on historical experience, including expectations of future events that are believed to be reasonable under the circumstances. The areas where various assumptions and estimates are significant to the Group’s financial statements or where judgment was exercised in application of accounting policies are as follows:
i) Classification of investments
- In classifying investments as “held-for-trading” the Group has determined securities which are acquired with the intention to trade by taking advantage of short term market / interest rate movements and are to be sold within 90 days.

Annual Report of Allied Bank Limited for the year 2012
173
Notes to the Consolidated Financial Statementsfor the year ended December 31, 2012
- In classifying investments as “held-to-maturity” the Group follows the guidance provided in SBP circulars on classifying non-derivative financial assets with fixed or determinable payments and fixed maturity. In making this judgment, the Group evaluates its intention and ability to hold such investments to maturity.
- The investments which are not classified as held for trading or held to maturity are classified as available for sale.
ii) Provision against non performing loans and advances and debt securities classified as investments
The Group reviews its loan portfolio and debt securities classified as investments to assess amount of non-performing loans and advances and debt securities and provision required there-against. While assessing this requirement various factors including the delinquency in the account, financial position of the borrower, the forced sale value of the securities and the requirements of the Prudential Regulations are considered. For portfolio provision on consumer advances, the Group follows, the general provision requirement set out in Prudential Regulations. These provisions change due to changes in requirements.
iii) Valuation and impairment of available for sale equity investments
The Group determines that available-for-sale equity investments are impaired when there has been a significant or prolonged decline in the fair value below its cost. This determination of what is significant or prolonged requires judgment. In making this judgment, the Group evaluates among other factors, the normal volatility in share price. In addition, impairment may be appropriate when there is evidence of deterioration in the financial health of the investee, industry and sector performance, changes in technology and operational and financing cash flows.
iv) Income taxes
In making the estimates for income taxes currently payable by the Group, the management looks at the current income tax laws and the decisions of appellate authorities. In determination of deferred taxes, estimates of the Group’s future taxable profits are taken into account.
v) Fair value of derivatives
The fair values of derivatives which are not quoted in active markets are determined by using valuation techniques. The valuation techniques take into account the relevant interest rates in effect at the statement of financial position date and the rates contracted.
vi) Fixed assets, depreciation and amortisation
In making estimates of the depreciation / amortisation, the management uses method which reflects the pattern in which economic benefits are expected to be consumed by the Group and estimates the useful life. The method applied and useful lives estimated are reviewed at each financial year end and if there is a change in the expected pattern or timing of consumption of the future economic benefits embodied in the assets, the estimate would be changed to reflect the change in pattern. Such a change is accounted for as change in accounting estimates in accordance with International Accounting Standard - 8, “Accounting Policies, Changes in Accounting Estimates and Errors”.
vii) Defined benefits plan
Liability is determined on the basis of actuarial advice using the Projected Unit Credit Method. The actuarial assumptions used to determine the liability and related expense are disclosed in note 36.
5. SUMMARY OF SIGNIFICANT ACCOUNTING POLICIES
The accounting policies adopted in the preparation of these consolidated financial statements of the Group are the same as those applied in the preparation of the consolidated financial statements of the Group for the year ended December 31, 2011 and of the Bank for the year ended December 31, 2012, except as stated in Note 3.3. Significant accounting policies are enumerated as follows:
5.1 Cash and cash equivalents
For the purpose of cash flow statement, cash and cash equivalents include cash and balances with treasury banks and balances with other banks (net of overdrawn Nostro balances) in current and deposit accounts.
5.2 Lendings to / borrowings from financial institutions
The Group enters into transactions of borrowing (re-purchase) from and lending (reverse re-purchase) to financial institutions, at contracted rates for a specified period of time. These are recorded as under:

174
Notes to the Consolidated Financial Statementsfor the year ended December 31, 2012
(a) Sale under re-purchase agreements
Securities sold subject to a re-purchase agreement are retained in the consolidated financial statements as investments and the counter party liability is included in borrowings from financial institutions. The differential in sale and re-purchase value is accrued on a prorata basis and recorded as interest expense.
(b) Purchase under resale agreements
Securities purchased under agreement to resell (reverse re-purchase) are included in lendings to financial institutions. The differential between the contracted price and resale price is amortised over the period of the contract and recorded as interest income.
Securities held as collateral are not recognized in the consolidated financial statements, unless these are sold to third
parties, in which case the obligation to return them is recorded at fair value as a trading liability under borrowings from financial institutions.
Other borrowings including borrowings from SBP are recorded at the proceeds received. Mark-up on such borrowings
is charged to the profit and loss account on a time proportion basis. Lendings are stated net of provision. Mark-up on such lending is charged to the profit and loss account on a time
proportion basis except mark-up on impaired/ delinquent lendings, which is recognized on receipt basis. 5.3 Investments
5.3.1 The Group at the time of purchase classifies its investment portfolio into the following categories, which are initially recognized at fair value plus the acquisition cost, except in case of held for trading investments, in which cases, these are charged off to the profit and loss account.
Investments are classified as follows: (a) Held for trading
These are securities which are either acquired for generating a profit from short-term fluctuations in market prices, interest rate movements, dealer’s margin or are securities included in a portfolio in which a pattern of short-term profit taking exists.
(b) Held to maturity
These are securities with fixed or determinable payments and fixed maturity that the Group has the positive intent and ability to hold to maturity.
(c) Available for sale
These are investments that do not fall under the held for trading or held to maturity categories. 5.3.2 In accordance with the requirements of the SBP, quoted securities, other than those classified as held to maturity and investments
in subsidiaries, are carried at market value. Investments classified as held to maturity are carried at amortized cost.
Unrealized surplus / (deficit) arising on revaluation of the Group’s held for trading investment portfolio is taken to the profit and loss account. Surplus / (deficit) arising on revaluation of quoted securities classified as available for sale is kept in a separate account shown in the statement of financial position below equity. The surplus / (deficit) arising on these securities is taken to the profit and loss account when actually realised upon disposal or when the investment is considered to be impaired.
Unquoted equity securities are valued at the lower of cost and break-up value. Subsequent increases or decreases in the carrying value are credited/charged to profit and loss account. Break-up value of equity securities is calculated with reference to the net assets of the investee company as per the latest available audited financial statements. Investments in other unquoted securities are valued at cost less impairment losses, if any.
Provision for diminution in the value of securities (except for debentures, participation term certificates and term finance certificates) is made after considering impairment, if any, in their value. Provision for diminution in value of debentures, participation term certificates and term finance certificates are made in accordance with the requirements of Prudential Regulations issued by SBP.
Associates as defined under local statutes but not under IAS are accounted for as ordinary investments. All “regular way” purchases and sales of investments are recognized on the trade date, i.e., the date that the Group commits to
purchase or sell the asset. Regular way purchases or sales are purchases or sales of investments that require delivery of assets within the time frame generally established by regulation or convention in the market place.

Annual Report of Allied Bank Limited for the year 2012
175
Notes to the Consolidated Financial Statementsfor the year ended December 31, 2012
5.4 Advances (including net investment in finance lease)
Advances are stated net of general and specific provisions. Specific provision against funded loans is determined in accordance with the requirements of the Prudential Regulations issued by the SBP and charged to the profit and loss account. General provision is maintained on consumer portfolio in accordance with the requirements of Prudential Regulations issued by SBP and charged to the profit and loss account.
Leases, where the Group transfers substantially all the risks and rewards incidental to the ownership of an asset to the lessee are classified as finance leases. A receivable is recognized at an amount equal to the present value of the minimum lease payments, including un-guaranteed residual value, if any. Finance lease receivables are included in advances to the customers.
Advances are written off when there are no realistic prospects of recovery. 5.5 Operating fixed assets and depreciation
Tangible assets
Property and equipment owned by the Group, other than land which is not depreciated, are stated at cost or revalued amount less accumulated depreciation and impairment losses, if any. Land is carried at revalued amount.
Depreciation is calculated using the straight line method, except buildings which are depreciated using the reducing balance
method, to write down the cost / carrying value of property and equipment to their residual values over their estimated useful lives. The rates at which the fixed assets are depreciated are disclosed in note 11.2. The residual values, useful lives and depreciation methods are reviewed and changes, if any, are treated as change in accounting estimates, at the date of statement of financial position.
Depreciation on additions is charged from the month the assets are available for use, while no depreciation is charged in the month
in which the assets are disposed off. Surplus arising on revaluation of fixed assets is credited to surplus on revaluation of fixed assets account. Deficit arising on
subsequent revaluation of fixed assets is adjusted against the balance in the above mentioned surplus account as allowed under the provisions of the Companies Ordinance, 1984. The surplus on revaluation of fixed assets to the extent of incremental depreciation charged on the related assets, is transferred directly to unappropriated profit (net of deferred tax).
Revaluation is carried out with sufficient regularity to ensure that the carrying amount of assets does not differ materially from
their fair value. An item of property and equipment is derecognized upon disposal or when no future economic benefits are expected from its
use or disposal. Any gain or loss arising on derecognition of the asset is recognized in the profit and loss account in the year the asset is derecognized, except that the related surplus on revaluation of fixed assets (net of deferred tax) is transferred directly to unappropriated profit.
Subsequent costs are included in the asset’s carrying amount only when it is probable that future economic benefits associated with
the item will flow to the Group and the cost of the item can be measured reliably. All other repairs and maintenance are charged to the profit and loss account.
Intangible assets
Intangible assets are carried at cost less any accumulated amortization and impairment losses, if any. The cost of intangible assets is amortized over their estimated useful lives, using the straight line method. Amortization is charged from the month the assets are available for use at the rate stated in note 11.3. The useful lives are reviewed and adjusted, if appropriate, at the date of statement of financial position.
Capital work-in-progress
Capital work- in- progress is stated at cost less impairment losses, if any. 5.6 Taxation
Current
Provision for current taxation is based on taxable income for the year determined in accordance with the prevailing laws for taxation on income earned. The charge for current tax is calculated using the prevailing tax rates or tax rates expected to apply to the profits for the year. The charge for current tax also includes adjustments, where considered necessary relating to prior years, arising from assessments finalised during the year for such years.
176
Deferred
Deferred tax is recognized using the balance sheet liability method on all temporary differences, at the reporting date between the amounts attributed to assets and liabilities for financial reporting purpose and amounts used for taxation purposes. Deferred tax is calculated at the rates that are expected to apply to the periods when the difference will reverse, based on tax rates that have been enacted or substantially enacted at the reporting date.
Deferred tax assets are recognized only to the extent that it is probable that future taxable profits will be available against which the assets can be utilized. Deferred tax assets are reduced to the extent that it is no longer probable that the related tax benefit will be realised.
The Group also recognizes a deferred tax asset / liability on deficit / surplus on revaluation of fixed assets and securities which is adjusted against the related deficit / surplus in accordance with the requirements of IAS-12 “Income Taxes”.
5.7 Staff retirement and other benefits
5.7.1 The Bank (Holding Company) - Staff retirement schemes
a) For employees who opted for the new scheme introduced by the management: An approved pension scheme (defined benefit scheme) under which the benefits on the basis of frozen basic salary
service and age as on June 30, 2002 are payable to all employees whose date of joining the Bank is on or before July 01, 1992 i.e., who have completed 10 years of service as on June 30, 2002; and
An approved gratuity scheme (defined benefit scheme) under which the benefits are payable as under: i) For members whose date of joining the Bank is on or before July 01, 1992, their services would be calculated
starting from July 01, 2002 for gratuity benefit purposes. ii) For members whose date of joining the Bank is after July 01, 1992 their services would be taken at actual for the
purpose of calculating the gratuity benefit. A Contributory Provident Fund scheme to which equal contribution are made by the Bank and the employees (defined
contribution scheme). b) For employees who did not opt for the new scheme:
An approved pension scheme (defined benefit scheme) under which the benefits on the basis of frozen basic salary as on June 30, 2002 are payable to all employees opting continuation of the previous scheme and whose date of joining the Bank is on or before July 01, 1992, i.e., who had completed ten years of service as on June 30, 2002.
Until December 31, 2008, the Bank operated a contributory benevolent fund, which was discontinued for active
employees. Existing employees were also given an option to settle their monthly grant with a lump sum payment. Those who have not opted for the lump sum option will continue to receive benevolent grant (defined benefit scheme).
c) Post retirement medical benefits
The Bank provides post retirement medical benefits to eligible retired employees. Provision is made annually to meet the cost of such medical benefits on the basis of actuarial valuation carried out using the Projected Unit Credit Method.
Annual contributions towards the defined benefit schemes are made on the basis of actuarial valuation carried out using the
Projected Unit Credit Method. Actuarial gains/losses arising from experience adjustments and changes in actuarial assumptions are amortized over the future expected remaining working lives of the employees, to the extent of the greater of ten percent of the present value of the defined benefit obligations at that date (before deducting plan assets) and ten percent of the fair value of any plan assets at that date.
5.7.2 The subsidiary - defined contribution plan
The subsidiary company operates an approved provident fund for its permanent employees. Equal monthly contributions to the fund are made both by the company and its employees at the rate of 10% each of the basic salary per month.
5.7.3 Group - Other benefits
Employees’ compensated absences
Group employees’ entitlement to annual leave is recognised when they accrue to employees. A provision is made for estimated liability for annual leaves as a result of services rendered by the employee against unavailed leaves, as per terms of service contract, up to the reporting date, based on actuarial valuation using Projected Unit Credit Method.
Notes to the Consolidated Financial Statementsfor the year ended December 31, 2012

Annual Report of Allied Bank Limited for the year 2012
177
5.8 Assets acquired in satisfaction of claims
The Group occasionally acquires assets in settlement of certain advances. These are stated at lower of the carrying value of the related advances and the current fair value of such assets.
5.9 Deposits
Deposits are initially recorded at the amount of proceeds received. Mark-up accrued on deposits is recognized separately as part of other liabilities and is charged to the profit and loss account on a time proportion basis.
5.10 Subordinated loans
Subordinated loans are initially recorded at the amount of proceeds received. Mark-up accrued on these loans is recognized separately as part of other liabilities and is charged to the profit and loss account on a time proportion basis.
5.11 Impairment
At each reproting date, the Group reviews the carrying amount of its assets (other than deferred tax assets) to determine whether there is an indication that those assets have suffered an impairment loss. If any such indication exists, the recoverable amount of assets is estimated in order to determine the extent of the impairment loss, if any. Recoverable amount is the greater of net selling price and value in use. If the recoverable amount of an asset is estimated to be less than its carrying amount, the carrying amount of the assets is reduced to its recoverable amount. The resulting impairment loss is recognized as an expense immediately, except for the impairment loss on revalued fixed assets which is adjusted against the related revaluation surplus to the extent that the impairment loss does not exceed the surplus on revaluation of those assets.
For assets excluding goodwill, an assessment is made at each reporting date as to whether there is any indication that previously recognised impairment losses may no longer exist or may have decreased. If such indication exists, the Group estimates the asset’s or cash-generating unit’s recoverable amount. A previously recognized impairment loss is reversed only if there has been a change in the assumptions used to determine the asset’s recoverable amount since the last impairment loss was recognised. The reversal is limited so that the carrying amount of the asset does not exceed its recoverable amount, nor exceed the carrying amount that would have been determined, net of depreciation, had no impairment loss been recognised for the asset in prior years. Such reversal is recognised in the profit and loss account unless the asset is carried at a revalued amount, in which case the reversal is treated as a revaluation increase.
5.12 Provisions
Provisions are recognized when the Group has a present obligation (legal or constructive) as a result of past events and it is probable that an outflow of resources embodying economic benefits will be required to settle the obligation and a reliable estimate of the amount can be made.
Provision against identified non-funded losses is recognized when intimated and reasonable certainty exists for the Group to settle the obligation. The loss is charged to the profit and loss account net of expected recovery and is classified under other liabilities.
Provisions are reviewed at the reporting date and are adjusted to reflect the current best estimate. 5.13 Dividend distribution and appropriations
Bonus and cash dividend and other appropriations (except for the appropriations required by law), declared / approved subsequent to the reporting date are considered as non-adjusting event and are not recorded in consolidated financial statements of the current year. These are recognized in the period in which these are declared / approved.
5.14 Foreign currencies
a) Foreign currency transactions
Transactions in foreign currencies are translated into rupees at the foreign exchange rates ruling on the transaction date. Monetary assets and liabilities in foreign currencies are expressed in rupee terms at the rates of exchange ruling on the reporting date. Foreign bills purchased are valued at spot rate and forward foreign exchange contracts are valued at forward rates applicable to their respective maturities.
b) Foreign operations
The assets and liabilities of foreign wholesale bank branch are translated to Pakistan Rupee at exchange rates prevailing at reporting date. The results of foreign operations are translated at the average rate of exchange.
Notes to the Consolidated Financial Statementsfor the year ended December 31, 2012

178
c) Translation gains and losses
Translation gains and losses arising on revaluation of net investments in foreign operations are taken to equity under “Exchange Translation Reserve” through Other Comprehensive Income and on disposal are recognised in profit and loss account.
d) Commitments
Commitments for outstanding forward foreign exchange contracts disclosed in these financial statements are translated at forward rates applicable to their respective maturities. Contingent liabilities / commitments for letters of credit and letters of guarantee denominated in foreign currencies are expressed in rupee terms at the rates of exchange ruling on the reporting date.
5.15 Financial instruments
5.15.1 Financial assets and liabilities
Financial assets and financial liabilities are recognised at the time when the Group becomes a party to the contractual provision of the instrument. Financial assets are de-recognised when the contractual right to future cash flows from the asset expires or is transferred along with the risk and reward of the asset. Financial liabilities are de-recognised when obligation specific in the contract is discharged, cancelled or expired. Any gain or loss on de-recognition of the financial asset and liability is recognised in the profit and loss account of the current period. The particular recognition and subsequent measurement methods adopted for significant financial assets and financial liabilities are disclosed in the individual policy statements associated with them.
5.15.2 Derivative financial instruments
Derivative financial instruments are initially recognized at fair value on the date on which the derivative contract is entered into and are subsequently re–measured at fair value using appropriate valuation techniques. All derivative financial instruments are carried as assets when fair value is positive and liabilities when fair value is negative. Any change in the fair value of derivative financial instruments is taken to the profit and loss account.
5.16 Off setting
Financial assets and financial liabilities are set off and the net amount is reported in the consolidated financial statements when there is a legally enforceable right to set off and the Group intends to either settle on a net basis, or to realize the assets and to settle the liabilities simultaneously.
5.17 Revenue recognition
Revenue is recognized to the extent that the economic benefits will flow to the Group and the revenue can be reliably measured. These are recognised as follows:
a) Advances and investments
Mark-up/return on regular loans / advances and investments is recognized on a time proportion basis. Where debt securities are purchased at premium or discount, the same is amortized through the profit and loss account using the effective interest rate method.
Interest or mark-up recoverable on classified loans and advances and investments is recognized on receipt basis. Interest /
return / mark-up on classified rescheduled / restructured loans and advances and investments is recognized as permitted by the regulations of the SBP.
Dividend income is recognized when the right to receive the dividend is established.
Gains and losses on sale of investments are recognized in the profit and loss account. b) Lease financing
Financing method is used in accounting for income from lease financing. Under this method, the unearned lease income (excess of the sum of total lease rentals and estimated residual value over the cost of leased assets) is deferred and taken to income over the term of the lease period so as to produce a constant periodic rate of return on the outstanding net investment in lease. Unrealised income on classified leases is recognized on receipt basis.
Gains / losses on termination of lease contracts and other lease income are recognized when realized. c) Fees, brokerage and commission
Fees, brokerage and commission on letters of credit / guarantee and other services are amortized over the tenure of the respective facility, whereas account maintenance and service charges are recognized when realized.
Notes to the Consolidated Financial Statementsfor the year ended December 31, 2012

Annual Report of Allied Bank Limited for the year 2012
179
Notes to the Consolidated Financial Statementsfor the year ended December 31, 2012
5.18 Segment reporting
A segment is a distinguishable component of the Group that is subject to risks and rewards that are different from those of other segments. A business segment is one that is engaged either in providing certain products or services, whereas a geographical segment is one engaged in providing certain products or services within a particular economic environment. Segment information is presented as per the Group’s functional structure and the guidance of State Bank of Pakistan. The Group comprises of the following main business segments:
5.18.1 Business segments
a) Corporate finance
This includes investment banking activities such as mergers and acquisitions, underwriting, privatization, securitization, Initial Public Offers (IPOs) and secondary private placements.
b) Trading and sales
This segment undertakes the treasury, money market and capital market activities. c) Retail banking
Retail banking provides services to small borrowers i.e. consumers, small and medium enterprises (SMEs) and borrowers’ agriculture sector. It includes loans, deposits and other transactions with retail customers.
d) Commercial banking
This includes loans, deposits and other transactions with corporate customers. e) Payment and settlement
This includes payments and collections, funds transfer, clearing and settlement with the customers. f ) Asset Management
This includes services of funds management and investment related activities. 5.18.2 Geographical segments
The Group operates in three geographical regions being: - Pakistan - Karachi Export Processing Zone - Middle East 5.19 Earnings per share
The Group presents earnings per share (EPS) data for its ordinary shares. EPS is calculated by dividing the profit or loss attributable to ordinary shareholders of the Group by the weighted average number of ordinary shares outstanding during the year.

180
Note December 31, December 31, 2012 2011
Rupees in ‘000
6. CASH AND BALANCES WITH TREASURY BANKS
In hand
Local currency 7,331,911 6,160,188 Foreign currencies 477,152 373,486 7,809,063 6,533,674 Remittances in transit 549,050 608,439 With State Bank of Pakistan (SBP) in Local currency current accounts 6.1 18,172,815 15,036,087 Foreign currency current account 6.2 4,382 2,040 18,177,197 15,038,127 Foreign currency deposit accounts - Non remunerative 6.3 1,900,744 1,778,924 - Remunerative 6.3 & 6.4 5,702,231 5,336,771 7,602,975 7,115,695
With National Bank of Pakistan in Local currency current accounts 9,143,240 7,138,145 National Prize Bonds 70,178 45,685 43,351,703 36,479,765 6.1 Deposits with the SBP are maintained to comply with the statutory requirements issued from time to time. 6.2 This represents US Dollar settlement account maintained with SBP. 6.3 This represents cash reserve and special cash reserve maintained with the SBP to comply with their statutory requirements issued
from time to time. 6.4 This represents special cash reserve requirement maintained with the SBP. The return on this account is declared by the SBP on a
monthly basis and, as at December 31, 2012, carries mark-up at the rate of 0% (2011: 0%) per annum. Note December 31, December 31, 2012 2011
Rupees in ‘000
7. BALANCES WITH OTHER BANKS
In Pakistan
On current accounts 289 320
Outside Pakistan
On current accounts 7.1 609,478 682,349
On deposit accounts 419,525 996,452
1,029,292 1,679,121
7.1 Included in Nostro accounts are balances, aggregating to Rs. 136.808 million (2011: Rs. 131.749 million), representing balances held
with a related party outside Pakistan.
Note December 31, December 31, 2012 2011
Rupees in ‘000
8. LENDINGS TO FINANCIAL INSTITUTIONS Repurchase agreement lendings (Reverse Repo) 8.1 & 8.5 8,270,935 1,361,754
Certificates of investment 8.2 520,000 70,000 Call money lendings 8.3 2,000,000 - 8.4 10,790,935 1,431,754 Provision against lendings to financial institutions 8.6 (70,000) (70,000) 10,720,935 1,361,754
Notes to the Consolidated Financial Statementsfor the year ended December 31, 2012

Annual Report of Allied Bank Limited for the year 2012
181
8.1 These are short-term lendings to various financial institutions against the government securities shown in note 8.5 below. These carry mark-up at rates ranging from 8.99% to 9.95% (2011: 11.90%) per annum and will mature on various dates, latest by February 4, 2013.
8.2 This represents certificate of investment of financial institution carrying markup at the rate of 9.35% (2011: Nil) and will mature on
February 6, 2013. This also includes a classified Certificate of Investment amounting to Rs. 70 million. 8.3 These call money lendings carry markup at rate of 9.75% (2011: Nil) and will mature on various dates latest by February 1, 2013. December 31, December 31, 2012 2011
Rupees in ‘000
8.4 Particulars of lending
In local currency 10,790,935 1,431,754 In foreign currencies - - 10,790,935 1,431,754 8.5 Securities held as collateral against lending to Financial Institutions December 31, 2012 December 31, 2011 Further Further Held by given as Held by given as Bank collateral Total Bank collateral Total
Rupees in ‘000 Market Treasury Bills 8,270,935 - 8,270,935 1,361,754 - 1,361,754 8,270,935 - 8,270,935 1,361,754 - 1,361,754
December 31, December 31, 2012 2011
Rupees in ‘000
8.6 Particulars of provision
Opening balance 70,000 - Charge for the year - 70,000 Reversal - - Net charge - 70,000 Closing balance 70,000 70,000
Notes to the Consolidated Financial Statementsfor the year ended December 31, 2012

182
9. INVESTMENTS December 31, 2012 December 31, 2011
Note Held by Given as Held by Given as Group collateral Total Group collateral Total
Rupees in ‘000
9.1 Investments by types Held-for-trading securities
Units of open-end mutual funds - related party 679,962 - 679,962 446,148 - 446,148
Term Finance Certificates 14,745 - 14,745 - - -
694,707 - 694,707 446,148 - 446,148
Available-for-sale securities
Market treasury bills 187,405,619 18,472,671 205,878,290 92,151,063 29,859,590 122,010,653
Pakistan investment bonds 147,813 - 147,813 147,290 - 147,290
Ordinary shares of listed companies /
certificates of mutual funds 14,788,340 - 14,788,340 10,727,056 - 10,727,056
Preference shares 149,355 - 149,355 149,355 - 149,355
Units of open end mutual funds 831,219 - 831,219 5,210,776 - 5,210,776
Ordinary shares of unlisted companies 1,692,292 - 1,692,292 1,643,673 - 1,643,673
Investment in related parties
- Unlisted shares 221,295 - 221,295 242,496 - 242,496
- Units of open end mutual funds 100,000 - 100,000 13,690,232 - 13,690,232
Sukuk bonds 3,216,409 - 3,216,409 3,598,872 - 3,598,872
Term finance certificates (TFCs) 2,783,904 - 2,783,904 3,395,447 - 3,395,447
211,336,246 18,472,671 229,808,917 130,956,260 29,859,590 160,815,850
Held-to-maturity securities
Pakistan investment bonds 26,818,371 - 26,818,371 27,574,628 - 27,574,628
Foreign currency bonds (US$) 2,612,263 - 2,612,263 1,591,392 - 1,591,392
TFCs, Bonds and PTCs 4,553,290 - 4,553,290 5,766,862 - 5,766,862
33,983,924 - 33,983,924 34,932,882 - 34,932,882
Investment at cost 246,014,877 18,472,671 264,487,548 166,335,290 29,859,590 196,194,880
Provision for diminution in the
value of investments 9.3 (1,947,781) - (1,947,781) (2,703,761) - (2,703,761)
Investment (net of provisions) 244,067,096 18,472,671 262,539,767 163,631,529 29,859,590 193,491,119
Surplus on revaluation of
held-for-trading securities 69,700 - 69,700 6,030 - 6,030
Surplus on revaluation of
available-for-sale securities 21.2 4,985,626 87,586 5,073,212 2,264,670 27,819 2,292,489
Total investments at market value 249,122,422 18,560,257 267,682,679 165,902,229 29,887,409 195,789,638
Notes to the Consolidated Financial Statementsfor the year ended December 31, 2012

Annual Report of Allied Bank Limited for the year 2012
183
Note December 31, December 31, 2012 2011
Rupees in ‘000
9.2 INVESTMENTS BY SEGMENTS:
Federal Government Securities: - Market Treasury Bills 9.2.1 - 9.2.3 205,878,290 122,010,653 - Pakistan Investment Bonds 9.2.1 26,966,184 27,721,918 - Foreign Currency Bonds (US$) 9.2.4 2,612,263 1,591,392 Fully paid up ordinary shares of listed companies / certificates of mutual funds 9.4 14,788,340 10,727,056 Fully paid up ordinary shares of unlisted companies 9.5 1,913,587 1,886,169 Investment in units of open end mutual funds 9.6 1,611,181 19,347,156 Fully paid up preference shares 9.7 149,355 149,355 Term Finance Certificates (TFCs), Bonds and Participation Term Certificates: Term Finance Certificates -Listed 9.8 1,871,823 2,165,895 -Unlisted 9.8 2,127,734 3,459,231 Sukuk Bonds 9.9 6,568,791 7,135,252 Participation Term Certificates 9.10 - 803 Total investments at cost 264,487,548 196,194,880 Less: Provision for diminution in the value of investments 9.3 (1,947,781) (2,703,761) Investments (net of provisions) 262,539,767 193,491,119 Surplus on revaluation of available-for-sale securities 21.2 5,073,212 2,292,489 Unrealized loss on revaluation of Held-for-trading securities 9.12 69,700 6,030 Total investments at market value 267,682,679 195,789,638 9.2.1 Principal terms of investments in Federal Government Securities Name of investment Maturity Redemption Period Coupon
Market Treasury Bills January, 2013 To November, 2013 On maturity At maturity Foreign Currency Bonds (US$) March, 2016 To June, 2017 On maturity Half Yearly Pakistan Investment Bonds 30 June 2013 To 18 Aug, 2016 On maturity Half Yearly 9.2.2 Included herein are Market Treasury Bills having a book value of Rs.18,132.871 million (2011: Rs. 29,519.79 million), given as
collateral against repurchase agreement borrowings from financial institutions.
9.2.3 Included herein are Market Treasury Bills having a face value of Rs. 339.80 million (2011: Rs 339.80 million), held by the SBP and National Bank of Pakistan against Demand Loan and TT / DD discounting facilities sanctioned to the Group.
Notes to the Consolidated Financial Statementsfor the year ended December 31, 2012

184
9.2.4 Investment in Foreign Currency Bonds
Name of Bond Coupon Rate Date of Date of Coupon Redemption December 31, December 31, Issue Maturity Due Period 2012 2011
US $ Bonds Rupees in ‘000
Euro Dollar Bond ($3,000,000) 7.125% 01-Oct-09 31-Mar-16 31-Mar-13 6.5 Years 270,291 245,360 Euro Dollar Bond ($3,200,000) 7.125% 24-May-10 31-Mar-16 31-Mar-13 5.9 Years 299,390 274,465 Euro Dollar Bond ($16,257,000) 7.125% 30-Mar-06 31-Mar-16 31-Mar-13 10 Years 1,444,079 1,071,567 Euro Dollar Bond ($7,500,000) 6.875% 31-May-07 01-Jun-17 31-May-13 10 Years 598,503 - 2,612,263 1,591,392
Note December 31, December 31, 2012 2011
Rupees in ‘000
9.3 Particulars of provision Opening balance 2,703,761 2,681,810 Charge for the year 55,856 344,752 Reversals (679,197) (115,749) Net charge (623,341) 229,003 Reversal as gain on disposal (132,243) (75,417) Amounts written off (396) (131,635) Closing balance 9.3.1 1,947,781 2,703,761 9.3.1 Particulars of provision in respect of type and segment By type Available-for-sale securities Ordinary shares / certificates of listed companies 400,596 505,639 Ordinary shares of unlisted companies 62,154 7,050 Preference shares 149,355 149,355 Units of open end mutual fund 121,906 148,764 Sukuk Bonds 20,757 23,731 Term Finance Certificates - 108,631 754,768 943,170 Held-to-maturity securities TFCs, Bonds and PTCs 1,193,013 1,760,591 1,947,781 2,703,761 By Segment Fully Paid up Ordinary Shares: - Listed companies 400,596 505,639 - Unlisted companies 62,154 7,050 - Preference Shares 149,355 149,355 612,105 662,044 Units of open end mutual fund 121,906 148,764 Term Finance Certificates, Bonds and Participation Term Certificates: Bonds 1,105,348 1,171,678 Term Finance Certificates 108,422 720,472 Participation Term Certificates - 803 1,213,770 1,892,953 1,947,781 2,703,761
Notes to the Consolidated Financial Statementsfor the year ended December 31, 2012

Annual Report of Allied Bank Limited for the year 2012
185
9.4 Investments in Listed Shares / Certificates of Mutual Funds
Cost 2012 2011
Name of Company / Mutual Fund per share / No. of shares / No. of shares / certificate certificates Total Cost certificates Total Cost
Rupees Rupees in ‘000 Rupees in ‘000 Available for Sale Agritech Limited 12.59 13,961,851 175,755 - - Attock Petroleum Limited 489.40 975,000 477,161 760,179 297,164 D.G.Khan Cement Limited 37.43 12,326,141 461,368 11,859,786 278,093 Fatima Fertilizer Company 21.27 54,995,000 1,169,939 50,000,000 927,047 Fauji Fertilizer Company 79.18 29,999,275 2,375,261 27,241,010 2,523,073 First Equity Modaraba 1.24 519,914 645 519,914 645 Habib Bank Limited - - - 2,319,067 242,587 Hub Power Company Limited 36.51 112,000,000 4,089,011 53,372,029 1,856,665 Lucky Cement Limited 146.34 3,450,000 504,884 10,015,000 822,101 MCB Bank Limited - - - 1,308,721 209,980 Namco Balanced Fund 4.37 2,205,360 9,640 2,160,000 9,640 National Refinery Limited - - - 784,960 241,464 Nishat (Chunian) Limited 18.12 17,560,603 318,244 15,964,185 256,353 Nishat Chunian Power Limited 10.00 30,000,000 300,000 30,000,000 300,000 Nishat Chunian Power Limited (underwriting) - - - 6,700,000 96,480 Nishat Mills Limited - - - 5,000,000 232,681 Nishat Power Limited 10.72 34,813,894 373,302 30,000,000 300,000 Otsuka Pakistan Limited 34.92 95,517 3,335 95,517 3,335 Pakistan International Containers Limited - - - 57,734 577 Pakistan Oil field Limited 380.28 8,876,000 3,375,364 5,170,307 1,527,373 Pakistan Petroleum Limited 159.35 1,556,500 248,029 1,249,714 225,708 PICIC Growth Mutual Fund 13.48 27,577,717 371,851 26,765,844 361,635 Pioneer Cement Limited 5.97 106,784 638 106,784 638 Safe Way Mutual Funds 8.63 1,601,045 13,817 1,601,045 13,817 United Bank limited 74.30 7,000,000 520,096 - - 14,788,340 10,727,056
Notes to the Consolidated Financial Statementsfor the year ended December 31, 2012
9.5 Investment in Un-Listed Shares Name of Company Percentage of No. of Break-up Value Paid up Value Cost Based on audited Name of Chief
Holding shares per shares per share accounts Executive/Managing as at Agent Rupees ‘000
Arabian Sea Country Club Limited - related party 6.45% 500,000 8.72 10 5,000 30-Jun-12 Mr. Arif Ali Khan Abbasi Atlas Power Limited 7.49% 35,500,000 17.06 10 355,000 30-Jun-12 Mr. Maqsood Ahmed Basraa Burj Bank Limited 2.00% 14,833,333 7.83 10 148,333 31-Dec-11 Mr. Ahmed Khizer Khan Central Depository Company 1.00% 650,000 26.05 10 40,300 30-Jun-12 Mr. Muhammad Hanif Jakhura First Women Bank Limited 7.16% 7,734,926 15.92 10 21,200 31-Dec-11 Ms. Shafqat Sultana Habib Allied International Bank - related party 9.50% 2,375,000 310.23 157 214,769 31-Dec-11 Mr. Anwar M. Zaidi Islamabad Stock Exchange* 0.83% 3,034,603 10.65 10 30,346 30-Jun-12 Mr. Mian Ayyaz Afzal Lahore Stock Exchange* 0.66% 843,975 11.32 10 8,440 31-Dec-12 Mr. Aftab Ahmed Ch. National Institutional Facilitation Technologies (Private) Limited (NIFT) - related party 13.57% 1,478,228 62.01 10 1,527 30-Jun-12 Mr. Muzaffar M khan Pakistan Agricultural Storage and Services Corporation Limited (PASSCO) 3.33% 1,000 - 1,000 1,000 31-Mar-12 Maj. Gen M. Tauqeer Ahmed Security General Insurance Life 18.22% 12,401,871 104.81 10 1,075,652 31-Dec-11 Mr. Nabiha Shahnawaz SME Bank Limited. 0.32% 774,351 7.80 10 5,250 31-Dec-11 Mr. Ihsan Ul Haq Khan SWIFT 9.00% 10 336,201 176,591 1,770 31-Dec-11 Mr. Gottfried Leibbrandt Eastern Capital Limited - 500,000 - - 5,000 30-Jun-07 Under liquidation 1,913,587 *These shares have been acquired according to the requirments of “The Stock Exchanges (Corporation, Demutualization and Integration) Act, 2012” (“The Act”).

186
Notes to the Consolidated Financial Statementsfor the year ended December 31, 2012
9.6 Detail of Investment in Open Ended Mutual Funds
Name of Company No. of Units Paid-up Total Cost value per 2012 2011 Certificate 2012 2011 Rupees Rupees in ‘000
ABL Cash Fund- related party 28,034,167 925,520,133 10 267,722 9,381,246
ABL Government Securites Fund- related party 20,099,680 50,000,000 10 179,140 775,000
ABL Income Fund- related party 5,567,533 374,529,738 10 50,092 3,798,213
ABLStock Fund- related party 13,135,682 10,000,000 10 124,579 124,395
ABL Islamic Cash Fund - related party 6,467,133 5,820,385 10 58,429 57,526
ABL AMC Capital Protected Fund - related party 10,034,700 - 10 100,000 -
AH Dow Jones Safe Pak Titans - 400,000 50 - 20,000
Atlas Money Market Fund - 99,502 500 - 50,000
AMZ Plus Income Fund - 108,786 100 - 10,707
Crosby Phoenix Fund - 192,381 100 - 20,000
HBL Money market Fund - 9,645,387 100 - 1,000,000
JS Aggressive Income Fund - 1,015 100 - -
KASB Income Opportunity Fund 1,345,614 3,468,894 100 121,906 325,019
KASB Cash Fund 1,459,700 - 100 150,000 -
Lakson Money Market Fund - 2,490,957 100 - 250,000
MCB Cash Optimizer Fund - 14,908,432 100 - 1,500,000
Meezan Cash Fund - 9,972,078 100 - 500,000
NAFA Income Opportunity Fund 58,950,235 82,680,350 10 559,313 785,050
UBL Liquidity Plus Fund - 7,433,989 100 - 750,000
1,611,181 19,347,156
First Dawood Investment Bank Limited 9.7.1 13.88% 9,935,500 10 99,355 99,355 30 June 12 Mr. Rasheed Y. Chinoy Trust Investment Bank Limited 9.7.2 16.31% 5,000,000 10 50,000 50,000 30 June 12 Mr. Shahid Iqbal 149,355 9.7.1 These preference shares issued in June 09, carry preference dividend @ 4% on cumulative basis and are redeemable at par after
five years, non-voting, non-participatory and have a call option available to the issuer after two years from the date of issue and conversion option available to the Group, into ordinary shares at par value of Rs. 10 along with cumulative dividend at any time after issuance.
9.7.2 These preference shares carry dividend @ 1 Year KIBOR plus 100 BPS on cumulative basis, and are non-voting with call option
available to the issuer and conversion option available to the Group, after completion of three years from the date of issue.
Percentage of No. of Paid-up Total paid- Total Cost Based on Name of Chief Name of Company Note Holding certificates Value per up value December audited Executive/ certificate 31, 2012 accounts Managing as at Agent
Rupees Rupees in ‘000
9.7 Detail of Investment in Preference Shares

Annual Report of Allied Bank Limited for the year 2012
187
9.8 Detail of Investment in TFCs Name of Company No. of Units Paid-up Total Cost value per 2012 2011 Certificate 2012 2011
Rupees Rupees in ‘000
Listed Standard Chartered Bank (Pakistan) Limited 10,000 10,000 5,000 12,500 34,960 Faysal Bank Limited 70,000 70,000 5,000 349,720 349,860 United Bank Limited-3rd Issue 10,000 10,000 5,000 33,267 49,900 United Bank Limited -4th Issue 37,000 37,000 5,000 184,667 184,741 PakArab Fertilizers Limited 84,080 84,080 5,000 126,120 311,096 Azgard Nine Limited 1,300 1,300 5,000 1,573 4,327 Orix Leasing Pakistan Limited 1,500 1,500 5,000 - 1,230 NIB Bank Limited 76,789 76,789 5,000 383,254 383,407 United Bank Limited-PPTFC 122,558 122,558 5,000 611,687 611,932 Telecard Limited 75,888 75,888 5,000 139,290 139,444 Pakistan Mobile Communication Limited 6,000 15,000 5,000 29,745 75,000 Engro Fertilizers Limited - 4,000 5,000 - 19,998 1,871,823 2,165,895 Unlisted Askari Bank Limited 20,000 30,000 5,000 99,880 149,920 (Chief Executive: Mr. M. R. Mehkari) Faysal Bank Limited (Royal Bank Of Scotland) 7,000 7,000 5,000 8,729 17,465 (Chief Executive: Mr. Naved A. Khan) Orix Leasing Pakistan Limited 23,000 23,000 100,000 383,333 1,150,000 (Chief Executive: Mr. Teizoon Kissat) Escort Investment Bank Limited 20,000 20,000 5,000 19,984 29,976 (Chief Executive: Ms. Shazia Bashir) Financial Receivable Securitization Company Limited - A 14,579 14,579 100,000 18,216 30,360 (Chief Executive: Mr. Munaf Ibrahim) Financial Receivable Securitization Company Limited - B 6,421 6,421 5,000 12,025 20,042 (Chief Executive: Mr. Munaf Ibrahim) Dewan Farooque Spinning Mills Limited 25,000 25,000 5,000 30,274 31,250 (Chief Executive: Mr. Dewan Abdul Baqi Farooqui) Al-Abbas Sugar Industries 25,000 25,000 5,000 24,950 49,950 (Chief Executive: Mr. Shunaid Qureshi) Javedan Cement Limited (Formerly Al-Abbas Holding (Private) Limited) - 5,750 100,000 - 499,702 (Chief Executive: Mr. Samad A. Habib) Javedan Cement Limited (Formerly Ghani Holding (Private) Limited) - 5,750 100,000 - 499,702 (Chief Executive: Mr. Samad A. Habib) Javedan Cement Limited - 2,500 100,000 - 217,262 (Chief Executive: Mr. Samad A. Habib) Khairpur Sugar Mills Limited 13 13 55,536 (Chief Executive: Muhammad Mubeen Jumani) 1 1 55,538 5 5 337,000 1 1 337,077 454 670 Bachani Sugar Mills Limited 23 23 135,227 (Chief Executive: Mr. Najmuddin Ansari) 1 1 135,236 14 14 1,526,874 13 13 655,656 1 1 655,657 10,999 12,667 Frontier Ceramics Limited - 15 117,000 (Chief Executive: Mr. Omer Khalid) - 1 118,846 - 13 224,000 - 1 217,221 - 13 113,000 - 1 113,960 - 955
Notes to the Consolidated Financial Statementsfor the year ended December 31, 2012

188
Notes to the Consolidated Financial Statementsfor the year ended December 31, 2012
Name of Company No. of Units Paid-up Total Cost value per 2012 2011 Certificate 2012 2011
Rupees Rupees in ‘000
9.10 Detail of Investment in Participation Term Certificates - (fully provided) Name of the Borrower No. of Certificates Value per Cost
2012 2011 Certificate 2012 2011
Rupees in ‘000
Pangrio Sugar Mills Limited - 15 236,000 (Chief Executive: Mr. Sajid Hussain Naqvi) - 1 240,000 - 1 168,000 - 13 169,000 - 803 - 803
9.9 Detail of Investment in Bonds
Name of Bond / Sukuk Coupon Rate Date of Issue Date of Coupon Coupon Cost
Maturity Due Date Frequency 2012 2011
Rupees in ‘000
Sukuk Bonds
Security Leasing Corporation Limited 6 MK+2% Jan-07 Jan-22 Jan-13 Monthly 83,027 94,922
Century Paper & Board Mills Limited Last 5 Days 6 Month
avg K+1.35% Sep-07 Sep-14 Mar-13 Half Yearly 460,000 690,000
K.S. Sulemanji Esmailji & Sons Limited 3 MK+2.4% Jun-08 Jun-18 Jan-13 Quarterly 79,760 79,760
Liberty Power Technology Limited 3 MK+3% Mar-09 Jan-21 Jan-13 Half Yearly 2,297,047 2,689,191
Liberty Power Technology Limited 3 MK+3% Nov-10 Jan-21 Jan-13 Half Yearly 256,575 -
Al-Zamin Leasing Modaraba 6 MK+1.9% May-08 May-12 May-13 Half Yearly 128,661 151,802
Quetta Textile Mills Limited 6 MK+1.5% Sep-08 Sep-15 Mar-13 Half Yearly 40,000 45,000
Shahraj Fabrics Private Limited 6 MK +2.10% Mar-08 Mar-13 Mar-13 Half Yearly 200,000 200,000
Maple Leaf Cement Factory Limited 3 MK + 1.0% Dec-07 Dec-18 Mar-13 Quarterly 3,023,721 3,184,577
6,568,791 7,135,252
Bank Al-Habib Limited 3rd Issue 60,000 60,000 5,000 299,160 299,400 (Chief Executive: Mr. Abbas D. Habib) Bank Al-Habib Limited 4th Issue 90,000 90,000 5,000 449,730 449,910 (Chief Executive: Mr. Abbas D. Habib) Standard Chartered Bank (Pakistan) Limited 3rd Issue 75,000 - 5,000 375,000 - (Chief Executive: Mr. Mohsin Ali Nathani) Jahangir Siddiqi & Company Limited 30,000 - 5,000 150,000 - (Chief Executive: Mr. Munaf Ibrahim) Bank Al Falah Limited 49,000 - 5,000 245,000 - (Chief Executive: Mr. Atif Bajwa) Total 2,127,734 3,459,231

Annual Report of Allied Bank Limited for the year 2012
189
Notes to the Consolidated Financial Statementsfor the year ended December 31, 2012
9.11 Quality of Available for Sale Securities 2012 2011 Market Market Name of Security value / Book Rating value / Book Rating Value Value
Rupees ‘000 Rupees ‘000 Government Securities Market Treasury Bills 206,138,340 Un Rated 122,010,653 Un Rated Pakistan Investment Bonds 145,735 Un Rated 147,290 Un Rated Listed TFCs Standard Chartered Bank (Pakistan) Limited (Union Bank) 12,760 AAA 35,790 AAA Faysal Bank Limited 354,091 AA- 329,803 AA- United Bank Limited 3rd Issue 33,755 AA 50,632 AA United Bank Limited 4th Issue 188,518 AA 184,176 AA Pak Arab Fertilizers Limited 126,251 AA 311,096 AA Azgard Nine Limited 1,479 D 4,067 D ORIX Leasing Pakistan Limited - - 1,224 AA+ Pakistan Mobile Communication Limited 14,926 AA- 73,768 AA- Engro Fertilizers Limited - - 20,000 ** Unlisted TFCs Askari Bank Limited 99,880 AA- 149,920 AA- Faysal Bank Limited (Royal Bank Of Scotland) 8,729 AA- 17,465 AA- ORIX Leasing Pakistan Limited 383,333 AA+ 1,150,000 AA+ Escort Investment Bank Limited 19,984 BB 29,976 BB Financial Receivable Securitization Company Limited-A 18,216 A+ 30,361 A+ Financial Receivable Securitization Company Limited-B 12,025 A+ 20,042 A+ Javedan Cement Limited - - 217,262 ** Bank Al-Habib Limited TFC 3rd Issue 299,160 AA 299,400 AA Bank Al-Habib Limited TFC 4th Issue 449,730 AA 449,910 AA Standard Chartered Bank (Pakistan) Limited 375,000 AAA - - Jahangir Siddiqi & Company Limited 150,000 AA+ - - Bank Alfalah Limited 245,000 AA- - - Shares Unlisted Arabian Sea Country Club Limited* 5,000 ** 5,000 ** Atlas Power Limited* 355,000 A+&A1 355,000 AA&A1+ Burj Bank Limited 148,333 A&A-1 - - Central Depository Committee 40,300 ** - - Eastern Capital Limited* 5,000 ** 5,000 ** First Women Bank Limited* 21,200 A-&A2 21,200 BBB+&A2 Habib Allied International Bank Limited* 214,769 ** 214,769 ** Islamabad Stock Exchange 30,346 ** - - Lahore Stock Exchange 8,440 ** - - Khushhali Bank Limited - - 200,000 A&A-1 NIFT* 1,526 ** 1,526 ** PASSCO* 1,000 ** 1,000 ** Security General Insurance Life 1,075,653 A+ 1,075,653 A+ SME Bank Limited* 5,250 BBB&A-3 5,250 BBB&A-3 SWIFT 1,771 ** 1,771 ** Shares / Certificates Listed Agritech Limited* 162,935 D - - Attock Petroleum Limited 499,190 ** 313,574 AA&A1+ D.G. Khan Cement Limited 672,761 ** 225,692 ** Fatima Fertilizer Company Limited 1,451,868 A+&A1 1,146,000 A & A1 Fauji Fertilizer Company Limited* 1,366,693 ** 2,326,279 ** Fauji Fertilizer Company Limited 2,147,422 ** 1,747,342 ** First Equity Modaraba 1,664 ** 390 ** Habib Bank Limited - - 246,007 AA+&A-1+ Hub Power Company Limited* 2,755,116 AA+&A1+ 1,065,929 AA+&A1+ Hub Power Company Limited 2,311,764 AA+&A1+ 759,395 AA+&A1+ Lucky Cement Limited 522,813 ** 751,526 ** MCB Bank Limited - - 176,154 AA+&A1+ Namco Balanced Fund 10,475 ** 10,908 ** National Refinery Limited - - 190,502 AAA&A1+

190
Notes to the Consolidated Financial Statementsfor the year ended December 31, 2012
2012 2011 Market Market Name of Security value/Book Rating value/Book Rating Value Value Rupees ‘000 Rupees ‘000
Nishat (Chunian) Limited 615,324 A-&A-2 285,120 ** Nishat Chunian Power Limited* 630,300 A&A-2 382,500 AA-&A1+ Nishat Chunian Power Limited - - 85,425 AA-&A1+ Nishat Mills Limited - - 202,250 AA-&A1+ Nishat Power Limited* 585,000 A+&A1 388,500 AA-&A1+ Nishat Power Limited 93,871 A+&A1 - - Otsuka Pakistan Limited 3,606 ** 3,133 ** Pakistan International Containers Limited - - 519 A+ & A Pakistan Oilfield Limited* 1,544,079 ** 1,791,253 ** Pakistan Oilfield Limited 2,339,526 ** - - Pakistan Petroleum Limited 275,174 ** 210,352 ** PICIC Growth Mutual Fund 452,275 ** 333,502 ** Pioneer Cement Limited 1,926 ** 352 ** Safe Way Mutual Fund 17,611 ** 8,470 AM4+ United Bank Limited 585,690 AA+&A-1+ - - Preference Shares Trust Investment Bank Limited 50,000 ** 50,000 BBB & A3 First Dawood Investment Bank 99,355 ** 99,355 D Investment in Mutual Funds ABL Cash Fund - - 9,272,601 AA+(f ) ABL Government Securites Fund - - 501,295 A+(f ) ABL Income Fund - - 3,751,177 A+(f ) ABL Stock Fund 121,115 MFR 5-Star 97,021 MFR 5-Star AH Dow Jones Safe Pak Titans - - 19,804 ** Atlas Money Market Fund - - 50,107 AA+(f ) AMZ Plus Income Fund - - 6,873 ** Crosby Phoenix Fund - - 20,567 A(f ) HBL Money Market Fund - - 995,225 AA+(f ) JS Aggressive Income Fund - - 106 - KASB Income Opportunity Fund 97,419 ** 186,962 BBB(f ) KASB Cash Fund 149,707 AA+(f ) - - Lakson Money Market Fund - - 249,344 AA(f ) MCB Cash Optimizer Fund - - 1,533,863 AA+(f ) Meezan Cash Fund - - 500,003 AA(f ) NAFA Cash Fund 588,040 ** 791,656 A(f ) UBL Liquidity Plus Fund - - 747,001 AA+(f ) Sukuk Bonds Security Leasing Corporation Limited 83,027 ** 94,922 ** Century Paper & Board Mills Limited 460,000 A+ 690,000 A+ K.S.Sulemanji Esmailji & Sons 79,760 ** 79,760 ** Liberty Power Technology Limited 1st Issue 2,297,047 A+ 2,689,191 AA- Liberty Power Technology Limited 2nd Issue 256,575 A+ - - Quetta Textile Mills Limited 40,000 ** 45,000 ** * Strategic investments of the Bank ** Ratings are not available
Note December 31, December 31, 2012 2011
Rupees in ‘000
9.12 Unrealized gain on revaluation of investments classified as held for trading
ABL Cash Fund 12,906 2,090 ABL Income Fund 5,668 1,879 ABL Stock Fund 13,399 183 ABL Islamic Income Fund (ABL Islamic Cash Fund) 6,344 903 ABL Government Securities Fund 22,991 975 ABL AMC Capital Protected Fund 8,211 - Pakistan Mobile Communication Limited 181 - 69,700 6,030

Annual Report of Allied Bank Limited for the year 2012
191
Notes to the Consolidated Financial Statementsfor the year ended December 31, 2012
Note December 31, December 31, 2012 2011
Rupees in ‘000
10. ADVANCES Loans, cash credits, running finances, etc. - in Pakistan 283,063,975 256,555,593 Net investment in finance lease - in Pakistan 10.2 1,815,004 1,748,858 Bills discounted and purchased (excluding treasury bills) Payable in Pakistan 2,390,263 1,769,188 Payable outside Pakistan 1,651,473 2,069,915 4,041,736 3,839,103 Advances - gross 288,920,715 262,143,554 Provision for non-performing advances 10.4 (17,752,942) (17,671,070) General provision for consumer financing 10.4 (52,090) (32,647) (17,805,032) (17,703,717) Advances - net of provision 271,115,683 244,439,837 10.1 Particulars of advances (Gross) 10.1.1 In local currency 286,460,665 258,299,094 In foreign currencies 2,460,050 3,844,460 288,920,715 262,143,554 10.1.2 Short term (for upto one year) 167,988,131 165,334,959 Long term (for over one year) 120,932,584 96,808,595 288,920,715 262,143,554
10.2 Net investment in finance lease December 31, 2012 December 31, 2011
Not later Later than one Not later Later than one than one and less than Over five than one and less than Over five year five years years Total year five years years Total
Rupees in ‘000
Lease rentals receivable 394,697 675,658 563,965 1,634,320 404,737 722,438 511,106 1,638,281 Residual value 74,614 243,008 128,548 446,170 45,621 221,157 128,082 394,860 Minimum lease payments 469,311 918,666 692,513 2,080,490 450,358 943,595 639,188 2,033,141 Financial charges for future periods (75,280) (87,307) (102,899) (265,486) (96,234) (104,188) (83,861) (284,283) Present value of minimum lease payments 394,031 831,359 589,614 1,815,004 354,124 839,407 555,327 1,748,858
December 31, 2012
Category of Classified Advances Provision Required Provision Held Classification Domestic Overseas Total Domestic Overseas Total Domestic Overseas Total
Rupees in ‘000
Other Assets Especially Mentioned 62,814 - 62,814 - - - - - - Substandard 608,677 - 608,677 151,422 - 151,422 151,422 - 151,422 Doubtful 4,750,195 - 4,750,195 2,405,112 - 2,405,112 2,405,112 - 2,405,112 Loss 15,245,875 - 15,245,875 15,196,408 - 15,196,408 15,196,408 - 15,196,408 20,667,561 - 20,667,561 17,752,942 - 17,752,942 17,752,942 - 17,752,942
10.3 Advances include Rs. 20,667.561 million (2011: Rs. 20,452.465 million) which have been placed under non-performing status as detailed below:
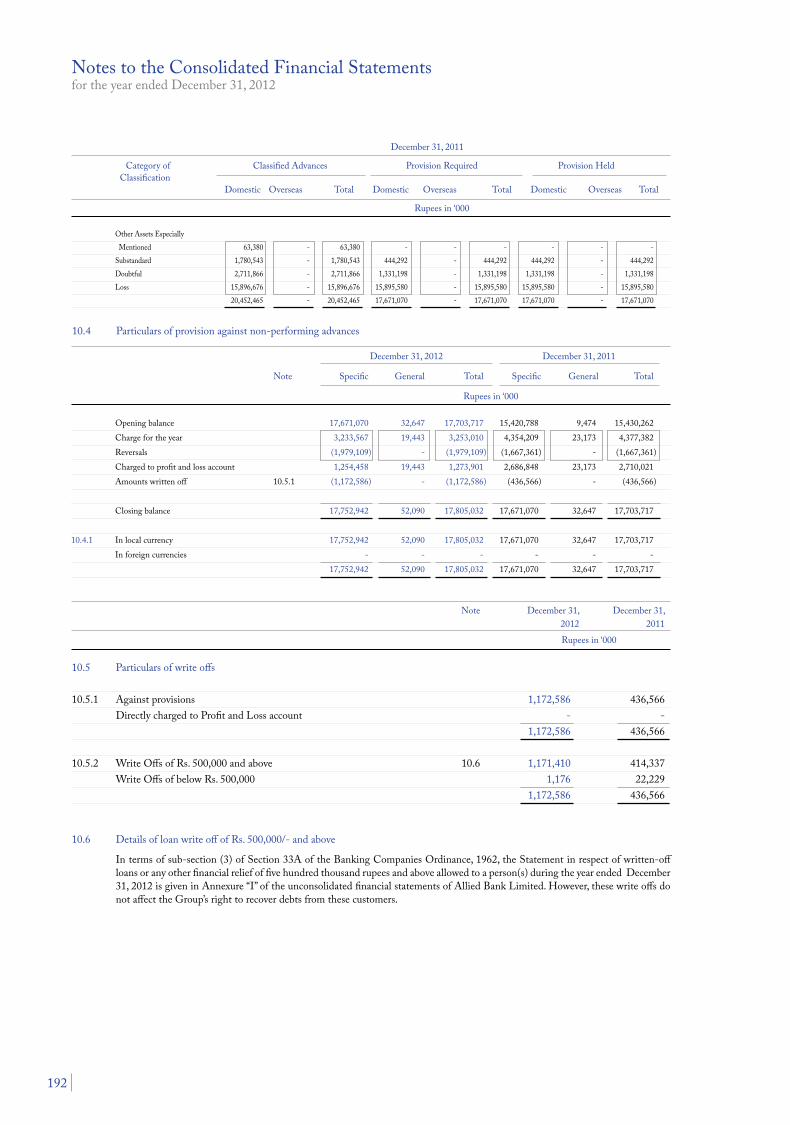
192
December 31, 2011
Category of Classified Advances Provision Required Provision Held Classification Domestic Overseas Total Domestic Overseas Total Domestic Overseas Total
Rupees in ‘000
Other Assets Especially Mentioned 63,380 - 63,380 - - - - - - Substandard 1,780,543 - 1,780,543 444,292 - 444,292 444,292 - 444,292 Doubtful 2,711,866 - 2,711,866 1,331,198 - 1,331,198 1,331,198 - 1,331,198 Loss 15,896,676 - 15,896,676 15,895,580 - 15,895,580 15,895,580 - 15,895,580 20,452,465 - 20,452,465 17,671,070 - 17,671,070 17,671,070 - 17,671,070
Notes to the Consolidated Financial Statementsfor the year ended December 31, 2012
December 31, 2012 December 31, 2011
Note Specific General Total Specific General Total
Rupees in ‘000
Opening balance 17,671,070 32,647 17,703,717 15,420,788 9,474 15,430,262 Charge for the year 3,233,567 19,443 3,253,010 4,354,209 23,173 4,377,382 Reversals (1,979,109) - (1,979,109) (1,667,361) - (1,667,361) Charged to profit and loss account 1,254,458 19,443 1,273,901 2,686,848 23,173 2,710,021 Amounts written off 10.5.1 (1,172,586) - (1,172,586) (436,566) - (436,566) Closing balance 17,752,942 52,090 17,805,032 17,671,070 32,647 17,703,717 10.4.1 In local currency 17,752,942 52,090 17,805,032 17,671,070 32,647 17,703,717 In foreign currencies - - - - - - 17,752,942 52,090 17,805,032 17,671,070 32,647 17,703,717
10.4 Particulars of provision against non-performing advances
10.6 Details of loan write off of Rs. 500,000/- and above
In terms of sub-section (3) of Section 33A of the Banking Companies Ordinance, 1962, the Statement in respect of written-off loans or any other financial relief of five hundred thousand rupees and above allowed to a person(s) during the year ended December 31, 2012 is given in Annexure “I” of the unconsolidated financial statements of Allied Bank Limited. However, these write offs do not affect the Group’s right to recover debts from these customers.
Note December 31, December 31, 2012 2011
Rupees in ‘000
10.5 Particulars of write offs 10.5.1 Against provisions 1,172,586 436,566 Directly charged to Profit and Loss account - - 1,172,586 436,566 10.5.2 Write Offs of Rs. 500,000 and above 10.6 1,171,410 414,337 Write Offs of below Rs. 500,000 1,176 22,229 1,172,586 436,566

Annual Report of Allied Bank Limited for the year 2012
193
Notes to the Consolidated Financial Statementsfor the year ended December 31, 2012
Note December 31, December 31, 2012 2011
Rupees in ‘000
10.7 Particulars of loans and advances to directors, related parties, etc Debts due by directors, executives or officers of the Group or any of them either severally or jointly with any other persons Balance at beginning of the year 5,205,090 5,333,962 Loans granted during the year 1,900,671 840,856 Repayments (1,500,716) (969,728) Balance at end of the year 5,605,045 5,205,090 Details of loans and advances to associates, subsidiary and other related parties are given in note 41. 11. OPERATING FIXED ASSETS Capital work-in-progress 11.1 1,598,345 4,511,386 Property and equipment 11.2 17,296,832 13,416,635 Intangible assets 11.3 987,069 167,102 19,882,246 18,095,123
11.1 Capital work-in-progress Civil works 938,326 3,297,410 Equipment 129,020 325,324 Advances to suppliers and contractors 530,999 888,652 1,598,345 4,511,386

194
Notes to the Consolidated Financial Statementsfor the year ended December 31, 201211
.2
Prop
erty
and
equi
pmen
t
C
ost /
Rev
aluat
ion
Acc
umul
ated
Dep
recia
tion
Cha
nge f
or
N
et b
ook
Ann
ual
A
t
At
At
the y
ear /
A
t va
lue a
t ra
te o
f
Janu
ary 1
, A
dditi
ons /
Re
valu
atio
n
Dec
embe
r 31,
Ja
nuar
y 1,
(dep
recia
tion
Reva
luat
ion
D
ecem
ber 3
1, D
ecem
ber 3
1, de
prec
iatio
n
Des
crip
tion
Not
e 20
12
(dele
tions
) su
rplu
s W
rite-
off
2012
20
12
on d
eletio
n)
defic
it/(su
rplu
s) W
rite-
off
2012
20
12
%
R
upee
s in
‘000
La
nd-F
reeh
old
11.4
5
,430
,494
4
61,1
65
3,8
58
-
5,8
95,5
17
-
-
-
-
-
5,8
95,5
17
-
Land
-Lea
seho
ld
11.4
1
,757
,977
2
06,1
59
-
-
1,9
64,1
36
-
-
-
-
-
1,9
64,1
36
-
Build
ings
-Fre
ehol
d 11
.4
1,8
41,5
33
2,3
83,8
43
-
-
4,2
25,3
76
159
,204
1
23,0
28
117
,892
-
4
00,1
24
3,8
25,2
52
5
Build
ings
-Lea
seho
ld
11.4
2
,118
,328
9
,982
-
-
2
,128
,310
2
60,3
70
93,
844
-
-
3
54,2
14
1,7
74,0
96
5
Build
ing
impr
ovem
ents
1,03
6,72
7
188
,865
-
-
1
,225
,592
4
22,0
81
211
,045
-
-
6
33,1
26
592
,466
20
(rent
ed p
rem
ises)
Fu
rnitu
re
6
29,6
02
160
,210
-
-
7
88,2
42
242
,370
5
8,43
5
-
-
299
,278
4
88,9
64
10
an
d fix
ture
s
(1
,570
)
(1
,527
)
Elec
trica
l, offi
ce
3,
739,
701
1
,474
,070
-
-
5
,210
,395
2
,128
,410
6
56,0
41
-
-
2,7
81,2
49
2,4
29,1
46
14.2
8 - 5
0
an
d co
mpu
ter
(3,3
76)
(3,2
02)
equi
pmen
ts
Vehi
cles
2
71,2
08
305
,806
-
-
5
46,0
78
196
,500
5
2,14
2
-
-
218
,823
3
27,2
55
20
(3
0,93
6)
(29,
819)
To
tal
1
6,82
5,57
0
5,1
90,1
00
3,8
58
-
21,
983,
646
3
,408
,935
1
,194
,535
1
17,8
92
-
4,6
86,8
14
17,
296,
832
(3
5,88
2)
(34,
548)

Annual Report of Allied Bank Limited for the year 2012
195
C
ost /
Rev
aluat
ion
Acc
umul
ated
Dep
recia
tion
Cha
nge f
or
N
et b
ook
Ann
ual
A
t A
dditi
ons /
A
t A
t th
e yea
r /
At
valu
e at
rate
of
Ja
nuar
y 1,
(Adj
ustm
ent)
/ Re
valu
atio
n
Dec
embe
r 31,
Ja
nuar
y 1,
(dep
recia
tion
Reva
luat
ion
D
ecem
ber 3
1, D
ecem
ber 3
1, de
prec
iatio
n
Des
crip
tion
Not
e 20
11
(Dele
tions
) su
rplu
s W
rite-
off
2011
20
11
on d
eletio
n)
defic
it/(su
rplu
s) W
rite-
off
2011
20
11
%
R
upee
s in
‘000
La
nd-F
reeh
old
11.4
4
,317
,291
3
58,9
34
754
,269
-
5
,430
,494
-
-
-
-
-
5
,430
,494
-
La
nd-L
ease
hold
11
.4
1,6
83,3
82
1,2
92
73,
303
-
1
,757
,977
-
-
-
-
-
1
,757
,977
-
Bu
ildin
gs-F
reeh
old
11.4
1
,742
,072
9
9,46
1
-
-
1,8
41,5
33
165
,379
8
2,67
9
(88,
854)
-
1
59,2
04
1,6
82,3
29
5
Build
ings
-Lea
seho
ld
11.4
2
,038
,518
7
9,81
0
-
-
2,1
18,3
28
175
,809
9
6,79
5
(12,
234)
-
2
60,3
70
1,8
57,9
58
5
Build
ing
impr
ovem
ents
837
,024
1
99,7
50
-
-
1,0
36,7
27
235
,426
1
86,7
01
-
-
422
,081
6
14,6
46
20
(re
nted
pre
mise
s)
(4
7)
(46)
Furn
iture
529
,019
1
04,0
53
-
-
629
,602
1
95,7
85
49,
965
-
-
2
42,3
70
387
,232
10
a
nd fi
xtur
es
(3,4
70)
(3,3
80)
El
ectri
cal, o
ffice
3,05
0,23
6
705
,776
-
-
3
,739
,701
1
,603
,539
5
39,0
30
-
-
2,1
28,4
10
1,6
11,2
91
10 -
50
and
com
pute
r
(1
6,31
1)
(14,
159)
equ
ipm
ents
Ve
hicle
s
245,
666
3
4,83
4
-
-
271
,208
1
60,8
16
39,
664
-
-
1
96,5
00
74,
708
20
(9,2
92)
(3,9
80)
Tota
l
14,4
43,2
08
1,5
83,9
10
827
,572
-
1
6,82
5,57
0
2,5
36,7
54
994
,834
(1
01,0
88)
-
3,4
08,9
35
13,
416,
635
(2
9,12
0)
(21,
565)
Notes to the Consolidated Financial Statementsfor the year ended December 31, 2012
11.3
In
tang
ible
asse
ts
Cos
t A
ccum
ulat
ed A
mor
tizat
ion
D
escr
iptio
n
At Ja
nuar
y 1,
Addi
tions
At
Dec
embe
r 31,
At Ja
nuar
y Am
ortiz
ation
At
Dec
embe
r N
et bo
ok va
lue
Rate
of
2012
2012
1,
2012
31, 2
012
at D
ecem
ber
amor
tizati
on
31, 2
012
%
R
upee
s in
‘ 000
Com
puter
softw
are
3
19,4
75
870,
661
1,19
0,13
6 15
2,37
3 50
,694
20
3,06
7
987,
069
14.2
8
C
ost
Acc
umul
ated
Am
ortiz
atio
n
Des
crip
tion
At
Janu
ary 1
, Ad
ditio
ns
At D
ecem
ber 3
1, At
Janu
ary
Amor
tizati
on
At D
ecem
ber
Net
book
value
Ra
te of
20
11
20
11
1, 20
11
31
, 201
1 at
Dec
embe
r am
ortiz
ation
31
, 201
1 %
(Rup
ees i
n ‘ 0
00)
C
ompu
ter so
ftware
296,7
62
22,71
3 31
9,475
11
2,111
40
,262
152,3
73
167,1
02
14.28
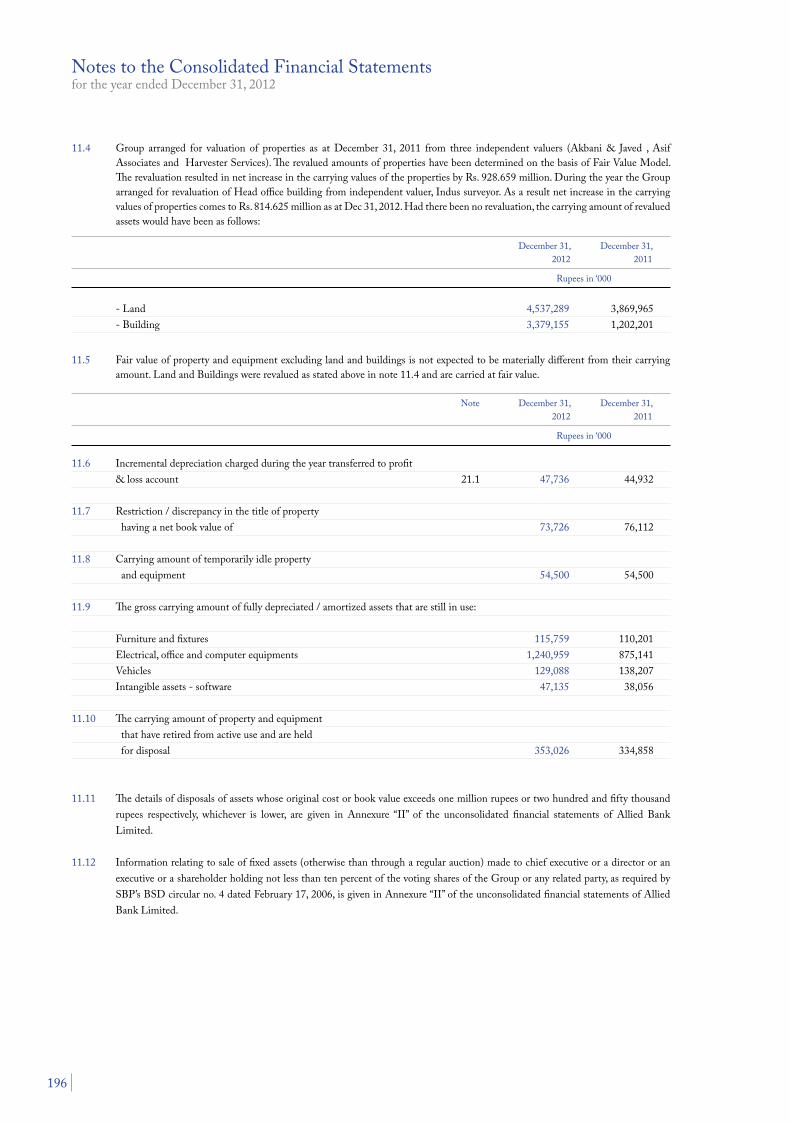
196
Notes to the Consolidated Financial Statementsfor the year ended December 31, 2012
11.4 Group arranged for valuation of properties as at December 31, 2011 from three independent valuers (Akbani & Javed , Asif Associates and Harvester Services). The revalued amounts of properties have been determined on the basis of Fair Value Model. The revaluation resulted in net increase in the carrying values of the properties by Rs. 928.659 million. During the year the Group arranged for revaluation of Head office building from independent valuer, Indus surveyor. As a result net increase in the carrying values of properties comes to Rs. 814.625 million as at Dec 31, 2012. Had there been no revaluation, the carrying amount of revalued assets would have been as follows:
Note December 31, December 31, 2012 2011
Rupees in ‘000
11.6 Incremental depreciation charged during the year transferred to profit & loss account 21.1 47,736 44,932 11.7 Restriction / discrepancy in the title of property having a net book value of 73,726 76,112 11.8 Carrying amount of temporarily idle property and equipment 54,500 54,500 11.9 The gross carrying amount of fully depreciated / amortized assets that are still in use: Furniture and fixtures 115,759 110,201 Electrical, office and computer equipments 1,240,959 875,141 Vehicles 129,088 138,207 Intangible assets - software 47,135 38,056 11.10 The carrying amount of property and equipment that have retired from active use and are held for disposal 353,026 334,858
11.11 The details of disposals of assets whose original cost or book value exceeds one million rupees or two hundred and fifty thousand rupees respectively, whichever is lower, are given in Annexure “II” of the unconsolidated financial statements of Allied Bank Limited.
11.12 Information relating to sale of fixed assets (otherwise than through a regular auction) made to chief executive or a director or an executive or a shareholder holding not less than ten percent of the voting shares of the Group or any related party, as required by SBP’s BSD circular no. 4 dated February 17, 2006, is given in Annexure “II” of the unconsolidated financial statements of Allied Bank Limited.
December 31, December 31, 2012 2011
Rupees in ‘000 - Land 4,537,289 3,869,965 - Building 3,379,155 1,202,201
11.5 Fair value of property and equipment excluding land and buildings is not expected to be materially different from their carrying amount. Land and Buildings were revalued as stated above in note 11.4 and are carried at fair value.
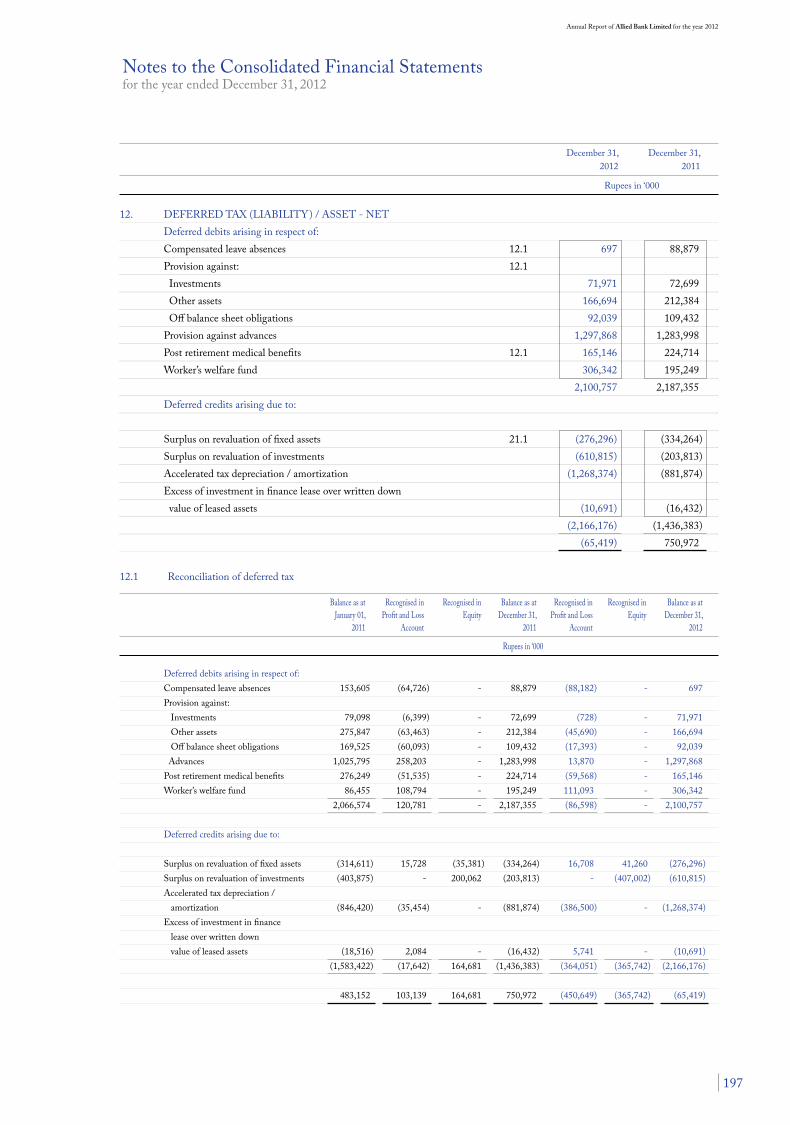
Annual Report of Allied Bank Limited for the year 2012
197
Notes to the Consolidated Financial Statementsfor the year ended December 31, 2012
12.1 Reconciliation of deferred tax Balance as at Recognised in Recognised in Balance as at Recognised in Recognised in Balance as at January 01, Profit and Loss Equity December 31, Profit and Loss Equity December 31, 2011 Account 2011 Account 2012
Rupees in ‘000 Deferred debits arising in respect of: Compensated leave absences 153,605 (64,726) - 88,879 (88,182) - 697 Provision against: Investments 79,098 (6,399) - 72,699 (728) - 71,971 Other assets 275,847 (63,463) - 212,384 (45,690) - 166,694 Off balance sheet obligations 169,525 (60,093) - 109,432 (17,393) - 92,039 Advances 1,025,795 258,203 - 1,283,998 13,870 - 1,297,868 Post retirement medical benefits 276,249 (51,535) - 224,714 (59,568) - 165,146 Worker’s welfare fund 86,455 108,794 - 195,249 111,093 - 306,342 2,066,574 120,781 - 2,187,355 (86,598) - 2,100,757 Deferred credits arising due to: Surplus on revaluation of fixed assets (314,611) 15,728 (35,381) (334,264) 16,708 41,260 (276,296) Surplus on revaluation of investments (403,875) - 200,062 (203,813) - (407,002) (610,815) Accelerated tax depreciation / amortization (846,420) (35,454) - (881,874) (386,500) - (1,268,374) Excess of investment in finance lease over written down value of leased assets (18,516) 2,084 - (16,432) 5,741 - (10,691) (1,583,422) (17,642) 164,681 (1,436,383) (364,051) (365,742) (2,166,176) 483,152 103,139 164,681 750,972 (450,649) (365,742) (65,419)
December 31, December 31, 2012 2011
Rupees in ‘000
12. DEFERRED TAX (LIABILITY) / ASSET - NET Deferred debits arising in respect of: Compensated leave absences 12.1 697 88,879 Provision against: 12.1 Investments 71,971 72,699 Other assets 166,694 212,384 Off balance sheet obligations 92,039 109,432 Provision against advances 1,297,868 1,283,998 Post retirement medical benefits 12.1 165,146 224,714 Worker’s welfare fund 306,342 195,249 2,100,757 2,187,355 Deferred credits arising due to: Surplus on revaluation of fixed assets 21.1 (276,296) (334,264) Surplus on revaluation of investments (610,815) (203,813) Accelerated tax depreciation / amortization (1,268,374) (881,874) Excess of investment in finance lease over written down value of leased assets (10,691) (16,432) (2,166,176) (1,436,383) (65,419) 750,972

198
Note December 31, December 31, 2012 2011
Rupees in ‘000
13. OTHER ASSETS
Income / mark-up accrued on advances, investments and lending to financial institutions: - in local currency 9,138,162 10,952,336 - in foreign currencies 84,750 32,023 Advances, deposits, advance rent and other prepayments 1,061,945 1,406,687 Advance taxation (payments less provisions) 4,061,051 1,587,941 Stationery and stamps on hand 122,598 41,439 Prepaid exchange risk fee - 53 Unrealized gain on forward foreign exchange contracts 15,004 162,279 Due from the employees’ retirement benefit schemes 36.4 1,808,080 1,562,389 Excise duty 11 11 Receivable from SBP - customers encashments 12,050 9,222 Non banking assets acquired in satisfaction of claims 13.1 2,787,866 1,974,266 Suspense account 764,492 584,350 Others 67,966 77,998 19,923,975 18,390,994 Less: Provision held against other assets 13.2 (1,404,807) (1,098,592) Other assets (net of provision) 18,519,168 17,292,402 13.1 Market value of non banking assets acquired in satisfaction of claims 2,211,578 1,820,550 13.2 Provision against Other Assets:
Opening balance 1,098,592 1,062,781 Charge for the year 472,926 308,815 Reversals (130,542) (194,634) Net charge 342,384 114,181 Written off / adjusted (36,169) (78,370) Closing balance 1,404,807 1,098,592
14. CONTINGENT ASSETS
There were no contingent assets of the Group as at December 31, 2012 and December 31, 2011. 15. BILLS PAYABLE
In Pakistan 6,203,051 4,015,317
Notes to the Consolidated Financial Statementsfor the year ended December 31, 2012
12.2 Through Finance Act 2007, a new section 100A read with the 7th Schedule (the Schedule) was inserted in the Income Tax Ordinance, 2001 for the taxation of banking companies. The Schedule seeks to simplify the taxation of banking companies and is applicable from the tax year 2009 (financial year ending on December 31, 2008).
The deferred tax asset on the deductible temporary differences disallowed as a deduction in the past up to December 31, 2007, for which transitory provisions are not available, is being kept as an asset as the Group is confident that transitory provisions would be introduced to set out the mechanism of claiming where benefit of these allowances can be claimed.

Annual Report of Allied Bank Limited for the year 2012
199
Note December 31, December 31, 2012 2011
Rupees in ‘000
16. BORROWINGS
In Pakistan 38,469,303 49,959,308 Outside Pakistan 446,889 33,892 38,916,192 49,993,200
16.1 Particulars of borrowings with respect to currencies
In local currency 38,362,235 48,043,881 In foreign currencies 553,957 1,949,319 38,916,192 49,993,200
16.2 Details of borrowings (Secured / Unsecured)
Secured Borrowings from State Bank of Pakistan Under export refinance scheme 16.3 15,179,074 14,162,420 Long term financing facility - Export oriented projects 16.4 908,543 1,418,190 Long term financing facility 16.5 2,623,950 2,673,844 Modernization of SMEs 16.6 7,222 154,240 Financing Facility for Storage of Agriculture Produce (FFSA) 16.7 60,290 71,249 Revival of SMEs & Agricultural activities in flood affected areas 16.8 112,650 89,450 18,891,729 18,569,393 Repurchase agreement borrowings 16.9 18,220,505 29,474,488 Unsecured
Call borrowings 16.10 1,553,957 1,915,427 Overdrawn nostro accounts - 33,892 Other Borrowings 250,001 - 1,803,958 1,949,319 38,916,192 49,993,200 16.3 The Bank has entered into various agreements for financing with the State Bank of Pakistan (SBP) for extending export finance to
customers. As per agreements, the Bank has granted to SBP the right to recover the outstanding amount from the Bank at the date of maturity of the finance by directly debiting the current account maintained by the Bank with the SBP. The loan carries mark-up at rates ranging from 8.5 % to 10% (2011: 10%) per annum. These borrowings are repayable within six months from the deal date.
16.4 This represents Long Term Financing against export oriented projects availed by the Bank for further extending the same to its
customers for export oriented projects, for a maximum period of 10 years. The loan repayments to SBP correspond the respective repayment from customers. The loan carries mark-up at the rate of 5% (2011: 5%) per annum.
16.5 This represents Long Term Financing Facility availed by the Bank for further extending the same to its customers for balancing, modernization and replacement (BMR) of existing units / projects, for a maximum period of 10 years. The loan carries mark-up at rates ranging from 8.20% to 9.50% (2011: 8.20% to 9.50%) per annum.
16.6 This represents Long Term Financing facility availed by the Bank for extending the same to its customers establishment, expansion and balancing, modernization & replacement (BMR) of steel / metal / concrete silos, warehouses & cold storage facilities for storing agricultural produce, for a maximum period of 5 years. These carry mark-up at the rates ranging from 6.5% (2011: 5% - 8%) per annum.
Notes to the Consolidated Financial Statementsfor the year ended December 31, 2012

200
Notes to the Consolidated Financial Statementsfor the year ended December 31, 2012
December 31, December 31, 2012 2011
Rupees in ‘000
17. DEPOSITS AND OTHER ACCOUNTS
Customers Fixed deposits 158,249,920 110,061,707 Savings deposits 125,835,518 106,782,794 Current accounts - remunerative 80,053,817 57,667,849 - non - remunerative 145,711,362 124,121,553 509,850,617 398,633,903 Financial Institutions Remunerative deposits 4,463,515 560,816 Non - remunerative deposits 388,312 366,071 514,702,444 399,560,790 17.1 Particulars of deposits In local currency 475,356,954 362,078,640 In foreign currencies 39,345,490 37,482,150 514,702,444 399,560,790 18. SUB-ORDINATED LOANS
Term Finance Certificates - I 2,494,000 2,495,000 Term Finance Certificates - II 2,996,400 2,997,600 5,490,400 5,492,600
The Group has issued following unsecured sub-ordinated Term Finance Certificates to improve the Group’s capital adequacy. Liability to the TFC holders is subordinated to and rank inferior to all other debts of the Group including deposits. The salient features of the issues are as follows:
Term Finance certificate - I Term Finance certificate - II Outstanding Amount- (Rupees in thousand) 2,494,000 2,996,400 Issue date December 06, 2006 August 28, 2009 Total issue 2,500,000 3,000,000 Rating AA AA Listing Karachi Stock Exchange Limited Karachi Stock Exchange Limited Mark up repayment Payable semi annually Payable semi annually Rate - Six months KIBOR plus 1.90% - Six months KIBOR plus 0.85% for first 5 years - Six months KIBOR plus 1.30% from start of 6th year Call Option Call option is not available to the issuer Issuer has the right to seek redemption
after the eleventh redemption date of the entire TFC issue, prior to its stated maturity. Repayment 8 Years (2007 - 2014) 10 Years (2009 - 2019)
16.7 This represents long term financing facility availed by the Bank for establishment, expansion and balancing modernization and replacement (BMR) of steel/Metal.Concrete Silos, Warehouses and Cold Storage. The financing is available for a maximum period of 7 years. The loan carries mark-up at the rate of 5% (2011: 5% to 6.5%) per annum.
16.8 This represents Production / Working capital financing facility availed by the Bank for extending the same to farmers and Small & Medium Enterprises (SMEs) in districts affected by recent flood as notified by National Disaster Management Authority. The loan carries mark-up at the rate of 5% (2011: 5%) per annum.
16.9 These represent funds borrowed from the local interbank market against government securities, carrying mark-up at the rates ranging from 6.49% to 9% (2011: 11.7% to 11.95%) per annum maturing on various dates, latest by January 09, 2013.
16.10 These represent unsecured borrowings in local and foreign currency from the local interbank market, carrying mark-up at rates ranging from 8.25% to 9% (2011: 11.75% to 11.85%) for local currency borrowing , and at rates ranging from 0.16% to 0.40 %(2011: 0.50% to 1%) for foreign currency borrowing per annum maturing on various dates, latest by March 11, 2013.

Annual Report of Allied Bank Limited for the year 2012
201
Note December 31, December 31, 2012 2011
Rupees in ‘000
19. OTHER LIABILITIES Mark-up / return / interest payable in local currency 5,227,681 4,824,619 Mark-up / return / interest payable in foreign currency 569,242 597,610 Accrued expenses 1,506,542 1,122,934 Branch adjustment account 670,232 485,125 Provision for: - gratuity 36.4 104,013 131,413 - employees’ medical benefits 36.4 1,864,778 1,771,930 - employees’ compensated absences 36.4 1,021,739 963,190 Unclaimed dividends 87,695 57,502 Dividend payable 13,107 10,984 Provision against off-balance sheet obligations 19.1 884,489 515,009 Retention money payable 139,544 113,644 Security deposits against lease 451,206 397,171 Sundry deposits 895,875 914,860 Workers Welfare Fund payable 899,748 576,706 Others 1,324,755 864,650 15,660,646 13,347,347 19.1 Provision against off-balance sheet obligations Opening balance 515,009 370,764 Charge for the year 419,173 182,304 Reversals (49,693) (38,059) Net charge 369,480 144,245 Closing balance 884,489 515,009 The above provision has been made against letters of guarantee issued by the Group. 19.2 Particulars of other liabilities In local currency 15,090,033 12,749,737 In foreign currencies 570,613 597,610 15,660,646 13,347,347
Notes to the Consolidated Financial Statementsfor the year ended December 31, 2012

202
Notes to the Consolidated Financial Statementsfor the year ended December 31, 2012
Note December 31, December 31, 2012 2011
Rupees in ‘000
21. SURPLUS ON REVALUATION OF ASSETS - NET OF TAX Surplus arising on revaluation of: - fixed assets 21.1 3,525,308 3,629,110 - securities 21.2 4,462,397 2,088,676 Surplus on revaluation of assets - net of tax 7,987,705 5,717,786 21.1 Surplus on revaluation of fixed assets Surplus on revaluation as at January 1, 2012 3,963,374 3,079,647 (Deficit) / surplus on revaluation during the year (114,034) 928,659 Transferred to unappropriated profit in respect of incremental depreciation charged during the year - net of deferred tax (31,028) (29,204) Related deferred tax liability 12.1 (16,708) (15,728) 11.6 (47,736) (44,932) Surplus on revaluation as at December 31, 2012 3,801,604 3,963,374 Less: Related deferred tax liability on : Revaluation as at January 1, 2012 334,264 314,611 Deferred tax liability on surplus on revaluation of fixed assets (41,260) 35,381 Incremental depreciation charged during the year transferred to profit and loss account 12.1 (16,708) (15,728) 276,296 334,264 3,525,308 3,629,110
20.2 Issued, subscribed and paid-up capital Fully paid-up Ordinary shares of Rs. 10/- each December 31, December 31, Ordinary shares December 31, December 31, 2012 2011 2012 2011
No. of shares Rupees in ‘000 406,780,094 406,780,094 Fully paid in cash 4,067,801 4,067,801 522,013,365 435,982,273 Issued as bonus shares 5,220,134 4,359,823 928,793,459 842,762,367 9,287,935 8,427,624 18,348,550 ordinary shares of Rs. 10 each, determined pursuant to the Scheme of Amalgamation in accordance with the swap ratio stipulated therein less 9,200,000 ordinary shares of Rs. 10 each, held by Ibrahim Leasing 9,148,550 9,148,550 Limited on the cut-off date (September 30, 2004) 91,486 91,486
8,400,000 Ordinary shares of Rs. 10 each, determined pursuant to the Scheme of Amalgamation of First Allied Bank Modaraba with Allied Bank Limited 8,400,000 8,400,000 in accordance with the share swap ratio stipulated therein. 84,000 84,000 946,342,009 860,310,917 9,463,421 8,603,110 Ibrahim Fibers Limited, related party of the Group, holds 226,365,220 (23.92%) [December 31, 2011: 270,786,564 (31.4%)] ordinary
shares of Rs.10 each, as at reporting date.
20. SHARE CAPITAL 20.1 Authorized capital December 31, December 31, December 31, December 31, 2012 2011 2012 2011
No. of shares Rupees in ‘000
1,500,000,000 1,500,000,000 Ordinary shares of Rs.10/- each 15,000,000 15,000,000

Annual Report of Allied Bank Limited for the year 2012
203
Notes to the Consolidated Financial Statementsfor the year ended December 31, 2012
Note December 31, December 31, 2012 2011
Rupees in ‘000
21.2 Surplus / (deficit) on revaluation of available-for-sale securities Federal Government Securities Market Treasury Bills 260,050 (67,646) Pakistan Investment Bonds (2,078) (13,023) Term Finance Certificates 9,007 (20,986) Shares / Certificates - Listed 4,659,339 2,429,655 Open end mutual funds 146,894 (35,511) 9.1 5,073,212 2,292,489 Less : related deferred tax (liability) 12.1 (610,815) (203,813) 4,462,397 2,088,676 22. CONTINGENCIES AND COMMITMENTS 22.1 Direct credit substitutes Guarantees in favor of: Banks and financial institutions 473,823 611,478 22.2 Transaction-related contingent liabilities Guarantees in favor of: Government 18,513,854 14,010,962 Others 12,703,025 21,208,164 31,216,879 35,219,126 22.3 Trade-related contingent liabilities 54,546,360 52,324,035 22.4 Claims against the bank not acknowledged as debt 5,929,382 4,210,600 22.5 The Group makes commitments to extend credit in the normal course of its business but these being revocable commitments do not
attract any significant penalty or expense if the facility is unilaterally withdrawn.
December 31, December 31, 2012 2011
Rupees in ‘000
22.6 Commitments in respect of forward foreign exchange contracts Purchase 35,605,257 49,580,813 Sale 9,400,993 25,543,453 22.7 Commitments in respect of: Civil works 495,414 1,496,831 Acquisition of operating fixed assets 706,733 504,141 1,202,147 2,000,972 22.8 Commitments in respect of lease financing 192,274 110,472 22.9 Commitments in respect Market Treasury Bills - 3,926,578 22.10 Other Commitments 919 900

204
22.11 Other Contingencies22.11.1 The income tax assessments of the Bank have been finalized up to and including tax year 2011 for local and Azad Kashmir
operations. While finalizing income tax assessments up to tax year 2011, income tax authorities made certain add backs with aggregate tax impact of Rs.11,471 million. As a result of appeals filed by the Bank before appellate authorities, most of the add backs have been deleted. However, the Bank and Tax Department are in appeals / references before higher appellate forums against unfavorable decisions. Pending finalization of appeals no provision has been made by the Bank on aggregate sum of Rs.11,471 million. The management is confident that the outcome of these appeals will be in favor of the Bank.
During the year, the Tax Authorities conducted proceedings of withholding tax audit under section 161/205 of Income Tax Ordinance, 2001 for tax year 2006 and tax year 2008 to 2012 and created an arbitrary demand of Rs. 219 million. The Bank has filed appeals against these orders. The management is confident that these appeals will be decided in favor of the Bank and therefore, no provision has been made agaisnt the said demand of Rs. 219 million.
Tax authorities have also issued an order under Federal Excise Act, 2005 thereby creating an arbitrary demand of Rs. 110 million. The bank has filed an appeal before Commissioner Inland Revenue (appeals). The management is confident that aforesaid demand will be deleted by appellate authorities and therefore no provision has been made against the said demand of Rs. 110 million.
22.11.2 As a result of a compromise decree granted by the Honorable High Court of Sindh in August 2002, Fateh Textile Mills Limited
pledged 16,376,106 shares of ABL with the Bank as security consequent to the default by Fateh Textile Mills Limited on the terms of the decree. The Bank published a notice on June 23, 2004 in accordance with the requirements of section 19(3) of the Financial Institutions (Recovery of Finances) Ordinance, 2001 and invited sealed bids from interested parties to purchase the pledged shares. The bidding process was scheduled for July 23, 2004 and the Bank had fixed a reserve price of Rs. 25 per share. On the bid date, the highest offer for these shares was received at a rate of Rs. 25.51 per share. The bid was approved and the successful bidder had deposited an amount of Rs. 417.75 million with the Bank.
Fateh Textile Mills Limited had filed a suit against the Bank in the High Court of Sindh challenging the sale of the above shares. The High Court had not granted a stay order on the process of sale of shares. However, the matter is still pending in the Court.
23. DERIVATIVE INSTRUMENTS The Group at present does not offer structured derivative products such as Interest Rate Swaps, Forward Rate Agreements or FX
Options. However, the Group’s Treasury Group buys and sells derivative instruments such as: • ForwardExchangeContracts • ForeignExchangeSwaps • EquityFutures Forward Exchange Contracts Forward Exchange Contract (FEC) is a product which is offered to the obligor who transact internationally. These traders use this
product to hedge themselves from unfavorable movements in a foreign currency, however, by agreeing to fix the exchange rate, they do not benefit from favorable movements in that currency.
An FEC is a contract between the Obligor and the Bank in which both agree to exchange an amount of one currency for another
currency at an agreed forward exchange rate for settlement over more than two business days after the FEC is entered into (the day on which settlement occurs is called the value date). FEC is entered with those Obligors whose credit worthiness has already been assessed, and they have underlined trade transactions.
If the relevant exchange rate moves un-favourably, the Group will loose money, and Obligor will benefit from that movement
because the Group must exchange currencies at the FEC rate. In order to mitigate this risk of adverse exchange rate movement, the Group hedges its exposure by taking forward position in inter-bank FX.
Foreign Exchange Swaps A Foreign Exchange Swap (FX Swap) is used by the Group if it has a need to exchange one currency for another currency on one
day and then re-exchange those currencies at a later date. Exchange rates and forward margins are determined in the “interbank” market and fluctuate according to supply and demand.
An FX Swap prevents the Bank from gaining any benefit resulting from a favourable exchange rate movement in the relevant
currency pair between the time Group enters into the transaction deal and when settlement occurs. Cancellation of the swap may also result in exposure to market movements. The key advantage of an FX swap is that it provides the Group with protection against unfavourable currency movements between the time it enters into the transaction and settlement. The term and amounts for FX Swap can also be tailored to suit the Group’s particular needs.
Equity Futures An equity futures contract is a standardized contract, traded on a futures counter of the stock exchange, to buy or sell a certain
underlying scrip at a certain date in the future, at a specified price. The Group uses equity futures as a hedging instrument to hedge its equity portfolio, in both held for trading and available for sale,
against equity price risk. Only selected shares are allowed to be traded on futures exchange. Equity futures give flexibility to the Group either to take delivery on the future settlement date or to settle it by adjusting the notional value of the contract based on the current market rates. Maximum exposure limit to the equity futures is 10% of Tier I Capital of the Group, based on prevailing SBP regulations.
The accounting policies used to recognize and disclose derivatives are given in note 5.15.2. The risk management framework of
derivative instruments is given in note 43.
Notes to the Consolidated Financial Statementsfor the year ended December 31, 2012

Annual Report of Allied Bank Limited for the year 2012
205
Notes to the Consolidated Financial Statementsfor the year ended December 31, 2012
December 31, December 31, 2012 2011
Rupees in ‘000
24. MARK-UP / RETURN / INTEREST EARNED On loans and advances: Customers 31,457,937 32,634,769 On investments in: Available for sale securities 12,904,292 16,029,300 Held to maturity securities 4,036,826 1,283,302 Held for Trading 41,990 4,349 16,983,108 17,316,951 On deposits with financial institutions 10,448 4,079 On securities purchased under resale agreements 996,522 1,796,144 On certificates of investment 6,571 6,929 On letters of placement 7,088 13,864 On call money lending 50,331 56,161 49,512,005 51,828,897
25. MARK-UP / RETURN / INTEREST EXPENSED Deposits 23,053,644 20,139,258 Long term borrowing 248,400 297,379 Securities sold under repurchase agreements 3,261,106 1,952,036 Call money borrowing 431,967 338,396 Brokerage and commission 194,469 209,802 Mark-up on sub-ordinated loans 716,980 814,737 Other short term borrowings 3,274,424 2,944,577 31,180,990 26,696,185 26. FEE, COMMISSION AND BROKERAGE INCOME Core fees, commission and brokerage 2,822,612 2,839,831 Account maintenance charges 119,580 176,641 2,942,192 3,016,472 27. GAIN / (LOSS) ON SALE OF SECURITIES Shares - listed 2,002,399 845,570 - unlisted 208,715 - Open end mutual funds (943,287) (107,390) Market treasury bills 660,944 130,660 Term finance certificates (679) 521 Sukuk Bonds 1,382 - 1,929,474 869,361 28. OTHER INCOME Gain on sale of operating fixed assets 27,762 2,576 Profit on sale of other assets 5,273 676 Management fee 71,737 36,280 Recovery from written off Loans 128,245 8,125 Gain on demutualization of Lahore and Islamabad Stock Exchanges 38,785 - 271,802 47,657

206
Notes to the Consolidated Financial Statementsfor the year ended December 31, 2012
29.1 Auditors’ remuneration
December 31, 2012 December 31, 2011
KPMG Ernst & Young Total KPMG Ernst & Young Total Taseer Hadi Ford Rhodes Taseer Hadi Ford Rhodes
& Co Sidat Hyder & Co Sidat Hyder
Rupees in ‘000
Annual audit 2,925 2,925 5,850 2,925 2,925 5,850 Annual audit overseas business unit 53 2,361 2,414 53 - 53 Half year review 1,180 1,180 2,360 1,180 1,180 2,360 Special certifications and miscellaneous services 2,094 2,175 4,269 1,925 2,220 4,145 Out-of-pocket expenses 545 538 1,083 771 737 1,508 Subsidiary Company Audit fee - 350 350 - 325 325 Other certification - 90 90 - 35 35 Out-of-pocket expenses - 49 49 - 33 33 6,797 9,668 16,465 6,854 7,455 14,309
Note December 31, December 31, 2012 2011
Rupees in ‘000
29. ADMINISTRATIVE EXPENSES Salaries, allowances, etc. 29.3 7,624,731 6,942,294 Charge for defined benefit plan 36 443,636 471,055 Contribution to defined contribution plan - provident fund 245,470 219,933 Non-executive directors’ fees, allowances and other expenses 7,675 4,525 Rent, taxes, insurance, electricity, etc. 1,827,362 1,530,143 Legal and professional charges 75,961 98,350 Communications 331,147 407,529 Repairs and maintenance 311,409 255,768 Stationery and printing 230,905 281,388 Advertisement and publicity 360,825 291,057 Auditors’ remuneration 29.1 16,465 14,309 Depreciation / Amortization 11.2 & 11.3 1,245,227 1,035,096 Security service charges 623,191 552,343 Travelling, conveyance and fuel expenses 272,995 274,850 Entertainment 118,894 138,253 Computer expenses 556,963 423,458 Subscription 249,401 257,810 Donations 29.2 103,515 61,295 Others 40,274 29,645 14,686,046 13,289,101

Annual Report of Allied Bank Limited for the year 2012
207
Notes to the Consolidated Financial Statementsfor the year ended December 31, 2012
December 31, December 31, 2012 2011
Rupees in ‘000
Allied fund for flood relief account - 15,000 Al-Mustafa Trust 1,500 - Aziz Jehan Begum Trust 1,000 - Bait ul Sakoon Karachi 100 - Bakhtawar Amin Memorial Trust Hospital 3,000 1,000 Construction of Houses at Flood Effected Areas 51,315 - GCU Endowment Fund Trust - 1,000 Imran Khan Foundation 100 100 Institute of Business Administration 15,000 20,000 Kaghan Memorial Trust 2,000 - Karachi Center for Dispute Resolution - 450 Karachi School For Business and Leadership 20,000 - Khoja Society for People’s Education - 600 Laeeq Rafique Foundation 2,000 - Lahore Business Association - 500 Lahore Businessmen Association for Rehabilitation of the Disabled 500 - Liver Center, Civil Hospital Faisalabad 3,000 - Marie Adelaide leprosy center - 1,000 Mayo Hospital Lahore - 1,200 Memon Medical Institute - 1,200 Namal Education Foundation 1,000 - Pakistan Hindu Council - 100 Patient Welfare Society Allied Hospital Faisalabad - 596 Patients welfare association, DMC & Civil hospital Karachi - 500 Patients welfare society Shaikh Zayed hospital Lahore - 1,000 Pink Ribbon Pakistan - 500 Sargodhian Spirit Trust 1,000 - Say Trust - 100 Shaukat khanum Memorial Cancer Hospital & Research Centre 2,000 2,000 Society for education technology - 500 Suleman Dawood School of Business - 10,000 Sundus Foundation - 800 Tamir Welfare Organization - 2,849 University of Karachi - 300 103,515 61,295 29.3 During the year, the Group announced the Voluntary Retirement Scheme (VRS) for its employees. Ninety One (91) employees
(2011 : 183) of the Group opted for retirement under this scheme. In accordance with the actuary recommendations, the Group has recognized an amount of Rs. 104 million (2011 : Rs. 265 million) to cover additional retirement benefits in respect of such employees.
December 31, December 31, 2012 2011
Rupees in ‘000
30. OTHER CHARGES Penalties imposed by SBP 39,062 117,986 SBP prism service charges 5,828 3,194 Education cess 12,100 12,046 Provision against write off of fixed assets - 116,920 Other assets written off 969 18,058 57,959 268,204
31. WORKERS WELFARE FUND
Under the Worker’s Welfare Fund Ordinance (WWF), 1971, WWF is applicable @ 2% of profit before tax as per accounts or declared income as per income tax return, whichever is higher.
29.2 None of the directors, executives and their spouses had any interest in the donations disbursed during the year.

208
Note December 31, December 31, 2012 2011
Rupees in ‘000
32. TAXATION Current - for the year 3,812,352 4,948,719 - for prior years 1,073 156,112 3,813,425 5,104,831 Deferred 450,649 (103,139) 4,264,074 5,001,692 32.1 Relationship between tax expense and accounting profit Accounting profit for the year 16,146,441 15,257,865 Tax on income @ 35% (2011 : 35%) 5,651,254 5,340,253 Effect of permanent differences 20,477 49,405 Adjustments in respect of tax at reduced rates (1,567,622) (892,672) Others 159,965 504,706 Tax charge for the year 4,264,074 5,001,692
33. EARNINGS PER SHARE - BASIC AND DILUTED Profit after taxation 11,882,367 10,256,173
Number of Shares
Restated Weighted average number of ordinary shares outstanding during the year 33.1 946,342,009 946,342,009
Rupees Restated
Earnings per share - basic and diluted 33.1 12.56 10.84
There is no dilution effect on basic earnings per share. 33.1 The corresponding figure of weighted average number of shares outstanding and earning per share have been restated to include the
effect of bonus shares issued by the Group during the year.
Note December 31, December 31, 2012 2011
Rupees in ‘000
34. CASH AND CASH EQUIVALENTS Cash and balances with treasury banks 6 43,351,703 36,479,765 Balances with other banks 7 1,029,292 1,679,121 Overdrawn nostro accounts 16.2 - (33,892) 44,380,995 38,124,994 35. STAFF STRENGTH Numbers Permanent 9,291 9,496 Temporary / on contractual basis / trainee 276 276 Bank’s own staff strength at the end of the year 9,567 9,772 Outsourced 3,492 3,257 Total staff strength 13,059 13,029 36 DEFINED BENEFIT PLANS
36.1 General description
The Bank operates a funded gratuity scheme for all employees who opted for the new staff retirement benefit scheme introduced by the management with effect from July 1, 2002. For those employees who did not opt for the new scheme, the Bank continues to operate a funded pension scheme.
The Bank also operates a contributory benevolent fund (defined benefit scheme - funded) and provides post retirement medical benefits (unfunded scheme) to eligible retired employees.
Notes to the Consolidated Financial Statementsfor the year ended December 31, 2012

Annual Report of Allied Bank Limited for the year 2012
209
December 31, December 31, 2012 2011
Numbers
36.2 Number of Employees under the schemes The number of employees covered under the following defined benefit scheme / plans are: - Gratuity fund 9,567 9,772 - Pension fund 6,603 6,797 - Benevolent fund 201 213 - Employees’ compensated absences 9,291 9,496 - Post retirement medical benefits 9,291 9,496
Notes to the Consolidated Financial Statementsfor the year ended December 31, 2012
36.3 Principal actuarial assumptions
The actuarial valuations were carried out on December 31, 2012 based on the Projected Unit Credit Method, using the following significant assumptions:
Sources of estimation December 31, December 31, 2012 2011 Discount rate Yield on investments in Government Bonds 12.00% 13.00% Expected rate of return on plan assets: Pension fund Yield on investments in Government Bonds 12.00% 13.00% Gratuity fund Yield on investments in Government Bonds 12.00% 13.00% Benevolent fund Yield on investments in Government Bonds 12.00% 13.00% Expected rate of salary increase Rate of salary increase 10.00% 11.00%
36.4 Reconciliation of (receivable from) / payable to defined benefit plans
December 31, 2012
Note Pension Gratuity Benevolent Post Leave fund fund fund retirement Encashment
medical
Rupees in ‘000
Present value of defined benefit obligations 36.6 2,873,602 1,384,215 12,992 1,381,400 1,020,459 Fair value of plan’s /scheme’s assets 36.7 (5,993,598) (1,082,001) (161,107) - - Net actuarial gains / (losses) not recognized 1,365,453 (198,201) 41,039 483,378 - (1,754,543) 104,013 (107,076) 1,864,778 1,020,459 Benefit of the surplus not available to the Bank - - 53,539 - - Net (asset) / liability (1,754,543) 104,013 (53,537) 1,864,778 1,020,459
December 31, 2011
Note Pension Gratuity Benevolent Post Leave fund fund fund retirement Encashment
medical
Rupees in ‘000
Present value of defined benefit obligations 36.6 4,239,314 1,193,848 19,561 1,656,505 962,292 Fair value of plan’s /scheme’s assets 36.7 (5,985,286) (918,453) (160,816) - - Net actuarial (losses) / gains not recognized 224,746 (143,982) 58,928 115,425 - (1,521,226) 131,413 (82,327) 1,771,930 962,292 Benefit of the surplus not available to the Bank - - 41,164 - - Net (asset) / liability (1,521,226) 131,413 (41,163) 1,771,930 962,292

210
36.5 Movement in (receivable from) / payable to defined benefit plans
December 31, 2012
Note Pension Gratuity Benevolent Post Leave fund fund fund retirement Encashment
medical
Rupees in ‘000
Opening balance (1,521,226) 131,413 (41,163) 1,771,930 962,292 (Reversal) / charge for the year 36.9 (233,317) 195,483 (12,374) 260,616 298,872 Benefits paid - (222,883) - (167,768) (240,705) Closing balance (1,754,543) 104,013 (53,537) 1,864,778 1,020,459
December 31, 2011
Note Pension Gratuity Benevolent Post Leave fund fund fund retirement Encashment
medical
Rupees in ‘000
Opening balance (1,474,259) 94,917 (30,679) 1,632,793 872,705 (Reversal) / charge for the year 36.9 (46,967) 183,090 (10,484) 265,446 267,115 Benefits paid - (146,594) - (126,309) (177,528) Closing balance (1,521,226) 131,413 (41,163) 1,771,930 962,292
36.6 Reconciliation of present value of defined benefit obligations
December 31, 2012
Pension Gratuity Benevolent Post Leave fund fund fund retirement Encashment
medical
Rupees in ‘000
Opening balance 4,239,314 1,193,848 19,561 1,656,505 962,292 Current service cost - 160,654 - 63,223 77,914 Interest cost 512,528 143,615 1,512 204,441 162,627 Benefits paid (593,575) (178,236) (15,858) (167,769) (240,705) VRS loss 35,000 6,000 - 1,000 19,000 Actuarial (gains) / losses (1,319,665) 58,334 7,777 (376,000) 39,331 Closing balance 2,873,602 1,384,215 12,992 1,381,400 1,020,459
December 31, 2011
Pension Gratuity Benevolent Post Leave fund fund fund retirement Encashment
medical
Rupees in ‘000
Opening balance 4,237,829 941,933 22,819 1,752,683 872,705 Current service cost - 173,408 - 63,963 77,550 Interest cost 518,408 115,255 2,755 196,898 113,452 Benefits paid (500,153) (110,708) (4,747) (126,309) (177,528) VRS loss 106,000 2,000 - 8,000 34,000 Actuarial (gains) / losses (122,770) 71,960 (1,266) (238,730) 42,113 Closing balance 4,239,314 1,193,848 19,561 1,656,505 962,292
Notes to the Consolidated Financial Statementsfor the year ended December 31, 2012
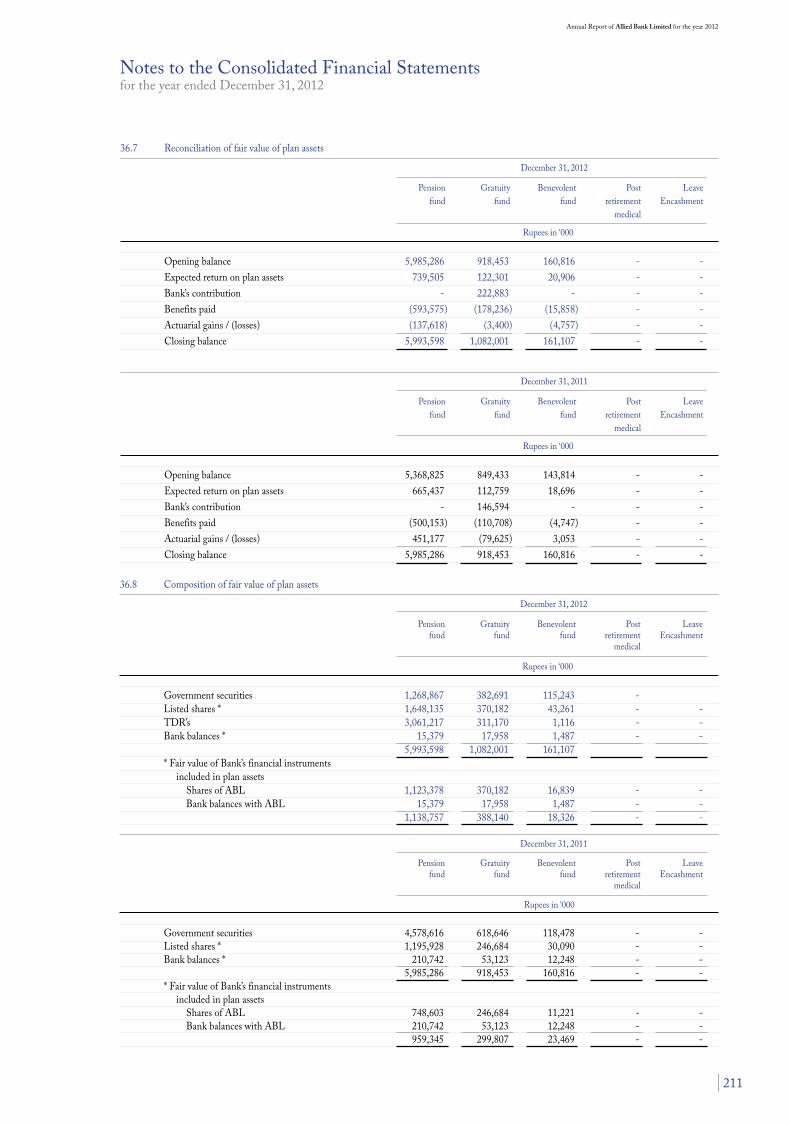
Annual Report of Allied Bank Limited for the year 2012
211
36.7 Reconciliation of fair value of plan assets
December 31, 2012
Pension Gratuity Benevolent Post Leave fund fund fund retirement Encashment
medical
Rupees in ‘000
Opening balance 5,985,286 918,453 160,816 - - Expected return on plan assets 739,505 122,301 20,906 - - Bank’s contribution - 222,883 - - - Benefits paid (593,575) (178,236) (15,858) - - Actuarial gains / (losses) (137,618) (3,400) (4,757) - - Closing balance 5,993,598 1,082,001 161,107 - -
December 31, 2011
Pension Gratuity Benevolent Post Leave fund fund fund retirement Encashment
medical
Rupees in ‘000
Opening balance 5,368,825 849,433 143,814 - - Expected return on plan assets 665,437 112,759 18,696 - - Bank’s contribution - 146,594 - - - Benefits paid (500,153) (110,708) (4,747) - - Actuarial gains / (losses) 451,177 (79,625) 3,053 - - Closing balance 5,985,286 918,453 160,816 - -
Notes to the Consolidated Financial Statementsfor the year ended December 31, 2012
36.8 Composition of fair value of plan assets
December 31, 2012
Pension Gratuity Benevolent Post Leave fund fund fund retirement Encashment
medical
Rupees in ‘000
Government securities 1,268,867 382,691 115,243 - Listed shares * 1,648,135 370,182 43,261 - - TDR’s 3,061,217 311,170 1,116 - - Bank balances * 15,379 17,958 1,487 - - 5,993,598 1,082,001 161,107 * Fair value of Bank’s financial instruments included in plan assets Shares of ABL 1,123,378 370,182 16,839 - - Bank balances with ABL 15,379 17,958 1,487 - - 1,138,757 388,140 18,326 - - December 31, 2011
Pension Gratuity Benevolent Post Leave fund fund fund retirement Encashment
medical
Rupees in ‘000
Government securities 4,578,616 618,646 118,478 - - Listed shares * 1,195,928 246,684 30,090 - - Bank balances * 210,742 53,123 12,248 - - 5,985,286 918,453 160,816 - - * Fair value of Bank’s financial instruments included in plan assets Shares of ABL 748,603 246,684 11,221 - - Bank balances with ABL 210,742 53,123 12,248 - - 959,345 299,807 23,469 - -
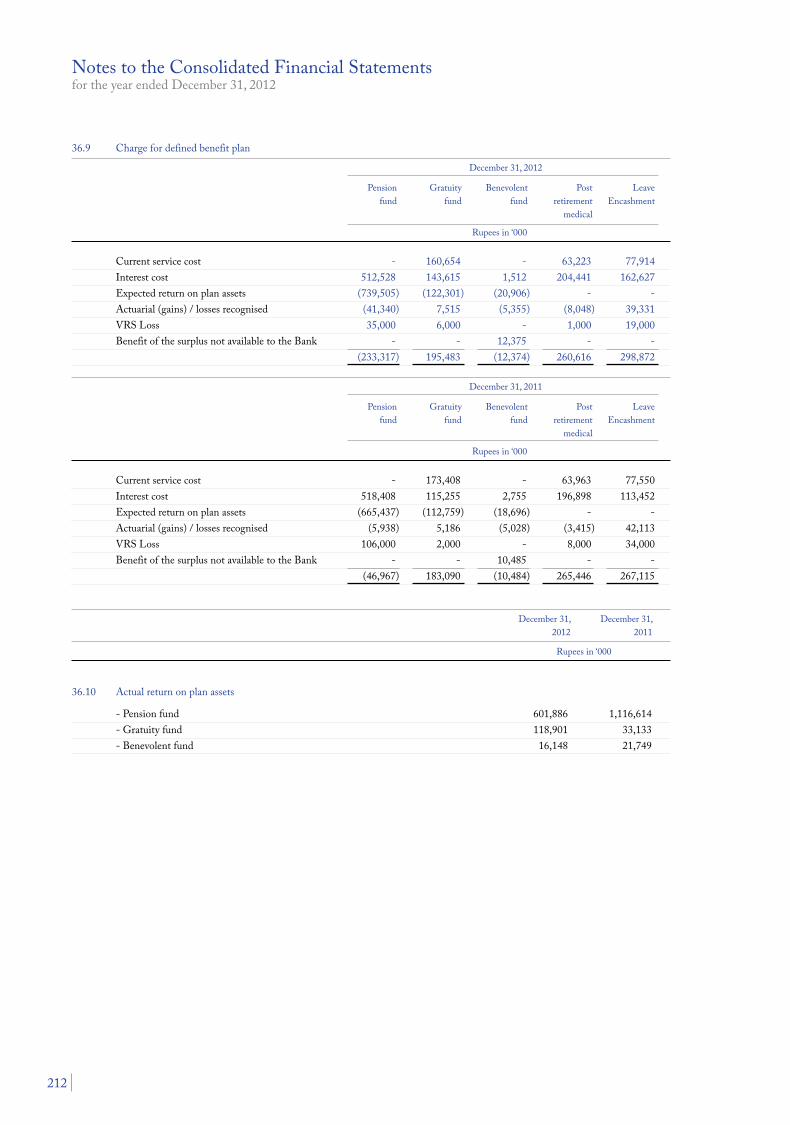
212
Notes to the Consolidated Financial Statementsfor the year ended December 31, 2012
36.9 Charge for defined benefit plan
December 31, 2012
Pension Gratuity Benevolent Post Leave fund fund fund retirement Encashment
medical
Rupees in ‘000
Current service cost - 160,654 - 63,223 77,914 Interest cost 512,528 143,615 1,512 204,441 162,627 Expected return on plan assets (739,505) (122,301) (20,906) - - Actuarial (gains) / losses recognised (41,340) 7,515 (5,355) (8,048) 39,331 VRS Loss 35,000 6,000 - 1,000 19,000 Benefit of the surplus not available to the Bank - - 12,375 - - (233,317) 195,483 (12,374) 260,616 298,872
December 31, 2011
Pension Gratuity Benevolent Post Leave fund fund fund retirement Encashment
medical
Rupees in ‘000
Current service cost - 173,408 - 63,963 77,550 Interest cost 518,408 115,255 2,755 196,898 113,452 Expected return on plan assets (665,437) (112,759) (18,696) - - Actuarial (gains) / losses recognised (5,938) 5,186 (5,028) (3,415) 42,113 VRS Loss 106,000 2,000 - 8,000 34,000 Benefit of the surplus not available to the Bank - - 10,485 - - (46,967) 183,090 (10,484) 265,446 267,115
December 31, December 31, 2012 2011
Rupees in ‘000
36.10 Actual return on plan assets
- Pension fund 601,886 1,116,614 - Gratuity fund 118,901 33,133 - Benevolent fund 16,148 21,749

Annual Report of Allied Bank Limited for the year 2012
213
Notes to the Consolidated Financial Statementsfor the year ended December 31, 2012
36.11 Five year data of defined benefit plan and experience adjustments
Pension fund 2012 2011 2010 2009 2008 Rupees in ‘000
Present value of defined benefit obligation 2,873,602 4,239,314 4,237,829 4,040,811 3,400,000 Fair value of plan assets (5,993,598) (5,985,286) (5,368,825) (5,138,070) (4,319,903) Surplus (3,119,996) (1,745,972) (1,130,996) (1,097,259) (919,903) Experience adjustments on plan obligations / assets Actuarial gains / (losses) on obligation 1,319,665 122,770 (191,900) (491,912) (117,235) Actuarial gains / (losses) on assets (137,618) 451,177 211,328 540,483 (1,264,567) Gratuity fund 2012 2011 2010 2009 2008 Rupees in ‘000
Present value of defined benefit obligation 1,384,215 1,193,848 941,933 766,547 557,547 Fair value of plan assets (1,082,001) (918,453) (849,433) (593,567) (304,031) Deficit 302,214 275,395 92,500 172,980 253,516 Experience adjustments on plan obligations / assets Actuarial gains / (losses) on obligation (58,334) (71,960) (41,223) (60,758) 60,479 Actuarial gains / (losses) on assets (3,400) (79,625) 125,349 131,570 (216,667) Benevolent fund 2012 2011 2010 2009 2008 Rupees in ‘000
Present value of defined benefit obligation 12,992 19,561 22,819 60,968 474,679 Fair value of plan assets (161,107) (160,816) (143,814) (143,594) (617,643) Surplus (148,115) (141,255) (120,995) (82,626) (142,964) Experience adjustments on plan obligations / assets Actuarial gains / (losses) on obligation (7,777) 1,266 25,350 6,697 94,790 Actuarial gains / (losses) on assets (4,757) 3,053 (202) 40,916 (153,801) Post retirement medical 2012 2011 2010 2009 2008 Rupees in ‘000
Present value of defined benefit obligation 1,381,400 1,656,505 1,752,683 1,681,204 1,521,833 Fair value of plan assets - - - - - Deficit 1,381,400 1,656,505 1,752,683 1,681,204 1,521,833 Experience adjustments on plan obligations Actuarial gains / (losses) on obligation 376,000 238,730 68,829 40,340 153,494 Leave Encashment 2012 2011 2010 2009 2008 Rupees in ‘000
Present value of defined benefit obligation 1,020,459 962,292 872,705 838,005 832,215 Fair value of plan assets - - - - - Deficit 1,020,459 962,292 872,705 838,005 832,215 Experience adjustments on plan obligations Actuarial gains / (losses) on obligation - - - - -

214
36.12 Expected contributions to be paid to the funds in the next financial year
The Bank contributes to the gratuity fund as per actuarial’s expected charge for the next financial year. Contribution to the benevolent fund is made by the Bank as per rates set out in the benevolent scheme. No contributions are being made to pension fund due to surplus of fair value of plan’s assets over present value of defined obligation. Based on actuarial advice, management estimates that the charge / reversal in respect of defined benefit plans for the year ending December 31, 2013 would be as follows:
Pension Gratuity Benevolent Post Leave fund fund fund retirement Encashment medical Rupees in ‘000
Expected (reversal) / charge for the next year (374,400) 231,309 (8,887) 243,708 183,396 37. DEFINED CONTRIBUTION PLAN
The Bank operates a contributory provident fund scheme for employees who are covered under the new gratuity scheme. The employer and employee both contribute 8.33% of the basic salaries to the funded scheme every month. Number of employees covered under this plan are 9,567 (2011: 9,093) as on December 31, 2012. During the year, employees made a contribution of Rs. 242.066 million (2011: 219.933 million) to the fund. The Bank has also made a contribution of equal amount to the fund.
38. COMPENSATION OF DIRECTORS AND EXECUTIVES
President/Chief Independent / Non- Executive Director Executives Executive Executive Directors
Note December 31, December 31 December 31, December 31 December 31, December 31, December 31, December 31, 2012 2011 2012 2011 2012 2011 2012 2011
Rupees in ‘000
Fees 38.1 - - 7,550 4,225 - - 125 300 Managerial remuneration 28,028 24,365 - - 15,353 13,350 1,165,772 1,062,406 Charge for defined benefit plans 1,667 1,614 - - 913 884 281,380 241,024 Contribution to defined contribution plan - - - - 1,279 1,112 97,629 88,739 Rent and house maintenance 12,615 10,973 - - 6,909 6,008 515,413 454,048 Utilities 2,803 2,443 - - 1,535 1,335 114,611 100,977 Medical 31 360 - - 190 196 143,997 127,219 Bonus 19,207 17,099 - - 14,661 13,150 374,195 412,242 Conveyance and others 219 285 - - 803 511 196,348 157,743 64,570 57,139 7,550 4,225 41,643 36,546 2,889,470 2,644,698 Number of persons 1 1 4 3 1 1 1,241 1,114 38.1 This represents meeting fees paid to independent / Non-Executive Directors excluding Sponsor Directors for attending meetings
of the Board of Directors, Audit Committee and other Board Committees held during the year. During the year Board of Directors in their meeting held on June 04, 2012 recommended an increase in meeting fee from Rs. 50,000 to Rs. 100,000, which was subsequently approved in Extra Ordinary General Meeting held on August 23, 2012.
39. FAIR VALUE OF FINANCIAL INSTRUMENTS
The fair value of traded investments is based on quoted market prices, and have been disclosed in note 9.
Fair value of fixed term loans, other assets, other liabilities and fixed term deposits cannot be calculated with sufficient reliability due to the absence of current and active market for such assets and liabilities and reliable data regarding market rates for similar instruments. The provision for impairment of loans and advances has been calculated in accordance with the Bank’s accounting policy as stated in note 5.4.
The maturity and repricing profile and effective rates are stated in notes 43.3.1 and 43.2.4 respectively. In the opinion of the management, the fair value of the remaining financial assets and liabilities are not significantly different from
their carrying values since assets and liabilities are either short-term in nature or in the case of customer loans and deposits are frequently repriced.
Notes to the Consolidated Financial Statementsfor the year ended December 31, 2012

Annual Report of Allied Bank Limited for the year 2012
215
40. SEGMENT DETAILS WITH RESPECT TO BUSINESS ACTIVITIES
The segment analysis with respect to business activity is as follows:- For the Year Ended December 31, 2012
Corporate Trading & Retail Commercial Payment & Asset Eliminations Total Finance Sales Banking Banking Settlement Management
Rupees in ‘000 Total income 501,703 3,185,436 39,597,029 55,836,450 592,932 439,877 (36,396,525) 63,756,902 Total expenses (231,989) (4,411,095) (31,348,352) (51,733,839) (290,731) (255,054) 36,396,525 (51,874,535) Net income / (loss) 269,714 (1,225,659) 8,248,677 4,102,611 302,201 184,823 - 11,882,367 Segment assets (gross) 317,997 9,478,602 120,589,035 521,918,500 336,616 888,576 - 653,529,326 Segment non performing loans - - 7,150,202 13,517,359 - - - 20,667,561 Segment provision required - - 6,168,891 11,636,141 - - - 17,805,032 Segment liabilities 272,124 18,599,234 503,837,433 51,781,198 6,505,857 42,306 - 581,038,152 Segment return on net assets (ROA) (%) 84.82% -12.93% 7.21% 0.80% 89.78% 20.80% - - Segment cost of funds (%) -0.02% 28.54% 6.87% 9.63% 0.00% 0.00% - - For the Year Ended December 31, 2011
Corporate Trading & Retail Commercial Payment & Asset Eliminations Total Finance Sales Banking Banking Settlement Management
Rupees in ‘000 Total income 400,890 2,197,570 33,139,197 49,517,619 720,216 378,407 (27,261,206) 59,092,693 Total expenses (210,455) (3,051,358) (27,196,204) (44,964,051) (413,743) (261,919) 27,261,206 (48,836,524) Net income / (loss) 190,435 (853,788) 5,942,993 4,553,568 306,477 116,488 - 10,256,173 Segment assets (gross) 218,401 559,815 108,738,971 426,927,011 326,217 694,267 - 537,464,682 Segment non performing loans - - 6,860,243 13,592,222 - - - 20,452,465 Segment provision required - - 5,526,915 12,176,802 - - - 17,703,717 Segment liabilities 196,172 30,641,723 386,210,738 50,981,414 4,328,203 51,004 - 472,409,254 Segment return on net assets (ROA) (%) 86.37% -13.18% 5.81% 1.21% 113.45% 18.88% - - Segment cost of funds (%) 0.00% 22.34% 9.51% 9.40% 0.00% - - -
Notes to the Consolidated Financial Statementsfor the year ended December 31, 2012

216
41. RELATED PARTY TRANSACTIONS
The Bank and its subsidiary have related party relationships with, companies with common directorship, directors, employee benefit plans and key management personnel.
Contributions to the accounts in respect of staff retirement benefits are made in accordance with actuarial valuation / terms of the contribution plan.
Remuneration of the key management personnel are in accordance with the terms of their employment. Other transactions are at agreed terms.
December 31, 2012 December 31, 2011
Key Key Associated management Other related Associated management Other related Directors Companies* personnel parties Directors Companies* personnel parties
Rupees in ‘000
Nature of related party transactions Loans Loans at the beginning of the year 49,969 - 203,005 - 61,581 - 211,703 16,061,896 Loans given during the year 14,847 2,000,000 91,199 3,185 23,757 - 37,765 464,087 Loans repaid/ adjustment during the year (20,974) (166,667) (117,776) (2,985) (35,369) - (46,463) (16,525,983)Loans at the end of the year 43,842 1,833,333 176,428 200 49,969 - 203,005 -
Deposits Deposits at the beginning of the year 17,270 48,985 13,556 230,430 9,821 93,965 16,128 3,042,357 Deposits received during the year 6,532,379 13,700,859 310,582 327,706,930 4,147,530 13,513,467 191,103 14,937,123 Deposits repaid during the year (6,515,996) (13,708,833) (296,498) (322,261,546) (4,140,081) (13,558,447) (193,675) (17,749,050)Deposits at the end of the year 33,653 41,011 27,640 5,675,814 17,270 48,985 13,556 230,430
Nostro balances - 136,808 - - - 131,749 - - Borrowings - - - - - 1,204,313 - - Lending - 1,479,252 - - - - - - Investments in shares/ open end mutual funds - 219,130 - 872,122 - 240,969 - 14,075,798 Other receivables - - - 62,563 - - - 74,071 Other payable - - - 110 - - - 13,630 Rent payable - - - - - - - 731 Net receivable from : staff retirement benefit funds - - - 1,704,067 - - - 1,430,976
December 31, 2012 December 31, 2011
Key Key Associated management Other related Associated management Other related Directors Companies* personnel parties Directors Companies* personnel parties
Rupees in ‘000
Mark-up earned 1,729 162,624 10,974 - 2,234 - 12,556 256,504 Income on Placements - 118 - - - 4 - - Income on lendings - 1,775 - - - 111 - - Dividend Income - - - 6,066,277 - - - 1,204,410 Capital Gain/ (Loss) - - - (899,779) - - - (60,225)Sales Commission - - - 1,531 - - - 12,251 Management fee sharing expense - - - 110 - - - 4,809 Management fee income - - - 418,563 - - - 305,338 Mark-up expense on deposits 2,032 6 224 176,366 559 29 82 220,873 Fee commission/ bank charges 19 1,062 15 168 - - - - Interest expense on borrowings - - - - - 2,578 - - Directors’ meeting fee 7,550 - - - 4,225 - - -Remuneration - - 246,176 - - - 243,361 - NIFT charges - - - 80,720 - - - 81,337 Rent Expense - 16,482 - - - 14,624 - - Charge / (reversal) in respect of : staff retirement benefit funds - - - 195,262 - - - 345,571
Other balances, held with related parties, outstanding at the end of the current year and transactions made during the year are included in notes 7.1, 9.4, 9.5, 20.2 and 38 to these consolidated financial statements.
* Associated company on the basis of common directorship.
Notes to the Consolidated Financial Statementsfor the year ended December 31, 2012

Annual Report of Allied Bank Limited for the year 2012
217
42. CAPITAL ASSESSMENT AND ADEQUACY
42.1 Scope of Applications
The Basel II Framework is applicable to the Bank both at the consolidated level (comprising of wholly owned subsidiary - ABL Asset Management Company Limited) and also on a stand alone basis.
42.2 Capital Structure
Group’s regulatory capital is analyzed into two tiers: Tier 1 capital, which includes fully issued, subscribed and paid up capital, balance in share premium account, reserve for bonus
issue, general reserves as per the financial statements and net un-appropriated profits, etc after deductions for investments in the equity of subsidiary companies engaged in banking and financial activities and deficit on revaluation of available for sale investments.
Tier 2 capital, which includes general provisions for loan losses (up to a maximum of 1.25 % of risk weighted assets), reserves on
the revaluation of fixed assets and equity investments (up to a maximum of 45% of the balance in the related revaluation reserves) and subordinated debt (up to a maximum of 50% of Tier 1 capital).
The Bank has issued unsecured subordinated Term Finance Certificates, which contributes towards Tier II capital for minimum
capital requirements (MCR) to support the Bank’s growth. The regulatory approval for TFC I and TFC II was obtained in December 2006 and August 2009 respectively.
Liability to the TFC holders is subordinated to and ranked inferior to all other debts of the bank including deposits. TFC I is not
redeemable before maturity without prior approval of the SBP, where as TFC II can be redeemed after the 11th redemption date of the entire TFC issue.
The salient features of the issue are as follow:
Term Finance Certificate-I Term Finance Certificate-II
Outstanding Amount- (Rupees in thousand) 2,494,000 2,996,400 Issue date December 06, 2006 August 28, 2009 Total issue 2,500,000 3,000,000 Rating AA AA Listing Karachi Stock Exchange Limited Karachi Stock Exchange Limited Rate Payable semi annually Payable semi annually - Six months KIBOR plus 1.9% - Six months KIBOR plus 0.85% for first 5 years - Six months KIBOR plus 1.30% from start of 6th year Call Option Call option is not available to the issuer Issuer has the right to seek redemption after the eleventh redemption date of the entire TFC issue, prior to its stated maturity. Repayment 8 Years (2007 - 2014) 10 Years (2009 - 2019) Tier 3 Capital has also been prescribed by the SBP for managing market risk; however the Group does not have any Tier 3
capital. The required capital is achieved by the Group through: (a) enhancement in the risk profile of asset mix at the existing volume level; (b) ensuring better recovery management; and (c) maintain acceptable profit margins.
Notes to the Consolidated Financial Statementsfor the year ended December 31, 2012

218
Detail of the Group’s eligible capital (on consolidated basis) is as follows:
December 31, December 31, 2012 2011
Rupees in ‘000
Tier I Capital Shareholders’ equity /Assigned Capital 9,463,421 8,603,110 Share premium - 201,856 Reserves 10,896,052 8,560,889 Unappropriated profits (Net of Losses) 22,906,178 20,395,717 Total Tier I Capital 43,265,651 37,761,572 Less: Book value of intangibles (987,070) (854,041) Shortfall in provisions required against classified assets irrespective of relaxation allowed (1,939,887) (1,698,881) Reciprocal investment - - Other deductions (represents 50% of investment in subsidiary) - - (2,926,957) (2,552,922) Eligible Tier I Capital 40,338,694 35,208,650 Tier II Capital Subordinated Debt (upto 50% of total Tier 1 Capital) 2,946,964 3,293,365 General Provisions subject to 1.25% of Total Risk Weighted Assets 52,090 32,647 Foreign Exchange Translation Reserves 10,198 - Revaluation Reserve (upto 45%) 3,993,665 2,815,138 Total Tier II Capital 7,002,917 6,141,150 Less: Investment in a subsidiary company (50%) - - Eligible Tier II Capital 7,002,917 6,141,150 Eligible Tier III Capital - - Total Regulatory Capital Base 47,341,611 41,349,800 42.3 Capital Adequacy
Objectives of Managing Capital
Capital Management aims to ensure that there is sufficient capital to meet the capital requirements of the Bank as determined by the underlying business strategy and the minimum requirements of the SBP. The Capital Management process is governed by the Bank’s Asset & Liability Committee (ALCO) and Management Committee (MANCO). Further, capital adequacy and management is overseen by the Board’s Risk Management Committee (BRMC) and Strategic Planning and Monitoring Committee (SPMC).
Bank’s capital management seeks:
- to comply with the capital requirements set by the regulators and comparable to the peers; - to actively manage the supply of capital costs and increase capital velocity; - to increase strategic and tactical flexibility in the deployment of capital to allow for the timely reallocation of capital; - to improve the liquidity of the Bank’s assets to allow for an optimal deployment of the Bank’s resources; - to protect the Bank against unexpected events and maintain strong ratings; - to safeguard the Bank’s ability to continue as a going concern so that it can continue to provide adequate return to
shareholders; - availability of adequate capital (including the quantum) at a reasonable cost so as to enable the Bank to expand; and - to achieve low overall cost of capital with appropriate mix of capital elements. Externally Imposed Capital Requirements
In order to strengthen the solvency of Banks / Development Financial Institutions (DFI), SBP through its BSD Circular No. 07 of 2009 dated April 15, 2009 has asked the Banks to raise their minimum paid up capital to Rs. 9 billion free of losses by the end of financial year 2012. Furthermore the Banks are required to increase their minimum paid up capital to Rs 10 billion in a phased manner by the end of financial year 2013.
SBP through its BSD Circular No. 09 dated April 15, 2009 has asked Banks to achieve the minimum Capital Adequacy Ratio
(CAR) of 10% on standalone as well as on consolidated basis latest by December 31, 2010. The paid up capital and CAR of the Group stands at Rs. 9.463 billion and 16.34% of its risk weighted exposure as at December
31, 2012.
The Group has complied with all externally imposed capital requirements as at year end.
Notes to the Consolidated Financial Statementsfor the year ended December 31, 2012

Annual Report of Allied Bank Limited for the year 2012
219
42.4 Risk Weighted Exposures
Capital Requirements Risk Weighted Assets
December 31, December 31, December 31, December 31, 2012 2011 2012 2011
Rupees in ‘000
Credit Risk
Portfolios subject to standardized approach (Simple or Comprehensive)
On-Balance Sheet
(a) Cash and Cash Equivalents - - - - (b) Claims on Government of Pakistan (Federal or Provincial Governments) and SBP, denominated in PKR - - - - (c) Foreign Currency claims on SBP arising out of statutory obligations of banks in Pakistan - - - (d) Claims on other sovereigns and on Government of Pakistan or provincial governments or SBP denominated in currencies other than PKR 392,497 162,461 3,924,967 1,624,605 (e) Claims on Bank for International Settlements, International Monetary Fund, European Central Bank, and European Community - - - - (f ) Claims on Multilateral Development Banks - - - - (g) Claims on Public Sector Entities in Pakistan 168,313 102,129 1,683,131 1,021,286 (h) Claims on Banks 338,034 261,066 3,380,340 2,610,657 (i) Claims, denominated in foreign currency, on banks with original maturity of 3 months or less 40,226 58,114 402,264 581,144 (j) Claims on banks with original maturity of 3 months or less denominated in PKR and funded in PKR 78,877 12,545 788,772 125,455 (k) Claims on Corporates (excluding equity exposures) 11,877,544 13,602,452 118,775,444 136,024,521 (l) Claims categorized as retail portfolio 1,700,008 2,169,600 17,000,084 21,696,004 (m) Claims fully secured by residential property 223,781 177,504 2,237,812 1,775,042 (n) Past Due loans: 1. The unsecured portion of any claim (other than loans and claims secured against eligible residential mortgages as defined in section 2.1 of circular 8 of 2006) that is past due for more than 90 days and/or impaired:
1.1 where specific provisions are less than 20 per cent of the outstanding amount of the past due claim. 48,495 73,146 484,947 731,459 1.2 where specific provisions are no less than 20 per cent of the outstanding amount of the past due claim. 280,234 271,692 2,802,338 2,716,919 1.3 where specific provisions are more than 50 per cent of the outstanding amount of the past due claim. 2,473 55 24,734 548
2. Loans and claims fully secured against eligible residential mortgages that are past due for more than 90 days and/or impaired - - - - 3. Loans and claims fully secured against eligible residential mortgage that are past due by 90 days and /or impaired and specific provision held there against is more than 20% of outstanding amount - - - - (o) Listed Equity investments and regulatory capital instruments issued by other banks (other than those deducted from capital) held in the banking book. 2,098,441 672,602 20,984,411 6,726,015 (p) Unlisted equity investments (other than that deducted from capital) held in banking book 390,049 281,868 3,900,485 2,818,678 (q) Investments in venture capital - - - - (r) Investments in premises, plant and equipment and all other fixed assets 1,889,471 1,724,108 18,894,711 17,241,083 (s) Claims on all fixed assets under operating lease - - - - (t) All other assets 515,862 546,185 5,158,618 5,461,854 20,044,305 20,115,527 200,443,058 201,155,270
Notes to the Consolidated Financial Statementsfor the year ended December 31, 2012

220
Capital Requirements Risk Weighted Assets
December 31, December 31, December 31, December 31, 2012 2011 2012 2011
Rupees in ‘000
Off- Balance Sheet - Non Market related Exposures Direct Credit Substitutes/ Lending of securities or posting of securities as collateral 2,546,572 2,959,326 25,465,724 29,593,260 Performance related contingencies 141,285 - 1,412,847 - Trade Related contingencies/Other Commitments with original maturity of one year or less 355,963 302,600 3,559,626 3,025,998 3,043,820 3,261,926 30,438,197 32,619,258 Off- Balance Sheet - Market related Exposures 33,869 56,159 338,691 561,588 Total Credit Risk (A) 23,121,994 23,433,612 231,219,946 234,336,116 Market Risk Capital requirement for portfolios subject to standardized approach Interest rate risk - - - - Equity position risk etc. 152,881 1,811,373 1,528,814 18,113,732 152,881 1,811,373 1,528,814 18,113,732 Capital requirement for portfolios subject to internal models approach Interest rate risk - - - - Foreign exchange risk etc. 93,291 38,017 932,914 380,172 93,291 38,017 932,914 380,172 Total Market Risk (B) 246,172 1,849,390 2,461,728 18,493,904 Operational Risk Basic Indicator Approach-Total of operational risk (C ) 5,608,547 5,172,713 56,085,463 51,727,126
TOTAL of A + B + C 28,976,713 30,455,715 289,767,137 304,557,146 December 31, December 31, 2012 2011 Capital Adequacy Ratio Total eligible regulatory capital held (Note 42.2) (a) 47,341,611 41,349,800
Total Risk Weighted Assets (Note 42.4) (b) 289,767,137 304,557,146
Capital Adequacy Ratio (a) / (b) 16.34% 13.58% 43. RISK MANAGEMENT
The Risk Management Framework (the Framework) provides principles for identifying, assessing, and monitoring risk within the Bank. The Framework specifies the key elements of the risk management process in order to maximize opportunities, to minimize adversity and to achieve improved outcomes and outputs based on informed decision making.
Categories of Risk
The Bank generates most of its revenues by accepting Credit, Country, Liquidity and Market Risk. Effective management of these four risks is the decisive factor in our profitability. In addition, the Bank is subject to certain consequential risks that are common to all business undertakings. These risks are grouped under two headings: Operational and Reputational Risk. The Framework is organized with reference to these five risk categories, as detailed below:
Credit Risk This risk is defined as the possibility of loss due to unexpected default or a deterioration of credit worthiness of a business partner.
Credit Risk includes Country Risk i.e., the risks that counterparty is unable to meet its foreign currency obligations as a result of adverse economic conditions or actions taken by governments in the relevant country.
Market Risk The risk of loss generated by adverse changes in the price of financial assets or contracts currently held by the Bank (this risk is also known as price risk).
Liquidity Risk The risk that the Bank is unable to meet its payment obligations when they fall due and to replace funds when they are withdrawn; the consequences of which may be the failure to meet obligations to repay depositors and fulfill commitments to lend.
Notes to the Consolidated Financial Statementsfor the year ended December 31, 2012

Annual Report of Allied Bank Limited for the year 2012
221
Operational Risk Operational Risk is the risk of loss resulting from inadequate or failed internal processes, people, and systems or from external events. The definition excludes reputational risk.
Reputational Risk The risk of failing to meet the standards of performance or behavior required or expected by stakeholders in commercial activities or the way in which business is conducted.
Risk Responsibilities
- The Board of Directors is accountable for overall supervision of the risk management process. This is discharged by distributing responsibilities at Board level for their management and determining the manner in which risk authorities are set. The Board is also responsible for approval of all risk policies and ensuring that these are properly implemented. Further, the Board shall also seek appointment of senior management personnel capable of managing the risk activities conducted by the Bank.
- The Board Risk Management Committee (BRMC) is responsible for ensuring that the overall risk strategy and appetite of the Bank is appropriately defined in the Strategic Plan and recommend the same to the Board of Directors.
- The BRMC recommends for approval to the Board of Directors the policies proposed by MANCO (Management Committee of the Bank) or ALCO (Assets and Liability Committee) which discharges various responsibilities assigned to it by the BRMC.
- The CEO and Group Chiefs are accountable for the management of risk collectively through their membership of risk committees, i.e., Management Committee and the Asset & Liability Committee. Independent supervision of risk management activities is provided by the Audit Committee.
- The Risk Management Group is headed by a Group Chief responsible to set-up and implement the Framework of the Bank.
Risk Management Group Organization
Risk management functions have been segregated by business specialization, i.e., Credit Risk, Credit Administration, Risk Architecture, Risk Analytics, Operational Risk and Market Risk. All these functions are operating in tandem to improve and maintain the health of assets and liabilities.
43.1 Credit Risk
Credit risk, the potential default of one or more debtors, is the largest source of risk for the Bank. The Bank is exposed to credit risk through its lending and investment activities. The Bank’s credit risk function is divided into Corporate and Financial Institutions Risk, Commercial and Retail Risk, and Consumer Risk. The functions operate within an integrated framework of credit policies, guidelines and processes. The credit risk management activities are governed by the Credit Risk Framework of the Bank that defines the respective roles and responsibilities, the credit risk management principles and the Bank’s credit risk strategy. Further Credit Risk Management is supported by a detailed Credit Policy and Procedural Manual.
The Bank manages 3 principal sources of credit risk: i) Sovereign credit risk on its public sector advances ii) Non-sovereign credit risk on its private sector advances iii) Counterparty credit risk on interbank limits Sovereign Credit Risk
When the Bank lends to public sector borrowers, it prefers obtaining a full sovereign guarantee or the equivalent from the Government of Pakistan (GOP). However, certain public sector enterprises have a well defined cash flow stream and appropriate business model, based on which the lending is secured through collaterals other than GOP guarantee.
Non-Sovereign Credit Risk
When the Bank lends to private sector borrowers it does not benefit from sovereign guarantees or the equivalent. Consequently, each borrower’s credit worthiness is analyzed on the Credit Application Package that incorporates a formalized and structured approach for credit analysis and directs the focus of evaluation towards a balanced assessment of credit risk with identification of proper mitigates. These risks include Industry Risk, Business Risk, Financial Risk, Security Risk and Account Performance Risk. Financial analysis is further strengthened through use of separate financial spreadsheet templates that have been designed for manufacturing/trading concerns, financial institutions and insurance companies.
Counter Party Credit Risk on Interbank Limits
In the normal course of its business, the Bank’s Treasury utilizes products such as Reverse REPO and call lending to meet the needs of the borrowers and manage its exposure to fluctuations in market, interest and currency rates and to temporarily invest its liquidity prior to disbursement. All of these financial instruments involve, to varying degrees, the risk that the counterparty in the transaction may be unable to meet its obligation to the Bank.
Reflecting a preference for minimizing exposure to counterparty credit risk, the Bank maintains eligibility criteria that link the exposure limits to counterparty credit ratings by external rating agencies. For example, the minimum rating for counterparties to be eligible for a banking relationship with the Bank is A-.
Notes to the Consolidated Financial Statementsfor the year ended December 31, 2012

222
Country Risk
The Bank has in place a Country Risk Management Framework which has been approved by the Board. This framework focuses on providing detailed roles and responsibilities with respect to country risk assessment as well as limit setting, exposure management and reporting of cross border exposure undertaken by the Bank. The Bank utilizes Export Credit Assessment (ECA) Scores published by The Organization for Economic Co-operation and Development (OECD) as well as country risk rating assessment reports published by Dun & Bradstreet Limited (an international credit rating agency) which uses political, commercial, macroeconomic and external risk factors in assigning a country risk rating. The country risk limits used by the Bank are linked to the ECA Scores and Dun & Bradstreet ratings and FID is responsible for monitoring of country exposure limits.
Credit Administration
Credit Administration is involved in minimizing losses that could arise due to security and documentation deficiencies. The Credit Administration Division constantly monitors the security and documentation risks inherent in the existing credit portfolio through six regional credit administration departments located all over the country.
Risk Analytics
To ensure a prudent distribution of asset portfolio, the Bank manages its lending and investment activities within a framework of Borrower, Group and Sector exposure limits and risk profile benchmarks.
Internal Risk Rating Models
The Bank has developed internal risk rating models to assign credit risk ratings to its Corporate, Institutional, SME and Consumer borrowers. These models are based on expert judgment, comprising of both quantitative and qualitative factors. The rating models are being automated through the Bank’s Loan Origination System, and are given due weightage while extending credit to these asset classes. The Bank intends to comply with the requirements of Foundation Internal Ratings Based approach for credit risk measurement under Basel II, for which services of a consultant have been solicited to assist the Bank in carrying out statistical testing and validation of the rating models.
Stress Testing
The Bank is also conducting stress testing of its existing portfolio, which includes all assets, i.e., advances as well as investments. This exercise is conducted on a quarterly basis through assigning shocks to all assets of the Bank and assessing its resulting affect on capital adequacy.
Early Warning System
In order to ensure that monitoring of the regular lending portfolio focuses on problem recognition, an early warning system in the form of a ‘Watch-List’ category has been instituted to cover the gap between Regular and Substandard categories. Identification of an account on the said ‘Watch-List’ influences the lending branch to carry out an assessment of the borrower’s ability to rectify the identified problem / weakness within a reasonable time-frame, consider tighter structuring of facilities, confirm that there are no critical deficiencies in the existing security position and, if possible, arrange for strengthening of the same through obtaining additional collateral. It should however, be noted that the Watch-List category of accounts is part of the Bank’s Regular portfolio and does not require any provisioning.
In some cases, an account may even be downgraded directly from a Regular to Sub-Standard or worse on subjective basis based on the severity of the trigger involved.
Management of Non Performing Loans
The Bank has a Special Asset Management Group (SAMG), which is responsible for management of non performing loans. SAMG undertakes restructuring / rescheduling of problem loans, as well as litigation both civil and criminal for collection of debt.
For the non-performing loan portfolio, the Bank makes a specific provision based on an assessment of the credit impairment of each loan. At the end of 2012, the specific provisioning rate was 85.93% of the non-performing loan portfolio.
The accounting policies and methods used to determine specific and general provision are given in the note numbers 5 and 10 to these financial statements. The movement in specific and general provision held is given in note 10.4 to these financial statements.
Portfolio Diversification
During the year 2012, the Bank’s focus remained on pruning and consolidation of advances portfolio, while concomitantly channelizing the available liquidity towards risk free assets i.e. Treasury Bills and PIBs. In line with this strategy, the advances show an overall increase by 10.21%, which has resulted in a healthy Advances to Deposit Ratio and Capital Adequacy Ratio.
Efficient diversification has been a key consideration for maintaining healthy advances portfolio. The diversification takes into account the volatility of various sectors by placing concentration limits on lending to these sectors thereby ensuring a diversified advances portfolio. Composition of the Bank’s advance’s portfolio is significantly diversified. Agriculture, Textile, Cement, and Electric Generation are major contributors to the advances portfolio. These sectors are considered to be the biggest contributors towards country’s GDP as well.
Notes to the Consolidated Financial Statementsfor the year ended December 31, 2012

Annual Report of Allied Bank Limited for the year 2012
223
43.1.1 Segmental Information
43.1.1.1 Segments by class of business
December 31, 2012
Advances (Gross) Deposits Contingencies and Commitments
Rupees Percent Rupees Percent Rupees Percent in ‘000 in ‘000 in ‘000
Agriculture, Forestry and Hunting 2,559,243 0.89% 23,119,213 4.49% 842,382 0.61% Basic metals (iron, steel) 2,535,624 0.88% 3,543,778 0.69% 786,616 0.57% Beverages 423,153 0.15% 61,538 0.01% 77,916 0.06% Cement / clay & ceramics 9,371,536 3.24% 1,626,253 0.32% 1,449,678 1.05% Chemical & pharmaceutical 20,428,684 7.07% 1,019,857 0.20% 837,597 0.60% Construction 4,401,714 1.52% 25,000,280 4.86% 10,415,008 7.52% Education 40,367 0.01% 11,639,094 2.26% 3,727 0.00% Financial 5,738,824 1.99% 4,847,216 0.94% 45,885,687 33.11% Finishing of Textile 10,953,823 3.79% 2,355,769 0.46% 459,140 0.33% Fishing 16,996 0.01% - 0.00% - 0.00% Footware & leather garments 455,457 0.16% 287,124 0.06% 71,063 0.05% Furniture & sports goods 567,305 0.20% 1,164,671 0.23% 102,785 0.07% Grains & related 6,844,285 2.37% 4,766,924 0.93% - 0.00% Health & social welfare 44,708 0.02% 3,199,003 0.62% 24,788 0.02% Hotel, restaurant & clubs 768,465 0.27% 2,930,115 0.57% - 0.00% Machinery & equipment 2,629,838 0.91% 2,847,663 0.55% 5,450,854 3.93% Manufacture of made up & ready made garments 3,153,672 1.09% 836,698 0.16% 13,026 0.01% Manufacture of transport equipment 452,360 0.16% 294,525 0.06% 170,911 0.12% Paper & paper boards 8,889,859 3.08% 20,503 0.00% 364,062 0.26% Petroleum products 1,976,112 0.68% 6,649,988 1.29% 825,322 0.60% Power, gas, water & sanitary 45,508,739 15.75% 3,615,350 0.70% 5,076,852 3.66% Printing, publishing & allied 118,821 0.04% 44,752 0.01% 53,245 0.04% Real estate, renting, and business activities 3,421,312 1.18% 83,416,781 16.21% 9,202 0.01% Rubber & plastic 458,701 0.16% 1,580,473 0.31% 297,634 0.21% Spinning 26,304,775 9.10% 9,732,133 1.89% 318,062 0.23% Sugar 5,511,440 1.91% 2,390,525 0.46% 334,000 0.24% Transport, storage & communication 5,553,689 1.92% 2,048,743 0.40% 1,065,651 0.77% Weaving 4,132,666 1.43% 4,632,180 0.90% 75,228 0.05% Wholesale & retail trade 11,021,755 3.81% 46,836,911 9.10% 1,795,936 1.30% Individuals 7,657,669 2.65% 131,635,979 25.58% 6,964,275 5.03% Others 96,979,123 33.57% 132,558,405 25.75% 54,796,468 39.55% 288,920,715 100.00% 514,702,444 100.00% 138,567,115 100.00%
43.1.1.2 Segments by sector
December 31, 2012
Advances (Gross) Deposits Contingencies and Commitments
Rupees Percent Rupees Percent Rupees Percent in ‘000 in ‘000 in ‘000
Public / Government 77,366,348 26.78% 57,904,113 11.25% 25,222,611 18.20% Private 211,554,367 73.22% 456,798,331 88.75% 113,344,504 81.80% 288,920,715 100.00% 514,702,444 100.00% 138,567,115 100.00%
Notes to the Consolidated Financial Statementsfor the year ended December 31, 2012

224
43.1.1.4 Details of non-performing advances and specific provisions by sector. December 31, 2012 December 31, 2011
Classified Specific Classified Specific Advances Provisions Advances Provisions Held Held
Rupees in ‘000
Public / Government 138,681 138,681 144,565 72,283 Private 20,528,880 17,614,261 20,307,900 17,598,787 20,667,561 17,752,942 20,452,465 17,671,070
43.1.1.3 Details of non-performing advances and specific provisions by class of business segment
December 31, 2012 December 31, 2011
Classified Specific Classified Specific Advances Provisions Advances Provisions Held Held
Rupees in ‘000
Agriculture, Forestry and Hunting 350,569 249,890 191,594 117,701
Food & Beverages 412,574 408,880 742,356 677,453 Spinning 2,041,246 1,823,545 3,124,538 2,306,832 Weaving 1,466,767 857,692 9,040 9,040 Finishing of Textile 6,011,402 5,389,845 1,936,749 2,050,251 Footware & leather garments 131,685 96,238 55,964 55,964 Paper & paper boards 21,508 21,508 2,559 2,559 Printing, publishing & allied 5,846 5,846 31,677 31,677 Petroleum products 5,497 4,248 6,062 4,939 Chemical & pharmaceutical 405,028 341,872 373,525 353,898 Rubber & plastic 42,146 38,900 2,680 2,403 Cement/clay & ceramics 39,880 19,940 119,625 31,156 Basic metals (iron, steel) 20,383 20,383 866,035 816,727 Machinery & equipment 1,274,679 1,274,679 1,292,141 1,283,410 Power, gas, water & sanitary 239,916 239,916 839,515 839,515 Manufacture of transport equipment 246,449 236,949 83,410 75,118 Financial 81,516 40,759 343,808 233,925 Real estate, renting, and business activities 155,724 155,724 1,745,401 1,659,885 Transport, storage & communication 6,100 6,100 361,199 350,232 Hotel, restaurant & clubs 7,414 7,167 63,319 59,532 Construction 103,478 90,888 625,067 590,694 Furniture & sports goods 73,409 72,059 215,210 112,077 Wholesale & retail trade 478,295 448,307 2,206,086 1,988,895 Individuals 358,248 347,126 36,966 36,966 Others 6,687,802 5,554,481 5,177,939 3,980,221 20,667,561 17,752,942 20,452,465 17,671,070
Notes to the Consolidated Financial Statementsfor the year ended December 31, 2012

Annual Report of Allied Bank Limited for the year 2012
225
43.1.1.5 Geographical Segment Analysis
December 31, 2012
Profit Total Net Contingencies before assets assets and taxation employed employed Commitments
Rupees in ‘000
Pakistan operations 15,925,655 628,108,485 48,501,183 138,076,927 Middle East 13,094 1,376,126 120,662 487,691 Karachi Export Processing Zone 207,692 2,817,095 2,641,709 2,497 220,786 4,193,221 2,762,371 490,188 16,146,441 632,301,706 51,263,554 138,567,115
43.1.2 Credit Risk - General Disclosures
The Bank is following standardized approach for all its Credit Risk Exposures.
43.1.2.1 Credit Risk: Disclosures for portfolio subject to Standardized Approach and supervisory risk weights in IRB approach Basel II specific
Under standardized approach, the capital requirement is based on the credit rating assigned to the counterparties by the External Credit Assessment Institutions (ECAIs) duly recognized by SBP for capital adequacy purposes. In this connection, the Bank utilizes the credit ratings assigned by ECAIs and has recognized agencies such as PACRA (Pakistan Credit Rating Agency), JCR-VIS ( Japan Credit Rating Company – Vital Information Systems), Fitch, Moody’s and Standard & Poors which are also recognized by the SBP. The Bank also utilizes rating scores of Export Credit Agencies (ECA) participating in the “Arrangement on Officially Supported Export Credits”
The Standardised Approach to credit risk sets out fixed risk weights corresponding, where appropriate, to external credit assessment levels or for unrated claims.
Selection of ECAIs
The Bank selects particular ECAI(s) for each type of claim. Amongst the ECAIs that have been recognised as eligible by SBP, the following are being used against each respective claim type.
Sovereigns Exposures: For foreign currency claims on sovereigns, the Bank uses country risk scores of Export Credit Agencies (ECA) participating in the “Arrangement on Officially Supported Export Credits” available on OECD’s website.
Exposures to Multilateral Development Banks (MDBs): For exposures on MDBs not eligible for a 0% risk weight, ratings of Moody’s, S&P and Fitch are being used to calculate risk-weighted assets.
Exposures to Public Sector Entities (PSEs): For PSE exposures, ratings of PACRA and JCR-VIS are used to arrive at risk weights.
Bank Exposures: For foreign banks (i.e., incorporated outside Pakistan), ratings of Moody’s, S&P and Fitch is being used to arrive at risk weights. However, for local banks (i.e., incorporated in Pakistan) ratings of PACRA and JCR-VIS are used.
Corporate Exposures: Ratings assigned by PACRA and JCR-VIS are used for claims on Corporates (excluding equity exposures).
Use of ECAI Ratings
The Bank prefers solicited ratings over unsolicited ratings at all times, owing to the greater degree of accuracy (in general) associated with solicited ratings as compared to unsolicited ratings. Unsolicited ratings may only be used in cases where a solicited rating is not available.
Notes to the Consolidated Financial Statementsfor the year ended December 31, 2012

226
Mapping to SBP Rating Grades The selected final ratings (after application of the principles stated above) for all exposures need to be translated to the standard rating grades
given by the SBP. In this regard, the mapping tables to be used for converting ECAI ratings to SBP rating grades are given below:
Long – Term Rating Grades Mapping SBP Rating Fitch Moody’s S & P PACRA JCR-VIS ECA grade Scores
1 AAA Aaa AAA AAA AAA 0 AA+ Aa1 AA+ AA+ AA+ 1 AA Aa2 AA AA AA AA- Aa3 AA- AA- AA-
2 A+ A1 A+ A+ A+ 2 A A2 A A A A- A3 A- A- A-
3 BBB+ Baa1 BBB+ BBB+ BBB+ 3 BBB Baa2 BBB BBB BBB BBB- Baa3 BBB- BBB- BBB-
4 BB+ Ba1 BB+ BB+ BB+ 4 BB Ba2 BB BB BB BB- Ba3 BB- BB- BB-
5 B+ B1 B+ B+ B+ 5 B B2 B B B 6 B- B3 B- B- B-
6 CCC+ and Caa1 and CCC+ and CCC CCC 7 below below below CC CC C C D Short – Term Rating Grades Mapping SBP Rating Fitch Moody’s S & P PACRA JCR-VIS Grade
S1 F1 P-1 A-1+ A-1+ A-1+ A-1 A-1 A-1
S2 F2 P-2 A-2 A-2 A-2
S3 F3 P-3 A-3 A-3 A-3
S4 Others Others Others Others Others
Types of exposures and ECAI’s used December 31, 2012
Exposures Fitch Moody’s S & P PACRA JCR-VIS Corporate - - - Yes Yes Banks Yes Yes Yes Yes Yes Sovereigns - - - - - SME’s - - - - - Securitizations - - - - - Public Sector - - - Yes Yes enterprises
Notes to the Consolidated Financial Statementsfor the year ended December 31, 2012

Annual Report of Allied Bank Limited for the year 2012
227
December 31, 2012 December 31, 2011 Rupees in ‘000 Exposures Rating Amount Deduction Net Amount Deduction Net Category Outstanding CRM Amount Outstanding CRM Amount
Corporate 1 26,936,369 26,936,369 54,954,120 - 54,954,120
2 46,847,514 46,847,514 20,593,018 - 20,593,018
3 , 4 - - 609,742 - 609,742
5 , 6 3,023,898 3,023,898 3,460,473 - 3,460,473
Claims on banks with original maturity of
3 months or less - 29,480,864 25,197,253 4,283,611 31,576,266 30,563,891 1,012,375
Retail - 29,288,020 4,743,104 24,544,916 35,433,013 2,718,177 32,714,836
Public sector entities 1 9,223,044 - 9,223,044 6,596,571 - 6,596,571
Others - 380,502,342 - 380,502,342 269,806,220 - 269,806,220
Unrated - 174,280,055 64,640,525 109,639,530 173,364,585 27,840,637 145,523,948
Credit exposures subject to Standardized Approach
43.1.2.2 Credit Risk: Disclosures with respect to Credit Risk Mitigation for Standardized Approach
The Group has adopted the Simple Approach of Credit Risk Mitigation for the Grouping Book. Since, the trading book of the Group only comprises equity investments, and units in open ended mutual funds, therefore no Credit Risk Mitigation benefit is taken in the trading book. In instances where the Group’s exposure on an obligor is secured by collateral that conforms with the eligibility criteria under the Simple Approach of CRM, then the Group reduces its exposure under that particular transaction by taking into account the risk mitigating effect of the collateral for the calculation of capital requirement i.e. risk weight of the collateral instrument securing the exposure is substituted for the risk weight of the counter party.
The Group accepts cash, lien on deposits, government securities and eligible guarantees etc. under the simple approach of Credit Risk Mitigation. The Group has in place detailed guidelines with respect to valuation and management of various collateral types. In order to obtain the credit risk mitigation benefit, the Group uses realizable value of eligible collaterals to the extent of outstanding exposure.
Since no specific asset is available by way of security in the context of unfunded credit protection, the creditworthiness and reliability of the provider and the validity and enforceability of that party’s obligations is of paramount importance. Therefore, unfunded credit protection is only “eligible” if it is provided by an appropriate counterparty which may include National Government, Central Bank and other reputable financial institutions etc.
43.2 Equity Position Risk in the Banking Book
The Group makes investment for variety of purposes. Some of the investment positions of equity holding are made for revenue generation as part of strategic initiatives, while other equity holdings are held to earn capital gain and dividend to support the Bank’s business activities.
Classification of investments
Under SBP’s directives, equity investment may be classified as “Held For Trading (HFT)”, “Available for Sale (AFS)” or “Investment in Subsidiaries and Associates”. Some of the equity investments are listed and traded in public through stock exchanges, while other investments are unlisted.
Policies, valuation and accounting of equity investments
In accordance with the requirements of the SBP, quoted securities are carried at market value whereas investments in subsidiaries are accounted for in accordance with the relevant International Accounting Standard as applicable in Pakistan.
The unrealized surplus / (deficit) arising on revaluation of the Group’s held for trading investment portfolio is taken to the profit and loss
account. The surplus / (deficit) arising on revaluation of quoted securities classified as available for sale is kept in a separate account shown in the statement of financial position below equity. The surplus / (deficit) arising on these securities is taken to the profit and loss account when actually realised upon disposal.
Unquoted equity securities are valued at the lower of cost and break-up value. Subsequent increases or decreases in the carrying value are
credited / charged to profit and loss account. Break-up value of equity securities is calculated with reference to the net assets of the investee company as per the latest available audited financial statements. Investments in other unquoted securities are valued at cost less impairment losses, if any. Provision for diminution in the value of securities is made after considering impairment, if any, in their value.
Profit and loss on sale of investments is included in income currently.
Notes to the Consolidated Financial Statementsfor the year ended December 31, 2012

228
Composition of equity investments
Held for Available for Investment in Trading Sale Subsidiary
Rupees in ‘000
Equity Investments - Publicly Traded - 19,047,083 - Equity Investments - Others - 1,842,993 - Total Value - 20,890,076 -
The cumulative realized gain arose of Rs. 1,267.827 million (2011: 738.180 million) from sale of equity securities / certificates of mutual funds and units of open end mutual funds; however unrealized gain of 5,073.212 million (2011: Rs. 2,292.489 million) was recognized in the statement of financial position in respect of “AFS” securities.
43.2.1 Market Risk
The Group is exposed to Foreign Exchange Rate Risk, Interest Rate Risk and Equity Price Risk. Market Risk performs risk measurement, monitoring and control functions through use of various risk procedures and models. To give it a
formal structure, all the policies and guidelines are approved by the Board and relevant management committees. The Group appointed services of a foreign risk advisory firm for assistance in establishment of Market Risk Management Framework.
Market Risk Pertaining to the Trading Book
Trading Book
A trading book consists of positions in financial instruments held either with trading intent or in order to hedge other elements of the trading book. To be eligible for trading book, financial instruments must be held with the intent of trading and free of any restrictive covenants on their tradability. In addition, positions need to be frequently and accurately valued and the portfolio should be actively managed.
The Group’s trading book includes securities classified as ‘Held for Trading’. These positions are actively managed by the Group and are
exposed to all forms of market risks. Risk Pertaining to Banking Book Investment Portfolio All investments excluding trading book are considered as part of banking book. Banking book includes: i) Available for sale securities - Strategic & Non Strategic Portfolio ii) Held to maturity securities iii) Other strategic investments Treasury investments parked in the banking book include: i) Government securities ii) Capital market investments iii) Strategic investments iv) Investments in bonds, debentures, etc Due to the diversified nature of investments in banking book, it is subject to interest rate and equity price risk. Interest Rate Risk – Banking Book
Government securities (PIBs & T-Bills), Bonds, Debentures, etc. and other money market investments are subject to interest rate risk. To capture the risk associated with these securities extensive modeling is being done with respect to duration analysis. Stress testing and scenario models are also in place to capture the sensitivity of the portfolio to adverse movement in interest rates. For prudent risk management, all money market investments are marked to market to assess changes in the market value of investments due to interest rate movements.
Equity Position Risk – Banking Book
The Group’s portfolio of equity securities categorized under ‘Available for Sale’ and ‘Strategic Investments’ are parked in the banking book. These investments expose the Group to equity price risk.
Stress Testing
The Group also conducts Stress Testing of the Group’s investment portfolio to ascertain the impact of various scenarios on the capital adequacy and sustainability of the Group. The exercise assumes various stress conditions, with respect to Market Risk (Rise or Fall in Interest Rates, leading to interest rate risk), Equity Price Risk resulting from Stock Market movements, FX Rate Risk leading from adverse movements in exchange rates and Liquidity Risk (ability to meet short-term obligations if there is a run on deposits).
Notes to the Consolidated Financial Statementsfor the year ended December 31, 2012

Annual Report of Allied Bank Limited for the year 2012
229
Notes to the Consolidated Financial Statementsfor the year ended December 31, 2012
December 31, 2012
Assets Liabilities Off-balance Net currency sheet items exposure
Rupees in ‘000 Pakistani Rupee 614,339,190 537,503,520 (10,626,746) 66,208,924 United States Dollar 17,016,159 38,604,175 6,601,389 (14,986,627) Great Britain Pound 360,136 2,938,989 2,604,233 25,380 Japanese Yen 21,035 6,267 (22,887) (8,119) Euro 536,416 1,981,270 1,459,852 14,998 Other Currencies 28,770 3,931 (15,841) 8,998 17,962,516 43,534,632 10,626,746 (14,945,370) 632,301,706 581,038,152 - 51,263,554
December 31, 2011
Assets Liabilities Off-balance Net currency sheet items exposure
Rupees in ‘000 Pakistani Rupee 499,554,312 432,417,767 (24,037,360) 43,099,185 United States Dollar 15,514,498 35,071,835 19,882,654 325,317 Great Britain Pound 278,730 2,497,583 2,238,347 19,494 Japanese Yen 14,241 627 (11,689) 1,925 Euro 512,154 2,417,146 1,933,335 28,343 Other Currencies 14,677 4,296 (5,287) 5,094 16,334,300 39,991,487 24,037,360 380,173 515,888,612 472,409,254 - 43,479,358
43.2.2 Foreign Exchange Risk
Foreign Exchange Risk is the risk of loss arising from fluctuations of exchange rates. Our FX Risk is first controlled through substantially matched funding policy. On the mismatched exposures, the Bank utilizes appropriate derivative instruments such as Forwards and Swaps.
The majority of net foreign currency exposure is in US Dollars. The Bank is carefully monitoring the net foreign currency exposure
and the effect of exchange rate fluctuations by conducting sensitivity analysis and stress testing, as well as utilizing the currency forwards and swaps to hedge the related exposure.
43.2.3 Equity Position Risk
The Board, based on the recommendations of ALCO, approves exposure limits applicable to investments in Trading and Banking Book. Equity securities are perpetual assets and are classified under either Held for Trading Portfolio or Available for Sale Portfolio.
Concentration Risk
ALCO is responsible for making investment decisions in the capital market and setting limits that are a component of the risk management framework. Portfolio, Sector and Scrip wise limits are assigned by the ALCO to guard against concentration risk and these limits are reviewed and revised periodically. The capital market desk ensures compliance of concentration limits set by ALCO. Limit monitoring is done on a daily basis. Limit breaches if any are promptly reported to ALCO with proper reason and justification.
Price Risk
Trading and investing in equity securities give rise to price risk. ALCO and Treasury’s Capital Market Unit both ensure that through prudent trading strategy and use of equity futures, the equity price risk is mitigated, albeit to a certain extent.

230
43.2
.4
Mism
atch
of I
nter
est R
ate S
ensit
ive A
sset
s and
Lia
bilit
ies
Yie
ld /
inte
rest
rate
sens
itivi
ty p
ositi
on fo
r on-
balan
ce sh
eet i
nstru
men
ts is
base
d on
the e
arlie
r of c
ontra
ctua
l re-
prici
ng o
r mat
urity
dat
e and
for o
ff-ba
lance
shee
t ins
trum
ents
is ba
sed
on se
ttlem
ent d
ate.
D
ecem
ber 3
1, 20
12
Effec
tive
Ex
pose
d to
Yie
ld /
Inte
rest
risk
Not
expo
sed
Yie
ld/
Tota
l U
p to
O
ver 1
O
ver 3
O
ver 6
O
ver 1
O
ver 2
O
ver 3
O
ver 5
A
bove
to
Yie
ld/
Inte
rest
1
mon
th
to 3
to
6
mon
ths t
o to
2
to 3
to
5
to 1
0 10
year
s In
tere
st
ra
te
mon
ths
mon
ths
1 ye
ar
year
s ye
ars
year
s ye
ars
R
isk
Rupe
es in
‘000
On
-bala
nce s
heet
finan
cial in
strum
ents
Asset
s
Cash
and b
alanc
es wi
th tre
asury
bank
s 0.0
0%
43,35
1,703
5,
702,2
31
-
-
-
-
-
-
-
-
37,64
9,472
Balan
ces w
ith ot
her b
anks
1,
029,2
92
-
-
-
-
-
-
-
-
-
1,02
9,292
Lend
ings t
o fina
ncial
insti
tution
s 9.2
7%
10,72
0,935
9,
077,3
10
1,64
3,625
-
-
-
-
-
-
-
-
Inves
tmen
ts - n
et 11
.63%
267,6
82,67
9 33
,963,0
46
38,85
8,271
57
,269,8
51
88,38
6,337
5,
808,9
90
-
22,00
5,676
-
-
21
,390,5
08
Ad
vances
- ne
t 12
.61%
271,1
15,68
3 43
,148,2
20
184,5
77,54
6 27
,537,1
38
3,29
1,012
6,
036,2
89
870,1
82
1,70
0,802
1,
039,8
75
- 2,
914,6
19
Ot
her a
ssets
- net
11
,112,5
16
-
-
-
-
-
-
-
-
-
11,11
2,516
605,0
12,80
8 91
,890,8
07
225,0
79,44
2 84
,806,9
89
91,67
7,349
11
,845,2
79
870,1
82
23,70
6,478
1,
039,8
75
-
74,09
6,407
Liab
ilities
Bills
paya
ble
6,
203,0
51
-
-
-
-
-
-
-
-
-
6,20
3,051
Borro
wing
s 8.6
9%
38,91
6,192
22
,269,3
23
5,31
0,921
7,
805,7
78
252,3
18
504,6
42
504,6
42
1,00
9,284
1,
009,2
84
-
250,0
00
De
posit
s and
othe
r acco
unts
5.86%
51
4,702
,444
20,43
8,757
36
,287,8
55
250,0
23,46
5 9,
139,6
58
5,39
0,952
1,
651,7
85
819,7
12
685,1
04
44,55
3,794
14
5,711
,362
Su
b-ord
inated
loan
11
.39%
5,49
0,400
-
2,
996,4
00
2,49
4,000
-
-
-
-
-
-
-
Othe
r liab
ilities
12,71
8,870
-
-
-
-
-
-
-
-
-
12
,718,8
70
57
8,030
,957
42,70
8,080
44
,595,1
76
260,3
23,24
3 9,
391,9
76
5,89
5,594
2,
156,4
27
1,82
8,996
1,
694,3
88
44,55
3,794
16
4,883
,283
On
-bala
nce s
heet
gap
26
,981,8
51
49,18
2,727
18
0,484
,266
(175
,516,2
54)
82,28
5,373
5,
949,6
85
(1,28
6,245
) 21
,877,4
82
(654
,513)
(44,5
53,79
4) (9
0,786
,876)
Off
-bala
nce s
heet
finan
cial in
strum
ents
Co
mmitm
ents
in res
pect
of for
ward
excha
nge c
ontra
cts -
purch
ase
35
,605,2
57
17,80
8,898
12
,574,2
88
4,65
4,141
56
7,930
-
-
-
-
-
-
Comm
itmen
ts in
respe
ct of
forwa
rd
exc
hang
e con
tracts
- sal
e
(9,40
0,993
) (3
,758,7
13)
(2,47
7,231
) (1
,387,0
07)
(1,77
8,042
) -
-
-
-
-
-
Off-b
alanc
e she
et ga
p
26,20
4,264
14
,050,1
85
10,09
7,057
3,
267,1
34
(1,21
0,112
) -
-
-
-
-
-
Total
yield
/ inte
rest r
isk se
nsitiv
ity ga
p
53,18
6,115
63
,232,9
12
190,5
81,32
3 (1
72,24
9,120
) 81
,075,2
61
5,94
9,685
(1
,286,2
45)
21,87
7,482
(6
54,51
3) (4
4,553
,794)
Cu
mulat
ive yi
eld / i
nteres
t risk
sens
itivity
gap
53
,186,1
15
63,23
2,912
25
3,814
,235
81,56
5,115
16
2,640
,376
168,5
90,06
1 16
7,303
,816
189,1
81,29
8 18
8,526
,785
143,9
72,99
1
Notes to the Consolidated Financial Statementsfor the year ended December 31, 2012

Annual Report of Allied Bank Limited for the year 2012
231
43.2
.4.1
R
econ
cilia
tion
of A
sset
s and
Lia
bilit
ies e
xpos
ed to
Yie
ld/I
nter
est R
ate R
isk w
ith T
otal
Ass
ets a
nd L
iabi
litie
s
Dec
embe
r 31,
Dec
embe
r 31,
D
ecem
ber 3
1, D
ecem
ber 3
1,
Rec
oncil
iatio
n to
tota
l ass
ets
2012
20
11
Rec
oncil
iatio
n to
tota
l lia
bilit
ies
2012
20
11
Rup
ees i
n ‘00
0
R
upee
s in
‘000
B
alanc
e as p
er S
tate
men
t of F
inan
cial P
ositi
on
632,
301,
706
51
5,88
8,61
2
Balan
ce as
per
Sta
tem
ent o
f Fin
ancia
l Pos
ition
58
1,03
8,15
2 4
72,4
09,2
54
L
ess :
Non
fina
ncia
l ass
ets
Less
: Non
fina
ncia
l lia
bilit
ies
O
pera
ting
fixed
asse
ts
19,
882,
246
1
8,09
5,12
3
D
efer
red
tax
asse
t -
7
50,9
72
Def
erre
d ta
x lia
bilit
y 6
5,41
9
-
O
ther
asse
ts
7,4
06,6
52
4,6
56,9
92
Oth
er li
abili
ties
2,9
41,7
76
2,0
22,2
66
27,2
88,8
98
23,
503,
087
3,0
07,1
95
2,0
22,2
66
T
otal
finan
cial a
sset
s 60
5,01
2,80
8
492
,385
,525
T
otal
finan
cial l
iabi
litie
s 57
8,03
0,95
7 4
70,3
86,9
88
Notes to the Consolidated Financial Statementsfor the year ended December 31, 2012
M
ismat
ch o
f Int
eres
t Rat
e Sen
sitiv
e Ass
ets a
nd L
iabi
litie
s
Y
ield
/ in
tere
st ra
te se
nsiti
vity
pos
ition
for o
n-ba
lance
shee
t ins
trum
ents
is ba
sed
on th
e ear
lier o
f con
tract
ual r
e-pr
icing
or m
atur
ity d
ate a
nd fo
r off-
balan
ce sh
eet i
nstru
men
ts is
base
d on
settl
emen
t dat
e.
Dec
embe
r 31,
2011
Effec
tive
Ex
pose
d to
Yie
ld/ I
nter
est r
isk
Not
expo
sed
Yie
ld/
Tota
l U
p to
O
ver 1
O
ver 3
O
ver 6
O
ver 1
O
ver 2
O
ver 3
O
ver 5
A
bove
to
Yie
ld/
Inte
rest
1
mon
th
to 3
to
6
mon
ths t
o to
2
to 3
to
5
to 1
0 10
year
s In
tere
st
ra
te
mon
ths
mon
ths
1 ye
ar
year
s ye
ars
year
s ye
ars
R
isk
Rupe
es in
‘000
On
-bala
nce s
heet
finan
cial in
strum
ents
As
sets
Ca
sh an
d bala
nces
with
treasu
ry ba
nks
0.0%
36,47
9,765
5,3
36,77
1 -
-
-
-
-
-
-
-
31
,142,9
94
Ba
lances
with
othe
r ban
ks
1,67
9,121
-
-
-
-
-
-
-
-
-
1,
679,1
21
Le
nding
s to fi
nanc
ial in
stitut
ions
11.90
% 1,
361,7
54
1,361
,754
-
-
-
-
-
-
-
-
-
In
vestm
ents
- net
12.69
% 19
5,789
,638
5,27
5,730
22
,231,4
93
30,76
6,483
74
,946,0
26
6,58
1,314
2,
293,4
99
21,84
2,601
-
-
31
,852,4
92
Ad
vances
- ne
t 12
.73%
244,4
39,83
7 45
,290,3
09
149,8
04,16
6 31
,164,8
89
3,35
8,944
2,
258,4
79
955,2
91
2,35
5,664
2,
482,7
67
2,48
4,225
4,
285,1
03
Ot
her a
ssets
- net
12
,635,4
10
-
-
-
-
-
-
-
-
-
12,63
5,410
492,3
85,52
5 57
,264,5
64
172,0
35,65
9 61
,931,3
72
78,30
4,970
8,
839,7
93
3,24
8,790
24
,198,2
65
2,48
2,767
2,
484,2
25
81,59
5,120
Liab
ilities
Bills
payab
le -
4,
015,3
17
-
-
-
-
-
-
-
-
-
4,01
5,317
Borro
wing
s 9.9
0%
49,99
3,200
3
3,783
,850
5,02
4,781
7,
384,8
24
292,2
90
584,5
76
584,5
76
2,33
8,303
-
-
-
Depo
sits a
nd ot
her a
ccoun
ts 5.8
1%
399,5
60,79
0 60
,827,3
23
41,74
7,838
31
,357,2
26
132,9
23,62
6 4,
643,3
69
948,6
25
1,20
5,348
52
6,447
33
2,549
12
5,048
,439
Su
b-ord
inated
loan
14
.42%
5,49
2,600
-
2,
495,0
00
2,99
7,600
-
-
-
-
-
-
-
Othe
r liab
ilities
11,32
5,081
-
-
-
-
-
-
-
-
-
11
,325,0
81
47
0,386
,988
94,61
1,173
49
,267,6
19
41,73
9,650
13
3,215
,916
5,22
7,945
1,
533,2
01
3,54
3,651
52
6,447
33
2,549
14
0,388
,837
On
-bala
nce s
heet
gap
21
,998,5
37
(37,3
46,60
9) 12
2,768
,040
20,19
1,722
(5
4,910
,946)
3,61
1,848
1,
715,5
89
20,65
4,614
1,
956,3
20
2,15
1,676
(5
8,793
,717)
Off
-bala
nce s
heet
finan
cial in
strum
ents
Co
mmitm
ents
in res
pect
of for
ward
excha
nge c
ontra
cts -
purch
ase
49
,580,8
13
17,45
6,577
20
,422,7
54
11,68
6,910
14
,571
-
-
-
-
-
Co
mmitm
ents
in res
pect
of for
ward
excha
nge c
ontra
cts -
sale
(2
5,543
,453)
(9,69
6,506
) (1
1,705
,161)
(4,14
1,786
) -
-
-
-
-
-
-
Off-b
alanc
e she
et ga
p
24,03
7,360
7,
760,0
71
8,71
7,593
7,
545,1
24
14,57
1 -
-
-
-
-
-
Total
yield
/ inte
rest r
isk se
nsitiv
ity ga
p
46,03
5,897
(2
9,586
,538)
131,4
85,63
3 27
,736,8
46
(54,8
96,37
5) 3,
611,8
48
1,71
5,589
20
,654,6
14
1,95
6,320
2,
151,6
76
Cu
mulat
ive yi
eld / i
nteres
t risk
sens
itivity
gap
46
,035,8
97
(29,5
86,53
8) 10
1,899
,095
129,6
35,94
1 74
,739,5
66
78,35
1,414
80
,067,0
03
100,7
21,61
7 10
2,677
,937
104,8
29,61
3
Yi
eld ri
sk is
the ri
sk of
decli
ne in
earn
ings d
ue to
adver
se mo
vemen
t of t
he yi
eld cu
rve.
In
terest
rate
risk i
s the
risk
that t
he va
lue of
the fi
nanc
ial in
strum
ent w
ill flu
ctuate
due t
o cha
nges
in the
mark
et int
erest
rates.

232
Notes to the Consolidated Financial Statementsfor the year ended December 31, 201243
.3
Liqu
idity
Risk
Liqu
idity
risk
is th
e risk
that
the B
ank
is un
able
to fu
nd it
s cur
rent
obl
igat
ions
and
oper
atio
ns in
the m
ost c
ost e
fficie
nt m
anne
r. A
LCO
is th
e for
um to
ove
rsee
liqu
idity
man
agem
ent.
The o
vera
ll Ba
nk’s
prin
ciple
is th
at th
e ALC
O h
as th
e res
pons
ibili
ty fo
r ens
urin
g th
at B
ank’s
pol
icy
for l
iqui
dity
man
agem
ent i
s adh
ered
to o
n a c
ontin
ual b
asis.
Oth
er th
an cu
stom
er’s
depo
sits,
the B
ank’s
fund
ing
sour
ce is
the i
nter
-ban
k m
oney
mar
ket.
Cha
nge i
n th
e gov
ernm
ent m
onet
ary
polic
y an
d m
arke
t exp
ecta
tions
of i
nter
est r
ate a
re a
ll im
porta
nt fa
ctor
s tha
t can
adve
rsel
y aff
ect o
ur k
ey fu
ndin
g so
urce
. Effi
cient
and
ac
cura
te p
lanni
ng p
lays a
criti
cal r
ole i
n liq
uidi
ty m
anag
emen
t. O
ur M
IS p
rovi
des i
nfor
mat
ion
on ex
pect
ed ca
sh in
flows
/out
flow
s whi
ch al
low
the B
ank
to ta
ke ti
mel
y de
cisio
ns b
ased
on
the f
utur
e req
uire
men
ts.
G
ap an
alys
is, st
ress
testi
ng an
d sc
enar
io an
alys
is is
done
on
perio
dic b
asis
to ca
ptur
e any
adve
rse e
ffect
of m
arke
t mov
emen
ts on
liqu
idity
pos
ition
. Bas
ed o
n th
e res
ults
prod
uced
, ALC
O d
evise
the l
iqui
dity
man
agem
ent s
trate
gy to
mai
ntai
n su
fficie
nt li
quid
ity to
dea
l wi
th an
y re
lated
cata
strop
he.
43.3
.1
Mat
uriti
es o
f Ass
ets a
nd L
iabi
litie
s - B
ased
on
cont
ract
ual m
atur
ity o
f the
asse
ts an
d lia
bilit
ies o
f the
Ban
k
D
ecem
ber 3
1, 20
12
To
tal
Up
to 1
O
ver 1
O
ver 3
O
ver 6
O
ver 1
O
ver 2
O
ver 3
O
ver 5
A
bove
m
onth
to
3
to 6
m
onth
s to
to
2
to 3
to
5
to 1
0
10 ye
ars
m
onth
s m
onth
s 1
year
ye
ars
year
s ye
ars
year
s
(R
upees
in ‘0
00)
As
sets
C
ash
and
balan
ces w
ith tr
easu
ry b
anks
4
3,35
1,70
3
43,
351,
703
-
-
-
-
-
-
-
-
Ba
lance
s with
oth
er b
anks
1
,029
,292
1
,029
,292
-
-
-
-
-
-
-
-
Lend
ings
to fi
nanc
ial i
nstit
utio
ns
10,
720,
935
9
,077
,310
1
,643
,625
-
-
-
-
-
-
-
Inve
stmen
ts - n
et
267
,682
,679
3
1,07
0,92
9
35,
033,
215
5
5,84
1,40
9
104
,532
,036
3
,191
,077
6
96,2
76
26,
671,
428
1
0,64
6,30
9
-
A
dvan
ces -
net
27
1,11
5,68
3 69
,459
,061
2
6,16
5,51
8
34,
419,
689
3
4,40
3,12
5
20,
654,
314
1
8,90
2,64
8
29,
551,
511
3
3,40
8,85
9
4,1
50,9
58
O
pera
ting
fixed
asse
ts 1
9,88
2,24
6
212
,761
4
25,5
19
638
,278
1
,276
,556
1
,731
,155
7
47,0
86
963
,510
1
,077
,313
1
2,81
0,06
8
Def
erre
d ta
x as
sets
-
O
ther
asse
ts - n
et
18,
519,
168
2
,371
,789
4
,195
,346
7
,804
,634
1
,177
,148
1
,157
,968
1
,401
2
,802
-
1
,808
,080
63
2,30
1,70
6 15
6,57
2,84
5 6
7,46
3,22
3
98,
704,
010
1
41,3
88,8
65
26,
734,
514
2
0,34
7,41
1
57,
189,
251
4
5,13
2,48
1
18,
769,
106
Li
abili
ties
Bi
lls p
ayab
le 6
,203
,051
6
,203
,051
-
-
-
-
-
-
-
-
Borro
wing
s 3
8,91
6,19
2
22,
519,
324
5
,310
,921
7
,805
,778
2
52,3
18
504
,642
5
04,6
42
1,0
09,2
84
1,0
09,2
83
-
D
epos
its an
d ot
her a
ccou
nts
514,
702,
444
376,
895,
890
36,
287,
854
3
9,27
7,69
2
9,1
39,6
59
5,3
90,9
52
1,6
51,7
85
819
,713
6
85,1
04
44,
553,
795
D
efer
red
tax
liabi
litie
s 6
5,41
9
15,
518
3
2,42
4
48,
636
(2
31,3
90)
(114
,695
) (2
64,8
73)
(107
,848
) 5
55,1
04
132
,543
Sub-
ordi
nate
d lo
an
5,4
90,4
00
-
600
6
23,5
00
1,2
48,8
00
624
,700
1
,200
2
,991
,600
-
-
Oth
er li
abili
ties
15,
660,
646
4
,965
,398
6
,577
,529
3
40,8
72
655
,402
3
78,9
38
451
,811
7
17,8
00
1,5
72,8
96
-
581,
038,
152
410,
599,
181
48,2
09,3
28
48,
096,
478
1
1,06
4,78
9
6,7
84,5
37
2,3
44,5
65
5,4
30,5
49
3,8
22,3
87
44,
686,
338
N
et as
sets
/ (lia
bilit
ies)
51,2
63,5
54
(254
,026
,336
) 1
9,25
3,89
5
50,
607,
532
1
30,3
24,0
76
19,
949,
977
1
8,00
2,84
6
51,
758,
702
4
1,31
0,09
4
(25,
917,
232)
Sh
are c
apita
l 9
,463
,421
Res
erve
s 1
0,90
6,25
0
U
napp
ropr
iate
d pr
ofit
22,9
06,1
78
43
,275
,849
Su
rplu
s on
reva
luat
ion
of as
sets
-
net o
f tax
7
,987
,705
51
,263
,554

Annual Report of Allied Bank Limited for the year 2012
233
M
atur
ities
of A
sset
s and
Lia
bilit
ies -
Bas
ed o
n co
ntra
ctua
l mat
urity
of t
he as
sets
and
liabi
litie
s of t
he B
ank
D
ecem
ber 3
1, 20
11
To
tal
Up
to 1
O
ver 1
O
ver 3
O
ver 6
O
ver 1
O
ver 2
O
ver 3
O
ver 5
A
bove
m
onth
to
3
to 6
m
onth
s to
to
2
to 3
to
5
to 1
0
10 ye
ars
m
onth
s m
onth
s 1
year
ye
ars
year
s ye
ars
year
s
Ru
pees
in ‘00
0
As
sets
C
ash
and
balan
ces w
ith tr
easu
ry b
anks
3
6,47
9,76
5
36,
479,
765
-
-
-
-
-
-
-
-
Ba
lance
s with
oth
er b
anks
1
,679
,121
1
,679
,121
-
-
-
-
-
-
-
-
Le
ndin
gs to
fina
ncia
l ins
titut
ions
1
,361
,754
1
,361
,754
-
-
-
-
-
-
-
-
In
vestm
ents
1
95,7
89,6
38
2,8
83,9
54
17,
311,
551
3
0,11
6,72
7
105
,103
,387
3
,263
,498
3
,994
,922
2
5,26
1,06
2
7,8
54,5
37
-
A
dvan
ces
244
,439
,837
7
9,73
1,32
2
21,
130,
178
3
2,93
4,92
2
27,
925,
869
1
2,14
3,84
6
11,
695,
073
1
5,84
0,29
6
39,
304,
013
3
,734
,318
O
pera
ting
fixed
asse
ts 1
8,09
5,12
3
145
,423
2
90,8
37
436
,255
8
72,5
11
912
,717
4
75,8
40
447
,698
6
94,3
14
13,
819,
528
D
efer
red
tax
asse
ts
750
,972
(9
,292
) (5
4,58
9)
(42,
519)
1
31,1
18
758
,304
4
15,6
78
(5,5
80)
(442
,148
) -
O
ther
asse
ts
17,
292,
402
9
,193
,213
2
,591
,199
2
,123
,996
2
65,1
87
(546
,622
) 2
,374
4
5,31
8
2,0
55,4
05
1,5
62,3
32
515
,888
,612
131
,465
,260
4
1,26
9,17
6
65,
569,
381
1
34,2
98,0
72
16,
531,
743
1
6,58
3,88
7
41,
588,
794
4
9,46
6,12
1
19,
116,
178
Li
abili
ties
Bi
lls p
ayab
le 4
,015
,317
4
,015
,317
-
-
-
-
-
-
-
-
Bo
rrowi
ngs
49,
993,
200
3
3,78
3,85
1
5,0
24,7
81
7,3
84,8
23
292
,288
5
84,5
76
584
,576
2
,338
,305
-
-
D
epos
its an
d ot
her a
ccou
nts
399
,560
,790
3
03,3
85,7
31
37,
540,
947
3
0,36
0,88
9
20,
617,
771
4
,643
,369
9
48,6
25
1,2
05,3
48
526
,447
3
31,6
63
D
efer
red
tax
liabi
litie
s -
-
-
-
-
-
-
-
-
-
Su
b-or
dina
ted
loan
5
,492
,600
-
6
00
500
1
,100
1
,248
,200
1
,248
,200
3
,600
2
,990
,400
-
O
ther
liab
ilitie
s 1
3,34
7,34
7
3,6
96,4
95
5,6
46,6
45
358
,340
7
05,0
28
355
,025
4
19,1
71
674
,774
1
,491
,869
-
472
,409
,254
3
44,8
81,3
94
48,
212,
973
3
8,10
4,55
2
21,
616,
187
6
,831
,170
3
,200
,572
4
,222
,027
5
,008
,716
3
31,6
63
N
et as
sets
/ (lia
bilit
ies)
43,
479,
358
(2
13,4
16,1
34)
(6,9
43,7
97)
27,
464,
829
1
12,6
81,8
85
9,7
00,5
73
13,
383,
315
3
7,36
6,76
7
44,
457,
405
1
8,78
4,51
5
Sh
are c
apita
l 8
,603
,110
R
eser
ves
8,7
62,7
45
U
napp
ropr
iate
d pr
ofit
20,
395,
717
37,7
61,5
72
Su
rplu
s on
reva
luat
ion
of as
sets
-
net o
f tax
5
,717
,786
43,
479,
358
43.3
.1.1
W
hen
an as
set o
r lia
bilit
y do
es n
ot h
ave a
ny co
ntra
ctua
l mat
urity
dat
e, th
e per
iod
in w
hich
thes
e are
assu
med
to m
atur
e has
bee
n ta
ken
as th
e exp
ecte
d da
te o
f m
atur
ity.
Notes to the Consolidated Financial Statementsfor the year ended December 31, 2012

234
43.4
M
atur
ities
of A
sset
s and
Lia
bilit
ies -
Bas
ed o
n th
e wor
king
pre
pare
d by
the A
sset
and
Liab
ilitie
s Man
agem
ent C
omm
ittee
(ALC
O) o
f the
Ban
k
Ex
pect
ed m
atur
ities
of n
on-c
ontra
ctua
l ass
ets a
nd li
abili
ties h
as b
een
com
pute
d us
ing
volat
ility
appr
oach
. Und
er th
is ap
proa
ch m
axim
um vo
latili
ty o
f non
cont
ract
ual a
sset
s and
liab
ilitie
s is c
alcul
ated
ove
r a p
erio
d an
d cla
ssifi
ed in
to co
re an
d no
n-co
re
porti
on.
D
ecem
ber 3
1, 20
12
To
tal
Up
to 1
O
ver 1
O
ver 3
O
ver 6
O
ver 1
O
ver 2
O
ver 3
O
ver 5
A
bove
m
onth
to
3
to 6
m
onth
s to
to
2
to 3
to
5
to 1
0
10 ye
ars
m
onth
s m
onth
s 1
year
ye
ars
year
s ye
ars
year
s
Ru
pees
in ‘00
0
A
sset
s
Cas
h an
d ba
lance
s with
trea
sury
ban
ks
43,
351,
703
3
4,85
2,66
3
197
,835
2
3,33
5
-
2,7
59,2
90
2,7
59,2
90
2,7
59,2
90
-
-
Ba
lance
s with
oth
er b
anks
1
,029
,292
1
,029
,292
-
-
-
-
-
-
-
-
Lend
ings
to fi
nanc
ial i
nstit
utio
ns
10,
720,
935
9
,077
,310
1
,643
,625
-
-
-
-
-
-
-
Inve
stmen
ts - n
et
267,
682,
679
31,0
70,9
29
35,
033,
215
5
5,84
1,40
9
104
,532
,036
3
,191
,077
6
96,2
76
26,
671,
428
1
0,64
6,30
9
-
A
dvan
ces -
net
27
1,11
5,68
3
43,0
76,9
65
26,1
66,7
93
34,
420,
443
3
4,40
3,97
3
29,
447,
837
2
7,69
5,60
6
38,
344,
249
3
3,40
8,85
9
4,1
50,9
58
O
pera
ting
fixed
asse
ts 1
9,88
2,24
6
212
,761
4
25,5
19
638
,278
1
,276
,556
1
,731
,155
7
47,0
86
963
,510
1
,077
,313
1
2,81
0,06
8
Def
erre
d ta
x as
sets
-
-
-
-
-
-
-
-
-
-
O
ther
asse
ts - n
et
18,
519,
168
2
,371
,789
4
,195
,346
7
,804
,634
1
,177
,148
1
,157
,968
1
,401
2
,802
-
1
,808
,080
63
2,30
1,70
6 12
1,69
1,70
9 67
,662
,333
9
8,72
8,09
9
141
,389
,713
3
8,28
7,32
7
31,
899,
659
6
8,74
1,27
9
45,
132,
481
1
8,76
9,10
6
Liab
ilitie
s
Bills
pay
able
6,2
03,0
51
4,1
77,2
69
171
,028
3
15,1
18
-
513
,212
5
13,2
12
513
,212
-
-
Borro
wing
s 3
8,91
6,19
2
22,
519,
324
5
,310
,921
7
,805
,778
2
52,3
18
504
,642
5
04,6
42
1,0
09,2
84
1,0
09,2
83
-
D
epos
its an
d ot
her a
ccou
nts
514,
702,
444
65,7
17,2
60
81,
561,
603
8
3,59
4,97
2
53,
457,
209
2
7,54
9,71
9
23,
810,
586
3
0,36
4,79
3
59,
775,
274
8
8,87
1,02
8
Def
erre
d ta
x lia
bilit
ies
65,4
19
15,5
18
32,
424
4
8,63
6
(231
,390
) (1
14,6
95)
(264
,873
) (1
07,8
48)
555
,104
1
32,5
43
Su
b-or
dina
ted
loan
5
,490
,400
-
6
00
623
,500
1
,248
,800
6
24,7
00
1,2
00
2,9
91,6
00
-
-
O
ther
liab
ilitie
s 1
5,66
0,64
6
4,9
65,3
98
6,5
77,5
29
340
,872
6
55,4
02
378
,938
4
51,8
11
717
,800
1
,572
,896
-
58
1,03
8,15
2 97
,394
,769
93
,654
,105
9
2,72
8,87
6
55,
382,
339
2
9,45
6,51
6
25,
016,
578
3
5,48
8,84
1
62,
912,
557
8
9,00
3,57
1
Net
asse
ts 51
,263
,554
24
,296
,940
(2
5,99
1,77
2)
5,9
99,2
23
86,
007,
374
8
,830
,811
6
,883
,081
3
3,25
2,43
8
(17,
780,
076)
(7
0,23
4,46
5)
Shar
e cap
ital
9,4
63,4
21
R
eser
ves
10,
906,
250
Una
ppro
pria
ted
profi
t 22
,906
,178
43,2
75,8
49
Surp
lus o
n re
valu
atio
n of
asse
ts
- ne
t of t
ax
7,9
87,7
05
51,2
63,5
54
Notes to the Consolidated Financial Statementsfor the year ended December 31, 2012

Annual Report of Allied Bank Limited for the year 2012
235
43.4
.1
Mat
uriti
es o
f Ass
ets a
nd L
iabi
litie
s - B
ased
on
the w
orki
ng p
repa
red
by th
e Ass
et an
d Li
abili
ties M
anag
emen
t Com
mitt
ee (A
LCO
) of t
he B
ank
E
xpec
ted
mat
uriti
es o
f non
-con
tract
ual a
sset
s and
liab
ilitie
s has
bee
n co
mpu
ted
usin
g vo
latili
ty ap
proa
ch. U
nder
this
appr
oach
max
imum
volat
ility
of n
on co
ntra
ctua
l ass
ets a
nd li
abili
ties i
s calc
ulat
ed o
ver a
per
iod
and
class
ified
into
core
and
non-
core
porti
on.
D
ecem
ber 3
1, 20
11
To
tal
Up
to 1
O
ver 1
O
ver 3
O
ver 6
O
ver 1
O
ver 2
O
ver 3
O
ver 5
A
bove
m
onth
to
3
to 6
m
onth
s to
to
2
to 3
to
5
to 1
0
10 ye
ars
m
onth
s m
onth
s 1
year
ye
ars
year
s ye
ars
year
s
Ru
pees
in ‘00
0
Ass
ets
C
ash
and
balan
ces w
ith tr
easu
ry b
anks
3
6,47
9,76
5
26,
081,
468
723
,187
21
,840
-
3
,217
,756
3,
217,
757
3,21
7,75
7
-
-
Ba
lance
s with
oth
er b
anks
1
,679
,121
1
,478
,416
31
,066
6,
277
-
54,4
54
54,4
54
54,4
54
-
-
Le
ndin
gs to
fina
ncia
l ins
titut
ions
1
,361
,754
1
,361
,754
-
-
-
-
-
-
-
-
In
vestm
ents
- net
1
95,7
89,6
38
2,8
83,9
55
17,3
11,5
51
30,1
16,7
26
104,
603,
387
3,26
3,49
8 3,
994,
922
25,2
61,0
62
8,35
4,53
7
-
A
dvan
ces -
net
2
44,4
39,8
37
52,
528,
206
19,9
63,6
27
22,6
18,8
69
8,27
2,27
3 31
,602
,421
31
,153
,648
35
,286
,734
39
,279
,740
3
,734
,319
O
pera
ting
fixed
asse
ts 1
8,09
5,12
3
145
,418
2
90,8
38
436
,256
8
72,5
13
912
,717
4
75,8
39
447
,699
6
94,3
14
13,
819,
529
D
efer
red
tax
asse
ts
750
,972
(9
,291
) (5
4,58
8)
(42,
519)
13
1,11
8 75
8,30
3 4
15,6
77
(5,5
79)
(442
,149
) -
O
ther
asse
ts - n
et
17,
292,
402
9
,193
,216
2,
591,
199
2,1
23,9
96
265
,187
(5
46,6
22)
2,37
4 45
,317
2,
055,
405
1,5
62,3
30
515
,888
,612
9
3,66
3,14
2
40,
856,
880
5
5,28
1,44
5
114
,144
,478
3
9,26
2,52
7
39,
314,
671
6
4,30
7,44
4
49,
941,
847
1
9,11
6,17
8
Li
abili
ties
Bi
lls p
ayab
le 4
,015
,317
2
,349
,529
1
59,5
00
-
-
502,
096
5
02,0
96
502
,096
-
-
Bo
rrowi
ngs
49,
993,
200
3
3,78
3,85
1
5,0
24,7
81
7,3
84,8
23
292
,288
58
4,57
6
584
,576
2
,338
,305
-
-
D
epos
its an
d ot
her a
ccou
nts
399
,560
,790
5
0,82
1,54
5
74,
477,
614
6
6,29
8,66
1
56,
555,
543
2
2,61
2,25
5
18,
917,
511
2
5,16
3,86
3
48,
443,
477
3
6,27
0,32
1
D
efer
red
tax
liabi
litie
s -
-
-
-
-
-
-
-
-
-
Su
b-or
dina
ted
loan
5
,492
,600
-
6
00
500
1
,100
1,
248,
200
1
,248
,200
3
,600
2
,990
,400
-
O
ther
liab
ilitie
s 1
3,34
7,34
7
3,6
96,4
92
5,6
46,6
45
358
,340
7
05,0
29
355,
025
4
19,1
71
674
,775
1
,491
,870
-
472,
409,
254
9
0,65
1,41
7
85,
309,
140
7
4,04
2,32
4
57,
553,
960
2
5,30
2,15
2
21,
671,
554
2
8,68
2,63
9
52,
925,
747
3
6,27
0,32
1
N
et as
sets
43,
479,
358
3
,011
,725
(4
4,45
2,26
0)
(18,
760,
879)
5
6,59
0,51
8
13,
960,
375
1
7,64
3,11
7
35,
624,
805
(2
,983
,900
) (1
7,15
4,14
3)
Sh
are c
apita
l 8
,603
,110
R
eser
ves
8,7
62,7
45
U
napp
ropr
iate
d pr
ofit
20,
395,
717
37,7
61,5
72
Su
rplu
s on
reva
luat
ion
of as
sets
-
net o
f tax
5
,717
,786
43,
479,
358
Notes to the Consolidated Financial Statementsfor the year ended December 31, 2012

236
43.5 Operational Risk
The Bank, like all financial institutions, is exposed to many types of operational risks, including the potential losses arising from internal activities or external events caused by breakdowns in information, communication, physical safeguards, business continuity, supervision, transaction processing, settlement systems and procedures and the execution of legal, fiduciary and agency responsibilities.
The Bank has in place a BOD approved Operational Risk Framework. Various policies and procedures with respect to this framework are currently being implemented across the Bank.
The Bank maintains a system of internal controls designed to keep operational risk at appropriate levels, in view of the bank’s
financial strength and the characteristics of the activities and market in which it operates. These internal controls are periodically updated to conform to industry best practice.
The Bank has also developed a Business Continuity Plan applicable to all its functional areas, with assistance of a
consultant. The Bank is currently in the process of implementing internationally accepted Internal Control-Integrated Framework published
by the Committee of Sponsoring Organizations of the Tread way Commission (COSO), with a view to consolidate and enhance the existing internal control processes.
During 2012, the Bank Achieved permission from SBP to initiate Parallel Run for Alternate Standardized Approach (ASA) for Basel II – Operational Risk Capital Charge Reporting, which signifies readiness of the Bank to move to advance approach.
44. NON ADJUSTING EVENT AFTER THE REPORTING DATE
The Board of Directors of the Bank in its meeting held on February 14, 2013 has proposed a cash dividend in respect of 2012 of Rs. 2 per share (2011: cash dividend Rs. 2.5 per share). In addition, the directors have also announced a bonus issue of 10 (2010: 10%). These appropriations will be approved in the forthcoming Annual General Meeting. The consolidated financial statements of the Bank for the year ended December 31, 2012 do not include the effect of these appropriations which will be accounted for in the consolidated financial statements for the year ending December 31, 2013.
45. GENERAL
45.1 These accounts have been prepared in accordance with the revised forms of annual financial statements of the banks issued by the State Bank of Pakistan through its BSD Circular No. 04 dated February 17, 2006.
45.2 Corresponding figures have been re-arranged and re-classified to reflect more appropriate presentation of events and transactions
for the purpose of comparison. 46. DATE OF AUTHORIZATION FOR ISSUE
These financial statements were authorized for issue on February 14, 2013 by the Board of Directors of the Bank.
Chief Financial Officer President and Chief Executive Director
Director Chairman
Notes to the Consolidated Financial Statementsfor the year ended December 31, 2012

Annual Report of Allied Bank Limited for the year 2012
237
Information for annual financial statement as on December 31, 2012. 1 Issued, Subscribed and Paid-up Capital:
ORDINARY SHARES As on December 31, 2012 As on December 31, 2011
No. of Shares Amount (Rs.) No. of Shares Amount (Rs.)
Fully paid in cash 406,780,094 4,067,800,940 406,780,094 4,067,800,940 Increase in Share Capital - - - - Issued as bonus shares 522,013,365 5,220,133,650 435,982,273 4,359,822,730 Issued for consideration other than cash 17,548,550 175,485,500 17,548,550 175,485,500 TOTAL : 946,342,009 9,463,420,090 860,310,917 8,603,109,170 2 Major shareholding Holding more than 5% of the total paid-up capital. Name of Shareholder No. of shares held Percentage Held
Mohammad Naeem Mukhtar 185,164,586 19.57 Muhammad Waseem Mukhtar 185,150,072 19.56 Sheikh Mukhtar Ahmad 163,736,714 17.30 Ibrahim Fibres Limited. 226,365,220 23.92 State Bank of Pakistan 95,264,414 10.07 TOTAL: 855,681,006 90.42
Pattern of ShareholdingAllied Bank Limited
6,491 1 100 250,189 9,127 101 500 2,254,059 1,606 501 1,000 1,217,313 1,795 1,001 5,000 3,954,670 358 5,001 10,000 2,577,556 351 10,001 100,000 8,873,890 30 100,001 1,000,000 9,639,902 3 1,000,001 2,000,000 4,776,241 1 6,000,001 7,000,000 6,759,474 2 8,000,001 9,000,000 16,150,371 1 11,000,001 12,000,000 11,958,080 1 13,000,001 14,000,000 13,227,384 1 20,000,001 21,000,000 20,979,954 1 83,000,001 84,000,000 83,306,334 1 163,000,001 164,000,000 163,736,714 2 185,000,001 186,000,000 370,314,658 1 226,000,001 227,000,000 226,365,220 19,772 946,342,009
No. of Shareholdings Total Shares Shareholders From To Held

238
Pattern of ShareholdingAllied Bank Limited
Categories of Shareholders No.of Shares Held Percentage
Associated Companies, undertaking and related parties. Ibrahim Fibres Limited. 1 226,365,220 23.92 Trustees of ABL Employees Superannuation Funds 1 20,979,954 2.22 Sub Total: 2 247,345,174 26.14 Executives 32 127,775 0.01 Sub Total: 32 127,775 0.01 Directors, Chief Executive Officer, their Spouses and Minor Children Mohammad Neem Mukhtar 1 185,164,586 19.57 Muhammad Waseem Mukhtar 1 185,150,072 19.56 Sheikh Mukhtar Ahmad 1 163,736,714 17.30 Abdul Aziz Khan 1 22,000 0.00 Jalees Ahmed 1 11,489 0.00 Mubashir A.Akhtar 1 4,455 0.00 Pervaiz Iqbal Butt 1 4,392 0.00 Sub Total: 7 534,093,708 56.44 Banks,DFIs, Financial Institutions, NBFIs State Bank of Pakistan 2 95,264,414 10.07 Standard Chartered Bank (Pak) Limited 1 19,926 0.00 Escorts Investment Bank Limited 2 258,477 0.03 Habib Metropolitan Bank Limited 2 429,722 0.05 Pak-Oman Investment Company Limited 1 386,499 0.04 The Bank Of Punjab Trustee Division 1 526,500 0.06 Trust Leasing Corporation Limited 1 166 0.00 Askari Bank Limited 1 675,772 0.07 National Bank Of Pakistan 5 8,249,964 0.87 MCB Bank Limited 1 6,759,474 0.71 M/S. Al-Faysal Invesment Bank 1 46 0.00 Bank Al Falah Limited 1 455,000 0.05 Sub Total: 19 113,025,960 11.94 NIT and ICP National Bank of Pakistan 1 1,957,595 0.21 Industrial Development Bank of Pakistan 4 13,148 0.00 Sub Total: 5 1,970,743 0.21 Insurance Companies EFU General Insurance Limited 1 265,000 0.03 EFU Life Asurance Limited 1 830,000 0.09 Adamjee Insurance Company Limited 1 1,731,346 0.18 State Life Insurance Corp. Of Pakistan 1 285,908 0.03 Atlas Insurance Limited 1 86,272 0.01 Asia Care Health & Life Insurance Co. Limited 1 52,308 0.01 Jubilee Life Insurance Co.Limited 1 339,186 0.04 Habib Insurance Company Limited 1 100,000 0.01 Century Insurance Company Limited 1 70,000 0.01 The Crescent Star Insurance Co. Limited 1 887 0.00 M/S. Orient Insurance Co. Limited 1 335 0.00 Gulf Insurance Company Limited 1 599 0.00 Sub Total: 12 3,761,841 0.40

Annual Report of Allied Bank Limited for the year 2012
239
Modarabas And Mutual Funds First Tawakal Modaraba 1 288 0.00 First Fadlity Leasing Modaraba 1 509 0.00 NAFA Trustee Assets Allocation Fund 1 105,393 0.01 Trustee Pak Strategic Allocation Fund 1 696 0.00 NAFA Trustee Stock Fund 1 790,521 0.08 AKD Trustee Index Tracker Fund 1 22,949 0.00 Trustee Askari Asset Allocation Fund 1 152,500 0.02 Trustee Askari Equity Fund 1 78,800 0.01 Trustee Lakson Equity Fund 1 72,000 0.01 Equity Sub Fund 1 10,078 0.00 NIT Trustee Equity Market Opportun 1 21,450 0.00 First Capital Mutual Fund Limited 1 29,500 0.00 HBL Trustee First Stock Fund 1 36,086 0.00 HBL Trustee Equity Fund PF 1 28,330 0.00 M/S. Modaraba Al Mali 1 97 0.00 Trustee IGI Stock Fund 1 73,000 0.01 Sub Total: 16 1,422,197 0.15 Public Sector Companies and Corporations (other than those covered in Insurance Companies and Banks) Nil Nil Nil Shareholders holding 10% (and above) (Excluding Directors and associated companies) Nil Nil Nil Sub Total: Nil Nil Nil Foreign Investors. The Bank Of New York Mellon 1 1 0.00 Polunin Discovery Funds- Frontier Markets 1 734,600 0.08 Tundra Pakistan Fond 1 1,087,300 0.11 Public Employee Retirement Assc. Of New Mexico 1 40,232 0.00 Habib Bank AG Zurich, Switzerland 1 13,310 0.00 BNP Paribas Arbitrage 1 157 0.00 Mohammad Tahir Butt 1 3,161 0.00 Ashiq Ali Kanji 1 16,490 0.00 Syed Asghar Ali Shah 1 5,000 Sub Total: 9 1,900,251 0.20 General Public - Individuals 19,555 25,505,577 2.70 - Others 113 3,961,370 0.42a) Federal Government of Pakistan 1 13,227,384 1.40b) Security & Exchange Commission of Pakistan 1 29 0.00 Sub Total: 115 17,188,783 1.82 Total : 19,772 946,342,009 All the Trade in the shares carried out by directors, CEO, CFO, Company Secretary, their spouses and minor children is reported as under:
Name Sale Purchased
Mohammad Naeem Mukhtar - 21,700,000 Muhammad Waseem Mukhtar - 21,700,000 Sheikh Mukhtar Ahmed - 21,600,000
Apart from these, there have been no trades in the shares of the Bank, carried out by its other directors, CEO, CFO, Company Secretary, their spouses and minor children.
Categories of Shareholders No.of Shares Held Percentage

240
Glossary of Financial & Banking TermsAllied Bank Limited
Accrual BasisRecognizing the effects of transactions and other events when they occur without waiting for receipt or payment of cash or its equivalent.
AcceptancesPromise to pay created when the drawee of a time draft stamps or writes the words “accepted” above his signature and a designated payment date.
Bonus Issue (Scrip Issue)The issue of new shares to existing shareholders in proportion to their shareholdings. It is a process for converting a company’s reserves (in whole or part) into issued capital and hence does not involve an infusion of cash.
Cash EquivalentsShort–term highly liquid investments that are readily convertible to known amounts of cash.
Capital Adequacy RatioThe relationship between capital and risk weighted assets as defined in the framework developed by the State Bankof Pakistan and Basel Committee.
Call Money RateInterbank clean (without collateral) lending/borrowing rates are called Call Money Rates
Coupon RateCoupon rate is interest rate payable on bond’s par value at specific regular periods. In PIBs they are paidon biannual basis.
Call DepositsThese include short notice and special notice deposits
Current Deposits:Non-remunerative Chequing account deposits wherein withdrawals and deposit of funds can be made frequently by the accountholders. ContingenciesA condition or situation existing at date of Statement of Financial Position where the outcome will be confirmed only by occurrence of one or more future events.
CAGRAn abbreviation for Compound Annual Growth Rate.
Corporate GovernanceIt is “the system by which companies are directed and controlled” by the Securities and Exchange Commission of Pakistan. It involves regulatory and market mechanisms, which govern the roles and relationships between a company’s management, its board, its shareholders and other stakeholders.
Defined ContributionA postemployment benefit plan under which entity and employee pays fixed contribution into a separate entity (a fund) and will have no legal or constructive obligation to pay further contribution if the fund does not hold sufficient assets to pay all the employee benefits relating to employee service in the current and prior periods.
DerivativesA financial instrument or a contract where;• Itsvalueisdependentuponorderived
from one or more underlying assets.• Requiresnoorverylittleinitialnet
investment• Itissettledatafuturedate.
Defined BenefitsIn a defined benefit plan, an employer typically guarantees a worker a specific lifetime annual retirement benefit, based on years of service, final rate of pay, age and other factors. The risks of paying for the plan rest entirely with the plan.
Deferred TaxationSum set aside for tax in financial statements that will become payable / receivable in a financial year other than current financial year due to differences in accounting policies and applicable taxation legislations.
Discount rateDiscount is the rate at which SBP provides three-day repo facility to banks, acting as the lender of lastresort.
Earnings Per ShareProfit after taxation divided by the weighted average number of ordinary shares in issue
Effective Tax RateProvision for taxation excluding deferred tax divided by the profit before taxation.
Finance LeaseFinance lease is the one in which risk and rewards incidental to the ownership of the leased asset is transferred to lessee but not the actual ownership.
Fixed Deposits:Deposits having fixed maturity dates and a rate of return.
Forward Exchange ContractForward contracts are agreements between two parties to exchange two designated currencies at a specific time in the future.
Guarantees:A promise to answer for the payment of some debt, or the performance of some duty, in case of the failure of another person, who is, in the first instance, liable to such payment or performance.
Historical Cost ConventionRecording transactions at the actual value received or paid.
ImpairmentImpairment of a fixed asset is an abrupt decrease of its fair value and measured in accordance with application regulations.
Interest SpreadRepresents the difference between the average interest rate earned and the average interest rate paid on funds.
Interest in SuspenseInterest suspended on non–performing loans and advances.
KIBOR – (Karachi Interbank Offered Rate)KIBOR is the interbank lending rate between banks in Pakistan and is used as a benchmark for lending.
Liquid AssetsAn asset that can be converted into cash quickly and with minimal impact to the price received
Market CapitalizationNumber of ordinary shares in issue multiplied by the market value of share as at the any cut-off date.year end.
MaterialityThe relative significance of a transaction or an event the omission or misstatement of which could influence the economic decisions of users of financial statements

Annual Report of Allied Bank Limited for the year 2012
241
Non-Performing LoanA non-performing loan is a loan that is in default or close to being in default. Loans become nonperforming in accordance with provision of prudential regulations issued by SBP.
Nostro AccountAn account held with a bank outside Pakistan.
Net Interest IncomeThe difference between what a bank earns on interest bearing assets such as loans and securities and what it pays on interest bearing liabilitiessuch as deposits, refinance funds and inter–bank borrowings.
Off Balance Sheet TransactionsTransactions that are not recognized as assets or liabilities in the statement of financial position but which give rise to contingencies and commitments.
Pakistan Investment Bonds (Pibs)They are the long term coupon yielding instruments of the Government of Pakistan with tenors available in 3, 5, 10, 15and 20 years.
PrudenceInclusion of degree of caution in the exercise of judgment needed in making the estimates required under conditions of uncertainty, so that assets or income are not overstated and liabilities or expenses are not understated.
Price Earnings Ratio (P/E Ratio)Market price of a share divided by earnings per share.
Risk Weighted AssetsOn Balance Sheet assets and the credit equivalent of off Balance Sheet assets multiplied by the relevant risk weighting factors..
Repurchase AgreementContract to sell and subsequently repurchase securities at a specified date and price.
Reverse Repurchase AgreementTransaction involving the purchase of securities by a bank or dealer and resale back to the seller at a future date andspecified price.
Return on Average EquityNet profit for the year, less preference share dividends if any, expressed as a percentage of average ordinary shareholders’ equity.
Return on Average AssetsProfit after tax divided by the average assets.
Related PartiesParties where one party has the ability to control the other party or exercise significant influence over the otherparty in making financial and operating decisions.
Revenue ReserveReserves set aside for future distribution and investment.
Subsidiary CompanyA company is a subsidiary of another company if the parent company holds more than 50% of the nominal value of its equity capital or holds some share in it and controls the composition of its Board of Directors.
Shareholders’ FundsTotal of Issued and fully paid share capital and revenue reserves.
Statutory Reserve FundsA capital reserve created as per the provisions of the Banking Companies Ordinance, 1962.

242
AGM
Notes
On March 27,
2013 at 11:00 am
Hotel Avari, Lahore.

Form of Proxy67th Annual General Meeting
I / We
of
being a shareholder of the Allied Bank Limited do hereby appoint
of also a shareholder of ABL, (Folio No. )
to be my/our proxy and to attend, act and vote for me/us on my/our behalf at the 67th Annual General Meeting of the Bank to be held on Wednesday, the
March 27, 2013 and at any adjournment thereof in the same manner as I/we myself/ourselves would vote if personally present at such meeting.
Signed this day of 2013.
AFFIX Revenue Stamp of Rs. 5/-
Witness
1. Signature
Name
Address
CNIC #
Signature The signature should agree with the specimen registered with the Company
Witness
2. Signature Folio No.
Name CDC A/c No.
Address Sub A/c. No.
CNIC # No. of Shares held
Distinctive Numbers:
From to
IMPORTANT
1. A member entitled to attend and vote at a meeting is entitled to appoint another member as a proxy to attend, speak and vote for him / her.
2. Further copies of the instrument of proxy, if required may be obtained from the Registered Office of the Bank during normal office hours.
3. An instrument of proxy and a Power of Attorney or other authority (if any) under which it is signed, or notarized copy of such Power of Attorney must be valid and deposited at the Registered Office of the Bank not less than 48 hours before the time of the Meeting.
4. In case of proxy for an individual beneficial owner of CDC, attested copies of beneficial owner’s valid CNIC or passport, Account and Participant’s I.D. numbers must be deposited along with the Form of Proxy. In case of Proxy for corporate members, he / she should bring the usual documents required for such purpose.
5. Members are requested to immediately notify changes, if any, in their registered address to Bank’s Share Registrar M/S Technology Trade (Pvt) Limited, Dagia House, 241-C, Block-2, PECHS, Karachi before book closure so that entitlement, if any, be dispatched at the correct address.

AFFIXCORRECTPOSTAGE
Allied Bank LimitedHead Office / Registered Office3 Tipu Block, Main Boulevard New Garden Town Lahore - Pakistan.Postal Code: 54000Phone: +92 42 35880043Website: www.abl.com


www.abl.com
Allied Bank Limited3 Tipu Block, Main Boulevard,New Garden Town, Lahore - PakistanTel 92 42 3588 0043
Concept, Design & Printing by www.vantageprinters.com