Impact of Prunus serotina invasion on understory functional diversity in a European temperate forest
17
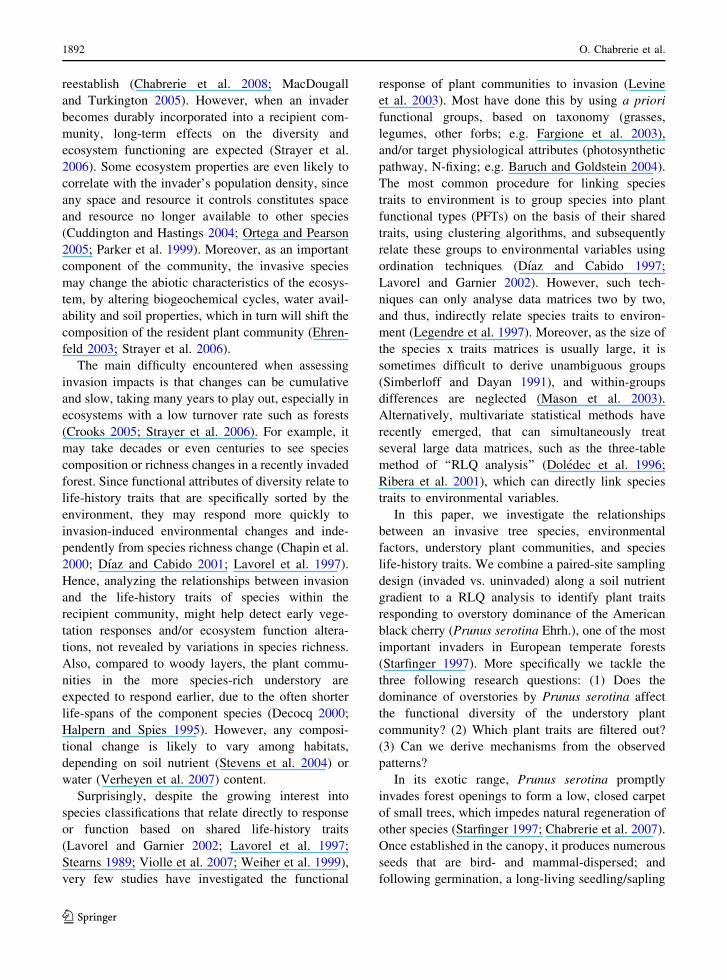
ORIGINAL PAPER Impact of Prunus serotina invasion on understory functional diversity in a European temperate forest Olivier Chabrerie • Je ´ro ˆme Loinard • Sidonie Perrin • Robert Saguez • Guillaume Decocq Received: 21 October 2008 / Accepted: 2 October 2009 / Published online: 21 October 2009 Ó Springer Science+Business Media B.V. 2009 Abstract We investigated the relationships between the overstory dominance of Prunus serotina, and the functional diversity of the understory plant commu- nities, in a managed European forest. Vegetation, habitat characteristics and disturbance history were surveyed in 32 invaded stands vs. 32 paired uninvaded stands, after a random stratification. Community specialization and functional diversity indices were compared and a RLQ analysis was run to link species traits to environmental variables. The herb layer of invaded stands exhibited significantly more specialist species and a lower trait diversity compared to uninvaded stands, with respect of species richness and vegetation cover. Light arrival to the forest floor and soil properties explained most of the variation in the RLQ analysis, but 20% of the variation strongly correlated with P. serotina dominance and associated disturbances. Traits characterizing shade-tolerant, short-living ruderals and shade-avoiders (vernal geo- phytes) were significantly associated to invaded stands, while those associated to light-demanding graminoids characterized uninvaded stands. The establishment of functionally close species (seedlings and saplings of native woody species) tended to be lower in invaded stands. We concluded that the invader was becoming the new ecosystem engineer, first by inducing trait convergence and community specialization, thus promoting traits that enable spe- cies to capture resources in the new environment it was creating, and second by reducing the grain of local heterogeneities. Keywords Exotic plant invasions Life-history traits Functional diversity Disturbance Forest management RLQ analysis Introduction Although biological invasions are widely accepted as one of the leading causes of biodiversity loss (Chapin et al. 2000; Cronk and Fuller 1995; Sax and Gaines 2003), evidence is accumulating suggesting that often, alien invaders are primarily ‘passengers’ to disturbance, together with diversity and environmen- tal changes, and can naturalize with little impact on the recipient ecosystem (Gurevitch and Padilla 2004; MacDougall and Turkington 2005; Seabloom et al. 2003). Non-natives would establish and subsequently spread into the recipient community, not because they are better competitors than natives, but simply because they are less dispersal-limited and thus, able to pre-empt space and resource before natives can O. Chabrerie J. Loinard S. Perrin R. Saguez G. Decocq (&) Dynamiques des Syste `mes Anthropise ´s (JE 2532), Universite ´ de Picardie Jules Verne, 1 rue des Louvels, 80037 Amiens Cedex 1, France e-mail: [email protected] 123 Biol Invasions (2010) 12:1891–1907 DOI 10.1007/s10530-009-9599-9
-
Upload
independent -
Category
Documents
-
view
0 -
download
0
Transcript of Impact of Prunus serotina invasion on understory functional diversity in a European temperate forest
ORIGINAL PAPER
Impact of Prunus serotina invasion on understory functionaldiversity in a European temperate forest
Olivier Chabrerie • Jerome Loinard •
Sidonie Perrin • Robert Saguez •
Guillaume Decocq
Received: 21 October 2008 / Accepted: 2 October 2009 / Published online: 21 October 2009
� Springer Science+Business Media B.V. 2009
Abstract We investigated the relationships between
the overstory dominance of Prunus serotina, and the
functional diversity of the understory plant commu-
nities, in a managed European forest. Vegetation,
habitat characteristics and disturbance history were
surveyed in 32 invaded stands vs. 32 paired uninvaded
stands, after a random stratification. Community
specialization and functional diversity indices were
compared and a RLQ analysis was run to link species
traits to environmental variables. The herb layer of
invaded stands exhibited significantly more specialist
species and a lower trait diversity compared to
uninvaded stands, with respect of species richness
and vegetation cover. Light arrival to the forest floor
and soil properties explained most of the variation in
the RLQ analysis, but 20% of the variation strongly
correlated with P. serotina dominance and associated
disturbances. Traits characterizing shade-tolerant,
short-living ruderals and shade-avoiders (vernal geo-
phytes) were significantly associated to invaded
stands, while those associated to light-demanding
graminoids characterized uninvaded stands. The
establishment of functionally close species (seedlings
and saplings of native woody species) tended to be
lower in invaded stands. We concluded that the
invader was becoming the new ecosystem engineer,
first by inducing trait convergence and community
specialization, thus promoting traits that enable spe-
cies to capture resources in the new environment it
was creating, and second by reducing the grain of
local heterogeneities.
Keywords Exotic plant invasions � Life-history
traits � Functional diversity � Disturbance �Forest management � RLQ analysis
Introduction
Although biological invasions are widely accepted as
one of the leading causes of biodiversity loss (Chapin
et al. 2000; Cronk and Fuller 1995; Sax and Gaines
2003), evidence is accumulating suggesting that
often, alien invaders are primarily ‘passengers’ to
disturbance, together with diversity and environmen-
tal changes, and can naturalize with little impact on
the recipient ecosystem (Gurevitch and Padilla 2004;
MacDougall and Turkington 2005; Seabloom et al.
2003). Non-natives would establish and subsequently
spread into the recipient community, not because
they are better competitors than natives, but simply
because they are less dispersal-limited and thus, able
to pre-empt space and resource before natives can
O. Chabrerie � J. Loinard � S. Perrin � R. Saguez �G. Decocq (&)
Dynamiques des Systemes Anthropises (JE 2532),
Universite de Picardie Jules Verne, 1 rue des Louvels,
80037 Amiens Cedex 1, France
e-mail: [email protected]
123
Biol Invasions (2010) 12:1891–1907
DOI 10.1007/s10530-009-9599-9
reestablish (Chabrerie et al. 2008; MacDougall
and Turkington 2005). However, when an invader
becomes durably incorporated into a recipient com-
munity, long-term effects on the diversity and
ecosystem functioning are expected (Strayer et al.
2006). Some ecosystem properties are even likely to
correlate with the invader’s population density, since
any space and resource it controls constitutes space
and resource no longer available to other species
(Cuddington and Hastings 2004; Ortega and Pearson
2005; Parker et al. 1999). Moreover, as an important
component of the community, the invasive species
may change the abiotic characteristics of the ecosys-
tem, by altering biogeochemical cycles, water avail-
ability and soil properties, which in turn will shift the
composition of the resident plant community (Ehren-
feld 2003; Strayer et al. 2006).
The main difficulty encountered when assessing
invasion impacts is that changes can be cumulative
and slow, taking many years to play out, especially in
ecosystems with a low turnover rate such as forests
(Crooks 2005; Strayer et al. 2006). For example, it
may take decades or even centuries to see species
composition or richness changes in a recently invaded
forest. Since functional attributes of diversity relate to
life-history traits that are specifically sorted by the
environment, they may respond more quickly to
invasion-induced environmental changes and inde-
pendently from species richness change (Chapin et al.
2000; Dıaz and Cabido 2001; Lavorel et al. 1997).
Hence, analyzing the relationships between invasion
and the life-history traits of species within the
recipient community, might help detect early vege-
tation responses and/or ecosystem function altera-
tions, not revealed by variations in species richness.
Also, compared to woody layers, the plant commu-
nities in the more species-rich understory are
expected to respond earlier, due to the often shorter
life-spans of the component species (Decocq 2000;
Halpern and Spies 1995). However, any composi-
tional change is likely to vary among habitats,
depending on soil nutrient (Stevens et al. 2004) or
water (Verheyen et al. 2007) content.
Surprisingly, despite the growing interest into
species classifications that relate directly to response
or function based on shared life-history traits
(Lavorel and Garnier 2002; Lavorel et al. 1997;
Stearns 1989; Violle et al. 2007; Weiher et al. 1999),
very few studies have investigated the functional
response of plant communities to invasion (Levine
et al. 2003). Most have done this by using a priori
functional groups, based on taxonomy (grasses,
legumes, other forbs; e.g. Fargione et al. 2003),
and/or target physiological attributes (photosynthetic
pathway, N-fixing; e.g. Baruch and Goldstein 2004).
The most common procedure for linking species
traits to environment is to group species into plant
functional types (PFTs) on the basis of their shared
traits, using clustering algorithms, and subsequently
relate these groups to environmental variables using
ordination techniques (Dıaz and Cabido 1997;
Lavorel and Garnier 2002). However, such tech-
niques can only analyse data matrices two by two,
and thus, indirectly relate species traits to environ-
ment (Legendre et al. 1997). Moreover, as the size of
the species x traits matrices is usually large, it is
sometimes difficult to derive unambiguous groups
(Simberloff and Dayan 1991), and within-groups
differences are neglected (Mason et al. 2003).
Alternatively, multivariate statistical methods have
recently emerged, that can simultaneously treat
several large data matrices, such as the three-table
method of ‘‘RLQ analysis’’ (Doledec et al. 1996;
Ribera et al. 2001), which can directly link species
traits to environmental variables.
In this paper, we investigate the relationships
between an invasive tree species, environmental
factors, understory plant communities, and species
life-history traits. We combine a paired-site sampling
design (invaded vs. uninvaded) along a soil nutrient
gradient to a RLQ analysis to identify plant traits
responding to overstory dominance of the American
black cherry (Prunus serotina Ehrh.), one of the most
important invaders in European temperate forests
(Starfinger 1997). More specifically we tackle the
three following research questions: (1) Does the
dominance of overstories by Prunus serotina affect
the functional diversity of the understory plant
community? (2) Which plant traits are filtered out?
(3) Can we derive mechanisms from the observed
patterns?
In its exotic range, Prunus serotina promptly
invades forest openings to form a low, closed carpet
of small trees, which impedes natural regeneration of
other species (Starfinger 1997; Chabrerie et al. 2007).
Once established in the canopy, it produces numerous
seeds that are bird- and mammal-dispersed; and
following germination, a long-living seedling/sapling
1892 O. Chabrerie et al.
123
bank is established in the understories (Closset-Kopp
et al. 2007). Due to fast decomposition and high
phosphorous content, the litter has soil amelioration
properties (Lorenz et al. 2004, but see Starfinger
et al. 2003), especially on nutrient-poor, acidic soils
(Dassonville et al. 2008). Because Prunus serotina
often becomes the dominant species in the canopy of
invaded forest stands, we hypothesized that it acts
as an ecosystem engineer (sensu Cuddington and
Hastings 2004) by imposing new environmental
filters to understory plant communities and thus
selecting for specific life-history traits of the compo-
nent species. Given the above mentioned character-
istics, this hypothesis makes three specific predictions
about the impacts of Prunus serotina on an under-
story community: (1) due to reduced light arrival at
the forest floor level, shade-adapted traits should be
promoted and shade-intolerant generalist species
displaced; (2) due to soil amelioration properties,
traits associated to nutrient-poor soils should decline;
(3) due to high seed production, available germina-
tion sites should be taken up by the invader, whereas
the establishment of functionally similar species
should be inhibited.
Methods
Study species and site
Prunus serotina is a gap-dependent tree species
native to North America which has been introduced
in France in ca. 1623–1629, and subsequently
planted through European forests for various pur-
poses (Starfinger 1997; Starfinger et al. 2003). Since
at least the early 1960s, it has largely spread
throughout the temperate forests of Western and
Central Europe, particularly on well-drained, nutri-
ent-poor soils, and has been recognized as one of the
most prominent forest invaders (Chabrerie et al.
2007; Starfinger 1997). It is able to overcompete
native species in openings, to form a low, closed
carpet of small trees which impedes natural regen-
eration (Closset-Kopp et al. 2007; Starfinger 1997).
Recent studies have suggested that its strong inva-
siveness in European forests may be explained by the
‘‘enemy release hypothesis’’ (Reinhart et al. 2003)
and/or the ‘‘empty niche hypothesis’’ (Closset-Kopp
et al. 2007). Paradoxically, although P. serotina can
become the dominant species of the canopy in
invaded stands, few changes have been observed in
the species composition and richness of the herb
layer, suggesting that the species would naturalize
with little impact on the recipient community, at
least in the first decades following canopy invasion
(Chabrerie et al. 2008; Godefroid et al. 2005;
Verheyen et al. 2007).
The study was carried out in the temperate, mixed
forest of Compiegne, located in northern France
(49�220N; 2�540E; 32–148 m altitude; 14,417 ha
area). This forest was chosen because it is the most
invaded by Prunus serotina in France and contains a
wide range of habitat conditions. The climate is of
oceanic type, with a mean annual temperature and
annual rainfall of 10.3�C and 677 mm, respectively.
The geological substrate mainly consists of paleo-
geneous sands and cretaceous chalks (ca. 60 and
20% of the total area, respectively). The forest of
Compiegne is characterized by a high diversity of
soil conditions from acidic and nutrient poor soils
(podzols, alisols) to basic and hydromorphic soils
(rendzinic leptosols, regosols, fluvisols). Forest man-
agement currently represents the main disturbance
regime. The study area contains even-aged planta-
tions of three ‘target’ species: the common beech
(Fagus sylvatica), oaks (Quercus robur, Quercus
petraea) and Scots pine (Pinus sylvestris), with a
silvicultural cycle, always starting with a large clear-
cut, lasting for 110, 180, and 100 years respectively.
During this time interval, thinnings are conducted
every 4–10 years. The major source of natural
disturbances are windthrows. For example, in the
past 30 years, two strong storms affected the forest,
in 1984 (364 m3/ha, i.e. 129,075 trunks over 933 ha)
and in 1990 (227 m3/ha, i.e. 134,451 trunks over 1
199 ha). P. serotina was first reported as an invader
by a local forester in 1970, but the oldest tree which
has been observed during field surveys in 2000 was
aged ca. 150 years. In 2004, P. serotina was present
in over ca. 70% of the total forest area, at least as
seedlings. It was the dominant canopy species in
over ca. 20% of this area (i.e. at least half of the total
canopy cover was made of P. serotina at the stand
scale). Few control operations are conducted in
young plantations; in mature stands, shrubby indi-
viduals are usually removed at the same time as the
coppice during thinning operations.
Impact of Prunus serotina invasion 1893
123
Vegetation sampling
We used a random stratified paired sampling strategy.
Stratification of forest stands was done on the basis of
soil type (haplic podzols, ferric and carbic podzols,
alisols, luvisols, cambic umbrisols, cambisols, fluvi-
sols) so as to represent a gradient of soil pH and
nutrient content, dominant target tree species (beech,
oaks or Scots pine), and dominance/absence of
P. serotina. Only closed-canopy forest stands were
included. We randomly selected 32 invaded stands,
where P. serotina had become the dominant canopy
species (i.e. when P. serotina was the highest ranked
tree species in terms of canopy cover; mean cover ±
standard error = 30 ± 5%). Often, P. serotina was
also the dominant species in the shrub (30 ± 3%) and
undershrub (32 ± 4%) layers, even sometimes in the
herb layer (41 ± 5%). We paired each invaded stand,
with a uninvaded stand nearby (no P. serotina in any
vegetation layer) which shared the same soil and
target tree conditions. This paired-site sampling
approach reduced the impact of possibly confounding
environmental variables on the observed differ-
ences in response variables between invaded and
uninvaded stands, while representing the entire range
of P. serotina in the study forest.
In each stand, a temporary 25 9 25 m plot
(625 m2) was marked out attempting to retain uniform
soil type, stand structure, and relief throughout. Total
vegetation cover was estimated for each vegetation
layer: tree layer ‘[6 m’; shrub layer ‘2–6 m’; under-
shrub layer ‘[0.5 m’; and herb layer ‘\0.5 m’.
Vascular plant species of the herb layer (including
seedlings and saplings of woody species) were
recorded in June-July 2004, and their cover-abundance
was scored using Braun-Blanquet (1964)’s scale. A
total of 170 species were recorded in the 64 plots.
Species nomenclature follows Lambinon et al. (2004).
Environmental variables
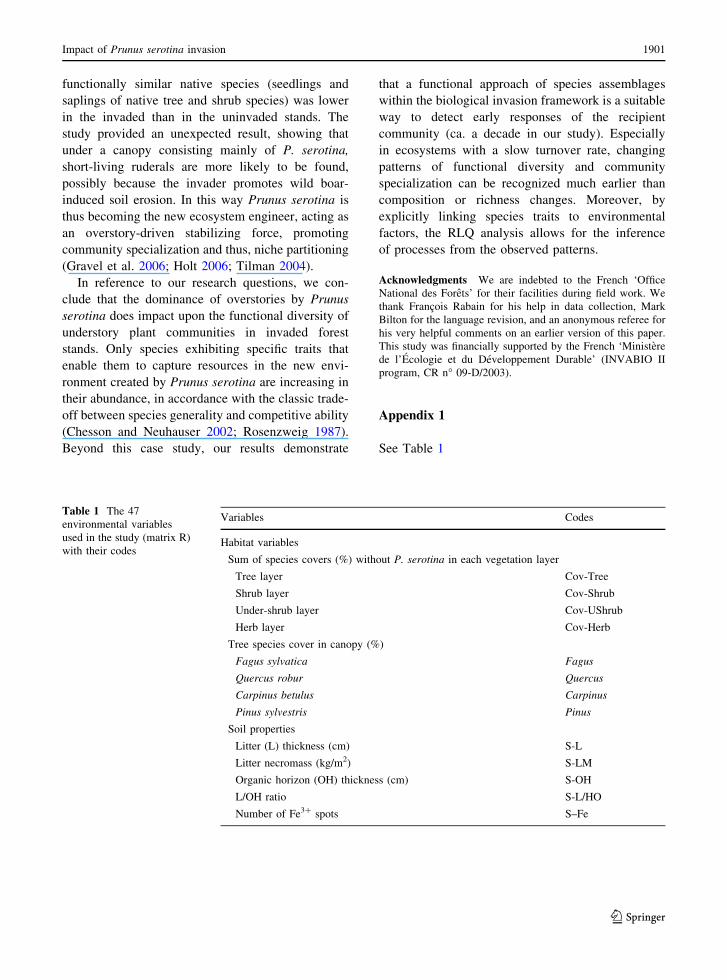
Forty-seven environmental variables, distributed
among three sets (i.e. habitat, invasion, and distur-
bance), were collected (see Appendix 1 for details):
(1) Habitat variables Within each 625 m2 plot we
recorded: cumulated species cover (excluding
P. serotina) in the different vegetation layers,
relative proportion of the main tree species,
litter thickness (L) and necromass, organic
horizon thickness (OH) and L/OH ratio, number
of Fe3? spots in the topsoil first 15 cm (used as
an indicator of temporary waterlogging). A
composite soil sample was also taken for further
lab analyses, following the recommendations of
Aubert (1978): plant available phosphorus
(P2O5; Olsen method), pHwater, organic matter
(loss on ignition at 850�C for 15 h), total
nitrogen, N–NH4?, N–NO3
- (Kjeldahl method),
organic carbon (Anne’s method), and C/N ratio.
(2) Invasion variables For invaded stands only, we
described the P. serotina population in a
40 9 40 m quadrat which was centred on the
smaller 625 m2 one: canopy height, diameter at
breast height (dbh), and canopy cover of all
individuals (dbh [ 5 cm) were recorded. A
wood core was also taken at breast height from
the three largest individuals per stand to count
tree rings and determine the population age.
(3) Disturbance variables For each stand, informa-
tion about natural (i.e. storm-induced tree falls)
and management-related disturbances were
extracted from the local forest service database
for the last 50 years (1955–2005). The volume
of tree falls (TF) which has been collected after
each storm event or cut down (Cut trees, CT)
was cumulated into 10 year-classes, from 1955
to 2005. Within each 625 m2 plot, we also
recorded number of canopy gaps and stumps,
dead tree and bare soil cover, and wild boar-
disturbed soil area.
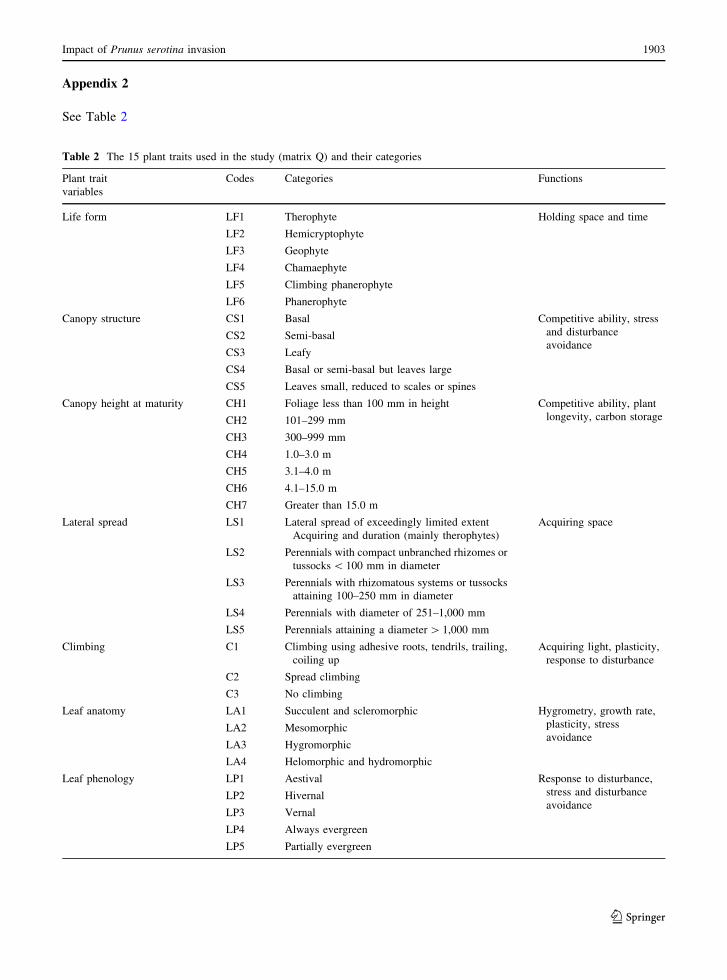
Species traits
Following the recommendations of Weiher et al.
(1999), we targeted functions that are associated to
the three fundamental challenges faced by plants, i.e.
dispersal, establishment, and persistence. A set of 15
biological traits was retained (Appendix 2). The
information was extracted from six plant databases:
‘‘Biological traits of vascular plants’’ (Kleyer 1995),
‘‘Electronic comparative plant ecology’’ (Hodgson
et al. 1995), the soil seed bank database of North
West Europe (Thompson et al. 1997), BIOLFLOR
(Klotz et al. 2002), BIOPOP (Poschlod et al. 2003)
and the LEDA Traitbase (Knevel et al. 2003), and
completed with local floras (Lambinon et al. 2004;
1894 O. Chabrerie et al.
123
Provost 1998; Rameau et al. 1989). Traits were
treated as categorical variables; the optimal number
of categories was defined to be ecologically mean-
ingful and have balanced sizes (Lavorel et al. 1998).
Species which appeared in only one releve as well as
those for which less than 50% of plant trait informa-
tion was available were excluded from the analysis.
We finally obtained a 121 species 9 15 traits matrix.
Data analysis
To test our first research question, whether the
functional diversity of understory plant assemblages
differed between invaded and uninvaded stands, we
used two different measures. First, we calculated the
generalist-specialist measure h of Fridley et al. (2007)
for each of the 170 species occurring in the herb layer.
This measure, which is derived from beta diversity
statistics, quantifies the relative niche width using
species co-occurrence data instead of environmental
factors that control plant species distribution. More-
over, no assumption is required regarding niche shape,
distribution and configuration of habitats, or how
species are distributed along gradients. Given equal
plot occurrences, generalist species should co-occur
with many species, whereas specialists should co-
occur with relatively few species. We then derived a
Community Specialization Index (CSI) by averaging
species’ h values for each vegetation releve, with and
without weighting by species abundance, and with
and without deleting rare species (i.e. species occur-
ring in less than 5% of the releves). The higher the CSI
value, the more generalist the species assemblage.
Second, we computed Rao’s quadratic entropy
FDQ, which has been found to surpass all other
available measures of functional diversity, by incor-
porating both the relative abundances of species and a
measure of the pairwise functional differences
between species (Botta-Dukat 2005). It has also the
advantage to be relatively independent from species
richness. For a S-species community characterized by
the relative abundance vector p = (p1, p2,…, pS), the
quadratic entropy is given by
FDQ ¼XS
i¼1
XS
j¼1
dij pi pj
where dij is a distance measure accounting for
functional difference between the i-th and j-th
species. We used Gower’s dissimilarity index as a
measure of dij, which allows to cope simultaneously
with binary, nominal, ordinal and quantitative data
(Gower 1971). The higher the FDQ value, the more
diverse the species traits within the community. This
index was calculated using the 121 species 9 15
traits matrix and the Macro Excel� file from Leps
et al. (2006).
Species richness, number of rare species (i.e.
species occurring in less than 5% of the plots), herb
layer cover, unweighted and weighted CSI, and FDQ
values between invaded and uninvaded stands were
compared using Wilcoxon rank tests for paired
observations and Statview� software. Results are
expressed as means ± standard errors.
Then, to address our second and third research
questions, we wanted to identify which life-history
traits were associated to Prunus serotina invasion and
search for potential mechanisms behind these pat-
terns. Therefore we conducted a RLQ co-inertia
analysis (Doledec et al. 1996) of our three matrices:
the 64 plots 9 47 environmental variables matrix
describing the habitat template (matrix R); the 64
plots 9 121 species matrix, giving the abundance of
the various species in each plot (matrix L); and the
121 species 9 15 life traits matrix, qualifying bio-
logical features of species (matrix Q). As a three-way
ordination method, RLQ analysis allows for the
exploration of the joint structure between the three
data matrices R, L, and Q, by running simultaneously
a Principal Component Analysis (PCA), a Correspon-
dence Analysis (CA), and a Multiple Correspondence
Analysis (MCA), respectively. These three analyses
are combined so as to maximize the covariation
between environmental variables and species traits,
i.e. plot scores in matrix R constrain plot scores in
matrix L, whereas species scores in matrix Q constrain
species scores in matrix L (Doledec et al. 1996; Dray
et al. 2003; Legendre et al. 1997; Ribera et al. 2001).
Therefore, matrix L is used as a link between matrices
R and Q, to directly relate environmental variables to
species traits. The significance of the relationship
between environmental variables (R) and species
traits (Q) was tested with a Monte Carlo permutation
test: the results of 1000 random permutations between
matrices R and Q were compared to the total inertia in
the RLQ analysis, following Doledec et al. (1996).
RLQ analysis and graphs used ADE-4 software
(Thioulouse et al. 1997).
Impact of Prunus serotina invasion 1895
123
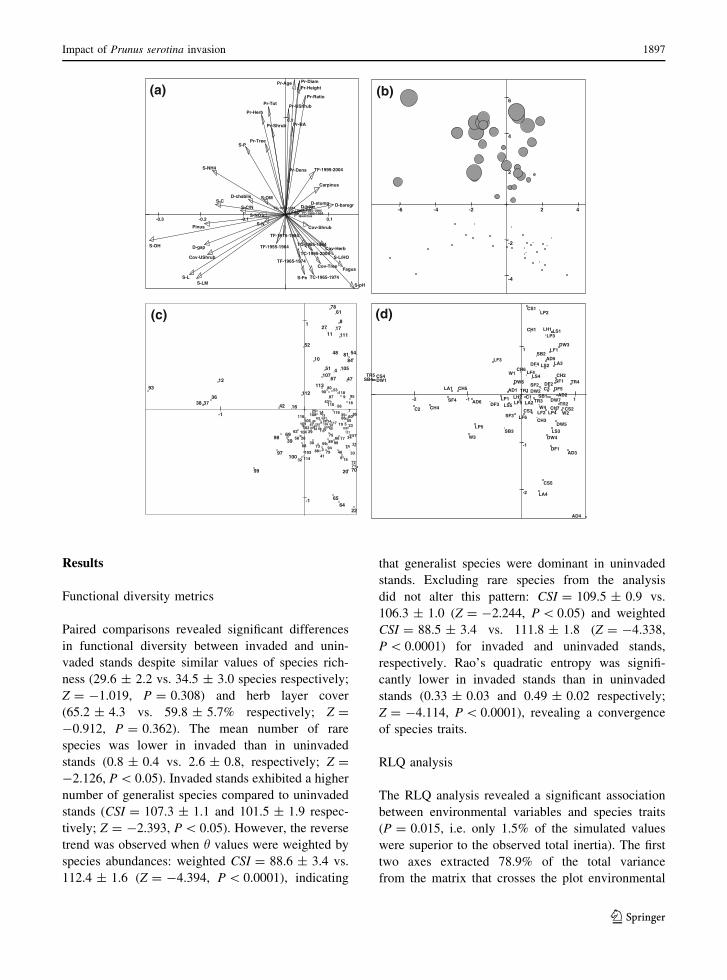
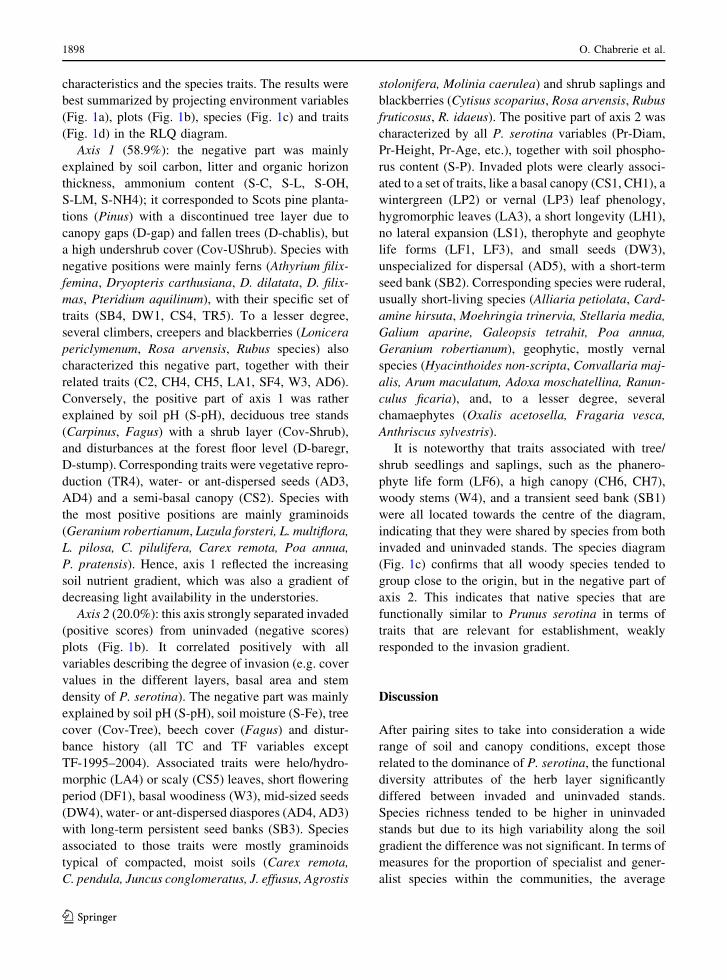
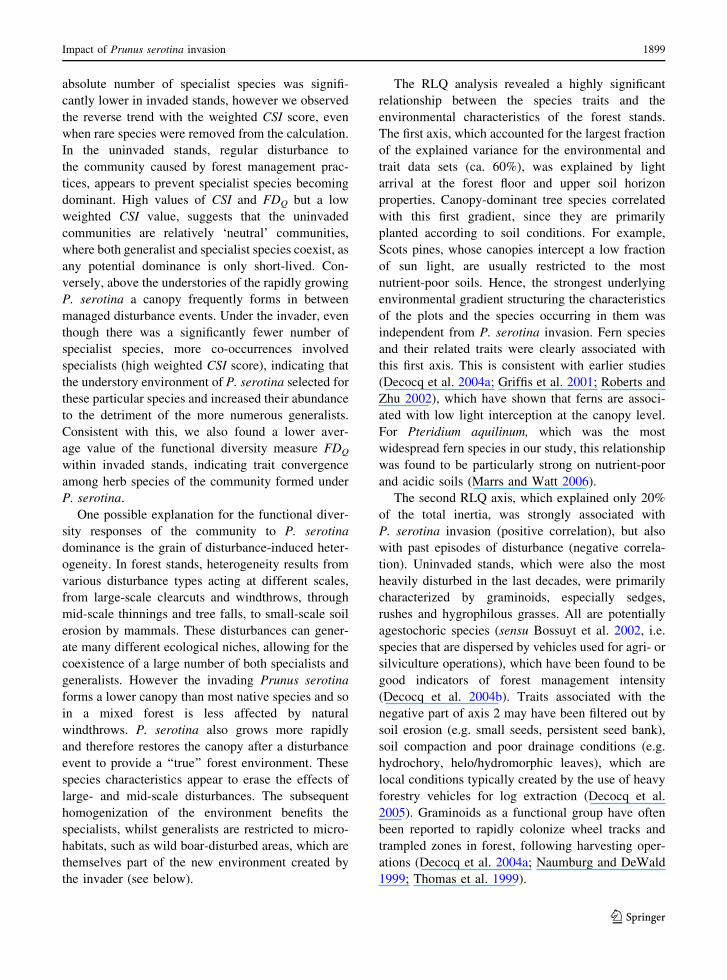
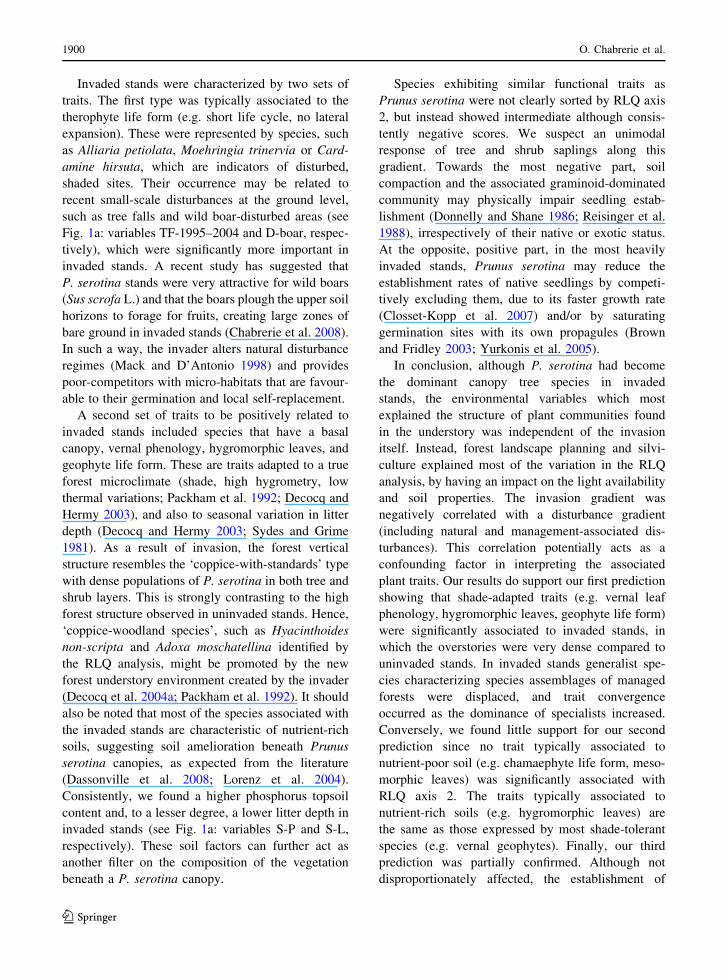
Fig. 1 RLQ diagram as defined by the first two axes with
projection of a environmental variables; b plots; dot size is
proportional to P. serotina cover in the overstories, c species;
d plant traits. Environmental variables. HABITAT VARI-
ABLES: Cover of the tree layer (Cov-Tree), shrub layer (Cov-
Shrub), the undershrub layer (Cov-UShrub) and the herb layer
(Cov-Herb), excluding Prunus serotina. Canopy cover value
for beech (Fagus), oaks (Quercus), hornbeam (Carpinus) and
Scots pine (Pinus). Litter thickness (S-L), litter necromass
(S-LM), soil organic horizon thickness (S-OH), L/OH ratio
(S-L/HO), number of Fe3? spots in upper soil horizons (S-Fe),
plant available soil phosphorus content (S-P), soil pH (S-pH),
soil organic matter content (S-OM), soil nitrogen content
(S-N), soil ammonia content (S-NH4), soil nitrate content
(S-NO3), organic carbon content (S-C), C/N ratio (S-C/N).
INVASION VARIABLES: Prunus serotina cover in the tree
layer (Pr-Tree), shrub layer (Pr-Shrub), undershrub layer
(Pr-UShrub), herb layer (Pr-Herb), all layers (Pr-Tot). Prunusserotina basal area (Pr-BA), stem density (Pr-Dens), mean
diameter (Pr-Diam), Mean height (Pr-Height), basal area/stem
density ratio (Pr-Ratio), age of the oldest individual (Pr-Age).
DISTURBANCE VARIABLES: volume of logs collected after
storms in the different decades (TF-1995–2004, TF-1985–
1994, TF-1975–1984, TF-1965–1974, TF-1955–1964). Vol-
ume of logs cut by foresters in the different decades (TC-
1995–2004, TC-1985–1994, TC-1975–1984, TC-1965–1974,
TC-1955–1964). Number of canopy gaps (D-gap). Fallen tree
cover (D-chablis). Bare soil area (D-baregr). Stump number
(D-stump). Wild boar-disturbed area (D-boar). Species.1 = Acer campestre; 2 = Acer platanoides; 3 = Acer pseudo-platanus; 4 = Adoxa moschatellina; 5 = Agrostis capillaris;
6 = Agrostis stolonifera; 7 = Ajuga reptans; 8 = Alliariapetiolata; 9 = Anemone nemorosa; 10 = Anthriscus sylves-tris; 11 = Arum maculatum; 12 = Athyrium filix-femina; 13 =
Betula pendula; 14 = Betula pubescens; 15 = Brachypodiumsylvaticum; 16 = Calystegia sepium; 17 = Cardamine hirsuta;
18 = Carex flacca; 19 = Carex pallescens; 20 =
Carex pendula; 21 = Carex pilulifera; 22 = Carex remota;
23 = Carex sylvatica; 24 = Carpinus betulus; 25 = Circaealutetiana; 26 = Clematis vitalba; 27 = Convallaria maialis;
28 = Cornus sanguinea; 29 = Corylus avellana; 30 = Cra-taegus laevigata; 31 = Crataegus monogyna; 32 = Cytisusscoparius; 33 = Dactylis glomerata; 34 = Deschampsiacespitosa; 35 = Deschampsia flexuosa; 36 = Dryopteris car-thusiana; 37 = Dryopteris dilatata; 38 = Dryopteris filix-mas;
39 = Epilobium hirsutum; 40 = Epilobium montanum; 41 =
Epilobium parviflorum; 42 = Epipactis helleborine; 43 =
Euphorbia amygdaloides; 44 = Euonymus europaeus;
45 = Fagus sylvatica; 46 = Festuca gigantea; 47 = Ranun-culus ficaria; 48 = Fragaria vesca; 49 = Frangula alnus;
50 = Fraxinus excelsior; 51 = Galeopsis tetrahit; 52 = Gali-um aparine; 53 = Galium odoratum; 54 = Geranium rober-tianum; 55 = Geum urbanum; 56 = Glechoma hederacea;
57 = Glyceria declinata; 58 = Hedera helix; 59 = Holcuslanatus; 60 = Holcus mollis; 61 = Hyacinthoides non-scripta;
62 = Hypericum hirsutum; 63 = Ilex aquifolium; 64 = Jun-cus conglomeratus; 65 = Juncus effusus; 66 = Lamium gale-obdolon; 67 = Lapsana communis; 68 = Ligustrum vulgare;
69 = Lonicera periclymenum; 70 = Luzula forsteri; 71 =
Luzula multiflora; 72 = Luzula pilosa; 73 = Malus sylvestris;
74 = Melica uniflora; 75 = Mercurialis perennis; 76 = Mes-pilus germanica; 77 = Milium effusum; 78 = Moehringiatrinervia; 79 = Molinia caerulea; 80 = Mycelis muralis;
81 = Oxalis acetosella; 82 = Picea abies; 83 = Pinus sylves-tris; 84 = Poa annua; 85 = Poa pratensis; 86 = Poa trivialis;
87 = Polygonatum multiflorum; 88 = Polygonum hydropiper;
89 = Potentilla sterilis; 90 = Primula veris; 91 = Prunusavium; 92 = Prunus spinosa; 93 = Pteridium aquilinum;
94 = Quercus robur; 95 = Ranunculus acris; 96 = Ranuncu-lus repens; 97 = Rosa arvensis; 98 = Rubus caesius; 99 =
Rubus fruticosus; 100 = Rubus idaeus; 101 = Rumex crispus;
102 = Rumex obtusifolius; 103 = Rumex sanguineus; 104 =
Sambucus nigra; 105 = Sanicula europaea; 106 = Scrophu-laria nodosa; 107 = Sonchus oleraceus; 108 = Sorbus aucu-paria; 109 = Stachys sylvatica; 110 = Stellaria holostea;
111 = Stellaria media; 112 = Tamus communis; 113 =
Taraxacum officinale; 114 = Teucrium scorodonia; 115 =
Tilia cordata; 116 = Urtica dioica; 117 = Veronica cha-maedrys; 118 = Veronica montana; 119 = Vicia sepium;
120 = Viola reichenbachiana; 121 = Viola riviniana. Planttraits. Life form: LF1: therophyte, LF2: hemicryptophyte, LF3:
geophyte, LF4: chamaephyte, LF5: climbing phanerophyte,
LF6: phanerophyte. Canopy structure: CS1: basal, CS2: semi-
basal, CS3: leafy, CS4: basal or semi-basal but large leaves,
CS5: small leaves, reduced to scales or spines. Canopy height
at maturity: CH1: \ 100 mm, CH2: 101–299 mm, CH3: 300–
999 mm, CH4: 1.0–3.0 m, CH5: 3.1–4.0 m, CH6: 4.1–15.0 m,
CH7: [ 15.0 m. Lateral spread: LS1: of exceedingly limited
extent and duration (mainly therophytes), LS2: perennials with
compact unbranched rhizomes or tussocks \ 100 mm in
diameter, LS3: perennials with rhizomatous systems or
tussocks attaining 100–250 mm, LS4: perennials with diameter
of 251–1000 mm, LS5: perennials attaining a diame-
ter [ 1000 mm. Climbing: C1: climbing using adhesive roots,
tendrils, trailing, coiling up, C2: spread climbing, C3: no
climbing. Leaf anatomy: LA1: succulent/scleromorphic, LA2:
mesomorphic, LA3: hygromorphic, LA4: helomorphic/hydro-
morphic. Leaf phenology: LP1: aestival, LP2: hivernal, LP3:
vernal, LP4: always evergreen, LP5: partially evergreen.
Woodiness: W1: herbs, W2: grasses, W3: woody at base,
W4: woody. Life history: LH1: annual/biennal, LH2: peren-
nial. Type of reproduction: TR1: by seeds, TR2: mostly by
seeds, rarely vegetatively, TR3: by seeds and vegetatively,
TR4: mostly vegetatively, rarely by seeds, TR5: by spores.
Start of flowering period: SF1: January to April, SF2: May,
SF3: June, SF4: July to December. Duration of flowering
period: DF1: 1 month, DF2: 2 months, DF3: 3 months, DF4:
4 months, DF5: 5–12 months. Dispersule weight: DW1: too
small to be measured easily, DW2: B 0.20 mg, DW3:
0.21–0.50 mg, DW4: 0.51–1.00 mg, DW5: 1.01–2.00 mg,
DW6: 2.01–10.00 mg, DW7: [ 10 mg. Dispersal mode:
AD1: endozoochory, AD2: ectozoochory, AD3: myrmecoch-
ory, AD4: hydrochory, AD5: unspecialized, AD6: anemochory.
Seed bank type: SB1: transient, SB2: short-term persistent,
SB3: long-term persistent, SB4: spores
c
1896 O. Chabrerie et al.
123
Results
Functional diversity metrics
Paired comparisons revealed significant differences
in functional diversity between invaded and unin-
vaded stands despite similar values of species rich-
ness (29.6 ± 2.2 vs. 34.5 ± 3.0 species respectively;
Z = -1.019, P = 0.308) and herb layer cover
(65.2 ± 4.3 vs. 59.8 ± 5.7% respectively; Z =
-0.912, P = 0.362). The mean number of rare
species was lower in invaded than in uninvaded
stands (0.8 ± 0.4 vs. 2.6 ± 0.8, respectively; Z =
-2.126, P \ 0.05). Invaded stands exhibited a higher
number of generalist species compared to uninvaded
stands (CSI = 107.3 ± 1.1 and 101.5 ± 1.9 respec-
tively; Z = -2.393, P \ 0.05). However, the reverse
trend was observed when h values were weighted by
species abundances: weighted CSI = 88.6 ± 3.4 vs.
112.4 ± 1.6 (Z = -4.394, P \ 0.0001), indicating
that generalist species were dominant in uninvaded
stands. Excluding rare species from the analysis
did not alter this pattern: CSI = 109.5 ± 0.9 vs.
106.3 ± 1.0 (Z = -2.244, P \ 0.05) and weighted
CSI = 88.5 ± 3.4 vs. 111.8 ± 1.8 (Z = -4.338,
P \ 0.0001) for invaded and uninvaded stands,
respectively. Rao’s quadratic entropy was signifi-
cantly lower in invaded stands than in uninvaded
stands (0.33 ± 0.03 and 0.49 ± 0.02 respectively;
Z = -4.114, P \ 0.0001), revealing a convergence
of species traits.
RLQ analysis
The RLQ analysis revealed a significant association
between environmental variables and species traits
(P = 0.015, i.e. only 1.5% of the simulated values
were superior to the observed total inertia). The first
two axes extracted 78.9% of the total variance
from the matrix that crosses the plot environmental
-1
-1
1
1
2
3
4
5
6
7
8
9
10
11
12
1314
15
16
17
18
19
20
21
22
2324
25
26
27
28
29
30
31
32
33
34
35
363738
39
40
41
4243
4445
46
47
48
49
50
51
52
53
54
55
56
5758
59
60
61
62
63
6465
66
67
68
69
707172
73 74
75
76
77
78
79
80
81
8283
84
8586
87
88
89
90
9192
93
94
95
96
97
98
99
100
101102
103
104
105
106
107
108
109
110
111
112
113
114
115
116
117
118
119
120121
-6 -4 -2 2 4
-4
-2
2
4
6
-2 -1 1
-2
-1
1 LF1
LF2
LF3
LF4
LF5
LF6
CS1
CS2CS3
CS4
CS5
CH1
CH2
CH3
CH4
CH5
CH6
CH7
LS1
LS2
LS3
LS4
LS5
C1
C2
C3LA1
LA2
LA3
LA4
LP1
LP2
LP3
LP4
LP5
W1
W2
W3
W4
LH1
LH2TR1
TR2TR3
TR4TR5
SF1SF2
SF3
SF4
DF1
DF2
DF3
DF4
DF5
DW1
DW2
DW3
DW4
DW5
DW6
DW7
AD1AD2
AD3
AD4
AD5
AD6SB1
SB2
SB3
SB4
(a) (b)
-0.3 -0.2 -0.1 0.1
0.1
Pr-Tree
Pr-Shrub
Pr-UShrubPr-Herb
Pr-Tot
Pr-BA
Pr-Dens
Pr-DiamPr-Height
Pr-Ratio
Pr-Age
Cov-Tree
Cov-Shrub
Cov-UShrub
Cov-Herb
Fagus
Quercus
Carpinus
Pinus
S-LS-LM
S-OH
S-L/HO
S-Fe
S-P
S-pH
S-OM
S-N
S-NH4
S-NO3
S-CS-C/N
TF-1995-2004
TF-1985-1994
TF-1975-1984
TF-1965-1974
TF-1955-1964
TC-1995-2004
TC-1985-1994
TC-1975-1984
TC-1965-1974
TC-1955-1964D-gap
D-chablis
D-baregrD-stumpD-boar
(d)(c)
Impact of Prunus serotina invasion 1897
123
characteristics and the species traits. The results were
best summarized by projecting environment variables
(Fig. 1a), plots (Fig. 1b), species (Fig. 1c) and traits
(Fig. 1d) in the RLQ diagram.
Axis 1 (58.9%): the negative part was mainly
explained by soil carbon, litter and organic horizon
thickness, ammonium content (S-C, S-L, S-OH,
S-LM, S-NH4); it corresponded to Scots pine planta-
tions (Pinus) with a discontinued tree layer due to
canopy gaps (D-gap) and fallen trees (D-chablis), but
a high undershrub cover (Cov-UShrub). Species with
negative positions were mainly ferns (Athyrium filix-
femina, Dryopteris carthusiana, D. dilatata, D. filix-
mas, Pteridium aquilinum), with their specific set of
traits (SB4, DW1, CS4, TR5). To a lesser degree,
several climbers, creepers and blackberries (Lonicera
periclymenum, Rosa arvensis, Rubus species) also
characterized this negative part, together with their
related traits (C2, CH4, CH5, LA1, SF4, W3, AD6).
Conversely, the positive part of axis 1 was rather
explained by soil pH (S-pH), deciduous tree stands
(Carpinus, Fagus) with a shrub layer (Cov-Shrub),
and disturbances at the forest floor level (D-baregr,
D-stump). Corresponding traits were vegetative repro-
duction (TR4), water- or ant-dispersed seeds (AD3,
AD4) and a semi-basal canopy (CS2). Species with
the most positive positions are mainly graminoids
(Geranium robertianum, Luzula forsteri, L. multiflora,
L. pilosa, C. pilulifera, Carex remota, Poa annua,
P. pratensis). Hence, axis 1 reflected the increasing
soil nutrient gradient, which was also a gradient of
decreasing light availability in the understories.
Axis 2 (20.0%): this axis strongly separated invaded
(positive scores) from uninvaded (negative scores)
plots (Fig. 1b). It correlated positively with all
variables describing the degree of invasion (e.g. cover
values in the different layers, basal area and stem
density of P. serotina). The negative part was mainly
explained by soil pH (S-pH), soil moisture (S-Fe), tree
cover (Cov-Tree), beech cover (Fagus) and distur-
bance history (all TC and TF variables except
TF-1995–2004). Associated traits were helo/hydro-
morphic (LA4) or scaly (CS5) leaves, short flowering
period (DF1), basal woodiness (W3), mid-sized seeds
(DW4), water- or ant-dispersed diaspores (AD4, AD3)
with long-term persistent seed banks (SB3). Species
associated to those traits were mostly graminoids
typical of compacted, moist soils (Carex remota,
C. pendula, Juncus conglomeratus, J. effusus, Agrostis
stolonifera, Molinia caerulea) and shrub saplings and
blackberries (Cytisus scoparius, Rosa arvensis, Rubus
fruticosus, R. idaeus). The positive part of axis 2 was
characterized by all P. serotina variables (Pr-Diam,
Pr-Height, Pr-Age, etc.), together with soil phospho-
rus content (S-P). Invaded plots were clearly associ-
ated to a set of traits, like a basal canopy (CS1, CH1), a
wintergreen (LP2) or vernal (LP3) leaf phenology,
hygromorphic leaves (LA3), a short longevity (LH1),
no lateral expansion (LS1), therophyte and geophyte
life forms (LF1, LF3), and small seeds (DW3),
unspecialized for dispersal (AD5), with a short-term
seed bank (SB2). Corresponding species were ruderal,
usually short-living species (Alliaria petiolata, Card-
amine hirsuta, Moehringia trinervia, Stellaria media,
Galium aparine, Galeopsis tetrahit, Poa annua,
Geranium robertianum), geophytic, mostly vernal
species (Hyacinthoides non-scripta, Convallaria maj-
alis, Arum maculatum, Adoxa moschatellina, Ranun-
culus ficaria), and, to a lesser degree, several
chamaephytes (Oxalis acetosella, Fragaria vesca,
Anthriscus sylvestris).
It is noteworthy that traits associated with tree/
shrub seedlings and saplings, such as the phanero-
phyte life form (LF6), a high canopy (CH6, CH7),
woody stems (W4), and a transient seed bank (SB1)
were all located towards the centre of the diagram,
indicating that they were shared by species from both
invaded and uninvaded stands. The species diagram
(Fig. 1c) confirms that all woody species tended to
group close to the origin, but in the negative part of
axis 2. This indicates that native species that are
functionally similar to Prunus serotina in terms of
traits that are relevant for establishment, weakly
responded to the invasion gradient.
Discussion
After pairing sites to take into consideration a wide
range of soil and canopy conditions, except those
related to the dominance of P. serotina, the functional
diversity attributes of the herb layer significantly
differed between invaded and uninvaded stands.
Species richness tended to be higher in uninvaded
stands but due to its high variability along the soil
gradient the difference was not significant. In terms of
measures for the proportion of specialist and gener-
alist species within the communities, the average
1898 O. Chabrerie et al.
123
absolute number of specialist species was signifi-
cantly lower in invaded stands, however we observed
the reverse trend with the weighted CSI score, even
when rare species were removed from the calculation.
In the uninvaded stands, regular disturbance to
the community caused by forest management prac-
tices, appears to prevent specialist species becoming
dominant. High values of CSI and FDQ but a low
weighted CSI value, suggests that the uninvaded
communities are relatively ‘neutral’ communities,
where both generalist and specialist species coexist, as
any potential dominance is only short-lived. Con-
versely, above the understories of the rapidly growing
P. serotina a canopy frequently forms in between
managed disturbance events. Under the invader, even
though there was a significantly fewer number of
specialist species, more co-occurrences involved
specialists (high weighted CSI score), indicating that
the understory environment of P. serotina selected for
these particular species and increased their abundance
to the detriment of the more numerous generalists.
Consistent with this, we also found a lower aver-
age value of the functional diversity measure FDQ
within invaded stands, indicating trait convergence
among herb species of the community formed under
P. serotina.
One possible explanation for the functional diver-
sity responses of the community to P. serotina
dominance is the grain of disturbance-induced heter-
ogeneity. In forest stands, heterogeneity results from
various disturbance types acting at different scales,
from large-scale clearcuts and windthrows, through
mid-scale thinnings and tree falls, to small-scale soil
erosion by mammals. These disturbances can gener-
ate many different ecological niches, allowing for the
coexistence of a large number of both specialists and
generalists. However the invading Prunus serotina
forms a lower canopy than most native species and so
in a mixed forest is less affected by natural
windthrows. P. serotina also grows more rapidly
and therefore restores the canopy after a disturbance
event to provide a ‘‘true’’ forest environment. These
species characteristics appear to erase the effects of
large- and mid-scale disturbances. The subsequent
homogenization of the environment benefits the
specialists, whilst generalists are restricted to micro-
habitats, such as wild boar-disturbed areas, which are
themselves part of the new environment created by
the invader (see below).
The RLQ analysis revealed a highly significant
relationship between the species traits and the
environmental characteristics of the forest stands.
The first axis, which accounted for the largest fraction
of the explained variance for the environmental and
trait data sets (ca. 60%), was explained by light
arrival at the forest floor and upper soil horizon
properties. Canopy-dominant tree species correlated
with this first gradient, since they are primarily
planted according to soil conditions. For example,
Scots pines, whose canopies intercept a low fraction
of sun light, are usually restricted to the most
nutrient-poor soils. Hence, the strongest underlying
environmental gradient structuring the characteristics
of the plots and the species occurring in them was
independent from P. serotina invasion. Fern species
and their related traits were clearly associated with
this first axis. This is consistent with earlier studies
(Decocq et al. 2004a; Griffis et al. 2001; Roberts and
Zhu 2002), which have shown that ferns are associ-
ated with low light interception at the canopy level.
For Pteridium aquilinum, which was the most
widespread fern species in our study, this relationship
was found to be particularly strong on nutrient-poor
and acidic soils (Marrs and Watt 2006).
The second RLQ axis, which explained only 20%
of the total inertia, was strongly associated with
P. serotina invasion (positive correlation), but also
with past episodes of disturbance (negative correla-
tion). Uninvaded stands, which were also the most
heavily disturbed in the last decades, were primarily
characterized by graminoids, especially sedges,
rushes and hygrophilous grasses. All are potentially
agestochoric species (sensu Bossuyt et al. 2002, i.e.
species that are dispersed by vehicles used for agri- or
silviculture operations), which have been found to be
good indicators of forest management intensity
(Decocq et al. 2004b). Traits associated with the
negative part of axis 2 may have been filtered out by
soil erosion (e.g. small seeds, persistent seed bank),
soil compaction and poor drainage conditions (e.g.
hydrochory, helo/hydromorphic leaves), which are
local conditions typically created by the use of heavy
forestry vehicles for log extraction (Decocq et al.
2005). Graminoids as a functional group have often
been reported to rapidly colonize wheel tracks and
trampled zones in forest, following harvesting oper-
ations (Decocq et al. 2004a; Naumburg and DeWald
1999; Thomas et al. 1999).
Impact of Prunus serotina invasion 1899
123
Invaded stands were characterized by two sets of
traits. The first type was typically associated to the
therophyte life form (e.g. short life cycle, no lateral
expansion). These were represented by species, such
as Alliaria petiolata, Moehringia trinervia or Card-
amine hirsuta, which are indicators of disturbed,
shaded sites. Their occurrence may be related to
recent small-scale disturbances at the ground level,
such as tree falls and wild boar-disturbed areas (see
Fig. 1a: variables TF-1995–2004 and D-boar, respec-
tively), which were significantly more important in
invaded stands. A recent study has suggested that
P. serotina stands were very attractive for wild boars
(Sus scrofa L.) and that the boars plough the upper soil
horizons to forage for fruits, creating large zones of
bare ground in invaded stands (Chabrerie et al. 2008).
In such a way, the invader alters natural disturbance
regimes (Mack and D’Antonio 1998) and provides
poor-competitors with micro-habitats that are favour-
able to their germination and local self-replacement.
A second set of traits to be positively related to
invaded stands included species that have a basal
canopy, vernal phenology, hygromorphic leaves, and
geophyte life form. These are traits adapted to a true
forest microclimate (shade, high hygrometry, low
thermal variations; Packham et al. 1992; Decocq and
Hermy 2003), and also to seasonal variation in litter
depth (Decocq and Hermy 2003; Sydes and Grime
1981). As a result of invasion, the forest vertical
structure resembles the ‘coppice-with-standards’ type
with dense populations of P. serotina in both tree and
shrub layers. This is strongly contrasting to the high
forest structure observed in uninvaded stands. Hence,
‘coppice-woodland species’, such as Hyacinthoides
non-scripta and Adoxa moschatellina identified by
the RLQ analysis, might be promoted by the new
forest understory environment created by the invader
(Decocq et al. 2004a; Packham et al. 1992). It should
also be noted that most of the species associated with
the invaded stands are characteristic of nutrient-rich
soils, suggesting soil amelioration beneath Prunus
serotina canopies, as expected from the literature
(Dassonville et al. 2008; Lorenz et al. 2004).
Consistently, we found a higher phosphorus topsoil
content and, to a lesser degree, a lower litter depth in
invaded stands (see Fig. 1a: variables S-P and S-L,
respectively). These soil factors can further act as
another filter on the composition of the vegetation
beneath a P. serotina canopy.
Species exhibiting similar functional traits as
Prunus serotina were not clearly sorted by RLQ axis
2, but instead showed intermediate although consis-
tently negative scores. We suspect an unimodal
response of tree and shrub saplings along this
gradient. Towards the most negative part, soil
compaction and the associated graminoid-dominated
community may physically impair seedling estab-
lishment (Donnelly and Shane 1986; Reisinger et al.
1988), irrespectively of their native or exotic status.
At the opposite, positive part, in the most heavily
invaded stands, Prunus serotina may reduce the
establishment rates of native seedlings by competi-
tively excluding them, due to its faster growth rate
(Closset-Kopp et al. 2007) and/or by saturating
germination sites with its own propagules (Brown
and Fridley 2003; Yurkonis et al. 2005).
In conclusion, although P. serotina had become
the dominant canopy tree species in invaded
stands, the environmental variables which most
explained the structure of plant communities found
in the understory was independent of the invasion
itself. Instead, forest landscape planning and silvi-
culture explained most of the variation in the RLQ
analysis, by having an impact on the light availability
and soil properties. The invasion gradient was
negatively correlated with a disturbance gradient
(including natural and management-associated dis-
turbances). This correlation potentially acts as a
confounding factor in interpreting the associated
plant traits. Our results do support our first prediction
showing that shade-adapted traits (e.g. vernal leaf
phenology, hygromorphic leaves, geophyte life form)
were significantly associated to invaded stands, in
which the overstories were very dense compared to
uninvaded stands. In invaded stands generalist spe-
cies characterizing species assemblages of managed
forests were displaced, and trait convergence
occurred as the dominance of specialists increased.
Conversely, we found little support for our second
prediction since no trait typically associated to
nutrient-poor soil (e.g. chamaephyte life form, meso-
morphic leaves) was significantly associated with
RLQ axis 2. The traits typically associated to
nutrient-rich soils (e.g. hygromorphic leaves) are
the same as those expressed by most shade-tolerant
species (e.g. vernal geophytes). Finally, our third
prediction was partially confirmed. Although not
disproportionately affected, the establishment of
1900 O. Chabrerie et al.
123
functionally similar native species (seedlings and
saplings of native tree and shrub species) was lower
in the invaded than in the uninvaded stands. The
study provided an unexpected result, showing that
under a canopy consisting mainly of P. serotina,
short-living ruderals are more likely to be found,
possibly because the invader promotes wild boar-
induced soil erosion. In this way Prunus serotina is
thus becoming the new ecosystem engineer, acting as
an overstory-driven stabilizing force, promoting
community specialization and thus, niche partitioning
(Gravel et al. 2006; Holt 2006; Tilman 2004).
In reference to our research questions, we con-
clude that the dominance of overstories by Prunus
serotina does impact upon the functional diversity of
understory plant communities in invaded forest
stands. Only species exhibiting specific traits that
enable them to capture resources in the new envi-
ronment created by Prunus serotina are increasing in
their abundance, in accordance with the classic trade-
off between species generality and competitive ability
(Chesson and Neuhauser 2002; Rosenzweig 1987).
Beyond this case study, our results demonstrate
that a functional approach of species assemblages
within the biological invasion framework is a suitable
way to detect early responses of the recipient
community (ca. a decade in our study). Especially
in ecosystems with a slow turnover rate, changing
patterns of functional diversity and community
specialization can be recognized much earlier than
composition or richness changes. Moreover, by
explicitly linking species traits to environmental
factors, the RLQ analysis allows for the inference
of processes from the observed patterns.
Acknowledgments We are indebted to the French ‘Office
National des Forets’ for their facilities during field work. We
thank Francois Rabain for his help in data collection, Mark
Bilton for the language revision, and an anonymous referee for
his very helpful comments on an earlier version of this paper.
This study was financially supported by the French ‘Ministere
de l’Ecologie et du Developpement Durable’ (INVABIO II
program, CR n� 09-D/2003).
Appendix 1
See Table 1
Table 1 The 47
environmental variables
used in the study (matrix R)
with their codes
Variables Codes
Habitat variables
Sum of species covers (%) without P. serotina in each vegetation layer
Tree layer Cov-Tree
Shrub layer Cov-Shrub
Under-shrub layer Cov-UShrub
Herb layer Cov-Herb
Tree species cover in canopy (%)
Fagus sylvatica Fagus
Quercus robur Quercus
Carpinus betulus Carpinus
Pinus sylvestris Pinus
Soil properties
Litter (L) thickness (cm) S-L
Litter necromass (kg/m2) S-LM
Organic horizon (OH) thickness (cm) S-OH
L/OH ratio S-L/HO
Number of Fe3? spots S–Fe
Impact of Prunus serotina invasion 1901
123
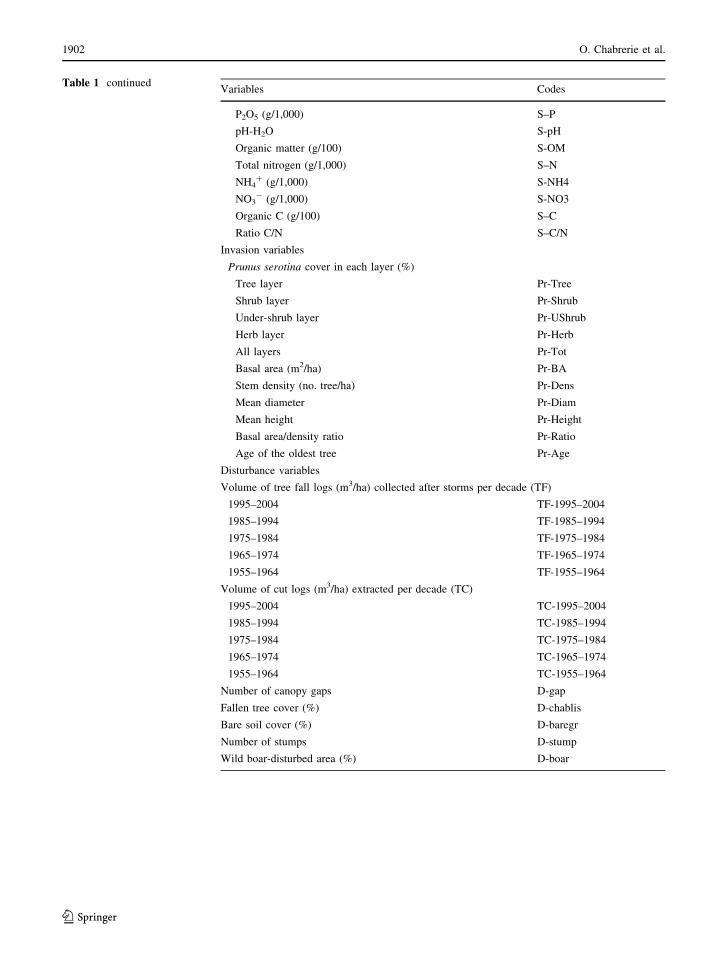
Table 1 continuedVariables Codes
P2O5 (g/1,000) S–P
pH-H2O S-pH
Organic matter (g/100) S-OM
Total nitrogen (g/1,000) S–N
NH4? (g/1,000) S-NH4
NO3- (g/1,000) S-NO3
Organic C (g/100) S–C
Ratio C/N S–C/N
Invasion variables
Prunus serotina cover in each layer (%)
Tree layer Pr-Tree
Shrub layer Pr-Shrub
Under-shrub layer Pr-UShrub
Herb layer Pr-Herb
All layers Pr-Tot
Basal area (m2/ha) Pr-BA
Stem density (no. tree/ha) Pr-Dens
Mean diameter Pr-Diam
Mean height Pr-Height
Basal area/density ratio Pr-Ratio
Age of the oldest tree Pr-Age
Disturbance variables
Volume of tree fall logs (m3/ha) collected after storms per decade (TF)
1995–2004 TF-1995–2004
1985–1994 TF-1985–1994
1975–1984 TF-1975–1984
1965–1974 TF-1965–1974
1955–1964 TF-1955–1964
Volume of cut logs (m3/ha) extracted per decade (TC)
1995–2004 TC-1995–2004
1985–1994 TC-1985–1994
1975–1984 TC-1975–1984
1965–1974 TC-1965–1974
1955–1964 TC-1955–1964
Number of canopy gaps D-gap
Fallen tree cover (%) D-chablis
Bare soil cover (%) D-baregr
Number of stumps D-stump
Wild boar-disturbed area (%) D-boar
1902 O. Chabrerie et al.
123
Appendix 2
See Table 2
Table 2 The 15 plant traits used in the study (matrix Q) and their categories
Plant trait
variables
Codes Categories Functions
Life form LF1 Therophyte Holding space and time
LF2 Hemicryptophyte
LF3 Geophyte
LF4 Chamaephyte
LF5 Climbing phanerophyte
LF6 Phanerophyte
Canopy structure CS1 Basal Competitive ability, stress
and disturbance
avoidanceCS2 Semi-basal
CS3 Leafy
CS4 Basal or semi-basal but leaves large
CS5 Leaves small, reduced to scales or spines
Canopy height at maturity CH1 Foliage less than 100 mm in height Competitive ability, plant
longevity, carbon storageCH2 101–299 mm
CH3 300–999 mm
CH4 1.0–3.0 m
CH5 3.1–4.0 m
CH6 4.1–15.0 m
CH7 Greater than 15.0 m
Lateral spread LS1 Lateral spread of exceedingly limited extent
Acquiring and duration (mainly therophytes)
Acquiring space
LS2 Perennials with compact unbranched rhizomes or
tussocks \ 100 mm in diameter
LS3 Perennials with rhizomatous systems or tussocks
attaining 100–250 mm in diameter
LS4 Perennials with diameter of 251–1,000 mm
LS5 Perennials attaining a diameter [ 1,000 mm
Climbing C1 Climbing using adhesive roots, tendrils, trailing,
coiling up
Acquiring light, plasticity,
response to disturbance
C2 Spread climbing
C3 No climbing
Leaf anatomy LA1 Succulent and scleromorphic Hygrometry, growth rate,
plasticity, stress
avoidanceLA2 Mesomorphic
LA3 Hygromorphic
LA4 Helomorphic and hydromorphic
Leaf phenology LP1 Aestival Response to disturbance,
stress and disturbance
avoidanceLP2 Hivernal
LP3 Vernal
LP4 Always evergreen
LP5 Partially evergreen
Impact of Prunus serotina invasion 1903
123
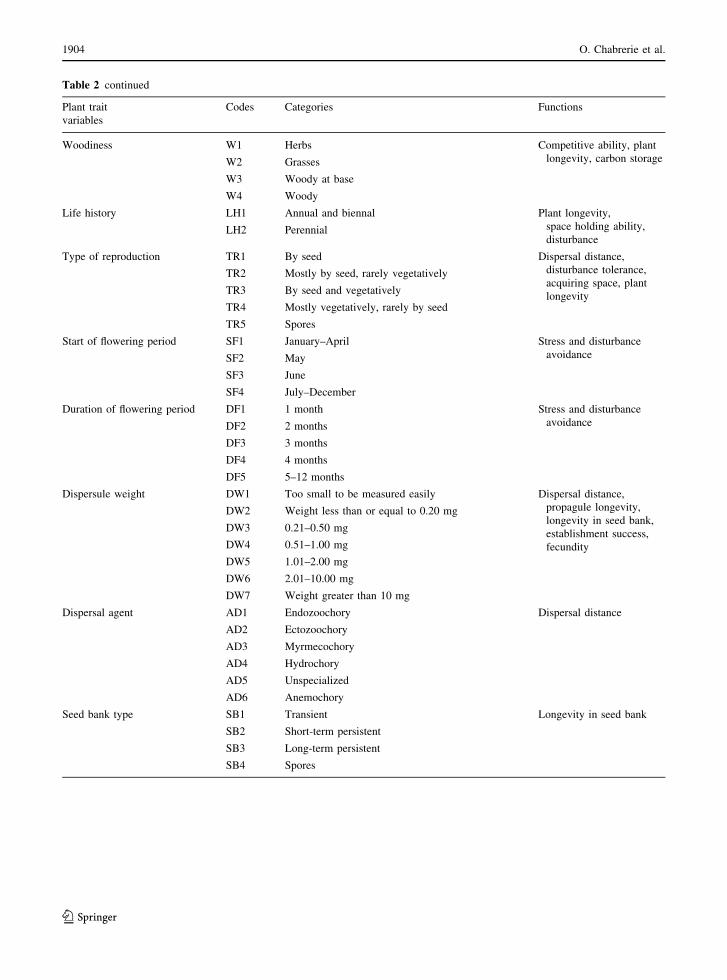
Table 2 continued
Plant trait
variables
Codes Categories Functions
Woodiness W1 Herbs Competitive ability, plant
longevity, carbon storageW2 Grasses
W3 Woody at base
W4 Woody
Life history LH1 Annual and biennal Plant longevity,
space holding ability,
disturbanceLH2 Perennial
Type of reproduction TR1 By seed Dispersal distance,
disturbance tolerance,
acquiring space, plant
longevity
TR2 Mostly by seed, rarely vegetatively
TR3 By seed and vegetatively
TR4 Mostly vegetatively, rarely by seed
TR5 Spores
Start of flowering period SF1 January–April Stress and disturbance
avoidanceSF2 May
SF3 June
SF4 July–December
Duration of flowering period DF1 1 month Stress and disturbance
avoidanceDF2 2 months
DF3 3 months
DF4 4 months
DF5 5–12 months
Dispersule weight DW1 Too small to be measured easily Dispersal distance,
propagule longevity,
longevity in seed bank,
establishment success,
fecundity
DW2 Weight less than or equal to 0.20 mg
DW3 0.21–0.50 mg
DW4 0.51–1.00 mg
DW5 1.01–2.00 mg
DW6 2.01–10.00 mg
DW7 Weight greater than 10 mg
Dispersal agent AD1 Endozoochory Dispersal distance
AD2 Ectozoochory
AD3 Myrmecochory
AD4 Hydrochory
AD5 Unspecialized
AD6 Anemochory
Seed bank type SB1 Transient Longevity in seed bank
SB2 Short-term persistent
SB3 Long-term persistent
SB4 Spores
1904 O. Chabrerie et al.
123
References
Aubert G (1978) Methodes d’analyses des sols. Centre
Regional de Documentation Pedagogique (CRDP),
Marseille
Baruch Z, Goldstein G (2004) Leaf construction cost, nutrient
concentration, and net CO2 assimilation of native and
invasive species in Hawaii. Oecologia 121:183–192
Bossuyt B, Heyn M, Hermy M (2002) Seed bank and vegeta-
tion composition across ancient-recent forest ecotones in
central Belgium. Plant Ecol 162:33–48
Botta-Dukat Z (2005) Rao’s quadratic entropy as a measure of
functional diversity based on multiple traits. J Veg Sci
16:533–540
Braun-Blanquet J (1964) Pflanzensoziologie Grunzuge der
Vegetationsgrunde. Springer, Berlin
Brown RL, Fridley JD (2003) Control of plant species diversity
and community invisibility by species immigration: seed
richness versus seed density. Oikos 102:15–24
Chabrerie O, Roulier F, Hoeblich H, Sebert-Cuvillier E,
Closset-Kopp D, Leblanc I, Jaminon J, Decocq G (2007)
Defining patch mosaic functional types to predict invasion
patterns in a forest landscape. Ecol Appl 17:464–481
Chabrerie O, Verheyen K, Saguez R, Decocq G (2008) Dis-
entangling relationships between habitat conditions, dis-
turbance history, plant diversity and American Black
cherry (Prunus serotina Ehrh.) invasion in a European
temperate forest. Divers Distrib 14:204–212
Chapin FS, Zaveleta ES, Eviner VT, Naylor RL, Vitousek PM,
Lavorel S, Reynolds HL, Hooper DU, Sala OE, Hobbie
SE, Mack MC, Dıaz S (2000) Consequences of changing
biotic diversity. Nature 405:234–242
Chesson P, Neuhauser C (2002) Intraspecific aggregation and
species coexistence. Trends Ecol Evol 17:210–211
Closset-Kopp D, Chabrerie O, Valentin B, Delachapelle H,
Decocq G (2007) When Oskar meets Alice: does a lack of
trade-off in r/K-strategies make Prunus serotina a suc-
cessful invader of European forests? For Ecol Manage
247:120–130
Cronk QCB, Fuller J (1995) Plant invaders: the threat to natural
ecosystems. Chapman & Hall, London
Crooks JA (2005) Lag times and exotic species: the ecology
and management of biological invasions in slow-motion.
Ecoscience 12:316–329
Cuddington K, Hastings A (2004) Invasive engineers. Ecol
Model 178:335–347
Dassonville N, Vanderhoeven S, Vanparys S, Hayez M, Gruber
W, Meerts P (2008) Impacts of alien invasive plants on
soil nutrients are correlated with initial site conditions in
NW Europe. Oecologia 157:131–140
Decocq G (2000) The masking effect of silviculture on sub-
strate-induced plant diversity in oak-hornbeam forests
from northern France. Biodivers Conserv 9:1467–1491
Decocq G, Hermy M (2003) Are there herbaceous dryads in
temperate deciduous forests? Acta Bot Gall 150:373–382
Decocq G, Aubert M, Dupont F, Alard D, Saguez R, Wattez-
Franger A, de Foucault B, Delelis-Dusollier A, Bardat J
(2004a) Plant diversity in a managed temperate forest:
understorey response to two silvicultural systems. J Appl
Ecol 41:1065–1079
Decocq G, Valentin B, Toussaint B, Hendoux F, Saguez R,
Bardat J (2004b) Soil seed bank composition and diversity
in a managed temperate deciduous forest. Biodivers
Conserv 13:2485–2509
Decocq G, Aubert M, Dupont F, Bardat J, Wattez-Franger A,
Saguez R, de Foucault B, Alard D, Delelis-Dusollier A
(2005) Silviculture-driven vegetation change in a Euro-
pean temperate deciduous forest. Ann For Sci 62:1–10
Dıaz S, Cabido M (1997) Plant functional types and ecosystem
function in relation to global change. J Veg Sci 8:463–474
Dıaz S, Cabido M (2001) Vive la difference: plant functional
diversity matters to ecosystem processes. Trends Ecol
Evol 16:646–655
Doledec S, Chessel D, Ter Braak CJF, Champely S (1996)
Matching species traits to environmental variables: a new
three-table ordination method. Environ Ecol Stat 3:143–
166
Donnelly JR, Shane JB (1986) Forest ecosystem responses to
artificially induced soil compaction. I. Soil physical
properties and tree diameter growth. Can J For Res
16:750–754
Dray S, Chessel D, Thioulouse J (2003) Co-inertia analysis and
the linking of ecological data tables. Ecology 84:3078–
3089
Ehrenfeld JG (2003) Effects of exotic plant invasions on soil
nutrient cycling processes. Ecosystems 6:503–523
Fargione J, Brown CS, Tilman D (2003) Community assembly
and invasion: an experimental test of neutral versus niche
processes. Proc Natl Acad Sci USA 100:8916–8920
Fridley JD, Vandermast DB, Kuppinger DM, Manthey M, Peet
RK (2007) Co-occurrence based assessment of habitat
generalists and specialists: a new approach for the mea-
surement of niche width. J Ecol 95:707–722
Godefroid S, Phartyal SS, Weyembergh G, Koedam N (2005)
Ecological factors controlling the abundance of non-
native invasive black cherry (Prunus serotina) in decid-
uous forest understory in Belgium. For Ecol Manage
210:91–105
Gower JC (1971) A general coefficient of similarity and some
of its properties. Biometrics 27:857–871
Gravel D, Canham CD, Beaudet M, Messier C (2006) Rec-
onciling niche and neutrality: the continuum hypothesis.
Ecol Lett 9:399–409
Griffis KL, Crawford JA, Wagner MR, Moir WH (2001)
Understory response to management treatments in north-
ern Arizona ponderosa pine forests. For Ecol Manage
146:239–245
Gurevitch J, Padilla DK (2004) Are invasive species a major
cause of extinctions? Trends Ecol Evol 19:470–474
Halpern CB, Spies TA (1995) Plant species diversity in natural
and managed forests of the Pacific Northwest. Ecol Appl
5:913–934
Hodgson JG, Grime JP, Hunt R, Thompson K (1995) The
electronic comparative plant ecology. Chapman & Hall,
London
Holt R (2006) Emergent neutrality. Trends Ecol Evol 21:531–
533
Kleyer M (1995) Biological traits of vascular plants—a data-
base. Arbeitsberichte Inst. f. Landschaftsplannung u.
Okologie. University of Stuttgart, DE
Impact of Prunus serotina invasion 1905
123
Klotz S, Kuhn I, Durka W (eds) (2002) BIOLFLOR—Eine
Datenbank zu biologisch-okologischen Merkmalen der
Gefaßpflanzen in Deutschland. Bundesamt fur Naturs-
chutz, Bonn
Knevel IC, Bekker RM, Bakker JP, Kleyer M (eds) (2003) The
LEDA traitbase—collecting and measuring standards of
life-history traits of the North-west European flora. Uni-
versity of Groningen, The Netherlands
Lambinon J, De Langhe J-E, Delvosalle L, Duvigneaud J
(2004) Nouvelle flore de la Belgique, du Grand-Duche de
Luxembourg, du Nord de la France et des regions voi-
sines. Patrimoine du Jardin botanique national de Belgi-
que, Meise
Lavorel S, Garnier E (2002) Predicting changes in community
composition and ecosystem functioning from plant traits:
revisiting the Holy Grail. Funct Ecol 16:545–556
Lavorel S, McIntyre S, Landsberg J, Forbes TDA (1997) Plant
functional classifications: from general groups to specific
groups based on response to disturbance. Trends Ecol
Evol 17:474–478
Lavorel S, Touzard B, Lebreton JD, Clement B (1998) Iden-
tifying functional groups for response to disturbance in an
abandoned pasture. Acta Oecol 19:227–240
Legendre P, Galzin R, Harmelin-Vivien ML (1997) Relating
behavior to habitat: solutions to the fourth-corner prob-
lem. Ecology 78:547–562
Leps J, de Bello F, Lavorel S, Berman S (2006) Quantifying
and interpreting functional diversity of natural commu-
nities: practical considerations matter. Preslia 78:481–501
Levine JM, Vila M, D’Antonio CM, Dukes JS, Grigulis K,
Lavorel S (2003) Mechanisms underlying the impacts of
exotic plant invasions. Proc R Soc Lond B Biol Sci
270:775–781
Lorenz K, Preston CM, Krumrei S, Feger K-H (2004)
Decomposition of needle/leaf litter from Scots pine, black
cherry, common oak and European beech at a conurbation
forest site. Eur J Forest Res 123:177–188
MacDougall AS, Turkington R (2005) Are exotic species the
drivers or passengers of ecological change in highly dis-
turbed plant communities? Ecology 86:42–55
Mack MC, D’Antonio CM (1998) Impacts of biological inva-
sions on disturbance regimes. Trends Ecol Evol 13:195–198
Marrs RH, Watt AS (2006) Biological flora of the British Isles:
Pteridium aquilinum (L.) Kuhn. J Ecol 94:1272–1321
Mason NWH, MacGillivray K, Steel JB, Wilson JB (2003) An
index of functional diversity. J Veg Sci 14:571–578
Naumburg E, DeWald LE (1999) Relationships between Pinusponderosa forest structure, light characteristics, and
understory graminoid species presence and abundance.
For Ecol Manage 124:205–215
Ortega YK, Pearson DE (2005) Weak versus strong invaders of
natural plant communities: assessing invasibility and
impact. Ecol Appl 15:651–661
Packham JR, Harding DJL, Hilton GM, Stuttard RA (1992)
Functional ecology of woodlands and forests. Chapman &
Hall, London
Parker IM, Simberloff D, Lonsdale WM, Goodell K, Wonham
M, Kareiva PM, Williamson MH, Von Holle B, Moyle
PB, Byers JE, Goldwasser L (1999) Impact: toward a
framework for understanding the ecological effects of
invaders. Biol Invas 1:3–19
Poschlod P, Kleyer M, Jackel A-K, Dannemann A, Tackenberg
O (2003) BIOPOP—a database of plant traits and internet
application for nature conservation. Folia Geobot 38:263–
271
Provost M (1998) Flore vasculaire de Basse-Normandie.
Presses Universitaires de Caen, Caen
Rameau J-C, Mansion D, Dume G (1989) Flore forestiere
francaise. Guide ecologique illustre. Institut pour le
Developpement Forestier, Paris
Reinhart KO, Packer A, van der Putten WH, Clay K (2003)
Plant-soil biota interactions and spatial distribution of
black cherry in its native and invasive ranges. Ecol Lett
6:1046–1050
Reisinger TW, Simmons GL, Pope PE (1988) The impact of
timber harvesting on soil properties and seedling growth
in the South. South J Appl For 12:58–67
Ribera I, Doledec S, Downie IS, Foster GN (2001) Effect of
land disturbance and stress on species traits of ground
beetle assemblages. Ecology 82:1112–1129
Roberts MR, Zhu L (2002) Early response of the herbaceous
layer to harvesting in a mixed coniferous-deciduous forest
in New Brunswick, Canada. For Ecol Manage 155:17–31
Rosenzweig ML (1987) Habitat selection as a source of bio-logical diversity. Evol Ecol 1:315–330
Sax DF, Gaines SD (2003) Species diversity: from global
decreases to local increases. Trends Ecol Evol 18:561–566
Seabloom EW, Harpole WS, Reichman OJ, Tilman D (2003)
Invasion, competitive dominance, and resource use by
exotic and native California grassland species. Proc Natl
Acad Sci USA 100:13384–13389
Simberloff D, Dayan T (1991) Guilds and the structure of
ecological communities. Annu Rev Ecol Syst 22:115–143
Starfinger U (1997) Introduction and naturalization of Prunusserotina in central Europe. In: Brock JH, Wade M, Pysek
P, Green D (eds) Plant invasions: studies from North
America and Europe. Backhuys, Leiden, pp 161–171
Starfinger U, Kowarik I, Rode M, Schepker H (2003) From
desirable ornamental plant to pest to accepted addition to
the flora? The perception of an alien plant species through
the centuries. Biol Inv 5:323–335
Stearns SC (1989) Trade-offs in life-history evolution. Funct
Ecol 3:259–268
Stevens MHH, Bunker DE, Schnitzer SA, Carson WP (2004)
Establishment limitation reduces species recruitment and
species richness as soil resources rise. J Ecol 92:339–347
Strayer DL, Eviner VT, Jeschke JM, Pace ML (2006) Under-
standing the long-term effects of species invasions.
Trends Ecol Evol 21:645–651
Sydes C, Grime JP (1981) Effects of tree leaf litter on herba-
ceous vegetation in deciduous woodland. II. Experimental
investigation. J Ecol 69:249–262
Thioulouse J, Chessel D, Doledec S, Olivier JM (1997) ADE-4:
a multivariate analysis and graphical display software.
Stat Comput 7:75–83
Thomas SC, Halpern CB, Falk DA, Liguori DA, Austin KA
(1999) Plant diversity in managed forests: understory
responses to thinning and fertilization. Ecol Appl 9:864–
879
Thompson K, Bakker JP, Bekker RM (eds) (1997) The soil
seed bank of North West Europe. Methodology, density
and longevity. Cambridge University Press, Cambridge
1906 O. Chabrerie et al.
123
Tilman D (2004) Niche tradeoffs, neutrality, and community
structure: a stochastic theory of resource competition,
invasion, and community assembly. Proc Natl Acad Sci
USA 101:10854–10861
Verheyen K, Vanhellemont M, Stock T, Hermy M (2007)
Predicting patterns of invasion by Prunus serotina Ehrh.
in Flanders (Belgium) and its impact on the forest
understory community. Divers Distrib 13:487–497
Violle C, Navas M-L, Vile D, Kazakou E, Fortunel C, Hummel
I, Garnier E (2007) Let the concept of trait be functional!
Oikos 116:882–892
Weiher E, Van der Werf A, Thompson K, Roderick M, Garnier
E, Eriksson O (1999) Challenging Theophrastus: a com-
mon core list of plant traits for functional ecology. J Veg
Sci 10:609–620
Yurkonis KA, Meiners S, Wachholder BE (2005) Invasion
impacts diversity through altered community dynamics.
J Ecol 93:1053–1061
Impact of Prunus serotina invasion 1907
123