IMPACT EVALUATION REPORT ON INTERVENTIONS ... - ILO
253
IMPACT EVALUATION REPORT ON INTERVENTIONS ON STARTING-UP SMALL ENTERPRISES AND REINTEGRATION OF CHILDREN TO SCHOOL OF THE PROJECT “ELIMINATING CHILD LABOUR IN EL SALVADOR THROUGH ECONOMIC EMPOWERMENT AND SOCIAL INCLUSION” INTERNATIONAL LABOUR ORGANIZATION (ILO)
-
Upload
khangminh22 -
Category
Documents
-
view
1 -
download
0
Transcript of IMPACT EVALUATION REPORT ON INTERVENTIONS ... - ILO

IMPACT EVALUATION REPORT ON
INTERVENTIONS ON STARTING-UP SMALL ENTERPRISES AND REINTEGRATION OF CHILDREN TO SCHOOL OF THE
PROJECT “ELIMINATING CHILD LABOUR IN EL SALVADOR THROUGH ECONOMIC
EMPOWERMENT AND SOCIAL INCLUSION”
INTERNATIONAL LABOUR ORGANIZATION (ILO)

Copyright © International Labour Organization 2017
First published 2017
Publications of the International Labour Office enjoy copyright under Protocol 2 of the Universal Copyright Convention.
Nevertheless, short excerpts from them may be reproduced without authorization, on condition that the source is indicated.
For rights of reproduction or translation, application should be made to ILO Publications (Rights and Licensing), International
Labour Office, CH-1211 Geneva 22, Switzerland, or by email: [email protected]. The International Labour Office welcomes such
applications.
Libraries, institutions and other users registered with a reproduction rights organization may make copies in accordance with
the licences issued to them for this purpose. Visit www.ifrro.org to find the reproduction rights organization in your country.
ISBN:
The designations employed in ILO publications, which are in conformity with United Nations practice, and the presentation of
material therein do not imply the expression of any opinion whatsoever on the part of the International Labour Office concerning
the legal status of any country, area or territory or of its authorities, or concerning the delimitation of its frontiers.
The responsibility for opinions expressed in signed articles, studies and other contributions rests solely with their authors, and
publication does not constitute an endorsement by the International Labour Office of the opinions expressed in them.
Reference to names of firms and commercial products and processes does not imply their endorsement by the International
Labour Office, and any failure to mention a particular firm, commercial product or process is not a sign of disapproval.
ILO publications and digital products can be obtained through major booksellers and digital distribution platforms, or ordered
directly from [email protected]. For more information, visit our website: www.ilo.org/publns or contact [email protected].
Cover photo credits: ©Jonathan Levinson/IRIN
Design by the International Training Centre of the ILO, Turin – Italy
Acknowledgements

iii
TABLE OF CONTENTS
1. Introduction 1
2. Child labour in El Salvador 3
3. Project description 5
Overall project 5
Interventions selected for the impact evaluation 7
Theory of change 7
4. Evaluating the impact of the household level interventions 11
Selection of the communities and beneficiaries 11
Evaluation strategy 13
5. Project implementation 15
Intervention take-up 15
Interventions provided 15
Timing 176
6. Data collection 19
7. Sample attrition 21
8. Methodology 27
9. Results 31
Impact on households 32Adult labour market outcomes 32
Household income and expenditures 34
Household decision-making 35
Impact on children 37Children’s education and work 37
Parent’s attitudes 41

iv
IMPACT EVALUATION REPORT ONinterventions on starting-up small enterprises and reintegration of children to school of the Project “Eliminating Child Labour in El Salvador through Economic Empowerment and Social Inclusion”
10. Conclusions 45
11. References 47
12. Annexes 49
Annex 1. Variable discontinuity: Scatter plots 49
Annex 2. Estimates of the effect of interventions: scatter plots 54
Annex 3. RD Estimates of the effect of interventions: Full results 57
Annex 4. Impact evaluation design 71
Annex 5. Baseline suvey report 98
Annex 6. Interim report on follow-up survey (Spanish) 127
Annex 7. Follow-up survey household questionnaire 210
List of tablesTable 1. Follow-up survey, children's employment and child labour, full sample of
children aged 5-17 years 4
Table 2. Basic information on selected municipalities 12
Table 3. Program take-up among selected beneficiaries 15
Table 4. Distribution of intention-to-treat and control households by municipality, baseline and follow-up survey 21
Table 5. Estimated discontinuities of the probability of being re-interviewed at the follow-up survey 22
Table 6. Estimated discontinuities in baseline covariates at the threshold in the wealth index: households interviewed in follow-up survey 24
Table 7. Estimated discontinuities in baseline outcome variables at the threshold in the wealth index: members of households interviewed in follow-up survey 25
Table 8. Variable definitions 31
Table 9. Impact on adult female labour market outcomes 33
Table 10. Impact on adult male labour market outcomes 33
Table 11. Female labour income, household adult labour income per capita and household expenditure per capita 34
Table 12. RD estimates of the effects of interventions on women decision-making within household 36
Table 13. RD estimates of the effects of interventions on children’s school attendance, regularity of school attendance and school expenditures, children aged 5-15 years in the baseline survey 37
Table 14. Comparison of attendance from school survey and self-reported school attendance, children aged 5-17 in the follow-up survey 38
Table 15. RD estimates of the effects of interventions on children’s involvement in employment and household chores, children aged 5-15 years in the baseline survey 39

v
Table of contents
Table 16. RD estimates of the effects of interventions on child time use, children aged 5-15 years in the baseline survey 40
Table 17. RD estimates of the effects of interventions on child involvement in own or house-hold business, working hours, work in hazardous conditions and child labour, children aged 5-15 years in the baseline survey 41
Table 18. RD estimates of the effects of interventions on the attitudes of the household head towards children’s employment 42
Table 19. RD estimates of the effects of interventions on the attitudes of the household head towards children’s schooling 43
Table A1. RD Estimates of the effect of interventions on child outcome variables, children aged 5-15 in the baseline survey 57
Table A2. RD Estimates of the effect of interventions on child outcome variables, children aged 7-15 in the follow-up survey 56
Table A3. RD Estimates of the effect of interventions on child outcome variables, children aged 5-15 years in the baseline survey 61
Table A4. RD Estimates of the effect of interventions on child outcome variables, children aged 7-15 in the follow-up survey 64
Table A5. RD Estimates of the effect of interventions on employment of eligible females and adult males from eligible households 65
Table A6. RD Estimates of the effect of interventions on the attitudes of the household head towards children's employment and schooling 66
Table A7. RD Estimates of the effect of interventions on employment of eligible females and adult males from eligible households 67
Table A8. RD Estimates of the effect of interventions on the attitudes of the household head towards children's employment and schooling 69
List of figuresFigure 1. Percentage of children in child labour, 5-17 years age range, 2001, 2007 and 2013 3
Figure 2. Strategic framework for the project “Eliminating Child Labour in El Salvador through Economic Empowerment and Social Inclusion” 6
Figure 3. Theory of change 9
Figure 4. Frequency distribution of treated households by specific intervention received 16
Figure 5. Number of households treated by year 17
Figure 6. Probability that household is interviewed in the follow-up survey 22
Figure 7. Density of the wealth index 23
Figure 8. AIC comparison for estimations of equation (1) for the preferred cross-validation criterion and with different orders of polynomial 28
Figure A1. Household level wealth indicators 49
Figure A2. Outcome variables: eligible women 51
Figure A3. Outcome variables children: aged 5-17 years 52
Figure A4. Impact of interventions: children aged 5-15 years at the time of the baseline survey 54
Figure A5. Impact of interventions: eligible females 56

2SLS Two-Stage least squares regression
AIC Akaike information criterion
CVC cross-validation criterion
DEICO Desarrollo, Investigación y Consultoría S.A. de C.V.
EHPM Encuesta Nacional de Hogares de Propósitos Múltiples
ILO International Labour Organization
IPEC International Programme for the Eradication of Child Labour
ITT intent-to-treat effect
OLS Ordinary Least Squares regression
RD Regression Discontinuity
TOT treatment-on-the treated effect
UCW Understanding Children's Work Programme
USDOL United States Department of Labor
LIST OF ACRONYMS AND ABBREVIATIONS:
vi
vii
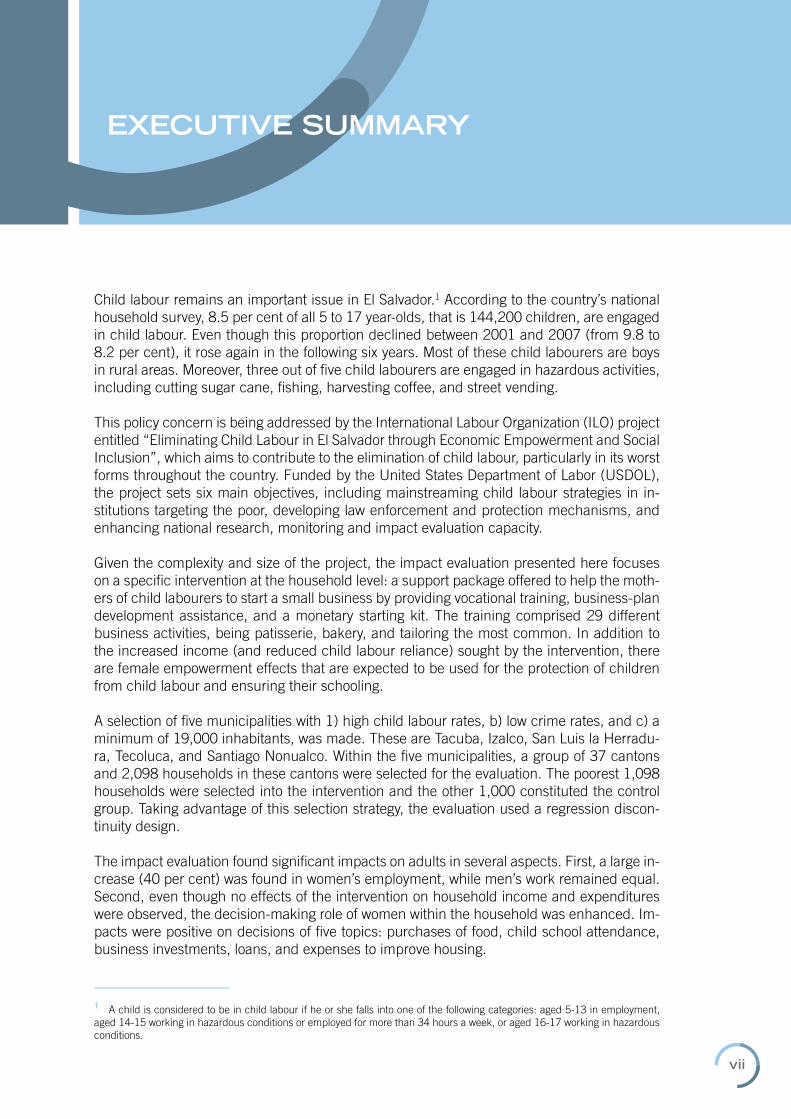
EXECUTIVE SUMMARY
Child labour remains an important issue in El Salvador.1 According to the country’s national household survey, 8.5 per cent of all 5 to 17 year-olds, that is 144,200 children, are engaged in child labour. Even though this proportion declined between 2001 and 2007 (from 9.8 to 8.2 per cent), it rose again in the following six years. Most of these child labourers are boys in rural areas. Moreover, three out of five child labourers are engaged in hazardous activities, including cutting sugar cane, fishing, harvesting coffee, and street vending.
This policy concern is being addressed by the International Labour Organization (ILO) project entitled “Eliminating Child Labour in El Salvador through Economic Empowerment and Social Inclusion”, which aims to contribute to the elimination of child labour, particularly in its worst forms throughout the country. Funded by the United States Department of Labor (USDOL), the project sets six main objectives, including mainstreaming child labour strategies in in-stitutions targeting the poor, developing law enforcement and protection mechanisms, and enhancing national research, monitoring and impact evaluation capacity.
Given the complexity and size of the project, the impact evaluation presented here focuses on a specific intervention at the household level: a support package offered to help the moth-ers of child labourers to start a small business by providing vocational training, business-plan development assistance, and a monetary starting kit. The training comprised 29 different business activities, being patisserie, bakery, and tailoring the most common. In addition to the increased income (and reduced child labour reliance) sought by the intervention, there are female empowerment effects that are expected to be used for the protection of children from child labour and ensuring their schooling.
A selection of five municipalities with 1) high child labour rates, b) low crime rates, and c) a minimum of 19,000 inhabitants, was made. These are Tacuba, Izalco, San Luis la Herradu-ra, Tecoluca, and Santiago Nonualco. Within the five municipalities, a group of 37 cantons and 2,098 households in these cantons were selected for the evaluation. The poorest 1,098 households were selected into the intervention and the other 1,000 constituted the control group. Taking advantage of this selection strategy, the evaluation used a regression discon-tinuity design.
The impact evaluation found significant impacts on adults in several aspects. First, a large in-crease (40 per cent) was found in women’s employment, while men’s work remained equal. Second, even though no effects of the intervention on household income and expenditures were observed, the decision-making role of women within the household was enhanced. Im-pacts were positive on decisions of five topics: purchases of food, child school attendance, business investments, loans, and expenses to improve housing.
1 A child is considered to be in child labour if he or she falls into one of the following categories: aged 5-13 in employment, aged 14-15 working in hazardous conditions or employed for more than 34 hours a week, or aged 16-17 working in hazardous conditions.
viii
IMPACT EVALUATION REPORT ONinterventions on starting-up small enterprises and reintegration of children to school of the Project “Eliminating Child Labour in El Salvador through Economic Empowerment and Social Inclusion”
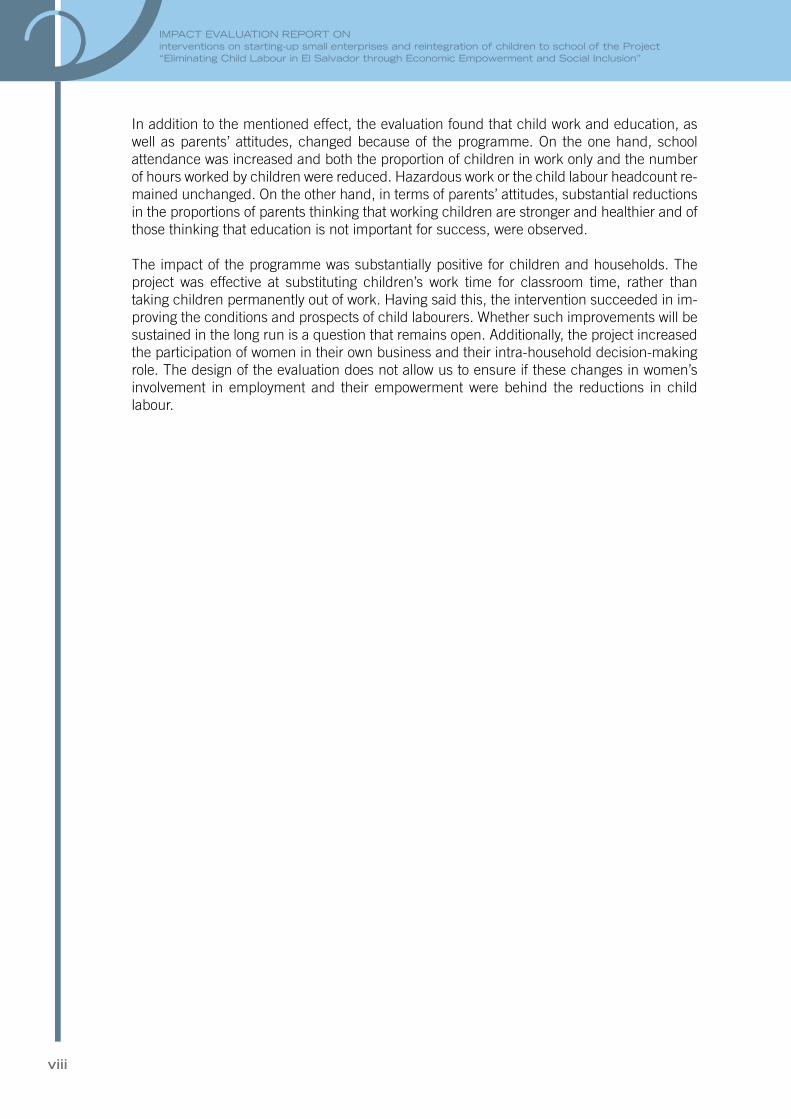
In addition to the mentioned effect, the evaluation found that child work and education, as well as parents’ attitudes, changed because of the programme. On the one hand, school attendance was increased and both the proportion of children in work only and the number of hours worked by children were reduced. Hazardous work or the child labour headcount re-mained unchanged. On the other hand, in terms of parents’ attitudes, substantial reductions in the proportions of parents thinking that working children are stronger and healthier and of those thinking that education is not important for success, were observed.
The impact of the programme was substantially positive for children and households. The project was effective at substituting children’s work time for classroom time, rather than taking children permanently out of work. Having said this, the intervention succeeded in im-proving the conditions and prospects of child labourers. Whether such improvements will be sustained in the long run is a question that remains open. Additionally, the project increased the participation of women in their own business and their intra-household decision-making role. The design of the evaluation does not allow us to ensure if these changes in women’s involvement in employment and their empowerment were behind the reductions in child labour.

1
The ILO project entitled “Eliminating Child Labour in El Salvador through Economic Empowerment and Social Inclusion” aimed at helping to eradicate child labour in El Salvador. The project supported a wide range of interventions at three levels: macro (national policies and institutional framework), meso (target municipalities and schools) and micro (child labourers’ households).
A set of household-level interventions (International Programme for the Eradication of Child Labour), implemented in five municipalities in El Salvador, is the object of the impact evaluation discussed here. The impact evaluation is one of the first to identify the causal effect of an IPEC project using a quasi-experimental approach with a valid counterfactual.
As described in more detail below, the targeted set of interventions consisted of providing support to mothers of child labourers to start a small enterprise as well as of “flexible education interventions” to help their children return to school at the appropriate level in case they have dropped out.
Similar sets of household-level livelihood and social mobility interventions can be found in other IP-EC-supported country-level projects and United States Department of Labour (USDOL) programmes in a number of countries. By identifying the causal effect of this set of interventions, therefore, the impact evaluation provides a unique insight into the functioning and effectiveness of an important dimension of IPEC’s and USDOL’s broader approach to addressing child labour.
In April 2012, in collaboration with the ILO El Salvador, drafted an impact evaluation design (UCW, 2012; attached as Annex 4 to this Report). As part of this design, UCW proposed to allocate the set of interventions to eligible households on the basis of a wealth index. This procedure ensures a fair distri-bution of the interventions to those households who are most in need. At the same time, as explained by UCW (2012), this allocation procedure can be exploited in a regression discontinuity framework to identify the causal effect of the set of interventions on outcomes of interest, such as education, child labour, participation in work of adult household members, and multiple other wellbeing indicators.
The International Labour Organization (ILO) conducted a baseline survey in the five municipalities in April and May of 2012. Subsequently, UCW (again in collaboration with the ILO in El Salvador) used these data to generate the wealth index utilized to assign the intervention. This process is described in more detail in the baseline survey report released in 2013 (UCW, 2013a; attached as Annex 5 to this Report). The follow-up survey was undertaken in July and August of 2015.
The current Report discusses the results of the follow-up survey and of the impact evaluation more broadly. It is structured as follows. Following this introduction, Section 2 provides a brief background overview of the child labour situation in El Salvador and how it has changed over time. Section 3 briefly discusses the project at large, the interventions selected for the impact evaluation and the underlying theory of change. Section 4 explains the selection process and the evaluation strategy. Section 5 looks at project implementation, specifically at intervention take-up, services provided, and the timing of imple-
1. INTRODUCTION

2
IMPACT EVALUATION REPORT ONinterventions on starting-up small enterprises and reintegration of children to school of the Project “Eliminating Child Labour in El Salvador through Economic Empowerment and Social Inclusion”
mentation. Section 6 describes data collection and Section 7 addresses the issue of sample at-trition between the baseline and follow-up surveys. Section 8 describes the methodology for the impact evaluation. Section 9 discusses the results and Section 10 presents the conclusions.

3
2. CHILD LABOUR IN EL SALVADOR
Figure 1. Percentage of children in child labour, 5-17 years age range, 2001, 2007 and 2013
Source: UCW calculations based on El Salvador Encuesta Nacional de Hogares de Propósitos Múltiples, 2001, 2007, and 2013.
Official surveys show that child labour in El Salvador have declined in the last years but it is still a pressing issue. Estimates based on the 2013 Encuesta Nacional de Hogares de Propósitos Múltiples (EHPM, 2013) show that 8.5% of all 5-17 year-olds, 144 200 children in absolute terms, are engaged in child labour. By age range, child labour affects almost six percent of children aged 5-14 years and 16% of adolescents aged 15-17 years. A comparison between estimates based on the 2001 and 2007 rounds of the same survey suggests that progress against child labour over the last 12 years has been limited and uneven. As illustrated in Figure 1, there was a decline from 9.8% in 2001 to 8.5% in 2013, but this overall decline masked a slight rise in child labour from 2007 to 2013.
The child labour population in El Salvador is male-dominated and concentrated in rural locations. The share of boys in total child labourers (13%) is more than three times that of girls (4%), while child labour incidence in rural areas (12%) is more than twice as high as incidence in urban areas. Over half of all working children are found in the agriculture sector; the commerce and services sectors ac-

4
IMPACT EVALUATION REPORT ONinterventions on starting-up small enterprises and reintegration of children to school of the Project “Eliminating Child Labour in El Salvador through Economic Empowerment and Social Inclusion”
count for most of the remainder. The majority of children’s jobs are characterised by informal, non-remunerated work arrangements, and are typically undertaken within the family unit.
Much of the work performed by children is hazardous in nature, adding to the urgency of elimination efforts. For the 5-14 age group, three out of five child labourers are found in haz-ardous sectors / occupations or are working excessive hours. Examples of work in which dan-gers are encountered include cutting of sugar cane, fishing (particularly mollusc extraction), harvesting coffee and street vending. Excessive hours, heavy loads, and a lack of protective gear are among the aggravating factors. Additional forms of hazardous labour in which a lesser number of children are involved include recycling of garbage, fireworks production, and domestic work in third-party households.
Table 1 reports the incidence of children’s employment and child labour for the full sample (i.e. for both the treatment and control group) of households considered in this study. As it is easy to see, the incidence of child labour in the targeted households is much higher than the national average.
Table 1. Follow-up survey, children's employment and child labour, full sample of children aged 5-17 years
FREQUENCY PERCENT
Employment 658 21.4
Child labour 622 20.3
Total 3,081
5
�Overall project The ILO project entitled “Eliminating Child Labour in El Salvador through Economic Empowerment and Social Inclusion” attempts to eradicate child labour in El Salvador. To achieve this goal, the project set the following six objectives:
1. By the end of the project, child labour elimination strategies will have been adopted by national and local institutions that implement poverty reduction, decent work, and social protection pro-grammes for the rural and urban poor;
2. By the end of the project, child labour law enforcement and protection mechanisms, particularly for the worst forms of child labour, will be developed and fully operational;
3. By the end of the project, national capacity to conduct child labour research, monitoring, and im-pact evaluation will be enhanced and pilot interventions documented;
4. By the end of the project, municipal capacity to prevent and eliminate child labour, in particular the worst forms, will have been strengthened;
5. By the end of the project, viable improved livelihood alternatives will have been implemented to reduce family reliance on child labour in target municipalities; and
6. By the end of the project, inclusive education models will have been implemented in selected schools of target municipalities to prevent and reduce child labour and improve education indica-tors.
Figure 2 provides a bird’s eye view of the project’s strategic framework and of how the project’s six strategic objectives tie in with El Salvador’s wider national strategic agenda to eradicate child labour. As shown, the project involves support to a large number of outcomes and associated interventions in order to achieve the six strategic objectives. Some of these interventions are implemented at the national level, some in selected municipalities, some in selected schools, and some are targeted at selected households.
3. PROJECT DESCRIPTION

6
IMPACT EVALUATION REPORT ONinterventions on starting-up small enterprises and reintegration of children to school of the Project “Eliminating Child Labour in El Salvador through Economic Empowerment and Social Inclusion”
Figure 2. Strategic framework for the project “Eliminating Child Labour in El Salvador through Economic Empowerment and Social Inclusion”
Source: UCW calculations based on El Salvador Encuesta Nacional de Hogares de Propositòs Múltiples, 2001, 2007, and 2013.

7
3. Project description
�Interventions selected for the impact evaluationGiven the complexity of the project and its multilevel structure, it was decided to limit the focus of the impact evaluation to a subset of interventions at the household level, selected in consultation with the Government of El Salvador and the US Department of Labor. This set consisted of the following two components:
1. A support package offered to help the mothers of child labourers start a small enterprise. This support consists of three steps: vocational training of choice;1 business training and preparation of a business plan; and a starting kit based on the needs identified in the business plan to kick-start the enterprise (value between US$ 100 and US$ 300).
2. If the children living in the households of the eligible women were not attending school according to the baseline information, then they are offered training to help them enter school at the appropriate level for their age. Children are invited to participate in this in-tervention by means of a sensitization campaign.2
However, as discussed below, only a minority of children took up the second component and, therefore, the impact we attempt to measure here is mainly relative to the support package for mothers.
Similar sets of livelihood and social mobility interventions can be found in other IPEC coun-try-level projects and USDOL programmes in a number of countries, and therefore their impact on child labour is also of broader interest.
�Theory of changeBroadly speaking, the program considered here belongs to a set of interventions that aim to increase productive employment opportunities for the rural poor in low- and lower mid-dle-income countries, and are widely implemented around the world (Cho and Honorati, 2014; Banerjee et al., 2015). These programs typically address household capital or skills constraints that can limit the possibility of poor households to cover setup costs and develop potentially profitable farm and non-farm economic activities (Eswaran and Kotwal, 1986). Some programs are targeted explicitly to women, as women are more likely than men to face obstacles in accessing credit and labour markets. In the case of the program considered here, the anticipated improvement in the livelihood of the household is also expected to have a positive effect on the investment in children’s human capital.
As discussed in De Hoop and Rosati (2013), on which this section draws, evidence of the impact of providing physical capital and skills training on children’s time use is scarce and results are varied. Banerjee et al. (2011) find limited effects of the Indian THP (Targeting the Hard-core Poor) program on children’s school attendance and labour supply. Bandiera et al. (2013), however, find that a similar program in Bangladesh increased children's work in self-employment. Karlan and Valdivia (2011) find that business training in Peru lowered
1 In each canton a limited number of vocational training courses is offered in areas such as baking bread, sewing clothes and others. The courses on offer are determined on the basis of an analysis of the local labour market.
2 Out of school children are not obliged to participate and the mother’s participation in the vocational training does not depend on the participation of the child.

8
IMPACT EVALUATION REPORT ONinterventions on starting-up small enterprises and reintegration of children to school of the Project “Eliminating Child Labour in El Salvador through Economic Empowerment and Social Inclusion”
children's participation in work and increased their participation in school, although these effects are not statistically significant.
Del Carpio and Loayza (2012) study the effects of a conditional cash transfer program com-plemented with a productive investment grant in Nicaragua. Their study focuses on a dif-ferent program than the one we analyse in this paper, as well as on a different (although not very dissimilar) region. The authors show that the intervention contributed to reducing overall child participation in household chores and agricultural work, but increased child participa-tion in commerce and retail. This is consistent with results in Del Carpio and Macours (2010) on the same intervention, which indicate that the productive investment grant added to a cash transfer reinforced existing specialization in non-agricultural activities and domestic work for girls, but that overall child labour did not decrease.
Most recently, De Hoop and Rosati (2015) analysed the impact on education and child labour of a program aimed at increasing women economic participation in Nicaragua. The results point to the importance of women’s empowerment in determining the impact of the program on child labour and children’s schooling.
The project considered here should result in new economic opportunities for participating women, influencing, in turn, decisions concerning children’s work and schooling through three basic channels.
First, the increased income available to the household through women’s new economic op-portunities should make the households less reliant on the income and productivity of their child members, and leave them in a better position to afford the direct and indirect costs of their children’s schooling.
The second channel relates to women’s empowerment. The new income opportunities re-sulting from the training and start-up support are likely to increase women’s control of house-hold resources and their bargaining power within the household. Insofar as women attribute more importance than men to children’s education, the increased women empowerment generated by the project should contribute to the reduction of child labour and the increase of school attendance.
The third channel relates to the impact of expanded household business activities in possibly increasing children’s work: household business activities may increase children’s produc-tivity in economic activities or lead to children substituting adults in performing household chores. As long as capital and children’s work are gross substitutes, the increased economic activity at the household level is likely to increase the household benefits of children’s work or of children’s performance of household chores instead of adults.
This third impact channel could limit or counterbalance the positive effects of the project on child labour and education. We cannot, therefore, discount a priori the possibility that new production opportunities will also create new work opportunities for children.
However, as the female beneficiaries are drawn from poorest households, where the income effect of new productive opportunities is likely to be greatest, it is reasonable to think that the net impact of the project will be a reduction in child labour and an increase in schooling. The positive change will be supported by training to out-of-school children aimed at facilitating their school (re)entry. The theory of change is depicted in very basic terms in Figure 3 below.

9
3. Project description
Figure 3. Theory of change
Inco
me e
ffect
s stem
ming
from
star
t-up
activ
ities m
ade p
ossib
le by
train
ing
and s
tart-u
p kits
.
Subs
titutio
n effe
cts ste
mming
from
ex
pand
ed ho
useh
old pr
oduc
tive
activ
ities .
New
oppo
rtunit
ies ar
e cre
ated f
or
child
ren’s
labo
ur as
a re
sult o
f exp
ande
d ho
useh
old pr
oduc
tive a
ctivit
ies .
Grea
ter in
come
secu
rity m
akes
ho
useh
old le
ss re
liant
on in
come
or
prod
uctiv
ity of
child
ren’s
labo
ur an
d be
tter a
ble to
affor
d the
inve
stmen
t in
their s
choo
ling.
Scho
ol (re
)entr
y fur
ther
facilit
ated b
y tra
ining
for o
ut-of-
scho
ol ch
ildre
n.
Ince
ntive
s cre
ated
favo
urin
g ch
ildre
n’s s
choo
ling
as
oppo
sed
to th
eir
invo
lvem
ent i
n wo
rk.
Ince
ntive
s cre
ated
favou
ring
child
ren’s
invo
lveme
nt in
work
as op
pose
d to t
heir
scho
oling
.
Fem
ale em
powe
rmen
t effe
cts
stemm
ing fr
om w
omen
’s gr
eater
co
ntrol
of ho
useh
old re
sour
ces a
nd
grea
ter ba
rgain
ing po
wer w
ithin
the
hous
ehold
.
Wom
en us
e the
ir gre
ater c
ontro
l of
reso
urce
s and
grea
ter ba
rgain
ing po
wer
to pr
otect
their c
hildr
en fr
om ch
ild
labou
r and
to en
sure
their
scho
oling
.
Elig
ible
mot
hers
are p
rovid
ed th
e vo
catio
nal t
rain
ing
of ch
oice
.
Elig
ible
mot
hers
are p
rovid
ed w
ith b
usin
ess
train
ing
and
star
t up
kits b
ased
on
the
need
s ide
ntifi
ed in
their
bus
ines
s pl
ans.
Out-o
f-sch
ool c
hild
ren
of el
igib
le m
othe
rs ar
e pro
vided
train
ing
to h
elp th
em
(re)e
nter
scho
ol at
the a
ppro
priat
e lev
el
for t
heir
age.
DR
IVER
S O
F C
HA
NG
EPR
OJE
CT
OU
TPU
TSIM
PAC
TS


11
�Selection of the communities and beneficiariesThe project team started by selecting a group of 10 municipalities to participate in the interventions. In order to select these municipalities, the project team first produced a shortlist. To appear on the shortlist, municipalities had to:
� Have a high child labour rate. In order to determine child labour rates, the project team used the 2009 school census which contains information on participation in employment for all children attending school (either basic education, “bachillerato general” or “bachillerato técnico”).3 Municipalities in which the involvement in employment among children in school exceeded 6.2% were considered to be municipalities with a high child labour rate.
� Be reasonably safe to ensure that it is possible to implement the necessary fieldwork. Municipalities were considered to be safe if they had a homicide and extortion rate of 128 per 100,000 inhabitants or lower according to the national police.
� Have more than 19,000 inhabitants to make certain that an overall target of 5,000 households with child labourers could be reached by all household level interventions.
A shortlist of 21 municipalities resulted from the application of these criteria, from which a total of five municipalities (i.e., Izalco, San Luis Herradura, Santiago Nonualco, Tacuba, Tecoluca) within reason-able geographic proximity of each other was eventually selected by the project team for participation in the interventions that were the subject of the current impact evaluation.
In order to ensure that the impact evaluation did not capture the effects of other interventions included in the overall project, only the interventions that were the focus of the impact evaluation were imple-mented in the selected 10 municipalities.
Table 2 provides an overview of the children’s involvement in employment, total population and the crime rate (homicide and extortion per 100,000 inhabitants) in the five municipalities.
3 Basic education in El Salvador consists of 9 years of education divided into three cycles of 3 years each. Pupils are supposed to enter basic education when they are 6 years old and finish when they are 15 years old. Basic education is followed by a 2 year “bachillerato” degree.
4. EVALUATING THE IMPACT OF THE HOUSEHOLD LEVEL INTERVENTIONS

12
IMPACT EVALUATION REPORT ONinterventions on starting-up small enterprises and reintegration of children to school of the Project “Eliminating Child Labour in El Salvador through Economic Empowerment and Social Inclusion”
Table 2. Basic information on selected municipalities
MUNICIPALITY URBAN OR RURAL
CHILDREN’S EMPLOYMENT
(%)(a)
POPULATION(b) CRIMERATE(c)
Tacuba Rural 15.4 30,718 68
Izalco Urban 8.4 74,085 115
San Luis la Herradura
Rural 7.9 21,388 122
Tecoluca Rural 7.9 25,344 55
Santiago Nonualco Rural 6.3 41,287 63
Notes: (a) Children’s employment is the percentage of working children identified in the 2010 school census; (b) Population estimates based on 2007 population census; and (c) Crime rates (homicide and extortion per 100,000) based on 2010 national police statistics.
Within each of the selected municipalities, a group of cantons was selected into the project. The selection of cantons took place on the basis of the information available from the 2010 school census and the 2007 population census. Cantons were selected if they had high numbers of child labourers according to the school census and had high child labour ratios.4 However, explicit thresholds for the selection cantons were not established. In total, the pro-ject team selected 37 cantons across the five municipalities.
Within each of the selected cantons, eligible households were identified on the basis of the data collected at baseline. Baseline data collection consisted of two parts: (1) a short-listing questionnaire administered to all households in 37 cantons, and (2) a more in-depth base-line questionnaire administered to all households identified as having working children in the listing exercise. The project team succeeded in tracking and administering the in-depth baseline questionnaire to 3,064 (93%) of the 3,294 households with working children iden-tified in the shortlisting.
Households were defined as being eligible for participation if (1) they had one or more work-ing child aged 5-17 years and (2) they had one or more literate woman aged 18 to 65 years that was not employed as a salaried worker. Of the 3,064 households with working children interviewed at baseline, 2,098 (68%) had a mother or another woman who was eligible ac-cording to these criteria.
The beneficiary households were selected out of the eligible households on the basis of a wealth index constructed using information provided by households during baseline data collection (see UCW 2012 and UCW 2013a for details). The poorest 1,098 households (i.e., the 1,098 households with the lowest wealth index) were selected into the program, while the remaining 1,000 households served as the control group. Note that the selection on the basis of a wealth index not only ensured a fair distribution of the interventions to those households that were most in need but also ensured that the causal effect of the set of interventions could be identified in a regression discontinuity framework.
4 As suggested by the number of child labourers in the school census divided by the total canton population according to the 2007 census.

13
4. Evaluating the impact of the household level interventions
�Evaluation strategyThe impact evaluation is aimed at identifying the causal effect (i.e., the impact) on child labour of the set of interventions on education, child labour, and participation in labour of adult household members (especially women, as they are the key target group of the inter-ventions). To identify the causal effect, the impact evaluation must estimate a counterfac-tual outcome: the education and (child) labour outcomes that would have been observed among project beneficiaries in the absence of the project. This counterfactual outcome is unobserved by definition. However, a valid counterfactual can be established by identifying a comparison group that is similar to the group of beneficiaries at the start of the project in all respects, with the exception that they do not participate in the intervention.
As explained in detail in UCW (2012), to identify a credible comparison group, the impact evaluation exploits the fact that the set of interventions described above is assigned on the basis of a wealth index using the so-called regression discontinuity methodology.
The intuition behind the regression discontinuity methodology is as follows. All households with working children and a mother who can participate in the intervention are ranked from poorest to richest on the basis of a wealth index generated using baseline data collected by the project, as described above. The poorest households (i.e., the households in the lower half of the wealth distribution) are assigned to the intervention group. The richest households (i.e. the households in the upper half of the wealth distribution) do not receive any inter-ventions and constitute our control group. While these two groups are obviously not similar before the implementation of the interventions, they may be expected to be virtually identical close to the point in the wealth index that separates the comparatively poor intervention households and the comparatively rich control households. By comparing intervention and control households close to this threshold, we can identify the (local) impact of the program.5
5 For a heuristic discussion see Lee and Lemieux (2010).


15
�Intervention take-upMonitoring information collected at the time of treatment indicates that there was a total of 680 treated households out of the 1,098 households initially selected as beneficiaries for the support packages to mothers described above. A total of 418 selected households, therefore, did not accept to participate in the program resulting in the take-up rate of about 62%. As shown in Table 3, Santiago Nonualco municipality was host to the largest number of treated households (206), followed by Tacuba (181), Luis La Herradura (128), Izalco (94) and Tecoluca (71).
Table 3. Program take-up among selected beneficiaries
PROGRAM TAKE-UP AMONG SELECTED BENEFICIARIES
Municipality
Households initially selected as beneficiaries
Participated in the program
Did not participate in the program Total
Tacuba 181 105 286
Izalco 94 36 130
Santiago Nonualco 206 139 345
San Luis la Herradura
128 69 197
Tecoluca 71 69 140
Total 680 418 1,098
Only a minority of children took up the education package. This is because of the relatively high level of school attendance. Therefore the rest of this discussion focuses on the package for the mothers.
�Interventions providedInformation on the specific interventions received by the treated households, also collected as part of monitoring at the time of treatment, is reported in Figure 4. As shown, the project involved the provision of 29 training-related interventions, distributed unequally across the 680 beneficiary house-holds. Patisserie and bakery were the most common, benefiting 80 and 79 households, respectively, followed by tailoring (74 households), training in business (72 households) and chicken breeding (57
5. PROJECT IMPLEMENTATION

16
IMPACT EVALUATION REPORT ONinterventions on starting-up small enterprises and reintegration of children to school of the Project “Eliminating Child Labour in El Salvador through Economic Empowerment and Social Inclusion”
households). At the other end of the frequency distribution, fewer than five households were provided with orientation training, such as rapid productive assessment.
Figure 4. Frequency distribution of treated households by specific intervention received

17
5. Project implementation
�TimingImplementation began in 2012 when a total of 162 households were treated. Implementation peaked the following year at 355 households, slowing after that to 123 households in 2014 and 38 households in 2015 (Figure 5).6
Figure 5. Number of households treated by year
Notes: (a) Information was missing for two households.
6 Information on the date of treatment was missing for two households.


19
Baseline data were collected in the five participating municipalities at the end of April and in May of 2012 (see UCW 2012 and UCW 2013a for further details). Follow-up data collection was undertaken primarily in July and August of 2015.7 The follow-up survey consisted of an in-depth questionnaire ad-ministered to the same households identified as having working children in the initial listing exercise. The follow-up survey questionnaire consisted of the following sections:
1. Identity and address of the respondent;
2. Characteristics of the household members;
3. Education status of household members (current school participation, highest level of education attended, ability to read and write);
4. Economic activities, vocational/professional training, other income, and other activities of all house-hold members aged five years or more;
5. Characteristics of the house inhabited by the household and access to durable goods;
6. Health of household members aged five to 17 years;
7. Businesses or enterprises of household members;
8. Participation in public or private social protection programs;
9. Respondent's attitudes towards child labour and education;
10. Household decision-making; and
11. Awareness of the IPEC Eliminating Child Labour in El Salvador through Economic Empowerment and Social Inclusion program.
The follow-up survey questionnaire is included as Annex 7 to the Report. Additionally, OIT and DEICO (2015), attached as Annex 6 to the Report, describes the follow-up data collection and discusses the main descriptive results of the follow-up survey (in Spanish).
7 In El Salvador the academic year runs from January to November. Thus, the baseline and follow-up surveys were fielded during the academic year and not during school holidays. Therefore, school holidays are not a factor in explaining differences in school attendance and child labour. Both the baseline and followup surveys were fielded during the rainy season, therefore also excluding seasonal factors in explaining the observed differences between treated and non-treated households.
6. DATA COLLECTION

21
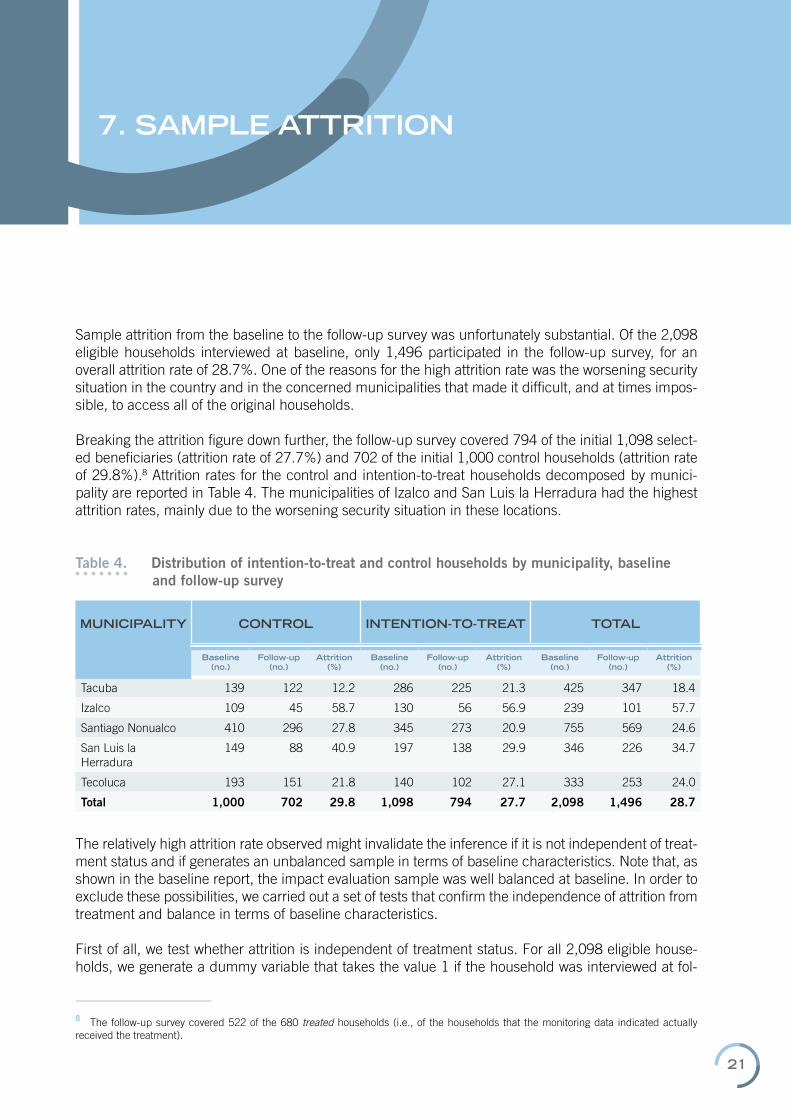
Sample attrition from the baseline to the follow-up survey was unfortunately substantial. Of the 2,098 eligible households interviewed at baseline, only 1,496 participated in the follow-up survey, for an overall attrition rate of 28.7%. One of the reasons for the high attrition rate was the worsening security situation in the country and in the concerned municipalities that made it difficult, and at times impos-sible, to access all of the original households.
Breaking the attrition figure down further, the follow-up survey covered 794 of the initial 1,098 select-ed beneficiaries (attrition rate of 27.7%) and 702 of the initial 1,000 control households (attrition rate of 29.8%).8 Attrition rates for the control and intention-to-treat households decomposed by munici-pality are reported in Table 4. The municipalities of Izalco and San Luis la Herradura had the highest attrition rates, mainly due to the worsening security situation in these locations.
Table 4. Distribution of intention-to-treat and control households by municipality, baseline and follow-up survey
MUNICIPALITY CONTROL INTENTION-TO-TREAT TOTAL
Baseline (no.)
Follow-up (no.)
Attrition (%)
Baseline (no.)
Follow-up (no.)
Attrition (%)
Baseline (no.)
Follow-up (no.)
Attrition (%)
Tacuba 139 122 12.2 286 225 21.3 425 347 18.4
Izalco 109 45 58.7 130 56 56.9 239 101 57.7
Santiago Nonualco 410 296 27.8 345 273 20.9 755 569 24.6
San Luis la Herradura
149 88 40.9 197 138 29.9 346 226 34.7
Tecoluca 193 151 21.8 140 102 27.1 333 253 24.0
Total 1,000 702 29.8 1,098 794 27.7 2,098 1,496 28.7
The relatively high attrition rate observed might invalidate the inference if it is not independent of treat-ment status and if generates an unbalanced sample in terms of baseline characteristics. Note that, as shown in the baseline report, the impact evaluation sample was well balanced at baseline. In order to exclude these possibilities, we carried out a set of tests that confirm the independence of attrition from treatment and balance in terms of baseline characteristics.
First of all, we test whether attrition is independent of treatment status. For all 2,098 eligible house-holds, we generate a dummy variable that takes the value 1 if the household was interviewed at fol-
8 The follow-up survey covered 522 of the 680 treated households (i.e., of the households that the monitoring data indicated actually received the treatment).
7. SAMPLE ATTRITION

22
IMPACT EVALUATION REPORT ONinterventions on starting-up small enterprises and reintegration of children to school of the Project “Eliminating Child Labour in El Salvador through Economic Empowerment and Social Inclusion”
low-up and 0 otherwise. As illustrated graphically in Figure 6, and shown formally in Table 5, the results of this test indicate that the probability of being interviewed at follow-up is not significantly different in the values that are closer to the threshold.
Figure 6. Probability that household is interviewed in the follow-up survey
Table 5. Estimated discontinuities of the probability of being re-interviewed at the follow-up survey
DISCONTINUITY STD. ERROR P-VALUE
(1) (2) (3)
Household is interviewed at the follow-up survey 0.015 0.056 0.786
Notes: Column (1) displays estimated discontinuities in the probability of being re-interviewed at the follow-up survey displayed in the stub column at the threshold separating the intervention households from the control households (based on the estimation procedure of Austin Nichols). Columns (2) and (3) respectively show the standard errors and P-values of the estimated coefficients.
In the baseline survey report (UCW 2013) we showed both graphically and formally that the households in the proximity of the wealth threshold for selection in the treatment (our forcing variable) were similar in terms of wealth characteristics. Moreover, we showed that the den-sity of the wealth index was continuous at the threshold.
In light of the relatively high attrition rate, we now repeat our graphical and formal tests for non-attritees (i.e., for the households re-interviewed at follow-up).
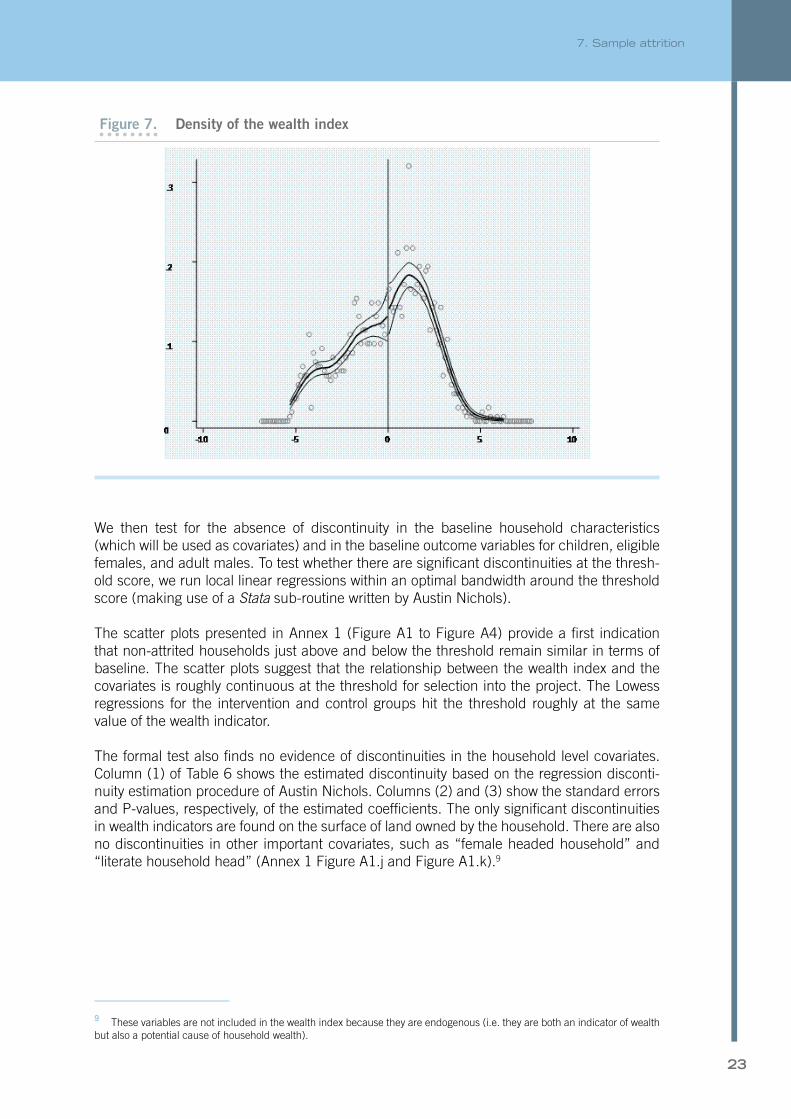
Following McCrary (2008), we examine whether the density of the wealth index is continuous at the threshold. The density of the wealth index not being continuous is an indication that there could be systematic differences between the intervention and the control group. Fig-ure 7, which was generated using McCrary’s sub-routine for Stata, depicts the density of the wealth index. The density of the wealth index is still reasonably continuous for the group of households also interviewed at followup. Most importantly, the confidence intervals indicate that the estimated density is not significantly different just above and below the threshold.
Prob
abili
ty
Wealth index
23
7. Sample attrition
Figure 7. Density of the wealth index
We then test for the absence of discontinuity in the baseline household characteristics (which will be used as covariates) and in the baseline outcome variables for children, eligible females, and adult males. To test whether there are significant discontinuities at the thresh-old score, we run local linear regressions within an optimal bandwidth around the threshold score (making use of a Stata sub-routine written by Austin Nichols).
The scatter plots presented in Annex 1 (Figure A1 to Figure A4) provide a first indication that non-attrited households just above and below the threshold remain similar in terms of baseline. The scatter plots suggest that the relationship between the wealth index and the covariates is roughly continuous at the threshold for selection into the project. The Lowess regressions for the intervention and control groups hit the threshold roughly at the same value of the wealth indicator.
The formal test also finds no evidence of discontinuities in the household level covariates. Column (1) of Table 6 shows the estimated discontinuity based on the regression disconti-nuity estimation procedure of Austin Nichols. Columns (2) and (3) show the standard errors and P-values, respectively, of the estimated coefficients. The only significant discontinuities in wealth indicators are found on the surface of land owned by the household. There are also no discontinuities in other important covariates, such as “female headed household” and “literate household head” (Annex 1 Figure A1.j and Figure A1.k).9
9 These variables are not included in the wealth index because they are endogenous (i.e. they are both an indicator of wealth but also a potential cause of household wealth).

24
IMPACT EVALUATION REPORT ONinterventions on starting-up small enterprises and reintegration of children to school of the Project “Eliminating Child Labour in El Salvador through Economic Empowerment and Social Inclusion”
Table 6. Estimated discontinuities in baseline covariates at the threshold in the wealth index: households interviewed in follow-up survey
HOUSEHOLD-LEVEL INDICATORS DISCONTINUITY STD. ERROR
P-VALUE MEAN FULL
SAMPLE
(1) (2) (3)
TV 0.007 0.049 0.889 0.725
Fridge -0.008 0.066 0.904 0.352
Oven -0.034 0.021 0.103 0.023
Access to electricity -0.013 0.047 0.782 0.737
Bedrooms per capita 0.039 0.028 0.159 0.182
No sanitary facilities -0.005 0.014 0.709 0.051
Floor made of dirt -0.057 0.061 0.354 0.375
Roof made of metal sheets 0.058 0.066 0.379 0.477
Wall made of adobe 0.054 0.047 0.251 0.161
Land surface (in manzanas) 0.359 0.176 0.042 0.513
Female headed household -0.014 0.066 0.836 0.311
Household head is literate -0.013 0.049 0.786 0.818
Notes: Column (1) displays estimated discontinuities in the household indicators displayed in the stub column at the threshold separating the intervention households from the control households (based on the estimation procedure of Austin Nichols). Columns (2) and (3) respectively show the standard errors and P-values of the estimated coefficients.
In terms of the outcome variables, the non-attrited households also look reasonably similar. As shown in Table 7 and Annex Figure A2 to Figure A4, there does not appear to be any significant discontinuity.

25
7. Sample attrition
Table 7. Estimated discontinuities in baseline outcome variables at the threshold in the wealth index: members of households interviewed in follow-up survey
DISCONTINUITY STD. ERROR
P-VALUE MEAN FULL
SAMPLE
(1) (2) (3)
Outcome variables eligible women
Working -0.076 0.072 0.289 0.446
Work in own or household business (self-employed or unpaid family)
-0.025 0.065 0.702 0.297
Monthly wage (conditional on working) -10.885 17.242 0.528 96.767
Average weekly working hours (conditional on working)
8.573 4.085 0.036 36.810
Outcome variables men aged 18+
Working 0.013 0.041 0.748 0.897
Work in own or household business (self-employed or unpaid family)
0.062 0.066 0.349 0.481
Outcome variables children 5-17
In school -0.027 0.032 0.388 0.859
Literate -0.004 0.031 0.910 0.878
Working 0.010 0.040 0.796 0.602
Work exclusively 0.007 0.027 0.792 0.093
Study exclusively -0.028 0.039 0.481 0.351
Work and study 0.002 0.042 0.972 0.508
Idle 0.022 0.019 0.252 0.048
In hazardous work 0.028 0.043 0.515 0.551
In chores 0.022 0.028 0.435 0.866
Weekly hours worked (conditional on working)
8.537 1.828 0.000 17.040
Weekly hours in chores (conditional on being in chores)
3.119 1.033 0.003 12.994
Notes: Column (1) displays estimated discontinuities in outcome variables displayed in the stub column at the threshold separating the in-tervention households from the control households (based on the estimation procedure of Austin Nichols). Columns (2) and (3) respectively show the standard errors and P-values of the estimated coefficients.


27
In the previous sections, we have seen how households close to the threshold for program assignment have similar characteristics at baseline. Also, attrition between the baseline and thefollow-up surveys appears to be random with respect to program assignment, and households in the followup survey continue to have similar baseline characteristics close to the threshold for assignment.
We can, therefore, proceed with Regression Discontinuity (RD) estimates to assess the impact of the program.
As we have seen, the compliance was far from perfect: only 680 out of 1,098 selected beneficiary households took up the program, a take-up rate of about 60%. Moreover, only 522 of 680 treated households were re-interviewed in the follow-up survey due to attrition. For these reasons, we esti-mate both the intent-to-treat and the treatment-on-the-treated effects, as they are likely to differ in our setting. We use the sharp RD design to estimate the intent-to-treat effect (ITT). The treatment-on-the treated effect (TOT) is estimated by applying the fuzzy RD design, using the treatment assignment as an instrument for actual program participation.
To measure the intent-to-treat effect of the program we estimate the following sharp regression dis-continuity equation:
Yij = α + βDj + ∑k≥1 γk (Xj – c)k+ ∑k≥1 δk Dj (Xj – c)k + ϑZi + εi (1)
where c – h≤ X ≤ c + h ;
Yij is the outcome of interest for individual i from household j; α is the intercept; Dj is a dummy tak-ing the value 1 if a household was selected for the interventions (i.e. had e wealth index below the implicit threshold); ∑k≥1 γk (Xj – c)k is a polynomial of order k that captures the relationship between the outcome of interest and the distance of a household's wealth index Xj to the threshold c, while the term ∑k≥1δk Dj (Xj – c)k allows for a different slope below and above the threshold. Zi is a vector of the baseline covariates, εi is the error term, and h is a bandwidth. The standard errors are clustered at the municipality level.
The estimated coefficient β identifies the average local ITT effect of households being selected for the interventions.
The fuzzy RD design can be described by the following two equations system:
Yij=α + βTj+∑k≥1γk (Xj – c)k+∑k≥1δk Dj(Xj – c)k+ϑZi+εi (2)
Tj= σ + τDj + ∑k≥1 ρk (Xj – c)k + ∑k≥1 φk Dj (Xj – c)k + θZi + ϵi (3)
8. METHODOLOGY
28
IMPACT EVALUATION REPORT ONinterventions on starting-up small enterprises and reintegration of children to school of the Project “Eliminating Child Labour in El Salvador through Economic Empowerment and Social Inclusion”
where Tj is the treatment dummy variable taking the value 1 if a household actually received the treatment; the other variables are as described in the equation (1).
Choice of the optimal bandwidth and order of polynomial
As is well known, the choice of the optimal bandwidth h is the crucial issue for the RD design, since there is always a tradeoff between precision and bias of the estimates. For each out-come, we select the optimal bandwidth using the cross-validation criterion (CVC) proposed by Imbens and Lemieux (2008):
CVCY(h) =(1/N) ∑ N (Yi – Ŷ( Xi ))2,
with the preferred bandwidth given by:
hCV = arg min CVY (h)
In particular, we estimate the CVC starting with a bandwidth of 0.2 and proceeding with steps of 0.2. For the fuzzy RD design, we use the same bandwidth selected for the sharp RD estimates.
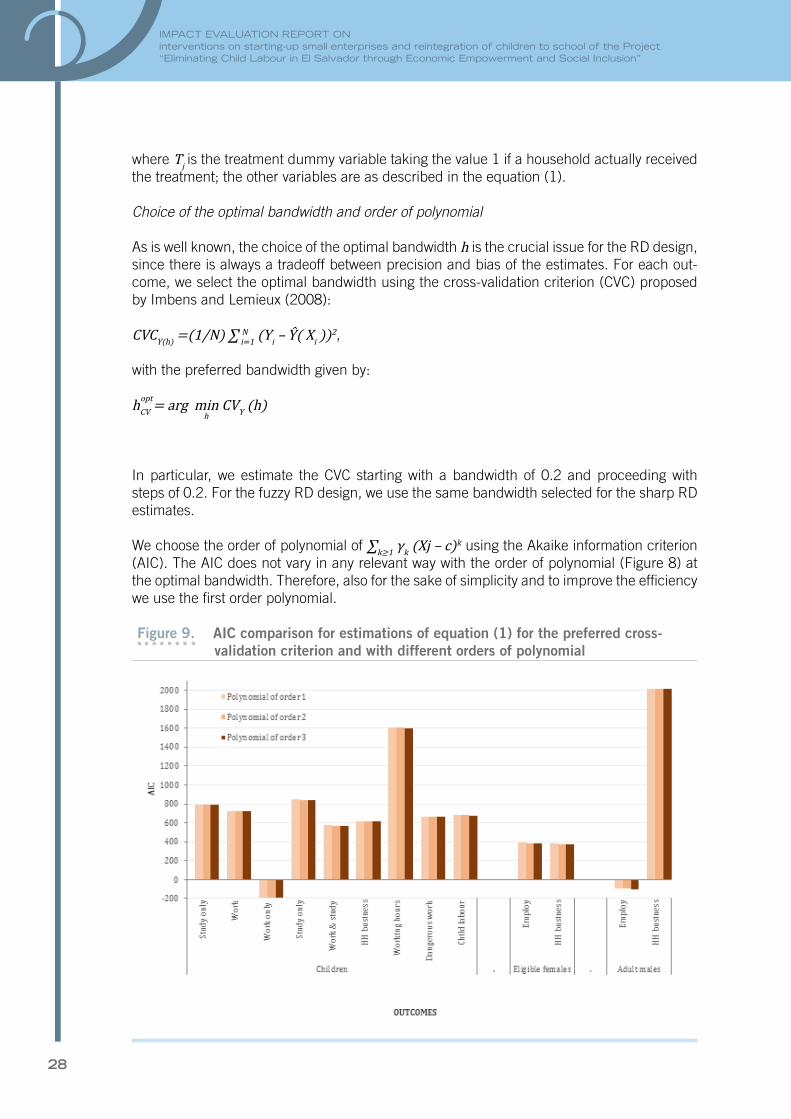
We choose the order of polynomial of ∑k≥1 γk (Xj – c)k using the Akaike information criterion (AIC). The AIC does not vary in any relevant way with the order of polynomial (Figure 8) at the optimal bandwidth. Therefore, also for the sake of simplicity and to improve the efficiency we use the first order polynomial.
Figure 9. AIC comparison for estimations of equation (1) for the preferred cross-validation criterion and with different orders of polynomial
i=1
opt
h

29
8. Methodology
The vector Z of baseline covariates for child outcomes includes child age dummies; sex of child; sex, literacy and education level of household head; number of children aged 5-14 years in household; and household wealth characteristics (ownership of TV, refrigerator, oven; access to electricity and sanitary facilities; whether the walls of dwelling are made of adobe; whether the floor of dwelling is made of dirt; whether the roof of dwelling is made of metal sheets; bedrooms per capita; and land surface). The vector Z of baseline covariates for adult outcomes includes a second order age polynomial, education level; number of children aged 5-14 years in household; and household wealth characteristics as described above for children’s outcomes.


31
We now turn to the impact of the program on eligible woman, men from eligible households, and, most importantly, on children. Table 9 to Table 19 show the results of the impact es-timates for both the treatment-on-the-treated (TOT) and the intent-to-treat (ITT) groups; 10 for each outcome variable the tables also report the optimal bandwidth on which the esti-mates are based. Standard errors are clustered at the municipality level. These estimates are based on the optimal bandwidth, a first order polynomial, and include the set of covariates described above. The set of complete results with and without covariates and for different bandwidths can be found in Annex 3. Table 8 presents the definitions of the variables used in the estimates.
Table 8. Variable definitions
School attendance
A child is defined as attending school if he/she is in attendance at any regular accredited educational institution or program for organized learning.
School attendance regularity
A child’s attendance regularity reflects whether school days were missed during the past week.
School expenditures
School expenditures comprise monthly expenditures for enrolment, books, uniform, footwear, other materials, parent fee, tuition, and transport.
Literacy
An individual is defined as literate if he/she can read and write.
Employment
An individual is defined as employed if he/she worked in the past week or in the past 12 months. In particular, if she/he 1) worked in past week at least 1 hour; or 2) has a job but did not work during the past week for some reason (sickness, maternity leave, change of shift, and etc.); or 3) in the past week participated in any cash or in-kind remunerated activities; and/or 4) in the past 12 months worked in a non agricultural enterprise; and/or 5) in the past 12 months was involved in any farming activities; and/or 6) in the past 12 months worked in an enterprise owned by himself/herself.
Household chores
A child is defined as performing household chores if he/she performs at least one of the following activities: cleaning the house; fetching wood; fetching water; taking care of small/old/sick members of the household; cooking; washing dishes; repair work; and others.
Own or household business
An individual is defined as working in own or household business if he/she works as an employer, self-employed or unpaid family worker in the main or secondary activities.
10 Also shown are the standard errors and bandwidths on which the estimates are based and the mean of outcome variable in the full sample.
9. RESULTS

32
IMPACT EVALUATION REPORT ONinterventions on starting-up small enterprises and reintegration of children to school of the Project “Eliminating Child Labour in El Salvador through Economic Empowerment and Social Inclusion”
Work in hazardous conditions
A child is defined as working in hazardous conditions if his or her work involves: work in dusty, smoky, noisy environment; work in extreme hot or cold; work with dangerous tools, chemical pesticides; work during the night or early morning; carrying heavy loads; work in rivers, lakes or under water.
Child labour
A child is defined as involved in child labour if he or she falls into one of the following categories: aged 5-13 years in employment; aged 14-15 years working in hazardous conditions or employed for more than 34 hours a week; or aged 16-17 working in hazardous conditions.
The estimated effects of the interventions are, not surprisingly, larger for the treatment-on-the-treated group, as it reflects those that actually participated in the program. The results for the intent-to-treat group differ in terms of magnitude, but otherwise are largely consistent with the TOT. Note that most of our findings are robust to the exclusion of covariates, to vari-ation of bandwidths. The cases in which the results are not robust are mentioned in the text.
�Impact on households
Adult labour market outcomes
The program had the expected impact on the employment of eligible women. Among the women actually taking part in the program, employment increased by 40 percentage points as a result of the programme (Table 9a).11 This rise in women’s employment was largely driv-en by involvement in own or household business, which increased by 44 percentage points among those who took up the program.12
11 ITT effect 23 percentage points (Table 9b).
12 ITT effect 25 percentage points (Table 9b).

33
9. Results
Table 9. Impact on adult female labour market outcomes
(A) TREATMENT-ON-THE-TREATED: 2SLS ESTIMATES
Employment Own/household business(1)
Impact estimate 0.403***
(0.123)
0.439**
(0.201)
Bandwidth 0.6 0.6
Num. observations 295 295
Mean full sample 0.54 0.39
(B) INTENT-TO-TREAT: OLS ESTIMATES
Employment Own/household business(1)
Impact estimate 0.230***
(0.084)
0.250**
(0.108)
Bandwidth 0.6 0.6
Num. observations 295 295
Mean full sample 0.54 0.39
Notes: all estimates are based on a first order polynomial and include the covariates described in section 8. Standard errors (in parentheses) are clustered at the municipality level. (1) Work as self-employed or unpaid family worker in the main or secondary activities.
* Statistical significance at 10%; ** Statistical significance at 5%; *** Statistical significance at 1%
The increase in women self-employment did not generate a reduction in other forms of eco-nomic activities. There is no significant reduction in the involvement of women in paid work as a consequence of the program. As shown in Annex 3 the impact on female paid employ-ment is very small and not significant.
This increase in female employment does not appear to spill over to other members of the family. Adult males from eligible households did not increase their participation in economic activities or their involvement in own household business. While the TOT estimates do in fact indicate a positive effect on adult male employment, this effect is only marginally significant and also not robust to changes in the bandwidth (Table 10). This result should, therefore, be considered with care.
Table 10. Impact on adult male labour market outcomes
(A) TREATMENT-ON-THE-TREATED: 2SLS ESTIMATES
Employment Own/household business(1)
Impact estimate 0.063*
(0.037)
-0.026
(0.082)
Bandwidth 0.6 Full sample

34
IMPACT EVALUATION REPORT ONinterventions on starting-up small enterprises and reintegration of children to school of the Project “Eliminating Child Labour in El Salvador through Economic Empowerment and Social Inclusion”
Num. observations 331 1,591
Mean full sample 0.93 0.60
(B) INTENT-TO-TREAT: OLS ESTIMATES
Employment Own/household business(1)
Impact estimate 0.036
(0.023)
-0.017
(0.053)
Bandwidth 0.6 full sample
Num. observations 331 1,591
Mean full sample 0.93 0.60
Notes: all estimates are based on a first order polynomial and include the covariates described in section 8. Standard errors (in parentheses) are clustered at the municipality level. (1) Work as employer, self-employed or unpaid family worker in the main or secondary activities.* Statistical significance at 10%; ** Statistical significance at 5%; *** Statistical significance at 1%
Household income and expenditures
Notwithstanding the substantial increase in women participation in economic activity, and in their own business in particular, it is not possible to identify a significant impact on household income and expenditures.
The point estimates indicate a large increase in the labour income of treated women: almost 50 per cent for the TOT estimates (Table 11b). The coefficients are, however, not significant. This might be due to the small sample size at the optimal bandwidth and/or to measurement errors that are known to affect income reporting, especially for non-wage employment. How-ever, as we have no way to test for this, the positive coefficient must be taken at most as a possible indication of direction of impact.
Similarly, the program shows a positive, but small and non-significant, impact on household per capita labour income and household per capita expenditures.
Table 11. Female labour income, household adult labour income per capita and household expenditure per capita
RD ESTIMATES OF THE EFFECTS OF INTERVENTIONS ON LABOUR INCOME OF ELIGIBLE FEMALES; HOUSEHOLD ADULT LABOUR INCOME P.C. AND HOUSEHOLD
TOTAL EXPENDITURE P.C.
(a) Intent-to-treat: OLS estimates
Labour income of eligible females
Household adult labour income
p.c.
Household total expenditure p.c.
Impact estimate 19.009
(24.493)
2.171
(6.011)
2.383
(2.981)

35
9. Results
Bandwidth 0.8 Full sample Full sample
Num. observations 384 1,463 1,496
Mean full sample 72.60 57.81 30.47
(b) Treatment-on-the-treated: 2SLS estimates
Labour income
of eligible females
Household adult labour income p.c.
Household total expenditure p.c.
Impact estimate 31.736
(40.715)
3.383
(9.395)
3.704
(4.644)
Bandwidth 0.8 Full sample Full sample
Num. observations 384 1,463 1,496
Mean full sample 72.60 57.81 30.47
Notes: all estimates are based on a first order polynomial and include variables displayed in section 8 as controls. Standard errors (in paren-theses) are clustered at the municipality level. * Statistical significance at 10%; ** Statistical significance at 5%; *** Statistical significance at 1%
Household decision-making
The program apparently affected the “balance of power” within the household. The follow-up survey contains a section of decision-making within the household. In particular, it is asked which individual contributes to the decisions regarding a broad set of activities ranging from purchase of food to education, investments, and loans. We have estimated the impact of the project on the probability that a beneficiary woman contributed to the decisions in the set of categories detailed below. As it can be seen in Table 12, the project has substantially increased the beneficiary women's decision-making role within the household with respect to the control group. The impact appears positive for all the categories, but large and significant only for a subset of them. Of particular relevance is the large increase in the role of women with respect to children’s school attendance and on household business investments.

36
IMPACT EVALUATION REPORT ONinterventions on starting-up small enterprises and reintegration of children to school of the Project “Eliminating Child Labour in El Salvador through Economic Empowerment and Social Inclusion”
Table 12. RD estimates of the effects of interventions on women decision-making within the household
(A) IN
TE
NT-
TO
-TR
EA
T: O
LS
ES
TIM
AT
ES
1.
Purc
hase
s:
Food
2.
Purc
hase
s:
Child
clo
thes
3.
Purc
hase
s:
Ele
ctr
ical
(house
hold
) applia
nces
4.
Child
sc
hool
att
endance
5.
Vis
its
to
hosp
ital
when
child
ren a
re
sick
6.
Invest
ments
to
fam
ily
busi
ness
7.
Fam
ily
pla
nnin
g
8.
Loans
9.
Part
icip
ation
in t
he
com
munity
activitie
s
10
.E
xpense
s to
im
pro
ve
housi
ng
Impa
ct e
stim
ate
0.04
8**
(0.0
22)
0.08
8
(0.0
64)
0.06
5
(0.0
52)
0.11
4*
(0.0
66)
0.10
4
(0.0
82)
0.17
9**
(0.0
84)
0.11
9
(0.1
15)
0.11
0**
(0.0
54)
0.04
8
(0.0
73)
0.04
7**
(0.0
22)
Ban
dwid
th1.
60.
81.
61.
01.
01.
00.
61.
61.
81.
6
Num
. obs
erva
tions
726
365
718
438
447
428
247
648
776
719
Mea
n fu
ll sa
mpl
e0.
840.
830.
740.
830.
840.
710.
710.
630.
750.
72
(B) T
RE
AT
ME
NT-
ON
-TH
E T
RE
AT
ED
: 2
SL
S E
ST
IMA
TE
S
1.
Purc
hase
s:
Food
2.
Purc
hase
s:
Child
clo
thes
3.
Purc
hase
s:
Ele
ctr
ical
(house
hold
) applia
nces
4.
Child
sc
hool
att
endance
5.
Vis
its
to
hosp
ital
when
child
ren a
re
sick
6.
Invest
ments
to
fam
ily
busi
ness
7.
Fam
ily
pla
nnin
g
8.
Loans
9.
Part
icip
ation
in t
he
com
munity
activitie
s
10
.E
xpense
s to
im
pro
ve
housi
ng
Impa
ct e
stim
ate
0.07
6*
(0.0
40)
0.15
0
(0.1
05)
0.10
4
(0.0
89)
0.17
8*
(0.1
04)
0.16
6
(0.1
33)
0.30
0*
(0.1
62)
0.18
3
(0.1
89)
0.17
8**
(0.0
72)
0.08
0
(0.1
27)
0.07
6***
(0.0
29)
Ban
dwid
th1.
60.
81.
61.
01.
01.
00.
61.
61.
81.
6
Num
. obs
erva
tions
726
365
718
438
447
428
247
648
776
719
Mea
n fu
ll sa
mpl
e0.
840.
830.
740.
830.
840.
710.
710.
630.
750.
72
Not
es: a
ll es
timat
es a
re b
ased
on
a fir
st o
rder
pol
ynom
ial a
nd in
clud
e va
riabl
es d
ispl
ayed
in ta
ble
5 as
con
trol
s. S
tand
ard
erro
rs (
in p
aren
thes
es)
are
clus
tere
d at
the
mun
icip
ality
leve
l. *
Stat
istic
al s
igni
fican
ce a
t 10%
; **
Sta
tistic
al s
igni
fican
ce a
t 5%
; ***
Sta
tistic
al s
igni
fican
ce a
t 1%

37
9. Results
�Impact on childrenThe effects of the project on household behavior set the stage for analyzing the impact on children and understanding the reasons for the observed changes, if any.
Children’s education and work
The program had a large impact on children’s school attendance. As reported in Table 13a, the probability of school attendance increased by 7.6 percentage points as a result of the program,13 a substantial increase given the already high level of school attendance at baseline. In fact, if taken at face value, the program appears to have brought about universal school attendance to children in the treated households.
The design of the evaluation does not permit the precise identification of the mechanisms that determined the observed change. It is likely, however, that mothers who were provided livelihood opportunities were in a better position to afford the direct and indirect costs as-sociated with sending their children to school. At the same time, training and sensitization efforts likely helped smooth children’s school (re)entry. These effects, however, may have been partially offset by the increase in the productivity of children’s work due to the increased level of own business activity. The fact that there was also no change in terms of children’s involvement in the household business (Table 17) is an indication that the program did not generate additional demand for children’s work as a result of the increased level of household economic activity.
Table 13. RD estimates of the effects of interventions on children’s school attendance, regularity of school attendance and school expenditures, children aged 5-15 years in the baseline survey
(A) TREATMENT-ON-THE-TREATED: 2SLS ESTIMATES
School attendanceRegularity of
school attendance(a)
School expenditures(b)
Impact estimate 0.076***
(0.026)
-0.019
(0.026)
4.868
(3.185)
Bandwidth 1.8 4.2 Full sample
Num. observations 1,308 1,581 2,025
Mean full sample 0.83 0.84 9.32
(B) INTENT-TO-TREAT: OLS ESTIMATES
School attendanceRegularity of
school attendance(a)
School expenditures(b)
Impact estimate 0.046***
(0.015)
-0.013
(0.017)
3.191
(2.166)
13 The increase is 2.5 percentage points according to the ITT estimates, Table 13b.
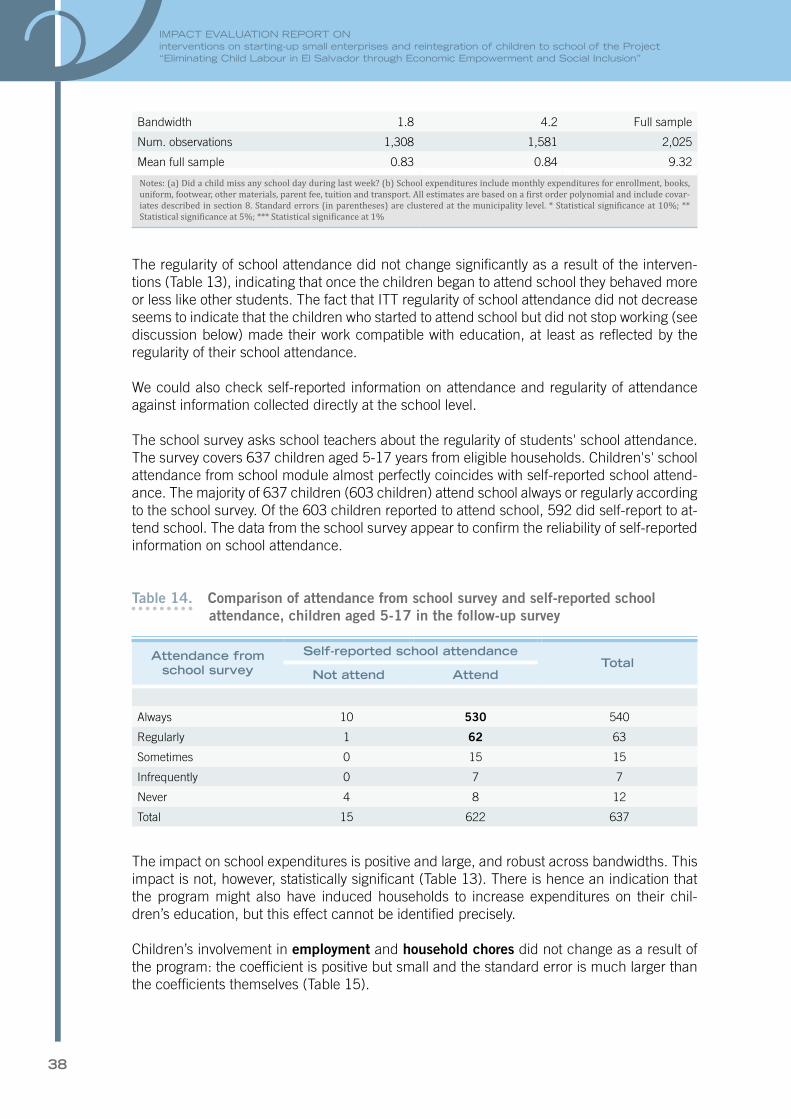
38
IMPACT EVALUATION REPORT ONinterventions on starting-up small enterprises and reintegration of children to school of the Project “Eliminating Child Labour in El Salvador through Economic Empowerment and Social Inclusion”
Bandwidth 1.8 4.2 Full sample
Num. observations 1,308 1,581 2,025
Mean full sample 0.83 0.84 9.32
Notes: (a) Did a child miss any school day during last week? (b) School expenditures include monthly expenditures for enrollment, books, uniform, footwear, other materials, parent fee, tuition and transport. All estimates are based on a first order polynomial and include covar-iates described in section 8. Standard errors (in parentheses) are clustered at the municipality level. * Statistical significance at 10%; ** Statistical significance at 5%; *** Statistical significance at 1%
The regularity of school attendance did not change significantly as a result of the interven-tions (Table 13), indicating that once the children began to attend school they behaved more or less like other students. The fact that ITT regularity of school attendance did not decrease seems to indicate that the children who started to attend school but did not stop working (see discussion below) made their work compatible with education, at least as reflected by the regularity of their school attendance.
We could also check self-reported information on attendance and regularity of attendance against information collected directly at the school level.
The school survey asks school teachers about the regularity of students' school attendance. The survey covers 637 children aged 5-17 years from eligible households. Children's' school attendance from school module almost perfectly coincides with self-reported school attend-ance. The majority of 637 children (603 children) attend school always or regularly according to the school survey. Of the 603 children reported to attend school, 592 did self-report to at-tend school. The data from the school survey appear to confirm the reliability of self-reported information on school attendance.
Table 14. Comparison of attendance from school survey and self-reported school attendance, children aged 5-17 in the follow-up survey
Attendance from school survey
Self-reported school attendance Total
Not attend Attend
Always 10 530 540
Regularly 1 62 63
Sometimes 0 15 15
Infrequently 0 7 7
Never 4 8 12
Total 15 622 637
The impact on school expenditures is positive and large, and robust across bandwidths. This impact is not, however, statistically significant (Table 13). There is hence an indication that the program might also have induced households to increase expenditures on their chil-dren’s education, but this effect cannot be identified precisely.
Children’s involvement in employment and household chores did not change as a result of the program: the coefficient is positive but small and the standard error is much larger than the coefficients themselves (Table 15).

39
9. Results
Table 15. RD estimates of the effects of interventions on children’s involvement in employment and household chores, children aged 5-15 years in the baseline survey
(A) TREATMENT-ON-THE-TREATED: 2SLS ESTIMATES
Employment Household chores
Impact estimate 0.039
(0.084)
0.182
(0.242)
Bandwidth 1.0 0.4
Num. observations 801 339
Mean full sample 0.25 0.54
(B) INTENT-TO-TREAT: OLS ESTIMATES
Employment Household chores
Impact estimate 0.026
(0.055)
0.100
(0.128)
Bandwidth 1.0 0.4
Num. observations 801 339
Mean full sample 0.25 0.54
Notes: all estimates are based on a first order polynomial and include covariates described in section 8. Standard errors (in parentheses) are clustered at the municipality level. * Statistical significance at 10%; ** Statistical significance at 5%; *** Statistical significance at 1%
The picture changes somewhat, however, when we look more closely at how the program affected the division of children’s time between work and schooling. The share of children working only (i.e., without also attending school), one of the worst-off categories of child workers, declined significantly. As reported in Table 16a, the share of children working only from treated households declined by 3.8 percentage points as a result of the program.14 Again, while we cannot identify with certainty the specific mechanism of this change, it is worth noting that it was this group of out-of-school children that was specifically targeted by the program with special training and sensitization efforts aimed at encouraging their school (re)entry. The decline in the working-only group was mirrored by an apparent rise in those working and attending school (although this result is not robust across all bandwidths). This suggests that families responded to the program by sending their children to school without fully withdrawing them from work at the same time.
14 The ITT effect was 2.5 percentage points, Table 16b.

40
IMPACT EVALUATION REPORT ONinterventions on starting-up small enterprises and reintegration of children to school of the Project “Eliminating Child Labour in El Salvador through Economic Empowerment and Social Inclusion”
Table 16. RD estimates of the effects of interventions on child time use, children aged 5-15 years in the baseline survey
(A) TREATMENT-ON-THE-TREATED: 2SLS ESTIMATES
Work exclusively Study exclusively Work and study Idle
Impact estimate -0.038***
(0.014)
-0.006
(0.103)
0.121
(0.116)
-0.034
(0.045)
Bandwidth 2.6 1.0 1.0 1.0
Num. observations 1,760 801 801 801
Mean full sample 0.07 0.66 0.17 0.09
(B) INTENT-TO-TREAT: OLS ESTIMATES
Work exclusively Study exclusively Work and study Idle
Impact estimate -0.025***
(0.008)
-0.004
(0.069)
0.081
(0.076)
-0.022
(0.029)
Bandwidth 2.6 1.0 1.0 1.0
Num. observations 1,760 801 801 801
Mean full sample 0.07 0.66 0.17 0.09
Notes: all estimates are based on a first order polynomial and include covariates described in section 8. Standard errors (in parentheses) are clustered at the municipality level. * Statistical significance at 10%; ** Statistical significance at 5%; *** Statistical significance at 1%
The program interventions resulted in a notable reduction in the time children spent in em-ployment. Children worked an estimated 13.6 fewer hours each week due to the program (Table 17a),15 a decline of almost one-half, leaving them more time for their studies and leisure, and reducing the length of their exposure to any workplace hazards. At the same time, families did not fully withdraw their children from work when sending them to school in response to the program. It nonetheless appears that more classroom time served to crowd out time that might have otherwise been spent working.
The reduction in the working hours was not accompanied by a shift in the nature of the work performed by children. Of particular importance in this regard is the fact that the program interventions did not result in a significant change in work in hazardous conditions or in work constituting child labour in accordance with national legislation (Table 17). We tried to iden-tify whether the large reduction in working hours also translated into a reduction of children whose working hours exceeded the hours threshold for light work. However, given the small number of observations for this group and the consequently low power, we could not identify any significant effect. There was also no change in terms of children’s involvement in the household business.
In conclusion, the key impact of the program appears to have been a substitution of work time with classroom time, rather than a reduction in the incidence of work or a change in its characteristics.
15 The ITT effect was 7 hours, Table 17b.

41
9. Results
Table 17. RD estimates of the effects of interventions on child involvement in own or household business, working hours, work in hazardous conditions and child labour, children aged 5-15 years in the baseline survey
(A) TREATMENT-ON-THE-TREATED: 2SLS ESTIMATES
Own/household business(1)
Weekly working hours
cond. on working
Work in hazardous
conditions(2)Child labour(3)
Impact estimate 0.068
(0.122)
-13.593***
(3.327)
0.033
(0.064)
0.030
(0.062)
Bandwidth 1.0 1.0 1.0 1.0
Num. observations
801 195 793 794
Mean full sample 0.20 24.8 0.22 0.23
(B) INTENT-TO-TREAT: OLS ESTIMATES
Own/household business(1)
Weekly working hours
cond. on working
Work in hazardous
conditions(2)Child labour(3)
Impact estimate 0.046
(0.079)
-6.979**
(3.227)
0.022
(0.042)
0.020
(0.041)
Bandwidth 1.0 1.0 1.0 1.0
Num. observations
801 195 793 794
Mean full sample 0.20 24.8 0.22 0.23
Notes: all estimates are based on a first order polynomial and include covariates described in section 8. Standard errors (in parentheses) are clustered at the municipality level. (1) Work as self-employed or unpaid family worker in the main or secondary activities. (2) Work in hazardous conditions includes: work in dusty, smoky, noisy environment; work in extreme hot or cold; work with dangerous tools, chemical pesticides; work during the night or early morning; carrying heavy loads; work in rivers, lakes or under water. (3) Child labor includes all children aged 5-13 years in employment; children aged 14-15 years working in hazardous conditions or employed for more than 34 hours a week; and children aged 16-17 working in hazardous conditions. * Statistical significance at 10%; ** Statistical significance at 5%; *** Statistical significance at 1%
Parents' attitudes
The program appears to have had some impact on parents' attitudes towards child labour employment and schooling. As reported in Table 18a, treated households are significantly less likely to agree with statements favourable to child labour such as “work keeps children out of trouble” and “working children are stronger and healthier”. Similarly, for schooling, treated households are significantly less likely to agree with statements downplaying the im-portance of schooling such as “education is only one of the factors that influence the success of a person” and “education is not important to success in life” (Table 19a).
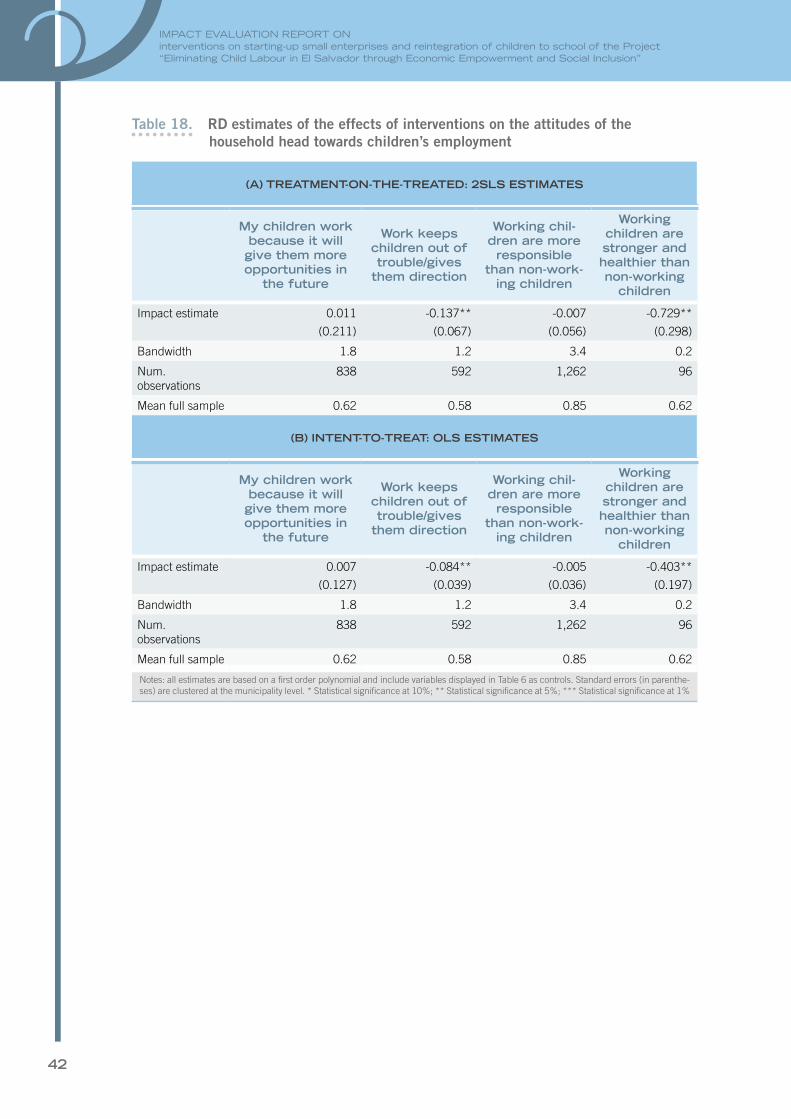
42
IMPACT EVALUATION REPORT ONinterventions on starting-up small enterprises and reintegration of children to school of the Project “Eliminating Child Labour in El Salvador through Economic Empowerment and Social Inclusion”
Table 18. RD estimates of the effects of interventions on the attitudes of the household head towards children’s employment
(A) TREATMENT-ON-THE-TREATED: 2SLS ESTIMATES
My children work because it will give them more opportunities in
the future
Work keeps children out of trouble/gives
them direction
Working chil-dren are more responsible
than non-work-ing children
Working children are stronger and healthier than non-working
children
Impact estimate 0.011
(0.211)
-0.137**
(0.067)
-0.007
(0.056)
-0.729**
(0.298)
Bandwidth 1.8 1.2 3.4 0.2
Num. observations
838 592 1,262 96
Mean full sample 0.62 0.58 0.85 0.62
(B) INTENT-TO-TREAT: OLS ESTIMATES
My children work because it will give them more opportunities in
the future
Work keeps children out of trouble/gives
them direction
Working chil-dren are more responsible
than non-work-ing children
Working children are stronger and healthier than non-working
children
Impact estimate 0.007
(0.127)
-0.084**
(0.039)
-0.005
(0.036)
-0.403**
(0.197)
Bandwidth 1.8 1.2 3.4 0.2
Num. observations
838 592 1,262 96
Mean full sample 0.62 0.58 0.85 0.62
Notes: all estimates are based on a first order polynomial and include variables displayed in Table 6 as controls. Standard errors (in parenthe-ses) are clustered at the municipality level. * Statistical significance at 10%; ** Statistical significance at 5%; *** Statistical significance at 1%
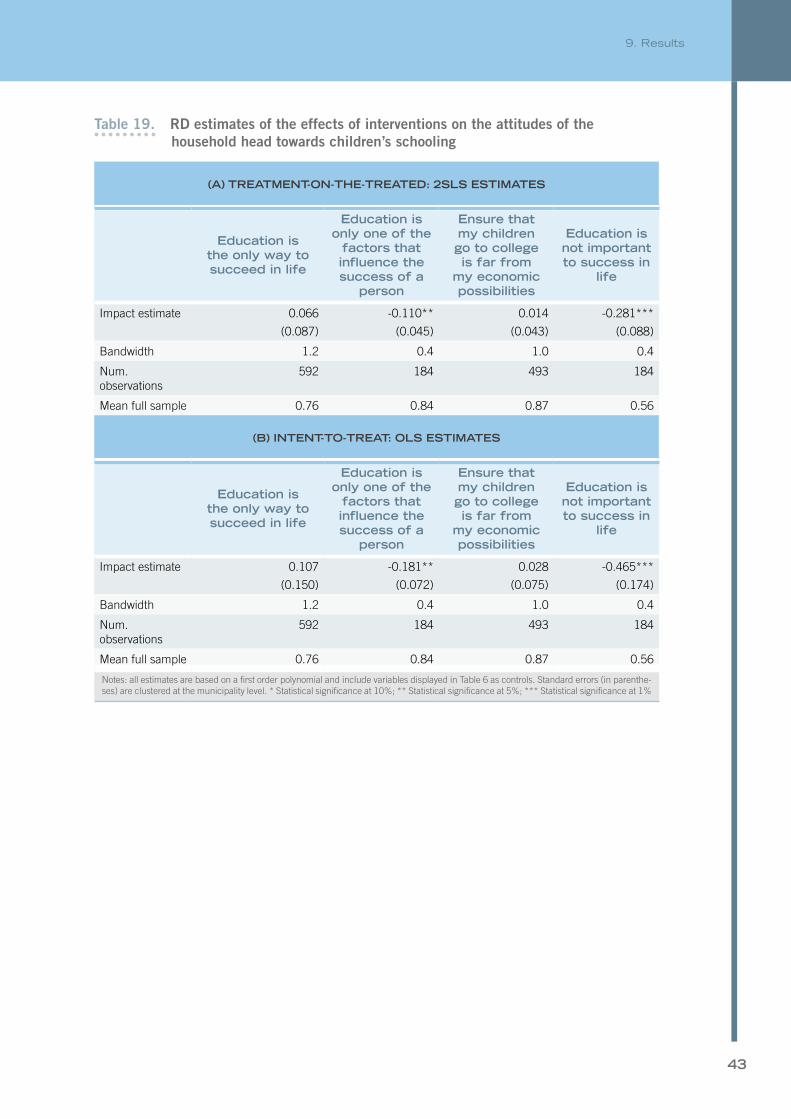
43
9. Results
Table 19. RD estimates of the effects of interventions on the attitudes of the household head towards children’s schooling
(A) TREATMENT-ON-THE-TREATED: 2SLS ESTIMATES
Education is the only way to succeed in life
Education is only one of the
factors that influence the success of a
person
Ensure that my children go to college is far from
my economic possibilities
Education is not important to success in
life
Impact estimate 0.066
(0.087)
-0.110**
(0.045)
0.014
(0.043)
-0.281***
(0.088)
Bandwidth 1.2 0.4 1.0 0.4
Num. observations
592 184 493 184
Mean full sample 0.76 0.84 0.87 0.56
(B) INTENT-TO-TREAT: OLS ESTIMATES
Education is the only way to succeed in life
Education is only one of the
factors that influence the success of a
person
Ensure that my children go to college is far from
my economic possibilities
Education is not important to success in
life
Impact estimate 0.107
(0.150)
-0.181**
(0.072)
0.028
(0.075)
-0.465***
(0.174)
Bandwidth 1.2 0.4 1.0 0.4
Num. observations
592 184 493 184
Mean full sample 0.76 0.84 0.87 0.56
Notes: all estimates are based on a first order polynomial and include variables displayed in Table 6 as controls. Standard errors (in parenthe-ses) are clustered at the municipality level. * Statistical significance at 10%; ** Statistical significance at 5%; *** Statistical significance at 1%


45
There are no impact evaluations of programs targeting child labour through support to wom-en’s businesses that we can use to frame the results presented here. However, some limited evidence exists on the impact of programs providing business training and seed capital to households. This evidence is reviewed in detail in De Hoop and Rosati (2013), from which the discussion below is taken.
Banerjee et al. (2011) study the effects of a program in India targeting women in the poorest of the poor households aimed at lifting them out of poverty by improving their income-gener-ating capacity. They find that the program increased the time spent at school by children, but did not reduce the time spent working. A comparable program (implemented by the same NGO) in Bangladesh (Bandera et al., 2013) resulted in a small but statistically significant increase in the working hours of children in economic activities and household business in particular.
Evidence from Nicaragua’s Results-Based Initiative, which provided business training and start-up capital to selected women in poor rural communities (De Hoop, Rosati and Vakis, 2015), points to an increase in children’s school attendance without any significant change in the involvement of children in economic activities.
In the light of this evidence, the impact of the El Salvador program was substantially positive, although the IE design does not allow us to identify the mechanisms through which it oper-ated.16 The program analysed in this Report produced substantial changes in household be-haviour. The participation of women in economic activities, and in own business in particular, increased substantially, but without generating relevant changes in the labour supply of other members of the households.
Children appear to have benefited substantially from the program. Their school attendance increased significantly and household expenditures on education showed signs (albeit not robust) of an increase. Children were not driven to work in the newly created or expanded household businesses, not an unusual outcome in this kind of programs, but they did not stop working either. Rather, they experienced a marked reduction (by about one-half) in their weekly working hours, making more than enough room for a regular school attendance.
The data do not allow, because of lack of power, the determination of whether the reduction in working hours also resulted in a reduction of the number of children working excessive hours. Even if we cannot identify a reduction in the child labour headcount, it is clear that the program succeeded in improving the current conditions and the future perspectives of
16 This is a common situation when there is more than one possible channel through which a program can affect the relevant outcomes. The random or as good as random (as in the present case) variation allows to identify the reduced formed effect, but not the structural parameters. A much more complex, and often unfeasible, design would be required to identify the structural parameters and hence the relative importance of the different channels.
10. CONCLUSIONS

46
IMPACT EVALUATION REPORT ONinterventions on starting-up small enterprises and reintegration of children to school of the Project “Eliminating Child Labour in El Salvador through Economic Empowerment and Social Inclusion”
child labourers. Whether such improvements will be sustained in the long run is, of course, a question that remains open, but goes beyond the aim of the present impact evaluation.
With only one instrument, namely the allocation of the program based on the wealth index, it is not possible to identify the exact mechanism that was behind the observed results. However, the evidence shows that the increased involvement in economic activity of women did result in a substantial increase in their decision-making capability within the household and in a possible, albeit not well identified, increase in household income. These two effects appear to have dominated any possible increase in child labour due to a higher demand for children’s time generated by the expanded household business activities.
47
Bandiera, O., R. Burgess, N. Das, S. Gulesci, I. Rasul, M. Sulaiman. 2013. “Can Basic Entrepreneurship Transform the Lives of the Poor?” Working Paper.
Banerjee, A., Duflo, E., Goldberg, N., Karlan, D., Osei, R., Parienté, J. Shapiro, B. Thuysbaert and Udry, C. (2015). A multifaceted program causes lasting progress for the very poor: Evidence from six countries. Science, 348(6236).
Banerjee, A., E. Duflo, R. Chattopadhyay, and J. Shapiro. 2011. “Targeting the Hard-Core Poor: An Impact Assessment.” Working paper.
Cho, Y., and Honorati, M. (2014). Entrepreneurship programs in developing countries: A meta regression analysis. Labour Economics, 28.
De Hoop, J and F. Rosati (2013), The complex effects of public policy on child labour, UCW Working Paper
De Hoop, J., Premand, P, Rosati, F. and R. Vakis. 2015, The Effects of Promoting Women’s Productive Capacity on Children's Work and Schooling.
Eswaran, M and A. Kotwal (1986), “Access to Capital and Agrarian Production Organisation”, Economic Journal, 96 (382), 482-498.
Imbens G. and T. Lemieux. 2008. “Regression Discontinuity Designs: A Guide to Practice.” Journal of Econometrics, 142 (2), 615-635.
Lee, D. S. and T. Lemieux. 2010. “Regression Discontinuity Designs in Economics.” Journal of Economic Literature, 48, 281-355.
Manacorda M. (2009) "Criteria and Guidelines fro the Evaluation of the Impact of Child Labour Interventions" UCW Working Paper
McCrary, J. 2008. “Manipulation of the Running Variable in the Regression Discontinuity Design: A Density Test.” Journal of Econometrics, 142 (2), 698-714.
UCW. 2012. "Impact Evaluation Design: Eliminating Child Labour in El Salvador through Economic Empowerment and Social Inclusion".
UCW. 2013a. "Baseline report: Eliminating Child Labour in El Salvador through Economic Empowerment and Social Inclusion".
UCW. 2013b. "Entendiendo los resultados del trabajo infantil y el empleo juvenil en El Salvador".
11. REFERENCES

48
IMPACT EVALUATION REPORT ONinterventions on starting-up small enterprises and reintegration of children to school of the Project “Eliminating Child Labour in El Salvador through Economic Empowerment and Social Inclusion”
OIT and DEICO. 2015. “Ejecución de Encuestas de resultados e Impacto del Proyecto: Elim-inación del trabajo infantil en El Salvador a través del empoderamiento económico y la in-clusión social”, www.deicoasociados.com.
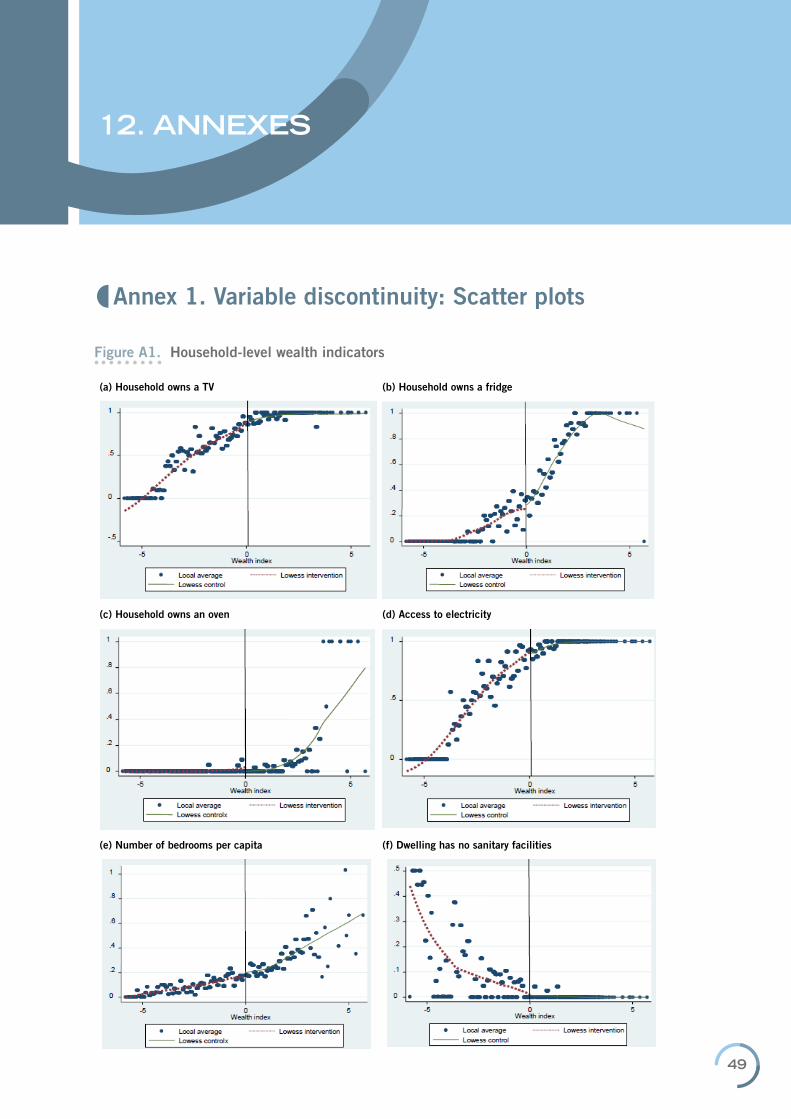
49
�Annex 1. Variable discontinuity: Scatter plots
Figure A1. Household-level wealth indicators
(a) Household owns a TV (b) Household owns a fridge
(c) Household owns an oven (d) Access to electricity
(e) Number of bedrooms per capita (f) Dwelling has no sanitary facilities
12. ANNEXES

50
IMPACT EVALUATION REPORT ONinterventions on starting-up small enterprises and reintegration of children to school of the Project “Eliminating Child Labour in El Salvador through Economic Empowerment and Social Inclusion”
Figure A1.Cont’d
(g) Floor made of dirt (h) Roof made of metal sheets
(i) Walls made of adobe (j) Female-headed household
(k) Household head literate

51
Annexes
Figure A2. Outcome variables: eligible women
(a) Eligible women in work (b) Eligible woman in own or household business
(c) Monthly wage of eligible women (d) Weekly hours worked by eligible women
Figure A3. Outcome variables: men aged 18+
(a) Adult males in work (b) Adult males in own or household business
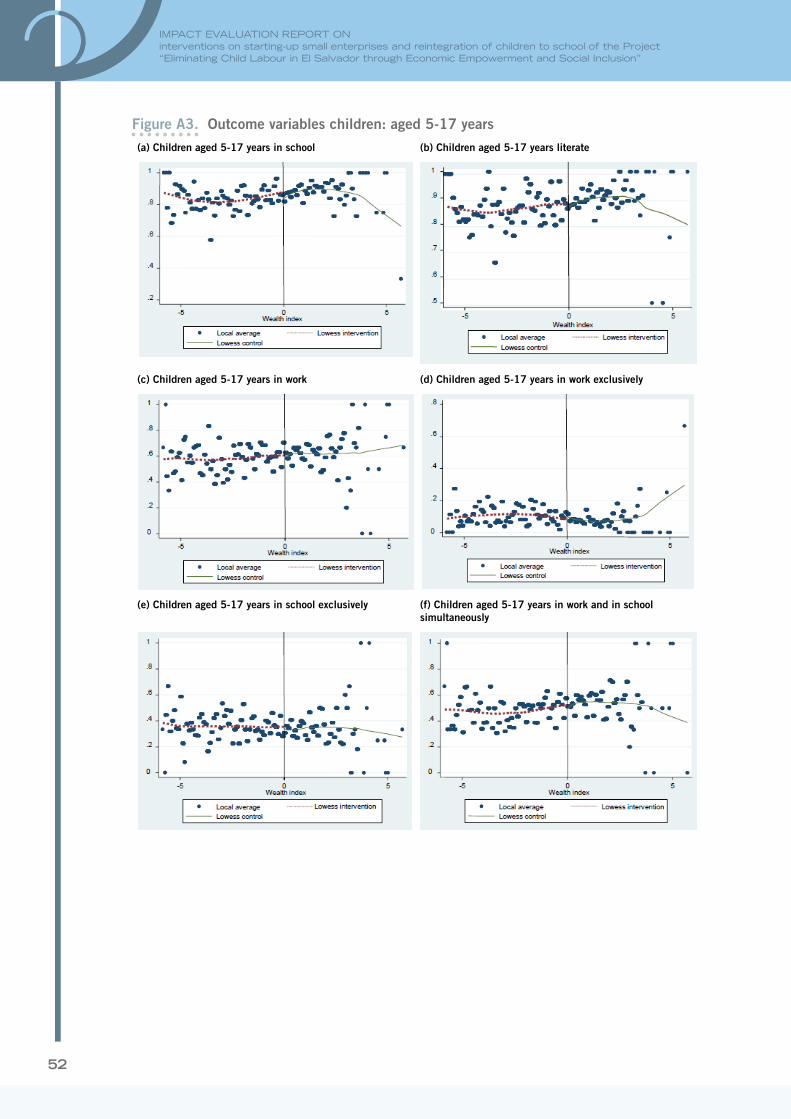
52
IMPACT EVALUATION REPORT ONinterventions on starting-up small enterprises and reintegration of children to school of the Project “Eliminating Child Labour in El Salvador through Economic Empowerment and Social Inclusion”
Figure A3. Outcome variables children: aged 5-17 years
(a) Children aged 5-17 years in school (b) Children aged 5-17 years literate
(c) Children aged 5-17 years in work (d) Children aged 5-17 years in work exclusively
(e) Children aged 5-17 years in school exclusively (f) Children aged 5-17 years in work and in school simultaneously

53
Annexes
Figure A4.Cont’d
(g) Children aged 5-17 years in neither work nor school (h) Children aged 5-17 years in hazardous work
(j) Children aged 5-17 years in chores(i) Weekly hours worked by children aged 5-17 years (conditional on working)
(k) Weekly hours worked in chores by children aged 5-17 years (conditional on working in chores)

54
IMPACT EVALUATION REPORT ONinterventions on starting-up small enterprises and reintegration of children to school of the Project “Eliminating Child Labour in El Salvador through Economic Empowerment and Social Inclusion”
�Annex 2. Estimates of the effect of interventions: scatter plots
Figure A4. Impact of interventions: children aged 5-15 years at the time of the baseline survey
(a) Impact on school attendance (b) Impact on employment
(c) Impact on being in employment exclusively (d) Impact on being in school exclusively
(e) Impact on being in employment and school simultaneously (f) Impact on being neither in work nor school

55
Annexes
Table A5.Cont’d
(g) Impact on working in hazardous conditions (h) Impact on weekly working hours
(i) Impact on involvement in child labour (j) Impact on being involved in household chores
(k) Impact on participation in own/household business (l) Impact on school expenditures
(m) Impact on occurrence of missed school days during last week
Notes: Dots present local averages at a bin size of 0.1 and the lines represent linearly fitted regressions.

56
IMPACT EVALUATION REPORT ONinterventions on starting-up small enterprises and reintegration of children to school of the Project “Eliminating Child Labour in El Salvador through Economic Empowerment and Social Inclusion”
Figure A5. Impact of interventions: eligible females
(a) Impact on the participation in employment (b) Impact on participation in own/household business
Notes: Dots present local averages at a bin size of 0.1 and the lines represent linearly fitted regressions.
Figure A7. Impact of interventions: adult males from eligible households
(a) Impact on the participation in employment (b) Impact on the participation in own/household business
Notes: proportion of adult males worked as self-employed or unpaid family workers in year 2015 as a function of the intervention forcing vari-able. Dots present local averages at a bin size of 0.1 and the lines represent linearly fitted regressions.
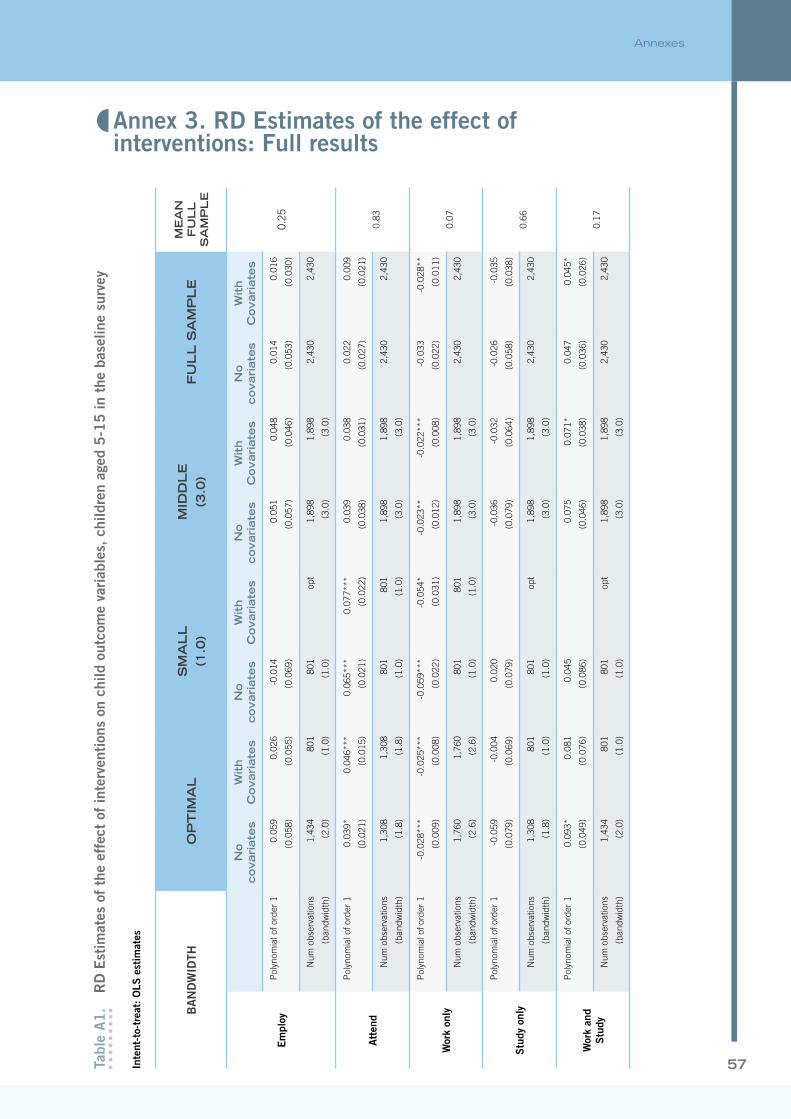
57
Annexes
Tabl
e A
1.
RD
Est
imat
es o
f th
e ef
fect
of
inte
rven
tion
s on
chi
ld o
utco
me
vari
able
s, c
hild
ren
aged
5-1
5 in
the
bas
elin
e su
rvey
Inte
nt-t
o-tr
eat:
OLS
est
imat
es
BA
ND
WID
THO
PT
IMA
LS
MA
LL
(1
.0)
MID
DL
E(3
.0)
FU
LL
SA
MP
LE
ME
AN
F
UL
L
SA
MP
LE
Em
ploy
No
covari
ate
sW
ith
Covari
ate
sN
o
covari
ate
sW
ith
Covari
ate
sN
o
covari
ate
sW
ith
Covari
ate
sN
o
covari
ate
sW
ith
Covari
ate
s
0.25
Pol
ynom
ial o
f ord
er 1
0.05
9
(0.0
58)
0.02
6
(0.0
55)
-0.0
14
(0.0
69)
0.05
1
(0.0
57)
0.04
8
(0.0
46)
0.01
4
(0.0
53)
0.01
6
(0.0
30)
Num
obs
erva
tions
(ban
dwid
th)
1,43
4
(2.0
)
801
(1.0
)
801
(1.0
)
opt
1,89
8
(3.0
)
1,89
8
(3.0
)
2,43
02,
430
Att
end
Pol
ynom
ial o
f ord
er 1
0.03
9*
(0.0
21)
0.04
6***
(0.0
15)
0.06
5***
(0.0
21)
0.07
7***
(0.0
22)
0.03
9
(0.0
38)
0.03
8
(0.0
31)
0.02
2
(0.0
27)
0.00
9
(0.0
21)
0.83
Num
obs
erva
tions
(ban
dwid
th)
1,30
8
(1.8
)
1,30
8
(1.8
)
801
(1.0
)
801
(1.0
)
1,89
8
(3.0
)
1,89
8
(3.0
)
2,43
02,
430
Wor
k on
ly
Pol
ynom
ial o
f ord
er 1
-0.0
28**
*
(0.0
09)
-0.0
25**
*
(0.0
08)
-0.0
59**
*
(0.0
22)
-0.0
54*
(0.0
31)
-0.0
23**
(0.0
12)
-0.0
22**
*
(0.0
08)
-0.0
33
(0.0
22)
-0.0
28**
(0.0
11)
0.07
Num
obs
erva
tions
(ban
dwid
th)
1,76
0
(2.6
)
1,76
0
(2.6
)
801
(1.0
)
801
(1.0
)
1,89
8
(3.0
)
1,89
8
(3.0
)
2,43
02,
430
Stu
dy o
nly
Pol
ynom
ial o
f ord
er 1
-0.0
59
(0.0
79)
-0.0
04
(0.0
69)
0.02
0
(0.0
79)
-0.0
36
(0.0
79)
-0.0
32
(0.0
64)
-0.0
26
(0.0
58)
-0.0
35
(0.0
38)
0.66
Num
obs
erva
tions
(ban
dwid
th)
1,30
8
(1.8
)
801
(1.0
)
801
(1.0
)
opt
1,89
8
(3.0
)
1,89
8
(3.0
)
2,43
02,
430
Wor
k an
d S
tudy
Pol
ynom
ial o
f ord
er 1
0.09
3*
(0.0
49)
0.08
1
(0.0
76)
0.04
5
(0.0
86)
0.07
5
(0.0
46)
0.07
1*
(0.0
38)
0.04
7
(0.0
36)
0.04
5*
(0.0
26)
0.17
Num
obs
erva
tions
(ban
dwid
th)
1,43
4
(2.0
)
801
(1.0
)
801
(1.0
)
opt
1,89
8
(3.0
)
1,89
8
(3.0
)
2,43
02,
430
�Annex 3. RD Estimates of the effect of interventions: Full results

58
IMPACT EVALUATION REPORT ONinterventions on starting-up small enterprises and reintegration of children to school of the Project “Eliminating Child Labour in El Salvador through Economic Empowerment and Social Inclusion”
BA
ND
WID
THO
PT
IMA
LS
MA
LL
(1
.0)
MID
DL
E(3
.0)
FU
LL
SA
MP
LE
ME
AN
F
UL
L
SA
MP
LE
Idle
Pol
ynom
ial o
f ord
er 1
-0.0
06
(0.0
30)
-0.0
22
(0.0
29)
-0.0
15
(0.0
28)
-0.0
16
(0.0
26)
0.01
1
(0.0
12)
0.01
9
(0.0
14)
Num
obs
erva
tions
(ban
dwid
th)
801
(1.0
)
801
(1.0
)
opt
opt
1,89
8
(3.0
)
1,89
8
(3.0
)
2,43
02,
430
Wee
kly
wor
king
hou
rs
cond
. on
w
orki
ng
Pol
ynom
ial o
f ord
er 1
-9.9
71**
*
(1.9
38)
-6.9
79**
(3.2
27)
-9.6
34**
(4.7
27)
-9.5
17**
*
(2.9
72)
-7.9
80**
*
(3.2
27)
-8.0
17**
*
(2.5
51)
-6.9
44**
*
(2.5
77)
Num
obs
erva
tions
(ban
dwid
th)
225
(1.2
)
195
(1.0
)
195
(1.0
)
opt
430
(3.0
)
430
(3.0
)
574
574
Wor
k in
ha
zard
ous
cond
itio
ns(1
)
Pol
ynom
ial o
f ord
er 1
0.04
0
(0.0
54)
0.02
2
(0.0
42)
-0.0
17
(0.0
61)
0.03
7
(0.0
52)
0.03
8
(0.0
41)
-0.0
08
(0.0
51)
-0.0
05
(0.0
28)
Num
obs
erva
tions
(ban
dwid
th)
1,82
5
(2.8
)
793
(1.0
)
793
(1.0
)
opt
1,88
3
(3.0
)
1,88
3
(3.0
)
2,41
32,
413
Chi
ld
labo
ur(2
)
Pol
ynom
ial o
f ord
er 1
0.04
3
(0.0
54)
0.02
0
(0.0
41)
-0.0
15
(0.0
61)
0.03
6
(0.0
52)
0.03
6
(0.0
42)
0.00
1
(0.0
50)
0.00
5
(0.0
27)
Num
obs
erva
tions
(ban
dwid
th)
1,42
5
(2.0
)
794
(1.0
)
794
(1.0
)
opt
1,88
7
(3.0
)
1,88
7
(3.0
)
2,41
92,
419
In o
wn
or
hous
ehol
d bu
sine
ss
as m
ain
or
seco
ndar
y ac
tivi
ty(3
)
Pol
ynom
ial o
f or
der
10.
058
(0.0
59)
0.04
6
(0.0
79)
-0.0
05
(0.0
91)
0.04
4
(0.0
69)
0.04
0
(0.0
57)
0.01
3
(0.0
59)
0.01
1
(0.0
41)
Num
obs
erva
tions
(ban
dwid
th)
1,43
4
(2.0
)
801
(1.0
)
801
(1.0
)
opt
1,89
8
(3.0
)
1,89
8
(3.0
)
2,43
02,
430
In h
ouse
hold
ch
ores
Pol
ynom
ial o
f or
der
10.
120
(0.1
45)
0.10
0
(0.1
28)
0.12
0
(0.1
45)
0.13
4
(0.1
44)
0.00
0
(0.0
91)
0.01
8
(0.1
00)
-0.0
16
(0.0
89)
0.00
6
(0.0
88)
Num
obs
erva
tions
(ban
dwid
th)
1.0
(868
)
339
(0.4
)
1.0
(868
)
868
(1.0
)
2,06
5
(3.0
)
2,06
5
(3.0
)
2,62
32,
623

59
Annexes
BA
ND
WID
THO
PT
IMA
LS
MA
LL
(1
.0)
MID
DL
E(3
.0)
FU
LL
SA
MP
LE
ME
AN
F
UL
L
SA
MP
LE
Chi
ld
atte
ndan
ce
regu
lari
ty
duri
ng la
st
wee
k
Pol
ynom
ial o
f or
der
1-0
.012
(0.0
23)
-0.0
13
(0.0
17)
0.01
6
(0.0
32)
0.04
0
(0.0
44)
-0.0
10
(0.0
25)
-0.0
12
(0.0
25)
-0.0
25
(0.0
26)
-0.0
19
(0.0
14)
Num
obs
erva
tions
(ban
dwid
th)
1,58
1(4
.2)
1,58
1(4
.2)
598
(1.0
)
598
(1.0
)
1,39
3
(3.0
)
1,39
3
(3.0
)
1,76
81,
768
Mon
thly
sc
hool
ex
pend
itur
es
Pol
ynom
ial o
f or
der
11.
712
(1.7
79)
3.19
1
(2.1
66)
4.86
4
(3.6
73)
4.90
4
(6.1
00)
3.69
9
(2.6
92)
4.12
9
(3.2
30)
Num
obs
erva
tions
(ban
dwid
th)
2,02
5
(ful
l sam
ple)
2,02
5
(ful
l sam
ple)
681
(1.0
)
681
(1.0
)
1,59
9
(3.0
)
1,59
9
(3.0
)
opt
opt
Not
es:
(1) W
ork
in h
azar
dous
con
ditio
ns in
clud
es: w
ork
in d
usty
, sm
oky,
noi
sy e
nviro
nmen
t; w
ork
in e
xtre
me
hot o
col
d; w
ork
with
dan
gero
us to
ols,
che
mic
al p
estic
ides
; wor
k du
ring
nigh
t or e
arly
mor
ning
; car
ryin
g he
avy
load
s; w
ork
in r
iver
s, la
kes
or u
nder
wat
er. (
2) C
hild
labo
r co
mpr
ises
all
child
ren
aged
5-1
3 ye
ars
in e
mpl
oym
ent;
child
ren
aged
14-
15 y
ears
wor
king
in h
azar
dous
con
ditio
ns o
r em
ploy
ed fo
r m
ore
than
34
hour
s a
wee
k; a
nd c
hild
ren
aged
16-
17 w
orki
ng in
haz
ardo
us c
ondi
tions
. (3
) W
ork
as e
mpl
oyer
s, s
elf-
empl
oyed
or
unpa
id f
amily
wor
ker
in t
he m
ain
or s
econ
dary
act
iviti
es.
Stan
dard
err
ors
(in p
aren
thes
es)
are
clus
tere
d at
the
mun
icip
ality
leve
l. *
Stat
istic
al s
igni
fican
ce a
t 10%
; **
Stat
istic
al s
igni
fican
ce a
t 5%
; ***
Sta
tistic
al s
igni
fican
ce a
t 1%
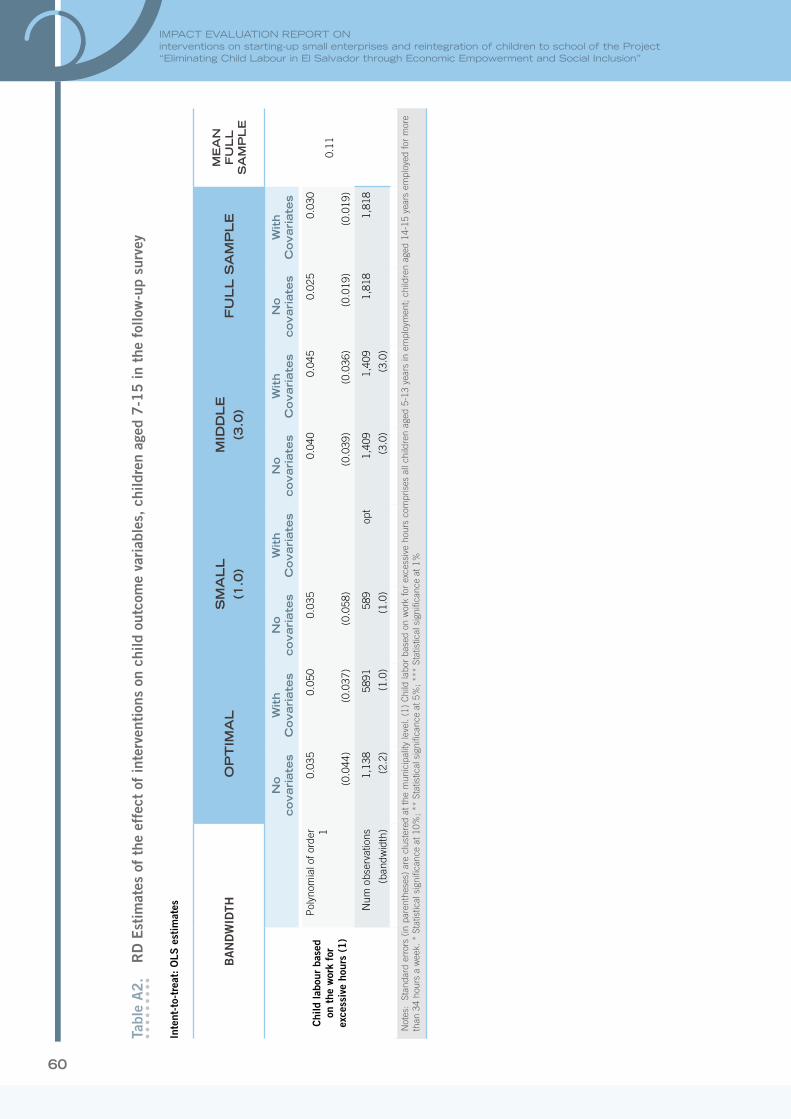
60
IMPACT EVALUATION REPORT ONinterventions on starting-up small enterprises and reintegration of children to school of the Project “Eliminating Child Labour in El Salvador through Economic Empowerment and Social Inclusion”
Tabl
e A
2.
RD
Est
imat
es o
f th
e ef
fect
of
inte
rven
tion
s on
chi
ld o
utco
me
vari
able
s, c
hild
ren
aged
7-1
5 in
the
fol
low
-up
surv
ey
Inte
nt-t
o-tr
eat:
OLS
est
imat
es
BA
ND
WID
THO
PT
IMA
LS
MA
LL
(1
.0)
MID
DL
E(3
.0)
FU
LL
SA
MP
LE
ME
AN
F
UL
L
SA
MP
LE
Chi
ld la
bour
bas
ed
on t
he w
ork
for
exce
ssiv
e ho
urs
(1)
No
covari
ate
sW
ith
Covari
ate
sN
o
covari
ate
sW
ith
Covari
ate
sN
o
covari
ate
sW
ith
Covari
ate
sN
o
covari
ate
sW
ith
Covari
ate
s
0.11
Pol
ynom
ial o
f ord
er 1
0.03
5
(0.0
44)
0.05
0
(0.0
37)
0.03
5
(0.0
58)
0.04
0
(0.0
39)
0.04
5
(0.0
36)
0.02
5
(0.0
19)
0.03
0
(0.0
19)
Num
obs
erva
tions
(ban
dwid
th)
1,13
8
(2.2
)
5891
(1.0
)
589
(1.0
)
opt
1,40
9
(3.0
)
1,40
9
(3.0
)
1,81
81,
818
Not
es:
Stan
dard
err
ors
(in p
aren
thes
es)
are
clus
tere
d at
the
mun
icip
ality
leve
l. (1
) C
hild
labo
r ba
sed
on w
ork
for
exce
ssiv
e ho
urs
com
pris
es a
ll ch
ildre
n ag
ed 5
-13
year
s in
em
ploy
men
t; ch
ildre
n ag
ed 1
4-15
yea
rs e
mpl
oyed
for
mor
e th
an 3
4 ho
urs
a w
eek.
* S
tatis
tical
sig
nific
ance
at 1
0%; *
* St
atis
tical
sig
nific
ance
at 5
%; *
** S
tatis
tical
sig
nific
ance
at 1
%
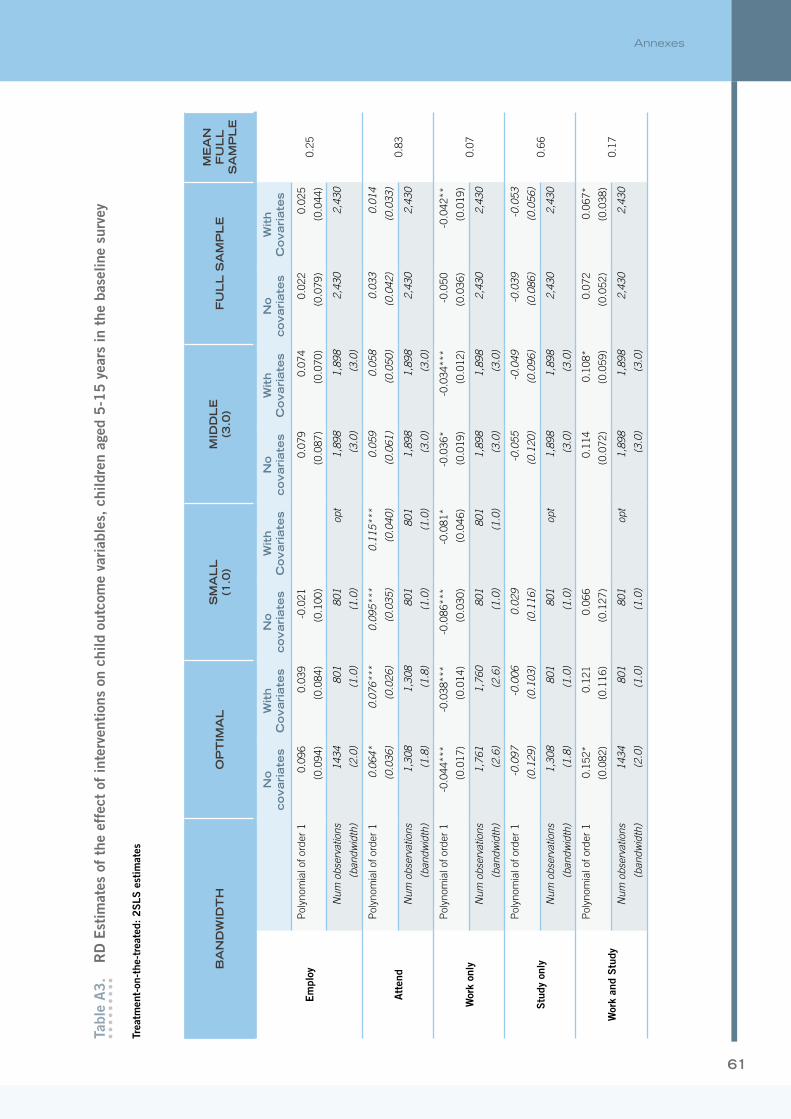
61
Annexes
Tabl
e A
3.
RD
Est
imat
es o
f th
e ef
fect
of
inte
rven
tion
s on
chi
ld o
utco
me
vari
able
s, c
hild
ren
aged
5-1
5 y
ears
in t
he b
asel
ine
surv
ey
Trea
tmen
t-on
-the
-tre
ated
: 2
SLS
est
imat
es
BA
ND
WID
TH
OP
TIM
AL
SM
AL
L
(1.0
)M
IDD
LE
(3.0
)F
UL
L S
AM
PL
EM
EA
N
FU
LL
S
AM
PL
E
Em
ploy
No
covariate
sW
ith
Covari
ate
sN
o
covari
ate
sW
ith
Covari
ate
sN
o
covari
ate
sW
ith
Covari
ate
sN
o
covari
ate
sW
ith
Covari
ate
s
0.25
Pol
ynom
ial o
f ord
er 1
0.09
6
(0.0
94)
0.03
9
(0.0
84)
-0.0
21
(0.1
00)
0.07
9
(0.0
87)
0.07
4
(0.0
70)
0.02
2
(0.0
79)
0.02
5
(0.0
44)
Num
obs
erva
tions
(ban
dwid
th)
1434
(2.0
)
801
(1.0
)
801
(1.0
)
opt
1,89
8
(3.0
)
1,89
8
(3.0
)
2,43
02,
430
Att
end
Pol
ynom
ial o
f ord
er 1
0.06
4*
(0.0
36)
0.07
6***
(0.0
26)
0.09
5***
(0.0
35)
0.11
5***
(0.0
40)
0.05
9
(0.0
61)
0.05
8
(0.0
50)
0.03
3
(0.0
42)
0.01
4
(0.0
33)
0.83
Num
obs
erva
tions
(ban
dwid
th)
1,30
8
(1.8
)
1,30
8
(1.8
)
801
(1.0
)
801
(1.0
)
1,89
8
(3.0
)
1,89
8
(3.0
)
2,43
02,
430
Wor
k on
ly
Pol
ynom
ial o
f ord
er 1
-0.0
44**
*
(0.0
17)
-0.0
38**
*
(0.0
14)
-0.0
86**
*
(0.0
30)
-0.0
81*
(0.0
46)
-0.0
36*
(0.0
19)
-0.0
34**
*
(0.0
12)
-0.0
50
(0.0
36)
-0.0
42**
(0.0
19)
0.07
Num
obs
erva
tions
(ban
dwid
th)
1,76
1
(2.6
)
1,76
0
(2.6
)
801
(1.0
)
801
(1.0
)
1,89
8
(3.0
)
1,89
8
(3.0
)
2,43
02,
430
Stu
dy o
nly
Pol
ynom
ial o
f ord
er 1
-0.0
97
(0.1
29)
-0.0
06
(0.1
03)
0.02
9
(0.1
16)
-0.0
55
(0.1
20)
-0.0
49
(0.0
96)
-0.0
39
(0.0
86)
-0.0
53
(0.0
56)
0.66
Num
obs
erva
tions
(ban
dwid
th)
1,30
8
(1.8
)
801
(1.0
)
801
(1.0
)
opt
1,89
8
(3.0
)
1,89
8
(3.0
)
2,43
02,
430
Wor
k an
d S
tudy
Pol
ynom
ial o
f ord
er 1
0.15
2*
(0.0
82)
0.12
1
(0.1
16)
0.06
6
(0.1
27)
0.11
4
(0.0
72)
0.10
8*
(0.0
59)
0.07
2
(0.0
52)
0.06
7*
(0.0
38)
0.17
Num
obs
erva
tions
(ban
dwid
th)
1434
(2.0
)
801
(1.0
)
801
(1.0
)
opt
1,89
8
(3.0
)
1,89
8
(3.0
)
2,43
02,
430
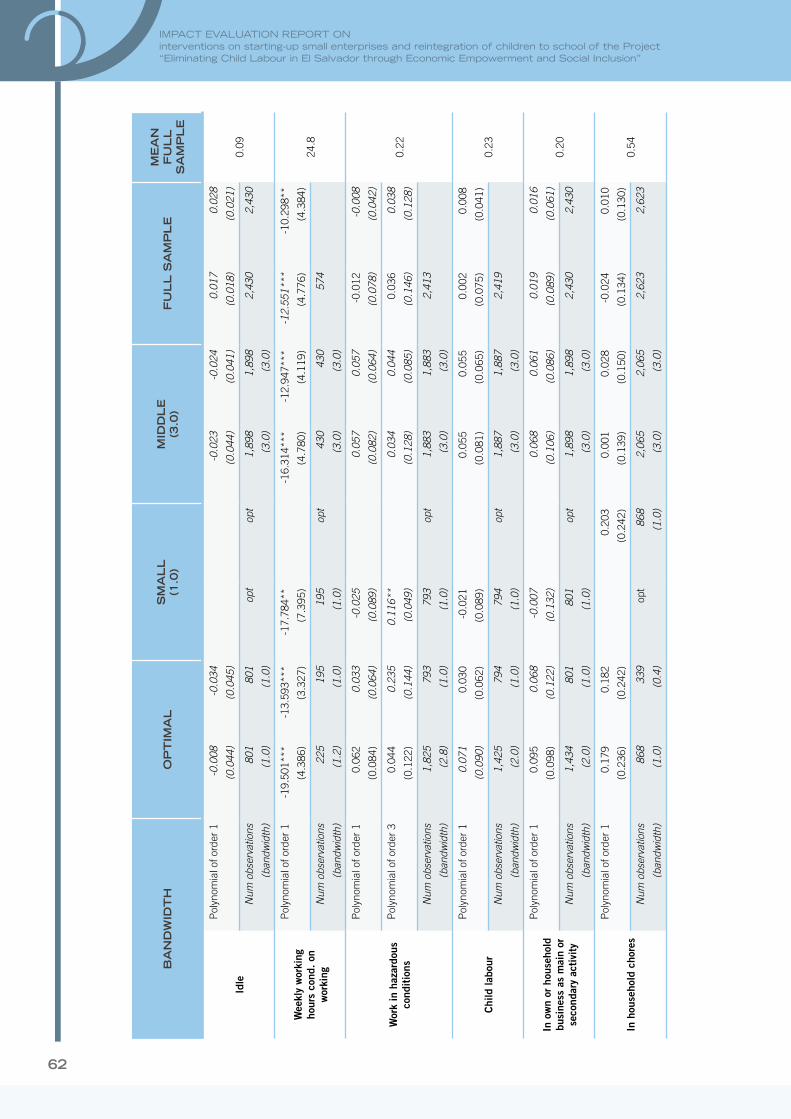
62
IMPACT EVALUATION REPORT ONinterventions on starting-up small enterprises and reintegration of children to school of the Project “Eliminating Child Labour in El Salvador through Economic Empowerment and Social Inclusion”
BA
ND
WID
TH
OP
TIM
AL
SM
AL
L
(1.0
)M
IDD
LE
(3.0
)F
UL
L S
AM
PL
EM
EA
N
FU
LL
S
AM
PL
E
Idle
Pol
ynom
ial o
f ord
er 1
-0.0
08
(0.0
44)
-0.0
34
(0.0
45)
-0.0
23
(0.0
44)
-0.0
24
(0.0
41)
0.01
7
(0.0
18)
0.02
8
(0.0
21)
0.09
Num
obs
erva
tions
(ban
dwid
th)
801
(1.0
)
801
(1.0
)
opt
opt
1,89
8
(3.0
)
1,89
8
(3.0
)
2,43
02,
430
Wee
kly
wor
king
ho
urs
cond
. on
w
orki
ng
Pol
ynom
ial o
f ord
er 1
-19.
501*
**
(4.3
86)
-13.
593*
**
(3.3
27)
-17.
784*
*
(7.3
95)
-16.
314*
**
(4.7
80)
-12.
947*
**
(4.1
19)
-12.
551*
**
(4.7
76)
-10.
298*
*
(4.3
84)
24.8
Num
obs
erva
tions
(ban
dwid
th)
225
(1.2
)
195
(1.0
)
195
(1.0
)
opt
430
(3.0
)
430
(3.0
)
574
Wor
k in
haz
ardo
us
cond
itio
ns
Pol
ynom
ial o
f ord
er 1
0.06
2
(0.0
84)
0.03
3
(0.0
64)
-0.0
25
(0.0
89)
0.05
7
(0.0
82)
0.05
7
(0.0
64)
-0.0
12
(0.0
78)
-0.0
08
(0.0
42)
0.22
Pol
ynom
ial o
f ord
er 3
0.04
4
(0.1
22)
0.23
5
(0.1
44)
0.11
6**
(0.0
49)
0.03
4
(0.1
28)
0.04
4
(0.0
85)
0.03
6
(0.1
46)
0.03
8
(0.1
28)
Num
obs
erva
tions
(ban
dwid
th)
1,82
5
(2.8
)
793
(1.0
)
793
(1.0
)
opt
1,88
3
(3.0
)
1,88
3
(3.0
)
2,41
3
Chi
ld la
bour
Pol
ynom
ial o
f ord
er 1
0.07
1
(0.0
90)
0.03
0
(0.0
62)
-0.0
21
(0.0
89)
0.05
5
(0.0
81)
0.05
5
(0.0
65)
0.00
2
(0.0
75)
0.00
8
(0.0
41)
0.23
Num
obs
erva
tions
(ban
dwid
th)
1,42
5
(2.0
)
794
(1.0
)
794
(1.0
)
opt
1,88
7
(3.0
)
1,88
7
(3.0
)
2,41
9
In o
wn
or h
ouse
hold
bu
sine
ss a
s m
ain
or
seco
ndar
y ac
tivi
ty
Pol
ynom
ial o
f ord
er 1
0.09
5
(0.0
98)
0.06
8
(0.1
22)
-0.0
07
(0.1
32)
0.06
8
(0.1
06)
0.06
1
(0.0
86)
0.01
9
(0.0
89)
0.01
6
(0.0
61)
0.20
Num
obs
erva
tions
(ban
dwid
th)
1,43
4
(2.0
)
801
(1.0
)
801
(1.0
)
opt
1,89
8
(3.0
)
1,89
8
(3.0
)
2,43
02,
430
In h
ouse
hold
cho
res
Pol
ynom
ial o
f ord
er 1
0.17
9
(0.2
36)
0.18
2
(0.2
42)
0.20
3
(0.2
42)
0.00
1
(0.1
39)
0.02
8
(0.1
50)
-0.0
24
(0.1
34)
0.01
0
(0.1
30)
0.54
Num
obs
erva
tions
(ban
dwid
th)
868
(1.0
)
339
(0.4
)
opt
868
(1.0
)
2,06
5
(3.0
)
2,06
5
(3.0
)
2,62
32,
623

63
Annexes
BA
ND
WID
TH
OP
TIM
AL
SM
AL
L
(1.0
)M
IDD
LE
(3.0
)F
UL
L S
AM
PL
EM
EA
N
FU
LL
S
AM
PL
E
Chi
ld a
tten
danc
e re
gula
rity
dur
ing
last
w
eek
Pol
ynom
ial o
f ord
er 1
-0.0
19
(0.0
34)
-0.0
19
(0.0
26)
0.02
1
(0.0
44)
0.05
5
(0.0
60)
-0.0
16
(0.0
38)
-0.0
18
(0.0
38)
-0.0
39
(0.0
38)
-0.0
29
(0.0
21)
0.84
Num
obs
erva
tions
(ban
dwid
th)
1,58
1
(4.2
)
1,58
1
(4.2
)
598
(1.0
)
598
(1.0
)
1,39
3
(3.0
)
1,39
3
(3.0
)
1,76
81,
768
Mon
thly
sch
ool
expe
ndit
ures
Pol
ynom
ial o
f ord
er 1
2.65
5
(2.7
71)
4.86
8
(3.1
85)
7.01
5
(5.2
71)
7.20
2
(8.7
04)
5.70
7
(4.0
08)
6.30
3
(4.6
97)
9.32
Num
obs
erva
tions
(ban
dwid
th)
2,02
5
(full
sam
ple)
2,02
5
(full
sam
ple)
681
(1.0
)
681
(1.0
)
1,59
9
(3.0
)
1,59
9
(3.0
)
opt
opt
Not
es: (
1) W
ork
in h
azar
dous
con
ditio
ns in
clud
es: w
ork
in d
usty
, sm
oky,
noi
sy e
nviro
nmen
t; w
ork
in e
xtre
me
hot o
col
d; w
ork
with
dan
gero
us to
ols,
che
mic
al p
estic
ides
; wor
k du
ring
nigh
t or
early
mor
ning
; car
ryin
g he
avy
load
s; w
ork
in r
iver
s, la
kes
or u
nder
wat
er. (
2) C
hild
labo
r co
mpr
ises
all
child
ren
aged
5-1
3 ye
ars
in e
mpl
oym
ent;
child
ren
aged
14-
15 y
ears
wor
king
in h
azar
dous
con
ditio
ns o
r em
ploy
ed fo
r m
ore
than
34
hour
s a
wee
k; a
nd c
hild
ren
aged
16-
17
wor
king
in h
azar
dous
con
ditio
ns.
(3)
Wor
k as
em
ploy
ers,
sel
f-em
ploy
ed o
r un
paid
fam
ily w
orke
r in
the
mai
n or
sec
onda
ry a
ctiv
ities
. St
anda
rd e
rror
s (in
par
enth
eses
) ar
e cl
uste
red
at t
he m
unic
ipal
ity le
vel.
* St
atis
tical
sig
nific
ance
at
10%
; **
Stat
istic
al s
igni
fican
ce a
t 5%
; ***
Sta
tistic
al s
igni
fican
ce a
t 1%

64
IMPACT EVALUATION REPORT ONinterventions on starting-up small enterprises and reintegration of children to school of the Project “Eliminating Child Labour in El Salvador through Economic Empowerment and Social Inclusion”
Tabl
e A
4.
RD
Est
imat
es o
f th
e ef
fect
of
inte
rven
tion
s on
chi
ld o
utco
me
vari
able
s, c
hild
ren
aged
7-1
5 in
the
fol
low
-up
surv
ey
Trea
tmen
t-on
-the
-tre
ated
: 2
SLS
est
imat
es
BA
ND
WID
TH
OP
TIM
AL
SM
AL
L
(1.0
)M
IDD
LE
(3.0
)F
UL
L S
AM
PL
EM
EA
N
FU
LL
S
AM
PL
E
Chi
ld la
bour
bas
ed
on th
e w
ork
for
exce
ssiv
e ho
urs
(1)
No
covari
ate
sW
ith
Covari
ate
sN
o
covari
ate
sW
ith
Covari
ate
sN
o
covari
ate
sW
ith
Covari
ate
sN
o
covari
ate
sW
ith
Covari
ate
s
0.11
Pol
ynom
ial o
f ord
er 1
0.05
5
(0.0
74)
0.07
1
(0.0
65)
0.04
9
(0.0
87)
0.06
0
(0.0
61)
0.06
7
(0.0
57)
0.03
9
(0.0
29)
0.04
4
(0.0
30)
Num
obs
erva
tions
(ban
dwid
th)
1,13
8
(2.2
)
589
(1.0
)
589
(1.0
)
opt
1,40
9
(3.0
)
1,40
9
(3.0
)
1,81
81,
818
Not
es: (
1) C
hild
labo
r ba
sed
on w
ork
for
exce
ssiv
e ho
urs
com
pris
es a
ll ch
ildre
n ag
ed 5
-13
year
s in
em
ploy
men
t; ch
ildre
n ag
ed 1
4-15
yea
rs e
mpl
oyed
for
mor
e th
an 3
4 ho
urs
a w
eek.
Sta
ndar
d er
rors
(in
par
enth
eses
) ar
e cl
uste
red
at
the
mun
icip
ality
leve
l. *
Stat
istic
al s
igni
fican
ce a
t 10%
; **
Stat
istic
al s
igni
fican
ce a
t 5%
; ***
Sta
tistic
al s
igni
fican
ce a
t 1%
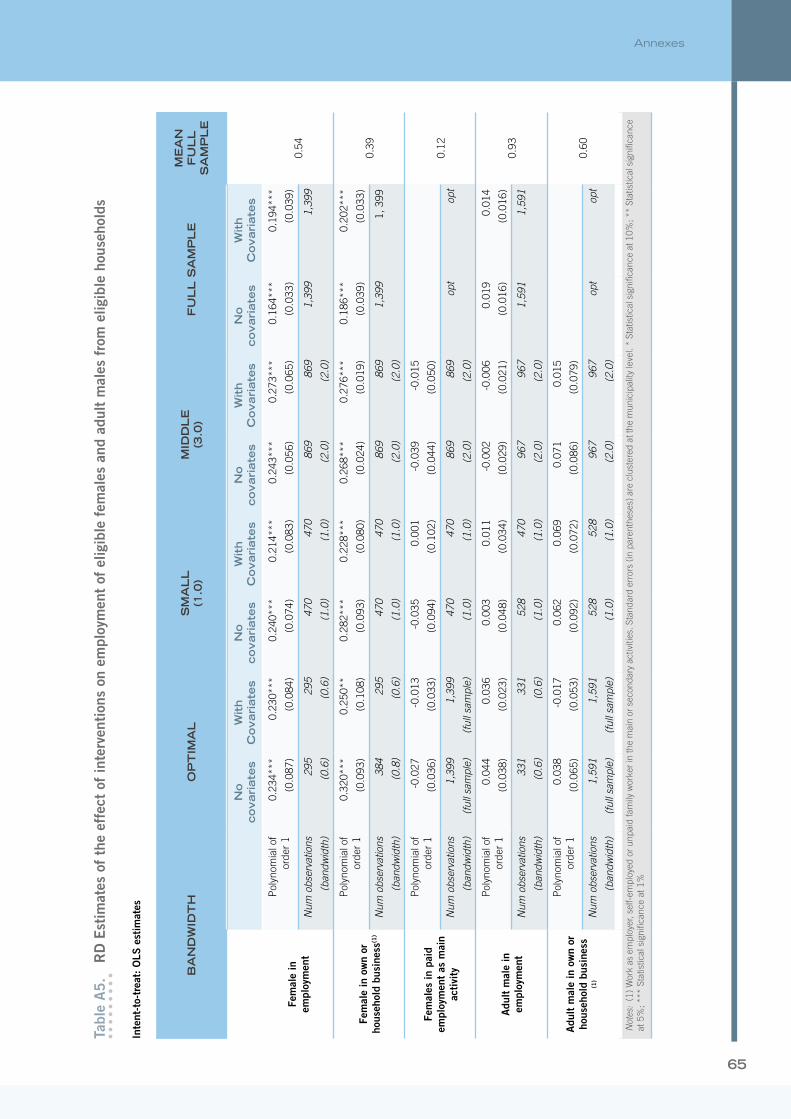
65
Annexes
Tabl
e A
5.
R
D E
stim
ates
of
the
effe
ct o
f in
terv
enti
ons
on e
mpl
oym
ent
of e
ligib
le f
emal
es a
nd a
dult
mal
es f
rom
elig
ible
hou
seho
lds
Inte
nt-t
o-tr
eat:
OLS
est
imat
es
BA
ND
WID
TH
OP
TIM
AL
SM
AL
L
(1.0
)M
IDD
LE
(3.0
)F
UL
L S
AM
PL
EM
EA
N
FU
LL
S
AM
PL
E
No
covari
ate
sW
ith
Covari
ate
sN
o
covari
ate
sW
ith
Covari
ate
sN
o
covari
ate
sW
ith
Covari
ate
sN
o
covari
ate
sW
ith
Covari
ate
s
Fem
ale
in
empl
oym
ent
Pol
ynom
ial o
f or
der
10.
234*
**
(0.0
87)
0.23
0***
(0.0
84)
0.24
0***
(0.0
74)
0.21
4***
(0.0
83)
0.24
3***
(0.0
56)
0.27
3***
(0.0
65)
0.16
4***
(0.0
33)
0.19
4***
(0.0
39)
0.54
Num
obs
erva
tions
(ban
dwid
th)
295
(0.6
)
295
(0.6
)
470
(1.0
)
470
(1.0
)
869
(2.0
)
869
(2.0
)
1,39
91,
399
Fem
ale
in o
wn
or
hous
ehol
d bu
sine
ss(1
)
Pol
ynom
ial o
f or
der
10.
320*
**
(0.0
93)
0.25
0**
(0.1
08)
0.28
2***
(0.0
93)
0.22
8***
(0.0
80)
0.26
8***
(0.0
24)
0.27
6***
(0.0
19)
0.18
6***
(0.0
39)
0.20
2***
(0.0
33)
0.39
Num
obs
erva
tions
(ban
dwid
th)
384
(0.8
)
295
(0.6
)
470
(1.0
)
470
(1.0
)
869
(2.0
)
869
(2.0
)
1,39
91,
399
Fem
ales
in p
aid
empl
oym
ent
as m
ain
acti
vity
Pol
ynom
ial o
f or
der
1-0
.027
(0.0
36)
-0.0
13
(0.0
33)
-0.0
35
(0.0
94)
0.00
1
(0.1
02)
-0.0
39
(0.0
44)
-0.0
15
(0.0
50)
0.12
Num
obs
erva
tions
(ban
dwid
th)
1,39
9
(full
sam
ple)
1,39
9
(full
sam
ple)
470
(1.0
)
470
(1.0
)
869
(2.0
)
869
(2.0
)
opt
opt
Adu
lt m
ale
in
empl
oym
ent
Pol
ynom
ial o
f or
der
10.
044
(0.0
38)
0.03
6
(0.0
23)
0.00
3
(0.0
48)
0.01
1
(0.0
34)
-0.0
02
(0.0
29)
-0.0
06
(0.0
21)
0.01
9
(0.0
16)
0.01
4
(0.0
16)
0.93
Num
obs
erva
tions
(ban
dwid
th)
331
(0.6
)
331
(0.6
)
528
(1.0
)
470
(1.0
)
967
(2.0
)
967
(2.0
)
1,59
11,
591
Adu
lt m
ale
in o
wn
or
hous
ehol
d bu
sine
ss
(1)
Pol
ynom
ial o
f or
der
10.
038
(0.0
65)
-0.0
17
(0.0
53)
0.06
2
(0.0
92)
0.06
9
(0.0
72)
0.07
1
(0.0
86)
0.01
5
(0.0
79)
0.60
Num
obs
erva
tions
(ban
dwid
th)
1,59
1
(full
sam
ple)
1,59
1
(full
sam
ple)
528
(1.0
)
528
(1.0
)
967
(2.0
)
967
(2.0
)
opt
opt
Not
es:
(1)
Wor
k as
em
ploy
er, s
elf-
empl
oyed
or
unpa
id fa
mily
wor
ker
in th
e m
ain
or s
econ
dary
act
iviti
es. S
tand
ard
erro
rs (
in p
aren
thes
es)
are
clus
tere
d at
the
mun
icip
ality
leve
l. *
Stat
istic
al s
igni
fican
ce a
t 10%
; **
Stat
istic
al s
igni
fican
ce
at 5
%; *
** S
tatis
tical
sig
nific
ance
at 1
%
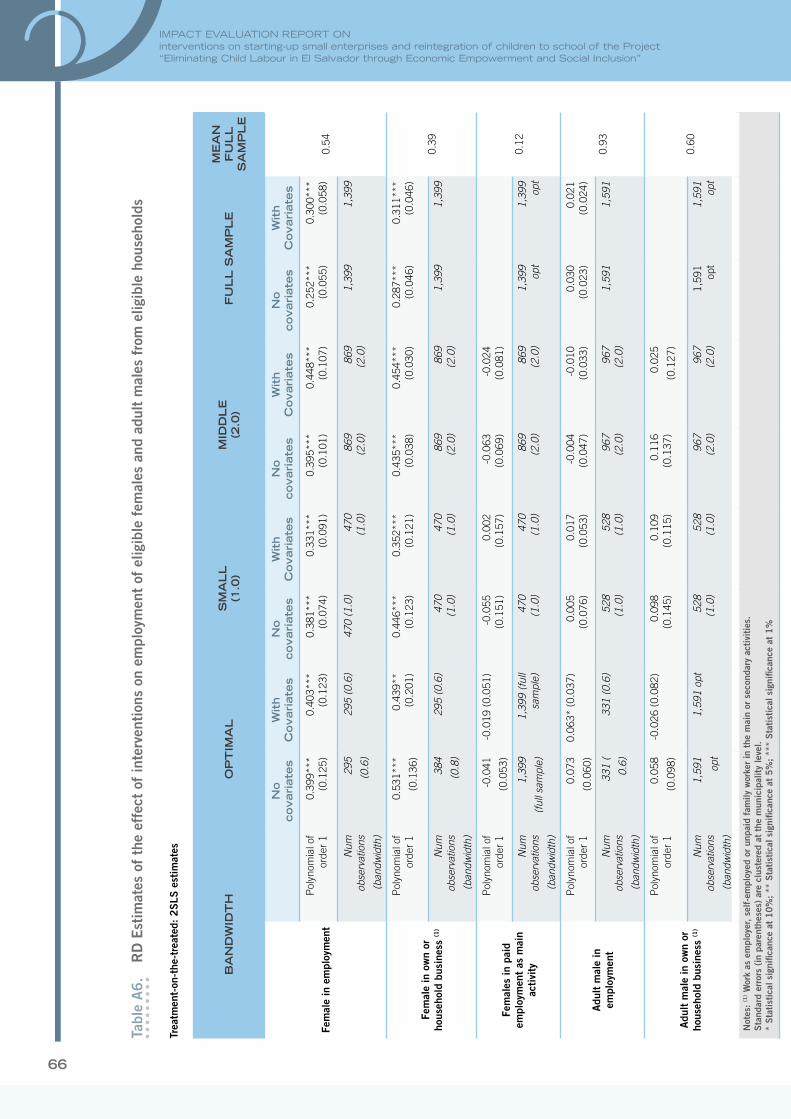
66
IMPACT EVALUATION REPORT ONinterventions on starting-up small enterprises and reintegration of children to school of the Project “Eliminating Child Labour in El Salvador through Economic Empowerment and Social Inclusion”
Tabl
e A
6.
RD
Est
imat
es o
f th
e ef
fect
of
inte
rven
tion
s on
em
ploy
men
t of
elig
ible
fem
ales
and
adu
lt m
ales
fro
m e
ligib
le h
ouse
hold
s
Trea
tmen
t-on
-the
-tre
ated
: 2
SLS
est
imat
es
BA
ND
WID
TH
OP
TIM
AL
SM
AL
L
(1.0
)M
IDD
LE
(2.0
)F
UL
L S
AM
PL
EM
EA
N
FU
LL
S
AM
PL
E
Fem
ale
in e
mpl
oym
ent
No
covari
ate
sW
ith
Covari
ate
sN
o
covari
ate
sW
ith
Covari
ate
sN
o
covari
ate
sW
ith
Covari
ate
sN
o
covari
ate
sW
ith
Covari
ate
s
0.54
Pol
ynom
ial o
f or
der
10.
399*
**
(0.1
25)
0.40
3***
(0
.123
)0.
381*
**
(0.0
74)
0.33
1***
(0
.091
)0.
395*
**
(0.1
01)
0.44
8***
(0
.107
)0.
252*
**
(0.0
55)
0.30
0***
(0
.058
)
Num
ob
serv
atio
ns
(ban
dwid
th)
295
(0.6
)
295
(0.6
)47
0 (1
.0)
470
(1.0
)86
9 (2
.0)
869
(2.0
)1,
399
1,39
9
Fem
ale
in o
wn
or
hous
ehol
d bu
sine
ss (1
)
Pol
ynom
ial o
f or
der
10.
531*
**
(0.1
36)
0.43
9**
(0.2
01)
0.44
6***
(0
.123
)0.
352*
**
(0.1
21)
0.43
5***
(0
.038
)0.
454*
**
(0.0
30)
0.28
7***
(0
.046
)0.
311*
**
(0.0
46)
0.39
Num
ob
serv
atio
ns
(ban
dwid
th)
384
(0.8
)
295
(0.6
)47
0 (1
.0)
470
(1.0
)86
9 (2
.0)
869
(2.0
)1,
399
1,39
9
Fem
ales
in p
aid
empl
oym
ent
as m
ain
acti
vity
Pol
ynom
ial o
f or
der
1-0
.041
(0.0
53)
-0.0
19 (
0.05
1)-0
.055
(0
.151
)0.
002
(0.1
57)
-0.0
63
(0.0
69)
-0.0
24
(0.0
81)
0.12
Num
ob
serv
atio
ns
(ban
dwid
th)
1,39
9
(full
sam
ple)
1,39
9 (fu
ll sa
mpl
e)47
0 (1
.0)
470
(1.0
)86
9 (2
.0)
869
(2.0
)1,
399
opt
1,39
9 op
t
Adu
lt m
ale
in
empl
oym
ent
Pol
ynom
ial o
f or
der
10.
073
(0.0
60)
0.06
3* (
0.03
7)0.
005
(0.0
76)
0.01
7 (0
.053
)-0
.004
(0
.047
)-0
.010
(0
.033
)0.
030
(0.0
23)
0.02
1 (0
.024
)
0.93
Num
ob
serv
atio
ns
(ban
dwid
th)
331
(
0.6)
331
(0.6
)52
8 (1
.0)
528
(1.0
)96
7 (2
.0)
967
(2.0
)1,
591
1,59
1
Adu
lt m
ale
in o
wn
or
hous
ehol
d bu
sine
ss (1
)
Pol
ynom
ial o
f or
der
10.
058
(0.0
98)
-0.0
26 (
0.08
2)0.
098
(0.1
45)
0.10
9 (0
.115
)0.
116
(0.1
37)
0.02
5
(0.1
27)
0.60
Num
ob
serv
atio
ns
(ban
dwid
th)
1,59
1
opt
1,59
1 op
t52
8 (1
.0)
528
(1.0
)96
7 (2
.0)
967
(2.0
)1,
591
opt
1,59
1 op
t
Not
es:
(1) W
ork
as e
mpl
oyer
, se
lf-e
mpl
oyed
or
unpa
id f
amily
wor
ker
in t
he m
ain
or s
econ
dary
act
ivit
ies.
S
tand
ard
erro
rs (
in p
aren
thes
es)
are
clus
tere
d at
the
mun
icip
alit
y le
vel.
*
Sta
tist
ical
sig
nific
ance
at
10
%; **
Sta
tist
ical
sig
nific
ance
at
5%
; **
* S
tati
stic
al s
igni
fican
ce a
t 1
%

67
Annexes
Tabl
e A
7.
RD
Est
imat
es o
f th
e ef
fect
of
inte
rven
tion
s on
the
att
itud
es o
f th
e ho
useh
old
head
tow
ards
chi
ldre
n's
empl
oym
ent
and
scho
olin
g
Inte
nt-t
o-tr
eat:
OLS
est
imat
es
BA
ND
WID
TH
OP
TIM
AL
SM
AL
L
(1.0
)M
IDD
LE
(2.0
)F
UL
L S
AM
PL
EM
EA
N
FU
LL
S
AM
PL
E
My
child
ren
wor
k,
beca
use
it w
ill
give
the
m g
reat
er
oppo
rtun
itie
s in
the
fu
ture
No
covari
ate
sW
ith
Covari
ate
sN
o
covari
ate
sW
ith
Covari
ate
sN
o
covari
ate
sW
ith
Covari
ate
sN
o
covari
ate
sW
ith
Covari
ate
s
0.62
Pol
ynom
ial o
f or
der
10.
008
(0.1
23)
0.00
7
(0.1
27)
0.03
3
(0.1
14)
0.06
9
(0.1
25)
0.00
7
(0.1
11)
0.00
3
(0.1
13)
0.02
2
(0.0
47)
0.01
0
(0.0
42)
Num
ob
serv
atio
ns
(ban
dwid
th)
838
(1.8
)
838
(1.8
)
493
(1.0
)
493
(1.0
)
917
(2.0
)
917
(2.0
)
1,49
51,
495
Wor
k ke
eps
child
ren
out
of t
roub
le/g
ives
th
em d
irec
tion
Pol
ynom
ial o
f or
der
1-0
.084
*
(0.0
48)
-0.0
84**
(0.0
39)
-0.0
45
(0.0
43)
-0.0
22
(0.0
46)
-0.0
27
(0.0
27)
-0.0
31
(0.0
26)
-0.0
27
(0.0
55)
-0.0
23
(0.0
55)
0.58
Num
ob
serv
atio
ns
(ban
dwid
th)
592
(1.2
)
592
(1.2
)
493
(1.0
)
493
(1.0
)
917
(2.0
)
917
(2.0
)
1,49
51,
495
Wor
king
chi
ldre
n ar
e m
ore
resp
onsi
ble
than
no
n-w
orki
ng c
hild
ren
Pol
ynom
ial o
f or
der
1-0
.002
(0.0
30)
-0.0
05
(0.0
36)
-0.0
11
(0.0
65)
0.00
6
(0.0
77)
-0.0
02
(0.0
39)
0.00
3
(0.0
38)
-0.0
04
(0.0
25)
0.01
3
(0.0
26)
0.85
Num
ob
serv
atio
ns
(ban
dwid
th)
1,37
3
(4.4
)
1,26
2
(3.4
)
493
(1.0
)
493
(1.0
)
917
(2.0
)
917
(2.0
)
1,49
51,
495
Wor
king
chi
ldre
n ar
e st
rong
er a
nd h
ealt
hier
th
an n
on-w
orki
ng
child
ren
Pol
ynom
ial o
f or
der
1-0
.339
**
(0.1
53)
-0.4
03**
(0.1
97)
-0.1
16*
(0.0
61)
-0.1
21**
(0.0
61)
-0.0
65
(0.0
62)
-0.0
76
(0.0
55)
-0.0
18
(0.0
58)
-0.0
32
(0.0
53)
0.62
Num
ob
serv
atio
ns
(ban
dwid
th)
96
(0.2
)
96
(0.2
)
493
(1.0
)
493
(1.0
)
917
(2.0
)
917
(2.0
)
1,49
51,
495
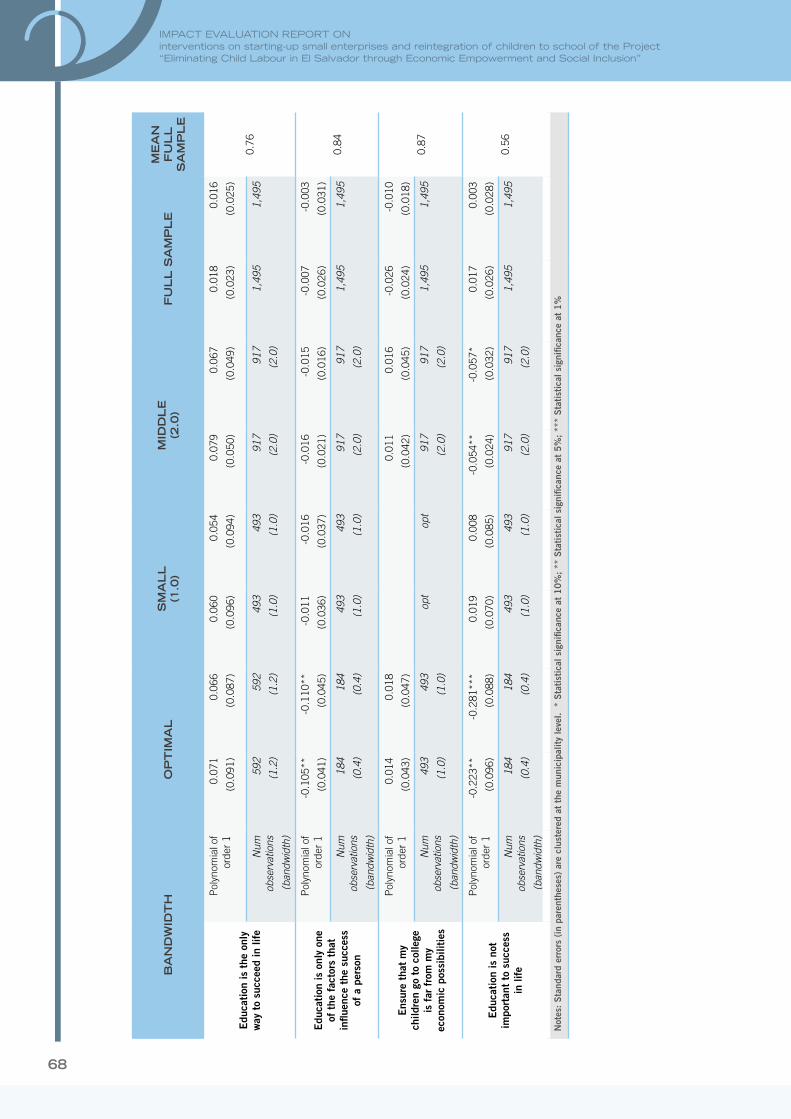
68
IMPACT EVALUATION REPORT ONinterventions on starting-up small enterprises and reintegration of children to school of the Project “Eliminating Child Labour in El Salvador through Economic Empowerment and Social Inclusion”
BA
ND
WID
TH
OP
TIM
AL
SM
AL
L
(1.0
)M
IDD
LE
(2.0
)F
UL
L S
AM
PL
EM
EA
N
FU
LL
S
AM
PL
E
Edu
cati
on is
the
onl
y w
ay t
o su
ccee
d in
life
Pol
ynom
ial o
f or
der
10.
071
(0.0
91)
0.06
6
(0.0
87)
0.06
0
(0.0
96)
0.05
4
(0.0
94)
0.07
9
(0.0
50)
0.06
7
(0.0
49)
0.01
8
(0.0
23)
0.01
6
(0.0
25)
0.76
Num
ob
serv
atio
ns
(ban
dwid
th)
592
(1.2
)
592
(1.2
)
493
(1.0
)
493
(1.0
)
917
(2.0
)
917
(2.0
)
1,49
51,
495
Edu
cati
on is
onl
y on
e of
the
fac
tors
tha
t in
fluen
ce t
he s
ucce
ss
of a
per
son
Pol
ynom
ial o
f or
der
1-0
.105
**
(0.0
41)
-0.1
10**
(0.0
45)
-0.0
11
(0.0
36)
-0.0
16
(0.0
37)
-0.0
16
(0.0
21)
-0.0
15
(0.0
16)
-0.0
07
(0.0
26)
-0.0
03
(0.0
31)
0.84
Num
ob
serv
atio
ns
(ban
dwid
th)
184
(0.4
)
184
(0.4
)
493
(1.0
)
493
(1.0
)
917
(2.0
)
917
(2.0
)
1,49
51,
495
Ens
ure
that
my
child
ren
go t
o co
llege
is
far
fro
m m
y ec
onom
ic p
ossi
bilit
ies
Pol
ynom
ial o
f or
der
10.
014
(0.0
43)
0.01
8
(0.0
47)
0.01
1
(0.0
42)
0.01
6
(0.0
45)
-0.0
26
(0.0
24)
-0.0
10
(0.0
18)
0.87
Num
ob
serv
atio
ns
(ban
dwid
th)
493
(1.0
)
493
(1.0
)
opt
opt
917
(2.0
)
917
(2.0
)
1,49
51,
495
Edu
cati
on is
not
im
port
ant
to s
ucce
ss
in li
fe
Pol
ynom
ial o
f or
der
1-0
.223
**
(0.0
96)
-0.2
81**
*
(0.0
88)
0.01
9
(0.0
70)
0.00
8
(0.0
85)
-0.0
54**
(0.0
24)
-0.0
57*
(0.0
32)
0.01
7
(0.0
26)
0.00
3
(0.0
28)
0.56
Num
ob
serv
atio
ns
(ban
dwid
th)
184
(0.4
)
184
(0.4
)
493
(1.0
)
493
(1.0
)
917
(2.0
)
917
(2.0
)
1,49
51,
495
Not
es:
Sta
ndar
d er
rors
(in
par
enth
eses
) ar
e cl
uste
red
at t
he m
unic
ipal
ity
leve
l. *
Sta
tist
ical
sig
nific
ance
at
10
%;
** S
tati
stic
al s
igni
fican
ce a
t 5
%;
***
Sta
tist
ical
sig
nific
ance
at
1%
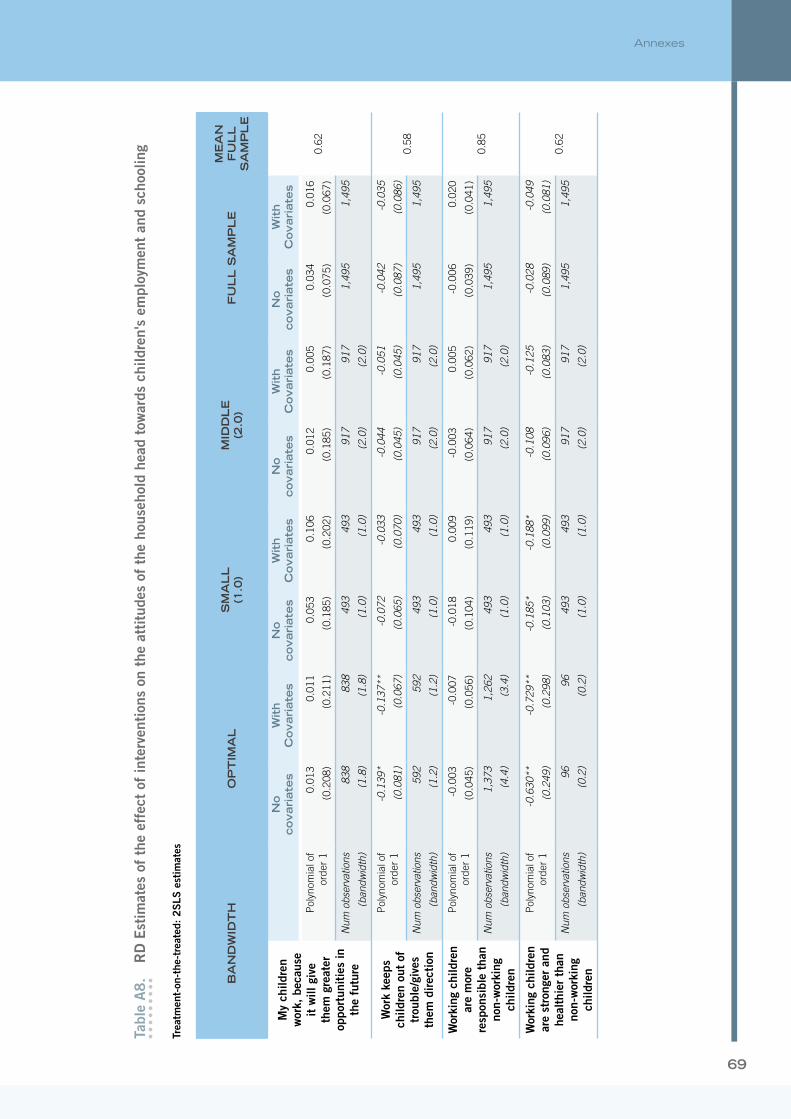
69
Annexes
Tabl
e A
8.
RD
Est
imat
es o
f th
e ef
fect
of
inte
rven
tion
s on
the
att
itud
es o
f th
e ho
useh
old
head
tow
ards
chi
ldre
n's
empl
oym
ent
and
scho
olin
g
Trea
tmen
t-on
-the
-tre
ated
: 2
SLS
est
imat
es
BA
ND
WID
TH
OP
TIM
AL
SM
AL
L
(1.0
)M
IDD
LE
(2.0
)F
UL
L S
AM
PL
EM
EA
N
FU
LL
S
AM
PL
E
My
child
ren
wor
k, b
ecau
se
it w
ill g
ive
them
gre
ater
op
port
unit
ies
in
the
futu
re
No
covari
ate
sW
ith
Covari
ate
sN
o
covari
ate
sW
ith
Covari
ate
sN
o
covari
ate
sW
ith
Covari
ate
sN
o
covari
ate
sW
ith
Covari
ate
s
0.62
Pol
ynom
ial o
f or
der
10.
013
(0.2
08)
0.01
1
(0.2
11)
0.05
3
(0.1
85)
0.10
6
(0.2
02)
0.01
2
(0.1
85)
0.00
5
(0.1
87)
0.03
4
(0.0
75)
0.01
6
(0.0
67)
Num
obs
erva
tions
(ban
dwid
th)
838
(1.8
)
838
(1.8
)
493
(1.0
)
493
(1.0
)
917
(2.0
)
917
(2.0
)
1,49
51,
495
Wor
k ke
eps
child
ren
out
of
trou
ble/
give
s th
em d
irec
tion
Pol
ynom
ial o
f or
der
1-0
.139
*
(0.0
81)
-0.1
37**
(0.0
67)
-0.0
72
(0.0
65)
-0.0
33
(0.0
70)
-0.0
44
(0.0
45)
-0.0
51
(0.0
45)
-0.0
42
(0.0
87)
-0.0
35
(0.0
86)
0.58
Num
obs
erva
tions
(ban
dwid
th)
592
(1.2
)
592
(1.2
)
493
(1.0
)
493
(1.0
)
917
(2.0
)
917
(2.0
)
1,49
51,
495
Wor
king
chi
ldre
n ar
e m
ore
resp
onsi
ble
than
no
n-w
orki
ng
child
ren
Pol
ynom
ial o
f or
der
1-0
.003
(0.0
45)
-0.0
07
(0.0
56)
-0.0
18
(0.1
04)
0.00
9
(0.1
19)
-0.0
03
(0.0
64)
0.00
5
(0.0
62)
-0.0
06
(0.0
39)
0.02
0
(0.0
41)
0.85
Num
obs
erva
tions
(ban
dwid
th)
1,37
3
(4.4
)
1,26
2
(3.4
)
493
(1.0
)
493
(1.0
)
917
(2.0
)
917
(2.0
)
1,49
51,
495
Wor
king
chi
ldre
n ar
e st
rong
er a
nd
heal
thie
r th
an
non-
wor
king
ch
ildre
n
Pol
ynom
ial o
f or
der
1-0
.630
**
(0.2
49)
-0.7
29**
(0.2
98)
-0.1
85*
(0.1
03)
-0.1
88*
(0.0
99)
-0.1
08
(0.0
96)
-0.1
25
(0.0
83)
-0.0
28
(0.0
89)
-0.0
49
(0.0
81)
0.62
Num
obs
erva
tions
(ban
dwid
th)
96
(0.2
)
96
(0.2
)
493
(1.0
)
493
(1.0
)
917
(2.0
)
917
(2.0
)
1,49
51,
495

70
IMPACT EVALUATION REPORT ONinterventions on starting-up small enterprises and reintegration of children to school of the Project “Eliminating Child Labour in El Salvador through Economic Empowerment and Social Inclusion”
BA
ND
WID
TH
OP
TIM
AL
SM
AL
L
(1.0
)M
IDD
LE
(2.0
)F
UL
L S
AM
PL
EM
EA
N
FU
LL
S
AM
PL
E
Edu
cati
on is
th
e on
ly w
ay t
o su
ccee
d in
life
Pol
ynom
ial o
f or
der
10.
118
(0.1
58)
0.10
7
(0.1
50)
0.09
7
(0.1
60)
0.08
3
(0.1
52)
0.13
2
(0.0
89)
0.11
1
(0.0
86)
0.02
7
(0.0
37)
0.02
4
(0.0
39)
0.76
Num
obs
erva
tions
(ban
dwid
th)
592
(1.2
)
592
(1.2
)
493
(1.0
)
493
(1.0
)
917
(2.0
)
917
(2.0
)
1,49
51,
495
Edu
cati
on is
on
ly o
ne o
f th
e fa
ctor
s th
at
influ
ence
the
su
cces
s of
a
pers
on
Pol
ynom
ial o
f or
der
1-0
.172
**
(0.0
72)
-0.1
81**
(0.0
72)
-0.0
18
(0.0
55)
-0.0
25
(0.0
54)
-0.0
26
(0.0
35)
-0.0
24
(0.0
26)
-0.0
11
(0.0
40)
-0.0
04
(0.0
49)
0.84
Num
obs
erva
tions
(ban
dwid
th)
184
(0.4
)
184
(0.4
)
493
(1.0
)
493
(1.0
)
917
(2.0
)
917
(2.0
)
1,49
51,
495
Ens
ure
that
m
y ch
ildre
n go
to
colle
ge
is f
ar f
rom
m
y ec
onom
ic
poss
ibili
ties
Pol
ynom
ial o
f or
der
10.
022
(0.0
71)
0.02
8
(0.0
75)
0.01
9
(0.0
70)
0.02
7
(0.0
74)
-0.0
41
(0.0
36)
-0.0
16
(0.0
29)
0.87
Num
ob
serv
atio
ns
(ban
dwid
th)
493
(1.0
)
493
(1.0
)
opt
opt
917
(2.0
)
917
(2.0
)
1,49
51,
495
Edu
cati
on is
no
t im
port
ant
to
succ
ess
in li
fe
Pol
ynom
ial o
f or
der
1-0
.366
**
(0.1
85)
-0.4
65**
*
(0.1
74)
0.03
0
(0.1
09)
0.01
2
(0.1
31)
-0.0
91**
(0.0
43)
-0.0
94*
(0.0
56)
0.02
6
(0.0
39)
0.00
5
(0.0
43)
0.56
Num
ob
serv
atio
ns
(ban
dwid
th)
184
(0.4
)
184
(0.4
)
493
(1.0
)
493
(1.0
)
917
(2.0
)
917
(2.0
)
1,49
51,
495
Not
es:
Sta
ndar
d er
rors
(in
par
enth
eses
) ar
e cl
uste
red
at t
he m
unic
ipal
ity
leve
l. *
Sta
tist
ical
sig
nific
ance
at
10
%;
** S
tati
stic
al s
igni
fican
ce a
t 5
%;
***
Sta
tist
ical
sig
nific
ance
at
1%

71
Annexes
�Annex 4. Impact evaluation design
Acknowledgements
The design of the impact evaluation has been carried out in close collaboration with the project team and the government counterparts. The government formally agreed to carry out an impact evaluation of some interventions of the project on the basis of a vulnerability index. The project team has continuously supported the development of the IE design with its suggestions and assessments of constraints. It has also carried out the preparatory fieldwork with great care and insured the support of the different stakeholders.
Funding for this project was provided by the United States Department of Labor. This doc-ument does not necessarily reflect the views or policies of the United States Department of Labor, nor does mention of trade names, commercial products, or organizations imply en-dorsement by the United States Government.
1. Outline
The most recent information on child labor in El Salvador shows that around 1 out of 10 children in the country (177,070 boys, girls and adolescents) worked in 2010. The ILO project called “Eliminating Child Labour in El Salvador through Economic Empowerment and Social Inclusion” attempts to eradicate child labor in El Salvador. To achieve this objective the project will implement a large range of interventions at three levels: macro (national policies and institutional framework), meso (target municipalities and schools) and micro (child laborers’ households).
One set of household level interventions, which is to be implemented in 5 municipalities in El Salvador, will be the object of an impact evaluation. This set consists of education interven-tions for child laborers (and their siblings), vocational training for their mothers, and an ex-tensive child labor monitoring system administered by local municipalities. Initial discussions considered the possibility to evaluate only the impact of the vocational training of mothers of child laborers. However, as explained in this document, the setup of the project does not allow for the identification of the separate impact of this intervention or other individual com-ponents of the project.
The project will allocate this set of interventions to beneficiaries within the 5 municipalities on the basis of a vulnerability index. Households with high vulnerability scores will be offered the interventions, households with lower scores will not. The impact evaluation will exploit this allocation procedure in a regression discontinuity framework to identify the causal effect of the set of interventions on education, child labor, participation in labor of adult household members, and multiple other wellbeing indicators. By identifying the causal effect of this set of interventions, the impact evaluation can provide a unique insight into the functioning and effectiveness of the ILO’s approach of integrated child labor programs.1
1 For a discussion of several issues relating to the impact evaluation of ILO/IPEC child labour programs see UCW (2009a and 2009b) and Manacorda (2009)

72
IMPACT EVALUATION REPORT ONinterventions on starting-up small enterprises and reintegration of children to school of the Project “Eliminating Child Labour in El Salvador through Economic Empowerment and Social Inclusion”
This document provides a detailed description of the design of the impact evaluation. In section 2 it starts by sketching the background of the project and providing detailed information on its objectives and the interventions that will be implemented to reach these objectives. Section 3 discusses how the interventions will be allocated to beneficiaries. Section 4 explains how these allocation mechanisms can be exploited to measure the impact of the interventions. Section 5 discusses the data sources on which the impact evaluation will be based. Section 6 provides information on some technical issues, some issues to be determined, and a few possible exten-sions of the basic impact evaluation. Section 7 gives an overview of the limitations of the (design of) the impact evaluation. Finally, section 8 provides a timeline of the project.
2. The Project
2.1 Background2
2.1.1 El Salvador
The territory of the Republic of El Salvador covers an area of 21,040.79 km. The country is divided in 14 departments which in turn comprehend 262 municipalities. In 2009, El Salva-dor’s population was estimated at 6,150,9533. Sixty three percent of the population is urban and 53 % is female. Population growth rate is 1.69% (2007 est.) and fertility rate is 3.08 chil-dren per woman. Population growth is compensated by El Salvador’s high rate of emigration, a continuous trend during the last three decades.
In 2009, El Salvador’s Human Development Index of 0.747, ranked it in 106th position out of 182 countries reviewed. The Adult literacy rate (ages 15 and above) is 82%. Life expectancy at birth (2008 est.) is 72.06 years; but while it is 75.84 years for women it is just 68.45 years for men. This difference is due to the high rate of violent death for men, largely due to the social violence that has been affecting the country for the past two decades, after the end of the armed conflict.
According to the World Bank4 (WB), in 2009, the gross national income per capita was U$ 3,370. However, this gross figure does not reflect the wide inequalities in income distribution (and opportunities) among different departments and municipalities, which have shown no improvement during the recent past.
The Salvadoran economy is characterized by a large informal sector. A study5 supported by the Economic Policy Institute found that the informal sector represents 69% of Salvadoran economy and a large portion of its labor market. A significant number of informal workers, 62%, earn less than the minimum wage and 21% have no formal education. The Salvador-an economy is heavily dependent on the United States, both for exports and as a source of remittances from Salvadoran workers living there. As a result, following the global financial
2 This section is based on the Project Document, ILO (2010).
3 Ministerio de Economía – General Directorate of Statistics and Census (DIGESTYC), Encuesta de Hogares de Propósitos Múltiples (EHPP) 2009; Delgado, July 2010.
4 http://siteresources.worldbank.org/DATASTATISTICS/Resources/GNIPC.pdf
5 Tony Avirgan, L. Josh Bivens & Sarah Gammage, eds. (2005), Good Jobs, Bad Jobs, No Jobs: Labor Markets and Informal Work in Egypt, El Salvador, India, Russia, and South Africa; GPN/EPI, Washington D.C.

73
Annexes
crisis, in 2009 the Salvadoran economy contracted by 3.5% (while in 2008 it had grown 2.4%), as both exports and remittances dropped sharply.
Agriculture activities are the main source of employment and account for a large part of na-tional exports. There is a clear difference between the culture of commercial products and those for the household’s own consumption. The first ones involve large plots where sugar cane, corn or coffee are produced with modern techniques and supplies, while the second involve small household plots with limited productivity, where beans, corn and rice are pro-duced. During harvest time, entire households with small children move to the coffee zones and from one finca to another in order to make a living.
El Salvador faces serious public security challenges. Violence associated to gang-crimes runs high. In 2006 the country had the highest violent crime rate in the Latin American Region: 65 homicides per 100,000 inhabitants (the average for the region is 25 per 100,000 and for the world: 9 per 100,000). In 2008, El Salvador was the country with the second highest crime rate in the region.
El Salvador is home to multiple social protection programs. Two important programs are PATI and Red Solidaria. PATI is a government-run public works program, which provides train-ing and temporary employment opportunities in community projects. Red Solidaria is also a government-run program. It provides cash transfers conditional on adherence to several schooling and health related requirements to the poorest population of El Salvador. In addi-tion, it attempts to strengthen basic services such as education and health and it supports small-scale projects that aim to increase the productivity of poor agricultural producers.
2.1.2 Child Labor in El Salvador
The most recent information available on the number of child laborers in El Salvador6 shows that around 1 out of 10 children (e.g., 177,070 boys, girls and adolescents) worked in 2010. Those child labor figures represent a slight reduction (6.3%) with regards to the 2009 child labor estimates. Approximately 73% of child laborers are boys. Most child laborers (62%) live in rural areas and more than half of child laborers work in agricultural activities. A majority of child laborers (61%) work with their family and receive no pay. Twenty-two percent of work-ing children work in temporary jobs.
Common hazardous child labor in El Salvador includes cutting of sugar cane, fishing (par-ticularly mollusk extraction), harvesting coffee, other forms of agricultural activity, carrying weights in trades and street vending. Children in these activities work for long hours, under the rain or sun, with no gear protection. Additional forms of hazardous child labor in which a lesser number of children are involved include: recycling of garbage, fireworks production and domestic work.7 In addition to hazardous child labor, the other more common worst forms in El Salvador include commercial sexual exploitation and the use of children for illicit activities (e.g., drug trafficking).
6 Ministerio de Economía – DIGESTYC, “Midiendo el Trabajo Infantil en la Encuesta de Hogares de Propósitos Múltiples, EHPM 2010”. Presentation, June 2011.
7 El Salvador has not yet approved a list of activities to be considered as hazardous child labor, although local stakeholders are in the process of discussing this issue. The specific activities mentioned in this paragraph have been considered as hazardous child labor by other countries.

74
IMPACT EVALUATION REPORT ONinterventions on starting-up small enterprises and reintegration of children to school of the Project “Eliminating Child Labour in El Salvador through Economic Empowerment and Social Inclusion”
2.2 Project Objectives
The Eliminating Child Labour in El Salvador through Economic Empowerment and Social Inclusion project aims to achieve the following 6 objectives:
i. By the end of the project, child labor elimination strategies will have been adopted by national and local institutions that implement poverty reduction, decent work, and social protection programs for the rural and urban poor;
ii. By the end of the project, child labor law enforcement and protection mechanisms, par-ticularly for the worst forms of child labor, will be developed and fully operational;
iii. By the end of the project, national capacity to conduct child labor research, monitoring and impact evaluation will be enhanced and pilot interventions documented;
iv. By the end of the project, municipal capacity to prevent and eliminate child labor, in particular the worst forms, will have been strengthened;
v. By the end of the project, viable improved livelihood alternatives will have been imple-mented to reduce family reliance on child labor in target municipalities;
vi. By the end of the project, inclusive education models will have been implemented in selected schools in target municipalities to prevent and reduce child labor and improve education indicators.
2.3 Interventions Selected for Impact Evaluation
The ILO plans to implement a large number of interventions to achieve these 6 objectives. Some of these interventions will be implemented at the national level, some in selected municipalities, some in selected schools, and some will be targeted at selected households. One set of household level interventions will be the object of an impact evaluation. The set consists of a combination of vocational training for mothers, a group of “flexible” education interventions for their children, and a direct beneficiary monitoring system.
This set of interventions was selected primarily because it will be implemented on a suffi-ciently large scale to conduct statistical analysis. The other interventions implemented by the project are of interest too and would merit rigorous evaluation. However, such rigorous evaluation is not possible because these interventions are either administered to a smaller number of individuals, clustered in a small number of geographical areas, or administered at the national level. This sub-section describes the evaluated interventions in more detail.
2.3.1 Vocational Training of Mothers
Vocational training will be provided to 2000 selected mothers of child laborers within 5 se-lected municipalities. This vocational training intervention should help the mothers of child laborers either to enter the labor market or to start a small enterprise. The resulting additional income generated by these activities should reduce their household’s dependence on child labor.
75
Annexes
The project team is currently developing two main types of vocational training courses. One type will prepare participants to start a small enterprise and the other to enter the labor mar-ket. The women who participate in the intervention can choose one of these training courses according to their needs and preferences.
The vocational training program will be preceded by an orientation course offered by El Sal-vador’s Ministry of Labor. This orientation course will help the women who enter the program decide which type of vocational training course to enter. Upon completion of the vocational training program, the mothers will be provided with additional services either in the form of job placement or in the form of tools, supplies, and technical support to start a small business.
2.3.2 Monitoring
The ILO will monitor the school attendance and participation in child labor of the children of the mothers selected to participate in the vocational training program. In practice, this means that the ILO keeps a record of the interventions administered to individual beneficiaries. As part of keeping this record, the ILO, the implementing agencies, or monitors trained in the local community will regularly be in touch with the beneficiaries to check whether they participate in the interventions and whether this participation is accompanied by behavioral changes such as improved school attendance. Technically, the ILO does not perceive this so-called direct beneficiary monitoring and reporting system (DBMR) as an intervention, but as a part of its evaluation system. However, from the perspective of the impact evaluation it should be interpreted as an intervention, as it is likely to affect household decisions on edu-cation and children’s work decisions.8
The project team plans to train officials of the administration in each of the 5 municipalities to execute the monitoring work. Monitoring will consist of an interview with the head of the household on a 3 month basis. In addition, monitoring may include spot checks in schools and meetings with other people in the community to verify that the information given by the household is correct. The project team will encourage the local administration to expand this system of regular checks to all individuals in the community and to continue this process after the ILO project is over.
The goal is to provide referral services when children are found to be working or not attending school. The project team will work with the local administration to identify local organizations and opportunities to provide such services. The ILO will not fund these activities as such, but will provide training and technical support to make sure they get started.
2.3.3 Flexible Education Interventions
In addition, the ILO will provide so-called “flexible” education interventions (modalidades flexibles) to 12 to 17 year olds who failed to complete their basic education and who live in the households of the mothers who receive vocational training. These interventions will differ according to the needs of the 12 to 17 year olds who failed to complete their education. Flex-ible education can include the following interventions:
8 Moreover, as discussed in some more detail below, the DBMR may result in biased responses of program beneficiaries, in particular to questions that determine their eligibility status.

76
IMPACT EVALUATION REPORT ONinterventions on starting-up small enterprises and reintegration of children to school of the Project “Eliminating Child Labour in El Salvador through Economic Empowerment and Social Inclusion”
� Accelerated education in which the final grades of secondary school are finished in a shortened period of time;
� Weekend education;
� Online education;
� Evening education;
� Participation in a government exam (called Examen de Suficiencia), completion of which allows the individual to re-enter the regular education system at the appropriate level.
The project team is currently in the process of designing these interventions.
2.4 Interventions Not Selected for Impact Evaluation
The three direct-beneficiary interventions that will be the object of the impact evaluation are part of a bigger group of interventions to be implemented in these 5 communities. This sub-section describes these other interventions. A full description of all (other) interventions that will be implemented (at the national, community, school, and household level) as part of the project is available from the project team.
2.4.1 Inclusive Education
Faced with multiple shortcomings, El Salvador is currently redesigning its education system. The aim is to make sure that El Salvador’s schools start to provide “inclusive education” (escuela inclusiva a tiempo pleno). Inclusive education entails longer school days (typically school days now last for half a day) and an overhaul of the curriculum.9 The ILO will help the schools attended by the children of mothers who receive the vocational training intervention (as well as the schools of children in households that receive either the vocational training for youths or the agricultural productivity interventions) to implement inclusive education. The project team is currently in the process of designing these interventions.
2.4.2 Strengthening Capacity of Local Administration
Finally, the ILO will attempt to strengthen the capacity of the local administration to address child labor issues. As part of this process, the ILO will attempt to raise local officials’ aware-ness of child labor issues in the community and will help the municipality to establish a local committee that deals with these issues. It will provide technical support to help the commit-tee implement national policies with respect to child labor. The project team is currently in the process of designing these interventions.
9 See also the document called “De la escuela tradicional a una escuela inclusiva de tiempo pleno” of El Salvador’s Ministry of Education.

77
Annexes
3. Selection Procedures
This section describes how the project will assign the described interventions to municipali-ties, and schools and households within the selected municipalities. As will be explained in more detail below, this assignment procedure is crucial for the impact evaluation as it allows for the identification of a credible control group.
3.1 Selection of Target Municipalities
The project team started by selecting a group of 10 municipalities that participate in the in-terventions. In order to select these municipalities the project team first produced a shortlist. To appear on the shortlist, municipalities had to:
� Have a high child labor rate. In order to determine child labor rates, the project team used the 2009 school census which contains information on participation in work for all children attending school (either basic education, “bachillerato general” or “bachillerato técnico”).10 Municipalities in which the child work rates among children in school ex-ceeded 6.2% were considered to be municipalities with a high child labor rate.
� Be reasonably safe to ensure that it is possible to implement the necessary fieldwork. Municipalities were considered to be safe if they had a homicide and extortion rate of 128 per 100,000 inhabitants or lower according to the national police.
� Have more than 19,000 inhabitants to make certain that an overall target of 5000 house-holds with child laborers could be reached by all household level interventions.
The shortlist of 21 municipalities that resulted from these criteria can be found in appendix 1.
Subsequently, the project team made a map that displayed all of the shortlisted municipali-ties. Given that it was the initial goal of the project to end up with 5 to 12 municipalities, the project team then selected 12 municipalities that were reasonably close to each other. This procedure ensured that travel costs that would be incurred to setup and run the project could be minimized.
This group of 12 was supposed to be the final group of selected municipalities. However, a few changes to this selection took place at a later stage. First, the project team narrowed down the number of selected communities to 10 to reduce the scale and costs of the project. This was done by removing the 2 selected municipalities with the lowest child work rates according to the 2009 school census: San Antonio del Monte and Santiago de Maria. Then, the team made a few further changes as the 2010 school census became available. Specif-ically, the team removed 2 municipalities, Guaymango and San Pedro Masahuat, because they did not have high child work rates according to the 2010 school census. It replaced these 2 municipalities with 2 other municipalities that did have sufficiently high child work rates according to the 2010 school census and were geographically close to the other 8 se-lected communities: Santiago Nonualco and Santiago de Maria (which had previously been removed). A map of the selected municipalities can be found in appendix 2.
10 Basic education in El Salvador consists of 9 years of education divided into 3 cycles of 3 years each. Pupils are supposed to enter basic education when they are 6 years old and finish when they are 15 years old. Basic education is followed by a 2 year “bachillerato” degree.

78
IMPACT EVALUATION REPORT ONinterventions on starting-up small enterprises and reintegration of children to school of the Project “Eliminating Child Labour in El Salvador through Economic Empowerment and Social Inclusion”
Next the 10 final selected municipalities were divided into 3 groups for organizational rea-sons. The two selected municipalities with the highest child work rates according to the 2010 school census were grouped together. These two municipalities will participate in a first wave of interventions not described in this document. The 5 municipalities with the next highest child work rates were grouped together and so were the 3 municipalities with the lowest child work rates according to the 2010 school census. The latter two groups will respectively participate in a second wave of interventions (the interventions described above) and a third wave of interventions. In total the three waves of interventions should reach 5000 beneficiary households.
The impact evaluation will focus on the interventions that will be implemented in the second wave of the project (i.e. in the group of 5 municipalities with intermediate child work rates). Table 1 provides an overview of the child work rate, total population and the crime rate (hom-icide and extortion per 100,000 inhabitants) in the wave 2 municipalities.
Table 1. Basic Information on Selected Municipalities
MunicipalityUrban or rural
Child work rate Population
Crime rate
Tacuba Rural 15,4 30.718 68
Izalco Urban 8,4 74.085 115
San Luis la Herradura Rural 7,9 21.388 122
Tecoluca Rural 7,9 25.344 55
Santiago Nonualco Rural 6,3 41.287 63Child labor rate is the percentage of working children identified in the 2010 school census. Population estimates based on 2007 population census. Crime rates (homicide and extortion per 100,000) based on 2010 national police statistics.
3.2 Selection of Target Cantons
Within each of the selected wave 2 municipalities a group of cantons was selected into the project. Selection of cantons took place on the basis of the information available from the 2010 school census and the 2007 population census. Cantons were selected if they had high numbers of child laborers according to the school census and had high child labor ratios.11 However, explicit thresholds for the selection cantons were not established. In total, the pro-ject team selected 28 cantons in the 5 municipalities.
3.3 Selection of Direct Beneficiaries
Within the identified wave 2 cantons selection of beneficiary households will be conducted on the basis of a vulnerability index. This index will be established using information pro-vided by households during the baseline interview. Table 2 displays the vulnerability index proposed by the project team.
11 As suggested by the number of child laborers in the school census divided by the total canton population according to the 2007 census.

79
Annexes
Households with high vulnerability scores (i.e. vulnerability scores above a predetermined threshold) will receive the set of interventions that will be evaluated: vocational training for mothers, flexible education interventions for 12 to 17 year olds who failed to complete their basic education, and monitoring of child labor and school participation. Households with a vulnerability score below the threshold will not receive this set of interventions.
3.4 Selection of Target Schools
All the schools attended by households with working children will receive the inclusive edu-cation interventions described above.
Table 2. Proposed Vulnerability Index
Vulnerability score
The household head is not married 20
The household head is married 12
Wall material: Lamina, paja o palma o materiales de desecho 7
Wall material: Bahareque, adobe o madera 4
Wall material: Concreto mixto 1
Floor material: Tierra 6
Floor material: Ladrillo de cemento(o de barro), o de cemento
4
Roof material: Paja o Palma o materiales de desecho 7
Roof material: Loza de concreto, teja de barro o cemento, lámina de asbesto ( o metálica)
4
Ratio of unemployed 18 to 25 year olds to total number of 18 to 25 year olds in the household = 1
20
0.5 <= Ratio of unemployed 18 to 25 year olds to total number of 18 to 25 year olds in the household < 1
12
Ratio of unemployed 18 to 25 year olds to total number of 18 to 25 year olds in the household < 0.5
4
Ration of 5 to 17 year old children who work to total number of 5 to 17 year old children in the household = 1
20
0.5 < =Ratio of 5 to 17 year old children who work to total number of 5 to 17 year old children in the household < 1
12
Ratio of 5 to 17 year old children who work to total number of 5 to 17 year old children in the household < 0.5
4
Household located in extremely precarious urban area 20
Household located in precarious urban area 14
Household lives in other urban area 4

80
IMPACT EVALUATION REPORT ONinterventions on starting-up small enterprises and reintegration of children to school of the Project “Eliminating Child Labour in El Salvador through Economic Empowerment and Social Inclusion”
4. Estimation Strategy: Regression Discontinuity
The impact evaluation will examine the impact of the set of interventions described above on households’ wellbeing. That is, it will seek to establish which of the observed changes in wellbeing indicators among project beneficiaries can be directly attributed to the project. To identify the causal effect of this set of interventions, the impact evaluation must estimate a counterfactual outcome: the wellbeing indicators that would have been observed among project beneficiaries in absence of the project. This counterfactual outcome is unobserved by definition. However, a valid counterfactual can be established by identifying a comparison group that is similar to the group of beneficiaries at the start of the project in all respects, except that they do not participate in the intervention. 12
To identify a credible comparison group, the impact evaluation of the ILO project in El Salva-dor will exploit the fact that the set of interventions is assigned on the basis of a vulnerability index using the so-called regression discontinuity methodology. The intuition behind the regression discontinuity methodology is that households (and members of households) with a vulnerability score just below the threshold are similar to households with a vulnerability score just above the threshold. These households therefore serve as a valid control group to measure the impact of the set of interventions.13
4.1 Graphical Explanation
Figures 1 and 2 below provide a graphical explanation of the regression discontinuity meth-odology (using fictional data). Figure 1 shows the hypothesized relationship between house-holds’ vulnerability scores and child labor before the start of the interventions. Dots represent local child labor averages at the vulnerability scores and the lines are linearly fitted regres-sions. There is a clear positive relationship between vulnerability in child labor. However, there is no jump in child labor at the threshold (which is set at 50 in this graph).
Figure 2 shows the hypothesized relationship between vulnerability and child labor after the interventions have been implemented. The relationship is still positive. However, there is now a clear discontinuity in the probability that children are in child labor at the threshold score. This discontinuity represents the local causal effect of the interventions on child labor.
12 For detailed yet accessible introductions to impact evaluation and methods that can be used to establish a control group the reader is referred to Duflo et al. (2008), Gertler et al. (2011) and Khandker et al. (2010).
13 The project initially aimed to implement a randomized experiment to measure the impact of the interventions. However, the Government of El Salvador did not support such an approach and as a consequence it was decided to adopt this quasi-exper-imental approach.

81
Annexes
Figure 1. Hypothesized relationship between vulnerability scores and child labor before the start of the intervention
Figure 2. Hypothesized relationship between vulnerability scores and child labor after the start of the intervention

82
IMPACT EVALUATION REPORT ONinterventions on starting-up small enterprises and reintegration of children to school of the Project “Eliminating Child Labour in El Salvador through Economic Empowerment and Social Inclusion”
4.2 Estimating the Intent-to-Treat Effect
To gauge the size of this discontinuity, we will estimate the following sharp regression discon-tinuity equation:
∆Yhm = α+βD + ∑k≥1 γk (X - c)k + ∑k≥1 δk D(X - c)k + εhm , (1)
where ∆Yhm is the change in the outcome of interest for household h in municipality m, α is the intercept, D is a dummy taking the value 1 if a household was selected to receive the set of interventions (i.e. had a vulnerability score above the threshold), the term ∑k≥1 γk (X - c)k is a polynomial of order k that approximates the relationship between the outcome of inter-est and the distance of a the household’s vulnerability score X to the threshold score c. The term includes the dummy for selection into the interventions and thus allows for a different functional form of the polynomial above and below the threshold score. The error term ∑(k≥1) δk D(Xv - c)k captures all other determinants of the outcome of interest. The estimated coef-ficient D gives the average local effect of a households being offered the set of interventions (the intent-to-treat effect).
The regression discontinuity approach will yield consistent parametric estimates of the intent-to-treat effect if the specified polynomial correctly approximates the relationship between the distance of the village’s forcing variable to the cutoff scores (X-c) and outcome Yhm. Misspec-ification becomes more likely when observations further from the cutoff score are used. The estimation should therefore check for the robustness of the estimated results within multiple bandwidths around the cutoff scores.
Fixed effects will be incorporated to deal with potential differences between municipali-ties / cantons. Municipality, household, and child level controls can be included to increase the precision of the estimates. The optimal order of the polynomial can be determined based on the Akaike information criterion (AIC) following Lee and Lemieux (2010). The preferred bandwidth can be determined using a cross-validation criterion proposed by Imbens and Lemieux (2008).
4.3 Validity Checks
The regression discontinuity design provides a valid method to identify a control group if households cannot precisely manipulate their vulnerability index to self-select into the inter-ventions and if households just above and just below the vulnerability index are truly similar before the start of the interventions. In the case of the project in El Salvador, there is little reason to believe that the regression discontinuity design will not generate a valid control group. First, when people participate in the baseline interview, they do not know that they might be eligible to participate in an intervention, nor that eligibility will be determined on the basis of their answers during this interview. Second, the threshold scores will not yet have been determined at the time of the baseline interview. There is thus little room for precise manipulation of the vulnerability index. Finally, we know that in Red Solidaria (an integrated program that provides cash transfers, micro-credit, education, health, and nutritional ser-vices to poor households in El Salvador) that the regression discontinuity assumptions were satisfied which gives us more confidence in the methodology.

83
Annexes
There are several procedures that can be used to check whether the regression discontinuity design indeed establishes a credible control group. First, McCrary (2008) proposed a test that looks at the density of the forcing variable (in this case the vulnerability index) around the threshold. If people bunch just below or above the threshold, this can be a sign that individ-uals are able to manipulate the forcing variable. Second, it is possible to check for continuity in observed baseline covariates at the threshold to ensure that there are no (observed) dif-ferences between the control and the intervention group. Both of these checks will be done when the baseline data have been collected and the threshold has been determined.
5. Data Sources and Outcome Indicators
This section discusses the data sources that will be used in the impact evaluation. The main data sources will be a census and a baseline survey (to be administered before the beginning of the project) and a follow-up survey (to be administered towards the end of or shortly after the end of the project). To the extent possible we will substantiate the self reported data from these surveys with other data sources.
5.1 Census
A census will be administered to all households in the selected cantons. The census will gather information on some basic characteristics of household members: age, gender, school participation, highest level of schooling attained, and work in the week and year prior to the interview. The census instrument is available from the team in El Salvador or UCW on re-quest.
5.2 Baseline Survey
Subsequently, a more in-depth baseline survey will be administered to all households which, according to the census, have 5 to 17 year old working children. The baseline survey con-tains the following 7 sections:
1. A household roster that collects basic information on household members (age, gender, relationship to household head, and marital status) and on education (current school participation, highest level of education attended, ability to read and write);
2. A section on the characteristics of the house inhabited by the household and access to durable goods;
3. A section on economic activities of the adult household members;
4. A section on participation in credit schemes by the household members;
5. A section on participation in other social protection programs;
6. A section on chores and economic activities by minors living in the household;

84
IMPACT EVALUATION REPORT ONinterventions on starting-up small enterprises and reintegration of children to school of the Project “Eliminating Child Labour in El Salvador through Economic Empowerment and Social Inclusion”
7. A section on the respondent’s attitudes towards child labor.
The vulnerability scores for households (that determine whether they are eligible to partic-ipate in the set of interventions) will be calculated on the basis of this survey. The baseline survey instrument is available from the team in El Salvador or UCW on request.
5.3 Follow-up Survey
Both the census and baseline survey will be administered before the start of the interven-tions. A follow-up survey will be administered when the main interventions are completed (the monitoring work will still be going on). The follow-up survey will be an in-depth interview administered to the households that also participated in the baseline survey. The follow-up survey has not yet been designed. It will be similar to the baseline survey, but may be some-what more extensive.
The outcome variables measured in the baseline and follow-up survey will be used in the regression discontinuity estimations described earlier. The subsections below describe the main outcome indicators that will be investigated by the impact evaluation: children’s work, school participation, and adult work.
5.3.1 Children’s work
To measure the impact of the interventions on children’s work detailed information on the activities in which children are involved during the baseline and follow-up survey will be col-lected. These activities include both remunerated and non-remunerated economic activities (work in agriculture, work in non-agricultural enterprises etc.). They also include non-eco-nomic activities, such as household chores. Information will be collected both for the week prior to the interview and the year prior to the interview.
To better understand children’s activities and to be able to classify these activities as (worst forms) child labor the surveys will also establish the amount of time children spend in these activities, what remuneration the children received and who decides how the income earned by the child is spent. Moreover, information on the circumstances under which children work (such as work in dusty or noisy environments) and injuries suffered during work will be collected to identify hazardous work.
5.3.1 School Participation
In the baseline and follow-up survey, special attention will be paid to school participation. We will examine a series of other school related outcomes (such as the highest grade of school attended) and indicators of learning in school (such as ability to read and write and passing the grade attended by the pupil). We will examine both school participation in general and participation in the flexible education interventions implemented as part of the program.

85
Annexes
5.3.2 Adult Work
Given that the vocational training for women aims to let women enter the labor force or start a small business, we would expect to find substantial movement here. These movements may not only involve women who participate in training (as they become more involved in income generating activities), but also other adult members of the household. To investigate these issues, information on work will be collected for all adult members of the household. Similar to the section on children’s work, this section will investigate multiple aspects of adult labor, including sector, working hours, wages, and training. The survey also collects information on social security provided by the employer.
5.4 DBMR
The ILO will collaborate with local authorities to monitor the school attendance and participa-tion in child labor of the children of the mothers selected to participate in the vocational train-ing program on a three month basis. This monitoring work will result in a direct beneficiary monitoring database (typically called DBMR). The project team will set the DBMR up with unique identifying variables so that it can be linked to the census, baseline, and follow-up survey.
5.5 Project Monitoring
In addition, the impact evaluation will rely on information from the project’s monitoring sys-tem. For each household in the baseline survey, the project monitoring system will provide the following information:
i. Interventions offered to the household
ii. Whether the intervention was accepted by the household
iii. Whether the household participated regularly in the interventions
iv. Content of the interventions
v. Implementing agency
5.6 Triangulation
The monitoring work (DBMR) could potentially lead to substantial bias in answers to the follow-up survey. The households in the intervention group will have been subject to regu-lar checks on child labor and school participation. The members of these households may therefore be inclined to deny that children participate in work and confirm that children are in school, even when this is not correct. To come up with reliable measures of school participa-tion and children’s work the project team will explore the possibility to use additional sources of information to substantiate the survey data.

86
IMPACT EVALUATION REPORT ONinterventions on starting-up small enterprises and reintegration of children to school of the Project “Eliminating Child Labour in El Salvador through Economic Empowerment and Social Inclusion”
6. Technical Issues, Issues to Be Determined, and Possible Extensions
6.1 Power Calculations and Sample Size
To identify the impact of the household level interventions (vocational training for mothers, monitoring, and flexible education) the regression discontinuity design requires a sufficiently large group of households to be located above and below (and preferably close to) the es-tablished threshold in the vulnerability index. We conducted power calculations to determine what impact size we can expect to identify at reasonable levels of statistical significance and at different control group sizes. The calculations use the Jujutla pilot data as a starting point. These pilot data show that, in households with working children, 74% of the children in the data can be classified as working. Approximately 27% of all 18 to 45 year old women in these households have paid employment and the average monthly earnings of the 18-45 year old women in these households are US$ 28 (with a standard deviation of 56). 14 (The outcomes of our power calculations can be found in appendix 3.)
With a control group of 720 to 990 households, we find that the we will be able to detect a decrease in the proportion of working children of 10 percentage points and an increase in the proportion of working women by 10 percentage points with reasonable levels of statistical power (at significance levels of 5 and 10%).15 If the decrease in the proportion of working children or the increase in the proportion of working women is only 8 percentage points we can achieve a reasonable level of statistical power only with high sample sizes (990 or higher) and low levels of significance (10%). Similarly we are able to detect an increase in average monthly earnings of women of 12 US$ with reasonable levels of statistical power. But lower earnings increases are harder to detect, particularly for lower sample sizes and lower levels of statistical significance.
The minimum impact sizes that we can detect with the current regression discontinuity setup are comparatively large. Attanasio et al. (2009) estimate that a vocational training program previously implemented in Colombia increased the incidence of paid employment among women (54% in the control group) by 5 to 5.7 percentage points (intent to treat effect). It increased monthly salary earnings of women (166 Peso in the control group) by 30 to 34 Peso or 18 to 20% (intent to treat effect).16 It is likely that we will not be able to statistically establish a beneficial impact of the program in El Salvador, if the actual impact is comparable with that of the program evaluated by Attanasio et al. (2009).
Table 3 investigates the number of households with working children we currently expect to find in the selected cantons during the baseline survey. For each of the selected municipal-ities (and a pilot municipality called Jujutla), the first two columns show the total number of cantons and the number of selected cantons. The next two columns then show the number
14 The power calculations were conducted using the “sampsi” routine in Stata. Sampsi can be used for power calculations in randomized experiments. Cappelleri et al (1994) and Goldberger (1972) observed that the sample size for regression disconti-nuity designs should be approximately three times that of a randomized experiment to achieve equivalent statistical power and we follow this rule of thumb. The calculation assumes that the intervention group consists of 2000 households.
15 Power above 0.8 is typically deemed acceptable.
16 We have no information on the impact of this program on child labor, nor are we aware of any other studies that register the impact of vocational training of adult women on the labor outcomes of their children.

87
Annexes
of children in school and in work both in the entire municipality and in the selected cantons according to the 2010 school census.
The number of households with working children is not necessarily equal to the number of children in school and in work according to the school census. A share of the working children may, for instance, not appear in the school census as they do not attend school. And multiple children identified as working and in school by the school census may live in the same household. In fact, in Jujutla (where the baseline has already been completed), the number of households with working children identified in the baseline survey turned out to be about 36% higher than the number of children in school and in work identified in the 2010 school census. Assuming this ratio is similar in other municipalities, we can estimate the number of households with working children in the selected and the remaining cantons of the wave 2 municipalities. These estimates are displayed in the last two columns of table 3.
Table 3 shows that we currently expect to find a total of about 3418 households with working children in the selected cantons. Approximately 500 households need to be discarded as the project will select a small group of cantons for (agricultural and youth) interventions not subject to impact evaluation.17 Given that it is the aim of the project to let 2000 households in the remaining cantons enter the vocational training for mothers we should expect to find a maximum of about 918 households that do not participate in any of the household level interventions and that could possibly enter the control group.
Table 3. Basic Information on Selected Cantons
MunicipalityTotal cantons
Cantons selected
Children in school and in work in the municipality
Children in school and in work in selected cantons
Expected number of households with working children in selected cantons
Expected number of households with working children in cantons not selected
Jujutla (pilot) 10 5 875 474 643 544Tacuba 14 5 1196 700 950 673Izalco 46 6 1644 701 951 1279San Luis la Herradura 10 4 571 356 483 292Tecoluca 26 4 640 345 468 400Santiago Nonualco 22 9 838 418 567 570Total 118 28 4889 2520 3418 3214Children in school and in work based on 2010 school census. Expected number of households with working children estimated using Jujutla as example.
In reality however, the final number of households in the control group is likely to be lower for multiple reasons. First, a percentage of the households that have been offered the inter-ventions will not accept the offer. A pilot that will be rolled out in Jujutla municipality will soon provide an indication of the take-up rate we should expect to encounter. If the take-up rate is relatively high, the household level interventions can be offered to exactly 2500 households. The wave 1 and wave 3 interventions can then be scaled up slightly to compensate any for
17 In principle all eligible households in these cantons will participate in either the agriculture and the youth intervention and there will be no control group in these cantons.

88
IMPACT EVALUATION REPORT ONinterventions on starting-up small enterprises and reintegration of children to school of the Project “Eliminating Child Labour in El Salvador through Economic Empowerment and Social Inclusion”
the households who do not take up the offer in wave 2. If the Jujutla data suggest that take-up rates are low, it may be necessary to offer the interventions to a larger number of wave 2 households, which would reduce the size of the control group.
Second, from the impact evaluation perspective, what matters is the number of households interviewed both at baseline and at follow-up. Usually, it is not possible to re-interview all households in the control group (and in the intervention group) towards the end of the pro-gram. Attrition may occur, for instance because households move to other municipalities or countries, because households fall apart etc. The survey firm hired to collect the data in Jujutla indicated that they expect an attrition rate of approximately 6%.
Third, in at least part of the analysis we probably cannot use control households that have children in schools that are not attended by children in the intervention households. The reason for this is that the so-called “inclusive education” interventions will be implemented only in those schools that are attended by children living in households that participate in the vocational training for mothers, vocational training for young adults, or agricultural produc-tivity interventions. Within those schools all pupils will be affected by the inclusive education interventions, even if they live in control households. Given that control households with children in these schools are equally affected by the inclusive education interventions, they serve as a (more) valid control group to measure the impact of the set of interventions that is the object of the impact evaluation.
Fourth, the baseline interviews in the selected cantons will take place during a busy agricul-tural season, when it is harder to find respondents.
These issues suggest that the number of cantons included may result in a control group that is too small to statistically identify meaningful effects of the program. UCW and the project team agreed to aim for a control group of 1000 households (after correction for the issues mentioned above). If the number of control observations appears to drop below 1000, it may be necessary to increase the number of cantons in which the interventions are implemented. Whether or not this increase in the number of cantons is necessary will be determined as soon as (i) the baseline data for the wave 2 cantons are available and (ii) we have a informa-tion on the take-up rate of the interventions implemented in the wave 1 communities.
A word of caution is necessary here. The project purposefully sampled cantons that are likely to have a high number of potential beneficiaries. Given that the number of potential benefi-ciaries per canton is much lower in the remaining areas (see Table 3) it will be expensive to increase the sample size. As a result only limited shortages in control observations can be dealt with.
6.2 Setting the Threshold Score
There are multiple possibilities when it comes to setting the threshold score. One option would be to use a fixed threshold score across municipalities and cantons. Another option would be to offer the interventions to a fixed percentage of households with child laborers, either at the municipality or at the canton level. In principle, the first option of a fixed thresh-old allows for a cleaner analysis in the impact evaluation, especially if there is still a control group in each canton. The final decision on this will be taken by the project team and UCW when the baseline data for the wave 2 municipalities has been collected.

89
Annexes
6.3 Smoothing the Vulnerability Index
The vulnerability index proposed by the project team is similar to the index used by other social protection programs such as PATI and Red Solidaria. However, this index does not appear to provide a smooth variable on the basis of which households can be selected. The histogram displayed in Figure 3 shows that there are large spikes in the density of the vulnerability index for households in the pilot municipality of Jujutla. These spikes may be problematic as they may lead to bunching of beneficiaries (with specific and endogenous characteristics) right above the threshold with few controls right below the threshold (or vice versa). UCW will use the wave 2 baseline data to propose a smoother vulnerability index.
Figure 3. Histogram of vulnerability index
0.0
5.1
.15
.2D
ensi
ty
50 60 70 80 90Vulnerability Index
6.4 DBMR in Control Group
Finally, as explained, the school attendance and participation in work of children in bene-ficiary households will be monitored. If possible, it would be interesting to implement this monitoring system also in control households. That way the impact evaluation would provide a purer insight into the effect of the vocational training of mothers. During our next meeting in El Salvador we will discuss in more detail the feasibility of such an approach.
7. Limitations
The impact evaluation of the “Eliminating Child Labour in El Salvador through Economic Em-powerment and Social Inclusion” project has multiple limitations. This subsection describes these limitations. First, the impact evaluation examines the causal effect of a combination of vocational training, flexible education, and monitoring interventions. However, it cannot iden-tify the impact of the individual components. Separate impact analysis could provide impor-

90
IMPACT EVALUATION REPORT ONinterventions on starting-up small enterprises and reintegration of children to school of the Project “Eliminating Child Labour in El Salvador through Economic Empowerment and Social Inclusion”
tant insights for the development of (the ILO’s) future household-level child labor programs. Unfortunately, it turns out that an impact evaluation that would disentangle the impact of one or more individual household level interventions is incompatible with the setup of the pro-ject. The household level interventions are administered as a package. When interventions overlap completely it is not possible to disentangle the impact of the individual components. There is no room to deviate from this procedure, because administering the interventions as a package is an integral part of the philosophy and design of the program.
Second, a series of interventions not part of the impact evaluation (such as capacity building among local administrations and school-level education interventions) is taking place in the background. These interventions do not reduce the internal validity of the impact evaluation, because they affect the households in the intervention and the control group equally. How-ever, they do imply that any impact identified should be interpreted as the interaction of the evaluated interventions with the background interventions. It cannot be guaranteed that a similar impact would be observed in the absence of the background interventions. Moreover, imagine that both the set of interventions evaluated and the interventions taking place in the background effectively eliminate child labor when implemented independently. In that case, the impact evaluation will (correctly) identify no impact of the evaluated interventions, because child labor has already been eliminated in both the intervention and control group by the interventions taking place in the background.
Third, the direct beneficiary monitoring system may be a source of bias in the impact eval-uation. Households in the intervention group will be interviewed about school participation and child labor on a 3 month basis. For multiple reasons, it is possible that these households start to adjust their answers to these questions in a way that is not consistent with actual changes in school participation and child labor. The households may, for instance, deny that children are in labor as they become aware that the program aims to eliminate child labor. The reliability of the measured impact on school participation and child labor will thus de-pend on possibilities to substantiate self-reported data with other sources of information. To see whether school participation improved, we might consider conducting independent spot checks in schools (if funds are available). For child labor we currently do not think there is a possibility to independently check the reliability of respondents answers. These issues will be discussed in more detail during the upcoming mission in El Salvador.
Fourth, there are some concerns about the statistical power of the current evaluation design. As shown in the appendix tables, our ability to detect statistically significant effects of the intervention drops quickly as the size of the control group shrinks. A low number of control observations could thus jeopardize the impact evaluation. We will more precise on of this issue once the baseline data are available and there is more information on the success of the interventions implemented in wave 1. If the control group turns out to be small, the team will try to increase the number of observations by moving into additional cantons. However, given that those cantons are likely to have a relatively low number of eligible households, this procedure will be successful only if the shortage in control observations is limited.
Finally, it should be noted that the regression discontinuity methodology only allows for the identification of a local treatment effect: the impact of the intervention for those households with a vulnerability score equal to the threshold. The average treatment effect for all indi-viduals participating in the intervention or heterogeneity of the treatment effects along the dimension of the vulnerability index cannot be identified.
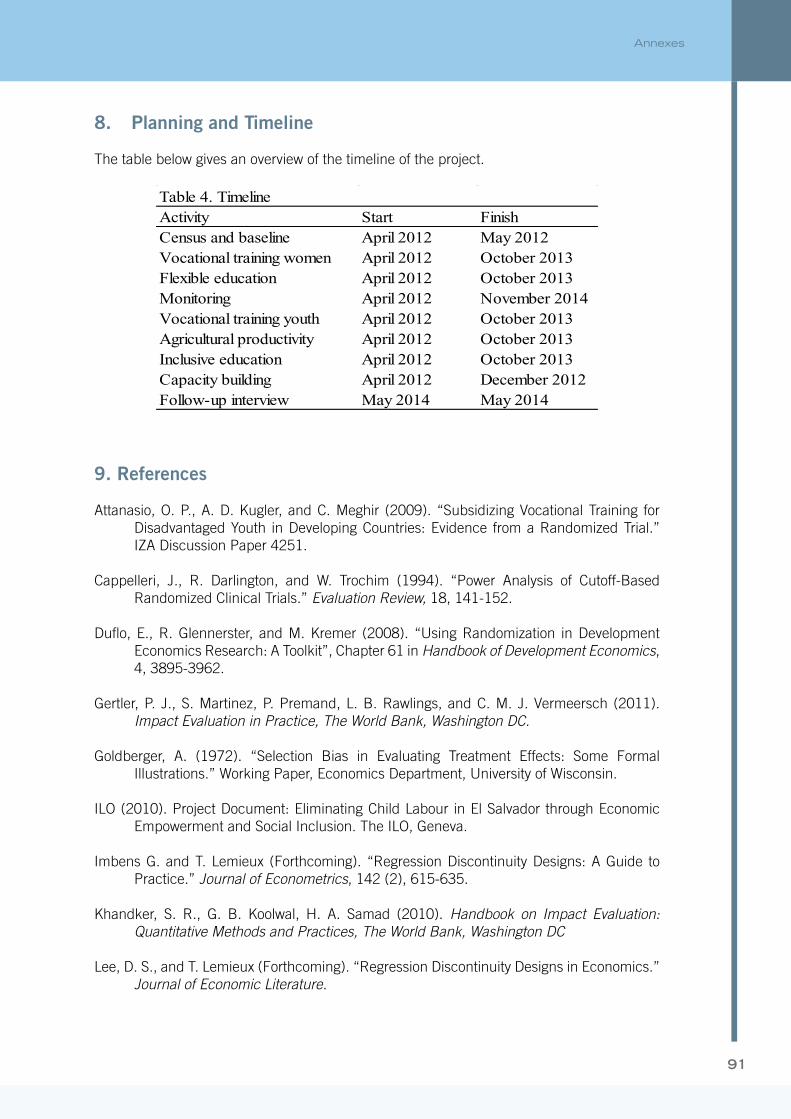
91
Annexes
8. Planning and Timeline
The table below gives an overview of the timeline of the project.
Table 4. TimelineActivity Start FinishCensus and baseline April 2012 May 2012Vocational training women April 2012 October 2013Flexible education April 2012 October 2013Monitoring April 2012 November 2014Vocational training youth April 2012 October 2013Agricultural productivity April 2012 October 2013Inclusive education April 2012 October 2013Capacity building April 2012 December 2012Follow-up interview May 2014 May 2014
9. References
Attanasio, O. P., A. D. Kugler, and C. Meghir (2009). “Subsidizing Vocational Training for Disadvantaged Youth in Developing Countries: Evidence from a Randomized Trial.” IZA Discussion Paper 4251.
Cappelleri, J., R. Darlington, and W. Trochim (1994). “Power Analysis of Cutoff-Based Randomized Clinical Trials.” Evaluation Review, 18, 141-152.
Duflo, E., R. Glennerster, and M. Kremer (2008). “Using Randomization in Development Economics Research: A Toolkit”, Chapter 61 in Handbook of Development Economics, 4, 3895-3962.
Gertler, P. J., S. Martinez, P. Premand, L. B. Rawlings, and C. M. J. Vermeersch (2011). Impact Evaluation in Practice, The World Bank, Washington DC.
Goldberger, A. (1972). “Selection Bias in Evaluating Treatment Effects: Some Formal Illustrations.” Working Paper, Economics Department, University of Wisconsin.
ILO (2010). Project Document: Eliminating Child Labour in El Salvador through Economic Empowerment and Social Inclusion. The ILO, Geneva.
Imbens G. and T. Lemieux (Forthcoming). “Regression Discontinuity Designs: A Guide to Practice.” Journal of Econometrics, 142 (2), 615-635.
Khandker, S. R., G. B. Koolwal, H. A. Samad (2010). Handbook on Impact Evaluation: Quantitative Methods and Practices, The World Bank, Washington DC
Lee, D. S., and T. Lemieux (Forthcoming). “Regression Discontinuity Designs in Economics.” Journal of Economic Literature.

92
IMPACT EVALUATION REPORT ONinterventions on starting-up small enterprises and reintegration of children to school of the Project “Eliminating Child Labour in El Salvador through Economic Empowerment and Social Inclusion”
Manacorda, M. (2009). “Criteria and Guidelines for the Evaluation of the Impact of Child Labor Interventions.” UCW Working Paper.
UCW (2009a). “Technical Issues for the Impact Evaluation of Components of ILO / IPEC Projects.” UCW Working Paper.
UCW (2009b). “Technical Criteria for the Impact Evaluation of USDOL-Funded Child Labour Education Initiative Projects.” UCW Working Paper.

93
Annexes
Appendix 1: Shortlisted Communities
MunicipalityUrban or
ruralChild labor
ratePopulation Crime rate
JUAYUA URBAN 13,1 25.323 115ILOBASCO RURAL 11,7 68.976 88JUJUTLA RURAL 10,3 29.179 69NUEVA CONCEPCION RURAL 10,0 30.281 116APASTEPEQUE RURAL 9,9 19.493 77METAPAN RURAL 9,0 63.604 41GUAYMANGO RURAL 8,9 19.487 36SAN FRANCISCO MENENDEZ RURAL 8,9 44.085 29JIQUILISCO RURAL 8,8 49.777 80IZALCO URBAN 8,7 74.085 115TACUBA RURAL 8,6 30.718 68TECOLUCA RURAL 8,6 25.344 55COATEPEQUE RURAL 8,3 39.255 84SENSUNTEPEQUE RURAL 8,0 43.858 109EL TRANSITO RURAL 7,9 19.822 116SAN LUIS LA HERRADURA RURAL 7,9 21.388 122SAN PEDRO MASAHUAT URBAN 7,5 26.806 108AGUILARES URBAN 7,2 23.508 119SAN ANTONIO DEL MONTE URBAN 7,1 30.104 123SAN PABLO TACACHICO RURAL 6,9 21.751 51SANTIAGO DE MARIA URBAN 6,7 19.024 79
PANCHIMALCO RURAL 6,5 45.921 128
Child labor rates based on 2009 school census
Population rates based on 2007 population census
Crime rates based on 2010 national police statistics
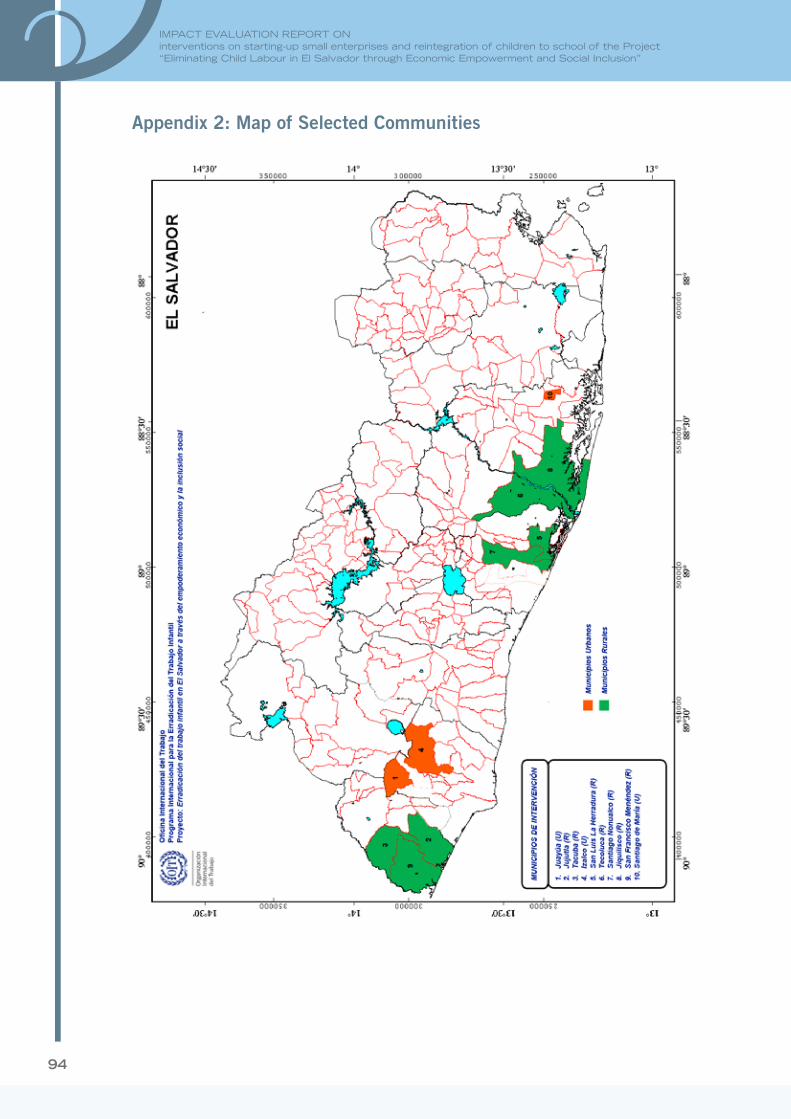
94
IMPACT EVALUATION REPORT ONinterventions on starting-up small enterprises and reintegration of children to school of the Project “Eliminating Child Labour in El Salvador through Economic Empowerment and Social Inclusion”
Appendix 2: Map of Selected Communities

95
Annexes
Appendix 3: Power Calculations
Impact AlphaControl
householdsPower (beta)
(1) (2) (3) (4).1 .1 990 0.934.1 .1 900 0.9198.1 .1 810 0.9015.1 .1 720 0.878.1 .1 630 0.8474.1 .05 990 0.8848.1 .05 900 0.8638.1 .05 810 0.8378.1 .05 720 0.8056.1 .05 630 0.7652.08 .1 990 0.813.08 .1 900 0.79.08 .1 810 0.7628.08 .1 720 0.7305.08 .1 630 0.6919.08 .05 990 0.7193.08 .05 900 0.6912.08 .05 810 0.6588.08 .05 720 0.6215.08 .05 630 0.5784.06 .1 990 0.6028.06 .1 900 0.5785.06 .1 810 0.5514.06 .1 720 0.5209.06 .1 630 0.4867.06 .05 990 0.4806.06 .05 900 0.456.06 .05 810 0.4292.06 .05 720 0.3997.06 .05 630 0.3673
Proportion of working children
Estimated statistical power (column 4) for regression discontinuity estimates at different imact sizes (column 1), significance levels (column 2), and number of households in the control group (column 3). Estimates are triple those of randomized experiment estimates and assume intervention group of 2000 households.

96
IMPACT EVALUATION REPORT ONinterventions on starting-up small enterprises and reintegration of children to school of the Project “Eliminating Child Labour in El Salvador through Economic Empowerment and Social Inclusion”
Impact AlphaControl
householdsPower (beta)
(1) (2) (3) (4).1 .1 990 0.9305.1 .1 900 0.9158.1 .1 810 0.8971.1 .1 720 0.8730.1 .1 630 0.8418.1 .05 990 0.8793.1 .05 900 0.8578.1 .05 810 0.8313.1 .05 720 0.7985.1 .05 630 0.7577
.08 .1 990 0.8066
.08 .1 900 0.7833
.08 .1 810 0.7558
.08 .1 720 0.7233
.08 .1 630 0.6846
.08 .05 990 0.7111
.08 .05 900 0.6828
.08 .05 810 0.6503
.08 .05 720 0.6130
.08 .05 630 0.5699
.06 .1 990 0.5953
.06 .1 900 0.5711
.06 .1 810 0.5441
.06 .1 720 0.5139
.06 .1 630 0.4798
.06 .05 990 0.4727
.06 .05 900 0.4484
.06 .05 810 0.4218
.06 .05 720 0.3926
.06 .05 630 0.3606
Proportion of 18-45 year old women in paid work
Estimated statistical power (column 4) for regression discontinuity estimates at different imact sizes (column 1), significance levels (column 2), and number of households in the control group (column 3). Estimates are triple those of randomized experiment estimates and assume intervention group of 2000 households.

97
Annexes
Impact AlphaControl
householdsPower (beta)
(1) (2) (3) (4)12 .1 990 0.938012 .1 900 0.924612 .1 810 0.907512 .1 720 0.885212 .1 630 0.856112 .05 990 0.889412 .05 900 0.869012 .05 810 0.843812 .05 720 0.812312 .05 630 0.77279 .1 990 0.77119 .1 900 0.74759 .1 810 0.72009 .1 720 0.68809 .1 630 0.65039 .05 990 0.66559 .05 900 0.63749 .05 810 0.60559 .05 720 0.56949 .05 630 0.52826 .1 990 0.47946 .1 900 0.45936 .1 810 0.43746 .1 720 0.41336 .1 630 0.38696 .05 990 0.35656 .05 900 0.33786 .05 810 0.31776 .05 720 0.29606 .05 630 0.2727
Estimated statistical power (column 4) for regression discontinuity estimates at different imact sizes (column 1), significance levels (column 2), and number of households in the control group (column 3). Estimates are triple those of randomized experiment estimates and assume intervention group of 2000 households.
Monthly earnings of 18-45 year old women

98
IMPACT EVALUATION REPORT ONinterventions on starting-up small enterprises and reintegration of children to school of the Project “Eliminating Child Labour in El Salvador through Economic Empowerment and Social Inclusion”
�Annex 5. Baseline survey report
Acknowledgements
The design of the impact evaluation has been carried out in close collaboration with the project team and the government counterparts. The government formally agreed to carry out an impact evaluation of some interventions of the project on the basis of a wealth index. The project team has continuously supported the development of the IE design with its sugges-tions and assessments of constraints. It has also carried out the preparatory fieldwork with great care and insured the support of the different stakeholders.
Funding for this project was provided by the United States Department of Labor. This doc-ument does not necessarily reflect the views or policies of the United States Department of Labor, nor does mention of trade names, commercial products, or organizations imply en-dorsement by the United States Government.
1. Introduction
The ILO project called “Eliminating Child Labour in El Salvador through Economic Empow-erment and Social Inclusion” attempts to eradicate child labor in El Salvador. To achieve this objective the project implements a large range of interventions at three levels: macro (nation-al policies and institutional framework), meso (target municipalities and schools) and micro (child laborers’ households). One set of household level interventions, which is to be imple-mented in 5 municipalities in El Salvador, will be the object of an impact evaluation. This set of interventions consists of two main components: (i) a support package to help the mothers of child laborers start a small enterprise and (ii) so-called “flexible education interventions” which provide needs-based support to help the children of these women return to school at the appropriate level in case they have dropped out. A monitoring system will be setup to check whether beneficiary mothers and children indeed participate in the interventions and whether this participation is accompanied by behavioral changes such as improved school attendance and reduced child work (a description of this monitoring system can be found in Annex 1, in Spanish).
In April 2012, UCW (in collaboration with the ILO El Salvador) drafted an impact evaluation design (UCW 2012). As part of this design, UCW proposed to allocate the set of interven-tions to eligible households within the 5 municipalities on the basis of a wealth index. This procedure ensures a fair distribution of the interventions to those households who are most in need. At the same time, as explained in UCW (2012), this allocation procedure can be exploited in a regression discontinuity framework to identify the causal effect of the set of interventions on outcomes of interest, such as education, child labor, participation in labor of adult household members, and multiple other wellbeing indicators.18
The ILO recently conducted a baseline survey in the 5 municipalities where it will implement the set of interventions that will be the focus of the impact evaluation. Subsequently, UCW (again in collaboration with the ILO in El Salvador) used this data to generate the wealth index and assign the intervention. This document describes this process in more detail. In section 2 it starts by providing some background. Specifically, this section briefly discusses
18 The project initially aimed to implement a randomized experiment to measure the impact of the interventions. However, the Government of El Salvador did not support such an approach and as a consequence it was decided to adopt this quasi-exper-imental approach.

99
Annexes
the project at large, the interventions selected for the impact evaluation, and the basic idea behind the identification strategy of the impact evaluation. Section 3 proceeds by discussing the baseline survey and providing some descriptive statistics. Section 4 provides a detailed description of the procedure by which eligible households have been assigned to the inter-vention and control group. Section 5 examines whether this selection procedure was suc-cessful in the sense that (i) it assigned the poorest and most vulnerable households to the intervention group and (ii) it can be exploited to identify the impact of the interventions.
2 Background
2.1 The Project
As explained above, the ILO project called “Eliminating Child Labour in El Salvador through Economic Empowerment and Social Inclusion” attempts to eradicate child labor in El Salva-dor. To achieve this goal, the project set the following 6 objectives:
i. By the end of the project, child labor elimination strategies will have been adopted by national and local institutions that implement poverty reduction, decent work, and social protection programs for the rural and urban poor;
ii. By the end of the project, child labor law enforcement and protection mechanisms, par-ticularly for the worst forms of child labor, will be developed and fully operational;
iii. By the end of the project, national capacity to conduct child labor research, monitoring and impact evaluation will be enhanced and pilot interventions documented;
iv. By the end of the project, municipal capacity to prevent and eliminate child labor, in particular the worst forms, will have been strengthened;
v. By the end of the project, viable improved livelihood alternatives will have been imple-mented to reduce family reliance on child labor in target municipalities;
vi. By the end of the project, inclusive education models will have been implemented in selected schools in target municipalities to prevent and reduce child labor and improve education indicators.
The project’s strategic framework, outlined in ILO (2010), explains how these 6 objectives were identified. Figures 1 – 3 provide a bird’s eye view of the strategic framework. They re-spectively depict (i) the main factors that contribute to child labour in El Salvador, (ii) El Sal-vador’s wider national strategic agenda to eradicate child labour, and (iii) how this project’s 6 strategic objectives tie in with this agenda.
2.2 Interventions Selected for the Impact Evaluation
The ILO plans to implement a large number of interventions to achieve the 6 strategic objec-tives. Some of these interventions will be implemented at the national level, some in selected municipalities, some in selected schools, and some will be targeted at selected households.
100
IMPACT EVALUATION REPORT ONinterventions on starting-up small enterprises and reintegration of children to school of the Project “Eliminating Child Labour in El Salvador through Economic Empowerment and Social Inclusion”
One set of household level interventions targeted at households will be the object of an im-pact evaluation. This set consists of the following two interventions:
i. A support package that will be offered to help the mothers of child laborers start a small enterprise. This support consists of three steps: (i) vocational training of choice19, (ii) business training and preparation of a business plan, and (iii) a starting kit based on the needs identified in the business plan to kick-start the enterprise (value between US$ 100 and US$ 300).
ii. If the children living in the households of the eligible women do not attend school ac-cording to the baseline information, then they will be offered training to help them enter school at the appropriate level for their age. Kids will be invited to participate in this inter-vention by means of a sensitization campaign.20
2.3 Identifying the Impact of these Interventions
The impact evaluation aims to identify the causal effect (i.e. the impact) of this set of inter-ventions on education, child labor, and participation in labor of adult household members (especially women, as they are the key target group of the interventions). To identify the causal effect of this set of interventions, the impact evaluation must estimate a counterfactual outcome: the education and (child) labour outcomes that would have been observed among project beneficiaries in absence of the project. This counterfactual outcome is unobserved by definition. However, a valid counterfactual can be established by identifying a comparison group that is similar to the group of beneficiaries at the start of the project in all respects, except that they do not participate in the intervention.
As explained in detail in UCW (2012), to identify a credible comparison group, the impact evaluation will exploit the fact that the set of interventions described above is assigned on the basis of a wealth index. The idea is as follows. All households with working children and a mother who can participate in the intervention are ranked from poorest to richest on the basis of a wealth index generated using baseline data collected by the project. The poorest households (i.e. the households in the lower half of the wealth distribution) are assigned to the intervention group. The richest households (i.e. the households in the upper half of the wealth distribution) do not receive any interventions and constitute our control group. While these two groups are obviously not similar before the implementation of the interventions, they may be expected to be virtually identical close to the point in the wealth index that sep-arates the comparatively poor intervention households and the comparatively rich control households. By comparing intervention and control households close to this threshold, we can identify the (local) impact of the program.
The remainder of this document explains the implementation and validity of this procedure in detail. The discussion will assume that the reader is familiar with the basics of regression discontinuity methodology. UCW (2012) provides a graphical explanation of the regression discontinuity procedure for readers who are unfamiliar with the methodology. More in-depth discussion of the regression discontinuity methodology is provided by Imbens and Lemieux (2008) and Lee and Lemieux (2010).
19 In each canton a limited number of vocational training courses will be offered, in areas such as e.g. baking bread, sewing clothes etc. The courses on offer are determined on the basis of an analysis of the local labour market.
20 Out of school children are not obliged to participate and the mother’s participation in the vocational training does not depend on the participation of the child.
101
Annexes
3. Data
3.1 Baseline Data Collection
As mentioned above, the set of interventions that will be the focus of the impact evaluation will be implemented in 5 municipalities (Izalco, San Luiz Herradura, Santiago Nonualco, Tacuba, Tecoluca). Within these 5 municipalities, the ILO selected a group of 37 cantons into the project where they expected to find the highest number of child laborers. Annex 2 describes the procedures by which the municipalities and cantons were selected in detail (in Spanish). UCW (2012) provides a summary of this procedure (in English).
Baseline data were collected in these cantons in April and May of 2012. The baseline data collection consisted of two parts: (i) a short listing questionnaire administered to all house-holds in the 37 cantons and (ii) a more in-depth baseline questionnaire administered to all households identified as having working children in the listing exercise. Annex 3 to 7, contain the ILO-IPEC documentation describing the baseline data collection (including fieldwork, data consistency etc.), discuss the main results of the baseline data, and contain the admin-istered questionnaires for each of the 5 municipalities (in Spanish).
3.2 Identifying and Interviewing (Households with) Working Children
The working status of children (aged 5-17) was determined on the basis of the following 5 household roster questions in the listing questionnaire:
� In the past week, did […] work at least 1 hour?
� In the past week, did […] participate in any remunerated activities (cash or in-kind)? (Only asked if answer to previous question was “no”)
� In the past 12 months, did […] work in a non-agricultural enterprise?
� In the past 12 months, was […] involved in any farming activities?
� In the past 12 months, did […] work in an enterprise owned by himself/herself?
When the answer to any of these questions was “yes”, the child was considered to be a work-ing child. The census identified a total of 12,248 households with 16,597 children between the age of 5 and 17 (52,024 household members in total). A share of 35% of these children (5,856) was working according to the above definition. Working children were distributed across 3,294 households (i.e. 27% of all households had one or more working children).
After administering the listing questionnaires and processing the data, the survey team re-visited all households with one or more working children to administer the in-depth baseline survey. The baseline survey instrument contains sections that collect information on charac-teristics of the household members, educational attainment of household members, partici-pation in work by adults, participation in work by children, characteristics of the dwelling and durable goods owned by the household, loans taken out by the household, aid the household receives from other programs, and attitudes towards child labor. In total, the team managed
102
IMPACT EVALUATION REPORT ONinterventions on starting-up small enterprises and reintegration of children to school of the Project “Eliminating Child Labour in El Salvador through Economic Empowerment and Social Inclusion”
to track and administer this more comprehensive interview in 93% (3,064) of the 3,294 households with working children identified in the census.
3.3 Descriptive Statistics
We now proceed to provide some descriptive statistics based on the baseline survey data. We restrict the sample of households for which we provide descriptive statistics to those households that are, in principle, eligible to participate in the set of interventions that are the focus of the impact evaluation. Households are eligible to participate in these interventions if:
i. according to the listing data, they have one or more working children aged 5-17 (see definition above)
ii. according to the baseline data, they have one or more women fitting the following de-scription:
a. aged 18 to 65
b. knows how to read and write
c. not employed as a salaried worker
Of the 3064 households with working children interviewed at baseline 68% (2098) have a mother or another woman who is eligible according to these criteria.
Column (1) of Table 1 provides descriptive statistics for these 2098 eligible households and their household members. We turn first to the children living in these households. In total there are 5535 children aged 5-17 in these households. Nearly 85% of these children is in school and 88% of them is literate. The prevalence rate of child work (same definition as in the listing questionnaire) is 60%. Working children work about 16 hours a week on average. More than half of the children is involved in some form of dangerous work: working in an en-vironment with dust, smoke, or noise; exposure to heat or cold; working with dangerous tools, chemicals, or pesticides; working at night or early morning; carrying heavy loads; working in or on water. The majority of children (86%) is involved in household chores and children who are involved in chores spend a substantial amount of their time on this activity (12.5 hours a week on average).21
The idea is that increasing the earning capacity of the mothers of these children (or another eligible woman in their household) will help move children out of work and into school. So, what is the current working status of mothers and other eligible women? Do these women work and how much do they contribute to family income? To answer these questions we rely on the answers to the following three questions:22
� In the past week, did […] work at least 1 hour?
21 Interestingly, by construction, all of the households that were selected for the in-depth baseline interview had one or more working children according to the listing exercise. However, in 270 of the 2098 households included in the impact evaluation, there is no working child according to the baseline survey.
22 In accordance with the eligibility criteria we exclude mothers who are employed as a salaried worker.

103
Annexes
� Although […] did not work, did he/she have permanent employment or an enterprise owned by himself/herself to which he/she will soon return? (Only asked if answer to pre-vious question was “no”)
� In the past week, did […] participate in any remunerated activities (cash or in-kind)? (Only asked if answer to previous two questions was “no”)
Currently, nearly half of the eligible women in our sample work (i.e. answer “yes” to one of the three questions above). On average eligible women who work, work over 34.5 hours a week and earn nearly US$100 a month.
Finally, we look at a few selected household level wealth indicators. We observe that the eligible households can be described as disadvantaged. More than a third of household dwellings has a dirt floor, nearly half of all household dwellings has a roof made of metal sheets, rooms are shared by 5 household members on average, and only 36% of households has a fridge. Monthly per capita household income (earned by adult laborers) and monthly per capita household expenditures are respectively US$41 and US$33. Access to electricity and ownership of a TV (both available in roughly three quarters of the households) is fairly common.
4. Beneficiary Selection
A share of the 2098 eligible households described above has been selected for participation in the set of interventions. To ensure that the interventions are administered to households most in need, the intervention has been assigned on the basis of a wealth index. Households with wealth below a pre-specified threshold score in the index are considered poor enough to participate in the interventions and have been selected. Households with a wealth index above the threshold are deemed too rich and will not receive an invitation to participate in the intervention.
Selection on the basis of a wealth index not only ensures a fair distribution of the interven-tions to those households who are most in need. It also ensures that the causal effect of the set of interventions can be identified in a regression discontinuity framework. The intuition behind the regression discontinuity methodology is that households (and members of house-holds) with a wealth score just above the threshold are similar to households (and members of households) with a wealth score just below the threshold. Households right above the threshold score therefore serve as a valid comparison group to measure the (local) impact of the interventions (see UCW 2012 for more technical details). In this subsection we provide a description of this selection procedure.
4.1 Generating the Wealth Index
We start by describing how the wealth index was generated for the 2098 eligible households. We first list the wealth indicators (which we obtained from the baseline survey) on the basis of which the wealth index was constructed:23
23 Some of these wealth indicators, such as water, light, and sanitation, contain an additional category called “other”. We have not included this category in the wealth index, because it is not immediately clear what this category entails.

104
IMPACT EVALUATION REPORT ONinterventions on starting-up small enterprises and reintegration of children to school of the Project “Eliminating Child Labour in El Salvador through Economic Empowerment and Social Inclusion”
� A binary indicator for land ownership;
� The amount of land owned by the household for cultivation (in manzanas);
� The number of bedrooms in the dwelling divided by number of household members;
� Binary indicators for ownership of the following assets: radio, tv, video, fridge, iron, oven, vehicle for own use, vehicle for company use, sewing machine, grill, shelves, tables, plow, yoke, pump, barn, tools, and boat;
� Binary indicators for materials of which the dwelling’s roof is made: concrete, tiles made of clay or cement, asbestos sheets, metal sheets, or straw, palm, or waste materials24;
� Binary indicators for materials of which the dwelling’s walls are made: concrete, adobe, wood, metal sheets, or straw, palm, or waste materials 25;
� Binary indicators for materials of which the dwelling’s floor is made: ceramic tiles, ce-ment tiles, clay tiles, cement, or earth;
� Indicators for main source of to light in the dwelling: electricity, Kerosene (gas), Candles;
� Binary indicators for main source of water in the dwelling: public network inside home, public network outside home, water tank, water truck, well (private or public), or a lake, river, or stream;
� Binary indicators for type of sanitary facilities in the dwelling: toilet connected to sewage system, toilet connected to septic tank, private latrine, public latrine, private latrine (extra hygienic), public latrine (extra hygienic), or no sanitary facilities;
� Binary indicators for house ownership: rented, owned and paid off, owned and still pay-ing off, living in someone else’s house (without pay), borrowed).
Following Filmer and Pritchett (2001), we use the first principal component of the described wealth indicators as our wealth index. Because a proper technical discussion of principal component analysis is beyond the scope of this report, we do not discuss the technical de-tails of the procedure here.26 Suffice it to say that principal component analysis allows us to reduce the dimensionality of the dataset such that we obtain one composite index (the first principal component) representing the highest possible level of variation in the assembled wealth indicators.27
24 We combined 2 categories because number of observations is low
25 combined 2 categories because number of observations is low
26 Readers who wish more detail can, among many other texts, refer to a tutorial (Smith, 2002) that can readily be found online.
27 An important advantage of the procedure is that it is not necessary to rely on arbitrary assumptions (such as assigning weights to individual wealth indicators) to construct the index.
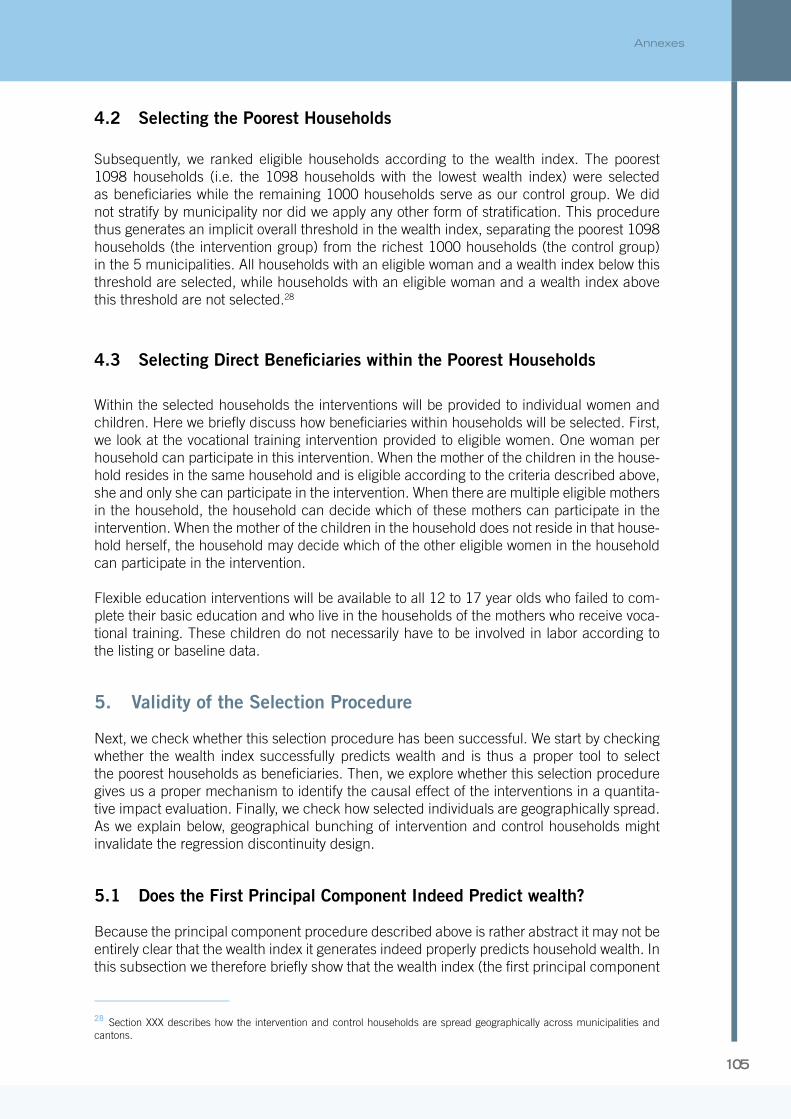
105
Annexes
4.2 Selecting the Poorest Households
Subsequently, we ranked eligible households according to the wealth index. The poorest 1098 households (i.e. the 1098 households with the lowest wealth index) were selected as beneficiaries while the remaining 1000 households serve as our control group. We did not stratify by municipality nor did we apply any other form of stratification. This procedure thus generates an implicit overall threshold in the wealth index, separating the poorest 1098 households (the intervention group) from the richest 1000 households (the control group) in the 5 municipalities. All households with an eligible woman and a wealth index below this threshold are selected, while households with an eligible woman and a wealth index above this threshold are not selected.28
4.3 Selecting Direct Beneficiaries within the Poorest Households
Within the selected households the interventions will be provided to individual women and children. Here we briefly discuss how beneficiaries within households will be selected. First, we look at the vocational training intervention provided to eligible women. One woman per household can participate in this intervention. When the mother of the children in the house-hold resides in the same household and is eligible according to the criteria described above, she and only she can participate in the intervention. When there are multiple eligible mothers in the household, the household can decide which of these mothers can participate in the intervention. When the mother of the children in the household does not reside in that house-hold herself, the household may decide which of the other eligible women in the household can participate in the intervention.
Flexible education interventions will be available to all 12 to 17 year olds who failed to com-plete their basic education and who live in the households of the mothers who receive voca-tional training. These children do not necessarily have to be involved in labor according to the listing or baseline data.
5. Validity of the Selection Procedure
Next, we check whether this selection procedure has been successful. We start by checking whether the wealth index successfully predicts wealth and is thus a proper tool to select the poorest households as beneficiaries. Then, we explore whether this selection procedure gives us a proper mechanism to identify the causal effect of the interventions in a quantita-tive impact evaluation. Finally, we check how selected individuals are geographically spread. As we explain below, geographical bunching of intervention and control households might invalidate the regression discontinuity design.
5.1 Does the First Principal Component Indeed Predict wealth?
Because the principal component procedure described above is rather abstract it may not be entirely clear that the wealth index it generates indeed properly predicts household wealth. In this subsection we therefore briefly show that the wealth index (the first principal component
28 Section XXX describes how the intervention and control households are spread geographically across municipalities and cantons.

106
IMPACT EVALUATION REPORT ONinterventions on starting-up small enterprises and reintegration of children to school of the Project “Eliminating Child Labour in El Salvador through Economic Empowerment and Social Inclusion”
of the listed wealth indicators) does indeed predict wealth and thus serves as an appropriate tool to distribute the interventions to the poorest eligible households. For this purpose, Fig-ures 4 – 10 graphically show that individual wealth indicators (e.g. ownership of a tv, owner-ship of a fridge, access to electricity, rooms per capita, no access to sanitary facilities, floor made of dirt, and roof made of metal sheets) of households with a high composite wealth index compare favorably with the individual wealth indicators of households with a low com-posite wealth index.
In each graph the horizontal index represents the wealth index. We normalized this index, such that it takes the value 0 at the implicit threshold that separates the poorest 1098 house-holds (the intervention group) from the richest 1000 households (the control group). With the exception of the variable “rooms per capita”, the vertical axis displays the proportion of households with the wealth characteristic under consideration (e.g. proportion of households owning a tv, proportion owning a fridge etc.). The dots are local averages and the lines are Lowess regressions, which provide a non-parametric estimate of the relationship between the calculated wealth index and the wealth indicator under consideration.29 The Lowess regres-sion for the intervention group is given in red (i.e. below threshold) and the Lowess regression for the control group is given in green (i.e. above threshold).
We see a clear relationship between the wealth index and the displayed wealth indicators. The ownership of TVs and fridges increases rapidly with the composite household wealth index. The same holds for access to electricity and the number of rooms per capita. On the other hand, the probability that a household has no sanitary facilities, has a dirt floor, or has a roof made of metal sheets (all indicators of poverty) drops rapidly with household wealth. These graphs thus strongly suggest that the wealth index is a useful tool to select beneficiary households on the basis of (observable and hard to manipulate) indicators of household wealth and poverty.
5.2 Validity of the Identification Mechanism
As explained in detail in the impact evaluation design, the selection procedure described above can be exploited in a regression discontinuity framework to identify the (local) impact of the vocational training interventions. The regression discontinuity methodology is valid only if households cannot precisely manipulate their wealth index (i.e. self-select into the inter-ventions) and if households just above and just below the wealth index are truly similar before the start of the interventions. In the case of the project in El Salvador, there is little reason to believe that the regression discontinuity design will not generate a valid control group. First, when people participated in the baseline interview, they did not know that they might be eligi-ble to participate in an intervention, nor that eligibility will be determined on the basis of their answers during this interview. Second, the procedure on the basis of which beneficiaries would be selected (described above) had not yet been determined at the time of the baseline interview. There is thus little room for precise manipulation of the wealth index.
To further ensure that the selection procedure indeed resulted in a valid control group, we conduct a series of additional tests. First, following McCrary (2008), we examine whether the density of the wealth index is continuous at the threshold. When the density of the wealth in-dex is not continuous this is an indication that there could be systematic differences between
29 We use non-parametric (Lowess) regressions as a convenient tool to graphically approximate the relationship between the wealth index and the individual wealth indicators. Other parametric and non-parametric procedures are available to approxi-mate this relationship (see Lee and Lemieux, 2010).

107
Annexes
the intervention and the control group.30 Figure 11, which was generated using McCrary’s software, depicts the density of the wealth index. We note that the density is of the wealth index is reasonably continuous. Most importantly, the confidence intervals indicate that the estimated density is not significantly different just above and below the threshold.
Second we test both graphically and formally whether the intervention and control group (households just above and below the threshold) are similar at the threshold. Here, we look not only at wealth indicators, but also at outcome indicators. While the wealth indicators in-cluded in the wealth index may be expected to be continuous at the threshold in the wealth index more or less by construction (because they are determinants of this same index), this is not the case for outcome variables. Our formal test relies on a regression discontinuity proce-dure written for Stata by Austin Nichols, which runs local linear regressions within an optimal bandwidth around the threshold score to estimate whether there are significant disconti-nuities in the wealth and outcome variables at the threshold score. The optimal bandwidth is estimated using a cross-validation procedure proposed by Imbens and Lemieux (2008), which balances the precision of the estimates (which increases with the bandwidth) against the bias that may result from using too large a bandwidth.
Figures 4-10 provide a first indication that households just above and below the threshold were indeed similar prior to the intervention. The scatter plots suggest that the relationship between the wealth index and the wealth indicators (TV, fridge, electricity, rooms per capita, sanitary facilities, floor made of dirt, and roof made of metal sheets) is roughly continuous at the threshold for selection into the program. And the Lowess regressions for the intervention (red) and control (green) group hit the threshold roughly at the same value of the wealth indicator.
The formal test also finds no evidence of discontinuities in these household level wealth indicators. The results of this test are displayed in Table 2. Column (1) shows the estimated discontinuity based on the regression discontinuity estimation procedure of Austin Nichols. Columns (2) and (3) respectively show the standard errors and P-values of the estimated coefficients. As can be inferred from the small discontinuity coefficients (column 3) and the high P-values (column 5). The only significant discontinuities in wealth indicators we do find (not displayed in the table) are in the probability of having an oven, the surface of land owned by the household, and whether the walls of the dwelling are made of adobe. Impor-tantly, there are also no discontinuities in other important wealth indicators not included in the wealth index, such as “female headed household” and “literate household head” (Figure 12 and 13 respectively).31
In terms of outcome variables (variables that are potentially affected by the intervention) households also look reasonably similar. Monthly per capita household income earned by adults (Figure 14) and monthly per capita household expenditure (Figure 15) are not dif-ferent in the intervention and control group. Eligible women look similar in terms of the
30 To understand why, consider the following explanatory example provided by McCrary (2008): “A doctor plans to randomly assign heart patients to a statin and a placebo to study the effect of the statin on heart attack within ten years. The doctor randomly assigns patients to two different waiting rooms, A and B, and plans to give those in A the statin and those in B the placebo. If some of the patients learn of the planned treatment assignment mechanism, we would expect them to proceed to waiting room A. If the doctor fails to divine the patients’ contrivance and follows the original protocol, random assignment of patients to separate waiting rooms may be undone by patient sorting after random assignment.” Similar problems may arise in the regression discontinuity context, for instance (in our case), when households manipulate their answers to the questions on the basis of which we constructed the wealth index such that that they end up in the intervention group (i.e. below the threshold) even though they should not be.
31 These variables are not included in the wealth index because they are endogenous (i.e. they are both an indicator of wealth but also a potential cause of household wealth).

108
IMPACT EVALUATION REPORT ONinterventions on starting-up small enterprises and reintegration of children to school of the Project “Eliminating Child Labour in El Salvador through Economic Empowerment and Social Inclusion”
probability of participating in work (Figure 16). However, we also observe some significant discontinuities for eligible women in terms of income from work (conditional on working) (Figure 17) and hours worked (conditional on working) (Figure 18).
Outcome variables for children (5-17) are also similar in the intervention and control group. Children right above and right below the threshold are equally likely to be in school (Figure 19), to be literate (Figure 20), to work (Figure 21), to be involved in dangerous work (Figure 22), and to participate in chores (Figure 23). Similar to eligible women, we do observe sub-stantive differences in the intensive margin of work (conditional on working) (Figure 24) and chores (Figure 25). Children in the control group work longer hours and they spend more time on chores.
Nonetheless, overall the regression discontinuity results suggest that the households just above and below the threshold are indeed similar in terms of wealth characteristics. There are some important differences in the extensive margin of work and chores for eligible wom-en and children alike. In principle, these observed differences at baseline can be accom-modated through difference in differences analysis and hence they should not invalidate the regression discontinuity approach.
5.3 Geographical Spread of the Intervention
We finish by examining one final aspect of the selection procedure that could invalidate the regression discontinuity design. Because the selection procedure is not stratified, it is possi-ble that the beneficiaries are bunched in some geographical areas while control households are bunched in other geographical areas. Geographical bunching could be problematic for the impact evaluation as the regression discontinuity methodology may pick up geographical differences in outcome variables rather than an impact of the administered intervention itself.
Table 3 displays the distribution of eligible households across the intervention and control group by municipality. Table 4 displays the distribution of eligible households across the intervention and control group by canton (the lowest geographical level of aggregation). At the municipality level intervention and control households are fairly evenly distributed. The municipality of Tacuba contains the highest percentage of intervention households (67%). In other municipalities the percentage of treated households ranges from 42 to 57%. At the canton level we observe larger differences in the percentage of intervention and control households. Yet, with only one exception (the canton of El Puente, which contains only 6 eligible households) all cantons contain both intervention and control households.
Given that all geographical areas and (sub-areas) contain both control and treated house-holds the geographical spread of intervention and control households does not appear to be cause for concern. We can simply add municipality or canton dummies in our regression discontinuity estimates to deal with any geographical differences. Otherwise, no adjustments seem to be necessary.

109
Annexes
References
Filmer, D. and L. H. Pritchett. 2001. “Estimating wealth effects without expenditure data-or tears: an application to educational enrollments in states of India.” Demography 38 (1), 115–132.
ILO (2010). Project Document: Eliminating Child Labour in El Salvador through Economic Empowerment and Social Inclusion.
Imbens G. and T. Lemieux. 2008. “Regression Discontinuity Designs: A Guide to Practice.” Journal of Econometrics, 142 (2), 615-635.
Lee, D. S. and T. Lemieux. 2010. “Regression Discontinuity Designs in Economics.” Journal of Economic Literature, 48, 281-355.
McCrary, J. 2008. “Manipulation of the Running Variable in the Regression Discontinuity Design: A Density Test.” Journal of Econometrics, 142 (2), 698-714.
Smith, L. I. 2002. A Tutorial on Principal Component Analysis.
UCW. 2012. Impact Evaluation Design: Eliminating Child Labour in El Salvador through Economic Empowerment and Social Inclusion.

110
IMPACT EVALUATION REPORT ONinterventions on starting-up small enterprises and reintegration of children to school of the Project “Eliminating Child Labour in El Salvador through Economic Empowerment and Social Inclusion”
Appendix: Tables and Figures
(1)Household level wealth indicators
TV 0.72Fridge 0.36Access to electricity 0.73Bedrooms per capita 0.19No sanitary facilities 0.05Floor made of dirt 0.36Roof made of metal sheets 0.49Female headed household 0.65Household head is literate 0.83
Household level outcome indicatorsMonthly per capita adult labor income (US$) 41.30Monthly per capita expenditures (US$) 33.04
Outcome variables eligible womenWorking 0.48Monthly wage (conditional on working) 98.70Average weekly working hours (conditional on working) 34.66
Outcome variables children 5-17In school 0.85Literate 0.88Working 0.60In dangerous work 0.54In chores 0.86Weekly hours worked (conditional on working) 16.26Weekly hours in chores (conditional on being in chores) 12.60
Table 1. Descriptive statisticsAverage eligible
households
Column (1) shows the average values of the wealth indicators and outcome variables displayed in the stub column.

111
Annexes
Discontinuity Std. Error P-value(1) (2) (3)
Household level wealth indicatorsTV 0.028 0.043 0.517Fridge -0.067 0.053 0.204Access to electricity -0.011 0.038 0.763Bedrooms per capita 0.020 0.024 0.393No sanitary facilities 0.002 0.016 0.908Floor made of dirt -0.058 0.051 0.262Roof made of metal sheets 0.012 0.055 0.827Female headed household 0.054 0.058 0.357Household head is literate 0.005 0.040 0.891
Household level outcome indicatorsMonthly per capita adult labor income (US$) -5.661 4.687 0.227Monthly per capita expenditures (US$) 0.363 2.654 0.891
Outcome variables eligible womenWorking -0.039 0.059 0.507Monthly wage (conditional on working) -28.826 16.193 0.075Average weekly working hours (conditional on working) 9.412 3.627 0.009
Outcome variables children 5-17In school -0.027 0.029 0.344Literate 0.005 0.027 0.863Working 0.050 0.037 0.176In dangerous work 0.058 0.036 0.107In chores 0.030 0.025 0.233Weekly hours worked (conditional on working) 3.671 1.278 0.004Weekly hours in chores (conditional on being in chores) 2.434 0.872 0.005
Table 2. Estimated discontinuities in baseline covariates and outcome variables at the threshold in the wealth
Column (1) displays estimated disontinuities in the wealth indicators and outcome variables displayed in the stub column at the threshold separating the intervention households from the control households (based on the estimation procedure of Austin Nichols). Columns (2) and (3) respectively show the standard errors and P-values of the estimated coefficients.
Table 3. Distribution of treatment and control individuals by municipality% Control % Treatment Observations
Tacuba 33 67 425Izalco 46 54 239Santiago Nonualco 54 46 755San Luis La Herradura 43 57 346Tecoluca 58 42 333Total 48 52 2,098
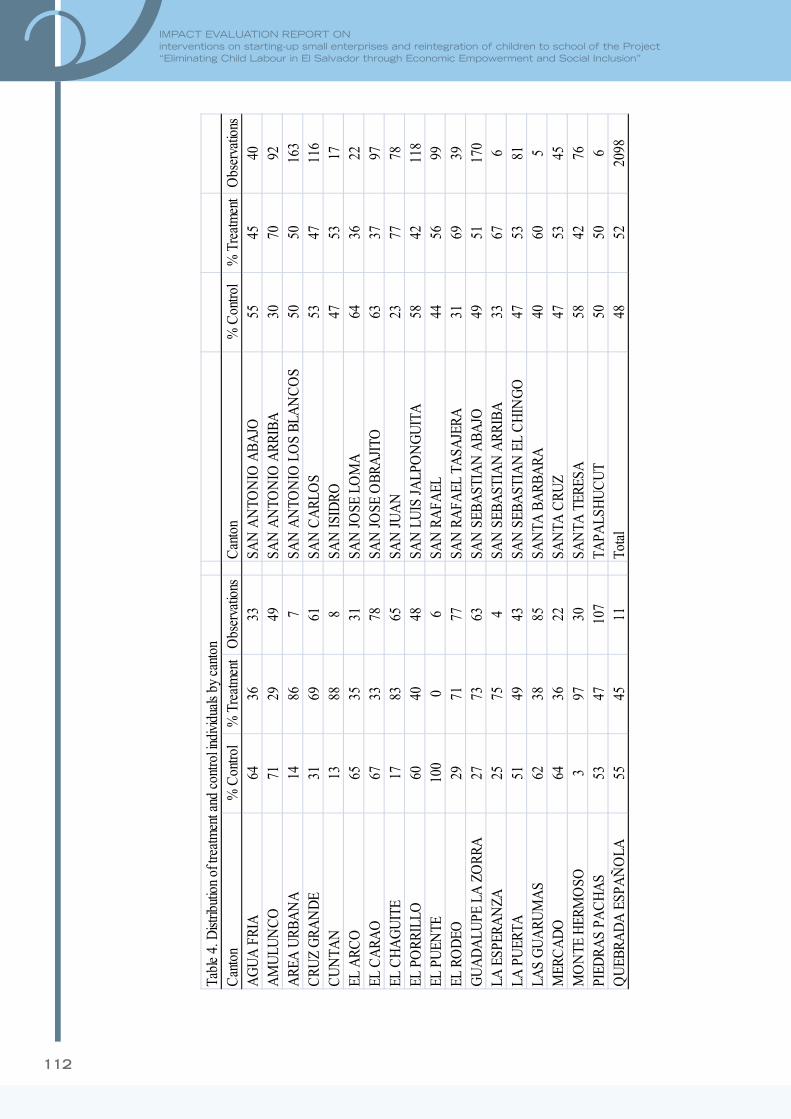
112
IMPACT EVALUATION REPORT ONinterventions on starting-up small enterprises and reintegration of children to school of the Project “Eliminating Child Labour in El Salvador through Economic Empowerment and Social Inclusion”
Tabl
e 4.
Dist
ribut
ion
of tr
eatm
ent a
nd c
ontro
l indi
vidua
ls by
can
ton
Can
ton
% C
ontro
l%
Tre
atm
ent
Obs
erva
tions
Can
ton
% C
ontro
l%
Tre
atm
ent
Obs
erva
tions
AG
UA
FRI
A64
3633
SAN
AN
TON
IO A
BAJO
5545
40A
MU
LUN
CO
7129
49SA
N A
NTO
NIO
ARR
IBA
3070
92A
REA
URB
AN
A14
867
SAN
AN
TON
IO L
OS
BLA
NC
OS
5050
163
CRU
Z G
RAN
DE
3169
61SA
N C
ARL
OS
5347
116
CU
NTA
N13
888
SAN
ISID
RO47
5317
EL A
RCO
6535
31SA
N JO
SE L
OM
A64
3622
EL C
ARA
O67
3378
SAN
JOSE
OBR
AJI
TO63
3797
EL C
HA
GU
ITE
1783
65SA
N JU
AN
2377
78EL
PO
RRIL
LO60
4048
SAN
LU
IS JA
LPO
NG
UIT
A58
4211
8EL
PU
ENTE
100
06
SAN
RA
FAEL
4456
99EL
RO
DEO
2971
77SA
N R
AFA
EL T
ASA
JERA
3169
39G
UA
DA
LUPE
LA
ZO
RRA
2773
63SA
N S
EBA
STIA
N A
BAJO
4951
170
LA E
SPER
AN
ZA25
754
SAN
SEB
AST
IAN
ARR
IBA
3367
6LA
PU
ERTA
5149
43SA
N S
EBA
STIA
N E
L C
HIN
GO
4753
81LA
S G
UA
RUM
AS
6238
85SA
NTA
BA
RBA
RA40
605
MER
CA
DO
6436
22SA
NTA
CRU
Z47
5345
MO
NTE
HER
MO
SO3
9730
SAN
TA T
ERES
A58
4276
PIED
RAS
PAC
HA
S53
4710
7TA
PALS
HU
CU
T50
506
QU
EBRA
DA
ESP
AÑ
OLA
5545
11To
tal
4852
2098

113
Annexes

114
IMPACT EVALUATION REPORT ONinterventions on starting-up small enterprises and reintegration of children to school of the Project “Eliminating Child Labour in El Salvador through Economic Empowerment and Social Inclusion”
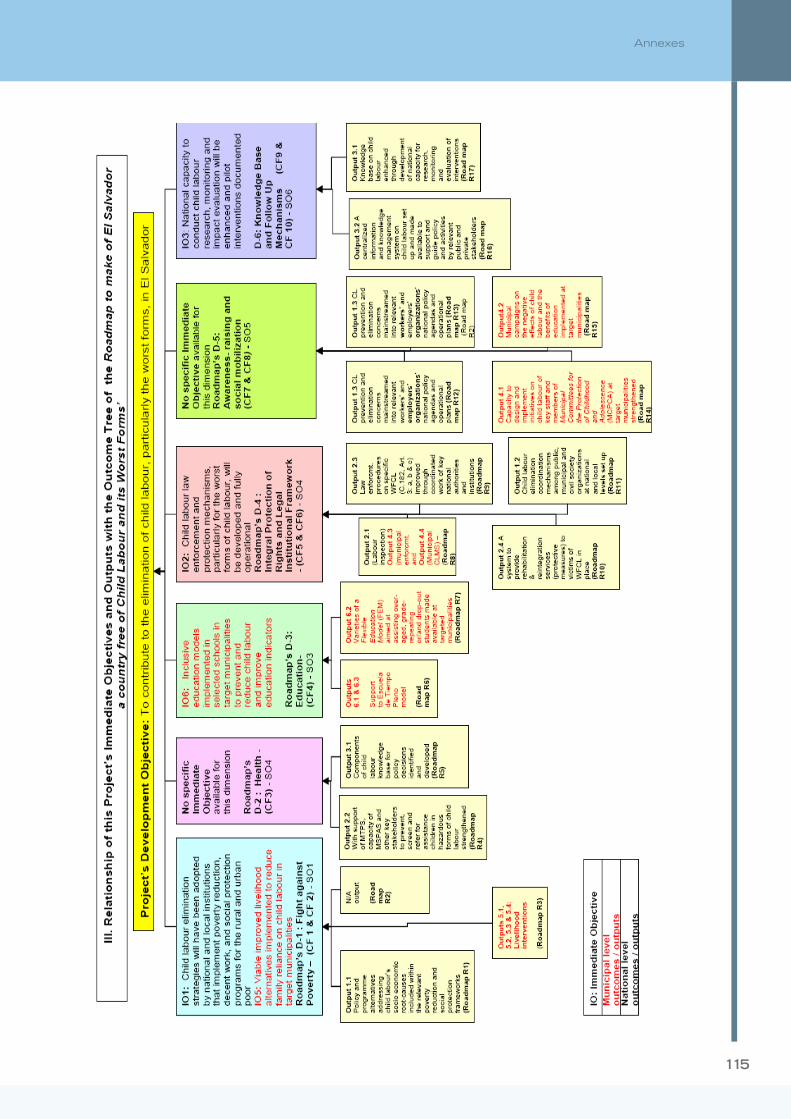
115
Annexes

116
IMPACT EVALUATION REPORT ONinterventions on starting-up small enterprises and reintegration of children to school of the Project “Eliminating Child Labour in El Salvador through Economic Empowerment and Social Inclusion”
Figure 4. Household owns a TV
-.5
0.5
1
-5 0 5Wealth index
Local average Lowess interventionLowess control
Figure 5. Household owns a fridge
0.2
.4.6
.81
-5 0 5Wealth index
Local average Lowess interventionLowess control

117
Annexes
Figure 6. Household has access to electricity0
.2.4
.6.8
1
-5 0 5Wealth index
Local average Lowess interventionLowess control
Figure 7. Number of bedrooms per capita
0.5
11.
52
-5 0 5Wealth index
Local average Lowess interventionLowess control
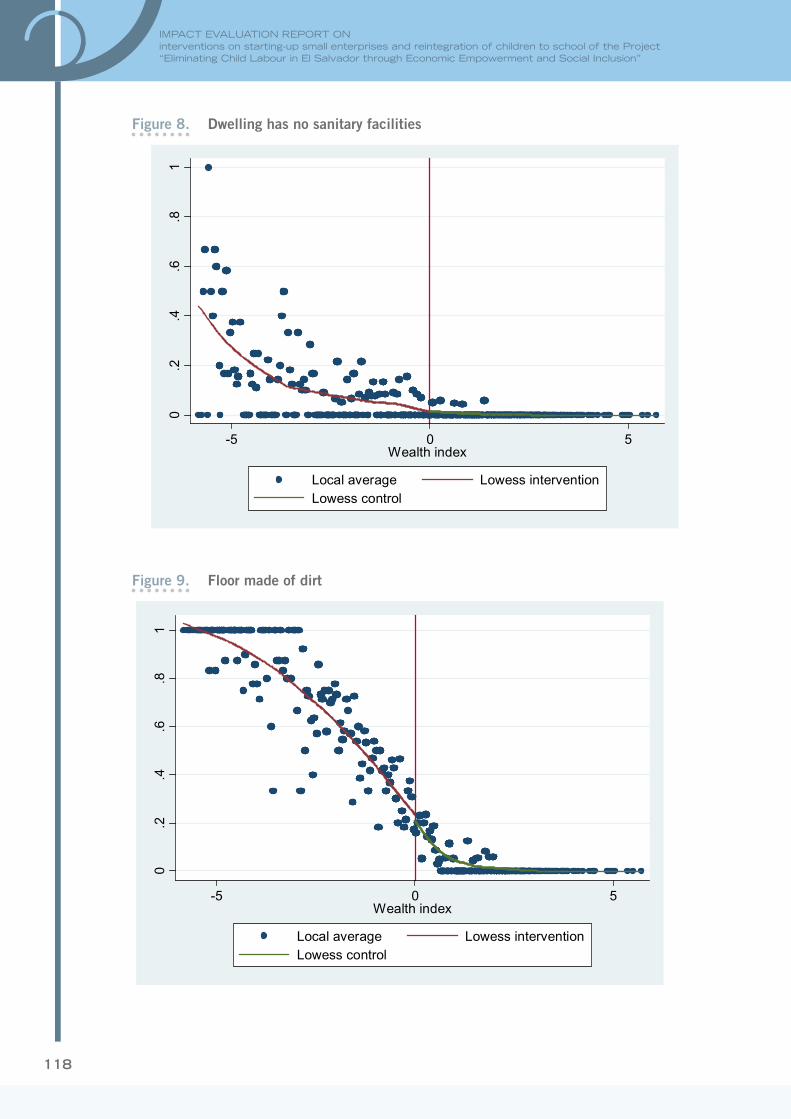
118
IMPACT EVALUATION REPORT ONinterventions on starting-up small enterprises and reintegration of children to school of the Project “Eliminating Child Labour in El Salvador through Economic Empowerment and Social Inclusion”
Figure 8. Dwelling has no sanitary facilities
0.2
.4.6
.81
-5 0 5Wealth index
Local average Lowess interventionLowess control
Figure 9. Floor made of dirt
0.2
.4.6
.81
-5 0 5Wealth index
Local average Lowess interventionLowess control

119
Annexes
Figure 10. Roof made of metal sheets0
.2.4
.6.8
1
-5 0 5Wealth index
Local average Lowess interventionLowess control
Figure 11. Density of the wealth index
0.0
5.1
.15
.2.2
5
-10 -5 0 5 10Wealth index

120
IMPACT EVALUATION REPORT ONinterventions on starting-up small enterprises and reintegration of children to school of the Project “Eliminating Child Labour in El Salvador through Economic Empowerment and Social Inclusion”
Figure 12. Female headed household
0.2
.4.6
.81
-5 0 5Wealth index
Local average Lowess interventionLowess control
Figure 13. Household Head Literate
0.2
.4.6
.81
-5 0 5Wealth index
Local average Lowess interventionLowess control

121
Annexes
Figure 14. Monthly per capita adult labor income0
5010
015
020
025
0
-5 0 5Wealth index
Local average Lowess interventionLowess control
Figure 15. Monthly per capita household expenditure
050
100
150
-5 0 5Wealth index
Local average Lowess interventionLowess control
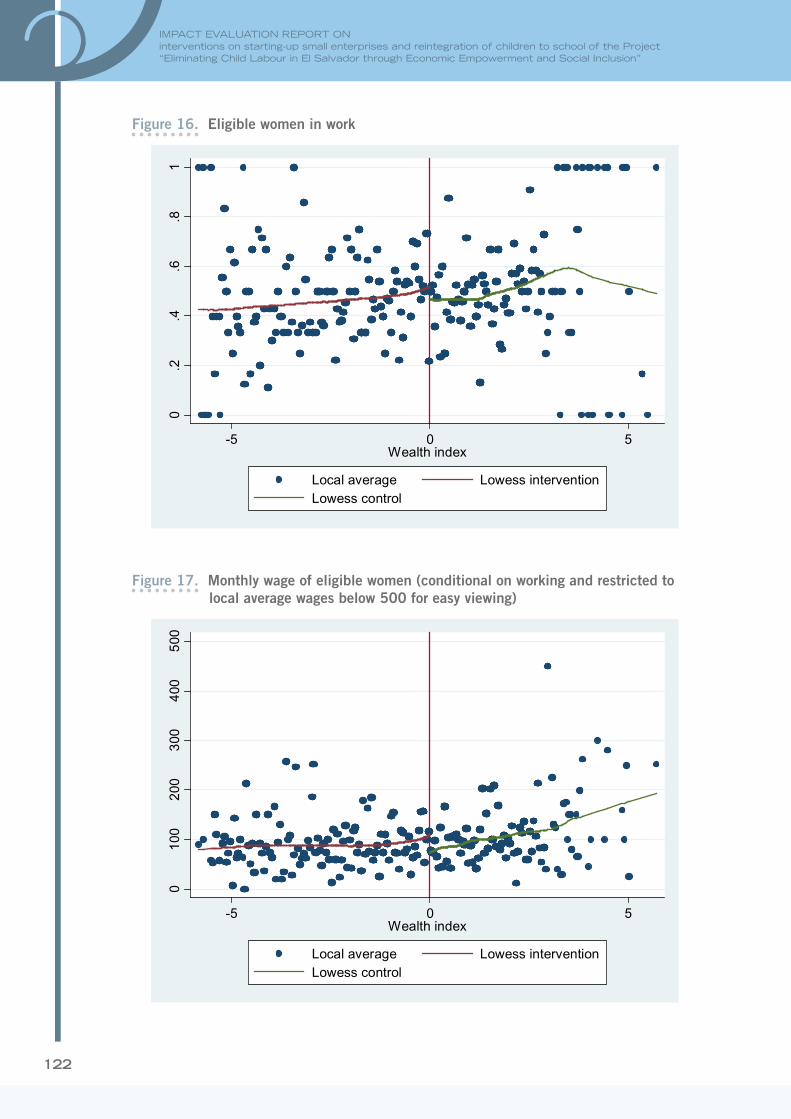
122
IMPACT EVALUATION REPORT ONinterventions on starting-up small enterprises and reintegration of children to school of the Project “Eliminating Child Labour in El Salvador through Economic Empowerment and Social Inclusion”
Figure 16. Eligible women in work
0.2
.4.6
.81
-5 0 5Wealth index
Local average Lowess interventionLowess control
Figure 17. Monthly wage of eligible women (conditional on working and restricted to local average wages below 500 for easy viewing)
010
020
030
040
050
0
-5 0 5Wealth index
Local average Lowess interventionLowess control

123
Annexes
Figure 18. Weekly hours worked by eligible women (conditional on working)0
2040
60
-5 0 5Wealth index
Local average Lowess interventionLowess control
Figure 19. Child (5-17) in school
.2.4
.6.8
1
-5 0 5Wealth index
Local average Lowess interventionLowess control

124
IMPACT EVALUATION REPORT ONinterventions on starting-up small enterprises and reintegration of children to school of the Project “Eliminating Child Labour in El Salvador through Economic Empowerment and Social Inclusion”
Figure 20. Child (5-17) literate
.5.6
.7.8
.91
-5 0 5Wealth index
Local average Lowess interventionLowess control
Figure 21. Child (5-17) in work
0.2
.4.6
.81
-5 0 5Wealth index
Local average Lowess interventionLowess control

125
Annexes
Figure 22. Child (5-17) in dangerous work0
.2.4
.6.8
1
-5 0 5Wealth index
Local average Lowess interventionLowess control
Figure 23. Child (5-17) in chores
0.2
.4.6
.81
-5 0 5Wealth index
Local average Lowess interventionLowess control

126
IMPACT EVALUATION REPORT ONinterventions on starting-up small enterprises and reintegration of children to school of the Project “Eliminating Child Labour in El Salvador through Economic Empowerment and Social Inclusion”
Figure 24. Weekly hours worked by child (5-17) conditional on working
010
2030
4050
-5 0 5Wealth index
Local average Lowess interventionLowess control
Figure 25. Weekly hours in chores by child (5-17) conditional on being in chores
010
2030
40
-5 0 5Wealth index
Local average Lowess interventionLowess control

127
Annexes
�Annex 6. Interim report on follow-up survey (Spanish)

128
IMPACT EVALUATION REPORT ONSupport mothers of child labourers to start a small enterprise and for reintegration of their children to school intervention of the Project “Eliminating Child Labour in El Salvador through Economic Empowerment and Social Inclusion”

129
Annexes

130
IMPACT EVALUATION REPORT ONSupport mothers of child labourers to start a small enterprise and for reintegration of their children to school intervention of the Project “Eliminating Child Labour in El Salvador through Economic Empowerment and Social Inclusion”

131
Annexes

132
IMPACT EVALUATION REPORT ONSupport mothers of child labourers to start a small enterprise and for reintegration of their children to school intervention of the Project “Eliminating Child Labour in El Salvador through Economic Empowerment and Social Inclusion”

133
Annexes

134
IMPACT EVALUATION REPORT ONSupport mothers of child labourers to start a small enterprise and for reintegration of their children to school intervention of the Project “Eliminating Child Labour in El Salvador through Economic Empowerment and Social Inclusion”
135
Annexes
136
IMPACT EVALUATION REPORT ONSupport mothers of child labourers to start a small enterprise and for reintegration of their children to school intervention of the Project “Eliminating Child Labour in El Salvador through Economic Empowerment and Social Inclusion”
137
Annexes

138
IMPACT EVALUATION REPORT ONSupport mothers of child labourers to start a small enterprise and for reintegration of their children to school intervention of the Project “Eliminating Child Labour in El Salvador through Economic Empowerment and Social Inclusion”

139
Annexes

140
IMPACT EVALUATION REPORT ONSupport mothers of child labourers to start a small enterprise and for reintegration of their children to school intervention of the Project “Eliminating Child Labour in El Salvador through Economic Empowerment and Social Inclusion”

141
Annexes

142
IMPACT EVALUATION REPORT ONSupport mothers of child labourers to start a small enterprise and for reintegration of their children to school intervention of the Project “Eliminating Child Labour in El Salvador through Economic Empowerment and Social Inclusion”
143
Annexes

144
IMPACT EVALUATION REPORT ONSupport mothers of child labourers to start a small enterprise and for reintegration of their children to school intervention of the Project “Eliminating Child Labour in El Salvador through Economic Empowerment and Social Inclusion”

145
Annexes

146
IMPACT EVALUATION REPORT ONSupport mothers of child labourers to start a small enterprise and for reintegration of their children to school intervention of the Project “Eliminating Child Labour in El Salvador through Economic Empowerment and Social Inclusion”

147
Annexes

148
IMPACT EVALUATION REPORT ONSupport mothers of child labourers to start a small enterprise and for reintegration of their children to school intervention of the Project “Eliminating Child Labour in El Salvador through Economic Empowerment and Social Inclusion”

149
Annexes

150
IMPACT EVALUATION REPORT ONSupport mothers of child labourers to start a small enterprise and for reintegration of their children to school intervention of the Project “Eliminating Child Labour in El Salvador through Economic Empowerment and Social Inclusion”
151
Annexes
152
IMPACT EVALUATION REPORT ONSupport mothers of child labourers to start a small enterprise and for reintegration of their children to school intervention of the Project “Eliminating Child Labour in El Salvador through Economic Empowerment and Social Inclusion”

153
Annexes

154
IMPACT EVALUATION REPORT ONSupport mothers of child labourers to start a small enterprise and for reintegration of their children to school intervention of the Project “Eliminating Child Labour in El Salvador through Economic Empowerment and Social Inclusion”

155
Annexes
156
IMPACT EVALUATION REPORT ONSupport mothers of child labourers to start a small enterprise and for reintegration of their children to school intervention of the Project “Eliminating Child Labour in El Salvador through Economic Empowerment and Social Inclusion”
157
Annexes

158
IMPACT EVALUATION REPORT ONSupport mothers of child labourers to start a small enterprise and for reintegration of their children to school intervention of the Project “Eliminating Child Labour in El Salvador through Economic Empowerment and Social Inclusion”
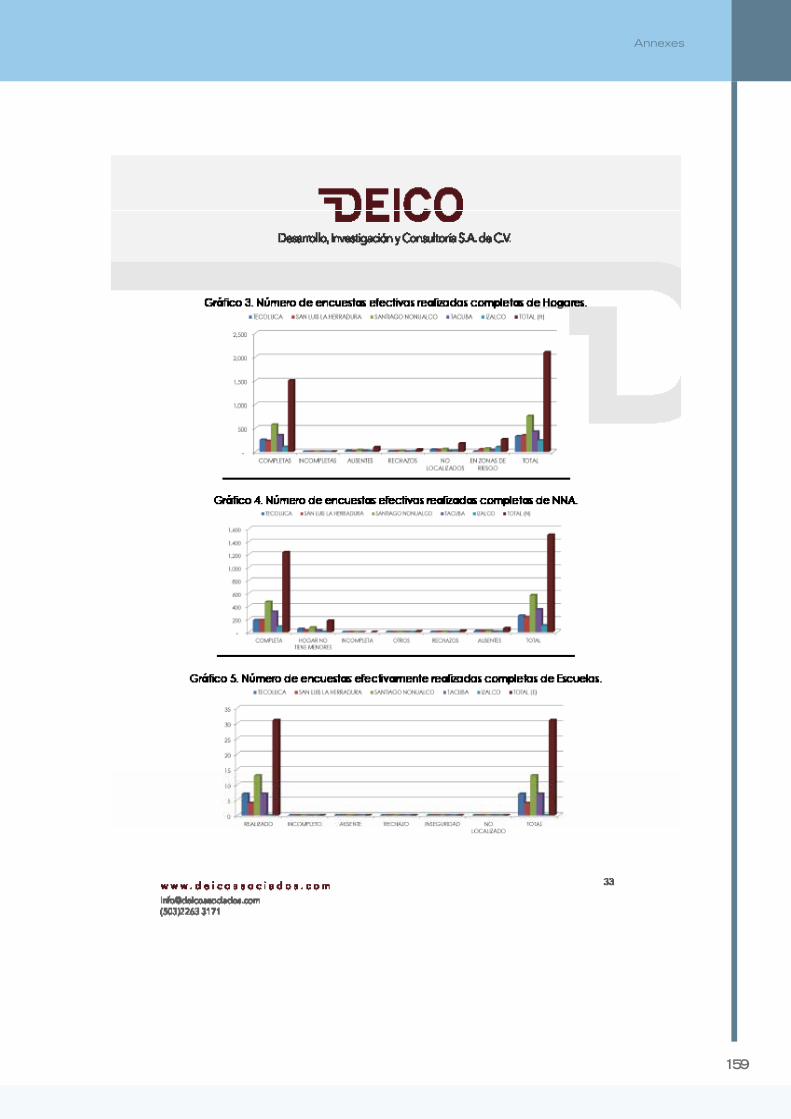
159
Annexes
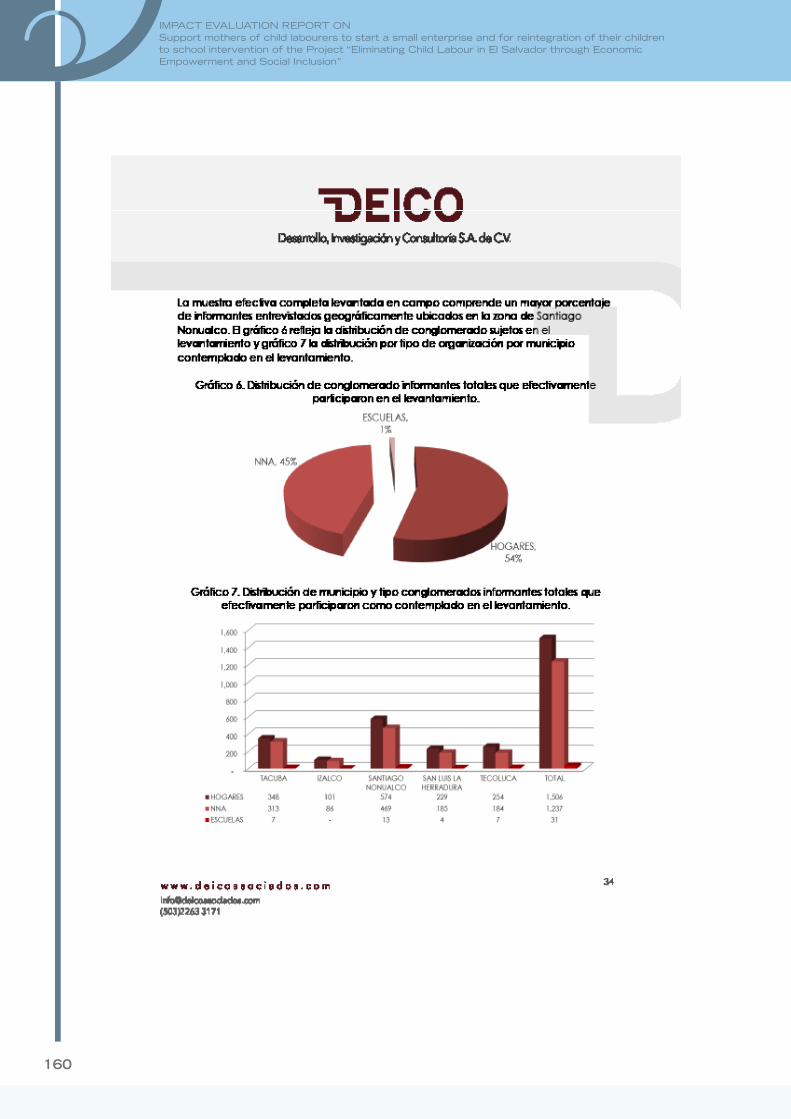
160
IMPACT EVALUATION REPORT ONSupport mothers of child labourers to start a small enterprise and for reintegration of their children to school intervention of the Project “Eliminating Child Labour in El Salvador through Economic Empowerment and Social Inclusion”

161
Annexes

162
IMPACT EVALUATION REPORT ONSupport mothers of child labourers to start a small enterprise and for reintegration of their children to school intervention of the Project “Eliminating Child Labour in El Salvador through Economic Empowerment and Social Inclusion”
163
Annexes
164
IMPACT EVALUATION REPORT ONSupport mothers of child labourers to start a small enterprise and for reintegration of their children to school intervention of the Project “Eliminating Child Labour in El Salvador through Economic Empowerment and Social Inclusion”
165
Annexes
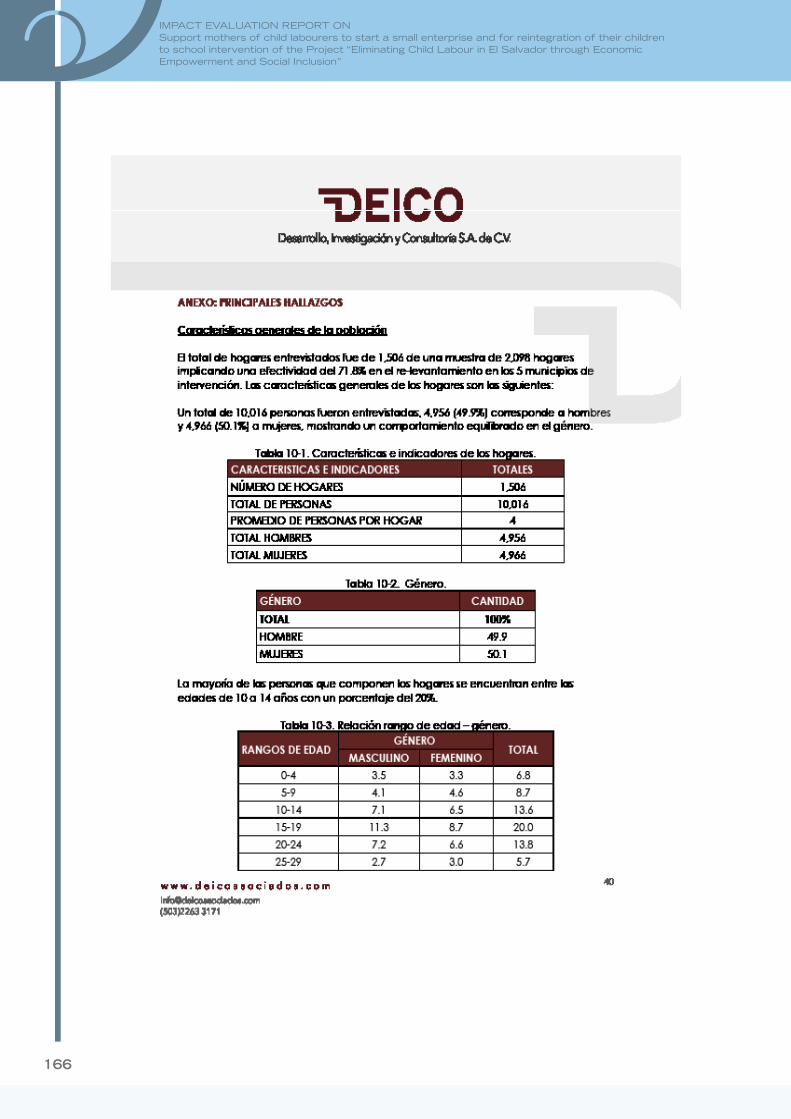
166
IMPACT EVALUATION REPORT ONSupport mothers of child labourers to start a small enterprise and for reintegration of their children to school intervention of the Project “Eliminating Child Labour in El Salvador through Economic Empowerment and Social Inclusion”

167
Annexes

168
IMPACT EVALUATION REPORT ONSupport mothers of child labourers to start a small enterprise and for reintegration of their children to school intervention of the Project “Eliminating Child Labour in El Salvador through Economic Empowerment and Social Inclusion”

169
Annexes
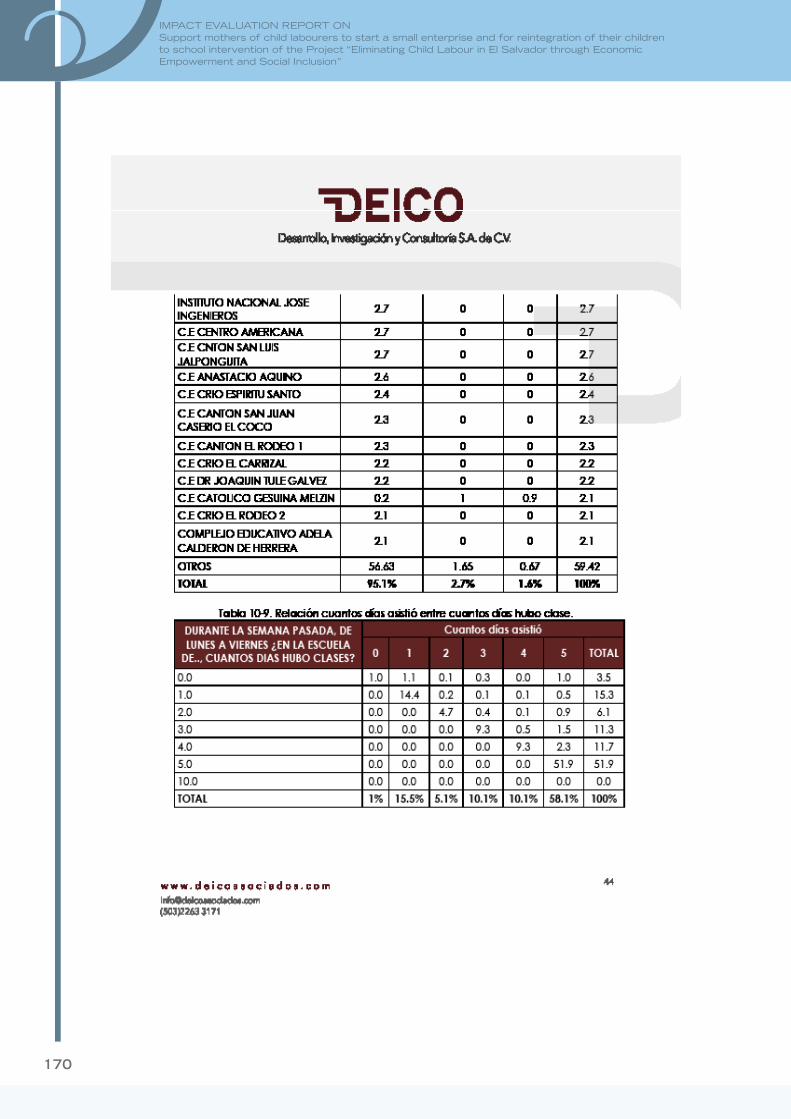
170
IMPACT EVALUATION REPORT ONSupport mothers of child labourers to start a small enterprise and for reintegration of their children to school intervention of the Project “Eliminating Child Labour in El Salvador through Economic Empowerment and Social Inclusion”
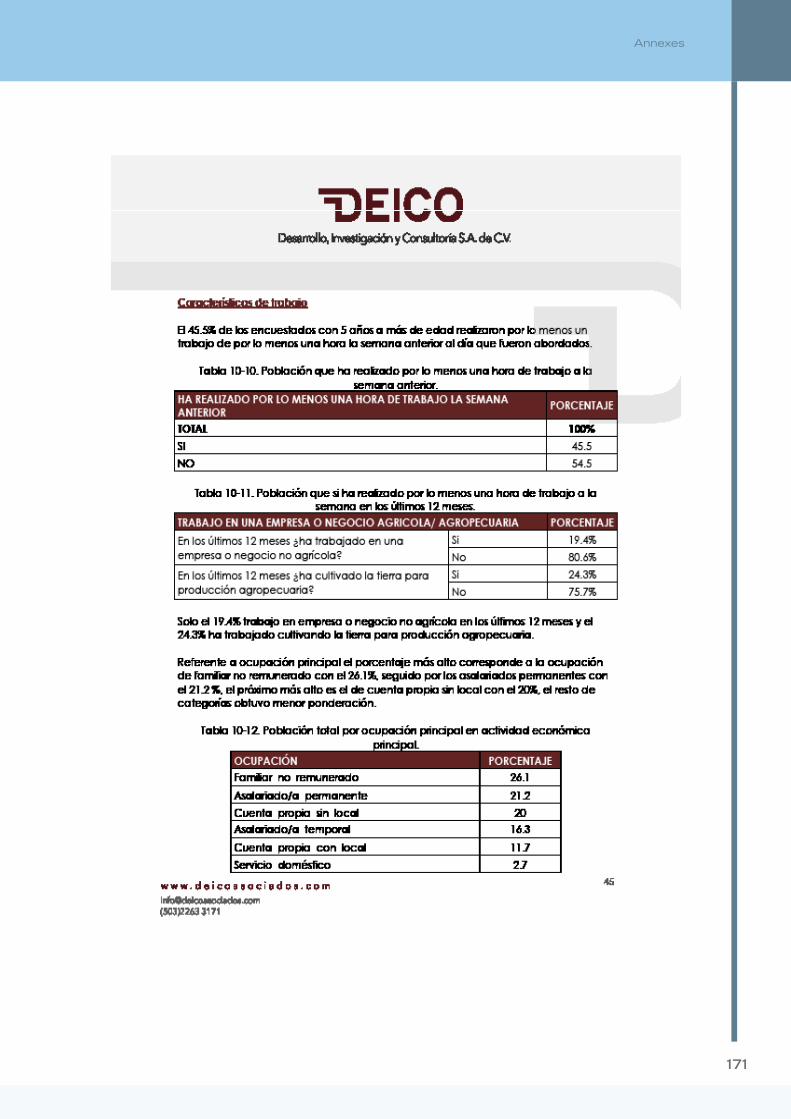
171
Annexes
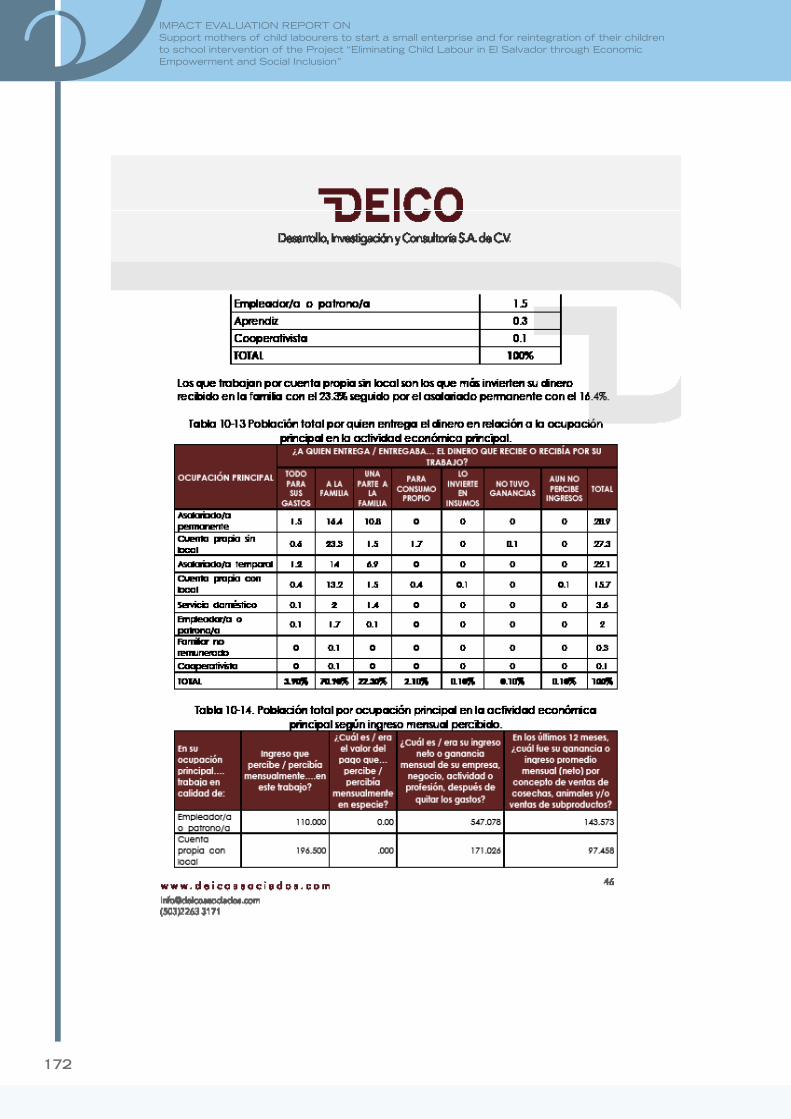
172
IMPACT EVALUATION REPORT ONSupport mothers of child labourers to start a small enterprise and for reintegration of their children to school intervention of the Project “Eliminating Child Labour in El Salvador through Economic Empowerment and Social Inclusion”
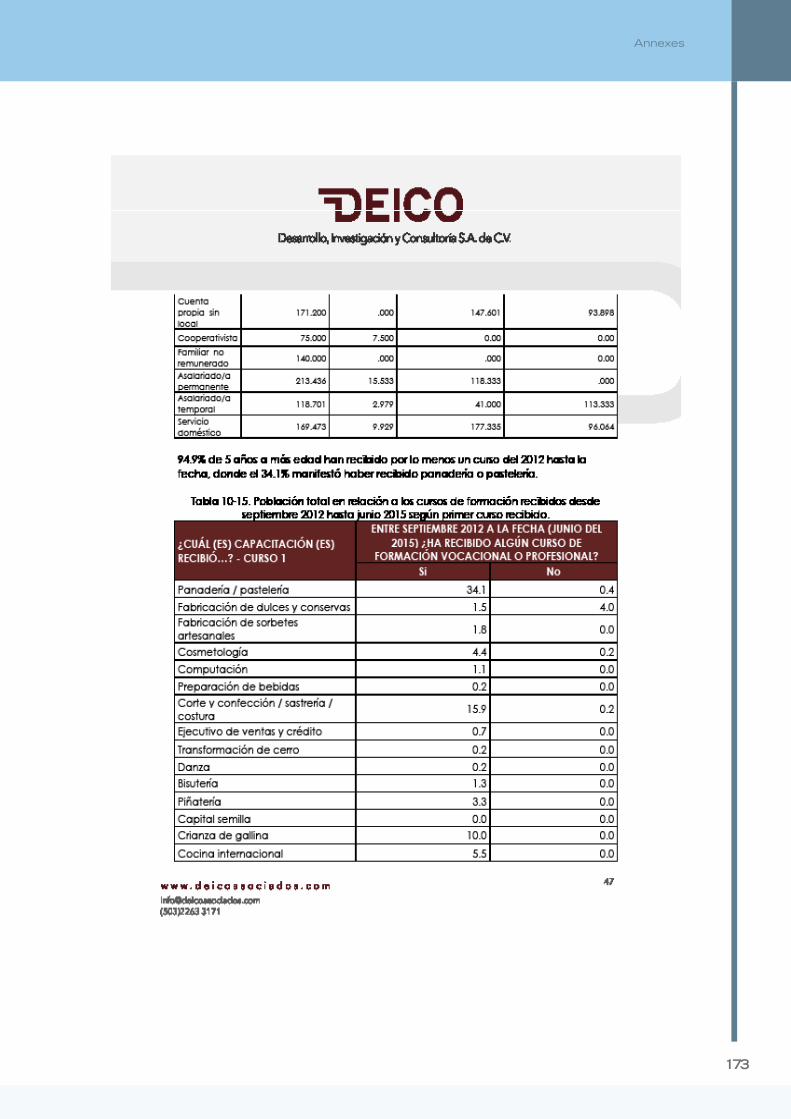
173
Annexes
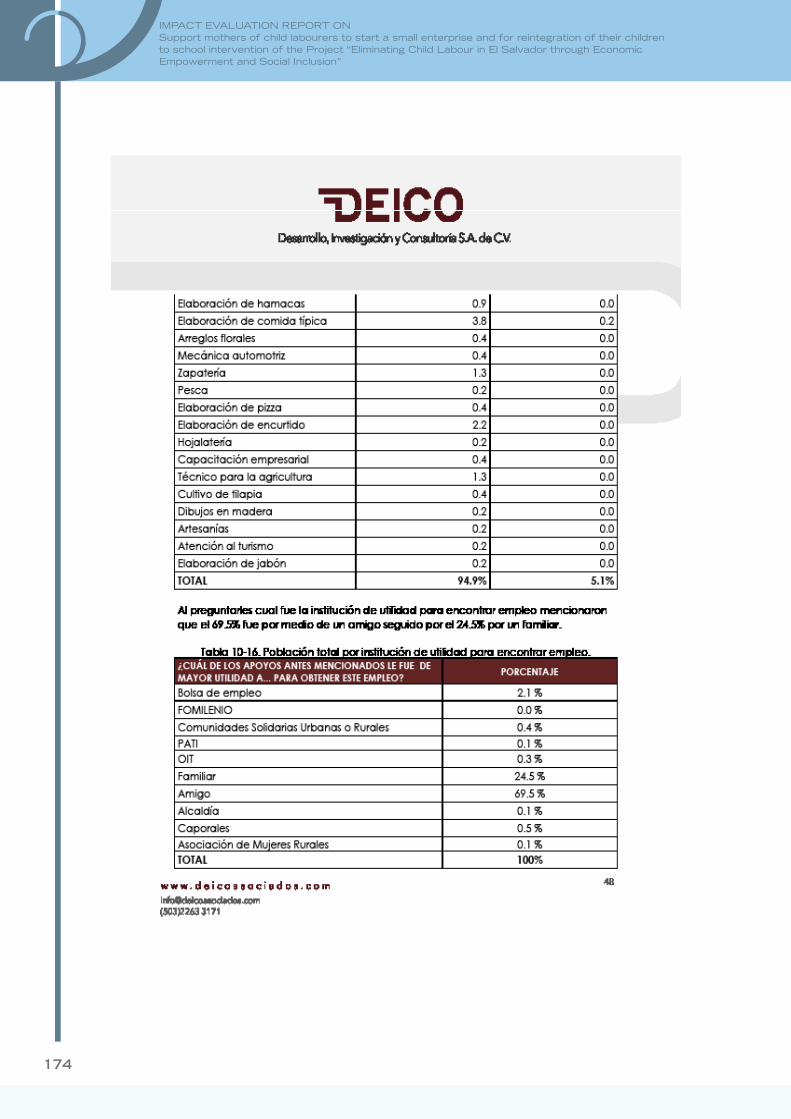
174
IMPACT EVALUATION REPORT ONSupport mothers of child labourers to start a small enterprise and for reintegration of their children to school intervention of the Project “Eliminating Child Labour in El Salvador through Economic Empowerment and Social Inclusion”
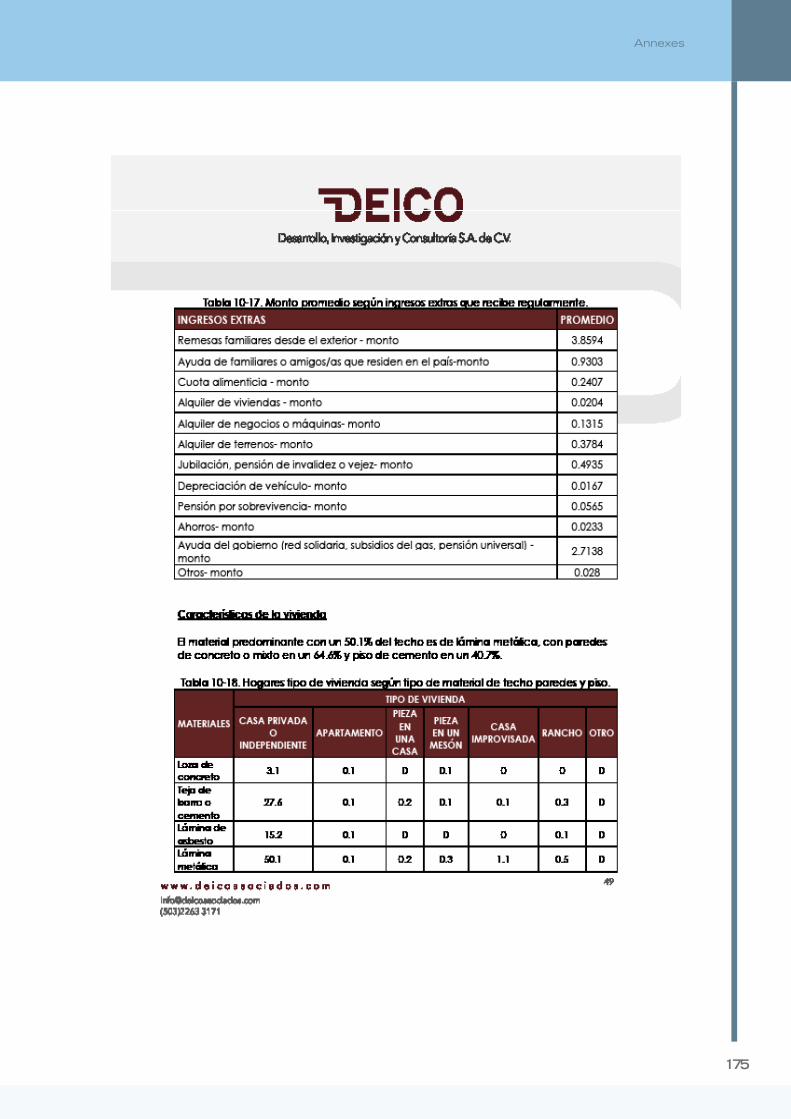
175
Annexes

176
IMPACT EVALUATION REPORT ONSupport mothers of child labourers to start a small enterprise and for reintegration of their children to school intervention of the Project “Eliminating Child Labour in El Salvador through Economic Empowerment and Social Inclusion”
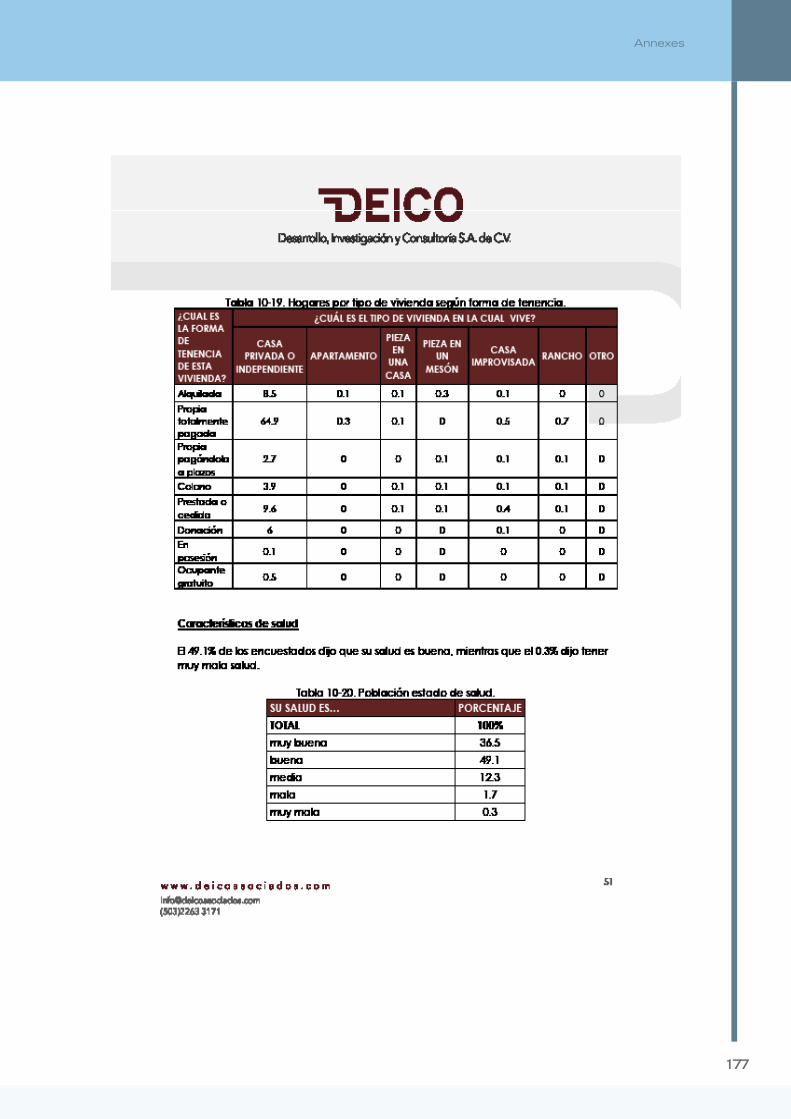
177
Annexes

178
IMPACT EVALUATION REPORT ONSupport mothers of child labourers to start a small enterprise and for reintegration of their children to school intervention of the Project “Eliminating Child Labour in El Salvador through Economic Empowerment and Social Inclusion”

179
Annexes

180
IMPACT EVALUATION REPORT ONSupport mothers of child labourers to start a small enterprise and for reintegration of their children to school intervention of the Project “Eliminating Child Labour in El Salvador through Economic Empowerment and Social Inclusion”

181
Annexes
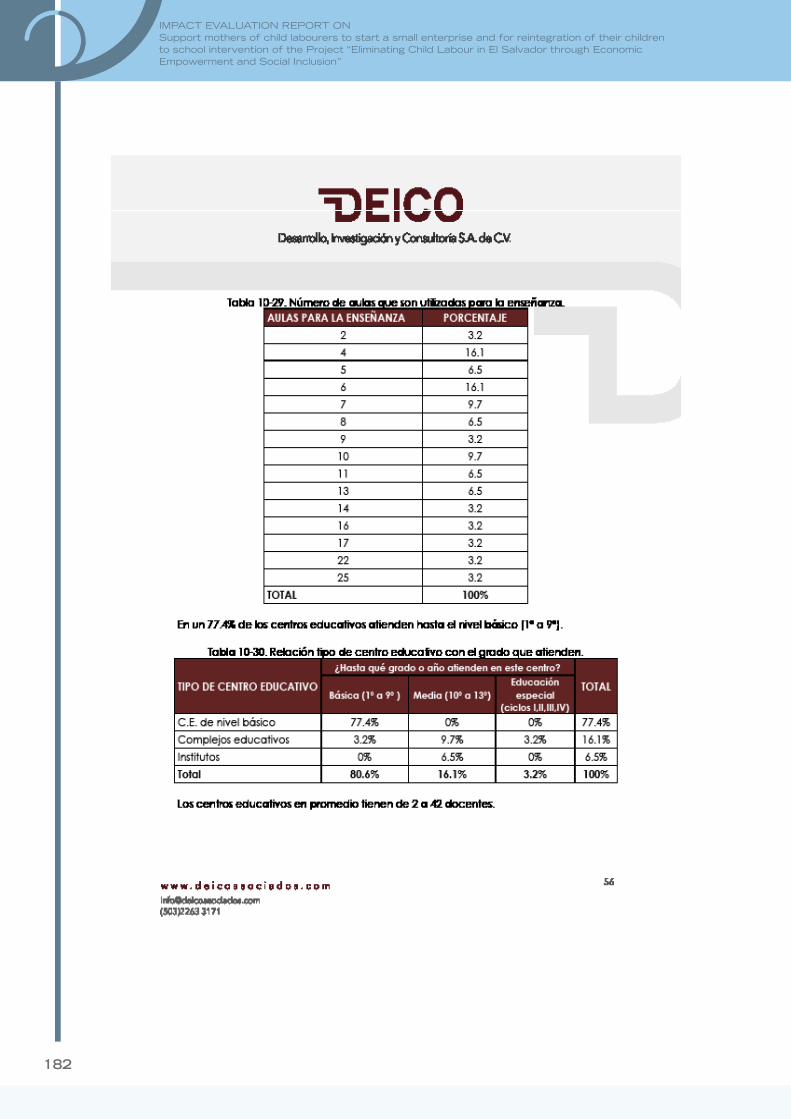
182
IMPACT EVALUATION REPORT ONSupport mothers of child labourers to start a small enterprise and for reintegration of their children to school intervention of the Project “Eliminating Child Labour in El Salvador through Economic Empowerment and Social Inclusion”

183
Annexes

184
IMPACT EVALUATION REPORT ONSupport mothers of child labourers to start a small enterprise and for reintegration of their children to school intervention of the Project “Eliminating Child Labour in El Salvador through Economic Empowerment and Social Inclusion”

185
Annexes

186
IMPACT EVALUATION REPORT ONSupport mothers of child labourers to start a small enterprise and for reintegration of their children to school intervention of the Project “Eliminating Child Labour in El Salvador through Economic Empowerment and Social Inclusion”

187
Annexes

188
IMPACT EVALUATION REPORT ONSupport mothers of child labourers to start a small enterprise and for reintegration of their children to school intervention of the Project “Eliminating Child Labour in El Salvador through Economic Empowerment and Social Inclusion”

189
Annexes
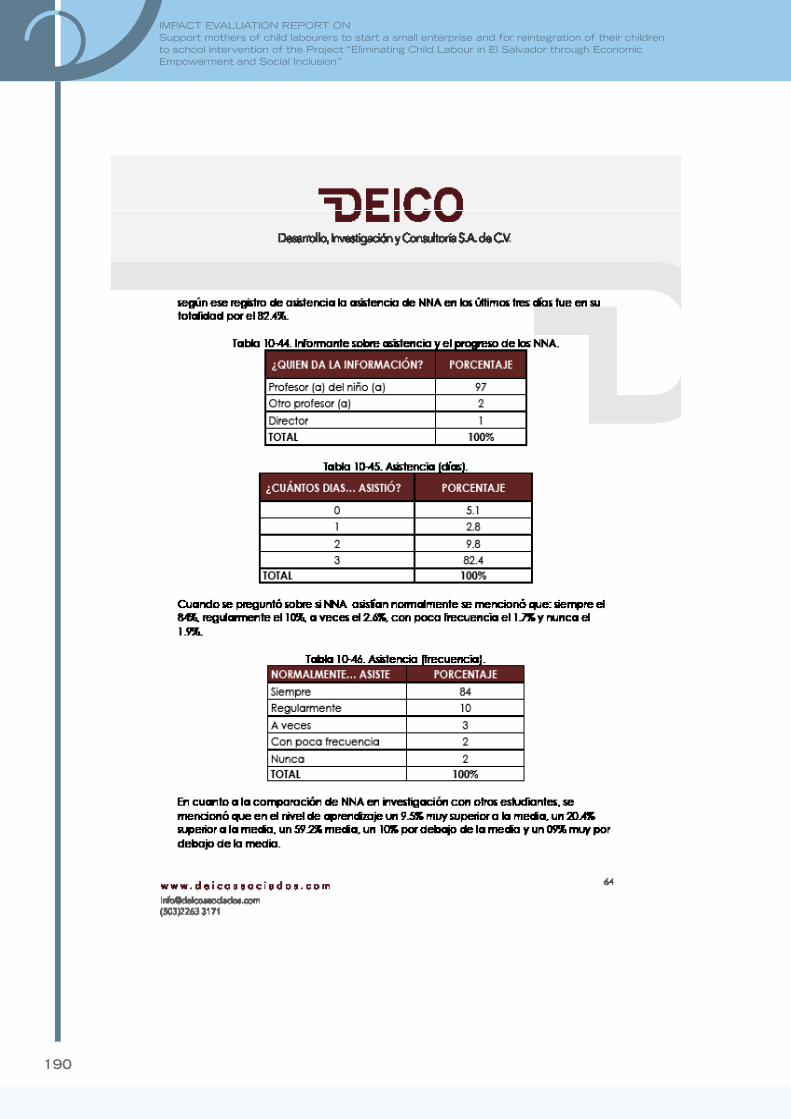
190
IMPACT EVALUATION REPORT ONSupport mothers of child labourers to start a small enterprise and for reintegration of their children to school intervention of the Project “Eliminating Child Labour in El Salvador through Economic Empowerment and Social Inclusion”
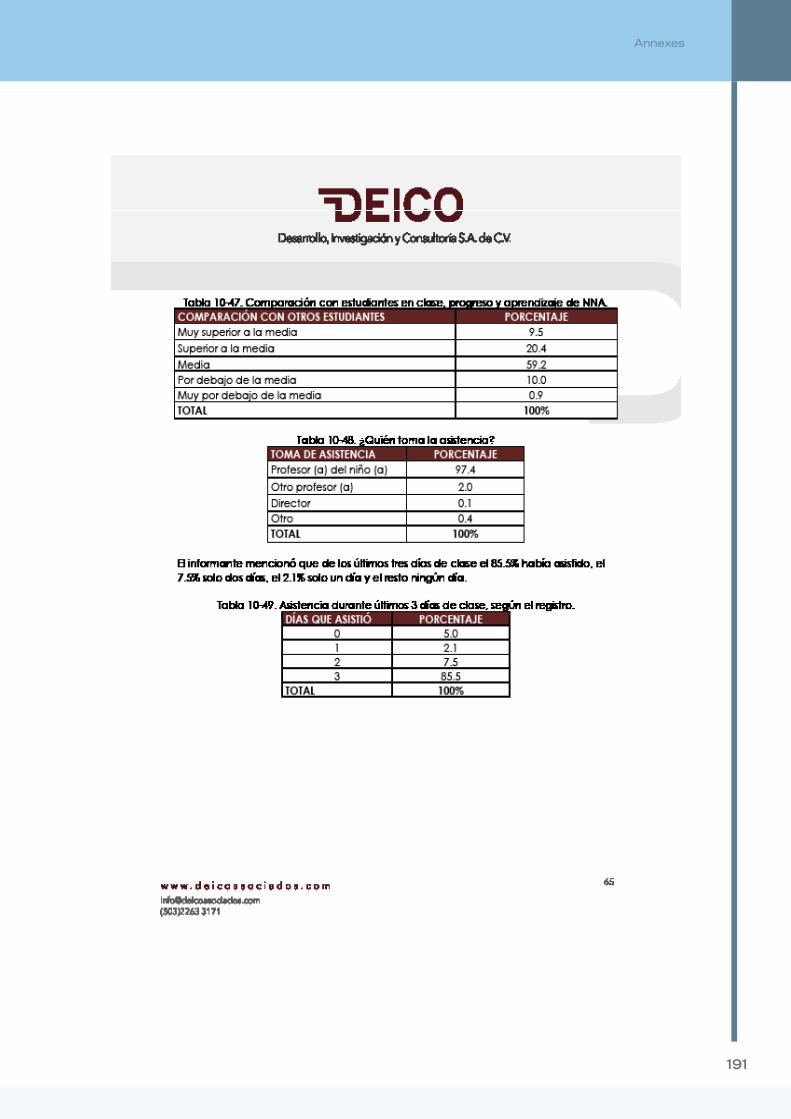
191
Annexes

192
IMPACT EVALUATION REPORT ONSupport mothers of child labourers to start a small enterprise and for reintegration of their children to school intervention of the Project “Eliminating Child Labour in El Salvador through Economic Empowerment and Social Inclusion”

193
Annexes

194
IMPACT EVALUATION REPORT ONSupport mothers of child labourers to start a small enterprise and for reintegration of their children to school intervention of the Project “Eliminating Child Labour in El Salvador through Economic Empowerment and Social Inclusion”

195
Annexes

196
IMPACT EVALUATION REPORT ONSupport mothers of child labourers to start a small enterprise and for reintegration of their children to school intervention of the Project “Eliminating Child Labour in El Salvador through Economic Empowerment and Social Inclusion”

197
Annexes
198
IMPACT EVALUATION REPORT ONSupport mothers of child labourers to start a small enterprise and for reintegration of their children to school intervention of the Project “Eliminating Child Labour in El Salvador through Economic Empowerment and Social Inclusion”

199
Annexes

200
IMPACT EVALUATION REPORT ONSupport mothers of child labourers to start a small enterprise and for reintegration of their children to school intervention of the Project “Eliminating Child Labour in El Salvador through Economic Empowerment and Social Inclusion”
201
Annexes
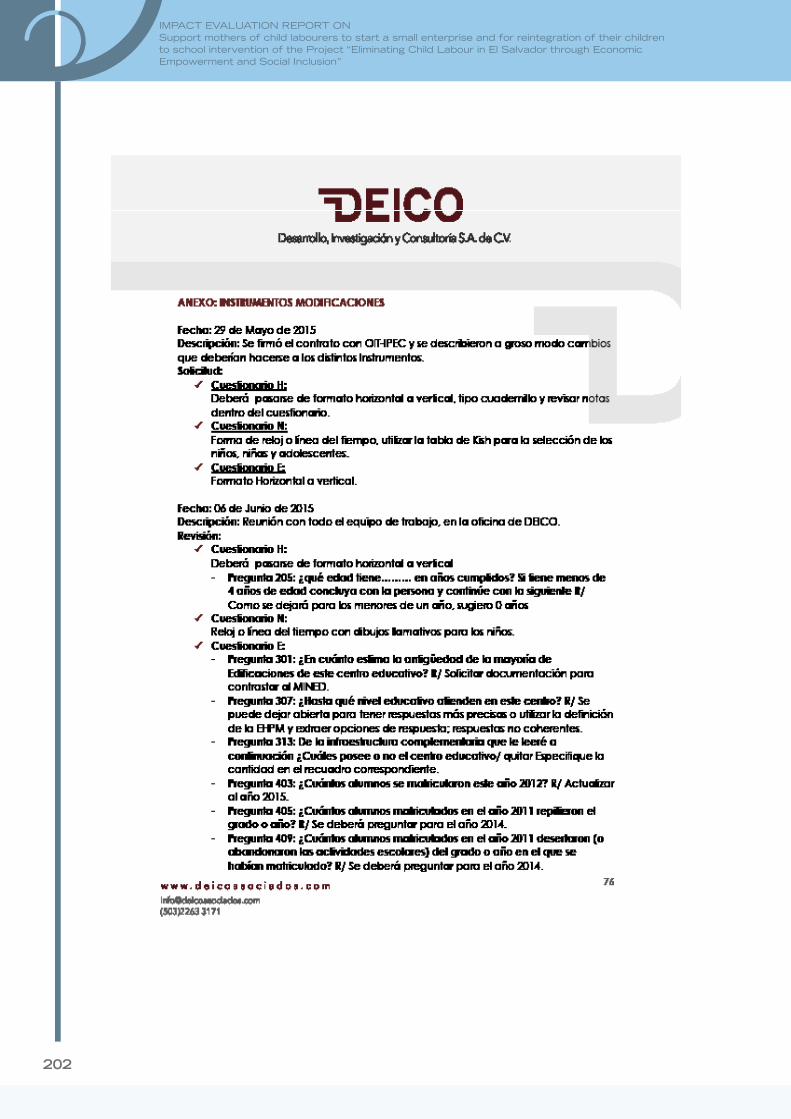
202
IMPACT EVALUATION REPORT ONSupport mothers of child labourers to start a small enterprise and for reintegration of their children to school intervention of the Project “Eliminating Child Labour in El Salvador through Economic Empowerment and Social Inclusion”

203
Annexes

204
IMPACT EVALUATION REPORT ONSupport mothers of child labourers to start a small enterprise and for reintegration of their children to school intervention of the Project “Eliminating Child Labour in El Salvador through Economic Empowerment and Social Inclusion”

205
Annexes

206
IMPACT EVALUATION REPORT ONSupport mothers of child labourers to start a small enterprise and for reintegration of their children to school intervention of the Project “Eliminating Child Labour in El Salvador through Economic Empowerment and Social Inclusion”
207
Annexes
208
IMPACT EVALUATION REPORT ONSupport mothers of child labourers to start a small enterprise and for reintegration of their children to school intervention of the Project “Eliminating Child Labour in El Salvador through Economic Empowerment and Social Inclusion”
209
Annexes

210
IMPACT EVALUATION REPORT ONSupport mothers of child labourers to start a small enterprise and for reintegration of their children to school intervention of the Project “Eliminating Child Labour in El Salvador through Economic Empowerment and Social Inclusion”
�Annex 7. Follow-up survey household questionnaire

211
Annexes

212
IMPACT EVALUATION REPORT ONSupport mothers of child labourers to start a small enterprise and for reintegration of their children to school intervention of the Project “Eliminating Child Labour in El Salvador through Economic Empowerment and Social Inclusion”

213
Annexes

214
IMPACT EVALUATION REPORT ONSupport mothers of child labourers to start a small enterprise and for reintegration of their children to school intervention of the Project “Eliminating Child Labour in El Salvador through Economic Empowerment and Social Inclusion”

215
Annexes

216
IMPACT EVALUATION REPORT ONSupport mothers of child labourers to start a small enterprise and for reintegration of their children to school intervention of the Project “Eliminating Child Labour in El Salvador through Economic Empowerment and Social Inclusion”

217
Annexes

218
IMPACT EVALUATION REPORT ONSupport mothers of child labourers to start a small enterprise and for reintegration of their children to school intervention of the Project “Eliminating Child Labour in El Salvador through Economic Empowerment and Social Inclusion”

219
Annexes

220
IMPACT EVALUATION REPORT ONSupport mothers of child labourers to start a small enterprise and for reintegration of their children to school intervention of the Project “Eliminating Child Labour in El Salvador through Economic Empowerment and Social Inclusion”

221
Annexes

222
IMPACT EVALUATION REPORT ONSupport mothers of child labourers to start a small enterprise and for reintegration of their children to school intervention of the Project “Eliminating Child Labour in El Salvador through Economic Empowerment and Social Inclusion”

223
Annexes

224
IMPACT EVALUATION REPORT ONSupport mothers of child labourers to start a small enterprise and for reintegration of their children to school intervention of the Project “Eliminating Child Labour in El Salvador through Economic Empowerment and Social Inclusion”
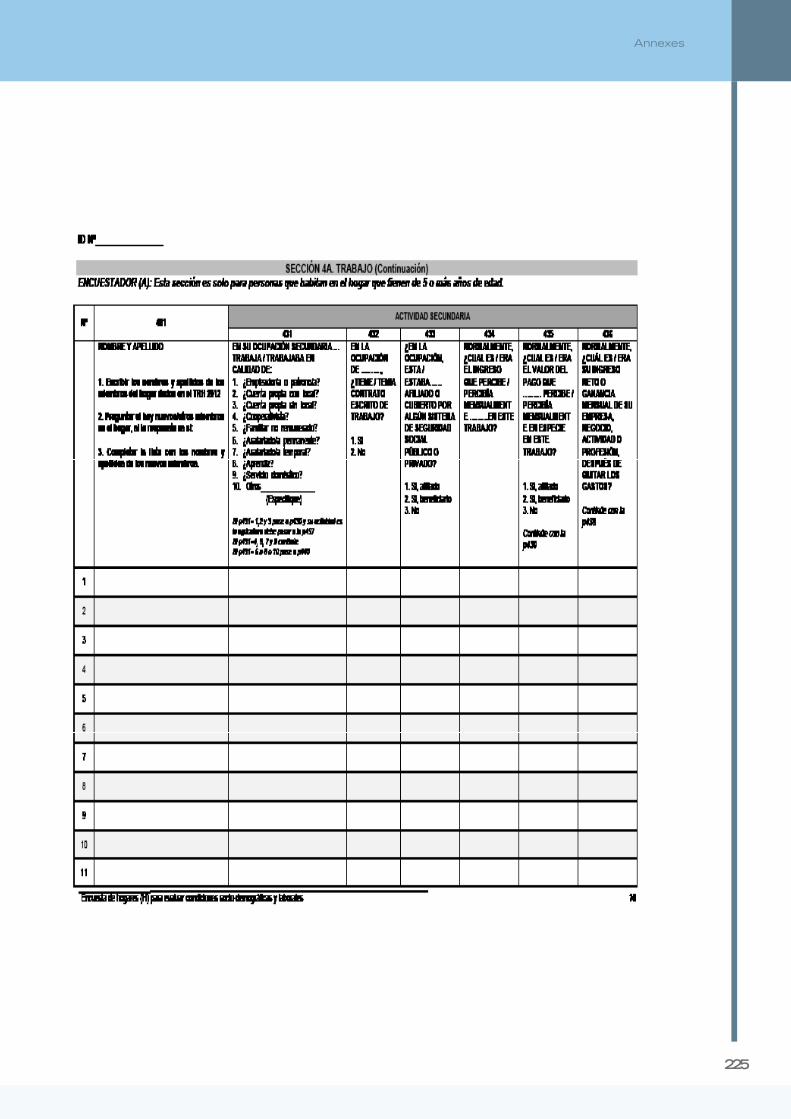
225
Annexes
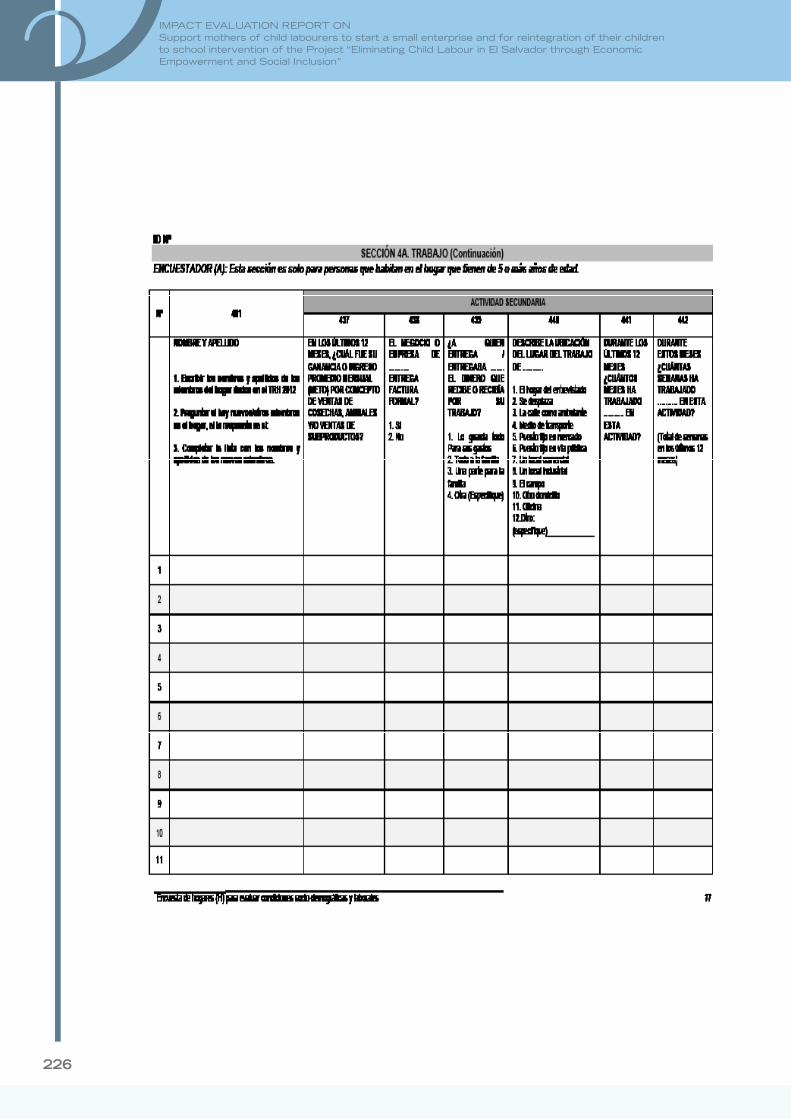
226
IMPACT EVALUATION REPORT ONSupport mothers of child labourers to start a small enterprise and for reintegration of their children to school intervention of the Project “Eliminating Child Labour in El Salvador through Economic Empowerment and Social Inclusion”

227
Annexes

228
IMPACT EVALUATION REPORT ONSupport mothers of child labourers to start a small enterprise and for reintegration of their children to school intervention of the Project “Eliminating Child Labour in El Salvador through Economic Empowerment and Social Inclusion”

229
Annexes

230
IMPACT EVALUATION REPORT ONSupport mothers of child labourers to start a small enterprise and for reintegration of their children to school intervention of the Project “Eliminating Child Labour in El Salvador through Economic Empowerment and Social Inclusion”

231
Annexes

232
IMPACT EVALUATION REPORT ONSupport mothers of child labourers to start a small enterprise and for reintegration of their children to school intervention of the Project “Eliminating Child Labour in El Salvador through Economic Empowerment and Social Inclusion”

233
Annexes

234
IMPACT EVALUATION REPORT ONSupport mothers of child labourers to start a small enterprise and for reintegration of their children to school intervention of the Project “Eliminating Child Labour in El Salvador through Economic Empowerment and Social Inclusion”

235
Annexes

236
IMPACT EVALUATION REPORT ONSupport mothers of child labourers to start a small enterprise and for reintegration of their children to school intervention of the Project “Eliminating Child Labour in El Salvador through Economic Empowerment and Social Inclusion”
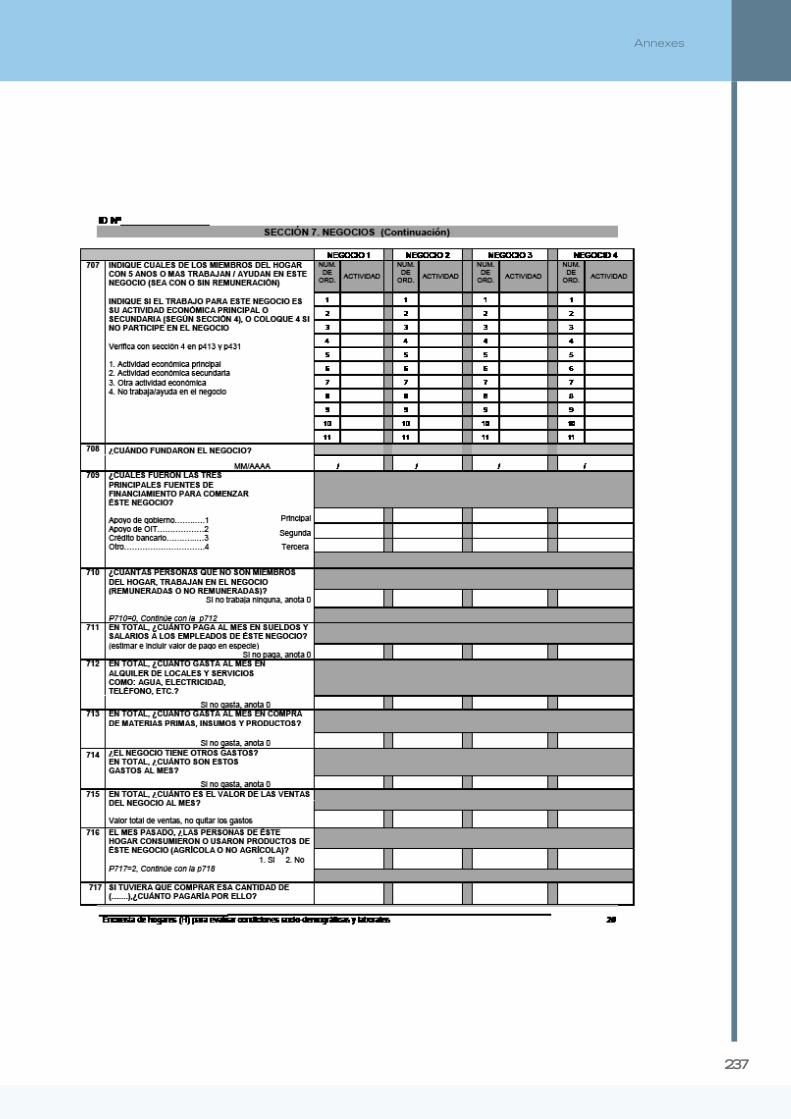
237
Annexes
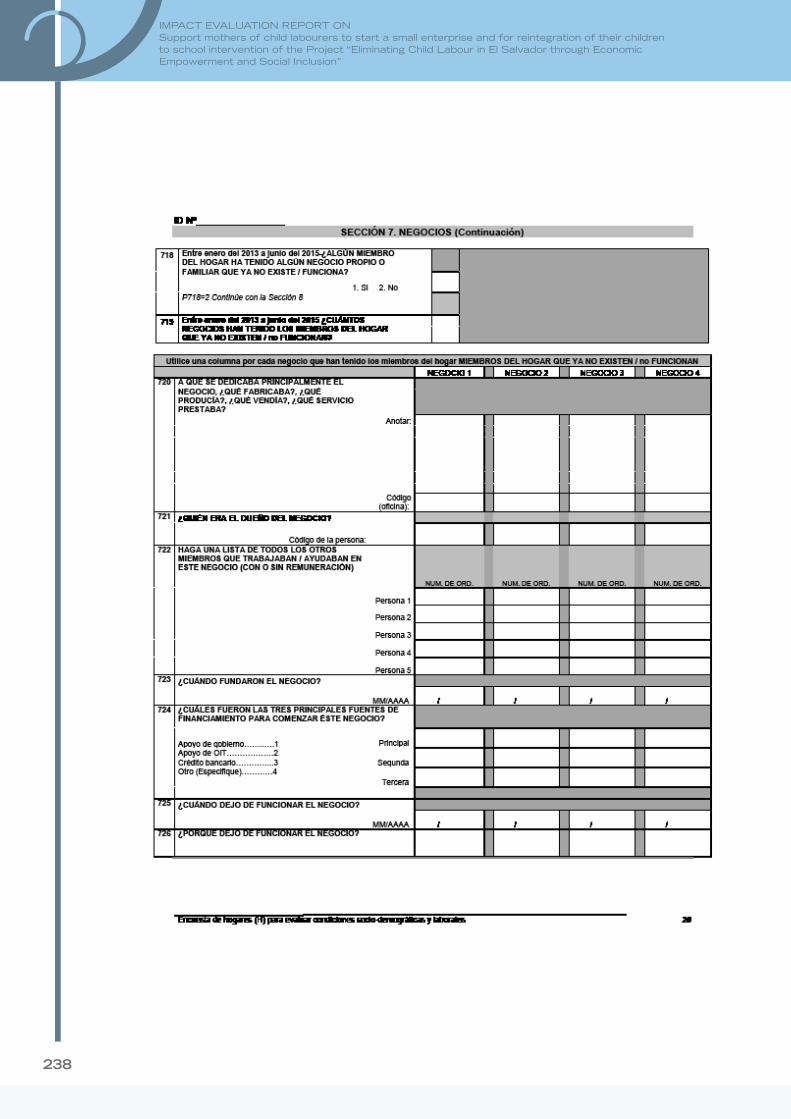
238
IMPACT EVALUATION REPORT ONSupport mothers of child labourers to start a small enterprise and for reintegration of their children to school intervention of the Project “Eliminating Child Labour in El Salvador through Economic Empowerment and Social Inclusion”

239
Annexes
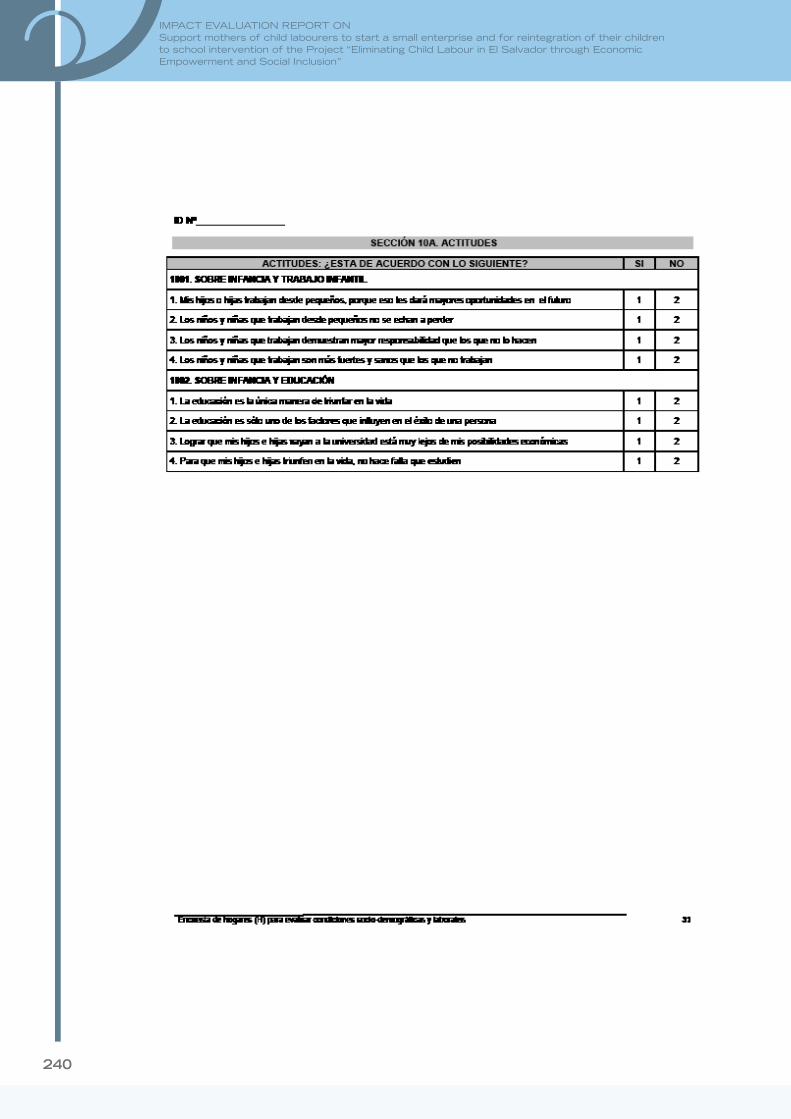
240
IMPACT EVALUATION REPORT ONSupport mothers of child labourers to start a small enterprise and for reintegration of their children to school intervention of the Project “Eliminating Child Labour in El Salvador through Economic Empowerment and Social Inclusion”

241
Annexes
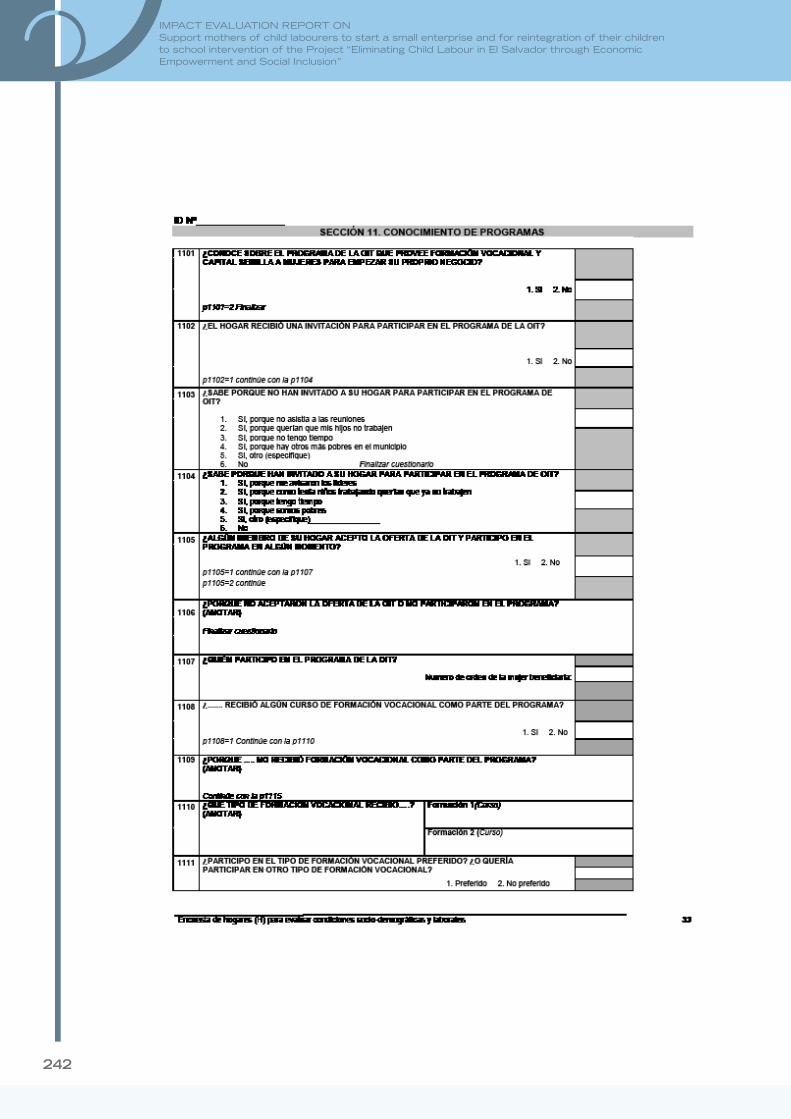
242
IMPACT EVALUATION REPORT ONSupport mothers of child labourers to start a small enterprise and for reintegration of their children to school intervention of the Project “Eliminating Child Labour in El Salvador through Economic Empowerment and Social Inclusion”

243
Annexes

244
IMPACT EVALUATION REPORT ONSupport mothers of child labourers to start a small enterprise and for reintegration of their children to school intervention of the Project “Eliminating Child Labour in El Salvador through Economic Empowerment and Social Inclusion”

245
Annexes