Imaging-Based Live Cell Yeast Screen Identifies Novel Factors Involved in Peroxisome Assembly
9
Subscriber access provided by Universitätsbibliothek | Karl-Franzens-Universität Graz Journal of Proteome Research is published by the American Chemical Society. 1155 Sixteenth Street N.W., Washington, DC 20036 Article Imaging-Based Live Cell Yeast Screen Identifies Novel Factors Involved in Peroxisome Assembly Heimo Wolinski, Uros# Petrovic#, Mojca Mattiazzi, Julia Petschnigg, Bettina Heise, Klaus Natter, and Sepp D. Kohlwein J. Proteome Res., 2009, 8 (1), 20-27 • DOI: 10.1021/pr800782n • Publication Date (Web): 02 January 2009 Downloaded from http://pubs.acs.org on January 7, 2009 More About This Article Additional resources and features associated with this article are available within the HTML version: • Supporting Information • Access to high resolution figures • Links to articles and content related to this article • Copyright permission to reproduce figures and/or text from this article
-
Upload
independent -
Category
Documents
-
view
0 -
download
0
Transcript of Imaging-Based Live Cell Yeast Screen Identifies Novel Factors Involved in Peroxisome Assembly
Subscriber access provided by Universitätsbibliothek | Karl-Franzens-Universität Graz
Journal of Proteome Research is published by the American Chemical Society.1155 Sixteenth Street N.W., Washington, DC 20036
Article
Imaging-Based Live Cell Yeast Screen IdentifiesNovel Factors Involved in Peroxisome Assembly
Heimo Wolinski, Uros# Petrovic#, Mojca Mattiazzi, JuliaPetschnigg, Bettina Heise, Klaus Natter, and Sepp D. Kohlwein
J. Proteome Res., 2009, 8 (1), 20-27 • DOI: 10.1021/pr800782n • Publication Date (Web): 02 January 2009
Downloaded from http://pubs.acs.org on January 7, 2009
More About This Article
Additional resources and features associated with this article are available within the HTML version:
• Supporting Information• Access to high resolution figures• Links to articles and content related to this article• Copyright permission to reproduce figures and/or text from this article
Imaging-Based Live Cell Yeast Screen Identifies Novel Factors
Involved in Peroxisome Assembly
Heimo Wolinski,† Uros Petrovic,‡ Mojca Mattiazzi,‡ Julia Petschnigg,† Bettina Heise,§
Klaus Natter,† and Sepp D. Kohlwein*,†
Institute of Molecular Biosciences, University of Graz, Austria, Department of Molecular and BiomedicalSciences, Jozef Stefan Institute, Ljubljana, Slovenia, and Fuzzy Logic Laboratory Linz-Hagenberg, Linz, Austria
Received September 15, 2008
We describe an imaging-based method in intact cells to systematically screen yeast mutant librariesfor abnormal morphology and distribution of fluorescently labeled subcellular structures. In this study,chromosomally expressed green fluorescent protein (GFP) fused to the peroxisomal targeting sequence1, consisting of serine-lysine-leucine, was introduced into 4740 viable yeast deletion mutants using amodified synthetic genetic array (SGA) technology. A benchtop robot was used to create ordered high-density arrays of GFP-expressing yeast mutants on solid media plates. Immobilized live yeast colonieswere subjected to high-resolution, multidimensional confocal imaging. A software tool was designedfor automated processing and quantitative analysis of acquired multichannel three-dimensional imagedata. The study resulted in the identification of two novel proteins, as well as of all previously knownproteins required for import of proteins bearing peroxisomal targeting signal PTS1, into yeastperoxisomes. The modular method enables reliable microscopic analysis of live yeast mutant librariesin a universally applicable format on standard microscope slides, and provides a step toward fullyautomated high-resolution imaging of intact yeast cells.
Keywords: synthetic genetic array • lipid metabolism • Saccharomyces cerevisiae • confocal microscopy• green fluorescent protein • high-content screen
IntroductionIn the postgenomic era proteomics and genetic methods
have been established to delineate protein function on agenome-wide scale and to reconstruct the network of functionalinteractions of proteins in eukaryotic cells. Fluorescence mi-croscopy and, in particular, green-fluorescent protein (GFP)technology provide outstanding tools for studying the spatialorganization and time-dependent behavior of fluorescentlylabeled proteins in live specimens. Consequently, in the lastyears, great efforts have been made in biomedical research toapply imaging techniques for proteomics approaches. Pioneer-ing work has been conducted in yeast, by labeling all proteinswith immuno-tags1 or green fluorescent protein.2 In thiscontext, microscope platforms and tools capable of automatedsample preparation and automated image acquisition, as wellas sophisticated software for processing of acquired screeningdata in batch mode, have been developed.3-7 Such imaging-based screening platforms allow the analysis of cellular eventsin a large number of experimental samples and with highthroughput. These approaches complement biochemical andgenetic methods and have been successfully applied, for
example, to characterize morphological phenotypes of cellscaused by mutations or by treatment of cells with chemicalinhibitors or drugs.8-11 In a recent imaging-based study ininsect cells, RNAi technology was used to identify genesinvolved in lipid droplet biogenesis and morphology.12
The yeast Saccharomyces cerevisiae is widely used as a modelsystem for studying fundamental cellular processes of eukary-otic cells, highlighted by the Nobel Prize in medicine awardedto yeast researchers for their work on the cell cycle (Leland H.Hartwell, Timothy R. Hunt and Paul M. Nurse. Key regulatorsof the cell cycle. Nobel Prize 2001). Because of its genetictractability, its ease of genetic manipulation and the wealth ofwell-established biochemical, genomics and proteomics tools,yeast represents an excellent model for the analysis of proteinfunction. Systematic analyses of yeast deletion mutant collec-tions13 provide an exceptional experimental platform for robot-ics-based phenotypic screens. The automated construction ofdouble mutants is the basis of synthetic lethality screens forthe identification of genetic interactions (synthetic geneticarray; SGA).14 However, despite the popularity of this modelorganism for genetic and biochemical studies and the avail-ability of strain libraries, large-scale, cell-based phenotypicanalyses of yeast are rare.2,13,15-18 One challenge for imaging-based yeast screens and the use of commercially availablemicroscopy platforms is the difficult immobilization of theunicellular organism on glass or plastic surfaces. In addition,such “technical” limitations have to be considered in the
* To whom correspondence should be addressed. Sepp D. Kohlwein,Institute of Molecular Biosciences, University of Graz, Humboldtstrasse 50/II, A8010 Graz, Austria. Phone: +43 316 380 5487. Fax: +43 316 380 9854.E-mail: [email protected].
† University of Graz.‡ Jozef Stefan Institute.§ Fuzzy Logic Laboratory Linz-Hagenberg.
20 Journal of Proteome Research 2009, 8, 20–27 10.1021/pr800782n CCC: $40.75 2009 American Chemical SocietyPublished on Web 01/02/2009
context of a potential interference of the preparation methodwith normal cellular physiology of yeast.19 A further, generallimitation of yeast imaging is the small size of the cells of ∼5-8µm in length. As a consequence, subcellular yeast structuresare typically at or below the limit of optical resolution. Thus,conventional fluorescence microscopy applied for phenotypicprofiling of subcellular yeast structures usually produces off-grade image data, which in turn may obscure a reliablequantitative analysis. For this reason, high-resolution andthree-dimensional imaging as provided by confocal microscopesystems is more suitable to sufficiently resolve cellular com-ponents of yeast.20
Here, we describe an imaging-based method for reliablehigh-resolution screens of large collections of fluorescentlylabeled living yeast strains. The method was applied to screenthe yeast deletion mutant collection for abnormal localizationof the peroxisomal matrix marker, green-fluorescent proteintagged with the peroxisomal targeting sequence, PTS1 (car-boxyl-terminal amino acid sequence serine-lysine-leucine(SKL)).21,22 Proteins involved in peroxisome biogenesis andfunction are highly conserved from yeast to man.23-26 Cur-rently, 32 genes (plus several isoforms) involved in membranebiogenesis and import of proteins into the peroxisomal matrix,as well as proliferation and inheritance of the organelle, havebeen identified in various organisms.27 Malfunction of someof these proteins may cause fatal inherited diseases in humanssuch as Zellweger syndrome, different types of adrenoleukod-ystrophy, rhizomelic chondrodysplasia punctata or infantileRefsum disease.28-32 Because of the conservation of theprinciples of peroxisome biogenesis, data obtained from theyeast system have greatly contributed to the elucidation ofthe molecular basis of human peroxisomal disorders.33,34 Upto now, 17 yeast genes are known to be involved in the importof proteins harboring PTS1 into the peroxisomal matrix ofyeast.24,35,36
The imaging-based screen resulted in the identification oftwo novel open reading frames that were not linked toperoxisome biogenesis before, one of which is a mitochondrialprotein that is required for the efficient import of PTS1 proteinsinto the matrix of yeast peroxisomes. In addition, all genespreviously known to be required for correct localization ofPTS1-marked proteins were identified, demonstrating theefficacy and reliability of the screen. We show that the approachprovides a robust experimental setup and a powerful basis forqualitative and quantitative large-scale analyses of fluorescentlylabeled yeast structures. The modular procedure is extensibleand applicable to yeast drug screens, multiplex imaging andother cell-based proteomics approaches.
Materials and Methods
Large-Scale Integration of GFP-PTS1 into Haploid YeastDeletion Mutants. The sequence for PTS1, coding for theamino acid triplet serine-lysine-leucine was fused to the 3′-end of an episomally encoded eGFP. A 1.5 kb piece of thepromoter sequence of ADH1 was cloned upstream of the eGFPstart codon for the constitutive expression of GFP-PTS1. Thisconstruct was linked to the NATr gene for selection of nourseo-thricin resistance. The whole cassette was chromosomallyintegrated at the MFA1 locus by directed integrative transfor-mation into the query strain harboring the following markers:MATR can1∆::MFA1pr-HIS3 lyp1∆ his3∆1 leu2∆0 ura3∆0met15∆0.14 The reporter construct was introduced into thehaploid yeast deletion collection, consisting of 4740 mutant
strains (Euroscarf, Germany) following the synthetic geneticarray (SGA) protocol,14,37 with minor modifications in thepinning procedure. Two rounds of pinning on haploid selectionplates (0.67% yeast nitrogen base without amino acids, 0.2%drop-out mixture, 2% glucose, 50 mg/L canavanine and 50mg/L S-(2-aminoethyl)-L-cysteine (Sigma, Inc.)) were followedby two rounds of pinning on double selective plates (DM: 0.17%yeast nitrogen base without amino acids and ammoniumsulfate, 0.1% monosodium glutamic acid, 0.2% drop-out mix-ture,14 2% glucose, 200 mg/L Geneticin (Invitrogen, Inc.), 100mg/L nourseothricin (Werner BioAgents, Inc.), 50 mg/L cana-vanine and 50 mg/L S-(2-aminoethyl)-L-cysteine (Sigma, Inc.).The colony pinning procedure was performed using a custom-made pinning robot (Adept Plus, Postojna, Slovenia) usingfloating pins with 0.8 mm diameter, and by hand with a 384solid pin replicator, with pin diameter 1.2 mm and a colonycopier (V&P Scientific, San Diego, CA). Double mutants werestored at 4 °C on double selective media plates in a format of386 yeast colonies per plate. Identified deletion mutants wereverified by colony PCR, using deletion-specific primers.13
Preparation of High-Density Yeast Arrays and Cultiva-tion Conditions. High-density arrays of yeast colonies (1536yeast colonies per plate) were produced using a Singer RoToRbenchtop robot (Singer Inc., U.K.). Four plates derived fromthe SGA process containing 386 yeast colonies each werepinned onto one YPD complete media plate (1% (w/v) Bactoyeast extract (BD, Inc.), 2% (w/v) D(+)-glucose (Roth, Inc.,Germany), 2% (w/v) Bacto peptone (BD, Inc.), 2% (w/v) Bactoagar (BD, Inc.)). Prior to microscopic analysis, colonies wereincubated for 16-20 h at 30 °C.
Preparation of Cell Arrays for High-Resolution ConfocalMicroscopy. Cell-arrays for high-resolution microscopy wereproduced as previously described.38 In brief, arrayed yeastcolonies grown on YPD plates (1536 colonies/plate) werereplicated using the benchtop robot to a freshly prepared 2%solid agar plate, lacking carbon source. The agar-block was cutinto 16 segments, each containing 96 (8 × 12) yeast colonies.Each segment was placed on a standard glass slide and aligned.To avoid mixing and air bubbles, thin horizontal and verticallines were cut into the agar between the colonies prior tocovering the cell array with a 25 × 50 mm coverslip. Thismounting procedure spread yeast colonies and immobilizedcells predominantly as a monolayer between the agar andcoverslip and supported wild type-like growth, in the presenceof nutrients in the agar.
Fluorescence Microscopy. Microscopy was performed usinga Leica SP2 AOBS confocal microscope (Leica Microsystems,Mannheim, Germany) with spectral detection. The microscopewas equipped with a programmable microscope stage forprecise sample positioning (Marzhauser, Inc., Wetzlar-Stein-dorf, Germany) as well as an integrated galvo-stage for axialscanning. For the acquisition of large cell numbers in oneimage, a 40× oil immersion objective (HCX PL APO, NA: 1.25)was used. GFP fluorescence was excited at 488nm and emissionrecorded at 500-550 nm. Five optical sections per sample wereimaged using the galvo-stage with a scan speed of ∼1.5 frames/s. Fluorescence and transmission images were acquired simul-taneously. For automated stage positioning and image acqui-sition with predefined scan settings, a customized microscopecontrol software was programmed using the Leica MacroDeveloper Software. After setting a reference start position, thissoftware addition enabled the user to sequentially or randomlyaddress all 96 “sample fields”. The acquisition of image stacks
Novel Factors Involved in Peroxisome Assembly research articles
Journal of Proteome Research • Vol. 8, No. 1, 2009 21
was performed automatically using the adjusted focal planeas the middle section of the z-stack, plus two additional opticalsections above and two sections below this plane (x/y/zsampling: 150 × 150 × 500 nm), thus, covering more than 50%of each cell volume. Typically, each image covered 100-200yeast cells, and the array of 96 yeast colonies was imaged within∼30 min.
Data Processing and Quantification. 3D image data wereprocessed using a custom-made software add-on (“HCS Pro-filer”) for amira visualization platforms (amira ResolveRT 4.0including Quantification Plus package; Mercury ComputerSystems, Inc.). The tool was programmed using Tool CommandLanguage (Tcl). The software was applied for automatedvisualization that included maximum-intensity projections offluorescence data, and single transmission image acquired fromthe middle section, 3D Gaussian filtering (kernel size: 3 × 3 ×3), segmentation (manual thresholding, see below), and quan-tification (mean gray level intensity per pixel of segmenteddata) of each acquired fluorescence data set.
Image processing was performed on a standard PC system(Intel Core Duo 1.66 GHz, 3 GB RAM, Nvidia GeForce 8500GT512 MB graphic card); processing of image data from 96 yeastcolonies required about 5 min on this platform. Mean gray levelintensity per pixel per z-stack was calculated using HCS-Profileras follows: in each optical section of a z-stack, for each graylevel i, the number of pixels at intensity i and subsequentlythe mean gray level intensity per pixel per optical section Isec
) ∑iP(i)/∑(i), for i ∈ [Imin, Imax] were computed, whereby Imin
was determined by an empirically set threshold value that wasdetermined for a control strain included in each array ofcolonies, for extraction of structures from the volumetric datasets; Imax ) 255. The mean gray level intensity per pixel perz-stack (Imean) was computed with Imean ) ∑Isec/∑ number ofsections. Statistical analyses were performed using SPSS version15 (SPSS, Inc. Chicago, IL). This method takes into accountvariability between the colony arrays, and is independent ofcell detection, which is difficult to achieve without additionalstaining due to the highly specific peroxisomal signal and lackof cellular background fluorescence.
Results
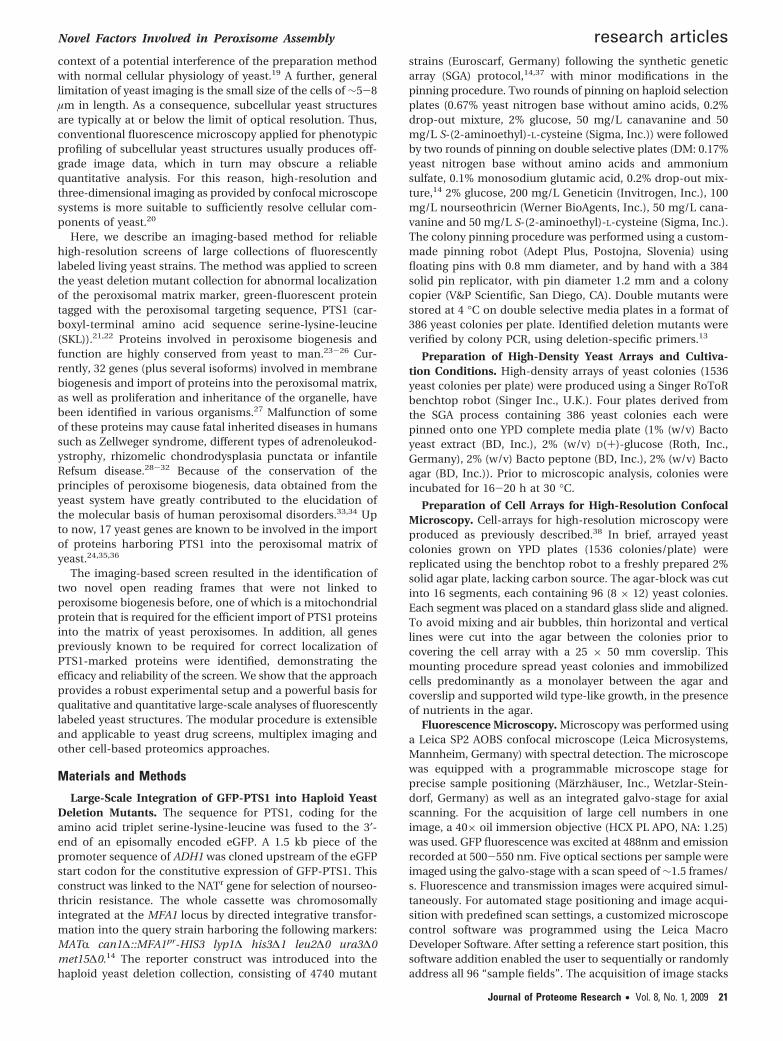
In this study, we have developed and applied an imaging-based screening method for the identification of factorsinvolved in peroxisome biogenesis in yeast. This strategy isbased on (i) labeling of yeast deletion mutants with a chro-mosomally encoded GFP-reporter construct; (ii) cultivation oflabeled cells in a high-density array on solid media plates; (iii)immobilization of cells under conditions to maintain cellularphysiology; (iv) high-resolution confocal imaging; and (v) imageprocessing and statistical assessment of localization data. Figure1 illustrates the workflow of the screening procedure. Detailsof the working steps of the procedure are described in Materialsand Methods. In our setup, imaging of yeast cells was per-formed semiautomatically, using a customized microscopecontrol software and a 40× oil immersion objective (NA 1.25)on a Leica SP2 confocal microscope. A lower magnificationobjective with high numerical aperture provides the advantageof high-resolution imaging of a larger field of view with some100-200 cells, which is preferable for quantitative and statisticalanalyses of cellular fluorescence intensity distributions.
Assessment of the Screening Procedure for PeroxisomalMutants. The peroxisomal reporter GFP-PTS1 was chromo-somally integrated into 4740 haploid yeast deletion mutants
by employing the modified synthetic genetic array (SGA)protocol, originally developed for the construction of haploiddouble mutants.14,37 Expression of the reporter construct undercontrol of the constitutive ADH1 promoter allowed homoge-neous staining of peroxisomes that are derepressed afterglucose exhaustion in early stationary phase cells.
High-density arrays of 1536 yeast colonies on completemedia (YPD) plates were generated with the use of a SingerRoToR benchtop replicating robot. The arrayed yeast colonieswere cultivated for 16-20 h and “diluted” by two sequentialreplicating steps to 2% agar plates without nutrients, to obtainsmall colonies amenable to microscopic inspection. The methodensures the immobilization of yeast cells as a monolayer andwithout air-bubbles that may interfere with high-resolutionimaging, and also prevents cross-contamination of the arrayedyeast colonies. The high quality of the simultaneously recordedfluorescence and transmission images enables easy detectionof morphologically compromised and dead yeast cells. Suchcells frequently display autofluorescence, which may interferewith the interpretation of the GFP localization data. However,the preparation procedure supports high vitality and thereforeavoids autofluorescence phenomena. This setup thus providesa very flexible and versatile solution to the problem of cellimmobilization, and since it is based on standard microscopeslides, it can be used on upright or inverted microscopes anddoes not require dedicated (and costly) high-throughput imag-ing devices.
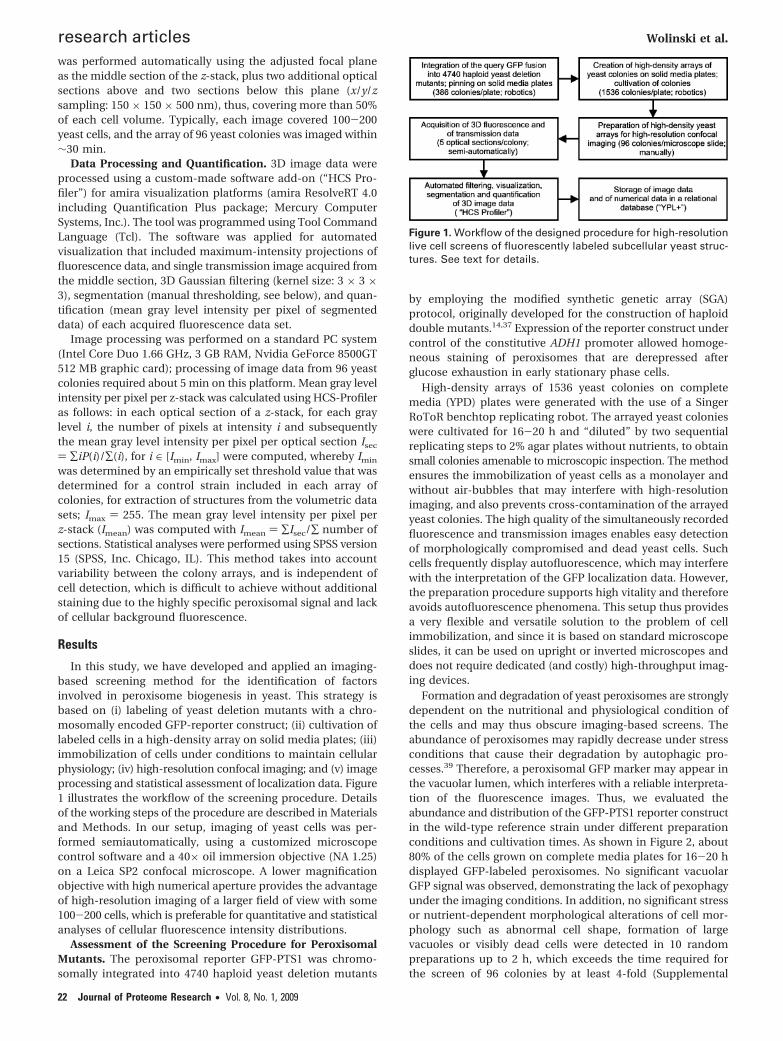
Formation and degradation of yeast peroxisomes are stronglydependent on the nutritional and physiological condition ofthe cells and may thus obscure imaging-based screens. Theabundance of peroxisomes may rapidly decrease under stressconditions that cause their degradation by autophagic pro-cesses.39 Therefore, a peroxisomal GFP marker may appear inthe vacuolar lumen, which interferes with a reliable interpreta-tion of the fluorescence images. Thus, we evaluated theabundance and distribution of the GFP-PTS1 reporter constructin the wild-type reference strain under different preparationconditions and cultivation times. As shown in Figure 2, about80% of the cells grown on complete media plates for 16-20 hdisplayed GFP-labeled peroxisomes. No significant vacuolarGFP signal was observed, demonstrating the lack of pexophagyunder the imaging conditions. In addition, no significant stressor nutrient-dependent morphological alterations of cell mor-phology such as abnormal cell shape, formation of largevacuoles or visibly dead cells were detected in 10 randompreparations up to 2 h, which exceeds the time required forthe screen of 96 colonies by at least 4-fold (Supplemental
Figure 1. Workflow of the designed procedure for high-resolutionlive cell screens of fluorescently labeled subcellular yeast struc-tures. See text for details.
research articles Wolinski et al.
22 Journal of Proteome Research • Vol. 8, No. 1, 2009
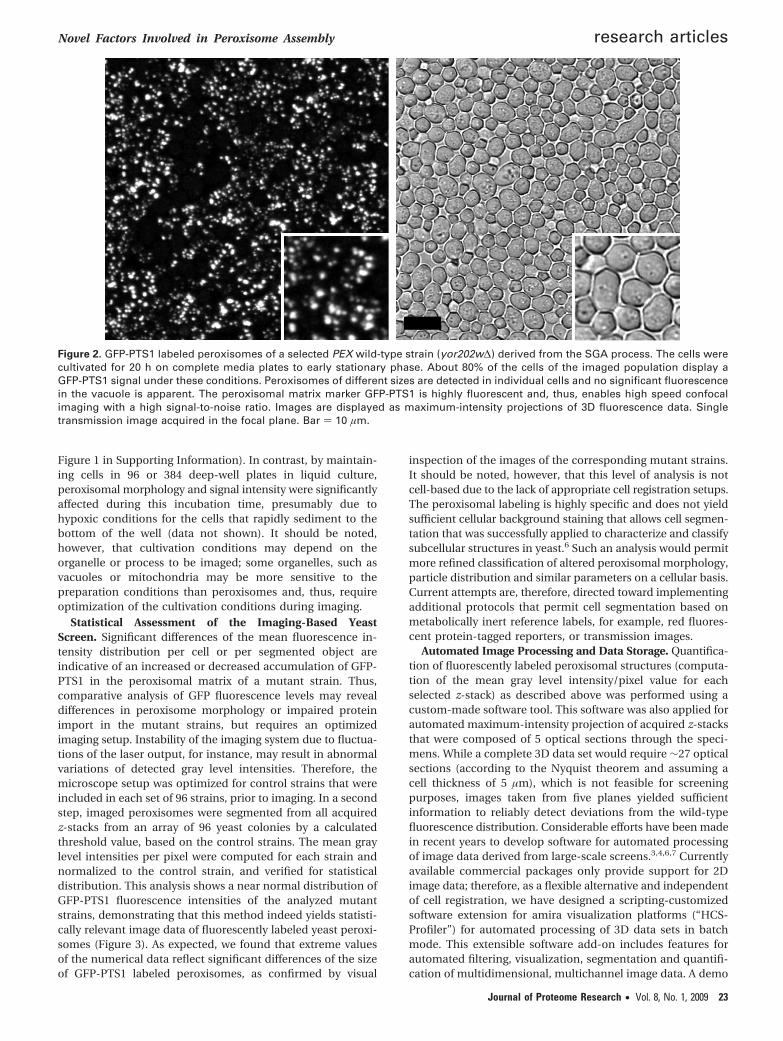
Figure 1 in Supporting Information). In contrast, by maintain-ing cells in 96 or 384 deep-well plates in liquid culture,peroxisomal morphology and signal intensity were significantlyaffected during this incubation time, presumably due tohypoxic conditions for the cells that rapidly sediment to thebottom of the well (data not shown). It should be noted,however, that cultivation conditions may depend on theorganelle or process to be imaged; some organelles, such asvacuoles or mitochondria may be more sensitive to thepreparation conditions than peroxisomes and, thus, requireoptimization of the cultivation conditions during imaging.
Statistical Assessment of the Imaging-Based YeastScreen. Significant differences of the mean fluorescence in-tensity distribution per cell or per segmented object areindicative of an increased or decreased accumulation of GFP-PTS1 in the peroxisomal matrix of a mutant strain. Thus,comparative analysis of GFP fluorescence levels may revealdifferences in peroxisome morphology or impaired proteinimport in the mutant strains, but requires an optimizedimaging setup. Instability of the imaging system due to fluctua-tions of the laser output, for instance, may result in abnormalvariations of detected gray level intensities. Therefore, themicroscope setup was optimized for control strains that wereincluded in each set of 96 strains, prior to imaging. In a secondstep, imaged peroxisomes were segmented from all acquiredz-stacks from an array of 96 yeast colonies by a calculatedthreshold value, based on the control strains. The mean graylevel intensities per pixel were computed for each strain andnormalized to the control strain, and verified for statisticaldistribution. This analysis shows a near normal distribution ofGFP-PTS1 fluorescence intensities of the analyzed mutantstrains, demonstrating that this method indeed yields statisti-cally relevant image data of fluorescently labeled yeast peroxi-somes (Figure 3). As expected, we found that extreme valuesof the numerical data reflect significant differences of the sizeof GFP-PTS1 labeled peroxisomes, as confirmed by visual
inspection of the images of the corresponding mutant strains.It should be noted, however, that this level of analysis is notcell-based due to the lack of appropriate cell registration setups.The peroxisomal labeling is highly specific and does not yieldsufficient cellular background staining that allows cell segmen-tation that was successfully applied to characterize and classifysubcellular structures in yeast.6 Such an analysis would permitmore refined classification of altered peroxisomal morphology,particle distribution and similar parameters on a cellular basis.Current attempts are, therefore, directed toward implementingadditional protocols that permit cell segmentation based onmetabolically inert reference labels, for example, red fluores-cent protein-tagged reporters, or transmission images.
Automated Image Processing and Data Storage. Quantifica-tion of fluorescently labeled peroxisomal structures (computa-tion of the mean gray level intensity/pixel value for eachselected z-stack) as described above was performed using acustom-made software tool. This software was also applied forautomated maximum-intensity projection of acquired z-stacksthat were composed of 5 optical sections through the speci-mens. While a complete 3D data set would require ∼27 opticalsections (according to the Nyquist theorem and assuming acell thickness of 5 µm), which is not feasible for screeningpurposes, images taken from five planes yielded sufficientinformation to reliably detect deviations from the wild-typefluorescence distribution. Considerable efforts have been madein recent years to develop software for automated processingof image data derived from large-scale screens.3,4,6,7 Currentlyavailable commercial packages only provide support for 2Dimage data; therefore, as a flexible alternative and independentof cell registration, we have designed a scripting-customizedsoftware extension for amira visualization platforms (“HCS-Profiler”) for automated processing of 3D data sets in batchmode. This extensible software add-on includes features forautomated filtering, visualization, segmentation and quantifi-cation of multidimensional, multichannel image data. A demo
Figure 2. GFP-PTS1 labeled peroxisomes of a selected PEX wild-type strain (yor202w∆) derived from the SGA process. The cells werecultivated for 20 h on complete media plates to early stationary phase. About 80% of the cells of the imaged population display aGFP-PTS1 signal under these conditions. Peroxisomes of different sizes are detected in individual cells and no significant fluorescencein the vacuole is apparent. The peroxisomal matrix marker GFP-PTS1 is highly fluorescent and, thus, enables high speed confocalimaging with a high signal-to-noise ratio. Images are displayed as maximum-intensity projections of 3D fluorescence data. Singletransmission image acquired in the focal plane. Bar ) 10 µm.
Novel Factors Involved in Peroxisome Assembly research articles
Journal of Proteome Research • Vol. 8, No. 1, 2009 23
movie of the software demonstrating the implemented featuresis available at http://microscopy.uni-graz.at/hcsprofiler.html.Processed image data are stored in an Oracle-based relationaldatabase (YPL+, Leitner et al., manuscript in preparation),which is an extension of the Yeast Protein Localization database(YPL) developed in our laboratory;40,41 image data are availablefor download at http://microscopy.uni-graz.at.
Application of the Screening Method Identifies AllKnown pex Mutants That Affect PTS1 Protein Localization.The collection of 4740 viable haploid yeast deletion mutantsexpressing the chromosomally encoded GFP-PTS1 reporterconstruct under control of the constitutive ADH1 promoter wasscreened as described, and yielded 14 pex mutants with anexclusively cytosolic localization of the reporter construct.Importantly, even if only a small fraction of cells expressedGFP-PTS1 in a mixture with unlabeled cells, mislocalization ofthe reporter construct was clearly detectable by visual inspec-tion (supplemental Figure 2a,b in Supporting Information).Three mutants, namely, pex25∆, djp1∆ and pex15∆, showedboth cytosolic and peroxisomal localization of the reporterconstruct (supplemental Figure 2c in Supporting Information),consistent with localization studies described elsewhere.24,35,36
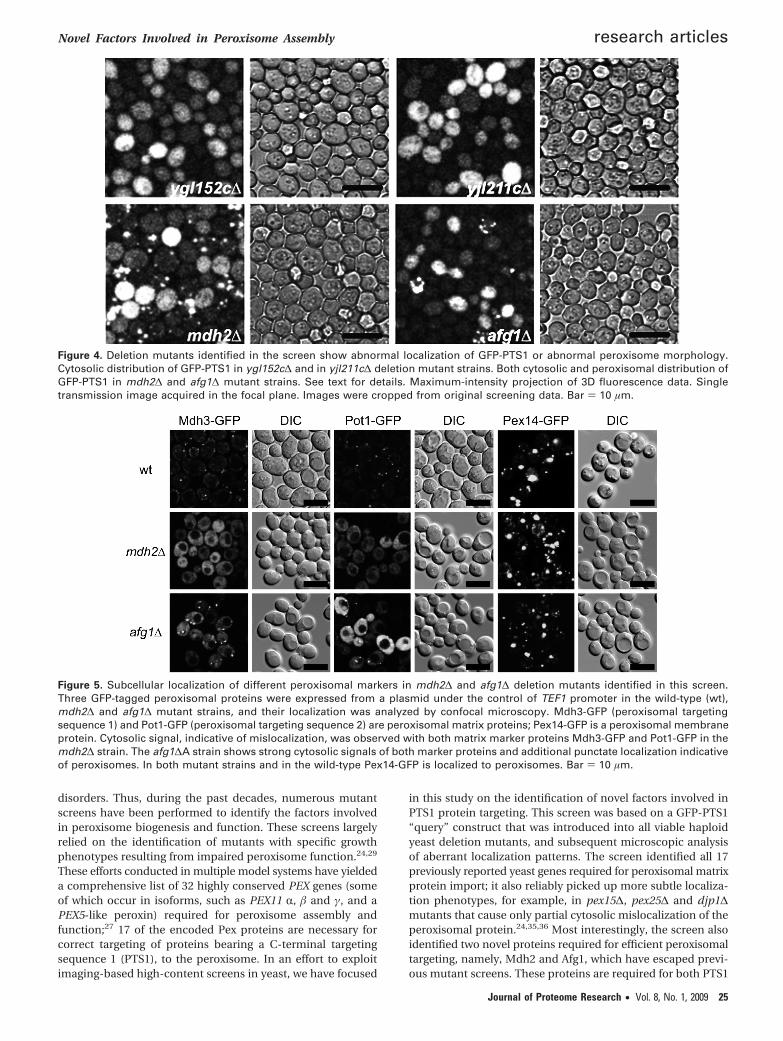
Identification of Novel Mutants with Aberrant GFP-PTS1Localization. In addition to previously known factors requiredfor peroxisomal localization of proteins harboring the PTS1signal sequence, the screening revealed several novel geneswhose deletion resulted in mislocalization of the GFP marker.The mdh2∆ and afg1∆ mutant strains showed a significantamount of cytosolic GFP, in addition to punctate, presumablyperoxisomal structures. MDH2 encodes the cytosolic malatedehydrogenase, which is one of three isozymes (Mdh1 ismitochondrial and Mdh3 is peroxisomal) that catalyze inter-conversion of malate and oxaloacetate in the glyoxylate cycle,and which is required for gluconeogenesis. AFG1 encodes amitochondrial, conserved protein of the AAA family that
localizes to the matrix face of the mitochondrial inner mem-brane and may act as a chaperone in the degradation ofmisfolded or unassembled cytochrome c oxidase subunits.Furthermore, yjl211c∆ and ygl152c∆ deletion mutants alsoshowed abnormal localization of the GFP reporter. YJL211C andYGL152C are dubious open reading frames and partially overlapwith the verified PEX2 and PEX14 genes, respectively. Thus,cytosolic localization of GFP-PTS1 in these mutants is notsurprising since Pex2 or Pex14 are missing in the yjl211c∆ andygl152c∆ deletion mutants, yet their independent identificationunderscores the efficacy and reliability of the screening method(Figure 4).
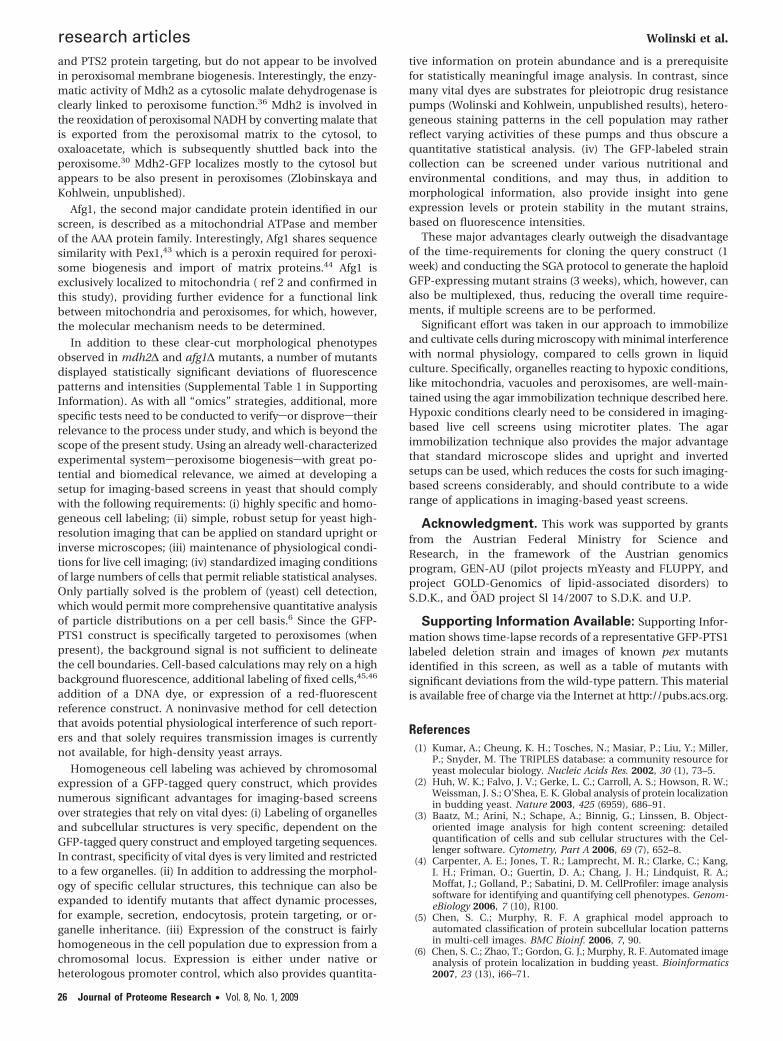
To confirm a potential impact of the mdh2∆ and afg1∆deletions on the localization of peroxisomal proteins or onperoxisome assembly, peroxisomal proteins Mdh3-GFP (PTS1protein), Pot1-GFP (PTS2 protein) and Pex14-GFP (peroxisomalmembrane protein) were expressed in the respective deletionmutants and inspected by fluorescence microscopy. As shownin Figure 5, Mdh3-GFP and Pot1-GFP both localized to per-oxisomes in the wild-type, in accordance with the literature,42
but remained in the cytosol in the mdh2∆ mutant. The afg1∆mutant strain also displayed strong cytosolic Mdh3-GFP andPot1-GFP signals, in addition to punctate peroxisomal struc-tures. Interestingly, the peroxisomal membrane protein Pex14-GFP localized to punctate structures in the mdh2∆ and afg1∆mutants indistinguishable from the wild-type, demonstratingthe existence of peroxisomal structures in these mutants. Thus,cytosolic localization of the GFP reporter constructs is not dueto the lack of peroxisomes but rather indicates defectivetargeting or import of both PTS1 and PTS2 harboring peroxi-somal proteins in the afg1∆ and mdh2∆ mutants.
Discussion
Peroxisome biogenesis is an important cellular process, andnumerous human diseases are associated with peroxisomal
Figure 3. Quantitative analysis of GFP-PTS1 fluorescence levels in 523 multidimensionally imaged mutant strains. (a) Histogram ofcomputed normalized mean gray level intensity/pixel values computed for each imaged strain. The black curve shows the computedtheoretical normal distribution. (b) Larger GFP-PTS1 labeled peroxisomal structures in mutant strain yjr074w∆ showed the highestmean gray level intensity/pixel value of all analyzed mutant strains. (c) Mutant strain ykr048c∆ showed the lowest mean gray levelintensity/pixel value of the data set. In this case, peroxisomes appear significantly smaller than in the yjr074w∆ strain. Images werecropped from larger maximum-intensity projections of acquired 3D fluorescence data. Bar ) 5 µm.
research articles Wolinski et al.
24 Journal of Proteome Research • Vol. 8, No. 1, 2009
disorders. Thus, during the past decades, numerous mutantscreens have been performed to identify the factors involvedin peroxisome biogenesis and function. These screens largelyrelied on the identification of mutants with specific growthphenotypes resulting from impaired peroxisome function.24,29
These efforts conducted in multiple model systems have yieldeda comprehensive list of 32 highly conserved PEX genes (someof which occur in isoforms, such as PEX11 R, � and γ, and aPEX5-like peroxin) required for peroxisome assembly andfunction;27 17 of the encoded Pex proteins are necessary forcorrect targeting of proteins bearing a C-terminal targetingsequence 1 (PTS1), to the peroxisome. In an effort to exploitimaging-based high-content screens in yeast, we have focused
in this study on the identification of novel factors involved inPTS1 protein targeting. This screen was based on a GFP-PTS1“query” construct that was introduced into all viable haploidyeast deletion mutants, and subsequent microscopic analysisof aberrant localization patterns. The screen identified all 17previously reported yeast genes required for peroxisomal matrixprotein import; it also reliably picked up more subtle localiza-tion phenotypes, for example, in pex15∆, pex25∆ and djp1∆mutants that cause only partial cytosolic mislocalization of theperoxisomal protein.24,35,36 Most interestingly, the screen alsoidentified two novel proteins required for efficient peroxisomaltargeting, namely, Mdh2 and Afg1, which have escaped previ-ous mutant screens. These proteins are required for both PTS1
Figure 4. Deletion mutants identified in the screen show abnormal localization of GFP-PTS1 or abnormal peroxisome morphology.Cytosolic distribution of GFP-PTS1 in ygl152c∆ and in yjl211c∆ deletion mutant strains. Both cytosolic and peroxisomal distribution ofGFP-PTS1 in mdh2∆ and afg1∆ mutant strains. See text for details. Maximum-intensity projection of 3D fluorescence data. Singletransmission image acquired in the focal plane. Images were cropped from original screening data. Bar ) 10 µm.
Figure 5. Subcellular localization of different peroxisomal markers in mdh2∆ and afg1∆ deletion mutants identified in this screen.Three GFP-tagged peroxisomal proteins were expressed from a plasmid under the control of TEF1 promoter in the wild-type (wt),mdh2∆ and afg1∆ mutant strains, and their localization was analyzed by confocal microscopy. Mdh3-GFP (peroxisomal targetingsequence 1) and Pot1-GFP (peroxisomal targeting sequence 2) are peroxisomal matrix proteins; Pex14-GFP is a peroxisomal membraneprotein. Cytosolic signal, indicative of mislocalization, was observed with both matrix marker proteins Mdh3-GFP and Pot1-GFP in themdh2∆ strain. The afg1∆A strain shows strong cytosolic signals of both marker proteins and additional punctate localization indicativeof peroxisomes. In both mutant strains and in the wild-type Pex14-GFP is localized to peroxisomes. Bar ) 10 µm.
Novel Factors Involved in Peroxisome Assembly research articles
Journal of Proteome Research • Vol. 8, No. 1, 2009 25
and PTS2 protein targeting, but do not appear to be involvedin peroxisomal membrane biogenesis. Interestingly, the enzy-matic activity of Mdh2 as a cytosolic malate dehydrogenase isclearly linked to peroxisome function.36 Mdh2 is involved inthe reoxidation of peroxisomal NADH by converting malate thatis exported from the peroxisomal matrix to the cytosol, tooxaloacetate, which is subsequently shuttled back into theperoxisome.30 Mdh2-GFP localizes mostly to the cytosol butappears to be also present in peroxisomes (Zlobinskaya andKohlwein, unpublished).
Afg1, the second major candidate protein identified in ourscreen, is described as a mitochondrial ATPase and memberof the AAA protein family. Interestingly, Afg1 shares sequencesimilarity with Pex1,43 which is a peroxin required for peroxi-some biogenesis and import of matrix proteins.44 Afg1 isexclusively localized to mitochondria ( ref 2 and confirmed inthis study), providing further evidence for a functional linkbetween mitochondria and peroxisomes, for which, however,the molecular mechanism needs to be determined.
In addition to these clear-cut morphological phenotypesobserved in mdh2∆ and afg1∆ mutants, a number of mutantsdisplayed statistically significant deviations of fluorescencepatterns and intensities (Supplemental Table 1 in SupportingInformation). As with all “omics” strategies, additional, morespecific tests need to be conducted to verifysor disprovestheirrelevance to the process under study, and which is beyond thescope of the present study. Using an already well-characterizedexperimental systemsperoxisome biogenesisswith great po-tential and biomedical relevance, we aimed at developing asetup for imaging-based screens in yeast that should complywith the following requirements: (i) highly specific and homo-geneous cell labeling; (ii) simple, robust setup for yeast high-resolution imaging that can be applied on standard upright orinverse microscopes; (iii) maintenance of physiological condi-tions for live cell imaging; (iv) standardized imaging conditionsof large numbers of cells that permit reliable statistical analyses.Only partially solved is the problem of (yeast) cell detection,which would permit more comprehensive quantitative analysisof particle distributions on a per cell basis.6 Since the GFP-PTS1 construct is specifically targeted to peroxisomes (whenpresent), the background signal is not sufficient to delineatethe cell boundaries. Cell-based calculations may rely on a highbackground fluorescence, additional labeling of fixed cells,45,46
addition of a DNA dye, or expression of a red-fluorescentreference construct. A noninvasive method for cell detectionthat avoids potential physiological interference of such report-ers and that solely requires transmission images is currentlynot available, for high-density yeast arrays.
Homogeneous cell labeling was achieved by chromosomalexpression of a GFP-tagged query construct, which providesnumerous significant advantages for imaging-based screensover strategies that rely on vital dyes: (i) Labeling of organellesand subcellular structures is very specific, dependent on theGFP-tagged query construct and employed targeting sequences.In contrast, specificity of vital dyes is very limited and restrictedto a few organelles. (ii) In addition to addressing the morphol-ogy of specific cellular structures, this technique can also beexpanded to identify mutants that affect dynamic processes,for example, secretion, endocytosis, protein targeting, or or-ganelle inheritance. (iii) Expression of the construct is fairlyhomogeneous in the cell population due to expression from achromosomal locus. Expression is either under native orheterologous promoter control, which also provides quantita-
tive information on protein abundance and is a prerequisitefor statistically meaningful image analysis. In contrast, sincemany vital dyes are substrates for pleiotropic drug resistancepumps (Wolinski and Kohlwein, unpublished results), hetero-geneous staining patterns in the cell population may ratherreflect varying activities of these pumps and thus obscure aquantitative statistical analysis. (iv) The GFP-labeled straincollection can be screened under various nutritional andenvironmental conditions, and may thus, in addition tomorphological information, also provide insight into geneexpression levels or protein stability in the mutant strains,based on fluorescence intensities.
These major advantages clearly outweigh the disadvantageof the time-requirements for cloning the query construct (1week) and conducting the SGA protocol to generate the haploidGFP-expressing mutant strains (3 weeks), which, however, canalso be multiplexed, thus, reducing the overall time require-ments, if multiple screens are to be performed.
Significant effort was taken in our approach to immobilizeand cultivate cells during microscopy with minimal interferencewith normal physiology, compared to cells grown in liquidculture. Specifically, organelles reacting to hypoxic conditions,like mitochondria, vacuoles and peroxisomes, are well-main-tained using the agar immobilization technique described here.Hypoxic conditions clearly need to be considered in imaging-based live cell screens using microtiter plates. The agarimmobilization technique also provides the major advantagethat standard microscope slides and upright and invertedsetups can be used, which reduces the costs for such imaging-based screens considerably, and should contribute to a widerange of applications in imaging-based yeast screens.
Acknowledgment. This work was supported by grantsfrom the Austrian Federal Ministry for Science andResearch, in the framework of the Austrian genomicsprogram, GEN-AU (pilot projects mYeasty and FLUPPY, andproject GOLD-Genomics of lipid-associated disorders) toS.D.K., and OAD project Sl 14/2007 to S.D.K. and U.P.
Supporting Information Available: Supporting Infor-mation shows time-lapse records of a representative GFP-PTS1labeled deletion strain and images of known pex mutantsidentified in this screen, as well as a table of mutants withsignificant deviations from the wild-type pattern. This materialis available free of charge via the Internet at http://pubs.acs.org.
References(1) Kumar, A.; Cheung, K. H.; Tosches, N.; Masiar, P.; Liu, Y.; Miller,
P.; Snyder, M. The TRIPLES database: a community resource foryeast molecular biology. Nucleic Acids Res. 2002, 30 (1), 73–5.
(2) Huh, W. K.; Falvo, J. V.; Gerke, L. C.; Carroll, A. S.; Howson, R. W.;Weissman, J. S.; O’Shea, E. K. Global analysis of protein localizationin budding yeast. Nature 2003, 425 (6959), 686–91.
(3) Baatz, M.; Arini, N.; Schape, A.; Binnig, G.; Linssen, B. Object-oriented image analysis for high content screening: detailedquantification of cells and sub cellular structures with the Cel-lenger software. Cytometry, Part A 2006, 69 (7), 652–8.
(4) Carpenter, A. E.; Jones, T. R.; Lamprecht, M. R.; Clarke, C.; Kang,I. H.; Friman, O.; Guertin, D. A.; Chang, J. H.; Lindquist, R. A.;Moffat, J.; Golland, P.; Sabatini, D. M. CellProfiler: image analysissoftware for identifying and quantifying cell phenotypes. Genom-eBiology 2006, 7 (10), R100.
(5) Chen, S. C.; Murphy, R. F. A graphical model approach toautomated classification of protein subcellular location patternsin multi-cell images. BMC Bioinf. 2006, 7, 90.
(6) Chen, S. C.; Zhao, T.; Gordon, G. J.; Murphy, R. F. Automated imageanalysis of protein localization in budding yeast. Bioinformatics2007, 23 (13), i66–71.
research articles Wolinski et al.
26 Journal of Proteome Research • Vol. 8, No. 1, 2009
(7) Chen, X.; Velliste, M.; Murphy, R. F. Automated interpretation ofsubcellular patterns in fluorescence microscope images for loca-tion proteomics. Cytometry, Part A 2006, 69 (7), 631–40.
(8) Starkuviene, V.; Pepperkok, R. The potential of high-content high-throughput microscopy in drug discovery. Br. J. Pharmacol. 2007,152 (1), 62–71.
(9) Pepperkok, R.; Ellenberg, J. High-throughput fluorescence micros-copy for systems biology. Nat. Rev. Mol. Cell. Biol. 2006, 7 (9), 690–6.
(10) Rausch, O. High content cellular screening. Curr. Opin. Chem. Biol.2006, 10 (4), 316–20.
(11) Abraham, V. C.; Taylor, D. L.; Haskins, J. R. High content screeningapplied to large-scale cell biology. Trends Biotechnol. 2004, 22 (1),15–22.
(12) Guo, Y.; Walther, T. C.; Rao, M.; Stuurman, N.; Goshima, G.;Terayama, K.; Wong, J. S.; Vale, R. D.; Walter, P.; Farese, R. V.Functional genomic screen reveals genes involved in lipid-dropletformation and utilization. Nature 2008, 453 (7195), 657–61.
(13) Giaever, G.; Chu, A. M.; Ni, L.; Connelly, C.; Riles, L.; Veronneau,S.; Dow, S.; Lucau-Danila, A.; Anderson, K.; Andre, B.; Arkin, A. P.;Astromoff, A.; El-Bakkoury, M.; Bangham, R.; Benito, R.; Brachat,S.; Campanaro, S.; Curtiss, M.; Davis, K.; Deutschbauer, A.; Entian,K. D.; Flaherty, P.; Foury, F.; Garfinkel, D. J.; Gerstein, M.; Gotte,D.; Guldener, U.; Hegemann, J. H.; Hempel, S.; Herman, Z.;Jaramillo, D. F.; Kelly, D. E.; Kelly, S. L.; Kotter, P.; LaBonte, D.;Lamb, D. C.; Lan, N.; Liang, H.; Liao, H.; Liu, L.; Luo, C.; Lussier,M.; Mao, R.; Menard, P.; Ooi, S. L.; Revuelta, J. L.; Roberts, C. J.;Rose, M.; Ross-Macdonald, P.; Scherens, B.; Schimmack, G.; Shafer,B.; Shoemaker, D. D.; Sookhai-Mahadeo, S.; Storms, R. K.; Strath-ern, J. N.; Valle, G.; Voet, M.; Volckaert, G.; Wang, C. Y.; Ward,T. R.; Wilhelmy, J.; Winzeler, E. A.; Yang, Y.; Yen, G.; Youngman,E.; Yu, K.; Bussey, H.; Boeke, J. D.; Snyder, M.; Philippsen, P.; Davis,R. W.; Johnston, M. Functional profiling of the Saccharomycescerevisiae genome. Nature 2002, 418 (6896), 387–91.
(14) Tong, A. H.; Evangelista, M.; Parsons, A. B.; Xu, H.; Bader, G. D.;Page, N.; Robinson, M.; Raghibizadeh, S.; Hogue, C. W.; Bussey,H.; Andrews, B.; Tyers, M.; Boone, C. Systematic genetic analysiswith ordered arrays of yeast deletion mutants. Science 2001, 294(5550), 2364–8.
(15) Narayanaswamy, R.; Niu, W.; Scouras, A. D.; Hart, G. T.; Davies,J.; Ellington, A. D.; Iyer, V. R.; Marcotte, E. M. Systematic profilingof cellular phenotypes with spotted cell microarrays revealsmating-pheromone response genes. GenomeBiology 2006, 7 (1),R6.
(16) Howson, R.; Huh, W. K.; Ghaemmaghami, S.; Falvo, J. V.; Bower,K.; Belle, A.; Dephoure, N.; Wykoff, D. D.; Weissman, J. S.; O’Shea,E. K. Construction, verification and experimental use of twoepitope-tagged collections of budding yeast strains. Comp. Funct.Genomics 2005, 6 (1-2), 2–16.
(17) Natter, K.; Leitner, P.; Faschinger, A.; Wolinski, H.; McCraith, S.;Fields, S.; Kohlwein, S. D. The spatial organization of lipid synthesisin the yeast Saccharomyces cerevisiae derived from large scalegreen fluorescent protein tagging and high resolution microscopy.Mol. Cell. Proteomics 2005, 4 (5), 662–72.
(18) Ohya, Y.; Sese, J.; Yukawa, M.; Sano, F.; Nakatani, Y.; Saito, T. L.;Saka, A.; Fukuda, T.; Ishihara, S.; Oka, S.; Suzuki, G.; Watanabe,M.; Hirata, A.; Ohtani, M.; Sawai, H.; Fraysse, N.; Latge, J. P.;Francois, J. M.; Aebi, M.; Tanaka, S.; Muramatsu, S.; Araki, H.;Sonoike, K.; Nogami, S.; Morishita, S. High-dimensional and large-scale phenotyping of yeast mutants. Proc. Natl. Acad. Sci. U.S.A.2005, 102 (52), 19015–20.
(19) Wolinski, H.; Kohlwein, S. D., Microscopic analysis of lipid dropletmetabolism and dynamics in yeast. In Methods in MolecularBiology; Vancura, A., Ed.; Membrane Trafficking, Vol. 457; HumanaPress: Totowa, NJ, 2008; pp 151-163.
(20) Kohlwein, S. D. The beauty of the yeast: live cell microscopy atthe limits of optical resolution. Microsc. Res. Tech. 2000, 51 (6),511–29.
(21) Gould, S. J.; Keller, G. A.; Hosken, N.; Wilkinson, J.; Subramani, S.A conserved tripeptide sorts proteins to peroxisomes. J. Cell Biol.1989, 108 (5), 1657–64.
(22) Keller, G. A.; Krisans, S.; Gould, S. J.; Sommer, J. M.; Wang, C. C.;Schliebs, W.; Kunau, W.; Brody, S.; Subramani, S. Evolutionary
conservation of a microbody targeting signal that targets proteinsto peroxisomes, glyoxysomes, and glycosomes. J. Cell Biol. 1991,114 (5), 893–904.
(23) Erdmann, R.; Schliebs, W. Peroxisomal matrix protein import: thetransient pore model. Nat. Rev. Mol. Cell Biol. 2005, 6 (9), 738–42.
(24) Eckert, J. H.; Erdmann, R. Peroxisome biogenesis. Rev. Physiol.Biochem. Pharmacol. 2003, 147, 75–121.
(25) Johnson, T. L.; Olsen, L. J. Building new models for peroxisomebiogenesis. Plant Physiol. 2001, 127 (3), 731–9.
(26) Sacksteder, K. A.; Gould, S. J. The genetics of peroxisome biogen-esis. Annu. Rev. Genet. 2000, 34, 623–652.
(27) Schluter, A.; Fourcade, S.; Ripp, R.; Mandel, J. L.; Poch, O.; Pujol,A. The evolutionary origin of peroxisomes: an ER-peroxisomeconnection. Mol. Biol. Evol. 2006, 23 (4), 838–45.
(28) Wanders, R. J. Metabolic and molecular basis of peroxisomaldisorders: a review. Am. J. Med. Genet., Part A 2004, 126A (4), 355–75.
(29) Purdue, P. E.; Lazarow, P. B. Peroxisome biogenesis. Annu. Rev.Cell. Dev. Biol. 2001, 17, 701–52.
(30) van Roermund, C. W.; Waterham, H. R.; Ijlst, L.; Wanders, R. J.Fatty acid metabolism in Saccharomyces cerevisiae. Cell. Mol. LifeSci. 2003, 60 (9), 1838–51.
(31) Fujiki, Y.; Okumoto, K. [Peroxisome biogenesis and humandisorders]. Tanpakushitsu Kakusan Koso 2000, 45 (5), 691–9.
(32) Gould, S. J.; Valle, D. Peroxisome biogenesis disorders: geneticsand cell biology. Trends Genet. 2000, 16 (8), 340–5.
(33) van der Klei, I. J.; Veenhuis, M. Yeast and filamentous fungi asmodel organisms in microbody research. Biochim. Biophys. Acta2006, 1763 (12), 1364–73.
(34) van der Klei, I.; Veenhuis, M. Peroxisomes: flexible and dynamicorganelles. Curr. Opin. Cell. Biol. 2002, 14 (4), 500–5.
(35) Hettema, E. H.; Ruigrok, C. C.; Koerkamp, M. G.; van den Berg,M.; Tabak, H. F.; Distel, B.; Braakman, I. The cytosolic DnaJ-likeprotein djp1p is involved specifically in peroxisomal proteinimport. J. Cell Biol. 1998, 142 (2), 421–34.
(36) Smith, J. J.; Marelli, M.; Christmas, R. H.; Vizeacoumar, F. J.;Dilworth, D. J.; Ideker, T.; Galitski, T.; Dimitrov, K.; Rachubinski,R. A.; Aitchison, J. D. Transcriptome profiling to identify genesinvolved in peroxisome assembly and function. J. Cell Biol. 2002,158 (2), 259–71.
(37) Tong, A. H.; Boone, C. Synthetic genetic array analysis in Saccha-romyces cerevisiae. Methods Mol. Biol. 2006, 313, 171–92.
(38) Wolinski, H.; Kohlwein, S. D. The fidgety yeast: focus on high-resolution live yeast cell microscopy. In Methods in MolecularBiology: Yeast Functional Genomics and Proteomics; Stagljar, I., Ed.;Humana Press: Totowa, NJ, 2008, in press.
(39) Veenhuis, M.; Kiel, J. A.; Van Der Klei, I. J. Peroxisome assemblyin yeast. Microsc. Res. Tech. 2003, 61 (2), 139–50.
(40) Kals, M.; Natter, K.; Thallinger, G. G.; Trajanoski, Z.; Kohlwein, S. D.YPL.db2: the Yeast Protein Localization database, version 2.0. Yeast2005, 22 (3), 213–8.
(41) Habeler, G.; Natter, K.; Thallinger, G. G.; Crawford, M. E.; Kohlwein,S. D.; Trajanoski, Z. YPL.db: the Yeast Protein Localizationdatabase. Nucleic Acids Res. 2002, 30 (1), 80–3.
(42) Steffan, J. S.; McAlister-Henn, L. Isolation and characterization ofthe yeast gene encoding the MDH3 isozyme of malate dehydro-genase. J. Biol. Chem. 1992, 267 (34), 24708–15.
(43) Lee, Y. J.; Wickner, R. B. AFG1, a new member of the SEC18-NSF,PAS1, CDC48-VCP, TBP family of ATPases. Yeast 1992, 8 (9), 787–90.
(44) Erdmann, R.; Wiebel, F. F.; Flessau, A.; Rytka, J.; Beyer, A.; Frohlich,K. U.; Kunau, W. H. PAS1, a yeast gene required for peroxisomebiogenesis, encodes a member of a novel family of putativeATPases. Cell 1991, 64 (3), 499–510.
(45) Ohtani, M.; Saka, A.; Sano, F.; Ohya, Y.; Morishita, S. Developmentof image processing program for yeast cell morphology. J. Bioin-form. Comput. Biol. 2004, 1 (4), 695–709.
(46) Saito, T. L.; Ohtani, M.; Sawai, H.; Sano, F.; Saka, A.; Watanabe,D.; Yukawa, M.; Ohya, Y.; Morishita, S. SCMD: Saccharomycescerevisiae Morphological Database. Nucleic Acids Res. 2004, 32(Database issue), D319–22.
PR800782N
Novel Factors Involved in Peroxisome Assembly research articles
Journal of Proteome Research • Vol. 8, No. 1, 2009 27