Illness representations, coping, illness outcomes, and support ...
327
Illness representations, coping, illness outcomes, and support needs of people with cancer and anxiety/depression Emma M. Richardson BPsych(Hons) Submitted in fulfilment of the requirements for the degree of Doctor of Philosophy (Psychology) in the Faculty of Health, School of Medicine University of Tasmania, March, 2017
-
Upload
khangminh22 -
Category
Documents
-
view
0 -
download
0
Transcript of Illness representations, coping, illness outcomes, and support ...

Illness representations, coping, illness outcomes, and support needs of
people with cancer and anxiety/depression
Emma M. Richardson
BPsych(Hons)
Submitted in fulfilment of the requirements for the degree of Doctor of Philosophy
(Psychology) in the Faculty of Health, School of Medicine
University of Tasmania, March, 2017

i
16/11/2016
Declaration of Originality
This thesis contains no material which has been accepted for a degree or diploma by the
University or any other institution, except by way of background information and duly
acknowledged in the thesis, and to the best of my knowledge and belief no material
previously published or written by another person except where due acknowledgment is made
in the text of the thesis, nor does the thesis contain any material that infringes copyright.
Signed: __________________________
Date: ___________________________

ii
16/11/2016
Authority of Access Statement
This thesis may be made available for loan and limited copying and communication in
accordance with the Copyright Act 1968.
Signed: __________________________
Date: ____________________________

iii
16/11/2016
Statement Regarding Published Work Contained in Thesis
The publishers of the paper comprising Chapter 2 hold the copyright for that content, and
access to the material should be sought from the respective journal. The remaining non-
published content of the thesis may be made available for loan and limited copying and
communication in accordance with the Copyright Act 1968.
Signed: __________________________
Date: ____________________________

iv
Statement of Co-Authorship
The following people and institutions contributed to the publication of work undertaken as
part of this thesis:
Author details:
Candidate: Emma M. Richardson, School of Medicine (Psychology)
Author 1: Assoc Prof Benjamin Schüz, School of Medicine (Psychology), Primary
Supervisor
Author 2: Prof Jennifer L. Scott, School of Medicine (Psychology), Co-Supervisor
Author 3: Dr Natalie Schüz, School of Health Sciences, Co-Supervisor
Author 4: Assoc Prof Kristy Sanderson, Menzies Institute for Medical Research, Co-
Supervisor
Author roles:
Paper 1, Illness representations, coping, and illness outcomes in people with cancer:
A systematic review and meta-analysis
Located in Chapter 2
Candidate was the primary author (70%) and contributed to the idea, its formulation, data
collection and analysis, and manuscript development. Author 1 (15%) contributed to idea
formulation, data analysis, and manuscript refinement. Author 2 (5%), author 3 (5%), and
author 4 (5%) contributed to idea formulation and manuscript refinement.

v
Paper 2, Illness representations, coping, and illness outcomes in depression:
A systematic review and meta-analysis
Located in Chapter 3
Candidate was the primary author (75%) and contributed to the idea, its formulation, data
collection and analysis, and manuscript development. Author 1 (10%) contributed to idea
formulation, data analysis, and manuscript refinement. Author 2 (5%), author 3 (5%), and
author 4 (5%) contributed to idea formulation and manuscript refinement.
Paper 3, ‘It was all intertwined’: Illness representations and self-management in people
with cancer and anxiety/depression
Located in Chapter 4
Candidate was the primary author (70%) and contributed to the idea, its formulation, data
collection and analysis, and manuscript development. Author 1 (12.5%) contributed to idea
formulation, data analysis, and manuscript refinement. Author 2 (7.5%) contributed to idea
formulation and manuscript refinement. Author 3 (5%) and author 4 (5%) contributed to
manuscript refinement.
Paper 4, A qualitative comparison of the support needs of people with cancer based on
their history of anxiety/depression
Located in Chapter 5
Candidate was the primary author (70%) and contributed to the idea, its formulation, data
collection and analysis, and manuscript development. Author 1 (10%) contributed to the idea,
its formulation, and manuscript refinement. Author 2 contributed to idea formulation, data
analysis, and manuscript refinement (10%). Author 3 (5%) and author 4 (5%) contributed to
manuscript refinement.

vi
16/11/2016 16/11/2016
We the undersigned agree with the above stated “proportion of work undertaken” for each of
the above published (or submitted) peer-reviewed manuscripts contributing to this thesis:
Signed: _____________________ Signed: _____________________
Date: _____________________ Date: _____________________
Assoc Prof Benjamin Schüz Dr Michael Garry
Primary Supervisor Associate Head, Psychology
School of Medicine School of Medicine
University of Tasmania University of Tasmania

vii
16/11/2016
Statement of Ethical Conduct
The research associated with this thesis abides by the international and Australian codes on
human and animal experimentation, the guidelines by the Australian Government’s Office of
the Gene Technology Regulator, and the rulings of the Safety, Ethics and Institutional
Biosafety Committees of the University.
Signed: __________________________
Date: ____________________________

viii
Abstract
Cancer and anxiety/depression commonly occur as co-morbid conditions, leading to
poorer health and illness outcomes as well as reduced quality of life in those affected.
However, currently too little is understood about the impact of this combination of illnesses.
In order to determine how people with cancer and anxiety/depression can be best supported to
improve health and illness outcomes, as well as to identify what supports and services they
may need, it is important to understand the psychological processes underlying coping
behaviours and illness outcomes for people with each illness separately and for those with
combinations of cancer and anxiety/depression. This thesis therefore aimed to firstly examine
how the illness representations of people with cancer (Study 1) and of people with depression
(Study 2) separately influenced coping responses and illness outcomes. Secondly, this thesis
aimed to examine how having a combination of cancer and anxiety/depression would
influence illness representations, coping and self-management behaviours, and support needs
(Study 3), as well as how such support needs might differ across cancer patients with varying
histories of anxiety/depression (Study 4).
The leading psychological model of self-regulation in the face of illness is
Leventhal’s Common Sense Model of health and illness (CSM), which assumes that people
form and access subjective representations of their illness based on common-sense
assumptions. These idiosyncratic representations then guide individual coping attempts and
processes. The CSM’s illness representation dimensions have been found to be reliably
associated with coping and outcomes for a variety of chronic illnesses. However, although
several studies have investigated these relationships in people with cancer, no systematic
review and meta-analysis to summarise these associations had yet been conducted. The same
lack of a systematic overview of the evidence was also found for anxiety/depression.
Based on these existing gaps in the literature, two separate systematic reviews and meta-

ix
analyses were conducted to determine the strength and direction of the relationships between
illness representations and coping behaviours as well as illness outcomes in people with
cancer (Study 1) and in people with depression (Study 2). The systematic literature search for
Study 1 located 54 studies, with 38 providing sufficient data for meta-analysis and 16
narratively reviewed, while the literature search for Study 2 located 19 studies, with 10
included in the meta-analysis and nine narratively reviewed. During the systematic review
process for Study 2 only one study examining illness representations in people with anxiety
was located, making a review of people with anxiety impossible. Both reviews found
substantial relationships between illness representations and coping as well as illness
outcomes, with findings suggesting that for people with cancer and for people with
depression, higher identity (more symptoms), a more chronic and cyclical timeline, more
severe consequences, less personal and treatment control, less illness coherence, and stronger
emotional representations were associated with maladaptive coping strategies and increased
psychological distress.
This evidence base served as a starting point for the second set of studies in this
thesis. As cancer and anxiety/depression commonly co-occur, whether and how the CSMs
illness representation dimensions were associated with coping and outcomes in people with
multimorbid cancer and anxiety/depression was explored. As no research had yet investigated
the multimorbid representations of people with cancer and anxiety/depression specifically,
Study 3 included 21 semi-structured interviews and used theoretical thematic analysis to
examine the structure and content of individual’s representations of co-morbid cancer and
anxiety/depression, as well as how these related to coping and self-management. This study
found that participants most often perceived their cancer and anxiety/depression as related,
with these interactions often considered causal (albeit with heterogeneity in which illness
caused the other). In terms of illness representations, personal control and illness coherence

x
emerged as important determinants of illness behaviour, with these representations shown to
have both positive and negative influences on coping and self-management. These results
suggested that better understanding of multimorbid representations by health professionals
have the potential to lead to improved self-management strategies and health care interactions
for people with cancer and anxiety/depression. As Study 3 began to identify differing support
needs across people with cancer and anxiety/depression, Study 4 used inductive thematic
analysis on data obtained from 21 semi-structured interviews to examine how the existing
needs and supports of this population differed based on experiences of varied histories of
anxiety/depression (e.g., episodic versus long-term). This study found important differences
across cancer patients with varying histories of anxiety/depression, with people who had a
history of long-term anxiety/depression that was not associated with cancer generally coping
better, experiencing less fear of cancer recurrence, and requiring less support from hospitals
and support services. These results highlight a need for both researchers and health
professionals to give more consideration to the origin and history of a cancer patient’s
anxiety/depression in order to facilitate better coping and improve and increase appropriate
support provision across cancer diagnosis, treatment, and survivorship.
Overall, across the research in this thesis, subjective illness representations such as
personal control, consequences, timeline, and illness coherence, have been found to be
important predictors of coping behaviours, self-management strategies, and illness outcomes
in people with cancer, people with depression, and people with co-morbid cancer and
anxiety/depression, supporting the importance of the CSM as a theoretical basis from which
to explore such representations. Further, multimorbid representations such as combined or
competing causal representations, prioritisation of a perceived most challenging illness,
beliefs about fear of cancer recurrence, and synergies/antagonisms in the management of
illnesses, were found to be associated with self-management strategies and illness outcomes

xi
in people with co-morbid cancer and anxiety/depression, with the support needs of these
people found to vary based on their history with anxiety/depression.
The discovery of these multimorbid illness representations suggests that the CSM
may need to be adapted to be more appropriate for people with multiple illnesses. These
findings also highlight the need for future research to trial interventions aimed at changing
incorrect or maladaptive representations for people with cancer, people with depression, and
people with both cancer and anxiety/depression. At the same time, the findings of this thesis
highlighted the role of support providers in improving outcomes for people with cancer and
anxiety/depression, suggesting a need for increased understanding of illness representations
and illness history by providers, improved communication between patients and health
professionals, and increased support provision and access to psycho-oncological services for
patients.

xii
Acknowledgements
The completion of this thesis would not have been possible without contributions
from a number of amazing people. Firstly, I must thank my supervisory team for their
continued guidance and assistance throughout the three year journey. Ben, you have been a
better supervisor than I could have ever hoped for; you have always made time for me, given
me thoughtful and timely feedback, and provided me with an overall excellent research
training experience. What you have taught me will hold me in good stead for a career in
psychology and I hope we can continue to collaborate in future. Jenn, thank you for teaching
me about qualitative research, for your valuable feedback on every project, and for your
optimistic approach to publication. Thank you also to Kristy and Natalie for always providing
thoughtful feedback and suggestions, as well as a word of encouragement when needed. All
four of you are excellent researchers and fantastic people, and I am extremely grateful to have
had your support throughout my PhD candidature.
My appreciation also goes to the University of Tasmania, the Australian Government,
and the sponsors of the Jim Bacon Memorial Scholarship for their financial support during
my candidature. Additionally, I wish to thank Penny Egan (CEO of Cancer Council
Tasmania), Cynthia Taafe, and Karen Rogers for allowing me to recruit participants through
Cancer Council Tasmania, to use the support room at Cancer Council Tasmania, and for their
continued support of me and of my research. I would also like to thank each participant
involved in this project, your valuable and selfless contributions have the power to improve
the lives of others with cancer.
I would also like to acknowledge my beautiful family and friends, without whom I
would not be the person I am, nor would I have completed this thesis. In particular, I must
thank my mum for attempting to teach me when to slow down, and my dad for encouraging
me to continue my studies. I love and thank you both for everything you have done and

xiii
continue to do for me. Mark, you are a wealth of knowledge and a fantastic brother, thank
you for always being there when I need. To my wonderful friends, Jane for helping to code
my interviews, Lil and Kim for sharing in the PhD joy/pain, Maz for always being there, and
the BHPs for being the best netballers and friends a person could ask for, thank you. Lastly,
Marty (and the pugs), thank you for your unwavering belief in me, your part in building our
beautiful home, and for working so hard over the last few years. Your love and support has
been essential to the success of my PhD, and I cannot wait for our next adventure together.

xiv
Table of Contents
Declaration of Originality ........................................................................................................ i
Authority of Access Statement ................................................................................................ ii
Statement Regarding Published Work Contained in Thesis .............................................. iii
Statement of Co-Authorship .................................................................................................. iv
Statement of Ethical Conduct ............................................................................................... vii
Abstract .................................................................................................................................. viii
Acknowledgements ................................................................................................................ xii
Table of Contents .................................................................................................................. xiv
List of Tables ......................................................................................................................... xix
List of Figures ......................................................................................................................... xx
Chapter 1: Introduction .......................................................................................................... 1
Cancer Prevalence and Associated Outcomes ................................................................... 2
Co-morbid Cancer and Anxiety/Depression ...................................................................... 3
The Common Sense Model of Health and Illness .............................................................. 6
Illness Representations ....................................................................................................... 7
The CSM in Practice .......................................................................................................... 9
The CSM and Chronic Illness........................................................................................... 10
The CSM and Cancer ....................................................................................................... 11
The CSM and Mental Illness ............................................................................................ 13
Co-morbid Illness Representations ................................................................................... 16
Comparing Support Needs across People with Cancer and Anxiety/Depression ........ 19
The Present Thesis ............................................................................................................. 20
Study 1 (Chapter 2) Aim ................................................................................................... 21
Study 2 (Chapter 3) Aim ................................................................................................... 22
Study 3 (Chapter 4) Aim ................................................................................................... 22
Study 4 (Chapter 5) Aim ................................................................................................... 23
Chapter 2: Study 1 ................................................................................................................. 25
Illness representations, coping, and illness outcomes in people with cancer: A systematic
review and meta-analysis ...................................................................................................... 25
Abstract ............................................................................................................................... 26
Background ......................................................................................................................... 27
Illness Representations and the Common Sense Model ................................................... 27

xv
Illness Representations in Cancer: The Present Review .................................................. 29
Aims and Hypotheses ........................................................................................................ 30
Methods ............................................................................................................................... 30
Literature Search, Inclusion Criteria, and Study Selection ............................................. 30
Classification of Coping Behaviours and Illness Outcomes ............................................ 32
Data Extraction and Meta-Analytic Strategy ................................................................... 33
Results ................................................................................................................................. 34
Study Characteristics........................................................................................................ 34
Risk of Bias Assessment .................................................................................................... 35
Relationship of Illness Representations to Coping Behaviours: Quantitative Analysis... 36
Relationship of Illness Representations to Illness Outcomes: Quantitative Analysis ...... 38
Moderator Analyses.......................................................................................................... 39
Relationship of Illness Representations to Coping Behaviours: Narrative Review ......... 43
Relationship of Illness Representations to Illness Outcomes: Narrative Review............. 44
Discussion ............................................................................................................................ 45
Implications and Future Research Directions ................................................................. 47
Strengths and Limitations ................................................................................................. 48
Conclusions ......................................................................................................................... 50
Chapter 3: Study 2 ................................................................................................................. 51
Illness representations, coping, and illness outcomes in depression: A systematic review
and meta-analysis ................................................................................................................... 51
Abstract ............................................................................................................................... 52
Introduction ........................................................................................................................ 53
Method ................................................................................................................................. 57
Literature Search, Inclusion Criteria, and Study Selection ............................................. 57
Coding of Coping Behaviours and Illness Outcomes ....................................................... 59
Data Extraction and Meta-Analytic Strategy ................................................................... 64
Results ................................................................................................................................. 65
Study Characteristics........................................................................................................ 65
Risk of Bias Assessment .................................................................................................... 65
Relationship of Illness Representations to Coping and Psychological Distress:
Quantitative Analysis........................................................................................................ 66
Relationship of Illness Representations to Coping and Psychological Distress: Narrative
Review............................................................................................................................... 67

xvi
Discussion ............................................................................................................................ 71
Illness Representations and Coping Behaviours .............................................................. 71
Illness Representations and Illness Outcomes ................................................................. 72
Implications ...................................................................................................................... 73
Limitations ........................................................................................................................ 73
Conclusion ........................................................................................................................ 75
Chapter 4: Study 3 ................................................................................................................. 76
‘It was all intertwined’: Illness representations and self-management in people with
cancer and anxiety/depression .............................................................................................. 76
Abstract ............................................................................................................................... 77
Introduction ........................................................................................................................ 78
Method ................................................................................................................................. 81
Participants ...................................................................................................................... 81
Materials........................................................................................................................... 82
Procedure ......................................................................................................................... 82
Analysis............................................................................................................................. 83
Results ................................................................................................................................. 84
Demographics and Illness Characteristics ...................................................................... 84
Thematic Analysis ............................................................................................................. 84
Discussion ............................................................................................................................ 96
Limitations ........................................................................................................................ 99
Implications .................................................................................................................... 101
Conclusion ...................................................................................................................... 102
Chapter 5: Study 4 ............................................................................................................... 104
A qualitative comparison of the support needs of people with cancer based on their
history of anxiety/depression .............................................................................................. 104
Abstract ............................................................................................................................. 105
Introduction ...................................................................................................................... 106
Method ............................................................................................................................... 108
Participants .................................................................................................................... 108
Materials......................................................................................................................... 108
Procedure ....................................................................................................................... 108
Analysis........................................................................................................................... 109
Results ............................................................................................................................... 110

xvii
Demographics and Illness Characteristics .................................................................... 110
DASS-21 ......................................................................................................................... 112
Thematic Analysis ........................................................................................................... 113
Discussion .......................................................................................................................... 117
Implications .................................................................................................................... 119
Limitations ...................................................................................................................... 120
Conclusions .................................................................................................................... 121
Chapter 6: Discussion .......................................................................................................... 122
Summary of the Main Findings ...................................................................................... 125
Illness Representations, Coping Behaviours, and Illness Outcomes in People with
Cancer, Anxiety, and/or Depression .............................................................................. 125
Support Needs for People with Cancer and Anxiety/Depression ................................... 130
Theoretical Implications and Future Research Directions .......................................... 132
Role of the CSM in Cancer and Anxiety/Depression ...................................................... 132
Expanding the CSM ........................................................................................................ 134
Practical Implications and Future Research Directions ............................................... 136
Future CSM Interventions .............................................................................................. 136
Health Professionals’ Understanding of Illness Representations .................................. 142
Challenge of Co-Morbid Cancer and Anxiety/Depression for Support Provision ........ 143
Provision of Appropriate Support and Information ....................................................... 146
Limitations ........................................................................................................................ 146
Sample ............................................................................................................................ 147
Research Design ............................................................................................................. 149
Conclusions ....................................................................................................................... 151
References ............................................................................................................................. 152
Appendices ............................................................................................................................ 183
Appendix 2.1 Published version of Study 1 (Chapter 2) ................................................... 183
Appendix 2.2 PRISMA 2009 Statement (Study 1) ........................................................... 197
Appendix 2.3 Database search strategies (original search) (Study 1) ............................... 199
Appendix 2.4 Coding manual (Study 1) ............................................................................ 201
Appendix 2.5 Coding sheet (Study 1) ............................................................................... 224
Appendix 2.6 Study selection process (Study 1) ............................................................... 228
Appendix 2.7 Quantitative data extraction and study characteristics table (Study 1) ....... 230
Appendix 2.8 Qualitative data extraction and study characteristics table (Study 1) ......... 235

xviii
Appendix 2.9 Meta-analytic strategy – additional information (Study 1)......................... 237
Appendix 2.10 Risk of bias assessment (Study 1) ............................................................ 239
Appendix 2.11 Meta-analysis forest plots between illness representations and coping
behaviours and illness representations and illness outcomes (Study 1) ............................. 247
Appendix 2.12 Meta-analysis funnel plots between illness representations and coping
behaviours and illness representations and illness outcomes (Study 1) ............................. 258
Appendix 3.1 PRISMA 2009 Statement (Study 2) ........................................................... 267
Appendix 3.2 Database search strategies (Study 2) .......................................................... 269
Appendix 3.3 Coding manual (Study 2) ............................................................................ 270
Appendix 3.4 Coding sheet (Study 2) ............................................................................... 290
Appendix 3.5 Risk of bias assessment table (Study 2) ...................................................... 294
Appendix 3.6 Risk of bias assessment and figure (Study 2) ............................................. 297
Appendix 3.7 Meta-analysis forest plots between illness representations and coping and
illness representations and psychological distress (Study 2) ............................................. 301
Appendix 3.8 Meta-analysis funnel plots between illness representations and coping and
illness representations and psychological distress (Study 2) ............................................. 304
Appendix 4.1 Interview guide (Study 3 and Study 4) ....................................................... 306
Appendix 4.2 COREQ checklist (Study 3) ....................................................................... 313
Appendix 4.3 Demographics and DASS-21 Stress subscale scores (Study 3).................. 315
Appendix 5.1 Additional methodological information (Study 4) ..................................... 316
Appendix 5.2 COREQ checklist (Study 4) ....................................................................... 318

xix
List of Tables
Table 2.1 Meta-analyses of the relationships between illness representations and coping
behaviours ................................................................................................................................ 37
Table 2.2 Meta-analyses of the relationships between illness representations and anxiety, and
illness representations and depression ..................................................................................... 40
Table 2.3 Meta-analyses of the relationships between illness representations and
psychological distress, and consequences and psychological well-being ............................... 41
Table 2.4 Meta-analyses of the relationships between illness representations and role
functioning, illness representations and physical functioning, and illness representations and
quality of life ............................................................................................................................ 42
Table 3.1 Data extraction and study characteristics ................................................................ 61
Table 3.2 Meta-analyses of the relationships between illness representations and coping, and
illness representations and psychological distress ................................................................... 68
Table 4.1 Illness characteristics and DASS-21 anxiety and depression subscale scores ........ 85
Table 5.1 Participant groupings based on history of cancer and anxiety/depression ............ 110
Table 5.2 Demographics and illness characteristics.............................................................. 111
Table 6.1 Summary of the findings in the present thesis ...................................................... 124

xx
List of Figures
Figure 1.1 The common sense model of self-regulation of health and illness (Leventhal et al.,
1980), adapted from Diefenbach and Leventhal (1996) ............................................................ 7
Figure 2.1 The common sense model of self-regulation of health and illness (Leventhal et al.,
1980), adapted from Diefenbach and Leventhal (1996) .......................................................... 28
Figure 2.2 Flow-chart of the study selection process .............................................................. 32
Figure 3.1 The common sense model of self-regulation of health and illness (Leventhal et al.,
1980), adapted from Diefenbach and Leventhal (1996) .......................................................... 55
Figure 3.2 Flow chart of the study selection process .............................................................. 60
Figure 4.1 Thematic map of representations of cancer and anxiety/depression and their
relationships with coping and self-management strategies ...................................................... 87
Figure 5.1 Thematic map comparing support needs of people with cancer and
anxiety/depression.................................................................................................................. 114

1
Chapter 1
Introduction

2
Cancer Prevalence and Associated Outcomes
Worldwide there were approximately 14 million new cancer cases in 2012, with
almost 32.5 million cancer patients/survivors within the first five years of their diagnosis
(International Agency for Research on Cancer & World Health Organisation, 2014). In
Australia, cancer is one of the most commonly experienced diseases, with the risk of
receiving a cancer diagnosis before the age of 85 years one in two for males and one in three
for females (Cancer Australia, 2016). With regard to cancer prevalence, in Australia in 2012
there were 122,093 new cancer cases diagnosed at an age-standardised incidence rate of 485
cases per 100,000 people (Australian Institute of Health and Welfare [AIHW], 2016), with
this number expected to grow to an estimated 130,466 people in 2016 (Cancer Australia,
2016). In terms of mortality, although 44,108 people died from cancer in 2013, the age-
standardised mortality rate for all cancers has fallen by approximately 20% from 1982 to now
(AIHW, 2014). The reasons for this drop in mortality are mainly attributed to increases in
early detection rates and improved treatment methods (Alfano & Rowland, 2006; Stewart &
Wild, 2014). Because of these advances and the associated drop in mortality rates, people
with cancer are now living longer, with 1.7% of the Australian population, or 370,474 people,
living with cancer at the end of 2009 (after being diagnosed in the previous five years).
Furthermore, 67% of people diagnosed with cancer are now surviving for at least five years’
post-diagnosis (between 2007-2011; AIHW, 2014), with better psychosocial support needed
to improve the outcomes for these cancer patients and survivors.
The improved survival rate for people diagnosed with cancer means that a
considerable proportion of the Australian population live with the continued effects of cancer.
These effects include both physical post-treatment side effects and mental health problems
such as fatigue, poor role and physical functioning, psychological distress, cognitive
impairment, anxiety, depression, fear of cancer recurrence, and a poorer quality of life

3
(Ahles, Root, & Ryan, 2012; Edwards & Clarke, 2004; Harrington, Hanse, Moskowitz, Todd,
& Feuerstein, 2010; Simard et al., 2013; Singer, Das-Munshi, & Brähler, 2010; Stein, Syrjala,
& Andrykowski, 2008). Further, these poor mental and physical health outcomes are often
long-term (Stein et al., 2008). One systematic review for example found that survivors
experienced poor outcomes for up to ten years post diagnosis (Harrington et al., 2010). To
both cope with and self-manage these outcomes is an extraordinary challenge for cancer
patients and survivors. However, the use of particular adaptive coping strategies, such as
cognitive reappraisal and problem-focused coping, can improve adjustment to cancer
(O'Brien & Moorey, 2010). Further, productive and proactive self-management strategies can
be facilitated by appropriate self-management interventions and partnerships between
patients and health care providers. Such self-management strategies have been found to
decrease symptom distress and uncertainty, and improve communication and quality of life
(McCorkle et al., 2011). However, the effectiveness of such interventions could be improved
by better matching them with people’s needs, their ideas about their illnesses, and their
subjective understanding of their illnesses, as cancer-related perceptions have been found to
influence coping responses and illness outcomes (e.g., treatment decision making: Kendel et
al., 2016). This thesis therefore provides an examination of the dimensions and parameters of
these subjective ideas, perceptions, understandings, and needs in people with cancer and
anxiety/depression.
Co-morbid Cancer and Anxiety/Depression
Nearly all people with cancer experience some psychological distress after being
diagnosed and throughout their treatment. However, for many this distress is short-term,
meaning that when they recover from their cancer they are likely to re-gain psychological
health and equilibrium, with few significant long-term effects experienced (Stein et al.,
2008). For others, however, the cancer experience can lead to more severe psychological

4
impairment, which is evident in the high number of diagnoses of mental illnesses in cancer
patients. The most prominent of these co-morbid mental illnesses are anxiety and depression.
However, reported prevalence rates vary due to differing conceptualisations of illness,
measurement techniques, and populations of interest (Massie, 2004; Pasquini & Biondi,
2007). An examination of the prevalence rates of depression amongst people with cancer in
60 studies found prevalence rates ranging up to 52%, stating that the association between
cancer and high levels of depression is beyond doubt (Massie, Lloyd-Williams, Irving, &
Miller, 2011). Although rates of anxiety amongst people with cancer also vary, it has been
suggested that anxiety co-occurs with cancer at an equivalent or greater rate than depression
(Mystakidou et al., 2005; Roy-Byrne et al., 2008).
Both anxiety and depression in cancer patients can be specifically associated with the
cancer itself, or relate to pre-existing anxiety or depression (Fulcher, Kim, Smith, & Sherner,
2014; Jacobsen, Donovan, Swaine, & Watson, 2006; Mehta & Roth, 2015; Stark & House,
2000). More specifically, sources of anxiety and depression amongst cancer patients include
pre-existing diagnoses (mental illness predating a cancer diagnosis) that may be re-activated
or exacerbated by the cancer experience, acute or chronic reactions to the diagnosis of cancer,
the disruption of life plans, adverse responses to cancer symptoms or treatment side-effects,
the effect of treatment on the central nervous system, reduced quality of life, and fears
associated with cancer progression or recurrence (Jacobsen et al., 2006). Experiences of
depression and anxiety are not limited to the active treatment stage of the cancer process but
often persist for months or years post treatment. A key source of this long-term anxiety
and/or depression is greater stress and burden associated with the cancer experience, coupled
with a lack of available resources (Stein et al., 2008).
As cancer is often associated with coping difficulties and poor health outcomes, it can
be assumed that an additional diagnosis of anxiety and/or depression would only increase

5
such coping difficulties and compound poor outcomes. Research supports this assumption,
with co-morbid cancer and anxiety/depression found to be associated with poorer social,
emotional, and role functioning, adherence to treatment, and several domains of quality of
life (including overall) (L. F. Brown, Kroenke, Theobald, Wu, & Tu, 2010; Mystakidou et al.,
2005; Pasquini & Biondi, 2007). With regard to employment, co-morbid cancer and
anxiety/depression have been associated with an increase in disability days (days in bed or
with a >50% reduction in work/usual activities) and with an inability to work (Kroenke et al.,
2010). Perhaps the most concerning findings for this population are however that co-morbid
depression can predict elevated mortality (Pinquart & Duberstein, 2010; Satin, Linden, &
Phillips, 2009), increase the risk of suicide (Misono, Weiss, Fann, Redman, & Yueh, 2008;
Robinson, Renshaw, Okello, Moller, & Davies, 2009; Robson, Scrutton, Wilkinson, &
MacLeod, 2010), and increase the desire for hastened death by up to four times in terminally
ill cancer patients (Breitbart, Rosenfeld, Pessin, & et al., 2000).
In order to increase adaptive coping responses and improve the poor health outcomes
associated with the co-morbid experience of cancer and anxiety/depression, we need to learn
more about the factors that are influencing these outcomes, with people’s cognitive
representations of illness (understanding of their illnesses) one such influencing factor. A
better understanding of these cognitive representations can provide a greater insight into how
people think about and experience their illnesses. In addition to this, an examination of how
these cognitive representations may influence the coping and self-management of, as well as
the illness outcomes associated with, cancer and anxiety/depression is needed. This new
knowledge could in turn lead to improvements in current interventions, or the development of
new effective support measures and future interventions that improve the health and well-
being of people with these illnesses. This appears to be an area in need of innovation, as
current evidence from systematic and meta-analytic reviews have mixed outcomes and
6
disparate conclusions regarding the effectiveness of interventions for cancer patients with
psychological distress, anxiety, and depression (Galway et al., 2012; Jacobsen & Jim, 2008;
Lepore & Coyne, 2006). This thesis will therefore attempt to examine the relationships
between cognitive representations and illness outcomes in people with cancer and
anxiety/depression with a view to improving future interventions.
The Common Sense Model of Health and Illness
The most widely used model of the psychological processes underlying coping
behaviours and health outcomes in people with chronic illness is the Common Sense Model
of Self-Regulation of Health and Illness (CSM; Leventhal, Meyer, & Nerenz, 1980). The
CSM aims to explain how people understand and respond to a health threat or illness. The
model conceptualises an individual as an active problem solver who is required to manage
two phenomena in parallel, their perceptions or representations of a health threat (e.g.,
symptoms, being told that something is wrong by a doctor, or encountering an advertisement
related to an illness) or illness (what is this health threat or illness, and what can I do about
it), and their associated emotional responses to that health threat or illness (how do I feel
about the health threat or illness and how can I feel better about it) (Diefenbach &
Leventhal, 1996). The model is hierarchically organised, with three main constructs: illness
representations, coping responses, and appraisal. Illness representations, people’s
interpretation of or beliefs about a health threat or illness, and emotional responses, are
formed based on existing schemata including current and past illness experience, information
from the external social environment, and general knowledge (Leventhal et al., 1980). These
cognitive representations, as well as their associated emotional responses, work in parallel to
guide coping responses and self-management strategies, which are later appraised in terms of
their success or failure in controlling the health threat and its consequences (Hale, Treharne,
& Kitas, 2007). Outcome appraisals then lead to the refinement of one’s illness

7
representations, as well as the selection of new coping and management strategies
(Diefenbach & Leventhal, 1996). The CSM includes illness representations, coping
responses, and appraisal, as part of a multi-directional and self-regulative feedback loop (see
Figure 1.1), meaning that these processes are subject to change and evolution over time
(Leventhal, Leventhal, & Contrada, 1998).
Figure 1.1. The common sense model of self-regulation of health and illness (Leventhal et
al., 1980), adapted from Diefenbach and Leventhal (1996).
Illness Representations
The key construct within the CSM are subjective illness representations (sometimes
referred to as illness perceptions), defined as individual’s lay beliefs about illness. This
means that rather than being accurate and correct, these representations encompass what
people understand about the illness and what they believe to be accurate and correct. These
representations are how people make sense of their illness, and according to the theory, they

8
explain how individuals attempt to cope with their illness (Hale et al., 2007; Leventhal et al.,
1998; Leventhal et al., 1980). The model proposes several distinct illness representation
dimensions: identity, cause, timeline (acute/chronic), timeline (cyclical), consequences,
curability/controllability, personal control, treatment control, illness coherence, and
emotional representations (Diefenbach & Leventhal, 1996; Leventhal et al., 1998; Leventhal
et al., 1980; Moss-Morris et al., 2002). Identity refers to the label or name of the health threat
or illness (e.g., cancer) and its symptoms (e.g., weight loss). Cause refers to the perceived
cause of the health threat or illness (e.g., poor diet). Timeline refers to beliefs about the length
of illness development, duration, and recovery (e.g., acute or chronic). Consequences (both
imagined and real) refers to beliefs about the anticipated repercussions associated with the
health threat or illness (e.g., financial hardship). Curability or Controllability refers to the
perceived belief about the extent to which the health threat or illness can be prevented,
controlled, prevented from progressing, or cured, by themselves or by others (e.g.,
controllable and curable with medication) (Diefenbach & Leventhal, 1996; Leventhal et al.,
1998).
Later revisions of the illness representation dimensions proposed that control beliefs
could be separated into two distinct dimensions: personal control – the amount of control an
individual perceives that they personally have over the health threat or illness, and treatment
control - the amount of control an individual perceives their treatment has over the health
threat or illness. These revisions also included a distinct dimension for cyclical timeline
perceptions, as well as an illness coherence dimension referring to the extent to which an
individual demonstrates coherent understanding of the health threat or illness (e.g., confused
by symptoms), and an emotional representations dimension that refers to an individual’s
emotional responses to the health threat or illness (e.g., anxious) (Moss-Morris et al., 2002).
The Illness Perception Questionnaire (IPQ; Weinman, Petrie, Moss-Morris, & Horne, 1996),

9
the Revised Illness Perception Questionnaire (IPQ-R; Moss-Morris et al., 2002), and the
Brief Illness Perception Questionnaire (B-IPQ; Broadbent, Petrie, Main, & Weinman, 2006),
are the most widely used instruments to assess these illness representations. The IPQ-R has
demonstrated acceptable test-retest reliability at three weeks and six months, sound
discriminant and predictive validity, and good internal reliability, with Cronbach alpha’s
ranging between .79 and .89 across subscales (Moss-Morris et al., 2002).
The CSM in Practice
How individuals’ illness beliefs may influence the way in which they cope with and
manage a health threat or illness can be explained by the CSM. For example, when
experiencing a health threat such as a headache, a person will automatically attempt to find
the location of the pain and try to establish its cause (accessing illness representations),
considering factors like the sharpness of the pain, dehydration, or whether a similar pain has
been experienced previously. How this person will then cope with and treat the headache
depends on the answers to these questions. Potential outcomes include visiting a doctor or
health professional (for example, if they interpret the pain to be a symptom of an underlying
illness), taking pain relieving medication (for example, if they know they are prone to a
headache when they have slept badly), asking for advice from a friend or family member (for
example, if they have a friend who has medical training), increasing hydration (for example,
if they have read that dehydration can lead to headaches), or waiting to see whether the pain
subsides on its own (for example, if this strategy was effective previously). This evaluation
and decision-making process is influenced by three key sources of information, bodily
experiences (e.g., the location of the headache), information based on previous experiences
with illness (e.g., a previous diagnosis of cancer), and information gathered from the external
social environment (e.g., from family and friends, health professionals, and the media)
(Leventhal et al., 1980). Cultural and social factors (e.g., “My family told me to stop getting

10
upset over nothing”), as well as emotional responses to the health threat (headache; e.g., “I’m
afraid my cancer may have returned”), also play a key role in this process (Diefenbach &
Leventhal, 1996).
Once a coping response has been chosen and enacted, the person will evaluate or
appraise the effectiveness of that response. For example, if the person had attempted to
alleviate their headache by increasing hydration levels, they might ask themselves whether
this was successful and whether they feel any better. If the headache is not relieved with
additional hydration, the individual will then revise their illness representations and initial
self-diagnosis, as well as seek an alternative explanation for the headache (for example, by
visiting a health professional). Emotional responses are also generated in parallel with this
cognitive process, for example, for a person with a previous cancer diagnosis, a headache
might provoke extreme anxiety, and could lead the person to engage in behaviours that may
reduce this fear. The CSM thus suggests that coping responses (and later appraisal) are
performed with respect to the emotional responses elicited by a health threat, as well as by
the cognitive activity that generates the representations of the health threat (Diefenbach &
Leventhal, 1996). It is thought that this process may be more complex for people who
experience multiple health threats or illnesses, where multimorbid representations may
impact coping behaviours and health outcomes. For example, co-morbid anxiety/depression
are often experienced with chronic illnesses and may result in maladaptive cognitions (e.g.,
catastrophising or hopelessness), which in turn may negatively influence coping attempts and
illness self-management.
The CSM and Chronic Illness
The CSM and the illness representation dimensions have been instrumental in helping
to understand how people respond to and experience chronic illness. A seminal systematic
review by Hagger and Orbell (2003) summarised how the illness representation dimensions

11
measured by the IPQ are related to coping behaviours and illness outcomes. In particular,
they found that greater perceived controllability over an illness was associated with more
adaptive coping strategies (e.g., cognitive reappraisal, problem-focused coping), while
perceiving an illness as highly symptomatic with a chronic timeline and serious consequences
was associated with more maladaptive coping strategies (e.g., avoidance/denial, expressing
emotion). With regard to illness outcomes, perceptions of the illness as curable and
controllable were associated with more positive illness outcomes (e.g., psychological well-
being, vitality), while perceptions of increased symptomology (higher identity), a chronic
timeline, and more severe consequences were associated with negative illness outcomes (e.g.,
psychological distress). A more recent meta-analytic review by Dempster, McCorry, and
Howell (2015) found further support for the relationship between illness representations and
psychological distress over a range of physical health conditions, with higher identity (more
perceived symptoms), more serious consequences, a more cyclical timeline, higher emotional
representations (a stronger emotional response), less controllability, and less illness
coherence, associated with higher levels of depression and anxiety. The associations
identified across both of these reviews provide strong support for the CSMs illness
representation dimensions, and highlight the importance of understanding individuals’
subjective illness representations.
The CSM and Cancer
Despite the important insights provided by Hagger and Orbell (2003) and Dempster et
al. (2015), neither review explicitly examined the relationships between illness
representations, coping, and outcomes, in people with cancer or in people with
anxiety/depression (or allowed for separate results by illnesses). Therefore, in order to
appropriately examine and understand how illness representations relate to coping behaviours
and illness outcomes in people with these illnesses, this thesis provides the first systematic

12
reviews with meta-analyses of these relationships (Study 1 and Study 2).
Interest in the relationships between illness representations and coping behaviours and
illness representations and illness outcomes in people with cancer specifically has increased
over time, with the number of publications examining the CSM in the cancer domain steadily
increasing (particularly since the creation of the IPQ; Weinman et al., 1996). The illness
representations held by people with cancer may be particularly relevant to understanding how
people with cancer cope and function, as research has shown that cancer patients have strong
and easily accessible representations based on illness experience that differ from the
representations of people without a cancer diagnosis (Anagnostopoulos & Spanea, 2005;
Buick & Petrie, 2002). Due to the differing nature of these representations, explorations of
the relationships between representations, coping, and outcomes in people with cancer
specifically were required.
Illness representations appear to be particularly relevant for coping behaviours and
illness outcomes in people with cancer. For example, Gould, Brown, and Bramwell (2010)
found higher perceived personal control to be associated with more adaptive coping strategies
(e.g., problem-focused coping and acceptance/growth), while perceptions of a more cyclical
timeline and less illness coherence were associated with maladaptive coping strategies (e.g.,
denial/disengagement), in people with gynaecological cancer. With respect to illness
outcomes, Dempster et al. (2012) found perceptions of a more chronic or cyclic timeline,
more severe consequences, less personal and treatment control, and less illness coherence, to
be associated with higher levels of depression and anxiety in people with oesophageal cancer.
At times the size and direction of the associations between illness representations,
coping, and outcomes, in people with cancer have been found to vary across studies. For
example, Keeling, Bambrough, and Simpson (2013) found a moderate negative relationship
between illness coherence and anxiety in people with low-grade brain tumours, suggesting

13
that less understanding of their cancer was associated with higher levels of anxiety. In
contrast, Freeman-Gibb (2012) found a negligible positive relationship between illness
coherence and anxiety in people with breast cancer, suggesting that a better understanding of
their cancer was associated with more anxiety, though the negligible size of the effect
suggests that this association is weak and may not be particularly meaningful. Both the large
number of studies examining illness perceptions in people with cancer, as well as the
inconsistencies in findings across some studies, warranted the completion of a systematic
review and meta-analysis to determine whether illness representations are related to coping
behaviours and illness outcomes across studies of people with cancer, as well as to clarify the
strength and direction of these relationships (Study 1).
The CSM and Mental Illness
No study has quantitatively synthesised the literature examining the relationships
between illness representations, coping behaviours, and illness outcomes, in people with
anxiety/depression. Therefore, in order to address this gap in the literature, as well as to find
out whether it would be appropriate to use the CSM as a basis for examining the
representations of people with co-morbid cancer and anxiety/depression (Study 3), this thesis
included a systematic review and meta-analysis to specifically examine the relationships
between illness representations, coping, and outcomes in people with anxiety and/or
depression (Study 2).
The CSM was originally designed to explain how cognitive structures and
representations can explain coping responses in people with physical illnesses. However, the
model has also been found to be useful for examining and understanding how people’s
representations can influence coping behaviours and illness outcomes in mental illnesses. For
example, Elwy, Yeh, Worcester, and Eisen (2011) found those who sought treatment for
depression had perceptions of a better understanding of depression (higher illness coherence)

14
and perceived treatment would control their depression (higher treatment control), while
those who did not seek treatment for depression perceived that treatment would not control
their depression (lower treatment control) and that the depression would be short-term (acute
timeline). With regard to illness outcomes, Lu et al. (2014) found that perceived chronic
timeline, more severe consequences, stronger emotional representations, and less perceived
personal control were associated with depression severity, anxiety, stress, and psychological
distress, in people with depression. Further, two recent reviews have offered support for the
illness representation dimensions of the CSM in people with mental illness and depression
respectively (Alderson, Foy, Glidewell, McLintock, & House, 2012; Baines & Wittkowski,
2013).
Alderson et al. (2012) used a narrative synthesis to examine beliefs about depression
in people with current depressive symptoms. Beliefs were coded into the main categories of
illness representations, though five additional thematic categories were found for beliefs that
did not clearly fit within the CSM framework (understandability, the depression cycle,
existential and self, suicidal thinking, and stigma, blame, and responsibility). They noted that
illness representations in depression may be more complex than those in physical illnesses,
highlighting the marked variations between participants across depression identity and
timeline beliefs, with many different labels used to describe depression, and acute, chronic,
and cyclic timelines all mentioned. Further, most study participants perceived complex multi-
factor causes for their depression, held strong beliefs about treatment control, and felt that
depression had mostly negative consequences that affected all current and future aspects of
life (e.g., physical health, social and home life), with some participants experiencing a lack of
any control over depression. Finally, there was difficulty in distinguishing between an
emotional representation for depression and the emotional symptoms of depression, though
depression was found to be associated with fear, anxiety, sadness, despair, and guilt. When

15
examining these findings, a consideration of the three key elements of Beck’s cognitive triad
(A. T. Beck, 1967), negative views about the self, world, and future, may help to explain how
depression influences subjective representations through negative automatic thoughts (A. T.
Beck, Rush, Shaw, & Emery, 1979). For example, a negative view of the future may lead to
perceptions of a more chronic timeline of depression, while negative self and world views
may lead to perceptions of less control over depression. Although this study provided insight
into how the experience of depressive symptoms may be related to the illness representation
dimensions, no formal review of how representations could impact coping and outcomes was
included.
More recently, a systematic review examining the relationships between illness
representations and coping behaviours and illness representations and illness outcomes in
people with mental illness was conducted by Baines and Wittkowski (2013) across 13
studies. This review included a qualitative synthesis and summary of four studies that
specifically examined the representations of people with depression, though no such
summary was included for studies of people with anxiety. This summary revealed that
perceptions of more negative consequences and a higher identity were associated with the use
of maladaptive coping strategies (e.g., self-blame); perceptions of a more chronic timeline
was associated with increased medication adherence and treatment seeking; and perceptions
of a higher identity, more chronic timeline, more severe consequences, and less personal
control were associated with increased depression severity.
The CSM has increased understanding of how people self-regulate, manage, and cope
with physical illnesses (Dempster et al., 2015; Hagger & Orbell, 2003). Further, research
examining illness representations in people with mental illness has demonstrated the CSMs
applicability for also understanding how people self-regulate mental illnesses (Alderson et
al., 2012; Baines & Wittkowski, 2013). However, in order to further understand how the

16
CSM can inform coping and outcomes in people with anxiety/depression specifically, a
systematic review and meta-analysis of the relationships between illness representations and
coping behaviours, as well as illness representations and illness outcomes, in this population
was required (Study 2), something not yet examined in previous review studies.
Co-morbid Illness Representations
As previously highlighted, many quantitative and qualitative studies across multiple
single chronic illnesses (e.g., diabetes, cancer, asthma, depression) have used the CSM as a
basis for improving our understanding of illness behaviour. In particular, this research
highlights the relationships between the CSMs illness representation dimensions and coping
behaviours as well as illness outcomes. However, given the high prevalence of co-existing
multiple illnesses (multimorbidity, co-morbidity), examining illness representations in single
illnesses alone may miss important information about the impact of multimorbidity on
representations of each individual condition, as well as missing information about the
representations of multimorbidity itself (e.g., representations of the relationships between
multiple illnesses). Importantly, research has recently begun to investigate illness
representations in people with multiple illnesses. A qualitative study by Bower et al. (2012)
explored multimorbid illness representations in people with at least two of five conditions:
type 2 diabetes, chronic arthritis, chronic obstructive pulmonary disease, coronary heart
disease, and depression. This study was one of the first to investigate what the content of
illness representations might look like for people with multimorbidity. For individual
conditions, several illness representation dimensions including identity, cause, consequences,
and illness coherence, were found to be impacted by multimorbidity. For example,
multimorbidity compounded the consequences experienced by participants, with difficulty in
linking individual symptoms with a particular illness reducing coherence and impacting
perceptions of identity and cause. Several dimensions relating to representations of

17
multimorbidity were also identified, including medication burden (the perceived burden of
taking medications for multiple conditions), condition priority (the relative importance
assigned to each condition), and management synergies and antagonisms (the perception that
managing one condition may benefit or aggravate another condition). These three
dimensions’ impact how people self-manage their illnesses, and may be appropriate targets
for intervention.
A qualitative study with participants who had co-morbid diabetes and depression by
Mc Sharry, Bishop, Moss-Morris, and Kendrick (2013) emphasised the importance of
understanding how people perceive the relationships between their illnesses, and provided
further evidence for the existence of multimorbid illness representations that influence how
illnesses are self-managed. Illnesses were either described as unrelated with separate
management strategies used for each, or as related with interactions between each illness. For
those who saw interactions between diabetes and depression, causal relationships were often
perceived (e.g., diabetes as causing depression or depression as causing diabetes), with the
nature of these relationships impacting the management of both illnesses. Further, either
integrated or conflicting self-management strategies were described by people who perceived
diabetes and depression as related. For example, symptoms of depression such as fatigue and
apathy interfered with diabetes self-management strategies such as exercise. Similar to Bower
et al. (2012) medication burden was highlighted as a concern for people with multimorbid
conditions, with difficulties in self-management perhaps related to a failure in self-regulation
caused by the high self-regulatory demands associated with multimorbidity (Detweiler-
Bedell, Friedman, Leventhal, Miller, & Leventhal, 2008).
A systematic review by Alderson et al. (2012) aimed to examine people’s beliefs
about depression in the presence of a chronic physical illness. However, a systematic
literature search only located two qualitative studies that examined beliefs about depression

18
associated with a chronic physical illness. Due to the paucity of research in this area,
Alderson, Foy, Glidewell, and House (2014) later conducted a qualitative study of beliefs
about depression in people with coronary heart disease and/or diabetes. They found that
general beliefs about depression were unable to be separated from beliefs about depression
related to diabetes or coronary heart disease, again highlighting the importance of
multimorbid representations for understanding illness beliefs and designing interventions.
These qualitative studies (Alderson et al., 2014; Bower et al., 2012; Mc Sharry et al.,
2013) support the existence of the CSMs illness representation dimensions (e.g., cause,
consequences, coherence), with these studies also highlighting the existence of additional
illness representations that are specific to multimorbidity. Such multimorbid representations
are likely to vary for different combinations of illnesses (e.g., diabetes and depression versus
cancer and depression), with this partially demonstrated by the findings of the studies
described. Therefore, using the CSM (as the best existing framework) may help to gain a
deeper understanding of, as well as provide additional insights into, the illness representations
of people with cancer and anxiety/depression specifically. Representations may differ for
people with this specific combination of illnesses for several reasons. For example, people
with cancer experience varying cancer types, stages of disease progression, and treatment
types, and these factors are very likely to influence representations of co-morbid
anxiety/depression. Further, pharmacological treatments such as chemotherapy are associated
with multiple side effects, while cancer-related surgery can affect issues such as body image.
People with cancer also often experience fear of cancer recurrence (FCR), a unique form of
anxiety experienced by cancer patients/survivors that comprises fears or worries about a
return or progression of a previous or new cancer (Lee-Jones, Humphris, Dixon, & Hatcher,
1997; Simard, Savard, & Ivers, 2010). How FCR interacts with multimorbid representations,
coping behaviours, and self-management strategies, may also provide important insights for

19
this population. Due to the unique issues associated with experiencing co-morbid cancer and
anxiety/depression, as well as the lack of research into the experience of co-morbid cancer
and anxiety/depression specifically, there is a need for more exploratory research to
understand how people with this common combination of physical and mental illness make
sense of their illnesses and associated difficulties (Study 3).
Comparing Support Needs across People with Cancer and Anxiety/Depression
How a person experiences cancer and anxiety/depression can be markedly different
based on their varying histories of each illness, with these varying aetiologies shown to cause
significant differences in health outcomes (Angst, Gamma, Rössler, Ajdacic, & Klein, 2009).
It follows that these variances are therefore highly likely to also cause differences in support
needs for people with cancer and anxiety/depression. In order to facilitate a better
understanding of how support needs might differ between people with cancer and
anxiety/depression, a comparison of the support needs of people with cancer and different
histories of anxiety/depression was required (Study 4).
In the field of psycho-oncology there is a common (mis)conception that
anxiety/depression are a normal part of the cancer experience (Pasquini & Biondi, 2007).
Unfortunately, this misconception has precluded appropriate treatment for anxiety/depression
in people with cancer, with many cancer patients requiring yet not receiving adequate
treatment (Nakash et al., 2014; Pasquini & Biondi, 2007; Sanjida et al., 2016). Despite this
misconception, research has shown that people with cancer do not always develop
anxiety/depression, with varying levels of distress experienced across cancer patients
(Helgeson, Snyder, & Seltman, 2004; Henselmans, Helgeson, et al., 2010). Further, a person
who is diagnosed with cancer may have a long-term pre-existing diagnosis of
anxiety/depression or experience episodic anxiety/depression in response to significant life
events. How such varying histories of anxiety/depression may influence the support needs of

20
people with cancer and anxiety/depression has rarely been considered across research in
psycho-oncology.
Although the support needs of people with cancer have been extensively researched
(Harrison, Young, Price, Butow, & Solomon, 2009), a recent review found that interventions
aimed at reducing unmet supportive care needs in cancer patients have limited effectiveness
(Carey et al., 2012). Further, interventions for cancer patients with distress rarely consider
how a prior history of anxiety/depression may influence intervention effectiveness, and often
provide mixed results and conflicting conclusions (Galway et al., 2012; Jacobsen & Jim,
2008; Lepore & Coyne, 2006). Examining and comparing the support needs of people with
varying histories of cancer and anxiety/depression may therefore inform the creation of more
appropriately focused and targeted interventions. Why support needs may differ between
people with cancer and varying histories of anxiety/depression relates to the significant
differences in health outcomes between people with long-term anxiety/depression and people
with episodic anxiety/depression. For example, long-term depression has been found to
require more treatment, be more clinically serious, be more often co-morbid with anxiety, and
lead to reduced well-being and poorer social and psychological outcomes than episodic
depression (Angst et al., 2009). In order to create more appropriate interventions and better
support people with cancer and anxiety/depression, research should examine and compare the
support needs of people who have cancer and long-term anxiety/depression and people who
have cancer and episodic anxiety/depression (Study 4).
The Present Thesis
The present thesis investigates the role of the Common Sense Model of Self-
Regulation of Health and Illness (Leventhal et al., 1980) in understanding how people’s
representations of cancer and anxiety/depression influence their coping behaviours, self-
management strategies, and illness outcomes, and what particular support needs people with

21
cancer and anxiety/depression express based on their understanding of their illnesses.
As highlighted above, cancer and anxiety/depression commonly occur as co-morbid
conditions, leading to poor health and illness outcomes. However, too little is currently
known about the psychological processes underlying this combination of illnesses. Chapter 2
presents a systematic review of the relationships between illness representations and coping
behaviours and illness representations and illness outcomes in people with cancer. Chapter 3
presents a second systematic review of the relationships between illness representations and
coping behaviours and illness representations and illness outcomes, but this time in people
with depression. Chapter 4 examines the content of multimorbid illness representations and
the relationship between these multimorbid representations and self-management strategies in
people with cancer and anxiety/depression. Chapter 5 explores how support needs differ
between people with long-term anxiety/depression and episodic anxiety/depression, as well
as between people with anxiety/depression associated with cancer and anxiety/depression not
associated with cancer. Chapter 6 concludes this thesis with an integrative discussion of the
study findings, overall limitations, both theoretical and practical implications, and
suggestions for future research.
Study 1 (Chapter 2): Illness representations, coping, and illness outcomes in people with
cancer: A systematic review and meta-analysis
Aim: To provide a systematic overview of the relationships between the Common Sense
Model’s illness representations and health and coping outcomes in people with cancer.
Due to the large pool of existing literature examining the relationship between illness
representations, coping behaviours, and illness outcomes in people with cancer, as well as the

22
inconsistency across some of these study findings, Study 1 involved the completion of a
systematic review and meta-analysis to synthesise the existing literature and reach a
consensus on the strength and direction of these relationships. A systematic literature search
identified 54 studies meeting inclusion criteria, with 38 studies providing sufficient data to be
included in the meta-analysis and the remaining 16 studies included in a narrative review.
Study 2 (Chapter 3): Illness representations, coping, and illness outcomes in depression: A
systematic review and meta-analysis
Aim: To provide a systematic overview of the relationships between the Common Sense
Model’s illness representations and health and coping outcomes in people with depression.
Although clear relationships have been found between the CSMs illness
representation dimensions and coping and outcomes in people with chronic physical illnesses,
the ability of this model to explain relationships between illness beliefs and behaviour in
people with mental illnesses is less well established, with no quantitative synthesis examining
this relationship in people with depression specifically. Study 2 therefore involved the
completion of a systematic review and meta-analysis to examine the relationships between
illness representations, coping, and outcomes in people with depression. Nineteen studies
were located following a systematic literature search, with 10 providing sufficient data for
meta-analysis, and nine included in a narrative review.
Study 3 (Chapter 4): ‘It was all intertwined’: Illness representations and self-management in
people with cancer and anxiety/depression

23
Aim: To explore the content of individual’s multimorbid representations of cancer and
anxiety/depression, as well as how these relate to their coping behaviours and self-
management strategies.
Though well established in single chronic illnesses, research has only recently begun
to investigate the content and role of illness representations in people with multiple illnesses,
with research yet to examine the illness representations of people with co-morbid cancer and
anxiety/depression. Study 3 aimed to address this gap in existing literature by qualitatively
examining the nature of illness representations for both cancer and anxiety/depression,
whether all individuals think about the relationships between cancer and anxiety/depression
in similar ways, and how particular illness representations might facilitate different coping
behaviours or self-management strategies for cancer and anxiety/depression. To examine
these aims, 21 semi-structured face-to-face interviews were conducted, and a theoretical
thematic analysis provides a detailed analysis of differences in representations between those
who identified links between cancer and anxiety/depression and those that did not.
Study 4 (Chapter 5): A qualitative comparison of the support needs of people with cancer
based on their history of anxiety/depression
Aim: To examine and compare the support needs of people with cancer and varying histories
of anxiety/depression in order to provide suggestions for improvements in support and
service provision.
The field of psycho-oncology (both in research and in practice) rarely takes into
account the origin and history of anxiety/depression in a person with cancer, instead

24
assuming it to be related to the cancer diagnosis. In order to determine whether and how this
history may influence the support needs of people with cancer and anxiety/depression,
interview transcripts from 21 people (same participant pool as Study 3) were analysed (Study
4). Study 4 categorised participants into four groups based on their history of
anxiety/depression, specifically considering whether they had experienced long-term
anxiety/depression or episodic anxiety/depression, as well as whether they had experienced
anxiety/depression that was associated with their cancer diagnosis or anxiety/depression that
was not associated with their cancer diagnosis. Following categorisation, an inductive
thematic analysis was used to collate codes into relevant themes and highlight important
differences between groups.

25
Chapter 2
Study 1
Illness representations, coping, and illness outcomes in people with cancer: A systematic
review and meta-analysis*
*Richardson, E. M., Schüz, N., Sanderson, K., Scott, J. L., Schüz. B. (2016). Illness
representations, coping, and illness outcomes in people with cancer: A systematic review and
meta-analysis. Psycho-Oncology. Advance online publication. doi: 10.1002/pon.4213 (see
Appendix 2.1)

26
Abstract
Objective: Cancer is associated with negative health and emotional outcomes in those
affected by it, suggesting the need to better understand the psychosocial determinants of
illness outcomes and coping. The Common Sense Model (CSM) is the leading psychological
model of self-regulation in the face of illness, and assumes that subjective illness
representations explain how people attempt to cope with illness. This systematic review and
meta-analysis examines the associations of the CSM’s illness representation dimensions with
health and coping outcomes in people with cancer.
Methods: A systematic literature search located 54 studies fulfilling the inclusion criteria,
with 38 providing sufficient data for meta-analysis. A narrative review of remaining studies
was also conducted.
Results: Random-effects models revealed small to moderate effect sizes (Fischer’s Z) for the
relations between illness representations and coping behaviours (in particular between control
perceptions, problem-focused coping, and cognitive reappraisal), and moderate to large effect
sizes between illness representations and illness outcomes (in particular between identity,
consequences, emotional representations, and psychological distress). The narrative review of
studies with insufficient data provided similar results.
Conclusions: The results indicate how illness representations relate to illness outcomes in
people with cancer. However, more high quality studies are needed to examine causal effects
of illness representations on coping and outcomes. High heterogeneity indicates potential
moderators of the relationships between illness representations and health and coping
outcomes, including diagnostic, prognostic, and treatment related variables. This review can
inform the design of interventions to improve coping strategies and mental health outcomes
in people with cancer.
Keywords: cancer; oncology; illness perceptions; common sense model of illness
representations; systematic review and meta-analysis

27
Background
Cancer is one of the most prevalent diseases worldwide, with more than 14 million
new cancer cases diagnosed annually (International Agency for Research on Cancer & World
Health Organisation, 2014). Often, people with cancer experience negative health outcomes
(e.g., anxiety, depression, psychological distress, poor role/physical functioning, and reduced
quality of life) and face extraordinary coping challenges (Croom, Hamann, & Kehoe, 2013;
Deimling et al., 2006; Edwards & Clarke, 2004; Harrington et al., 2010; O'Brien & Moorey,
2010; Singer et al., 2010). These outcomes and coping behaviours depend on individual
representations of illness (Diefenbach & Leventhal, 1996), but to date, no systematic review
and meta-analysis has provided an overview of the complex relationships between illness
representations, coping and illness outcomes in cancer to inform the content of psychological
interventions based on subjective illness representations.
Illness Representations and the Common Sense Model
The Common Sense Model of Self-Regulation of Health and Illness (CSM; Leventhal
et al., 1980) is a widely accepted psychological model of the processes underlying health and
coping in people with chronic illness. According to the CSM, individual representations of
health threats (i.e., people’s common-sense understanding of their illness; Leventhal et al.,
1998; Leventhal et al., 1980) and the according emotional response guide peoples’ coping
responses in parallel processes, which are later appraised in terms of their success or failure
(Diefenbach & Leventhal, 1996) (Figure 2.1).
The CSM orders illness representations into distinct dimensions. Identity refers to the
label of the health threat (e.g. cancer) and its symptoms (e.g. fatigue). Cause refers to the
individual’s beliefs about the cause of the health threat (e.g. genetic weakness). Timeline
refers to the perceived time-frame of disease development, duration, and recovery (e.g. acute,
chronic, or cyclical). Consequences (both imagined and real) are beliefs about what effect the

28
health threat may have on an individual’s life (e.g. absence from work). Curability or
controllability refers to the degree to which someone believes that the health threat can be
controlled or cured by themselves or others (e.g. incurable but controllable with medication)
(Leventhal et al., 1998). This dimension has later been revised to represent two distinct
dimensions - personal control - the amount of control an individual perceives to have over
the course of their illness, and treatment control - the amount of control the individual
believes their treatment has over the illness. Illness coherence refers to the extent to which a
patient’s illness representations provide coherent understanding of the illness, and emotional
representations describe an individual’s emotional responses to the illness (Moss-Morris et
al., 2002). The most widely used instruments to assess illness representations are the Illness
Perception Questionnaire (IPQ; Weinman et al., 1996), the Revised Illness Perception
Questionnaire (IPQ-R; Moss-Morris et al., 2002), and the Brief Illness Perception
Questionnaire (B-IPQ; Broadbent et al., 2006). The IPQ-R has acceptable test-retest
reliability, sound discriminant and predictive validity, and good internal reliability (Moss-
Morris et al., 2002).
Figure 2.1. The common sense model of self-regulation of health and illness (Leventhal et
al., 1980), adapted from Diefenbach and Leventhal (1996).

29
In a seminal systematic review of the CSM, Hagger and Orbell (2003) have shown
that the IPQ dimensions are related to both coping behaviours (such as avoidance/denial and
medication adherence) and illness outcomes (e.g., depression and physical functioning)
across a range of chronic and acute illnesses. In particular, greater perceived controllability
was associated with more adaptive coping strategies, while perceiving an illness as highly
symptomatic with a chronic timeline and serious consequences was associated with more
maladaptive coping strategies. Perceptions of the illness as curable and controllable were
associated with positive illness outcomes, while perceived negative consequences, chronic
timeline, and higher identity (more perceived symptoms) were associated with negative
illness outcomes. These relations highlight the importance of subjective representations for
understanding how people cope with illness and their illness outcomes. However, the review
by Hagger and Orbell (2003) included only one study of cancer patients. Further, in the 13
years since this original review, the number of publications examining illness representations
in cancer have greatly increased.
Illness Representations in Cancer: The Present Review
Illness representations might be particularly relevant to understanding coping and
illness outcomes in the area of cancer, as people hold strong and readily accessible
representations of cancer based on common-sense knowledge (Anagnostopoulos & Spanea,
2005; Buick & Petrie, 2002). These representations determine coping and illness outcomes,
for example higher levels of control and better understanding have been associated with
lower rates of anxiety and depression (Dempster et al., 2012).
However, the size (and occasionally direction) of these associations varies across
studies, with one study finding a moderate negative relationship between illness coherence
and anxiety (Keeling et al., 2013), whereas another study found a negligible positive
relationship between illness coherence and anxiety (Freeman-Gibb, 2012). Such inconsistent

30
findings warrant a systematic review to determine a consensus on the strength and direction
of the relationships between illness representations and health and coping outcomes.
The findings of this review have the potential to inform clinical interventions based
on illness representations. Some previous intervention studies in other chronic illness patients
(e.g., Siemonsma et al., 2013) support the malleability of coping behaviours and illness
outcomes via modifying illness representations, although to date, none have been conducted
with cancer patients.
Aims and Hypotheses
The present review aims to provide the first systematic overview of the relationships
between illness representations and health and coping outcomes in people with cancer.
Consistent with the findings from Hagger and Orbell (2003) involving diverse chronic
illnesses, we hypothesised that higher identity, acute/chronic timeline, cyclical timeline,
consequences, and emotional representations, as well as lower personal control, treatment
control, and illness coherence, would be associated with more maladaptive coping behaviours
(e.g., higher levels of avoidance/denial) and more negative illness outcomes (e.g., higher
levels of anxiety). In contrast, lower identity, acute/chronic timeline, cyclical timeline,
consequences, and emotional representations, as well as higher personal control, treatment
control, and illness coherence, were predicted to be associated with more adaptive coping
behaviours (e.g., higher levels of cognitive reappraisal) and more positive illness outcomes
(e.g., higher quality of life).
Methods
Literature Search, Inclusion Criteria, and Study Selection
This study followed the Preferred Reporting Items for Systematic Reviews and Meta-
Analysis (PRISMA) Statement (Moher, Liberati, Tetzlaff, Altman, & The PRISMA Group,
2009; Appendix 2.2), with no ethical approval required. A systematic literature search was

31
conducted using Scopus, Web of Science, PubMed, PsycINFO, and CINAHL. In an attempt to
locate ‘grey literature’ additional searches were conducted through Google Scholar. For the
full search strategy for each database refer to Appendix 2.3. A manual search of the reference
lists of included articles was also completed to identify additional studies. Attempts were
made to locate missing data sets by contacting relevant authors.
Studies were eligible for inclusion if they met the following criteria: quantitative
design, including any subscale from the IPQ (Weinman et al., 1996), the IPQ-R (Moss-
Morris et al., 2002), or the B-IPQ (Broadbent et al., 2006), measuring coping behaviours or
illness outcomes, adult participants (over 18 years) with a cancer diagnosis, written in
English or German, and conducted after 1995 (post IPQ development).
Following three consecutive literature searches and full-text coding by the first author
(using a coding manual and coding sheet: see Appendix 2.4 and Appendix 2.5), the final
number of studies for the systematic review was 54, with 38 included in the meta-analysis
(based on relevant data) (Beatty & Scott, 2013; Cameron et al., 2005; Chen, 2012; Cook et
al., 2015a; Corter, Findlay, Broom, Porter, & Petrie, 2013; Costanzo, Lutgendorf, & Roeder,
2011; Croom, 2012; Croom et al., 2013; Dempster et al., 2012; Donovan, 2003; Duric et al.,
2007; S. Y. Fan, Eiser, Ho, & Lin, 2013; Fischer et al., 2013; Förster & Taubert, 2006; Foster
et al., 2015; Freeman-Gibb, 2012; A. Gibbons, 2013; Gould et al., 2010; Green, Steinnagel,
Morris, & Laakso, 2014; Henselmans, Sanderman, et al., 2010; Hopman & Rijken, 2014;
Karademas & Giannousi, 2013; Keeling et al., 2013; Llewellyn, McGurk, & Weinman, 2006,
2007b; Llewellyn, Weinman, McGurk, & Humphris, 2008; McCorry et al., 2013; Mols,
Lemmens, Bosscha, van den Broek, & Thong, 2014; Paschali, Hadjulis, Papadimitriou, &
Karademas, 2015; Rozema, Völlink, & Lechner, 2009; Scharloo et al., 2010; Silva, Moreira,
& Canavarro, 2012; Thuné-Boyle, Myers, & Newman, 2006; Traeger, 2009; Traeger et al.,
2009; van der Kloot et al., 2014; Wu, Mohamed, Winkel, & Diefenbach, 2013; Zivkovic,

32
Buljan, Blajic, & Situm, 2008). A flow-chart of the study selection process can be found in
Figure 2.2, with a detailed description of the search process in Appendix 2.6.
Figure 2.2. Flow-chart of the study selection process.
Classification of Coping Behaviours and Illness Outcomes
Categories of coping behaviours were adapted from Hagger and Orbell (2003) to
include the behaviours most frequently mentioned in the cancer literature. Eleven categories

33
were identified: expressing emotion, cognitive reappraisal, avoidance/denial, problem-
focused coping (generic and specific behaviours separately), treatment decision making,
medication adherence, adherence to treatment visits, doctor visits, seeking social support, and
other (specified) coping behaviour. Only three of these categories (cognitive reappraisal,
avoidance/denial, and problem-focused coping [generic]) could be used in the meta-analysis
due to a lack of studies measuring or reporting the other categories.
Illness outcomes were also classified using the categories in Hagger and Orbell (2003)
and extended if necessary. Thirteen categories were identified: affect (negative/positive),
anxiety, depression, psychological distress, treatment related distress, decisional
uncertainty/regret, psychological well-being, vitality, role functioning, physical functioning,
disease state, quality of life, and other (specified) illness outcome. Only seven of these
categories (anxiety, depression, psychological distress, psychological well-being, role
functioning, physical functioning, and quality of life) were used in the meta-analysis due to a
lack of studies measuring or reporting the other categories.
Data Extraction and Meta-Analytic Strategy
We extracted publication date, cancer type, sample characteristics (age and sex), study
design, IPQ version, coping behaviours, illness outcomes, and a summary of the relevant
results from all identified articles (Appendix 2.7 shows a summary of studies included in the
meta-analysis; Appendix 2.8 shows a summary of studies included in the narrative review).
To assist in evaluating validity of results, risk of bias was assessed using four criteria
relevant to the research aims: (i) whether each version of the IPQ had been administered as
recommended; (ii) which IPQ dimensions were reported; (iii) whether equivalent
correlational analyses were conducted across studies; (iv) whether adjustments were made for
confounding variables.
Zero-order correlations were the most frequently reported effect size, and therefore

34
the average correlation coefficient weighted by sample size and calculated using Fischer’s Z
transformations (rz) was used as the measure of effect in the meta-analysis. We interpreted
.10 as a small effect, .30 as a moderate effect, and .50 as a large effect (Cohen, 1992). The
meta-analyses were conducted in R (R Core Team, 2014) using the ‘metafor’ package
(Viechtbauer, 2010). A random-effects meta-analysis was performed, which accommodates
the assumption that the true effect size (the effect size in the underlying population of studies)
may vary from study to study due to heterogeneity (Borenstein, Hedges, Higgins, &
Rothstein, 2010). In the present meta-analysis, the studies were likely to be heterogeneous
due to differing study designs, cancer types, treatment types, and other sampling
characteristics.
To examine heterogeneity between studies, Q and I2 statistics were calculated. To
assess publication bias (‘file drawer problem’), funnel plots and the ‘fail-safe N’ (Nfs) were
examined, and moderator analyses (random-effects meta-regression) were conducted as
appropriate. In these analyses, cross-sectional (0) and longitudinal (1) design were entered as
predictors of the effect sizes between studies, and B’s can be interpreted as differences in the
pooled effect sizes between cross-sectional and longitudinal studies. For additional
information regarding the meta-analytic strategy used in our review, please refer to Appendix
2.9.
Results
Study Characteristics
Thirty-six (66.67%) of the studies had a cross-sectional design, two (3.70%) were
experimental with only baseline correlations extracted, and 16 (29.63%) were longitudinal
with intervals ranging from one week to twelve months. Sample sizes ranged between 43 and
1019, with a mean sample size of 182. Eleven different types of cancer were reported, with
the most common breast cancer (15 studies, 27.78%), followed by head and neck cancer

35
(seven studies, 12.96%), and prostate cancer (six studies, 11.11%). Sixteen studies (29.63%)
reported heterogeneous cancer populations (multiple cancer types) and were classified as ‘not
specified’. Other cancer types included colorectal, oesophageal, gynaecological, oral,
ovarian, liver, brain, and skin. Cancer stage was coded, but only 19 of 38 studies (50%) in the
meta-analysis provided data on participants’ cancer stage, which additionally was often based
on different staging systems (e.g., TNM, idiosyncratic systems) with no separate results
provided for differing cancer stages. In 27 studies (50% of all articles reviewed), the IPQ was
adapted to be ‘cancer specific’, rather than using the generic version. This involved minor
changes in wording and the inclusion of cancer specific symptoms and causes. For more key
study characteristics refer to Appendix 2.7 and Appendix 2.8.
Risk of Bias Assessment
Risk of bias assessment was based on the fidelity of measurement of illness
representations and outcomes as well as study design. The majority of studies (42 out of 54)
administered the IPQ, IPQ-R, or B-IPQ as recommended, with some studies (12 out of 54)
only partially adhering to guidelines by developers. Those studies either used shortened
versions of subscales, added items to subscales, or adapted items to suit the sample or cancer
patients specifically. Most studies reported the correlations of the illness representation
dimensions they had assessed, with those that did not contacted for missing data. However,
data was unable to be obtained for three studies omitting cause and three that failed to report
non-significant results. In 30 out of 38 studies Pearson’s correlation coefficients were
reported, with Spearman’s correlation coefficients used in two, lagged, point-biserial, and
bivariate used in one each, and three studies not specifying a correlation type. Four studies
adjusted for either demographic or cancer-specific confounding variables (Croom, 2012;
Gould et al., 2010; van der Kloot et al., 2014; Wu et al., 2013), see Appendix 2.10.
Relationship of Illness Representations to Coping Behaviours: Quantitative Analysis

36
Table 2.1 shows that the relations between coherence, cyclical timeline,
consequences, emotional representations and avoidance/denial, and the relations between
identity, acute/chronic timeline and generic problem-focused coping, were subject to high
heterogeneity, with the remaining I2 values indicating moderate-low heterogeneity between
studies.
The majority of results from the meta-analyses between coping behaviours and illness
representations indicate small to moderate effects (Table 2.1, Forest plots in Appendix 2.11).
Cognitive reappraisal. The strongest correlate of cognitive reappraisal was personal
control, with higher levels of control associated with higher levels of cognitive reappraisal.
Other correlates included acute/chronic timeline, emotional representations, and treatment
control.
Avoidance/denial. The strongest correlate of avoidance/denial was emotional
representations, with higher levels of emotional representations associated with higher levels
of avoidance. The other key correlate of avoidance/denial was cyclical timeline.
Problem focused coping (generic). The strongest correlate of problem-focused
coping (generic) was personal control, with higher levels of control associated with higher
levels of problem-focused coping. The other key correlate of problem-focused coping
(generic) was consequences.
Publication bias: Funnel plots and fail-safe N.
Across all relationships between illness representations and coping behaviours, funnel
plots (Appendix 2.12) were generally symmetrical. Although some funnel plots were skewed,
it has been recommended that these plots be interpreted with caution, as any skew in the
funnel may be explained by considerable heterogeneity amongst studies, indicating that
publication bias is unlikely (Lau, Ioannidis, Terrin, Schmid, & Olkin, 2006). Fail-safe N was

37
Table 2.1
Meta-Analyses of the Relationships between Illness Representations and Coping Behaviours
Cognitive-Reappraisal Avoidance/Denial Problem-Focused-Coping-(Generic)
Illness-
Representation k N rz (95%CI) Nfs Q I2 k N rz (95%CI) Nfs Q I2 k N rz (95%CI) Nfs Q I2
Identity 4 351 .019
(-.141,
.179) 0 6.54 54.38 5 470 .022
(-.125,
.169) 0 10.15* 59.96 5 1008 .068
(-.092,
.229) 14 25.78*** 76.71
Cause 6 832 .075*
(.006,
.144) 2 4.02 <.01 4 1004 -.031
(-.093,
.031) 0 .15 <.01
Timeline-
(Acute/Chronic) 7 809 -.201**
(-.341,
-.062) 66 21.02** 72.67 9 1033 .049
(-.076,
.174) 0 28.55*** 73.86 8 1298 .026
(-.110,
.162) 0 30.90*** 78.73
Timeline-
(Cyclical) 6 650 .024
(-.064,
.111) 0 5.72 15.90 8 874 .217**
(.060,
.373) 94 31.34*** 80.20 7 1141 .054
(-.053,
.161) 4 15.25* 57.11
Consequences 7 732 -.036
(-.135,
.064) 0 10.78 40.16 8 879 .130
(-.010,
.270) 26 27.45*** 75.46 7 1151 .121*
(.013,
.229) 32 13.44* 58.01
Personal-Control 7 811 .287***
(.182,
.391) 151 12.21 51.35 10 1146 -.005
(-.082,
.072) 0 14.68 38.17 7 673 .286***
(.178,
.394) 128 11.62 47.58
Treatment-
Control 5 572 .183*
(.014,
.352) 27 13.46** 72.47 7 797 -.025
(-.126,
.075) 0 10.90 46.39 5 435 -.007
(-.194,
.179) 0 12.87* 72.70
Illness-Coherence 6 650 .104**
(.026,
.182) 10 5.22 .02 7 755 -.170
(-.382,
.042) 39 44.09*** 87.48 6 1029 .082*
(.002,
.163) 7 5.90 20.77
Emotional-
Representations 5 589
-
.190***
(-.272,
-.108) 34 3.98 .01 8 923 .240**
(.073,
.406) 121 41.06*** 83.75 6 1270 -.046
(-.160,
.069) 0 13.17* 68.04
Note. k = number of studies, N = total sample size across included studies, rz = effect size, (95%CI) = 95% confidence intervals around the effect size, Nfs = Rosenthal’s fail-safe N (measure of publication bias),
Q = measure of heterogeneity (suggests heterogeneity when statistically significant), I2 = measure of heterogeneity (25% = low, 50% = moderate, 75% = high)
*p < .05, **p < .01, ***p < .001

38
found to range from zero to 151 across the relationships between illness representations and
coping behaviours (Table 2.1).
Relationship of Illness Representations to Illness Outcomes: Quantitative Analysis
High heterogeneity was observed in studies examining psychological distress and
emotional representations; role functioning and illness coherence; physical functioning and
identity, consequences, coherence, and emotional representations; and quality of life and
identity, treatment control, and illness coherence. Overall, there was a wide range of effect
sizes of the associations between illness outcomes and illness representations, from negligible
effects to very large effects (Tables 2.2, 2.3, and 2.4).
Anxiety. The strongest correlate of anxiety was emotional representations, with higher
emotional representations associated with higher anxiety. Other moderate-strong correlates
included consequences, identity, cyclical timeline, and acute/chronic timeline.
Depression. The strongest correlate of depression was emotional representations, with
higher emotional representations associated with more depression. Other moderate-strong
correlates included identity, consequences, cyclical timeline, treatment control, and
acute/chronic timeline. Table 2.2 contains the full set of analyses regarding anxiety and
depression; forest plots can be found in Appendix 2.11.
Psychological distress. Emotional representations were the highest correlate of
psychological distress, with higher emotional representations associated with more distress.
Other moderate to strong correlates included consequences, identity, cyclical timeline, and
acute/chronic timeline.
Psychological well-being. The strongest correlate of psychological well-being was
consequences, with less consequences associated with more psychological well-being. Table
2.3 contains all analyses regarding psychological distress and well-being; forest plots are
shown in Appendix 2.11.

39
Role functioning. The strongest correlate of role functioning was identity, with lower
identity scores (perceived cancer related symptoms) associated with better role functioning.
Other correlates included emotional representations, and consequences.
Physical functioning. The strongest correlate of physical functioning was identity,
with lower identity scores associated with better physical functioning. Other correlates
included consequences, emotional representations, acute/chronic timeline, and treatment
control.
Quality of life. The strongest correlate of quality of life was identity, with lower
identity scores associated with better quality of life. Other moderate to strong correlates
included consequences, emotional representations, and acute/chronic timeline. Table 2.4
contains all analyses regarding role functioning, physical functioning, and quality of life;
forest plots are shown in Appendix 2.11.
Illness outcomes and publication bias: Funnel plots and fail-safe N.
Across the relationships, funnel plots (Appendix 2.12) were generally symmetrical,
although this was difficult to assess in plots with small numbers of studies. The number of
studies that fell outside the funnel generally varied between none and three, with one plot
displaying four points outside the funnel (psychological distress and illness coherence).
Across the relationships between illness representations and illness outcomes the fail-safe N
ranged from zero to 3975. The two relationships with a fail-safe N of zero (illness coherence
and physical functioning; illness coherence and quality of life) both also had high
heterogeneity, suggesting the presence of moderators (Card, 2012).
Moderator Analyses
Study-level moderators.
We examined whether research design (cross-sectional versus longitudinal) affected
the effect sizes (correlations between illness representations and coping as well as outcomes)
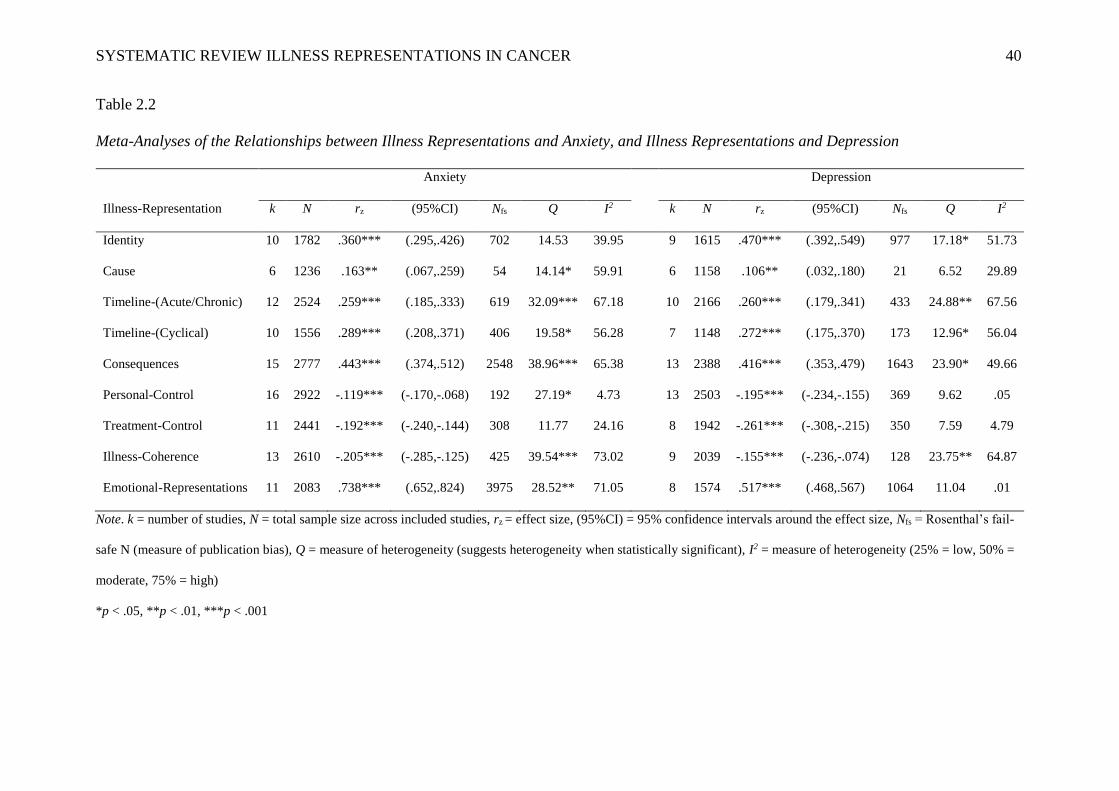
SYSTEMATIC REVIEW ILLNESS REPRESENTATIONS IN CANCER 40
Table 2.2
Meta-Analyses of the Relationships between Illness Representations and Anxiety, and Illness Representations and Depression
Anxiety Depression
Illness-Representation k N rz (95%CI) Nfs Q I2 k N rz (95%CI) Nfs Q I2
Identity 10 1782 .360*** (.295,.426) 702 14.53 39.95 9 1615 .470*** (.392,.549) 977 17.18* 51.73
Cause 6 1236 .163** (.067,.259) 54 14.14* 59.91 6 1158 .106** (.032,.180) 21 6.52 29.89
Timeline-(Acute/Chronic) 12 2524 .259*** (.185,.333) 619 32.09*** 67.18 10 2166 .260*** (.179,.341) 433 24.88** 67.56
Timeline-(Cyclical) 10 1556 .289*** (.208,.371) 406 19.58* 56.28 7 1148 .272*** (.175,.370) 173 12.96* 56.04
Consequences 15 2777 .443*** (.374,.512) 2548 38.96*** 65.38 13 2388 .416*** (.353,.479) 1643 23.90* 49.66
Personal-Control 16 2922 -.119*** (-.170,-.068) 192 27.19* 4.73 13 2503 -.195*** (-.234,-.155) 369 9.62 .05
Treatment-Control 11 2441 -.192*** (-.240,-.144) 308 11.77 24.16 8 1942 -.261*** (-.308,-.215) 350 7.59 4.79
Illness-Coherence 13 2610 -.205*** (-.285,-.125) 425 39.54*** 73.02 9 2039 -.155*** (-.236,-.074) 128 23.75** 64.87
Emotional-Representations 11 2083 .738*** (.652,.824) 3975 28.52** 71.05 8 1574 .517*** (.468,.567) 1064 11.04 .01
Note. k = number of studies, N = total sample size across included studies, rz = effect size, (95%CI) = 95% confidence intervals around the effect size, Nfs = Rosenthal’s fail-
safe N (measure of publication bias), Q = measure of heterogeneity (suggests heterogeneity when statistically significant), I2 = measure of heterogeneity (25% = low, 50% =
moderate, 75% = high)
*p < .05, **p < .01, ***p < .001

SYSTEMATIC REVIEW ILLNESS REPRESENTATIONS IN CANCER 41
Table 2.3
Meta-Analyses of the Relationships between Illness Representations and Psychological Distress, and Consequences and Psychological Well-
being
Psychological-Distress Psychological-Well-Being
Illness-Representation k N rz (95%CI) Nfs Q I2 k N rz (95%CI) Nfs Q I2
Identity 8 1555 .354*** (.268,.441) 471 15.74* 58.37
Cause 6 1030 .174*** (.086,.261) 61 9.81 47.92
Timeline-(Acute/Chronic) 8 1692 .185*** (.137,.233) 140 8.75 .01
Timeline-(Cyclical) 5 735 .249*** (.103,.395) 69 11.34* 71.40
Consequences 11 2287 .377*** (.336,.418) 1127 10.84 .01 4 956 -.355*** (-.419,-.291) 135 2.71 .01
Personal-Control 9 1921 -.091** (-.158,-.023) 35 15.56* 48.02
Treatment-Control 9 1908 -.130*** (-.205,-.055) 88 18.31* 57.83
Illness-Coherence 9 1979 -.172*** (-.266,-.078) 146 29.45*** 74.61
Emotional-Representations 9 2003 .596*** (.496,.696) 2010 34.30** 77.50
Note. k = number of studies, N = total sample size across included studies, rz = effect size, (95%CI) = 95% confidence intervals around the effect size, Nfs = Rosenthal’s fail-
safe N (measure of publication bias), Q = measure of heterogeneity (suggests heterogeneity when statistically significant), I2 = measure of heterogeneity (25% = low, 50% =
moderate, 75% = high)
*p < .05, **p < .01, ***p < .001

42
Table 2.4
Meta-Analyses of the Relationships between Illness Representations and Role Functioning, Illness Representations and Physical Functioning, and Illness
Representations and Quality of Life
Role-Functioning Physical-Functioning Quality-of-Life
Illness-Representation k N rz (95%CI) Nfs Q I2 k N rz (95%CI) Nfs Q I2 k N rz (95%CI) Nfs Q I2
Identity 4 1124 -.309*** (-.384,-.235) 136 3.56 28.14 4 1171 -.505*** (-.676,-.335) 350 19.57*** 86.94 6 1289 -.607*** (-.772,-.443) 808 31.04*** 86.22
Cause
Timeline-(Acute/Chronic) 4 1104 -.108*** (-.167,-.049) 11 .60 <.01 6 1323 -.265*** (-.378,-.152) 164 15.01* 72.11 8 1478 -.176*** (-.241,-.112) 97 7.13 24.95
Timeline-(Cyclical) 4 439 -.347*** (-.442,-.252) 74 1.44 <.01
Consequences 7 1689 -.184*** (-.272,-.096) 133 18.17** 65.58 8 1693 -.367*** (-.481,-.253) 595 28.10*** 79.30 8 1621 -.445*** (-.530,-.360) 800 16.61* 58.80
Personal-Control 6 1462 .072** (.021,.124) 5 8.50 .01 6 1334 .118** (.042,.194) 32 8.43 39.89 8 1509 .122** (.042,.203) 50 13.92 50.91
Treatment-Control 5 1320 .088** (.034,.143) 10 1.91 <.01 5 1244 .178*** (.078,.277) 63 9.59* 62.27 7 1337 .130* (.007,.254) 63 22.64*** 75.83
Illness-Coherence 5 1346 -.069 (-.269,.132) 10 56.94*** 91.88 5 1232 -.006 (-.179,.167) 0 38.13*** 87.20 6 1296 .043 (-.182,.267) 0 85.81*** 92.84
Emotional-Representations 4 1132 -.292*** (-.350,-.233) 116 3.51 .09 7 1637 -.205*** (-.312,-.099) 176 19.73** 75.80 7 1539 -.426*** (-.501,-.351) 592 9.89 44.93
Note. k = number of studies, N = total sample size across included studies, rz = effect size, (95%CI) = 95% confidence intervals around the effect size, Nfs = Rosenthal’s fail-safe N (measure of publication
bias), Q = measure of heterogeneity (suggests heterogeneity when statistically significant), I2 = measure of heterogeneity (25% = low, 50% = moderate, 75% = high)
*p < .05, **p < .01, ***p < .001

43
in random-effects meta-regressions. Most meta-regressions indicated non-significant and
negligible moderator effects of study design. However, relationships between depression and
identity (B = -.15), acute/chronic timeline (B = -.18), and consequences (B = -.15) were
significantly smaller in longitudinal studies. The same pattern of significantly smaller effect
sizes in longitudinal studies was also found for the relationships between psychological
distress and emotional representations (B = -.29) as well as treatment control (B = .16; note
that the pooled correlation in this case was negative, thus the positive B indicates smaller
effects), and between anxiety and acute/chronic timeline (B = -.17). Overall, though smaller
in effect, these findings suggest that relationships between illness representations, illness
outcomes and coping behaviours were mostly stable overtime.
Relationship of Illness Representations to Coping Behaviours: Narrative Review
A narrative review was conducted for the 16 studies where data required for
quantitative meta-analysis could not be obtained (see Appendix 2.8 for a summary of study
characteristics). There were five studies (Grande, Arnott, Brundle, & Pilling, 2014; Grande,
Myers, & Sutton, 2006; Iskandarsyah, Klerk, Suardi, Sadarjoen, & Passchier, 2014; Landers,
McCarthy, Livingstone, & Savage, 2014; Llewellyn, McGurk, & Weinman, 2007a) that
examined coping behaviours, four of which (Grande et al., 2014; Grande et al., 2006;
Iskandarsyah et al., 2014; Landers et al., 2014) focused on problem-focused coping via
specific behaviours. The results of these studies are in line with the meta-analysis findings,
with higher personal control associated with positive outcomes from participating in a cancer
community support group (Grande et al., 2006), particularly in combination with higher
emotional representations (Grande et al., 2014; Grande et al., 2006). More mixed results
emerged for illness representations capturing negative consequences of illness; with higher
identity scores and cyclical timeline related to better medication adherence (Landers et al.,
2014), while women with more negative illness representations (or a more negative view of

44
their breast cancer) were more likely to miss treatment sessions (Iskandarsyah et al., 2014).
This mixed pattern is perhaps most evident in (Llewellyn et al., 2007a), where several coping
strategies were associated with each illness representation, for example higher perceived
consequences of cancer and lower levels of illness coherence (understanding) were associated
with higher levels of avoidance coping.
Relationship of Illness Representations to Illness Outcomes: Narrative Review
Eleven of the 16 studies not included in the meta-analysis examined illness outcomes
(Cook et al., 2015b; Cooper, Hankins, Rixon, Eaton, & Grunfeld, 2013; Dempster et al.,
2011; Giannousi, Manaras, Georgoulias, & Samonis, 2010; Gray et al., 2014; Gray et al.,
2011; Jørgensen, Frederiksen, Boesen, Elsass, & Johansen, 2009; Mickevičiene, Vanagas,
Jievaltas, & Ulys, 2013; Millar, Purushotham, McLatchie, George, & Murray, 2005; Scharloo
et al., 2005; Traeger et al., 2013), along with one study examining both illness outcomes and
coping behaviours (Llewellyn et al., 2007a). These findings were also largely in line with the
results of the quantitative meta-analysis. Poor role functioning was associated with a
perception of more negative consequences of cancer, less perceived personal control over
cancer, and more perceived cancer symptoms (Cooper et al., 2013; Scharloo et al., 2005).
Higher levels of anxiety were associated with less perceived personal and treatment control
over cancer, a greater emotional impact of cancer (higher emotional representations), and
more severe consequences of cancer (Cook et al., 2015b; Dempster et al., 2011; Gray et al.,
2014). Similarly, higher levels of depression were associated with less perceived personal and
treatment control over cancer, a greater emotional impact of cancer, more severe
consequences of cancer, as well as a more chronic perceived timeline of cancer (Dempster et
al., 2011; Giannousi et al., 2010; Gray et al., 2014; Llewellyn et al., 2007a). As expected,
higher levels of psychological distress were also associated with a greater emotional impact
of cancer, more severe consequences of cancer, a more chronic perceived timeline of cancer,

45
as well as more perceived cancer symptoms (Jørgensen et al., 2009; Mickevičiene et al.,
2013; Millar et al., 2005). Finally, a better quality of life was associated with less perceived
cancer symptoms, a less cyclical timeline, less severe consequences of cancer, less emotional
impact of cancer, and greater perceived personal and treatment control over cancer (Gray et
al., 2011; Jørgensen et al., 2009; Mickevičiene et al., 2013; Scharloo et al., 2005).
Discussion
This systematic review and meta-analysis aimed to determine whether and how
coping behaviours and illness outcomes in cancer are associated with illness representations
in the Common Sense Model (CSM; Leventhal et al., 1980). The findings were generally
consistent with our hypotheses and provided support for associations between the illness
representation dimensions of the CSM, coping behaviours, and illness outcomes in cancer.
The findings broadly replicated the patterns of associations between illness representations,
coping, and illness outcomes in chronic illness (Hagger & Orbell, 2003), but add a specific
cancer perspective, longitudinal data, and a narrative review of relevant studies. These
findings have particular implications for the content of illness representation based
interventions (Stanton, Luecken, MacKinnon, & Thompson, 2013).
Regarding coping behaviours, personal control perceptions appear to be the most
promising areas to target to improve adaptive coping responses (cognitive reappraisal and
problem-focused coping). In addition, emotional representations were associated with
avoidance/denial coping behaviours. These findings are in line with Lazarus’s general coping
theory (Lazarus, 1993), as perceptions of control have been identified as preconditions for
effective problem-focused coping, whereas emotional representations might foster emotion-
focused coping responses to the cancer experience; as outlined in the parallel processing
structure of the CSM. However, it is important to note that normative classifications of
coping as adaptive or maladaptive are difficult, as factors such as cancer stage, time since

46
diagnosis, and outcome of the coping behaviour, can influence whether a coping strategy
(such as avoidance/denial) would be considered adaptive or maladaptive (Salander &
Windahl, 1999).
Regarding illness outcomes, higher levels of identity (perceived symptoms) and
consequence perceptions were associated with higher levels of psychological distress, and
lower levels of functioning and quality of life. Higher levels of control-related illness
perceptions were associated with lower levels of distress and higher levels of functioning and
quality of life. The findings for illness coherence had high heterogeneity, suggesting the
relationships between coherence and illness outcomes may have been influenced by a
moderator, such as treatment type. For example, an examination of the raw data suggested
that those without an ostomy who had higher levels of illness coherence experienced better
quality of life, physical and role functioning (better understanding is associated with better
illness outcomes for people without an ostomy). In contrast, those with an ostomy and higher
levels of illness coherence experienced poorer quality of life, physical and role functioning
(better understanding is associated with worse illness outcomes for people with an ostomy)
(Mols et al., 2014).
In general, the relationship between illness representations and coping behaviours
were not as strong as those between illness representations and illness outcomes. This may be
due to the fact that there were fewer studies examining coping behaviours than illness
outcomes, so there was less power to detect effects (Cafri, Kromrey, & Brannick, 2010).
Another explanation may be a potential overlap between illness representations and illness
outcomes (e.g., consequences and quality of life or emotional representations and
psychological distress). Further, as many studies were cross-sectional, emotional
representations were likely to be highly correlated with measures of psychological distress.
Finally, the level of specificity of the measures may influence the strength of these

47
relationships, in that illness outcomes (as more general evaluations of health status) may be
more likely to correlate with illness representations than specific coping behaviours.
Implications and Future Research Directions
For many people a cancer diagnosis is associated with acute and/or delayed emotional
distress, clinical levels of depression and anxiety, poor role and physical functioning, and a
poor quality of life (e.g., Bultz & Holland, 2006; Carlson et al., 2004; Croom et al., 2013;
Edwards & Clarke, 2004). Some cancer survivors experience poor mental and physical health
outcomes for up to ten years post diagnosis (Harrington et al., 2010). Further, coping with
cancer is extremely complex (Parle, Jones, & Maguire, 1996), with maladaptive coping
strategies such as avoidance or denial likely to lead to higher levels of worry, anxiety, and
depression (Deimling et al., 2006). The current systematic review suggests that in order to
foster coping behaviours and improve mental health outcomes it may be beneficial for
interventions to target patients’ maladaptive or unrealistic illness representations. It has been
shown that mapping and challenging maladaptive illness representations, while at the same
time forming alternative representations, can change both illness representations and role
functioning, leading to improved psychosocial outcomes (Siemonsma et al., 2013). These
findings are promising, and illness representations have been suggested as mediators of
psychosocial intervention effects (Stanton et al., 2013). However, few intervention studies
exist and none specifically target people with cancer or provide an explicit rationale for
which illness representations to target.
The present review provides some suggestions for which illness representations might
be best to target in interventions, though the cross-sectional nature of the majority of included
studies precludes judgments regarding causality and suggestions must be considered with
caution. Interventions that target perceptions of personal control may be useful to increase
use of adaptive coping strategies such as cognitive reappraisal, and reduce maladaptive

48
coping strategies such as avoidance/denial. Further, interventions that aim to adapt timeline
perceptions to be less cyclical and chronic, decrease perceptions of the severity of cancer, and
decrease the perceived emotional impact of cancer, may reduce psychological distress, and
improve role functioning, physical functioning, and quality of life.
In interventions targeting illness representations, it is important to acknowledge that
some perceptions about poor illness outcomes may be realistic; for a person with terminal
cancer, representations of a chronic timeline, severe consequences, and less personal control
may be justified. In these cases interventions could better target illness representations such
as emotional representations and coping. Future research should examine how stage of illness
influences illness representations, and what type of interventions would be best for cancer
patients at early versus advanced stages.
Strengths and Limitations
Although the CSM has been used extensively to examine health and coping outcomes,
the present systematic review is the first to assess illness representations with health and
coping outcomes in people with cancer specifically, with the results helping to guide
intervention development, particularly by deepening understanding of the nature of cognitive
responses associated with the cancer experience. A further strength is the inclusion of a
number of unpublished correlations obtained from authors, creating a comprehensive meta-
analysis.
The present review has some limitations, including the potential for publication bias,
missing correlational data, and the examination of cross-sectional and correlational data. To
control for publication bias a random-effects model was used (Cafri et al., 2010). Although
the focus on quantitative data may have potentially impacted on the results of the meta-
analysis, the inclusion of the narrative review and synthesis aimed to avoid missing relevant
or contrasting findings. In addition, an assessment of included studies suggested a low risk of

49
bias at the study level. However, as the majority of studies used cross-sectional study designs
and correlational analyses, judgements regarding causality or predictive relationships
between variables are precluded, limiting the conclusions to be drawn from this review.
Further, zero-order correlations need to be interpreted with caution as it cannot be assumed
that observed associations will remain stable if other illness representations are accounted for
in multivariate analyses.
Another limitation is the potential for overlap between measures (i.e. illness
representations and illness outcomes). For example, items assessing emotional
representations and emotional distress may overlap, making these concepts difficult to
entangle. However, the CSM assumes these to be distinct processes, with Moss-Morris et al.
(2002) suggesting that emotional representations allow researchers to investigate both coping
behaviours and illness outcomes. The authors of the IPQ-R claim to have ensured that the
emotional representations concept was not simply a measure of general mood by ensuring
discriminant validity with both positive and negative affect (Moss-Morris et al., 2002).
Consistent with recommendations by Weinman et al. (1996) and Moss-Morris et al.
(2002) that users adapt the IPQ and IPQ-R to be illness specific, over fifty percent of studies
included in the systematic review changed these to be ‘cancer specific’. Though each cancer
specific adaptation could influence the reliability and validity of generic versus specific
versions of the IPQ, this appears unlikely as the majority of changes involved simply
replacing wording (e.g., Corter et al., 2013), or adjusting the identity and causes subscales to
include items specifically related to cancer or a specific cancer type (e.g., Costanzo et al.,
2011; Freeman-Gibb, 2012).
Several fail-safe Ns of zero were found in analyses with small numbers of studies
included, suggesting a lack of statistical power (Card, 2012). However, as fail-safe N does
not take into account heterogeneity, this may be an artefact of the heterogeneous population

50
in the meta-analysis (i.e. differing cancer types, cancer stages, and treatment types) (Card,
2012). There was high heterogeneity found across several relationships in the meta-anlyses,
and psychological distress and adaptability to cancer varies greatly with different types of
cancer (Zabora & MacMurray, 2012) or cancer stages (Strada & Sourkes, 2010). However
few studies reported this information, precluding moderator analyses on these variables.
Similarly, treatment type or toxicity might also have impacted associations, with people at a
higher risk for psychological distress when receiving treatment other than surgery or having
little role in the treatment decision making process (Admiraal, Reyners, & Hoekstra-Weebers,
2013; Hack et al., 2010); but again there was insufficient data to allow moderator analyses, as
underpowered moderator tests may result in failure to detect the true effect of an important
moderator (Cafri et al., 2010).
Conclusions
This systematic review has provided support for the validity of the illness
representation construct in the CSM, and has summarised the associations between illness
representations, coping behaviours and illness outcomes in people with cancer. The review
found small to moderate relationships between illness representations and coping behaviours,
and moderate to large relationships between illness representations and illness outcomes.
These findings suggest that cognitive representations are key factors to understanding
individual responses to cancer.

51
Chapter 3
Study 2
Illness representations, coping, and illness outcomes in depression: A systematic review
and meta-analysis*
*Richardson, E. M., Schüz, N., Sanderson, K., Scott, J. L., Schüz. B. (2016). Illness
representations, coping, and illness outcomes in depression: A systematic review and meta-
analysis. Manuscript under review.

52
Abstract
Purpose: The Common Sense Model is the leading psychological model of behavioural self-
regulation in the face of illness, using subjective illness representations to explain how people
cope with illness. However, this model has rarely been examined in the context of mental
health. This review summarises associations between illness representations, health and
coping outcomes in people with depression.
Methods: A systematic literature search identified 19 out of a potential 1,008 studies, with 10
providing sufficient data for random-effects meta-analysis, and nine included in a narrative
review.
Results: Results found that more severe consequences were associated with more coping
efforts, while higher identity, consequences, emotional representations, a more chronic
timeline, and lower control were associated with more severe outcomes.
Conclusions: The illness representations identified seem to play an important role in
behavioural self-regulation of depression. This suggests targeting these illness representations
(in particular, identity, timeline, consequences, control, and emotional representations) in
psychosocial interventions to improve coping and reduce psychological distress.
Keywords: depression; illness perceptions; common sense model of illness representations;
systematic review; meta-analysis

53
Depression is a highly prevalent, disabling mental illness that is estimated to affect
over 350 million people worldwide (Marcus et al., 2012). Depression has been associated
with greater risk for physical disability (inability to perform activities due to impairment)
(Brenes et al., 2008; Lenze et al., 2001), poor psychosocial functioning (Wells & Sherbourne,
1999), and poor quality of life (Brenes, 2007; Wells & Sherbourne, 1999). A key factor in
both the etiology and treatment of depression are negative beliefs or schemas that lead to
negative thoughts that occur when faced with adverse life events, leading to negative or
depressed mood (A. T. Beck et al., 1979). These negative beliefs also influence how people
with depression think about their illness, which in turn influences whether and how people
cope with and manage depression, make treatment decisions, seek professional help, or
adhere to anti-depressant medication (Lynch, Kendrick, Moore, Johnston, & Smith, 2006;
Prins, Verhaak, Bensing, & van der Meer, 2008). These illness-related behaviours are
perhaps best understood in light of a theory that explicitly addresses how people make
decisions and cope with illness, which would suggest utilising theories from a Health
Psychology rather than a Clinical Psychology background.
In order to understand the idiosyncratic patterns of beliefs that determine how people
cope with their depression, the Common Sense Model of Self-Regulation of Health and
Illness (CSM; Leventhal et al., 1980) should be considered. This model has been used widely
to gain a systematic understanding of how people perceive chronic physical illnesses, and
how this relates to coping attempts and illness outcomes. In order to establish whether the
CSM might be a useful framework to inform Cognitive Behavioural Therapy (CBT; A. T.
Beck et al., 1979), the currently most used and best-evidenced psychotherapeutic intervention
for depression (Hofmann, Asnaani, Vonk, Sawyer, & Fang, 2012), our study aims to provide
a systematic overview of the associations between the concepts from this theory, coping, and

54
illness outcomes in people with depression1.
In CBT-based treatments for depression (A. T. Beck et al., 1979; J. S. Beck, 2011),
those thoughts and beliefs of a client (that are often negative or inaccurate) that contribute to
the experience of depression are targeted for modification in an attempt to create lasting
improved emotional and behavioural change. Here, negative automatic thoughts that lead to
depressive symptoms are challenged through reality-testing and generating alternatives. To
do this, the person with depression must first become familiar with their own negative
automatic thoughts and the role they play in influencing their emotions and behaviours. This
means that in order to treat depression successfully, both client and therapist need to find a
common ground in defining and understanding depression (e.g., Tryon & Winograd, 2011),
which underlines the importance of subjective illness concepts. This is where the Common
Sense Model could make an important contribution. The CSM has been used as a framework
with which to understand these cognitive processes in people with physical illnesses
(Leventhal et al., 1980). According to the CSM, individual representations of the illness and
associated emotional responses work in parallel to guide peoples’ coping responses, which
are later appraised in terms of their success or failure. Representations, coping, and appraisal
are part of a multi-directional and self-regulative feedback loop (Diefenbach & Leventhal,
1996) (Figure 3.1).
The key factors that explain why and how individuals cope with their illness are
subjective illness representations (or illness perceptions). These can be defined as
individuals’ common sense understanding of the illness (Leventhal et al., 1998; Leventhal et
al., 1980). Identity (“What defines whether I have this illness?”) refers to a person’s
associations with the label of the illness (e.g. “depression”) and which symptoms someone
1 Anxiety was also included in the systematic search process; however only one study including anxiety was
located and therefore it could not be examined in this review.

55
associated with this illness (e.g. fatigue). Cause refers to a person’s beliefs about the causes
of the illness (e.g. stress). Timeline refers to the perceived duration of the illness (e.g. acute or
chronic). Consequences (both imagined and real) refer to perceived beliefs about the effect of
the illness on an individual’s life (e.g. loss of social life). Curability or controllability refers
to people’s perceptions about whether the illness can be controlled or cured by themselves or
others (e.g. incurable but controllable with treatment) (Leventhal et al., 1998). Later revisions
of the framework proposed that control beliefs have two distinct dimensions - personal
control - the amount of control an individual perceives to have over the illness, and treatment
control - the amount of control the individual perceives their treatment has over the illness.
These revisions also included a distinct dimension for cyclical timeline perceptions, an illness
coherence subscale to assess perceptions of an individual’s understanding and comprehension
of the illness, and a separate emotional representations subscale to assess the individual’s
emotional response to the illness (Moss-Morris et al., 2002).
Figure 3.1. The common sense model of self-regulation of health and illness (Leventhal et
al., 1980), adapted from Diefenbach and Leventhal (1996).

56
Illness representations play a key role in how people respond to and experience their
illness. Systematic reviews on the CSM in physical illness (Hagger & Orbell, 2003) show that
perceiving an illness as highly symptomatic with a chronic timeline and serious consequences
is associated with maladaptive coping strategies such as denial, and negative illness outcomes
such as lower role functioning; while perceptions of the illness as curable and controllable
were associated with more adaptive coping strategies such as adherence to treatment, and
positive illness outcomes such as psychological well-being. Focusing on depression and
anxiety as illness outcomes, a recent review (Dempster et al., 2015) found very similar
patterns, with perceptions of more serious consequences and greater emotional
representations most strongly associated with higher levels of depression and anxiety. The
associations identified in both reviews highlight that it is crucial to gain an understanding of
individuals’ subjective illness representations. However, neither of these previous systematic
reviews took into account how these representations may be associated with coping
behaviours and illness outcomes in people with depression.
Although the CSM was originally designed in the context of physical illness, it has
also been successfully applied in mental illness (e.g., Akcakaya, 2012; Glattacker, Heyduck,
& Meffert, 2013). This is likely due to the fact that mental illnesses such as depression
require self-management and self-regulation, central components of the CSM. However,
these relationships may be complicated by potential reciprocity between illness perceptions
and depression, which may, for example, make it particularly difficult to disentangle
emotional representations of depression from emotional symptoms of the illness (Alderson et
al., 2012). Alderson et al. (2012) also note that depression illness perceptions might be more
complex than those in physical illness, with depression identity and timeline beliefs highly
idiosyncratic, and most participants perceiving complex multi-factor causes for their
depression. Further, influenced by depressive schemas, some people with depression might

57
perceive no control over their depression at all.
A recent review on illness perceptions in mental illness in general by Baines and
Wittkowski (2013) included a qualitative summary of four studies in people with depression.
This summary revealed that identity, timeline, personal control, and consequences, were
associated with depression severity; that identity, consequences, and control beliefs were
associated with the use of particular coping behaviours; and that control beliefs, timeline, and
causal beliefs were associated with medication adherence.
The CSM has led to an improved understanding of how people self-regulate their
behaviours when faced with physical illness (Dempster et al., 2015; Hagger & Orbell, 2003).
However, although two systematic reviews on CSM-based illness representations in mental
illness exist (Alderson et al., 2012; Baines & Wittkowski, 2013), no previous review has
quantitatively summarised and reviewed the evidence on the relationships between illness
representations, coping behaviours, and illness outcomes in people with depression
specifically. This might have particular implications for CBT-based treatments for
depression: Although CBT has been shown to be effective at changing specific underlying
beliefs found in depression (Hollon, Stewart, & Strunk, 2005), therapeutic interventions
could be better targeted to illness-based cognitions. If we are able to identify a common
pattern of beliefs that lead people with depression to engage in effective and adaptive
behaviours, then specifically designed targeted CBT programs incorporating appropriate
aspects of the CSM that aim to improve coping and reduce negative outcomes can be
designed and implemented. The present review aims to synthesise the research that examines
how such beliefs are related to coping and illness outcomes in order to provide appropriate
direction for the creation of such tailored interventions.
Method
Literature Search, Inclusion Criteria, and Study Selection

58
This systematic review followed PRISMA guidelines (Moher et al., 2009, Appendix
3.1). The following databases were searched: Scopus, Web of Science, PubMed, PsycINFO,
and Google Scholar. The keywords were: (anxiety OR "anxiety disorder*" OR depress* OR
"depress* disorder*") AND ("illness perception*" OR "illness representation*" OR "common
sense" OR Leventhal* OR IPQ*). See Appendix 3.2 for the full search strategy for each
database. Manual searches of reference lists of included articles were conducted to identify
additional studies for review, with attempts to locate missing data sets undertaken by
contacting relevant authors.
Inclusion criteria for studies in this review were: (a) used the Illness Perception
Questionnaire (IPQ; Weinman et al., 1996), the Revised IPQ (IPQ-R; Moss-Morris et al.,
2002), or the Brief IPQ (B-IPQBroadbent et al., 2006), (b) measured coping behaviours or
illness outcomes, (c) adult participants (over 18 years) with a diagnosis of depression or
anxiety, (d) was written in English or German.
Following database screening, 2098 articles were identified, with 1008 articles
remaining following duplicate removal. Of these, 965 studies were removed for not meeting
inclusion criteria. Inter-rater agreement between two authors during abstract screening was
68.63% (Cohen’s Kappa = .69). Full texts were retrieved of the remaining 43 articles, with a
further 26 excluded. Two additional studies were found and included following a manual
search of the reference lists, which left 19 studies for coding (manual and coding sheet in
Appendix 3.3 and 3.4). Ten studies provided appropriate and relevant statistical data and
could be included in the meta-analysis (Akcakaya, 2012; Baines, Wittkowski, & Wieck,
2013; C. Brown et al., 2001; Cabassa, Lagomasino, Dwight-Johnson, Hansen, & Xie, 2008;
Fortune, Barrowclough, & Lobban, 2004; Glattacker et al., 2013; Horn, Kneisler, Schuster, &
Traue, 2010; Houle et al., 2013; Lu et al., 2014; Vollmann et al., 2010), with the remaining
nine studies subject to a narrative review (C. Brown et al., 2007; Elwy et al., 2016; Elwy et

59
al., 2011; Hunot, Horne, Leese, & Churchill, 2007; Kelly, Sereika, Battista, & Brown, 2007;
Mc Sharry et al., 2013; O'Mahen, Flynn, Chermack, & Marcus, 2009; Patel, Wittkowski,
Fox, & Wieck, 2013; E. C. Ward, Mengesha, & Issa, 2014). A flow chart of the study
selection process is displayed in Figure 3.2. See Table 3.1 for a summary of key
characteristics of the studies.
Coding of Coping Behaviours and Illness Outcomes
The coping behaviours included in the articles reviewed were categorised into logical
subsets using categories adapted from Hagger and Orbell (2003), with seven categories
identified: expressing emotion, avoidance/denial, problem-focused coping (generic),
treatment decision making, medication adherence, seeking social support, and other
(specified) coping behaviour. Due to small cell sizes (most of these coping categories were
only populated by one study), these categories were collapsed into one ‘coping’ scale which
measured the extent to which participants used or did not use the above specified coping
behaviours.
Illness outcomes were also classified using adapted and extended categories identified
by Hagger and Orbell (2003), resulting in nine categories: affect (positive), anxiety,
depression (severity), psychological distress, psychological well-being, vitality, role
functioning, physical functioning, other illness outcome (general health). Similar to the
classification of coping behaviours, small cell sizes prevented an analysis of distinct
categories, and analogous to Hagger and Orbell (2003), affect, anxiety, depression,
psychological distress, and psychological well-being were collapsed into one ‘psychological
distress’ dimension. Although it may seem circular to examine psychological distress when
our population of interest is people with depression, some illness representations are
associated with less psychological distress (e.g., control perceptions), suggesting that this
relationship is of practical importance.

60
Figure 3.2. Flow chart of the study selection process.
Records identified through
database searching
(n = 2098)
Records after duplicates removed
(n = 1008)
Titles screened
(n = 1008)
Titles excluded
(n = 852)
Abstract screened
(n = 156)
Abstracts excluded
(n = 113)
Full-text articles
assessed for eligibility
(n = 43)
Full text-articles
excluded, with reasons
(n = 26)
Studies included in
qualitative synthesis
(n = 19)
Studies included in
quantitative synthesis
(meta-analysis)
(n = 10)
Additional records identified
through other sources
(n = 2)

61
Table 3.1
Data Extraction and Study Characteristics
Authors (Date) Depression
or Anxiety
Sample Size
(Completed all
Time Points)
Sex (T1) Age (T1) Study Design IPQ Type Coping Behaviour Illness Outcome Relevant Results
Akcakaya (2012) Depression 112 60% Male M = 59, SD = 10.3, Range =
30 - 81
Longitudinal
IPQ-R: Timeline - Acute/Chronic, Timeline -
Cyclical, Consequences, Personal
Control, Treatment Control, Illness Coherence, Emotional
Representations
Depression
(Severity), Anxiety
Consequences, timeline (acute/chronic), and emotional representations were
significantly related to depression
severity, while only emotional representations were significantly
related to anxiety.
Baines, Wittkowski, &
Wieck (2013)
Depression
(Postpartum) 43 100% Female
M = 29.36,
SD = 5.79,
Range = 18 - 40
Longitudinal
IPQ-R: Identity, Cause, Timeline - Acute/Chronic, Timeline -
Cyclical, Consequences, Personal
Control, Treatment Control, Illness Coherence, Emotional
Representations
Depression
(Symptom Severity)
More perceived symptoms (higher identity scores), a more chronic
timeline, less perceived personal
control, and higher rates of emotional distress, were significantly related to
depression symptom severity.
Brown, Battista, Sereika,
Bruehlman, Dunbar-
Jacob, & Thase (2007)
Depression 191 70.68% Male M = 45.1, SD
= 15.9 Cross-sectional IPQ
Multiple - e.g., Expressing Emotion,
Cognitive Reappraisal,
Avoidance/Denial, Other
Multiple - e.g.,
Depression,
Physical
Functioning
Illness representations associated with
psychosocial functioning included
perceived control, perceived duration, and perceived cause of depressive
symptoms. Several coping behaviours
(e.g., expressing emotion, cognitive reappraisal, avoidance/denial) mediated
or moderated the relationship between
illness representations and psychosocial functioning.
Brown, Dunbar-Jacob, Palenchar, Kelleher,
Bruehlman, Sereika, &
Thase (2001)
Depression 41 66% Female M = 43, SD =
15.7 Cross-sectional
IPQ: Identity, Cause, Timeline,
Consequences, Controllability,
Expressing Emotion, Avoidance/Denial,
Problem-Focused Coping Generic (x2),
Other Coping
Behaviour (x2) (Self-
Blame, Religion),
Medication Adherence
Perceived negative consequences for
depression were associated with more
active coping, religious coping, and self-blame, while perception of
depressive symptoms as more chronic
was associated with less planning. Perception of more depressive
symptoms (increased identity) was
associated with more self-blame, avoidance, and venting.
Cabassa, Lagomasino,
Dwight-Johnson,
Hansen, & Xie (2008)
Depression 339 83.78% Female
M = 49.73, SD = 12.53
Cross-sectional
IPQ-R: Timeline -
Acute/Chronic, Timeline - Cyclical, Consequences, Personal
Control, Treatment Control
Depression (Symptom Severity)
Perceptions of a more chronic timeline
was significantly related to greater depression symptom severity, while
perceptions of a less cyclical timeline
were related to greater depression symptom severity (though not
significantly).
Elwy, Glickman, Bokhour, Dell, Mueller,
Zhao, Osei-Bonsu,
Rodrigues, Coldwell, Ngo, Schlosser,
Vielhauer, Pirraglia, &
Eisen (2013)
Depression 271 93.3% Male Range = 20 -
71+ Longitudinal
IPQ-R: Identity, Cause, Timeline - Acute Timeline - Chronic,
Timeline - Cyclical,
Consequences, Personal Control, Treatment Control, External
Control Illness Coherence,
Emotional Representations
Treatment Decision
Making
Veterans perceptions of their
symptoms, cause, timeline (cyclical),
and personal controllability, predicted receiving guideline-concordant
treatment for depression.

62
Elwy, Yeh, Worcester,
& Eisen (2011) Depression 30 53.33% Male
M = 44,
Range = 20 - 61
Qualitative IPQ-R Treatment Decision
Making
Those who sought treatment for
depression had a better understanding of depression (illness coherence),
perceived treatment would control their
depression, and that there would be negative consequences if they did
nothing. In contrast, those who did not
seek treatment perceived that treatment would not control their depression, that
the depression would be short-term, and
that depression did not affect their everyday life.
Fortune, Barrowclough,
& Lobban (2004) Depression 101 100% Female
M = 33, SD =
5.5 Cross-sectional
IPQ: Identity, Cause, Timeline,
Consequences, Control/Cure Depression
(Severity)
Depression severity was significantly
related to perception of more symptoms (identity), a more chronic timeline,
more severe consequences, and less
perceived personal control.
Glattacker, Heyduck, & Meffert (2013)
Depression 80 74% Female M = 48.5, SD = 9.5
Longitudinal
IPQ-R: Identity, Timeline -
Acute/Chronic, Timeline -
Cyclical, Consequences, Personal Control, Treatment Control,
Illness Coherence, Emotional
Representations
Physical
Functioning (x2) (Pain), Role
Functioning (x3)
(Physical, Emotional, Social),
Other Illness
Outcome (Self-Rated General
Health), Vitality,
Psychological Well-Being, Depression
(Symptom Severity)
Illness perceptions were related to functioning. The strongest predictors of
functioning were generally identity,
consequences, and timeline (acute/chronic).
Horn, Kneisler, Schuster, & Traue
(2010)
Depression 59 69.49%
Female
M = 46, SD = 8.7, Range =
25 - 62
Longitudinal
IPQ-R: Cause, Timeline - Acute/Chronic, Timeline -
Cyclical, Consequences, Personal
Control, Treatment Control, Illness Coherence, Emotional
Representations
Depression
(Symptom
Severity), Affect (Positive)
Perceptions of a more cyclical timeline,
more severe consequences, and stronger emotional representations were
associated with increased depression
symptom severity, while perceptions of a more chronic timeline, more severe
consequences, stronger emotional
representations, less personal control, and less illness coherence were
associated with decreased positive
affect.
Houle, Villaggi,
Beaulieu, Lespérance,
Rondeau, & Lambert (2013)
Depression 88 53.4% Male M = 42, SD =
12.2 Cross-sectional
IPQ-R: Cause, Timeline - Acute/Chronic, Timeline -
Cyclical, Consequences, Personal
Control, Treatment Control, Illness Coherence, Emotional
Representations
Treatment Decision
Making (x3) (Antidepressant
Acceptability,
Psychotherapy Acceptability,
Psychotherapy
Preference)
A perceived chronic timeline of
depression was associated with preference for psychotherapy treatment,
higher levels of treatment control was
associated with higher levels of
antidepressant acceptability, and a
perception of more severe
consequences of depression was associated with higher levels of
psychotherapy acceptability.

63 Hunot, Horne, Leese, &
Churchill (2007)
Depression
and Anxiety 147 75% Female
M = 40.1, SD
= 12.6 Longitudinal IPQ-R Medication Adherence Illness perceptions were not associated
with antidepressant adherence.
Kelly, Sereika, Battista,
& Brown (2007) Depression 189
70.4%
Female
M = 45.19,
SD = 15.91,
Range = 18 - 87
Cross-sectional IPQ: Identity, Cause, Timeline, Consequences, Control/Cure,
Emotional Reactions
Multiple - e.g., Expressing Emotion,
Cognitive Reappraisal,
Avoidance/Denial, Treatment Decision
Making, Other
Greater emotional reactions to
depression were associated with
maladaptive coping for both men and women, while greater perceived control
over depression was associated with
more adaptive coping strategies for women.
Lu, Tang, Shan Liow,
Wei Ni Ng, Su Hui Ho,
& Chun Mun Ho (2014)
Depression 110 54% Female
M = 41.7, SD
= 12.3, Range
= 19 - 67
Cross-sectional
IPQ-R: Identity, Timeline -
Acute/Chronic, Timeline -
Cyclical, Consequences, Personal Control, Treatment Control,
Illness Coherence, Emotional
Representations
Cognitive Reappraisal
(Adaptive
Rumination), Other Coping Behaviour
(Maladaptive
Rumination)
Depression,
Anxiety,
Psychological Distress (x2)
(Stress, Negative
Emotions)
Perceived chronic timeline, more severe consequences, less perceived personal
control, and stronger emotional
representations were associated with
severity of depression, anxiety, stress,
and negative emotions (psychological distress). Adaptive rumination was
most strongly related to perceptions of
a less chronic timeline, while maladaptive rumination was most
strongly related to a perception of more
severe consequences.
Mc Sharry, Bishop,
Moss-Morris, & Kendrick (2013)
Depression 17 52.9%
Female
Range = 31 -
78 Qualitative CSM Generally No specific DV No specific DV
Diabetes and depression representations
varied for those who saw interactions between conditions (e.g. in terms of
causation), and those who saw their
conditions as unrelated. Problems with medication adherence were frequently
described, often with respect to the
difficulty of living with multimorbid conditions.
O'Mahen, Flynn,
Chermack, & Marcus
(2009)
Depression (Perinatal)
82 100% Female
M = 30.02,
SD = 4.9, Range = 19 -
39
Longitudinal IPQ: Cause, Timeline, Consequences, Control/Cure
Other Coping
Behaviour (Treatment
Use)
Beliefs in a more chronic timeline for
depression symptoms significantly
predicted treatment use.
Patel, Wittkowski, Fox,
& Wieck (2013)
Depression
(Postnatal) 11 100% Female
M = 29.4,
Range = 22 - 35
Qualitative CSM Generally No specific DV No specific DV
Although participants identified with PND, the CSM dimensions did not map
onto the key themes identified - which
were more related to self-worth.
Vollmann, Scharloo,
Salewski, Dienst, Schonauer, & Renner
(2010)
Depression 41 56.10% Female
M = 49.56,
SD = 10.40, Range = 17 -
67
Cross-sectional
IPQ-R: Identity, Cause, Timeline
- Acute/Chronic, Timeline -
Cyclical, Consequences, Personal Control, Treatment Control,
Illness Coherence, Emotional
Representations
Social Support (x5)
Activation-oriented support was regarded as more helpful when people
perceived depression as less chronic, as
more controllable by treatment, and as caused by immunity malfunction.
Ward, Mengesha, & Issa
(2014) Depression 13 100% Female
M = 71,
Range = 60 - 78
Qualitative CSM Generally No specific DV No specific DV
Women generally believed that
depression was a normal reaction to life
circumstances and that culturally sanctioned coping behaviours (e.g.
religion and resilience) were appropriate. These factors may provide
a barrier for seeking professional
mental health care.

64
Data Extraction and Meta-Analytic Strategy
From all articles included in the systematic review, authors and date of publication,
depression type, sample characteristics (sex and age), study design, IPQ version and
subscales, coping behaviours, illness outcomes, and a summary of relevant results were
extracted (Table 3.1).
Zero-order correlations were the most frequently reported effect size in the included
studies. Thus the average correlation coefficient weighted by sample size and calculated
using Fischer’s Z transformations (rz). Where necessary, correlations were reversed to
maintain consistency across studies (i.e., correlations with psychological well-being were
reversed). If more than one measure was used by a single study to assess an outcome within
the same category (e.g., emotional social support and informational social support), the
average weighted correlation coefficient was calculated and used in order to avoid bias.
Further, to minimise heterogeneity due to design, only the baseline (Time 1) result was used
for longitudinal studies that measured an outcome at more than one time point. Eight authors
were contacted to provide correlations not reported in the articles, with responses from four
authors received, and three authors able to provide the relevant data required for meta-
analysis. The remaining articles were included in a narrative review.
The meta-analyses were conducted in R (R Core Team, 2014) using the ‘metafor’
package (Viechtbauer, 2010). A random-effects meta-analysis was conducted, which allows
for the assumption that the true effect size (the effect size in the underlying population of
studies) may vary from study to study as a result of heterogeneity (Borenstein et al., 2010).
The studies were likely to be heterogeneous in the present meta-analysis because of differing
design, depression types, treatment types, and other sampling characteristics.
To assess heterogeneity between studies, Q and I2 statistics were calculated. The Q
statistic assesses the ratio of the variation in the observed effects to the within-study error,

65
suggesting heterogeneity when statistically significant (Huedo-Medina, Sanchez-Meca,
Marin-Martinez, & Botella, 2006). The I2 statistic indicates the percentage of variance across
studies that can be attributed to heterogeneity rather than chance, with increasing values
representing increasing heterogeneity. While the I2 statistic gives an indication of the extent
of true heterogeneity, the Q statistic provides only an indication of statistical significance. An
I2 value of 25% is considered low, 50% considered moderate, and 75% considered high
(Higgins, Thompson, Deeks, & Altman, 2003).
Results
Study Characteristics
Sample sizes ranged between 11 and 339 (M = 103). One study included participants
with both anxiety and depression (Hunot et al., 2007), and three studies examined
perinatal/postnatal/postpartum depression specifically (Baines et al., 2013; O'Mahen et al.,
2009; Patel et al., 2013). All studies except one (90%) adapted the IPQ to be ‘depression
specific’, rather than using a generic measure of illness representations. This involved minor
changes in wording and the inclusion of depression specific symptoms and causes, and
accordingly resulted in some heterogeneity with regards to the assessment of depression. See
Table 3.1 for more key study characteristics.
Risk of Bias Assessment
Risk of bias was evaluated using four criteria relevant to the research aims assessed: (i)
whether each version of the IPQ was administered as recommended; (ii) which IPQ
dimensions were reported and assessed; (iii) study design; (iv) whether confounding variables
were adjusted for. With respect to administration of the IPQ, IPQ-R, or B-IPQ, 36.64% of
studies adhered to guidelines by developers (lower risk of bias), 31.58% partially adhered to
guidelines by developers (medium risk of bias), and 31.58% used the CSM as a theoretical
basis for qualitative interviews or did not adhere to developers’ guidelines (higher risk of

66
bias). The majority of studies (68.42%) assessed and reported all measured illness
representation dimensions (lower risk of bias), with 5.26% assessing but not reporting all
measured illness representations dimensions (medium risk of bias), and 26.32% not assessing
nor reporting all measured illness representation dimensions (higher risk of bias). With regard
to study design, 36.84% of studies were longitudinal (lower risk of bias), 42.11% of studies
were cross-sectional (medium risk of bias), and 21.05% of studies were qualitative (high risk
of bias). Only one study (C. Brown et al., 2001) adjusted for potential confounds (low risk of
bias). See Appendices 3.5 and 3.6 for summary tables and a graph on risk of bias.
Relationship of Illness Representations to Coping and Psychological Distress:
Quantitative Analysis
Table 3.2 shows that only the relationships between acute/chronic timeline and coping
and acute/chronic timeline and psychological distress were subject to high heterogeneity (I2 =
73.02 and I2 = 71.02 respectively). The remaining I2 values indicate moderate to low
heterogeneity.
The results from the meta-analyses between coping and illness representations
represented small to moderate effects (following Cohen, 1992), while the results between
psychological distress and illness representations represented small to large effects (Table
3.2, Forest plots in Appendix 3.7). The strongest correlate of coping was consequences, with
more depression-related consequences indicating more use of coping behaviours (both
adaptive and maladaptive), rz = .205, 95% CI [.051, .360]. The next strongest correlates
included cause (rz = .194, 95% CI [-.245, .632]) and treatment control (rz = .162, 95% CI [-
.014, .339]).
Overall, there were stronger and more significant relationships between illness
representations and psychological distress than between illness representations and coping.
The strongest correlate of psychological distress was emotional representations, with higher

67
levels of emotional representations (stronger emotional responses to depression) indicating
more psychological distress, rz = .481, 95% CI [.378, .583]. Other correlates included identity
rz = .442, 95% CI [.289, .595], consequences rz = .435, 95% CI [.296, .573], acute/chronic
timeline rz = .330, 95% CI [.193, .466], and personal control rz = -.253, 95% CI [-.384, -
.122]. Treatment control rz = -.151, 95% CI [-.301, -.002] and illness coherence rz = -.105,
95% CI [-.202, -.007] were also statistically significantly related to psychological distress, but
had smaller effect sizes. It is worth noting here that similar results and effect sizes were found
for both cross-sectional and longitudinal data when analysed separately.
Across all relationships funnel plots (Appendix 3.8) were generally symmetrical,
suggesting that publication bias was unlikely (Light & Pillemer, 1984). The number of
studies that fell outside the funnel varied between none and two, with those points falling
outside the plot likely to represent heterogeneity in the data. Fail-safe N ranged from zero to
198 across the relationships between illness representations and coping and illness
representations and psychological distress (see Table 3.2). This suggests that we can only be
confident that some of the relationships identified would not be altered by finding a large
number of missing or unpublished contradictory data (Rosenthal, 1979).
Relationship of Illness Representations to Coping and Psychological Distress: Narrative
Review
Nine of the 19 studies did not report relevant data, or data could not be obtained from
authors on request. Using thematic analysis, we conducted a narrative review of these studies
and identified four common themes. These themes broadly replicate the findings of the meta-
analysis.
One theme related to perceptions of specific causes of depression that influenced both
coping behaviours and illness outcomes. Elwy et al. (2016) found that veterans who
perceived the cause of their symptoms to be family problems were less likely to receive

68
Table 3.2
Meta-Analyses of the Relationships between Illness Representations and Coping, and Illness Representations and Psychological Distress
Coping Psychological Distress
k N rz (95% CI) Nfs Q I2 k N rz (95% CI) Nfs Q I2
Identity 4 342 .442*** (.289, .595) 89 5.68 48.16
Cause 2 48 .194 (-.245, .632) 0 1.25 19.92
Timeline (Acute/Chronic) 3 169 -.084 (-.397, .228) 0 6.88* 73.02 7 858 .330*** (.193, .466) 183 23.88*** 71.02
Timeline (Cyclical) 6 759 .069 (-.003, .141) 5 3.14 <.01
Consequences 3 170 .205** (.051, .360) 5 2.33 <.01 6 520 .435*** (.296, .573) 198 12.09* 58.37
Personal Control 2 129 .048 (-.129, .225) 0 <.01 <.01 5 419 -.253*** (-.384, -.122) 42 6.69 41.82
Treatment Control 2 129 .162 (-.014, .339) 1 .39 <.01 5 418 -.151* (-.301, -.002) 12 9.11 55.12
Illness Coherence 2 129 .089 (-.087, .266) 0 .03 <.01 5 419 -.105* (-.202, -.007) 4 1.58 <.01
Emotional Representations 2 129 .067 (-.109, .244) 0 .97 <.01 5 420 .481*** (.378, .583) 163 3.61 8.23
Note. k = number of studies, N = total sample size across included studies, rz = effect size, (95%CI) = 95% confidence intervals around the effect size, Nfs = Rosenthal’s fail-
safe N (measure of publication bias), Q = measure of heterogeneity (suggests heterogeneity when statistically significant), I2 = measure of heterogeneity (25% = low, 50% =
moderate, 75% = high), *p < .05, **p < .01, ***p < .001

69
guideline-concordant treatment following a positive screen for depression. E. C. Ward et al.
(2014) found that older African American women generally perceived that their depression
was a normal reaction to life circumstances and that culturally accepted behaviours such as
religion and resilience were appropriate strategies for coping with such depression. These
studies suggest that perceiving external and stable causes for depression is associated with
less help-seeking. C. Brown et al. (2007) suggests mechanisms for the cause-coping
relationship by showing that the coping behaviours venting and self-blame mediated the
relationship between the perceived cause stress and interpersonal problems (outcome).
A second theme revolved around the effects of timeline perceptions and treatment
seeking, but with more heterogeneous results. A more chronic timeline predicted treatment
use (antidepressant or psychotherapy/counselling) (O'Mahen et al., 2009), while those who
did not seek treatment for depression perceived a more acute or cyclical timeline (Elwy et al.,
2016; Elwy et al., 2011). In contrast, E. C. Ward et al. (2014) highlight that a perceived
chronic timeline of depression may be a barrier to seeking appropriate professional mental
health care. Further, C. Brown et al. (2007) found that two coping behaviours (behavioural
disengagement and self-blame) partially mediated the relationship between perceived
timeline of depression and psychosocial functioning.
The third theme was related to the role of consequences for coping, which also
revealed some diverse patterns and relationships. The perception of less severe consequences
of depression in one’s day-to-day life was associated with reduced treatment seeking (Elwy et
al., 2011), but at the same time, perceiving more severe consequences of depression was
associated with less problem-solving oriented coping strategies and more maladaptive coping
strategies such as behavioural disengagement or rumination (Kelly et al., 2007).
A fourth theme emerged around the relationship of control perceptions and coping
behaviours. Higher levels of control perceptions were associated with less likelihood of

70
receiving guideline concordant treatment for Veterans (Elwy et al., 2016). However, contrary
to this, higher treatment control perceptions were associated with more treatment seeking
(Elwy et al., 2011). In addition, higher treatment and personal control perceptions were
associated with the use of more adaptive coping strategies, such as problem solving, positive
reframing, and active coping, for women (Kelly et al., 2007). While on the other hand, low
control perceptions predicted behavioural disengagement which in turn predicted lower
psychosocial functioning (C. Brown et al., 2007).
A further three studies could not be easily or clearly synthesised using thematic
analysis. Hunot et al. (2007) found no significant relationship between continued
antidepressant use and illness representations, and non-continued antidepressant use and
illness representations. Mc Sharry et al. (2013) examined multimorbid illness representations
and self-management in people with depression and diabetes. They found that diabetes and
depression representations varied for those who perceived interactions between each
condition (e.g., in terms of causation), and those who saw their illnesses as unrelated. These
multimorbid representations were described as impacting on participants’ self-management.
For example, due to the difficulty of living with multimorbid conditions, problems with
medication adherence were commonly described. Finally, Patel et al. (2013) examined illness
representations in mothers with postnatal depression using semi-structured interviews and
concluded that the themes identified from these interviews did not clearly map onto the key
illness representation dimensions of the CSM. Instead, this study revealed more complex
conceptualisations of postnatal depression that seemed to be attached to mothers’ sense of
self and self-worth.
In summary, this narrative review broadly replicates the findings from the meta-
analyses, with the majority of studies finding and reporting some association between illness
representations and coping behaviours or illness representations and illness outcomes.

71
Discussion
The aim of this systematic review and meta-analysis was to determine whether and
how illness representations are associated with coping behaviours and illness outcomes for
people with depression. The CSM has been used extensively to examine health and coping
outcomes in physical illness, however the present systematic review and meta-analysis was
the first to assess the associations of illness representations specifically with health and
coping outcomes in people with depression. This review provides new insights into the utility
of the CSM for mental health, and can be used as the basis for interventions aimed at
improving the health and coping outcomes of those with depression.
Illness Representations and Coping Behaviours
The strongest relationship with regard to coping identified in the meta-analysis was
between consequences and the use of coping behaviours, with perceptions of more severe
consequences associated with the use of more coping behaviours. The narrative review also
found more severe consequences to be associated with the use of more coping strategies
(including behavioural disengagement and rumination), though more severe consequences
were also found to be associated with less treatment seeking. When combined, this suggests
that the more severe people perceive the consequences of depression to be, the more likely
they are to use various strategies to cope with it, but at the same time seem less likely to seek
treatment. To understand this seemingly paradoxical relationship with both more maladaptive
and less adaptive coping strategies, control beliefs might be of importance. More personal
and treatment related control were associated with the use of not only more coping strategies,
but specifically with the use of more adaptive coping strategies (including positive reframing,
problem solving, active coping, and treatment seeking). This means that the more control a
person feels over their depression, and the more control a person feels that their treatment has
over their depression, the more likely that person is to use an adaptive coping strategy. This

72
finding is in line with research examining physical health conditions and recommendations
for best practice in CBT. Finally, the narrative review also found that a more chronic timeline
was associated with less treatment seeking. Taken together, these findings suggest that in
order to increase the use of coping strategies it may be beneficial to target beliefs around
consequences, both personal and treatment control, and chronicity of timeline. For example,
personal control beliefs can be targeted in traditional CBT interventions that encourage
patients to take more control over depressive thoughts, symptoms, and feelings (J. S. Beck,
2011), but at the same time exploring causal and timeline beliefs might enrich CBT practice
and provide target points for cognitive restructuring. In addition, interventions that explicitly
target beliefs about depression and its treatment could remove barriers to treatment adherence
(Elwy et al., 2011).
Illness Representations and Illness Outcomes
Findings from our meta-analysis matched previous reviews (Baines & Wittkowski,
2013; Dempster et al., 2015; Hagger & Orbell, 2003), with higher identity (perceived
symptoms), perceptions of a more chronic timeline, perceptions of more severe
consequences, and stronger emotional representations, associated with more psychological
distress. In contrast, higher perceived personal and treatment control, as well as stronger
illness coherence, were found to be associated with lower levels of psychological distress.
The narrative review generally revealed similar patterns of relationships between illness
representations and illness outcomes. These findings suggest that identity, timeline, and
control perceptions are the key illness representations to target in therapeutic interventions.
For example, psychoeducational strategies could focus on increasing understanding and
perceived control over depression, correcting beliefs regarding treatment control and the
expected timeline of depressive episodes, reducing consequences and perceptions of severe
consequences of depression, and improving emotional responses to depression.

73
Implications
The current systematic review suggests that in order to both improve and increase the
use of coping strategies, and improve mental illness outcomes such as psychological distress,
it would be beneficial to target unrealistic or maladaptive illness representations in evidence-
based psychosocial interventions. For people with some chronic physical illnesses it has been
shown that challenging maladaptive illness representations and forming alternate
representations can both change illness representations and lead to improved psychosocial
outcomes (Siemonsma et al., 2013). However, although such findings are promising, only
few intervention studies exist (with none specifically targeting depression). Further, very few
of these intervention based studies provide an explicit rationale for which illness
representations are best to target. The present review provides some suggestions for which
illness representations would be best to target in intervention trials – in particular perceived
control. Further, interventions aimed at adapting timeline perceptions to be less chronic,
decreasing perceptions of severe consequences of depression, and reducing the perceived
emotional impacts of depression, may lead to less psychological distress.
Limitations
This review is limited by a lack of quantitative research examining the relationship
between illness representations and specific coping behaviours, meaning that instead of
assessing which representations were associated with the use of adaptive versus maladaptive
coping strategies, we were only able to examine which illness representations were associated
with the use of coping strategies in general. This lack of data also led results to suggest that
the relationships between illness representations and coping behaviours were not as strong as
those between illness representations and illness outcomes. However, the limited quantitative
results, combined with the findings from the qualitative review, do provide some interesting
insights into the relationships between illness representations and coping behaviours in

74
people with depression.
It can be argued that a substantial overlap between depression, the illness outcomes
measured (psychological distress), and illness representations (particularly emotional
representations) precludes interpreting relationships between these factors. It seems obvious
that if a person is depressed, this will influence their illness perceptions and the extent to
which they experience psychological distress. However, according to Cognitive Theory
(Clark & Watson, 1991), people have relatively stable core beliefs that can influence how
people interpret and respond to specific information, and these core beliefs also impact
individuals’ interpretation of illness. Therefore, specific illness representations may not only
be influenced by how an individual perceives the illness, but also by their more generalised
core beliefs.
There is also the potential for overlapping items assessing depression, illness
outcomes (psychological distress), and illness representations. For example, at times items
assessing emotional representations and items assessing psychological distress may overlap,
making these concepts difficult to entangle. However, the development process of the IPQ-R
suggests discriminant validity between the emotional representations construct and positive
and negative affect (Moss-Morris et al., 2002). In future, studies should take care to use items
and measures that assess each individual construct as uniquely as possible to ensure
appropriate discriminant validity is achieved.
An assessment of included studies suggests some risk of bias at the study level,
particularly when examining administration and modification of the IPQ, IPQ-R, and B-IPQ.
These adaptations have the potential to differ substantially from the original questionnaires,
meaning that the reliability and validity of the IPQ/IPQ-R may be affected. However, as the
majority of studies included in the present review have adjusted the IPQ or IPQ-R by
replacing generic wording to be more specific (e.g., illness for depression), or by adjusting

75
the identity and causes subscales to assess symptoms and causes that relate specifically to
depression, this appears unlikely.
Conclusion
This systematic review provides support for the validity of the CSM’s illness
representation dimensions for predicting illness outcomes (specifically psychological
distress) in people with depression. Our findings suggest that such representations including
perceived control, timeline, consequences, identity, and emotional representations are key to
understanding how people respond to depression. These relationships can inform CBT-based
interventions that target inaccurate or maladaptive illness representations. However, the low
number and varying quality of the studies reviewed suggests that more high-quality research
is needed before we can confirm which dimensions underlie the subjective illness
understandings of people with depression.

76
Chapter 4
Study 3
‘It was all intertwined’: Illness representations and self-management in people with
cancer and anxiety/depression*
*Richardson, E. M., Scott, J. L., Schüz, N. Sanderson, K., & Schüz, B. (2016). ‘It was all
intertwined’: Illness representations and self-management in people with cancer and
anxiety/depression. Manuscript under review.

77
Abstract
Objective: Cancer and anxiety/depression frequently co-occur, leading to poorer outcomes
for these illnesses. However, the majority of existing research investigates how participants
view single illnesses alone. This study aimed to explore the content of individuals’
multimorbid representations and how these relate to their coping behaviours and self-
management strategies for cancer and anxiety/depression.
Design: A semi-structured qualitative research design with theoretical thematic analysis.
Main Outcome Measures: Multimorbid illness representations, coping behaviours, and self-
management strategies.
Results: In interviews with 21 participants multimorbid representations varied, with three
participants viewing cancer and anxiety/depression as unrelated, five participants uncertain
about the relationship between cancer and anxiety/depression, and the majority of participants
(13) perceiving cancer and anxiety/depression as related. This third group of participants
often described relationships as causal, with representations having both positive and
negative influences on coping behaviours and self-management strategies. Representations
were shown to change over the course of the cancer experience, with fear of cancer
recurrence and the influence of participants’ most challenging illness also discussed.
Conclusions: People hold multimorbid illness representations that can influence self-
management. An awareness of these representations by researchers, health professionals, and
patients is important for the creation of future interventions that aim to improve and maintain
patient well-being.
Keywords: cancer; anxiety; depression; multimorbidity; illness representations

78
Anxiety and depression commonly occur as co-morbid illnesses in cancer patients. A
meta-analysis of 60 studies (Massie et al., 2011) investigated the prevalence of co-occurring
cancer and depression, estimating this co-occurrence at between 1.5 and 52%. Massie et al.
(2011) suggested that this high variability in prevalence may be due to differences in the
measurement of depression, different criteria used to define depression, and varying
conceptualisations of depression (e.g., depression severity, depressed mood, minor
depression, major depression, depressive disorder, adjustment disorder with depressed mood,
and dysthymia), across the studies included in their meta-analysis. However, despite this
range in prevalence, Massie et al. (2011) state that it is beyond doubt that cancer is associated
with high levels of depression. Rates of anxiety amongst cancer patients vary, but some
research suggests that anxiety accompanies cancer more frequently than depression
(Mystakidou et al., 2005). For cancer patients, anxiety and depression are associated with
poorer functioning (social and emotional) and quality of life (Mystakidou et al., 2005), with
depression (both major depressive disorder and depressive symptoms associated with
adjustment disorder) even found to predict elevated mortality in those with cancer (Pinquart
& Duberstein, 2010; Satin et al., 2009). To improve the outcomes of people with co-morbid
cancer and anxiety/depression, it is important to consider how they experience and think
about their illnesses, and how these subjective illness representations are associated with
coping and self-management behaviours.
One theoretical model that explores how patients’ representations of their illnesses
relate to coping and self-management is the Common Sense Model of Health and Illness
(CSM; Leventhal et al., 1980). According to the CSM, when individuals perceive a health
threat, they access cognitive and emotional representations of that threat based on their
current experience, information from the external social environment and past illness
experience, and general knowledge (Leventhal et al., 1980). These representations guide

79
peoples’ coping responses and self-management strategies, and are appraised in terms of their
success or failure in controlling the health threat and its consequences. Outcome appraisals
then lead to the refinement of one’s illness representations, as well as the selection of new
coping/management strategies (Diefenbach & Leventhal, 1996). Being faced with more than
one health threat or illness makes this process much more complex, with potential
difficulties, such as misattributions of symptoms or conflicting self-management strategies,
arising at each stage of the self-regulation process (Schüz, Wolff, Warner, Ziegelmann, &
Wurm, 2014).
The key component of the CSM are illness representations; individuals’ common-
sense definitions of health threats (Leventhal et al., 1998; Leventhal et al., 1980), which
guide individual coping attempts. A range of studies and meta-analyses underline the
importance of these subjective representations for coping behaviours and illness outcomes in
people with cancer (Richardson, Schüz, Sanderson, Scott, & Schüz, 2016), depression
(Alderson et al., 2012), and mental illness (Baines & Wittkowski, 2013). However, only
recently research has begun to examine illness representations in people with multiple
illnesses. In a qualitative study on the content of illness representations and reported
management strategies for people with multimorbidity, Bower et al. (2012) identified specific
representations about multimorbidity, including medication burden, illness priority, and
management synergies and antagonisms. In a second qualitative study (Mc Sharry et al.,
2013), participants with co-morbid diabetes and depression either described their illnesses as
unrelated with separate management strategies for each, or as being related, which in turn
implied common treatment factors and interactions between the illnesses. Those participants
who saw interactions between diabetes and depression often perceived one illness as causing
the other (e.g., diabetes as causing depression), and accordingly described the management of
both illnesses as either integrated or conflicting, e.g., in perceiving the symptoms of

80
depression to interfere with diabetes self-management. Participants also differed in the
confidence (strength) with which they described multimorbid illness representations, with
participants again also highlighting problems associated with medication burden.
Although these studies supported the CSM’s general framework of illness
representations guiding coping behaviours and self-management strategies, they also
identified illness representations that were specific to multimorbidity, highlighting the need
for more qualitative research in this area. Multimorbid illness representations are likely to
vary across different illnesses, and examining the specific combination of cancer and
anxiety/depression may give rise to additional insights into the representations of people with
multimorbid illnesses. For example, cancer is a complex illness, with varying cancer types,
stages of disease, and treatment types experienced by patients. Varying cancer types and
stages mean that the severity of cancer differs widely between patients, with toxic cancer
treatments such as chemotherapy associated with multiple side effects, and cancer-related
surgery affecting issues such as body image. These factors are likely to influence
representations of multimorbid anxiety/depression with cancer, and may provide distinct
insights into how patients cope with and self-manage these illnesses. Cancer patients also
commonly experience fear of cancer recurrence (FCR), a form of anxiety uniquely associated
with fears or worries of a return or progression of a previous or new cancer (Lee-Jones et al.,
1997; Simard et al., 2010). How FCR interacts with multimorbid representations, coping
behaviours, and self-management strategies, could also provide important insights for this
population. These unique issues associated with multimorbid cancer and anxiety/depression
demonstrate the need for exploratory research within this population.
There is currently little existing research into the experience of multimorbid cancer
and anxiety/depression, with much of the research instead focusing on: the role of
anxiety/depression and cancer as separate illnesses for illness management, groups of cancer

81
patients without a formal diagnosis of anxiety/depression, anxiety/depression as assumed
elements of the sequela associated with adjustment to cancer, or examining predictors of
anxiety/depression in cancer patients. In addition, the majority of research that has assessed
experiences of cancer and anxiety/depression has examined the coping behaviours and self-
management strategies of each illness separately, rather than assessing them as integrated
multimorbid illnesses. This study therefore is a first attempt to explicitly examine the
experience of co-morbid cancer and anxiety/depression, rather than cancer and
anxiety/depression separately.
By using semi-structured interviews, we aimed to address existing gaps in the
literature by examining the content of illness representations and their associations with
participants reported coping behaviours and self-management strategies for multimorbid
cancer and anxiety/depression. Based on previous research by Mc Sharry et al. (2013), three
key questions were used to guide this study. What kind of illness representations do
individuals have for both cancer and anxiety/depression? Do all individuals think about the
relationships between multiple illnesses in similar ways? Do particular illness representations
facilitate different coping behaviours or self-management strategies?
Method
Participants
Participants were recruited via self-selection sampling through advertisements in local
hospitals, in face-to-face support groups at Cancer Council Tasmania, and on appropriate
Facebook pages (cancer support groups). Participants contacted the researcher and
interviewer via phone or email and were invited to participate in the study if they met the
following inclusion criteria: over 18 years of age, current or previous diagnosis with any type
of cancer, current or previous experience with (diagnosed or treated for) anxiety or
depression or both anxiety and depression.

82
Sample size was based on information power (Malterud, Siersma, & Guassora, 2015),
a sampling criterion that addresses some of the limitations associated with the use of
saturation (Glaser & Strauss, 2009; Malterud et al., 2015). Following the application of the
information power criteria, 21 participants was considered an appropriate sample size, due to:
the neither especially broad nor narrow study aims, the inclusion of participants specific to
the research aim (based on meeting inclusion criteria), the study being supported by well-
established theory (the CSM), the strong rapport and interview dialogue between the
interviewer (ER) and participants (due to a strong knowledge of the theoretical background
and previous experience working with cancer patients), and the use of cross-case analysis.
Materials
Participants were required to complete a consent form, demographics and illness
characteristics questionnaire, and the shortened version of the Depression Anxiety Stress
Scale (DASS-21; Lovibond, Lovibond, & Psychology Foundation of Australia, 1995) to
assess the current severity of the symptoms of each of these three negative emotional states.
An interviewer guide that contained open-ended questions focusing on participant’s
experience of cancer, anxiety and/or depression, as well as illness representations (for
individual illnesses and those relating to multimorbidity), and coping and self-management
strategies, was used to guide each interview (see Appendix 4.1 for the full interview guide).
Procedure
The study protocol was reviewed and approved by [withheld]. Participants were
informed of the purpose of the study and the researchers’ reasons for conducting it (to
increase and improve understanding of cancer patients’ thoughts and experiences) during
contact. Although six participants were known to the interviewer through support work with
Cancer Council [withheld], relationships were generally not established prior to study
commencement. Following completion of the consent form, demographics and illness

83
characteristics questionnaire, and DASS-21 (Lovibond et al., 1995), face-to-face one-on-one
semi-structured interviews were conducted by ER at either Cancer Council [withheld], the
University [withheld], or in participants own homes. ER was a female PhD candidate in
psychology with formal training and experience in support work with cancer patients.
Interviews were audiotaped and lasted between 13 and 82 minutes (M = 50 minutes), ending
when all key topics had been covered. To maintain rapport and trust between interviewer and
participant, no field notes were taken during interviews.
Analysis
This study followed the Consolidated criteria for Reporting Qualitative research
(COREQ) Checklist (Tong, Sainsbury, & Craig, 2007) (see Appendix 4.2). Interviews were
transcribed verbatim and transcripts were imported into NVivo 10 qualitative data analysis
Software (QSR International Pty Ltd., 2014) for ease of data management and thematic
analysis. Participants were not given an opportunity to review interview transcripts as all
information was de-identified to maintain confidentiality and ethical requirements.
Analyses were conducted from a subtle realist viewpoint, which involves
acknowledging the subjective perceptions of researchers while attempting to represent the
underlying existing reality under study (Mays & Pope, 2000). As this study was conducted
within a CSM framework (with a particular focus on illness representations), our analysis was
conducted under the a priori assumption that participants have representations about their
illnesses. Based on recent research examining multimorbid illness representations (Bower et
al., 2012; Mc Sharry et al., 2013), a theoretical thematic analysis was conducted (Braun &
Clarke, 2006). This approach is used to provide a more detailed analysis of some particular
aspect of the data, in this case differences in representations between those who identified
links between cancer and anxiety/depression and those that did not. However, although a
theoretical thematic approach was used, themes were not identified in advance but were

84
instead derived from the interview data, allowing for a richer description of that data.
Data analysis began with data immersion, which involved ER transcribing audiotaped
interviews verbatim into written form and reading and re-reading completed transcripts to
familiarise oneself with the data. ER then coded all transcripts into units of meaning using
NVivo 10. Units of meaning were used rather than line-by-line, sentence, or paragraph blocks
for coding, as predefined blocks of text may not accurately reflect meanings as intended by
participants and important contextual information may be missed (Campbell, Quincy,
Osserman, & Pedersen, 2013). To ensure reliability and to avoid missing important codes a
second coder (JH) coded 5/21 (23.81%) interviews. Both inter-rater agreement (92.25%) and
inter-rater reliability were good (Cohen’s Kappa = .664) between ER and JH. Following
coding, codes were collated into potential themes. Finally, themes were reviewed, cross-
checked for overlap, defined, and named. Participants were not offered a chance to provide
feedback on these themes, but instead could request to be sent any publications or research
output arising from the research.
Results
Demographics and Illness Characteristics
Of the 22 participants who were met for interview, 21 were included in the study (3
males and 18 females), with one participant removed as they did not meet inclusion criteria
(no diagnosis of or treatment for anxiety and/or depression). Participants were aged between
23 and 75 years (M = 50 years, SD = 18 years), with four participants experiencing anxiety,
five participants experiencing depression, and 12 participants experiencing both anxiety and
depression at some point throughout their lifespan. For more demographics and illness
characteristics, as well as DASS-21 scores, see Table 4.1 and Appendix 4.3.
Thematic Analysis
The main theme in the data was identified as representations of the relationships (or

85
Table 4.1
Illness Characteristics and DASS-21 Anxiety and Depression Subscale Scores
Characteristic Characteristic Sub-Categories N (%)
Primary Cancer Type Breast 9 (42.9%)
Bowel 5 (23.8%)
Sarcoma 1 (4.8%)
Hodgkin’s Lymphoma 1 (4.8%)
Non-Hodgkin’s Lymphoma 1 (4.8%)
Brain 1 (4.8%)
Liver 1 (4.8%)
Prostate 1 (4.8%)
Unknown Primary 1 (4.8%)
Diagnosis of Second Primary Cancer Yes 3 (14.3%)
No 18 (85.7%)
Diagnosis of Secondary Cancer Yes 4 (19.0%)
No 17 (81.0%)
Cancer Treatment Stage Peri-Treatment 5 (23.8%)
Post-Treatment 16 (76.2%)
Cancer Treatment Type Surgery 20 (95.2%)
Chemotherapy 16 (76.2%)
Radiotherapy 12 (57.1%)
Hormone Therapy 6 (28.6%)
Tablet Medication 7 (33.3%)
Order of Illness Diagnosis Cancer pre- Anxiety 2 (12.5%)
Anxiety pre- Cancer 11 (68.8%)
Anxiety and Cancer Together 3 (18.8%)
Cancer pre- Depression 5 (29.4%)
Depression pre- Cancer 7 (41.2%)
Depression and Cancer Together 5 (29.4%)
Other Multimorbid Conditions None 9 (42.9%)
One 9 (42.9%)
Two 3 (14.3%)
DASS-21 Subscale Subscale Ratings N (%)
Anxiety Normal 9 (42.9%)
Mild 2 (9.5%)
Moderate 3 (14.3%)
Severe 2 (9.5%)
Extremely Severe 5 (23.8%)
Depression Normal 5 (23.8%)
Mild 2 (9.5%)
Moderate 2 (9.5%)
Severe 2 (9.5%)
Extremely Severe 10 (47.6)

86
lack of relationships) between cancer and anxiety/depression, with these relationships guiding
participants’ coping strategies and illness management. This theme has been broken down for
discussion into three sub-themes: ‘cancer and anxiety/depression are unrelated’, ‘uncertainty
about the relationship between cancer and anxiety/depression’, and ‘cancer and
anxiety/depression are related’. How these representations influence coping and management
will be discussed separately in each sub-thematic section. Three additional themes, fear of
cancer recurrence, changing perceptions throughout the cancer experience, and most
challenging illness, were found across representations of the relationships between cancer and
anxiety/depression, and will be discussed as separate themes. Figure 4.1 presents a thematic
map that provides a visual representation of results. To illustrate the main themes and
highlight important issues, quotations will be presented. Demographic and illness
characteristics will be provided where relevant, with pseudo-names used to preserve
anonymity of participants.
Cancer and anxiety/depression are unrelated.
Only three participants described cancer and anxiety/depression as unrelated. All
three participants were female with very similar ages (M = 66 years, range = 65-67 years),
but had different cancer types (bowel, breast, and non-Hodgkin’s lymphoma). All three
participants had experienced depression pre-cancer, with two out of three also experiencing
anxiety pre-cancer. The main reason for seeing no relationship between cancer and
anxiety/depression was the perception of unrelated causes.
All three participants described causes for their anxiety/depression unrelated to
cancer. For example, Ruby described the cause of her anxiety as workload with additional
links between anxiety, genetics, and low self-esteem. With regard to depression, Ruby
proposes it ‘is actually triggered by events’ (although not by her cancer diagnosis), while also
describing links between her anxiety and depression ‘there’s anxiety which is leading to

87
Figure 4.1. Thematic map of representations of cancer and anxiety/depression and their relationships with coping and self-management
strategies.

88
depression’.
Coping and self-management in participants who perceived no relationship between
cancer and anxiety/depression varied. For Julia, there was no overlap between the
management of depression and cancer, with depression only managed through the use of anti-
depressants, while cancer was managed by trying to ‘keep life as normal as possible’ through
activities such as walking and visiting friends and family. For both Ruby and Bridget, similar
self-management strategies were used for both cancer and anxiety/depression (e.g.,
distraction through social support, making music, or reading [Bridget]), though no explicit
links were made about managing these illnesses in tandem. Ruby, however did identify some
links between mental and physical health, in that when feeling anxious or concerned, things
like posture and diet deteriorate, leading to poorer health. According to Ruby ‘if you can
catch that and you just get it right, then you physically feel better.’.
Uncertainty about the relationship between cancer and anxiety/depression.
Five participants did not describe clear relationships between cancer and
anxiety/depression. Participants in this group varied in age, gender, and cancer type, though
four out of five participants experienced their depression and/or anxiety pre-cancer. Two
participants, Bonnie and Janet, considered cancer as a potential cause for their depression,
while another two participants, Adam and Mary, considered anxiety/depression as a potential
cause for their cancer. However, all four of these participants mentioned alternate causes they
had also considered. For example, Bonnie did not mention cancer as a cause for her
depression originally, when questioned specifically she suggested the physical consequences
of the cancer and its treatment may play a part in causing her depression, ‘this can come over
me, um, if it’s been particularly difficult, if I feel like, that um, it’s restricted my life too
much.’.
One participant, Matthew, did not perceive any causal links between depression and

89
cancer and was not depressed at the time of his cancer, but did highlight how having cancer
made it more difficult to cope with underlying depression.
I wasn’t depressed at the time I had cancer. (ER: Mmhm). Um, I was in a really good space. Um, but it
definitely sort of having something like that happen makes everything a lot harder … Like it didn’t
make me depressed but I, it was definitely a lot more of a struggle because it happened. (Matthew)
Matthew also identified how having a predisposition to depression made it more difficult to
cope with cancer.
It definitely made it harder, because you know, you struggle to cope with things, and you know like I
said those coping mechanisms that you have, if you can’t do those, like you, they’re in place for a
reason and you do them for a reason. (ER: Mm.). Um, especially when you’re, you’re sick and stuff
and you can’t do those. It, it did, you know, have an impact. (Matthew)
The other four participants had fairly distinct coping and self-management strategies
for cancer and anxiety/depression, with this mostly due to the timeline of development for
each illness (fairly distant) and the different causal factors for each illness.
Cancer and anxiety/depression are related.
The remaining 13 participants described relationships between cancer and
anxiety/depression, with these relationships often considered causal.
Anxiety/depression causes cancer.
Four participants described anxiety/depression as a cause for their cancer, with, for
example, Samuel suggesting depression was the cause of his cancer, ‘I believe, honestly that I
got it through depression and stress.’ Sophie, who developed depression following the
passing of her mother, believed that depression may have helped her cancer to grow.
The depression would have helped the cancer, well it would have helped the cancer grow, um I would
think. Um, because it has to be expressed somehow. I think when you internalise stuff, uh, in that way,
um. Because we’re very good at talking about things that make us happy and our joys, but not the
other, we keep it in, it must, and it has to come out some way surely. (Sophie)
Cancer causes anxiety/depression.
The remaining nine participants described the opposite relationship, with cancer
believed to be a direct cause for their anxiety/depression: ‘I’m anxious because I have cancer,

90
yes’ (Anna), or ‘I think the cancer caused the depression, yes.’ (Georgia).
Another common point of discussion across participants was that the consequences of
cancer (symptoms, treatment side-effects, etc.) were linked with causing or influencing
anxiety/depression. Participants suffered from a wide range of cancer-related consequences
that were perceived as causing anxiety/depression, including visible scars from treatment,
physical disabilities, hair loss, inability to work, fertility difficulties, and loss of
independence. For example, Sarah, who had a brain tumour (Medullablastoma) and needed
extensive treatment including surgery, chemotherapy, and radiotherapy, described several
permanent physiological consequences from her cancer and its treatment. She described these
consequences and the resultant loss of control as the main reason for her anxiety and
depression.
When I started feeling depressed, um, was, I guess when I lost my hair … when I realised how much of
my life I’d, that I’ve lost control of. Because when I was, um, younger, like when I, like I couldn’t, I
could always have an escape. (ER: Mm.). Like, you know, even through work, or you know, working
really hard, thinking to myself, “well I’m going to be able to make myself better, or I’m going to be
able to get over, get above this” ... because I had control. … and then going from that type of person to
losing my hearing, losing my hair, confidence, the ability to be independent, and not working… (Sarah)
Cancer, anxiety, and depression are intertwined.
Several participants suffered from cancer and both depression and anxiety, with some
of these participants suggesting that all three illnesses were intertwined. For example, Sarah
suggested that for her ‘Anxiety brings on depression, and cancer brings on anxiety. It is really
just a ball … It’s just a rolling ball.’. When relationships were perceived between cancer and
anxiety/depression, attempting to cope with and manage them was described as being more
difficult than dealing with one illness alone, with several participants, including Lisa,
describing this challenge.
ER: So having all three of those, how much harder did that make things? Lisa: Oh it was excruciating.
Just even the needles for my chemo, my anxiety… I used to have a double dose on my anxiety pills
before they tried to put a needle in. (ER: Mm.). Um, and being a needle-phobe doesn’t help, but the
anxiety was always sky high when I walked into the hospital. So I would pop a pill in the car on the

91
way in, then in the waiting room I’d pop another one, so that’s double dosing. (ER: Mm.). Um, and
even then it was a struggle for them to get a line in. So, it was… I, it just made everything that much
harder. … Even just going to an appointment with the oncologist and she’d talk about what she’d
found. What the diagnosis was. What, you know, what the cancer … That was really hard. (ER: Mm.).
Um, and then I’d leave there and, and I’d sink into the biggest, um, a funk, you know. (Lisa)
Coping and self-management strategies.
Although cancer and anxiety/depression were seen as related by the majority of
participants, this did not necessarily mean that these participants used strategies to help cope
with and manage their illnesses together. Quite often, separate self-management strategies
were utilised for each illness. However, some participants highlighted that managing one
aspect of an illness may be of benefit to their other illness. For example, Cheryl, who had
metastatic breast cancer, explained how meditation and relaxation was not only beneficial for
reducing her anxiety, but also for helping to heal her body.
However, several participants also described how interactions between cancer and
anxiety/depression can negatively impact coping and self-management. For example, at times
it can be difficult to determine the best way to manage a particular symptom, particularly
when it is unclear whether it is a symptom of the cancer, a treatment side-effect, or a
symptom of anxiety/depression.
Um, depression yeah. When you’ve got that foggy state in your mind and you’re fatigued and your
treatment, it, it can be really really hard to motivate yourself. But it’s more a, I’m not sure how much
it’s treatment related or (ER: Mm.) what it, it’s just really hard to, sort of, um. I sort of feel when I’m
being down and crap and stuff like that I just thinking, “ok I probably am depressed” but I just think
“ok these are going to be the side effects of the treatment that I’ll need to work through”, and yep.
(Cheryl)
Further for some participants with anxiety/depression, the symptoms of cancer or the
side-effects from cancer treatment prevented them from being able to participate in their
normal anxiety/depression coping strategies. For example, Matthew described the importance
of exercise, specifically running, as a coping strategy for depression (or to keep depression
dormant), ‘So exercise is normally a massive one for me … If I don’t, you know, I just go

92
downhill really quickly’. However, after his diagnosis of liver cancer, surgery and
chemotherapy were required, limiting his ability to exercise, and requiring him to find other
coping strategies.
Similarly, some participants suggested that the symptoms of anxiety/depression
prevented them from undertaking either their usual cancer prevention strategies, or general
lifestyle and health factors that are known to help prevent cancer. For example, Mary stated
that in the past her depression had prevented her from ‘yoga and gym and horse riding and
rowing and going out of walks’, while Lisa explains how the consequences of her depression
prevent her from doing the healthy living practices that she knows will help to prevent future
cancer.
Not eating the healthy foods that I know are going to protect me from future cancer. (ER: Yes.). But
eating the comfort foods that are undermining my whole health plan. Um, also the inability to go out
and do exercise. (ER: Mm.). Um, because gentle walking is my chosen form of activity. … But when
I’m feeling depressed do you think I can walk out that door? (ER: Mm.). Nup. … We came to the
country for lifestyle… (ER: Yes.) for fresh air, to grown our own fruit and veg, to have healthier food,
all that sort of stuff. (ER: Yes.). And when I give in to the depression, it undermines everything. (ER:
Mm, mm.). I don’t’ look after my family properly. I don’t look after myself properly. (Lisa)
That constant looking over your shoulder - Fear of cancer recurrence.
One particularly important issue that is fairly unique to the cancer space and arose
commonly when discussing the relationship between cancer and anxiety, was fear of cancer
recurrence for those post cancer treatment (FCR; Lee-Jones et al., 1997; Simard et al., 2010).
FCR is common but can become problematic when it influences behaviour. Most participants
mentioned some experience of FCR, particularly around check-ups, tests, or scans.
‘You worry at times. (ER: Yes.). When, when you come up to the six monthly pathology I still. “ah
here we go again”, you know (ER: Mm.) sort of thing … And it’s a bit of anxiety there, but nothing
that you don’t cope with and handle.’. (Adam)
However, several participants described experiences of FCR at a more debilitating level. For
example, Rebecca described the constant focus on any abnormality or discomfort she noticed
within her body post cancer.

93
An ache or pain is never just an ache or pain to me, it’s always like, could it be more. (ER: Mm.). …
Whereas most people get an ache or pain they wouldn’t even think of cancer… (ER: Yes.) would be
the furthest thing from their mind. But for me, every ache or pain could be that. (Rebecca)
For participants like Danielle, this constant FCR led them to experience depression.
I lived on this level of anxiety for quite a while, quite a high level, without realising that’s what it was.
(ER: Mm.). And it just tires you out. And then you get depressed, because you, yeah, you’re tired and
you lock yourself in the house, and you don’t get out of bed because you’re scared you’re gonna hurt
yourself. (Danielle)
Several participants also described how this constant FCR also drove particular coping
behaviours and self-management strategies, not all of which were adaptive. Examples of
these behaviours included adjusting eating behaviours and food choices, taking multiple
dietary supplements, constantly searching the internet ‘engrossed in Dr Google’, and making
constant calls or visits to previous or current treating health professionals.
Um, basically cause after the treatment was finished I was like always at the Doctors. Like I’d always
be going back to the GP. I would go, “I’ve got a pain in my elbow”… (ER: Yeah.). and I would, you
know that was like a classic example, “I have a pain in my elbow, like I must have cancer in my
elbow”. (ER: Mm.). And he’s going “no”, you know, check me elbow out, “it’s fine”. By the time I’d
walk back to the car, this pain I’d had for a couple of weeks had gone. (Rebecca)
I could be perfectly fine in the morning, and I’d bump my knee, and by lunch time I would have cancer
in my knee and in my bones, and I’d be ringing the oncologist and saying I need a bone scan. And you
know, and I just bumped my knee! But that’s where it took me. … And they’re still there. That’s my
first thought. It’s still there. (ER: Mm.). Every time something hurts. I was driving home from Burnie
yester, last night. And the front of my shoe was hurting, and I had to keep rubbing it. It was quite sore.
(ER: Mm.). And I was thinking, “Oh God, I’ve got cancer in my bones now. Oh Danielle don’t be an
idiot. It’s just a strain from the accelerator for the last four and a half hours.” Like, you know, it’s gone
today. *Laughs*. (Danielle)
Who am I now? - Changing perceptions throughout the cancer experience.
An additional theme arising related to changing self-perceptions throughout the
cancer experience and how these interact with experiences of anxiety/depression, as well as
coping and self-management. In having such a large impact on one’s life, it is unsurprising
that many participants described cancer as leading to changes in perceptions, self-image,
attitudes, and opinions. For several participants these changes were positive, with Melanie

94
describing improvements in her attitude towards work and Bridget describing changes to how
her and her partner live their lives, ‘we don’t hold off … either in terms of doing this or
enjoying things, or even saving money … you know, now is when we need to do it’.
However, at times these changes presented challenges for participants, particularly when
related to changes in self-image.
And looking in the mirror at myself and saying, “That’s not you… You didn’t…” I looked like you
before, more or less. A lot older obviously, but long blonde hair. (ER: Yeah.). Had all my life been
someone with long blonde hair. And then suddenly I’m not that person anymore. (ER: Mm.). And
probably will never be the person that I was before. (ER: Mm.). So it’s kind of dealing with that too.
Who am I now? (Kathryn)
Changes in self-perception were often associated with experiences of loss and grief.
For example, Georgia described how cancer led to a ‘loss of sense of identity because it’s
changed who I am as a person. It’s changed the way I view myself, and my self-image … and
the way I view the world.’. This loss was particularly evident amongst participants with
metastatic cancer, who had been required to face their mortality at a deeper level.
I was doing really well. … We’d had Amelia, I’d returned from maternity leave, I was getting back on
track with work, we were considering having another child, I’d gone off the pill, you know, we were at
that sort of stage of our lives, and… that’s all sort of gone. … I feel like things have been taken away
from me. And, to start off with a lot of it was grieving the life that we were going to have. Because I
had to stop thinking, planning. … I wasn’t able to plan at all. … I didn’t feel like I wanted to plan six
months ahead. … My husband wanted to go sort of do like a bucket list thing, and let’s tick everything
off, let’s do all the things that we would have done in, in the future, but I couldn’t even do that cause I
didn’t want it to be like the last hoorah, “ok we’re going to travel and then I can die after that”. (Anna)
Associated with these perceptions of loss and grief, were representations around
normality. Several participants, including Julia, mentioned trying to ‘keep life as normal as
possible” as one way of coping with their cancer. While other participants, like Mary,
realised that life ‘might not ever be the same again’. Lori described not remembering ‘what
it’s like to have a normal life’, while Lisa explained ‘There is no life as normal.’. Some
participants also described having to learn to accept their ‘new normal’, while others
struggled with family or friends who believed that they should be ‘back to normal’ post-

95
treatment.
And he thinks that now that I don’t have to see the doctors for twelve months that things are back to
normal. But I’m thinking “well, normal for me is different.”. (Melanie)
I don’t know if I’m going to get over this - Most challenging illness.
Some participants suggested that anxiety/depression were more challenging than
cancer. This was particularly true amongst participants who had recurring or chronic
anxiety/depression and/or who had completed treatment for, or were in remission from, their
cancer. Participants described several reasons for these beliefs, including a more chronic or
cyclical timeline for anxiety/depression, less control over anxiety/depression, and less
understanding of anxiety/depression. Julia highlighted how the more chronic nature of
depression makes it more challenging to cope with, ‘the cancer diagnosis, treatment, bla, bla,
bla, that’s all over now. (ER: Yes.). Whereas the depression will go on forever’. When
describing why depression was more challenging for her, Sophie highlighted her lack of
understanding of depression, as well as the absence of the depression label.
I think on reflection the depression is harder. … Because it wasn’t named. I was just living in a
particular way. (ER: Mm.). Ah, whereas the cancer it’s named. It’s like, you can do something with
that if you so choose. (ER: Mm.). And because medicine is such, then there are things that can happen
to help that. Um, and I’ve always, I always think that the knowing, knowing something is better than
not knowing. (Sophie)
Several participants, including Danielle, described struggling with anxiety/depression
because of a lack of control over their illness, ‘The anxiety is probably the hardest to deal
with, to be honest. … When it’s not under control, it just has such a debilitating effect.’
Adam described a similar lack of control, ‘Anxiety’s something in there that, almost out of
your control. (ER: Mm.). You’ve got to really, really work harder, to control it, than what you
do to cope with the facts of having cancer.’ Although Lisa described both cancer and
depression as extremely challenging, she explained that depression, at its worst, was more
difficult than cancer, as it led to her losing the will to live.
Well… cancer was really, really, really hard. Um, because it, it’s physical inside you. (ER: Yes.). …

96
See with cancer, I wanted to live and that’s why I let them poison me… (ER: Mm.) that’s why I let
them stick needles into me, and that’s why I went through all of those things is because I wanted to
live. But when I was at my worst with depression I wanted to die. … So perhaps depression was… at
its worst… was harder than cancer. … I think the thing with cancer is you can see the light at the end of
the tunnel. ‘Cause you know these are the steps you’ve got to go through before they tell you that your
treatment’s finished. (ER: Yes.). You, you know what’s coming. But with depression you don’t. ... It’s
almost like, you know, even when you’re feeling good you know that somewhere it’s just lurking.
(Lisa)
In contrast, several participants, including all four participants with metastatic cancer,
described cancer as more challenging than anxiety/depression. The life-threatening nature of
cancer, particularly metastatic cancer, as well as a lack of control over cancer, were described
as the main reasons for perceiving cancer as participants most challenging illness. Mary, who
was recently diagnosed with Stage IV bowel cancer, provided a clear insight into how cancer
stage and the life-threatening nature of metastatic cancer can influence perceptions of cancer.
I have stage four cancer… (ER: Mm.). I’d rather be depressed again and not have cancer. I can get over
the depression… (ER: Mm.) and then be… live ‘til 80, please. Um, but if I had stage one cancer,
maybe I’d answer differently. (ER: Mm.). Cause as I said, especially early on in my diagnosis I kept
thinking “this is going to be quick fix and over and move on with life.” (ER: Yes.). So if I felt, if I still
felt like that, then maybe I’d answer differently. But as a stage four cancer person absolutely 100% I
would rather be depressed than have cancer, because I can, I know I can get over depression … but I
don’t know if I’m gonna get over this.
Discussion
This qualitative study aimed to examine multimorbid illness representations and their
associations with coping behaviours and self-management strategies in people with cancer
and anxiety/depression. Our findings suggest that patients think about the relationships
between multiple illnesses in different ways, with some viewing cancer and
anxiety/depression as unrelated, some unsure about the relationship between cancer and
anxiety/depression (think that there could possibly be a connection between them), and some
viewing cancer and anxiety/depression as related. We also found that participants’
representations had clear links with coping and self-management behaviours.
Three participants perceived cancer and anxiety/depression as unrelated, with all three

97
participants experiencing anxiety/depression pre-cancer. These participants did not discuss
links between cancer and anxiety/depression, instead discussing alternative causes for their
mental illness/es. Further, two participants described a lack of understanding of their
illnesses, particularly demonstrating confusion regarding the difference between anxiety and
depression. Finally, although two participants mentioned using the same coping behaviours
and self-management strategies for both cancer and anxiety/depression, no explicit links were
made between these strategies.
Five participants were uncertain about the relationship between cancer and
anxiety/depression, with four participants describing multiple potential causes for either
cancer or anxiety/depression (including cancer or anxiety/depression itself). This indicates a
lack of understanding about the causes of cancer and anxiety/depression. For these
participants, coping and self-management behaviours were different for each illness, and this
appeared to be mainly due to the distant timeline between diagnoses. Although one
participant suggested no causal relationship between his cancer and depression, he did
describe how cancer had made it more difficult to cope with underlying depression, and how
underlying depression had made it more difficult to cope with cancer.
Similarly to a previous study of diabetes and depression (Mc Sharry et al., 2013), the
majority of participants (13) described relationships between their illnesses. In general, these
participants described either causal links between cancer and anxiety/depression, how
consequences of cancer and its treatment caused anxiety/depression, or how cancer caused
fear of cancer recurrence (FCR) related anxiety, which at times then led to depression. For
these participants, the type of links described influenced the coping behaviours and self-
management strategies undertaken. For example, for those whose cancer had led to FCR,
coping and self-management strategies that ease this fear were frequently described,
including adjusting eating behaviours, taking dietary supplements, using the internet to search

98
for health information, or making constant calls or visits to treating Doctors. In our
interviews, the strategies described were often maladaptive, suggesting the need for
appropriate intervention. Similarly to previous research (Bower et al., 2012; Mc Sharry et al.,
2013), both separate and combination coping and self-management behaviours were
described, with behaviours beneficial to both illnesses employed at times, while symptoms or
side-effects of one illness were sometimes suggested to prevent normal coping and self-
management strategies for the other illness. Interestingly, in contrast to previous research
(Bower et al., 2012; Mc Sharry et al., 2013), issues in managing multiple medications were
rarely described.
Both within and between participants, changing perceptions and needs throughout the
cancer experience were described, suggesting that different representations may be present at
different stages of illness timeline, and that these representations may need to be re-assessed
and modified depending on content and adaptability. This was also true with respect to
coping behaviours and self-management strategies, which varied across different timelines
and stages of illness. These findings provide support for the CSM’s feedback loop, which
suggests that individuals act as problem solvers who constantly appraise their coping/self-
management behaviours and change illness representations accordingly, leading to the
adoption of new management strategies (Leventhal et al., 1998; Leventhal et al., 1980).
However, longitudinal studies are required to gain a more systematic understanding of
specific changes in multimorbid illness representations and their associations with coping
behaviours and self-management strategies.
Several participants described anxiety/depression as more challenging than cancer.
These participants were often sufferers of recurring or chronic anxiety/depression and/or in
remission from their cancer. Reasons for the more challenging nature of anxiety/depression
was related to representations of a more chronic or cyclic timeline for anxiety/depression, less

99
control over anxiety/depression, and less understanding of anxiety/depression. In contrast,
several participants described cancer as more challenging than anxiety/depression.
Importantly, all four participants with metastatic cancer were included in this group. Reasons
for the more challenging nature of cancer included perceiving less control over cancer, and
beliefs about the life-threatening nature of cancer. A lack of control was identified as an
important factor for participants no matter which illness they described as most challenging,
with less perceived control associated with a range of coping behaviours and illness outcomes
(Richardson et al., 2016). Perceived control is also associated with the use of varying self-
management strategies, such as decision making and priority setting (Bratzke et al., 2015).
Although not always inaccurate (particularly for those with metastatic cancer), control beliefs
may be important to target in interventions, as they continually appear as important predictors
of coping, self-management, and mental health.
Research suggests that patients will prioritise a dominant chronic illness (Bratzke et
al., 2015), and therefore it may be beneficial to add additional items that assess participants
most challenging or dominant illness to questionnaires such as the Illness Perception
Questionnaire (Moss-Morris et al., 2002; Weinman et al., 1996). If patients state one illness
as more challenging than another, it may be possible to determine which individual illness
representations are more likely to be determinants of behaviour. However, due to the
changing nature and re-prioritisation of representations over time (Bratzke et al., 2015), the
potential for these beliefs to be unstable must be considered before attempting to rely on their
content in an intervention.
Limitations
Due to the lack of existing research examining illness representations in people with
cancer and anxiety/depression, qualitative methods were using to explore such
representations. A limitation associated with the use of qualitative methods is the potential for

100
the subjective perceptions of researchers to unknowingly influence the analysis. However, in
conducting this study from a subtle realist viewpoint, our subjective perceptions were
constantly acknowledged while we attempted to represent the existing reality under study
(Mays & Pope, 2000). The possibility of recall bias by participants must also be considered
as a potential limitation in qualitative research.
The study lacked measurement of crude diagnostic indicators, such as whether
participants had ever been hospitalised or had outpatient contact for clinical depression or
anxiety. Further, although we recruited participants who had received either a formal
diagnosis or previous treatment for anxiety/depression, there was no clear differentiation
between those with major depression and those with ‘normal’ psychological distress
associated with the cancer experience.
Our participant sample varied widely in terms of cancer type, cancer stage, and
treatment type, with this heterogeneity likely responsible for variations across some results.
For example, the results of the DASS-21 found that although our sample had an almost even
number of participants who had experienced depression/anxiety (four with anxiety only, five
with depression only, and 12 with both anxiety and depression), there were large differences
across anxiety and depression scores, with 42.9% of participants experiencing normal anxiety
in comparison to 23.8% experiencing normal depression, and 23.8% of participants
experiencing extremely severe anxiety in comparison to 47.6% experiencing extremely
severe depression. It is possible that more consensus might have been found by using a more
focused sample, for example by only interviewing participants with breast cancer, or by only
interviewing participants with Stage I (early-stage) disease. In contrast, additional insights
might have been uncovered with the inclusion of a more diverse sample. For example, our
sample only included three males, making meaningful gender differences difficult to
examine. Despite these potential limitations, our sample was able to provide both overlapping

101
and unique representations, suggesting a good mix between specificity and diversity.
Implications
This study identified a number of multimorbid illness representations, including
differing representations of relationships between cancer and anxiety/depression, fears of
cancer recurrence, participants’ identification of their most challenging illness, and changing
beliefs across the illness experience. This suggests that standardised assessments of illness
representations such as the illness perception questionnaire (Moss-Morris et al., 2002;
Weinman et al., 1996) might not be applicable for multiple illnesses, but would need
adaptation (e.g., C. J. Gibbons et al., 2013; Mc Sharry, Bishop, Moss-Morris, Holt, &
Kendrick, 2015). Such adaptations may lead to an increased understanding of determinants of
current behaviours, as well as the implementation of more appropriate treatment approaches
by health professionals.
The CSMs illness representation dimensions have been used increasingly in
interventions for single illnesses. These intervention trials have shown positive results, with
more accurate illness representations, increases in illness coherence and perceived control,
improved mental health, and participation in more positive self-management strategies
adopted (Broadbent, Ellis, Thomas, Gamble, & Petrie, 2009; Petrie, Perry, Broadbent, &
Weinman, 2012; Siemonsma et al., 2013). Interventions for patients with multimorbidity
could potentially use a similar approach to the interventions that have been trialled for single
illnesses, though modifications to take into account the more complex nature of multimorbid
representations would be required. For example, combined or competing representations,
prioritisation of a more challenging illness, and changing representations over time, would
need to be considered before a comprehensive intervention program could be implemented.
People with multimorbid cancer and anxiety/depression require more support, with
research demonstrating that oncologists are often poor at recognising distress and the need for

102
further counselling in their patients (Söllner et al., 2001). However, in recognising such
needs, health professionals should not always assume that anxiety/depression is specifically
related to the cancer experience or adjustment process. Education for health professionals
regarding the content of patients multimorbid illness representations, as well as the
importance and impact of multimorbidity, particularly with respect to cancer and
anxiety/depression, is important for improving patient outcomes. Health professionals should
also be educated about the benefits of combination management strategies, where health
behaviours such as exercise or mindfulness can lead to improved patient outcomes across
multimorbid illnesses (Ledesma & Kumano, 2009; Mishra, Scherer, Geigle, et al., 2012;
Mishra, Scherer, Snyder, et al., 2012). However, for these strategies to be successful, care
must be taken to ensure that participants multimorbid illness representations are congruent
with their implementation. Finally, health professionals must be made aware of the ongoing
challenges that cancer survivors and metastatic cancer patients face, with patients often
requiring assistance to accept their ‘new normal’.
Conclusion
This study provides support for the CSM as an effective basis for exploring patients
multimorbid representations, with differing illness representations of, and management
strategies for, cancer and anxiety/depression identified across participants. However,
although specific illness representation dimensions from the CSM have been used in
interventions for single illnesses, the experience of multimorbid illnesses cannot currently be
fully addressed by the CSM, with a need to consider additional and more complex
representations. Future research should attempt to confirm whether representations identified
in this study can help to inform intervention design for cancer and anxiety/depression. If a
clear understanding of patients’ multimorbid representations can be gained, it may help to
improve health care interactions, as well as the coping behaviours and self-management

103
strategies, of those with cancer and anxiety/depression.

104
Chapter 5
Study 4
A qualitative comparison of the support needs of people with cancer based on their
history of anxiety/depression*
*Richardson, E. M., Scott, J. L., Schüz, N., Sanderson, K., & Schüz, B. (2016). A qualitative
comparison of the support needs of people with cancer based on their history of
anxiety/depression. Manuscript submitted for publication.

105
Abstract
Purpose: Research rarely considers the origin or history of a cancer patient’s anxiety and/or
depression, instead assuming that these illnesses are related to the cancer experience. The aim
of this study was to compare differences in the support needs of people who have
experienced anxiety/depression as part of the cancer experience and people who have not, as
well as between people who have experienced episodic anxiety/depression and people who
have experienced long-term anxiety/depression.
Methods: Twenty-one semi-structured interviews were conducted with people with a current
or previous diagnosis of cancer, and a current or previous experience with anxiety and/or
depression. Participants were split into four groups based on their history with cancer and
anxiety/depression, and an inductive thematic analysis was conducted to identify themes
across groups.
Results: Two superordinate themes (with three and two subordinate themes respectively)
were found: ‘coping with cancer’ and ‘health care system support provision’. Important
differences were found across groups, with participants in Group 4 (who had long-term
anxiety/depression and whose anxiety/depression was not associated with the cancer
diagnosis) coping best with cancer, experiencing less fear of cancer recurrence, and
highlighting more positive experiences with hospital and support services.
Conclusions: The origin and history of a person’s anxiety/depression is important to consider
when determining how they might cope with cancer, what their support needs are, and how
much support they may require during the diagnosis, treatment, and survivorship phases of
cancer.
Keywords: cancer; anxiety; depression; co-morbidity; support; needs

106
Traditionally, psycho-oncology has examined anxiety and/or depression as conditions
resulting from the cancer experience (Pasquini & Biondi, 2007). However, not all people with
cancer develop anxiety/depression, and their levels of distress vary (Helgeson et al., 2004;
Henselmans, Helgeson, et al., 2010). Further, some people have pre-existing
anxiety/depression which then becomes co-morbid with cancer, while others experience
episodes of anxiety/depression that occur in response to significant life events (including the
cancer diagnosis). These examples highlight that anxiety/depression experienced by someone
with cancer can have differential aetiology. However, the role of these origins and how they
influence the cancer experience and the support needs of people with cancer and
anxiety/depression is rarely considered in psycho-oncology research (Jacobsen & Jim, 2008;
Pasquini & Biondi, 2007).
The most important areas in need of support for people with cancer include physical
health and daily living, psychological health, health system and information, and social
support (Harrison et al., 2009). Although there are several interventions aimed at addressing
these needs, a recent review has found that such interventions generally have limited
effectiveness (Carey et al., 2012). Further, though much of the research and interventions for
people with cancer aim at improving distress, and one study has specifically examined how
screening for distress might uncover unmet needs in people with cancer (van Scheppingen et
al., 2011), research so far has not taken into account whether needs differ according to which
illness (cancer or anxiety/depression) came first, or the causes of anxiety/depression. It is
therefore unclear whether and how the needs of people with cancer are influenced by their
history with anxiety/depression.
Comparing the support needs of people with varying histories of cancer and
anxiety/depression will allow us to identify and discuss how the potentially differing needs of
people according to their cancer and anxiety/depression history can best be addressed. For

107
example, those who have experienced anxiety/depression as part of the cancer experience
might differ from those who have not, and those who have experienced episodes of
anxiety/depression in relation to significant life events might differ from those who have
experienced long-term anxiety/depression. Support needs may differ between these groups, as
long-term depression tends to be clinically more serious, is more often co-morbid with
anxiety, requires more treatment, and leads to poorer social and psychological outcomes and
reduced well-being, than episodic depression (Angst et al., 2009). Examining differences
between these groups is important because although intervention studies often take into
account psychological distress at baseline (Schneider et al., 2010), they rarely consider how a
prior history of anxiety/depression may influence intervention effectiveness. Further, the
outcomes of interventions for cancer patients with distress are often mixed, and previous
systematic and meta-analytic reviews yielded disparate conclusions that are often difficult to
interpret (Galway et al., 2012; Jacobsen & Jim, 2008; Lepore & Coyne, 2006). This
highlights the need for more research on how the aetiology and sequence of cancer and
mental illness may determine the support needs of people with cancer and anxiety/depression.
This knowledge can form the basis for better targeted and more effective interventions, as
well as improved access to appropriate support services, for people with cancer and
anxiety/depression.
This study therefore aims to explicitly examine and compare the existing supports and
needs of people with cancer and different histories of anxiety/depression (e.g., episodic
versus long-term) through semi-structured interviews, allowing for insights to be gained
through thematic analysis without researcher preconceptions. Two key questions were used to
guide this study:
1. How do different histories of anxiety/depression influence the support needs of people
with cancer?

108
2. How can support providers and health professionals better assist people with cancer
and anxiety/depression based on their history with each illness?
Method
Participants
Twenty-one participants was considered an appropriate sample size for this study
based on information power (Malterud et al., 2015). Information power provides clear criteria
for ascertaining appropriate sample sizes in qualitative research while addressing some of the
limitations associated with the use of saturation (Glaser & Strauss, 2009; Malterud et al.,
2015) (see Appendix 5.1). Participants were recruited via self-selection sampling through
advertisements in Cancer Council Tasmania face-to-face support groups, local hospitals, and
appropriate Facebook pages (cancer support groups). Persons interested in participating
contacted the researcher via phone or email and were then invited to participate in the study
upon meeting the following inclusion criteria: over 18 years of age, current or previous
diagnosis with any type of cancer, current or previous experience with (diagnosed or treated
for) anxiety or depression or both anxiety and depression. Ethics approval was obtained from
the Tasmanian Human Research Ethics Committee (H0014664).
Materials
Participants completed a consent form, demographics and illness characteristics
questionnaire, and the shortened version of the Depression Anxiety Stress Scale (DASS-21;
Lovibond et al., 1995) to assess the symptom severity of each negative emotional state. An
interviewer guide with open-ended questions was used to direct each interview (see Appendix
4.1).
Procedure
Face-to-face one-on-one semi-structured interviews were conducted following
completion of the consent form, demographics and illness characteristics questionnaire, and

109
DASS-21 (Lovibond et al., 1995). The first author conducted each interview (ER; female
PhD student with formal training and experience in support work with cancer patients) at a
place convenient to participants (university, Cancer Council, or participants’ homes).
Audiotaped interviews lasted between 13 and 82 minutes (M = 50 minutes), ending after all
key topics were covered. For additional methodological information see Appendix 5.1.
Analysis
This study followed the Consolidated criteria for Reporting Qualitative research
(COREQ) Checklist (Tong et al., 2007; see Appendix 5.2). Following verbatim transcription,
transcripts were de-identified and imported into NVivo 10 (QSR International Pty Ltd., 2014)
for data management and thematic analysis.
A subtle realist viewpoint guided analyses, where the researchers’ subjective
perceptions were acknowledged while attempting to represent the underlying existing reality
under study (Mays & Pope, 2000). An inductive thematic analysis was conducted (Braun &
Clarke, 2006). This approach involves a data-driven way of identifying themes, where data is
coded without any pre-existing coding frames or researcher preconceptions. Thematic
analysis was guided by Braun and Clarke (2006), who provide clear steps for conducting
such an analysis.
Data analysis began with data immersion (ER transcribing interviews and reading
completed transcripts several times to familiarise with the data). All transcripts were then
coded into units of meaning by ER using NVivo 10. Units of meaning were used for coding,
as predefined blocks of text (lines or sentences) may inaccurately reflect intended meanings
of participants and important contextual information may be missed (Campbell et al., 2013).
A second coder (JH) coded 5/21 (23.8%) interviews to ensure reliability. Between ER and JH
inter-rater agreement was high (92.25%) and inter-rater reliability was good (Cohen’s Kappa
= .664).

110
Based on their history with cancer and anxiety/depression, participants were
categorised by two authors (ER and JS) into four groups: cancer associated with
anxiety/depression AND a history of episodic anxiety/depression or anxiety/depression
caused by cancer alone (Group 1; ten participants); cancer associated with anxiety/depression
AND long-term anxiety/depression (Group 2; six participants); cancer that was not associated
with anxiety/depression AND a history of episodic anxiety/depression (Group 3; one
participant); cancer that was not associated with anxiety/depression AND long-term
anxiety/depression (Group 4; four participants; see Table 5.1). Following the creation of these
groups, codes were collated into potential themes, with themes then reviewed, cross-checked
for overlap, defined, and named.
Table 5.1
Participant Groupings Based on History of Cancer and Anxiety/Depression
Episodic anxiety/depression
(or caused by cancer alone) Long-term anxiety/depression
Cancer associated
anxiety/depression Group 1 Group 2
No cancer associated
anxiety/depression Group 3 Group 4
Results
Demographics and Illness Characteristics
Twenty-two participants were seen, with 21 (3 males, 18 females) meeting inclusion

111
criteria for participation (one participant had no formal diagnosis of or treatment for
anxiety/depression). Participants were aged between 23 and 75 years (M = 50 years, SD = 18
years) and had a current or previous cancer diagnosis, with four participants experiencing
anxiety, five experiencing depression, and 12 participants experiencing both anxiety and
depression at some point throughout their lifespan. Table 5.2 contains additional
demographics and illness characteristics.
Table 5.2
Demographics and Illness Characteristics
Characteristic Characteristic Sub-Categories N (%)
Country of Birth Australia 16 (76.2%)
New Zealand 1 (4.8%)
England 3 (14.3%)
Scotland 1 (4.8%)
Education (highest level obtained) Year 9 or Below 1 (4.8%)
Year 10 2 (9.5%)
Year 12 2 (9.5%)
Certificate 5 (23.8%)
Diploma 3 (14.3%)
Undergraduate Degree 5 (23.8%)
Post-Graduate Degree 3 (14.3%)
Employment Status Paid Full-Time Work 2 (9.5%)
Paid Part-Time Work 2 (9.5%)
Paid Casual Work 2 (9.5%)
Retired 6 (28.6%)
Not Working Due to Health 6 (28.6%)
Job Seeker 1 (4.8%)
Other 2 (9.5%)
Relationship Status Married 10 (47.6%)
Divorced 1 (4.8%)
Separated 1 (4.8%)
De-facto Relationship 4 (19.0%)
Single 5 (23.8%)

112
Primary Cancer Type Breast 9 (42.9%)
Bowel 5 (23.8%)
Sarcoma 1 (4.8%)
Hodgkin’s Lymphoma 1 (4.8%)
Non-Hodgkin’s Lymphoma 1 (4.8%)
Brain 1 (4.8%)
Liver 1 (4.8%)
Prostate 1 (4.8%)
Unknown Primary 1 (4.8%)
Diagnosis of Second Primary Cancer Yes 3 (14.3%)
No 18 (85.7%)
Diagnosis of Secondary Cancer Yes 4 (19.0%)
No 17 (81.0%)
Cancer Treatment Stage Peri-Treatment 5 (23.8%)
Post-Treatment 16 (76.2%)
Cancer Treatment Type Surgery 20 (95.2%)
Chemotherapy 16 (76.2%)
Radiotherapy 12 (57.1%)
Hormone Therapy 6 (28.6%)
Tablet Medication 7 (33.3%)
Order of Illness Diagnosis Cancer pre- Anxiety 2 (12.5%)
Anxiety pre- Cancer 11 (68.8%)
Anxiety and Cancer Together 3 (18.8%)
Cancer pre- Depression 5 (29.4%)
Depression pre- Cancer 7 (41.2%)
Depression and Cancer Together 5 (29.4%)
Other Multimorbid Conditions None 9 (42.9%)
One 9 (42.9%)
Two 3 (14.3%)
DASS-21
On average, anxiety scores were in the moderate range (M = 7.43, SD = 8.80), stress
scores were in the severe range (M = 15.52, SD = 8.02), and depression scores were in the
extremely severe range (M = 14.00, SD = 11.33), though scores on each subscale ranged from

113
normal to extremely severe.
Thematic Analysis
Differences between the four participant groups (see Table 5.1) were identified across
two superordinate themes, with each superordinate theme broken into several additional
subordinate themes (see Figure 5.1). The first superordinate theme, ‘Coping with Cancer’,
describes and compares coping strategies, personal relationships, and fear of cancer
recurrence (FCR) across participant groups. The second superordinate theme, ‘Health Care
System Support Provision’, describes and compares hospital care and support services across
participant groups.
Coping with Cancer
In general, participants in Groups 1 and 2 did not cope as well with their cancer as
participants in Groups 3 and 4. More specifically, participants in Groups 1 and 2 required
more coping strategies and resources to cope with their cancer, while also perceiving and
describing less social support and a higher FCR, than participants in Groups 3 and 4.
Coping strategies.
Most participants in Groups 1 and 2 received formal psychological treatment for
cancer-related anxiety/depression, though participants in Group 2 generally described this
treatment in much less detail and/or were less likely to include this as a coping strategy for
cancer. Participants in Groups 3 and 4 reported the use of less formal coping and self-
management strategies, such as being positive, taking control where possible, keeping busy,
and keeping life as normal as possible, with no treatment for cancer-related anxiety and
depression described by these participants.
With regard to support groups specifically, eight of ten people in Group 1, and four
out of five people in Group 2, attended a support group for cancer-related support. The
participants in Groups 3 and 4 did not attend a cancer-related support group. The majority of

114
Figure 5.1. Thematic map comparing support needs of people with cancer and anxiety/depression.

115
participants attending support groups found them highly beneficial.
Personal relationships.
For participants in Group 1, strong social support was important, with participants
describing how their cancer diagnosis strengthened some relationships but led to the loss of
others (most often friendships). Cancer was sometimes described as changing the individual,
and therefore changing their relationships. Although some participants in Group 2 described
strengthened relationships with their partner or spouse, the majority of these participants
described losing friendships and feeling isolated, with less positive social support mentioned
overall.
I had a … friend the other day, a month or two ago I sent her a message and she asked me how I was
and I just text her back saying I felt like crap and I was angry and everything, and you know you don’t
hear from them for a month. So you’ve got to be careful about what you say otherwise… (ER: Mm.)
people just walk away or they just stay away for a, you know, yeah. (Rosalina, Group 2)
In contrast, participants in Groups 3 and 4 described strong social support and personal
relationships, with no loss of relationships or support from loved ones described.
Fear of cancer recurrence (FCR).
FCR was experienced by participants in Groups 1 and 2, particularly when waiting for
test results and when experiencing physiological symptoms that could be a sign of recurrence.
However, only participants in Group 1 experienced highly maladaptive FCR post cancer
treatment, which was described as occurring once they had time to process what had
happened to them.
It wasn't until after, well after 12 months that I really … started to feel the effects of anxiety and stuff.
(ER: Mm.). When the oncologist visits dropped off, when you didn't need to see a surgeon again. …
When chemo finished … So that's when it started to mess with me. (Freya, Group 1)
If I started to feel an ache or pain somewhere … I would get that focused on it I’d physically make,
make myself … sick, and I’d, you know, I’d feel worse than I was, you know, I’d have tingly feelings
and all sorts of weird feelings that I thought “well I’m going to die” or something… (Eve, Group 1).
Participants in Groups 3 and 4 were much less concerned about FCR, with minor
worry occurring when awaiting test results and when thinking about the possibility that they

116
may miss symptoms of a recurrence.
Health Care System Support Provision
In general, participants in Groups 2 and 4 described experiencing good support from
the hospital and appropriate integration with support services, while participants in Group 1
described a lack of support and information from the hospital and a lack of integration with
appropriate support services. The participant in Group 3 made no specific comments
regarding the hospital system or use of support services.
Hospital care.
Participants in Group 1 generally described a lack of support and information from
the hospital with regard to mental health and support services (though some participants felt
adequately supported). This was particularly highlighted by participants at the post-treatment
stage.
It’s a business … getting the cancer sorted out, and getting the cancer over with, as far as the hospital
and all that is concerned. (ER: Mm.). So, and it was like, once it stopped it was like “ah, what now?”
… I said to my psychologist today, “It was like… the treatment should only be starting now...” (Sienna,
Group 1)
In contrast, participants in Groups 2 and 4 felt that the hospital system was mostly
good, with less needs described.
I went Private, and they were brilliant. … They’d give you this and they’d give you that, and I didn’t
take any of it, because well why, there was people going to be worse off than me. (Quinn, Group 4)
In general, interviews suggested that those with no prior support or treatment in place
for anxiety/depression required more support from the hospital than those with long-term
and/or previous mental illness experiences.
Support services.
A lack of integration with appropriate support services for people with cancer, a lack
of information, and few links with counselling or psychological support services, were
described by multiple participants in Group 1. In particular, Doctors (and the hospital system)
were often described as failing to link their patients with appropriate support services.

117
I don’t know what it would be like for anybody who, um, doesn’t have support. … cause the Doctor
didn’t, nobody sort of said “do you want counselling?”. … there was no offer of counselling. … Even
nobody mentioned the Support Group. (Bella, Group 1)
Doctors need to be more responsible, more proactive ... and stop being this sausage factory of putting
people through as quickly as you possible. … And I think a lot of people probably find it more difficult
after treatment has finished, because there's nothing. … And … the lack of links with people that are
integrative medicine specialists, like um homoeopathic, ah naturopaths, physio … psychologists.
There's just no central link to the whole thing. (Bianca, Group 1)
In contrast, participants in Group 2 (bar one) and Group 4 perceived solid links with
support services, though some of these participants had links with mental health services
already in place prior to their cancer diagnosis.
Discussion
This qualitative study aimed to compare and examine the existing supports and needs
of people with cancer and different histories of depression/anxiety. Our findings suggest that
a person’s support needs may differ based on their history of coping with anxiety/depression
premorbid to their cancer diagnosis. More specifically, we found that participants with
anxiety/depression associated with cancer (no matter the origin or history of their
anxiety/depression) were much more likely to access formal coping strategies such as
psychological treatment for cancer-related anxiety/depression, attend cancer support groups,
lose personal relationships because of their cancer, and experience severe maladaptive FCR,
than participants with anxiety/depression not associated with cancer (no matter the origin or
history of their anxiety/depression). Our results also found that participants with episodic or
cancer-related anxiety/depression felt less well supported by the hospital system and
experienced less links with support services than participants with long-term
anxiety/depression.
Many of the participants in this study had a vulnerability for experiencing
anxiety/depression associated with their cancer due to their history of long-term
anxiety/depression (Mehta & Roth, 2015). Interestingly, however, only some of these
participants experienced cancer related anxiety/depression (Group 2), with these same

118
participants demonstrating poorer coping, needing more anxiety/depression treatment, and
experiencing worse FCR. To better understand why this might have occurred, it is important
to consider how and why those with a premorbid history of long-term anxiety/depression and
anxiety/depression in response to their cancer (Group 2) might differ from those with a
similar history who did not experience any cancer-related anxiety/depression (Group 4).
Participants in Group 2 were generally younger than those in Group 4, had an average of one
additional chronic illness per person (whereas only one participant in Group 4 had an
additional chronic illness), reported they received more misinformation and misdiagnoses
from health professionals, described less positive social support interactions, and perceived
more, and more severe, cancer related psychosocial consequences. This is in line with
previous research that suggests that cancer patients who are younger (Dunn et al., 2013;
Hulbert-Williams, Neal, Morrison, Hood, & Wilkinson, 2012; Linden, Vodermaier,
Mackenzie, & Greig, 2012), have additional chronic illnesses (J. M. Gunn et al., 2010;
Ritchie, Kvale, & Fisch, 2011), less social support (Pinar, Okdem, Buyukgonenc, & Ayhan,
2012; Singer et al., 2012), and more negative illness representations (Richardson et al., 2016),
are more likely to experience higher levels of distress. This suggests that together with these
potential risk factors, people who also have a history of long-term anxiety/depression and
who have not developed coping strategies to manage these issues might be at risk to develop
cancer-related anxiety/depression, and therefore may be more at need for support to prevent
or decrease such anxiety/depression.
Participants with episodic or cancer-related anxiety/depression (Group 1) often felt
less supported by the hospital system and experienced less access to appropriate support and
mental health services than participants with long-term anxiety/depression (Groups 2 and 4).
Our findings suggest that this was likely due to a lack of prior exposure to mental health and
support services, as participants with previous or existing links with such services required

119
less hospital support and service access. One other potential explanation for this pattern of
results lies with the setting for our study, a regional area of Australia (Australian Bureau of
Statistics, 2011) with no cancer-specific hospitals, cancer centres, and a lack of individualised
services and tailored support (particularly psychological services). Research suggests that
people in rural/regional settings often experience worse outcomes, limited access to tailored
cancer-specific hospital care, a lack of psychological support, and few links and referrals to
other key support services (Butow et al., 2012; K. Gunn, Turnbull, McWha, Davies, & Olver,
2013).
Implications
Our study suggests that a person’s history of anxiety/depression may influence how
they cope with their cancer experience. In terms of distress trajectories in cancer patients
(Dunn et al., 2013; Helgeson et al., 2004; Henselmans, Helgeson, et al., 2010; Lam, Shing,
Bonanno, Mancini, & Fielding, 2012), our findings suggest that those who have a history of
anxiety/depression that is unrelated to cancer might be better able to cope with the combined
burden resulting from both the mental and physical illness than those whose
anxiety/depression is cancer related. The knowledge that inexperience in coping with
anxiety/depression might place a person at risk of a trajectory of chronic distress post cancer
could inform targeted implementation of appropriate resources and services for people at risk.
However, more research is needed to determine which facets of a person’s anxiety/depression
history might be most important in predicting such trajectories. Coping repertoire and skills
to manage psychological distress would be particularly worthy of exploration.
In terms of service provision, our study is in line with previous research (K. Gunn et
al., 2013; Rainbird, Perkins, Sanson-Fisher, Rolfe, & Anseline, 2009) and suggests a need for
patients to receive additional support and information from hospitals, as well as referrals to
external mental health and support services where required. However, hospitals often lack the

120
resources to implement such changes, particularly in rural/regional areas. This study suggests
that these limited resources are best directed towards increasing information and links with
support services for people with cancer related anxiety/depression, rather than for those who
report coping well with a history of long-term anxiety/depression. This is because the latter
group often already have existing support systems in place, while people with cancer related
anxiety/depression are distressed, have less social support, and experience more severe FCR.
For the same reasons it is also suggested that health professionals recommend the use of
appropriate support services (including support groups) to people with cancer related
anxiety/depression. Our findings highlight the importance of investigating a cancer patient’s
history of anxiety/depression to determine how much support they may (or may not) require.
Limitations
Although we attempted to differentiate between people with episodic
anxiety/depression and people with long-term anxiety/depression, no clinical diagnostic
measures or criteria were used to assess this during the interview process. Instead, two
researchers (ER and JS – a clinical psychologist) placed participants into groups based on
participant data (demographic and interview). Participants were assigned to groups based
upon consideration of their reported family history of psychological disorders, psychological
responses to past significant life events and premorbid experience of anxiety/depression
generally, as well as their reports of their response to their cancer experience.
Due to the widely varied cancer types, cancer stages, and treatment types, experienced
by our sample, more consensus could potentially have been found with the use of a more
focused sample, such as the inclusion of participants who only have bowel cancer or early-
stage disease (Stage 1). Conversely, our more diverse sample may have led to additional
insights. As our sample provided both overlapping and unique representations across groups,
a good balance between specificity and diversity appears to have been achieved. However, as

121
only one participant had episodic anxiety/depression that was not related to cancer (Group 3),
results from this specific participant category should not be generalised to others in similar
situations.
Conclusions
In conclusion, our study has highlighted the need for both researchers and health
professionals to give more consideration to the origin and history of a person’s
anxiety/depression in order to determine how they might cope with cancer, their support
needs, and the amount of support required during the diagnosis, treatment, and survivorship
phases of cancer.

122
Chapter 6
Discussion

123
The aim of the present thesis was to understand how people cognitively represent
cancer and anxiety/depression and to examine how these illness representations might
influence coping behaviours, self-management strategies, illness outcomes, and support needs
using the Common Sense Model of Self-Regulation of Health and Illness (CSM; Leventhal et
al., 1980). Four complementary studies were conducted to build an evidence base to meet this
aim. Study 1 involved the completion of a systematic review and meta-analysis to synthesise
existing literature on the relationships between illness representations, coping behaviours, and
illness outcomes in people with cancer. Study 2 consisted of a systematic review and meta-
analysis synthesising the findings of the relationships between illness representations, coping
behaviours, and illness outcomes in people with depression (a lack of published studies
precluded a systematic review on studies in people with anxiety). As a first foray into
exploring co-morbid illness representations in people with cancer and anxiety/depression,
Study 3 involved the completion of qualitative interviews with people who had this
combination of illnesses. These interviews were aimed at examining the content of
multimorbid illness representations, as well as analysing how these representations would
impact the use and effectiveness of self-management strategies. Finally, Study 4 examined
how the subjective support needs of cancer patients/survivors differed between people with
varying histories of anxiety/depression (e.g., episodic versus long-term) and how these needs
might fit with a person’s co-morbid illness representations in order to provide suggestions for
how support provision could be improved for this population. The key aims, findings, and
conclusions from each of these studies are summarised in Table 6.1. This discussion chapter
will integrate the main findings from each of these four studies, highlight both the theoretical
and practical implications uncovered by this research, identify areas and considerations for
future research, discuss potential limitations, and draw overall conclusions.

124
Table 6.1
Summary of the Findings in the Present Thesis
Aims Findings Conclusions
Study 1
Chapter 2
To provide a systematic
overview of the
relationships between the
Common Sense Model’s
(CSM) illness
representations and health
and coping outcomes in
people with cancer.
Greater identity, consequences, and emotional
representations, a more chronic timeline, as well as
less illness coherence, personal and treatment
control, was associated with more adaptive coping
behaviours (e.g., cognitive reappraisal) and illness
outcomes (e.g., psychological distress).
Illness representations are key factors to understanding
how individuals respond to cancer, with interventions
aimed at changing or reframing maladaptive
representations required to improve the coping
strategies and illness outcomes of people with cancer.
Study 2
Chapter 3
To provide a systematic
overview of the
relationships between the
CSMs illness
representations and health
and coping outcomes in
people with depression.
More severe consequences were found to be
associated with more coping efforts, while greater
identity, consequences, and emotional
representations, a more chronic timeline, and lower
control were associated with increased psychological
distress.
This review suggests that illness representations are
important for understanding how people respond to
depression, with research examining the effectiveness
of adjusting key representations in CBT-based
interventions required.
Study 3
Chapter 4
To explore the content of
individual’s multimorbid
representations of cancer
and anxiety/depression, as
well as how these relate to
their coping behaviours and
self-management strategies.
The majority of participants perceived cancer and
anxiety/depression as related, though some perceived
them as unrelated or were unsure about their
relationship. When described as related, participants
using adaptive combination self-management
strategies (e.g., meditation) coped better than those
who tried to ease cancer related anxiety/depression
with strategies that could be considered maladaptive
(e.g., internet research).
In order to improve health care interactions and
increase the use of adaptive self-management
strategies, health professionals need to develop a
deeper understanding of patients’ multimorbid
representations of cancer and anxiety/depression, the
effectiveness of combination management for
multimorbid illnesses, and the ongoing challenges
faced by cancer patients and survivors.
Study 4
Chapter 5
To examine and compare
the support needs of people
with cancer and varying
histories of
anxiety/depression in order
to provide suggestions for
improvements in support
and service provision.
Cancer patients with long-term anxiety/depression
that was not associated with their cancer diagnosis
coped best with cancer and experienced less fear of
cancer recurrence. These participants also highlighted
more positive experiences with, and required less
support from, hospitals and support services.
Both researchers and health professionals should
examine a cancer patient’s origin and history of
anxiety/depression in order to facilitate improvements
in coping with cancer, reduce fear of cancer
recurrence, and determine the type and amount of
support needed by a person living with or post a cancer
diagnosis.

125
Summary of the Main Findings
Illness Representations, Coping Behaviours, and Illness Outcomes in People with Cancer,
Anxiety, and/or Depression
In Study 1, Study 2, and Study 3, the illness representation dimensions were related
both to specific coping behaviours and illness outcomes in people with cancer, depression,
and cancer and anxiety/depression. Study 1 found that less perceived personal control over
cancer, less perceived treatment control over cancer, perceptions of a more chronic or
cyclical timeline for cancer, perceptions of more serious consequences of cancer, and a
stronger emotional impact of cancer (higher emotional representations), were associated with
the use of maladaptive coping strategies such as avoidance/denial. In contrast, perceptions of
more personal and treatment control, acute timeline perceptions, less perceived
consequences, and less emotional impact of cancer, were associated with the use of more
adaptive coping strategies such as cognitive reappraisal and problem focused coping. Study 2
included a limited number of studies investigating the relationships between illness
representations and coping behaviours in people with depression. This meant that for the
meta-analysis in Study 2, specific coping behaviours were collapsed into one coping scale
that measured the extent to which participants used or did not use a coping behaviour, making
comparisons with Study 1 difficult. The meta-analysis in Study 2 found that perceptions of
more severe depression related consequences and more perceived treatment control were
related to the use of more coping strategies (both adaptive and maladaptive). However,
similarly to the findings of Study 1, the summary of the studies included in the narrative
review suggests that more perceived personal and treatment control were associated with the
use of more adaptive coping strategies (e.g., treatment seeking, problem solving, active
coping, positive reframing).
With regard to illness outcomes, Study 1 found that more perceived symptoms of

126
cancer (higher identity), perceptions of a more chronic or cyclical timeline for cancer,
perceptions of more severe consequences of cancer, less perceived personal control over
cancer, less perceived treatment control over cancer, and more emotional impacts of cancer
(higher emotional representations), were associated with worse illness outcomes, including
higher anxiety, depression, and psychological distress, as well as poorer psychological well-
being, role functioning, physical functioning, and quality of life. The opposite profile of
perceptions (lower identity, timeline, consequences, emotional representations, and higher
personal and treatment control) was associated with better illness outcomes (less anxiety,
depression, and psychological distress, and better role and physical functioning, and quality
of life). Study 2 found similar associations to those identified in Study 1, with a stronger
emotional impact of depression (higher emotional representations), perceptions of more
depression related symptoms (higher identity), perceptions of more severe depression related
consequences, perceptions of a more chronic timeline for depression, less perceived personal
and treatment control over depression, and less perceived understanding of depression (illness
coherence), associated with higher levels of psychological distress. Overall these findings
were consistent with the existing literature, in which similar associations between illness
representations, coping behaviours, and illness outcomes in people with a variety of chronic
physical and mental illnesses were found (Baines & Wittkowski, 2013; Dempster et al., 2015;
Hagger & Orbell, 2003)
A final important finding from Study 1 pertains to the high rates of heterogeneity that
was identified across several meta-analytic analyses. For example, illness coherence had
particularly high heterogeneity, meaning that associations between coherence and outcomes
were unable to be identified, most likely due to the presence of a moderator. Several other
relationships between illness representations and illness outcomes were found to have high
heterogeneity, and although several potential moderators were identified (e.g., cancer type,

127
cancer stage, treatment type, or treatment toxicity) these were unable to be examined due to
missing and unreported information. The systematic review by Hagger and Orbell (2003) also
found considerable heterogeneity amongst relationships between illness representations,
coping behaviours, and illness outcomes in people with different chronic illnesses. However,
similarly to the findings of Study 1, moderator analyses were unable to be examined due to
the low number of studies in their sample.
Using the CSM as a framework to explore the illness representations of people with
co-morbid cancer and anxiety/depression, Study 3 found both support for the existing illness
representation dimensions as applied to single illnesses, as well as for new multimorbid
representations of illness. Specifically, more symptoms of cancer (higher identity), more
severe consequences of cancer, and less perceived control caused by the cancer, prevented
the use of adaptive coping strategies and were associated with more severe
anxiety/depression. These findings matched those of Study 1 and Study 2, in which identity,
consequences, and control were found to have similar associations with anxiety, depression,
psychological distress, and coping strategies (e.g., lower cognitive-reappraisal and problem-
focused coping) in people with cancer and in people with depression. However, in Study 3
these findings were extended by the existence of subjective representations about
multimorbidity. Study 3 participants were found to think about the relationships between
cancer and anxiety/depression in different ways. While some perceived them as unrelated or
were unsure about their relationship, the majority of participants perceived their cancer and
anxiety/depression as related. These results matched those from a previous study by Mc
Sharry et al. (2013) in people with diabetes and depression. In Study 3, when participants
described cancer and anxiety/depression as unrelated or were unsure about their relationship,
a distant timeline between illness diagnoses, less understanding of anxiety/depression, and
the use of separate coping and self-management strategies for each illness were most often

128
described. Separate self-management strategies for illnesses perceived as unrelated were also
generally described by participants in the study by Mc Sharry et al. (2013). When illnesses
were considered related these links were often described as being causal (Mc Sharry et al.,
2013). For example, some participants believed their cancer caused their anxiety/depression,
while others believed their anxiety/depression caused their cancer. It is important to note that
generally the consequences of cancer and its treatment were described as causing
anxiety/depression, rather than the cancer itself. Both separate and combination coping and
self-management strategies were described by people who perceived their cancer and
anxiety/depression as related, with participants who used adaptive combination strategies
(e.g., meditation) coping better with cancer related anxiety/depression than those who used
maladaptive strategies (e.g., unguided internet research).
Study 3 also identified representations on prioritising illnesses, and participants
identified the illness they found most challenging (cancer or anxiety/depression), with a more
chronic or cyclical timeline, less perceived control, and less understanding (illness
coherence), associated with perceptions of a more challenging illness. These findings were
supported by Bower et al. (2012), who highlighted the importance of perceived control for
illness prioritisation. Which illness a person finds most challenging appears likely to
influence which illness they will prioritise in terms of self-management and treatment (Mc
Sharry et al., 2013; Schüz et al., 2014). Changing perceptions and needs were also identified
across the cancer experience, with different illness representations likely to be present at
different stages of the illness timeline. These changing representations were associated with
changes in coping and self-management strategies. Study 3 also highlighted how
representations related to fear of cancer recurrence (FCR) often lead to the use of maladaptive
coping and self-management strategies. For example, those who perceived a cyclical timeline
for cancer, more severe consequences of cancer, less perceived control over cancer, and less

129
understanding (illness coherence) of cancer, were more likely to have high FCR, and to use
coping and self-management aimed at reducing this FCR. However, these strategies were
often maladaptive (e.g., constantly calling or visiting the doctor), suggesting the need for
appropriate intervention in this population. These findings from Study 3 are also related to
the findings of Study 1, with a more cyclical timeline, more severe consequences, less
perceived control, and less illness coherence, associated with higher levels of anxiety in
cancer patients (anxiety is a crucial aspect of FCR; Lee-Jones et al., 1997; Simard et al.,
2010), as well as the use of less adaptive coping strategies (e.g., a more cyclical timeline is
related to increased avoidance/denial).
Study 4 extended this perspective by examining which illness representations
influenced the support needs of people with cancer and varying histories of
anxiety/depression. In order to examine these differences, participants were placed into four
groups. These groups were created based on whether participants had episodic
anxiety/depression or long-term anxiety/depression, and whether or not participants perceived
their anxiety/depression to be associated with their cancer. Perceptions of more, and more
severe, psychosocial consequences of cancer in people with long-term anxiety/depression,
were associated with poorer coping, a need for more anxiety/depression treatment, and worse
FCR. Further, participants with episodic or long-term anxiety/depression that did not
experience any cancer related anxiety/depression perceived greater control over their
illnesses, leading to better coping and outcomes. Finally, participants with long-term
anxiety/depression generally perceived more control over their illnesses and had a better
perceived understanding of their illnesses (more illness coherence), with these participants
requiring less support from the hospital system and support services. In contrast, those
participants with episodic or cancer related anxiety/depression often perceived less control
over and understanding of their illnesses, with less hospital support, access to external

130
support services, and access to mental health services described.
In summary, all four studies provide strong evidence for the applicability of the CSM
to people with cancer and anxiety/depression, with the CSMs illness representation
dimensions found to be particularly important for predicting the health and coping outcomes
of the people in this population. The most important predictors of coping behaviours, illness
outcomes, and support needs, included timeline, consequences, control, and illness
coherence, with support found for each of these dimensions across all four studies. Other
illness representation dimensions were found to be important across specific studies only
(identity, Studies 1, 2, and 3; cause, Study 3). Finally, while emotional responses (emotional
representations) to illnesses (e.g., fear) were found to influence coping and self-management
strategies throughout this thesis, associations between emotional representations and illness
outcomes were difficult to disentangle in studies that examined anxiety/depression as an
illness (rather than an outcome).
Support Needs for People with Cancer and Anxiety/Depression
Study 3 and Study 4 demonstrate the need for people with cancer and
anxiety/depression to receive better support, with these studies able to provide insights into
the specific support needs of people with these illnesses. Similarly to previous research,
Study 3 found that illness representations and associated support needs change throughout the
cancer experience, with different needs identified at different stages of illness timeline (e.g.,
at diagnosis versus during treatment versus post treatment) (Fischer et al., 2013; McDowell,
Occhipinti, Ferguson, Dunn, & Chambers, 2010). Because of this, continued support for
cancer patients and survivors with anxiety/depression is paramount, with more consideration
of these needs at key stages of the cancer experience required by health professionals.
Support needs were also found to differ based on which illness participants found more
challenging (anxiety/depression or cancer), with more needs associated with the illness they

131
found more challenging. Further, Study 3, Study 4, and previous research have found that
higher levels of FCR have been associated with more support needs from the hospital,
external support services, and health professionals (Simard et al., 2013). Both Studies 3 and 4
also found that people with extremely severe cases of FCR often constantly contact health
professionals for advice, and can even require hospitalisation. In order to address the needs of
people with cancer and anxiety/depression, Study 3 suggested that health professionals
should increase their understanding of the illness representations held by people with these
illnesses.
Study 4 found differences between the support needs of people with cancer and
episodic anxiety/depression and people with cancer and long-term anxiety/depression, as well
as between people with anxiety/depression related to (or caused by) their cancer and people
with anxiety/depression that was not related to their cancer. More specifically, participants
with both episodic and long-term anxiety/depression that was perceived as associated with
their cancer coped less well with their cancer, required more psychological treatment for their
anxiety/depression, attended more cancer support groups, lost more personal relationships
because of their cancer, and experienced worse FCR, than participants with
anxiety/depression that was not associated with their cancer. Further, people with episodic
cancer related anxiety/depression generally felt less supported by the hospital system and
experienced fewer links with appropriate support services than people with long-term
anxiety/depression. This suggests that people with episodic cancer related anxiety/depression
have a need for increased access to relevant support services. Overall, despite a large body of
literature aimed at reducing support needs and improving illness outcomes in people with
cancer, it appears that there is still room for improvement in this area (Carey et al., 2012;
Galway et al., 2012). More knowledge about the content of illness representations appears
likely to deepen our understanding of the needs of people with cancer and anxiety/depression,

132
as well as to provide insights into how to address such needs.
Theoretical Implications and Future Research Directions
Role of the CSM in Cancer and Anxiety/Depression
The Common Sense Model of Self-Regulation of Health and Illness (CSM; Leventhal
et al., 1980) is the most widely used model to examine the cognitive processes underlying
coping behaviours, self-management strategies, and illness outcomes in people with chronic
illness. All four of the studies in this thesis found relationships between the CSMs illness
representation dimensions, coping, and outcomes, and provided support for the CSM as an
appropriate framework for examining the content of illness representations. Additionally,
these studies support the CSM as a basis for examining how such illness representations
relate to coping and outcomes in people with cancer and anxiety/depression. Each of the
distinct illness representation dimensions identified by the model and its associated
questionnaires (Leventhal et al., 1980; Moss-Morris et al., 2002; Weinman et al., 1996) were
supported by the present thesis, though the extent to which each representation was supported
varied across and between studies. These representations were also found to be associated
with coping behaviours and illness outcomes in people with cancer, people with depression,
and people with co-morbid cancer and anxiety/depression. In general, the results of this
thesis, as well as the results of previous review studies (e.g., Baines & Wittkowski, 2013;
Dempster et al., 2015; Hagger & Orbell, 2003), have found that a more positive profile of
representations is associated with the use of more adaptive coping behaviours and better
illness outcomes, while a more negative profile of representations is associated with the use
of more maladaptive coping behaviours and worse illness outcomes. Although the findings
for these relationships were well supported across people with cancer (Study 1) and
depression (Study 2) there was a lack of existing research examining these relationships in
people with anxiety, with only one study including participants with anxiety located across

133
the systematic search process included as a part of Study 2 (Hunot et al., 2007). Why this
may be the case is not evident, and future research is therefore needed to investigate the
relationships between the illness representation dimensions of the CSM, coping behaviours,
and illness outcomes in people with anxiety specifically.
The CSMs multi-directional and self-regulative feedback loop suggests that cognitive
and emotional responses to an illness guide coping and self-management strategies in
parallel, with these strategies later appraised in terms of their success or failure for
controlling the illness and its consequences. This appraisal process then leads to the
refinement of illness representations, coping behaviours, and self-management strategies,
where the feedback loop can start again (Diefenbach & Leventhal, 1996; Hale et al., 2007;
Leventhal et al., 1998). Study 3 provided support for this feedback loop, where evidence for
changing illness representations, support needs, coping behaviours, and self-management
strategies throughout the cancer experience were highlighted. This is in line with research by
Mc Sharry et al. (2013), who found that the self-management behaviours associated with
illness representations underwent constant appraisal. When coping behaviours were appraised
as successful, this positive appraisal was found to reinforce patients’ confidence in their
multimorbid representations (e.g., that their anxiety/depression was caused by the
consequences of their cancer). Further, patients with less clear representations expressed
unclear goals for self-management strategies, which in turn resulted in evaluating these
strategies as less successful (Mc Sharry et al., 2013). Overall, these findings provide support
for the CSMs feedback loop in suggesting that individuals act as problem solvers who
constantly appraise and alter their representations and coping behaviours. However, in order
to gain a more systematic understanding of specific changes in illness representations and
associated coping behaviours over time, as well as how this feedback loop might work for
people with multiple illnesses (e.g., co-morbid cancer and anxiety/depression), longitudinal

134
studies are required (Mc Sharry et al., 2013). These studies should also focus on how the
existence of complex multimorbid illness representations and the use of
synergistic/antagonistic self-management strategies might influence the functioning of the
CSMs feedback loop.
Expanding the CSM
A number of multimorbid illness representations were identified in Study 3, including
varied representations of the relationships between (or causes of) cancer and
anxiety/depression, beliefs about FCR, perceptions of participants most challenging illness,
and changing beliefs across the illness experience. In addition, both Study 3 and Study 4
highlighted the importance of examining a person’s history with their illnesses (e.g., which
illness came first). The majority of these multimorbid representations were supported by
previous qualitative research (Bower et al., 2012; Mc Sharry et al., 2013). Importantly, each
of these multimorbid factors and/or representations were shown to influence coping and self-
management strategies, with Schüz et al. (2014) suggesting that the way in which people
operationalise their illnesses (e.g., combined multimorbid representations versus illness-
specific representations) might be dependent on the specific illness outcome under
examination (e.g., medication adherence versus physical functioning), though more research
is needed to examine such relationships. Although the CSM takes into account some
multimorbid factors (e.g., prior illness experience), these findings suggest that the CSM may
need to be adjusted or expanded to be more applicable to people with multiple illnesses. In
particular, the inclusion of specific multimorbid illness representations including perceptions
of the connections, relationships, and causes between illnesses, priorities amongst illnesses,
and synergies and antagonisms in the management of illnesses, is recommended, as these
were the most commonly identified multimorbid representations across studies (Bower et al.,
2012; Mc Sharry et al., 2013).

135
The development of standardised measures would allow for easier examination and
assessment of multimorbid illness representations. Currently, the most widely used measures
of illness representations are the illness perception questionnaires (Broadbent et al., 2006;
Moss-Morris et al., 2002; Weinman et al., 1996); however these questionnaires need
adaptation to be applicable for multiple illnesses. C. J. Gibbons et al. (2013) proposed a new
measure of illness perceptions for people with multiple illnesses based on these existing
questionnaires and previous qualitative research. Their Multimorbidity Illness Perceptions
Scale (MULTIPLeS) consists of five individual subscales including emotional
representations, treatment burden, prioritising conditions, causal links, and activity
limitations, as well as a summary scale comprising all items from each subscale that
measures the overall perceived impact of multimorbidity. Four subscales (emotional
representations, prioritising conditions, causal links, and activity limitations) were supported
by the results of Study 3, while the prioritisation and causal links scales were also partially
supported by the results of Study 4. Neither Study 3 nor Study 4 provided support for the
treatment burden scale, with multimorbid medication burden not arising as an important
concern in studies of people with cancer and anxiety/depression (Studies 3 and 4). As FCR is
a cancer specific consequence, it was not considered for inclusion in the MULTIPLeS. If a
specific measure for people with cancer and anxiety/depression was to be created, the
inclusion of a subscale that specifically measures FCR, or items measuring FCR as part of an
emotional representations subscale, should be considered. Overall, findings suggest that the
MULTIPLeS may be appropriate to examine the types of research questions addressed in
Study 3, Study 4, and previous research (Bower et al., 2012; Mc Sharry et al., 2013).
However, as the MULTIPLeS has not yet been validated for people with co-morbid cancer
and anxiety/depression, future research is needed to assess its relevance for answering such
questions in this particular population.

136
Other specific measures of multimorbid illness representations are also beginning to
be developed, with Mc Sharry et al. (2015) creating the Diabetes and Depression
Representation and Management Questionnaire (DDRMQ). This questionnaire consists of ten
subscales including separate representations, negative linked representations, incoherent
representations, separate management, linked management integration, linked management
struggle, general medication negative effects, general medication burden, diabetes medication
worry, and depression medication worry. The majority of these subscales (separate
representations, negative linked representations, incoherent representations, separate
management, linked management integration, linked management struggle) appear
transferrable to people with cancer and anxiety/depression, as they are supported by the
findings of Study 3 and Study 4. Study 3 also partially supported each of the medication
related subscales (general medication negative effects, general medication burden, and
medication worry). However, as this questionnaire was developed specifically for diabetes
and depression, cancer specific representations (e.g., FCR representations) were not included.
Similarly to the MULTIPLeS, the DDRMQ, if adapted for cancer and anxiety/depression,
may be useful for examining the content of illness representations and their relationships with
self-management strategies. Nevertheless, the applicability of both the MULTIPLeS and the
DDRMQ (altered for people with cancer and anxiety/depression) would need to be
investigated in people with cancer and anxiety/depression before either could be used as an
appropriate measure of multimorbid illness representations in this population. If neither prove
to be appropriate, then a similar more specific questionnaire could be created for people with
cancer and anxiety/depression (as has been done with the DDRMQ).
Practical Implications and Future Research Directions
Future CSM Interventions
There is an increasing interest in designing interventions based on the CSM to

137
improve coping strategies and illness outcomes in people with chronic illnesses. A recent
systematic review by Jones, Smith, and Llewellyn (2015) highlights that interventions
informed by the CSM have the potential to improve adherence behaviours in people with
various chronic illnesses (however, no studies of people with cancer, anxiety, or depression
were included). In this review, interventions that had the largest effect on behaviour were
those that were delivered by psychologists, involved multiple sessions, included information
about antecedents, reattribution, and action planning, and targeted control beliefs (matching
the findings from the studies in the present thesis). Illness representation based interventions
have also been successful in changing outcomes other than adherence. For example, Keogh et
al. (2011) conducted a family-based intervention aimed at changing negative/inaccurate
illness representations. They found this intervention improved illness self-management,
psychological well-being, diet, exercise, and family support in people with poorly controlled
type 2 diabetes. Further, Broadbent et al. (2009) found that if illness representations of people
with myocardial infarctions were successfully changed, people gained a better understanding
of illness information, had higher intentions to attend rehabilitation classes, less anxiety about
returning to work, exercised more, and called their GP less. Based on these findings and on
the findings of the current thesis, it is suggested that interventions informed by the CSM have
the potential to improve coping and outcomes for people with chronic illnesses. However,
such interventions for people with cancer should consider several cancer specific factors that
may influence the illness representations in this population. For example, representations that
would generally lead to more negative illness outcomes for a person with a chronic illness
(e.g., representations of a more chronic timeline and severe consequences) may be realistic
for a person with cancer, particularly when at an advanced or metastatic stage. In these cases,
it may be better to target emotional responses to cancer (emotional representations) and focus
on facilitating the use of more adaptive coping behaviours. Targeting emotional

138
representations might be particularly important for people with cancer and
anxiety/depression, as relieving anxiety/depression might improve a person’s ability to cope
with cancer. In some cases, it may also be beneficial to target different aspects of certain
illness representations. For example, although increasing perceived levels of personal or
treatment control over the cancer may not be possible, increasing control over other key
factors (e.g., everyday events such as pain management) has been found to improve both
physical and psychological outcomes (Sand, Olsson, & Strang, 2009; Thompson, Sobolew-
Shubin, Galbraith, Schwankovsky, & Cruzen, 1993).
Support for the use of the CSM as a basis for interventions in cancer patients was
provided by Stanton et al. (2013), who synthesised information from 16 randomised
psychosocial intervention trials in adults diagnosed with cancer. Their review concluded that
altering cancer related illness representations in psychosocial interventions has benefits for
cancer patients. Two interventions included in this study specifically attempted to use the
CSMs illness representation dimensions to improve illness outcomes (Traeger et al., 2013; S.
Ward et al., 2008). A representational intervention to decrease cancer pain (RIDcancerPain)
was created and conducted by S. Ward et al. (2008). This study used an approach to patient
education that involved assessing a patient’s illness representations (based on the CSMs
representation dimensions) and providing educational information to reduce any
misconceptions described by patients (Arida, Sherwood, Flannery, & Donovan, 2016;
Donovan & Ward, 2001; Donovan et al., 2007). The RIDcancerPain was delivered in one
face-to-face psychoeducational session lasting between 20 and 60 minutes. Five steps were
completed beginning with a representational assessment of current beliefs about cancer pain
with respect to identity, cause, timeline, consequences, and cure/control. An exploration of
any misconceptions and a discussion of any problems arising from holding these
misconceptions was then conducted. Following this, replacement information was provided,

139
and finally patients were given an opportunity for clarification, and a summary of the session.
This intervention program was found to reduce existing barriers (misconceptions associated
with specific illness representations) and pain severity in people with metastatic cancer,
though several illness outcomes remained unimproved by the intervention (e.g., overall well-
being). These findings by S. Ward et al. (2008), along with the findings of the present thesis,
suggest that interventions aimed at adjusting inaccurate or maladaptive illness representations
are likely to be beneficial for improving outcomes in people with cancer. However,
interventions examining which illness representations are most amenable to change, as well
as which outcomes might be most improved, are required.
A more recent intervention study in men with prostate cancer by Traeger et al. (2013)
examined whether changes in illness representations would mediate intervention-based
improvements in emotional well-being. Their cognitive-behavioural stress management
(CBSM) intervention involved ten weekly two hour sessions focusing on stress management
and health maintenance through training in relaxation, cognitive restructuring, problem-
solving, coping skills, interpersonal skills, and enhancing support networks. Illness
perceptions were specifically targeted through psychoeducation about prostate cancer,
cognitive restructuring of cancer related illness representations, and discussion of cancer
related experiences, and were designed to normalise experiences and address self-perceptions
in the cancer context. The CBSM intervention was found to change key illness perceptions
(perceived treatment efficacy or treatment control and understanding of the cancer experience
or illness coherence), which in turn led to improvements in emotional well-being. Traeger et
al. (2013) suggested that interventions might be further improved by including more explicit
strategies for modifying illness representations, as well as by exploring how such
interventions can influence representations that change over time. Study 3 supported these
suggestions, further highlighting how representations and needs change across the cancer

140
experience, with changes in illness representations also associated with changes in coping
and self-management strategies. Specific research into how future interventions might be able
to address such changes over time is required in order to maximise their effectiveness for
improving coping and outcomes.
Research using CSM based interventions has led to some promising improvements in
illness outcomes in people with chronic illnesses including cancer. However, interventions
that specifically aim to challenge and modify maladaptive or unrealistic illness
representations in people with cancer and anxiety/depression have yet to be created and
trialled, and therefore the creation and assessment of such interventions is an important area
for future research. The studies in this thesis, as well as the findings from research previously
highlighted, provide some suggestions for which illness representations would be best to
target in future interventions for people with cancer, anxiety, depression, and co-morbid
cancer and anxiety/depression. For example, interventions that aim to adapt causal
perceptions to be more accurate, timeline perceptions to be less cyclical and chronic, decrease
perceptions of the amount and severity of the consequences associated with cancer, increase
perceived personal and treatment control over cancer, and decrease the perceived emotional
impacts of cancer, may increase the use of adaptive coping strategies, reduce poor illness
outcomes such as psychological distress, and improve quality of life. Future interventions
based on the CSM for people with cancer and anxiety/depression should also take into
account the existence of multimorbid representations, including causal representations (e.g.,
did one illness cause the other illness), which illness a person prioritises or finds most
challenging, beliefs about FCR, and the synergisms/antagonisms associated with self-
managing multiple illnesses.
With regard to how such interventions might best target these representations, it is
suggested that a combination of psychoeducation from cognitive-behavioural therapy (CBT;

141
A. T. Beck et al., 1979) and the education based Representational Approach (RA; Donovan &
Ward, 2001), might be effective for improving coping and outcomes in people with cancer
and anxiety/depression. In CBT-based treatments (A. T. Beck et al., 1979; J. S. Beck, 2011) a
client’s negative and/or inaccurate thoughts and beliefs are modified in order to change and
improve emotional responses and behaviours. Before modifications can be made, the patient
must become familiar with such thoughts and how they impact emotions and behaviours,
with the CSM providing an evidence based starting point for examining the content of such
thoughts. These negative automatic thoughts can then be challenged through
psychoeducation, reality-testing, and generating alternatives. For example, consider a person
who holds a strong belief that their cancer will return (high FCR), who perceives a low
amount of control over their cancer, and who self-diagnoses any minor ache or pain as a sign
of a cancer recurrence. For this person, reality-testing these beliefs (e.g., how likely is it that a
headache is a sign of your cancer returning), and then providing psychoeducation (e.g.,
providing information about how rare a recurrence of that type of cancer would be), could
change these representations to be more accurate and adaptive. However, although CBT has
been found to be effective for changing specific underlying beliefs in anxiety and depression
(Hollon et al., 2005), therapeutic interventions have yet to use CBT for targeting illness-based
cognitions.
The CSM was used to guide the development of the Representation Approach (RA) to
patient education (Arida et al., 2016; Donovan & Ward, 2001; Donovan et al., 2007). This
approach involves investigating the patients existing illness beliefs using key dimensions
from the CSM: identity, cause, timeline, consequences, and control/cure, and explores any
misconceptions, gaps, or confusions described. After discussing the consequences of these
representations for behaviours, information that fills gaps in knowledge, clarifies confusions,
and replaces misconceptions, is provided. The RA has shown potential for changing illness

142
representations and improving illness outcomes by challenging and altering maladaptive
cognitions in people with cancer, with early interventions using the RA showing promise
(e.g., S. Ward et al., 2008).
A combination of CBT and the RA may prove effective for improving coping and
outcomes in people with cancer and anxiety/depression, as previous research has
demonstrated that relatively brief psychoeducational interventions based on the CSM are
useful for identifying and modifying illness representations, and in turn improving coping
and outcomes (Petrie & Weinman, 2012). However, any intervention aimed at improving the
health and coping outcomes of people with cancer and anxiety/depression must also consider
how illness representations change over time, as well as how a person’s illness history can
influence coping and support needs (highlighted by Studies 3 and 4). For example, people
with cancer and long-term anxiety/depression may be less likely to require assistance from
the hospital system and other external support services than people with cancer and episodic
anxiety/depression. In summary, although psychosocial interventions aimed at changing
patients’ illness representations have shown promise, more research investigating the types
and timing of such interventions, as well as the effectiveness of such interventions in people
with cancer and anxiety/depression, are required.
Health Professionals’ Understanding of Illness Representations
It is important that health care providers have a good understanding of a patient’s
illness and a patient’s illness beliefs (Street, Makoul, Arora, & Epstein, 2009). However, the
results of Study 3 and Study 4 suggest that patients do not believe this is the case. Therefore,
in order to better support people with cancer and anxiety/depression, health professionals
need to gain a better understanding of the illness representations experienced by people with
these illnesses, and how these representations might be associated with the use of particular
coping strategies and with specific illness outcomes. Education for health professionals

143
regarding the content of such representations (individual and multimorbid), as well as the
importance and impact of multimorbidity itself, would be important to improve patient
coping and outcomes. For example, Study 3 and Study 4, as well as previous research by
Bower et al. (2012) and Mc Sharry et al. (2013), suggest that if health professionals were
aware of which illness their patients perceived as most challenging and which illness they
would prioritise, they would have a clearer picture of where support is most needed for each
patient. Previous research has also highlighted the importance of a shared understanding
between health professionals and patients for improving patient outcomes (Street et al.,
2009). Further, health professionals should be aware that these illness representations will
change over time, and therefore continued assessment would be required. Studies 3 and 4, as
well as research by McDowell et al. (2010), suggest that these assessments might be
particularly important at key stages of an illness experience, for example when a person with
cancer moves from the treatment phase to the survivorship phase. As well as providing a
solid footing for interventions with patients, the Representational Approach (Donovan &
Ward, 2001) may provide a good basis for improving a health professionals understanding of
illness representations. This approach to patient education offers a theoretically based model
that can help support health professionals to develop a shared understanding of a person’s
illness representations with the aim of collaboratively developing personalised plans for self-
management behaviours (Arida et al., 2016).
Challenge of Co-Morbid Cancer and Anxiety/Depression for Support Provision
Because cancer and anxiety/depression often co-occur (Massie et al., 2011;
Mystakidou et al., 2005; Roy-Byrne et al., 2008), and because these co-morbid conditions are
often associated with worse outcomes for patients (L. F. Brown et al., 2010; Mystakidou et
al., 2005; Pasquini & Biondi, 2007), it is important that health professionals ask about a
person’s past and present mental health when they have been diagnosed with cancer. Study 4

144
showed that examining a person’s history with anxiety/depression may lead to important
insights into how they might cope with their cancer diagnosis, and the amount and type of
support required. However, research has shown that oncologists in particular often require
further training to better recognise patient distress and patients’ need for further counselling
(Gouveia et al., 2015; Söllner et al., 2001). To improve a health professional’s ability to
identify patient distress, as well as to improve their knowledge of when a patient needs to be
referred to additional support services or counselling, validated screening tools such as the
revised Beck Depression Inventory (BDI-II; A. T. Beck, Steer, & Brown, 1996) or the
Depression Anxiety Stress Scale (DASS; Lovibond et al., 1995) should be utilised. Further,
specific training programs for health professionals that focus on providing appropriate
relational and psychological evaluation skills, including taking a detailed history of illnesses
as suggested by the findings of Study 4, could be implemented to improve accurate detection
of distress. Future research should evaluate the effectiveness of these different procedures in
health professionals who care for people with cancer and anxiety/depression.
A further challenge for people with co-morbid cancer and anxiety/depression is self-
management, as the symptoms of one condition (or the side-effects of the treatment of one
condition) might interfere with the coping or self-management strategies for the other
condition. For example, Study 3 found that for a person who uses exercise to help cope with
their depression, a cancer diagnosis might limit their ability to exercise and therefore
exacerbate their depression. These interactions have also been highlighted by previous
research in people with co-morbid diabetes and depression: Mc Sharry et al. (2013) found
that although exercising lowered the sugar level of a person with diabetes, their depression
made it difficult for them to find the energy for exercise. Health professionals should be
mindful of the management difficulties or antagonisms that occur in patients with multiple
illnesses so that alternative management strategies can be implemented. As well as being

145
made aware of the potentially negative impacts of multimorbidity on coping and self-
management strategies, health professionals should also be aware of the potential benefits of
synergistic combination management strategies, as these are likely to improve patient
outcomes across multimorbid illnesses. For example, Study 3 highlighted how one participant
found meditation beneficial for reducing her anxiety and improving cancer related
consequences, while Bower et al. (2012) described how one participant felt that exercise
improved both her mood (depression) and arthritis. However, more formal studies of these
synergistic effects are required before specific recommendations can be made.
The survivorship phase (Aziz, 2007) is another important part of the cancer
experience, with a need for more support at this time highlighted by the findings of Study 3.
This post treatment or remission stage of the cancer experience is often described as being
even more difficult than peri treatment, with FCR, anxiety, and depression often worsening at
this stage (Baker, Denniston, Smith, & West, 2005; Harrington et al., 2010). The participants
in Studies 3 and 4 described a lack of support at this post treatment stage, demonstrating the
need for many cancer survivors to find both their own coping strategies, as well as access to
appropriate support services and allied health professionals. These findings are in line with
previous research, as FCR and uncertainty about the future are often highlighted as unmet
needs for cancer patients and survivors (Harrison et al., 2009; McDowell et al., 2010).
Although not experiencing FCR, patients with metastatic cancer often describe constant
concerns about the progression of their cancer, as well as difficulties with self-management
of symptoms, treatment side effects, mental health, and coping with the prospect of death (G.
Fan, 2007; Irving & Lloyd-Williams, 2010; Rainbird et al., 2009; Schofield, Carey, &
Aranda, 2006). Overall, these findings suggest that the mental health and support needs of
cancer patients and survivors need to be better monitored across the entire cancer experience
rather than purely at the diagnosis or treatment stage, with more support particularly required

146
for people with cancer and anxiety/depression post treatment.
Provision of Appropriate Support and Information
Connecting cancer patients and survivors with appropriate support services and allied
health professionals is extremely important for the promotion of positive outcomes (K. Gunn
et al., 2013; Pascoe, Edelman, & Kidman, 2000). However, the studies in this thesis found a
lack of integration between people with cancer and anxiety/depression and appropriate
support services and information provision. Specifically, health professionals and hospitals
often failed to connect people with cancer and anxiety/depression to appropriate support
services at key stages of the cancer experience. This lack of support and information was
particularly evident immediately post treatment, when the majority of contact with hospitals
and health professionals had ended. Inadequate access to appropriate support services has
been found to impair patient outcomes, increase distress, and increase FCR (Pascoe et al.,
2000; Wang et al., 2016). Therefore, to improve information provision and support for people
at this time in particular, the distribution of a tool-kit or information pack might be beneficial
(Jefford & Tattersall, 2002). This pack could include information on common thoughts and
emotions post treatment (cognitive and emotional representations guided by the findings of
Study 3), what to do when experiencing such thoughts and emotions, and information on
where and how to access appropriate support services when required. The findings of Studies
3 and 4 suggest that this type of information pack may be particularly relevant for those
people in regional/rural settings where tailored access to psycho-oncological support is
limited (Butow et al., 2012; K. Gunn et al., 2013; Underhill et al., 2009).
Limitations
In addition to the limitations that have been discussed in previous chapters, several
more general limitations and methodological issues must be considered. These limitations are
discussed below.

147
Sample
Due to the reasonably small number of studies located in Study 1, and the limited
participant pool for Studies 3 and 4, each of these studies included participants with varying
cancer types (e.g., breast or bowel), stages (e.g., early-stage or metastatic), treatments (e.g.,
chemotherapy or surgery), treatment severity/toxicity (e.g., targeted cancer therapy or
traditional chemotherapy), and treatment stages (e.g., peri-treatment or post-treatment). It is
highly likely that each of these factors would impact the illness representations of people with
cancer or with cancer and anxiety/depression, as psychological distress (including anxiety
and depression) and adaptability to cancer have been shown to vary between cancer types and
cancer stages (Admiraal et al., 2013; Linden et al., 2012; Strada & Sourkes, 2010; Zabora,
Brintzenhofeszoc, Curbow, Hooker, & Piantadosi, 2001), as well as between treatment types
and toxicity of treatment (Admiraal et al., 2013; Hack et al., 2010). For example, Linden et
al. (2012) found that people with lung, gynaecological, or haematological cancer reported the
highest amount of distress at diagnosis, while cancer patients who received treatment other
than surgery (e.g., chemotherapy or radiotherapy) were found by Admiraal et al. (2013) to be
at a higher risk for experiencing psychological distress. However, these factors were unable
to be examined in Study 1 through the use of moderator analyses due to the provision of
insufficient data by studies included in the meta-analyses. These factors were also unable to
be examined in Studies 2 and 3 due to the limited participant pool, though the overlapping
representations and support needs identified suggests these representations and needs may
often be similar across varying cancer types, stages, and treatments. To find out how these
factors might influence illness representations, self-management strategies, and support
needs, future research should consider comparing people with varying cancer types, stages, or
treatments.
A further limitation lies in the setting and location of Study 3 and Study 4. The

148
majority of Tasmania is considered a regional area (Australian Bureau of Statistics, 2011) and
has no cancer-specific hospitals or cancer centres, as well as a lack of individualised support
and limited access to psychological services. As people living in such regional and remote
areas often have different outcomes, needs, and access to services than those living in major
urban or metropolitan areas (Butow et al., 2012; Underhill et al., 2009), it is likely that the
results of the present thesis (particularly Studies 3 and 4) will have limited applicability for
people living outside of regional areas. Therefore, the results of Study 3 and Study 4 should
not be generalised to such populations.
The systematic literature search conducted in Study 2 only found one study that
examined the relationships between illness representations, coping behaviours, and illness
outcomes in participants with anxiety, demonstrating a dearth of research in this area.
However, depression and anxiety often occur concurrently, with substantial overlap between
these illnesses identified (T. A. Brown, Campbell, Lehman, Grisham, & Mancill, 2001; Clark
& Watson, 1991; Pomerantz & Rose, 2014; Zbozinek et al., 2012). This suggests that similar
relationships may exist between illness representations and anxiety as between illness
representations and depression. Nonetheless, more studies are needed to confirm whether this
is true, and until then caution should be taken when making inferences regarding the
relationships between illness representations, coping behaviours, and illness outcomes in
people with anxiety.
Studies 3 and 4 focused on people with depression and/or anxiety and an analysis of
differences between people who had only anxiety, only depression, or both anxiety and
depression was not conducted. This means that important differences may have been missed
between such groups. However, as previously identified, anxiety/depression have been shown
to have substantial overlap, meaning that the differences between these illnesses may be
minimal, though future research would be needed to establish whether this is true. Further,

149
Study 3 did not make clear differentiations between those with diagnosable depression or
anxiety and those with ‘normal’ psychological distress associated with the cancer experience,
and while Study 4 did attempt to differentiate between people with episodic
anxiety/depression and people with long-term anxiety/depression, no clinical diagnostic
criteria or measures were used to assess these factors during the interview process. Instead,
people were eligible to participate if they reported a previous diagnosis of, or previous
treatment for, anxiety/depression via self-report. Although comparative studies have found
self-reports to be relatively consistent with objective illness data (Chaudhry, Jin, & Meltzer,
2005), future research should confirm the presence of multimorbidity using objective
measures such as medical records or diagnoses from general practitioners (Fortin et al.,
2004).
Research Design
Studies 3 and 4, as well as the majority of studies included in Study 1 and Study 2,
were cross-sectional in nature, meaning that judgements regarding causality, predictive
relationships between variables, and changes over time were precluded. However, Study 1
did use a moderator analysis to compare whether research design (cross-sectional versus
longitudinal) influenced the effect sizes of the relationships between illness representations
and coping behaviours and illness representations and illness outcomes. Overall these
analyses suggested that relationships between illness representations, coping behaviours, and
illness outcomes in people with cancer were mostly stable over time, though slightly smaller
in effect. Further, Studies 3 and 4 found that illness representations and self-management
strategies were likely to change over time, though this information was provided by self-
report and therefore caution should be taken if generalising such results. Future studies
should employ longitudinal research designs to determine how illness representations, coping
behaviours, and illness outcomes might change over time in people with cancer and

150
anxiety/depression.
There is currently no known existing research examining the content of specific
illness representations or the relationship of these illness representations to coping and self-
management strategies in people with co-morbid cancer and anxiety/depression. Furthermore,
there is a lack of research examining how the support needs of people with cancer vary based
on their history with anxiety/depression. Therefore, qualitative research methods were
employed to explore such representations, strategies, and needs. Although the use of
qualitative methods have been increasingly accepted for exploratory research (Michell,
2004), at times the use of such methods can be seen as a limitation, particularly when poorly
constructed and lacking theoretical and analytical detail (Collingridge & Gantt, 2008). In the
present thesis, qualitative methods were deemed appropriate for use in Studies 3 and 4, as
exploration of a relatively new area of research was required. Further, the Consolidated
Criteria for Reporting Qualitative Research (COREQ; Tong et al., 2007) was used in these
studies to ensure the appropriate standards for qualitative research were met. A further
limitation of qualitative research is the potential for subjective researcher perceptions to
unknowingly influence thematic analysis, though as Studies 3 and 4 were conducted from a
subtle realist viewpoint, subjective researcher perceptions were constantly acknowledged
throughout the analysis process (Mays & Pope, 2000). Finally, the possibility of self-report or
recall bias by the participants in Studies 3 and 4 must also be considered as a potential
limitation of those studies. Overall, despite the possible limitations associated with the use of
qualitative research, important implications were able to be drawn from these studies, though
caution must be taken when generalising such results. Future research should address these
limitations by using experimental or questionnaire-based research to confirm the findings
from Studies 3 and 4.

151
Conclusions
This thesis has demonstrated the importance of understanding subjective illness
representations for facilitating better coping behaviours, self-management strategies, illness
outcomes, and access to support services in people with cancer and anxiety/depression.
Further, the CSM was shown to provide a strong theoretical basis from which to explore such
representations. Illness representations including timeline, consequences, personal control,
and illness coherence, were found to have important associations with coping behaviours and
illness outcomes in people with cancer, anxiety, and depression. Further, multimorbid
representations including combined or competing causal representations, beliefs regarding the
prioritisation of the illness perceived as most challenging, beliefs about FCR, and perceived
synergies and antagonisms in the management of illnesses, were identified as having
important associations with self-management strategies and illness outcomes in people with
co-morbid cancer and anxiety/depression. These findings highlighted the need for the
development of future interventions that aim to adjust incorrect or maladaptive
representations in people with cancer and anxiety/depression. Further, the discovery of
multimorbid representations suggests the CSM may need to be adjusted or expanded to be
more applicable for people with multiple illnesses. Finally, this thesis also highlighted the
importance of increasing health professionals’ understanding of illness representations and
illness history. This will both foster the promotion of suitable self-management strategies and
increase referrals to appropriate psycho-oncological support services, helping to improve the
health outcomes of people with cancer and anxiety/depression.

152
References
Admiraal, J. M., Reyners, A. K. L., & Hoekstra-Weebers, J. E. H. M. (2013). Do cancer and
treatment type affect distress? Psycho-Oncology, 22(8), 1766-1773.
doi:10.1002/pon.3211
Ahles, T. A., Root, J. C., & Ryan, E. L. (2012). Cancer and cancer-treatment associated
cognitive change: An update on the state of the science. Journal of Clinical Oncology,
30(30), 3675-3686. doi:10.1200/jco.2012.43.0116
Akcakaya, R. L. R. (2012). Patient perceptions of comorbid depression in heart disease
(Doctoral dissertation, Washington University). Retrieved from PsycINFO.
(AAI3516358)
Alderson, S. L., Foy, R., Glidewell, L., & House, A. O. (2014). Patients understanding of
depression associated with chronic physical illness: A qualitative study. BMC Family
Practice, 15(1), 1-9. doi:10.1186/1471-2296-15-37
Alderson, S. L., Foy, R., Glidewell, L., McLintock, K., & House, A. (2012). How patients
understand depression associated with chronic physical disease – a systematic review.
BMC Family Practice, 13(1), 1-19. doi:10.1186/1471-2296-13-41
Alfano, C. M., & Rowland, J. H. (2006). Recovery issues in cancer survivorship: A new
challenge for supportive care. The Cancer Journal, 12(5), 432-443.
doi:10.1097/00130404-200609000-00012
Anagnostopoulos, F., & Spanea, E. (2005). Assessing illness representations of breast cancer:
A comparison of patients with healthy and benign controls. Journal of Psychosomatic
Research, 58(4), 327-334. doi:10.1016/j.jpsychores.2004.09.011
Angst, J., Gamma, A., Rössler, W., Ajdacic, V., & Klein, D. N. (2009). Long-term depression
versus episodic major depression: Results from the prospective Zurich study of a
community sample. Journal of Affective Disorders, 115(1–2), 112-121.

153
doi:10.1016/j.jad.2008.09.023
Arida, J. A., Sherwood, P. R., Flannery, M., & Donovan, H. S. (2016). Representational
approach: A conceptual framework to guide patient education research and practice.
Oncology Nursing Forum, 43(6), 781-783. doi:10.1188/16.ONF.781-783
Australian Bureau of Statistics. (2011). Australian Statistical Geography Standard (ASGS):
Volume 5 - remoteness structure. (1270.0.55.005). Canberra: ABS. Retrieved from
http://www.abs.gov.au/ausstats/[email protected]/mf/1270.0.55.005?OpenDocument.
Australian Institute of Health and Welfare. (2014). Cancer in Australia: An overview 2014.
(No 90. Cat. no. CAN 88.). Canberra: AIHW. Retrieved from
http://www.aihw.gov.au/publication-detail/?id=60129550047.
Australian Institute of Health and Welfare. (2016). Australian cancer incidence and mortality
(ACIM) books: All cancers combined. Canberra: AIHW. Retrieved from
http://www.aihw.gov.au/acim-books/.
Aziz, N. M. (2007). Cancer survivorship research: State of knowledge, challenges and
opportunities. Acta Oncologica, 46(4), 417-432. doi:10.1080/02841860701367878
Baines, T., & Wittkowski, A. (2013). A systematic review of the literature exploring illness
perceptions in mental health utilising the self-regulation model. Journal of Clinical
Psychology in Medical Settings, 20(3), 263-274. doi:10.1007/s10880-012-9337-9
Baines, T., Wittkowski, A., & Wieck, A. (2013). Illness perceptions in mothers with
postpartum depression. Midwifery, 29(7), 779-786. doi:10.1016/j.midw.2012.06.020
Baker, F., Denniston, M., Smith, T., & West, M. M. (2005). Adult cancer survivors: How are
they faring? Cancer, 104(S11), 2565-2576. doi:10.1002/cncr.21488
Beatty, L., & Scott, K. (2013). Examining eHealth use as a coping strategy for cancer-
adjustment: An application of the Chronic Illness Model. E-Journal of Applied
Psychology, 9(1), 9-18. doi:10.7790/ejap.v9i1.349

154
Beck, A. T. (1967). Depression: Clinical, experimental, and theoretical aspects.
Philadelphia, Pennsylvania: University of Pennsylvania Press.
Beck, A. T., Rush, J. A., Shaw, B. F., & Emery, G. (1979). Cognitive therapy of depression.
New York: Guilford Press.
Beck, A. T., Steer, R. A., & Brown, G. K. (1996). BDI-II: Beck Depression Inventory
Manual (2nd ed.). San Antonio, Texas: Psychological Corporation.
Beck, J. S. (2011). Cognitive behavior therapy: Basics and beyond. New York: Guilford
Press.
Borenstein, M., Hedges, L. V., Higgins, J. P. T., & Rothstein, H. R. (2010). A basic
introduction to fixed-effect and random-effects models for meta-analysis. Research
Synthesis Methods, 1(2), 97-111. doi:10.1002/jrsm.12
Bower, P., Harkness, E., Macdonald, W., Coventry, P., Bundy, C., & Moss-Morris, R.
(2012). Illness representations in patients with multimorbid long-term conditions:
Qualitative study. Psychology & Health, 27(10), 1211-1226.
doi:10.1080/08870446.2012.662973
Bratzke, L. C., Muehrer, R. J., Kehl, K. A., Kyoung Suk, L., Ward, E. C., & Kwekkeboom,
K. L. (2015). Self-management priority setting and decision-making in adults with
multimorbidity: A narrative review of literature. International Journal of Nursing
Studies, 52(3), 744-755. doi:10.1016/j.ijnurstu.2014.10.010
Braun, V., & Clarke, V. (2006). Using thematic analysis in psychology. Qualitative Research
in Psychology, 3(2), 77-101. doi:10.1191/1478088706qp063oa
Breitbart, W., Rosenfeld, B., Pessin, H., & et al. (2000). Depression, hopelessness, and desire
for hastened death in terminally ill patients with cancer. JAMA, 284(22), 2907-2911.
doi:10.1001/jama.284.22.2907
Brenes, G. A. (2007). Anxiety, depression, and quality of life in primary care patients.

155
Primary Care Companion to The Journal of Clinical Psychiatry, 9(6), 437-443.
doi:10.4088/PCC.v09n0606
Brenes, G. A., Penninx, B. W. J. H., Judd, P. H., Rockwell, E., Sewell, D. D., & Wetherell, J.
L. (2008). Anxiety, depression, and disability across the lifespan. Aging and Mental
Health, 12(1), 158-163. doi:10.1080/13607860601124115
Broadbent, E., Ellis, C. J., Thomas, J., Gamble, G., & Petrie, K. J. (2009). Further
development of an illness perception intervention for myocardial infarction patients:
A randomized controlled trial. Journal of Psychosomatic Research, 67(1), 17-23.
doi:10.1016/j.jpsychores.2008.12.001
Broadbent, E., Petrie, K. J., Main, J., & Weinman, J. (2006). The brief illness perception
questionnaire. Journal of Psychosomatic Research, 60(6), 631-637.
doi:10.1016/j.jpsychores.2005.10.020
Brown, C., Battista, D. R., Sereika, S. M., Bruehlman, R. D., Dunbar-Jacob, J., & Thase, M.
E. (2007). Primary care patients' personal illness models for depression: Relationship
to coping behavior and functional disability. General Hospital Psychiatry, 29(6), 492-
500. doi:10.1016/j.genhosppsych.2007.07.007
Brown, C., Dunbar-Jacob, J., Palenchar, D. R., Kelleher, K. J., Bruehlman, R. D., Sereika, S.,
& Thase, M. E. (2001). Primary care patients' personal illness models for depression:
A preliminary investigation. Family Practice, 18(3), 314-320.
doi:10.1093/fampra/18.3.314
Brown, L. F., Kroenke, K., Theobald, D. E., Wu, J., & Tu, W. (2010). The association of
depression and anxiety with health-related quality of life in cancer patients with
depression and/or pain. Psycho-Oncology, 19(7), 734-741. doi:10.1002/pon.1627
Brown, T. A., Campbell, L. A., Lehman, C. L., Grisham, J. R., & Mancill, R. B. (2001).
Current and lifetime comorbidity of the DSM-IV anxiety and mood disorders in a

156
large clinical sample. Journal of Abnormal Psychology, 110(4), 585-599.
doi:10.1037/0021-843X.110.4.585
Buick, D. L., & Petrie, K. J. (2002). “I know just how you feel”: The validity of healthy
women's perceptions of breast-cancer patients receiving treatment. Journal of Applied
Social Psychology, 32(1), 110-123. doi:10.1111/j.1559-1816.2002.tb01422.x
Bultz, B. D., & Holland, J. C. (2006). Emotional distress in patients with cancer: The sixth
vital sign. Community Oncology, 3(5), 311-314. doi:10.1016/S1548-5315(11)70702-1
Butow, P. N., Phillips, F., Schweder, J., White, K., Underhill, C., & Goldstein, D. (2012).
Psychosocial well-being and supportive care needs of cancer patients living in urban
and rural/regional areas: A systematic review. Supportive Care in Cancer, 20(1), 1-
22. doi:10.1007/s00520-011-1270-1
Cabassa, L. J., Lagomasino, I. T., Dwight-Johnson, M., Hansen, M. C., & Xie, B. (2008).
Measuring Latinos' perceptions of depression: A confirmatory factor analysis of the
Illness Perception Questionnaire. Cultural Diversity and Ethnic Minority Psychology,
14(4), 377-384. doi:10.1037/a0012820
Cafri, G., Kromrey, J. D., & Brannick, M. T. (2010). A meta-meta-analysis: Empirical review
of statistical power, Type I error rates, effect sizes, and model selection of meta-
analyses published in psychology. Multivariate Behavioral Research, 45(2), 239-270.
doi:10.1080/00273171003680187
Cameron, L. D., Booth, R. J., Schlatter, M., Ziginskas, D., Harman, J. E., & Benson, S. R. C.
(2005). Cognitive and affective determinants of decisions to attend a group
psychosocial support program for women with breast cancer. Psychosomatic
Medicine, 67(4), 584-589. doi:10.1097/01.psy.0000170834.54970.f5
Campbell, J. L., Quincy, C., Osserman, J., & Pedersen, O. K. (2013). Coding in-depth
semistructured interviews: Problems of unitization and intercoder reliability and

157
agreement. Sociological Methods & Research, 42(3), 294-320.
doi:10.1177/0049124113500475
Cancer Australia. (2016). Cancer in Australia statistics. Canberra: Australian Government.
Retrieved from https://canceraustralia.gov.au/affected-cancer/what-cancer/cancer-
australia-statistics
Card, N. A. (2012). Applied meta-analysis for social science research. New York: Guilford
Publications.
Carey, M., Lambert, S., Smits, R., Paul, C., Sanson-Fisher, R., & Clinton-McHarg, T. (2012).
The unfulfilled promise: A systematic review of interventions to reduce the unmet
supportive care needs of cancer patients. Supportive Care in Cancer, 20(2), 207-219.
doi:10.1007/s00520-011-1327-1
Carlson, L., Angen, M., Cullum, J., Goodey, E., Koopmans, J., Lamont, L., . . . Bultz, B.
(2004). High levels of untreated distress and fatigue in cancer patients. British Journal
of Cancer, 90(12), 2297-2304. doi:10.1038/sj.bjc.6601887
Chaudhry, S., Jin, L., & Meltzer, D. (2005). Use of a self-report-generated Charlson
Comorbidity Index for predicting mortality. Medical Care, 43(6), 607-615.
doi:10.1097/01.mlr.0000163658.65008.ec
Chen, H. C. (2012). Self-transcendence, illness perception and depression in Taiwanese men
with oral cancer (Doctoral dissertation, University of Arizona). Retrieved from Web
of Science. (000314910700247)
Clark, L. A., & Watson, D. (1991). Tripartite model of anxiety and depression: Psychometric
evidence and taxonomic implications. Journal of Abnormal Psychology, 100(3), 316-
336. doi:10.1037/0021-843X.100.3.316
Cohen, J. (1992). A power primer. Psychological Bulletin, 112(1), 155-159.
doi:10.1037/0033-2909.112.1.155

158
Collingridge, D. S., & Gantt, E. E. (2008). The quality of qualitative research. American
Journal of Medical Quality, 23(5), 389-395. doi:10.1177/1062860608320646
Cook, S. A., Salmon, P., Dunn, G., Holcombe, C., Cornford, P., & Fisher, P. (2015a). The
association of metacognitive beliefs with emotional distress after diagnosis of cancer.
Health Psychology, 34(3), 207-215. doi:10.1037/hea0000096
Cook, S. A., Salmon, P., Dunn, G., Holcombe, C., Cornford, P., & Fisher, P. (2015b). A
prospective study of the association of metacognitive beliefs and processes with
persistent emotional distress after diagnosis of cancer. Cognitive Therapy and
Research, 39(1), 51-60. doi:10.1002/pon.3156
Cooper, A. F., Hankins, M., Rixon, L., Eaton, E., & Grunfeld, E. A. (2013). Distinct work-
related, clinical and psychological factors predict return to work following treatment
in four different cancer types. Psycho-Oncology, 22(3), 659-667.
doi:10.1002/pon.3049
Corter, A. L., Findlay, M., Broom, R., Porter, D., & Petrie, K. J. (2013). Beliefs about
medicine and illness are associated with fear of cancer recurrence in women taking
adjuvant endocrine therapy for breast cancer. British Journal of Health Psychology,
18(1), 168-181. doi:10.1111/bjhp.12003
Costanzo, E. S., Lutgendorf, S. K., & Roeder, S. L. (2011). Common-sense beliefs about
cancer and health practices among women completing treatment for breast cancer.
Psycho-Oncology, 20(1), 53-61. doi:10.1002/pon.1707
Croom, A. R. (2012). Illness perceptions of patients with late-stage cancer and their partners
(Doctoral dissertation, University of Texas). Retrieved from UT Southwestern
Electronic Theses and Dissertations.
Croom, A. R., Hamann, H. A., & Kehoe, S. M. (2013). Illness perceptions matter:
Understanding quality of life and advanced illness behaviors in female patients with

159
late-stage cancer. The Journal of Supportive Oncology, 11, 165-173.
doi:10.12788/j.suponc.0014
Deimling, G. T., Wagner, L. J., Bowman, K. F., Sterns, S., Kercher, K., & Kahana, B. (2006).
Coping among older-adult, long-term cancer survivors. Psycho-Oncology, 15(2), 143-
159. doi:10.1002/pon.931
Dempster, M., McCorry, N. K., Brennan, E., Donnelly, M., Murray, L. J., & Johnston, B. T.
(2011). Do changes in illness perceptions predict changes in pychological distress
among oesophageal cancer survivors? Journal of Health Psychology, 16(3), 500-509.
doi:10.1177/1359105310386633
Dempster, M., McCorry, N. K., Brennan, E., Donnelly, M., Murray, L. J., & Johnston, B. T.
(2012). Psychological distress among survivors of esophageal cancer: The role of
illness cognitions and coping. Diseases of the Esophagus, 25(3), 222-227.
doi:10.1111/j.1442-2050.2011.01233.x
Dempster, M., McCorry, N. K., & Howell, D. (2015). Illness perceptions and coping in
physical health conditions: A meta-analysis. Journal of Psychosomatic Research,
76(6), 506-513. doi:10.1016/j.jpsychores.2015.10.006
Detweiler-Bedell, J. B., Friedman, M. A., Leventhal, H., Miller, I. W., & Leventhal, E. A.
(2008). Integrating co-morbid depression and chronic physical disease management:
Identifying and resolving failures in self-regulation. Clinical Psychology Review,
28(8), 1426-1446. doi:10.1016/j.cpr.2008.09.002
Diefenbach, M. A., & Leventhal, H. (1996). The common-sense model of illness
representation: Theoretical and practical considerations. Journal of Social Distress
and the Homeless, 5(1), 11-38. doi:10.1007/BF02090456
Donovan, H. S. (2003). The role of cognitive and emotional representations in cancer
symptom management (Doctoral dissertation, University of Wisconsin). Retrieved

160
from PsycINFO. (620617364)
Donovan, H. S., & Ward, S. (2001). A representational approach to patient education.
Journal of Nursing Scholarship, 33(3), 211-216. doi:10.1111/j.1547-
5069.2001.00211.x
Donovan, H. S., Ward, S., Song, M., Heidrich, S. M., Gunnarsdottir, S., & Phillips, C. M.
(2007). An update on the representational approach to patient education. Journal of
Nursing Scholarship, 39(3), 259-265. doi:10.1111/j.1547-5069.2007.00178.x
Dunn, J., Ng, S. K., Holland, J., Aitken, J., Youl, P., Baade, P. D., & Chambers, S. K. (2013).
Trajectories of psychological distress after colorectal cancer. Psycho-Oncology, 22(8),
1759-1765. doi:10.1002/pon.3210
Duric, V. M., Butow, P. N., Sharpe, L., Boyle, F., Beith, J., Wilcken, N. R. C., . . . Stockler,
M. R. (2007). Psychosocial factors and patients' preferences for adjuvant
chemotherapy in early breast cancer. Psycho-Oncology, 16(1), 48-59.
doi:10.1002/pon.1045
Edwards, B., & Clarke, V. (2004). The psychological impact of a cancer diagnosis on
families: The influence of family functioning and patients' illness characteristics on
depression and anxiety. Psycho-Oncology, 13(8), 562-576. doi:10.1002/pon.773
Elwy, A. R., Glickman, M. E., Bokhour, B. G., Dell, N. S., Mueller, N. M., Zhao, S., . . .
Ngo, T. A. (2016). Using mixed methods to examine the role of Veterans' illness
perceptions on depression treatment utilization and HEDIS concordance. Medical
Care, 54(6), 35-42. doi:10.1097/MLR.0000000000000056
Elwy, A. R., Yeh, J., Worcester, J., & Eisen, S. V. (2011). An illness perception model of
primary care patients' help seeking for depression. Qualitative Health Research,
21(11), 1495-1507. doi:10.1177/1049732311413781
Fan, G. (2007). Symptom clusters in cancer patients: A review of the literature. Current

161
Oncology, 14(5), 173-179. doi:10.3747/co.2007.145
Fan, S. Y., Eiser, C., Ho, M. C., & Lin, C. Y. (2013). Health-related quality of life in patients
with hepatocellular carcinoma: The mediation effects of illness perceptions and
coping. Psycho-Oncology, 22(6), 1353-1360. doi:10.1002/pon.3146
Fischer, M. J., Wiesenhaan, M. E., Does-den Heijer, A., Kleijn, W. C., Nortier, J. W. R., &
Kaptein, A. A. (2013). From despair to hope: A longitudinal study of illness
perceptions and coping in a psycho‐educational group intervention for women with
breast cancer. British Journal of Health Psychology, 18(3), 526-545.
doi:10.1111/j.2044-8287.2012.02100.x
Förster, C., & Taubert, S. (2006). Subjektive Krankheitstheorien und Selbstregulation von
Tumorpatienten. Zeitschrift für Medizinische Psychologie, 15(3), 117-127. Retrieved
from http://iospress.metapress.com/content/ela2kptxxt5ree0l/
Fortin, M., Lapointe, L., Hudon, C., Vanasse, A., Ntetu, A. L., & Maltais, D. (2004).
Multimorbidity and quality of life in primary care: A systematic review. Health and
Quality of Life Outcomes, 2, 51-51. doi:10.1186/1477-7525-2-51
Fortune, G., Barrowclough, C., & Lobban, F. (2004). Illness representations in depression.
British Journal of Clinical Psychology, 43(4), 347-364.
doi:10.1348/0144665042388955
Foster, C., Breckons, M., Cotterell, P., Barbosa, D., Calman, L., Corner, J., . . . Smith, P. W.
(2015). Cancer survivors' self-efficacy to self-manage in the year following primary
treatment. Journal of Cancer Survivorship, 9(1), 11-19. doi:10.1007/s11764-014-
0384-0
Freeman-Gibb, L. A. (2012). The relationship of illness representations and coping to fear of
recurrence in breast cancer patients (Doctoral dissertation, University of Michigan).
Retrieved from ProQuest Dissertations & Theses. (3530607)

162
Fulcher, C. D., Kim, H.-J., Smith, P. R., & Sherner, T. L. (2014). Putting evidence into
practice: Evidence-based interventions for depression. Clinical Journal of Oncology
Nursing, 18, 26-37. doi:10.1188/14.CJON.S3.26-37
Galway, K., Black, A., Cantwell, M., Cardwell, C. R., Mills, M., & Donnelly, M. (2012).
Psychosocial interventions to improve quality of life and emotional wellbeing for
recently diagnosed cancer patients. Cochrane Database of Systematic Reviews.
doi:10.1002/14651858.CD007064.pub2
Giannousi, Z., Manaras, I., Georgoulias, V., & Samonis, G. (2010). Illness perceptions in
Greek patients with cancer: A validation of the Revised-Illness Perception
Questionnaire. Psycho-Oncology, 19(1), 85-92. doi:10.1002/pon.1538
Gibbons, A. (2013). An evaluation of the influence of perceptions of breast cancer on distress
in Irish women (Doctoral dissertation, National University of Ireland). Retrieved from
NUI Galway Theses.
Gibbons, C. J., Kenning, C., Coventry, P. A., Bee, P., Bundy, C., Fisher, L., & Bower, P.
(2013). Development of a multimorbidity llness perceptions scale (MULTIPleS).
PLoS ONE, 8(12), e81852. doi:10.1371/journal.pone.0081852
Glaser, B. G., & Strauss, A. L. (2009). The discovery of grounded theory: Strategies for
qualitative research. New Brunswick, USA: Aldine Transaction.
Glattacker, M., Heyduck, K., & Meffert, C. (2013). Illness beliefs and treatment beliefs as
predictors of short and middle term outcome in depression. Journal of Health
Psychology, 18(1), 139-152. doi:10.1177/1359105311433907
Gould, R. V., Brown, S. L., & Bramwell, R. (2010). Psychological adjustment to
gynaecological cancer: Patients' illness representations, coping strategies and mood
disturbance. Psychology & Health, 25(5), 633-646. doi:10.1080/08870440902811163
Gouveia, L., Lelorain, S., Brédart, A., Dolbeault, S., Bonnaud-Antignac, A., Cousson-Gélie,

163
F., & Sultan, S. (2015). Oncologists’ perception of depressive symptoms in patients
with advanced cancer: Accuracy and relational correlates. BMC Psychology, 3(1), 1-
11. doi:10.1186/s40359-015-0063-6
Grande, G. E., Arnott, J., Brundle, C., & Pilling, M. (2014). Predicting cancer patients'
participation in support groups: A longitudinal study. Patient Education and
Counseling, 96(2), 229-236. doi:10.1016/j.pec.2014.05.003
Grande, G. E., Myers, L. B., & Sutton, S. R. (2006). How do patients who participate in
cancer support groups differ from those who do not? Psycho-Oncology, 15(4), 321-
334. doi:10.1002/pon.956
Gray, N. M., Hall, S. J., Browne, S., Johnston, M., Lee, A. J., Macleod, U., . . . Campbell, N.
C. (2014). Predictors of anxiety and depression in people with colorectal cancer.
Supportive Care in Cancer, 22(2), 307-314. doi:10.1007/s00520-013-1963-8
Gray, N. M., Hall, S. J., Browne, S., Macleod, U., Mitchell, E., Lee, A. J., . . . Campbell, N.
C. (2011). Modifiable and fixed factors predicting quality of life in people with
colorectal cancer. British Journal of Cancer, 104, 1697-1703.
doi:10.1038/bjc.2011.155
Green, H. J., Steinnagel, G., Morris, C., & Laakso, E. L. (2014). Health behaviour models
and patient preferences regarding nutrition and physical activity after breast or
prostate cancer diagnosis. European Journal of Cancer Care, 23(5), 640-652.
doi:10.1111/ecc.12190
Gunn, J. M., Ayton, D. R., Densley, K., Pallant, J. F., Chondros, P., Herrman, H. E., &
Dowrick, C. F. (2010). The association between chronic illness, multimorbidity and
depressive symptoms in an Australian primary care cohort. Social Psychiatry and
Psychiatric Epidemiology, 47(2), 175-184. doi:10.1007/s00127-010-0330-z
Gunn, K., Turnbull, D., McWha, J. L., Davies, M., & Olver, I. (2013). Psychosocial service

164
use: A qualitative exploration from the perspective of rural Australian cancer patients.
Supportive Care in Cancer, 21(9), 2547-2555. doi:10.1007/s00520-013-1812-9
Hack, T. F., Pickles, T., Ruether, J. D., Weir, L., Bultz, B. D., Mackey, J., & Degner, L. F.
(2010). Predictors of distress and quality of life in patients undergoing cancer therapy:
Impact of treatment type and decisional role. Psycho-Oncology, 19(6), 606-616.
doi:10.1002/pon.1590
Hagger, M. S., & Orbell, S. (2003). A meta-analytic review of the common-sense model of
illness representations. Psychology & Health, 18(2), 141-184.
doi:10.1080/088704403100081321
Hale, E. D., Treharne, G. J., & Kitas, G. D. (2007). The common-sense model of self-
regulation of health and illness: How can we use it to understand and respond to our
patients' needs? Rheumatology, 46(6), 904-906. doi:10.1093/rheumatology/kem060
Harrington, C. B., Hanse, J. A., Moskowitz, M., Todd, B. L., & Feuerstein, M. (2010). It's not
over when it's over: Long-term symptoms in cancer survivors - A systematic review.
International Journal of Psychiatry in Medicine, 40(2), 163-181.
doi:10.2190/PM.40.2.c
Harrison, J. D., Young, J. M., Price, M. A., Butow, P. N., & Solomon, M. J. (2009). What are
the unmet supportive care needs of people with cancer? A systematic review.
Supportive Care in Cancer, 17(8), 1117-1128. doi:10.1007/s00520-009-0615-5
Helgeson, V. S., Snyder, P., & Seltman, H. (2004). Psychological and physical adjustment to
breast cancer over 4 years: Identifying distinct trajectories of change. Health
Psychology, 23(1), 3-15. doi:10.1037/0278-6133.23.1.3
Henselmans, I., Helgeson, V. S., Seltman, H., de Vries, J., Sanderman, R., & Ranchor, A. V.
(2010). Identification and prediction of distress trajectories in the first year after a
breast cancer diagnosis. Health Psychology, 29(2), 160-168. doi:10.1037/a0017806

165
Henselmans, I., Sanderman, R., Helgeson, V. S., de Vries, J., Smink, A., & Ranchor, A. V.
(2010). Personal control over the cure of breast cancer: Adaptiveness, underlying
beliefs and correlates. Psycho-Oncology, 19, 525-534. doi:10.1002/pon.1599
Higgins, J. P. T., Thompson, S. G., Deeks, J. J., & Altman, D. G. (2003). Measuring
inconsistency in meta-analyses. BMJ, 327, 557-560. doi:10.1136/bmj.327.7414.557
Hofmann, S. G., Asnaani, A., Vonk, I. J. J., Sawyer, A. T., & Fang, A. (2012). The efficacy
of Cognitive Behavioral Therapy: A review of meta-analyses. Cognitive Therapy and
Research, 36(5), 427-440. doi:10.1007/s10608-012-9476-1
Hollon, S. D., Stewart, M. O., & Strunk, D. (2005). Enduring effects for cognitive behavior
therapy in the treatment of depression and anxiety. Annual Review of Psychology,
57(1), 285-315. doi:10.1146/annurev.psych.57.102904.190044
Hopman, P., & Rijken, M. (2014). Illness perceptions of cancer patients: Relationships with
illness characteristics and coping. Psycho-Oncology, 24(1), 11-18.
doi:10.1002/pon.3591
Horn, A. B., Kneisler, L., Schuster, H., & Traue, H. C. (2010). Subjective illness
representations in depressive disorder: A longitudinal study. [Subjektive
Krankheitskonzepte bei depressiven Störungen: Längsschnittstudie einer
rehabilitativen Maßnahme]. Zeitschrift fur Gesundheitspsychologie, 18(1), 40-51.
doi:10.1026/0943-8149/a000006
Houle, J., Villaggi, B., Beaulieu, M.-D., Lespérance, F., Rondeau, G., & Lambert, J. (2013).
Treatment preferences in patients with first episode depression. Journal of Affective
Disorders, 147(1-3), 94-100. doi:10.1016/j.jad.2012.10.016
Huedo-Medina, T. B., Sanchez-Meca, J., Marin-Martinez, F., & Botella, J. (2006). Assessing
heterogeneity in meta-analysis: Q statistic or I2 index? Psychological Methods, 11(2),
193-206. doi:10.1037/1082-989X.11.2.193

166
Hulbert-Williams, N., Neal, R., Morrison, V., Hood, K., & Wilkinson, C. (2012). Anxiety,
depression and quality of life after cancer diagnosis: What psychosocial variables best
predict how patients adjust? Psycho-Oncology, 21(8), 857. doi:10.1002/pon.1980
Hunot, V. M., Horne, R., Leese, M. N., & Churchill, R. C. (2007). A cohort study of
adherence to antidepressants in primary care: The influence of antidepressant
concerns and treatment preferences. Primary Care Companion to The Journal of
Clinical Psychiatry, 9(2), 91-99. doi:10.4088/PCC.v09n0202
International Agency for Research on Cancer, & World Health Organisation. (2014).
Population fact sheets (GLOBOCAN 2012). Retrieved from
http://globocan.iarc.fr/Pages/fact_sheets_population.aspx
Irving, G., & Lloyd-Williams, M. (2010). Depression in advanced cancer. European Journal
of Oncology Nursing, 14(5), 395-399. doi:10.1016/j.ejon.2010.01.026
Iskandarsyah, A., Klerk, C., Suardi, D. R., Sadarjoen, S. S., & Passchier, J. (2014).
Consulting a traditional healer and negative illness perceptions are associated with
non-adherence to treatment in Indonesian women with breast cancer. Psycho-
Oncology, 23(10), 1118-1124. doi:10.1002/pon.3534
Jacobsen, P. B., Donovan, K. A., Swaine, Z. N., & Watson, I. S. (2006). Management of
anxiety and depression in adult cancer patients: Toward an evidence-based approach.
In A. E. Chang, D. F. Hayes, H. I. Pass, R. M. Stone, P. A. Ganz, T. J. Kinsella, J. H.
Schiller, & V. J. Strecher (Eds.), Oncology: An evidence based approach (pp. 1561-
1588). doi:10.1007/0-387-31056-8_89
Jacobsen, P. B., & Jim, H. S. (2008). Psychosocial interventions for anxiety and depression in
adult cancer patients: Achievements and challenges. CA: A Cancer Journal for
Clinicians, 58(4), 214-230. doi:10.3322/CA.2008.0003
Jefford, M., & Tattersall, M. H. (2002). Informing and involving cancer patients in their own

167
care. The Lancet Oncology, 3(10), 629-637. doi:10.1016/S1470-2045(02)00877-X
Jones, C. J., Smith, H. E., & Llewellyn, C. D. (2015). A systematic review of the
effectiveness of interventions using the Common Sense Self-Regulatory Model to
improve adherence behaviours. Journal of Health Psychology, 21(11), 2709-2724.
doi:10.1177/1359105315583372
Jørgensen, I. L., Frederiksen, K., Boesen, E., Elsass, P., & Johansen, C. (2009). An
exploratory study of associations between illness perceptions and adjustment and
changes after psychosocial rehabilitation in survivors of breast cancer. Acta
Oncologica, 48(8), 1119-1127. doi:10.3109/02841860903033922
Karademas, E. C., & Giannousi, Z. (2013). Representations of control and psychological
symptoms in couples dealing with cancer: A dyadic-regulation approach. Psychology
& Health, 28(1), 67-83. doi:10.1080/08870446.2012.713954
Keeling, M., Bambrough, J., & Simpson, J. (2013). Depression, anxiety and positive affect in
people diagnosed with low-grade tumours: The role of illness perceptions. Psycho-
Oncology, 22(6), 1421-1427. doi:10.1002/pon.3158
Kelly, M. A. R., Sereika, S. M., Battista, D. R., & Brown, C. (2007). The relationship
between beliefs about depression and coping strategies: Gender differences. British
Journal of Clinical Psychology, 46(3), 315-332. doi:10.1348/014466506x173070
Kendel, F., Helbig, L., Neumann, K., Herden, J., Stephan, C., Schrader, M., & Gaissmaier,
W. (2016). Patients' perceptions of mortality risk for localized prostate cancer vary
markedly depending on their treatment strategy. International Journal of Cancer,
139(4), 749-753. doi:10.1002/ijc.30123
Keogh, K. M., Smith, S. M., White, P., McGilloway, S., Kelly, A., Gibney, J., & O'Dowd, T.
(2011). Psychological family intervention for poorly controlled type 2 diabetes. The
American Journal of Managed Care, 17(2), 105-113. Retrieved from

168
http://www.ajmc.com/
Kroenke, K., Theobald, D., Wu, J., Loza, J. K., Carpenter, J. S., & Tu, W. (2010). The
association of depression and pain with health-related quality of life, disability, and
health care use in cancer patients. Journal of Pain and Symptom Management, 40(3),
327-341. doi:10.1016/j.jpainsymman.2009.12.023
Lam, W. W. T., Shing, Y. T., Bonanno, G. A., Mancini, A. D., & Fielding, R. (2012).
Distress trajectories at the first year diagnosis of breast cancer in relation to 6 years
survivorship. Psycho-Oncology, 21(1), 90-99. doi:10.1002/pon.1876
Landers, M., McCarthy, G., Livingstone, V., & Savage, E. (2014). Patients' bowel symptom
experiences and self-care strategies following sphincter-saving surgery for rectal
cancer. Journal of Clinical Nursing, 23, 2343-2354. doi:10.1111/jocn.12516
Lau, J., Ioannidis, J. P., Terrin, N., Schmid, C. H., & Olkin, I. (2006). The case of the
misleading funnel plot. BMJ, 333, 597-600. doi:10.1136/bmj.333.7568.597
Lazarus, R. S. (1993). Coping theory and research: Past, present, and future. Psychosomatic
Medicine, 55(3), 234-247. doi:10.1097/00006842-199305000-00002
Ledesma, D., & Kumano, H. (2009). Mindfulness-based stress reduction and cancer: A meta-
analysis. Psycho-Oncology, 18(6), 571-579. doi:10.1002/pon.1400
Lee-Jones, C., Humphris, G., Dixon, R., & Hatcher, M. B. (1997). Fear of cancer recurrence -
A literature review and proposed cognitive formulation to explain exacerbation of
recurrence fears. Psycho-Oncology, 6(2), 95-105. doi:10.1002/(SICI)1099-
1611(199706)6:2<95::AID-PON250>3.0.CO;2-B
Lenze, E. J., Rogers, J. C., Martire, L. M., Mulsant, B. H., Rollman, B. L., Dew, M. A., . . .
Reynolds, C. F. (2001). The association of late-life depression and anxiety with
physical disability: A review of the literature and prospectus for future research. The
American Journal of Geriatric Psychiatry, 9(2), 113-135. doi:10.1097/00019442-

169
200105000-00004
Lepore, S. J., & Coyne, J. C. (2006). Psychological interventions for distress in cancer
patients: A review of reviews. Annals of Behavioral Medicine, 32(2), 85-92.
doi:10.1207/s15324796abm3202_2
Leventhal, H., Leventhal, E. A., & Contrada, R. J. (1998). Self-regulation, health, and
behavior: A perceptual-cognitive approach. Psychology & Health, 13(4), 717-733.
doi:10.1080/08870449808407425
Leventhal, H., Meyer, D., & Nerenz, D. (1980). The common sense representation of illness
danger. In S. Rachman (Ed.), Contrubutions to medical psychology (pp. 7-30). New
York: Pergamon Press.
Light, R. J., & Pillemer, D. B. (1984). Summing up: The science of reviewing research.
Cambridge, MA: Harvard University Press.
Linden, W., Vodermaier, A., Mackenzie, R., & Greig, D. (2012). Anxiety and depression
after cancer diagnosis: Prevalence rates by cancer type, gender, and age. Journal of
Affective Disorders, 141(2-3), 343-351. doi:10.1016/j.jad.2012.03.025
Llewellyn, C. D., McGurk, M., & Weinman, J. (2006). Head and neck cancer: To what extent
can psychological factors explain differences between health-related quality of life
and individual quality of life? British Journal of Oral and Maxillofacial Surgery,
44(5), 351-357. doi:10.1016/j.bjoms.2005.06.033
Llewellyn, C. D., McGurk, M., & Weinman, J. (2007a). Illness and treatment beliefs in head
and neck cancer: Is Leventhal's common sense model a useful framework for
determining changes in outcomes over time? Journal of Psychosomatic Research,
63(1), 17-26. doi:10.1016/j.jpsychores.2007.01.013
Llewellyn, C. D., McGurk, M., & Weinman, J. (2007b). The relationship between the Patient
Generated Index (PGI) and measures of HR-QoL following diagnosis with head and

170
neck cancer: Are illness and treatment perceptions determinants of judgment-based
outcomes? British Journal of Health Psychology, 12(3), 421-437.
doi:10.1348/135910706x118422
Llewellyn, C. D., Weinman, J., McGurk, M., & Humphris, G. (2008). Can we predict which
head and neck cancer survivors develop fears of recurrence? Journal of
Psychosomatic Research, 65(6), 525-532. doi:10.1016/j.jpsychores.2008.03.014
Lovibond, S. H., Lovibond, P. F., & Psychology Foundation of Australia. (1995). Manual for
the depression anxiety stress scales (2nd ed.). Sydney, NSW: Psychology Foundation
of Australia.
Lu, Y., Tang, C., Liow, C. S., Ng, W. W. N., Ho, C. S. H., & Ho, R. C. M. (2014). A
regressional analysis of maladaptive rumination, illness perception and negative
emotional outcomes in Asian patients suffering from depressive disorder. Asian
Journal of Psychiatry, 12, 69-76. doi:10.1016/j.ajp.2014.06.014
Lynch, J., Kendrick, T., Moore, M., Johnston, O., & Smith, P. W. (2006). Patients' beliefs
about depression and how they relate to duration of antidepressant treatment. Use of a
US measure in a UK primary care population. Primary Care Mental Health, 4(3),
207-217. Retrieved from http://www.mhfmjournal.com/
Malterud, K., Siersma, V. D., & Guassora, A. D. (2015). Sample size in qualitative interview
studies: Guided by information power. Qualitative Health Research.
doi:10.1177/1049732315617444
Marcus, M., Yasamy, M. T., van Ommeren, M., Chisholm, D., Saxena, S., & WHO
Department of Mental Health and Substance Abuse. (2012). Depression: A global
public health concern. Retrieved from http://www.who.int/mental_health/
management/depression/who_paper_depression_wfmh_2012.pdf
Massie, M. J. (2004). Prevalence of depression in patients with cancer. Journal of the

171
National Cancer Institute Monographs, 2004(32), 57-71.
doi:10.1093/jncimonographs/lgh014
Massie, M. J., Lloyd-Williams, M., Irving, G., & Miller, K. (2011). The prevalence of
depression in people with cancer. In D. W. Kissane, M. Maj, & N. Sartorius (Eds.),
Depression and Cancer. (pp. 1-36). Oxford: Willey-Blackwell.
Mays, N., & Pope, C. (2000). Assessing quality in qualitative research. British Medical
Journal, 320(7226), 50-52. doi:10.1136/bmj.320.7226.50
Mc Sharry, J., Bishop, F. L., Moss-Morris, R., Holt, R. I., & Kendrick, T. (2015). A new
measure of multimorbid illness and treatment representations: The example of
diabetes and depression. Journal of Affective Disorders, 174, 192-200.
doi:10.1016/j.jad.2014.11.050
Mc Sharry, J., Bishop, F. L., Moss-Morris, R., & Kendrick, T. (2013). ‘The chicken and egg
thing’: Cognitive representations and self-management of multimorbidity in people
with diabetes and depression. Psychology & Health, 28(1), 103-119.
doi:10.1080/08870446.2012.716438
McCorkle, R., Ercolano, E., Lazenby, M., Schulman-Green, D., Schilling, L. S., Lorig, K., &
Wagner, E. H. (2011). Self-management: Enabling and empowering patients living
with cancer as a chronic illness. CA: A Cancer Journal for Clinicians, 61(1), 50-62.
doi:10.3322/caac.20093
McCorry, N. K., Dempster, M., Quinn, J., Hogg, A., Newell, J., Moore, M., . . . Kirk, S. J.
(2013). Illness perception clusters at diagnosis predict psychological distress among
women with breast cancer at 6 months post diagnosis. Psycho-Oncology, 22(3), 692-
698. doi:10.1002/pon.3054
McDowell, M. E., Occhipinti, S., Ferguson, M., Dunn, J., & Chambers, S. K. (2010).
Predictors of change in unmet supportive care needs in cancer. Psycho-Oncology,

172
19(5), 508-516. doi:10.1002/pon.1604
Mehta, R. D., & Roth, A. J. (2015). Psychiatric considerations in the oncology setting. CA: A
Cancer Journal for Clinicians, 65(4), 299-314. doi:10.3322/caac.21285
Michell, J. (2004). The place of qualitative research in psychology. Qualitative Research in
Psychology, 1(4), 307-319. doi:10.1191/1478088704qp020oa
Mickevičiene, A., Vanagas, G., Jievaltas, M., & Ulys, A. (2013). Does illness perception
explain quality of life of patients with prostate cancer? Medicina (Kaunas, Lithuania),
49(5), 235-241. Retrieved from http://medicina.kmu.lt/main-e.htm
Millar, K., Purushotham, A. D., McLatchie, E., George, W. D., & Murray, G. D. (2005). A 1-
year prospective study of individual variation in distress, and illness perceptions, after
treatment for breast cancer. Journal of Psychosomatic Research, 58(4), 335-342.
doi:10.1016/j.jpsychores.2004.10.005
Mishra, S. I., Scherer, R. W., Geigle, P. M., Berlanstein, D. R., Topaloglu, O., Gotay, C. C.,
& Snyder, C. (2012). Exercise interventions on health‐related quality of life for cancer
survivors. Cochrane Database of Systematic Reviews. doi:10.1002/14651858.CD00
7566.pub2
Mishra, S. I., Scherer, R. W., Snyder, C., Geigle, P. M., Berlanstein, D. R., & Topaloglu, O.
(2012). Exercise interventions on health‐related quality of life for people with cancer
during active treatment. Cochrane Database of Systematic Reviews.
doi:10.1002/14651858.CD008465.pub2
Misono, S., Weiss, N. S., Fann, J. R., Redman, M., & Yueh, B. (2008). Incidence of suicide
in persons with cancer. Journal of Clinical Oncology, 26(29), 4731-4738.
doi:10.1200/jco.2007.13.8941
Moher, D., Liberati, A., Tetzlaff, J., Altman, D. G., & The PRISMA Group. (2009). Preferred
reporting items for systematic reviews and meta-analysis: The PRISMA statement.

173
PLoS Medicine, 6(7), e1000097. doi:10.1371/journal.pmed.1000097
Mols, F., Lemmens, V., Bosscha, K., van den Broek, W., & Thong, M. S. (2014). Living with
the physical and mental consequences of an ostomy: A study among 1-10-year rectal
cancer survivors from the population-based PROFILES registry. Psycho-Oncology,
23(9), 998-1004. doi:10.1002/pon.3517
Moss-Morris, R., Weinman, J., Petrie, K., Horne, R., Cameron, L., & Buick, D. (2002). The
revised illness perception questionnaire (IPQ-R). Psychology & Health, 17(1), 1-16.
doi:10.1080/08870440290001494
Mystakidou, K., Tsilika, E., Parpa, E., Katsouda, E., Galanos, A., & Vlahos, L. (2005).
Assessment of anxiety and depression in advanced cancer patients and their
relationship with quality of life. Quality of Life Research, 14(8), 1825-1833.
doi:10.1007/s11136-005-4324-3
Nakash, O., Levav, I., Aguilar-Gaxiola, S., Alonso, J., Andrade, L. H., Angermeyer, M. C., . .
. Scott, K. M. (2014). Comorbidity of common mental disorders with cancer and their
treatment gap: Findings from the World Mental Health Surveys. Psycho-Oncology,
23(1), 40-51. doi:10.1002/pon.3372
O'Brien, C. W., & Moorey, S. (2010). Outlook and adaptation in advanced cancer: A
systematic review. Psycho-Oncology, 19(12), 1239-1249. doi:10.1002/pon.1704
O'Mahen, H. A., Flynn, H. A., Chermack, S., & Marcus, S. (2009). Illness perceptions
associated with perinatal depression treatment use. Archives Of Women's Mental
Health, 12(6), 447-450. doi:10.1007/s00737-009-0078-1
Parle, M., Jones, B., & Maguire, P. (1996). Maladaptive coping and affective disorders
among cancer patients. Psychological Medicine, 26, 735-744.
doi:10.1017/S0033291700037752
Paschali, A. A., Hadjulis, M., Papadimitriou, A., & Karademas, E. C. (2015). Patient and

174
physician reports of the information provided about illness and treatment: What
matters for patients' adaptation to cancer during treatment? Psycho-Oncology, 24(8),
901-909. doi:10.1002/pon.3741
Pascoe, S., Edelman, S., & Kidman, A. (2000). Prevalence of psychological distress and use
of support services by cancer patients at Sydney hospitals. Australian and New
Zealand Journal of Psychiatry, 34(5), 785-791. doi:10.1080/j.1440-
1614.2000.00817.x
Pasquini, M., & Biondi, M. (2007). Depression in cancer patients: A critical review. Clinical
Practice and Epidemiology in Mental Health, 3(1), 1-9. doi:10.1186/1745-0179-3-2
Patel, S., Wittkowski, A., Fox, J. R. E., & Wieck, A. (2013). An exploration of illness beliefs
in mothers with postnatal depression. Midwifery, 29(6), 682-689.
doi:10.1016/j.midw.2012.06.012
Petrie, K. J., Perry, K., Broadbent, E., & Weinman, J. (2012). A text message programme
designed to modify patients’ illness and treatment beliefs improves self-reported
adherence to asthma preventer medication. British Journal of Health Psychology,
17(1), 74-84. doi:10.1111/j.2044-8287.2011.02033.x
Petrie, K. J., & Weinman, J. (2012). Patients' perceptions of their illness: The dynamo of
volition in health care. Current Directions in Psychological Science, 21(1), 60-65.
doi:10.1177/0963721411429456
Pinar, G., Okdem, S., Buyukgonenc, L., & Ayhan, A. (2012). The relationship between social
support and the level of anxiety, depression, and quality of life of Turkish women
with gynecologic cancer. Cancer Nursing, 35(3), 229-235.
doi:10.1097/NCC.0b013e31822c47bd
Pinquart, M., & Duberstein, P. (2010). Depression and cancer mortality: A meta-analysis.
Psychological Medicine, 40(11), 1797-1810. doi:10.1017/S0033291709992285

175
Pomerantz, A. M., & Rose, P. (2014). Is depression the past tense of anxiety? An empirical
study of the temporal distinction. International Journal of Psychology, 49(6), 446-
452. doi:10.1002/ijop.12050
Prins, M. A., Verhaak, P. F. M., Bensing, J. M., & van der Meer, K. (2008). Health beliefs
and perceived need for mental health care of anxiety and depression—The patients'
perspective explored. Clinical Psychology Review, 28, 1038-1058.
doi:10.1016/j.cpr.2008.02.009
QSR International Pty Ltd. (2014). NVivo qualitative data analysis Software (Version 10).
Retrieved from http://www.qsrinternational.com/
R Core Team. (2014). R: A language and environment for statistical computing. Vienna,
Austria: R Foundation for Statistical Computing. Retrieved from http://www.R-
project.org/
Rainbird, K., Perkins, J., Sanson-Fisher, R., Rolfe, I., & Anseline, P. (2009). The needs of
patients with advanced, incurable cancer. British Journal of Cancer, 101(5), 759-764.
doi:10.1038/sj.bjc.6605235
Richardson, E. M., Schüz, N., Sanderson, K., Scott, J. L., & Schüz, B. (2016). Illness
representations, coping, and illness outcomes in people with cancer: A systematic
review and meta-analysis. Psycho-Oncology. Advance online publication.
doi:10.1002/pon.4213
Ritchie, C. S., Kvale, E., & Fisch, M. J. (2011). Multimorbidity: An issue of growing
importance for oncologists. Journal of Oncology Practice, 7(6), 371-374.
doi:10.1200/JOP.2011.000460
Robinson, D., Renshaw, C., Okello, C., Moller, H., & Davies, E. A. (2009). Suicide in cancer
patients in South East England from 1996 to 2005: A population-based study. British
Journal of Cancer, 101(1), 198-201. doi:10.1038/sj.bjc.6605110

176
Robson, A., Scrutton, F., Wilkinson, L., & MacLeod, F. (2010). The risk of suicide in cancer
patients: A review of the literature. Psycho-Oncology, 19(12), 1250-1258.
doi:10.1002/pon.1717
Rosenthal, R. (1979). The "file drawer problem" and tolerance for null results. Psychological
Bulletin, 86(3), 638-641. doi:10.1037/0033-2909.86.3.638
Roy-Byrne, P. P., Davidson, K. W., Kessler, R. C., Asmundson, G. J. G., Goodwin, R. D.,
Kubzansky, L., . . . Stein, M. B. (2008). Anxiety disorders and comorbid medical
illness. General Hospital Psychiatry, 30(3), 208-225.
doi:10.1016/j.genhosppsych.2007.12.006
Rozema, H., Völlink, T., & Lechner, L. (2009). The role of illness representations in coping
and health of patients treated for breast cancer. Psycho-Oncology, 18(8), 849-857.
doi:10.1002/pon.1488
Salander, P., & Windahl, G. (1999). Does ‘denial’ really cover our everyday experiences in
clinical oncology? A critical view from a psychoanalytic perspective on the use of
‘denial’. British Journal of Medical Psychology, 72(2), 267-279.
doi:10.1348/000711299159899
Sand, L., Olsson, M., & Strang, P. (2009). Coping strategies in the presence of one's own
impending death from cancer. Journal of Pain and Symptom Management, 37(1), 13-
22. doi:10.1016/j.jpainsymman.2008.01.013
Sanjida, S., Janda, M., Kissane, D., Shaw, J., Pearson, S-A., DiSipio, T., & Couper, J. (2016).
A systematic review and meta-analysis of prescribing practices of antidepressants in
cancer patients. Psycho-Oncology, 25(9), 1002-1016. doi:10.1002/pon.4048
Satin, J. R., Linden, W., & Phillips, M. J. (2009). Depression as a predictor of disease
progression and mortality in cancer patients. Cancer, 115(22), 5349-5361.
doi:10.1002/cncr.24561

177
Scharloo, M., Baatenburg de Jong, R. J., Langeveld, T. P. M., van Velzen-Verkaik, E.,
Doorn-op den Akker, M. M., & Kaptein, A. A. (2005). Quality of life and illness
perceptions in patients with recently diagnosed head and neck cancer. Head and Neck,
27(10), 857-863. doi:10.1002/hed.20251
Scharloo, M., Baatenburg de Jong, R. J., Langeveld, T. P. M., van Velzen-Verkaik, E.,
Doorn-op den Akker, M. M., & Kaptein, A. A. (2010). Illness cognitions in head and
neck squamous cell carcinoma: Predicting quality of life outcome. Supportive Care in
Cancer, 18(9), 1137-1145. doi:10.1007/s00520-009-0728-x
Schneider, S., Moyer, A., Knapp-Oliver, S., Sohl, S., Cannella, D., & Targhetta, V. (2010).
Pre-intervention distress moderates the efficacy of psychosocial treatment for cancer
patients: A meta-analysis. Journal of Behavioral Medicine, 33(1), 1-14.
doi:10.1007/s10865-009-9227-2
Schofield, P., Carey, M., & Aranda, S. (2006). Psychosocial issues for people with advanced
cancer: Overcoming the research challenges. Cancer Forum, 30(1), 18-21. Retrieved
from http://cancerforum.org.au/
Schüz, B., Wolff, J. K., Warner, L. M., Ziegelmann, J. P., & Wurm, S. (2014). Multiple
illness perceptions in older adults: Effects on physical functioning and medication
adherence. Psychology & Health, 29(4), 442-457. doi:10.1080/08870446.2013.
863884
Siemonsma, P. C., Stuive, I., Roorda, L. D., Vollebregt, J. A., Walker, M. F., Lankhorst, G.
J., & Lettinga, A. T. (2013). Cognitive treatment of illness perceptions in patients
with chronic low back pain: A randomized controlled trial. Physical Therapy, 93(4),
435-448. doi:10.2522/ptj.20110150
Silva, S. M., Moreira, H. C., & Canavarro, M. C. (2012). Examining the links between
perceived impact of breast cancer and psychosocial adjustment: The buffering role of

178
posttraumatic growth. Psycho-Oncology, 21(4), 409-418. doi:10.1002/pon.1913
Simard, S., Savard, J., & Ivers, H. (2010). Fear of cancer recurrence: Specific profiles and
nature of intrusive thoughts. Journal of Cancer Survivorship, 4(4), 361-371.
doi:10.1007/s11764-010-0136-8
Simard, S., Thewes, B., Humphris, G., Dixon, M., Hayden, C., Mireskandari, S., & Ozakinci,
G. (2013). Fear of cancer recurrence in adult cancer survivors: A systematic review of
quantitative studies. Journal of Cancer Survivorship, 7(3), 300-322.
doi:10.1007/s11764-013-0272-z
Singer, S., Das-Munshi, J., & Brähler, E. (2010). Prevalence of mental health conditions in
cancer patients in acute care—a meta-analysis. Annals of Oncology, 21(5), 925-930.
doi:10.1093/annonc/mdp515
Singer, S., Krauß, O., Keszte, J., Siegl, G., Papsdorf, K., Severi, E., . . . Brähler, E. (2012).
Predictors of emotional distress in patients with head and neck cancer. Head & Neck,
34(2), 180-187. doi:10.1002/hed
Söllner, W., DeVries, A., Steixner, E., Lukas, P., Sprinzl, G., Rumpold, G., & Maislinger, S.
(2001). How successful are oncologists in identifying patient distress, perceived social
support, and need for psychosocial counselling? British Journal of Cancer, 84(2),
179-185. doi:10.1054/bjoc.2000.1545
Stanton, A. L., Luecken, L. J., MacKinnon, D. P., & Thompson, E. H. (2013). Mechanisms in
psychosocial interventions for adults living with cancer: Opportunity for integration
of theory, research, and practice. Journal of Consulting and Clinical Psychology,
81(2), 318-335. doi:10.1037/a0028833
Stark, D. P. H., & House, A. (2000). Anxiety in cancer patients. British Journal of Cancer,
83(10), 1261-1267. doi:10.1054/bjoc.2000.1405
Stein, K. D., Syrjala, K. L., & Andrykowski, M. A. (2008). Physical and psychological long-

179
term and late effects of cancer. Cancer, 112(S11), 2577-2592.
doi:10.1002/cncr.23448
Stewart, B. W., & Wild, C. P. (2014). World Cancer Report 2014. Switzerland: International
Agency for Research on Cancer, World Health Organization.
Strada, E. A., & Sourkes, B. M. (2010). Principles of psychotherapy. In J. C. Holland, W. S.
Breitbart, P. B. Jacobsen, M. S. Lederberg, M. J. Loscalzo, & R. McCorkle (Eds.),
Psycho-Oncology (2nd ed., pp. 397-401). New York: Oxford University Press.
Street, R. L., Jr., Makoul, G., Arora, N. K., & Epstein, R. M. (2009). How does
communication heal? Pathways linking clinician-patient communication to health
outcomes. Patient Education and Counseling, 74(3), 295-301.
doi:10.1016/j.pec.2008.11.015
Thompson, S. C., Sobolew-Shubin, A., Galbraith, M. E., Schwankovsky, L., & Cruzen, D.
(1993). Maintaining perceptions of control: Finding perceived control in low-control
circumstances. Journal of Personality and Social Psychology, 64(2), 293-304.
doi:10.1037//0022-3514.64.2.293
Thuné-Boyle, I. C. V., Myers, L. B., & Newman, S. P. (2006). The role of illness beliefs,
treatment beliefs, and perceived severity of symptoms in explaining distress in cancer
patients during chemotherapy treatment. Behavioral Medicine, 32(1), 19-29.
doi:10.3200/bmed.32.1.19-29
Tong, A., Sainsbury, P., & Craig, J. (2007). Consolidated criteria for reporting qualitative
research (COREQ): A 32-item checklist for interviews and focus groups.
International Journal for Quality in Health Care, 19(6), 349-357.
doi:10.1093/intqhc/mzm042
Traeger, L. (2009). Cognitive predictors of health-related quality of life in localized prostate
cancer: A lifespan perspective (Doctoral dissertation, University of Miami). Retrieved

180
from PsychINFO. (622199237)
Traeger, L., Penedo, F. J., Benedict, C., Dahn, J. R., Lechner, S. C., Schneiderman, N., &
Antoni, M. H. (2013). Identifying how and for whom cognitive-behavioral stress
management improves emotional well-being among recent prostate cancer survivors.
Psycho-Oncology, 22(2), 250-259. doi:10.1002/pon.2074
Traeger, L., Penedo, F. J., Gonzalez, J. S., Dahn, J. R., Lechner, S. C., Schneiderman, N., &
Antoni, M. H. (2009). Illness perceptions and emotional well-being in men treated for
localized prostate cancer. Journal of Psychosomatic Research, 67(5), 389-397.
doi:10.1016/j.jpsychores.2009.03.013
Tryon, G. S., & Winograd, G. (2011). Goal consensus and collaboration. Psychotherapy,
48(1), 50-57. doi:10.1037/a0022061
Underhill, C., Bartel, R., Goldstein, D., Snodgrass, H., Begbie, S., Yates, P., . . . Grogan, P.
(2009). Mapping oncology services in regional and rural Australia. Australian Journal
of Rural Health, 17(6), 321-329. doi:10.1111/j.1440-1584.2009.01106.x
van der Kloot, W. A., Kobayashi, K., Yamaoka, K., Inoue, K., Nortier, H. W. R., & Kaptein,
A. A. (2014). Summarizing the fifteen scales of the EORTC QLQ-C30 questionnaire
by five aggregate scales with two underlying dimensions: A literature review and an
empirical study. Journal of Psychosocial Oncology, 32(4), 413-430.
doi:10.1080/07347332.2014.917139
van Scheppingen, C., Schroevers, M. J., Smink, A., van der Linden, Y. M., Mul, V. E.,
Langendijk, J. A., . . . Sanderman, R. (2011). Does screening for distress efficiently
uncover meetable unmet needs in cancer patients? Psycho-Oncology, 20(6), 655-663.
doi:10.1002/pon.1939
Viechtbauer, W. (2010). Conducting meta-analyses in R with the metafor package. Journal of
Statistical Software, 36(3), 1-48. doi:10.18637/jss.v036.i03

181
Vollmann, M., Scharloo, M., Salewski, C., Dienst, A., Schonauer, K., & Renner, B. (2010).
Illness representations of depression and perceptions of the helpfulness of social
support: Comparing depressed and never-depressed persons. Journal of Affective
Disorders, 125(1-3), 213-220. doi:10.1016/j.jad.2010.01.075
Wang, J.-W., Shen, Q., Ding, N., Zhang, T.-R., Yang, Z.-Q., Liu, C., . . . Yu, J.-M. (2016). A
qualitative exploration of the unmet psychosocial rehabilitation needs of cancer
survivors in China. Psycho-Oncology, 25(8), 905-912. doi:10.1002/pon.4023
Ward, E. C., Mengesha, M. M., & Issa, F. (2014). Older African American women's lived
experiences with depression and coping behaviours. Journal of Psychiatric and
Mental Health Nursing, 21(1), 46-59. doi:10.1111/jpm.12046
Ward, S., Donovan, H., Gunnarsdottir, S., Serlin, R. C., Shapiro, G. R., & Hughes, S. (2008).
A randomized trial of a representational intervention to decrease cancer pain
(RIDcancerPain). Health Psychology, 27(1), 59-67. doi:10.1037/0278-6133.27.1.59
Weinman, J., Petrie, K., Moss-Morris, R., & Horne, R. (1996). The illness perception
questionnaire: A new method for assessing the cognitive representation of illness.
Psychology & Health, 11(3), 431-445. doi:10.1080/08870449608400270
Wells, K. B., & Sherbourne, C. D. (1999). Functioning and utility for current health of
patients with depression or chronic medical conditions in managed, primary care
practices. Archives of General Psychiatry, 56(10), 897-904.
doi:10.1001/archpsyc.56.10.897
Wu, L. M., Mohamed, N. E., Winkel, G., & Diefenbach, M. A. (2013). Patient and spouse
illness beliefs and quality of life in prostate cancer patients. Psychology & Health,
28(4), 355-368. doi:10.1080/08870446.2012.722219
Zabora, J. R., Brintzenhofeszoc, K., Curbow, B., Hooker, C., & Piantadosi, S. (2001). The
prevalence of psychological distress by cancer site. Psycho-Oncology, 10(1), 19-28.

182
doi:10.1002/1099-1611(200101/02)10:1<19::AID-PON501>3.0.CO;2-6
Zabora, J. R., & MacMurray, L. (2012). The history of psychosocial screening among cancer
patients. Journal of Psychosocial Oncology, 30(6), 625-635.
doi:10.1080/07347332.2012.721491
Zbozinek, T. D., Rose, R. D., Wolitzky‐Taylor, K. B., Sherbourne, C., Sullivan, G., Stein, M.
B., . . . Craske, M. G. (2012). Diagnostic overlap of generalized anxiety disorder and
major depressive disorder in a primary care sample. Depression and Anxiety, 29(12),
1065-1071. doi:10.1002/da.22026
Zivkovic, M. V., Buljan, M., Blajic, I., & Situm, M. (2008). Psychological status and illness
perceptions in patients with melanoma. Collegium Antropologicum, 32, 75-78.
Retrieved from http://www.collantropol.hr/antropo

Appendix 2.1 has been removed for copyright or proprietary reasons.
It is a published article: Richardson, E. M., Schüz, N., Sanderson, K., Scott, J. L., Schüz, B., 2016. Illness representations, coping, and illness outcomes in people with cancer: a systematic review and meta-analysis, Psycho-oncology, 26(6), 724-737

Appendix 2.2 PRISMA 2009 Statement (Study 1) 197
Section/topic # Checklist item Reported on page #
TITLE
Title 1 Identify the report as a systematic review, meta-analysis, or both. 25
ABSTRACT
Structured summary 2 Provide a structured summary including, as applicable: background; objectives; data sources; study eligibility criteria, participants, and interventions; study appraisal and synthesis methods; results; limitations; conclusions and implications of key findings; systematic review registration number.
26
INTRODUCTION
Rationale 3 Describe the rationale for the review in the context of what is already known. 27-30
Objectives 4 Provide an explicit statement of questions being addressed with reference to participants, interventions, comparisons, outcomes, and study design (PICOS).
30
METHODS
Protocol and registration 5 Indicate if a review protocol exists, if and where it can be accessed (e.g., Web address), and, if available, provide registration information including registration number.
N/A
Eligibility criteria 6 Specify study characteristics (e.g., PICOS, length of follow-up) and report characteristics (e.g., years
considered, language, publication status) used as criteria for eligibility, giving rationale. 31
Information sources 7 Describe all information sources (e.g., databases with dates of coverage, contact with study authors to identify additional studies) in the search and date last searched.
30-32
Search 8 Present full electronic search strategy for at least one database, including any limits used, such that it could be repeated.
App 2.3
Study selection 9 State the process for selecting studies (i.e., screening, eligibility, included in systematic review, and, if applicable, included in the meta-analysis).
30-31, Figure 2.2, App 2.6
Data collection process 10 Describe method of data extraction from reports (e.g., piloted forms, independently, in duplicate) and any processes for obtaining and confirming data from investigators.
33
Data items 11 List and define all variables for which data were sought (e.g., PICOS, funding sources) and any assumptions and simplifications made.
32-33
Risk of bias in individual studies
12 Describe methods used for assessing risk of bias of individual studies (including specification of whether this was done at the study or outcome level), and how this information is to be used in any data synthesis.
33, App 2.10
Summary measures 13 State the principal summary measures (e.g., risk ratio, difference in means). 33-34
Synthesis of results 14 Describe the methods of handling data and combining results of studies, if done, including measures of
consistency (e.g., I2) for each meta-analysis. 34, App 2.9
Page 1 of 2

198
Section/topic # Checklist item Reported on page #
Risk of bias across studies 15 Specify any assessment of risk of bias that may affect the cumulative evidence (e.g., publication bias, selective reporting within studies).
34, App 2.9
Additional analyses 16 Describe methods of additional analyses (e.g., sensitivity or subgroup analyses, meta-regression), if done,
indicating which were pre-specified. 39, 43
RESULTS
Study selection 17 Give numbers of studies screened, assessed for eligibility, and included in the review, with reasons for exclusions at each stage, ideally with a flow diagram.
31, Figure 2.2, App 2.6
Study characteristics 18 For each study, present characteristics for which data were extracted (e.g., study size, PICOS, follow-up period) and provide the citations.
34-35, App 2.7 2.8
Risk of bias within studies 19 Present data on risk of bias of each study and, if available, any outcome level assessment (see item 12). 35, App 2.10
Results of individual studies 20 For all outcomes considered (benefits or harms), present, for each study: (a) simple summary data for each intervention group (b) effect estimates and confidence intervals, ideally with a forest plot.
N/A
Synthesis of results 21 Present results of each meta-analysis done, including confidence intervals and measures of consistency. 36-39, Tables 2.1-2.4, App 2.11
Risk of bias across studies 22 Present results of any assessment of risk of bias across studies (see Item 15). 36-39, App 2.12
Additional analysis 23 Give results of additional analyses, if done (e.g., sensitivity or subgroup analyses, meta-regression [see Item 16]).
39, 43
DISCUSSION
Summary of evidence 24 Summarize the main findings including the strength of evidence for each main outcome; consider their relevance to key groups (e.g., healthcare providers, users, and policy makers).
45-47
Limitations 25 Discuss limitations at study and outcome level (e.g., risk of bias), and at review-level (e.g., incomplete retrieval of identified research, reporting bias).
48-50
Conclusions 26 Provide a general interpretation of the results in the context of other evidence, and implications for future research.
47-48, 50
FUNDING
Funding 27 Describe sources of funding for the systematic review and other support (e.g., supply of data); role of funders for the systematic review.
N/A
From: Moher D, Liberati A, Tetzlaff J, Altman DG, The PRISMA Group (2009). Preferred Reporting Items for Systematic Reviews and Meta-Analyses: The PRISMA Statement. PLoS Med 6(6): e1000097. doi:10.1371/journal.pmed1000097
For more information, visit: www.prisma-statement.org. Page 2 of 2

199
Appendix 2.3 Database search strategies (original search) (Study 1)
Scopus Syntax
Advanced Search
PUBYEAR > 1995 AND TITLE-ABS-KEY(tumour* OR cancer* OR oncolog* OR
carcinoma* OR maligna* OR neoplasm* OR metasta* OR *sarcoma* OR “gestational
trophoblastic” OR leukaemia OR lymphoma OR mesothelioma OR myeloma OR
myelodysplastic OR *blastoma OR melanoma OR waldenstrom) AND TITLE-ABS-
KEY("illness perception*" OR "illness representation*" OR “common sense” OR Leventhal*
OR “self-regulation” OR IPQ*)
Web of Science Syntax
Basic Search
((tumour* OR cancer* OR oncolog* OR carcinoma* OR maligna* OR neoplasm* OR
metasta* OR *sarcoma* OR “gestational trophoblastic” OR leukaemia OR lymphoma OR
mesothelioma OR myeloma OR myelodysplastic OR *blastoma OR melanoma OR
waldenstrom) AND ("illness perception*" OR "illness representation*" OR “common sense”
OR Leventhal* OR “self-regulation” OR IPQ*))
Timespan 1995 - 2014
PubMed Syntax
Advanced Search
(tumour*[TIAB] OR cancer*[TIAB] OR oncolog*[TIAB] OR carcinoma*[TIAB] OR
maligna*[TIAB] OR neoplasm*[TIAB] OR metasta*[TIAB] OR *sarcoma*[TIAB] OR
“gestational trophoblastic”[TIAB] OR leukaemia[TIAB] OR lymphoma[TIAB] OR
mesothelioma[TIAB] OR myeloma[TIAB] OR myelodysplastic[TIAB] OR *blastoma[TIAB]
OR melanoma[TIAB] OR waldenstrom [TIAB]) AND ("illness perception*"[TIAB] OR
"illness representation*"[TIAB] OR “common sense”[TIAB] OR Leventhal*[TIAB] OR
“self-regulation”[TIAB] OR IPQ*[TIAB])
Custom Date Range 1995 - 2014
PsycINFO Syntax
Command Line
AB,TI(tumour* OR cancer* OR oncolog* OR carcinoma* OR maligna* OR neoplasm* OR
metasta* OR *sarcoma* OR “gestational trophoblastic” OR leukaemia OR lymphoma OR
mesothelioma OR myeloma OR myelodysplastic OR *blastoma OR melanoma OR
waldenstrom) AND AB,TI("illness perception*" OR "illness representation*" OR “common
sense” OR Leventhal* OR “self-regulation” OR IPQ*)
Enter a specific date range starting 1995 ending 2014

200
Google Scholar Syntax
With the exact phrase:
Illness Representation Illness Representations
Illness Perception Illness Perceptions
Self-Regulation Common Sense
IPQ
With at least one of the words: cancer tumour oncology carcinoma malignant malignancy
neoplasm metastatic metastasis sarcoma leukaemia lymphoma
In the title of the article
Return articles dated between 1995 – 2014
CINAHL (follow-up search) Syntax
((tumour* OR cancer* OR oncolog* OR carcinoma* OR maligna* OR neoplasm* OR
metasta* OR *sarcoma* OR “gestational trophoblastic” OR leukaemia OR lymphoma OR
mesothelioma OR myeloma OR myelodysplastic OR *blastoma OR melanoma OR
waldenstrom) AND ("illness perception*" OR "illness representation*" OR “common sense”
OR Leventhal* OR “self-regulation” OR IPQ*))
Published date: 1995 - 2015

201
Appendix 2.4 Coding manual (Study 1)
Coding Manual
1 General Information
ID No. _______________ Cancer Type ______ DV _______
An article identification number should be included at the top left of each page under ID No., and again in the
General Publication Information section of the coding sheet. The 7-digit ID is specified in BLOCK CAPITALS.
It is composed of:
• the first three letters of the surname of the first author
• the last two digits of the publication year
• the first two letters of the surname of the second author (if no secondary author: xx)
If several cancer types are examined in a publication, a private coding sheet is filled out for each type of cancer.
The cancer types in an article are numbered. This number is entered in the upper right corner of each page under
Cancer Type, and again in the Cancer and Sample Information section of the coding sheet. If the publication
examines only one cancer type, the number of the cancer type followed by the word “only” is entered here. Cancer
Type has been adopted from the American Cancer Society and should be coded as per the categories below:
1 = Adrenal
2 = Anal
3 = Bile Duct
4 = Bladder
5 = Bone
6 = Brain / Spinal Cord (Central Nervous System) Tumour
7 = Breast
8 = Breast in Men
9 = Cancer of Unknown Primary Source
10 = Cervical
11 = Colon / Rectum (Colorectal or Bowel)
12 = Endometrial
13 = Esophagus/ Esophageal
14 = Ewing Family of Tumours
15 = Eye
16 = Head and Neck
17 = Gallbladder
18 = Gastric
19 = Gastrointestinal Carcinoid Tumours
20 = Gastrointestinal Stromal Tumour (GIST)
21 = Gestational Trophoblastic Disease
22 = Kaposi Sarcoma
23 = Kidney Cancer
24 = Laryngeal and Hyphopharyngeal
25 = Leukemia
26 = Acute Lymphocytic Leukemia (ALL)
27 = Acute Myeloid Leukemia (AML)
37 = Hodgkin Lymphoma (Hodgkin Disease)
38 = Non-Hodgkin Lymphoma
39 = Lymphoma of the Skin
40 = Malignant Mesothelioma
41 = Multiple Myeloma
42 = Myelodysplastic Syndrome (MDS)
43 = Nasal Cavity and Paranasal Sinus
44 = Neuroblastoma
45 = Oral Cavity and Oropharyngeal
46 = Osteosarcoma
47 = Ovarian
48 = Pancreatic
49 = Penile
50 = Pituitary Carcinomas or Tumours
51 = Prostate
52 = Renal Cell Carcinoma
53 = Retinoblastoma
54 = Rhabdomyosarcoma (RMS)
55 = Salivary Gland
56 = Sarcoma (Soft Tissue Sarcoma)
57 = Skin Cancer
58 = Basal and Squamous Cell Skin Cancers
59 = Melanoma Skin Cancer
60 = Small Intestine
61 = Stomach
62 = Testicular
63 = Thymus

202
28 = Chronic Lymphocytic Leukemia (CLL)
29 = Chronic Myeloid Leukemia (CML)
30 = Chronic Myelomonocytic Leukemia (CMML)
31 = Liver
32 = Lung
33 = Non-Small Cell Lung Cancer (NSCLC)
34 = Small Cell Lung Cancer (SCLC)
35 = Lung Carcinoid Tumour
36 = Lymphoma
64 = Thyroid
65 = Urethral
66 = Uterine Sarcoma
67 = Vaginal
68 = Vulvar
69 = Waldenstrom Macroglubulinemia (WM)
70 = Wilms Tumour
71 = Cancer Type Not Specified
99 = Other Cancer Type (Specify)
Note: Please code cancer type with the most specific cancer type code possible.
If in the publication several dependent variables (including separate subscales) are analysed (e.g. psychological
distress, and avoidance/denial), each dependent variable is given a number in terms of its DV (Subscale) Type.
This number is entered in the upper right corner of each page under DV, and again in the dependent variable
section of the coding sheet. These numbers are the same for all cancer types. DV (Subscale) Type has been adopted
from Hagger and Orbell (2003) and should be coded as per the categories below:
Coping Behaviours
1. Expressing Emotion
2. Cognitive Reappraisal
3. Avoidance/Denial
4. Problem-Focused Coping (Generic)
5. Problem-Focused Coping (Specific - Other)
6. Treatment Decision Making
7. Medication Adherence
8. Adherence to Treatment Visits
9. Doctors Visits
10. Seeking Social Support
98. Other Coping Behaviour (Specify)
Illness Outcomes
11. Affect (Negative/Positive)
12. Anxiety
13. Depression
14. Psychological Distress
15. Treatment Related Distress
16. Decisional Uncertainty / Regret
17. Psychological Well-Being
18. Vitality
19. Role Functioning
20. Physical Functioning
21. Disease State
22. Quality of Life
99. Other Illness Outcome (Specify)
Redundant Information
If multiple coding sheets are filled in for one article, the details that apply to the entire article should be recorded
in only one coding sheet, and the corresponding check box (to the right of the questions) should be ticked in other
relevant coding sheets.
Therefore a ticked box means that the missing information may be taken from another coding sheet.
Missing Information
There are two types of missing information:
• Not Applicable: is crossed out in coding sheet and later encoded in data entry with 777.
• Missing: is left open (and possibly supplemented, if one has written to the author).

203
Decimal Places
All sample values should be a maximum of two decimal places (rounded).
All statistical values should be a maximum of three decimal places.
Exclusion Criteria
If one of the following criteria apply, the study must be excluded:
• Study did not use a Quantitative Design: The study used one or more invalidated or unstandardised key measure of interest.
• Study did not use the IPQ or IPQ-R: The study did not measure Illness Representations from the CSM using the Illness Perception
Questionnaire or the Revised Illness Perception Questionnaire.
• Study did not measure Coping Behaviours or Illness Outcomes
• Study contained Participants without a Cancer Diagnosis
• Study used (only) Children or Adolescents: Participants must not be under the age of eighteen.
• Study in a language other than English or German: Note: We will consider studies in other languages if they include clear results.
• Study was conducted prior to 1995: The study was conducted prior to the creation of the IPQ.
A coding sheet must be created for any excluded study. However, it is sufficient to only fill in the general
information for publication section. In addition, the “Study will be Excluded” box should be ticked and reasons
should be provided in the comments box on the last page.

204
2 Comments on the Study
Study will be Excluded Write to Authors Important Comments
If problems occurred during encoding, the relevant box should be ticked (with details to be included in the Final
Details box on the last page of the coding sheet).
• Study will be Excluded: Reason for exclusion in the final data set.
• Write to Authors: If the publication is lacking important statistical information (e.g. information about the sample size or standard
deviations), the coder will try to check this information with the authors. The missing details are mentioned in the Final Details
box.
• Important Comments: If any problems/comments are entered in the Final Details box, this field should be ticked – unless these are
reasons for exclusion or information about a lack of statistical information.

205
3 General Publication Information
Article Identification Number (ID-No.): __ __ __ __ __ __ __ Study in Article: _________
The Article Identification Number should be the same 7-digit ID (specified in BLOCK CAPITALS) as appears at
the top left hand corner of each page. It is composed of
• the first three letters of the surname of the first author
• the last two digits of the publication year
• the first two letters of the surname of the second author (if no secondary author: xx)
If the publication contains several studies that refer to different samples, these studies are numbered. For each
study, a separate coding sheet should be created. The respective number of the study is then given here.
Coder: ___________ Coding Date____ / ___ / _______ Time of Day: ___________
Coder: Enter initials of Coder
Coding Date: Day / Month / Year
Time of Day: Specify at the start of encoding in order to determine the total duration of coding
Authors: ________________________________________________ Publication Year: _________
Specify the last name of the first three authors. If more than three authors are mentioned, all the other authors are
abbreviated with et al. The publication year is four digits.
Title (first six words): ______________________________________________________________
Note the first six words from the title of the publication.
Country of Origin - Author: _________ Other Origin: ______________________
The Country of Origin of the first author is usually noted on the publication. If not, it should be googled and
entered using the codes below. If the author has more than one Country of Origin, enter this under Other Origin.

206
Coding of Country of Origin
1 = USA
2 = Canada
3 = Germany
4 = Great Britain
5 = Netherlands
6 = Scandinavia
7 = Australia
8 = Western Europe (excluding G, GB, N, Scandinavia)
9 = Eastern Europe (including Russia)
99 = Other (Specify)
Discipline of the First Author: _________ Other Discipline: ____________________
The discipline of the first author is usually noted on the publication. If not, it should be googled and entered using
the codes below. If the author has more than one discipline listed, enter this under Other Discipline.
Coding of Discipline
1 = Psychology
2 = Psychiatry
3 = Medicine
4 = Sociology
5 = Economy
6 = Education
99 = Other
Publication Found In: _________ Other Place Publication Found: _____________
Coding where the Publication was Found
1 = Scopus
2 = Web of Science
3 = PubMed
4 = PsycINFO
5 = Google Scholar
6 = Manual Search in Journals
7 = Hand-Searched Reference Lists
8 = Contact with Researchers
99 = Other Source
Note: Some publications may be found (or exist) in more than one location or database. The code given will reflect
the first place the coders have found the publication.

207
Type of Publication: _____ Other Publication: ______ Citations: _______ Impact: _________
Coding the Type of Publication
1 = Journal with Peer Review
2 = Journal without Peer Review
3 = Book / Book Chapters
4 = Dissertation (PhD)
5 = Honours Thesis or Master’s Thesis (or German Diploma)
6 = Conference Presentation / Poster (Abstract or Full Paper)
7 = Unpublished Manuscript
8 = Internet Document
99 = Other
Citations
How many citations does the study have (in Scopus)?
Impact
What is the Impact Factor of the Journal (in Journal Citation Reports)?

208
4 Description of the Study
Study Type: _____________ IPQ or IPQ-R Dimension: ___________________________________
Reliability Source: ________ Coefficients Type: ________ Number of Items: ___________
Study: _______________________________________________________________________________
Coding of Study Type Coding of IPQ or IPQ-R Dimension
1 = Cross-Sectional
2 = Longitudinal
3 = Experimental
4 = Pseudo-Experimental
99 = Other Study Type
1 = Identity
2 = Cause (Generic)
3 = Timeline (Acute/Chronic)
4 = Consequences
5 = Personal Control
6 = Treatment Control Items
7 = Illness Coherence Items
8 = Timeline Cyclical
9 = Emotional Representations
10 = IPQ Only – Cure-Control
11 = All Dimensions of IPQ
12 = All Dimensions of IPQ-R
Coding of Reliability Source
0 = No Information
1 = No Information, but reference to another publication (specify study)
2 =Yes, calculated using the sample from this publication (specify values)
3 = Yes, calculated using a different sample (values and specify study)
If reliability coefficients are given for individual subscales, these should be included later in the coding sheet (in
the Statistical Analyses and Effect Sizes section).
If coefficients are drawn from both this sample (coding 2) and from other studies (coding 3) in the publication,
only the coefficients of the concrete sample are to be coded.
If there is no information about reliability, but there is a reference in the description of the instrument, this
corresponds to Coding 1.
Coding of Coefficient Type
1 = Internal Consistency, E.g. Cronbach’s
2 = Split- Halves Reliability
3 = Test-Retest Reliability
4 = Parallel Test Reliability
5 = Mean Value of Several Coefficients
6 = No Precise Indication
99 = Other Coefficient
Study
If a reliability coefficient is (or is not) stated, and reference is made to another study, the first three authors and
the year of publication of the study are stated under “Study”.

209
Number of Items
If all dimensions of the IPQ or IPQ-R were measured, provide the number of items for the entire measure here.
The number of items for each individual subscale should be included later in the coding sheet (in the Statistical
Analyses and Effect Sizes section).
If Experimental:
Number of Groups: _______
Assignment: _______
Group a: _______________
Group b: _______________
Group c: _______________
Group d: _______________
The values of various groups are often reported, e.g. for women and for men. In this case, the statistics for each
group are reported on a single coding sheet.
Note: Only fill out this section of the coding sheet if the study is experimental.
Number of Groups
Specify the number of groups for which statistics are available. If only one group is available, use a 1. Further, all
other fields must not be filled in, but instead crossed out and encoded with 777 (not applicable).
Assignment
Group allocation:
1 = Randomisation: The subjects were randomly assigned to the groups.
2 = Matched Groups: Each person of one group matches a person of the other group. Each pair has similar properties (e.g. the same age or the
same sex).
3 = Natural Groups, parallelised: E.g., women’s and men’s groups are natural groups. These two groups can also be parallelised for other
characteristics (e.g. by having the same mean age).
4 = Natural Groups without further assignment: E.g., comparison of women and men, without other sampling features.
Group a, Group b, etc.
Each group is assigned a continuous index a, b, c, etc. Note which identify groups, e.g. group a = men, group b =
women, or group a = pre-treatment, group b = peri-treatment, group c = post-treatment.
If more than four groups were analysed, the other group affiliations are simply noted on the margin or on a separate
piece of paper.
Number of Measurement Points: _______ Year of the First Data Collection: __________
Number of Measurement Points: Enter a number or 99, when the number of measurement times varied within the
sample. These are only included when statistical information is available for the measurement point.
Year of the First Data Collection: Enter the four-digit year number. If given several years for the first MP, the
earliest year is coded.

210
Lag Between Assessments ________:
MP 2 __________________________________
MP 3 __________________________________
MP 4 __________________________________
MP 5 __________________________________
MP 6 __________________________________
MP 7 __________________________________
MP 8 __________________________________
This box can only be filled in if the distance between the MPs is the same for all individuals, and if statistics are
available. The time interval is specified in months (rounded if necessary).
Use this scale for the conversion of years, weeks and days into months:
1 Day = 0.03 Months
1 Week = 0.25 Months
1 Year = 12 Months

211
5 Cancer and Sample Information
The information on the sample should refer to the smallest unit of analysis (e.g., males and females separately).
If there are several groups, information on the sample for each group should be recorded separately. If this is not
possible and only information on the total sample can be accessed, it is sufficient to fill in the Cancer and Sample
Information box on a single coding sheet and to tick the box on the right – meaning that this data is applicable
across all groups.
Sometimes statistics are only available at the group level, and other times only for the entire sample. In this case,
you can mark information as generally applicable by placing a tick in the smaller box to the right of each row. A
ticked box means that this information refers to the whole sample. If this box is not ticked, it means that this
information refers to the specific group.
Type of Sample: _______________________
The nature of the sample may change during a longitudinal study. For example, students might participate, and
after a passage of time, leave the university. It is therefore crucial for to identify what the type of sample was at
the first MP.
Coding the Type of Sample
1 = Representative Sample
2 = Non-representative Sample of the general population (specify if the study has a name)
3 = Students
4 = Clinical Sample (E.g. those assessed in a hospital)
5 = Cancer Groups, Societies, and Communities (E.g. self-help groups, internet communities)
99 = Other type of Sample (specify)
Cancer Type: ______ Cancer Stage: _________________________________________
Coding of Cancer Type
Cancer Type has been adopted from the American Cancer Society and should be coded as per the categories
below:
1 = Adrenal
2 = Anal
3 = Bile Duct
4 = Bladder
5 = Bone
6 = Brain / Spinal Cord (Central Nervous System) Tumour
7 = Breast
8 = Breast in Men
9 = Cancer of Unknown Primary Source
10 = Cervical
11 = Colon / Rectum (Colorectal or Bowel)
12 = Endometrial
37 = Hodgkin Lymphoma (Hodgkin Disease)
38 = Non-Hodgkin Lymphoma
39 = Lymphoma of the Skin
40 = Malignant Mesothelioma
41 = Multiple Myeloma
42 = Myelodysplastic Syndrome (MDS)
43 = Nasal Cavity and Paranasal Sinus
44 = Neuroblastoma
45 = Oral Cavity and Oropharyngeal
46 = Osteosarcoma
47 = Ovarian
48 = Pancreatic

212
13 = Esophagus/ Esophageal
14 = Ewing Family of Tumours
15 = Eye
16 = Head and Neck
17 = Gallbladder
18 = Gastric
19 = Gastrointestinal Carcinoid Tumours
20 = Gastrointestinal Stromal Tumour (GIST)
21 = Gestational Trophoblastic Disease
22 = Kaposi Sarcoma
23 = Kidney Cancer
24 = Laryngeal and Hyphopharyngeal
25 = Leukemia
26 = Acute Lymphocytic Leukemia (ALL)
27 = Acute Myeloid Leukemia (AML)
28 = Chronic Lymphocytic Leukemia (CLL)
29 = Chronic Myeloid Leukemia (CML)
30 = Chronic Myelomonocytic Leukemia (CMML)
31 = Liver
32 = Lung
33 = Non-Small Cell Lung Cancer (NSCLC)
34 = Small Cell Lung Cancer (SCLC)
35 = Lung Carcinoid Tumour
36 = Lymphoma
49 = Penile
50 = Pituitary Carcinomas or Tumours
51 = Prostate
52 = Renal Cell Carcinoma
53 = Retinoblastoma
54 = Rhabdomyosarcoma (RMS)
55 = Salivary Gland
56 = Sarcoma (Soft Tissue Sarcoma)
57 = Skin Cancer
58 = Basal and Squamous Cell Skin Cancers
59 = Melanoma Skin Cancer
60 = Small Intestine
61 = Stomach
62 = Testicular
63 = Thymus
64 = Thyroid
65 = Urethral
66 = Uterine Sarcoma
67 = Vaginal
68 = Vulvar
69 = Waldenstrom Macroglubulinemia (WM)
70 = Wilms Tumour
71 = Cancer Type Not Specified
99 = Other Cancer Type (Specify)
Note: Please code cancer type with the most specific cancer type code possible.
Coding of Cancer Stage
The Tumour-Node-Metastasis (TNM) Classification of Malignant Tumours will be used to code cancer stage.
In the TNM system, T refers to the size or direct extent of the primary tumour. Higher numbers indicate
increased size, extent, or degree of penetration. Each Cancer Type has specific indicators for classification of a
number. N describes whether or not the cancer has spread into nearby Lymph Nodes. Higher numbers indicate
greater Lymph Node involvement. M informs whether or not distant metastases have been identified (spread of
cancer to other parts of the body).
1 = TX – Primary Tumour cannot be evaluated
2 = T0 – No evidence of Primary Tumour (it cannot be found)
3 = Tis – Carcinoma in situ (early cancer with no invasion of Tumour cells into surrounding tissue)
4 = T1 – Presence of Tumours
5 = T2 - Presence of Tumours
6 = T3 - Presence of Tumours
7 = T4 - Presence of Tumours
8 = NX – Lymph Nodes cannot be evaluated
9 = N0 – No regional Lymph Node Metastasis (Tumour cells are absent)
10 = N1 – Regional Lymph Node Metastasis present
11 = N2 - Regional Lymph Node Metastasis present
12 = N3 – Regional Lymph Node Metastasis
13 = MX – Distant Metastasis cannot be evaluated
14 = M0 – No distant Metastasis (no distant Cancer spread)
15 = M1 – Distant Metastasis (Cancer has spread to distant organs or tissues)
99 = Other Cancer Stage (some cancers are not classified using TNM, e.g. early grade brain tumours – specify the correct stage and include relevant details)

213
Cancer Duration: M = ____________ SD = __________ Range from _______ to _________
Cancer Duration: Record information here regarding the length of time participants have suffered from (been
diagnosed with) cancer (in months).
Use this scale for the conversion of years, weeks and days into months:
1 Day = 0.03 Months
1 Week = 0.25 Months
1 Year = 12 Months
M: Mean value.
SD: Standard deviation.
Range: Specify a minimum and maximum Cancer Duration.
Age at Onset: M = ____________ SD = _________ Range from _______ to _________
Age at Onset: Record information here regarding which age participants were diagnosed with cancer (in months).
M: Mean value.
SD: Standard deviation.
Range: Specify a minimum and maximum Age at Onset.
Treatment Type: ______ Treatment Stage: __________________________________
Coding of Treatment Type Coding of Treatment Stage
1 = Surgery
2 = Radiotherapy
3 = Chemotherapy
4 = Hormone Therapy
99 = Other Treatment (Specify)
1 = Pre-Treatment
2 = Peri-Treatment (Currently Undergoing Treatment)
3 = Post-Treatment
Size of the Sample at each Measurement Point:
MP 1 __________
MP 2 __________
MP 3 __________
MP 4 __________
MP 5 __________
MP 6 __________
MP 7 __________
MP 8 __________

214
Here the sample size at each measurement time point is indicated. Sample size includes all participants, regardless
of whether or not they were later excluded from the analysis. The point is to show how the sample has changed
over time (i.e. mostly reduced).
If multiple groups are examined separately, only the respective group size is specified.
Total N: ______________ Retention Rate: _________ %
Total N: The number of individuals that participated at all time points.
Retention Rate: How high is the percentage of those who have participated in all MPs (total N), compared to the
sample for the first MP (can be calculated from the ratio of MP 1 and total N).
Proportion of Men at MP 1: _______ %
Proportion of Men: Always indicate the MP for which the proportion of men refers.
Age at MP 1 _____: M = __________ SD = __________ Range from __________ to _________
Age at MP 1: Specify to whom the information relates. If data is available for several MPs, the information for
MP 1 is reported.
M: Mean value.
SD: Standard deviation.
Range: Specify a minimum and maximum age.
Ethnicity: ____ Other Ethnicity: ____ Country of Origin: ____ Other Country of Origin: ____
Coding of Ethnicity
Ethnicity is specified only if the proportion of this ethnic group makes up a minimum of 50% of the sample.
1 = White (Caucasian, Anglo-American, European)
2 = Black
3 = Hispanic
4 = Indigenous People
5 = Asian
6 = Mixed (when two ethnic groups are represented with 50% each)
99 = Other (specify)

215
Coding of Country of Origin
Specify in which Country the study was conducted.
1 = USA
2 = Canada
3 = Germany
4 = Great Britain
5 = Netherlands
6 = Scandinavia
7 = Australia
8 = Western Europe (excluding G, GB, N, Scandinavia)
9 = Eastern Europe (including Russia)
99 = Other (Specify)

216
6 Dependent Variable
No. ______ Did the Study aim to change the Dependent Variable? ________
Number of Dependent Variables
If there are several DVs (including separate subscales), the DVs are numbered in terms of their DV (Subscale)
Type and a separate coding sheet for each DV is created. This number should also be entered in the top right hand
corner of every page. Note. As each subscale can be a DV of its own, the number of DVs should include subscales
(if their details are to be recorded separately throughout the coding sheet). At “No.” the number of DVs is given.
If only one DV is encoded, this field is crossed out and later coded with 777 (not applicable).
Did the Study aim to change the Dependent Variable/s?
Did the study aim to change the DV:
0 = No
1 = Yes
DV Global: _________ DV Name: ___________________________________________________
There are three aspects of the DV that need to be coded. In DV Global, the global category is entered. These are
distinguished as:
1 = Coping Behaviour
2 = Illness Outcome
99 = Other (Please Specify)
DV Name indicates the name of the DV which is used in the publication.
Subscale: __________________________ DV (Subscale) Type: _______________
Subscale
If only one subscale of an instrument is used, or if data is provided separately for several subscales, this is noted
here (by recording the name of the subscale). All other information (e.g., reliability and number of items) will
always refer to this subscale, and not the entire instrument.
DV (Subscale) Type has been adopted from Hagger and Orbell (2003) and should be coded as per the categories
below:

217
Coping Behaviours
1. Expressing Emotion
2. Cognitive Reappraisal
3. Avoidance/Denial
4. Problem-Focused Coping (Generic)
5. Problem-Focused Coping (Specific - Other)
6. Treatment Decision Making
7. Medication Adherence
8. Adherence to Treatment Visits
9. Doctors Visits
10. Seeking Social Support
98. Other Coping Behaviour (Specify)
Illness Outcomes
11. Affect (Negative/Positive)
12. Anxiety
13. Depression
14. Psychological Distress
15. Treatment Related Distress
16. Decisional Uncertainty / Regret
17. Psychological Well-Being
18. Vitality
19. Role Functioning
20. Physical Functioning
21. Disease State
22. Quality of Life
99. Other Illness Outcome (Specify)
Data Source: _______ Additional Information: _________________________________________
Coding of the Data Source
1 = Self-report Questionnaire
2 = Self-report Interview
3 = Self-report on Ambulatory Assessment
5 = Observation
6 = Ratings by Others (include who provided the ratings)
7 = Analysis of Written Reports (e.g., diaries or autobiographies)
8 = Physiological Measures
9 = Objective Measures (e.g., pill bottle count)
99 = Other Data Source
Caution: The use of a scale does not always mean that the data source is a self-report questionnaire. Often the
scales are presented in an interview, making it a self-report interview.
Instrument: Code: ____________ Number of Items: _______________
Reliability: Coefficients: MP ___ MP ___ MP ___ MP ___ MP ___ MP ___
Source: _________ Type: ________ _______ _______ _______ _______ _______ _______
Study: _______________________________________________________________________________
Coding of the Instrument
Measures of Coping Behaviours
1 = COPE (Carver, Scheier, & Weintraub, 1989)
2 = Utrechtse Coping Questionnaire (UCL; Schreurs, & Willige, 1988)
3 = Impact of Event Scale - Revised (IES-R; Weiss & Marmar, 1997)
4 = Ways of Coping Checklist - Revised (WCCL-R; Vitaliano, Russo, Carr,
Maiuro, & Becker)
5 = Ways of Coping Questionnaire (WCQ; Folkman & Lazarus, 1988)
Measures of Illness Outcomes
12 = Medical Outcomes Study 36/20/12 Item Short Form (MOS SF-36/20/12;
Stewart, Hays, & Ware, 1988)
13 = General Health Questionnaire 60/30/28/12 Item (GHQ-60/30/28/12;
Goldberg, 1978)
14 = Positive and Negative Affect Schedule (PANAS; Watson, Clark, &
Tellegen, 1988)

218
6 = Medication Adherence Reporting Scale - 5 (MARS-5; Horne, 2001)
7 = The Morisky Medication Adherence Scale – 8 (MMAS-8; Morisky,
Green, & Levine, 1986)
8 = Ways of Coping – Cancer Version (WOC-CA; Dunkel-Schetter,
Feinstein, Taylor, & Falke, 1992)
9 = Cancer Coping Questionnaire (CCQ; Moorey, Frampton, & Greer, 2003)
10 = Mental Adjustment to Cancer Scale (or Mini-Mac 1994) (MAC; Watson,
Greer, Young, Inayat, Burgess, & Robertson, 1988)
11 = Other Measure of Coping Behaviour (Specify)
15 = Generalised Anxiety Disorder 7-Item Scale (GAD-7; Spitzer, Kroenke,
Williams, & Lowe, 2006)
16 = State-Trait Anxiety Inventory (STAI; Speilberger, Gorsuch, Lushene,
Vagg, & Jacobs, 1983)
17 = Centre for Epidemiological Studies Depression Scale Revised (CESD-
R; Eaton, Muntaner, Smith, Tien, & Ybarra, 2004)
18 = Patient Health Questionnaire – 2/9 Item (PHQ-9/2; Kroenke, & Spitzer,
2002; Kroenke, Spitzer, & Williams, 2003)
19 = Hospital Anxiety and Depression Scale (HADS; Zigmond & Snaith,
1983)
20 = Impact of Event Scale – Revised (IES-R; Weiss & Marmar 1996)
21 = Psychological Adjustment to Illness Scale – Self Report (PAIS-SR;
Derogatis, 1986)
22 = Penn State Worry Questionnaire (PSWQ; Meyer, Miller, Metzeger, &
Borkovec, 1990)
23 = Strengths and Difficulties Questionnaire (SDQ; Goodman, 1997)
24 = Well-being Questionnaire (WB-Q12 or WB-Q22; Bradley, 1994)
25 = World Health Organisation Quality of Life (or BREF) (WHOQOL;
WHO, 1998)
26 = European Organisation for Research and Treatment of Cancer Quality
of Life Questionnaire (EORTC QLQ-C30; EORTC 1993)
27 = Mental Adjustment to Cancer Scale (or Mini-Mac 1994) (MAC; Watson,
Greer, Young, Inayat, Burgess, & Robertson, 1988)
28 = Other Measure of Illness Outcome (Specify)
Number of Items
Number of items specifies the number of items the construct was measured with. If only one subscale is used,
only list the number of items for this subscale.
Source of Reliability Information
0 = No Information
1 = No Information, but reference to another publication (specify study)
2 =Yes, calculated using the sample from this publication (specify values)
3 = Yes, calculated using a different sample (values and specify study)
If there is no information about reliability, but there is a reference in the description of the instrument, this
corresponds to Coding 1.
If coefficients are drawn from both this sample (coding 2) and from other studies (coding 3) in the publication,
only the coefficients of the concrete sample are to be coded.
Type of Reliability Coefficient
1 = Internal Consistency, E.g. Cronbach’s
2 = Split- Halves Reliability
3 = Test-Retest Reliability
4 = Parallel Test Reliability
5 = Mean Value of Several Coefficients
6 = No Precise Indication
99 = Other Coefficient

219
MPs for Reliability Coefficients
If a reliability coefficient is given, it is placed in the small table. These should be noted at each MP, for as far as
possible. If several reliability coefficients exist for a MP (eg, Cronbach's alpha and split-half coefficient), only
report Cronbach’s alpha.
If only one reliability coefficient is given for the study, cross out other MP boxes.
If a reliability coefficient is not given, but reference is made to another study, the coefficient from that study
should be provided in (beneath) the first MP box, with no number given to the MP itself.
Study
If a reliability coefficient is (or is not) stated, and reference is made to another study, the first three authors and
the year of publication of the study are stated under “Study”.

220
7 Statistical Analyses and Effect Sizes
Type of Statistics Provided: _____________________
Means, Standard Deviations, and Standard Errors
T1 N = ______ T2 N = ______ T3 N = ______ T4 N = ______
M SD SE M SD SE M SD SE M SD SE
T5 N = ______ T6 N = ______ T7 N = ______ T8 N = ______
M SD SE M SD SE M SD SE M SD SE
Coding of the Type of Statistics Provided
1 = Mean Values, Standard Deviations, Standard Errors
2 = Correlations
3 = Regression
4 = Multilevel Models
5 = Method with Latent Variables (E.g. Structural Equation Models, Latent Class Models)
6 = More Data (E.g. Averages and Correlations)
99 = Other (specify)
In this table, all the means (M), standard deviations (SD), and standard errors (SE) are given for the dependent
variable, separately for all measurement times. In addition, the sample size (for which the data refer to) is specified
for each measurement time (N = _________).
Correlations and Reliabilities
Type:
r1 N = _____ r2 N = _____ IPQ Reliability MP
_____ IPQ Reliability MP
_____
t1 t2 r p t1 t2 r p Coeff. Items Coeff. Items
Identity
Cause (generic)
Timeline (acute/chronic)
Timeline Cyclical
Consequence
Personal Control
Treatment Control
Illness Coherence
Emotional Representations

221
If correlation coefficients are provided, please include the type of correlation in the top left hand corner of the
correlation and reliabilities table.
If cause is included in the data set, provide relevant details in the Final Details box.
If bivariate correlations between different time points are reported, these can be specified here. N is the size of the
sample. At t1 and t2 place the relevant MP details. The correlation is given at r. The p-value is given at p.
If correlation coefficients are provided, regression weights do not need to be recorded.
If no correlation data is provided, this should be noted in the Final Details box and the Write to Authors box on
the front page of the coding sheet should be ticked.
IPQ reliability coefficients for one or two MPs can be entered in this table. If there is only one MP, cross out the
other MP box.
For each subscale reported, provide the relevant coefficient at Coeff., and the number of items included in that
subscale at Items.
Regressions
Time 1 Time 2
Standardised Regression
Coefficients
Unstandardised Regression Coefficients
Standardised Regression
Coefficients
Unstandardised Regression Coefficients
SE df p B SE df p SE df p B SE df p
Identity
Cause
(generic)
Timeline (acute/chronic)
Timeline Cyclical
Consequence
Personal Control
Treatment Control
Illness Coherence
Emotional Representations

222
The standardised () and unstandardised (B) regression coefficients should be reported here. In addition, the
standard error (SE), the degrees of freedom (df) and p-value (p) of the coefficient should be coded.
Source of Statistical Information
Page: __________ Table/Graph: __________________________
In order to find the statistical information quickly, record the page number, and if applicable, the number of the
table or graph from which the information was collected. If the statistical information was taken from the text,
enter “text” here.
Moderator Variables: _______ _______ _______ _______ _______ _______ _______
Other Moderator Variables (Authors’ Term): _____________________________________________
If Moderator Variables of the relationship between Illness Perceptions and Outcomes have been examined,
provide information here.
Coding of Moderator Variables
1 = Social Support
3 = Extraversion
4 = Neuroticism
5 = Other Personality Characteristics (E.g. Optimism, Self-Esteem, etc.)
6 = Previous Experience with Cancer
7 = Socio-Economic Status
8 = Age
9 = Number of Other Illnesses
10 = Coping Strategies
99 = Other (Specify)

223
8 Concluding Information
Time for Coding: _________ minutes
Problems/Comments:
Study Interpretation:
At the end of coding an article, the time needed for encoding should be noted.
In addition, there is space for problems and comments. If information is missing, the missing information should
be listed here.
Finally, include a brief interpretation of the study in this box. This can be transcribed or taken directly from the
publication abstract.

224
Appendix 2.5 Coding sheet (Study 1)
ID No. _______________ Cancer Type ______ DV _______
Comments on the study
Study will be Excluded Write to Authors Important Comments
General Publication Information
Article Identification Number (ID-No.): __ __ __ __ __ __ __ Study in Article: _________
Coder: ___________ Coding Date ___ / ___ / _______ Time of Day: ___________
Authors: ________________________________________________ Publication Year: _________
Title (first six words): ______________________________________________________________
Country of Origin - Author: _________ Other Origin: _______________________________
Discipline of the First Author: _________ Other Discipline: _____________________________
Publication Found In: ________ Other Place Publication Found: ________________
Type of Publication: _____ Other Publication: _______ Citations: ______ Impact: ________
Description of the Study
Study Type: _________________ IPQ or IPQ-R Dimension: _____________________________
Reliability Source: ________ Coefficient Type: ________ Number of Items: ___________
Study: _______________________________________________________________________________
If Experimental:
Number of Groups: ______
Assignment: _______
Group a: ______________
Group b: ______________
Group c: ______________
Group d: ______________
Number of Measurement Points: _________ Year of the First Data Collection: __________
Lag Between Assessments ________:
MP 2 __________________________________
MP 3 __________________________________
MP 4 __________________________________
MP 6 __________________________________
MP 7 __________________________________
MP 8 __________________________________
MP 9 __________________________________

225
Cancer and Sample Information
Type of Sample: __________________
Cancer Type: ___________________ Cancer Stage: _____________________________
Cancer Duration: M = ____________ SD = ________ Range from _______ to _________
Age at Onset: M = ____________ SD = ________ Range from _______ to _________
Treatment Type: ________________ Treatment Stage: __________________________
Sample Size at each Measurement Point:
MP 1 __________
MP 2 __________
MP 3 __________
MP 4 __________
MP 5 __________
MP 6 __________
MP 7 __________
MP 9 __________
Total-N: ______________ Retention Rate: _________ %
Proportion of Men at MP 1: _______ %
Age at MP 1: M = __________ SD = __________ Range from __________ to _________
Ethnicity: ____ Other Ethnicity: ____ Country of Origin: ____ Other Country of Origin: ____ Dependent Variables
No. ______ Did the Study aim to change the Dependent Variable/s? ________
DV Global: _______ DV Name: __________________________________________________
Subscale: __________________________ DV (Subscale) Type:___________________
Data Source: __________ Additional Info: ______________________________________
Instrument: Code: ____________ Number of Items: _____________
Reliability: Coefficients: MP ___ MP ___ MP ___ MP ___ MP ___ MP ___
Source: _________ Type: ________ _______ _______ _______ _______ _______ _______
Study: _______________________________________________________________________________

226
Statistical Analyses and Effect Sizes
Type of Statistics Provided: ______________________
Means, Standard Deviations, and Standard Errors
T1 N = ______ T2 N = ______ T3 N = ______ T4 N = ______
M SD SE M SD SE M SD SE M SD SE
T5 N = ______ T6 N = ______ T7 N = ______ T8 N = ______
M SD SE M SD SE M SD SE M SD SE
Correlations and Reliabilities
Type: r1 N = _____ r2 N = _____
IPQ Reliability MP _____
IPQ Reliability MP _____
t1 t2 r p t1 t2 r p Coeff. Items Coeff.
Items
Identity
Cause (generic)
Timeline (acute/chronic)
Timeline Cyclical
Consequence
Personal Control
Treatment Control
Illness Coherence
Emotional Representations
Regression Coefficients
Time 1 Time 2
Standardised Regression
Coefficients
Unstandardised Regression
Coefficients
Standardised Regression
Coefficients
Unstandardised Regression
Coefficients
SE df p B SE df p SE df p B SE df p
Identity
Cause (generic)
Timeline (acute/chronic)
Timeline Cyclical
Consequence
Personal Control
Treatment Control
Illness Coherence
Emotional Representations

227
Source of Statistical Information Page: __________ Table/Graph: __________________________
Moderator Variables
Moderator Variables: _______ _______ _______ _______ _______ _______ _______ Other Moderator Variables (Authors’ Term): _____________________________________________
Final Details
Time for Coding: _________ Minutes
Problems/Comments: Study Interpretation:

228
Appendix 2.6 Study selection process (Study 1)
Following database screening, 1846 articles were identified, with 983 articles
remaining after the removal of duplicates. A title search eliminated 443 studies not meeting
the inclusion criteria. The remaining 540 abstracts were screened, and a further 494 of these
were excluded for not meeting inclusion criteria. There was a high level of agreement in the
abstract screening process between the first and last author, with an inter-rater agreement of
97.59% (Cohen’s Kappa = .86). A further four studies were added following a manual search
of the reference lists of the 46 studies already identified for inclusion. These 50 studies were
coded by the first author using a coding manual and coding sheet (see Appendix 4 and
Appendix 5), with a random subsample of studies (20%, k = 10) double-coded by the last
author. Following coding, five studies that had duplicative data or did not meet the inclusion
criteria were excluded.
A second search for relevant literature was conducted in August 2014 using the same
process. One hundred and twenty four additional studies were identified, with 49 studies
remaining following the removal of duplicates. Of these, 43 did not meet inclusion criteria,
based on a high level of agreement between the first and last author, with an inter-rater
agreement of 96.49% (Cohen’s Kappa = .81). The remaining six studies were again coded by
the first author, with a subsample (33.33%, k = 2) coded by the last author. Correlations were
extracted from a subsample of all studies by the first and last author separately (19.61%, k =
5). Out of 101 correlations, 100 were correctly recorded by both researchers (99.01%); the
remaining correlation was resolved through discussion and an examination of raw data.
A final search for relevant literature was conducted in March 2015 using the same
search strategy. Two hundred and thirty one studies were identified, with 63 studies
remaining following the removal of duplicates. Of these, 60 studies did not meet inclusion

229
criteria, based on high level of agreement between the first and last author (95.24%, Cohen’s
Kappa = .70). Following coding, the remaining three studies were coded by the first author.

230
Appendix 2.7 Quantitative data extraction and study characteristics table (Study 1)
Authors (Date) Cancer Type
Sample Size
(Completed all
Time Points)
Sex (T1) Age (T1) Study Design IPQ Type Coping Behaviour Illness Outcome Relevant Results
Beatty and Scott (2013)
Not Specified 88 31% Male M = 56.81, SD = 10.67
Cross-sectional
IPQ-R: Identity, Cause, Consequences
Seeking Social
Support, Problem-
Focused Coping (Specific-Other)
(eHealth Info), Other
(eHealth Support)
Psychological Distress
Identity, psychological cause, and consequences were predictive of
searching for health-related information
online and psychological distress. Cause was also predictive of social support.
Cameron, Booth,
Schlatter, Ziginskas,
Harman, &
Benson (2005)
Breast 110 100% Female M = 51.48,
SD = 9.26
Cross-
sectional
IPQ-R: Cause, Personal Control, Emotional
Representations
Seeking Social Support (x2),
Avoidance/Denial
Anxiety, Depression
Emotional representations predicted
depression, anxiety, and avoidance. Higher personal control was associated
with lower depression. Cause (stress)
was associated with anxiety.
Chen (2013) Oral Cavity and
Oropharyngeal 103 100% Male M = 42.5
Cross-
sectional
IPQ-R: Timeline -
Acute/Chronic and Cyclical,
Personal and Treatment Control, Consequences
Other (Self-
Transcendence) Depression
Timeline, Consequences, and Control were significant predictors of self-
transcendence and depression.
Cook, Salman,
Dunn, Holcombe,
Cornford, &
Fisher (2015)
Not Specified
(Breast &
Prostate)
229 34% Male
M = 61.3, SD
= 8.9, Range
= 38 - 85
Cross-
sectional
IPQ-R: Identity, Cause,
Timeline - Acute/Chronic,
Timeline - Cyclical,
Consequences, Personal
Control, Treatment Control,
Illness Coherence
Anxiety, Depression,
Psychological Distress
(Trauma)
Higher identity, timeline
(acute/chronic), consequences, and treatment control (PD only), explained
an additional 20%, 18%, and 22% of the
variance in anxiety, depression, and psychological distress respectively
(controlling for age/gender).
Corter, Findlay,
Broom, Porter, &
Petrie (2013)
Breast 153 100% Female Age range: 45 - 61+
Cross-sectional
B-IPQ Anxiety (Fear of Recurrence)
All illness perceptions (apart from
control) were associated with fear of
recurrence.
Costanzo,
Lutgendorf, &
Roeder (2011)
Breast 71 100% Female
M = 55, SD =
10.8, Age
range: 32 - 89
Longitudinal
IPQ-R: Cause, Timeline -
Acute/Chronic, Consequences, Personal
Control
Problem-Focused
Coping (Specific-Other) (Decreased Fat
Intake, Increased
Fruit/Vegetable Intake, Increased Physical
Activity, Decreased
Alcohol Intake, Increased Stress
Reduction)
Women who believed their cancer had
more severe consequences and those
that attributed the development of cancer to health behaviours or stress,
were most likely to report improvements
in health behaviours.
Croom (2012) Not Specified 88 100% Female M = 58.2, SD
= 11.3
Cross-
sectional
IPQ-R: Identity, Timeline -
Acute/Chronic, Timeline - Cyclical, Consequences,
Personal Control, Treatment
Control, Illness Coherence
Anxiety, Depression
Illness perceptions predicted anxiety and depression. Identity was the strongest
predictor of depression and cyclical
timeline the strongest predictor of anxiety.
Croom, Hamann, Kehoe, Paulk, &
Wiebe (2013)
Not Specified 105 100% Female
M = 58.29,
SD = 11.05,
Age range: 24-83
Cross-
sectional
IPQ-R: Identity, Timeline -
Acute/Chronic, Timeline - Cyclical, Consequences,
Personal Control, Treatment
Control, Illness Coherence
Problem-Focused
Coping (Generic)
(Advanced-Illness Behaviours)
Quality of Life
Illness perception variables accounted
for a large proportion of the variance for QOL and advanced-illness behaviours,
with identity the strongest predictor of
QOL and chronic timeline the strongest predictor of advanced-illness
behaviours.

231 Dempster,
McCorry,
Brennan, Donnelly, Murray,
& Johnston (2012)
Oesophageal 484 66% Male M = 65, SD =
9.94
Cross-
sectional
IPQ-R: Cause, Timeline -
Acute/Chronic, Timeline -
Cyclical, Consequences, Personal Control, Treatment
Control, Illness Coherence
Anxiety, Depression
Several illness perceptions predicted
anxiety and depression. Consequences
was the strongest predictor, with more severe consequences associated with
higher levels of anxiety and depression.
Donovan (2003) Ovarian 713 100% Female
Total: M = 53.42, SD =
48.94, Range
= 22-91
Cross-
sectional
IPQ-R: Identity, Cause, Timeline - Acute/Chronic,
Timeline - Cyclical,
Consequences, Personal Control, Treatment Control,
Illness Coherence, Emotional
Representations
Problem-Focused
Coping (Generic) (Coping)
Treatment Related Distress, Psychological
Well-Being (Life
Satisfaction)
Illness perceptions predicted problem-
focused coping, treatment related
distress, and psychological well-being. Identity was the strongest predictor of
all three outcomes.
Duric, Butow, Sharpe, Boyle,
Beith, Wilcken,
Heritier, Coates, Simes, & Stockler
(2007)
Breast 83 100% Female M = 55, Range = 25-
73
Cross-
sectional
IPQ-R: Identity, Timeline - Acute/Chronic, Timeline -
Cyclical, Consequences,
Personal Control, Treatment Control, Illness Coherence,
Emotional Representations
Treatment Decision
Making (Preferences -
small benefits of adjuvant
chemotherapy),
Treatment Decision Making (Preferences -
negligible benefits of
adjuvant chemotherapy)
Depression, Treatment
Related Distress
Identity and consequences were
associated with treatment decision
making, treatment related distress, and depression.
Fan, Eiser, Ho, &
Lin (2013)
Liver
(Heptocellular
Carcinoma)
286 76.22% Male
M = 59.85,
SD = 12.16,
Range = 25.46 - 84.81
Cross-
sectional B-IPQ
Problem-Focused
Coping (Generic),
Other (Emotion-Focused Coping)
Psychological Distress
(Emotional Functioning),
Physical Functioning,
Quality of Life (Health-
Related)
Cognitive representations (combined)
and emotional representations predicted
global HRQOL, physical functioning, and emotional functioning.
Fischer,
Wiesenhaan, Heijer, Kleijn,
Nortier, &
Kaptein (2013)
Breast 57 100% Female M = 50.7, SD = 6.9, Range
= 37 - 72
Longitudinal
IPQ-R: Identity, Timeline - Acute/Chronic, Timeline -
Cyclical, Consequences,
Personal Control, Treatment Control, Illness Coherence,
Emotional Representations
Problem-Focused
Coping (Generic),
Other (Emotional Support),
Avoidance/Denial,
Cognitive Reappraisal
Psychological Distress
Several illness perception dimensions
predicted each coping outcome. All illness perceptions other than control
(personal and treatment) predicted
psychological distress.
Förster & Taubert
(2006) Not Specified 156 58.3% Male
M = 63, SD =
10.5, Range =
34 - 86
Longitudinal
IPQ-R: Cause, Timeline -
Acute/Chronic, Personal
Control
Problem-Focused
Coping (Generic),
Cognitive Reappraisal
(x2), Other (Self-
Blame)
Depression, Quality of
Life, Disease State
Control beliefs were predictive of adaptive coping behaviours (problem-
solving, reappraisal). Shorter timeline
predicted higher levels of quality of life.
Foster, Breckons,
Cotterell,
Barbosa, Calman, Corner, Fenlon,
Foster, Grimmett,
Richardson, & Smith (2015)
Not Specified 182 80.8%
Female
M = 50, SD = 9.51, Range =
23 - 79
Cross-
sectional
B-IPQ: Identity, Timeline - Acute/Chronic,
Consequences, Personal
Control, Treatment Control, Illness Coherence, Emotional
Representations
Other (Self-Efficacy)
Individuals most likely to report low
self-efficacy included those with an
overall more negative perception of cancer.
Freeman-Gibb
(2012) Breast 107 100% Female
Range = 26 -
75
Cross-
sectional
IPQ-R: Identity, Cause,
Timeline - Acute/Chronic, Timeline - Cyclical,
Consequences, Personal
Control, Treatment Control, Illness Coherence, Emotional
Representations
Other (Cognitive Coping Strategies),
Other (Self-Blame),
Avoidance/Denial, Cognitive Reappraisal
Anxiety (x2) (Fear of
Recurrence)
Several illness perception dimensions
predicted trait anxiety and each coping outcome. Fear of cancer recurrence was
related to emotional representations,
timeline (acute/chronic), perceived consequences/severity, and symptom
attribution (identity).

232
Gibbons (2013) Breast 57 100% Female
M = 56.35, SD = 5.20,
Range = 40 -
77
Longitudinal
IPQ-R: Identity, Cause, Timeline - Acute/Chronic,
Timeline - Cyclical,
Consequences, Personal Control, Treatment Control,
Illness Coherence, Emotional
Representations
Cognitive Reappraisal,
Other (Fatalism), Avoidance/Denial
Psychological Distress
(Perceived Stress), Anxiety
(x3) (State), Depression, Psychological Distress (x2)
(Cancer-related),
Psychological Distress (Helplessness -
Hopelessness)
Illness perceptions are important predictors of distress and coping
outcomes over the first 12 months after
a diagnosis of breast cancer.
Gould, Brown, &
Bramwell (2010)
Other
Gynaecological 61 100% Female
M = 56.34,
SD = 18.41
Cross-
sectional
IPQ-R: Timeline -
Acute/Chronic, Timeline -
Cyclical, Consequences,
Personal Control, Treatment
Control, Illness Coherence
Problem-Focused Coping (Generic),
Other (Emotion/social
support),
Avoidance/Denial,
Cognitive Reappraisal,
Other (Religion)
Affect
Several illness perceptions were associated with each coping outcome.
Illness coherence and consequences
were the strongest predictors of affect.
Green, Steinnagel,
Morris, & Laakso
(2014)
Not Specified
(Breast and
Prostate)
237 61.2% Female
M = 60.60,
SD = 9.55, Range = 32 -
84
Cross-sectional
IPQ-R: Identity, Timeline -
Acute/Chronic, Timeline -
Cyclical, Consequences, Personal Control, Treatment
Control, Illness Coherence,
Emotional Representations
Problem-Focused
Coping (Specific-Other) (Nutrition,
Physical Activity)
Illness perception dimensions did not
seem to predict nutrition in this sample. However, identity, personal control, and
illness coherence predicted nutrition.
Henselmans,
Sanderman,
Helgeson, de
Vries, Smink, &
Ranchor (2010)
Breast 133 100% Female M = 57, SD =
9 Longitudinal IPQ-R: Personal Control
Depression, Anxiety (State), Role Functioning
(Threat Appraisal),
Anxiety (Worry)
A strong sense of control over the cure of breast cancer predicted lower
depression, state anxiety, threat
appraisal, and worry.
Hopman & Rijken
(2014) Not Specified 267
50.46%
Female
M = 64.31,
SD = 12.21,
Range = 21 - 89
Cross-
sectional
IPQ-R: Cause, Timeline - Acute/Chronic, Timeline -
Cyclical, Consequences,
Personal Control, Treatment Control, Illness Coherence,
Emotional Representations
Cognitive Reappraisal, Other (Fatalism),
Avoidance/Denial
Anxiety, Psychological Distress (Helplessness -
Hopelessness)
More passive ways of coping were more
often found in patients who perceived their illness as long lasting, more
emotionally burdening, and having more
negative consequences.
Karademas &
Giannousi (2013) Not Specified 72 55.56% Male
M = 55.01,
SD = 13.29,
Range = 31 -
74
Cross-
sectional
IPQ-R: Personal Control,
Treatment Control Anxiety, Depression,
Quality of Life
Findings suggest that both representations of control (personal and
treatment) are important for adaptation
to illness. With higher levels of personal
and treatment control associated with
lower levels of anxiety and depression.
Keeling, Bambrough, &
Simpson (2013)
Brain 74 52.70%
Female
M = 38.30,
SD = 10.67
Cross-
sectional
IPQ-R: Identity, Cause,
Timeline - Acute/Chronic,
Timeline - Cyclical, Consequences, Personal
Control, Treatment Control,
Illness Coherence, Emotional Representations
Anxiety, Depression,
Affect (Positive)
Illness perceptions play a significant
role in emotional distress experienced by people with low-grade brain tumours
but did not play such a role in positive
affect.
Llewellyn,
McGurk, &
Weinman (2006)
Head and Neck 55 65% Male
M = 59, SD =
13.4, Range =
23 - 89
Cross-sectional
IPQ-R: Identity, Timeline -
Acute/Chronic, Timeline -
Cyclical, Consequences, Personal Control, Illness
Coherence, Emotional
Representations
Quality of Life
(Individualised), Physical Functioning (x2),
Psychological Distress
(Emotional Functioning), Role Functioning (x2)
(Social Functioning)
(Cognitive Functioning), Other (General Health),
Vitality, Psychological
Several illness perception dimensions
predicted several health outcomes.
Higher emotional representations
predicted poorer QOL, and higher levels of anxiety and depression.

233 Well-being, Anxiety,
Depression
Llewellyn,
McGurk, &
Weinman (2007)
Head and Neck 82 66% Male
M = 59.9, SD
= 12.5, Range
= 23 - 89
Cross-sectional
IPQ-R: Identity, Timeline -
Acute/Chronic, Timeline -
Cyclical, Consequences, Personal Control, Illness
Coherence, Emotional
Representations
Cognitive Reappraisal (x3), Problem-Focused
Coping (Generic) (x2),
Avoidance/Denial (x2), Other (Substance
Use), Seeking Social
Support (x2), Expressing Emotion,
Other (Humour),
Other (Religion), Other (Self-Blame)
Physical Functioning,
Psychological Well-being (Mental Component
Summary), Quality of Life
Illness perceptions predicted several health and coping outcomes. Emotional
representations was often the highest or
one of the highest predictors of the various outcomes.
Llewellyn,
Weinman, McGurk, &
Humphris (2008)
Head and Neck 50 66% Male
M = 59.9, SD
= 12.5, Range
= 23 - 89
Longitudinal
IPQ-R: Identity, Timeline -
Acute/Chronic, Timeline - Cyclical, Consequences,
Personal Control, Illness
Coherence, Emotional Representations
Anxiety (Fear of Recurrence)
Emotional representations and
consequences were the highest predictors of fear of recurrence, with
higher levels leading to more fear.
McCorry, Dempster, Quinn,
Hogg, Newell,
Moore, Kelly, & Kirk (2013)
Breast 75 100% Female M = 57.2, SD
= 10.4 Longitudinal
IPQ-R: Identity, Cause,
Timeline - Acute/Chronic, Timeline - Cyclical,
Consequences, Personal
Control, Treatment Control, Illness Coherence, Emotional
Representations
Anxiety, Depression
Emotional representations and consequences were the highest
predictors of both anxiety and
depression, with higher levels of each leading to more anxiety and depression.
Mols, Lemmens,
Bosscha, van den Broek, & Thong
(2014)
Rectal
1019 (538 no
ostomy, 408
ostomy)
58.77% Male [56.1% Male
(no ostomy),
62.3% Male (ostomy)]
Median = 68.72
[Median =
67.0 (no ostomy),
Median =
69.8 (ostomy)]
Cross-sectional
B-IPQ: Identity, Timeline -
Acute/Chronic,
Consequences, Personal Control, Treatment Control,
Illness Coherence, Emotional
Representations
Anxiety, Depression, Quality of Life, Physical
Functioning, Role
Functioning (x3) (Cognitive Functioning)
(Social Functioning),
Psychological Distress (Emotional Functioning)
Those survivors with or without an ostomy had several illness perceptions
related to functioning. However,
survivors with an ostomy believed that their illness has significantly more
serious consequences, will last longer,
and were more concerned about their illness.
Paschali, Hadjulis,
Papadimitriou, &
Karademas (2015)
Not Specified 93 43.01% Male M = 58.34, SD = 11.18
Cross-sectional
IPQ-R: Cause, Timeline -
Acute/Chronic, Timeline -
Cyclical, Consequences, Personal Control, Treatment
Control, Illness Coherence, Emotional Representations
Problem-Focused
Coping (Generic) (Positive Adjustment
to Cancer),
Avoidance/Denial (Negative Adjustment
to Cancer)
Physical Functioning
Several illness perceptions were related
to physical functioning, positive adjustment to cancer, and negative
adjustment to cancer.
Rozema, Völlink,
& Lechner (2009) Breast 119 100% Female
M = 46.8, SD
= 8.21, Range = 22 - 64
Cross-
sectional
IPQ-R: Identity, Cause,
Timeline - Acute/Chronic,
Timeline - Cyclical, Consequences, Personal
Control, Treatment Control,
Emotional Representations
Problem-Focused
Coping (Generic), Avoidance/Denial
(x2), Seeking Social
Support, Expressing
Emotion
Physical Functioning (Physical Health),
Psychological Well-being
(Mental Health)
Patients who view their illness as a
condition with serious symptoms (identity) and consequences, a chronic
timeline, and who view their illness as
uncontrollable were found to report
worse physical and mental health.
Scharloo,
Baatenburg de
Jong, Langeveld, van Velzen-
Verkaik, Doorn-
Head and Neck 95 64.89% Male
M = 59.5, SD
= 11.3, Range = 28 - 84
Longitudinal
IPQ-R: Identity, Cause,
Timeline - Acute/Chronic,
Timeline - Cyclical, Consequences, Personal
Control, Treatment Control,
Quality of Life, Physical
Functioning, Role
Functioning (x3) (Cognitive Functioning)
(Social Functioning),
Illness perceptions were related to
functioning. The strongest predictor of
functioning was generally identity, with higher levels associated with poorer
functioning.

234 op den Akker, &
Kaptein (2010)
Illness Coherence, Emotional
Representations
Psychological Distress
(Emotional Functioning)
Silva, Moreira, &
Canavarro (2012) Breast 78 100% Female
M = 52.08,
SD = 8.86,
Range = 30 - 68
Cross-
sectional B-IPQ: Consequences
Cognitive Reappraisal (Posttraumatic
Growth)
Anxiety, Depression, Physical Functioning
(Physical QOL),
Psychological Well-being (Psychological QOL), Role
Functioning (Social QOL)
A more negative perception of the impact of breast cancer was significantly
associated with higher emotional
distress and impaired physical and psychological QOL, but was unrelated
to posttraumatic growth.
Thune-Boyle,
Myers, &
Newman (2006)
Not Specified 72 54% Female
M = 56,
Range = 22 -
83
Cross-sectional
IPQ: Consequences, Cure/Control
Anxiety, Depression
More severe consequences predictor
higher levels of both anxiety and
depression.
Traeger (2009) Prostate 261 100% Male M = 65.4, SD = 7.6
Cross-sectional
IPQ-R: Consequences
Role Functioning (x3)
(Sexual Bother) (Sexual Function) (Social WB),
Quality of Life (Health-
Related), Other (General Health), Physical
Functioning (x2)
(Functional WB), Psychological Distress
(Emotional WB)
More severe consequences predicted worse functioning and a poorer QOL.
Traeger, Penedo,
Gonzalez, Dahn,
Lechner,
Schneiderman, & Antoni (2009)
Prostate 214 100% Male M = 64.9, SD = 7.4
Cross-sectional
IPQ-R: Cause,
Consequences, Personal Control, Treatment Control,
Illness Coherence
Psychological Distress (x2)
(Life Stress) (Emotional WB), Role Functioning
(Sexual Function)
More severe perceived consequences of
prostate cancer were associated with
poorer emotional well-being,
particularly among men experiencing greater life stress.
Van Der Kloot, Kobayashi,
Yamaoka, Inoue,
Nortier, & Kaptein (2014)
Not Specified (Breast & Lung)
80 62.92% Female
M = 55.99, SD = 8.53
Longitudinal
B-IPQ: Identity, Timeline -
Acute/Chronic,
Consequences, Personal Control, Treatment Control,
Illness Coherence, Emotional
Representations
Quality of Life, Role
Functioning (x2) (Social Functioning) (Physical and
Role Functioning),
Psychological Distress (Psychological
Functioning)
Illness perceptions were related to functioning. The strongest predictors of
functioning were generally identity,
consequences, and emotional representations.
Wu, Mohamed, Winkel, &
Diefenbach
(2013)
Prostate 53 100% Male
M = 64.52,
SD = 9.02,
Range = 43 -
84 (For the TOTAL
sample - 53 -
NOT at T1)
Longitudinal
IPQ-R: Timeline -
Acute/Chronic, Treatment Control
Quality of Life
A more chronic timeline and higher levels of treatment control were
associated with better QOL, but not
significantly.
Živkovic, Buljan, Blajic, & Situm
(2008)
Melanoma Skin Cancer
60 56.67% Female
M = 52, Range = 29 -
74
Cross-sectional
B-IPQ
Quality of Life (x2)
(Subjective QOL) (The Impact of Illness on QOL),
Depression
Several illness perception dimensions
are correlated with patients' QOL, the influence illness has on QOL, and
depression.

235
Appendix 2.8 Qualitative data extraction and study characteristics table (Study 1)
Authors (Date) Cancer Type Sample Size All
Time Points Sex (T1) Age (T1) Study Design IPQ Type
Coping
Behaviour Illness Outcome Relevant Results
Cook, Salman, Dunn, Holcombe,
Cornford, &
Fisher (2015)
Not Specified
(Breast & Prostate)
206
35.44% Male
(final sample - T2)
M = 61.50, SD = 9.00, Range = 39 -
85 (final sample -
T2)
Longitudinal
IPQ-R: Identity, Cause,
Timeline - Acute/Chronic, Timeline - Cyclical,
Consequences, Personal
Control, Treatment Control, Illness Coherence
Anxiety, Depression,
Psychological Distress (Trauma)
Illness perceptions at T1 predicted
between 10% for trauma and 12% for anxiety of the variance in T2 outcomes
(controlling for age/gender). Perceived
lack of personal control and a perception of more serious
consequences predicted T2 anxiety,
while less illness coherence predicted
T2 depression and trauma.
Cooper, Hankins, Rixon, Eaton, &
Grunfeld (2013)
Breast,
Gynaecological, Prostate,
Head and
Neck
Breast (89),
Gynaecological (56), Prostate
(88), Head and
Neck (47)
Breast (100%
Female), Gynaecological
(100% Female),
Prostate (100% Male), Head
and Neck
(74.5% Male)
Breast (M = 49,
SD = 7), Gynaecological
(M = 48, SD =
10), Prostate (M = 54, SD = 11),
Head and Neck
(M = 52, SD = 9)
Longitudinal
IPQ-R: Timeline -
Acute/Chronic, Consequences, Personal Control, Treatment
Control, Illness Coherence,
Emotional Representations
Role Functioning (Return
to Work)
Consequences were associated with return to work in those with breast
cancer and head and neck cancer.
Personal control was associated with return to work in those with
gynaecological cancer.
Dempster,
McCorry,
Brennan, Donnelly, Murray,
& Johnston (2011)
Oesophageal 189 74.07% Male M = 64.8, SD =
8.83 Longitudinal
IPQ-R: Identity, Cause,
Timeline - Acute/Chronic,
Timeline - Cyclical,
Consequences, Personal
Control, Treatment Control,
Illness Coherence, Emotional Representations
Anxiety, Depression
Several illness perception dimensions
predicted anxiety and depression over a 12 month period.
Giannousi, Manaras,
Georgoulias, &
Samonis (2010)
Not Specified 206 66% Female M = 55, SD =
12.53
Cross-
sectional
IPQ-R: Identity, Cause, Timeline - Acute/Chronic,
Timeline - Cyclical,
Consequences, Personal Control, Treatment Control,
Illness Coherence, Emotional
Representations
Depression
Multiple regression analysis showed
that consequences, emotional
representations, illness identity, and psychological attributions were the
best predictors for depression.
Grande, Arnott,
Brundle, & Pilling
(2014)
Not Specified 43 61.3% Male M = 66.48, SD =
8.95 Longitudinal
IPQ-R: Personal Control,
Emotional Representations
Seeking Social
Support (x2) Emotional representations significantly
predicted support group participation.
Grande, Myers, &
Sutton (2006) Not Specified
SG-Y = 63, SG-N
= 44
SG-Y = 16.1%,
SG-N = 38.6%
SG-Y Median = 61 (IQR = 15.3),
SG-N Median =
64.5 (IQR = 18.8)
Cross-
sectional
IPQ-R: Personal Control,
Emotional Representations
Seeking Social
Support
Support group participants felt more control over their cancer, but were
more distressed and anxious (higher
emotional representations).
Gray, Hall, Browne, Johnston,
Lee, Macleod,
Mitchell, Samuel, & Campbell
(2014)
Colorectal 496 55% Male M = 66, SD =
11.11
Cross-
sectional
IPQ-R: Timeline -
Acute/Chronic, Timeline -
Cyclical, Consequences, Personal Control, Treatment
Control, Illness Coherence,
Emotional Representations
Anxiety, Depression
Reporting a high negative life and
emotional impact (emotional representations) predicted anxiety
caseness and increased the odds of
depression caseness.
Gray, Hall,
Browne, Macleod,
Lee, Johnston, Wyke, Samuel,
Weller, &
Campbell (2011)
Colorectal 496 55% Male M = 66, SD = 11.11
Cross-sectional
IPQ-R: Identity, Timeline -
Acute/Chronic, Timeline -
Cyclical, Consequences, Personal Control, Treatment
Control, Illness Coherence,
Emotional Representations
Quality of Life
Higher identity, cyclical timeline, and consequences were predictive of lower
QOL, while higher personal and
treatment control was associated with higher QOL.

236
Iskandarsyah, de
Klerk, Suardi,
Sadarjoen, & Passchier (2014)
Breast 70 100% Female M = 45.6, SD = 7.88, Range = 28 -
66
Cross-
sectional
B-IPQ: Identity, Timeline -
Acute/Chronic, Consequences, Personal Control, Treatment
Control, Illness Coherence,
Emotional Representations
Adherence to Treatment
Visits (x2)
More negative illness perceptions and
whether a traditional healer had been
consulted after diagnosis were associated with missing treatment
sessions. Treatment related distress
was most closely associated with missing treatment sessions.
JØrgensen,
Frederiksen, Boesen, Elsass, &
Johansen (2009)
Breast 177 100% Female M = 53.27, Range = 25 - 74
Experimental
IPQ-R: Identity, Cause, Timeline - Acute/Chronic,
Consequences, Personal
Control, Treatment Control,
Emotional Representations
Quality of Life,
Psychological Distress
(Emotional Distress)
Baseline analysis showed that illness
perceptions were associated with distress and QOL. Consequences and
treatment control were associated with
QOL, while cause (stress or worry) and
emotional representations were
associated with distress.
Landers, McCarthy,
Livingstone, &
Savage (2014
Rectal 143 61.5% Male Range = 35 - 80 Cross-
sectional
IPQ: Identity, Cause, IPQ-R: Timeline - Acute/Chronic,
Timeline - Cyclic,
Consequences, Personal Control, Treatment Control,
Emotional Representations
Problem-
Focused Coping
(Specific) (x3),
Medication Adherence
Respondents reporting more bowel symptoms (identity) and high timeline
cyclical scores were more likely to use
certain self-care strategies.
Llewellyn, McGurk, &
Weinman (2007)
Head and
Neck 50 66% Male
M = 59.9, SD = 12.5, Range = 23 -
89
Longitudinal
IPQ-R: Identity, Timeline - Acute/Chronic, Timeline -
Cyclical, Consequences,
Personal Control, Illness
Coherence, Emotional
Representations
Multiple Multiple - e.g. Depression
Beliefs about the chronicity of the
disease (timeline beliefs) were
predictors of depression after
treatment.
Miĉkevicienė,
Vanagas, Jievalta, & Ulys, (2013)
Prostate 501 100% Male M = 69.3, SD =
8.8
Cross-
sectional
IPQ-R: Identity, Timeline -
Acute/Chronic, Timeline -Cyclical, Consequences,
Personal Control, Treatment
Control, Illness Coherence, Emotional Representations
Quality of Life, Physical Functioning, Role
Functioning (x3)
(Cognitive Functioning) (Social Functioning),
Psychological Distress
(Emotional Functioning)
Several illness perception dimensions were associated with functioning.
Consequences were often the strongest
predictor of functioning.
Millar, Purushotham,
McLatchie,
George, & Murray (2005)
Breast 213 100% Female
M = 59.4, SD =
10.9, Range = 29 -
98
Longitudinal IPQ: Identity, Timeline,
Consequences, Cure/Control Psychological Distress
Psychological morbidity (distress) in
the year following breast cancer
surgery is reliably predicted by the
patient's perception of the impact of
the symptoms (identity) and the timeline of the disease.
Scharloo,
Baatenburg de Jong, Langeveld,
van Velzen-
Verkaik, Doorn-op den Akker, &
Kaptein (2005)
Head and Neck
68 58.33% Male M = 60, Range = 41 - 84
Cross-sectional
IPQ-R: Identity, Cause,
Timeline - Acute/Chronic, Timeline - Cyclical,
Consequences, Personal
Control, Treatment Control, Illness Coherence, Emotional
Representations
Quality of Life, Physical
Functioning, Role Functioning (x3)
(Cognitive Functioning)
(Social Functioning), Psychological Distress
(Emotional Functioning)
Illness perceptions were significantly
related to the QLQ-C30 physical, role, emotional, cognitive, social
functioning, and global health scales.
Traeger, Penedo,
Benedict, Dahn,
Lechner,
Schneiderman, &
Antoni (2013)
Prostate 257 100% Male M = 65.3, SD =
7.7 Experimental
IPQ-R: Cause, Consequences,
Personal Control, Treatment
Control, Illness Coherence
Psychological Distress (x2)
(Emotional WB) (Life
Stress), Role Functioning
(x2) (Sexual Function)
(Urinary Function)
For men reporting higher stress upon study entry, Cognitive-Behavioural
Stress Management (intervention)
related improvements were partially explained by changes in some illness
perceptions.

237
Appendix 2.9 Meta-analytic strategy – additional information (Study 1)
Zero-order correlations were the most frequently reported effect size, and therefore
the average correlation coefficient weighted by sample size and calculated using Fischer’s Z
transformations (rz) was used as the measure of effect in the meta-analysis. Correlations were
reversed where necessary to maintain consistency across studies (e.g., when measuring
emotional functioning rather than psychological distress). If a study used more than one
measure to assess an outcome within the same category (e.g., generalised anxiety and trait
anxiety), the smallest correlation coefficient was used in order to obtain a more conservative
estimate of the correlation and to avoid bias. Further, if a study measured an outcome at more
than one time point, only the Time 1 (baseline) result was used to minimise heterogeneity due
to design. Authors of papers that did not report correlations were contacted. A qualitative
narrative review was conducted for studies that did not include sufficient data and where data
could not be obtained.
To examine heterogeneity between studies, Q and I2 statistics were calculated. The Q
statistic assesses the ratio of the variation in the observed effects to the within-study error,
and suggests heterogeneity when statistically significant (Huedo-Medina, Sanchez-Meca,
Marin-Martinez, & Botella, 2006). The I2 statistic indicates the percentage of variance across
studies that is due to heterogeneity rather than chance, with increasing values meaning
increasing heterogeneity. This, the I2 statistic gives an indication of the extent of true
heterogeneity, whereas the Q statistic only provides an indication of statistical significance. It
has been suggested that an I2 value of 25% is low, 50% is moderate, and 75% is high
(Higgins, Thompson, Deeks, & Altman, 2003).
In a meta-analysis, no matter how systematic the search process, there is always the
chance that the results will be biased due to unpublished, missing, or otherwise unidentified

238
studies that potentially report non-significant or even contrary findings. This phenomenon
was described by Rosenthal (1979) as the ‘file drawer problem’, and suggests that there may
be a range of unpublished studies living in the file drawers of researchers. One of the
implications of this problem is that there is a publication bias towards results that are
statistically significant or that have larger effect sizes. Funnel plots and the ‘fail-safe N’ (Nfs)
were used to assess this risk of bias. Funnel plots display the relationship between effect size
and standard error (sample size) (Light & Pillemer, 1984), while the Rosenthal method for
calculating fail-safe N was applied. This method results in the provision of the number of
studies with non-significant results that would need to be found to reduce the effect size of
the present meta-analysis to a negligible level (Rosenthal, 1979).
References
Higgins, J. P.T., Thompson, S. G., Deeks, J.J., & Altman, D. G. (2003). Measuring
inconsistency in meta-analyses. BMJ, 327, 557-560. doi: 10.1136/bmj.327.7414.557
Huedo-Medina, T. B., Sanchez-Meca, J., Marin-Martinez, & F., Botella, J. (2006). Assessing
heterogeneity in meta-analysis: Q statistic or I2 index? Psychological Methods, 11(2),
193-206. doi: 10.1037/1082-989X.11.2.193
Light, R. J., & Pillemer, D. B. (1984). Summing up: The science of reviewing research.
Cambridge, MA: Harvard University Press.
Rosenthal, R. (1979). The "file drawer problem" and tolerance for null results. Psychological
Bulletin, 86(3), 638-641. doi: 10.1037/0033-2909.86.3.638

239
Appendix 2.10 Risk of bias assessment (Study 1)
Authors (Date) Study Design IPQ, IPQ-R, or B-IPQ: Used
as recommended
Dimensions assessed (number of
items)*
Correlation
Analysis
Adjustment for
possible confounds
Meta-Analysis or
Narrative Review
Beatty and Scott (2013) Cross-sectional IPQ-R: Yes
- ‘cancer’ substituted for
‘illness’
Identity (14), Cause (6), Consequences
(6)
Spearman’s
Correlation
None Meta-Analysis
Cameron, Booth,
Schlatter, Ziginskas,
Harman, & Benson
(2005)
Cross-sectional IPQ-R: Partially
- shortened versions of scales
were used
- ‘breast cancer’ substituted
for ‘illness’
Cause (2), Personal Control (3),
Emotional Representations (4)
Pearson’s
Correlation
None Meta-Analysis
Chen (2013) Cross-sectional IPQ-R: Yes Timeline - Acute/Chronic and Cyclical
(10), Personal and Treatment Control
(11), Consequences (6)
Pearson’s
Correlation
None Meta-Analysis
Cook, Salman, Dunn,
Holcombe, Cornford, &
Fisher (2015)
Longitudinal IPQ-R: Yes
- several cause items removed
Identity (14), Cause (7), Timeline -
Acute/Chronic (6), Timeline - Cyclical
(4), Consequences (6), Personal
Control (6), Treatment Control (5),
Illness Coherence (5)
N/A N/A Narrative Review
Cook, Salman, Dunn,
Holcombe, Cornford, &
Fisher (2015)
Cross-sectional IPQ-R: Yes
- one identity item added
- several cause items removed
Identity (15), Cause (7), Timeline -
Acute/Chronic (6), Timeline - Cyclical
(4), Consequences (6), Personal
Control (6), Treatment Control (5),
Illness Coherence (5)
Pearson’s
Correlation
None Meta-Analysis
Cooper, Hankins, Rixon,
Eaton, & Grunfeld
(2013)
Longitudinal IPQ-R: Partially
- adapted for cancer patients
- additional items added to
some subscales
Timeline - Acute/Chronic (5),
Consequences (6), Personal Control
(5), Treatment Control (7), Illness
Coherence (5), Emotional
Representations (6)
N/A N/A Narrative Review
Corter, Findlay, Broom,
Porter, & Petrie (2013)
Cross-sectional B-IPQ: Yes
- ‘breast cancer’ substituted
for ‘illness’
Identity (1), Cause (1), Timeline -
Acute/Chronic (1), Consequences (1),
Personal Control (1), Treatment
Control (1), Illness Coherence (1),
Emotional Representations (2)
Spearman’s
Correlation
None Meta-Analysis

240
Costanzo, Lutgendorf, &
Roeder (2011)
Longitudinal IPQ-R: Yes
- cause items were adapted to
suit breast cancer
Cause (13), Timeline - Acute/Chronic
(6), Consequences (6), Personal
Control (6)
Pearson’s
Correlation
None Meta-Analysis
Croom (2012) Cross-sectional IPQ-R: Partially
- additional items added to
some subscales
- ‘cancer’ substituted for
‘illness’
Identity (15), Timeline - Acute/Chronic
(8), Timeline - Cyclical (4),
Consequences (6), Personal Control
(6), Treatment Control (6), Illness
Coherence (5)
Pearson’s
Correlation
- Relationship Length
- Income
- The Eastern
Cooperative Oncology
Group (ECOG)
Performance Status
Meta-Analysis
Croom, Hamann, Kehoe,
Paulk, & Wiebe (2013)
Cross-sectional IPQ-R: Yes
- one identity item added
Identity (15), Timeline - Acute/Chronic
(8), Timeline - Cyclical (4),
Consequences (6), Personal Control
(6), Treatment Control (6), Illness
Coherence (5)
Pearson’s
Correlation
None Meta-Analysis
Dempster, McCorry,
Brennan, Donnelly,
Murray, & Johnston
(2012)
Cross-sectional IPQ-R: Yes
- cause items were adapted
following factor analysis
Cause (18), Timeline - Acute/Chronic
(6), Timeline - Cyclical (4),
Consequences (6), Personal Control
(6), Treatment Control (5), Illness
Coherence (5)
Point-Biserial
Correlation
None Meta-Analysis
Dempster, McCorry,
Brennan, Donnelly,
Murray, & Johnston
(2011)
Longitudinal IPQ-R: Yes
- cause items were adapted
following factor analysis
Identity, (14), Cause (18), Timeline -
Acute/Chronic (6), Timeline - Cyclical
(4), Consequences (6), Personal
Control (6), Treatment Control (5),
Illness Coherence (5), Emotional
Representations (6)
N/A N/A Narrative Review
Donovan (2003) Cross-sectional IPQ-R: Yes
- several identity items added
Identity, (22), Cause (6), Timeline -
Acute/Chronic (6), Timeline - Cyclical
(4), Consequences (6), Personal
Control (6), Treatment Control (5),
Illness Coherence (5), Emotional
Representations (6)
Pearson’s
Correlation
None Meta-Analysis
Duric, Butow, Sharpe,
Boyle, Beith, Wilcken,
Heritier, Coates, Simes,
& Stockler (2007)
Cross-sectional IPQ-R: Yes
- items were adapted to suit
breast cancer
Identity (14), Timeline - Acute/Chronic
(6), Timeline - Cyclical (4),
Consequences (6), Personal Control
(6), Treatment Control (5), Illness
Coherence (5), Emotional
Representations (6)
Pearson’s
Correlation
None Meta-Analysis

241
Fan, Eiser, Ho, & Lin
(2013)
Cross-sectional B-IPQ: Yes Identity (1), Cause (1), Timeline -
Acute/Chronic (1), Consequences (1),
Personal Control (1), Treatment
Control (1), Illness Coherence (1),
Emotional Representations (2)
Pearson’s
Correlation
None Meta-Analysis
Fischer, Wiesenhaan,
Heijer, Kleijn, Nortier, &
Kaptein (2013)
Longitudinal IPQ-R: Yes Identity (14), Timeline - Acute/Chronic
(6), Timeline - Cyclical (4),
Consequences (6), Personal Control
(6), Treatment Control (5), Illness
Coherence (5), Emotional
Representations (6)
Pearson’s
Correlation
None Meta-Analysis
Förster & Taubert (2006) Longitudinal IPQ-R: Partially
- shortened versions of scales
were used
Cause (7), Timeline - Acute/Chronic
(2), Personal Control (1)
Lagged
Correlation
None Meta-Analysis
Foster, Breckons,
Cotterell, Barbosa,
Calman, Corner, Fenlon,
Foster, Grimmett,
Richardson, & Smith
(2015)
Cross-sectional B-IPQ: Yes Identity (1), Timeline - Acute/Chronic
(1), Consequences (1), Personal
Control (1), Treatment Control (1),
Illness Coherence (1), Emotional
Representations (2)
Pearson’s
Correlation
None Meta-Analysis
Freeman-Gibb (2012) Cross-sectional IPQ-R: Yes
- several identity items added
- cause items were adapted to
suit breast cancer
Identity (20), Cause (18), Timeline -
Acute/Chronic (6), Timeline - Cyclical
(4), Consequences (6), Personal
Control (6), Treatment Control (5),
Illness Coherence (5), Emotional
Representations (6)
Pearson’s
Correlation
None Meta-Analysis
Giannousi, Manaras,
Georgoulias, & Samonis
(2010)
Cross-sectional IPQ-R: Partially
- scales underwent factor
analysis and were changed
accordingly
- several identity items added
- cause items were adapted
following factor analysis
Identity (22), Cause (13), Timeline -
Acute/Chronic (7), Timeline - Cyclical
(3), Consequences (8), Personal
Control (6), Treatment Control (4),
Illness Coherence (4), Emotional
Representations (8)
None None Narrative Review

242
Gibbons (2013) Longitudinal IPQ-R: Yes
- ‘breast cancer’ substituted
for ‘illness’
- several identity items added
- cause items were adapted to
suit breast cancer
Identity (19), Cause (17), Timeline -
Acute/Chronic (6), Timeline - Cyclical
(4), Consequences (6), Personal
Control (6), Treatment Control (5),
Illness Coherence (5), Emotional
Representations (6)
Pearson’s
Correlation
None Meta-Analysis
Gould, Brown, &
Bramwell (2010)
Cross-sectional IPQ-R: Yes
- ‘cancer’ substituted for
‘illness’
Timeline - Acute/Chronic (6), Timeline
- Cyclical (4), Consequences (6),
Personal Control (6), Treatment
Control (5), Illness Coherence (5)
Pearson’s
Correlation
- Age
- Time Since
- Diagnosis
- Cancer Stage
- Cancer Site
Meta-Analysis
Grande, Arnott, Brundle,
& Pilling (2014)
Longitudinal IPQ-R: Yes Personal Control (6), Emotional
Representations (6)
N/A N/A Narrative Review
Grande, Myers, & Sutton
(2006)
Cross-sectional IPQ-R: Yes
- ‘cancer’ substituted for
‘illness’
Personal Control (6), Emotional
Representations (6)
N/A N/A Narrative Review
Gray, Hall, Browne,
Johnston, Lee, Macleod,
Mitchell, Samuel, &
Campbell (2014)
Cross-sectional IPQ-R: Yes Timeline - Acute/Chronic (6), Timeline
- Cyclical (4), Consequences (6),
Personal Control (6), Treatment
Control (5), Illness Coherence (5),
Emotional Representations (6)
N/A N/A Narrative Review
Gray, Hall, Browne,
Macleod, Lee, Johnston,
Wyke, Samuel, Weller,
& Campbell (2011)
Cross-sectional IPQ-R: Yes Identity (14), Timeline - Acute/Chronic
(6), Timeline - Cyclical (4),
Consequences (6), Personal Control
(6), Treatment Control (5), Illness
Coherence (5), Emotional
Representations (6)
N/A N/A Narrative Review
Green, Steinnagel,
Morris, & Laakso (2014)
Cross-sectional IPQ-R: Yes Identity (14), Timeline - Acute/Chronic
(6), Timeline - Cyclical (4),
Consequences (6), Personal Control
(6), Treatment Control (5), Illness
Coherence (5), Emotional
Representations (6)
Unspecified
Correlation
None Meta-Analysis
Henselmans, Sanderman,
Helgeson, de Vries,
Smink, & Ranchor
(2010)
Longitudinal IPQ-R: Yes
- ‘breast cancer’ substituted
for ‘illness’
Personal Control (6) Pearson’s
Correlation
None Meta-Analysis

243
Hopman & Rijken
(2014)
Cross-sectional IPQ-R: Yes Cause (18), Timeline - Acute/Chronic
(6), Timeline - Cyclical (4),
Consequences (6), Personal Control
(6), Treatment Control (5), Illness
Coherence (5), Emotional
Representations (6)
Pearson’s
Correlation
None Meta-Analysis
Iskandarsyah, de Klerk,
Suardi, Sadarjoen, &
Passchier (2014)
Cross-sectional B-IPQ: Yes Identity (1), Timeline - Acute/Chronic
(1), Consequences (1), Personal
Control (1), Treatment Control (1),
Illness Coherence (1), Emotional
Representations (2)
N/A N/A Narrative Review
JØrgensen, Frederiksen,
Boesen, Elsass, &
Johansen (2009)
Experimental IPQ-R: Yes
- several cause items removed
Identity (14), Cause (3), Timeline -
Acute/Chronic (6), Consequences (6),
Personal Control (6), Treatment
Control (5), Emotional Representations
(6)
N/A N/A Narrative Review
Karademas & Giannousi
(2013)
Cross-sectional IPQ-R: Yes Personal Control (6), Treatment
Control (5)
Unspecified
Correlation
None Meta-Analysis
Keeling, Bambrough, &
Simpson (2013)
Cross-sectional IPQ-R: Yes
- several identity items added
- cause items were adapted
following factor analysis
Identity (22), Cause (21), Timeline -
Acute/Chronic (6), Timeline -
Cyclical (4), Consequences (6),
Personal Control (6), Treatment
Control (5), Illness Coherence (5),
Emotional Representations (6)
Pearson’s
Correlation
None Meta-Analysis
Landers, McCarthy,
Livingstone, & Savage
(2014)
Cross-sectional IPQ: Partially
- scales were adapted for
cancer patients
- several cause items removed
Identity (12), Cause (10), IPQ-R:
Timeline - Acute/Chronic (6), Timeline
- Cyclic (4), Consequences (6),
Personal Control (6), Treatment
Control (5), Emotional Representations
(6)
N/A N/A Narrative Review
Llewellyn, McGurk, &
Weinman (2006)
Cross-sectional IPQ-R: Yes Identity (14), Timeline -
Acute/Chronic (6), Timeline -
Cyclical (4), Consequences (6),
Personal Control (6), Illness
Coherence (5), Emotional
Representations (6)
Pearson’s
Correlation
None Meta-Analysis

244
Llewellyn, McGurk, &
Weinman (2007)
Cross-sectional IPQ-R: Yes Identity (14), Timeline - Acute/Chronic
(6), Timeline - Cyclical (4),
Consequences (6), Personal Control
(6), Illness Coherence (5), Emotional
Representations (6)
Pearson’s
Correlation
None Meta-Analysis
Llewellyn, McGurk, &
Weinman (2007)
Longitudinal IPQ-R: Yes Identity (14), Timeline - Acute/Chronic
(6), Timeline - Cyclical (4),
Consequences (6), Personal Control
(6), Illness Coherence (5), Emotional
Representations (6)
N/A N/A Narrative Review
Llewellyn, Weinman,
McGurk, & Humphris
(2008)
Longitudinal IPQ-R: Yes Identity (14), Timeline - Acute/Chronic
(6), Timeline - Cyclical (4),
Consequences (6), Personal Control
(6), Illness Coherence (5), Emotional
Representations (6)
Pearson’s
Correlation
None Meta-Analysis
McCorry, Dempster,
Quinn, Hogg, Newell,
Moore, Kelly, & Kirk
(2013)
Longitudinal IPQ-R: Yes
- cause items were adapted
following factor analysis
Identity (14), Cause (18), Timeline -
Acute/Chronic (6), Timeline - Cyclical
(4), Consequences (6), Personal
Control (6), Treatment Control (5),
Illness Coherence (5), Emotional
Representations (6)
Pearson’s
Correlation
None Meta-Analysis
Miĉkevicienė, Vanagas,
Jievalta, & Ulys, (2013)
Cross-sectional IPQ-R: Yes Identity (14), Timeline - Acute/Chronic
(6), Timeline -Cyclical (4),
Consequences (6), Personal Control
(6), Treatment Control (5), Illness
Coherence (5), Emotional
Representations (6)
N/A N/A Narrative Review
Millar, Purushotham,
McLatchie, George, &
Murray (2005)
Longitudinal IPQ: Yes Identity (12), Timeline (3),
Consequences (7), Cure/Control (6)
N/A N/A Narrative Review
Mols, Lemmens,
Bosscha, van den Broek,
& Thong (2014)
Cross-sectional B-IPQ: Yes Identity (1), Timeline - Acute/Chronic
(1), Consequences (1), Personal
Control (1), Treatment Control (1),
Illness Coherence (1), Emotional
Representations (2)
Pearson’s
Correlation
None Meta-Analysis

245
Paschali, Hadjulis,
Papadimitriou, &
Karademas (2015)
Cross-sectional IPQ-R: Yes
- cause items were adapted to
suit cancer
Cause (13), Timeline - Acute/Chronic
(6), Timeline - Cyclical (4),
Consequences (6), Personal Control
(6), Treatment Control (5), Illness
Coherence (5), Emotional
Representations (6)
Pearson’s
Correlation
None Meta-Analysis
Rozema, Völlink, &
Lechner (2009)
Cross-sectional IPQ-R: Partially
- scales were adapted for
breast cancer patients
- several identity items added
- cause items were adapted
following factor analysis
Identity (17), Cause (14), Timeline -
Acute/Chronic (6), Timeline - Cyclical
(4), Consequences (6), Personal
Control (6), Treatment Control (5),
Emotional Representations (6)
Pearson’s
Correlation
None Meta-Analysis
Scharloo, Baatenburg de
Jong, Langeveld, van
Velzen-Verkaik, Doorn-
op den Akker, & Kaptein
(2010)
Longitudinal IPQ-R: Partially
- cause items were adapted to
suit the sample (though not
using a formal factor analysis)
Identity (14), Cause (5), Timeline -
Acute/Chronic (6), Timeline - Cyclical
(4), Consequences (6), Personal
Control (6), Treatment Control (5),
Illness Coherence (5), Emotional
Representations (6)
Pearson’s
Correlation
None Meta-Analysis
Scharloo, Baatenburg de
Jong, Langeveld, van
Velzen-Verkaik, Doorn-
op den Akker, & Kaptein
(2005)
Cross-sectional IPQ-R: Partially
- cause items were adapted to
suit the sample (though not
using a formal factor analysis)
Identity (14), Cause (5), Timeline -
Acute/Chronic (6), Timeline - Cyclical
(4), Consequences (6), Personal
Control (6), Treatment Control (5),
Illness Coherence (5), Emotional
Representations (6)
N/A N/A Narrative Review
Silva, Moreira, &
Canavarro (2012)
Cross-sectional B-IPQ: Yes Consequences (1) Pearson’s
Correlation
None Meta-Analysis
Thune-Boyle, Myers, &
Newman (2006)
Cross-sectional IPQ: Partially
- scales were adapted for
breast cancer patients
Consequences (7), Cure/Control (6) Pearson’s
Correlation
None Meta-Analysis
Traeger (2009) Cross-sectional IPQ-R: Yes Consequences (6) Unspecified
Correlation
None Meta-Analysis
Traeger, Penedo,
Benedict, Dahn, Lechner,
Schneiderman, & Antoni
(2013)
Experimental IPQ-R: Partially
- cause items were adapted
based on previous research
(not through a formal factor
analysis)
Cause (4), Consequences (6), Personal
Control (6), Treatment Control (5),
Illness Coherence (5)
N/A N/A Narrative Review

246
Traeger, Penedo,
Gonzalez, Dahn,
Lechner, Schneiderman,
& Antoni (2009)
Cross-sectional IPQ-R: Partially
- cause items were adapted to
suit the sample (though not
using a formal factor analysis)
Cause (4), Consequences (6), Personal
Control (6), Treatment Control (5),
Illness Coherence (5)
Pearson’s
Correlation
None Meta-Analysis
Van Der Kloot,
Kobayashi, Yamaoka,
Inoue, Nortier, &
Kaptein (2014)
Longitudinal B-IPQ: Yes Identity (1), Timeline - Acute/Chronic
(1), Consequences (1), Personal
Control (1), Treatment Control (1),
Illness Coherence (1), Emotional
Representations (2)
Pearson’s
Correlation
- Country
- Cancer Type
Meta-Analysis
Wu, Mohamed, Winkel,
& Diefenbach (2013)
Longitudinal IPQ-R: Yes
- ‘prostate cancer’ substituted
for ‘illness’
Timeline - Acute/Chronic (6),
Treatment Control (5)
Bivariate
Correlation
- Age
- Sexual Function
Meta-Analysis
Živkovic, Buljan, Blajic,
& Situm (2008)
Cross-sectional B-IPQ: Yes Identity (1), Cause (1), Timeline -
Acute/Chronic (1), Consequences (1),
Personal Control (1), Treatment
Control (1), Illness Coherence (1),
Emotional Representations (2)
Pearson’s
Correlation
None Meta-Analysis
Note: *Dimensions that appear are in bold were assessed by authors but not reported by authors for some outcomes

247
Appendix 2.11 Meta-analysis forest plots between illness representations and coping behaviours and illness representations and illness outcomes
(Study 1)
Note: See Pages 255-256 for the key to each study code.
Figure 1. Cognitive Reappraisal and Identity Figure 2. Cognitive Reappraisal and Acute/Chronic Timeline Figure 3. Cognitive Reappraisal and Cyclical Timeline
Figure 4. Cognitive Reappraisal and Consequences Figure 5. Cognitive Reappraisal and Personal Control Figure 6. Cognitive Reappraisal and Treatment Control

248
Figure 7. Cognitive Reappraisal and Illness Coherence Figure 8. Cognitive Reappraisal and Emotional Representations Figure 9. Avoidance/Denial and Identity
Figure 10. Avoidance/Denial and Cause Figure 11. Avoidance/Denial and Acute/Chronic Timeline Figure 12. Avoidance/Denial and Cyclical Timeline
Figure 13. Avoidance/Denial and Consequences Figure 14. Avoidance/Denial and Personal Control Figure 15. Avoidance/Denial and Treatment Control

249
Figure 16. Avoidance/Denial and Illness Coherence Figure 17. Avoidance/Denial and Emotional Representations Figure 18. Problem-Focused Coping (Generic) and Identity
Figure 19. Problem-Focused Coping (Generic) and Cause Figure 20. Problem-Focused Coping (Generic) and Acute/Chronic Timeline Figure 21. Problem-Focused Coping (Generic) and Cyclical Timeline
Figure 22. Problem-Focused Coping (Generic) and Consequences Figure 23. Problem-Focused Coping (Generic) and Personal Control Figure 24. Problem-Focused Coping (Generic) and Treatment Control

250
Figure 25. Problem-Focused Coping (Generic) and Illness Coherence Figure 26. Problem-Focused Coping (Generic) and Emotional Representations Figure 27. Anxiety and Identity
Figure 28. Anxiety and Cause Figure 29. Anxiety and Acute/Chronic Timeline Figure 30. Anxiety and Cyclical Timeline
Figure 31. Anxiety and Consequences Figure 32. Anxiety and Personal Control Figure 33. Anxiety and Treatment Control

251
Figure 34. Anxiety and Illness Coherence Emotional Representations Figure 35. Anxiety and Emotional Representations Figure 36. Depression and Identity
Figure 37. Depression and Cause Figure 38. Depression and Acute/Chronic Timeline Figure 39. Depression and Cyclical Timeline
Figure 40. Depression and Consequences Figure 41. Depression and Personal Control Figure 42. Depression and Treatment Control

252
Figure 43. Depression and Illness Coherence Figure 44. Depression and Emotional Representations Figure 45. Psychological Distress and Identity
Figure 46. Psychological Distress and Cause Figure 47. Psychological Distress and Acute/Chronic Timeline Figure 48. Psychological Distress and Cyclical Timeline
Figure 49. Psychological Distress and Consequences Figure 50. Psychological Distress and Personal Control Figure 51. Psychological Distress and Treatment Control

253
Figure 52. Psychological Distress and Illness Coherence Figure 53. Psychological Distress and Emotional Representations Figure 54. Psychological Well-Being and Consequences
Figure 55. Role Functioning and Identity Figure 56. Role Functioning and Acute/Chronic Timeline Figure 57. Role Functioning and Consequences
Figure 58. Role Functioning and Personal Control Figure 59. Role Functioning and Treatment Control Figure 60. Role Functioning and Illness Coherence

254
Figure 61. Role Functioning and Emotional Representations Figure 62. Physical Functioning and Identity Figure 63. Physical Functioning and Acute/Chronic Timeline
Figure 64. Physical Functioning and Cyclical Timeline Figure 65. Physical Functioning and Consequences Figure 66. Physical Functioning and Personal Control
Figure 67. Physical Functioning and Treatment Control Figure 68. Physical Functioning and Illness Coherence Figure 69. Physical Functioning and Emotional Representations

255
Figure 70. Quality of Life and Identity Figure 71. Quality of Life and Acute/Chronic Timeline Figure 72. Quality of Life and Consequences
Figure 73. Quality of Life and Personal Control Figure 74. Quality of Life and Treatment Control Figure 75. Quality of Life and Illness Coherence
Figure 76. Quality of Life and Emotional Representations

256
Study codes with associated authors and dates
Study Code Authors (Date)
BEA13SC Beatty and Scott (2013)
CAM05BO Cameron, Booth, Schlatter, Ziginskas, Harman, & Benson (2005)
CHE12XX Chen (2013)
COO13HA Cooper, Hankins, Rixon, Eaton, & Grunfeld (2013)
COO15SA Cook, Salman, Dunn, Holcombe, Cornford, & Fisher (2015)
COO15SA* Cook, Salman, Dunn, Holcombe, Cornford, & Fisher (2015)
COR13FI Corter, Findlay, Broom, Porter, & Petrie (2013)
COS11LU Costanzo, Lutgendorf, & Roeder (2011)
CRO12XX Croom (2012)
CRO13HA Croom, Hamann, Kehoe, Paulk, & Wiebe (2013)
DEM12MC Dempster, McCorry, Brennan, Donnelly, Murray, & Johnston (2012)
DEM11MC Dempster, McCorry, Brennan, Donnelly, Murray, & Johnston (2011)
DON03XX Donovan (2003)
DUR07BU Duric, Butow, Sharpe, Boyle, Beith, Wilcken, Heritier, Coates, Simes, & Stockler (2007)
FAN13EI Fan, Eiser, Ho, & Lin (2013)
FIS13WI Fischer, Wiesenhaan, Heijer, Kleijn, Nortier, & Kaptein (2013)
FÖR06TA Förster & Taubert (2006)
FOS14BR Foster, Breckons, Cotterell, Barbosa, Calman, Corner, Fenlon, Foster, Grimmett, Richardson, & Smith (2015)
FRE12XX Freeman-Gibb (2012)
GIA10MA Giannousi, Manaras, Georgoulias, & Samonis (2010)
GIB13XX Gibbons (2013)
GOU10BR Gould, Brown, & Bramwell (2010)
GRA06MY Grande, Myers, & Sutton (2006)
GRA14AR Grande, Arnott, Brundle, & Pilling (2014)
GRA14HA Gray, Hall, Browne, Johnston, Lee, Macleod, Mitchell, Samuel, & Campbell (2014)
GRA11HA Gray, Hall, Browne, Macleod, Lee, Johnston, Wyke, Samuel, Weller, & Campbell (2011)
GRE14ST Green, Steinnagel, Morris, & Laakso (2014)
HEN10SA Henselmans, Sanderman, Helgeson, de Vries, Smink, & Ranchor (2010)
HOP14RI Hopman & Rijken (2014)
ISK14DE Iskandarsyah, de Klerk, Suardi, Sadarjoen, & Passchier (2014)

257
JØR09FR JØrgensen, Frederiksen, Boesen, Elsass, & Johansen (2009)
KAR13GI Karademas & Giannousi (2013)
KEE13BA Keeling, Bambrough, & Simpson (2013)
LAN14MC Landers, McCarthy, Livingstone, & Savage (2014
LLE06MC Llewellyn, McGurk, & Weinman (2006)
LLE07MC Llewellyn, McGurk, & Weinman (2007)
LLE07MC* Llewellyn, McGurk, & Weinman (2007)
LLE08WE Llewellyn, Weinman, McGurk, & Humphris (2008)
MCC13DE McCorry, Dempster, Quinn, Hogg, Newell, Moore, Kelly, & Kirk (2013)
MIC13VA Miĉkevicienė, Vanagas, Jievalta, & Ulys, (2013)
MIL05PU Millar, Purushotham, McLatchie, George, & Murray (2005)
MOL14LE(NO)
– No Ostomy
Mols, Lemmens, Bosscha, van den Broek, & Thong (2014)
MOL14LE(O)
– Ostomy
Mols, Lemmens, Bosscha, van den Broek, & Thong (2014)
PAS15HA Paschali, Hadjulis, Papadimitriou, & Karademas (2015)
ROZ09VÖ Rozema, Völlink, & Lechner (2009)
SCH10BA Scharloo, Baatenburg de Jong, Langeveld, van Velzen-Verkaik, Doorn-op den Akker, & Kaptein (2010)
SCH05BA Scharloo, Baatenburg de Jong, Langeveld, van Velzen-Verkaik, Doorn-op den Akker, & Kaptein (2005)
SIL12MO Silva, Moreira, & Canavarro (2012)
THU06MY Thune-Boyle, Myers, & Newman (2006)
TRA09XX Traeger (2009)
TRA13PE Traeger, Penedo, Benedict, Dahn, Lechner, Schneiderman, & Antoni (2013)
TRA09PE Traeger, Penedo, Gonzalez, Dahn, Lechner, Schneiderman, & Antoni (2009)
VAN14KO Van Der Kloot, Kobayashi, Yamaoka, Inoue, Nortier, & Kaptein (2014)
WUX13MO Wu, Mohamed, Winkel, & Diefenbach (2013)
ŽIV08BU Živkovic, Buljan, Blajic, & Situm (2008)

258
Appendix 2.12 Meta-analysis funnel plots between illness representations and coping behaviours and illness representations and illness
outcomes (Study 1)
Figure 1. Cognitive Reappraisal and Identity Figure 2. Cognitive Reappraisal and Acute/Chronic Timeline Figure 3. Cognitive Reappraisal and Cyclical Timeline
Figure 4. Cognitive Reappraisal and Consequences Figure 5. Cognitive Reappraisal and Personal Control Figure 6. Cognitive Reappraisal and Treatment Control

259
Figure 7. Cognitive Reappraisal and Illness Coherence Figure 8. Cognitive Reappraisal and Emotional Representations Figure 9. Avoidance/Denial and Identity
Figure 10. Avoidance/Denial and Cause Figure 11. Avoidance/Denial and Acute/Chronic Timeline Figure 12. Avoidance/Denial and Cyclical Timeline
Figure 13. Avoidance/Denial and Consequences Figure 14. Avoidance/Denial and Personal Control Figure 15. Avoidance/Denial and Treatment Control

260
Figure 16. Avoidance/Denial and Illness Coherence Figure 17. Avoidance/Denial and Emotional Representations Figure 18. Problem-Focused Coping (Generic) and Identity
Figure 19. Problem-Focused Coping (Generic) and Cause Figure 20. Problem-Focused Coping (Generic) and Acute/Chronic Timeline Figure 21. Problem-Focused Coping (Generic) and Cyclical Timeline
Figure 22. Problem-Focused Coping (Generic) and Consequences Figure 23. Problem-Focused Coping (Generic) and Personal Control Figure 24. Problem-Focused Coping (Generic) and Treatment Control

261
Figure 25. Problem-Focused Coping (Generic) and Illness Coherence Figure 26. Problem-Focused Coping (Generic) and Emotional Representations Figure 27. Anxiety and Identity
Figure 28. Anxiety and Cause Figure 29. Anxiety and Acute/Chronic Timeline Figure 30. Anxiety and Cyclical Timeline
Figure 31. Anxiety and Consequences Figure 32. Anxiety and Personal Control Figure 33. Anxiety and Treatment Control

262
Figure 34. Anxiety and Illness Coherence Figure 35. Anxiety and Emotional Representations Figure 36. Depression and Identity
Figure 37. Depression and Cause Figure 38. Depression and Acute/Chronic Timeline Figure 39. Depression and Cyclical Timeline
Figure 40. Depression and Consequences Figure 41. Depression and Personal Control Figure 42. Depression and Treatment Control

263
Figure 43. Depression and Illness Coherence Figure 44. Depression and Emotional Representations Figure 45. Psychological Distress and Identity
Figure 46. Psychological Distress and Cause Figure 47. Psychological Distress and Acute/Chronic Timeline Figure 48. Psychological Distress and Cyclical Timeline
Figure 49. Psychological Distress and Consequence Figure 50. Psychological Distress and Personal Control Figure 51. Psychological Distress and Treatment Control

264
Figure 52. Psychological Distress and Illness Coherence Figure 53. Psychological Distress and Emotional Representations Figure 54. Psychological Well-Being and Consequences
Figure 55. Role Functioning and Identity Figure 56. Role Functioning and Acute/Chronic Timeline Figure 57. Role Functioning and Consequences
Figure 58. Role Functioning and Personal Control Figure 59. Role Functioning and Treatment Control Figure 60. Role Functioning and Illness Coherence

265
Figure 61. Role Functioning and Emotional Representations Figure 62. Physical Functioning and Identity Figure 63. Physical Functioning and Acute/Chronic Timeline
Figure 64. Physical Functioning and Cyclical Timeline Figure 65. Physical Functioning and Consequences Figure 66. Physical Functioning and Personal Control
Figure 67. Physical Functioning and Treatment Control Figure 68. Physical Functioning and Illness Coherence Figure 69.Physical Functioning and Emotional Representations

266
Figure 70. Quality of Life and Identity Figure 71. Quality of Life and Acute/Chronic Timeline Figure 72. Quality of Life and Consequences
Figure 73. Quality of Life and Personal Control Figure 74. Quality of Life and Treatment Control Figure 75. Quality of Life and Illness Coherence
Figure 76. Quality of Life and Emotional Representations

Appendix 3.1 PRISMA 2009 Statement (Study 2) 267
Section/topic # Checklist item Reported on page #
TITLE
Title 1 Identify the report as a systematic review, meta-analysis, or both. 51
ABSTRACT
Structured summary 2 Provide a structured summary including, as applicable: background; objectives; data sources; study eligibility criteria, participants, and interventions; study appraisal and synthesis methods; results; limitations; conclusions and implications of key findings; systematic review registration number.
52
INTRODUCTION
Rationale 3 Describe the rationale for the review in the context of what is already known. 53-57
Objectives 4 Provide an explicit statement of questions being addressed with reference to participants, interventions, comparisons, outcomes, and study design (PICOS).
57
METHODS
Protocol and registration 5 Indicate if a review protocol exists, if and where it can be accessed (e.g., Web address), and, if available, provide registration information including registration number.
N/A
Eligibility criteria 6 Specify study characteristics (e.g., PICOS, length of follow-up) and report characteristics (e.g., years
considered, language, publication status) used as criteria for eligibility, giving rationale. 58
Information sources 7 Describe all information sources (e.g., databases with dates of coverage, contact with study authors to identify additional studies) in the search and date last searched.
58
Search 8 Present full electronic search strategy for at least one database, including any limits used, such that it could be repeated.
App 3.2
Study selection 9 State the process for selecting studies (i.e., screening, eligibility, included in systematic review, and, if applicable, included in the meta-analysis).
58-59, Figure 3.2
Data collection process 10 Describe method of data extraction from reports (e.g., piloted forms, independently, in duplicate) and any processes for obtaining and confirming data from investigators.
64
Data items 11 List and define all variables for which data were sought (e.g., PICOS, funding sources) and any assumptions and simplifications made.
59
Risk of bias in individual studies
12 Describe methods used for assessing risk of bias of individual studies (including specification of whether this was done at the study or outcome level), and how this information is to be used in any data synthesis.
65
Summary measures 13 State the principal summary measures (e.g., risk ratio, difference in means). 64
Synthesis of results 14 Describe the methods of handling data and combining results of studies, if done, including measures of consistency (e.g., I2) for each meta-analysis.
64-65
Page 1 of 2

268
Section/topic # Checklist item Reported on page #
Risk of bias across studies 15 Specify any assessment of risk of bias that may affect the cumulative evidence (e.g., publication bias, selective reporting within studies).
67
Additional analyses 16 Describe methods of additional analyses (e.g., sensitivity or subgroup analyses, meta-regression), if done, indicating which were pre-specified.
N/A
RESULTS
Study selection 17 Give numbers of studies screened, assessed for eligibility, and included in the review, with reasons for exclusions at each stage, ideally with a flow diagram.
58-59, Figure 3.2
Study characteristics 18 For each study, present characteristics for which data were extracted (e.g., study size, PICOS, follow-up period) and provide the citations.
65, Table 3.1
Risk of bias within studies 19 Present data on risk of bias of each study and, if available, any outcome level assessment (see item 12). 65-66; App 3.5-3.6
Results of individual studies 20 For all outcomes considered (benefits or harms), present, for each study: (a) simple summary data for each intervention group (b) effect estimates and confidence intervals, ideally with a forest plot.
N/A
Synthesis of results 21 Present results of each meta-analysis done, including confidence intervals and measures of consistency. 66-67, Table 3.2, App 3.7
Risk of bias across studies 22 Present results of any assessment of risk of bias across studies (see Item 15). 67, App 3.8
Additional analysis 23 Give results of additional analyses, if done (e.g., sensitivity or subgroup analyses, meta-regression [see Item 16]).
N/A
DISCUSSION
Summary of evidence 24 Summarize the main findings including the strength of evidence for each main outcome; consider their relevance to key groups (e.g., healthcare providers, users, and policy makers).
71-73
Limitations 25 Discuss limitations at study and outcome level (e.g., risk of bias), and at review-level (e.g., incomplete retrieval of identified research, reporting bias).
73-75
Conclusions 26 Provide a general interpretation of the results in the context of other evidence, and implications for future research.
73, 75
FUNDING
Funding 27 Describe sources of funding for the systematic review and other support (e.g., supply of data); role of funders for the systematic review.
N/A
From: Moher D, Liberati A, Tetzlaff J, Altman DG, The PRISMA Group (2009). Preferred Reporting Items for Systematic Reviews and Meta-Analyses: The PRISMA Statement. PLoS Med 6(6): e1000097. doi:10.1371/journal.pmed1000097
For more information, visit: www.prisma-statement.org. Page 2 of 2

269
Appendix 3.2 Database search strategies (Study 2)
Scopus Syntax
Advanced Search
PUBYEAR > 1995 AND TITLE-ABS-KEY(anxiety OR "anxiety disorder*" OR depress* OR "depress*
disorder*") AND TITLE-ABS-KEY("illness perception*" OR "illness representation*" OR "common sense"
OR Leventhal* OR IPQ*)
Web of Science Syntax
Basic Search
((anxiety OR "anxiety disorder*" OR depress* OR "depress* disorder*") AND ("illness perception*" OR
"illness representation*" OR “common sense” OR Leventhal* OR IPQ*))
Timespan 1995 - 2015
PubMed Syntax
Advanced Search
(anxiety[TIAB] OR “anxiety disorder*”[TIAB] OR depress*[TIAB] OR “depress* disorder*”[TIAB]) AND
("illness perception*"[TIAB] OR "illness representation*"[TIAB] OR “common sense”[TIAB] OR
Leventhal*[TIAB] OR IPQ*[TIAB])
Custom Date Range 1995 - 2015
PsycINFO Syntax
Command Line
AB,TI(anxiety OR "anxiety disorder*" OR depress* OR "depress* disorder*") AND AB,TI("illness
perception*" OR "illness representation*" OR “common sense” OR Leventhal* OR IPQ*)
Enter a specific date range starting 1995 ending 2015
Google Scholar Syntax (1995-2015)
With the exact phrase:
Illness Representation Illness Representations
Illness Perception Illness Perceptions
Common Sense IPQ
With at least one of the words: anxiety depression
In the title of the article
Return articles dated between 1995 - 2015

270
Appendix 3.3 Coding manual (Study 2)
Coding Manual
1 General Information
ID No. _______________ Depression/Anxiety Type ______ DV _______
An article identification number should be included at the top left of each page under ID No., and again in the
General Publication Information section of the coding sheet. The 7-digit ID is specified in BLOCK CAPITALS.
It is composed of:
• the first three letters of the surname of the first author
• the last two digits of the publication year
• the first two letters of the surname of the second author (if no secondary author: xx)
If several depression/anxiety types are examined in a publication, a private coding sheet is filled out for each type
of depression/anxiety. The depression/anxiety types in an article are numbered. This number is entered in the upper
right corner of each page under Depression/Anxiety Type, and again in the Depression/Anxiety and Sample
Information section of the coding sheet. If the publication examines only one depression/anxiety type, the number
of the depression/anxiety type followed by the word “only” is entered here. Depression/Anxiety Type should be
coded as per the categories below:
1 = Depression
2 = Anxiety
Note: Please include a more specific description of the depression/anxiety type in the Depression/Anxiety and
Sample Information section of the coding sheet if necessary.
If in the publication several dependent variables (including separate subscales) are analysed (e.g. psychological
distress, and avoidance/denial), each dependent variable is given a number in terms of its DV (Subscale) Type.
This number is entered in the upper right corner of each page under DV, and again in the dependent variable
section of the coding sheet. These numbers are the same for all depression/anxiety types. DV (Subscale) Type has
been adopted from Hagger and Orbell (2003) and should be coded as per the categories below:

271
Coping Behaviours
23. Expressing Emotion
24. Cognitive Reappraisal
25. Avoidance/Denial
26. Problem-Focused Coping (Generic)
27. Problem-Focused Coping (Specific - Other)
28. Treatment Decision Making
29. Medication Adherence
30. Adherence to Treatment Visits
31. Doctors Visits
32. Seeking Social Support
98. Other Coping Behaviour (Specify)
Illness Outcomes
33. Affect (Negative/Positive)
34. Anxiety
35. Depression
36. Psychological Distress
37. Treatment Related Distress
38. Decisional Uncertainty / Regret
39. Psychological Well-Being
40. Vitality
41. Role Functioning
42. Physical Functioning
43. Disease State
44. Quality of Life
99. Other Illness Outcome (Specify)
Redundant Information
If multiple coding sheets are filled in for one article, the details that apply to the entire article should be recorded
in only one coding sheet, and the corresponding check box (to the right of the questions) should be ticked in other
relevant coding sheets.
Therefore a ticked box means that the missing information may be taken from another coding sheet.
Missing Information
There are two types of missing information:
• Not Applicable: is crossed out in coding sheet and later encoded in data entry with 777.
• Missing: is left open (and possibly supplemented, if one has written to the author).
Decimal Places
All sample values should be a maximum of two decimal places (rounded).
All statistical values should be a maximum of three decimal places.
Exclusion Criteria
If one of the following criteria apply, the study must be excluded:
• Study did not use the IPQ or IPQ-R: The study did not measure Illness Representations from the CSM using the Illness Perception
Questionnaire or the Revised Illness Perception Questionnaire.
• Study did not measure Coping Behaviours or Illness Outcomes
• Study contained Participants without a Diagnosis of Depression or Anxiety
• Study used (only) Children or Adolescents: Participants must not be under the age of eighteen.
• Study in a language other than English or German: Note: We will consider studies in other languages if they include clear results.
• Study was conducted prior to 1995: The study was conducted prior to the creation of the IPQ.
A coding sheet must be created for any excluded study. However, it is sufficient to only fill in the general
information for publication section. In addition, the “Study will be Excluded” box should be ticked and reasons
should be provided in the comments box on the last page.

272
2 Comments on the Study
Study will be Excluded Write to Authors Important Comments
If problems occurred during encoding, the relevant box should be ticked (with details to be included in the Final
Details box on the last page of the coding sheet).
• Study will be Excluded: Reason for exclusion in the final data set.
• Write to Authors: If the publication is lacking important statistical information (e.g. information about the sample size or standard
deviations), the coder will try to check this information with the authors. The missing details are mentioned in the Final Details box.
• Important Comments: If any problems/comments are entered in the Final Details box, this field should be ticked – unless these are
reasons for exclusion or information about a lack of statistical information.

273
3 General Publication Information
Article Identification Number (ID-No.): __ __ __ __ __ __ __ Study in Article: _________
The Article Identification Number should be the same 7-digit ID (specified in BLOCK CAPITALS) as appears at
the top left hand corner of each page. It is composed of
• the first three letters of the surname of the first author
• the last two digits of the publication year
• the first two letters of the surname of the second author (if no secondary author: xx)
If the publication contains several studies that refer to different samples, these studies are numbered. For each
study, a separate coding sheet should be created. The respective number of the study is then given here.
Coder: ___________ Coding Date____ / ___ / _______ Time of Day: ___________
Coder: Enter initials of Coder
Coding Date: Day / Month / Year
Time of Day: Specify at the start of encoding in order to determine the total duration of coding
Authors: ________________________________________________ Publication Year: _________
Specify the last name of the first three authors. If more than three authors are mentioned, all the other authors are
abbreviated with et al. The publication year is four digits.
Title (first six words): ______________________________________________________________
Note the first six words from the title of the publication.
Country of Origin - Author: _________ Other Origin: ______________________
The Country of Origin of the first author is usually noted on the publication. If not, it should be googled and
entered using the codes below. If the author has more than one Country of Origin, enter this under Other Origin.

274
Coding of Country of Origin
1 = USA
2 = Canada
3 = Germany
4 = Great Britain
5 = Netherlands
6 = Scandinavia
7 = Australia
8 = Western Europe (excluding G, GB, N, Scandinavia)
9 = Eastern Europe (including Russia)
99 = Other (Specify)
Discipline of the First Author: _________ Other Discipline: ____________________
The discipline of the first author is usually noted on the publication. If not, it should be googled and entered using
the codes below. If the author has more than one discipline listed, enter this under Other Discipline.
Coding of Discipline
1 = Psychology
2 = Psychiatry
3 = Medicine
4 = Sociology
5 = Economy
6 = Education
99 = Other
Publication Found In: _________ Other Place Publication Found: _____________
Coding where the Publication was Found
1 = Scopus
2 = Web of Science
3 = PubMed
4 = PsycINFO
5 = Google Scholar
6 = Manual Search in Journals
7 = Hand-Searched Reference Lists
8 = Contact with Researchers
99 = Other Source
Note: Some publications may be found (or exist) in more than one location or database. The code given will reflect
the first place the coders have found the publication.

275
Type of Publication: _____ Other Publication: ______ Citations: _______ Impact: _________
Coding the Type of Publication
1 = Journal with Peer Review
2 = Journal without Peer Review
3 = Book / Book Chapters
4 = Dissertation (PhD)
5 = Honours Thesis or Master’s Thesis (or German Diploma)
6 = Conference Presentation / Poster (Abstract or Full Paper)
7 = Unpublished Manuscript
8 = Internet Document
99 = Other
Citations
How many citations does the study have (in Scopus)?
Impact
What is the Impact Factor of the Journal (in Journal Citation Reports)?

276
4 Description of the Study
Study Type: _____________ IPQ or IPQ-R Dimension: ___________________________________
Reliability Source: ________ Coefficients Type: ________ Number of Items: ___________
Study: _______________________________________________________________________________
Coding of Study Type Coding of IPQ or IPQ-R Dimension
1 = Cross-Sectional
2 = Longitudinal
3 = Experimental
4 = Pseudo-Experimental
5 = Qualitative
99 = Other Study Type
1 = Identity
2 = Cause (Generic)
3 = Timeline (Acute/Chronic)
4 = Consequences
5 = Personal Control
6 = Treatment Control Items
7 = Illness Coherence Items
8 = Timeline Cyclical
9 = Emotional Representations
10 = IPQ Only – Cure-Control
11 = All Dimensions of IPQ
12 = All Dimensions of IPQ-R
Coding of Reliability Source
0 = No Information
1 = No Information, but reference to another publication (specify study)
2 =Yes, calculated using the sample from this publication (specify values)
3 = Yes, calculated using a different sample (values and specify study)
If reliability coefficients are given for individual subscales, these should be included later in the coding sheet (in
the Statistical Analyses and Effect Sizes section).
If coefficients are drawn from both this sample (coding 2) and from other studies (coding 3) in the publication,
only the coefficients of the concrete sample are to be coded.
If there is no information about reliability, but there is a reference in the description of the instrument, this
corresponds to Coding 1.
Coding of Coefficient Type
1 = Internal Consistency, E.g. Cronbach’s
2 = Split- Halves Reliability
3 = Test-Retest Reliability
4 = Parallel Test Reliability
5 = Mean Value of Several Coefficients
6 = No Precise Indication
99 = Other Coefficient
Study
If a reliability coefficient is (or is not) stated, and reference is made to another study, the first three authors and the
year of publication of the study are stated under “Study”.

277
Number of Items
If all dimensions of the IPQ or IPQ-R were measured, provide the number of items for the entire measure here.
The number of items for each individual subscale should be included later in the coding sheet (in the Statistical
Analyses and Effect Sizes section).
If Experimental:
Number of Groups: _______
Assignment: _______
Group a: _______________
Group b: _______________
Group c: _______________
Group d: _______________
The values of various groups are often reported, e.g. for women and for men. In this case, the statistics for each
group are reported on a single coding sheet.
Note: Only fill out this section of the coding sheet if the study is experimental.
Number of Groups
Specify the number of groups for which statistics are available. If only one group is available, use a 1. Further, all
other fields must not be filled in, but instead crossed out and encoded with 777 (not applicable).
Assignment
Group allocation:
1 = Randomisation: The subjects were randomly assigned to the groups.
2 = Matched Groups: Each person of one group matches a person of the other group. Each pair has similar properties (e.g. the same age or the
same sex).
3 = Natural Groups, parallelised: E.g., women’s and men’s groups are natural groups. These two groups can also be parallelised for other
characteristics (e.g. by having the same mean age).
4 = Natural Groups without further assignment: E.g., comparison of women and men, without other sampling features.
Group a, Group b, etc.
Each group is assigned a continuous index a, b, c, etc. Note which identify groups, e.g. group a = men, group b =
women, or group a = pre-treatment, group b = peri-treatment, group c = post-treatment.
If more than four groups were analysed, the other group affiliations are simply noted on the margin or on a separate
piece of paper.
Number of Measurement Points: _______ Year of the First Data Collection: __________
Number of Measurement Points: Enter a number or 99, when the number of measurement times varied within the
sample. These are only included when statistical information is available for the measurement point.
Year of the First Data Collection: Enter the four-digit year number. If given several years for the first MP, the
earliest year is coded.

278
Lag Between Assessments ________:
MP 2 __________________________________
MP 3 __________________________________
MP 4 __________________________________
MP 5 __________________________________
MP 6 __________________________________
MP 7 __________________________________
MP 8 __________________________________
This box can only be filled in if the distance between the MPs is the same for all individuals, and if statistics are
available. The time interval is specified in months (rounded if necessary).
Use this scale for the conversion of years, weeks and days into months:
1 Day = 0.03 Months
1 Week = 0.25 Months
1 Year = 12 Months

279
5 Depression/Anxiety and Sample Information
The information on the sample should refer to the smallest unit of analysis (e.g., males and females separately). If
there are several groups, information on the sample for each group should be recorded separately. If this is not
possible and only information on the total sample can be accessed, it is sufficient to fill in the Depression/Anxiety
and Sample Information box on a single coding sheet and to tick the box on the right – meaning that this data is
applicable across all groups.
Sometimes statistics are only available at the group level, and other times only for the entire sample. In this case,
you can mark information as generally applicable by placing a tick in the smaller box to the right of each row. A
ticked box means that this information refers to the whole sample. If this box is not ticked, it means that this
information refers to the specific group.
Type of Sample: _______________________
The nature of the sample may change during a longitudinal study. For example, students might participate, and
after a passage of time, leave the university. It is therefore crucial for to identify what the type of sample was at
the first MP.
Coding the Type of Sample
1 = Representative Sample
2 = Non-representative Sample of the general population (specify if the study has a name)
3 = Students
4 = Clinical Sample (E.g. those assessed in a hospital)
5 = Depression/Anxiety Groups, Societies, and Communities (E.g. self-help groups, internet communities)
99 = Other type of Sample (specify)
Dep/Anx Type: __________________________________________________________
Coding of Dep/Anx Type
Depression/Anxiety Type should be coded as per the categories below:
1 = Depression
2 = Anxiety
Note: Please include a more specific description of the depression/anxiety type in the Depression/Anxiety and
Sample Information section of the coding sheet if necessary.

280
Dep/Anx Duration: M = ___________ SD = __________ Range from _______ to _________
Dep/Anx Duration: Record information here regarding the length of time participants have suffered from (been
diagnosed with) depression or anxiety (in months).
Use this scale for the conversion of years, weeks and days into months:
1 Day = 0.03 Months
1 Week = 0.25 Months
1 Year = 12 Months
M: Mean value.
SD: Standard deviation.
Range: Specify a minimum and maximum Depression/Anxiety Duration.
Age at Onset: M = ____________ SD = _________ Range from _______ to _________
Age at Onset: Record information here regarding which age participants were diagnosed with depression or anxiety
(in years).
M: Mean value.
SD: Standard deviation.
Range: Specify a minimum and maximum Age at Onset.
Treatment Type: ______ Treatment Stage: __________________________________
Coding of Treatment Type Coding of Treatment Stage
1 = Psychological (Specify)
2 = Antidepressant Medication
3 = Other Medication (Specify)
99 = Other Treatment (Specify)
1 = Pre-Treatment
2 = Peri-Treatment (Currently Undergoing Treatment)
3 = Post-Treatment
Size of the Sample at each Measurement Point:
MP 1 __________
MP 2 __________
MP 3 __________
MP 4 __________
MP 5 __________
MP 6 __________
MP 7 __________
MP 8 __________

281
Here the sample size at each measurement time point is indicated. Sample size includes all participants, regardless
of whether or not they were later excluded from the analysis. The point is to show how the sample has changed
over time (i.e. mostly reduced).
If multiple groups are examined separately, only the respective group size is specified.
Total N: ______________ Retention Rate: _________ %
Total N: The number of individuals that participated at all time points.
Retention Rate: How high is the percentage of those who have participated in all MPs (total N), compared to the
sample for the first MP (can be calculated from the ratio of MP 1 and total N).
Proportion of Men at MP 1: _______ %
Proportion of Men: Always indicate the MP for which the proportion of men refers.
Age at MP 1 _____: M = __________ SD = __________ Range from __________ to _________
Age at MP 1: Specify to whom the information relates. If data is available for several MPs, the information for
MP 1 is reported.
M: Mean value.
SD: Standard deviation.
Range: Specify a minimum and maximum age.
Ethnicity: ____ Other Ethnicity: ____ Country of Origin: ____ Other Country of Origin: ____
Coding of Ethnicity
Ethnicity is specified only if the proportion of this ethnic group makes up a minimum of 50% of the sample.
1 = White (Caucasian, Anglo-American, European)
2 = Black
3 = Hispanic
4 = Indigenous People
5 = Asian
6 = Mixed (when two ethnic groups are represented with 50% each)
99 = Other (specify)

282
Coding of Country of Origin
Specify in which Country the study was conducted.
1 = USA
2 = Canada
3 = Germany
4 = Great Britain
5 = Netherlands
6 = Scandinavia
7 = Australia
8 = Western Europe (excluding G, GB, N, Scandinavia)
9 = Eastern Europe (including Russia)
99 = Other (Specify)

283
6 Dependent Variable
No. ______ Did the Study aim to change the Dependent Variable? ________
Number of Dependent Variables
If there are several DVs (including separate subscales), the DVs are numbered in terms of their DV (Subscale)
Type and a separate coding sheet for each DV is created. This number should also be entered in the top right hand
corner of every page. Note. As each subscale can be a DV of its own, the number of DVs should include subscales
(if their details are to be recorded separately throughout the coding sheet). At “No.” the number of DVs is given.
If only one DV is encoded, this field is crossed out and later coded with 777 (not applicable).
Did the Study aim to change the Dependent Variable/s?
Did the study aim to change the DV:
0 = No
1 = Yes
DV Global: _________ DV Name: ___________________________________________________
There are three aspects of the DV that need to be coded. In DV Global, the global category is entered. These are
distinguished as:
1 = Coping Behaviour
2 = Illness Outcome
99 = Other (Please Specify)
DV Name indicates the name of the DV which is used in the publication.
Subscale: __________________________ DV (Subscale) Type: _______________
Subscale
If only one subscale of an instrument is used, or if data is provided separately for several subscales, this is noted
here (by recording the name of the subscale). All other information (e.g., reliability and number of items) will
always refer to this subscale, and not the entire instrument.
DV (Subscale) Type has been adopted from Hagger and Orbell (2003) and should be coded as per the categories
below:
Coping Behaviours Illness Outcomes

284
23. Expressing Emotion
24. Cognitive Reappraisal
25. Avoidance/Denial
26. Problem-Focused Coping (Generic)
27. Problem-Focused Coping (Specific - Other)
28. Treatment Decision Making
29. Medication Adherence
30. Adherence to Treatment Visits
31. Doctors Visits
32. Seeking Social Support
98. Other Coping Behaviour (Specify)
33. Affect (Negative/Positive)
34. Anxiety
35. Depression
36. Psychological Distress
37. Treatment Related Distress
38. Decisional Uncertainty / Regret
39. Psychological Well-Being
40. Vitality
41. Role Functioning
42. Physical Functioning
43. Disease State
44. Quality of Life
99. Other Illness Outcome (Specify)
Data Source: _______ Additional Information: _________________________________________
Coding of the Data Source
1 = Self-report Questionnaire
2 = Self-report Interview
3 = Self-report on Ambulatory Assessment
5 = Observation
6 = Ratings by Others (include who provided the ratings)
7 = Analysis of Written Reports (e.g., diaries or autobiographies)
8 = Physiological Measures
9 = Objective Measures (e.g., pill bottle count)
99 = Other Data Source
Caution: The use of a scale does not always mean that the data source is a self-report questionnaire. Often the
scales are presented in an interview, making it a self-report interview.
Instrument: Code: ____________ Number of Items: _______________
Reliability: Coefficients: MP ___ MP ___ MP ___ MP ___ MP ___ MP ___
Source: _________ Type: ________ _______ _______ _______ _______ _______ _______
Study: _______________________________________________________________________________
Coding of the Instrument
Measures of Coping Behaviours
1 = COPE (Carver, Scheier, & Weintraub, 1989)
2 = Utrechtse Coping Questionnaire (UCL; Schreurs, & Willige, 1988)
3 = Impact of Event Scale - Revised (IES-R; Weiss & Marmar, 1997)
4 = Ways of Coping Checklist - Revised (WCCL-R; Vitaliano, Russo, Carr,
Maiuro, & Becker)
5 = Ways of Coping Questionnaire (WCQ; Folkman & Lazarus, 1988)
6 = Medication Adherence Reporting Scale - 5 (MARS-5; Horne, 2001)
7 = The Morisky Medication Adherence Scale – 8 (MMAS-8; Morisky,
Green, & Levine, 1986)
8 = Other Measure of Coping Behaviour (Specify)
Measures of Illness Outcomes
9 = Medical Outcomes Study 36/20/12 Item Short Form (MOS SF-36/20/12;
Stewart, Hays, & Ware, 1988)
10 = General Health Questionnaire 60/30/28/12 Item (GHQ-60/30/28/12;
Goldberg, 1978)
11 = Positive and Negative Affect Schedule (PANAS; Watson, Clark, &
Tellegen, 1988)
12 = Generalised Anxiety Disorder 7-Item Scale (GAD-7; Spitzer, Kroenke,
Williams, & Lowe, 2006)
13 = State-Trait Anxiety Inventory (STAI; Speilberger, Gorsuch, Lushene,
Vagg, & Jacobs, 1983)

285
14 = Centre for Epidemiological Studies Depression Scale Revised (CESD-
R; Eaton, Muntaner, Smith, Tien, & Ybarra, 2004)
15 = Patient Health Questionnaire – 2/9 Item (PHQ-9/2; Kroenke, & Spitzer,
2002; Kroenke, Spitzer, & Williams, 2003)
16 = Hospital Anxiety and Depression Scale (HADS; Zigmond & Snaith,
1983)
17 = Impact of Event Scale – Revised (IES-R; Weiss & Marmar 1996)
18 = Psychological Adjustment to Illness Scale – Self Report (PAIS-SR;
Derogatis, 1986)
19 = Penn State Worry Questionnaire (PSWQ; Meyer, Miller, Metzeger, &
Borkovec, 1990)
20 = Strengths and Difficulties Questionnaire (SDQ; Goodman, 1997)
21 = Well-being Questionnaire (WB-Q12 or WB-Q22; Bradley, 1994)
22 = World Health Organisation Quality of Life (or BREF) (WHOQOL;
WHO, 1998)
23 = Other Measure of Illness Outcome (Specify)
Number of Items
Number of items specifies the number of items the construct was measured with. If only one subscale is used, only
list the number of items for this subscale.
Source of Reliability Information
0 = No Information
1 = No Information, but reference to another publication (specify study)
2 =Yes, calculated using the sample from this publication (specify values)
3 = Yes, calculated using a different sample (values and specify study)
If there is no information about reliability, but there is a reference in the description of the instrument, this
corresponds to Coding 1.
If coefficients are drawn from both this sample (coding 2) and from other studies (coding 3) in the publication,
only the coefficients of the concrete sample are to be coded.
Type of Reliability Coefficient
1 = Internal Consistency, E.g. Cronbach’s
2 = Split- Halves Reliability
3 = Test-Retest Reliability
4 = Parallel Test Reliability
5 = Mean Value of Several Coefficients
6 = No Precise Indication
99 = Other Coefficient
MPs for Reliability Coefficients
If a reliability coefficient is given, it is placed in the small table. These should be noted at each MP, for as far as
possible. If several reliability coefficients exist for a MP (eg, Cronbach's alpha and split-half coefficient), only
report Cronbach’s alpha.
If only one reliability coefficient is given for the study, cross out other MP boxes.
If a reliability coefficient is not given, but reference is made to another study, the coefficient from that study should
be provided in (beneath) the first MP box, with no number given to the MP itself.
Study
If a reliability coefficient is (or is not) stated, and reference is made to another study, the first three authors and the
year of publication of the study are stated under “Study”.

286
7 Statistical Analyses and Effect Sizes
Type of Statistics Provided: _____________________
Means, Standard Deviations, and Standard Errors
T1 N = ______ T2 N = ______ T3 N = ______ T4 N = ______
M SD SE M SD SE M SD SE M SD SE
T5 N = ______ T6 N = ______ T7 N = ______ T8 N = ______
M SD SE M SD SE M SD SE M SD SE
Coding of the Type of Statistics Provided
1 = Mean Values, Standard Deviations, Standard Errors
2 = Correlations
3 = Regression
4 = Multilevel Models
5 = Method with Latent Variables (E.g. Structural Equation Models, Latent Class Models)
6 = More Data (E.g. Averages and Correlations)
99 = Other (specify)
In this table, all the means (M), standard deviations (SD), and standard errors (SE) are given for the dependent
variable, separately for all measurement times. In addition, the sample size (for which the data refer to) is specified
for each measurement time (N = _________).
Correlations and Reliabilities
Type:
r1 N = _____ r2 N = _____ IPQ Reliability MP
_____
IPQ Reliability MP
_____
t1 t2 r p t1 t2 r p Coeff. Items Coeff. Items
Identity
Cause (generic)
Timeline (acute/chronic)
Timeline Cyclical
Consequence
Personal Control
Treatment Control
Illness Coherence
Emotional Representations

287
If correlation coefficients are provided, please include the type of correlation in the top left hand corner of the
correlation and reliabilities table.
If cause is included in the data set, provide relevant details in the Final Details box.
If bivariate correlations between different time points are reported, these can be specified here. N is the size of the
sample. At t1 and t2 place the relevant MP details. The correlation is given at r. The p-value is given at p.
If correlation coefficients are provided, regression weights do not need to be recorded.
If no correlation data is provided, this should be noted in the Final Details box and the Write to Authors box on
the front page of the coding sheet should be ticked.
IPQ reliability coefficients for one or two MPs can be entered in this table. If there is only one MP, cross out the
other MP box.
For each subscale reported, provide the relevant coefficient at Coeff., and the number of items included in that
subscale at Items.
Regressions
Time 1 Time 2
Standardised
Regression
Coefficients
Unstandardised
Regression Coefficients
Standardised
Regression
Coefficients
Unstandardised
Regression Coefficients
SE df p B SE df p SE df p B SE df p
Identity
Cause
(generic)
Timeline
(acute/chronic)
Timeline Cyclical
Consequence
Personal Control
Treatment Control
Illness Coherence
Emotional
Representations
The standardised () and unstandardised (B) regression coefficients should be reported here. In addition, the
standard error (SE), the degrees of freedom (df) and p-value (p) of the coefficient should be coded.

288
Source of Statistical Information Page: __________ Table/Graph: __________________________
In order to find the statistical information quickly, record the page number, and if applicable, the number of the
table or graph from which the information was collected. If the statistical information was taken from the text,
enter “text” here.
Moderator Variables: _______ _______ _______ _______ _______ _______ _______ Other Moderator Variables (Authors’ Term): _____________________________________________
If Moderator Variables of the relationship between Illness Perceptions and Outcomes have been examined, provide
information here.
Coding of Moderator Variables
1 = Social Support
3 = Extraversion
4 = Neuroticism
5 = Other Personality Characteristics (E.g. Optimism, Self-Esteem, etc.)
6 = Previous Experience with Depression/Anxiety
7 = Socio-Economic Status
8 = Age
9 = Number of Other Illnesses
10 = Coping Strategies
99 = Other (Specify)

289
8 Concluding Information
Time for Coding: _________ minutes
Problems/Comments: Study Interpretation:
At the end of coding an article, the time needed for encoding should be noted.
In addition, there is space for problems and comments. If information is missing, the missing information should
be listed here.
Finally, include a brief interpretation of the study in this box. This can be transcribed or taken directly from the
publication abstract.

290
Appendix 3.4 Coding sheet (Study 2)
ID No. _______________ Depression/Anxiety Type ______ DV _______
Comments on the study
Study will be Excluded Write to Authors Important Comments
General Publication Information
Article Identification Number (ID-No.): __ __ __ __ __ __ __ Study in Article: _________
Coder: ___________ Coding Date ___ / ___ / _______ Time of Day: ___________
Authors: ________________________________________________ Publication Year: _________
Title (first six words): ______________________________________________________________
Country of Origin - Author: _________ Other Origin: _______________________________
Discipline of the First Author: _________ Other Discipline: _____________________________
Publication Found In: ________ Other Place Publication Found: ________________
Type of Publication: _____ Other Publication: _______ Citations: ______ Impact: ________
Description of the Study
Study Type: _________________ IPQ or IPQ-R Dimension: _____________________________
Reliability Source: ________ Coefficient Type: ________ Number of Items: ___________
Study: _______________________________________________________________________________
If Experimental:
Number of Groups: ______
Assignment: _______
Group a: ______________
Group b: ______________
Group c: ______________
Group d: ______________
Number of Measurement Points: _________ Year of the First Data Collection: __________
Lag Between Assessments ________:
MP 2 __________________________________
MP 3 __________________________________
MP 4 __________________________________
MP 6 __________________________________
MP 7 __________________________________
MP 8 __________________________________
MP 9 __________________________________

291
Depression/Anxiety and Sample Information
Type of Sample: __________________
Dep/Anx Type: ______________________________________________________________
Dep/Anx Duration: M = ____________ SD = ________ Range from _______ to _________
Age at Onset: M = ____________ SD = ________ Range from _______ to _________
Treatment Type: ________________ Treatment Stage: __________________________
Sample Size at each Measurement Point:
MP 1 __________
MP 2 __________
MP 3 __________
MP 4 __________
MP 5 __________
MP 6 __________
MP 7 __________
MP 9 __________
Total-N: ______________ Retention Rate: _________ %
Proportion of Men at MP 1: _______ %
Age at MP 1: M = __________ SD = __________ Range from __________ to _________
Ethnicity: ____ Other Ethnicity: ____ Country of Origin: ____ Other Country of Origin: ____
Dependent Variables
No. ______ Did the Study aim to change the Dependent Variable/s? ________
DV Global: _______ DV Name: __________________________________________________
Subscale: __________________________ DV (Subscale) Type:___________________
Data Source: __________ Additional Info: ______________________________________
Instrument: Code: ____________ Number of Items: _____________
Reliability: Coefficients: MP ___ MP ___ MP ___ MP ___ MP ___ MP ___
Source: _________ Type: ________ _______ _______ _______ _______ _______ _______
Study: _______________________________________________________________________________

292
Statistical Analyses and Effect Sizes
Type of Statistics Provided: ______________________
Means, Standard Deviations, and Standard Errors
T1 N = ______ T2 N = ______ T3 N = ______ T4 N = ______
M SD SE M SD SE M SD SE M SD SE
T5 N = ______ T6 N = ______ T7 N = ______ T8 N = ______
M SD SE M SD SE M SD SE M SD SE
Correlations and Reliabilities
Type: r1 N = _____ r2 N = _____
IPQ Reliability MP _____
IPQ Reliability MP _____
t1 t2 r p t1 t2 r p Coeff. Items Coeff. Items
Identity
Cause (generic)
Timeline (acute/chronic)
Timeline Cyclical
Consequence
Personal Control
Treatment Control
Illness Coherence
Emotional Representations
Regression Coefficients
Time 1 Time 2
Standardised Regression
Coefficients
Unstandardised Regression
Coefficients
Standardised Regression
Coefficients
Unstandardised Regression
Coefficients
SE df p B SE df p SE df p B SE df p
Identity
Cause (generic)
Timeline (acute/chronic)
Timeline Cyclical
Consequence
Personal Control
Treatment Control
Illness Coherence
Emotional Representations

293
Source of Statistical Information
Page: __________ Table/Graph: __________________________
Moderator Variables
Moderator Variables: _______ _______ _______ _______ _______ _______ _______
Other Moderator Variables (Authors’ Term): _____________________________________________
Final Details
Time for Coding: _________ Minutes
Problems/Comments:
Study Interpretation:

294
Appendix 3.5 Risk of bias assessment table (Study 2)
Authors (Date) Study Design IPQ, IPQ-R, or B-IPQ: Used
as recommended
Dimensions assessed (number of
items)*
Correlation
Analysis
Adjustment for
possible confounds
Meta-Analysis or
Narrative Review
Akcakaya (2012) Longitudinal IPQ-R: Yes
- ‘depression’ substituted for
‘illness’
Timeline - Acute/Chronic (6), Timeline
- Cyclical (4), Consequences (6),
Personal Control (6), Treatment
Control (5), Illness Coherence (5),
Emotional Representations (6)
Pearson’s
Correlation
None Meta-Analysis
Baines, Wittkowski, &
Wieck (2013)
Longitudinal IPQ-R: Partially
- identity and cause scales
adapted to suit depression
- one emotional
representations item removed
- two additional answer
options included
Identity (14), Cause (21)^, Timeline -
Acute/Chronic (6), Timeline - Cyclical
(4), Consequences (6), Personal
Control (6), Treatment Control (5),
Illness Coherence (5), Emotional
Representations (5)
Spearman’s
Correlation
None Meta-Analysis
Brown, Battista, Sereika,
Bruehlman, Dunbar-
Jacob, & Thase (2007)
Cross-sectional IPQ: Partially
- modified to suit depression
- cause items were adapted
following factor analysis
Identity (23), Cause (5), Timeline (3),
Consequences (7), Controllability (7)
N/A N/A Narrative Review
Brown, Dunbar-Jacob,
Palenchar, Kelleher,
Bruehlman, Sereika, &
Thase (2001)
Cross-sectional IPQ: Partially
- modified to suit depression
- additional identity and cause
items included
Identity (23), Cause (16), Timeline
(4), Consequences (7), Controllability
(7)
Partial
Correlation
Depression Severity Meta-Analysis
Cabassa, Lagomasino,
Dwight-Johnson,
Hansen, & Xie (2008)
Cross-sectional IPQ-R: Partially
- modified to suit depression
- ‘depression’ substituted for
‘illness’
Timeline - Acute/Chronic (6), Timeline
- Cyclical (4), Consequences (6),
Personal Control (4), Treatment
Control (4)
Unspecified
Correlation
None Meta-Analysis
Elwy, Glickman,
Bokhour, Dell, Mueller,
Zhao, Osei-Bonsu,
Rodrigues, Coldwell,
Ngo, Schlosser,
Vielhauer, Pirraglia, &
Eisen (2013)
Longitudinal IPQ-R: No
- Factor analysis was
undertaken for all items to
create new subscales
Identity (23 - 5 subscales), Cause (26 -
7 subscales), Timeline - Acute (3)
Timeline - Chronic (3), Timeline -
Cyclical (3), Consequences (5),
Personal Control (7), Treatment
Control (3), External Control (4)
Illness Coherence (5), Emotional
Representations (5)
N/A N/A Narrative Review

295
Elwy, Yeh, Worcester, &
Eisen (2011)
Qualitative CSM Generally:
- Qualitative Interview
CSM Generally N/A N/A Narrative Review
Fortune, Barrowclough,
& Lobban (2004)
Cross-sectional IPQ: Yes
- ‘depression’ substituted for
‘illness’
- identity items were adapted
to suit depression
Identity (14), Cause (11)^, Timeline
(4), Consequences (7), Control/Cure
(6)
Pearson’s
Correlation
None Meta-Analysis
Glattacker, Heyduck, &
Meffert (2013)
Longitudinal IPQ-R: Yes
- ‘depression’ substituted for
‘illness’
- identity items were adapted
to suit depression
- German version
Identity (14), Timeline - Acute/Chronic
(6), Timeline - Cyclical (4),
Consequences (6), Personal Control
(6), Treatment Control (5), Illness
Coherence (5), Emotional
Representations (6)
Pearson’s
Correlation
None
Meta-Analysis
Horn, Kneisler, Schuster,
& Traue (2010)
Longitudinal IPQ-R: Yes
- German version
Cause^, Timeline - Acute/Chronic (6),
Timeline - Cyclical (4), Consequences
(6), Personal Control (6), Treatment
Control (5), Illness Coherence (5),
Emotional Representations (6)
Unspecified
Correlation
None Meta-Analysis
Houle, Villaggi,
Beaulieu, Lespérance,
Rondeau, & Lambert
(2013)
Cross-sectional IPQ-R: Yes
- ‘depression’ substituted for
‘illness’
- cause items were adapted
following factor analysis
Cause (18)^, Timeline - Acute/Chronic
(6), Timeline - Cyclical (4),
Consequences (6), Personal Control
(6), Treatment Control (5), Illness
Coherence (5), Emotional
Representations (6)
Pearson’s
Correlation
None Meta-Analysis
Hunot, Horne, Leese, &
Churchill (2007)
Longitudinal IPQ-R: Yes IPQ-R: Identity (14), Cause (18),
Timeline - Acute/Chronic (6), Timeline
- Cyclical (4), Consequences (6),
Personal Control (6), Treatment
Control (5), Illness Coherence (5),
Emotional Representations (6)
N/A N/A Narrative Review
Kelly, Sereika, Battista,
& Brown (2007)
Cross-sectional IPQ: Yes
- cause items were adapted
following factor analysis
Identity (14), Cause (23), Timeline (6),
Consequences (7), Control/Cure (7),
Emotional Reactions (9)
N/A N/A Narrative Review

296
Lu, Tang, Shan Liow,
Wei Ni Ng, Su Hui Ho,
& Chun Mun Ho (2014)
Cross-sectional IPQ-R: Partially
- modified to suit depression
Identity (14), Timeline - Acute/Chronic
(6), Timeline - Cyclical (4),
Consequences (6), Personal Control
(6), Treatment Control (5), Illness
Coherence (5), Emotional
Representations (6)
Pearson’s
Correlation
None Meta-Analysis
Mc Sharry, Bishop,
Moss-Morris, &
Kendrick (2013)
Qualitative CSM Generally:
- Qualitative Interview
CSM Generally N/A N/A Narrative Review
O'Mahen, Flynn,
Chermack, & Marcus
(2009)
Longitudinal IPQ: No
- Perinatal depression specific
items were added to several
subscales
Cause (10), Timeline (3),
Consequences (8), Control/Cure (8)
N/A N/A Narrative Review
Patel, Wittkowski, Fox,
& Wieck (2013)
Qualitative CSM Generally:
- Qualitative Interview
CSM Generally N/A N/A Narrative Review
Vollmann, Scharloo,
Salewski, Dienst,
Schonauer, & Renner
(2010)
Cross-sectional IPQ-R: Partially
- modified to suit depression
- identity and cause scales
adapted to suit depression
Identity (24)^, Cause (19), Timeline -
Acute/Chronic (6), Timeline - Cyclical
(4)^, Consequences (6), Personal
Control (6), Treatment Control (5),
Illness Coherence (5), Emotional
Representations (6)
Profile
Correlation
None Meta-Analysis
Ward, Mengesha, & Issa
(2014)
Qualitative CSM Generally:
- Qualitative Interview
CSM Generally N/A N/A Narrative Review
Note: *Dimensions that appear are in bold were assessed by authors but not reported by authors for some outcomes; ^ = items were measured but not assessed

297
Appendix 3.6 Risk of bias assessment and figure (Study 2)
Study
Risk of Bias from
IPQ Use (Yes vs.
Partially vs. No)
Risk of Bias from
Design (Cross-sectional
vs. Longitudinal)
Adjustment for
Confounds (Yes
vs. No)
Assessing and Reporting of IPQ Dimensions
(Assessed and Reported vs. Assessed and Not
Reported vs. Measured and Not Assessed)
- Akcakaya (2012) 1 1 2 1
- Baines, Wittkowski, & Wieck
(2013)
2 1 2 3
- Brown, Battista, Sereika,
Bruehlman, Dunbar-Jacob, &
Thase (2007)
2 2 2 1
- Brown, Dunbar-Jacob,
Palenchar, Kelleher, Bruehlman,
Sereika, & Thase (2001)
2 2 1 2
- Cabassa, Lagomasino, Dwight-
Johnson, Hansen, & Xie (2008)
2 2 2 1
- Elwy, Glickman, Bokhour,
Dell, Mueller, Zhao, Osei-
Bonsu, Rodrigues, Coldwell,
Ngo, Schlosser, Vielhauer,
Pirraglia, & Eisen (2013)
3 1 2 1

298
- Elwy, Yeh, Worcester, & Eisen
(2011)
3 3 2 1
- Fortune, Barrowclough, &
Lobban (2004)
1 2 2 3
- Glattacker, Heyduck, &
Meffert (2013)
1 1 2 1
- Horn, Kneisler, Schuster, &
Traue (2010)
1 1 2 3
- Houle, Villaggi, Beaulieu,
Lespérance, Rondeau, &
Lambert (2013)
1 2 2 3
- Hunot, Horne, Leese, &
Churchill (2007)
1 1 2 1
- Kelly, Sereika, Battista, &
Brown (2007)
1 2 2 1
- Lu, Tang, Shan Liow, Wei Ni
Ng, Su Hui Ho, & Chun Mun
Ho (2014)
2 2 2 1
- Mc Sharry, Bishop, Moss-
Morris, & Kendrick (2013)
3 3 2 1

299
- O'Mahen, Flynn, Chermack, &
Marcus (2009)
3 1 2 1
- Patel, Wittkowski, Fox, &
Wieck (2013)
3 3 2 1
- Vollmann, Scharloo, Salewski,
Dienst, Schonauer, & Renner
(2010)
2 2 2 3
- Ward, Mengesha, & Issa
(2014)
3 3 2 1
Key:
1 = Yes used IPQ
as recommended
1 = Longitudinal 1 = Adjusted for
Confounds
1 = Assessed and Reported all measured IPQ
Dimensions
2 = Partially used
IPQ as
recommended
2 = Cross-Sectional 2 = Did not adjust
for Confounds
2 = Assessed but did not Report all measured
IPQ Dimensions
3 = Did not use
IPQ as
recommended (or
qual study)
3 = Qualitative 3 = Did not Assess nor Report all measured IPQ
Dimensions

300
Scores:
Risk of Bias from
IPQ Use
Risk of Bias from
Design
Risk of Bias from
Confounds
Risk of Bias from IPQ Assessing and Reporting
Low 36.84210526 36.84211 5.263158 68.4211
Medium 31.57894737 42.10526 94.73684 5.26316
High 31.57894737 21.05263 0 26.3158

301
Appendix 3.7 Meta-analysis forest plots between illness representations and coping and illness representations and psychological distress (Study
2)
Note: See page 302 for the key to each study code.
Figure 1. Coping and Cause Figure 2. Coping and Acute/Chronic Timeline Figure 3. Coping and Consequences
Figure 4. Coping and Personal Control Figure 5. Coping and Treatment Control Figure 6. Coping and Illness Coherence

302
Figure 7. Coping and Emotional Representations Figure 8. Psychological Distress and Identity Figure 9. Psychological Distress and Acute/Chronic Timeline
Figure 10. Psychological Distress and Cyclical Timeline Figure 11. Psychological Distress and Consequences Figure 12. Psychological Distress and Personal Control
Figure 13. Psychological Distress and Treatment Control Figure 14. Psychological Distress and Illness Coherence Figure 15. Psychological Distress and Emotional Representations

303
Study codes with associated authors and dates
Study Code Authors (Date)
ACK12XX Akcakaya (2012)
BAI13WI Baines, Wittkowski, & Wieck (2013)
BRO01DU Brown, Dunbar-Jacob, Palenchar, Kelleher, Bruehlman, Sereika, & Thase (2001)
CAB08LA Cabassa, Lagomasino, Dwight-Johnson, Hansen, & Xie (2008)
FOR04BA Fortune, Barrowclough, & Lobban (2004)
GLA13HE Glattacker, Heyduck, & Meffert (2013)
HOR10KN Horn, Kneisler, Schuster, & Traue (2010)
HOU13VI Houle, Villaggi, Beaulieu, Lespérance, Rondeau, & Lambert (2013)
LUX14TA Lu, Tang, Shan Liow, Wei Ni Ng, Su Hui Ho, & Chun Mun Ho (2014)
VOL10SC Vollmann, Scharloo, Salewski, Dienst, Schonauer, & Renner (2010)

304
Appendix 3.8 Meta-analysis funnel plots between illness representations and coping and illness representations and psychological distress
(Study 2)
Figure 1. Coping and Cause Figure 2. Coping and Acute/Chronic Timeline Figure 3. Coping and Consequences
Figure 4. Coping and Personal Control Figure 5. Coping and Treatment Control Figure 6. Coping and Illness Coherence

305
Figure 7. Coping and Emotional Representations Figure 8. Psychological Distress and Identity Figure 9. Psychological Distress and Acute/Chronic Timeline
Figure 10. Psychological Distress and Cyclical Timeline Figure 11. Psychological Distress and Consequences Figure 12. Psychological Distress and Personal Control
Figure 13. Psychological Distress and Treatment Control Figure 14. Psychological Distress and Illness Coherence Figure 15. Psychological Distress and Emotional Representations

306
Appendix 4.1 Interview guide (Study 3 and Study 4)
Interviewee Number and Codes:
Interviewer:
Introductory Information:
Introductions are made…
Information Sheet
Consent Forms
Before we get started I would like to ask you if you have any issues with the recording of
today’s interview. The recording of the interview is important so that all relevant information
can be documented. After I have completed interviewing I will be transcribing the audio
tapes into a written format. Please be advised that following this transcription all audio tapes
will be destroyed and transcripts will be coded to preserve anonymity.
Interviewee Background and Demographics:
I would now like you to fill out this short questionnaire which asks you some general
information about yourself and your illnesses.
There are some questions about your illness in the questionnaire that we might revisit later in
the interview.
[NOTE: The indented questions are follow-up questions and don’t need to be asked if
participants already talked about this content]

307
Questions:
Can you tell me about your health?
Cancer Related Questions:
Could you please tell me about your cancer?
Perhaps you could start by telling me when and how you were diagnosed with cancer?
How did you feel when you first found out you had cancer?
Did being diagnosed and given the label of cancer help?
Could you describe/explain your cancer to me?
Do you feel you have a good understanding of cancer?
Does your illness ‘make sense’ to you?
Can you tell me about the symptoms of your cancer?
Do you have any thoughts about what may have caused your cancer?
What are these?
Do you perceive your cancer to be an acute (short-term), chronic (long-term), or cyclic
(comes and goes) condition?
In the past and in the future
What do you perceive to be the consequences of your cancer?
How does cancer impact your life (every-day life)?
How has cancer changed your life?
Does it affect your career/relationships?
What can be done to help your cancer (if anything)?
How much control do you feel you have over your cancer?
How much control do you feel others have over your cancer?

308
How much worry or stress does your cancer cause you?
What do you do to treat your cancer? What treatment have you received in the past and what
treatment are you currently receiving?
How much control do you feel your treatment has over your cancer?
How much control do you feel you have over your treatment?
How easy or difficult do you find it to adhere to your treatment regime and/or
medication requirements?
What do you do to cope with your cancer?
What coping strategies do you use? (Practical? Social Support?)
Is there anything else you would like to tell me about your cancer?
Anxiety Related Questions:
Are you currently or have you ever been diagnosed or treated for anxiety?
When and how were you diagnosed with or treated for anxiety?
How did you feel when you first found out you had anxiety?
Did being diagnosed and given the label of anxiety help?
Could you describe/explain your anxiety to me?
Do you feel you have a good understanding of anxiety?
Does your illness ‘make sense’ to you?
Can you tell me about the symptoms of your anxiety?
Do you have any thoughts about what may have caused your anxiety?
What are these?
Do you perceive your anxiety to be an acute (short-term), chronic (long-term), or cyclic
(comes and goes) condition?
In the past and in the future

309
What do you perceive to be the consequences of your anxiety?
How does anxiety impact your life (every-day life)?
How has anxiety changed your life?
Does it affect your career/relationships?
What can be done to help your anxiety (if anything)?
How much control do you feel you have over your anxiety?
How much control do you feel others have over your anxiety?
How much worry or stress does your anxiety cause you?
What do you do to treat your anxiety? What treatment have you received in the past and what
treatment are you currently receiving?
How much control do you feel your treatment has over your anxiety?
How much control do you feel you have over your treatment?
How easy or difficult do you find it to adhere to your treatment regime and/or
medication requirements?
What do you do to cope with your anxiety?
What coping strategies do you use? (Practical? Social Support?)
Is there anything else you would like to tell me about your anxiety?
Depression Related Questions:
Are you currently or have you ever been diagnosed or treated for depression?
When and how were you diagnosed with or treated for depression?
How did you feel when you first found out you had depression?
Did being diagnosed and given the label of depression help?
Could you describe/explain your depression to me?

310
Do you feel you have a good understanding of depression?
Does your illness ‘make sense’ to you?
Can you tell me about the symptoms of your depression?
Do you have any thoughts about what may have caused your depression?
What are these?
Do you perceive your depression to be an acute (short-term), chronic (long-term), or cyclic
(comes and goes) condition?
In the past and in the future
What do you perceive to be the consequences of your depression?
How does depression impact your life (every-day life)?
How has depression changed your life?
Does it affect your career/relationships?
What can be done to help your depression (if anything)?
How much control do you feel you have over your depression?
How much control do you feel others have over your depression?
How much worry or stress does your depression cause you?
What do you do to treat your depression? What treatment have you received in the past and
what treatment are you currently receiving?
How much control do you feel your treatment has over your depression?
How much control do you feel you have over your treatment?
How easy or difficult do you find it to adhere to your treatment regime and/or
medication requirements?
What do you do to cope with your depression?
What coping strategies do you use? (Practical? Social Support?)
Is there anything else you would like to tell me about your depression?

311
Other Chronic Illness Related Questions:
Please tell me about any other health conditions you have
When was the condition diagnosed?
Are you receiving treatment for that condition?
What kind of treatment are you receiving?
What do you do to cope with these other illnesses?
What coping strategies do you use? (Practical? Social Support?)
Multimorbidity and Other Questions:
How have your thoughts about your health changed over time?
What is it like for you to have both cancer and anxiety?
Do you think one affects (or even caused) the other?
Does having both make things better or worse?
How does having both conditions affect your medication or treatment adherence?
Is one more challenging than another?
Would you prioritise one condition over another?
What is it like for you to have both cancer and depression?
Do you think one affects (or even caused) the other?
Does having both make things better or worse?
Is one more challenging than another?
Would you prioritise one condition over another?

312
What is it like for you to have cancer, anxiety and depression?
Do you think one affects (or even caused) the other?
Does having all three make things better or worse?
Is one more challenging than another?
Would you prioritise one condition over another?
What is it like for you to have a number of different health conditions?
Do they affect (or even cause) each other?
Does having multiple health conditions make things better or worse?
Is one more challenging than another?
Would you prioritise one condition over another?
Is there anything else you would like to tell me about?

Appendix 4.2 COREQ checklist (Study 3) 313
COREQ (COnsolidated criteria for REporting Qualitative research) Checklist A checklist of items that should be included in reports of qualitative research. You must report the page number in your manuscript
where you consider each of the items listed in this checklist. If you have not included this information, either revise your manuscript
accordingly before submitting or note N/A.
Topic Item No. Guide Questions/Description Reported on
Page No.
Domain 1: Research team
and reflexivity
Personal characteristics
Interviewer/facilitator 1 Which author/s conducted the interview or focus group? 82-83 Credentials 2 What were the researcher’s credentials? E.g. PhD, MD 83 Occupation 3 What was their occupation at the time of the study? 83 Gender 4 Was the researcher male or female? 83 Experience and training 5 What experience or training did the researcher have? 83 Relationship with
participants
Relationship established 6 Was a relationship established prior to study commencement? 82 Participant knowledge of
the interviewer
7 What did the participants know about the researcher? e.g. personal
goals, reasons for doing the research 82
Interviewer characteristics 8 What characteristics were reported about the inter viewer/facilitator?
e.g. Bias, assumptions, reasons and interests in the research topic 82
Domain 2: Study design
Theoretical framework
Methodological orientation
and Theory
9 What methodological orientation was stated to underpin the study? e.g.
grounded theory, discourse analysis, ethnography, phenomenology,
content analysis
83
Participant selection
Sampling 10 How were participants selected? e.g. purposive, convenience,
consecutive, snowball 81
Method of approach 11 How were participants approached? e.g. face-to-face, telephone, mail,
email 82
Sample size 12 How many participants were in the study? 84 Non-participation 13 How many people refused to participate or dropped out? Reasons? 84 Setting
Setting of data collection 14 Where was the data collected? e.g. home, clinic, workplace 83 Presence of non-
participants
15 Was anyone else present besides the participants and researchers? 83
Description of sample 16 What are the important characteristics of the sample? e.g. demographic
data, date
84, Table 4.1, App 4.3
Data collection
Interview guide 17 Were questions, prompts, guides provided by the authors? Was it pilot
tested? 82, App 4.1
Repeat interviews 18 Were repeat inter views carried out? If yes, how many? N/A Audio/visual recording 19 Did the research use audio or visual recording to collect the data? 83 Field notes 20 Were field notes made during and/or after the interview or focus group? 83 Duration 21 What was the duration of the inter views or focus group? 83 Data saturation 22 Was data saturation discussed? 82 Transcripts returned 23 Were transcripts returned to participants for comment and/or 83

314
Topic Item No. Guide Questions/Description Reported on
Page No.
correction? Domain 3: analysis and
findings
Data analysis
Number of data coders 24 How many data coders coded the data? 84 Description of the coding
tree
25 Did authors provide a description of the coding tree? 84, 86, Figure 4.1
Derivation of themes 26 Were themes identified in advance or derived from the data? 83-84 Software 27 What software, if applicable, was used to manage the data? 83 Participant checking 28 Did participants provide feedback on the findings? 84 Reporting
Quotations presented 29 Were participant quotations presented to illustrate the themes/findings?
Was each quotation identified? e.g. participant number 86, 88-96
Data and findings consistent 30 Was there consistency between the data presented and the findings? 86-103 Clarity of major themes 31 Were major themes clearly presented in the findings? 84, 86-96 Clarity of minor themes 32 Is there a description of diverse cases or discussion of minor themes? 86-96
Developed from: Tong A, Sainsbury P, Craig J. Consolidated criteria for reporting qualitative research (COREQ): a 32-item
checklist for interviews and focus groups. International Journal for Quality in Health Care. 2007. Volume 19, Number 6: pp. 349
– 357

315
Appendix 4.3 Demographics and DASS-21 Stress subscale scores (Study 3)
Characteristic Characteristic Sub-Categories N (%)
Country of Birth Australia 16 (76.2%)
New Zealand 1 (4.8%)
United Kingdom 4 (19.0%)
Education (highest level obtained) Year 9 or Below 1 (4.8%)
Year 10 2 (9.5%)
Year 12 2 (9.5%)
Certificate 5 (23.8%)
Diploma 3 (14.3%)
Undergraduate Degree 5 (23.8%)
Post-Graduate Degree 3 (14.3%)
Employment Status Paid Full-Time Work 2 (9.5%)
Paid Part-Time Work 2 (9.5%)
Paid Casual Work 2 (9.5%)
Retired 6 (28.6%)
Not Working Due to Health 6 (28.6%)
Job Seeker 1 (4.8%)
Other 2 (9.5%)
Relationship Status Married 10 (47.6%)
Divorced 1 (4.8%)
Separated 1 (4.8%)
De-facto Relationship 4 (19.0%)
Single 5 (23.8%)
DASS-21 Subscale Subscale Ratings N (%)
Stress Normal 4 (19.0%)
Mild 0 (0.0%)
Moderate 1 (4.8%)
Severe 8 (38.1%)
Extremely Severe 8 (38.1%)

316
Appendix 5.1 Additional methodological information (Study 4)
Information power was used to determine the sample size for this study (Malterud,
Siersma, Guassora, 2015). It provides clear criteria for ascertaining appropriate sample sizes
in qualitative research while addressing some of the limitations associated with the use of
saturation (Glaser & Strauss, 2009; Malterud et al., 2015). The sample size for this study was
ascertained based on its neither especially broad nor narrow aims, the inclusion of
participants specific to the research aim (based on meeting inclusion criteria), strong rapport
and interview dialogue between ER and participants (due to a strong knowledge of the
theoretical background and previous experience working with cancer patients), and the use of
cross-case analysis.
Following recruitment and meeting of recruitment criteria, participants were invited to
participate in the study. Participants were informed of the purpose of the study, as well as the
researchers’ reasons for completing it (to increase understanding of cancer patients’ thoughts
and experiences with a view to improving support service provision) at this early stage.
Relationships were generally not established prior to study commencement, though six
participants were known to the interviewer through support work with Cancer Council
Tasmania. Field notes were not taken during interviews to maintain rapport and trust between
interviewer and participant. Further, although participants were not offered a chance to
review transcripts or provide feedback on identified themes, they were given an opportunity
to request to be sent any research output or publications arising from the research.
References
Glaser, B. G., & Strauss, A. L. (2009). The discovery of grounded theory: Strategies for
qualitative research. Aldine Transaction, New Brunswick, USA

317
Malterud, K., Siersma, V. D., & Guassora, A. D. (2015). Sample size in qualitative interview
studies: Guided by information power. Qualitative Health Research, 26, 1753-1760.
doi: 10.1177/1049732315617444

Appendix 5.2 COREQ checklist (Study 4) 318
COREQ (COnsolidated criteria for REporting Qualitative research) Checklist A checklist of items that should be included in reports of qualitative research. You must report the page number in your manuscript
where you consider each of the items listed in this checklist. If you have not included this information, either revise your manuscript
accordingly before submitting or note N/A.
Topic Item No. Guide Questions/Description Reported on
Page No.
Domain 1: Research team
and reflexivity
Personal characteristics
Interviewer/facilitator 1 Which author/s conducted the interview or focus group? 109 Credentials 2 What were the researcher’s credentials? E.g. PhD, MD 109 Occupation 3 What was their occupation at the time of the study? 109 Gender 4 Was the researcher male or female? 109 Experience and training 5 What experience or training did the researcher have? 109 Relationship with
participants
Relationship established 6 Was a relationship established prior to study commencement? App 5.1 Participant knowledge of
the interviewer
7 What did the participants know about the researcher? e.g. personal
goals, reasons for doing the research App 5.1
Interviewer characteristics 8 What characteristics were reported about the inter viewer/facilitator?
e.g. Bias, assumptions, reasons and interests in the research topic 109, App 5.1
Domain 2: Study design
Theoretical framework
Methodological orientation
and Theory
9 What methodological orientation was stated to underpin the study? e.g.
grounded theory, discourse analysis, ethnography, phenomenology,
content analysis
109
Participant selection
Sampling 10 How were participants selected? e.g. purposive, convenience,
consecutive, snowball 108
Method of approach 11 How were participants approached? e.g. face-to-face, telephone, mail,
email 108
Sample size 12 How many participants were in the study? 110-111 Non-participation 13 How many people refused to participate or dropped out? Reasons? 110-111 Setting
Setting of data collection 14 Where was the data collected? e.g. home, clinic, workplace 109 Presence of non-
participants
15 Was anyone else present besides the participants and researchers? 109
Description of sample 16 What are the important characteristics of the sample? e.g. demographic
data, date
110-113, Table 5.2
Data collection
Interview guide 17 Were questions, prompts, guides provided by the authors? Was it pilot
tested? 108, App 4.1
Repeat interviews 18 Were repeat inter views carried out? If yes, how many? N/A Audio/visual recording 19 Did the research use audio or visual recording to collect the data? 109 Field notes 20 Were field notes made during and/or after the interview or focus group? App 5.1 Duration 21 What was the duration of the interviews or focus group? 109 Data saturation 22 Was data saturation discussed? 108, App 5.1 Transcripts returned 23 Were transcripts returned to participants for comment and/or App 5.1

319
Topic Item No. Guide Questions/Description Reported on
Page No.
correction? Domain 3: analysis and
findings
Data analysis
Number of data coders 24 How many data coders coded the data? 109-110 Description of the coding
tree
25 Did authors provide a description of the coding tree? 113-114, Figure 5.1
Derivation of themes 26 Were themes identified in advance or derived from the data? 109 Software 27 What software, if applicable, was used to manage the data? 109 Participant checking 28 Did participants provide feedback on the findings? App 5.1 Reporting
Quotations presented 29 Were participant quotations presented to illustrate the themes/findings?
Was each quotation identified? e.g. participant number 113, 115-117
Data and findings consistent 30 Was there consistency between the data presented and the findings? 113-121 Clarity of major themes 31 Were major themes clearly presented in the findings? 113-117 Clarity of minor themes 32 Is there a description of diverse cases or discussion of minor themes? 113, 115-117
Developed from: Tong A, Sainsbury P, Craig J. Consolidated criteria for reporting qualitative research (COREQ): a 32-item
checklist for interviews and focus groups. International Journal for Quality in Health Care. 2007. Volume 19, Number 6: pp. 349
– 357