
If rhyme of history holds, a market correction is likely ... - ONGC
12
................BM-BME CM YK SUNDAY • SEPTEMBER 19, 2021 MUMBAI ₹10 • Pages 12 Volume 28 • Number 260 BENGALURU CHENNAI COIMBATORE HUBBALLI HYDERABAD KOCHI KOLKATA MADURAI MALAPPURAM MANGALURU MUMBAI NOIDA THIRUVANANTHAPURAM TIRUCHIRAPALLI TIRUPATI VIJAYAWADA VISAKHAPATNAM INSIDE BIG STORY P2 Bitcoin bait To join or not to join... Here are key facts that will help you take a call about cryptocurrency trading FUND INSIGHT P4 Safety net We analyse two new target maturity fund offerings that will help fixed income investors CHART GAZING P7 Index outlook With stock indices retreating from their record highs, here is a technical view that can add edge to your trading strategy HARI VISWANATH .......................................... BL Research Bureau Mark Twain didn’t have much to do with stock mar- kets. But market parti- cipants during times of crashes and recovery fre- quently resort to his famous quote: ‘History never re- peats itself, but it does often rhyme.’ Well, Sensex of 2006-07 and Nifty of 2020-21 do seem to rhyme. The fact that Nifty in February/March 2020 was around the same 12,000 levels at which Sensex was in April/May 2006 is just the starting point of this similarity. In lock-step By May 2006, Sensex had had the run of its life. From a post dotcom bust bear mar- ket low of around 2,600 in September 2001, the index had given CAGR returns of 37 per cent to reach an all- time high of 12,671 by May 2006. What followed was a stunning reversal starting May 18 triggered by US infla- tion data/rate increase and sudden fall in metal prices. In a little over a month, the benchmark index had cor- rected by 30 per cent. Sounds a bit familiar, doesn’t it? The Nifty index, after reaching record high of 12,430 in January 2020 (similar to Sensex highs in 2006) and hovering above 12,000 till mid-February 2020, had as stunning a crash over the next month as fears of a Covid-driven economic crisis engulfed the world. What transpired in both the indices following the short bearish phase was a marathon rally lasting 18 months. While the Nifty of today is up 131 per cent in the 18 months from its March 2020 lows, the Sensex then was up a near matching 125 per cent from its June 2006 lows in 18 months. Fundamentals contrast However, the underlying factors behind the rally at both times are a study in contrast. The years leading to FY07 were a period of ac- celerating economic growth for India while in FY21 reces- sion stared at us, with GDP contracting 7.3 per cent. The global economy, too, witnessed one of its best phases of economic expan- sion since the Second World War (WW2) between 2003 and 2007 and saw the worst recession since WW2 in 2020. Concerns that the eco- nomy could overheat led to central banks increasing in- terest rates then. In con- trast, heading into the slump of March 2020, the global economy was dealing with a decade of low eco- nomic growth, low inflation and declining interest rates. Quantitative easing (QE) was only a theoretical concept in 2006-07, while the massive QE driven mon- etary stimulus by global central banks is the factor driving markets today. Corporate earnings were booming then with Sensex earnings CAGR at around 25 per cent in the five years into 2007. The Nifty earnings CAGR in the five years into 2021 were a paltry 5 per cent. The Sensex trailing PE was at 21 times then versus the Nifty trailing PE of around 30 times now. The index leadership then was from Power/Infra and Real Estate stocks with blue chip IT services companies underperforming and giv- ing negative absolute re- turns in 2007 due to worries from the impact of the signi- ficant rupee appreciation that year. In contrast, IT services companies have been lead- ers in the current bull run although ironically their revenue/earnings growth now is much lower than in 2007. There were, however, a few similarities, the most in- teresting being the boom in US housing prices during both these times. The record number of IPOs and the frenzy around it as well as the bull run in commodities is another similarity. What awaits? Probably what has panned out so far is just a coincid- ence. However, if the rhyme of history continues, then a significant correction is likely. Remember 2008? That said, when it comes to markets, one can only deal in terms of probabilit- ies and not certainties. All-time high valuations and the fact that the global economy is today depend- ent on monetary and fiscal stimulus that may not con- tinue forever, do imply that there are risks to the current rally. If rhyme of history holds, a market correction is likely Nifty of 2020-21 has shades of Sensex of 2006-07, but fundamentals today are starkly different KV KURMANATH .......................................... Hyderabad, September 18 What started as a small ex- periment by a 14-year-old girl has caught the atten- tion of T Works, an elec- tronic hardware start-up incubator, resulting in the development of a machine that can churn out 500 biodegradable pots for use in nurseries. A Srija of Gadwal was quite upset about black plastic bags being used at the plantation drive at her school last year. She went home, got some groundnut shells and prepared a dough with them to make a pot to keep the saplings. Her work, presented in some exhibitions, caught the attention of Telangana State Innovation Council (TSIC), which in turn re- ferred it to T Works. “The key task before us was to build a machine, the best mix and the best temperature at which it should be baked in the mould. “We helped her in struc- tured experiments to find out the best combination,” Anand Rajagopalan, Dir- ector (Operations) of T Works, told BusinessLine. “We zeroed in on three mixes and three temperat- ures. We built a robust ma- chine that doesn’t require any maintenance. Besides, the mould mounted in the machine (named Biopress 4T) can churn out lakhs of pots. And, the moulds can come in different shapes,” he said. Open source tech Not only will the biopot help civic bodies get rid of plastic bags at nurseries, it will nourish the saplings as the mix contains fertil- ising groundnut shells, tamarind seed powder and other proprietary ma- terial developed by Srija. Now that a machine is ready to manufacture the pots, T Works has decided not to go for patenting the technology. “We are going to make it open sourced to de- velopers,” he said. T Works, however, will help the girl seek a patent on the proprietary mix. “We worked closely with Srija and her mentor Au- gustine to design and fab- ricate a machine capable of churning out biopots in large numbers. Their in- put was critical to design- ing a machine that can be used in a village setting, for example by self-help groups,” Sujai Karampuri, Chief Executive Officer of T Works, said. The moulds, developed by Srija, could find a place in the Telangana govern- ment’s mass greenery pro- gramme – Telangana ku Haritaharam. “We will aim at skilling the self-help group com- munities for large-scale production of pots,” Shanta Thoutam, Chief In- novation Officer, Govern- ment of Telangana, said. ‘Biopot’ — Invented by a school girl, nurtured by T Works The 14-year-old’s idea of replacing plastic bags in nurseries will be scaled up by the start-up incubator Biopress 4T developed by T Works that can produce 500 biodegradable nursery pots a day. KEERTHI SANAGASETTI .......................................... BL Research Bureau The housing finance in- dustry is experiencing tailwinds from low in- terest rates, and govern- ment (Central and State) stimulus measures. With their presence in non-metro cities and semi-urban or rural areas, housing finance compan- ies (HFCs) are set to bene- fit better from this tide, given the push for afford- able housing. Can Fin Homes, pro- moted by Canara Bank, and in existence for three decades, is one such HFC. Banking on its pres- ence in Tier-2 and -3 cities, Can Fin Homes has grown its loan book at a CAGR of 18 per cent from FY15 to FY21 to ₹22,105 crore. With a focus on hous- ing loans (90 per cent of loan book) and on salar- ied customers (73 per cent of loan book), the company has been able to maintain healthy yields of over 9 per cent on its loan book, until FY21. Besides, with a much granular loan book (aver- age ticket size of ₹20 lakh in FY21), and near-zero ex- posure to builder loans (0.03 per cent of loan book), Can Fin Homes has also been able to contain its bad loans. The gross non-performing assets of the company remained at less than one per cent of the loan book, even dur- ing the pandemic — 0.76 per cent in FY20 and 0.91 per cent in FY21. The stock traded at 3.22 times its book value as of June 2021, which is at a 21 per cent premium to its three-year average. Long-term investors can, hence, accumulate the stock on dips. Can Fin Homes - Accumulate touted Lal as the turnaround man of Royal Enfield brand. Makarand Joshi, founding partner, MMJC and Associates LLP, says Eicher Motors in- vestors had no problem with Lal’s reappointment, but did not approve the resolution on salary hike, indicating a vi- brant shareholder activism taking shape in India. Wake-up call It is a wake-up call for board members and C-suite execut- ives to effectively play the role of trusteeship and avoid ex- tending unreasonable finan- cial support to group compan- ies, he added. Nevertheless, Eicher Motors reappointed Lal as Managing Director with a maximum salary cap of 1.5 per cent of profit subject to postal ballot SURESH P IYENGAR .......................................... Mumbai, September 18 Right from rejecting salary hikes for managing directors to striking down promoters’ plans to delist their compan- ies, shareholder activism has never been as robust. Even as promoters move to reward top honchos with hefty pay rises for steering their companies through the Covid crisis, investors want the bosses to also moderate their expectations in case of a disap- pointing performance. For instance, shareholders of Eicher Motors, makers of the iconic Royal Enfield motor- cycle, rejected the special resol- ution to reappoint Siddhartha Lal as Managing Director with a huge salary hike. Never mind that not long back, they had approval by shareholders. Last fiscal, Lal had drawn ₹21.12 crore as salary, including commission and perquisites, while Vinod K Dasari, who stepped down as Chief Execut- ive Officer of Royal Enfield and Executive Director of Eicher Motors from August 13, 2021, took home ₹25.37 crore without a share in profits. Justifying Lal’s reappoint- ment, S Sandilya, Chairman, Eicher Motors, said that when Lal took over as CEO of Royal Enfield in 2000, the division was making huge losses and was slated for closure. He had indeed turned around the brand. But the pandemic played spoilsport, and motor- cycle maker’s profit dipped 30 per cent to ₹1,330 crore last fiscal. Good for retail investors At a recent summit, SEBI chair- man Ajay Tyagi had said that shareholder activism is not bad as long as it protects the in- terest of retail investors. Allcargo Logistics had to drop the plan to delist after shareholders resisted the pro- posal tooth and nail. In August last year, promoters of Allcargo Logistics felt it would be diffi- cult to raise growth capital without going private. After shareholders’ resistance, the promoters withdrew their plan. While shareholders flexing muscles is good to an extent, any delay in taking the right decision can lead to a serious erosion in value and job losses. Unlike others, IT giant Wipro managed to overcome share- holder activism by reappoint- ing Patrick Ennis and Patrick Dupuis as independent direct- ors despite proxy advisors ask- ing shareholders to vote against the proposal. But Balaji Telefilms was not as lucky as investors rejected the proposed salary hike of Ekta Kapoor (Joint Managing Director) and her mother Shobha (Managing Director) and capped the commission in absolute amount. Mohit Saraf, Founder and Managing Partner, Saraf & Part- ners, said the country has seen some sparkling success stories in shareholder activism with the regulatory architecture de- signed to ensure certain checks and balances on the powers of the promoters. How shareholder activism has hit a high in India A robust ecosystem is developing to keep promoter powers in check While shareholders flexing muscles is good, any delay in taking the right decision can lead to erosion in value and job losses OUR BUREAU .......................................... New Delhi, September 18 Punjab Chief Minister Am- arinder Singh resigned on Saturday even as the Con- gress strained to find a suc- cessor to the ‘Captain’ ahead of the Assembly polls next year. Amarinder Singh main- tained that he had been “hu- miliated” by the Congress, while party sources said he was increasingly becoming unpopular and had also ruffled feathers by reportedly requesting the party high command to drop as many as 60 sitting MLAs in the next elections. Top contenders Among the successors being considered were senior lead- ers Pratap Singh Bajwa, Sukhjinder Singh Randhawa, Ravneet Singh Bittu and Sunil Jhakar. While Amarinder Singh has quit as CM, chances of him remaining with the Con- gress are slim although he himself maintained that he is still with the party. “As far as my future politics is concerned, there is always an option and I will use that option when time comes. I am in the Congress party. I will talk to my supporters and decide the future course of politics,” he said. Amarinder Singh is re- portedly considering form- ing a new party. He had formed Shiromani Akali Dal (Panthic) in the 1990s before merging it with the Congress. The Congress Legislative Party met in the evening after Amarinder Singh submitted his resignation to Governor Banwarilal Purohit. AICC gen- eral secretary in-charge of the State, Harish Rawat, told reporters that the CLP meet- ing passed a resolution ask- ing party President Sonia Gandhi to find a new leader. Fissures in the party With Amarinder Singh’s de- parture, the fissures in the Congress have now come to the fore. The high command believes replacing Am- arinder Singh is the only way the Congress can rescue an election that is becoming dif- ficult although Congress is in pole position in the State fol- lowing the farmers’ agitation against the three farm laws. The BJP and the Shiromani Akali Dal are discredited and the Aam Aadmi Party — which had won 19 seats in the 117- member Assembly in the 2017 elections — does not have the organisational structure or a CM candidate. ‘Humiliated’, Amarinder quits as Punjab CM Punjab CM Amarinder Singh OUR BUREAU .......................................... New Delhi, September 18 “India administers 80 crore vaccine doses,” Health Minis- ter Mansukh Mandaviya tweeted on Saturday, a day after the country clocked its highest 24-hour vaccination tally of 2.5 crore jabs. Breaking it down, he said, India took 85 days to get to 10 crore vaccinations, an- other 45 days to get from 10 to 20 crore, 29 days to touch 30 crore, 24 to get to 40 crore, 20 days to reach 50 crore, 19 to 60 crore, and 13 days to touch 70 crore. From 70 crore to 80 crore vaccina- tions, it took only 11 days, he tweeted. The 80-crore vaccination milestone also got a mention from Soumya Swaminathan, Chief Scientist with the World Health Organization. Vax break-up In fact, Saturday also saw a good run at vaccination centres, with close to 83 lakh doses being administered till 8.30 pm. A lion’s share of the jabs were administered at the 62,249 government-run sites, while about 3,721 private sites also contributed to the day’s tally. Maharashtra led with over 13 lakh shots and West Bengal did over 12 lakh. Madhya Pra- desh administered over 6 lakh doses and Uttar Pradesh 5 lakh plus. The development comes even as Cabinet Secretary Rajiv Gauba chaired a high- level meeting to review Covid-19 management and response strategies across the country. Concerns remain Pointing out that there was no room for complacency, he referred to the experience of other countries that had seen multiple peaks of Covid-19 and expressed con- cern over certain pockets in India reporting high test pos- itivity. State Health adminis- trators were urged to under- take granular analysis of their Covid trajectory, ramp up the health infrastructure, stock up on essential medi- cines and augment human resources at the earliest, to meet any potential surge in cases. At the meeting, the Health Secretary pointed out that 70 districts in 15 States were a cause for concern as 34 of them had a positivity of over 10 per cent and in 36 dis- tricts, it was in the 5-10 per cent range. With the festival season coming up, he directed the States to ensure precautions and effective enforcement to avoid mass gatherings and congested closed spaces. Also, he said, funds had been released to all States and Union Territories under the Emergency COVID Re- sponse Package, and urged them to use it. India’s vaccination count crosses 80-cr mark; over 80 lakh today However, Cabinet Secretary Rajiv Gauba sounds caution on Covid Regd. TN/ARD/14/09-11, RNI No. 55320/94
-
Upload
khangminh22 -
Category
Documents
-
view
1 -
download
0
Transcript of If rhyme of history holds, a market correction is likely ... - ONGC

................BM-BMECMYK
SUNDAY • SEPTEMBER 19, 2021
MUMBAI
₹�10 • Pages 12
Volume 28 • Number 260
BENGALURU CHENNAI COIMBATORE HUBBALLI HYDERABAD KOCHI KOLKATA MADURAI MALAPPURAM MANGALURU MUMBAI NOIDA THIRUVANANTHAPURAM TIRUCHIRAPALLI TIRUPATI VIJAYAWADA VISAKHAPATNAM
INSIDE
BIG STORY P2
Bitcoin baitTo join or not to join... Here are key
facts that will help you take a call
about cryptocurrency trading
FUND INSIGHT P4
Safety netWe analyse two new target
maturity fund offerings that will
help fi�xed income investors
CHART GAZING P7
Index outlookWith stock indices retreating from their
record highs, here is a technical view that
can add edge to your trading strategy
HARI VISWANATH..........................................
BL Research Bureau
Mark Twain didn’t havemuch to do with stock markets. But market participants during times ofcrashes and recovery frequently resort to his famousquote: ‘History never repeats itself, but it does oftenrhyme.’
Well, Sensex of 200607and Nifty of 202021 do seemto rhyme. The fact that Niftyin February/March 2020 wasaround the same 12,000levels at which Sensex was inApril/May 2006 is just thestarting point of thissimilarity.
In lock-stepBy May 2006, Sensex hadhad the run of its life. From apost dotcom bust bear market low of around 2,600 inSeptember 2001, the indexhad given CAGR returns of37 per cent to reach an alltime high of 12,671 by May2006. What followed was astunning reversal starting
May 18 triggered by US infl�ation data/rate increase andsudden fall in metal prices.In a little over a month, thebenchmark index had corrected by 30 per cent.
Sounds a bit familiar,doesn’t it? The Nifty index,after reaching record highof 12,430 in January 2020(similar to Sensex highs in2006) and hovering above12,000 till midFebruary2020, had as stunning acrash over the next monthas fears of a Coviddriveneconomic crisis engulfedthe world.
What transpired in boththe indices following theshort bearish phase was amarathon rally lasting 18months. While the Nifty oftoday is up 131 per cent in the18 months from its March2020 lows, the Sensex thenwas up a near matching 125per cent from its June 2006lows in 18 months.
Fundamentals contrastHowever, the underlyingfactors behind the rally at
both times are a study incontrast. The years leadingto FY07 were a period of accelerating economic growthfor India while in FY21 recession stared at us, with GDPcontracting 7.3 per cent.
The global economy, too,witnessed one of its bestphases of economic expansion since the Second WorldWar (WW2) between 2003
and 2007 and saw the worstrecession since WW2 in2020.
Concerns that the economy could overheat led tocentral banks increasing interest rates then. In contrast, heading into theslump of March 2020, theglobal economy was dealingwith a decade of low economic growth, low infl�ation
and declining interest rates.Quantitative easing (QE)was only a theoreticalconcept in 200607, whilethe massive QE driven monetary stimulus by globalcentral banks is the factordriving markets today.
Corporate earnings werebooming then with Sensexearnings CAGR at around 25per cent in the fi�ve yearsinto 2007.
The Nifty earnings CAGRin the fi�ve years into 2021were a paltry 5 per cent. TheSensex trailing PE was at 21times then versus the Niftytrailing PE of around 30times now.
The index leadership thenwas from Power/Infra andReal Estate stocks with bluechip IT services companiesunderperforming and giving negative absolute returns in 2007 due to worriesfrom the impact of the signifi�cant rupee appreciationthat year.
In contrast, IT servicescompanies have been leaders in the current bull run
although ironically theirrevenue/earnings growthnow is much lower than in2007.
There were, however, afew similarities, the most interesting being the boom inUS housing prices duringboth these times. The recordnumber of IPOs and thefrenzy around it as well asthe bull run in commoditiesis another similarity.
What awaits?Probably what has pannedout so far is just a coincidence. However, if the rhymeof history continues, then asignifi�cant correction islikely. Remember 2008?
That said, when it comesto markets, one can onlydeal in terms of probabilities and not certainties.
Alltime high valuationsand the fact that the globaleconomy is today dependent on monetary and fi�scalstimulus that may not continue forever, do imply thatthere are risks to the currentrally.
If rhyme of history holds, a market correction is likelyNifty of 202021 has shades of Sensex of 200607, but fundamentals today are starkly diff�erent
KV KURMANATH..........................................
Hyderabad, September 18
What started as a small experiment by a 14yearoldgirl has caught the attention of T Works, an electronic hardware startupincubator, resulting in thedevelopment of a machinethat can churn out 500biodegradable pots for usein nurseries.
A Srija of Gadwal wasquite upset about blackplastic bags being used atthe plantation drive at herschool last year.
She went home, gotsome groundnut shellsand prepared a doughwith them to make a pot tokeep the saplings.
Her work, presented insome exhibitions, caughtthe attention of TelanganaState Innovation Council(TSIC), which in turn referred it to T Works.
“The key task before uswas to build a machine,the best mix and the besttemperature at which itshould be baked in themould.
“We helped her in structured experiments to fi�ndout the best combination,”Anand Rajagopalan, Dir
ector (Operations) of TWorks, told BusinessLine.
“We zeroed in on threemixes and three temperatures. We built a robust machine that doesn’t requireany maintenance.
Besides, the mouldmounted in the machine(named Biopress 4T) canchurn out lakhs of pots.And, the moulds can comein diff�erent shapes,” hesaid.
Open source techNot only will the biopothelp civic bodies get rid ofplastic bags at nurseries, itwill nourish the saplingsas the mix contains fertilising groundnut shells,tamarind seed powder
and other proprietary material developed by Srija.
Now that a machine isready to manufacture thepots, T Works has decidednot to go for patenting thetechnology.
“We are going to make itopen sourced to developers,” he said.
T Works, however, willhelp the girl seek a patenton the proprietary mix.
“We worked closely withSrija and her mentor Augustine to design and fabricate a machine capableof churning out biopots inlarge numbers. Their input was critical to designing a machine that can beused in a village setting,for example by selfhelpgroups,” Sujai Karampuri,Chief Executive Offi�cer of TWorks, said.
The moulds, developedby Srija, could fi�nd a placein the Telangana government’s mass greenery programme – Telangana kuHaritaharam.
“We will aim at skillingthe selfhelp group communities for largescaleproduction of pots,”Shanta Thoutam, Chief Innovation Offi�cer, Government of Telangana, said.
‘Biopot’ — Invented by a schoolgirl, nurtured by T Works
The 14yearold’s idea of replacing plastic bags innurseries will be scaled up by the startup incubator
Biopress 4T developed by
T Works that can produce
500 biodegradable nursery
pots a day.
KEERTHI SANAGASETTI..........................................
BL Research Bureau
The housing fi�nance industry is experiencingtailwinds from low interest rates, and government (Central and State)stimulus measures.
With their presence innonmetro cities andsemiurban or rural areas,housing fi�nance companies (HFCs) are set to benefi�t better from this tide,given the push for aff�ordable housing.
Can Fin Homes, promoted by Canara Bank,and in existence for threedecades, is one such HFC.Banking on its presence in Tier2 and3 cities, Can FinHomes hasgrown its loanbook at a CAGRof 18 per centfrom FY15 toFY21 to ₹�22,105crore.
With a focus on housing loans (90 per cent ofloan book) and on salaried customers (73 percent of loan book), thecompany has been able tomaintain healthy yieldsof over 9 per cent on itsloan book, until FY21.
Besides, with a muchgranular loan book (average ticket size of ₹�20 lakhin FY21), and nearzero exposure to builder loans(0.03 per cent of loan
book), Can Fin Homes hasalso been able to containits bad loans. The grossnonperforming assets ofthe company remained atless than one per cent ofthe loan book, even during the pandemic — 0.76per cent in FY20 and 0.91per cent in FY21.
The stock traded at 3.22times its book value
as of June 2021,which is at a 21
per centpremium toits threeyearaverage.
Longterminvestors can,
hence, accumulatethe stock on dips.
Can Fin Homes - Accumulate
touted Lal as the turnaroundman of Royal Enfi�eld brand.
Makarand Joshi, foundingpartner, MMJC and AssociatesLLP, says Eicher Motors investors had no problem withLal’s reappointment, but didnot approve the resolution onsalary hike, indicating a vibrant shareholder activismtaking shape in India.
Wake-up callIt is a wakeup call for boardmembers and Csuite executives to eff�ectively play the roleof trusteeship and avoid extending unreasonable fi�nancial support to group companies, he added.
Nevertheless, Eicher Motorsreappointed Lal as ManagingDirector with a maximumsalary cap of 1.5 per cent ofprofi�t subject to postal ballot
SURESH P IYENGAR..........................................
Mumbai, September 18
Right from rejecting salaryhikes for managing directorsto striking down promoters’plans to delist their companies, shareholder activism hasnever been as robust.
Even as promoters move toreward top honchos with heftypay rises for steering theircompanies through the Covidcrisis, investors want thebosses to also moderate theirexpectations in case of a disappointing performance.
For instance, shareholdersof Eicher Motors, makers of theiconic Royal Enfi�eld motorcycle, rejected the special resolution to reappoint SiddharthaLal as Managing Director witha huge salary hike. Never mindthat not long back, they had
approval by shareholders.Last fi�scal, Lal had drawn
₹�21.12 crore as salary, includingcommission and perquisites,while Vinod K Dasari, whostepped down as Chief Executive Offi�cer of Royal Enfi�eld andExecutive Director of EicherMotors from August 13, 2021,took home ₹�25.37 crorewithout a share in profi�ts.
Justifying Lal’s reappointment, S Sandilya, Chairman,Eicher Motors, said that whenLal took over as CEO of RoyalEnfi�eld in 2000, the divisionwas making huge losses andwas slated for closure. He hadindeed turned around thebrand. But the pandemicplayed spoilsport, and motorcycle maker’s profi�t dipped 30
per cent to ₹�1,330 crore lastfi�scal.
Good for retail investorsAt a recent summit, SEBI chairman Ajay Tyagi had said thatshareholder activism is notbad as long as it protects the interest of retail investors.
Allcargo Logistics had todrop the plan to delist aftershareholders resisted the proposal tooth and nail. In Augustlast year, promoters of AllcargoLogistics felt it would be diffi�cult to raise growth capitalwithout going private. Aftershareholders’ resistance, thepromoters withdrew theirplan.
While shareholders fl�exingmuscles is good to an extent,any delay in taking the rightdecision can lead to a seriouserosion in value and job losses.
Unlike others, IT giant Wipromanaged to overcome shareholder activism by reappointing Patrick Ennis and PatrickDupuis as independent directors despite proxy advisors asking shareholders to voteagainst the proposal.
But Balaji Telefi�lms was notas lucky as investors rejectedthe proposed salary hike ofEkta Kapoor (Joint ManagingDirector) and her motherShobha (Managing Director)and capped the commission inabsolute amount.
Mohit Saraf, Founder andManaging Partner, Saraf & Partners, said the country has seensome sparkling success storiesin shareholder activism withthe regulatory architecture designed to ensure certainchecks and balances on thepowers of the promoters.
How shareholder activism has hit a high in India A robust ecosystem is developing to keep promoter powers in check
While shareholders fl�exing muscles is good, any delay in taking the
right decision can lead to erosion in value and job losses
OUR BUREAU..........................................
New Delhi, September 18
Punjab Chief Minister Amarinder Singh resigned onSaturday even as the Congress strained to fi�nd a successor to the ‘Captain’ aheadof the Assembly polls nextyear.
Amarinder Singh maintained that he had been “humiliated” by the Congress,while party sources said hewas increasingly becomingunpopular and had alsoruffled feathers by reportedlyrequesting the party highcommand to drop as many as60 sitting MLAs in the nextelections.
Top contendersAmong the successors beingconsidered were senior leaders Pratap Singh Bajwa,Sukhjinder Singh Randhawa,Ravneet Singh Bittu andSunil Jhakar.
While Amarinder Singhhas quit as CM, chances ofhim remaining with the Congress are slim although hehimself maintained that heis still with the party.
“As far as my future politicsis concerned, there is alwaysan option and I will use thatoption when time comes. Iam in the Congress party. Iwill talk to my supportersand decide the future courseof politics,” he said.
Amarinder Singh is reportedly considering forming a new party. He hadformed Shiromani Akali Dal
(Panthic) in the 1990s beforemerging it with theCongress.
The Congress LegislativeParty met in the evening afterAmarinder Singh submittedhis resignation to GovernorBanwarilal Purohit. AICC general secretary incharge ofthe State, Harish Rawat, toldreporters that the CLP meeting passed a resolution asking party President SoniaGandhi to fi�nd a new leader.
Fissures in the partyWith Amarinder Singh’s departure, the fi�ssures in theCongress have now come tothe fore. The high commandbelieves replacing Amarinder Singh is the only waythe Congress can rescue anelection that is becoming diffi�cult although Congress is inpole position in the State following the farmers’ agitationagainst the three farm laws.The BJP and the ShiromaniAkali Dal are discredited andthe Aam Aadmi Party — whichhad won 19 seats in the 117member Assembly in the2017 elections — does nothave the organisationalstructure or a CM candidate.
‘Humiliated’, Amarinderquits as Punjab CM
Punjab CM Amarinder Singh
OUR BUREAU..........................................
New Delhi, September 18
“India administers 80 crorevaccine doses,” Health Minister Mansukh Mandaviyatweeted on Saturday, a dayafter the country clocked itshighest 24hour vaccinationtally of 2.5 crore jabs.
Breaking it down, he said,India took 85 days to get to10 crore vaccinations, another 45 days to get from 10to 20 crore, 29 days to touch30 crore, 24 to get to 40crore, 20 days to reach 50crore, 19 to 60 crore, and 13days to touch 70 crore. From70 crore to 80 crore vaccinations, it took only 11 days, hetweeted.
The 80crore vaccinationmilestone also got a mentionfrom Soumya Swaminathan,Chief Scientist with theWorld Health Organization.
Vax break-upIn fact, Saturday also saw agood run at vaccinationcentres, with close to 83 lakhdoses being administered till8.30 pm.
A lion’s share of the jabswere administered at the62,249 governmentrun sites,while about 3,721 privatesites also contributed to theday’s tally.
Maharashtra led with over13 lakh shots and West Bengaldid over 12 lakh. Madhya Pra
desh administered over 6lakh doses and Uttar Pradesh5 lakh plus.
The development comeseven as Cabinet SecretaryRajiv Gauba chaired a highlevel meeting to reviewCovid19 management andresponse strategies acrossthe country.
Concerns remainPointing out that there wasno room for complacency, hereferred to the experience ofother countries that hadseen multiple peaks ofCovid19 and expressed con
cern over certain pockets inIndia reporting high test positivity. State Health administrators were urged to undertake granular analysis oftheir Covid trajectory, rampup the health infrastructure,stock up on essential medicines and augment humanresources at the earliest, tomeet any potential surge incases.
At the meeting, the HealthSecretary pointed out that 70districts in 15 States were acause for concern as 34 ofthem had a positivity of over10 per cent and in 36 districts, it was in the 510 percent range.
With the festival seasoncoming up, he directed theStates to ensure precautionsand eff�ective enforcement toavoid mass gatherings andcongested closed spaces.
Also, he said, funds hadbeen released to all Statesand Union Territories underthe Emergency COVID Response Package, and urgedthem to use it.
India’s vaccination count crosses80-cr mark; over 80 lakh todayHowever, Cabinet Secretary Rajiv Gauba sounds caution on Covid
Regd. TN/ARD/14/09-11, RNI No. 55320/94
KUMAR SHANKAR ROY..........................................
BL Research Bureau
Ever since Bitcoin was conceptualised in 200809post the global fi�nancialcrisis, it has split the civilised world into two un
equal halves: the haves and the havenots. The early adopters, who ‘hold’the crypto asset, have become wealthyin line with the meteoric rise of Bitcoin market value (1 BTC now costs ₹�35lakh), despite many ups and downs.
But the naysayers, including manygovernments and central banks, havebeen left wondering whether this isyet another fi�nancial scam, thanks tothe highly technical nature of cryptos,regular controversies, and the challenge cryptos as an alternative pose tofi�at moneybased fi�nancial systems.
With the sharp increase in bitcoinprice, newer cryptocurrencies havemushroomed. From just 66 cryptocurrencies in 2013, today there are over5,800 of them. Given the high stakes, awar is currently on between cryptobackers and crypto adversaries.
Be it social media, electronic mediaor the Internet in general, positivestories about cryptocurrencies appeareverywhere, and all this could piqueyour curiosity. With the trusty smartphone giving access to crypto tradingapps, it is all too tempting to jumponto the bandwagon that has an estimated 10 million Indians. But beforeyou enter that highoctane world ofgetrichquick schemes, there are keythings to know that can help youmake an informed decision.
1 No safety net
Out of the $2 trillion market value ofcryptocurrencies, Bitcoin alone is 44per cent. It is the fi�rst cryptocurrencyand thus the fi�rst socalled system ofglobal, decentralised, scarce, digitalmoney. So, one would think that thereis an elaborate system behind all this.
The reality is diff�erent. Bitcoin is avirtual thing. A Bitcoin address is aparticular virtual location where bitcoins are sent and received. It is like abank account number and is represented as a 26 to 35 characterlong,casesensitive string of letters and alphabets. Each Bitcoin address is controlled through the use of a uniqueprivate key, a cryptographic equivalent of a password. Whoever holds thatkey can authorise transfer of Bitcoinfrom that address to another.
There is no central authority, nocentral server and no central storage.Sounds like the Wild Wild West in anew techno avatar? Small wonderthen that the losses from cryptocurrency theft, hacks, and fraud in 2020were at $1.9 billion, according toCipherTrace. Fraud was the dominantcryptocurrency crime in 2020, followed by theft and ransomware.
In due time, cryptocurrencies aspire to gain the trust of people,without most of the intermediariesthat have helped the existing fi�nancialsystem become what it is today. So,when you trade in Bitcoin, Ethereum,Cardano etc. understand that you arein a system that lacks intermediariesviz. banks, brokers, clearing houses,custodians, and their networks.
Crypto enthusiasts will tell you thatthe existing system’s intermediariesimpose access limitations, hinder effi�ciency and rack up costs for end users.But that’s only one side of the coin.
An elaborate group of intermediaries make sure that people are able to‘TRUST’ the system. Right from thedays of barter systems involving saltor cowrie shells to fi�at money systeminvolving dollars or rupees, trust hasbeen the keyword. And when you have
instances such as Titan token in June2021 falling from $60 to 40 cents inless than 24 hours, that trust in this alternative system gets badly shaken.
2 Self-regulation only
Unless you live in El Salvador, the fi�rstcountry to accept Bitcoin as legaltender, investments in cryptocurrencies are not covered by regulation. InIndia, the policy slant is towards acentral bank digital currency, notprivate cryptocurrencies.
Recent media reports indicate thatthe government will not recogniseany currency not fl�oated by the RBI.Since Bitcoin is not recognised in India, there are no laws on holding suchcrypto assets, taxation and grievanceredress from the side of authorities. Ifanything goes wrong, you are on yourown against selfregulated entities.
What about Indian crypto exchanges, the crypto platforms? Arethese also unregulated? The answer isyes and no. Most of the exchanges arelegitimate companies that operate ona marketplace model. There are also afew platforms that call themselves anaggregator of crypto exchanges. A fewof the popular crypto exchangesamongst Indians are based outside ofIndia and one doesn’t know whichcountry laws would apply in a dispute.
If you think these are like a stock orcommodity exchange, you are mistaken. Formal stock/commoditybourses are recognised as exchangesby authorities such as SEBI, but cryptoexchanges are not. Typically, crypto exchanges have been started by a groupof blockchain enthusiasts with noformal background in operating anyrecognised exchange previously.
It is important to understand therole of crypto exchanges at a timewhen crypto currencies are not legaltender. Similar to stock exchanges,crypto exchanges provide an onlineplatform for cryptocurrencies. Butthey also enable trading of cryptocurrencies for fi�at money such as Indianrupees. This makes crypto exchanges aconnecting point between crypto andtraditional fi�nancial systems. Though
centralised exchanges off�er a
single point ofregulation and
more reliability interms of transactions,
they act as a thirdpartybetween a buyer and a seller
and thus should get to playthat key role after due diligence.
Currently, there is no diligence,which puts your investments athuge potential risk. At this point,there is no system of licence issuance based on compliance withstrict eligibility requirementsand scrutiny of governance, riskmanagement and resources.
Recall how the Cajee brothers,who ran a cryptocurrency plat
form from South Africa, vanishedalong with $4.8 billion of bitcoin?
Of course, the world is catching upwith crypto criminals too. For instance, the US Department of Justice,in a June 2021 case, seized bitcoinspaid as ransom. This was done by reviewing the Bitcoin public ledger. Lawenforcement offi�cers were able totrack multiple transfers and identifythe bitcoins paid to the criminals.
3 Volatile asset-class
Bitcoin and many other cryptocurrencies are not backed by physical assets.Essentially, they are more like speculative assets. “They’re highly volatileand therefore not really useful storesof value and they’re not backed byanything,” Fed Chair Jerome Powellsaid in March 2021. And when billionaire investor Warren Buff�ett says therecent craze over bitcoin and othercryptocurrencies will come to a badending, it calls for circumspection.
Huge swings in Bitcoin and Etherprices highlight the speculativenature of the asset. To recall, Tesla’sFebruary statement (highlightingcompany’s embracement of the Bitcoin) sent it to a high of $65,000. However, Bitcoin price fell sharply (in midMay 2021) after Elon Musk expressedconcerns over its power consumptionand said Tesla would no longer acceptBitcoin as payment. Separately, thePeople’s Bank of China banned cryptocurrency as a form of payment whileannouncing a crack down on Bitcoinmining and trading activities.
If you invest in bitcoins, be ready toaccept that it will show massiveamounts of volatility based on somebody’s tweet or remark. A contributing factor to the extreme volatilitylevels in cryptocurrencies is likely tobe the asset’s fragility associated withhighly concentrated ownership —more than 90 per cent of all Bitcoinsare held by just 2 per cent of accounts.
Also, there is a strong correlationbetween Bitcoin prices and Googlesearches. This indicates that it is per
hapsmore of afad, underliningits highly speculative nature. AnHDFC Bank reportshowed that Bitcoinprices are likely to be driven byinternet attention i.e. monthly Googletrends for searches using ‘Bitcoin’ askeyword. Every time there is a sharpswing in Bitcoin prices, many feelcompelled to read about this ‘investment opportunity’. A 3040 per centprice movement in a week is a normalthing in the crypto market!
When you compare Bitcoin withother asset classes, it is easy to understand why this has no comparable!Bitcoin has been three times morevolatile than the S&P 500 or NASDAQcomposite over the past two yearsended January 2021, and fourandahalf times more volatile than gold.
According to World Gold Councildata, Bitcoin has lost 2.5 per cent ormore once in 4 weeks on average compared to once in 12 weeks on averagefor the S&P 500 or NASDAQ, or once in13 weeks on average for gold. Finally,Bitcoin’s ValueatRisk (VaR) has alsobeen considerably higher. On anygiven week over the past two years, investors had a 5 per cent chance (95 percent VaR) of losing at least $1,382 forevery $10,000 invested in Bitcoin. Bitcoin trades like a ‘highoctane’ asset.
4 Scores high on gullibility
To popularise cryptos, domestic platforms and exchanges have tried toride the success of popular investment avenues. This has led to variousproducts emerging from the cryptoexchange stable. On paper, they appear harmless, just like products onthe regulated traditional asset side.But users/investors should show extreme caution while dealing withcrypto products.
Firstly, crypto lending is emergingas a scheme to attract new users withthe promise of loans. In many platforms, the verifi�ed users will be able toobtain an instant loan in a stablecoin(crypto assets backed by fi�at money orother crypto assets) against pledgingcollateral in bitcoin. Leverage up to 4xis allowed. EMI plan lets user pay theirloan and interest (15 per cent) in easymonthly instalments of 3 to 36months, while fl�exible option letsusers pay the interest and principalwithout any restrictions on repayment time. Such loans give you liquidity without having to sell bitcoins.
There is also another form of cryptolending where a verifi�ed user can lenddigital assets through exchange orlending sites, for returns. Typically,users lend their coins to the crypto exchange and in return they get simpleinterest depending on the cryptocurrency and tenure (open or fi�xed 7 daysto 90 days). The most popular cryptoassets for lending are BTC, ETH, USDT,MATIC, Binance Coin, DAI, etc.
Secondly, crypto SIPs are being marketed as a ‘disciplined’ way of longterm investing in crypto currencies.These borrow the mutual fund SIPconcept. The crypto SIPs are off�eredthrough bundled plans, which spreadthe investment across crypto assets,or allow you to focus on one asset with₹�100/day (since cryptos can be boughtin fractions). The SIP frequenciesrange from daily to quarterly. But theyare advertised with unrealistic returnpotential such as ‘1,800% in a fi�veyearplan’. Given the massive volatility ofcryptocurrencies, such high rates ofreturns are plain misleading.
The key point here is that crypto exchanges are giving retail investors fullaccess to complex products withoutadequate disclosures. Given thatcrypto is itself a young fi�eld and avolatile asset, there are not many advisors to guide investors on productsuitability. Thus, misselling can easilyhappen and without proper regulation, it would almost be impossible toenforce investors’ rights, even incourts, and press for recovery. Investorprotection is weak in cryptos thoughunderlying technology may beadvanced.
Are ‘wealthy’ investors in virtual moneysuch as Bitcoin tempting you to join thebandwagon? Check out these facts beforeyou turn towards that high-octane world
VIRTUALLYYOURS
Crypto assetAny digital asset built
using blockchaintechnology
CryptoeconomyA new open financial
system built uponcrypto
DeFiShort for
DecentralisedFinance. Peer-to-peer
software-basednetwork of protocols
that can be used tofacilitate traditional
financial services likeborrowing, lending,trading derivatives,
insurance, and morethrough smart
contracts
WalletA place to store
public and privatekeys for crypto
assets. Wallets aretypically software,
hardware, orpaper-based.
Multiple addressescan be stored in a
Bitcoin wallet
................BM-BME
v This is with reference to ‘4things to know about P2Plending’, published onSeptember 12, 2021. Despitebeing in the fi�nancial fi�eld forover three decades, I was notable to fully understand P2Plending. Now I understand itclearly. As the writer says, anycoercive method to recover theloan can backfi�re on the investoras a lender.
––Shyam Jaisingh
v This is with reference to ‘Abeginner’s guide to NCDinvesting’ published onSeptember 12, 2021. Section 48 ofIncome Tax Act doesn’t allowindexation for bonds/debentures.So no indexation, as referred to inthe article. However, Section112Proviso allows to pay 10 percent tax on the gains withoutindexation. Secondly, breakup ofthe market price into interestcomponent and sales component
has no legal backing. Thisbreakup, at the most, can beuseful only to gain anunderstanding. For taxationpurposes, entire market priceshould be the sales consideration.
––Vishal Shah
BLRB says: Thanks for bringingthe point on indexation to ournotice. Yes, longterm capital gainsare taxed at 10 per cent in case oflisted NCDs and at 20 per cent incase of unlisted NCDs — both
without indexation. We haveupdated the online version ofthe article to refl�ect the same.However, opinion is divided onthe issue of bifurcation of saleprice into interest and capitalgains component and itappears to be a grey area.
According to the personquoted in the article and oneother tax expert we spoke to,the two parts are taxeddiff�erently.
The following are withreference to ‘Markets at apeak, but only one in fivestocks is at lifetime high’,(September 12, 2021).
v Very interesting article on whyit is important to look beyond theheadlines on alltime high indexlevels and valuations and identifypockets of relevant opportunitieswhile constructing an equityportfolio. Investors are expected
to have a calibrated approach toequity investments at these levels.Allocations based on relevantproduct strategies, choice ofmanagers and managerinvestment styles would beextremely crucial.
––Rohith Karkera
v Very insightful. Thissecond/third leg of rally has beenled by select largecaps.
––Dhruvin Doshi
v Very wellarticulated––Kranthi Bathini
v Interesting perspective...––Va Nagappan (@nagappanv)
v I think we need to keep lookingfor better days ahead for specifi�cindustries (as not all sectoralindices are at their peaks). Thatcan change the dynamics. May betextile, may be alcohol....
––Satya Prakash (@sa8ypr)
READERS’ FEEDBACK
Readers can share their views and suggestions in the comments section on our website (thehindubusinessline.com/portfolio/), mail them to [email protected], or tweet to us @BlPortfolio
The key to superperformanceis losing the least amount
when you’re wrong. Then theupside part of the equationbecomes much much easier
MARK MINERVINI Ace stock trader
WISE WORDS
CMYK
BIG STORY2MUMBAI
BusinessLineSUNDAY • SEPTEMBER 19 • 2021 BLPORTFOLIO
Scan & Share
The otherside ofthe coin
GET
TY IM
AG
ES/I
STO
CK
PH
OTO

My question pertains to the applicability ofgrandfathering of capital gains in the case of corporateactions such as demergers and amalgamations. Let meillustrate with an example: I bought 100 shares ofCompany A in September 2016. In February of 2019, ascheme of demerger was approved by shareholdersthat entitled them to an equal number of shares inCompany B (100 in this instant case; shares listed on theexchange in November 2019). I sell shares of bothcompanies in October 2020. What should I reckon to begrandfathered price as on Jan 31, 2018, for bothCompany A and B to crystallise my capital gains liability?Please also confirm that the holding duration for bothcompanies will be reckoned from the date of theoriginal purchase, which is September 2016, and hencetax rate applicable in the case of Company B will also beLTCG.
GIRISH BALAKRISHNAN
The following comments are based on assumption thatthe shares of company A are equity shares & listed in arecognised stock exchange in India.
As per the provisions of Section 112A of the Act, Longterm capital gain (LTCG) on sale of STT paid equityshares exceeding ₹�1 lakh shall be taxable at the rate of10 per cent. Further, surcharge (if any) and health &education cess at 4 per cent shall apply. For the purposeof computing LTCG/LTCL, in cases where the asset isacquired before the 1st day of February, 2018, the cost ofacquisition, shall be the higher of the following, asdefi�ned in Section 55(2)(ac) of the Act:
· actual cost of acquisition; or· lower of (i) fair market value (FMV) of such share on
31 January 2018 (highest quoted price) or (ii) full valueof consideration as a result of transfer.
The term FMV, in the context of equity shares, hasbeen defi�ned in section 55(2)(ac) of the Act, as follows:
· In case the equity share is listed on any recognizedstock exchange, the highest price quoted on such stockexchange as on January 31, 2018;
· Where the equity share, is not listed as on January 31,2018 but is subsequently listed on the date of thetransfer, an amount which bears to the cost ofacquisition the same proportion as the CII for thefi�nancial year 201718 bears to the CII in which the assetwas held by the tax payer or for the fi�nancial year200102, whichever is later.
On a literal interpretation of the wordings in section55(2)(ac) of the Act, one may fi�nd it diffi�cult to contendthat the equity shares in B Ltd have been acquired priorto February 1, 2018. Hence, technically, thegrandfathering benefi�ts may not be available in case ofthe equity shares in B Ltd.
Given the above, one could argue that the FMV of theequity shares in A Ltd as on January 31, 2018 should beadopted for determining the proportionate FMV of theshares in A Ltd and B Ltd. However, adopting thegrandfathering benefi�ts for shares in B Ltd is not freefrom litigation.
TAXQUERY
SUDHAKAR SETHURAMAN
The writer is Partner, Deloitte India
Send your queries to [email protected]
................BM-BME
HARI VISWANATH..........................................
BL Research Bureau
In his path breaking book Thinking, Fast and Slow; Daniel Kahneman(Psychologist, Nobel Laureate in economic sciences) explains the two systems in our brain that govern our decision making. System one which isfast, automatic, intuitive & instinctive,based on heuristics, biases etc. Andsystem two which is slow, analytical,objective, controlled and based oncritical and logical thought. Both havetheir purpose. For example, when youare crossing the road or driving a carduring which you need to take spontaneous decisions, you need to function based on system one decisions.However, in your investment decisions there is absolutely no case forsystem one.
If you are a longterm investor, everysingle investment decision must bebased on logical, critically analysed,and validated decisions. In the longrun, for a diversifi�ed portfolio, delaying few investment decisions by days,weeks or even months till you are convinced about the opportunity is notgoing to make much of a diff�erence.For example, whether you had boughtthe Tesla stock in 2014 or 2017 or 2018,you would have made multibaggerreturns. Also, if you miss one good opportunity in one stock because ofdelays in decisions, with thousands ofstocks listed in the markets you will bepresented with another good opportunity soon. Hence, there is no reasonto buy stocks on a rush of adrenaline.
Here are some steps you can take toimprove your stock investmentdecisions.
Understand your risk tolerance In an era of mobile trading appswhere you can open a trading accountsitting in your couch, buying a stockon impulse is one of the easiest thingsto do. However, what won’t be easy formany is dealing with the loss. So, youneed to take more precautions in yourinvestment decisions if you cannottake losses on the chin. The point hereis that investors may not be adept inassessing their risk tolerance well.Many realise they cannot take stockmarket volatility only after facinglosses, by when it may be late. According to the concept of loss aversion, awidely prevelant cognitive human
bias, the pain of losing is psychologically about twice as powerful as thepleasure of gaining. Hence, it may bebetter to err on the side of caution ifyou are in doubt, by limiting your exposure or taking the mutual fundroute rather than direct stock investing.
Maintain an investment journal Every time you invest, make a note of35 reasons/assumptions based onwhich you bought a stock. And everytime you assess the performance ofthe investment, compare your original assumptions with the actualevents that played out that infl�uencedthe stock performance. This way youcan see if you are able to analyse thestocks/sector well and also revisit/revise the assumptions before you wantto add to positions or average in caseof losses. If your originally assumptions were wrong and you still want toaverage, maybe you are getting this investment wrong unless you have improved your investment skills and canmake better assumptions the secondor third time.
If you are a longterm investor, therereally isn’t much of case for you to follow markets on a daily basis unlessthat is part of your profession. Withsmartphone at our constant disposalto check stock prices ticker by ticker,too much of stock/market relatednoise can build a subconscious bias
that will infl�uence your buying andselling decisions without you beingaware of it. There are thousands of listed stocks whose prices change everyfew seconds and constantly checkingthese movements and trying to makesense can get exhausting. Avoid thishabit. Maybe following up on your investment related news fl�ows on aweekly basis in leisure during nonmarket hours and assessing portfolioperformance on quarterly or monthlybasis may be a better way.
Invest based on rules Warren Buff�et has stressed how themost important quality to be a successful investor is the temperamentalquality, and not the intellectual quality. Unfortunately most people lack intemperamental ability when it comesto investing in stocks. Even stock market geniuses have paid the price fornot keeping temperament in check.Jesse Livermore, who is consideredone of the greatest traders of all timesand whose strategies are still followedand studied widely even decades afterhis time, had many blow ups and eventually committed suicide. The lack oftemperament makes all the diff�erence.
One way to deal with the issue oftemperament would be to have a clearinvestment rule book that will bringin discipline. For example, you canhave rules like – one, you will always
ensure no single stock makes up morethan 57 per cent of your portfolio;two, you will average only after a decline of 25 or 50 per cent from yourprevious entry point in a stock; three,you will invest only once every month,etc can help bring in discipline and ensure you do not make investing mistakes driven by temperament. Onceyou have the rules, you have to ensureyou follow it. For example, if your ruleis you will average only on a 50 percent decline and you average on a 30per cent decline it implies you mayhave temperamental issues. Thatwould be a sign your biases are takingover.
Analyse the pay-offs Every time you make a decision, analyse the payoff�s. Markets off�er diff�erent kind of opportunities at diff�erenttimes. There are times when marketsmay off�er a payoff� such as a possibilityof 10 percent upside versus a 50 percent downside or a favourable 20 percent downside versus a 50 per cent upside. While one could be tempted to gofor the 10 per cent upside in a low interest rate regime, a clear analysis ofthe payoff�s will help deal with biasesand lead to a more optimal decision. Ifyou are investing with a belief marketsalways go up, then you have a seriousproblem when it comes to investing. Ifyou do not have a clear idea of the payoff�s/riskreward, do not invest.
4 ways to boost stock investing skillsLong-term investing should be based on logical, critically analysed and validated decisions
MARKET WISE
WRONGAPPROACH
If you are a long terminvestor, there reallyisn’t much of a casefor you to followmarkets on a dailybasis unless that ispart of yourprofession
Developed World Index FoF NFOHDFC Asset Management
Company has launched a
new fund HDFC
Developed World Indexes
Fund of Funds (FoF). The
fund will invest in units/
shares of overseas index
funds and/or ETFs which
will in aggregate track the MSCI World Index. It is
being launched in association with Credit Suisse
Asset Management. It will provide exposure to 5
regions across 23 developed markets countries
including Europe, Japan, Canada and the US. The
scheme will have exposure to over 1,500
constituents and 14 currencies. The minimum
application amount is ₹�5,000. The new fund
offer will close on October 1, 2021.
ALERTS
CMYK
MUMBAI
BusinessLine 3SUNDAY • SEPTEMBER 19 • 2021 YOUR MONEY
Scan & Share
Digital loan against MF facilityTata Capital has announced
the launch of loan against
mutual funds which can be
availed by customers
completely online. The
loan amount can range
from ₹�5 lakh to ₹�2 crore.
This digital loan offering is
provided against a wide range of equity and
debt schemes across mutual funds. Customers
can avail the loan after marking a lien on the
mutual fund units held by them. The loan
amount is customised based on the value of the
units in the MF folio and tenure. Note that the
loan can be availed as an overdraft facility or as a
term loan.
New option in HDFC Click 2 ProtectHDFC Life has introduced a
new option – Life and
Critical Illness (CI)
Rebalance option, as part
of its term insurance
product, HDFC Life Click 2
Protect Life. The option is
designed keeping in mind
that as age progresses, the need for health cover
increases and the need for life cover decreases.
The option will allow for increasing critical
illness cover as life cover decreases
proportionally, on each policy anniversary. On
positive diagnosis of any of the 36 critical
illnesses the higher critical illness cover is paid
and all future premiums are waived off and the
life cover continues.
REQ: SR.GRAPHIC Designers, Chen-nai, 5 to 7 Yrs, Relevant Degree,Fluent in English, Mail: hr −[email protected]
SITUATION VACANT
GENERAL
SATYA SONTANAM..........................................
BL Research Bureau
Even as the bellwether indices touch
record levels, Taher Badshah, Chief
Investment Officer - Equities, Invesco
Asset Management, says that it is an
investable market for investors with
good investment horizon, provided
they keep their return expectations
under control. He thinks
continuation of rise in commodity
prices is a bigger risk to Indian
markets than any global event.
Excerpts:
What is the biggest risk that
markets are facing now?
At the global level, one risk is therise in interest rates, which willcome about in 2023. The otherthing which they haven’t addressed yet is with regard to theirexit from the accommodativestance. But it’s not going to be verydisruptive, in my view. While thepace of monetary support willcome down, it does not imply
withdrawal of liquidity from themarket because the accommodation is for a healthrelated crisis,and it’s not a typical economiccrisis.
In India, the bigger risk to themarkets is continuation of the risein commodity prices that thenstarts aff�ecting the profi�tability ofcorporates which, in turn, couldhurt markets.
Besides that, irregular monsoon, fall of rural purchasingpower and spending ability on account of the impact of the virus, ifany, will be some of the other moredomesticoriented risks.
So, what would you call a key
worry for an investor today?
Any change in the interest rate trajectory will probably hurt. The impact will be a function of theamount of rate hikes and if thoserate hikes are a function of an outcome of a higher infl�ation, andthat higher infl�ation is further anoutcome of better growth, then I
think markets will be able to take itin their stride.
But a scenario where there islack of growth and interest ratesmove northwards is more worrisome. From here on, the returnsfrom markets will be based on normal recovery in the economy. Investors need to keep their returnexpectations under control, andwith good investment horizon,this is still an investable market.
Do you think the current
valuations are justified?
If you were to rewind back toearly part of 2020, for example, the markets weretrading at about 2022 timeson oneyear forward model.Today, the valuation on a oneyear forward basis issimilar.
And we are in ascenario wherewe are lookingforward to a better earnings tra
jectory materialising over the nexttwo years for the Indian economyas well as for the world at large.Also, in the last 12 to 18 months’time, the interest rate table hasgone down quite meaningfullyacross the world. So, it is so naturalfor valuations to move the otherway.
I would defi�ne valuations asprobably fair. Having said that,there are pockets where you see eu
phoria quite visibly, whichone can probably avoid.
Which sectors look
attractive in terms of
space. But I don’t envisage thescenario, like in 2018 and 2019,when the mid and smallcapswere at discount by about 3040per cent to largecaps. That said,there will always be some opportunities. Once the economy opensup, these are the companies thatwill benefi�t.
Are the policy measures by the
Government good enough to
stimulate the economy?
With regard to manufacturing, forthe last six to eight months, we’veseen a fair bit of push, particularlywith regard to extending the PLI tovarious segments.
On infrastructure, there is theresolve for National MonetisationProgramme, which is infrastructure modernisation programme.From a policy perspective, there isno dearth of policy measures.
It is more about implementation. But we see enough push fromthe government to prioritisegrowth.
be a lot stronger than what themarket has forecast today.
Technology is another sectorwhich we like for the top line andthe visibility of growth despitehigher valuations.
We have pockets of FMCG, consumer discretionary and consumer staples, which still havesome bit of extended valuationsand are not very easy from an entrystandpoint.
But then there are parts likeautos, which are kind of mixed.The sector as a whole has turnedcheap on valuation. But we werestruggling with a little bit of clarity on growth out there.
Within the auto ecosystem, weare better off� with some of the ancillaries that are welldiversifi�ed.
Should investors avoid mid- and
small-cap stocks due to their rich
valuations?
Valuations problems are moreacute in mid and smallcap space.
Correction is possible in this
valuations, and which frothy, as
you just mentioned?
One sector you can at least actupon is fi�nancials. The entire banking space has probably becomestronger than what it was abouttwo years back. And yet, their valuations are probably below theirown historic averages.
We also like industrials. This is asector that normally can enjoy ameaningful amount of operatingleverage if the economy is up overthe next couple of years.
So what is apparently high valuations today may not necessarilybe the case, if earnings turn out to
‘Higher commodity prices could hurt markets in India’MEET THE MANAGER
Irregular monsoon, fall of rural purchasingpower and spending ability on account of the
impact of the virus will be some of theother domestic-oriented risks.
TAHER BADSHAHChief Investment Officer - Equities, Invesco
Asset Management
................BM-BME
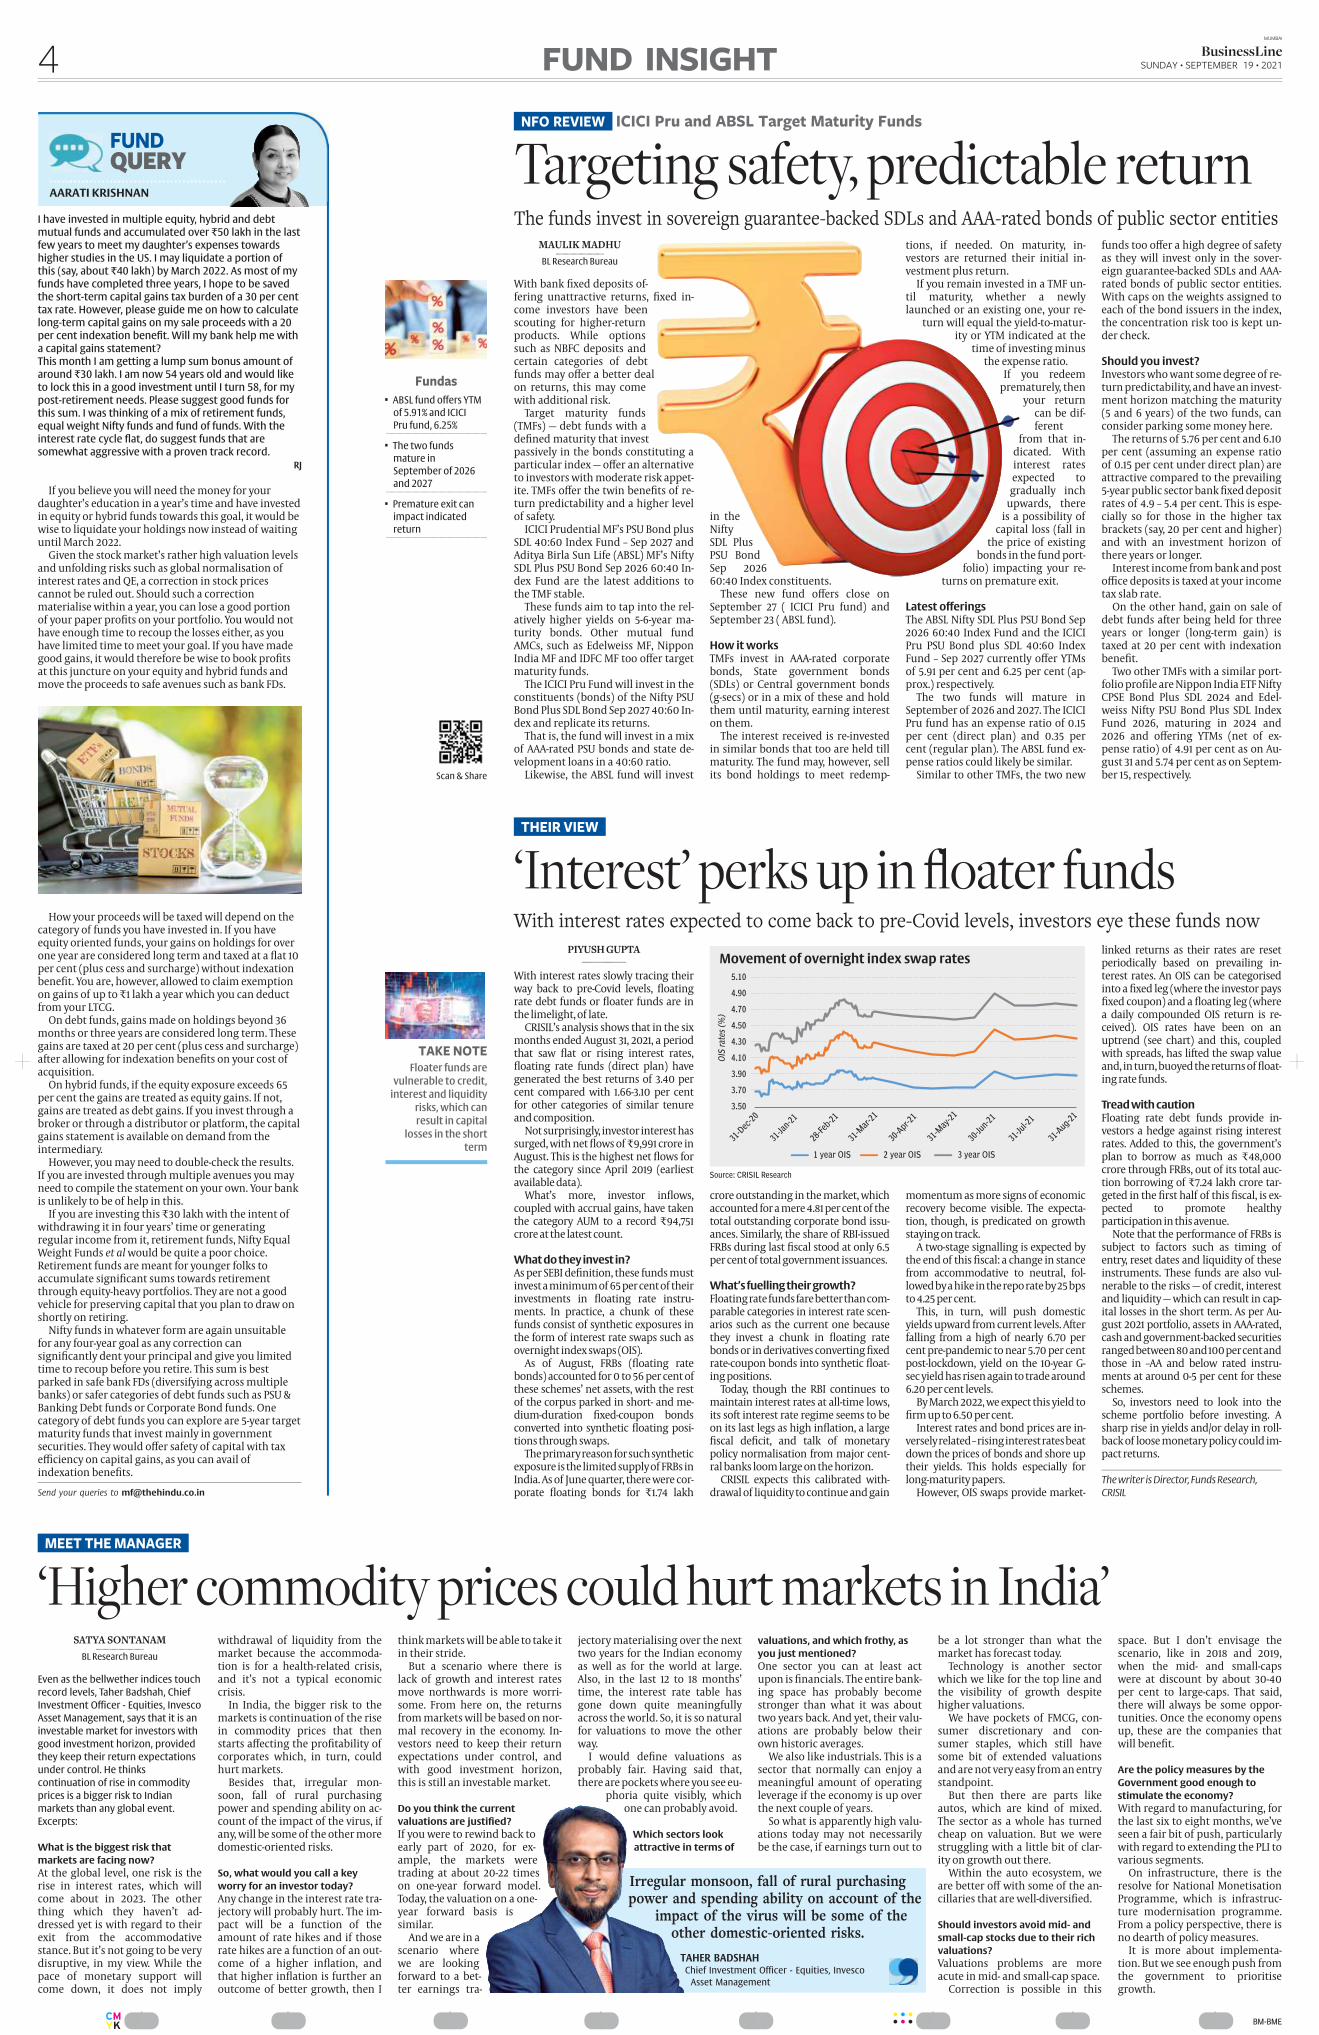
MAULIK MADHU..........................................
BL Research Bureau
With bank fi�xed deposits offering unattractive returns, fi�xed income investors have beenscouting for higherreturnproducts. While optionssuch as NBFC deposits andcertain categories of debtfunds may off�er a better dealon returns, this may comewith additional risk.
Target maturity funds(TMFs) — debt funds with adefi�ned maturity that investpassively in the bonds constituting aparticular index — off�er an alternativeto investors with moderate risk appetite. TMFs off�er the twin benefi�ts of return predictability and a higher levelof safety.
ICICI Prudential MF’s PSU Bond plusSDL 40:60 Index Fund – Sep 2027 andAditya Birla Sun Life (ABSL) MF’s NiftySDL Plus PSU Bond Sep 2026 60:40 Index Fund are the latest additions tothe TMF stable.
These funds aim to tap into the relatively higher yields on 56year maturity bonds. Other mutual fundAMCs, such as Edelweiss MF, NipponIndia MF and IDFC MF too off�er targetmaturity funds.
The ICICI Pru Fund will invest in theconstituents (bonds) of the Nifty PSUBond Plus SDL Bond Sep 2027 40:60 Index and replicate its returns.
That is, the fund will invest in a mixof AAArated PSU bonds and state development loans in a 40:60 ratio.
Likewise, the ABSL fund will invest
in theNiftySDL PlusPSU BondSep 202660:40 Index constituents.
These new fund off�ers close onSeptember 27 ( ICICI Pru fund) andSeptember 23 ( ABSL fund).
How it worksTMFs invest in AAArated corporatebonds, State government bonds(SDLs) or Central government bonds(gsecs) or in a mix of these and holdthem until maturity, earning intereston them.
The interest received is reinvestedin similar bonds that too are held tillmaturity. The fund may, however, sellits bond holdings to meet redemp
tions, if needed. On maturity, investors are returned their initial investment plus return.
If you remain invested in a TMF until maturity, whether a newlylaunched or an existing one, your re
turn will equal the yieldtomaturity or YTM indicated at the
time of investing minusthe expense ratio.
If you redeemprematurely, then
your returncan be different
from that indicated. Withinterest ratesexpected to
gradually inchupwards, there
is a possibility ofcapital loss (fall in
the price of existingbonds in the fund port
folio) impacting your returns on premature exit.
Latest offerings The ABSL Nifty SDL Plus PSU Bond Sep2026 60:40 Index Fund and the ICICIPru PSU Bond plus SDL 40:60 IndexFund – Sep 2027 currently off�er YTMsof 5.91 per cent and 6.25 per cent (approx.) respectively.
The two funds will mature inSeptember of 2026 and 2027. The ICICIPru fund has an expense ratio of 0.15per cent (direct plan) and 0.35 percent (regular plan). The ABSL fund expense ratios could likely be similar.
Similar to other TMFs, the two new
funds too off�er a high degree of safetyas they will invest only in the sovereign guaranteebacked SDLs and AAArated bonds of public sector entities.With caps on the weights assigned toeach of the bond issuers in the index,the concentration risk too is kept under check.
Should you invest?Investors who want some degree of return predictability, and have an investment horizon matching the maturity(5 and 6 years) of the two funds, canconsider parking some money here.
The returns of 5.76 per cent and 6.10per cent (assuming an expense ratioof 0.15 per cent under direct plan) areattractive compared to the prevailing5year public sector bank fi�xed depositrates of 4.9 – 5.4 per cent. This is especially so for those in the higher taxbrackets (say, 20 per cent and higher)and with an investment horizon ofthere years or longer.
Interest income from bank and postoffi�ce deposits is taxed at your incometax slab rate.
On the other hand, gain on sale ofdebt funds after being held for threeyears or longer (longterm gain) istaxed at 20 per cent with indexationbenefi�t.
Two other TMFs with a similar portfolio profi�le are Nippon India ETF NiftyCPSE Bond Plus SDL 2024 and Edelweiss Nifty PSU Bond Plus SDL IndexFund 2026, maturing in 2024 and2026 and off�ering YTMs (net of expense ratio) of 4.91 per cent as on August 31 and 5.74 per cent as on September 15, respectively.
Targeting safety, predictable return
FundasB ABSL fund offers YTM
of 5.91% and ICICIPru fund, 6.25%
.................................................................................................................
B The two fundsmature inSeptember of 2026and 2027
.................................................................................................................
B Premature exit canimpact indicatedreturn
.................................................................................................................
NFO REVIEW ICICI Pru and ABSL Target Maturity Funds
The funds invest in sovereign guarantee-backed SDLs and AAA-rated bonds of public sector entities
PIYUSH GUPTA..........................................
With interest rates slowly tracing theirway back to preCovid levels, fl�oatingrate debt funds or fl�oater funds are inthe limelight, of late.
CRISIL’s analysis shows that in the sixmonths ended August 31, 2021, a periodthat saw fl�at or rising interest rates,fl�oating rate funds (direct plan) havegenerated the best returns of 3.40 percent compared with 1.663.10 per centfor other categories of similar tenureand composition.
Not surprisingly, investor interest hassurged, with net fl�ows of ₹�9,991 crore inAugust. This is the highest net fl�ows forthe category since April 2019 (earliestavailable data).
What’s more, investor infl�ows,coupled with accrual gains, have takenthe category AUM to a record ₹�94,751crore at the latest count.
What do they invest in? As per SEBI defi�nition, these funds mustinvest a minimum of 65 per cent of theirinvestments in fl�oating rate instruments. In practice, a chunk of thesefunds consist of synthetic exposures inthe form of interest rate swaps such asovernight index swaps (OIS).
As of August, FRBs (fl�oating ratebonds) accounted for 0 to 56 per cent ofthese schemes’ net assets, with the restof the corpus parked in short and mediumduration fi�xedcoupon bondsconverted into synthetic fl�oating positions through swaps.
The primary reason for such syntheticexposure is the limited supply of FRBs inIndia. As of June quarter, there were corporate fl�oating bonds for ₹�1.74 lakh
crore outstanding in the market, whichaccounted for a mere 4.81 per cent of thetotal outstanding corporate bond issuances. Similarly, the share of RBIissuedFRBs during last fi�scal stood at only 6.5per cent of total government issuances.
What’s fuelling their growth? Floating rate funds fare better than comparable categories in interest rate scenarios such as the current one becausethey invest a chunk in fl�oating ratebonds or in derivatives converting fi�xedratecoupon bonds into synthetic fl�oating positions.
Today, though the RBI continues tomaintain interest rates at alltime lows,its soft interest rate regime seems to beon its last legs as high infl�ation, a largefi�scal defi�cit, and talk of monetarypolicy normalisation from major central banks loom large on the horizon.
CRISIL expects this calibrated withdrawal of liquidity to continue and gain
momentum as more signs of economicrecovery become visible. The expectation, though, is predicated on growthstaying on track.
A twostage signalling is expected bythe end of this fi�scal: a change in stancefrom accommodative to neutral, followed by a hike in the repo rate by 25 bpsto 4.25 per cent.
This, in turn, will push domesticyields upward from current levels. Afterfalling from a high of nearly 6.70 percent prepandemic to near 5.70 per centpostlockdown, yield on the 10year Gsec yield has risen again to trade around6.20 per cent levels.
By March 2022, we expect this yield tofi�rm up to 6.50 per cent.
Interest rates and bond prices are inversely related – rising interest rates beatdown the prices of bonds and shore uptheir yields. This holds especially forlongmaturity papers.
However, OIS swaps provide market
linked returns as their rates are resetperiodically based on prevailing interest rates. An OIS can be categorisedinto a fi�xed leg (where the investor paysfi�xed coupon) and a fl�oating leg (wherea daily compounded OIS return is received). OIS rates have been on anuptrend (see chart) and this, coupledwith spreads, has lifted the swap valueand, in turn, buoyed the returns of fl�oating rate funds.
Tread with cautionFloating rate debt funds provide investors a hedge against rising interestrates. Added to this, the government’splan to borrow as much as ₹�48,000crore through FRBs, out of its total auction borrowing of ₹�7.24 lakh crore targeted in the fi�rst half of this fi�scal, is expected to promote healthyparticipation in this avenue.
Note that the performance of FRBs issubject to factors such as timing ofentry, reset dates and liquidity of theseinstruments. These funds are also vulnerable to the risks — of credit, interestand liquidity — which can result in capital losses in the short term. As per August 2021 portfolio, assets in AAArated,cash and governmentbacked securitiesranged between 80and 100 per cent andthose in –AA and below rated instruments at around 05 per cent for theseschemes.
So, investors need to look into thescheme portfolio before investing. Asharp rise in yields and/or delay in rollback of loose monetary policy could impact returns.
The writer is Director, Funds Research,
CRISIL
‘Interest’ perks up in floater fundsWith interest rates expected to come back to pre-Covid levels, investors eye these funds now
THEIR VIEW
TAKE NOTEFloater funds are
vulnerable to credit,
interest and liquidity
risks, which can
result in capital
losses in the short
term
I have invested in multiple equity, hybrid and debtmutual funds and accumulated over ₹�50 lakh in the lastfew years to meet my daughter’s expenses towardshigher studies in the US. I may liquidate a portion ofthis (say, about ₹�40 lakh) by March 2022. As most of myfunds have completed three years, I hope to be savedthe shortterm capital gains tax burden of a 30 per centtax rate. However, please guide me on how to calculatelongterm capital gains on my sale proceeds with a 20per cent indexation benefi�t. Will my bank help me witha capital gains statement? This month I am getting a lump sum bonus amount ofaround ₹�30 lakh. I am now 54 years old and would liketo lock this in a good investment until I turn 58, for mypostretirement needs. Please suggest good funds forthis sum. I was thinking of a mix of retirement funds,equal weight Nifty funds and fund of funds. With theinterest rate cycle fl�at, do suggest funds that aresomewhat aggressive with a proven track record.
RJ
If you believe you will need the money for yourdaughter’s education in a year’s time and have investedin equity or hybrid funds towards this goal, it would bewise to liquidate your holdings now instead of waitinguntil March 2022.
Given the stock market’s rather high valuation levelsand unfolding risks such as global normalisation ofinterest rates and QE, a correction in stock pricescannot be ruled out. Should such a correctionmaterialise within a year, you can lose a good portionof your paper profi�ts on your portfolio. You would nothave enough time to recoup the losses either, as youhave limited time to meet your goal. If you have madegood gains, it would therefore be wise to book profi�tsat this juncture on your equity and hybrid funds andmove the proceeds to safe avenues such as bank FDs.
How your proceeds will be taxed will depend on thecategory of funds you have invested in. If you haveequity oriented funds, your gains on holdings for overone year are considered long term and taxed at a fl�at 10per cent (plus cess and surcharge) without indexationbenefi�t. You are, however, allowed to claim exemptionon gains of up to ₹�1 lakh a year which you can deductfrom your LTCG.
On debt funds, gains made on holdings beyond 36months or three years are considered long term. Thesegains are taxed at 20 per cent (plus cess and surcharge)after allowing for indexation benefi�ts on your cost ofacquisition.
On hybrid funds, if the equity exposure exceeds 65per cent the gains are treated as equity gains. If not,gains are treated as debt gains. If you invest through abroker or through a distributor or platform, the capitalgains statement is available on demand from theintermediary.
However, you may need to doublecheck the results.If you are invested through multiple avenues you mayneed to compile the statement on your own. Your bankis unlikely to be of help in this.
If you are investing this ₹�30 lakh with the intent ofwithdrawing it in four years’ time or generatingregular income from it, retirement funds, Nifty EqualWeight Funds et al would be quite a poor choice.Retirement funds are meant for younger folks toaccumulate signifi�cant sums towards retirementthrough equityheavy portfolios. They are not a goodvehicle for preserving capital that you plan to draw onshortly on retiring.
Nifty funds in whatever form are again unsuitablefor any fouryear goal as any correction cansignifi�cantly dent your principal and give you limitedtime to recoup before you retire. This sum is bestparked in safe bank FDs (diversifying across multiplebanks) or safer categories of debt funds such as PSU &Banking Debt funds or Corporate Bond funds. Onecategory of debt funds you can explore are 5year targetmaturity funds that invest mainly in governmentsecurities. They would off�er safety of capital with taxeffi�ciency on capital gains, as you can avail ofindexation benefi�ts.
FUNDQUERY
AARATI KRISHNAN
Send your queries to [email protected]
CMYK
MUMBAI
BusinessLine4 SUNDAY • SEPTEMBER 19 • 2021FUND INSIGHT
Scan & Share
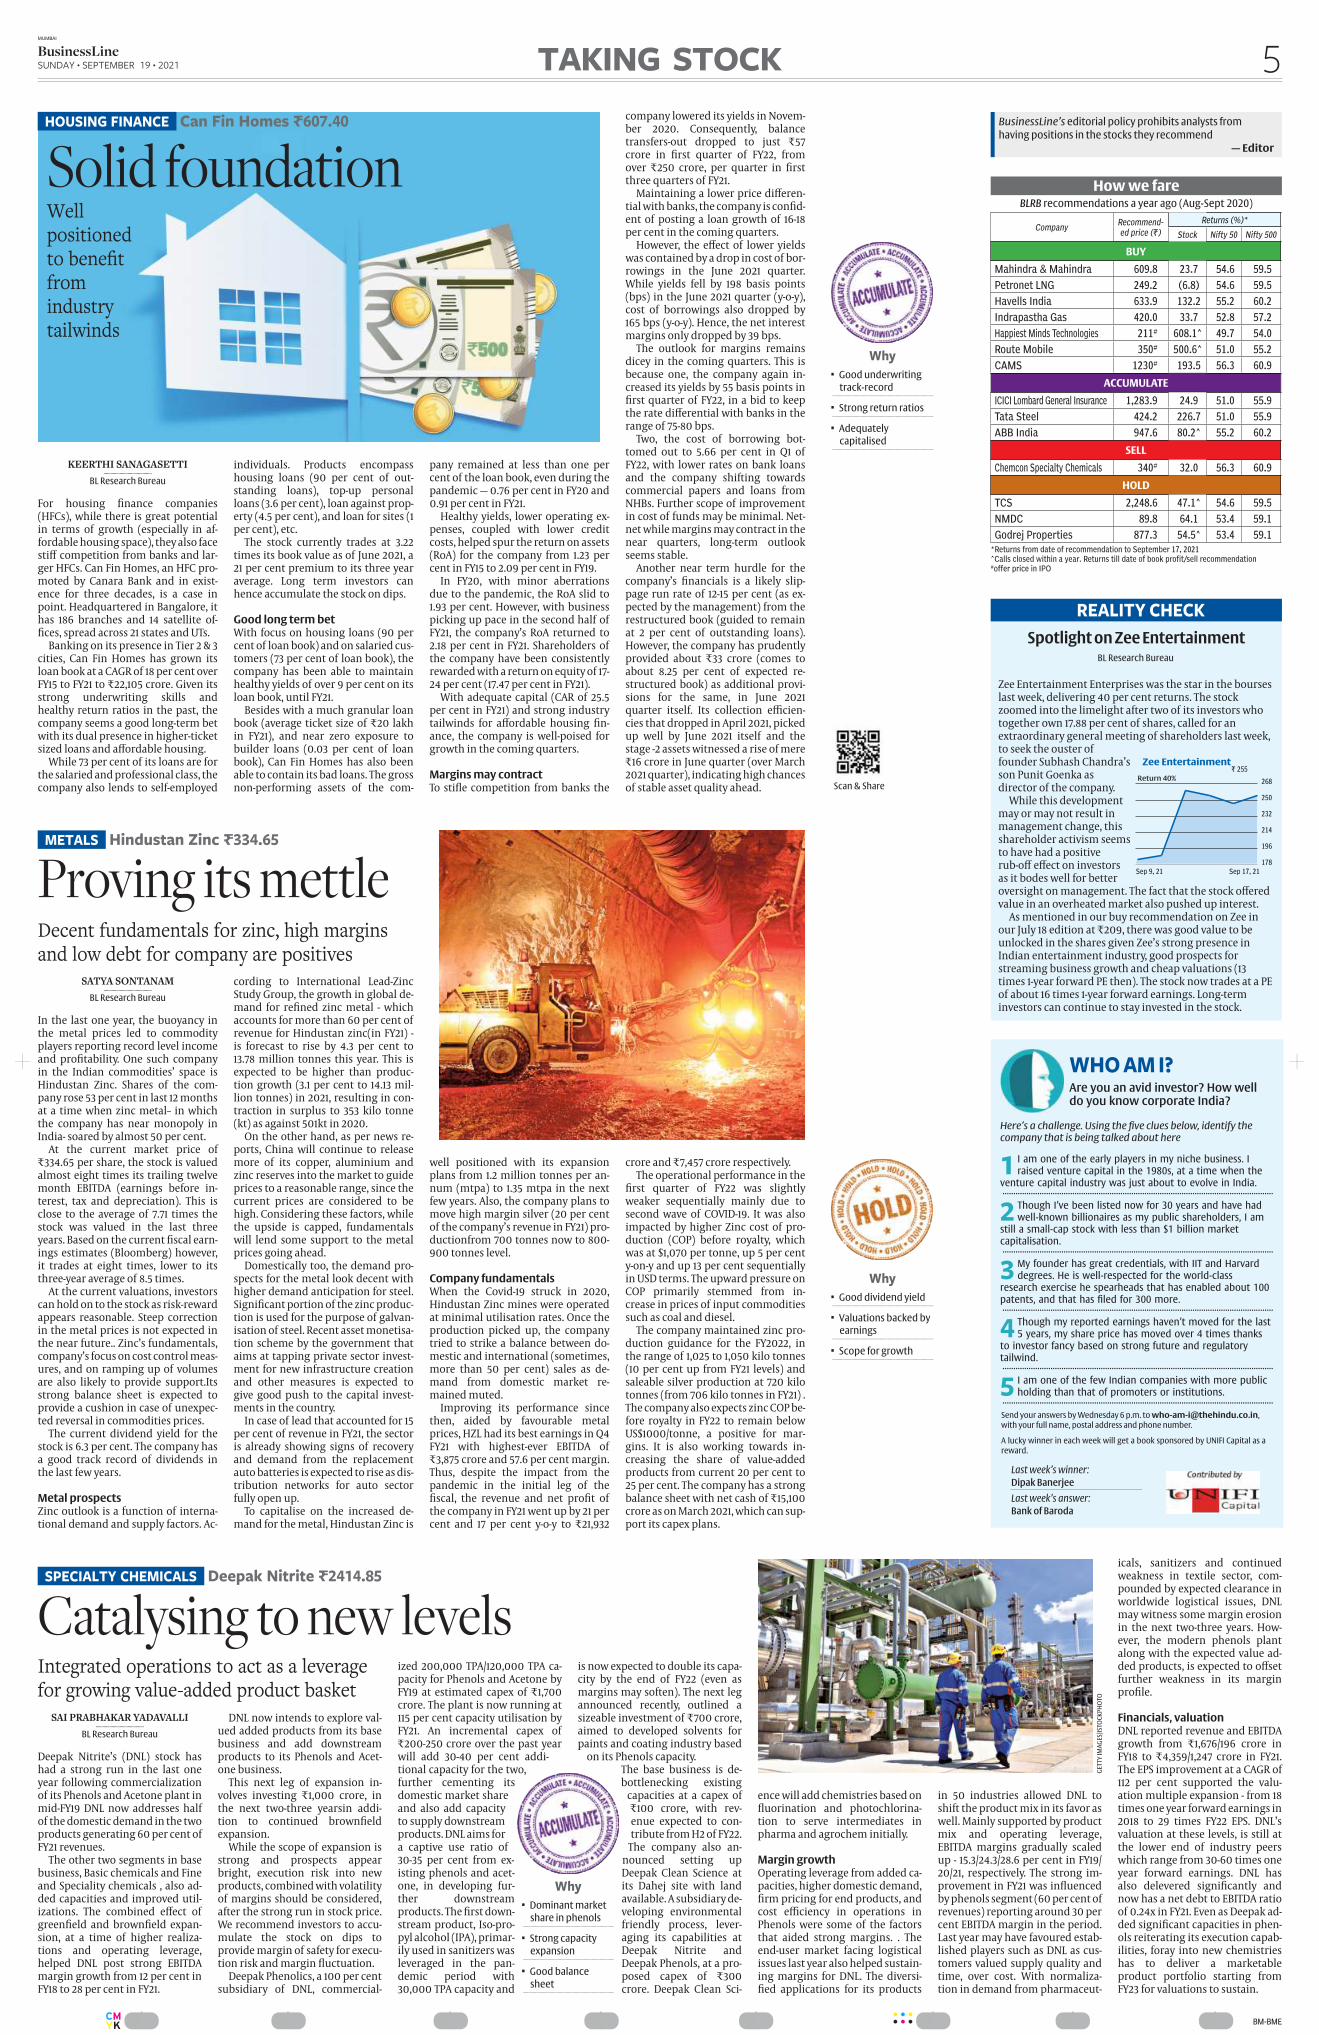
KEERTHI SANAGASETTI..........................................
BL Research Bureau
For housing fi�nance companies(HFCs), while there is great potentialin terms of growth (especially in affordable housing space), they also facestiff� competition from banks and larger HFCs. Can Fin Homes, an HFC promoted by Canara Bank and in existence for three decades, is a case inpoint. Headquartered in Bangalore, ithas 186 branches and 14 satellite offi�ces, spread across 21 states and UTs.
Banking on its presence in Tier 2 & 3cities, Can Fin Homes has grown itsloan book at a CAGR of 18 per cent overFY15 to FY21 to ₹�22,105 crore. Given itsstrong underwriting skills andhealthy return ratios in the past, thecompany seems a good longterm betwith its dual presence in higherticketsized loans and aff�ordable housing.
While 73 per cent of its loans are forthe salaried and professional class, thecompany also lends to selfemployed
individuals. Products encompasshousing loans (90 per cent of outstanding loans), topup personalloans (3.6 per cent), loan against property (4.5 per cent), and loan for sites (1per cent), etc.
The stock currently trades at 3.22times its book value as of June 2021, a21 per cent premium to its three yearaverage. Long term investors canhence accumulate the stock on dips.
Good long term bet With focus on housing loans (90 percent of loan book) and on salaried customers (73 per cent of loan book), thecompany has been able to maintainhealthy yields of over 9 per cent on itsloan book, until FY21.
Besides with a much granular loanbook (average ticket size of ₹�20 lakhin FY21), and near zero exposure tobuilder loans (0.03 per cent of loanbook), Can Fin Homes has also beenable to contain its bad loans. The grossnonperforming assets of the com
pany remained at less than one percent of the loan book, even during thepandemic — 0.76 per cent in FY20 and0.91 per cent in FY21.
Healthy yields, lower operating expenses, coupled with lower creditcosts, helped spur the return on assets(RoA) for the company from 1.23 percent in FY15 to 2.09 per cent in FY19.
In FY20, with minor aberrationsdue to the pandemic, the RoA slid to1.93 per cent. However, with businesspicking up pace in the second half ofFY21, the company’s RoA returned to2.18 per cent in FY21. Shareholders ofthe company have been consistentlyrewarded with a return on equity of 1724 per cent (17.47 per cent in FY21).
With adequate capital (CAR of 25.5per cent in FY21) and strong industrytailwinds for aff�ordable housing fi�nance, the company is wellpoised forgrowth in the coming quarters.
Margins may contractTo stifl�e competition from banks the
company lowered its yields in November 2020. Consequently, balancetransfersout dropped to just ₹�57crore in fi�rst quarter of FY22, fromover ₹�250 crore, per quarter in fi�rstthree quarters of FY21.
Maintaining a lower price diff�erential with banks, the company is confi�dent of posting a loan growth of 1618per cent in the coming quarters.
However, the eff�ect of lower yieldswas contained by a drop in cost of borrowings in the June 2021 quarter.While yields fell by 198 basis points(bps) in the June 2021 quarter (yoy),cost of borrowings also dropped by165 bps (yoy). Hence, the net interestmargins only dropped by 39 bps.
The outlook for margins remainsdicey in the coming quarters. This isbecause one, the company again increased its yields by 55 basis points infi�rst quarter of FY22, in a bid to keepthe rate diff�erential with banks in therange of 7580 bps.
Two, the cost of borrowing bottomed out to 5.66 per cent in Q1 ofFY22, with lower rates on bank loansand the company shifting towardscommercial papers and loans fromNHBs. Further scope of improvementin cost of funds may be minimal. Netnet while margins may contract in thenear quarters, longterm outlookseems stable.
Another near term hurdle for thecompany’s fi�nancials is a likely slippage run rate of 1215 per cent (as expected by the management) from therestructured book (guided to remainat 2 per cent of outstanding loans).However, the company has prudentlyprovided about ₹�33 crore (comes toabout 8.25 per cent of expected restructured book) as additional provisions for the same, in June 2021quarter itself. Its collection effi�ciencies that dropped in April 2021, pickedup well by June 2021 itself and thestage 2 assets witnessed a rise of mere₹�16 crore in June quarter (over March2021 quarter), indicating high chancesof stable asset quality ahead.
Solid foundationWellpositionedto benefitfromindustrytailwinds
WhyB Good underwriting
track-record .................................................................................................................
B Strong return ratios.................................................................................................................
B Adequatelycapitalised
.................................................................................................................
HOUSING FINANCE Can Fin Homes ₹�607.40
SATYA SONTANAM..........................................
BL Research Bureau
In the last one year, the buoyancy inthe metal prices led to commodityplayers reporting record level incomeand profi�tability. One such companyin the Indian commodities’ space isHindustan Zinc. Shares of the company rose 53 per cent in last 12 monthsat a time when zinc metal– in whichthe company has near monopoly inIndia soared by almost 50 per cent.
At the current market price of₹�334.65 per share, the stock is valuedalmost eight times its trailing twelvemonth EBITDA (earnings before interest, tax and depreciation). This isclose to the average of 7.71 times thestock was valued in the last threeyears. Based on the current fi�scal earnings estimates (Bloomberg) however,it trades at eight times, lower to itsthreeyear average of 8.5 times.
At the current valuations, investorscan hold on to the stock as riskrewardappears reasonable. Steep correctionin the metal prices is not expected inthe near future.. Zinc’s fundamentals,company’s focus on cost control measures, and on ramping up of volumesare also likely to provide support.Itsstrong balance sheet is expected toprovide a cushion in case of unexpected reversal in commodities prices.
The current dividend yield for thestock is 6.3 per cent. The company hasa good track record of dividends inthe last few years.
Metal prospectsZinc outlook is a function of international demand and supply factors. Ac
cording to International LeadZincStudy Group, the growth in global demand for refi�ned zinc metal whichaccounts for more than 60 per cent ofrevenue for Hindustan zinc(in FY21) is forecast to rise by 4.3 per cent to13.78 million tonnes this year. This isexpected to be higher than production growth (3.1 per cent to 14.13 million tonnes) in 2021, resulting in contraction in surplus to 353 kilo tonne(kt) as against 501kt in 2020.
On the other hand, as per news reports, China will continue to releasemore of its copper, aluminium andzinc reserves into the market to guideprices to a reasonable range, since thecurrent prices are considered to behigh. Considering these factors, whilethe upside is capped, fundamentalswill lend some support to the metalprices going ahead.
Domestically too, the demand prospects for the metal look decent withhigher demand anticipation for steel.Signifi�cant portion of the zinc production is used for the purpose of galvanisation of steel. Recent asset monetisation scheme by the government thataims at tapping private sector investment for new infrastructure creationand other measures is expected togive good push to the capital investments in the country.
In case of lead that accounted for 15per cent of revenue in FY21, the sectoris already showing signs of recoveryand demand from the replacementauto batteries is expected to rise as distribution networks for auto sectorfully open up.
To capitalise on the increased demand for the metal, Hindustan Zinc is
well positioned with its expansionplans from 1.2 million tonnes per annum (mtpa) to 1.35 mtpa in the nextfew years. Also, the company plans tomove high margin silver (20 per centof the company’s revenue in FY21) productionfrom 700 tonnes now to 800900 tonnes level.
Company fundamentalsWhen the Covid19 struck in 2020,Hindustan Zinc mines were operatedat minimal utilisation rates. Once theproduction picked up, the companytried to strike a balance between domestic and international (sometimes,more than 50 per cent) sales as demand from domestic market remained muted.
Improving its performance sincethen, aided by favourable metalprices, HZL had its best earnings in Q4FY21 with highestever EBITDA of₹�3,875 crore and 57.6 per cent margin.Thus, despite the impact from thepandemic in the initial leg of thefi�scal, the revenue and net profi�t ofthe company in FY21 went up by 21 percent and 17 per cent yoy to ₹�21,932
crore and ₹�7,457 crore respectively.The operational performance in the
fi�rst quarter of FY22 was slightlyweaker sequentially mainly due tosecond wave of COVID19. It was alsoimpacted by higher Zinc cost of production (COP) before royalty, whichwas at $1,070 per tonne, up 5 per centyony and up 13 per cent sequentiallyin USD terms. The upward pressure onCOP primarily stemmed from increase in prices of input commoditiessuch as coal and diesel.
The company maintained zinc production guidance for the FY2022, inthe range of 1,025 to 1,050 kilo tonnes(10 per cent up from FY21 levels) andsaleable silver production at 720 kilotonnes (from 706 kilo tonnes in FY21) .The company also expects zinc COP before royalty in FY22 to remain belowUS$1000/tonne, a positive for margins. It is also working towards increasing the share of valueaddedproducts from current 20 per cent to25 per cent. The company has a strongbalance sheet with net cash of ₹�15,100crore as on March 2021, which can support its capex plans.
Proving its mettleDecent fundamentals for zinc, high marginsand low debt for company are positives
WhyB Good dividend yield.................................................................................................................
B Valuations backed byearnings
.................................................................................................................
B Scope for growth.................................................................................................................
METALS Hindustan Zinc ₹�334.65
................BM-BME
SAI PRABHAKAR YADAVALLI..........................................
BL Research Bureau
Deepak Nitrite’s (DNL) stock hashad a strong run in the last oneyear following commercializationof its Phenols and Acetone plant inmidFY19 DNL now addresses halfof the domestic demand in the twoproducts generating 60 per cent ofFY21 revenues.
The other two segments in basebusiness, Basic chemicals and Fineand Speciality chemicals , also added capacities and improved utilizations. The combined eff�ect ofgreenfi�eld and brownfi�eld expansion, at a time of higher realizations and operating leverage,helped DNL post strong EBITDAmargin growth from 12 per cent inFY18 to 28 per cent in FY21.
DNL now intends to explore valued added products from its basebusiness and add downstreamproducts to its Phenols and Acetone business.
This next leg of expansion involves investing ₹�1,000 crore, inthe next twothree yearsin addition to continued brownfi�eldexpansion.
While the scope of expansion isstrong and prospects appearbright, execution risk into newproducts, combined with volatilityof margins should be considered,after the strong run in stock price.We recommend investors to accumulate the stock on dips toprovide margin of safety for execution risk and margin fl�uctuation.
Deepak Phenolics, a 100 per centsubsidiary of DNL, commercial
ized 200,000 TPA/120,000 TPA capacity for Phenols and Acetone byFY19 at estimated capex of ₹�1,700crore. The plant is now running at115 per cent capacity utilisation byFY21. An incremental capex of₹�200250 crore over the past yearwill add 3040 per cent additional capacity for the two,further cementing itsdomestic market shareand also add capacityto supply downstreamproducts. DNL aims fora captive use ratio of3035 per cent from existing phenols and acetone, in developing further downstreamproducts. The fi�rst downstream product, Isopropyl alcohol (IPA), primarily used in sanitizers wasleveraged in the pandemic period with30,000 TPA capacity and
is now expected to double its capacity by the end of FY22 (even asmargins may soften). The next legannounced recently, outlined asizeable investment of ₹�700 crore,aimed to developed solvents forpaints and coating industry based
on its Phenols capacity.The base business is debottlenecking existing
capacities at a capex of₹�100 crore, with revenue expected to contribute from H2 of FY22.
The company also announced setting upDeepak Clean Science atits Dahej site with landavailable. A subsidiary developing environmentalfriendly process, leveraging its capabilities atDeepak Nitrite andDeepak Phenols, at a proposed capex of ₹�300crore. Deepak Clean Sci
icals, sanitizers and continuedweakness in textile sector, compounded by expected clearance inworldwide logistical issues, DNLmay witness some margin erosionin the next twothree years. However, the modern phenols plantalong with the expected value added products, is expected to off�setfurther weakness in its marginprofi�le.
Financials, valuationDNL reported revenue and EBITDAgrowth from ₹�1,676/196 crore inFY18 to ₹�4,359/1,247 crore in FY21.The EPS improvement at a CAGR of112 per cent supported the valuation multiple expansion from 18times one year forward earnings in2018 to 29 times FY22 EPS. DNL’svaluation at these levels, is still atthe lower end of industry peerswhich range from 3060 times oneyear forward earnings. DNL hasalso delevered signifi�cantly andnow has a net debt to EBITDA ratioof 0.24x in FY21. Even as Deepak added signifi�cant capacities in phenols reiterating its execution capabilities, foray into new chemistrieshas to deliver a marketableproduct portfolio starting fromFY23 for valuations to sustain.
in 50 industries allowed DNL toshift the product mix in its favor aswell. Mainly supported by productmix and operating leverage,EBITDA margins gradually scaledup 15.3/24.3/28.6 per cent in FY19/20/21, respectively. The strong improvement in FY21 was infl�uencedby phenols segment (60 per cent ofrevenues) reporting around 30 percent EBITDA margin in the period.Last year may have favoured established players such as DNL as customers valued supply quality andtime, over cost. With normalization in demand from pharmaceut
ence will add chemistries based onfl�uorination and photochlorination to serve intermediates inpharma and agrochem initially.
Margin growthOperating leverage from added capacities, higher domestic demand,fi�rm pricing for end products, andcost effi�ciency in operations inPhenols were some of the factorsthat aided strong margins. . Theenduser market facing logisticalissues last year also helped sustaining margins for DNL. The diversifi�ed applications for its products
Catalysing to new levelsIntegrated operations to act as a leveragefor growing value-added product basket
GET
TY IM
AG
ES/I
STO
CK
PH
OTO
WhyB Dominant market
share in phenols......................................................................................................
B Strong capacityexpansion
......................................................................................................
B Good balancesheet
......................................................................................................
SPECIALTY CHEMICALS Deepak Nitrite ₹�2414.85
BL Research Bureau
Zee Entertainment Enterprises was the star in the bourseslast week, delivering 40 per cent returns. The stockzoomed into the limelight after two of its investors whotogether own 17.88 per cent of shares, called for anextraordinary general meeting of shareholders last week,to seek the ouster offounder Subhash Chandra’sson Punit Goenka asdirector of the company.
While this developmentmay or may not result inmanagement change, thisshareholder activism seemsto have had a positiveruboff� eff�ect on investorsas it bodes well for betteroversight on management. The fact that the stock off�eredvalue in an overheated market also pushed up interest.
As mentioned in our buy recommendation on Zee inour July 18 edition at ₹�209, there was good value to beunlocked in the shares given Zee’s strong presence inIndian entertainment industry, good prospects forstreaming business growth and cheap valuations (13times 1year forward PE then). The stock now trades at a PEof about 16 times 1year forward earnings. Longterminvestors can continue to stay invested in the stock.
REALITY CHECK
Spotlight on Zee Entertainment
BusinessLine’s editorial policy prohibits analysts fromhaving positions in the stocks they recommend
— Editor
Here’s a challenge. Using the five clues below, identify thecompany that is being talked about here
Send your answers by Wednesday 6 p.m. to [email protected],with your full name, postal address and phone number.
A lucky winner in each week will get a book sponsored by UNIFI Capital as areward.
Last week’s winner:Dipak Banerjee
Last week’s answer:Bank of Baroda
WHO AM I?Are you an avid investor? How welldo you know corporate India?
1 I am one of the early players in my niche business. Iraised venture capital in the 1980s, at a time when the
venture capital industry was just about to evolve in India.............................................................................................................................
2 Though I’ve been listed now for 30 years and have hadwell-known billionaires as my public shareholders, I am
still a small-cap stock with less than $1 billion marketcapitalisation.............................................................................................................................
3 My founder has great credentials, with IIT and Harvarddegrees. He is well-respected for the world-class
research exercise he spearheads that has enabled about 100patents, and that has filed for 300 more.............................................................................................................................
4 Though my reported earnings haven’t moved for the last5 years, my share price has moved over 4 times thanks
to investor fancy based on strong future and regulatorytailwind.............................................................................................................................
5 I am one of the few Indian companies with more publicholding than that of promoters or institutions.
............................................................................................................................
CMYK
MUMBAI
BusinessLine 5SUNDAY • SEPTEMBER 19 • 2021 TAKING STOCK
Scan & Share
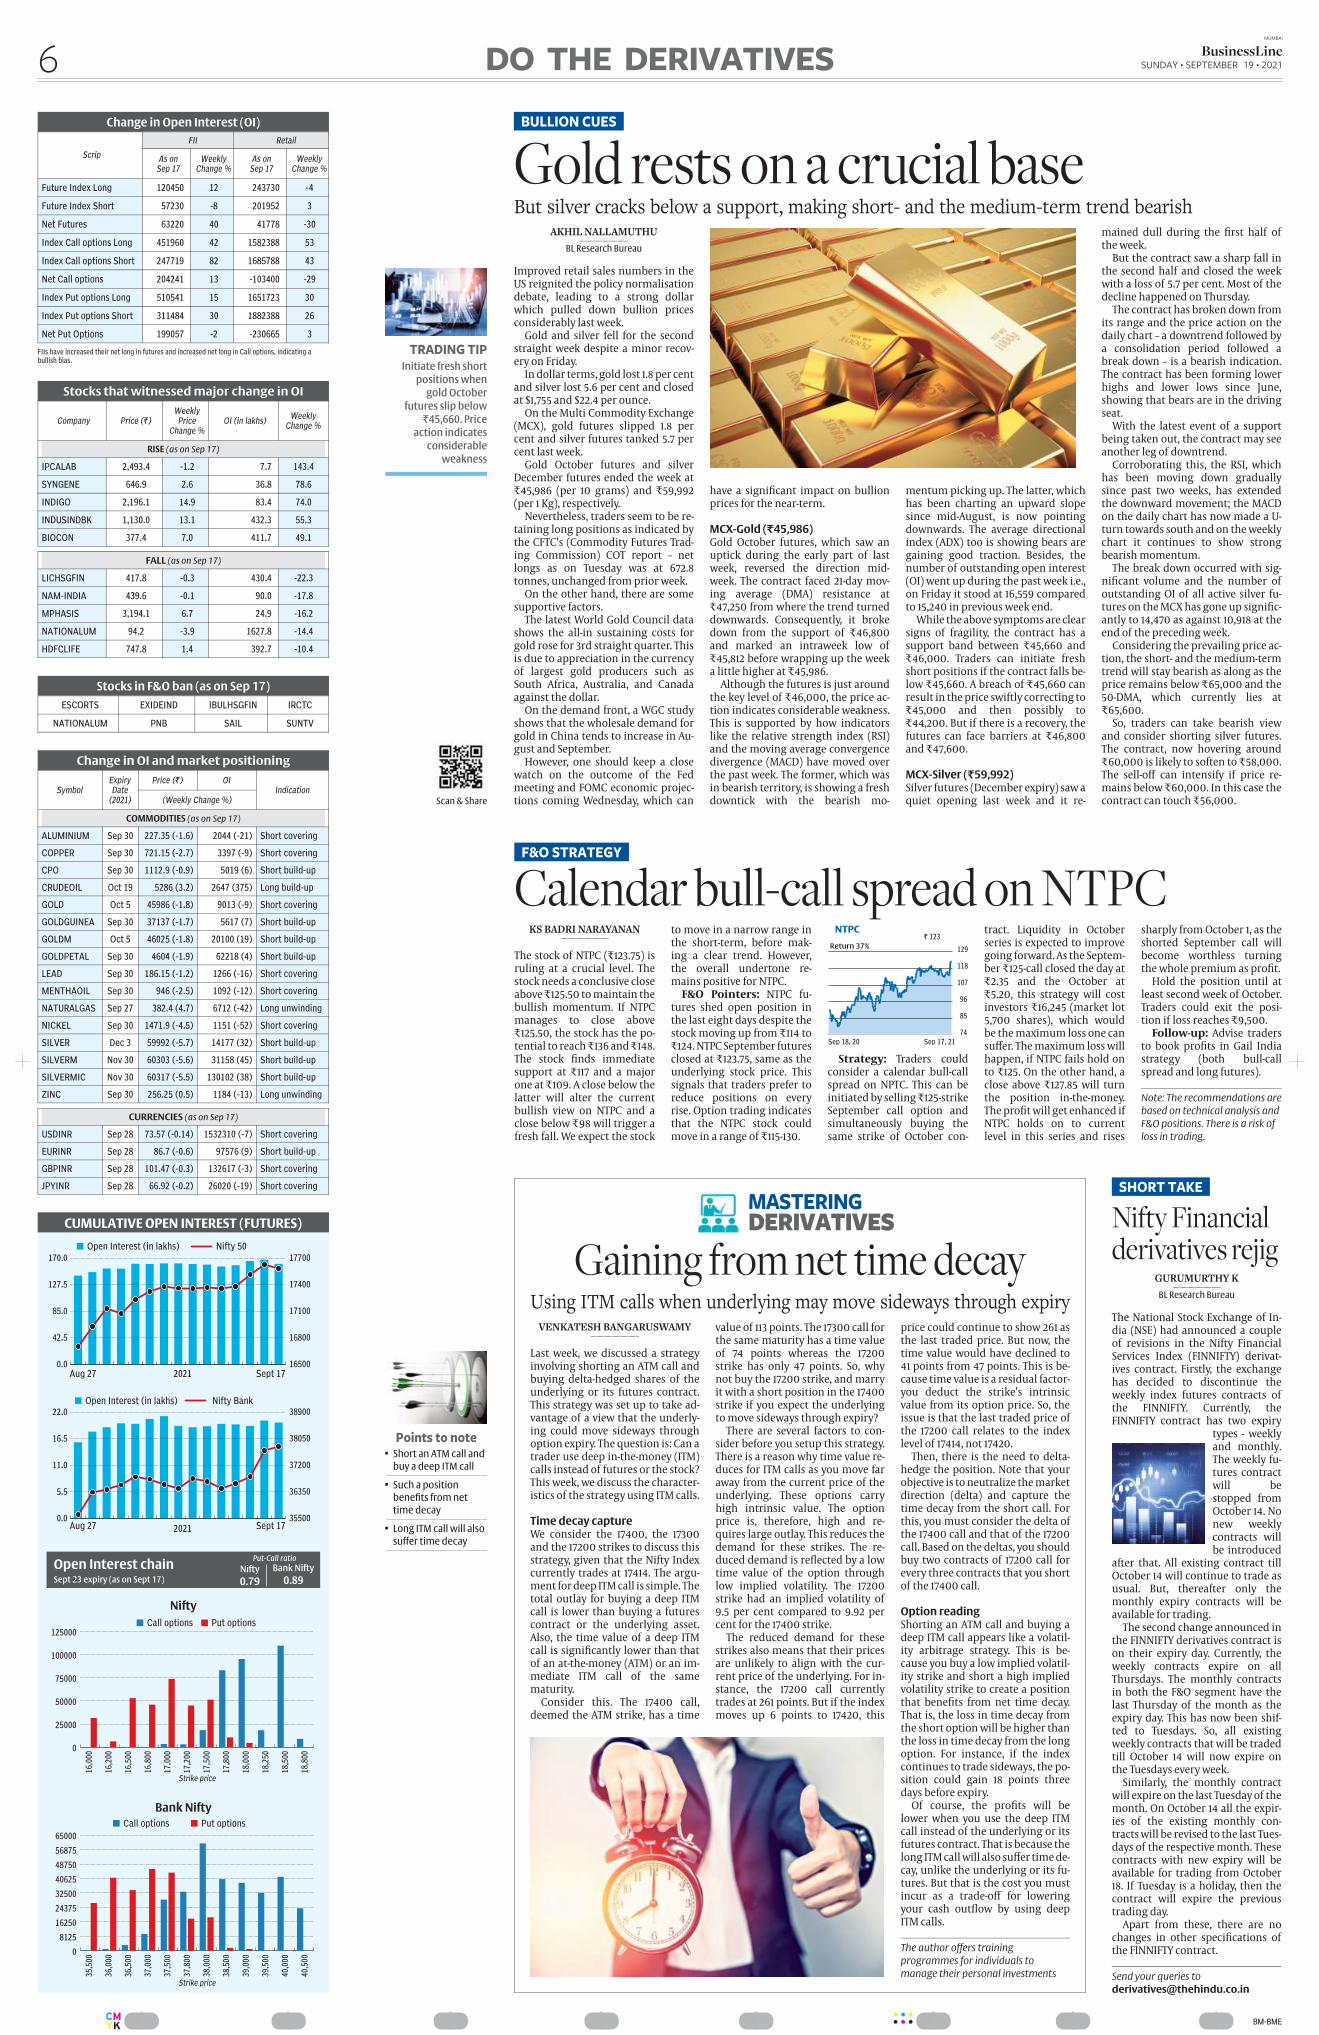
GURUMURTHY K..........................................
BL Research Bureau
The National Stock Exchange of India (NSE) had announced a coupleof revisions in the Nifty FinancialServices Index (FINNIFTY) derivatives contract. Firstly, the exchangehas decided to discontinue theweekly index futures contracts ofthe FINNIFTY. Currently, theFINNIFTY contract has two expiry
types weeklyand monthly.The weekly futures contractwill bestopped fromOctober 14. Nonew weeklycontracts willbe introduced
after that. All existing contract tillOctober 14 will continue to trade asusual. But, thereafter only themonthly expiry contracts will beavailable for trading.
The second change announced inthe FINNIFTY derivatives contract ison their expiry day. Currently, theweekly contracts expire on allThursdays. The monthly contractsin both the F&O segment have thelast Thursday of the month as theexpiry day. This has now been shifted to Tuesdays. So, all existingweekly contracts that will be tradedtill October 14 will now expire onthe Tuesdays every week.
Similarly, the monthly contractwill expire on the last Tuesday of themonth. On October 14 all the expiries of the existing monthly contracts will be revised to the last Tuesdays of the respective month. Thesecontracts with new expiry will beavailable for trading from October18. If Tuesday is a holiday, then thecontract will expire the previoustrading day.
Apart from these, there are nochanges in other specifi�cations ofthe FINNIFTY contract.
Send your queries to
Nifty Financialderivatives rejig
SHORT TAKE
................BM-BME
AKHIL NALLAMUTHU..........................................
BL Research Bureau
Improved retail sales numbers in theUS reignited the policy normalisationdebate, leading to a strong dollarwhich pulled down bullion pricesconsiderably last week.
Gold and silver fell for the secondstraight week despite a minor recovery on Friday.
In dollar terms, gold lost 1.8 per centand silver lost 5.6 per cent and closedat $1,755 and $22.4 per ounce.
On the Multi Commodity Exchange(MCX), gold futures slipped 1.8 percent and silver futures tanked 5.7 percent last week.
Gold October futures and silverDecember futures ended the week at₹�45,986 (per 10 grams) and ₹�59,992(per 1 Kg), respectively.
Nevertheless, traders seem to be retaining long positions as indicated bythe CFTC’s (Commodity Futures Trading Commission) COT report – netlongs as on Tuesday was at 672.8tonnes, unchanged from prior week.
On the other hand, there are somesupportive factors.
The latest World Gold Council datashows the allin sustaining costs forgold rose for 3rd straight quarter. Thisis due to appreciation in the currencyof largest gold producers such asSouth Africa, Australia, and Canadaagainst the dollar.
On the demand front, a WGC studyshows that the wholesale demand forgold in China tends to increase in August and September.
However, one should keep a closewatch on the outcome of the Fedmeeting and FOMC economic projections coming Wednesday, which can
have a signifi�cant impact on bullionprices for the nearterm.
MCXGold (₹�45,986)Gold October futures, which saw anuptick during the early part of lastweek, reversed the direction midweek. The contract faced 21day moving average (DMA) resistance at₹�47,250 from where the trend turneddownwards. Consequently, it brokedown from the support of ₹�46,800and marked an intraweek low of₹�45,812 before wrapping up the weeka little higher at ₹�45,986.
Although the futures is just aroundthe key level of ₹�46,000, the price action indicates considerable weakness.This is supported by how indicatorslike the relative strength index (RSI)and the moving average convergencedivergence (MACD) have moved overthe past week. The former, which wasin bearish territory, is showing a freshdowntick with the bearish mo
mentum picking up. The latter, whichhas been charting an upward slopesince midAugust, is now pointingdownwards. The average directionalindex (ADX) too is showing bears aregaining good traction. Besides, thenumber of outstanding open interest(OI) went up during the past week i.e.,on Friday it stood at 16,559 comparedto 15,240 in previous week end.
While the above symptoms are clearsigns of fragility, the contract has asupport band between ₹�45,660 and₹�46,000. Traders can initiate freshshort positions if the contract falls below ₹�45,660. A breach of ₹�45,660 canresult in the price swiftly correcting to₹�45,000 and then possibly to₹�44,200. But if there is a recovery, thefutures can face barriers at ₹�46,800and ₹�47,600.
MCXSilver (₹�59,992)Silver futures (December expiry) saw aquiet opening last week and it re
mained dull during the fi�rst half ofthe week.
But the contract saw a sharp fall inthe second half and closed the weekwith a loss of 5.7 per cent. Most of thedecline happened on Thursday.
The contract has broken down fromits range and the price action on thedaily chart – a downtrend followed bya consolidation period followed abreak down – is a bearish indication.The contract has been forming lowerhighs and lower lows since June,showing that bears are in the drivingseat.
With the latest event of a supportbeing taken out, the contract may seeanother leg of downtrend.
Corroborating this, the RSI, whichhas been moving down graduallysince past two weeks, has extendedthe downward movement; the MACDon the daily chart has now made a Uturn towards south and on the weeklychart it continues to show strongbearish momentum.
The break down occurred with signifi�cant volume and the number ofoutstanding OI of all active silver futures on the MCX has gone up signifi�cantly to 14,470 as against 10,918 at theend of the preceding week.
Considering the prevailing price action, the short and the mediumtermtrend will stay bearish as along as theprice remains below ₹�65,000 and the50DMA, which currently lies at₹�65,600.
So, traders can take bearish viewand consider shorting silver futures.The contract, now hovering around₹�60,000 is likely to soften to ₹�58,000.The selloff� can intensify if price remains below ₹�60,000. In this case thecontract can touch ₹�56,000.
Gold rests on a crucial baseBut silver cracks below a support, making short- and the medium-term trend bearish
BULLION CUES
TRADING TIP
Initiate fresh shortpositions when
gold October futures slip below
₹�45,660. Price action indicates
considerableweakness
Change in Open Interest (OI)
FII Retail
Scrip As onSep 17
WeeklyChange %
As onSep 17
WeeklyChange %
Future Index Long 120450 12 243730 -4
Future Index Short 57230 -8 201952 3
Net Futures 63220 40 41778 -30
Index Call options Long 451960 42 1582388 53
Index Call options Short 247719 82 1685788 43
Net Call options 204241 13 -103400 -29
Index Put options Long 510541 15 1651723 30
Index Put options Short 311484 30 1882388 26
Net Put Options 199057 -2 -230665 3
FIIs have increased their net long in futures and increased net long in Call options, indicating abullish bias.
Stocks that witnessed major change in OI
Company Price (₹�)Weekly
PriceChange %
OI (in lakhs)Weekly
Change %
RISE (as on Sep 17)
IPCALAB 2,493.4 -1.2 7.7 143.4
SYNGENE 646.9 2.6 36.8 78.6
INDIGO 2,196.1 14.9 83.4 74.0
INDUSINDBK 1,130.0 13.1 432.3 55.3
BIOCON 377.4 7.0 411.7 49.1
FALL (as on Sep 17)
LICHSGFIN 417.8 -0.3 430.4 -22.3
NAM-INDIA 439.6 -0.1 90.0 -17.8
MPHASIS 3,194.1 6.7 24.9 -16.2
NATIONALUM 94.2 -3.9 1627.8 -14.4
HDFCLIFE 747.8 1.4 392.7 -10.4
Stocks in F&O ban (as on Sep 17)
ESCORTS EXIDEIND IBULHSGFIN IRCTC
NATIONALUM PNB SAIL SUNTV
Change in OI and market positioning
Expiry Date
(2021)
Price (₹�) OISymbol
(Weekly Change %)Indication
COMMODITIES (as on Sep 17)
ALUMINIUM Sep 30 227.35 (-1.6) 2044 (-21) Short covering
COPPER Sep 30 721.15 (-2.7) 3397 (-9) Short covering
CPO Sep 30 1112.9 (-0.9) 5019 (6) Short build-up
CRUDEOIL Oct 19 5286 (3.2) 2647 (375) Long build-up
GOLD Oct 5 45986 (-1.8) 9013 (-9) Short covering
GOLDGUINEA Sep 30 37137 (-1.7) 5617 (7) Short build-up
GOLDM Oct 5 46025 (-1.8) 20100 (19) Short build-up
GOLDPETAL Sep 30 4604 (-1.9) 62218 (4) Short build-up
LEAD Sep 30 186.15 (-1.2) 1266 (-16) Short covering
MENTHAOIL Sep 30 946 (-2.5) 1092 (-12) Short covering
NATURALGAS Sep 27 382.4 (4.7) 6712 (-42) Long unwinding
NICKEL Sep 30 1471.9 (-4.5) 1151 (-52) Short covering
SILVER Dec 3 59992 (-5.7) 14177 (32) Short build-up
SILVERM Nov 30 60303 (-5.6) 31158 (45) Short build-up
SILVERMIC Nov 30 60317 (-5.5) 130102 (38) Short build-up
ZINC Sep 30 256.25 (0.5) 1184 (-13) Long unwinding
CURRENCIES (as on Sep 17)
USDINR Sep 28 73.57 (-0.14) 1532310 (-7) Short covering
EURINR Sep 28 86.7 (-0.6) 97576 (9) Short build-up
GBPINR Sep 28 101.47 (-0.3) 132617 (-3) Short covering
JPYINR Sep 28 66.92 (-0.2) 26020 (-19) Short covering
VENKATESH BANGARUSWAMY..........................................
Last week, we discussed a strategyinvolving shorting an ATM call andbuying deltahedged shares of theunderlying or its futures contract.This strategy was set up to take advantage of a view that the underlying could move sideways throughoption expiry. The question is: Can atrader use deep inthemoney (ITM)calls instead of futures or the stock?This week, we discuss the characteristics of the strategy using ITM calls.
Time decay captureWe consider the 17400, the 17300and the 17200 strikes to discuss thisstrategy, given that the Nifty Indexcurrently trades at 17414. The argument for deep ITM call is simple. Thetotal outlay for buying a deep ITMcall is lower than buying a futurescontract or the underlying asset.Also, the time value of a deep ITMcall is signifi�cantly lower than thatof an atthemoney (ATM) or an immediate ITM call of the samematurity.
Consider this. The 17400 call,deemed the ATM strike, has a time
value of 113 points. The 17300 call forthe same maturity has a time valueof 74 points whereas the 17200strike has only 47 points. So, whynot buy the 17200 strike, and marryit with a short position in the 17400strike if you expect the underlyingto move sideways through expiry?
There are several factors to consider before you setup this strategy.There is a reason why time value reduces for ITM calls as you move faraway from the current price of theunderlying. These options carryhigh intrinsic value. The optionprice is, therefore, high and requires large outlay. This reduces thedemand for these strikes. The reduced demand is refl�ected by a lowtime value of the option throughlow implied volatility. The 17200strike had an implied volatility of9.5 per cent compared to 9.92 percent for the 17400 strike.
The reduced demand for thesestrikes also means that their pricesare unlikely to align with the current price of the underlying. For instance, the 17200 call currentlytrades at 261 points. But if the indexmoves up 6 points to 17420, this
price could continue to show 261 asthe last traded price. But now, thetime value would have declined to41 points from 47 points. This is because time value is a residual factoryou deduct the strike’s intrinsicvalue from its option price. So, theissue is that the last traded price ofthe 17200 call relates to the indexlevel of 17414, not 17420.
Then, there is the need to deltahedge the position. Note that yourobjective is to neutralize the marketdirection (delta) and capture thetime decay from the short call. Forthis, you must consider the delta ofthe 17400 call and that of the 17200call. Based on the deltas, you shouldbuy two contracts of 17200 call forevery three contracts that you shortof the 17400 call.
Option readingShorting an ATM call and buying adeep ITM call appears like a volatility arbitrage strategy. This is because you buy a low implied volatility strike and short a high impliedvolatility strike to create a positionthat benefi�ts from net time decay.That is, the loss in time decay fromthe short option will be higher thanthe loss in time decay from the longoption. For instance, if the indexcontinues to trade sideways, the position could gain 18 points threedays before expiry.
Of course, the profi�ts will belower when you use the deep ITMcall instead of the underlying or itsfutures contract. That is because thelong ITM call will also suff�er time decay, unlike the underlying or its futures. But that is the cost you mustincur as a tradeoff� for loweringyour cash outfl�ow by using deepITM calls.
The author offers training
programmes for individuals to
manage their personal investments
Gaining from net time decayUsing ITM calls when underlying may move sideways through expiry
MASTERINGDERIVATIVES
Points to noteB Short an ATM call and
buy a deep ITM call .................................................................................................................
B Such a positionbenefits from nettime decay
.................................................................................................................
B Long ITM call will alsosuffer time decay
.................................................................................................................
KS BADRI NARAYANAN..........................................
The stock of NTPC (₹�123.75) isruling at a crucial level. Thestock needs a conclusive closeabove ₹�125.50 to maintain thebullish momentum. If NTPCmanages to close above₹�125.50, the stock has the potential to reach ₹�136 and ₹�148.The stock fi�nds immediatesupport at ₹�117 and a majorone at ₹�109. A close below thelatter will alter the currentbullish view on NTPC and aclose below ₹�98 will trigger afresh fall. We expect the stock
to move in a narrow range inthe shortterm, before making a clear trend. However,the overall undertone remains positive for NTPC.
F&O Pointers: NTPC futures shed open position inthe last eight days despite thestock moving up from ₹�114 to₹�124. NTPC September futuresclosed at ₹�123.75, same as theunderlying stock price. Thissignals that traders prefer toreduce positions on everyrise. Option trading indicatesthat the NTPC stock couldmove in a range of ₹�115130.
Strategy: Traders couldconsider a calendar bullcallspread on NPTC. This can beinitiated by selling ₹�125strikeSeptember call option andsimultaneously buying thesame strike of October con
tract. Liquidity in Octoberseries is expected to improvegoing forward. As the September ₹�125call closed the day at₹�2.35 and the October at₹�5.20, this strategy will costinvestors ₹�16,245 (market lot5,700 shares), which wouldbe the maximum loss one cansuff�er. The maximum loss willhappen, if NTPC fails hold onto ₹�125. On the other hand, aclose above ₹�127.85 will turnthe position inthemoney.The profi�t will get enhanced ifNTPC holds on to currentlevel in this series and rises
sharply from October 1, as theshorted September call willbecome worthless turningthe whole premium as profi�t.
Hold the position until atleast second week of October.Traders could exit the position if loss reaches ₹�9,500.
Follow-up: Advise tradersto book profi�ts in Gail Indiastrategy (both bullcallspread and long futures).
Note: The recommendations are
based on technical analysis and
F&O positions. There is a risk of
loss in trading.
Calendar bull-call spread on NTPCF&O STRATEGY
Scan & Share
CMYK
MUMBAI
BusinessLine6 SUNDAY • SEPTEMBER 19 • 2021DO THE DERIVATIVES

GURUMURTHY K..........................................
BL Research Bureau
Indian benchmark indices, the Sensexand Nifty 50, continued to surge in thepast week. The indices outperformedglobal peers by surging to recordhighs. The Sensex made a high of59,737.32 and Nifty touched 17,792.95on Friday. However, the indices fellback sharply from their respectivehighs, giving up all the gains made, onFriday. The Nifty has closed the week at17,585.15, up 215 points or 1.24 per cent.Sensex, on the other hand, was up 710points or 1.22 per cent for the weekand has closed at 59,015.89.
All eyes will be on the US Federal Reserve meeting outcome on Wednesday. Market is expecting the Fed to announce when it would begin thestimulus taper. If the Dow Jones Industrial Average gets beaten down afterthe Fed policy meeting, then the Sensex and Nifty will also be vulnerablefor a sharp correction, going forward.We will have to wait and watch.
Nifty 50 (17,585.15)The Nifty 50 broke above 17,400 androse to 17,700 as mentioned in thiscolumn last week. However, the sharp207 points pullback from the recordhigh of 17,792.95 on Friday leaves asign of worry. As such, investorsshould remain cautious in the comingweek instead of being strongly bullishat these levels.
The week ahead: For the comingweek, 17,800 will be an important resistance to be watched. Nifty has tobreak above 17,800 in order to keepthe momentum going. Such a breakcan take the index up to 17,90017,950.A pullback to 17,70017,600 is possiblethereafter.
On the downside, 17,250 will be acrucial support. Nifty has to necessarily sustain above 17,250 in order to
keep the current uptrend intact. Incase Nifty breaks below 17,250, it cancome under pressure for a fresh corrective fall. In such a scenario, it canfall to 17,000 initially.
If so, traders will have to unwindtheir long positions and look to initiate fresh shorts in the market. Investors will also have to look for booking partial profi�ts at current levels andenter the market again on acorrection.
A bounceback move from 17,000 to17,400 cannot be ruled out. A furtherbreak below 17,000 can trigger amuch deeper fall to 16,70016,650eventually thereafter. Broadly, 17,25017,800 will be a range of trade for thenear term. A breakout on either side ofthis range will then determinewhether the Nifty can go up to 17,90017,950 or fall to 17,000.
Mediumterm outlook: The mediumterm trend is up. Any fall to17,000 and 16,70016,650 mentioned
above will just be a corrective fallwithin this mediumterm uptrend.
As mentioned last week, 16,60016,400 is a strong and crucial supportzone to watch from a mediumtermperspective.
The uptrend will come under threaton a strong break below 16,400. Such abreak can drag the Nifty to 16,000 initially. A further break below 16,000can take it down to 15,500 and 15,000over the medium term.
Sensex (59,015.89)The Sensex lost over 700 points fromits record high of 59,737.32 on Friday. Itwill have to be seen if it can sustainabove 59,000 this week which wouldaid the index to move up to new record highs.
The week ahead: If the Sensexmanages to sustain above 59,000 thisweek, it can rise to 60,00060,200 inthe near term. Thereafter a reversalis possible. But a fall below59,000 on Monday itself can drag it to58,500 initially.The levels of58,500 and58,000 are important supports. TheSensex has tosustainabove 58,000to keep thebroaderuptrend intact.A break below58,000 can bring itunder pressure for asharp correction towards57,000 and even 56,000.
Mediumterm outlook: The levelof 56,000 (revised lower from 57,000mentioned last week) will be a crucialsupport to watch from a mediumterm perspective. The mediumterm
uptrend will come under threat if theSensex breaks below 56,000. Such abreak can drag the index lower to54,000 and even 52,000 over the medium term.
Nifty Bank (37,811.95)The support at 36,200 mentioned lastweek has held very well and the NiftyBank index has surged over 3 per centlast week. This keeps the broaderbullish view of seeing 39,00039,500on the upside intact. Supports for theweek will be at 37,150 and 36,950. Aslightly deeper support is at 36,500.
Traders can go long on dips at37,200 and accumulate at 37,000.Stoploss can be placed at 36,800 forthe target of 38,500.
Global cuesOn the global front, the Dow Jones Industrial Average (34,584.88) was stuck
in a range of 34,50035,000 allthrough last week. On the
charts, the Dow looksvulnerable to break
34,500 and fall to34,000 initially.
As mentionedlast week,34,000 is avery cruciallevel towatch. Abreak below
it can triggera strong cor
rective fall towards 33,000 and
even 32,000 in thecoming months. In
that case, the Sensex andNifty can also come under pressure
for a sharp correction. As such, the price action in the Dow
will need a close watch in the comingdays as it could set the direction ofmove for the other global indices.
Indian indices retreat from peaks Limited upside from here for Sensex and Nifty 50 signals that a correction could be under way
Nifty 50: What to watch
B Important resistanceat 17,800
.................................................................................................................
B Crucial support at17,250
.................................................................................................................
B US FOMC meetingoutcome
.................................................................................................................
INDEX OUTLOOK
................BMBME
GURUMURTHY K..........................................
BL Research Bureau
The US dollar has risen well for thesecond consecutive week. The US dollar index rose above the key intermediate resistance level of 93 last weekand closed at 93.25.
A sharp fall in the euro hadtaken the dollar index higherlast week. The euro failed tosustain above the key 1.181.1780 support zone andtumbled to close theweek at 1.1725.
The dollar index gained momentum onThursday after the USretail sales data release.
US retail sales rose, contrary to themarket expectation to see a fall.
The total retail sales in the US rose0.71 per cent (monthonmonth) in August to $618,676 billion after dropping1.77 per cent in the previous month to$614.313 billion.
The rise in retail sales had increasedthe expectations in the market for theUS Federal Reserve to begin the stimulus tapering.
After this, all eyes will be on the Fedmeeting this week on Wednesday. Itwill be interesting to see how the market reacts to it. It is to be noted that the
Federal Reserve Chairman Jerome Powell stating
last month that the centralbank would begin tapering by theend of this year did not have much impact on the market.
Dollar Index: BullishThe US Dollar Index (93.25) has roomto test 93.7594 this week. The level of94 is a crucial resistance, which willhave to be broken to boost the bullishmomentum. Such a break can thentake the index up to 96 and evenhigher. It will also reduce the dangerof the index breaking below 92 andfalling back to 9089 levels. However, astrong trigger will be needed for theindex to break 94. Can the US FederalReserve provide that trigger this Wednesday in its policy meeting? We willhave to wait and watch.
Inability to break 94 can drag the index lower and keep it in the 9294
range for some moretime.
Euro: Near supportThe euro (1.1725)
has declinedsharply, breaking below thekey support
level of 1.1780 lastweek. The outlook is bearish.The next important support is at 1.17.
The price actionat 1.17 will need a
close watch. If the euro manages to
bounce from 1.17, a corrective rise to 1.18 can
be seen this week. But a break below1.17 will increase the downside pressure and can drag the euro to 1.16 andeven 1.15 in the coming weeks. Thatwill depend on whether the dollar index breaks above 94 or not.
Treasury yields: Resistance aheadThe US 10Yr Treasury Yield (1.36 percent) fell to 1.28 initially, last week.However, the good retail sales numbers aided the yields to rise back andclose on a strong note for the week. Animportant resistance is at 1.4 per cent,which can be tested ahead of the Fedmeeting on Wednesday.
A strong break above 1.4 per cent isneeded for the yields to move further
up towards 1.451.5 per cent, going forward. Inability to breach 1.4 per centcan drag the 10Yr Treasury yield downto 1.3 per cent again.
Rupee can weakenThe Indian rupee remained relativelystable and rangebound last week. Thedomestic currency had closed at 73.48on the spot market. But the strengthin the US dollar had dragged it to closefurther lower at 73.69 in the off�shoremarket.
The important resistance at 73.40mentioned last week has held verywell. The rupee made a high of 73.3450on Thursday and has reversed lowerfrom there.
If the rupee opens below 73.60 — animportant support in the spot market— it can then weaken to 73.8073.85and even 74 in the coming week. Thisis more likely to happen in the fi�rsthalf of the week ahead of Wednesday’sFed meeting outcome.
If the dollar index strengthens,breaking above 94, that can increasethe chances of the rupee declining below 74 this week. In that case the rupeecan weaken to 74.50 and even lower inthe coming weeks.
To sum up, 94 on the dollar index,1.17 on the euro, 1.4 per cent on the US10Yr Treasury yield and 74 on the Indian rupee are the crucial levels towatch this week. The outcome of theUS Federal Reserve meeting this weekwill decide whether these levels canbe broken or not.
IMAGES/ISTOCKPHOTO
GLOBAL 360
AN EYE ON 74If the rupee opensbelow 73.60 — animportant support inthe spot market — itcan then weaken to73.8073.85 and even74 in the comingweek
Dollar gains ahead of Fed meetingBut can the central bank provide the trigger tobreak 94 on the dollar index? Wait and watch
I want to invest in the stock of Engineers India Ltd. Myinvestment horizon is five years. Please advise.
VIKAS SHARMA
Engineers India (₹�73.8): The stock of EngineersIndia was in a downtrend from January 2018 to March2020. This downtrend had found strong support at ₹�57from a longterm trend line coming up from the low of2001. The stock made a low of ₹�49.2 in March this yearand started to rise. The longterm trend line support iscurrently at ₹�62. Thestock can be bought atcurrent levels. However,there are chances for thestock to oscillate in abroad range of ₹�6196 forseveral months. So, onewill need to waitpatiently for a breakout.But as long as the trendsupport at ₹�61 holds, thechances are high for thestock of Engineers India to break ₹�96 eventually in thecoming months. Such a break will then pave the way fora fresh rise to ₹�160170. Book profi�ts in the ₹�160170region. In case the stock breaks below ₹�61, it can fall to₹�45. Since your investment horizon is fi�ve years, you canaccumulate the stock at the levels of ₹�47. Keep thestoploss at ₹�34.
I would like to accumulate Tata Power. What is itstechnical outlook?
SANJAY KAIMAL
Tata Power Company Limited (₹�137.55): The stock ofTata Power Company Limited has been in an uptrendsince May last year. This uptrend is coming close to theprevious tops. There is limited room left on the upsidefrom current levels. The levels of ₹�147, ₹�152 and ₹�159 areimportant resistancesahead. Since the stockhas had a strong runup,it is unlikely to breachthe previous highs fromhere. As such we canexpect the stock to makea top anywhere in thebroad ₹�147₹�159resistance zone and thenreverse lower. Such areversal can drag thestock lower to ₹�120₹�115 initially. A strong break below₹�130 can trigger this fall. Although you have notmentioned your average purchase price, it is notadvisable to accumulate the stock at current levels.Instead, you can consider either booking profi�tscompletely in the ₹�147₹�159 region or at least for 50 percent of your holding. If you are going for the secondoption, then keep a stoploss at ₹�127 for the rest of the 50per cent holding and exit if the stock falls below ₹�130.
TECHQUERY
GURUMURTHY KBL Research Bureau
Send your queries to [email protected]
Dabur India (₹�654)Hits fresh lifetime high
The stock of Dabur India had a weak start tothe year as it saw its price soften during thefi�rst couple of months. That is, in February, itmade a low of ₹�497. However, ₹�500 being apsychological support, the stock quicklyrecovered above ₹�500. Following this, itestablished an uptrend. The price continuedto appreciate in the ensuing months, withminor intermittent corrections. Both the 21and 50day moving averages have beenoff�ering good support for the stock. The lastleg of rally began a month ago from around₹�575. But since the beginning of this month,the stock has been stuck in the range of ₹�630and ₹�645. Last week, it broke out of thisrange, opening the door for further gains. So,buy the stock with a stoploss at ₹�640; targetat ₹�680.
HCL Technologies (₹�1,263.3)Bulls running the show
Since the beginning of 2021, the stock of HCLTechnologies has been charting a broadsideways trend i.e., fl�uctuating within ₹�900and ₹�1,060. But in midAugust, it breachedthe upper limit of the range confi�rming abullish fl�ag pattern on the weekly chart. Thatis a bullish signal, and this pattern indicatesa potential target of ₹�1,750. Irrespective ofthis, the stock broke out of a range, and ithas been rallying with good momentum,hinting at more upside, at least in the nearterm. Notably, it registered a fresh alltimehigh of ₹�1,295.3 on Thursday before seeing adrop, which is likely to be nothing morethan a corrective decline before the stockaligning with a major uptrend. Hence,traders can initiate fresh long trades withstoploss at ₹�1,220 for a target of ₹�1,315.
SBI Life (₹�1,198.8)Looks set to rebound
The stock of SBI Life Insurance was fl�at untilend of April this year. The scrip was tradingfl�at in the price area of ₹�845 and ₹�960. Itbroke out of this range on the upside in earlyMay but could not extend the rally sharply.Rather, the stock was gaining at a slow pace,and rising along the 21day moving average(DMA). In midJuly, it gathered momentumand started to appreciate at better pace.Consequently, it marked a fresh high of₹�1,253.65 in early September. However, theprice declined from there and is nowhovering around ₹�1,200 where 21DMA lies.Importantly, the stock has bounced off� fromthis moving average support several timesand is more likely to repeat it. The overalltrend is bullish. So, one can buy withstoploss at ₹�1,150. Target can be at ₹�1,280.
Eicher Motors (₹�2,898.5)Sustaining above a support
The stock of Eicher Motors opened on thefront foot this year and made a fresh 52weekhigh of ₹�3,037 in January this year. But,thereafter the chart failed to keep up thetraction. As a result, the stock started to headsouthwards and in the fi�nal week of April, ithad fallen to mark a low of ₹�2,303.7, losingabout 24 per cent from the high of ₹�3,037.But the price level of ₹�2,300 being a goodsupport bulls capitalised on it and pushedthe price up. However, the stock was unableto crack the resistance band of ₹�2,775 and₹�2,800 until recently. Since past three weeks,the stock is on a rise. It rallied past ₹�2,800and has been able to sustain above this levelfor over a week. Thus, there can be moreupside and so buy with stoploss at ₹�2,830;target at ₹�3,035.
UPL (₹�742.3)Rejected at a resistance
The stock of UPL has had a sharp rally in2021 until early June. But the fortunes seemto have turned upside down for the stock asit reversed the trend and has been on asteady decline, making lower highs andlower lows. Post hitting the 52week high of₹�864.7 in June, the stock made a Uturn.While it rebounded by taking support at₹�770 towards the end of June, it could notmove past ₹�850. Eventually it fell and amonth ago, it slipped below ₹�770 turningthe nearterm outlook bearish. Even lastweek, the stock made an unsuccessfulattempt to go beyond ₹�770 only to see freshselloff�. The prevailing price action indicatesthe chances for further decline are high.Hence, initiate fresh shorts with stoploss at₹�770. Target can be ₹�680.
MOVERS & SHAKERS AKHIL NALLAMUTHU, BL Research Bureau
On April 1, four years back, piqued by the incessant jokes inthe village at his expense, Bandu Barve decided he’d hadenough. It was time for him to turn ‘smart’. His dead granny'svoice rang in his ears — “Read the papers, Bandya, they tellyou all.” So, off went Bandu to the stash of newspapers on hisfather’s desk. As luck would have it, the fi�rst paper Bandu gothis hands on was The Hindu BusinessLine. The stock recos, inparticular, had him in thrall. Soon Bandu metamorphosed intoan ace investor and trader.
These days, Bandupicks fi�ve stocks each
Sunday, which he believeswill be blockbusters over the next week
Here's your chance to match step with Bandu. Guess the stock that will give the best return by next Friday (BSE
prices). By Wednesday noon, mail us your pick and its expected pricerise to [email protected] with your name, mobile number
and address. One lucky winner will get a prize of ₹�2,000.
Last week’s prize winner
K.V.Subramanyam
Last week’s winning stock
Zensar Technologies
Closing price (Sep 9): ₹�468.55
Closing price (Sep 17): ₹�547.15
Return: 16.8 per cent
BANDU’S BLOCKBUSTERS
BANDU’s PICKS
■ SRF■ Swan Energy■ FDC■ Godrej Agrovet■ Fine Organic Industries
CMYK
MUMBAI
BusinessLine 7SUNDAY • SEPTEMBER 19 • 2021 CHART-GAZING
Scan & Share
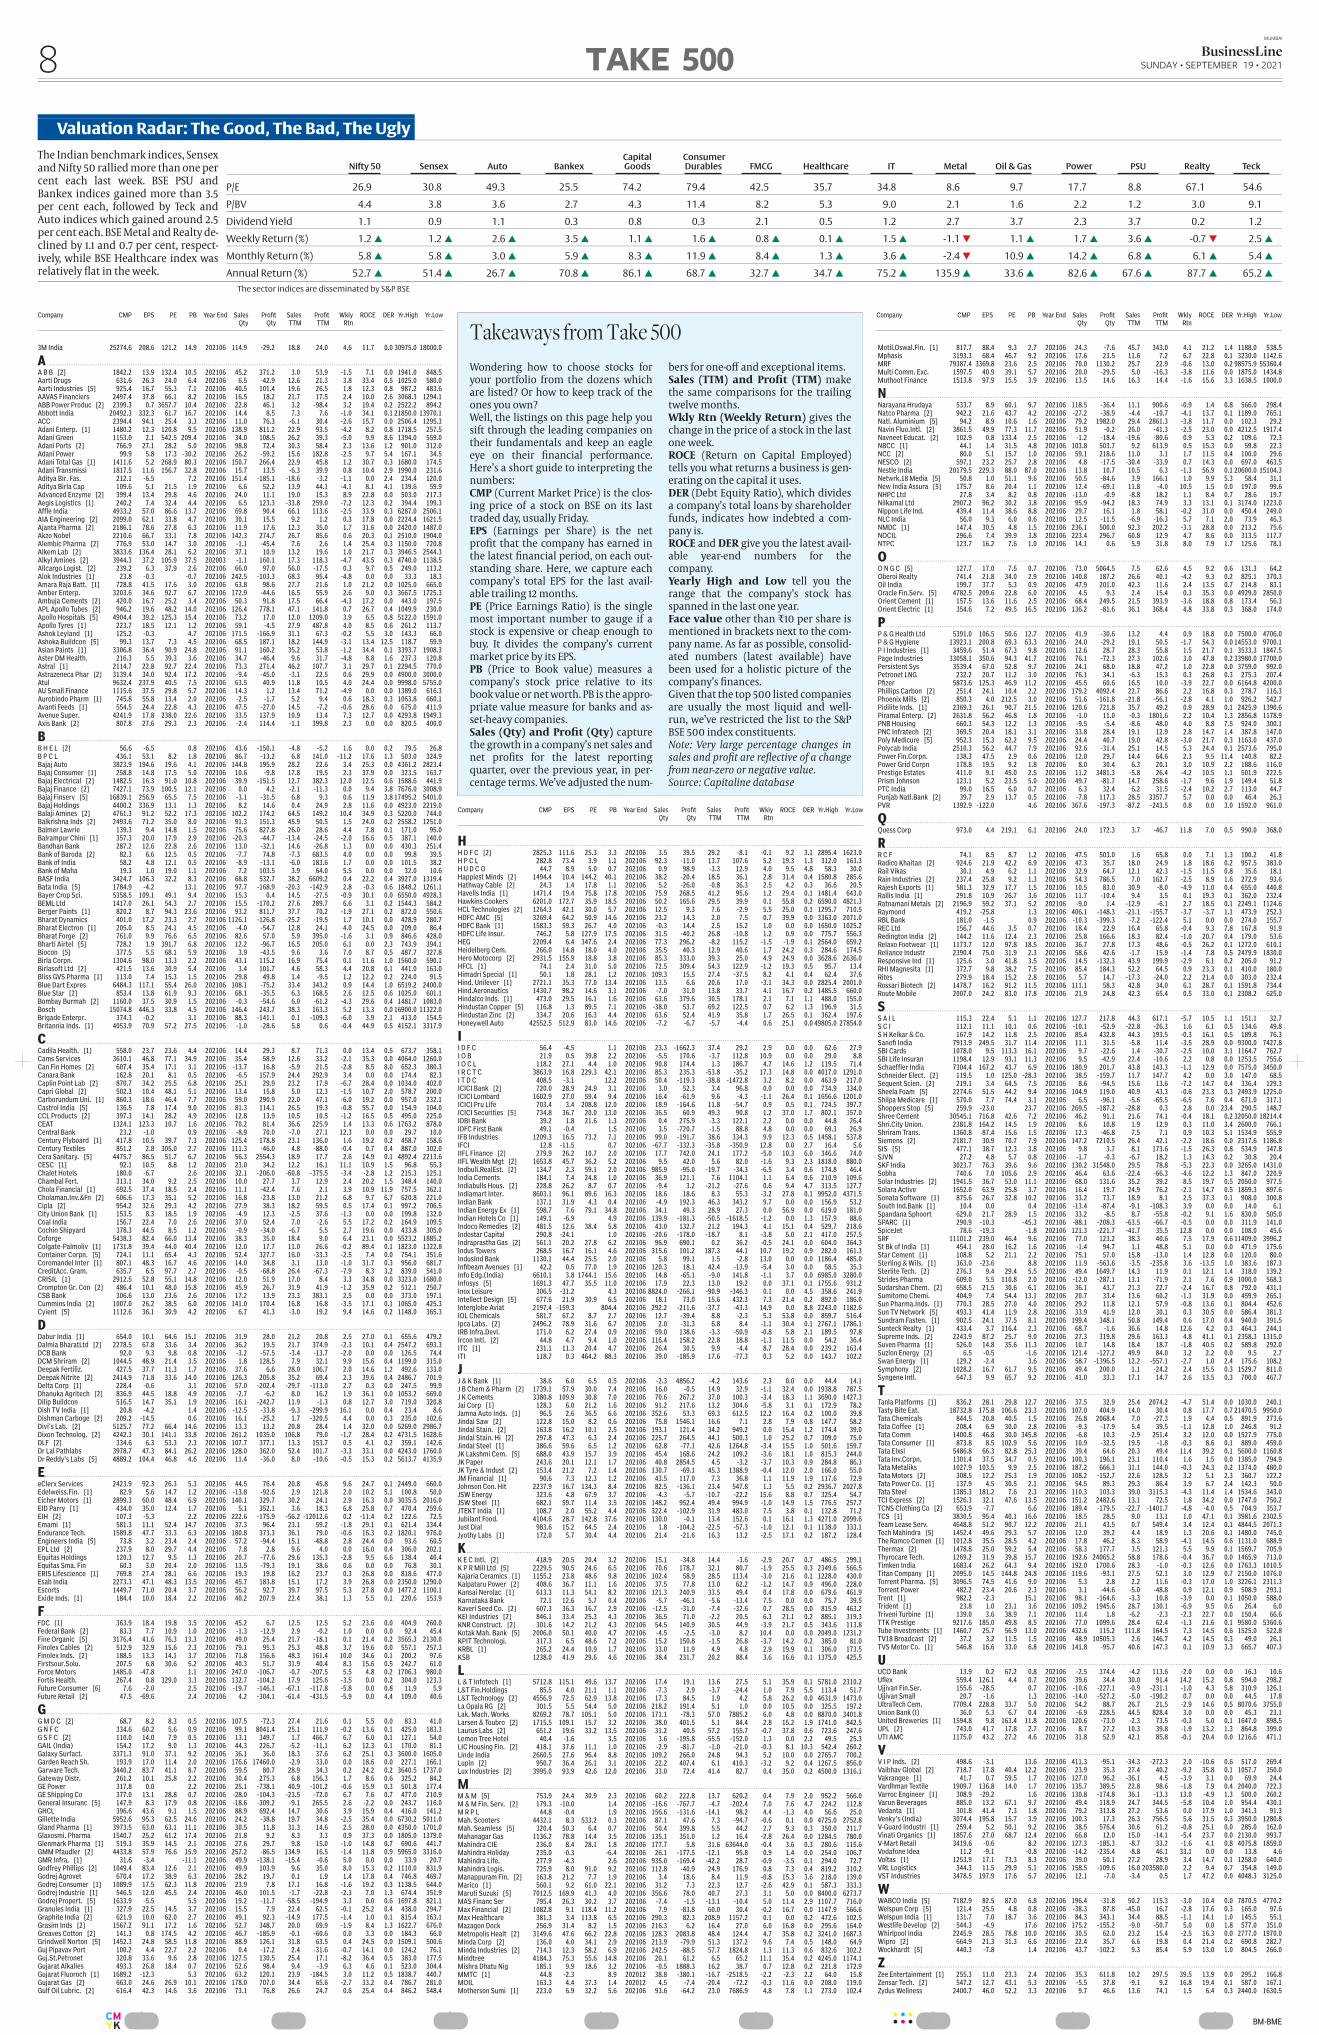
................BM-BME
Wondering how to choose stocks foryour portfolio from the dozens whichare listed? Or how to keep track of theones you own? Well, the listings on this page help yousift through the leading companies ontheir fundamentals and keep an eagleeye on their fi�nancial performance.Here’s a short guide to interpreting thenumbers:CMP (Current Market Price) is the closing price of a stock on BSE on its lasttraded day, usually Friday.EPS (Earnings per Share) is the netprofi�t that the company has earned inthe latest fi�nancial period, on each outstanding share. Here, we capture eachcompany’s total EPS for the last available trailing 12 months.PE (Price Earnings Ratio) is the singlemost important number to gauge if astock is expensive or cheap enough tobuy. It divides the company’s currentmarket price by its EPS.PB (Price to Book value) measures acompany’s stock price relative to itsbook value or net worth. PB is the appropriate value measure for banks and assetheavy companies.Sales (Qty) and Profit (Qty) capturethe growth in a company’s net sales andnet profi�ts for the latest reportingquarter, over the previous year, in percentage terms. We’ve adjusted the num
bers for oneoff� and exceptional items.Sales (TTM) and Profit (TTM) makethe same comparisons for the trailingtwelve months.Wkly Rtn (Weekly Return) gives thechange in the price of a stock in the lastone week.ROCE (Return on Capital Employed)tells you what returns a business is generating on the capital it uses.DER (Debt Equity Ratio), which dividesa company’s total loans by shareholderfunds, indicates how indebted a company is.ROCE and DER give you the latest available yearend numbers for thecompany.Yearly High and Low tell you therange that the company’s stock hasspanned in the last one year.Face value other than ₹�10 per share ismentioned in brackets next to the company name. As far as possible, consolidated numbers (latest available) havebeen used for a holistic picture of thecompany’s fi�nances. Given that the top 500 listed companiesare usually the most liquid and wellrun, we’ve restricted the list to the S&PBSE 500 index constituents.Note: Very large percentage changes insales and profit are reflective of a changefrom near-zero or negative value. Source: Capitaline database
Takeaways from Take 500
Valuation Radar: The Good, The Bad, The Ugly
Capital ConsumerNifty 50 Sensex Auto Bankex Goods Durables FMCG Healthcare IT Metal Oil & Gas Power PSU Realty Teck
P/E 26.9 30.8 49.3 25.5 74.2 79.4 42.5 35.7 34.8 8.6 9.7 17.7 8.8 67.1 54.6
P/BV 4.4 3.8 3.6 2.7 4.3 11.4 8.2 5.3 9.0 2.1 1.6 2.2 1.2 3.0 9.1
Dividend Yield 1.1 0.9 1.1 0.3 0.8 0.3 2.1 0.5 1.2 2.7 3.7 2.3 3.7 0.2 1.2
Weekly Return (%) 1.2 G 1.2 G 2.6 G 3.5 G 1.1 G 1.6 G 0.8 G 0.1 G 1.5 G -1.1 H 1.1 G 1.7 G 3.6 G -0.7 H 2.5 G
Monthly Return (%) 5.8 G 5.8 G 3.0 G 5.9 G 8.3 G 11.9 G 8.4 G 1.3 G 3.6 G -2.4 H 10.9 G 14.2 G 6.8 G 6.1 G 5.4 G
Annual Return (%) 52.7 G 51.4 G 26.7 G 70.8 G 86.1 G 68.7 G 32.7 G 34.7 G 75.2 G 135.9 G 33.6 G 82.6 G 67.6 G 87.7 G 65.2 G
The sector indices are disseminated by S&P BSE
Company CMP EPS PE PB Year End Sales Profit Sales Profit Wkly ROCE DER Yr.High Yr.LowQty Qty TTM TTM Rtn
Company CMP EPS PE PB Year End Sales Profit Sales Profit Wkly ROCE DER Yr.High Yr.LowQty Qty TTM TTM Rtn
Company CMP EPS PE PB Year End Sales Profit Sales Profit Wkly ROCE DER Yr.High Yr.LowQty Qty TTM TTM Rtn
The Indian benchmark indices, Sensexand Nifty 50 rallied more than one percent each last week. BSE PSU andBankex indices gained more than 3.5per cent each, followed by Teck andAuto indices which gained around 2.5per cent each. BSE Metal and Realty declined by 1.1 and 0.7 per cent, respectively, while BSE Healthcare index wasrelatively fl�at in the week.
3M India 25274.6 208.6 121.2 14.9 202106 114.9 -29.2 18.8 24.0 4.6 11.7 0.0 30975.0 18000.0
A . . . . . . . . . . . . . . . . . . . . . . . . . . . . . . . . . . . . . . . . . . . . . . . . . . . . . . . . . . . . . . . . . . . . . . . . . . . . . . . . . . . . . . . . . . . . . . . . . . . . . . . . . . . . . . . . . . . . . . . . . . . . . . . . . . . . . . . . . . . . . . . . . . . . . . . . . . . . . . . . . . . . . . . . . . . . . . . . . . . . . . . . . . . . . . . . . . . . . . . . . . . . . . . . . . . . . . . .
A B B [2] 1842.2 13.9 132.4 10.5 202106 45.2 371.2 3.0 53.9 -1.5 7.1 0.0 1941.0 848.5Aarti Drugs 631.6 26.3 24.0 6.4 202106 6.5 -42.9 12.6 21.3 3.8 33.4 0.5 1025.0 580.0Aarti Industries [5] 925.4 16.7 55.3 7.1 202106 40.5 101.4 19.6 26.5 1.8 12.3 0.8 987.2 483.6AAVAS Financiers 2497.4 37.8 66.1 8.2 202106 16.5 18.2 21.7 17.5 2.4 10.0 2.6 3068.3 1294.1ABB Power Produc [2] 2399.3 0.7 3657.7 10.4 202106 22.8 46.1 3.2 -98.4 3.2 19.4 0.2 2522.2 894.2Abbott India 20492.3 332.3 61.7 16.7 202106 14.4 8.5 7.3 7.6 -1.0 34.1 0.1 21850.0 13970.1ACC 2394.4 94.1 25.4 3.3 202106 11.0 76.3 -6.1 30.4 -2.6 15.7 0.0 2506.4 1295.3Adani Enterp. [1] 1480.2 12.3 120.8 9.5 202106 138.9 811.2 22.9 93.5 -4.2 8.2 0.8 1718.5 257.5Adani Green 1153.0 2.1 542.5 209.4 202106 34.0 108.5 26.2 39.3 -5.0 9.9 8.6 1394.0 559.0Adani Ports [2] 766.9 27.1 28.2 5.0 202106 98.8 72.4 30.3 58.4 2.3 13.6 1.2 901.0 312.0Adani Power 99.9 5.8 17.3 -30.2 202106 26.2 -59.2 15.6 182.8 -2.5 9.7 5.4 167.1 34.5Adani Total Gas [1] 1411.6 5.2 268.9 80.3 202106 150.7 266.4 22.9 45.8 1.2 30.7 0.3 1680.0 174.5Adani Transmissi 1817.5 11.6 156.7 32.8 202106 15.7 13.5 -6.3 39.9 0.8 10.4 2.9 1990.0 231.6Aditya Bir. Fas. 212.1 -6.5 7.2 202106 151.4 -185.1 -18.6 -3.2 -1.1 0.0 2.4 234.4 120.0Aditya Birla Cap 109.6 5.1 21.5 1.9 202106 6.6 52.2 13.9 44.1 -4.1 8.1 4.1 139.6 59.9Advanced Enzyme [2] 399.4 13.4 29.8 4.6 202106 24.0 11.1 19.0 15.3 8.9 22.8 0.0 503.0 217.3Aegis Logistics [1] 240.2 7.4 32.4 4.4 202106 6.5 123.3 -33.8 259.0 -7.2 12.3 0.2 394.4 199.3Affle India 4933.2 57.0 86.6 13.7 202106 69.8 90.4 66.1 113.6 -2.5 33.9 0.3 6287.0 2506.1AIA Engineering [2] 2099.0 62.1 33.8 4.7 202106 30.1 15.5 9.2 1.2 0.3 17.8 0.0 2224.4 1621.5Ajanta Pharma [2] 2186.1 78.6 27.8 6.3 202106 11.9 17.6 12.3 35.0 1.7 31.6 0.0 2420.0 1487.0Akzo Nobel 2210.6 66.7 33.1 7.8 202106 142.3 274.7 26.7 85.6 0.6 20.3 0.1 2510.0 1904.0Alembic Pharma [2] 776.9 53.0 14.7 3.0 202106 -1.1 -45.4 7.6 2.6 1.4 25.4 0.3 1150.0 720.8Alkem Lab [2] 3833.6 136.4 28.1 6.2 202106 37.1 10.9 13.2 19.6 1.0 21.7 0.3 3946.5 2544.3Alkyl Amines [2] 3944.3 37.2 105.9 37.5 202003 -1.1 160.1 17.3 118.3 -4.7 43.5 0.3 4740.0 1138.5Allcargo Logist. [2] 239.2 6.3 37.9 2.6 202106 66.0 97.0 56.0 -17.5 0.3 9.7 0.5 249.0 113.2Alok Industries [1] 23.8 -0.3 -0.7 202106 242.5 -103.3 68.3 95.4 -4.8 0.0 0.0 33.3 18.3Amara Raja Batt. [1] 728.8 41.5 17.6 3.0 202106 63.8 98.6 27.7 21.6 1.0 21.2 0.0 1025.0 665.0Amber Enterp. 3203.6 34.6 92.7 6.7 202106 172.9 -44.6 16.5 55.9 2.6 9.0 0.3 3667.5 1725.3Ambuja Cements [2] 420.0 16.7 25.2 3.4 202106 50.3 91.8 17.5 66.4 -4.3 17.2 0.0 443.0 197.5APL Apollo Tubes [2] 946.2 19.6 48.2 14.0 202106 126.4 778.1 47.1 141.8 0.7 26.7 0.4 1049.9 230.0Apollo Hospitals [5] 4904.4 39.2 125.3 15.4 202106 73.2 17.0 12.0 1209.0 3.9 6.5 0.8 5122.0 1591.0Apollo Tyres [1] 223.7 18.5 12.1 1.2 202106 59.1 -4.5 27.9 487.8 4.0 8.5 0.6 261.2 113.7Ashok Leyland [1] 125.2 -0.3 4.7 202106 171.5 -166.9 31.1 67.3 -0.2 5.5 3.0 143.3 66.0Ashoka Buildcon [5] 99.3 13.7 7.3 4.5 202106 68.5 187.1 18.2 144.9 -3.1 13.4 12.5 118.7 59.9Asian Paints [1] 3306.8 36.4 90.9 24.8 202106 91.1 160.2 35.2 53.8 -1.2 34.4 0.1 3393.7 1908.3Aster DM Health. 216.3 5.5 39.3 3.6 202106 34.7 -46.4 9.6 31.7 -4.8 8.8 1.6 237.3 120.8Astral [1] 2114.7 22.8 92.7 22.4 202106 73.3 271.4 46.2 107.7 3.1 29.7 0.1 2294.5 770.0Astrazeneca Phar [2] 3139.4 34.0 92.4 17.2 202106 -9.4 -45.0 -3.1 22.5 0.6 29.9 0.0 4900.0 3000.0Atul 9632.4 237.9 40.5 7.5 202106 63.5 40.9 11.8 10.5 4.0 24.4 0.0 9998.0 5755.0AU Small Finance 1115.6 37.5 29.8 5.7 202106 14.3 1.2 13.4 71.2 -4.9 0.0 0.0 1389.0 616.3Aurobindo Pharm [1] 745.8 55.8 13.4 2.0 202106 -2.5 -1.7 5.2 9.4 0.6 18.3 0.3 1063.8 660.1Avanti Feeds [1] 554.5 24.4 22.8 4.3 202106 47.5 -27.0 14.5 -7.2 -0.6 28.6 0.0 675.0 411.9Avenue Super. 4241.9 17.8 238.0 22.6 202106 33.5 137.9 10.9 13.4 7.3 12.7 0.0 4293.8 1949.3Axis Bank [2] 807.8 27.6 29.3 2.3 202106 -2.4 114.4 -1.1 399.8 2.3 0.0 0.0 820.5 400.0
B . . . . . . . . . . . . . . . . . . . . . . . . . . . . . . . . . . . . . . . . . . . . . . . . . . . . . . . . . . . . . . . . . . . . . . . . . . . . . . . . . . . . . . . . . . . . . . . . . . . . . . . . . . . . . . . . . . . . . . . . . . . . . . . . . . . . . . . . . . . . . . . . . . . . . . . . . . . . . . . . . . . . . . . . . . . . . . . . . . . . . . . . . . . . . . . . . . . . . . . . . . . . . . . . . . . . . . . .
B H E L [2] 56.6 -6.5 0.8 202106 43.6 -150.1 -4.8 -5.2 1.6 0.0 0.2 79.5 26.8B P C L 436.1 53.1 8.2 1.8 202106 86.7 -13.2 6.8 141.0 -11.2 17.6 1.3 503.0 324.9Bajaj Auto 3823.9 194.6 19.6 4.1 202106 144.8 195.9 28.2 22.6 3.4 25.3 0.0 4361.2 2823.4Bajaj Consumer [1] 258.8 14.8 17.5 5.0 202106 10.6 -9.8 17.8 19.5 2.3 37.9 0.0 323.5 163.7Bajaj Electrical [2] 1482.5 16.3 91.0 10.8 202106 39.9 -151.5 12.7 382.3 12.0 12.5 0.6 1588.6 441.9Bajaj Finance [2] 7427.1 73.9 100.5 12.1 202106 0.0 4.2 -2.1 -11.3 0.0 9.4 3.8 7676.0 3008.9Bajaj Finserv [5] 16839.1 256.9 65.5 7.5 202106 -3.1 -31.5 6.8 9.3 0.6 11.9 3.8 17495.2 5401.0Bajaj Holdings 4400.2 336.9 13.1 1.3 202106 8.2 14.6 0.4 24.9 2.8 11.6 0.0 4923.0 2219.0Balaji Amines [2] 4761.3 91.2 52.2 17.3 202106 102.2 174.2 64.5 149.2 10.4 34.9 0.3 5220.0 744.0Balkrishna Inds [2] 2493.6 71.2 35.0 8.0 202106 91.3 151.3 45.9 50.5 1.5 24.0 0.2 2558.2 1251.0Balmer Lawrie 139.3 9.4 14.8 1.5 202106 75.6 827.8 26.0 28.6 4.4 7.8 0.1 171.0 95.0Balrampur Chini [1] 357.3 20.0 17.9 2.9 202106 -20.3 -44.7 -13.4 -24.5 -2.0 16.6 0.5 387.1 140.0Bandhan Bank 287.2 12.6 22.8 2.6 202106 13.0 -32.1 14.6 -26.8 1.3 0.0 0.0 430.3 251.4Bank of Baroda [2] 82.3 6.6 12.5 0.5 202106 -7.7 74.8 -7.3 683.5 4.0 0.0 0.0 99.8 39.5Bank of India 58.2 4.8 12.1 0.5 202106 -8.9 -13.1 -6.0 183.6 1.7 0.0 0.0 101.5 38.2Bank of Maha 19.3 1.0 19.0 1.1 202106 7.2 103.5 3.9 64.0 5.5 0.0 0.0 32.0 10.6BASF India 3424.7 106.3 32.2 8.3 202106 68.8 532.7 38.2 6609.2 0.4 22.2 0.4 3927.0 1319.4Bata India [5] 1784.9 -4.2 13.1 202106 97.7 -168.9 -20.3 -142.9 2.8 -0.3 0.6 1848.2 1261.1Bayer Crop Sci. 5358.5 109.1 49.1 9.4 202106 15.3 0.4 14.5 -27.5 -0.9 30.1 0.0 6550.0 4928.3BEML Ltd 1417.0 26.1 54.3 2.7 202106 15.5 -170.2 27.6 289.7 6.6 3.1 0.2 1544.3 584.2Berger Paints [1] 820.2 8.7 94.3 23.6 202106 93.2 811.7 37.7 70.2 -1.9 27.1 0.2 872.0 550.6Bharat Dynamics 401.0 17.2 23.3 2.7 202106 1126.1 -126.8 -25.2 -19.5 1.7 10.1 0.0 428.9 280.7Bharat Electron [1] 205.0 8.5 24.1 4.5 202106 -4.0 -54.7 12.8 24.1 4.0 24.5 0.0 209.0 86.4Bharat Forge [2] 761.0 9.9 76.6 6.5 202106 82.6 57.0 5.9 395.0 -1.6 3.1 0.9 846.6 428.0Bharti Airtel [5] 728.2 1.9 391.7 6.8 202106 12.2 -96.7 16.5 205.0 6.1 0.0 2.3 743.9 394.1Biocon [5] 377.5 5.5 68.1 5.9 202106 3.9 -43.5 9.6 3.6 7.0 8.7 0.5 487.7 327.8Birla Corpn. 1304.6 98.0 13.3 2.2 202106 43.1 115.2 16.9 75.4 0.1 11.6 1.0 1560.0 590.1Birlasoft Ltd [2] 421.5 13.6 30.9 5.4 202106 3.4 101.7 4.6 58.3 4.4 20.8 0.1 441.0 163.0Bliss GVS Pharma [1] 113.0 7.4 15.3 1.5 202106 29.8 49.8 1.4 -9.5 1.2 12.2 0.2 224.0 91.5Blue Dart Expres 6484.3 117.1 55.4 26.0 202106 108.1 -75.2 33.4 343.2 0.9 14.4 1.0 6519.2 2400.0Blue Star [2] 853.4 13.8 61.9 9.3 202106 68.1 -35.5 6.3 168.5 2.6 12.5 0.6 1025.0 601.1Bombay Burmah [2] 1160.0 37.5 30.9 1.5 202106 -0.3 -54.6 6.0 -61.2 -4.3 29.6 0.4 1481.7 1083.0Bosch 15074.8 446.3 33.8 4.5 202106 146.4 243.7 38.3 163.3 5.2 13.3 0.0 16900.0 11322.0Brigade Enterpr. 374.3 -0.2 3.1 202106 88.3 -141.1 0.1 -109.3 -6.0 3.9 2.1 413.0 154.5Britannia Inds. [1] 4053.9 70.9 57.2 27.5 202106 -1.0 -28.6 5.8 0.6 -0.4 44.9 0.5 4152.1 3317.9
C . . . . . . . . . . . . . . . . . . . . . . . . . . . . . . . . . . . . . . . . . . . . . . . . . . . . . . . . . . . . . . . . . . . . . . . . . . . . . . . . . . . . . . . . . . . . . . . . . . . . . . . . . . . . . . . . . . . . . . . . . . . . . . . . . . . . . . . . . . . . . . . . . . . . . . . . . . . . . . . . . . . . . . . . . . . . . . . . . . . . . . . . . . . . . . . . . . . . . . . . . . . . . . . . . . . . . . . .
Cadila Health. [1] 558.0 23.7 23.6 4.4 202106 14.4 29.3 8.7 71.3 0.0 13.4 0.5 673.7 358.1Cams Services 3610.1 46.8 77.1 34.9 202106 35.4 58.9 12.6 33.2 -2.1 35.3 0.0 4064.0 1260.0Can Fin Homes [2] 607.4 35.4 17.1 3.1 202106 -13.7 16.8 -5.9 21.5 -2.8 8.5 8.0 652.3 380.3Canara Bank 162.8 20.1 8.1 0.5 202106 -6.5 157.9 24.4 292.9 3.4 0.0 0.0 174.4 82.3Caplin Point Lab [2] 870.7 34.2 25.5 6.8 202106 25.1 29.9 23.2 17.9 -6.7 28.4 0.0 1034.0 402.0Capri Global [2] 502.3 10.4 48.1 5.1 202106 13.4 15.8 5.0 12.3 -1.5 10.7 2.0 578.7 200.0Carborundum Uni. [1] 860.3 18.6 46.4 7.7 202106 59.0 290.9 22.0 47.1 -6.0 19.2 0.0 957.0 232.1Castrol India [5] 136.5 7.8 17.4 9.0 202106 81.3 114.1 26.5 19.3 -0.8 55.7 0.0 154.9 104.0CCL Products [2] 397.3 14.1 28.2 4.9 202106 12.8 13.9 10.5 10.5 -1.2 16.5 0.5 495.0 225.0CEAT 1324.1 123.3 10.7 1.6 202106 70.2 81.4 36.6 225.9 1.4 13.3 0.6 1763.2 878.0Central Bank 23.2 -1.0 0.9 202106 -8.9 70.0 -7.0 27.1 12.3 0.0 0.0 29.7 10.0Century Plyboard [1] 417.8 10.5 39.7 7.3 202106 125.4 178.8 23.1 136.0 1.6 19.2 0.2 458.7 158.6Century Textiles 851.2 2.8 305.0 2.7 202106 111.3 -46.0 4.8 -88.0 -0.4 0.7 0.4 887.0 302.0Cera Sanitary. [5] 4475.7 86.5 51.7 6.7 202106 56.3 2554.3 18.9 17.7 2.6 14.9 0.1 4892.4 2213.6CESC [1] 92.1 10.5 8.8 1.2 202106 23.0 34.2 12.2 16.1 11.1 10.9 1.5 96.8 55.3Chalet Hotels 180.0 -6.7 2.6 202106 32.1 -206.0 -60.8 -375.5 -3.4 -2.8 1.2 215.3 125.1Chambal Fert. 313.1 34.0 9.2 2.5 202106 10.0 27.7 3.7 12.9 2.4 20.2 1.5 348.4 140.0Chola Financial [1] 692.5 37.4 18.5 2.4 202106 11.1 -42.4 7.6 2.1 3.9 10.9 11.9 757.5 362.1Cholaman.Inv.&Fn [2] 606.6 17.3 35.1 5.2 202106 16.8 -23.8 13.0 21.2 6.8 9.7 6.7 620.8 221.0Cipla [2] 954.2 32.6 29.3 4.2 202106 27.9 38.3 18.2 59.5 0.5 17.4 0.1 997.2 706.5City Union Bank [1] 153.5 8.3 18.5 1.9 202106 -4.9 12.3 -2.5 37.6 -1.3 0.0 0.0 199.8 132.0Coal India 156.7 22.4 7.0 2.6 202106 37.0 52.4 7.0 -2.6 5.5 17.2 0.2 164.9 109.5Cochin Shipyard 378.3 44.5 8.5 1.2 202106 -0.9 -34.0 -6.7 5.5 2.7 19.6 0.0 433.8 305.0Coforge 5438.3 82.4 66.0 13.4 202106 38.3 35.0 18.4 9.0 6.4 23.1 0.0 5523.2 1885.2Colgate-Palmoliv [1] 1731.8 39.4 44.0 40.4 202106 12.0 17.7 11.0 26.6 -0.2 89.4 0.1 1823.0 1322.8Container Corpn. [5] 724.1 11.1 65.4 4.3 202106 52.4 327.7 16.0 -33.3 -2.5 7.4 0.0 754.1 351.6Coromandel Inter [1] 807.1 48.3 16.7 4.6 202106 14.0 34.8 3.1 13.0 -1.0 31.7 0.3 956.0 681.7CreditAcc. Gram. 635.7 6.5 97.7 2.7 202106 -0.5 -68.8 26.4 -67.3 -7.9 8.3 3.2 839.0 541.0CRISIL [1] 2912.5 52.8 55.1 14.8 202106 12.0 51.9 17.0 8.4 3.3 34.8 0.0 3323.0 1680.0Crompton Gr. Con [2] 486.4 10.1 48.0 15.8 202106 45.9 26.7 31.9 41.9 -1.2 35.9 0.2 512.1 250.7CSB Bank 306.6 13.0 23.6 2.6 202106 17.2 13.9 23.3 383.1 2.5 0.0 0.0 373.0 197.1Cummins India [2] 1007.0 26.2 38.5 6.0 202106 141.0 170.4 16.8 16.8 -3.5 17.1 0.1 1065.0 425.3Cyient [5] 1112.6 36.1 30.9 4.2 202106 6.7 41.3 -3.0 19.2 9.4 14.6 0.2 1148.0 365.3
D . . . . . . . . . . . . . . . . . . . . . . . . . . . . . . . . . . . . . . . . . . . . . . . . . . . . . . . . . . . . . . . . . . . . . . . . . . . . . . . . . . . . . . . . . . . . . . . . . . . . . . . . . . . . . . . . . . . . . . . . . . . . . . . . . . . . . . . . . . . . . . . . . . . . . . . . . . . . . . . . . . . . . . . . . . . . . . . . . . . . . . . . . . . . . . . . . . . . . . . . . . . . . . . . . . . . . . . .
Dabur India [1] 654.0 10.1 64.6 15.1 202106 31.9 28.0 21.2 20.8 2.5 27.0 0.1 655.6 479.2Dalmia BharatLtd [2] 2278.5 67.8 33.6 3.4 202106 36.2 19.5 21.7 374.9 -2.3 10.1 0.4 2547.2 693.3DCB Bank 92.0 9.3 9.8 0.8 202106 -3.2 -57.5 -3.4 -13.7 -2.0 0.0 0.0 126.5 74.4DCM Shriram [2] 1044.5 48.9 21.4 3.5 202106 1.8 128.5 7.9 32.1 9.9 15.6 0.4 1199.0 315.0Deepak Fertiliz. 427.5 37.7 11.3 1.7 202106 37.6 6.6 28.0 106.7 2.0 14.6 1.2 492.6 133.0Deepak Nitrite [2] 2414.9 71.8 33.6 14.0 202106 126.3 205.8 35.2 69.4 2.3 39.6 0.4 2486.7 701.9Delta Corp [1] 228.4 -0.6 3.1 202106 57.0 -202.4 -29.7 -113.0 2.7 0.3 0.0 247.5 99.9Dhanuka Agritech [2] 836.9 44.5 18.8 4.9 202106 -2.7 -6.2 8.0 16.2 1.9 36.1 0.0 1053.2 669.0Dilip Buildcon 516.5 14.7 35.1 1.9 202106 16.1 -242.7 11.9 -1.3 0.8 12.7 3.0 719.0 320.8Dish TV India [1] 20.8 -4.2 1.4 202106 -12.5 -33.8 -9.3 -299.9 16.1 0.0 0.4 23.4 8.6Dishman Carboge [2] 209.2 -14.5 0.6 202106 16.1 -25.2 1.7 -320.5 4.4 0.0 0.3 235.0 102.6Divi's Lab. [2] 5125.7 77.2 66.4 14.6 202106 13.3 13.2 20.8 28.4 1.4 32.0 0.0 5269.0 2986.7Dixon Technolog. [2] 4242.3 30.1 141.1 33.8 202106 261.2 1035.0 106.8 79.0 -1.7 28.4 0.2 4731.5 1628.6DLF [2] 334.6 6.3 53.3 2.3 202106 107.7 377.1 13.3 153.7 0.5 4.1 0.2 359.1 142.6Dr Lal Pathlabs 3978.7 47.3 84.1 26.2 202106 128.0 362.0 52.4 101.7 -3.3 33.1 0.0 4243.0 1760.0Dr Reddy's Labs [5] 4889.2 104.4 46.8 4.6 202106 11.4 -36.0 8.0 -10.6 -0.5 15.3 0.2 5613.7 4135.9
E. . . . . . . . . . . . . . . . . . . . . . . . . . . . . . . . . . . . . . . . . . . . . . . . . . . . . . . . . . . . . . . . . . . . . . . . . . . . . . . . . . . . . . . . . . . . . . . . . . . . . . . . . . . . . . . . . . . . . . . . . . . . . . . . . . . . . . . . . . . . . . . . . . . . . . . . . . . . . . . . . . . . . . . . . . . . . . . . . . . . . . . . . . . . . . . . . . . . . . . . . . . . . . . . . . . . . . . . .
eClerx Services 2423.9 92.3 26.3 5.3 202106 44.5 76.4 20.8 45.8 9.6 24.7 0.1 2449.0 660.0Edelweiss.Fin. [1] 82.9 5.6 14.7 1.2 202106 -13.8 -92.6 2.9 121.8 2.0 10.2 5.1 100.8 50.0Eicher Motors [1] 2899.3 60.0 48.4 6.9 202106 140.1 329.7 30.2 24.1 2.9 16.3 0.0 3035.5 2016.0EID Parry [1] 434.0 35.0 12.4 1.7 202106 5.1 352.1 3.6 18.3 6.8 25.8 0.7 470.4 259.6EIH [2] 107.3 -5.3 2.2 202106 222.6 -175.9 -56.2 -12012.6 0.2 -11.4 0.2 122.6 72.5Emami [1] 581.3 11.1 52.4 14.7 202106 37.3 96.4 23.1 59.2 -1.8 29.1 0.1 621.4 334.4Endurance Tech. 1589.8 47.7 33.3 6.3 202106 180.8 373.3 36.1 79.0 -0.6 16.3 0.2 1820.1 976.0Engineers India [5] 73.8 3.2 23.4 2.4 202106 57.2 -94.4 15.1 -48.8 2.8 24.4 0.0 93.6 60.5EPL Ltd [2] 237.9 8.0 29.7 4.4 202106 7.8 2.8 9.6 4.0 0.0 16.0 0.4 306.0 202.1Equitas Holdings 120.3 12.7 9.5 1.3 202106 20.7 -77.6 29.6 135.3 -2.8 9.5 6.6 138.4 40.4Equitas Sma. Fin 60.3 3.0 20.4 2.0 202106 13.5 -79.3 19.1 38.6 0.6 0.0 0.0 76.8 30.1ERIS Lifescience [1] 769.8 27.4 28.1 6.6 202106 19.3 19.8 16.2 23.7 0.3 26.8 0.0 818.6 477.0Esab India 2273.3 47.1 48.3 13.5 202106 45.7 183.8 15.1 17.2 3.9 26.8 0.0 2350.0 1290.0Escorts 1449.7 71.0 20.4 3.7 202106 56.2 92.7 39.7 97.5 5.3 27.8 0.0 1477.2 1100.1Exide Inds. [1] 184.4 10.0 18.4 2.2 202106 40.2 207.9 22.4 38.1 1.3 5.5 0.1 220.6 153.9
F . . . . . . . . . . . . . . . . . . . . . . . . . . . . . . . . . . . . . . . . . . . . . . . . . . . . . . . . . . . . . . . . . . . . . . . . . . . . . . . . . . . . . . . . . . . . . . . . . . . . . . . . . . . . . . . . . . . . . . . . . . . . . . . . . . . . . . . . . . . . . . . . . . . . . . . . . . . . . . . . . . . . . . . . . . . . . . . . . . . . . . . . . . . . . . . . . . . . . . . . . . . . . . . . . . . . . . . . .
FDC [1] 363.9 18.4 19.8 3.5 202106 45.2 6.7 12.5 12.5 5.2 23.6 0.0 404.9 260.0Federal Bank [2] 83.3 7.7 10.9 1.0 202106 -1.3 -12.9 2.9 -0.2 1.0 0.0 0.0 92.4 45.4Fine Organic [5] 3176.4 41.6 76.3 13.3 202106 49.0 25.4 21.7 -18.1 0.1 21.4 0.2 3565.3 2130.0Finolex Cables [2] 512.9 32.9 15.6 2.3 202106 79.1 95.3 25.3 48.8 3.7 19.6 0.0 557.1 257.3Finolex Inds. [2] 188.5 13.3 14.1 3.7 202106 71.8 156.6 48.3 161.4 10.0 34.6 0.1 200.2 97.6Firstsour.Solu. 207.5 6.8 30.6 5.2 202106 40.3 51.7 31.9 40.4 8.3 15.6 0.5 242.7 61.0Force Motors 1485.0 -47.8 1.1 202106 247.0 -106.7 -0.7 -207.5 5.5 4.8 0.2 1706.3 980.0Fortis Health. 267.4 0.8 329.0 3.3 202106 132.7 -104.2 17.9 125.6 -3.5 0.0 0.2 304.0 123.3Future Consumer [6] 7.6 -2.0 2.5 202106 -19.7 -146.1 -67.1 -117.8 -5.8 0.0 0.8 11.9 5.9Future Retail [2] 47.5 -69.6 2.4 202106 4.2 -304.1 -61.4 -431.5 -5.9 0.0 4.4 109.0 40.6
G . . . . . . . . . . . . . . . . . . . . . . . . . . . . . . . . . . . . . . . . . . . . . . . . . . . . . . . . . . . . . . . . . . . . . . . . . . . . . . . . . . . . . . . . . . . . . . . . . . . . . . . . . . . . . . . . . . . . . . . . . . . . . . . . . . . . . . . . . . . . . . . . . . . . . . . . . . . . . . . . . . . . . . . . . . . . . . . . . . . . . . . . . . . . . . . . . . . . . . . . . . . . . . . . . . . . . . . .
G M D C [2] 68.7 8.2 8.3 0.5 202106 107.5 -72.3 27.4 21.6 0.1 5.5 0.0 83.3 41.0G N F C 334.6 60.2 5.6 0.9 202106 99.1 8041.4 25.1 111.9 -0.2 13.6 0.1 425.0 183.3G S F C [2] 110.0 14.0 7.9 0.5 202106 13.1 349.7 1.7 466.7 6.7 6.0 0.1 127.1 54.0GAIL (India) 154.2 17.2 9.0 1.3 202106 44.3 226.7 -5.2 -11.1 6.2 12.3 0.1 170.0 81.3Galaxy Surfact. 3371.3 91.0 37.1 9.2 202106 36.1 36.0 18.3 37.6 6.2 25.1 0.3 3600.0 1605.0Garden Reach Sh. 193.9 17.0 11.4 2.0 202106 176.6 17460.0 -2.9 33.0 0.0 18.6 0.0 227.1 166.1Garware Tech. 3440.2 83.7 41.1 8.7 202106 59.5 80.7 28.9 34.3 0.2 24.2 0.2 3640.5 1737.0Gateway Distr. 261.2 10.1 25.8 2.2 202106 30.4 275.3 6.8 156.3 1.7 8.6 0.6 325.2 84.2GE Power 317.8 0.0 2.2 202106 25.1 -738.1 40.9 -101.2 -0.6 15.9 0.3 501.8 177.4GE Shipping Co 377.0 13.1 28.8 0.7 202106 -28.0 -104.3 -23.5 -72.0 6.7 7.6 0.7 477.0 210.9General Insuranc [5] 147.9 8.3 17.9 0.8 202106 -18.6 -309.2 -9.1 265.5 2.6 -2.2 0.0 243.7 116.0GHCL 396.6 43.6 9.1 1.5 202106 88.9 692.4 14.7 30.6 3.9 15.9 0.4 416.0 141.2Gillette India 5952.6 95.3 62.5 24.6 202106 24.2 -38.8 19.7 34.8 -2.5 35.4 0.0 6730.2 5011.0Gland Pharma [1] 3973.5 63.0 63.1 11.1 202106 30.5 11.8 31.3 14.6 2.5 28.0 0.0 4350.0 1701.0Glaxosmi. Pharma 1540.7 25.2 61.2 17.4 202106 21.8 9.2 8.3 3.3 0.9 37.3 0.0 1805.0 1379.0Glenmark Pharma [1] 519.3 35.9 14.5 2.1 202106 27.6 29.7 9.8 15.0 -1.0 14.8 0.7 690.6 441.7GMM Pfaudler [2] 4433.8 57.9 76.6 15.9 202106 257.2 -86.5 134.9 16.5 -1.4 11.8 0.9 5965.0 3316.0GMR Infra. [1] 31.6 -3.4 -11.1 202106 49.9 -138.1 -15.4 -0.6 5.0 0.0 0.0 33.9 20.7Godfrey Phillips [2] 1049.4 83.4 12.6 2.1 202106 49.9 103.9 9.6 35.0 8.0 15.3 0.2 1110.0 831.9Godrej Agrovet 670.4 17.2 38.9 6.3 202106 28.2 19.7 0.1 1.9 1.4 17.8 0.4 746.8 469.7Godrej Consumer [1] 1089.9 17.5 62.3 11.8 202106 23.9 7.8 17.1 16.8 -1.6 19.2 0.3 1138.5 644.0Godrej Industrie [1] 546.5 12.0 45.5 2.4 202106 46.0 101.5 -1.7 -22.8 -2.3 7.0 1.3 674.4 351.9Godrej Propert. [5] 1633.9 -5.5 5.5 202106 19.2 -11.7 -58.5 -194.9 3.3 0.0 0.6 1697.8 821.1Granules India [1] 327.9 22.5 14.5 3.7 202106 15.5 7.9 22.4 62.5 -0.1 25.2 0.4 438.0 294.7Graphite India [2] 621.9 10.0 62.0 2.7 202106 49.1 92.3 -14.9 177.5 -1.4 1.0 0.1 815.4 163.1Grasim Inds [2] 1567.2 91.1 17.2 1.6 202106 52.7 348.7 20.0 69.9 -1.9 8.4 1.3 1622.7 676.0Greaves Cotton [2] 141.3 0.8 174.5 4.2 202106 46.7 -185.9 -0.1 -60.6 0.0 3.3 0.0 184.3 66.0Grindwell Norton [5] 1452.3 24.8 58.5 11.8 202106 88.9 126.1 31.8 63.5 0.4 24.5 0.0 1509.1 500.6Guj Pipavav Port 100.2 4.4 22.7 2.2 202106 0.4 -17.2 2.4 -31.6 -0.7 14.1 0.0 124.2 76.1Guj.St.Petronet 320.8 33.6 9.6 2.8 202106 127.5 130.5 25.4 17.1 -8.2 36.4 0.5 383.0 177.5Gujarat Alkalies 493.3 26.8 18.4 0.7 202106 52.6 98.4 9.4 -3.9 6.3 4.6 0.1 523.0 304.4Gujarat Fluoroch [1] 1689.2 -12.3 5.3 202106 63.2 120.1 23.9 -184.5 3.0 11.2 0.5 1838.7 440.7Gujarat Gas [2] 663.0 24.6 26.9 10.1 202106 178.0 707.0 34.4 65.6 -2.7 33.2 0.4 786.7 281.0Gulf Oil Lubric. [2] 616.4 42.3 14.6 3.6 202106 73.1 76.8 26.6 24.7 0.6 25.4 0.4 846.2 548.4
Motil.Oswal.Fin. [1] 817.7 88.4 9.3 2.7 202106 24.3 -7.6 45.7 343.0 4.1 21.2 1.4 1188.0 538.5Mphasis 3193.3 68.4 46.7 9.2 202106 17.6 23.5 11.6 7.2 6.7 22.8 0.1 3230.0 1142.6MRF 79387.4 3369.8 23.6 2.5 202106 70.0 1130.2 25.7 22.9 -0.6 13.0 0.2 98575.9 55360.4Multi Comm. Exc. 1597.5 40.9 39.1 5.7 202106 20.0 -29.5 5.0 -16.3 -3.8 11.6 0.0 1875.0 1434.8Muthoot Finance 1513.8 97.9 15.5 3.9 202106 13.5 14.6 16.3 14.4 -1.6 15.6 3.3 1638.5 1000.0
N . . . . . . . . . . . . . . . . . . . . . . . . . . . . . . . . . . . . . . . . . . . . . . . . . . . . . . . . . . . . . . . . . . . . . . . . . . . . . . . . . . . . . . . . . . . . . . . . . . . . . . . . . . . . . . . . . . . . . . . . . . . . . . . . . . . . . . . . . . . . . . . . . . . . . . . . . . . . . . . . . . . . . . . . . . . . . . . . . . . . . . . . . . . . . . . . . . . . . . . . . . . . . . . . . . . . . . . .
Narayana Hrudaya 533.7 8.9 60.1 9.7 202106 118.5 -36.4 11.1 900.6 -0.9 1.4 0.8 566.0 298.4Natco Pharma [2] 942.2 21.6 43.7 4.2 202106 -27.2 -38.9 -4.4 -10.7 -4.1 13.7 0.1 1189.0 765.1Natl. Aluminium [5] 94.2 8.9 10.6 1.6 202106 79.2 1982.0 29.4 2861.3 -3.8 11.7 0.0 102.3 29.2Navin Fluo.Intl. [2] 3861.5 49.9 77.3 11.7 202106 51.9 -0.2 26.0 -41.3 -2.5 23.0 0.0 4212.5 1917.4Navneet Educat. [2] 102.9 0.8 133.4 2.5 202106 -1.2 -18.4 -19.6 -80.6 0.9 5.3 0.2 109.6 72.3NBCC [1] 44.1 1.4 31.5 4.8 202106 103.8 503.7 9.2 613.9 0.5 15.3 0.0 59.8 22.3NCC [2] 80.0 5.1 15.7 1.0 202106 59.1 218.6 11.0 3.1 1.7 11.5 0.4 100.0 29.6NESCO [2] 597.1 23.2 25.7 2.8 202106 4.8 -17.5 -30.4 -33.9 0.7 14.3 0.0 697.0 463.5Nestle India 20179.5 229.3 88.0 87.0 202106 13.8 10.7 10.5 6.3 -1.3 56.9 0.1 20600.0 15104.3Netwrk.18 Media [5] 50.8 1.0 51.1 9.6 202106 50.5 -84.6 3.9 166.1 1.0 9.9 5.3 58.4 31.1New India Assura [5] 175.7 8.6 20.4 1.1 202106 12.4 -69.1 11.8 -4.0 10.5 1.5 0.0 197.0 99.6NHPC Ltd 27.8 3.4 8.2 0.8 202106 -13.0 -0.9 -8.8 18.2 1.1 8.4 0.7 28.6 19.7Nilkamal Ltd 2907.2 96.2 30.2 3.8 202106 95.9 -94.2 18.3 74.9 3.3 13.1 0.1 3174.0 1223.0Nippon Life Ind. 439.4 11.4 38.6 8.8 202106 29.7 16.1 1.8 58.1 -0.2 31.0 0.0 450.4 249.0NLC India 56.0 9.3 6.0 0.6 202106 12.5 -11.5 -6.9 -16.3 5.7 7.1 2.0 73.9 46.3NMDC [1] 147.4 30.5 4.8 1.5 202106 236.1 500.0 92.3 202.2 -3.1 28.8 0.0 213.2 75.6NOCIL 296.6 7.4 39.9 3.8 202106 223.4 296.7 60.8 12.9 4.7 8.6 0.0 313.5 117.7NTPC 123.7 16.2 7.6 1.0 202106 14.1 0.6 5.9 31.8 8.0 7.9 1.7 125.6 78.1
O. . . . . . . . . . . . . . . . . . . . . . . . . . . . . . . . . . . . . . . . . . . . . . . . . . . . . . . . . . . . . . . . . . . . . . . . . . . . . . . . . . . . . . . . . . . . . . . . . . . . . . . . . . . . . . . . . . . . . . . . . . . . . . . . . . . . . . . . . . . . . . . . . . . . . . . . . . . . . . . . . . . . . . . . . . . . . . . . . . . . . . . . . . . . . . . . . . . . . . . . . . . . . . . . . . . . . . . .
O N G C [5] 127.7 17.0 7.5 0.7 202106 73.0 5064.5 7.5 62.6 4.5 9.2 0.6 131.3 64.2Oberoi Realty 741.4 21.8 34.0 2.9 202106 140.8 187.2 26.6 40.1 -4.2 9.3 0.2 825.1 370.3Oil India 199.7 37.7 5.3 0.9 202106 47.9 201.0 42.3 11.6 2.4 13.5 0.7 214.8 83.1Oracle Fin.Serv. [5] 4782.5 209.6 22.8 6.0 202106 4.5 9.3 2.4 15.4 0.3 35.3 0.0 4929.0 2850.0Orient Cement [1] 157.5 13.6 11.6 2.5 202106 68.4 249.5 21.5 393.9 -3.6 18.8 0.8 173.4 56.3Orient Electric [1] 354.6 7.2 49.5 16.5 202106 136.2 -81.6 36.1 368.4 4.8 33.8 0.3 368.0 174.0
P . . . . . . . . . . . . . . . . . . . . . . . . . . . . . . . . . . . . . . . . . . . . . . . . . . . . . . . . . . . . . . . . . . . . . . . . . . . . . . . . . . . . . . . . . . . . . . . . . . . . . . . . . . . . . . . . . . . . . . . . . . . . . . . . . . . . . . . . . . . . . . . . . . . . . . . . . . . . . . . . . . . . . . . . . . . . . . . . . . . . . . . . . . . . . . . . . . . . . . . . . . . . . . . . . . . . . . . .
P & G Health Ltd 5391.0 106.5 50.6 12.7 202106 41.9 -30.6 13.2 4.4 0.9 18.8 0.0 7500.0 4706.0P & G Hygiene 13923.1 200.8 69.3 63.3 202106 24.0 -29.2 19.1 50.5 -1.7 54.3 0.0 14553.0 9700.1P I Industries [1] 3459.6 51.4 67.3 9.8 202106 12.6 28.7 28.3 55.8 1.5 21.7 0.1 3533.3 1847.5Page Industries 33058.1 350.6 94.3 41.7 202106 76.1 -72.3 27.3 102.6 3.0 47.8 0.2 33980.0 17700.0Persistent Sys 3539.4 67.0 52.8 9.7 202106 24.1 68.0 18.8 47.2 1.0 22.8 0.0 3759.0 992.0Petronet LNG 232.2 20.7 11.2 3.0 202106 76.1 34.1 -6.3 15.3 0.3 26.8 0.3 275.3 207.4Pfizer 5873.6 125.3 46.9 11.2 202106 45.5 60.6 16.5 10.0 -3.9 22.7 0.0 6164.8 4200.0Phillips Carbon [2] 251.4 24.1 10.4 2.2 202106 179.2 4092.4 22.7 86.6 2.2 16.8 0.3 278.7 116.3Phoenix Mills [2] 850.3 4.0 212.5 3.0 202106 51.6 -161.8 -21.8 -56.1 -2.8 4.1 1.0 926.2 542.7Pidilite Inds. [1] 2369.3 26.1 90.7 21.5 202106 120.6 721.8 35.7 49.2 0.9 28.9 0.1 2425.9 1390.6Piramal Enterp. [2] 2631.8 56.2 46.8 1.8 202106 -1.0 11.0 -0.3 1801.6 2.2 10.4 1.3 2856.8 1178.9PNB Housing 660.3 54.3 12.2 1.3 202106 -9.5 -5.4 -8.6 48.0 4.0 8.8 7.5 924.0 300.1PNC Infratech [2] 369.5 20.4 18.1 3.1 202106 33.8 28.4 19.1 12.9 2.8 14.7 1.4 387.8 147.0Poly Medicure [5] 952.3 15.3 62.2 9.5 202106 24.4 40.7 19.0 42.8 -3.0 21.7 0.3 1163.0 437.0Polycab India 2510.3 56.2 44.7 7.9 202106 92.6 -31.4 25.1 14.5 5.3 24.4 0.1 2573.6 795.0Power Fin.Corpn. 138.3 47.5 2.9 0.6 202106 12.0 29.7 14.4 64.6 2.3 9.5 11.4 140.8 82.2Power Grid Corpn 178.8 19.5 9.2 1.8 202106 8.0 30.4 6.3 20.1 3.0 10.9 2.2 188.6 116.0Prestige Estates 411.0 9.1 45.0 2.5 202106 11.2 3481.3 -5.8 26.4 -4.2 10.5 1.1 501.9 222.5Prism Johnson 123.1 5.2 23.5 5.0 202106 49.7 -81.7 14.7 258.6 -1.7 9.6 1.9 149.4 51.8PTC India 99.0 16.5 6.0 0.7 202106 6.3 32.4 6.2 31.5 -2.4 10.2 2.7 113.0 44.7Punjab Natl.Bank [2] 39.7 2.9 13.7 0.5 202106 -7.8 117.3 28.5 3357.7 5.7 0.0 0.0 46.4 26.3PVR 1392.9 -122.0 4.6 202106 367.6 -197.3 -87.2 -243.5 0.8 0.0 3.0 1592.0 961.0
Q. . . . . . . . . . . . . . . . . . . . . . . . . . . . . . . . . . . . . . . . . . . . . . . . . . . . . . . . . . . . . . . . . . . . . . . . . . . . . . . . . . . . . . . . . . . . . . . . . . . . . . . . . . . . . . . . . . . . . . . . . . . . . . . . . . . . . . . . . . . . . . . . . . . . . . . . . . . . . . . . . . . . . . . . . . . . . . . . . . . . . . . . . . . . . . . . . . . . . . . . . . . . . . . . . . . . . . . .
Quess Corp 973.0 4.4 219.1 6.1 202106 24.0 172.3 3.7 -46.7 11.8 7.0 0.5 990.0 368.0
R . . . . . . . . . . . . . . . . . . . . . . . . . . . . . . . . . . . . . . . . . . . . . . . . . . . . . . . . . . . . . . . . . . . . . . . . . . . . . . . . . . . . . . . . . . . . . . . . . . . . . . . . . . . . . . . . . . . . . . . . . . . . . . . . . . . . . . . . . . . . . . . . . . . . . . . . . . . . . . . . . . . . . . . . . . . . . . . . . . . . . . . . . . . . . . . . . . . . . . . . . . . . . . . . . . . . . . . .
R C F 74.1 8.5 8.7 1.2 202106 47.5 503.0 1.6 65.8 0.0 7.1 1.3 100.2 41.8Radico Khaitan [2] 924.6 21.9 42.2 6.9 202106 47.3 35.7 18.0 24.9 1.8 18.6 0.2 957.5 383.0Rail Vikas 30.1 4.9 6.2 1.1 202106 32.9 64.7 12.1 42.3 -1.5 11.5 0.8 35.6 18.1Rain Industries [2] 237.4 25.8 9.2 1.3 202106 54.3 786.5 7.0 162.7 -2.5 8.9 1.6 272.9 93.6Rajesh Exports [1] 581.3 32.9 17.7 1.5 202106 10.5 83.0 30.9 -8.0 -4.9 11.0 0.4 655.0 440.8Rallis India [1] 291.8 10.9 26.7 3.6 202106 11.7 -10.4 9.4 3.5 0.1 19.3 0.1 362.0 232.4Ratnamani Metals [2] 2196.9 59.2 37.1 5.2 202106 -9.0 1.4 -12.9 -6.1 2.7 18.5 0.1 2249.1 1124.6Raymond 419.2 -25.8 1.3 202106 406.1 -148.3 -21.1 -155.7 -3.7 -3.7 1.1 473.9 252.3RBL Bank 181.0 -1.5 0.9 202106 -10.3 -399.3 -7.2 -122.4 5.1 0.0 0.0 274.0 155.7REC Ltd 156.7 44.6 3.5 0.7 202106 18.4 22.9 16.4 65.8 -0.4 9.3 7.8 167.8 91.9Redington India [2] 144.2 11.6 12.4 2.3 202106 25.8 166.6 18.3 82.4 -1.0 20.7 0.4 179.0 53.6Relaxo Footwear [1] 1173.7 12.0 97.8 18.5 202106 36.7 27.8 17.3 48.6 -0.5 26.2 0.1 1272.0 610.1Reliance Industr 2390.4 75.0 31.9 2.3 202106 58.6 42.6 -1.7 15.9 -1.4 7.8 0.5 2479.9 1830.0Responsive Ind [1] 125.6 3.0 41.8 3.5 202106 14.5 -132.3 43.9 199.9 -2.9 6.1 0.2 205.0 91.2RHI Magnesita [1] 372.7 9.8 38.2 7.5 202106 85.4 184.3 52.2 64.5 0.9 23.3 0.1 410.0 180.0Rites 279.9 18.4 15.2 2.8 202106 5.7 14.7 -17.3 -24.0 2.2 21.4 0.0 303.0 232.4Rossari Biotech [2] 1478.7 16.2 91.2 11.5 202106 111.1 58.3 42.8 34.0 6.1 28.7 0.1 1591.8 734.4Route Mobile 2007.0 24.2 83.0 17.8 202106 21.9 24.8 42.3 65.4 0.5 33.0 0.1 2308.2 625.0
S. . . . . . . . . . . . . . . . . . . . . . . . . . . . . . . . . . . . . . . . . . . . . . . . . . . . . . . . . . . . . . . . . . . . . . . . . . . . . . . . . . . . . . . . . . . . . . . . . . . . . . . . . . . . . . . . . . . . . . . . . . . . . . . . . . . . . . . . . . . . . . . . . . . . . . . . . . . . . . . . . . . . . . . . . . . . . . . . . . . . . . . . . . . . . . . . . . . . . . . . . . . . . . . . . . . . . . . . .
S A I L 115.3 22.4 5.1 1.1 202106 127.7 217.8 44.3 617.1 -5.7 10.5 1.1 151.1 32.7S C I 112.1 11.1 10.1 0.6 202106 -10.1 -52.9 -22.8 -26.3 1.6 6.1 0.5 134.6 49.8S H Kelkar & Co. 167.9 14.2 11.8 2.5 202106 85.4 432.8 44.3 193.5 -0.3 16.1 0.5 189.8 76.3Sanofi India 7913.9 249.5 31.7 11.4 202106 11.1 31.5 -5.8 11.4 -3.5 28.9 0.0 9300.0 7427.8SBI Cards 1078.0 9.5 113.3 16.1 202106 9.7 -22.6 1.4 -30.7 -2.5 10.0 3.1 1164.7 762.7SBI Life Insuran 1198.4 12.9 93.1 11.3 202106 9.5 -42.9 22.4 -10.6 2.2 0.8 0.0 1253.5 755.6Schaeffler India 7304.4 167.2 43.7 6.9 202106 180.9 201.7 43.8 143.3 -1.1 12.9 0.0 7575.0 3450.0Schneider Elect. [2] 119.5 1.0 125.0 -28.3 202106 38.5 -159.7 11.7 147.7 4.2 0.0 3.0 147.0 68.5Sequent Scien. [2] 219.1 3.4 64.5 7.5 202106 8.6 -94.5 15.6 13.6 -7.2 14.7 0.4 336.4 129.3Sheela Foam [5] 2274.6 51.5 44.2 9.4 202106 104.9 119.0 40.9 43.3 -0.6 23.3 0.3 2493.9 1225.0Shilpa Medicare [1] 570.0 7.7 74.4 3.1 202106 6.5 -96.1 -5.6 -65.5 -6.5 7.6 0.4 671.0 317.1Shoppers Stop [5] 259.9 -23.0 23.7 202106 269.5 -187.2 -28.8 0.3 2.8 0.0 23.4 290.5 148.7Shree Cement 30545.1 716.8 42.6 7.2 202106 46.2 91.1 21.6 74.1 -0.4 18.1 0.2 32050.0 18214.4Shri.City Union. 2381.8 164.2 14.5 1.9 202106 8.6 10.8 1.9 12.9 0.3 11.0 3.4 2600.0 766.1Shriram Trans. 1360.8 87.4 15.6 1.5 202106 12.3 -46.8 7.5 7.1 0.9 10.3 5.1 1534.9 555.9Siemens [2] 2181.7 30.9 70.7 7.9 202106 147.2 7210.5 26.4 42.1 -2.2 18.6 0.0 2317.6 1186.8SIS [5] 477.1 38.7 12.3 3.8 202106 9.8 3.7 8.1 173.6 -1.5 26.3 0.8 534.9 347.8SJVN 27.2 4.8 5.7 0.8 202106 -1.7 -0.3 -6.7 18.2 1.3 14.3 0.2 30.8 20.4SKF India 3023.7 76.3 39.6 9.6 202106 130.2 31548.0 29.5 78.8 -5.3 22.3 0.0 3265.0 1431.0Sobha 740.6 7.0 105.6 2.9 202106 46.4 63.6 -22.4 -66.3 -4.6 12.2 1.3 847.0 220.9Solar Industries [2] 1941.5 36.7 53.0 11.1 202106 68.0 131.6 35.2 39.2 8.5 19.7 0.5 2050.0 977.5Solara Active 1652.0 63.9 25.8 3.7 202106 16.4 19.7 24.9 76.2 -2.1 14.7 0.5 1859.3 897.6Sonata Software [1] 875.6 26.7 32.8 10.2 202106 33.2 73.7 18.9 8.1 2.5 37.3 0.1 908.0 300.8South Ind.Bank [1] 10.4 0.0 0.4 202106 -13.4 -87.4 -9.1 -108.3 3.9 0.0 0.0 14.0 6.1Spandana Sphoort 629.0 21.7 28.9 1.5 202106 33.2 -8.5 8.7 -55.8 -0.2 9.1 1.6 830.0 505.0SPARC [1] 290.9 -10.3 -45.3 202106 -88.1 -208.3 -63.5 -66.7 -0.5 0.0 0.0 311.9 141.0SpiceJet 78.6 -19.3 -1.8 202106 121.3 -221.7 -41.7 35.5 12.8 0.0 0.0 108.0 45.6SRF 11101.2 239.0 46.4 9.6 202106 77.0 123.2 38.3 40.6 7.5 17.9 0.6 11409.0 3996.2St Bk of India [1] 454.1 28.0 16.2 1.6 202106 -1.4 94.7 1.1 48.8 5.1 0.0 0.0 471.9 175.6Star Cement [1] 108.8 5.2 21.1 2.2 202106 75.1 57.0 15.8 -13.0 1.4 12.8 0.0 120.0 80.0Sterling & Wils. [1] 363.0 -23.6 8.8 202106 11.9 -563.6 -3.5 -235.8 3.6 -13.5 1.0 383.6 187.3Sterlite Tech. [2] 276.3 9.4 29.4 5.5 202106 49.4 1649.7 14.3 11.9 0.1 12.1 1.4 318.0 139.2Strides Pharma 609.0 5.5 110.8 2.0 202106 -12.0 -287.1 13.1 -71.9 2.1 7.6 0.9 1000.0 568.3Sudarshan Chem. [2] 658.5 21.5 30.6 6.1 202106 36.1 43.7 21.3 22.7 -2.4 16.7 0.8 792.0 431.1Sumitomo Chemi. 404.9 7.4 54.4 13.1 202106 20.7 33.4 13.6 60.2 -1.1 31.9 0.0 459.9 265.1Sun Pharma.Inds. [1] 770.3 28.5 27.0 4.0 202106 29.2 11.8 12.1 57.9 -0.8 13.6 0.1 804.4 452.6Sun TV Network [5] 493.3 41.4 11.9 2.8 202106 33.9 41.9 12.0 30.1 0.3 30.5 0.0 586.4 381.3Sundram Fasten. [1] 902.5 24.1 37.5 8.1 202106 199.4 348.1 50.8 149.4 0.6 17.0 0.4 940.0 391.5Sunteck Realty [1] 433.4 3.7 116.4 2.3 202106 68.7 -1.6 36.6 14.8 12.6 4.2 0.3 464.3 244.1Supreme Inds. [2] 2243.9 87.2 25.7 9.0 202106 27.3 319.8 29.6 163.3 4.8 41.1 0.1 2358.3 1315.0Suven Pharma [1] 526.0 14.8 35.6 11.3 202106 10.7 14.8 18.4 18.7 -1.8 40.5 0.2 589.8 292.0Suzlon Energy [2] 6.5 -0.5 -1.6 202106 121.4 -127.2 49.9 84.0 3.2 2.2 0.0 9.5 2.7Swan Energy [1] 129.2 -2.4 3.6 202106 58.7 -1396.5 12.2 -557.1 -2.7 1.0 2.4 175.6 108.2Symphony [2] 1028.2 16.7 61.7 9.5 202106 49.4 200.0 1.1 -24.2 2.4 15.5 0.3 1529.7 811.0Syngene Intl. 647.3 9.9 65.7 9.2 202106 41.0 33.3 17.1 14.7 2.6 13.5 0.3 700.0 467.7
T. . . . . . . . . . . . . . . . . . . . . . . . . . . . . . . . . . . . . . . . . . . . . . . . . . . . . . . . . . . . . . . . . . . . . . . . . . . . . . . . . . . . . . . . . . . . . . . . . . . . . . . . . . . . . . . . . . . . . . . . . . . . . . . . . . . . . . . . . . . . . . . . . . . . . . . . . . . . . . . . . . . . . . . . . . . . . . . . . . . . . . . . . . . . . . . . . . . . . . . . . . . . . . . . . . . . . . . . .
Tanla Platforms [1] 836.2 28.1 29.8 12.7 202106 37.5 32.9 25.4 2074.2 -4.7 51.4 0.0 1030.0 240.1Tasty Bite Eat. 18732.8 175.8 106.6 23.3 202106 107.0 404.9 14.0 30.4 0.8 17.7 0.7 21470.5 9950.0Tata Chemicals 844.5 20.8 40.5 1.5 202106 26.8 2068.4 7.0 -27.3 1.9 4.4 0.5 891.9 273.6Tata Coffee [1] 208.4 6.9 30.0 2.8 202106 -9.3 -17.9 5.4 39.5 -1.1 12.8 1.0 246.8 91.2Tata Comm 1400.8 46.8 30.0 345.8 202106 -6.8 10.3 -2.9 251.4 3.2 12.0 0.0 1527.9 775.0Tata Consumer [1] 873.8 8.5 102.9 5.6 202106 10.9 -32.5 19.5 -1.8 -0.3 8.6 0.1 889.0 459.0Tata Elxsi 5486.8 66.3 82.8 25.3 202106 39.4 64.6 20.3 49.4 11.4 39.2 0.1 5600.0 1160.8Tata Inv.Corpn. 1301.4 37.5 34.7 0.5 202106 100.3 196.1 23.1 110.4 1.6 1.5 0.0 1385.0 794.9Tata Metaliks 1027.9 103.5 9.9 2.5 202106 187.2 666.3 31.1 144.0 -0.3 24.3 0.2 1374.0 480.0Tata Motors [2] 308.5 12.2 25.3 1.9 202106 108.2 -152.7 22.6 128.5 3.2 5.1 2.3 360.7 122.2Tata Power Co. [1] 137.9 4.5 30.5 2.1 202106 54.5 89.3 29.3 86.4 3.9 6.7 2.4 142.3 50.0Tata Steel 1385.3 181.2 7.6 2.3 202106 110.3 103.3 39.0 3115.3 -4.3 11.4 1.4 1534.6 343.0TCI Express [2] 1526.3 32.1 47.6 13.5 202106 151.2 2482.6 13.1 72.5 1.8 34.2 0.0 1747.0 750.2TCNS Clothing Co [2] 653.9 -7.7 6.6 202106 189.4 -179.5 -22.7 -1401.7 -4.8 -4.0 0.5 704.9 353.7TCS [1] 3830.5 95.4 40.1 16.6 202106 18.5 28.5 9.0 13.1 1.0 47.1 0.1 3981.6 2302.5Team Lease Serv. 4648.8 51.2 90.7 12.2 202106 21.1 43.5 0.7 549.4 3.4 12.4 0.1 4844.5 2071.3Tech Mahindra [5] 1452.4 49.6 29.3 5.7 202106 12.0 39.2 4.4 18.9 1.3 20.6 0.1 1480.0 745.0The Ramco Cemen [1] 1012.8 35.5 28.5 4.2 202106 17.8 46.2 8.3 58.9 -4.1 14.5 0.6 1131.0 688.9Thermax [2] 1478.8 25.0 59.2 5.4 202106 58.3 177.7 3.5 121.3 5.5 9.9 0.1 1569.7 705.9Thyrocare Tech. 1269.2 31.9 39.8 15.7 202106 192.6 24065.2 58.8 178.6 -0.4 36.7 0.0 1465.9 713.0Timken India 1683.4 26.2 64.3 9.4 202106 192.0 1700.6 28.3 -1.0 -0.3 12.6 0.0 1763.3 1010.5Titan Company [1] 2095.0 14.5 144.8 24.8 202106 119.6 -93.1 27.5 52.1 3.0 12.9 0.7 2150.0 1076.0Torrent Pharma. [5] 3096.5 74.5 41.6 9.0 202106 5.3 2.8 2.2 11.6 -0.3 17.0 1.0 3226.1 2311.3Torrent Power 482.2 23.4 20.6 2.3 202106 3.1 -44.6 -5.0 -48.8 0.9 12.1 0.9 508.9 293.1Trent [1] 982.2 -2.3 15.1 202106 98.1 -164.6 -3.3 10.8 -3.9 0.0 0.1 1050.0 588.0Trident [1] 23.8 1.0 23.1 3.6 202106 109.2 1945.6 28.7 130.1 -6.9 9.5 0.6 26.4 6.0Triveni Turbine [1] 139.0 3.6 38.9 7.1 202106 11.4 1.8 -6.2 -2.3 -2.3 22.7 0.0 150.4 66.6TTK Prestige 9217.6 185.0 49.8 8.5 202106 77.0 1099.6 28.4 62.4 -1.3 21.6 0.1 9580.0 5360.6Tube Investments [1] 1460.7 25.7 56.9 13.0 202106 432.6 115.2 111.8 164.5 7.3 14.5 0.6 1525.0 522.8TV18 Broadcast [2] 37.2 3.2 11.5 1.5 202106 48.9 10505.3 2.6 146.7 4.2 14.5 0.3 49.0 26.1TVS Motor Co. [1] 546.8 16.6 33.0 6.8 202106 141.8 -95.7 40.6 147.3 0.1 10.9 3.3 665.7 407.3
U . . . . . . . . . . . . . . . . . . . . . . . . . . . . . . . . . . . . . . . . . . . . . . . . . . . . . . . . . . . . . . . . . . . . . . . . . . . . . . . . . . . . . . . . . . . . . . . . . . . . . . . . . . . . . . . . . . . . . . . . . . . . . . . . . . . . . . . . . . . . . . . . . . . . . . . . . . . . . . . . . . . . . . . . . . . . . . . . . . . . . . . . . . . . . . . . . . . . . . . . . . . . . . . . . . . . . . . .
UCO Bank 13.9 0.2 67.2 0.8 202106 -2.5 374.4 -4.2 113.6 -2.0 0.0 0.0 16.3 10.6Uflex 559.4 126.1 4.4 0.7 202106 39.6 34.4 30.0 91.4 14.2 15.2 0.8 594.0 298.2Ujjivan Fin.Ser. 155.6 -28.5 0.7 202106 -10.6 -227.1 -0.9 -231.1 -1.0 4.3 5.8 310.9 126.1Ujjivan Small 20.7 -1.6 1.3 202106 -14.0 -527.2 -5.0 -190.2 0.7 0.0 0.0 44.5 17.8UltraTech Cem. 7709.4 228.8 33.7 5.0 202106 54.2 88.7 26.7 21.5 -2.9 14.6 0.5 8070.6 3755.0Union Bank (I) 36.0 5.3 6.7 0.4 202106 -6.9 228.5 44.5 828.4 3.0 0.0 0.0 45.3 23.1United Breweries [1] 1594.8 9.8 163.4 11.8 202106 120.6 -73.0 -2.3 73.5 -0.3 5.0 0.1 1647.0 898.5UPL [2] 743.0 41.7 17.8 2.7 202106 8.7 27.2 10.3 39.8 -1.9 13.2 1.3 864.8 399.0UTI AMC 1175.0 43.2 27.2 4.6 202106 31.8 52.9 42.1 85.8 -0.1 20.4 0.0 1216.6 471.1
V . . . . . . . . . . . . . . . . . . . . . . . . . . . . . . . . . . . . . . . . . . . . . . . . . . . . . . . . . . . . . . . . . . . . . . . . . . . . . . . . . . . . . . . . . . . . . . . . . . . . . . . . . . . . . . . . . . . . . . . . . . . . . . . . . . . . . . . . . . . . . . . . . . . . . . . . . . . . . . . . . . . . . . . . . . . . . . . . . . . . . . . . . . . . . . . . . . . . . . . . . . . . . . . . . . . . . . . .
V I P Inds. [2] 498.6 -3.1 13.6 202106 411.3 -95.1 -34.3 -272.3 2.0 -10.6 0.6 517.0 269.4Vaibhav Global [2] 718.7 17.8 40.4 12.2 202106 23.9 35.3 27.4 40.2 -9.2 35.8 0.1 1057.7 350.0Vakrangee [1] 41.7 0.7 59.5 1.7 202106 127.0 96.2 -36.1 4.5 -3.9 3.1 0.0 69.9 24.4Vardhman Textile 1909.7 136.8 14.0 1.7 202106 135.7 389.5 22.8 98.6 -1.8 7.9 0.4 2040.0 722.3Varroc Engineer [1] 308.9 -29.2 1.6 202106 130.8 -174.8 36.1 -13.3 13.0 -4.9 1.3 500.0 260.2Varun Beverages 885.0 13.2 67.1 9.7 202106 49.4 118.9 24.7 344.5 -5.8 10.4 1.0 954.4 430.1Vedanta [1] 301.8 41.4 7.3 1.8 202106 79.2 313.8 27.2 53.6 0.0 17.9 1.0 341.3 91.3Venky's (India) 3074.4 195.8 15.7 3.9 202106 100.3 17.3 26.3 756.5 5.6 31.5 0.3 3950.0 1280.8V-Guard Industri [1] 259.4 5.2 50.1 9.2 202106 38.5 576.4 30.6 61.2 -0.8 25.1 0.0 285.0 162.0Vinati Organics [1] 1857.6 27.0 68.7 12.4 202106 66.8 12.0 15.0 -14.1 -5.4 23.7 0.0 2130.0 993.7V-Mart Retail 3419.6 -0.6 8.2 202106 127.3 -185.3 -8.7 33.2 -1.6 4.1 0.8 4075.8 1859.0Vodafone Idea 11.2 -9.1 -0.8 202106 -14.2 -235.4 -8.8 46.1 33.1 0.0 0.0 13.8 4.6Voltas [1] 1253.9 17.1 73.3 8.3 202106 39.0 50.1 27.2 28.9 3.4 14.7 0.1 1258.0 640.0VRL Logistics 344.3 11.5 29.9 5.1 202106 158.5 -109.6 16.0 203580.0 2.2 9.4 0.7 354.8 149.0VST Industries 3478.5 197.9 17.6 5.7 202106 12.1 -7.0 -3.4 0.5 1.7 47.2 0.0 4048.3 3125.0
W . . . . . . . . . . . . . . . . . . . . . . . . . . . . . . . . . . . . . . . . . . . . . . . . . . . . . . . . . . . . . . . . . . . . . . . . . . . . . . . . . . . . . . . . . . . . . . . . . . . . . . . . . . . . . . . . . . . . . . . . . . . . . . . . . . . . . . . . . . . . . . . . . . . . . . . . . . . . . . . . . . . . . . . . . . . . . . . . . . . . . . . . . . . . . . . . . . . . . . . . . . . . . . . . . . . . . .
WABCO India [5] 7182.9 82.5 87.0 6.8 202106 196.4 -31.8 50.2 115.3 -3.0 10.4 0.0 7870.5 4770.2Welspun Corp [5] 121.4 25.5 4.8 0.8 202106 -38.3 87.8 -45.0 16.7 -2.8 17.6 0.3 165.0 97.6Welspun India [1] 131.7 7.0 18.7 3.6 202106 84.3 343.1 34.4 88.5 -1.1 14.1 1.0 145.5 55.1Westlife Develop [2] 544.3 -4.9 17.6 202106 175.2 -155.2 -9.0 -50.7 5.0 0.0 1.8 577.0 351.0Whirlpool India 2245.9 28.5 78.8 10.0 202106 30.5 62.0 23.2 15.4 -2.5 16.3 0.0 2777.0 1970.0Wipro [2] 664.9 21.3 31.3 6.6 202106 22.4 35.7 6.6 19.8 0.4 21.4 0.2 690.8 282.7Wockhardt [5] 440.3 -7.8 1.4 202106 43.7 -102.2 9.3 85.4 5.9 13.0 1.0 804.5 266.0
Z. . . . . . . . . . . . . . . . . . . . . . . . . . . . . . . . . . . . . . . . . . . . . . . . . . . . . . . . . . . . . . . . . . . . . . . . . . . . . . . . . . . . . . . . . . . . . . . . . . . . . . . . . . . . . . . . . . . . . . . . . . . . . . . . . . . . . . . . . . . . . . . . . . . . . . . . . . . . . . . . . . . . . . . . . . . . . . . . . . . . . . . . . . . . . . . . . . . . . . . . . . . . . . . . . . . . . . . . .
Zee Entertainment [1] 255.3 11.0 23.3 2.4 202106 35.3 611.8 10.2 297.5 39.5 13.9 0.0 295.2 166.8Zensar Tech. [2] 547.2 12.7 43.1 5.3 202106 -5.5 37.8 -9.1 9.2 16.8 19.4 0.1 587.0 167.1Zydus Wellness 2400.7 46.0 52.2 3.3 202106 9.7 46.6 13.6 74.1 1.5 6.4 0.3 2440.0 1630.5
H . . . . . . . . . . . . . . . . . . . . . . . . . . . . . . . . . . . . . . . . . . . . . . . . . . . . . . . . . . . . . . . . . . . . . . . . . . . . . . . . . . . . . . . . . . . . . . . . . . . . . . . . . . . . . . . . . . . . . . . . . . . . . . . . . . . . . . . . . . . . . . . . . . . . . . . . . . . . . . . . . . . . . . . . . . . . . . . . . . . . . . . . . . . . . . . . . . . . . . . . . . . . . . . . . . . . . . . .
H D F C [2] 2825.3 111.6 25.3 3.3 202106 3.5 39.5 29.2 -8.1 -0.1 9.2 3.1 2895.4 1623.0H P C L 282.8 73.4 3.9 1.1 202106 92.3 -11.0 13.7 107.6 5.2 19.3 1.3 312.0 163.3H U D C O 44.7 8.9 5.0 0.7 202106 0.9 98.9 -3.3 12.9 4.0 9.5 4.8 58.3 30.0Happiest Minds [2] 1494.4 10.4 144.2 40.1 202106 38.2 -20.4 18.5 36.1 2.8 31.4 0.4 1580.8 285.6Hathway Cable [2] 24.3 1.4 17.8 1.1 202106 5.2 -26.0 -0.8 36.3 2.5 4.2 0.3 36.6 20.5Havells India [1] 1471.4 19.4 75.8 17.8 202106 75.9 268.5 41.2 95.6 1.2 29.4 0.1 1481.4 643.0Hawkins Cookers 6201.0 172.7 35.9 18.5 202106 50.2 165.6 29.5 39.9 0.1 55.8 0.2 6590.0 4821.3HCL Technologies [2] 1264.3 42.1 30.0 5.7 202106 12.5 9.3 7.6 -2.9 5.5 25.0 0.1 1295.7 710.5HDFC AMC [5] 3269.4 64.2 50.9 14.6 202106 23.2 14.3 2.0 7.5 0.7 39.9 0.0 3363.0 2071.0HDFC Bank [1] 1583.3 59.3 26.7 4.0 202106 -0.3 14.4 2.5 15.2 1.0 0.0 0.0 1650.0 1025.2HDFC Life Insur. 746.2 5.8 127.9 17.5 202106 31.5 -40.2 26.8 -10.8 1.2 0.9 0.0 775.7 556.3HEG 2209.4 6.4 347.6 2.4 202106 77.3 296.2 -8.2 115.2 -1.5 -1.9 0.1 2564.0 659.2Heidelberg Cem. 266.0 14.8 18.0 4.0 202106 35.5 40.3 12.9 40.6 1.7 24.2 0.3 284.6 174.5Hero Motocorp [2] 2931.5 155.9 18.8 3.8 202106 85.3 333.0 39.3 25.0 4.9 24.9 0.0 3628.6 2636.0HFCL [1] 74.1 2.4 31.0 5.0 202106 72.5 309.4 54.3 122.9 -1.2 19.3 0.5 95.7 13.4Himadri Special [1] 50.1 1.8 28.1 1.2 202106 109.3 15.5 27.4 -37.5 8.2 4.1 0.4 62.4 37.6Hind. Unilever [1] 2721.1 35.3 77.0 13.4 202106 13.5 6.6 20.6 17.0 -3.1 34.3 0.0 2825.4 2001.0Hind.Aeronautics 1430.7 98.2 14.6 3.1 202106 -7.0 31.0 13.8 33.7 4.1 16.7 0.2 1485.5 660.0Hindalco Inds. [1] 473.0 29.5 16.1 1.6 202106 63.6 379.6 30.5 178.1 2.1 7.1 1.1 488.0 155.0Hindustan Copper [5] 116.8 1.3 89.5 7.1 202106 -38.0 53.7 69.2 122.5 0.7 6.2 1.3 196.9 31.5Hindustan Zinc [2] 334.7 20.6 16.3 4.4 202106 63.6 52.4 41.9 35.8 1.7 26.5 0.1 362.4 197.6Honeywell Auto 42552.5 512.9 83.0 14.6 202106 -7.2 -6.7 -5.7 -4.4 0.6 25.1 0.0 49805.0 27854.0
I . . . . . . . . . . . . . . . . . . . . . . . . . . . . . . . . . . . . . . . . . . . . . . . . . . . . . . . . . . . . . . . . . . . . . . . . . . . . . . . . . . . . . . . . . . . . . . . . . . . . . . . . . . . . . . . . . . . . . . . . . . . . . . . . . . . . . . . . . . . . . . . . . . . . . . . . . . . . . . . . . . . . . . . . . . . . . . . . . . . . . . . . . . . . . . . . . . . . . . . . . . . . . . . . . . . . . . . . . .
I D F C 56.4 -4.5 1.1 202106 23.3 -1662.3 37.4 29.2 2.9 0.0 0.0 62.6 27.9I O B 21.9 0.5 39.8 2.2 202106 -5.5 170.6 -3.7 112.8 10.9 0.0 0.0 29.0 8.8I O C L 118.2 27.1 4.4 1.0 202106 90.8 174.4 1.3 186.7 4.7 14.6 1.2 119.5 71.4I R C T C 3863.9 16.8 229.3 42.1 202106 85.3 235.3 -53.8 -35.2 17.3 14.8 0.0 4017.0 1291.0I T D C 408.5 -3.1 12.2 202106 50.4 -119.3 -38.8 -1472.8 3.2 8.2 0.0 463.9 217.0ICICI Bank [2] 720.0 28.9 24.9 3.1 202106 3.0 52.3 3.4 96.8 0.0 0.0 0.0 734.9 334.0ICICI Lombard 1602.9 27.0 59.4 9.4 202106 16.4 -61.9 9.6 -4.3 -1.1 26.4 0.1 1656.6 1201.0ICICI Pru Life 703.4 3.4 208.8 12.0 202106 18.9 -164.6 11.8 -54.7 0.9 0.5 0.1 724.5 397.7ICICI Securities [5] 734.8 36.7 20.0 13.0 202106 36.5 60.9 49.3 90.8 1.2 37.0 1.7 802.1 357.0IDBI Bank 39.2 1.8 21.6 1.3 202106 0.4 275.9 -3.3 122.1 2.2 0.0 0.0 44.8 26.4IDFC First Bank 49.1 -0.4 1.5 202106 3.5 -720.7 -1.5 88.8 4.8 0.0 0.0 69.3 26.9IFB Industries 1209.3 16.5 73.2 7.1 202106 99.0 -191.7 38.6 334.3 9.9 12.3 0.5 1458.1 537.8IFCI 12.8 -11.5 0.7 202106 -67.7 -332.3 -35.8 -350.9 12.8 0.0 2.7 16.4 5.6IIFL Finance [2] 279.9 26.2 10.7 2.0 202106 17.7 742.0 24.1 177.2 -5.0 10.3 6.0 346.6 74.0IIFL Wealth Mgt [2] 1653.8 45.7 36.2 5.2 202106 9.5 42.0 5.6 82.0 -1.6 9.3 2.3 1818.0 880.0Indbull.RealEst. [2] 134.7 2.3 59.1 2.0 202106 985.9 -95.0 -19.7 -34.3 -6.5 3.4 0.6 174.8 46.4India Cements 184.1 7.4 24.8 1.0 202106 36.9 121.1 7.6 1104.1 1.1 6.4 0.6 210.9 109.6Indiabulls Hous. [2] 228.8 26.2 8.7 0.7 202106 -9.4 3.2 -21.2 -27.6 0.6 9.4 4.7 313.5 127.7Indiamart Inter. 8603.1 96.1 89.6 16.3 202106 18.6 18.6 8.3 55.3 -3.2 27.8 0.1 9952.0 4371.5Indian Bank 137.1 31.9 4.3 0.4 202106 -4.9 192.3 46.3 343.2 9.7 0.0 0.0 156.9 53.2Indian Energy Ex [1] 598.7 7.6 79.1 34.8 202106 34.1 49.3 28.9 27.3 0.0 56.9 0.0 619.0 181.0Indian Hotels Co [1] 149.1 -6.9 4.9 202106 139.9 -181.3 -50.5 -1618.5 -1.2 0.0 1.3 157.9 88.6Indoco Remedies [2] 481.5 12.6 38.4 5.8 202106 43.0 132.7 21.2 194.3 4.1 15.1 0.4 529.7 218.6Indostar Capital 290.8 -24.1 1.0 202106 -20.6 -178.0 -18.7 8.1 -3.8 5.0 2.1 417.0 257.5Indraprastha Gas [2] 561.1 20.2 27.8 6.2 202106 96.9 690.1 0.2 36.2 -0.5 24.1 0.0 604.0 364.3Indus Towers 268.5 16.7 16.1 4.6 202106 315.6 101.2 187.3 44.1 10.7 19.2 0.9 282.0 161.3IndusInd Bank 1130.1 44.4 25.5 2.0 202106 5.8 99.1 1.5 -2.8 13.0 0.0 0.0 1186.4 485.0Infibeam Avenues [1] 42.2 0.5 77.0 1.9 202106 120.3 18.1 42.4 -13.9 -5.4 3.0 0.0 58.5 35.3Info Edg.(India) 6610.1 3.8 1744.1 15.6 202106 14.8 -65.1 -9.0 141.8 -1.1 3.7 0.0 6985.0 3280.0Infosys [5] 1691.3 47.7 35.5 11.0 202106 17.9 22.3 13.0 19.2 0.0 37.1 0.1 1755.6 931.2Inox Leisure 306.5 -31.2 4.3 202106 8824.0 -266.1 -90.9 -346.3 0.1 0.0 4.5 358.6 241.9Intellect Design [5] 677.6 21.9 30.9 6.5 202106 18.1 73.0 15.6 432.3 7.3 21.4 0.2 892.0 186.0Interglobe Aviat 2197.4 -159.3 804.4 202106 292.2 -211.6 -37.7 -43.3 14.9 0.0 8.8 2243.0 1182.6IOL Chemicals 581.7 67.2 8.7 2.7 202106 12.7 -39.4 8.8 -2.3 5.3 53.8 0.0 859.7 516.4Ipca Labs. [2] 2496.2 78.9 31.6 6.7 202106 2.0 -31.3 6.8 8.4 -1.1 30.4 0.1 2767.1 1786.1IRB Infra.Devl. 171.0 6.2 27.4 0.9 202106 59.0 138.6 -3.3 -50.9 -0.8 5.8 2.1 189.5 97.8Ircon Intl. [2] 44.8 4.7 9.4 1.0 202106 116.4 158.2 22.8 18.8 -1.3 11.5 0.0 54.2 36.4ITC [1] 231.1 11.3 20.4 4.7 202106 26.4 30.5 9.9 -4.4 8.7 28.4 0.0 239.2 163.4ITI 118.7 0.3 464.2 88.3 202106 39.0 -185.9 17.6 -77.3 0.3 5.2 0.0 143.7 102.2
J . . . . . . . . . . . . . . . . . . . . . . . . . . . . . . . . . . . . . . . . . . . . . . . . . . . . . . . . . . . . . . . . . . . . . . . . . . . . . . . . . . . . . . . . . . . . . . . . . . . . . . . . . . . . . . . . . . . . . . . . . . . . . . . . . . . . . . . . . . . . . . . . . . . . . . . . . . . . . . . . . . . . . . . . . . . . . . . . . . . . . . . . . . . . . . . . . . . . . . . . . . . . . . . . . . . . . . . . . .
J & K Bank [1] 38.6 6.0 6.5 0.5 202106 -2.3 4856.2 -4.2 143.6 2.3 0.0 0.0 44.4 14.1J B Chem & Pharm [2] 1739.1 57.9 30.0 7.4 202106 16.0 -0.5 14.9 32.9 -1.1 32.4 0.0 1938.8 787.5J K Cements 3380.8 109.9 30.8 7.0 202106 70.6 267.2 37.0 100.3 -3.4 18.3 1.1 3690.0 1427.3Jai Corp [1] 128.3 6.0 21.2 1.6 202106 91.2 217.6 13.2 304.6 -5.8 3.1 0.1 172.9 78.2Jamna Auto Inds. [1] 96.5 2.6 36.5 6.6 202106 352.6 53.3 69.3 612.5 12.2 16.4 0.2 100.0 39.8Jindal Saw [2] 122.8 15.0 8.2 0.6 202106 75.8 1546.1 16.6 7.1 2.8 7.9 0.8 147.7 58.2Jindal Stain. [2] 163.8 16.2 10.1 2.5 202106 193.1 121.4 34.2 949.2 0.0 15.4 1.2 174.4 39.0Jindal Stain. Hi [2] 297.8 47.3 6.3 2.4 202106 225.7 264.5 44.1 500.3 1.0 25.2 0.7 309.0 75.0Jindal Steel [1] 386.6 59.6 6.5 1.2 202106 62.8 -77.1 42.6 1264.8 -3.4 15.5 1.0 501.6 159.7JK Lakshmi Cem. [5] 688.0 43.9 15.7 3.9 202106 45.4 168.6 24.2 109.2 -3.6 18.1 1.0 815.3 244.0JK Paper 243.6 20.1 12.1 1.7 202106 40.8 2854.5 4.5 -3.2 -3.7 10.3 0.9 284.8 86.3JK Tyre & Indust [2] 153.4 21.2 7.2 1.4 202106 130.7 -69.1 45.3 1388.9 -0.4 12.0 2.0 166.0 55.0JM Financial [1] 90.6 7.3 12.3 1.2 202106 43.5 117.0 7.3 36.8 1.1 11.9 1.9 117.6 72.9Johnson Con. Hit 2237.9 16.7 134.3 8.4 202106 82.5 -136.1 23.4 547.8 1.3 5.5 0.2 2936.7 2027.8JSW Energy 323.6 4.8 67.9 3.7 202106 -4.3 -5.7 -10.7 -22.2 15.6 8.8 0.7 325.4 54.7JSW Steel [1] 682.1 59.7 11.4 3.5 202106 148.2 952.4 49.4 994.9 -1.0 14.9 1.5 776.5 257.7JTEKT India [1] 108.7 2.0 55.2 4.4 202106 322.4 -102.9 31.9 483.0 7.5 3.8 0.1 132.8 71.2Jubilant Food. 4104.6 28.7 142.8 37.6 202106 130.0 -0.1 13.4 152.6 0.1 16.1 1.3 4271.0 2099.6Just Dial 983.6 15.2 64.5 2.4 202106 1.8 -104.2 -22.5 -57.3 -1.0 12.1 0.1 1138.0 333.1Jyothy Labs [1] 172.0 5.7 30.4 4.4 202106 21.4 -21.6 16.3 13.2 -2.5 17.1 0.2 187.2 128.4
K . . . . . . . . . . . . . . . . . . . . . . . . . . . . . . . . . . . . . . . . . . . . . . . . . . . . . . . . . . . . . . . . . . . . . . . . . . . . . . . . . . . . . . . . . . . . . . . . . . . . . . . . . . . . . . . . . . . . . . . . . . . . . . . . . . . . . . . . . . . . . . . . . . . . . . . . . . . . . . . . . . . . . . . . . . . . . . . . . . . . . . . . . . . . . . . . . . . . . . . . . . . . . . . . . . . . . . . .
K E C Intl. [2] 418.9 20.5 20.4 3.2 202106 15.1 -34.8 14.4 -3.6 -2.9 20.7 0.7 486.5 299.1K P R Mill Ltd [5] 2229.5 90.5 24.6 6.5 202106 70.6 178.7 32.1 80.7 -1.9 25.5 0.3 2349.6 566.5Kajaria Ceramics [1] 1155.2 23.8 48.6 9.8 202106 102.4 58.9 28.5 113.4 -3.0 21.6 0.1 1228.0 430.0Kalpataru Power [2] 408.6 36.7 11.1 1.6 202106 37.5 77.8 13.0 62.2 -1.2 14.7 0.9 496.0 228.0Kansai Nerolac [1] 613.3 11.3 54.1 8.2 202106 121.3 240.9 33.5 49.4 0.4 17.8 0.0 679.6 461.9Karnataka Bank 72.1 12.6 5.7 0.4 202106 -5.7 -46.1 -5.6 -13.4 7.5 0.0 0.0 75.7 39.5Kaveri Seed Co. [2] 607.3 36.3 16.7 2.9 202106 -12.5 -31.0 -7.4 -32.6 0.7 28.5 0.0 815.9 463.2KEI Industries [2] 846.1 33.4 25.3 4.3 202106 36.5 71.0 -2.2 20.5 6.3 21.1 0.2 885.1 319.3KNR Construct. [2] 301.6 14.2 21.2 4.3 202106 54.5 140.9 30.5 44.9 -3.9 21.7 0.5 343.6 113.8Kotak Mah. Bank [5] 2006.0 50.1 40.0 4.7 202106 -4.5 -2.5 -3.0 8.2 10.4 0.0 0.0 2049.0 1231.2KPIT Technologi. 317.3 6.5 48.6 7.2 202106 15.2 150.8 -1.5 26.8 -3.7 14.2 0.2 385.0 81.0KRBL [1] 265.2 24.4 10.9 1.7 202106 33.0 11.9 4.9 4.8 2.9 19.9 0.1 306.0 173.5KSB 1238.0 41.9 29.6 4.6 202106 38.4 231.7 20.2 88.4 3.6 16.6 0.1 1375.0 425.5
L . . . . . . . . . . . . . . . . . . . . . . . . . . . . . . . . . . . . . . . . . . . . . . . . . . . . . . . . . . . . . . . . . . . . . . . . . . . . . . . . . . . . . . . . . . . . . . . . . . . . . . . . . . . . . . . . . . . . . . . . . . . . . . . . . . . . . . . . . . . . . . . . . . . . . . . . . . . . . . . . . . . . . . . . . . . . . . . . . . . . . . . . . . . . . . . . . . . . . . . . . . . . . . . . . . . . . . . . .
L & T Infotech [1] 5712.8 115.1 49.6 13.7 202106 17.4 19.1 13.6 27.5 5.1 35.9 0.1 5781.0 2310.2L&T Fin.Holdings 85.5 4.0 21.1 1.1 202106 -7.3 2.9 -3.7 -24.4 1.0 7.9 5.5 113.4 51.7L&T Technology [2] 4556.9 72.5 62.9 13.8 202106 17.3 84.5 1.9 4.2 5.8 26.2 0.0 4631.9 1473.0La Opala RG [2] 301.5 5.5 54.4 5.0 202106 218.2 191.4 5.1 1.0 0.0 10.5 0.0 325.5 197.2Lak. Mach. Works 8269.2 78.7 105.1 5.0 202106 171.1 -78.3 57.0 7885.2 6.0 4.8 0.0 8870.0 3401.8Larsen & Toubro [2] 1715.5 109.1 15.7 3.2 202106 38.0 401.5 5.1 84.4 2.8 15.2 1.9 1741.0 842.5Laurus Labs [2] 651.2 19.6 33.2 13.5 202106 31.2 40.5 57.2 155.7 -0.7 37.8 0.6 723.6 247.6Lemon Tree Hotel 40.4 -1.6 3.5 202106 3.6 -195.8 -55.5 -152.0 1.3 0.0 2.2 49.5 25.3LIC Housing Fin. [2] 418.1 37.6 11.1 1.0 202106 -2.9 -81.7 -1.0 -21.0 -0.3 8.1 10.3 542.4 260.2Linde India 2660.5 27.6 96.4 8.8 202106 109.2 266.0 24.8 94.3 5.2 10.0 0.0 2765.7 700.2Lupin [2] 950.7 36.4 26.1 3.1 202106 22.2 407.4 6.1 410.3 -3.2 9.2 0.4 1267.5 856.0Lux Industries [2] 3995.0 93.9 42.6 12.0 202106 33.0 72.4 41.4 82.7 0.4 35.0 0.2 4500.0 1316.1
M. . . . . . . . . . . . . . . . . . . . . . . . . . . . . . . . . . . . . . . . . . . . . . . . . . . . . . . . . . . . . . . . . . . . . . . . . . . . . . . . . . . . . . . . . . . . . . . . . . . . . . . . . . . . . . . . . . . . . . . . . . . . . . . . . . . . . . . . . . . . . . . . . . . . . . . . . . . . . . . . . . . . . . . . . . . . . . . . . . . . . . . . . . . . . . . . . . . . . . . . . . . . . . . . . . . . . . .
M & M [5] 753.9 24.4 30.9 2.3 202106 60.2 222.8 13.7 620.2 0.4 7.9 2.0 952.2 566.0M & M Fin. Serv. [2] 179.3 -10.0 1.4 202106 -16.6 -767.7 -4.7 -202.4 7.0 7.6 4.7 224.2 112.8M R P L 44.8 -0.4 1.9 202106 156.6 -131.6 -14.1 98.2 4.4 -1.3 4.0 56.6 25.0Mah. Scooters 4432.1 8.3 533.2 0.3 202106 87.1 47.6 7.3 -94.7 -0.6 0.1 0.0 4725.0 2752.8Mah. Seamless [5] 320.4 50.3 6.4 0.7 202106 50.4 399.8 5.5 44.2 2.7 9.3 0.3 350.0 211.7Mahanagar Gas 1136.2 78.8 14.4 3.5 202106 135.1 351.0 1.2 16.4 -2.8 26.4 0.0 1284.5 780.0Mahindra CIE 236.0 8.4 28.1 1.8 202106 177.7 5.8 31.6 63644.0 -0.4 3.6 0.3 280.6 115.6Mahindra Holiday 235.0 -0.3 -6.4 202106 26.1 -177.5 -12.1 95.8 0.9 1.4 0.0 254.0 106.7Mahindra Life. 277.9 -4.3 2.6 202106 935.0 -169.4 -42.2 28.7 -0.9 -3.5 0.1 294.0 72.7Mahindra Logis. 725.9 8.0 91.0 9.2 202106 112.8 -40.9 24.9 176.9 0.8 7.3 0.4 819.2 310.2Manappuram Fin. [2] 163.8 21.2 7.7 1.9 202106 3.4 18.6 8.4 11.9 -0.8 15.3 3.6 218.0 139.0Marico [1] 560.1 9.2 61.0 22.1 202106 31.2 7.3 22.3 12.7 -2.6 42.9 0.1 587.3 333.3Maruti Suzuki [5] 7012.5 169.9 41.3 4.0 202106 356.6 78.0 40.7 27.3 3.1 5.0 0.0 8400.0 6273.7MAS Financ Ser 795.4 26.3 30.2 3.7 202106 -7.4 -1.5 -13.1 -10.4 5.0 11.4 2.9 1107.7 716.0Max Financial [2] 1082.8 9.1 118.4 11.2 202106 7.9 -83.8 60.0 30.4 -0.2 16.7 0.0 1147.9 566.6Max Healthcare 381.3 3.4 113.8 6.5 202106 290.3 82.3 208.9 1157.2 0.1 0.0 0.2 472.6 102.5Mazagon Dock 256.9 31.4 8.2 1.5 202106 216.3 6.2 16.4 27.0 6.0 16.8 0.0 295.6 164.0Metropolis Healt [2] 3149.6 47.6 66.2 22.8 202106 128.3 2083.8 48.4 124.4 4.7 35.8 0.2 3241.0 1687.3Minda Corp [2] 136.0 4.0 34.1 2.9 202106 213.9 -79.9 51.3 137.2 9.6 7.4 0.5 148.0 64.9Minda Industries [2] 714.3 12.3 58.2 6.9 202106 242.5 -88.5 57.7 1824.8 1.3 11.3 0.6 832.6 302.2Mindtree 4184.3 75.3 55.6 14.8 202106 20.1 61.2 6.5 65.2 11.1 35.4 0.2 4245.0 1174.1Mishra Dhatu Nig 185.1 9.9 18.6 3.2 202106 -0.5 1888.3 16.2 38.7 0.7 12.8 0.2 221.8 172.9MMTC [1] 44.8 -2.3 8.9 202012 38.8 -380.1 -16.7 -2518.5 -2.2 -2.3 2.2 64.0 15.8MOIL 163.3 4.4 37.3 1.4 202012 4.5 -7.4 -20.4 -72.2 -0.3 11.6 0.0 208.0 119.0Motherson Sumi [1] 223.0 6.9 32.2 5.6 202106 93.6 -64.2 23.0 7686.9 4.8 7.8 1.1 273.0 102.4
CMYK
MUMBAI
BusinessLine8 SUNDAY • SEPTEMBER 19 • 2021TAKE 500
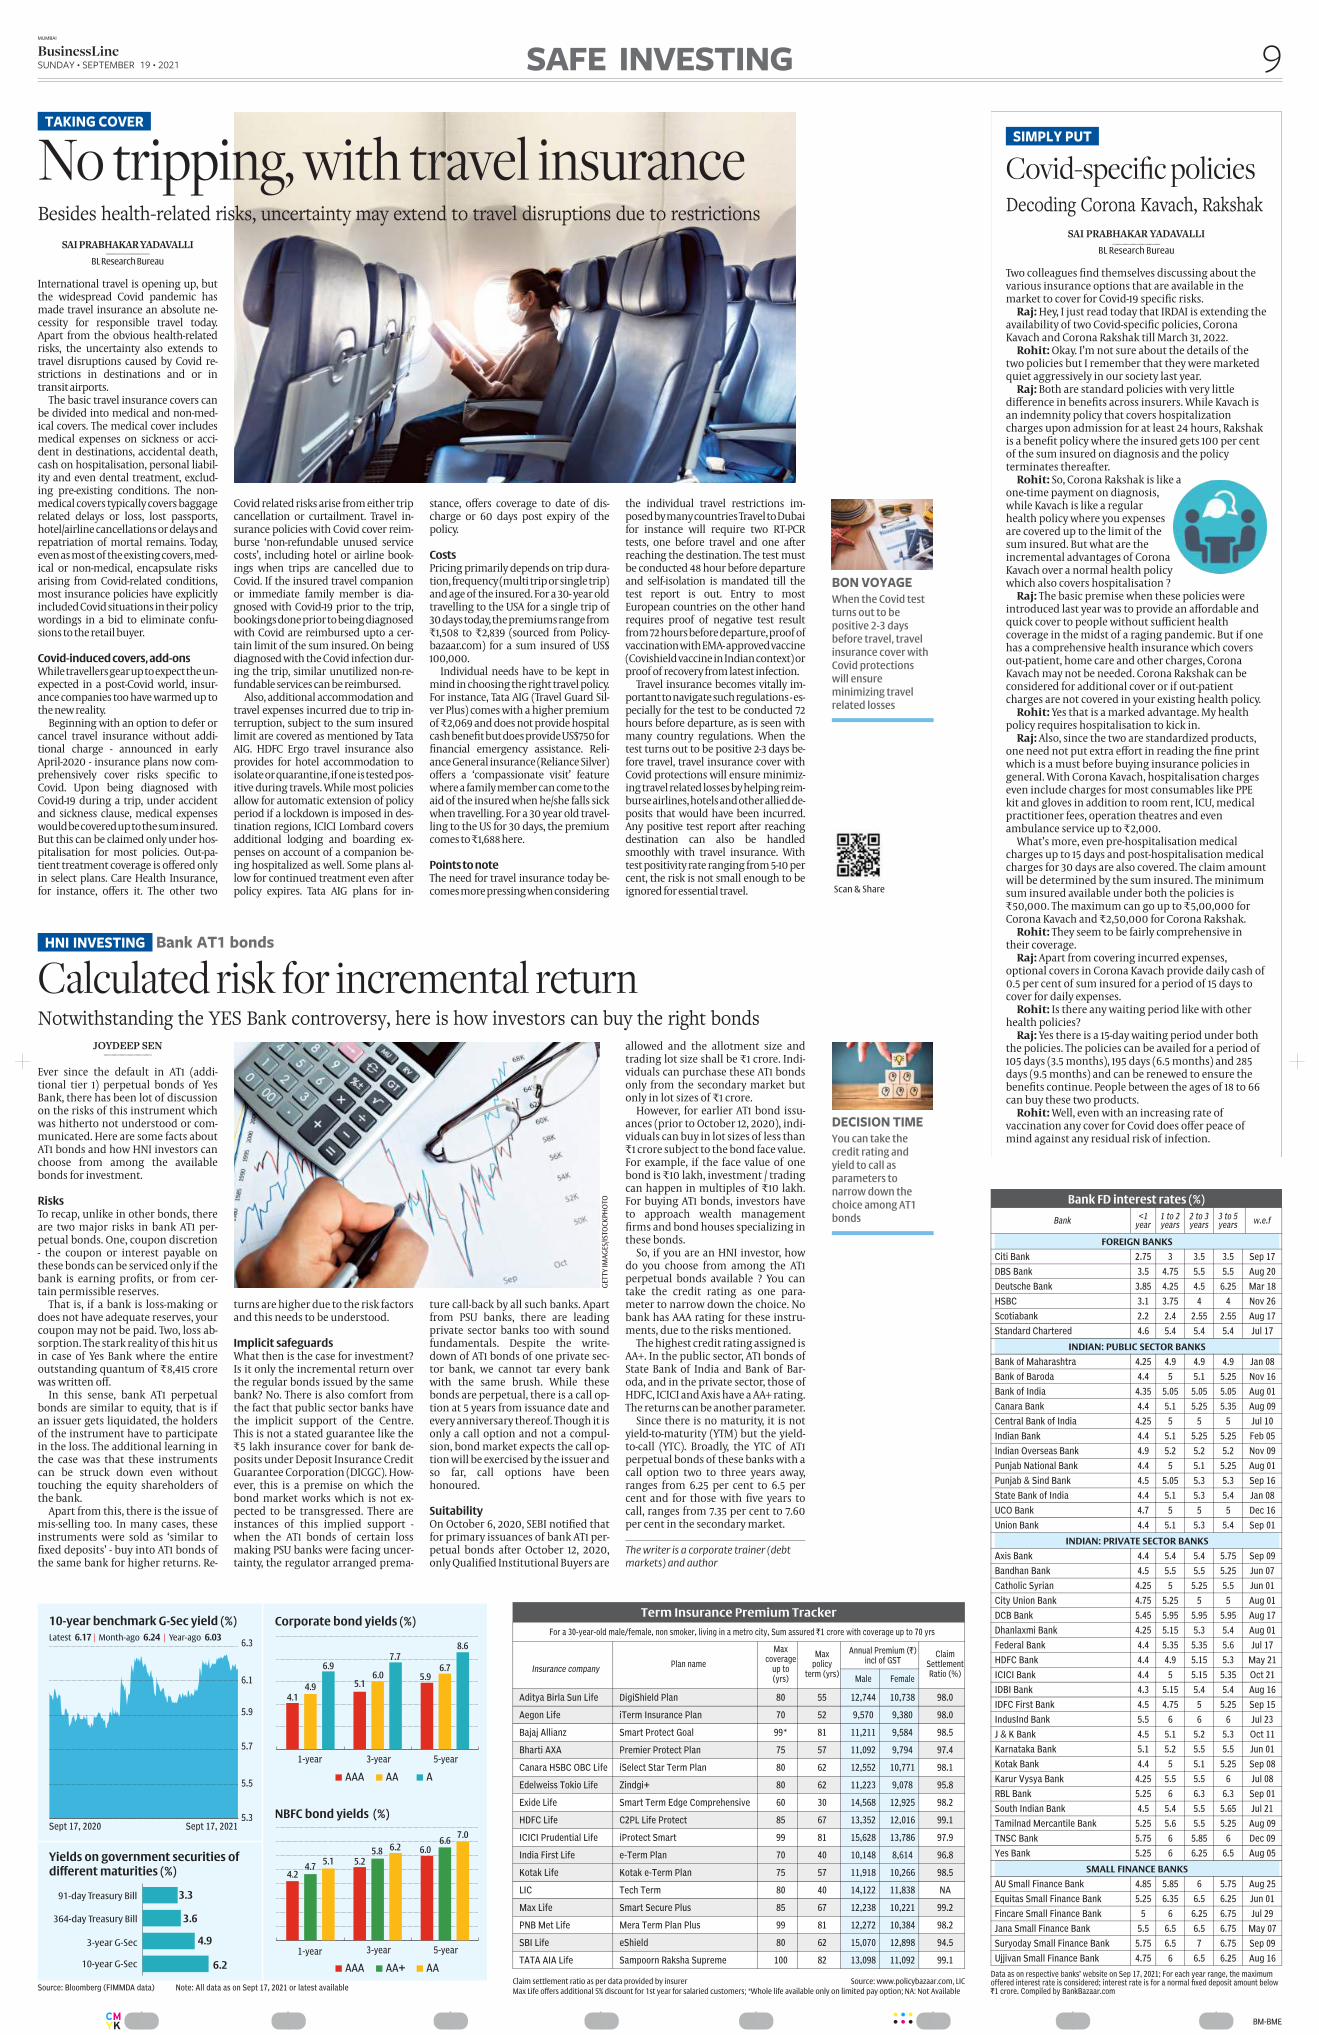
SAI PRABHAKAR YADAVALLI..........................................
BL Research Bureau
International travel is opening up, butthe widespread Covid pandemic hasmade travel insurance an absolute necessity for responsible travel today.Apart from the obvious healthrelatedrisks, the uncertainty also extends totravel disruptions caused by Covid restrictions in destinations and or intransit airports.
The basic travel insurance covers canbe divided into medical and nonmedical covers. The medical cover includesmedical expenses on sickness or accident in destinations, accidental death,cash on hospitalisation, personal liability and even dental treatment, excluding preexisting conditions. The nonmedical covers typically covers baggagerelated delays or loss, lost passports,hotel/airline cancellations or delays andrepatriation of mortal remains. Today,even as most of the existing covers, medical or nonmedical, encapsulate risksarising from Covidrelated conditions,most insurance policies have explicitlyincluded Covid situations in their policywordings in a bid to eliminate confusions to the retail buyer.
Covid-induced covers, add-onsWhile travellers gear up to expect the unexpected in a postCovid world, insurance companies too have warmed up tothe new reality.
Beginning with an option to defer orcancel travel insurance without additional charge announced in earlyApril2020 insurance plans now comprehensively cover risks specifi�c toCovid. Upon being diagnosed withCovid19 during a trip, under accidentand sickness clause, medical expenseswould be covered up to the sum insured.But this can be claimed only under hospitalisation for most policies. Outpatient treatment coverage is off�ered onlyin select plans. Care Health Insurance,for instance, off�ers it. The other two
Covid related risks arise from either tripcancellation or curtailment. Travel insurance policies with Covid cover reimburse ‘nonrefundable unused servicecosts’, including hotel or airline bookings when trips are cancelled due toCovid. If the insured travel companionor immediate family member is diagnosed with Covid19 prior to the trip,bookings done prior to being diagnosedwith Covid are reimbursed upto a certain limit of the sum insured. On beingdiagnosed with the Covid infection during the trip, similar unutilized nonrefundable services can be reimbursed.
Also, additional accommodation andtravel expenses incurred due to trip interruption, subject to the sum insuredlimit are covered as mentioned by TataAIG. HDFC Ergo travel insurance alsoprovides for hotel accommodation toisolate or quarantine, if one is tested positive during travels. While most policiesallow for automatic extension of policyperiod if a lockdown is imposed in destination regions, ICICI Lombard coversadditional lodging and boarding expenses on account of a companion being hospitalized as well. Some plans allow for continued treatment even afterpolicy expires. Tata AIG plans for in
stance, off�ers coverage to date of discharge or 60 days post expiry of thepolicy.
Costs Pricing primarily depends on trip duration, frequency (multi trip or single trip)and age of the insured. For a 30 year oldtravelling to the USA for a single trip of30 days today, the premiums range from₹�1,508 to ₹�2,839 (sourced from Policybazaar.com) for a sum insured of US$100,000.
Individual needs have to be kept inmind in choosing the right travel policy.For instance, Tata AIG (Travel Guard Silver Plus) comes with a higher premiumof ₹�2,069 and does not provide hospitalcash benefi�t but does provide US$750 forfi�nancial emergency assistance. Reliance General insurance (Reliance Silver)off�ers a ‘compassionate visit’ featurewhere a family member can come to theaid of the insured when he/she falls sickwhen travelling. For a 30 year old travelling to the US for 30 days, the premiumcomes to ₹�1,688 here.
Points to noteThe need for travel insurance today becomes more pressing when considering
the individual travel restrictions imposed by many countries Travel to Dubaifor instance will require two RTPCRtests, one before travel and one afterreaching the destination. The test mustbe conducted 48 hour before departureand selfisolation is mandated till thetest report is out. Entry to mostEuropean countries on the other handrequires proof of negative test resultfrom 72 hours before departure, proof ofvaccination with EMA approved vaccine(Covishield vaccine in Indian context) orproof of recovery from latest infection.
Travel insurance becomes vitally important to navigate such regulations especially for the test to be conducted 72hours before departure, as is seen withmany country regulations. When thetest turns out to be positive 23 days before travel, travel insurance cover withCovid protections will ensure minimizing travel related losses by helping reimburse airlines, hotels and other allied deposits that would have been incurred.Any positive test report after reachingdestination can also be handledsmoothly with travel insurance. Withtest positivity rate ranging from 510 percent, the risk is not small enough to beignored for essential travel.
No tripping, with travel insuranceBesides health-related risks, uncertainty may extend to travel disruptions due to restrictions
TAKING COVER
BON VOYAGE
When the Covid testturns out to bepositive 2-3 daysbefore travel, travelinsurance cover withCovid protectionswill ensureminimizing travelrelated losses
JOYDEEP SEN..........................................
Ever since the default in AT1 (additional tier 1) perpetual bonds of YesBank, there has been lot of discussionon the risks of this instrument whichwas hitherto not understood or communicated. Here are some facts aboutAT1 bonds and how HNI investors canchoose from among the availablebonds for investment.
RisksTo recap, unlike in other bonds, thereare two major risks in bank AT1 perpetual bonds. One, coupon discretion the coupon or interest payable onthese bonds can be serviced only if thebank is earning profi�ts, or from certain permissible reserves.
That is, if a bank is lossmaking ordoes not have adequate reserves, yourcoupon may not be paid. Two, loss absorption. The stark reality of this hit usin case of Yes Bank where the entireoutstanding quantum of ₹�8,415 crorewas written off�.
In this sense, bank AT1 perpetualbonds are similar to equity, that is ifan issuer gets liquidated, the holdersof the instrument have to participatein the loss. The additional learning inthe case was that these instrumentscan be struck down even withouttouching the equity shareholders ofthe bank.
Apart from this, there is the issue ofmisselling too. In many cases, theseinstruments were sold as ‘similar tofi�xed deposits’ buy into AT1 bonds ofthe same bank for higher returns. Re
turns are higher due to the risk factorsand this needs to be understood.
Implicit safeguards What then is the case for investment?Is it only the incremental return overthe regular bonds issued by the samebank? No. There is also comfort fromthe fact that public sector banks havethe implicit support of the Centre.This is not a stated guarantee like the₹�5 lakh insurance cover for bank deposits under Deposit Insurance CreditGuarantee Corporation (DICGC). However, this is a premise on which thebond market works which is not expected to be transgressed. There areinstances of this implied support when the AT1 bonds of certain lossmaking PSU banks were facing uncertainty, the regulator arranged prema
ture callback by all such banks. Apartfrom PSU banks, there are leadingprivate sector banks too with soundfundamentals. Despite the writedown of AT1 bonds of one private sector bank, we cannot tar every bankwith the same brush. While thesebonds are perpetual, there is a call option at 5 years from issuance date andevery anniversary thereof. Though it isonly a call option and not a compulsion, bond market expects the call option will be exercised by the issuer andso far, call options have beenhonoured.
SuitabilityOn October 6, 2020, SEBI notifi�ed thatfor primary issuances of bank AT1 perpetual bonds after October 12, 2020,only Qualifi�ed Institutional Buyers are
allowed and the allotment size andtrading lot size shall be ₹�1 crore. Individuals can purchase these AT1 bondsonly from the secondary market butonly in lot sizes of ₹�1 crore.
However, for earlier AT1 bond issuances (prior to October 12, 2020), individuals can buy in lot sizes of less than₹�1 crore subject to the bond face value.For example, if the face value of onebond is ₹�10 lakh, investment / tradingcan happen in multiples of ₹�10 lakh.For buying AT1 bonds, investors haveto approach wealth managementfi�rms and bond houses specializing inthese bonds.
So, if you are an HNI investor, howdo you choose from among the AT1perpetual bonds available ? You cantake the credit rating as one parameter to narrow down the choice. Nobank has AAA rating for these instruments, due to the risks mentioned.
The highest credit rating assigned isAA+. In the public sector, AT1 bonds ofState Bank of India and Bank of Baroda, and in the private sector, those ofHDFC, ICICI and Axis have a AA+ rating.The returns can be another parameter.
Since there is no maturity, it is notyieldtomaturity (YTM) but the yieldtocall (YTC). Broadly, the YTC of AT1perpetual bonds of these banks with acall option two to three years away,ranges from 6.25 per cent to 6.5 percent and for those with fi�ve years tocall, ranges from 7.35 per cent to 7.60per cent in the secondary market.
The writer is a corporate trainer (debt
markets) and author
Calculated risk for incremental returnNotwithstanding the YES Bank controversy, here is how investors can buy the right bonds
HNI INVESTING Bank AT1 bonds
DECISION TIME
You can take thecredit rating andyield to call asparameters tonarrow down thechoice among AT1bonds
GET
TY
IMA
GES
/IS
TOC
KP
HO
TO
................BMBME
Term Insurance Premium Tracker
For a 30yearold male/female, non smoker, living in a metro city, Sum assured ₹�1 crore with coverage up to 70 yrs
Plan name
Maxcoverage
up to(yrs)
Maxpolicy
term (yrs)
Annual Premium (₹�)incl of GST
ClaimSettlementRatio (%)
Insurance companyMale Female
Aditya Birla Sun Life DigiShield Plan 80 55 12,744 10,738 98.0
Aegon Life iTerm Insurance Plan 70 52 9,570 9,380 98.0
Bajaj Allianz Smart Protect Goal 99* 81 11,211 9,584 98.5
Bharti AXA Premier Protect Plan 75 57 11,092 9,794 97.4
Canara HSBC OBC Life iSelect Star Term Plan 80 62 12,552 10,771 98.1
Edelweiss Tokio Life Zindgi+ 80 62 11,223 9,078 95.8
Exide Life Smart Term Edge Comprehensive 60 30 14,568 12,925 98.2
HDFC Life C2PL Life Protect 85 67 13,352 12,016 99.1
ICICI Prudential Life iProtect Smart 99 81 15,628 13,786 97.9
India First Life eTerm Plan 70 40 10,148 8,614 96.8
Kotak Life Kotak eTerm Plan 75 57 11,918 10,266 98.5
LIC Tech Term 80 40 14,122 11,838 NA
Max Life Smart Secure Plus 85 67 12,238 10,221 99.2
PNB Met Life Mera Term Plan Plus 99 81 12,272 10,384 98.2
SBI Life eShield 80 62 15,070 12,898 94.5
TATA AIA Life Sampoorn Raksha Supreme 100 82 13,098 11,092 99.1
Claim settlement ratio as per data provided by insurer Source: www.policybazaar.com, LICMax Life offers additional 5% discount for 1st year for salaried customers; *Whole life available only on limited pay option; NA: Not Available
Bank FD interest rates (%)
Bank<1
year1 to 2years
2 to 3years
3 to 5years
w.e.f
FOREIGN BANKS
Citi Bank 2.75 3 3.5 3.5 Sep 17
DBS Bank 3.5 4.75 5.5 5.5 Aug 20
Deutsche Bank 3.85 4.25 4.5 6.25 Mar 18
HSBC 3.1 3.75 4 4 Nov 26
Scotiabank 2.2 2.4 2.55 2.55 Aug 17
Standard Chartered 4.6 5.4 5.4 5.4 Jul 17
INDIAN: PUBLIC SECTOR BANKS
Bank of Maharashtra 4.25 4.9 4.9 4.9 Jan 08
Bank of Baroda 4.4 5 5.1 5.25 Nov 16
Bank of India 4.35 5.05 5.05 5.05 Aug 01
Canara Bank 4.4 5.1 5.25 5.35 Aug 09
Central Bank of India 4.25 5 5 5 Jul 10
Indian Bank 4.4 5.1 5.25 5.25 Feb 05
Indian Overseas Bank 4.9 5.2 5.2 5.2 Nov 09
Punjab National Bank 4.4 5 5.1 5.25 Aug 01
Punjab & Sind Bank 4.5 5.05 5.3 5.3 Sep 16
State Bank of India 4.4 5.1 5.3 5.4 Jan 08
UCO Bank 4.7 5 5 5 Dec 16
Union Bank 4.4 5.1 5.3 5.4 Sep 01
INDIAN: PRIVATE SECTOR BANKS
Axis Bank 4.4 5.4 5.4 5.75 Sep 09
Bandhan Bank 4.5 5.5 5.5 5.25 Jun 07
Catholic Syrian 4.25 5 5.25 5.5 Jun 01
City Union Bank 4.75 5.25 5 5 Aug 01
DCB Bank 5.45 5.95 5.95 5.95 Aug 17
Dhanlaxmi Bank 4.25 5.15 5.3 5.4 Aug 01
Federal Bank 4.4 5.35 5.35 5.6 Jul 17
HDFC Bank 4.4 4.9 5.15 5.3 May 21
ICICI Bank 4.4 5 5.15 5.35 Oct 21
IDBI Bank 4.3 5.15 5.4 5.4 Aug 16
IDFC First Bank 4.5 4.75 5 5.25 Sep 15
IndusInd Bank 5.5 6 6 6 Jul 23
J & K Bank 4.5 5.1 5.2 5.3 Oct 11
Karnataka Bank 5.1 5.2 5.5 5.5 Jun 01
Kotak Bank 4.4 5 5.1 5.25 Sep 08
Karur Vysya Bank 4.25 5.5 5.5 6 Jul 08
RBL Bank 5.25 6 6.3 6.3 Sep 01
South Indian Bank 4.5 5.4 5.5 5.65 Jul 21
Tamilnad Mercantile Bank 5.25 5.6 5.5 5.25 Aug 09
TNSC Bank 5.75 6 5.85 6 Dec 09
Yes Bank 5.25 6 6.25 6.5 Aug 05
SMALL FINANCE BANKS
AU Small Finance Bank 4.85 5.85 6 5.75 Aug 25
Equitas Small Finance Bank 5.25 6.35 6.5 6.25 Jun 01
Fincare Small Finance Bank 5 6 6.25 6.75 Jul 29
Jana Small Finance Bank 5.5 6.5 6.5 6.75 May 07
Suryoday Small Finance Bank 5.75 6.5 7 6.75 Sep 09
Ujjivan Small Finance Bank 4.75 6 6.5 6.25 Aug 16
Data as on respective banks’ website on Sep 17, 2021; For each year range, the maximumoffered interest rate is considered; interest rate is for a normal fi�xed deposit amount below₹�1 crore. Compiled by BankBazaar.com
SAI PRABHAKAR YADAVALLI..........................................
BL Research Bureau
Two colleagues fi�nd themselves discussing about thevarious insurance options that are available in themarket to cover for Covid19 specifi�c risks.Raj: Hey, I just read today that IRDAI is extending the
availability of two Covidspecifi�c policies, CoronaKavach and Corona Rakshak till March 31, 2022.Rohit: Okay. I’m not sure about the details of the
two policies but I remember that they were marketedquiet aggressively in our society last year.Raj: Both are standard policies with very little
diff�erence in benefi�ts across insurers. While Kavach isan indemnity policy that covers hospitalizationcharges upon admission for at least 24 hours, Rakshakis a benefi�t policy where the insured gets 100 per centof the sum insured on diagnosis and the policyterminates thereafter.Rohit: So, Corona Rakshak is like a
onetime payment on diagnosis,while Kavach is like a regularhealth policy where you expensesare covered up to the limit of thesum insured. But what are theincremental advantages of CoronaKavach over a normal health policywhich also covers hospitalisation ?Raj: The basic premise when these policies were
introduced last year was to provide an aff�ordable andquick cover to people without suffi�cient healthcoverage in the midst of a raging pandemic. But if onehas a comprehensive health insurance which coversoutpatient, home care and other charges, CoronaKavach may not be needed. Corona Rakshak can beconsidered for additional cover or if outpatientcharges are not covered in your existing health policy.Rohit: Yes that is a marked advantage. My health
policy requires hospitalisation to kick in.Raj: Also, since the two are standardized products,
one need not put extra eff�ort in reading the fi�ne printwhich is a must before buying insurance policies ingeneral. With Corona Kavach, hospitalisation chargeseven include charges for most consumables like PPEkit and gloves in addition to room rent, ICU, medicalpractitioner fees, operation theatres and evenambulance service up to ₹�2,000.
What’s more, even prehospitalisation medicalcharges up to 15 days and posthospitalisation medicalcharges for 30 days are also covered. The claim amountwill be determined by the sum insured. The minimumsum insured available under both the policies is₹�50,000. The maximum can go up to ₹�5,00,000 forCorona Kavach and ₹�2,50,000 for Corona Rakshak.Rohit: They seem to be fairly comprehensive in
their coverage.Raj: Apart from covering incurred expenses,
optional covers in Corona Kavach provide daily cash of0.5 per cent of sum insured for a period of 15 days tocover for daily expenses.Rohit: Is there any waiting period like with other
health policies?Raj: Yes there is a 15day waiting period under both
the policies. The policies can be availed for a period of105 days (3.5 months), 195 days (6.5 months) and 285days (9.5 months) and can be renewed to ensure thebenefi�ts continue. People between the ages of 18 to 66can buy these two products.Rohit: Well, even with an increasing rate of
vaccination any cover for Covid does off�er peace ofmind against any residual risk of infection.
Decoding Corona Kavach, Rakshak
Covid-specific policiesSIMPLY PUT
CMYK
MUMBAI
BusinessLine 9SUNDAY • SEPTEMBER 19 • 2021 SAFE INVESTING
Scan & Share
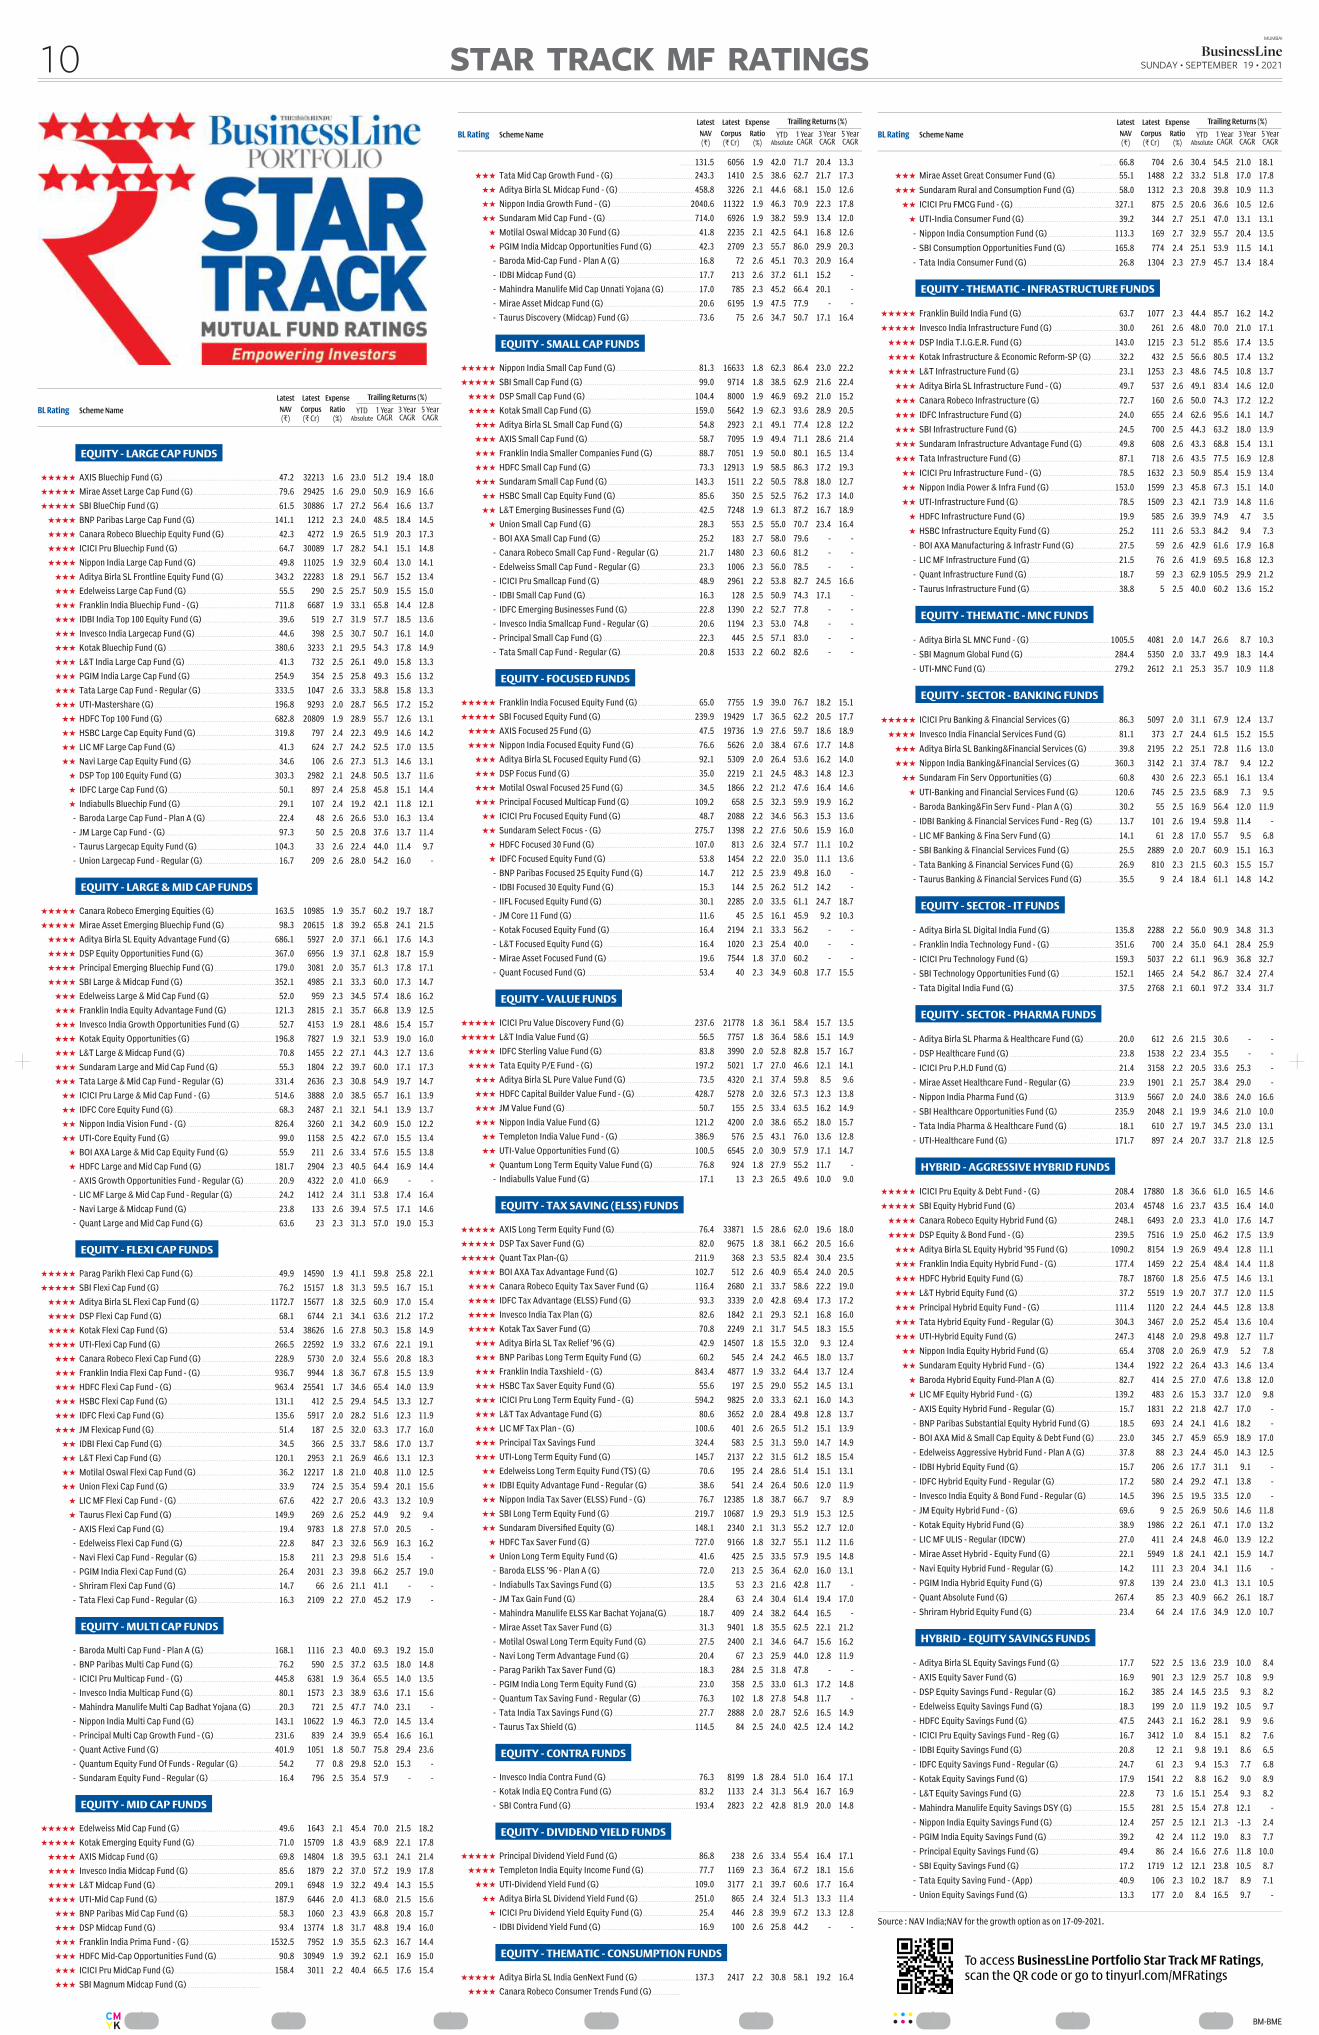
................BM-BME
EQUITY - LARGE CAP FUNDS
★★★★★ AXIS Bluechip Fund (G) . . . . . . . . . . . . . . . . . . . . . . . . . . . . . . . . . . . . . . . . . . . . . . . . . . . . .. . . . . . . . . . 47.2 32213 1.6 23.0 51.2 19.4 18.0
★★★★★ Mirae Asset Large Cap Fund (G) . . . . . . . . . . . . . . . . . . . . . . . . . . . . . . . . . . . . .. . . . . . . . . . 79.6 29425 1.6 29.0 50.9 16.9 16.6
★★★★★ SBI BlueChip Fund (G). . . . . . . . . . . . . . . . . . . . . . . . . . . . . . . . . . . . . . . . . . . . . . . . . . . . . . . .. . . . . . . . . . 61.5 30886 1.7 27.2 56.4 16.6 13.7
★★★★ BNP Paribas Large Cap Fund (G) . . . . . . . . . . . . . . . . . . . . . . . . . . . . . . . . . . . .. . . . . . . . 141.1 1212 2.3 24.0 48.5 18.4 14.5
★★★★ Canara Robeco Bluechip Equity Fund (G) . . . . . . . . . . . . . . . . . . . .. . . . . . . . . . 42.3 4272 1.9 26.5 51.9 20.3 17.3
★★★★ ICICI Pru Bluechip Fund (G) . . . . . . . . . . . . . . . . . . . . . . . . . . . . . . . . . . . . . . . . . . . . .. . . . . . . . . . 64.7 30089 1.7 28.2 54.1 15.1 14.8
★★★★ Nippon India Large Cap Fund (G) . . . . . . . . . . . . . . . . . . . . . . . . . . . . . . . . . . .. . . . . . . . . . 49.8 11025 1.9 32.9 60.4 13.0 14.1
★★★ Aditya Birla SL Frontline Equity Fund (G) . . . . . . . . . . . . . . . . . . . .. . . . . . . . 343.2 22283 1.8 29.1 56.7 15.2 13.4
★★★ Edelweiss Large Cap Fund (G) . . . . . . . . . . . . . . . . . . . . . . . . . . . . . . . . . . . . . . . .. . . . . . . . . . 55.5 290 2.5 25.7 50.9 15.5 15.0
★★★ Franklin India Bluechip Fund - (G). . . . . . . . . . . . . . . . . . . . . . . . . . . . . . . . . .. . . . . . . . 711.8 6687 1.9 33.1 65.8 14.4 12.8
★★★ IDBI India Top 100 Equity Fund (G) . . . . . . . . . . . . . . . . . . . . . . . . . . . . . . . .. . . . . . . . . . 39.6 519 2.7 31.9 57.7 18.5 13.6
★★★ Invesco India Largecap Fund (G) . . . . . . . . . . . . . . . . . . . . . . . . . . . . . . . . . . . .. . . . . . . . . . 44.6 398 2.5 30.7 50.7 16.1 14.0
★★★ Kotak Bluechip Fund (G) . . . . . . . . . . . . . . . . . . . . . . . . . . . . . . . . . . . . . . . . . . . . . . . . . . .. . . . . . . . 380.6 3233 2.1 29.5 54.3 17.8 14.9
★★★ L&T India Large Cap Fund (G) . . . . . . . . . . . . . . . . . . . . . . . . . . . . . . . . . . . . . . . . .. . . . . . . . . . 41.3 732 2.5 26.1 49.0 15.8 13.3
★★★ PGIM India Large Cap Fund (G) . . . . . . . . . . . . . . . . . . . . . . . . . . . . . . . . . . . . . .. . . . . . . . 254.9 354 2.5 25.8 49.3 15.6 13.2
★★★ Tata Large Cap Fund - Regular (G) . . . . . . . . . . . . . . . . . . . . . . . . . . . . . . . .. . . . . . . . 333.5 1047 2.6 33.3 58.8 15.8 13.3
★★★ UTI-Mastershare (G) . . . . . . . . . . . . . . . . . . . . . . . . . . . . . . . . . . . . . . . . . . . . . . . . . . . . . . . . . .. . . . . . . . 196.8 9293 2.0 28.7 56.5 17.2 15.2
★★ HDFC Top 100 Fund (G) . . . . . . . . . . . . . . . . . . . . . . . . . . . . . . . . . . . . . . . . . . . . . . . . . . . . .. . . . . . . . 682.8 20809 1.9 28.9 55.7 12.6 13.1
★★ HSBC Large Cap Equity Fund (G) . . . . . . . . . . . . . . . . . . . . . . . . . . . . . . . . . . .. . . . . . . . 319.8 797 2.4 22.3 49.9 14.6 14.2
★★ LIC MF Large Cap Fund (G) . . . . . . . . . . . . . . . . . . . . . . . . . . . . . . . . . . . . . . . . . . . . . .. . . . . . . . . . 41.3 624 2.7 24.2 52.5 17.0 13.5
★★ Navi Large Cap Equity Fund (G) . . . . . . . . . . . . . . . . . . . . . . . . . . . . . . . . . . . . . .. . . . . . . . . . 34.6 106 2.6 27.3 51.3 14.6 13.1
★ DSP Top 100 Equity Fund (G) . . . . . . . . . . . . . . . . . . . . . . . . . . . . . . . . . . . . . . . . . . .. . . . . . . . 303.3 2982 2.1 24.8 50.5 13.7 11.6
★ IDFC Large Cap Fund (G). . . . . . . . . . . . . . . . . . . . . . . . . . . . . . . . . . . . . . . . . . . . . . . . . . .. . . . . . . . . . 50.1 897 2.4 25.8 45.8 15.1 14.4
★ Indiabulls Bluechip Fund (G) . . . . . . . . . . . . . . . . . . . . . . . . . . . . . . . . . . . . . . . . . . . .. . . . . . . . . . 29.1 107 2.4 19.2 42.1 11.8 12.1
- Baroda Large Cap Fund - Plan A (G) . . . . . . . . . . . . . . . . . . . . . . . . . . . . . .. . . . . . . . . . 22.4 48 2.6 26.6 53.0 16.3 13.4
- JM Large Cap Fund - (G) . . . . . . . . . . . . . . . . . . . . . . . . . . . . . . . . . . . . . . . . . . . . . . . . . . . .. . . . . . . . . . 97.3 50 2.5 20.8 37.6 13.7 11.4
- Taurus Largecap Equity Fund (G). . . . . . . . . . . . . . . . . . . . . . . . . . . . . . . . . . .. . . . . . . . 104.3 33 2.6 22.4 44.0 11.4 9.7
- Union Largecap Fund - Regular (G). . . . . . . . . . . . . . . . . . . . . . . . . . . . . . . .. . . . . . . . . . 16.7 209 2.6 28.0 54.2 16.0 -
EQUITY - LARGE & MID CAP FUNDS
★★★★★ Canara Robeco Emerging Equities (G) . . . . . . . . . . . . . . . . . . . . . . . . .. . . . . . . . 163.5 10985 1.9 35.7 60.2 19.7 18.7
★★★★★ Mirae Asset Emerging Bluechip Fund (G) . . . . . . . . . . . . . . . . . . . .. . . . . . . . . . 98.3 20615 1.8 39.2 65.8 24.1 21.5
★★★★ Aditya Birla SL Equity Advantage Fund (G). . . . . . . . . . . . . . . . .. . . . . . . . 686.1 5927 2.0 37.1 66.1 17.6 14.3
★★★★ DSP Equity Opportunities Fund (G) . . . . . . . . . . . . . . . . . . . . . . . . . . . . . . .. . . . . . . . 367.0 6956 1.9 37.1 62.8 18.7 15.9
★★★★ Principal Emerging Bluechip Fund (G) . . . . . . . . . . . . . . . . . . . . . . . . .. . . . . . . . 179.0 3081 2.0 35.7 61.3 17.8 17.1
★★★★ SBI Large & Midcap Fund (G) . . . . . . . . . . . . . . . . . . . . . . . . . . . . . . . . . . . . . . . . . .. . . . . . . . 352.1 4985 2.1 33.3 60.0 17.3 14.7
★★★ Edelweiss Large & Mid Cap Fund (G) . . . . . . . . . . . . . . . . . . . . . . . . . . . .. . . . . . . . . . 52.0 959 2.3 34.5 57.4 18.6 16.2
★★★ Franklin India Equity Advantage Fund (G) . . . . . . . . . . . . . . . . . .. . . . . . . . 121.3 2815 2.1 35.7 66.8 13.9 12.5
★★★ Invesco India Growth Opportunities Fund (G) . . . . . . . . . . .. . . . . . . . . . 52.7 4153 1.9 28.1 48.6 15.4 15.7
★★★ Kotak Equity Opportunities (G) . . . . . . . . . . . . . . . . . . . . . . . . . . . . . . . . . . . . . .. . . . . . . . 196.8 7827 1.9 32.1 53.9 19.0 16.0
★★★ L&T Large & Midcap Fund (G) . . . . . . . . . . . . . . . . . . . . . . . . . . . . . . . . . . . . . . . . .. . . . . . . . . . 70.8 1455 2.2 27.1 44.3 12.7 13.6
★★★ Sundaram Large and Mid Cap Fund (G) . . . . . . . . . . . . . . . . . . . . . . .. . . . . . . . . . 55.3 1804 2.2 39.7 60.0 17.1 17.3
★★★ Tata Large & Mid Cap Fund - Regular (G) . . . . . . . . . . . . . . . . . . . .. . . . . . . . 331.4 2636 2.3 30.8 54.9 19.7 14.7
★★ ICICI Pru Large & Mid Cap Fund - (G) . . . . . . . . . . . . . . . . . . . . . . . . . . .. . . . . . . . 514.6 3888 2.0 38.5 65.7 16.1 13.9
★★ IDFC Core Equity Fund (G). . . . . . . . . . . . . . . . . . . . . . . . . . . . . . . . . . . . . . . . . . . . . . . .. . . . . . . . . . 68.3 2487 2.1 32.1 54.1 13.9 13.7
★★ Nippon India Vision Fund - (G) . . . . . . . . . . . . . . . . . . . . . . . . . . . . . . . . . . . . . . . .. . . . . . . . 826.4 3260 2.1 34.2 60.9 15.0 12.2
★★ UTI-Core Equity Fund (G) . . . . . . . . . . . . . . . . . . . . . . . . . . . . . . . . . . . . . . . . . . . . . . . . . .. . . . . . . . . . 99.0 1158 2.5 42.2 67.0 15.5 13.4
★ BOI AXA Large & Mid Cap Equity Fund (G). . . . . . . . . . . . . . . . . .. . . . . . . . . . 55.9 211 2.6 33.4 57.6 15.5 13.8
★ HDFC Large and Mid Cap Fund (G) . . . . . . . . . . . . . . . . . . . . . . . . . . . . . . . .. . . . . . . . 181.7 2904 2.3 40.5 64.4 16.9 14.4
- AXIS Growth Opportunities Fund - Regular (G) . . . . . . . . .. . . . . . . . . . 20.9 4322 2.0 41.0 66.9 - -
- LIC MF Large & Mid Cap Fund - Regular (G) . . . . . . . . . . . . . . .. . . . . . . . . . 24.2 1412 2.4 31.1 53.8 17.4 16.4
- Navi Large & Midcap Fund (G) . . . . . . . . . . . . . . . . . . . . . . . . . . . . . . . . . . . . . . . .. . . . . . . . . . 23.8 133 2.6 39.4 57.5 17.1 14.6
- Quant Large and Mid Cap Fund (G) . . . . . . . . . . . . . . . . . . . . . . . . . . . . . . .. . . . . . . . . . 63.6 23 2.3 31.3 57.0 19.0 15.3
EQUITY - FLEXI CAP FUNDS
★★★★★ Parag Parikh Flexi Cap Fund (G) . . . . . . . . . . . . . . . . . . . . . . . . . . . . . . . . . . . . .. . . . . . . . . . 49.9 14590 1.9 41.1 59.8 25.8 22.1
★★★★★ SBI Flexi Cap Fund (G) . . . . . . . . . . . . . . . . . . . . . . . . . . . . . . . . . . . . . . . . . . . . . . . . . . . . . . .. . . . . . . . . . 76.2 15157 1.8 31.3 59.5 16.7 15.1
★★★★ Aditya Birla SL Flexi Cap Fund (G) . . . . . . . . . . . . . . . . . . . . . . . . . . . . . . . . .. . . . . 1172.7 15677 1.8 32.5 60.9 17.0 15.4
★★★★ DSP Flexi Cap Fund (G) . . . . . . . . . . . . . . . . . . . . . . . . . . . . . . . . . . . . . . . . . . . . . . . . . . . . . .. . . . . . . . . . 68.1 6744 2.1 34.1 63.6 21.2 17.2
★★★★ Kotak Flexi Cap Fund (G). . . . . . . . . . . . . . . . . . . . . . . . . . . . . . . . . . . . . . . . . . . . . . . . . . .. . . . . . . . . . 53.4 38626 1.6 27.8 50.3 15.8 14.9
★★★★ UTI-Flexi Cap Fund (G). . . . . . . . . . . . . . . . . . . . . . . . . . . . . . . . . . . . . . . . . . . . . . . . . . . . . . .. . . . . . . . 266.5 22592 1.9 33.2 67.6 22.1 19.1
★★★ Canara Robeco Flexi Cap Fund (G) . . . . . . . . . . . . . . . . . . . . . . . . . . . . . . . .. . . . . . . . 228.9 5730 2.0 32.4 55.6 20.8 18.3
★★★ Franklin India Flexi Cap Fund - (G) . . . . . . . . . . . . . . . . . . . . . . . . . . . . . . . . .. . . . . . . . 936.7 9944 1.8 36.7 67.8 15.5 13.9
★★★ HDFC Flexi Cap Fund - (G) . . . . . . . . . . . . . . . . . . . . . . . . . . . . . . . . . . . . . . . . . . . . . . . .. . . . . . . . 963.4 25541 1.7 34.6 65.4 14.0 13.9
★★★ HSBC Flexi Cap Fund (G) . . . . . . . . . . . . . . . . . . . . . . . . . . . . . . . . . . . . . . . . . . . . . . . . . . .. . . . . . . . 131.1 412 2.5 29.4 54.5 13.3 12.7
★★★ IDFC Flexi Cap Fund (G). . . . . . . . . . . . . . . . . . . . . . . . . . . . . . . . . . . . . . . . . . . . . . . . . . . . .. . . . . . . . 135.6 5917 2.0 28.2 51.6 12.3 11.9
★★★ JM Flexicap Fund (G) . . . . . . . . . . . . . . . . . . . . . . . . . . . . . . . . . . . . . . . . . . . . . . . . . . . . . . . . . .. . . . . . . . . . 51.4 187 2.5 32.0 63.3 17.7 16.0
★★ IDBI Flexi Cap Fund (G) . . . . . . . . . . . . . . . . . . . . . . . . . . . . . . . . . . . . . . . . . . . . . . . . . . . . . .. . . . . . . . . . 34.5 366 2.5 33.7 58.6 17.0 13.7
★★ L&T Flexi Cap Fund (G) . . . . . . . . . . . . . . . . . . . . . . . . . . . . . . . . . . . . . . . . . . . . . . . . . . . . . .. . . . . . . . 120.1 2953 2.1 26.9 46.6 13.1 12.3
★★ Motilal Oswal Flexi Cap Fund (G) . . . . . . . . . . . . . . . . . . . . . . . . . . . . . . . . . . .. . . . . . . . . . 36.2 12217 1.8 21.0 40.8 11.0 12.5
★★ Union Flexi Cap Fund (G). . . . . . . . . . . . . . . . . . . . . . . . . . . . . . . . . . . . . . . . . . . . . . . . . . .. . . . . . . . . . 33.9 724 2.5 35.4 59.4 20.1 15.6
★ LIC MF Flexi Cap Fund - (G) . . . . . . . . . . . . . . . . . . . . . . . . . . . . . . . . . . . . . . . . . . . . . .. . . . . . . . . . 67.6 422 2.7 20.6 43.3 13.2 10.9
★ Taurus Flexi Cap Fund (G) . . . . . . . . . . . . . . . . . . . . . . . . . . . . . . . . . . . . . . . . . . . . . . . .. . . . . . . . 149.9 269 2.6 25.2 44.9 9.2 9.4
- AXIS Flexi Cap Fund (G). . . . . . . . . . . . . . . . . . . . . . . . . . . . . . . . . . . . . . . . . . . . . . . . . . . . .. . . . . . . . . . 19.4 9783 1.8 27.8 57.0 20.5 -
- Edelweiss Flexi Cap Fund (G) . . . . . . . . . . . . . . . . . . . . . . . . . . . . . . . . . . . . . . . . . .. . . . . . . . . . 22.8 847 2.3 32.6 56.9 16.3 16.2
- Navi Flexi Cap Fund - Regular (G). . . . . . . . . . . . . . . . . . . . . . . . . . . . . . . . . . .. . . . . . . . . . 15.8 211 2.3 29.8 51.6 15.4 -
- PGIM India Flexi Cap Fund (G) . . . . . . . . . . . . . . . . . . . . . . . . . . . . . . . . . . . . . . . .. . . . . . . . . . 26.4 2031 2.3 39.8 66.2 25.7 19.0
- Shriram Flexi Cap Fund (G) . . . . . . . . . . . . . . . . . . . . . . . . . . . . . . . . . . . . . . . . . . . . . .. . . . . . . . . . 14.7 66 2.6 21.1 41.1 - -
- Tata Flexi Cap Fund - Regular (G) . . . . . . . . . . . . . . . . . . . . . . . . . . . . . . . . . .. . . . . . . . . . 16.3 2109 2.2 27.0 45.2 17.9 -
EQUITY - MULTI CAP FUNDS
- Baroda Multi Cap Fund - Plan A (G) . . . . . . . . . . . . . . . . . . . . . . . . . . . . . . .. . . . . . . . 168.1 1116 2.3 40.0 69.3 19.2 15.0
- BNP Paribas Multi Cap Fund (G) . . . . . . . . . . . . . . . . . . . . . . . . . . . . . . . . . . . . .. . . . . . . . . . 76.2 590 2.5 37.2 63.5 18.0 14.8
- ICICI Pru Multicap Fund - (G) . . . . . . . . . . . . . . . . . . . . . . . . . . . . . . . . . . . . . . . . . .. . . . . . . . 445.8 6381 1.9 36.4 65.5 14.0 13.5
- Invesco India Multicap Fund (G) . . . . . . . . . . . . . . . . . . . . . . . . . . . . . . . . . . . . .. . . . . . . . . . 80.1 1573 2.3 38.9 63.6 17.1 15.6
- Mahindra Manulife Multi Cap Badhat Yojana (G) . . . . .. . . . . . . . . . 20.3 721 2.5 47.7 74.0 23.1 -
- Nippon India Multi Cap Fund (G) . . . . . . . . . . . . . . . . . . . . . . . . . . . . . . . . . . . .. . . . . . . . 143.1 10622 1.9 46.3 72.0 14.5 13.4
- Principal Multi Cap Growth Fund - (G) . . . . . . . . . . . . . . . . . . . . . . . . .. . . . . . . . 231.6 839 2.4 39.9 65.4 16.6 16.1
- Quant Active Fund (G) . . . . . . . . . . . . . . . . . . . . . . . . . . . . . . . . . . . . . . . . . . . . . . . . . . . . . . .. . . . . . . . 401.9 1051 1.8 50.7 75.8 29.4 23.6
- Quantum Equity Fund Of Funds - Regular (G) . . . . . . . . . . . .. . . . . . . . . . 54.2 77 0.8 29.8 52.0 15.3 -
- Sundaram Equity Fund - Regular (G) . . . . . . . . . . . . . . . . . . . . . . . . . . . .. . . . . . . . . . 16.4 796 2.5 35.4 57.9 - -
EQUITY - MID CAP FUNDS
★★★★★ Edelweiss Mid Cap Fund (G) . . . . . . . . . . . . . . . . . . . . . . . . . . . . . . . . . . . . . . . . . . . .. . . . . . . . . . 49.6 1643 2.1 45.4 70.0 21.5 18.2
★★★★★ Kotak Emerging Equity Fund (G) . . . . . . . . . . . . . . . . . . . . . . . . . . . . . . . . . . . .. . . . . . . . . . 71.0 15709 1.8 43.9 68.9 22.1 17.8
★★★★ AXIS Midcap Fund (G) . . . . . . . . . . . . . . . . . . . . . . . . . . . . . . . . . . . . . . . . . . . . . . . . . . . . . . . .. . . . . . . . . . 69.8 14804 1.8 39.5 63.1 24.1 21.4
★★★★ Invesco India Midcap Fund (G) . . . . . . . . . . . . . . . . . . . . . . . . . . . . . . . . . . . . . . .. . . . . . . . . . 85.6 1879 2.2 37.0 57.2 19.9 17.8
★★★★ L&T Midcap Fund (G) . . . . . . . . . . . . . . . . . . . . . . . . . . . . . . . . . . . . . . . . . . . . . . . . . . . . . . . . .. . . . . . . . 209.1 6948 1.9 32.2 49.4 14.3 15.5
★★★★ UTI-Mid Cap Fund (G) . . . . . . . . . . . . . . . . . . . . . . . . . . . . . . . . . . . . . . . . . . . . . . . . . . . . . . . .. . . . . . . . 187.9 6446 2.0 41.3 68.0 21.5 15.6
★★★ BNP Paribas Mid Cap Fund (G). . . . . . . . . . . . . . . . . . . . . . . . . . . . . . . . . . . . . . . .. . . . . . . . . . 58.3 1060 2.3 43.9 66.8 20.8 15.7
★★★ DSP Midcap Fund (G) . . . . . . . . . . . . . . . . . . . . . . . . . . . . . . . . . . . . . . . . . . . . . . . . . . . . . . . . .. . . . . . . . . . 93.4 13774 1.8 31.7 48.8 19.4 16.0
★★★ Franklin India Prima Fund - (G) . . . . . . . . . . . . . . . . . . . . . . . . . . . . . . . . . . . . . . .. . . . . 1532.5 7952 1.9 35.5 62.3 16.7 14.4
★★★ HDFC Mid-Cap Opportunities Fund (G) . . . . . . . . . . . . . . . . . . . . . . . .. . . . . . . . . . 90.8 30949 1.9 39.2 62.1 16.9 15.0
★★★ ICICI Pru MidCap Fund (G) . . . . . . . . . . . . . . . . . . . . . . . . . . . . . . . . . . . . . . . . . . . . . . .. . . . . . . . 158.4 3011 2.2 40.4 66.5 17.6 15.4
★★★ SBI Magnum Midcap Fund (G) . . . . . . . . . . . . . . . . . . . . . . . . . . . . . . . . . . . . . . . .
. . . . . . . . . . 66.8 704 2.6 30.4 54.5 21.0 18.1
★★★ Mirae Asset Great Consumer Fund (G). . . . . . . . . . . . . . . . . . . . . . . . .. . . . . . . . . . 55.1 1488 2.2 33.2 51.8 17.0 17.8
★★★ Sundaram Rural and Consumption Fund (G) . . . . . . . . . . . . . .. . . . . . . . . . 58.0 1312 2.3 20.8 39.8 10.9 11.3
★★ ICICI Pru FMCG Fund - (G) . . . . . . . . . . . . . . . . . . . . . . . . . . . . . . . . . . . . . . . . . . . . . . . .. . . . . . . . 327.1 875 2.5 20.6 36.6 10.5 12.6
★ UTI-India Consumer Fund (G) . . . . . . . . . . . . . . . . . . . . . . . . . . . . . . . . . . . . . . . . . .. . . . . . . . . . 39.2 344 2.7 25.1 47.0 13.1 13.1
- Nippon India Consumption Fund (G) . . . . . . . . . . . . . . . . . . . . . . . . . . . . .. . . . . . . . 113.3 169 2.7 32.9 55.7 20.4 13.5
- SBI Consumption Opportunities Fund (G) . . . . . . . . . . . . . . . . . . .. . . . . . . . 165.8 774 2.4 25.1 53.9 11.5 14.1
- Tata India Consumer Fund (G) . . . . . . . . . . . . . . . . . . . . . . . . . . . . . . . . . . . . . . . .. . . . . . . . . . 26.8 1304 2.3 27.9 45.7 13.4 18.4
EQUITY - THEMATIC - INFRASTRUCTURE FUNDS
★★★★★ Franklin Build India Fund (G) . . . . . . . . . . . . . . . . . . . . . . . . . . . . . . . . . . . . . . . . . . .. . . . . . . . . . 63.7 1077 2.3 44.4 85.7 16.2 14.2
★★★★★ Invesco India Infrastructure Fund (G) . . . . . . . . . . . . . . . . . . . . . . . . . .. . . . . . . . . . 30.0 261 2.6 48.0 70.0 21.0 17.1
★★★★ DSP India T.I.G.E.R. Fund (G) . . . . . . . . . . . . . . . . . . . . . . . . . . . . . . . . . . . . . . . . . . .. . . . . . . . 143.0 1215 2.3 51.2 85.6 17.4 13.5
★★★★ Kotak Infrastructure & Economic Reform-SP (G) . . . . .. . . . . . . . . . 32.2 432 2.5 56.6 80.5 17.4 13.2
★★★★ L&T Infrastructure Fund (G) . . . . . . . . . . . . . . . . . . . . . . . . . . . . . . . . . . . . . . . . . . . .. . . . . . . . . . 23.1 1253 2.3 48.6 74.5 10.8 13.7
★★★ Aditya Birla SL Infrastructure Fund - (G) . . . . . . . . . . . . . . . . . . . . .. . . . . . . . . . 49.7 537 2.6 49.1 83.4 14.6 12.0
★★★ Canara Robeco Infrastructure (G) . . . . . . . . . . . . . . . . . . . . . . . . . . . . . . . . .. . . . . . . . . . 72.7 160 2.6 50.0 74.3 17.2 12.2
★★★ IDFC Infrastructure Fund (G) . . . . . . . . . . . . . . . . . . . . . . . . . . . . . . . . . . . . . . . . . . .. . . . . . . . . . 24.0 655 2.4 62.6 95.6 14.1 14.7
★★★ SBI Infrastructure Fund (G). . . . . . . . . . . . . . . . . . . . . . . . . . . . . . . . . . . . . . . . . . . . . .. . . . . . . . . . 24.5 700 2.5 44.3 63.2 18.0 13.9
★★★ Sundaram Infrastructure Advantage Fund (G) . . . . . . . . . .. . . . . . . . . . 49.8 608 2.6 43.3 68.8 15.4 13.1
★★★ Tata Infrastructure Fund (G) . . . . . . . . . . . . . . . . . . . . . . . . . . . . . . . . . . . . . . . . . . .. . . . . . . . . . 87.1 718 2.6 43.5 77.5 16.9 12.8
★★ ICICI Pru Infrastructure Fund - (G) . . . . . . . . . . . . . . . . . . . . . . . . . . . . . . . .. . . . . . . . . . 78.5 1632 2.3 50.9 85.4 15.9 13.4
★★ Nippon India Power & Infra Fund (G) . . . . . . . . . . . . . . . . . . . . . . . . . . . .. . . . . . . . 153.0 1599 2.3 45.8 67.3 15.1 14.0
★★ UTI-Infrastructure Fund (G) . . . . . . . . . . . . . . . . . . . . . . . . . . . . . . . . . . . . . . . . . . . . .. . . . . . . . . . 78.5 1509 2.3 42.1 73.9 14.8 11.6
★ HDFC Infrastructure Fund (G) . . . . . . . . . . . . . . . . . . . . . . . . . . . . . . . . . . . . . . . . .. . . . . . . . . . 19.9 585 2.6 39.9 74.9 4.7 3.5
★ HSBC Infrastructure Equity Fund (G). . . . . . . . . . . . . . . . . . . . . . . . . . . .. . . . . . . . . . 25.2 111 2.6 53.3 84.2 9.4 7.3
- BOI AXA Manufacturing & Infrastr Fund (G) . . . . . . . . . . . . . .. . . . . . . . . . 27.5 59 2.6 42.9 61.6 17.9 16.8
- LIC MF Infrastructure Fund (G). . . . . . . . . . . . . . . . . . . . . . . . . . . . . . . . . . . . . . .. . . . . . . . . . 21.5 76 2.6 41.9 69.5 16.8 12.3
- Quant Infrastructure Fund (G) . . . . . . . . . . . . . . . . . . . . . . . . . . . . . . . . . . . . . . . .. . . . . . . . . . 18.7 59 2.3 62.9 105.5 29.9 21.2
- Taurus Infrastructure Fund (G) . . . . . . . . . . . . . . . . . . . . . . . . . . . . . . . . . . . . . . .. . . . . . . . . . 38.8 5 2.5 40.0 60.2 13.6 15.2
EQUITY - THEMATIC - MNC FUNDS
- Aditya Birla SL MNC Fund - (G) . . . . . . . . . . . . . . . . . . . . . . . . . . . . . . . . . . . . . . .. . . . . 1005.5 4081 2.0 14.7 26.6 8.7 10.3
- SBI Magnum Global Fund (G) . . . . . . . . . . . . . . . . . . . . . . . . . . . . . . . . . . . . . . . . . .. . . . . . . . 284.4 5350 2.0 33.7 49.9 18.3 14.4
- UTI-MNC Fund (G) . . . . . . . . . . . . . . . . . . . . . . . . . . . . . . . . . . . . . . . . . . . . . . . . . . . . . . . . . . . . . . .. . . . . . . . 279.2 2612 2.1 25.3 35.7 10.9 11.8
EQUITY - SECTOR - BANKING FUNDS
★★★★★ ICICI Pru Banking & Financial Services (G). . . . . . . . . . . . . . . . .. . . . . . . . . . 86.3 5097 2.0 31.1 67.9 12.4 13.7
★★★★ Invesco India Financial Services Fund (G) . . . . . . . . . . . . . . . . . . .. . . . . . . . . . 81.1 373 2.7 24.4 61.5 15.2 15.5
★★★ Aditya Birla SL Banking&Financial Services (G) . . . . . . .. . . . . . . . . . 39.8 2195 2.2 25.1 72.8 11.6 13.0
★★★ Nippon India Banking&Financial Services (G) . . . . . . . . . . .. . . . . . . . 360.3 3142 2.1 37.4 78.7 9.4 12.2
★★ Sundaram Fin Serv Opportunities (G) . . . . . . . . . . . . . . . . . . . . . . . . . .. . . . . . . . . . 60.8 430 2.6 22.3 65.1 16.1 13.4
★ UTI-Banking and Financial Services Fund (G) . . . . . . . . . . . .. . . . . . . . 120.6 745 2.5 23.5 68.9 7.3 9.5
- Baroda Banking&Fin Serv Fund - Plan A (G) . . . . . . . . . . . . . . .. . . . . . . . . . 30.2 55 2.5 16.9 56.4 12.0 11.9
- IDBI Banking & Financial Services Fund - Reg (G) . . . .. . . . . . . . . . 13.7 101 2.6 19.4 59.8 11.4 -
- LIC MF Banking & Fina Serv Fund (G) . . . . . . . . . . . . . . . . . . . . . . . . . . .. . . . . . . . . . 14.1 61 2.8 17.0 55.7 9.5 6.8
- SBI Banking & Financial Services Fund (G) . . . . . . . . . . . . . . . . .. . . . . . . . . . 25.5 2889 2.0 20.7 60.9 15.1 16.3
- Tata Banking & Financial Services Fund (G) . . . . . . . . . . . . . . .. . . . . . . . . . 26.9 810 2.3 21.5 60.3 15.5 15.7
- Taurus Banking & Financial Services Fund (G) . . . . . . . . . .. . . . . . . . . . 35.5 9 2.4 18.4 61.1 14.8 14.2
EQUITY - SECTOR - IT FUNDS
- Aditya Birla SL Digital India Fund (G). . . . . . . . . . . . . . . . . . . . . . . . . . . .. . . . . . . . 135.8 2288 2.2 56.0 90.9 34.8 31.3
- Franklin India Technology Fund - (G) . . . . . . . . . . . . . . . . . . . . . . . . . . . .. . . . . . . . 351.6 700 2.4 35.0 64.1 28.4 25.9
- ICICI Pru Technology Fund (G) . . . . . . . . . . . . . . . . . . . . . . . . . . . . . . . . . . . . . . .. . . . . . . . 159.3 5037 2.2 61.1 96.9 36.8 32.7
- SBI Technology Opportunities Fund (G) . . . . . . . . . . . . . . . . . . . . . .. . . . . . . . 152.1 1465 2.4 54.2 86.7 32.4 27.4
- Tata Digital India Fund (G) . . . . . . . . . . . . . . . . . . . . . . . . . . . . . . . . . . . . . . . . . . . . . . .. . . . . . . . . . 37.5 2768 2.1 60.1 97.2 33.4 31.7
EQUITY - SECTOR - PHARMA FUNDS
- Aditya Birla SL Pharma & Healthcare Fund (G) . . . . . . . . .. . . . . . . . . . 20.0 612 2.6 21.5 30.6 - -
- DSP Healthcare Fund (G) . . . . . . . . . . . . . . . . . . . . . . . . . . . . . . . . . . . . . . . . . . . . . . . . . .. . . . . . . . . . 23.8 1538 2.2 23.4 35.5 - -
- ICICI Pru P.H.D Fund (G) . . . . . . . . . . . . . . . . . . . . . . . . . . . . . . . . . . . . . . . . . . . . . . . . . . .. . . . . . . . . . 21.4 3158 2.2 20.5 33.6 25.3 -
- Mirae Asset Healthcare Fund - Regular (G) . . . . . . . . . . . . . . . .. . . . . . . . . . 23.9 1901 2.1 25.7 38.4 29.0 -
- Nippon India Pharma Fund (G) . . . . . . . . . . . . . . . . . . . . . . . . . . . . . . . . . . . . . . . .. . . . . . . . 313.9 5667 2.0 24.0 38.6 24.0 16.6
- SBI Healthcare Opportunities Fund (G) . . . . . . . . . . . . . . . . . . . . . . .. . . . . . . . 235.9 2048 2.1 19.9 34.6 21.0 10.0
- Tata India Pharma & Healthcare Fund (G) . . . . . . . . . . . . . . . . . .. . . . . . . . . . 18.1 610 2.7 19.7 34.5 23.0 13.1
- UTI-Healthcare Fund (G) . . . . . . . . . . . . . . . . . . . . . . . . . . . . . . . . . . . . . . . . . . . . . . . . . . .. . . . . . . . 171.7 897 2.4 20.7 33.7 21.8 12.5
HYBRID - AGGRESSIVE HYBRID FUNDS
★★★★★ ICICI Pru Equity & Debt Fund - (G) . . . . . . . . . . . . . . . . . . . . . . . . . . . . . . . . .. . . . . . . . 208.4 17880 1.8 36.6 61.0 16.5 14.6
★★★★★ SBI Equity Hybrid Fund (G) . . . . . . . . . . . . . . . . . . . . . . . . . . . . . . . . . . . . . . . . . . . . . .. . . . . . . . 203.4 45748 1.6 23.7 43.5 16.4 14.0
★★★★ Canara Robeco Equity Hybrid Fund (G). . . . . . . . . . . . . . . . . . . . . . . .. . . . . . . . 248.1 6493 2.0 23.3 41.0 17.6 14.7
★★★★ DSP Equity & Bond Fund - (G) . . . . . . . . . . . . . . . . . . . . . . . . . . . . . . . . . . . . . . . . . .. . . . . . . . 239.5 7516 1.9 25.0 46.2 17.5 13.9
★★★ Aditya Birla SL Equity Hybrid '95 Fund (G) . . . . . . . . . . . . . . . . . .. . . . . 1090.2 8154 1.9 26.9 49.4 12.8 11.1
★★★ Franklin India Equity Hybrid Fund - (G) . . . . . . . . . . . . . . . . . . . . . . . .. . . . . . . . 177.4 1459 2.2 25.4 48.4 14.4 11.8
★★★ HDFC Hybrid Equity Fund (G) . . . . . . . . . . . . . . . . . . . . . . . . . . . . . . . . . . . . . . . . . .. . . . . . . . . . 78.7 18760 1.8 25.6 47.5 14.6 13.1
★★★ L&T Hybrid Equity Fund (G) . . . . . . . . . . . . . . . . . . . . . . . . . . . . . . . . . . . . . . . . . . . . .. . . . . . . . . . 37.2 5519 1.9 20.7 37.7 12.0 11.5
★★★ Principal Hybrid Equity Fund - (G) . . . . . . . . . . . . . . . . . . . . . . . . . . . . . . . . .. . . . . . . . 111.4 1120 2.2 24.4 44.5 12.8 13.8
★★★ Tata Hybrid Equity Fund - Regular (G). . . . . . . . . . . . . . . . . . . . . . . . . .. . . . . . . . 304.3 3467 2.0 25.2 45.4 13.6 10.4
★★★ UTI-Hybrid Equity Fund (G) . . . . . . . . . . . . . . . . . . . . . . . . . . . . . . . . . . . . . . . . . . . . . .. . . . . . . . 247.3 4148 2.0 29.8 49.8 12.7 11.7
★★ Nippon India Equity Hybrid Fund (G) . . . . . . . . . . . . . . . . . . . . . . . . . . . .. . . . . . . . . . 65.4 3708 2.0 26.9 47.9 5.2 7.8
★★ Sundaram Equity Hybrid Fund - (G) . . . . . . . . . . . . . . . . . . . . . . . . . . . . . .. . . . . . . . 134.4 1922 2.2 26.4 43.3 14.6 13.4
★ Baroda Hybrid Equity Fund-Plan A (G) . . . . . . . . . . . . . . . . . . . . . . . . .. . . . . . . . . . 82.7 414 2.5 27.0 47.6 13.8 12.0
★ LIC MF Equity Hybrid Fund - (G) . . . . . . . . . . . . . . . . . . . . . . . . . . . . . . . . . . . . .. . . . . . . . 139.2 483 2.6 15.3 33.7 12.0 9.8
- AXIS Equity Hybrid Fund - Regular (G) . . . . . . . . . . . . . . . . . . . . . . . . .. . . . . . . . . . 15.7 1831 2.2 21.8 42.7 17.0 -
- BNP Paribas Substantial Equity Hybrid Fund (G) . . . . . .. . . . . . . . . . 18.5 693 2.4 24.1 41.6 18.2 -
- BOI AXA Mid & Small Cap Equity & Debt Fund (G) . . .. . . . . . . . . . 23.0 345 2.7 45.9 65.9 18.9 17.0
- Edelweiss Aggressive Hybrid Fund - Plan A (G). . . . . . . . .. . . . . . . . . . 37.8 88 2.3 24.4 45.0 14.3 12.5
- IDBI Hybrid Equity Fund (G) . . . . . . . . . . . . . . . . . . . . . . . . . . . . . . . . . . . . . . . . . . . . .. . . . . . . . . . 15.7 206 2.6 17.7 31.1 9.1 -
- IDFC Hybrid Equity Fund - Regular (G) . . . . . . . . . . . . . . . . . . . . . . . . .. . . . . . . . . . 17.2 580 2.4 29.2 47.1 13.8 -
- Invesco India Equity & Bond Fund - Regular (G) . . . . . . . .. . . . . . . . . . 14.5 396 2.5 19.5 33.5 12.0 -
- JM Equity Hybrid Fund - (G) . . . . . . . . . . . . . . . . . . . . . . . . . . . . . . . . . . . . . . . . . . . . .. . . . . . . . . . 69.6 9 2.5 26.9 50.6 14.6 11.8
- Kotak Equity Hybrid Fund (G) . . . . . . . . . . . . . . . . . . . . . . . . . . . . . . . . . . . . . . . . . .. . . . . . . . . . 38.9 1986 2.2 26.1 47.1 17.0 13.2
- LIC MF ULIS - Regular (IDCW) . . . . . . . . . . . . . . . . . . . . . . . . . . . . . . . . . . . . . . . . .. . . . . . . . . . 27.0 411 2.4 24.8 46.0 13.9 12.2
- Mirae Asset Hybrid - Equity Fund (G) . . . . . . . . . . . . . . . . . . . . . . . . . . .. . . . . . . . . . 22.1 5949 1.8 24.1 42.1 15.9 14.7
- Navi Equity Hybrid Fund - Regular (G). . . . . . . . . . . . . . . . . . . . . . . . . .. . . . . . . . . . 14.2 111 2.3 20.4 34.1 11.6 -
- PGIM India Hybrid Equity Fund (G) . . . . . . . . . . . . . . . . . . . . . . . . . . . . . . .. . . . . . . . . . 97.8 139 2.4 23.0 41.3 13.1 10.5
- Quant Absolute Fund (G). . . . . . . . . . . . . . . . . . . . . . . . . . . . . . . . . . . . . . . . . . . . . . . . . . .. . . . . . . . 267.4 85 2.3 40.9 66.2 26.1 18.7
- Shriram Hybrid Equity Fund (G) . . . . . . . . . . . . . . . . . . . . . . . . . . . . . . . . . . . . .. . . . . . . . . . 23.4 64 2.4 17.6 34.9 12.0 10.7
HYBRID - EQUITY SAVINGS FUNDS
- Aditya Birla SL Equity Savings Fund (G) . . . . . . . . . . . . . . . . . . . . . .. . . . . . . . . . 17.7 522 2.5 13.6 23.9 10.0 8.4
- AXIS Equity Saver Fund (G) . . . . . . . . . . . . . . . . . . . . . . . . . . . . . . . . . . . . . . . . . . . . . .. . . . . . . . . . 16.9 901 2.3 12.9 25.7 10.8 9.9
- DSP Equity Savings Fund - Regular (G) . . . . . . . . . . . . . . . . . . . . . . . .. . . . . . . . . . 16.2 385 2.4 14.5 23.5 9.3 8.2
- Edelweiss Equity Savings Fund (G). . . . . . . . . . . . . . . . . . . . . . . . . . . . . . . .. . . . . . . . . . 18.3 199 2.0 11.9 19.2 10.5 9.7
- HDFC Equity Savings Fund (G) . . . . . . . . . . . . . . . . . . . . . . . . . . . . . . . . . . . . . . . .. . . . . . . . . . 47.5 2443 2.1 16.2 28.1 9.9 9.6
- ICICI Pru Equity Savings Fund - Reg (G) . . . . . . . . . . . . . . . . . . . . . .. . . . . . . . . . 16.7 3412 1.0 8.4 15.1 8.2 7.6
- IDBI Equity Savings Fund (G) . . . . . . . . . . . . . . . . . . . . . . . . . . . . . . . . . . . . . . . . . . .. . . . . . . . . . 20.8 12 2.1 9.8 19.1 8.6 6.5
- IDFC Equity Savings Fund - Regular (G) . . . . . . . . . . . . . . . . . . . . . . .. . . . . . . . . . 24.7 61 2.3 9.4 15.3 7.7 6.8
- Kotak Equity Savings Fund (G). . . . . . . . . . . . . . . . . . . . . . . . . . . . . . . . . . . . . . . .. . . . . . . . . . 17.9 1541 2.2 8.8 16.2 9.0 8.9
- L&T Equity Savings Fund (G) . . . . . . . . . . . . . . . . . . . . . . . . . . . . . . . . . . . . . . . . . . .. . . . . . . . . . 22.8 73 1.6 15.1 25.4 9.3 8.2
- Mahindra Manulife Equity Savings DSY (G) . . . . . . . . . . . . . . .. . . . . . . . . . 15.5 281 2.5 15.4 27.8 12.1 -
- Nippon India Equity Savings Fund (G) . . . . . . . . . . . . . . . . . . . . . . . . . .. . . . . . . . . . 12.4 257 2.5 12.1 21.3 -1.3 2.4
- PGIM India Equity Savings Fund (G) . . . . . . . . . . . . . . . . . . . . . . . . . . . . .. . . . . . . . . . 39.2 42 2.4 11.2 19.0 8.3 7.7
- Principal Equity Savings Fund (G). . . . . . . . . . . . . . . . . . . . . . . . . . . . . . . . . .. . . . . . . . . . 49.4 86 2.4 16.6 27.6 11.8 10.0
- SBI Equity Savings Fund (G) . . . . . . . . . . . . . . . . . . . . . . . . . . . . . . . . . . . . . . . . . . . .. . . . . . . . . . 17.2 1719 1.2 12.1 23.8 10.5 8.7
- Tata Equity Saving Fund - (App) . . . . . . . . . . . . . . . . . . . . . . . . . . . . . . . . . . . . .. . . . . . . . . . 40.9 106 2.3 10.2 18.7 8.9 7.1
- Union Equity Savings Fund (G) . . . . . . . . . . . . . . . . . . . . . . . . . . . . . . . . . . . . . . . .. . . . . . . . . . 13.3 177 2.0 8.4 16.5 9.7 -
Source : NAV India;NAV for the growth option as on 17-09-2021.
. . . . . . . . 131.5 6056 1.9 42.0 71.7 20.4 13.3
★★★ Tata Mid Cap Growth Fund - (G) . . . . . . . . . . . . . . . . . . . . . . . . . . . . . . . . . . . . .. . . . . . . . 243.3 1410 2.5 38.6 62.7 21.7 17.3
★★ Aditya Birla SL Midcap Fund - (G) . . . . . . . . . . . . . . . . . . . . . . . . . . . . . . . . . .. . . . . . . . 458.8 3226 2.1 44.6 68.1 15.0 12.6
★★ Nippon India Growth Fund - (G) . . . . . . . . . . . . . . . . . . . . . . . . . . . . . . . . . . . . . .. . . . . 2040.6 11322 1.9 46.3 70.9 22.3 17.8
★★ Sundaram Mid Cap Fund - (G) . . . . . . . . . . . . . . . . . . . . . . . . . . . . . . . . . . . . . . . . .. . . . . . . . 714.0 6926 1.9 38.2 59.9 13.4 12.0
★ Motilal Oswal Midcap 30 Fund (G) . . . . . . . . . . . . . . . . . . . . . . . . . . . . . . . . .. . . . . . . . . . 41.8 2235 2.1 42.5 64.1 16.8 12.6
★ PGIM India Midcap Opportunities Fund (G). . . . . . . . . . . . . . . .. . . . . . . . . . 42.3 2709 2.3 55.7 86.0 29.9 20.3
- Baroda Mid-Cap Fund - Plan A (G) . . . . . . . . . . . . . . . . . . . . . . . . . . . . . . . . .. . . . . . . . . . 16.8 72 2.6 45.1 70.3 20.9 16.4
- IDBI Midcap Fund (G) . . . . . . . . . . . . . . . . . . . . . . . . . . . . . . . . . . . . . . . . . . . . . . . . . . . . . . . . .. . . . . . . . . . 17.7 213 2.6 37.2 61.1 15.2 -
- Mahindra Manulife Mid Cap Unnati Yojana (G) . . . . . . . . .. . . . . . . . . . 17.0 785 2.3 45.2 66.4 20.1 -
- Mirae Asset Midcap Fund (G) . . . . . . . . . . . . . . . . . . . . . . . . . . . . . . . . . . . . . . . . . .. . . . . . . . . . 20.6 6195 1.9 47.5 77.9 - -
- Taurus Discovery (Midcap) Fund (G) . . . . . . . . . . . . . . . . . . . . . . . . . . . .. . . . . . . . . . 73.6 75 2.6 34.7 50.7 17.1 16.4
EQUITY - SMALL CAP FUNDS
★★★★★ Nippon India Small Cap Fund (G) . . . . . . . . . . . . . . . . . . . . . . . . . . . . . . . . . . .. . . . . . . . . . 81.3 16633 1.8 62.3 86.4 23.0 22.2
★★★★★ SBI Small Cap Fund (G) . . . . . . . . . . . . . . . . . . . . . . . . . . . . . . . . . . . . . . . . . . . . . . . . . . . . .. . . . . . . . . . 99.0 9714 1.8 38.5 62.9 21.6 22.4
★★★★ DSP Small Cap Fund (G) . . . . . . . . . . . . . . . . . . . . . . . . . . . . . . . . . . . . . . . . . . . . . . . . . . . .. . . . . . . . 104.4 8000 1.9 46.9 69.2 21.0 15.2
★★★★ Kotak Small Cap Fund (G) . . . . . . . . . . . . . . . . . . . . . . . . . . . . . . . . . . . . . . . . . . . . . . . . .. . . . . . . . 159.0 5642 1.9 62.3 93.6 28.9 20.5
★★★ Aditya Birla SL Small Cap Fund (G) . . . . . . . . . . . . . . . . . . . . . . . . . . . . . . .. . . . . . . . . . 54.8 2923 2.1 49.1 77.4 12.8 12.2
★★★ AXIS Small Cap Fund (G) . . . . . . . . . . . . . . . . . . . . . . . . . . . . . . . . . . . . . . . . . . . . . . . . . . .. . . . . . . . . . 58.7 7095 1.9 49.4 71.1 28.6 21.4
★★★ Franklin India Smaller Companies Fund (G) . . . . . . . . . . . . . . .. . . . . . . . . . 88.7 7051 1.9 50.0 80.1 16.5 13.4
★★★ HDFC Small Cap Fund (G) . . . . . . . . . . . . . . . . . . . . . . . . . . . . . . . . . . . . . . . . . . . . . . . . .. . . . . . . . . . 73.3 12913 1.9 58.5 86.3 17.2 19.3
★★★ Sundaram Small Cap Fund (G) . . . . . . . . . . . . . . . . . . . . . . . . . . . . . . . . . . . . . . . .. . . . . . . . 143.3 1511 2.2 50.5 78.8 18.0 12.7
★★ HSBC Small Cap Equity Fund (G) . . . . . . . . . . . . . . . . . . . . . . . . . . . . . . . . . . .. . . . . . . . . . 85.6 350 2.5 52.5 76.2 17.3 14.0
★★ L&T Emerging Businesses Fund (G) . . . . . . . . . . . . . . . . . . . . . . . . . . . . . .. . . . . . . . . . 42.5 7248 1.9 61.3 87.2 16.7 18.9
★ Union Small Cap Fund (G) . . . . . . . . . . . . . . . . . . . . . . . . . . . . . . . . . . . . . . . . . . . . . . . . .. . . . . . . . . . 28.3 553 2.5 55.0 70.7 23.4 16.4
- BOI AXA Small Cap Fund (G). . . . . . . . . . . . . . . . . . . . . . . . . . . . . . . . . . . . . . . . . . . .. . . . . . . . . . 25.2 183 2.7 58.0 79.6 - -
- Canara Robeco Small Cap Fund - Regular (G) . . . . . . . . . . . .. . . . . . . . . . 21.7 1480 2.3 60.6 81.2 - -
- Edelweiss Small Cap Fund - Regular (G) . . . . . . . . . . . . . . . . . . . . . .. . . . . . . . . . 23.3 1006 2.3 56.0 78.5 - -
- ICICI Pru Smallcap Fund (G) . . . . . . . . . . . . . . . . . . . . . . . . . . . . . . . . . . . . . . . . . . . .. . . . . . . . . . 48.9 2961 2.2 53.8 82.7 24.5 16.6
- IDBI Small Cap Fund (G) . . . . . . . . . . . . . . . . . . . . . . . . . . . . . . . . . . . . . . . . . . . . . . . . . . . .. . . . . . . . . . 16.3 128 2.5 50.9 74.3 17.1 -
- IDFC Emerging Businesses Fund (G) . . . . . . . . . . . . . . . . . . . . . . . . . . . . .. . . . . . . . . . 22.8 1390 2.2 52.7 77.8 - -
- Invesco India Smallcap Fund - Regular (G) . . . . . . . . . . . . . . . . .. . . . . . . . . . 20.6 1194 2.3 53.0 74.8 - -
- Principal Small Cap Fund (G) . . . . . . . . . . . . . . . . . . . . . . . . . . . . . . . . . . . . . . . . . . .. . . . . . . . . . 22.3 445 2.5 57.1 83.0 - -
- Tata Small Cap Fund - Regular (G). . . . . . . . . . . . . . . . . . . . . . . . . . . . . . . . .. . . . . . . . . . 20.8 1533 2.2 60.2 82.6 - -
EQUITY - FOCUSED FUNDS
★★★★★ Franklin India Focused Equity Fund (G) . . . . . . . . . . . . . . . . . . . . . . .. . . . . . . . . . 65.0 7755 1.9 39.0 76.7 18.2 15.1
★★★★★ SBI Focused Equity Fund (G). . . . . . . . . . . . . . . . . . . . . . . . . . . . . . . . . . . . . . . . . . . .. . . . . . . . 239.9 19429 1.7 36.5 62.2 20.5 17.7
★★★★ AXIS Focused 25 Fund (G). . . . . . . . . . . . . . . . . . . . . . . . . . . . . . . . . . . . . . . . . . . . . . . . .. . . . . . . . . . 47.5 19736 1.9 27.6 59.7 18.6 18.9
★★★★ Nippon India Focused Equity Fund (G) . . . . . . . . . . . . . . . . . . . . . . . . .. . . . . . . . . . 76.6 5626 2.0 38.4 67.6 17.7 14.8
★★★ Aditya Birla SL Focused Equity Fund (G). . . . . . . . . . . . . . . . . . . . . .. . . . . . . . . . 92.1 5309 2.0 26.4 53.6 16.2 14.0
★★★ DSP Focus Fund (G) . . . . . . . . . . . . . . . . . . . . . . . . . . . . . . . . . . . . . . . . . . . . . . . . . . . . . . . . . . . .. . . . . . . . . . 35.0 2219 2.1 24.5 48.3 14.8 12.3
★★★ Motilal Oswal Focused 25 Fund (G) . . . . . . . . . . . . . . . . . . . . . . . . . . . . . . .. . . . . . . . . . 34.5 1866 2.2 21.2 47.6 16.4 14.6
★★★ Principal Focused Multicap Fund (G) . . . . . . . . . . . . . . . . . . . . . . . . . . . .. . . . . . . . 109.2 658 2.5 32.3 59.9 19.9 16.2
★★ ICICI Pru Focused Equity Fund (G). . . . . . . . . . . . . . . . . . . . . . . . . . . . . . . . .. . . . . . . . . . 48.7 2088 2.2 34.6 56.3 15.3 13.6
★★ Sundaram Select Focus - (G) . . . . . . . . . . . . . . . . . . . . . . . . . . . . . . . . . . . . . . . . . . .. . . . . . . . 275.7 1398 2.2 27.6 50.6 15.9 16.0
★ HDFC Focused 30 Fund (G) . . . . . . . . . . . . . . . . . . . . . . . . . . . . . . . . . . . . . . . . . . . . . . .. . . . . . . . 107.0 813 2.6 32.4 57.7 11.1 10.2
★ IDFC Focused Equity Fund (G) . . . . . . . . . . . . . . . . . . . . . . . . . . . . . . . . . . . . . . . . .. . . . . . . . . . 53.8 1454 2.2 22.0 35.0 11.1 13.6
- BNP Paribas Focused 25 Equity Fund (G) . . . . . . . . . . . . . . . . . . . .. . . . . . . . . . 14.7 212 2.5 23.9 49.8 16.0 -
- IDBI Focused 30 Equity Fund (G) . . . . . . . . . . . . . . . . . . . . . . . . . . . . . . . . . . . .. . . . . . . . . . 15.3 144 2.5 26.2 51.2 14.2 -
- IIFL Focused Equity Fund (G) . . . . . . . . . . . . . . . . . . . . . . . . . . . . . . . . . . . . . . . . . . .. . . . . . . . . . 30.1 2285 2.0 33.5 61.1 24.7 18.7
- JM Core 11 Fund (G) . . . . . . . . . . . . . . . . . . . . . . . . . . . . . . . . . . . . . . . . . . . . . . . . . . . . . . . . . . .. . . . . . . . . . 11.6 45 2.5 16.1 45.9 9.2 10.3
- Kotak Focused Equity Fund (G) . . . . . . . . . . . . . . . . . . . . . . . . . . . . . . . . . . . . . . .. . . . . . . . . . 16.4 2194 2.1 33.3 56.2 - -
- L&T Focused Equity Fund (G) . . . . . . . . . . . . . . . . . . . . . . . . . . . . . . . . . . . . . . . . . .. . . . . . . . . . 16.4 1020 2.3 25.4 40.0 - -
- Mirae Asset Focused Fund (G) . . . . . . . . . . . . . . . . . . . . . . . . . . . . . . . . . . . . . . . .. . . . . . . . . . 19.6 7544 1.8 37.0 60.2 - -
- Quant Focused Fund (G). . . . . . . . . . . . . . . . . . . . . . . . . . . . . . . . . . . . . . . . . . . . . . . . . . . .. . . . . . . . . . 53.4 40 2.3 34.9 60.8 17.7 15.5
EQUITY - VALUE FUNDS
★★★★★ ICICI Pru Value Discovery Fund (G) . . . . . . . . . . . . . . . . . . . . . . . . . . . . . . .. . . . . . . . 237.6 21778 1.8 36.1 58.4 15.7 13.5
★★★★★ L&T India Value Fund (G) . . . . . . . . . . . . . . . . . . . . . . . . . . . . . . . . . . . . . . . . . . . . . . . . . .. . . . . . . . . . 56.5 7757 1.8 36.4 58.6 15.1 14.9
★★★★ IDFC Sterling Value Fund (G) . . . . . . . . . . . . . . . . . . . . . . . . . . . . . . . . . . . . . . . . . . .. . . . . . . . . . 83.8 3990 2.0 52.8 82.8 15.7 16.7
★★★★ Tata Equity P/E Fund - (G) . . . . . . . . . . . . . . . . . . . . . . . . . . . . . . . . . . . . . . . . . . . . . . . .. . . . . . . . 197.2 5021 1.7 27.0 46.6 12.1 14.1
★★★ Aditya Birla SL Pure Value Fund (G) . . . . . . . . . . . . . . . . . . . . . . . . . . . . . .. . . . . . . . . . 73.5 4320 2.1 37.4 59.8 8.5 9.6
★★★ HDFC Capital Builder Value Fund - (G) . . . . . . . . . . . . . . . . . . . . . . . . .. . . . . . . . 428.7 5278 2.0 32.6 57.3 12.3 13.8
★★★ JM Value Fund (G) . . . . . . . . . . . . . . . . . . . . . . . . . . . . . . . . . . . . . . . . . . . . . . . . . . . . . . . . . . . . . . .. . . . . . . . . . 50.7 155 2.5 33.4 63.5 16.2 14.9
★★★ Nippon India Value Fund (G) . . . . . . . . . . . . . . . . . . . . . . . . . . . . . . . . . . . . . . . . . . . .. . . . . . . . 121.2 4200 2.0 38.6 65.2 18.0 15.7
★★ Templeton India Value Fund - (G) . . . . . . . . . . . . . . . . . . . . . . . . . . . . . . . . . .. . . . . . . . 386.9 576 2.5 43.1 76.0 13.6 12.8
★★ UTI-Value Opportunities Fund (G) . . . . . . . . . . . . . . . . . . . . . . . . . . . . . . . . .. . . . . . . . 100.5 6545 2.0 30.9 57.9 17.1 14.7
★ Quantum Long Term Equity Value Fund (G) . . . . . . . . . . . . . . .. . . . . . . . . . 76.8 924 1.8 27.9 55.2 11.7 -
- Indiabulls Value Fund (G). . . . . . . . . . . . . . . . . . . . . . . . . . . . . . . . . . . . . . . . . . . . . . . . . .. . . . . . . . . . 17.1 13 2.3 26.5 49.6 10.0 9.0
EQUITY - TAX SAVING (ELSS) FUNDS
★★★★★ AXIS Long Term Equity Fund (G) . . . . . . . . . . . . . . . . . . . . . . . . . . . . . . . . . . . .. . . . . . . . . . 76.4 33871 1.5 28.6 62.0 19.6 18.0
★★★★★ DSP Tax Saver Fund (G) . . . . . . . . . . . . . . . . . . . . . . . . . . . . . . . . . . . . . . . . . . . . . . . . . . . .. . . . . . . . . . 82.0 9675 1.8 38.1 66.2 20.5 16.6
★★★★★ Quant Tax Plan-(G) . . . . . . . . . . . . . . . . . . . . . . . . . . . . . . . . . . . . . . . . . . . . . . . . . . . . . . . . . . . . .. . . . . . . . 211.9 368 2.3 53.5 82.4 30.4 23.5
★★★★ BOI AXA Tax Advantage Fund (G) . . . . . . . . . . . . . . . . . . . . . . . . . . . . . . . . . .. . . . . . . . 102.7 512 2.6 40.9 65.4 24.0 20.5
★★★★ Canara Robeco Equity Tax Saver Fund (G) . . . . . . . . . . . . . . . . .. . . . . . . . 116.4 2680 2.1 33.7 58.6 22.2 19.0
★★★★ IDFC Tax Advantage (ELSS) Fund (G) . . . . . . . . . . . . . . . . . . . . . . . . . . .. . . . . . . . . . 93.3 3339 2.0 42.8 69.4 17.3 17.2
★★★★ Invesco India Tax Plan (G) . . . . . . . . . . . . . . . . . . . . . . . . . . . . . . . . . . . . . . . . . . . . . . . .. . . . . . . . . . 82.6 1842 2.1 29.3 52.1 16.8 16.0
★★★★ Kotak Tax Saver Fund (G) . . . . . . . . . . . . . . . . . . . . . . . . . . . . . . . . . . . . . . . . . . . . . . . . .. . . . . . . . . . 70.8 2249 2.1 31.7 54.5 18.3 15.5
★★★ Aditya Birla SL Tax Relief '96 (G) . . . . . . . . . . . . . . . . . . . . . . . . . . . . . . . . . . . .. . . . . . . . . . 42.9 14507 1.8 15.5 32.0 9.3 12.4
★★★ BNP Paribas Long Term Equity Fund (G) . . . . . . . . . . . . . . . . . . . . .. . . . . . . . . . 60.2 545 2.4 24.2 46.5 18.0 13.7
★★★ Franklin India Taxshield - (G). . . . . . . . . . . . . . . . . . . . . . . . . . . . . . . . . . . . . . . . . . .. . . . . . . . 843.4 4877 1.9 33.2 64.4 13.7 12.4
★★★ HSBC Tax Saver Equity Fund (G) . . . . . . . . . . . . . . . . . . . . . . . . . . . . . . . . . . . .. . . . . . . . . . 55.6 197 2.5 29.0 55.2 14.5 13.1
★★★ ICICI Pru Long Term Equity Fund - (G) . . . . . . . . . . . . . . . . . . . . . . . . .. . . . . . . . 594.2 9825 2.0 33.3 62.1 16.0 14.3
★★★ L&T Tax Advantage Fund (G) . . . . . . . . . . . . . . . . . . . . . . . . . . . . . . . . . . . . . . . . . . .. . . . . . . . . . 80.6 3652 2.0 28.4 49.8 12.8 13.7
★★★ LIC MF Tax Plan - (G) . . . . . . . . . . . . . . . . . . . . . . . . . . . . . . . . . . . . . . . . . . . . . . . . . . . . . . . . . .. . . . . . . . 100.6 401 2.6 26.5 51.2 15.1 13.9
★★★ Principal Tax Savings Fund . . . . . . . . . . . . . . . . . . . . . . . . . . . . . . . . . . . . . . . . . . . . . .. . . . . . . . 324.4 583 2.5 31.3 59.0 14.7 14.9
★★★ UTI-Long Term Equity Fund (G) . . . . . . . . . . . . . . . . . . . . . . . . . . . . . . . . . . . . . .. . . . . . . . 145.7 2137 2.2 31.5 61.2 18.5 15.4
★★ Edelweiss Long Term Equity Fund (TS) (G) . . . . . . . . . . . . . . . .. . . . . . . . . . 70.6 195 2.4 28.6 51.4 15.1 13.1
★★ IDBI Equity Advantage Fund - Regular (G) . . . . . . . . . . . . . . . . . .. . . . . . . . . . 38.6 541 2.4 26.4 50.6 12.0 11.9
★★ Nippon India Tax Saver (ELSS) Fund - (G) . . . . . . . . . . . . . . . . . . .. . . . . . . . . . 76.7 12385 1.8 38.7 66.7 9.7 8.9
★★ SBI Long Term Equity Fund (G) . . . . . . . . . . . . . . . . . . . . . . . . . . . . . . . . . . . . . . .. . . . . . . . 219.7 10687 1.9 29.3 51.9 15.3 12.5
★★ Sundaram Diversified Equity (G) . . . . . . . . . . . . . . . . . . . . . . . . . . . . . . . . . . . .. . . . . . . . 148.1 2340 2.1 31.3 55.2 12.7 12.0
★ HDFC Tax Saver Fund (G) . . . . . . . . . . . . . . . . . . . . . . . . . . . . . . . . . . . . . . . . . . . . . . . . .. . . . . . . . 727.0 9166 1.8 32.7 55.1 11.2 11.6
★ Union Long Term Equity Fund (G) . . . . . . . . . . . . . . . . . . . . . . . . . . . . . . . . . .. . . . . . . . . . 41.6 425 2.5 33.5 57.9 19.5 14.8
- Baroda ELSS '96 - Plan A (G) . . . . . . . . . . . . . . . . . . . . . . . . . . . . . . . . . . . . . . . . . . . .. . . . . . . . . . 72.0 213 2.5 36.4 62.0 16.0 13.1
- Indiabulls Tax Savings Fund (G) . . . . . . . . . . . . . . . . . . . . . . . . . . . . . . . . . . . . .. . . . . . . . . . 13.5 53 2.3 21.6 42.8 11.7 -
- JM Tax Gain Fund (G) . . . . . . . . . . . . . . . . . . . . . . . . . . . . . . . . . . . . . . . . . . . . . . . . . . . . . . . . .. . . . . . . . . . 28.4 63 2.4 30.4 61.4 19.4 17.0
- Mahindra Manulife ELSS Kar Bachat Yojana(G). . . . . . . .. . . . . . . . . . 18.7 409 2.4 38.2 64.4 16.5 -
- Mirae Asset Tax Saver Fund (G) . . . . . . . . . . . . . . . . . . . . . . . . . . . . . . . . . . . . .. . . . . . . . . . 31.3 9401 1.8 35.5 62.5 22.1 21.2
- Motilal Oswal Long Term Equity Fund (G). . . . . . . . . . . . . . . . . . .. . . . . . . . . . 27.5 2400 2.1 34.6 64.7 15.6 16.2
- Navi Long Term Advantage Fund (G) . . . . . . . . . . . . . . . . . . . . . . . . . . . .. . . . . . . . . . 20.4 67 2.3 25.9 44.0 12.8 11.9
- Parag Parikh Tax Saver Fund (G) . . . . . . . . . . . . . . . . . . . . . . . . . . . . . . . . . . .. . . . . . . . . . 18.3 284 2.5 31.8 47.8 - -
- PGIM India Long Term Equity Fund (G) . . . . . . . . . . . . . . . . . . . . . . . .. . . . . . . . . . 23.0 358 2.5 33.0 61.3 17.2 14.8
- Quantum Tax Saving Fund - Regular (G). . . . . . . . . . . . . . . . . . . . . .. . . . . . . . . . 76.3 102 1.8 27.8 54.8 11.7 -
- Tata India Tax Savings Fund (G) . . . . . . . . . . . . . . . . . . . . . . . . . . . . . . . . . . . . .. . . . . . . . . . 27.7 2888 2.0 28.7 52.6 16.5 14.9
- Taurus Tax Shield (G) . . . . . . . . . . . . . . . . . . . . . . . . . . . . . . . . . . . . . . . . . . . . . . . . . . . . . . . . .. . . . . . . . 114.5 84 2.5 24.0 42.5 12.4 14.2
EQUITY - CONTRA FUNDS
- Invesco India Contra Fund (G). . . . . . . . . . . . . . . . . . . . . . . . . . . . . . . . . . . . . . . . .. . . . . . . . . . 76.3 8199 1.8 28.4 51.0 16.4 17.1
- Kotak India EQ Contra Fund (G). . . . . . . . . . . . . . . . . . . . . . . . . . . . . . . . . . . . . .. . . . . . . . . . 83.2 1133 2.4 31.3 56.4 16.7 16.9
- SBI Contra Fund (G) . . . . . . . . . . . . . . . . . . . . . . . . . . . . . . . . . . . . . . . . . . . . . . . . . . . . . . . . . . . .. . . . . . . . 193.4 2823 2.2 42.8 81.9 20.0 14.8
EQUITY - DIVIDEND YIELD FUNDS
★★★★★ Principal Dividend Yield Fund (G) . . . . . . . . . . . . . . . . . . . . . . . . . . . . . . . . . .. . . . . . . . . . 86.8 238 2.6 33.4 55.4 16.4 17.1
★★★★ Templeton India Equity Income Fund (G) . . . . . . . . . . . . . . . . . . . .. . . . . . . . . . 77.7 1169 2.3 36.4 67.2 18.1 15.6
★★★ UTI-Dividend Yield Fund (G) . . . . . . . . . . . . . . . . . . . . . . . . . . . . . . . . . . . . . . . . . . . .. . . . . . . . 109.0 3177 2.1 39.7 60.6 17.7 16.4
★★ Aditya Birla SL Dividend Yield Fund (G) . . . . . . . . . . . . . . . . . . . . . . .. . . . . . . . 251.0 865 2.4 32.4 51.3 13.3 11.4
★ ICICI Pru Dividend Yield Equity Fund (G). . . . . . . . . . . . . . . . . . . . .. . . . . . . . . . 25.4 446 2.8 39.9 67.2 13.3 12.8
- IDBI Dividend Yield Fund (G) . . . . . . . . . . . . . . . . . . . . . . . . . . . . . . . . . . . . . . . . . . .. . . . . . . . . . 16.9 100 2.6 25.8 44.2 - -
EQUITY - THEMATIC - CONSUMPTION FUNDS
★★★★★ Aditya Birla SL India GenNext Fund (G) . . . . . . . . . . . . . . . . . . . . . . .. . . . . . . . 137.3 2417 2.2 30.8 58.1 19.2 16.4
★★★★ Canara Robeco Consumer Trends Fund (G) . . . . . . . . . . . . . . . .
BL Rating Scheme Name
Trailing Returns (%)Latest
NAV(₹�)
Latest
Corpus (₹� Cr)
Expense
Ratio(%)
YTDAbsolute
1 YearCAGR
3 YearCAGR
5 YearCAGR
BL Rating Scheme Name
Trailing Returns (%)Latest
NAV(₹�)
Latest
Corpus (₹� Cr)
Expense
Ratio(%)
YTDAbsolute
1 YearCAGR
3 YearCAGR
5 YearCAGR
BL Rating Scheme Name
Trailing Returns (%)Latest
NAV(₹�)
Latest
Corpus (₹� Cr)
Expense
Ratio(%)
YTDAbsolute
1 YearCAGR
3 YearCAGR
5 YearCAGR
CMYK
MUMBAI
BusinessLine10 SUNDAY • SEPTEMBER 19 • 2021STAR TRACK MF RATINGS
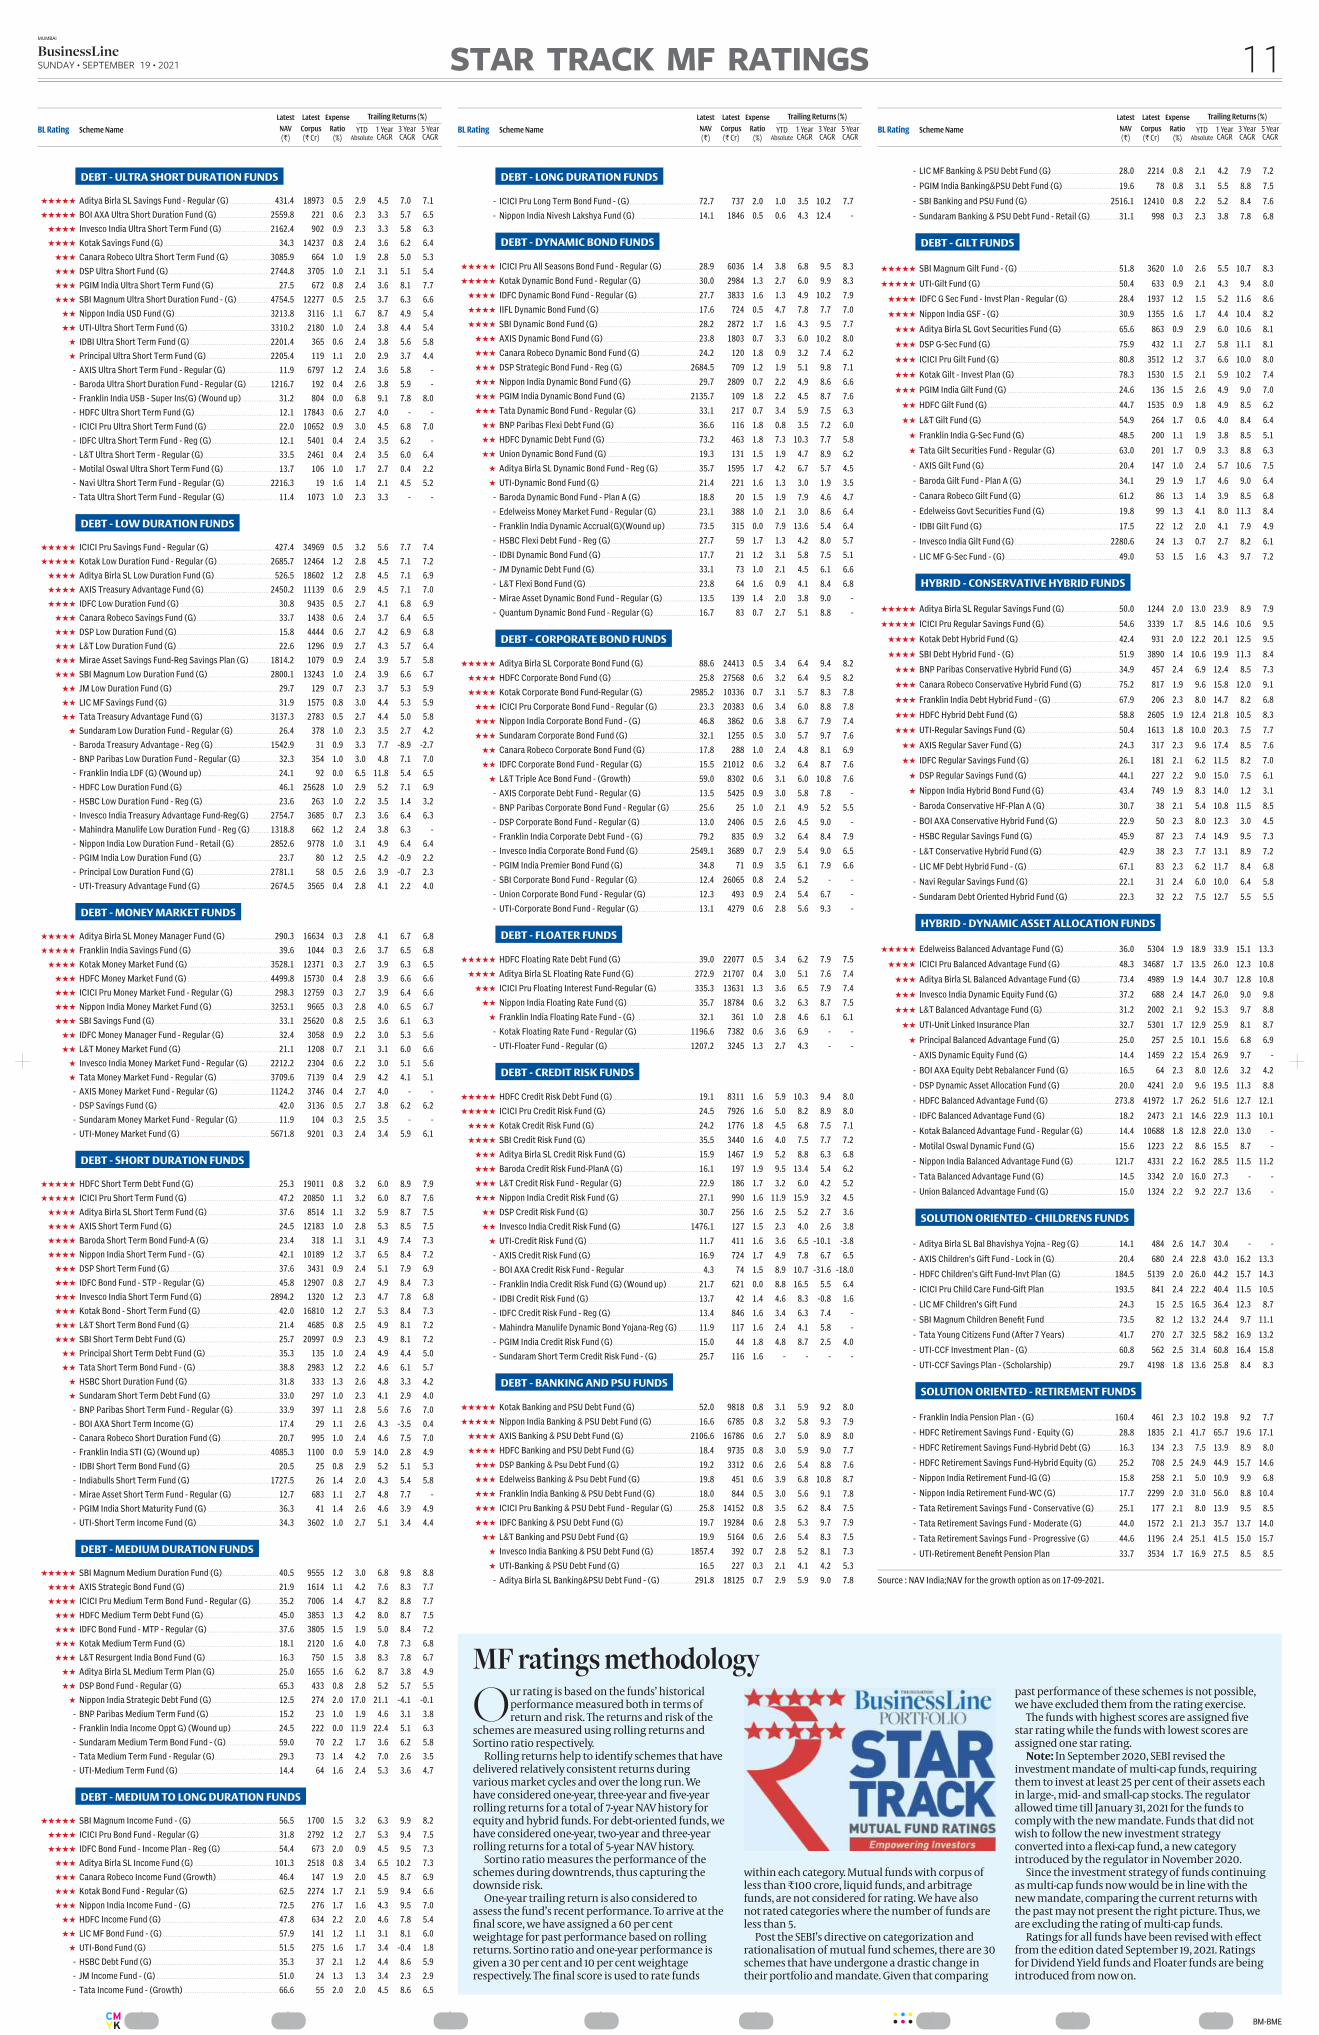
Our rating is based on the funds’ historicalperformance measured both in terms ofreturn and risk. The returns and risk of the
schemes are measured using rolling returns andSortino ratio respectively.
Rolling returns help to identify schemes that havedelivered relatively consistent returns duringvarious market cycles and over the long run. Wehave considered oneyear, threeyear and fi�veyearrolling returns for a total of 7year NAV history forequity and hybrid funds. For debtoriented funds, wehave considered oneyear, twoyear and threeyearrolling returns for a total of 5year NAV history.
Sortino ratio measures the performance of theschemes during downtrends, thus capturing thedownside risk.
Oneyear trailing return is also considered toassess the fund’s recent performance. To arrive at thefi�nal score, we have assigned a 60 per centweightage for past performance based on rollingreturns. Sortino ratio and oneyear performance isgiven a 30 per cent and 10 per cent weightagerespectively. The fi�nal score is used to rate funds
within each category. Mutual funds with corpus ofless than ₹�100 crore, liquid funds, and arbitragefunds, are not considered for rating. We have alsonot rated categories where the number of funds areless than 5.
Post the SEBI’s directive on categorization andrationalisation of mutual fund schemes, there are 30schemes that have undergone a drastic change intheir portfolio and mandate. Given that comparing
past performance of these schemes is not possible,we have excluded them from the rating exercise.
The funds with highest scores are assigned fi�vestar rating while the funds with lowest scores areassigned one star rating.Note: In September 2020, SEBI revised the
investment mandate of multicap funds, requiringthem to invest at least 25 per cent of their assets eachin large, mid and smallcap stocks. The regulatorallowed time till January 31, 2021 for the funds tocomply with the new mandate. Funds that did notwish to follow the new investment strategyconverted into a fl�exicap fund, a new categoryintroduced by the regulator in November 2020.
Since the investment strategy of funds continuingas multicap funds now would be in line with thenew mandate, comparing the current returns withthe past may not present the right picture. Thus, weare excluding the rating of multicap funds.
Ratings for all funds have been revised with eff�ectfrom the edition dated September 19, 2021. Ratingsfor Dividend Yield funds and Floater funds are beingintroduced from now on.
MF ratings methodology
................BM-BME
DEBT - ULTRA SHORT DURATION FUNDS
★★★★★ Aditya Birla SL Savings Fund - Regular (G) . . . . . . . . . . . . . . . . .. . . . . . . . 431.4 18973 0.5 2.9 4.5 7.0 7.1
★★★★★ BOI AXA Ultra Short Duration Fund (G) . . . . . . . . . . . . . . . . . . . . . . . .. . . . . 2559.8 221 0.6 2.3 3.3 5.7 6.5
★★★★ Invesco India Ultra Short Term Fund (G) . . . . . . . . . . . . . . . . . . . . .. . . . . 2162.4 902 0.9 2.3 3.3 5.8 6.3
★★★★ Kotak Savings Fund (G) . . . . . . . . . . . . . . . . . . . . . . . . . . . . . . . . . . . . . . . . . . . . . . . . . . . . .. . . . . . . . . . 34.3 14237 0.8 2.4 3.6 6.2 6.4
★★★ Canara Robeco Ultra Short Term Fund (G) . . . . . . . . . . . . . . . . .. . . . . 3085.9 664 1.0 1.9 2.8 5.0 5.3
★★★ DSP Ultra Short Fund (G) . . . . . . . . . . . . . . . . . . . . . . . . . . . . . . . . . . . . . . . . . . . . . . . . . .. . . . . 2744.8 3705 1.0 2.1 3.1 5.1 5.4
★★★ PGIM India Ultra Short Term Fund (G) . . . . . . . . . . . . . . . . . . . . . . . . .. . . . . . . . . . 27.5 672 0.8 2.4 3.6 8.1 7.7
★★★ SBI Magnum Ultra Short Duration Fund - (G) . . . . . . . . . . . . .. . . . . 4754.5 12277 0.5 2.5 3.7 6.3 6.6
★★ Nippon India USD Fund (G) . . . . . . . . . . . . . . . . . . . . . . . . . . . . . . . . . . . . . . . . . . . . . . .. . . . . 3213.8 3116 1.1 6.7 8.7 4.9 5.4
★★ UTI-Ultra Short Term Fund (G) . . . . . . . . . . . . . . . . . . . . . . . . . . . . . . . . . . . . . . . .. . . . . 3310.2 2180 1.0 2.4 3.8 4.4 5.4
★ IDBI Ultra Short Term Fund (G) . . . . . . . . . . . . . . . . . . . . . . . . . . . . . . . . . . . . . . .. . . . . 2201.4 365 0.6 2.4 3.8 5.6 5.8
★ Principal Ultra Short Term Fund (G). . . . . . . . . . . . . . . . . . . . . . . . . . . . . .. . . . . 2205.4 119 1.1 2.0 2.9 3.7 4.4
- AXIS Ultra Short Term Fund - Regular (G) . . . . . . . . . . . . . . . . . . .. . . . . . . . . . 11.9 6797 1.2 2.4 3.6 5.8 -
- Baroda Ultra Short Duration Fund - Regular (G). . . . . . . .. . . . . 1216.7 192 0.4 2.6 3.8 5.9 -
- Franklin India USB - Super Ins(G) (Wound up) . . . . . . . . . .. . . . . . . . . . 31.2 804 0.0 6.8 9.1 7.8 8.0
- HDFC Ultra Short Term Fund (G) . . . . . . . . . . . . . . . . . . . . . . . . . . . . . . . . . . . .. . . . . . . . . . 12.1 17843 0.6 2.7 4.0 - -
- ICICI Pru Ultra Short Term Fund (G) . . . . . . . . . . . . . . . . . . . . . . . . . . . . .. . . . . . . . . . 22.0 10652 0.9 3.0 4.5 6.8 7.0
- IDFC Ultra Short Term Fund - Reg (G) . . . . . . . . . . . . . . . . . . . . . . . . . . .. . . . . . . . . . 12.1 5401 0.4 2.4 3.5 6.2 -
- L&T Ultra Short Term - Regular (G) . . . . . . . . . . . . . . . . . . . . . . . . . . . . . . .. . . . . . . . . . 33.5 2461 0.4 2.4 3.5 6.0 6.4
- Motilal Oswal Ultra Short Term Fund (G) . . . . . . . . . . . . . . . . . . . .. . . . . . . . . . 13.7 106 1.0 1.7 2.7 0.4 2.2
- Navi Ultra Short Term Fund - Regular (G). . . . . . . . . . . . . . . . . . . .. . . . . 2216.3 19 1.6 1.4 2.1 4.5 5.2
- Tata Ultra Short Term Fund - Regular (G). . . . . . . . . . . . . . . . . . . .. . . . . . . . . . 11.4 1073 1.0 2.3 3.3 - -
DEBT - LOW DURATION FUNDS
★★★★★ ICICI Pru Savings Fund - Regular (G) . . . . . . . . . . . . . . . . . . . . . . . . . . . .. . . . . . . . 427.4 34969 0.5 3.2 5.6 7.7 7.4
★★★★★ Kotak Low Duration Fund - Regular (G). . . . . . . . . . . . . . . . . . . . . . . .. . . . . 2685.7 12464 1.2 2.8 4.5 7.1 7.2
★★★★ Aditya Birla SL Low Duration Fund (G) . . . . . . . . . . . . . . . . . . . . . . . . .. . . . . . . . 526.5 18602 1.2 2.8 4.5 7.1 6.9
★★★★ AXIS Treasury Advantage Fund (G) . . . . . . . . . . . . . . . . . . . . . . . . . . . . . . .. . . . . 2450.2 11139 0.6 2.9 4.5 7.1 7.0
★★★★ IDFC Low Duration Fund (G) . . . . . . . . . . . . . . . . . . . . . . . . . . . . . . . . . . . . . . . . . . . .. . . . . . . . . . 30.8 9435 0.5 2.7 4.1 6.8 6.9
★★★ Canara Robeco Savings Fund (G) . . . . . . . . . . . . . . . . . . . . . . . . . . . . . . . . . . .. . . . . . . . . . 33.7 1438 0.6 2.4 3.7 6.4 6.5
★★★ DSP Low Duration Fund (G) . . . . . . . . . . . . . . . . . . . . . . . . . . . . . . . . . . . . . . . . . . . . . .. . . . . . . . . . 15.8 4444 0.6 2.7 4.2 6.9 6.8
★★★ L&T Low Duration Fund (G) . . . . . . . . . . . . . . . . . . . . . . . . . . . . . . . . . . . . . . . . . . . . . .. . . . . . . . . . 22.6 1296 0.9 2.7 4.3 5.7 6.4
★★★ Mirae Asset Savings Fund-Reg Savings Plan (G) . . . . . .. . . . . 1814.2 1079 0.9 2.4 3.9 5.7 5.8
★★★ SBI Magnum Low Duration Fund (G) . . . . . . . . . . . . . . . . . . . . . . . . . . . . .. . . . . 2800.1 13243 1.0 2.4 3.9 6.6 6.7
★★ JM Low Duration Fund (G) . . . . . . . . . . . . . . . . . . . . . . . . . . . . . . . . . . . . . . . . . . . . . . . .. . . . . . . . . . 29.7 129 0.7 2.3 3.7 5.3 5.9
★★ LIC MF Savings Fund (G) . . . . . . . . . . . . . . . . . . . . . . . . . . . . . . . . . . . . . . . . . . . . . . . . . . .. . . . . . . . . . 31.9 1575 0.8 3.0 4.4 5.3 5.9
★★ Tata Treasury Advantage Fund (G) . . . . . . . . . . . . . . . . . . . . . . . . . . . . . . .. . . . . 3137.3 2783 0.5 2.7 4.4 5.0 5.8
★ Sundaram Low Duration Fund - Regular (G) . . . . . . . . . . . . . . .. . . . . . . . . . 26.4 378 1.0 2.3 3.5 2.7 4.2
- Baroda Treasury Advantage - Reg (G) . . . . . . . . . . . . . . . . . . . . . . . . . .. . . . . 1542.9 31 0.9 3.3 7.7 -8.9 -2.7
- BNP Paribas Low Duration Fund - Regular (G) . . . . . . . . . . .. . . . . . . . . . 32.3 354 1.0 3.0 4.8 7.1 7.0
- Franklin India LDF (G) (Wound up) . . . . . . . . . . . . . . . . . . . . . . . . . . . . . . . .. . . . . . . . . . 24.1 92 0.0 6.5 11.8 5.4 6.5
- HDFC Low Duration Fund (G) . . . . . . . . . . . . . . . . . . . . . . . . . . . . . . . . . . . . . . . . . . .. . . . . . . . . . 46.1 25628 1.0 2.9 5.2 7.1 6.9
- HSBC Low Duration Fund - Reg (G). . . . . . . . . . . . . . . . . . . . . . . . . . . . . . . .. . . . . . . . . . 23.6 263 1.0 2.2 3.5 1.4 3.2
- Invesco India Treasury Advantage Fund-Reg(G) . . . . . .. . . . . 2754.7 3685 0.7 2.3 3.6 6.4 6.3
- Mahindra Manulife Low Duration Fund - Reg (G). . . . . .. . . . . 1318.8 662 1.2 2.4 3.8 6.3 -
- Nippon India Low Duration Fund - Retail (G) . . . . . . . . . . . . . .. . . . . 2852.6 9778 1.0 3.1 4.9 6.4 6.4
- PGIM India Low Duration Fund (G) . . . . . . . . . . . . . . . . . . . . . . . . . . . . . . . .. . . . . . . . . . 23.7 80 1.2 2.5 4.2 -0.9 2.2
- Principal Low Duration Fund (G) . . . . . . . . . . . . . . . . . . . . . . . . . . . . . . . . . . . .. . . . . 2781.1 58 0.5 2.6 3.9 -0.7 2.3
- UTI-Treasury Advantage Fund (G) . . . . . . . . . . . . . . . . . . . . . . . . . . . . . . . . .. . . . . 2674.5 3565 0.4 2.8 4.1 2.2 4.0
DEBT - MONEY MARKET FUNDS
★★★★★ Aditya Birla SL Money Manager Fund (G) . . . . . . . . . . . . . . . . . . .. . . . . . . . 290.3 16634 0.3 2.8 4.1 6.7 6.8
★★★★★ Franklin India Savings Fund (G) . . . . . . . . . . . . . . . . . . . . . . . . . . . . . . . . . . . . . .. . . . . . . . . . 39.6 1044 0.3 2.6 3.7 6.5 6.8
★★★★ Kotak Money Market Fund (G) . . . . . . . . . . . . . . . . . . . . . . . . . . . . . . . . . . . . . . . .. . . . . 3528.1 12371 0.3 2.7 3.9 6.3 6.5
★★★ HDFC Money Market Fund (G) . . . . . . . . . . . . . . . . . . . . . . . . . . . . . . . . . . . . . . . .. . . . . 4499.8 15730 0.4 2.8 3.9 6.6 6.6
★★★ ICICI Pru Money Market Fund - Regular (G) . . . . . . . . . . . . . . .. . . . . . . . 298.3 12759 0.3 2.7 3.9 6.4 6.6
★★★ Nippon India Money Market Fund (G). . . . . . . . . . . . . . . . . . . . . . . . . . .. . . . . 3253.1 9665 0.3 2.8 4.0 6.5 6.7
★★★ SBI Savings Fund (G) . . . . . . . . . . . . . . . . . . . . . . . . . . . . . . . . . . . . . . . . . . . . . . . . . . . . . . . . . .. . . . . . . . . . 33.1 25620 0.8 2.5 3.6 6.1 6.3
★★ IDFC Money Manager Fund - Regular (G) . . . . . . . . . . . . . . . . . . . .. . . . . . . . . . 32.4 3058 0.9 2.2 3.0 5.3 5.6
★★ L&T Money Market Fund (G) . . . . . . . . . . . . . . . . . . . . . . . . . . . . . . . . . . . . . . . . . . .. . . . . . . . . . 21.1 1208 0.7 2.1 3.1 6.0 6.6
★ Invesco India Money Market Fund - Regular (G) . . . . . . .. . . . . 2212.2 2304 0.6 2.2 3.0 5.1 5.6
★ Tata Money Market Fund - Regular (G) . . . . . . . . . . . . . . . . . . . . . . . .. . . . . 3709.6 7139 0.4 2.9 4.2 4.1 5.1
- AXIS Money Market Fund - Regular (G) . . . . . . . . . . . . . . . . . . . . . . .. . . . . 1124.2 3746 0.4 2.7 4.0 - -
- DSP Savings Fund (G) . . . . . . . . . . . . . . . . . . . . . . . . . . . . . . . . . . . . . . . . . . . . . . . . . . . . . . . .. . . . . . . . . . 42.0 3136 0.5 2.7 3.8 6.2 6.2
- Sundaram Money Market Fund - Regular (G) . . . . . . . . . . . .. . . . . . . . . . 11.9 104 0.3 2.5 3.5 - -
- UTI-Money Market Fund (G) . . . . . . . . . . . . . . . . . . . . . . . . . . . . . . . . . . . . . . . . . . . .. . . . . 5671.8 9201 0.3 2.4 3.4 5.9 6.1
DEBT - SHORT DURATION FUNDS
★★★★★ HDFC Short Term Debt Fund (G) . . . . . . . . . . . . . . . . . . . . . . . . . . . . . . . . . . . .. . . . . . . . . . 25.3 19011 0.8 3.2 6.0 8.9 7.9
★★★★★ ICICI Pru Short Term Fund (G) . . . . . . . . . . . . . . . . . . . . . . . . . . . . . . . . . . . . . . . .. . . . . . . . . . 47.2 20850 1.1 3.2 6.0 8.7 7.6
★★★★ Aditya Birla SL Short Term Fund (G) . . . . . . . . . . . . . . . . . . . . . . . . . . . . .. . . . . . . . . . 37.6 8514 1.1 3.2 5.9 8.7 7.5
★★★★ AXIS Short Term Fund (G) . . . . . . . . . . . . . . . . . . . . . . . . . . . . . . . . . . . . . . . . . . . . . . . .. . . . . . . . . . 24.5 12183 1.0 2.8 5.3 8.5 7.5
★★★★ Baroda Short Term Bond Fund-A (G) . . . . . . . . . . . . . . . . . . . . . . . . . . . .. . . . . . . . . . 23.4 318 1.1 3.1 4.9 7.4 7.3
★★★★ Nippon India Short Term Fund - (G) . . . . . . . . . . . . . . . . . . . . . . . . . . . . . .. . . . . . . . . . 42.1 10189 1.2 3.7 6.5 8.4 7.2
★★★ DSP Short Term Fund (G). . . . . . . . . . . . . . . . . . . . . . . . . . . . . . . . . . . . . . . . . . . . . . . . . .. . . . . . . . . . 37.6 3431 0.9 2.4 5.1 7.9 6.9
★★★ IDFC Bond Fund - STP - Regular (G) . . . . . . . . . . . . . . . . . . . . . . . . . . . . . .. . . . . . . . . . 45.8 12907 0.8 2.7 4.9 8.4 7.3
★★★ Invesco India Short Term Fund (G) . . . . . . . . . . . . . . . . . . . . . . . . . . . . . . . .. . . . . 2894.2 1320 1.2 2.3 4.7 7.8 6.8
★★★ Kotak Bond - Short Term Fund (G) . . . . . . . . . . . . . . . . . . . . . . . . . . . . . . . . .. . . . . . . . . . 42.0 16810 1.2 2.7 5.3 8.4 7.3
★★★ L&T Short Term Bond Fund (G) . . . . . . . . . . . . . . . . . . . . . . . . . . . . . . . . . . . . . . .. . . . . . . . . . 21.4 4685 0.8 2.5 4.9 8.1 7.2
★★★ SBI Short Term Debt Fund (G) . . . . . . . . . . . . . . . . . . . . . . . . . . . . . . . . . . . . . . . . .. . . . . . . . . . 25.7 20997 0.9 2.3 4.9 8.1 7.2
★★ Principal Short Term Debt Fund (G) . . . . . . . . . . . . . . . . . . . . . . . . . . . . . .. . . . . . . . . . 35.3 135 1.0 2.4 4.9 4.4 5.0
★★ Tata Short Term Bond Fund - (G) . . . . . . . . . . . . . . . . . . . . . . . . . . . . . . . . . . .. . . . . . . . . . 38.8 2983 1.2 2.2 4.6 6.1 5.7
★ HSBC Short Duration Fund (G) . . . . . . . . . . . . . . . . . . . . . . . . . . . . . . . . . . . . . . . .. . . . . . . . . . 31.8 333 1.3 2.6 4.8 3.3 4.2
★ Sundaram Short Term Debt Fund (G) . . . . . . . . . . . . . . . . . . . . . . . . . . .. . . . . . . . . . 33.0 297 1.0 2.3 4.1 2.9 4.0
- BNP Paribas Short Term Fund - Regular (G) . . . . . . . . . . . . . . .. . . . . . . . . . 33.9 397 1.1 2.8 5.6 7.6 7.0
- BOI AXA Short Term Income (G) . . . . . . . . . . . . . . . . . . . . . . . . . . . . . . . . . . . .. . . . . . . . . . 17.4 29 1.1 2.6 4.3 -3.5 0.4
- Canara Robeco Short Duration Fund (G). . . . . . . . . . . . . . . . . . . . . .. . . . . . . . . . 20.7 995 1.0 2.4 4.6 7.5 7.0
- Franklin India STI (G) (Wound up) . . . . . . . . . . . . . . . . . . . . . . . . . . . . . . . . .. . . . . 4085.3 1100 0.0 5.9 14.0 2.8 4.9
- IDBI Short Term Bond Fund (G) . . . . . . . . . . . . . . . . . . . . . . . . . . . . . . . . . . . . . .. . . . . . . . . . 20.5 25 0.8 2.9 5.2 5.1 5.3
- Indiabulls Short Term Fund (G). . . . . . . . . . . . . . . . . . . . . . . . . . . . . . . . . . . . . . .. . . . . 1727.5 26 1.4 2.0 4.3 5.4 5.8
- Mirae Asset Short Term Fund - Regular (G) . . . . . . . . . . . . . . . .. . . . . . . . . . 12.7 683 1.1 2.7 4.8 7.7 -
- PGIM India Short Maturity Fund (G) . . . . . . . . . . . . . . . . . . . . . . . . . . . . .. . . . . . . . . . 36.3 41 1.4 2.6 4.6 3.9 4.9
- UTI-Short Term Income Fund (G) . . . . . . . . . . . . . . . . . . . . . . . . . . . . . . . . . . .. . . . . . . . . . 34.3 3602 1.0 2.7 5.1 3.4 4.4
DEBT - MEDIUM DURATION FUNDS
★★★★★ SBI Magnum Medium Duration Fund (G) . . . . . . . . . . . . . . . . . . . . .. . . . . . . . . . 40.5 9555 1.2 3.0 6.8 9.8 8.8
★★★★ AXIS Strategic Bond Fund (G) . . . . . . . . . . . . . . . . . . . . . . . . . . . . . . . . . . . . . . . . .. . . . . . . . . . 21.9 1614 1.1 4.2 7.6 8.3 7.7
★★★★ ICICI Pru Medium Term Bond Fund - Regular (G) . . . . .. . . . . . . . . . 35.2 7006 1.4 4.7 8.2 8.8 7.7
★★★ HDFC Medium Term Debt Fund (G) . . . . . . . . . . . . . . . . . . . . . . . . . . . . . . .. . . . . . . . . . 45.0 3853 1.3 4.2 8.0 8.7 7.5
★★★ IDFC Bond Fund - MTP - Regular (G) . . . . . . . . . . . . . . . . . . . . . . . . . . . . .. . . . . . . . . . 37.6 3805 1.5 1.9 5.0 8.4 7.2
★★★ Kotak Medium Term Fund (G) . . . . . . . . . . . . . . . . . . . . . . . . . . . . . . . . . . . . . . . . .. . . . . . . . . . 18.1 2120 1.6 4.0 7.8 7.3 6.8
★★★ L&T Resurgent India Bond Fund (G) . . . . . . . . . . . . . . . . . . . . . . . . . . . . . .. . . . . . . . . . 16.3 750 1.5 3.8 8.3 7.8 6.7
★★ Aditya Birla SL Medium Term Plan (G) . . . . . . . . . . . . . . . . . . . . . . . . .. . . . . . . . . . 25.0 1655 1.6 6.2 8.7 3.8 4.9
★★ DSP Bond Fund - Regular (G) . . . . . . . . . . . . . . . . . . . . . . . . . . . . . . . . . . . . . . . . . . .. . . . . . . . . . 65.3 433 0.8 2.8 5.2 5.7 5.5
★ Nippon India Strategic Debt Fund (G) . . . . . . . . . . . . . . . . . . . . . . . . . . .. . . . . . . . . . 12.5 274 2.0 17.0 21.1 -4.1 -0.1
- BNP Paribas Medium Term Fund (G) . . . . . . . . . . . . . . . . . . . . . . . . . . . .. . . . . . . . . . 15.2 23 1.0 1.9 4.6 3.1 3.8
- Franklin India Income Oppt G) (Wound up) . . . . . . . . . . . . . . . .. . . . . . . . . . 24.5 222 0.0 11.9 22.4 5.1 6.3
- Sundaram Medium Term Bond Fund - (G) . . . . . . . . . . . . . . . . . . .. . . . . . . . . . 59.0 70 2.2 1.7 3.6 6.2 5.8
- Tata Medium Term Fund - Regular (G) . . . . . . . . . . . . . . . . . . . . . . . . .. . . . . . . . . . 29.3 73 1.4 4.2 7.0 2.6 3.5
- UTI-Medium Term Fund (G) . . . . . . . . . . . . . . . . . . . . . . . . . . . . . . . . . . . . . . . . . . . . .. . . . . . . . . . 14.4 64 1.6 2.4 5.3 3.6 4.7
DEBT - MEDIUM TO LONG DURATION FUNDS
★★★★★ SBI Magnum Income Fund - (G) . . . . . . . . . . . . . . . . . . . . . . . . . . . . . . . . . . . . . .. . . . . . . . . . 56.5 1700 1.5 3.2 6.3 9.9 8.2
★★★★ ICICI Pru Bond Fund - Regular (G) . . . . . . . . . . . . . . . . . . . . . . . . . . . . . . . . .. . . . . . . . . . 31.8 2792 1.2 2.7 5.3 9.4 7.5
★★★★ IDFC Bond Fund - Income Plan - Reg (G) . . . . . . . . . . . . . . . . . . . . . .. . . . . . . . . . 54.4 673 2.0 0.9 4.5 9.5 7.3
★★★ Aditya Birla SL Income Fund (G) . . . . . . . . . . . . . . . . . . . . . . . . . . . . . . . . . . . . .. . . . . . . . 101.3 2518 0.8 3.4 6.5 10.2 7.3
★★★ Canara Robeco Income Fund (Growth) . . . . . . . . . . . . . . . . . . . . . . . .. . . . . . . . . . 46.4 147 1.9 2.0 4.5 8.7 6.9
★★★ Kotak Bond Fund - Regular (G). . . . . . . . . . . . . . . . . . . . . . . . . . . . . . . . . . . . . . . .. . . . . . . . . . 62.5 2274 1.7 2.1 5.9 9.4 6.6
★★★ Nippon India Income Fund - (G) . . . . . . . . . . . . . . . . . . . . . . . . . . . . . . . . . . . . . .. . . . . . . . . . 72.5 276 1.7 1.6 4.3 9.5 7.0
★★ HDFC Income Fund (G) . . . . . . . . . . . . . . . . . . . . . . . . . . . . . . . . . . . . . . . . . . . . . . . . . . . . . .. . . . . . . . . . 47.8 634 2.2 2.0 4.6 7.8 5.4
★★ LIC MF Bond Fund - (G) . . . . . . . . . . . . . . . . . . . . . . . . . . . . . . . . . . . . . . . . . . . . . . . . . . . . . .. . . . . . . . . . 57.9 141 1.2 1.1 3.1 8.1 6.0
★ UTI-Bond Fund (G) . . . . . . . . . . . . . . . . . . . . . . . . . . . . . . . . . . . . . . . . . . . . . . . . . . . . . . . . . . . . . .. . . . . . . . . . 51.5 275 1.6 1.7 3.4 -0.4 1.8
- HSBC Debt Fund (G) . . . . . . . . . . . . . . . . . . . . . . . . . . . . . . . . . . . . . . . . . . . . . . . . . . . . . . . . . . .. . . . . . . . . . 35.3 37 2.1 1.2 4.4 8.6 5.9
- JM Income Fund - (G) . . . . . . . . . . . . . . . . . . . . . . . . . . . . . . . . . . . . . . . . . . . . . . . . . . . . . . . . .. . . . . . . . . . 51.0 24 1.3 1.3 3.4 2.3 2.9
- Tata Income Fund - (Growth) . . . . . . . . . . . . . . . . . . . . . . . . . . . . . . . . . . . . . . . . . .. . . . . . . . . . 66.6 55 2.0 2.0 4.5 8.6 6.5
- LIC MF Banking & PSU Debt Fund (G) . . . . . . . . . . . . . . . . . . . . . . . . . . .. . . . . . . . . . 28.0 2214 0.8 2.1 4.2 7.9 7.2
- PGIM India Banking&PSU Debt Fund (G) . . . . . . . . . . . . . . . . . . . . .. . . . . . . . . . 19.6 78 0.8 3.1 5.5 8.8 7.5
- SBI Banking and PSU Fund (G) . . . . . . . . . . . . . . . . . . . . . . . . . . . . . . . . . . . . . . . .. . . . . 2516.1 12410 0.8 2.2 5.2 8.4 7.6
- Sundaram Banking & PSU Debt Fund - Retail (G). . . . . .. . . . . . . . . . 31.1 998 0.3 2.3 3.8 7.8 6.8
DEBT - GILT FUNDS
★★★★★ SBI Magnum Gilt Fund - (G) . . . . . . . . . . . . . . . . . . . . . . . . . . . . . . . . . . . . . . . . . . . . .. . . . . . . . . . 51.8 3620 1.0 2.6 5.5 10.7 8.3
★★★★★ UTI-Gilt Fund (G). . . . . . . . . . . . . . . . . . . . . . . . . . . . . . . . . . . . . . . . . . . . . . . . . . . . . . . . . . . . . . . . . .. . . . . . . . . . 50.4 633 0.9 2.1 4.3 9.4 8.0
★★★★ IDFC G Sec Fund - Invst Plan - Regular (G) . . . . . . . . . . . . . . . . . .. . . . . . . . . . 28.4 1937 1.2 1.5 5.2 11.6 8.6
★★★★ Nippon India GSF - (G) . . . . . . . . . . . . . . . . . . . . . . . . . . . . . . . . . . . . . . . . . . . . . . . . . . . . . . .. . . . . . . . . . 30.9 1355 1.6 1.7 4.4 10.4 8.2
★★★ Aditya Birla SL Govt Securities Fund (G) . . . . . . . . . . . . . . . . . . . . .. . . . . . . . . . 65.6 863 0.9 2.9 6.0 10.6 8.1
★★★ DSP G-Sec Fund (G) . . . . . . . . . . . . . . . . . . . . . . . . . . . . . . . . . . . . . . . . . . . . . . . . . . . . . . . . . . . .. . . . . . . . . . 75.9 432 1.1 2.7 5.8 11.1 8.1
★★★ ICICI Pru Gilt Fund (G) . . . . . . . . . . . . . . . . . . . . . . . . . . . . . . . . . . . . . . . . . . . . . . . . . . . . . . .. . . . . . . . . . 80.8 3512 1.2 3.7 6.6 10.0 8.0
★★★ Kotak Gilt - Invest Plan (G) . . . . . . . . . . . . . . . . . . . . . . . . . . . . . . . . . . . . . . . . . . . . . . .. . . . . . . . . . 78.3 1530 1.5 2.1 5.9 10.2 7.4
★★★ PGIM India Gilt Fund (G) . . . . . . . . . . . . . . . . . . . . . . . . . . . . . . . . . . . . . . . . . . . . . . . . . . .. . . . . . . . . . 24.6 136 1.5 2.6 4.9 9.0 7.0
★★ HDFC Gilt Fund (G) . . . . . . . . . . . . . . . . . . . . . . . . . . . . . . . . . . . . . . . . . . . . . . . . . . . . . . . . . . . . . .. . . . . . . . . . 44.7 1535 0.9 1.8 4.9 8.5 6.2
★★ L&T Gilt Fund (G) . . . . . . . . . . . . . . . . . . . . . . . . . . . . . . . . . . . . . . . . . . . . . . . . . . . . . . . . . . . . . . . . .. . . . . . . . . . 54.9 264 1.7 0.6 4.0 8.4 6.4
★ Franklin India G-Sec Fund (G) . . . . . . . . . . . . . . . . . . . . . . . . . . . . . . . . . . . . . . . . .. . . . . . . . . . 48.5 200 1.1 1.9 3.8 8.5 5.1
★ Tata Gilt Securities Fund - Regular (G) . . . . . . . . . . . . . . . . . . . . . . . . .. . . . . . . . . . 63.0 201 1.7 0.9 3.3 8.8 6.3
- AXIS Gilt Fund (G). . . . . . . . . . . . . . . . . . . . . . . . . . . . . . . . . . . . . . . . . . . . . . . . . . . . . . . . . . . . . . . .. . . . . . . . . . 20.4 147 1.0 2.4 5.7 10.6 7.5
- Baroda Gilt Fund - Plan A (G) . . . . . . . . . . . . . . . . . . . . . . . . . . . . . . . . . . . . . . . . . . .. . . . . . . . . . 34.1 29 1.9 1.7 4.6 9.0 6.4
- Canara Robeco Gilt Fund (G) . . . . . . . . . . . . . . . . . . . . . . . . . . . . . . . . . . . . . . . . . . .. . . . . . . . . . 61.2 86 1.3 1.4 3.9 8.5 6.8
- Edelweiss Govt Securities Fund (G). . . . . . . . . . . . . . . . . . . . . . . . . . . . . . .. . . . . . . . . . 19.8 99 1.3 4.1 8.0 11.3 8.4
- IDBI Gilt Fund (G). . . . . . . . . . . . . . . . . . . . . . . . . . . . . . . . . . . . . . . . . . . . . . . . . . . . . . . . . . . . . . . . .. . . . . . . . . . 17.5 22 1.2 2.0 4.1 7.9 4.9
- Invesco India Gilt Fund (G) . . . . . . . . . . . . . . . . . . . . . . . . . . . . . . . . . . . . . . . . . . . . . . .. . . . . 2280.6 24 1.3 0.7 2.7 8.2 6.1
- LIC MF G-Sec Fund - (G) . . . . . . . . . . . . . . . . . . . . . . . . . . . . . . . . . . . . . . . . . . . . . . . . . . . .. . . . . . . . . . 49.0 53 1.5 1.6 4.3 9.7 7.2
HYBRID - CONSERVATIVE HYBRID FUNDS
★★★★★ Aditya Birla SL Regular Savings Fund (G) . . . . . . . . . . . . . . . . . . . .. . . . . . . . . . 50.0 1244 2.0 13.0 23.9 8.9 7.9
★★★★★ ICICI Pru Regular Savings Fund (G) . . . . . . . . . . . . . . . . . . . . . . . . . . . . . . .. . . . . . . . . . 54.6 3339 1.7 8.5 14.6 10.6 9.5
★★★★ Kotak Debt Hybrid Fund (G) . . . . . . . . . . . . . . . . . . . . . . . . . . . . . . . . . . . . . . . . . . . . .. . . . . . . . . . 42.4 931 2.0 12.2 20.1 12.5 9.5
★★★★ SBI Debt Hybrid Fund - (G) . . . . . . . . . . . . . . . . . . . . . . . . . . . . . . . . . . . . . . . . . . . . . . .. . . . . . . . . . 51.9 3890 1.4 10.6 19.9 11.3 8.4
★★★ BNP Paribas Conservative Hybrid Fund (G). . . . . . . . . . . . . . . .. . . . . . . . . . 34.9 457 2.4 6.9 12.4 8.5 7.3
★★★ Canara Robeco Conservative Hybrid Fund (G) . . . . . . . . . .. . . . . . . . . . 75.2 817 1.9 9.6 15.8 12.0 9.1
★★★ Franklin India Debt Hybrid Fund - (G) . . . . . . . . . . . . . . . . . . . . . . . . . . .. . . . . . . . . . 67.9 206 2.3 8.0 14.7 8.2 6.8
★★★ HDFC Hybrid Debt Fund (G) . . . . . . . . . . . . . . . . . . . . . . . . . . . . . . . . . . . . . . . . . . . . .. . . . . . . . . . 58.8 2605 1.9 12.4 21.8 10.5 8.3
★★★ UTI-Regular Savings Fund (G) . . . . . . . . . . . . . . . . . . . . . . . . . . . . . . . . . . . . . . . . .. . . . . . . . . . 50.4 1613 1.8 10.0 20.3 7.5 7.7
★★ AXIS Regular Saver Fund (G) . . . . . . . . . . . . . . . . . . . . . . . . . . . . . . . . . . . . . . . . . . .. . . . . . . . . . 24.3 317 2.3 9.6 17.4 8.5 7.6
★★ IDFC Regular Savings Fund (G) . . . . . . . . . . . . . . . . . . . . . . . . . . . . . . . . . . . . . . .. . . . . . . . . . 26.1 181 2.1 6.2 11.5 8.2 7.0
★ DSP Regular Savings Fund (G) . . . . . . . . . . . . . . . . . . . . . . . . . . . . . . . . . . . . . . . .. . . . . . . . . . 44.1 227 2.2 9.0 15.0 7.5 6.1
★ Nippon India Hybrid Bond Fund (G) . . . . . . . . . . . . . . . . . . . . . . . . . . . . . . .. . . . . . . . . . 43.4 749 1.9 8.3 14.0 1.2 3.1
- Baroda Conservative HF-Plan A (G) . . . . . . . . . . . . . . . . . . . . . . . . . . . . . .. . . . . . . . . . 30.7 38 2.1 5.4 10.8 11.5 8.5
- BOI AXA Conservative Hybrid Fund (G) . . . . . . . . . . . . . . . . . . . . . . .. . . . . . . . . . 22.9 50 2.3 8.0 12.3 3.0 4.5
- HSBC Regular Savings Fund (G) . . . . . . . . . . . . . . . . . . . . . . . . . . . . . . . . . . . . .. . . . . . . . . . 45.9 87 2.3 7.4 14.9 9.5 7.3
- L&T Conservative Hybrid Fund (G) . . . . . . . . . . . . . . . . . . . . . . . . . . . . . . . .. . . . . . . . . . 42.9 38 2.3 7.7 13.1 8.9 7.2
- LIC MF Debt Hybrid Fund - (G) . . . . . . . . . . . . . . . . . . . . . . . . . . . . . . . . . . . . . . . .. . . . . . . . . . 67.1 83 2.3 6.2 11.7 8.4 6.8
- Navi Regular Savings Fund (G). . . . . . . . . . . . . . . . . . . . . . . . . . . . . . . . . . . . . . . .. . . . . . . . . . 22.1 31 2.4 6.0 10.0 6.4 5.8
- Sundaram Debt Oriented Hybrid Fund (G) . . . . . . . . . . . . . . . . . .. . . . . . . . . . 22.3 32 2.2 7.5 12.7 5.5 5.5
HYBRID - DYNAMIC ASSET ALLOCATION FUNDS
★★★★★ Edelweiss Balanced Advantage Fund (G) . . . . . . . . . . . . . . . . . . . .. . . . . . . . . . 36.0 5304 1.9 18.9 33.9 15.1 13.3
★★★★ ICICI Pru Balanced Advantage Fund (G) . . . . . . . . . . . . . . . . . . . . . .. . . . . . . . . . 48.3 34687 1.7 13.5 26.0 12.3 10.8
★★★ Aditya Birla SL Balanced Advantage Fund (G) . . . . . . . . . . .. . . . . . . . . . 73.4 4989 1.9 14.4 30.7 12.8 10.8
★★★ Invesco India Dynamic Equity Fund (G) . . . . . . . . . . . . . . . . . . . . . . .. . . . . . . . . . 37.2 688 2.4 14.7 26.0 9.0 9.8
★★★ L&T Balanced Advantage Fund (G) . . . . . . . . . . . . . . . . . . . . . . . . . . . . . . . .. . . . . . . . . . 31.2 2002 2.1 9.2 15.3 9.7 8.8
★★ UTI-Unit Linked Insurance Plan. . . . . . . . . . . . . . . . . . . . . . . . . . . . . . . . . . . . . . .. . . . . . . . . . 32.7 5301 1.7 12.9 25.9 8.1 8.7
★ Principal Balanced Advantage Fund (G) . . . . . . . . . . . . . . . . . . . . . .. . . . . . . . . . 25.0 257 2.5 10.1 15.6 6.8 6.9
- AXIS Dynamic Equity Fund (G) . . . . . . . . . . . . . . . . . . . . . . . . . . . . . . . . . . . . . . . .. . . . . . . . . . 14.4 1459 2.2 15.4 26.9 9.7 -
- BOI AXA Equity Debt Rebalancer Fund (G) . . . . . . . . . . . . . . . . .. . . . . . . . . . 16.5 64 2.3 8.0 12.6 3.2 4.2
- DSP Dynamic Asset Allocation Fund (G) . . . . . . . . . . . . . . . . . . . . . .. . . . . . . . . . 20.0 4241 2.0 9.6 19.5 11.3 8.8
- HDFC Balanced Advantage Fund (G). . . . . . . . . . . . . . . . . . . . . . . . . . . . .. . . . . . . . 273.8 41972 1.7 26.2 51.6 12.7 12.1
- IDFC Balanced Advantage Fund (G) . . . . . . . . . . . . . . . . . . . . . . . . . . . . . .. . . . . . . . . . 18.2 2473 2.1 14.6 22.9 11.3 10.1
- Kotak Balanced Advantage Fund - Regular (G) . . . . . . . . .. . . . . . . . . . 14.4 10688 1.8 12.8 22.0 13.0 -
- Motilal Oswal Dynamic Fund (G) . . . . . . . . . . . . . . . . . . . . . . . . . . . . . . . . . . . .. . . . . . . . . . 15.6 1223 2.2 8.6 15.5 8.7 -
- Nippon India Balanced Advantage Fund (G) . . . . . . . . . . . . . . .. . . . . . . . 121.7 4331 2.2 16.2 28.5 11.5 11.2
- Tata Balanced Advantage Fund (G) . . . . . . . . . . . . . . . . . . . . . . . . . . . . . . .. . . . . . . . . . 14.5 3342 2.0 16.0 27.3 - -
- Union Balanced Advantage Fund (G) . . . . . . . . . . . . . . . . . . . . . . . . . . . .. . . . . . . . . . 15.0 1324 2.2 9.2 22.7 13.6 -
SOLUTION ORIENTED - CHILDRENS FUNDS
- Aditya Birla SL Bal Bhavishya Yojna - Reg (G). . . . . . . . . . . .. . . . . . . . . . 14.1 484 2.6 14.7 30.4 - -
- AXIS Children's Gift Fund - Lock in (G) . . . . . . . . . . . . . . . . . . . . . . . . .. . . . . . . . . . 20.4 680 2.4 22.8 43.0 16.2 13.3
- HDFC Children's Gift Fund-Invt Plan (G) . . . . . . . . . . . . . . . . . . . . . .. . . . . . . . 184.5 5139 2.0 26.0 44.2 15.7 14.3
- ICICI Pru Child Care Fund-Gift Plan . . . . . . . . . . . . . . . . . . . . . . . . . . . . . . .. . . . . . . . 193.5 841 2.4 22.2 40.4 11.5 10.5
- LIC MF Children's Gift Fund . . . . . . . . . . . . . . . . . . . . . . . . . . . . . . . . . . . . . . . . . . . . .. . . . . . . . . . 24.3 15 2.5 16.5 36.4 12.3 8.7
- SBI Magnum Children Benefit Fund. . . . . . . . . . . . . . . . . . . . . . . . . . . . . . .. . . . . . . . . . 73.5 82 1.2 13.2 24.4 9.7 11.1
- Tata Young Citizens Fund (After 7 Years) . . . . . . . . . . . . . . . . . . .. . . . . . . . . . 41.7 270 2.7 32.5 58.2 16.9 13.2
- UTI-CCF Investment Plan - (G) . . . . . . . . . . . . . . . . . . . . . . . . . . . . . . . . . . . . . . . .. . . . . . . . . . 60.8 562 2.5 31.4 60.8 16.4 15.8
- UTI-CCF Savings Plan - (Scholarship). . . . . . . . . . . . . . . . . . . . . . . . . . .. . . . . . . . . . 29.7 4198 1.8 13.6 25.8 8.4 8.3
SOLUTION ORIENTED - RETIREMENT FUNDS
- Franklin India Pension Plan - (G) . . . . . . . . . . . . . . . . . . . . . . . . . . . . . . . . . . . .. . . . . . . . 160.4 461 2.3 10.2 19.8 9.2 7.7
- HDFC Retirement Savings Fund - Equity (G) . . . . . . . . . . . . . .. . . . . . . . . . 28.8 1835 2.1 41.7 65.7 19.6 17.1
- HDFC Retirement Savings Fund-Hybrid Debt (G) . . . . .. . . . . . . . . . 16.3 134 2.3 7.5 13.9 8.9 8.0
- HDFC Retirement Savings Fund-Hybrid Equity (G) . .. . . . . . . . . . 25.2 708 2.5 24.9 44.9 15.7 14.6
- Nippon India Retirement Fund-IG (G) . . . . . . . . . . . . . . . . . . . . . . . . . . .. . . . . . . . . . 15.8 258 2.1 5.0 10.9 9.9 6.8
- Nippon India Retirement Fund-WC (G) . . . . . . . . . . . . . . . . . . . . . . . .. . . . . . . . . . 17.7 2299 2.0 31.0 56.0 8.8 10.4
- Tata Retirement Savings Fund - Conservative (G) . . .. . . . . . . . . . 25.1 177 2.1 8.0 13.9 9.5 8.5
- Tata Retirement Savings Fund - Moderate (G) . . . . . . . . . .. . . . . . . . . . 44.0 1572 2.1 21.3 35.7 13.7 14.0
- Tata Retirement Savings Fund - Progressive (G) . . . . . .. . . . . . . . . . 44.6 1196 2.4 25.1 41.5 15.0 15.7
- UTI-Retirement Benefit Pension Plan . . . . . . . . . . . . . . . . . . . . . . . . . . .. . . . . . . . . . 33.7 3534 1.7 16.9 27.5 8.5 8.5
Source : NAV India;NAV for the growth option as on 17-09-2021.
DEBT - LONG DURATION FUNDS
- ICICI Pru Long Term Bond Fund - (G) . . . . . . . . . . . . . . . . . . . . . . . . . . . .. . . . . . . . . . 72.7 737 2.0 1.0 3.5 10.2 7.7
- Nippon India Nivesh Lakshya Fund (G) . . . . . . . . . . . . . . . . . . . . . . . . .. . . . . . . . . . 14.1 1846 0.5 0.6 4.3 12.4 -
DEBT - DYNAMIC BOND FUNDS
★★★★★ ICICI Pru All Seasons Bond Fund - Regular (G) . . . . . . . . . .. . . . . . . . . . 28.9 6036 1.4 3.8 6.8 9.5 8.3
★★★★★ Kotak Dynamic Bond Fund - Regular (G). . . . . . . . . . . . . . . . . . . . . .. . . . . . . . . . 30.0 2984 1.3 2.7 6.0 9.9 8.3
★★★★ IDFC Dynamic Bond Fund - Regular (G). . . . . . . . . . . . . . . . . . . . . . . .. . . . . . . . . . 27.7 3833 1.6 1.3 4.9 10.2 7.9
★★★★ IIFL Dynamic Bond Fund (G) . . . . . . . . . . . . . . . . . . . . . . . . . . . . . . . . . . . . . . . . . . . .. . . . . . . . . . 17.6 724 0.5 4.7 7.8 7.7 7.0
★★★★ SBI Dynamic Bond Fund (G) . . . . . . . . . . . . . . . . . . . . . . . . . . . . . . . . . . . . . . . . . . . . .. . . . . . . . . . 28.2 2872 1.7 1.6 4.3 9.5 7.7
★★★ AXIS Dynamic Bond Fund (G) . . . . . . . . . . . . . . . . . . . . . . . . . . . . . . . . . . . . . . . . . .. . . . . . . . . . 23.8 1803 0.7 3.3 6.0 10.2 8.0
★★★ Canara Robeco Dynamic Bond Fund (G) . . . . . . . . . . . . . . . . . . . . . .. . . . . . . . . . 24.2 120 1.8 0.9 3.2 7.4 6.2
★★★ DSP Strategic Bond Fund - Reg (G). . . . . . . . . . . . . . . . . . . . . . . . . . . . . . . .. . . . . 2684.5 709 1.2 1.9 5.1 9.8 7.1
★★★ Nippon India Dynamic Bond Fund (G) . . . . . . . . . . . . . . . . . . . . . . . . . . .. . . . . . . . . . 29.7 2809 0.7 2.2 4.9 8.6 6.6
★★★ PGIM India Dynamic Bond Fund (G) . . . . . . . . . . . . . . . . . . . . . . . . . . . . . .. . . . . 2135.7 109 1.8 2.2 4.5 8.7 7.6
★★★ Tata Dynamic Bond Fund - Regular (G) . . . . . . . . . . . . . . . . . . . . . . . .. . . . . . . . . . 33.1 217 0.7 3.4 5.9 7.5 6.3
★★ BNP Paribas Flexi Debt Fund (G) . . . . . . . . . . . . . . . . . . . . . . . . . . . . . . . . . . . .. . . . . . . . . . 36.6 116 1.8 0.8 3.5 7.2 6.0
★★ HDFC Dynamic Debt Fund (G) . . . . . . . . . . . . . . . . . . . . . . . . . . . . . . . . . . . . . . . . .. . . . . . . . . . 73.2 463 1.8 7.3 10.3 7.7 5.8
★★ Union Dynamic Bond Fund (G) . . . . . . . . . . . . . . . . . . . . . . . . . . . . . . . . . . . . . . . .. . . . . . . . . . 19.3 131 1.5 1.9 4.7 8.9 6.2
★ Aditya Birla SL Dynamic Bond Fund - Reg (G) . . . . . . . . . . . .. . . . . . . . . . 35.7 1595 1.7 4.2 6.7 5.7 4.5
★ UTI-Dynamic Bond Fund (G) . . . . . . . . . . . . . . . . . . . . . . . . . . . . . . . . . . . . . . . . . . . .. . . . . . . . . . 21.4 221 1.6 1.3 3.0 1.9 3.5
- Baroda Dynamic Bond Fund - Plan A (G) . . . . . . . . . . . . . . . . . . . . . .. . . . . . . . . . 18.8 20 1.5 1.9 7.9 4.6 4.7
- Edelweiss Money Market Fund - Regular (G) . . . . . . . . . . . . .. . . . . . . . . . 23.1 388 1.0 2.1 3.0 8.6 6.4
- Franklin India Dynamic Accrual(G)(Wound up) . . . . . . . .. . . . . . . . . . 73.5 315 0.0 7.9 13.6 5.4 6.4
- HSBC Flexi Debt Fund - Reg (G) . . . . . . . . . . . . . . . . . . . . . . . . . . . . . . . . . . . . . .. . . . . . . . . . 27.7 59 1.7 1.3 4.2 8.0 5.7
- IDBI Dynamic Bond Fund (G) . . . . . . . . . . . . . . . . . . . . . . . . . . . . . . . . . . . . . . . . . . .. . . . . . . . . . 17.7 21 1.2 3.1 5.8 7.5 5.1
- JM Dynamic Debt Fund (G) . . . . . . . . . . . . . . . . . . . . . . . . . . . . . . . . . . . . . . . . . . . . . . .. . . . . . . . . . 33.1 73 1.0 2.1 4.5 6.1 6.6
- L&T Flexi Bond Fund (G) . . . . . . . . . . . . . . . . . . . . . . . . . . . . . . . . . . . . . . . . . . . . . . . . . . . .. . . . . . . . . . 23.8 64 1.6 0.9 4.1 8.4 6.8
- Mirae Asset Dynamic Bond Fund - Regular (G) . . . . . . . . . .. . . . . . . . . . 13.5 139 1.4 2.0 3.8 9.0 -
- Quantum Dynamic Bond Fund - Regular (G) . . . . . . . . . . . . . . .. . . . . . . . . . 16.7 83 0.7 2.7 5.1 8.8 -
DEBT - CORPORATE BOND FUNDS
★★★★★ Aditya Birla SL Corporate Bond Fund (G) . . . . . . . . . . . . . . . . . . . .. . . . . . . . . . 88.6 24413 0.5 3.4 6.4 9.4 8.2
★★★★ HDFC Corporate Bond Fund (G) . . . . . . . . . . . . . . . . . . . . . . . . . . . . . . . . . . . . . .. . . . . . . . . . 25.8 27568 0.6 3.2 6.4 9.5 8.2
★★★★ Kotak Corporate Bond Fund-Regular (G). . . . . . . . . . . . . . . . . . . . .. . . . . 2985.2 10336 0.7 3.1 5.7 8.3 7.8
★★★ ICICI Pru Corporate Bond Fund - Regular (G). . . . . . . . . . . . .. . . . . . . . . . 23.3 20383 0.6 3.4 6.0 8.8 7.8
★★★ Nippon India Corporate Bond Fund - (G). . . . . . . . . . . . . . . . . . . . . .. . . . . . . . . . 46.8 3862 0.6 3.8 6.7 7.9 7.4
★★★ Sundaram Corporate Bond Fund (G) . . . . . . . . . . . . . . . . . . . . . . . . . . . . .. . . . . . . . . . 32.1 1255 0.5 3.0 5.7 9.7 7.6
★★ Canara Robeco Corporate Bond Fund (G) . . . . . . . . . . . . . . . . . . .. . . . . . . . . . 17.8 288 1.0 2.4 4.8 8.1 6.9
★★ IDFC Corporate Bond Fund - Regular (G) . . . . . . . . . . . . . . . . . . . . .. . . . . . . . . . 15.5 21012 0.6 3.2 6.4 8.7 7.6
★ L&T Triple Ace Bond Fund - (Growth) . . . . . . . . . . . . . . . . . . . . . . . . . . .. . . . . . . . . . 59.0 8302 0.6 3.1 6.0 10.8 7.6
- AXIS Corporate Debt Fund - Regular (G). . . . . . . . . . . . . . . . . . . . . .. . . . . . . . . . 13.5 5425 0.9 3.0 5.8 7.8 -
- BNP Paribas Corporate Bond Fund - Regular (G) . . . . . .. . . . . . . . . . 25.6 25 1.0 2.1 4.9 5.2 5.5
- DSP Corporate Bond Fund - Regular (G) . . . . . . . . . . . . . . . . . . . . . .. . . . . . . . . . 13.0 2406 0.5 2.6 4.5 9.0 -
- Franklin India Corporate Debt Fund - (G) . . . . . . . . . . . . . . . . . . . .. . . . . . . . . . 79.2 835 0.9 3.2 6.4 8.4 7.9
- Invesco India Corporate Bond Fund (G) . . . . . . . . . . . . . . . . . . . . . . .. . . . . 2549.1 3689 0.7 2.9 5.4 9.0 6.5
- PGIM India Premier Bond Fund (G) . . . . . . . . . . . . . . . . . . . . . . . . . . . . . . .. . . . . . . . . . 34.8 71 0.9 3.5 6.1 7.9 6.6
- SBI Corporate Bond Fund - Regular (G). . . . . . . . . . . . . . . . . . . . . . . .. . . . . . . . . . 12.4 26065 0.8 2.4 5.2 - -
- Union Corporate Bond Fund - Regular (G) . . . . . . . . . . . . . . . . . . .. . . . . . . . . . 12.3 493 0.9 2.4 5.4 6.7 -
- UTI-Corporate Bond Fund - Regular (G) . . . . . . . . . . . . . . . . . . . . . . .. . . . . . . . . . 13.1 4279 0.6 2.8 5.6 9.3 -
DEBT - FLOATER FUNDS
★★★★★ HDFC Floating Rate Debt Fund (G). . . . . . . . . . . . . . . . . . . . . . . . . . . . . . . . .. . . . . . . . . . 39.0 22077 0.5 3.4 6.2 7.9 7.5
★★★★ Aditya Birla SL Floating Rate Fund (G) . . . . . . . . . . . . . . . . . . . . . . . . .. . . . . . . . 272.9 21707 0.4 3.0 5.1 7.6 7.4
★★★ ICICI Pru Floating Interest Fund-Regular (G) . . . . . . . . . . . . .. . . . . . . . 335.3 13631 1.3 3.6 6.5 7.9 7.4
★★ Nippon India Floating Rate Fund (G) . . . . . . . . . . . . . . . . . . . . . . . . . . . . .. . . . . . . . . . 35.7 18784 0.6 3.2 6.3 8.7 7.5
★ Franklin India Floating Rate Fund - (G) . . . . . . . . . . . . . . . . . . . . . . . . .. . . . . . . . . . 32.1 361 1.0 2.8 4.6 6.1 6.1
- Kotak Floating Rate Fund - Regular (G) . . . . . . . . . . . . . . . . . . . . . . . .. . . . . 1196.6 7382 0.6 3.6 6.9 - -
- UTI-Floater Fund - Regular (G) . . . . . . . . . . . . . . . . . . . . . . . . . . . . . . . . . . . . . . . .. . . . . 1207.2 3245 1.3 2.7 4.3 - -
DEBT - CREDIT RISK FUNDS
★★★★★ HDFC Credit Risk Debt Fund (G) . . . . . . . . . . . . . . . . . . . . . . . . . . . . . . . . . . . . .. . . . . . . . . . 19.1 8311 1.6 5.9 10.3 9.4 8.0
★★★★★ ICICI Pru Credit Risk Fund (G) . . . . . . . . . . . . . . . . . . . . . . . . . . . . . . . . . . . . . . . . .. . . . . . . . . . 24.5 7926 1.6 5.0 8.2 8.9 8.0
★★★★ Kotak Credit Risk Fund (G) . . . . . . . . . . . . . . . . . . . . . . . . . . . . . . . . . . . . . . . . . . . . . . .. . . . . . . . . . 24.2 1776 1.8 4.5 6.8 7.5 7.1
★★★★ SBI Credit Risk Fund (G) . . . . . . . . . . . . . . . . . . . . . . . . . . . . . . . . . . . . . . . . . . . . . . . . . . . .. . . . . . . . . . 35.5 3440 1.6 4.0 7.5 7.7 7.2
★★★ Aditya Birla SL Credit Risk Fund (G) . . . . . . . . . . . . . . . . . . . . . . . . . . . . . .. . . . . . . . . . 15.9 1467 1.9 5.2 8.8 6.3 6.8
★★★ Baroda Credit Risk Fund-PlanA (G) . . . . . . . . . . . . . . . . . . . . . . . . . . . . . . .. . . . . . . . . . 16.1 197 1.9 9.5 13.4 5.4 6.2
★★★ L&T Credit Risk Fund - Regular (G) . . . . . . . . . . . . . . . . . . . . . . . . . . . . . . . .. . . . . . . . . . 22.9 186 1.7 3.2 6.0 4.2 5.2
★★★ Nippon India Credit Risk Fund (G) . . . . . . . . . . . . . . . . . . . . . . . . . . . . . . . . . .. . . . . . . . . . 27.1 990 1.6 11.9 15.9 3.2 4.5
★★ DSP Credit Risk Fund (G) . . . . . . . . . . . . . . . . . . . . . . . . . . . . . . . . . . . . . . . . . . . . . . . . . .. . . . . . . . . . 30.7 256 1.6 2.5 5.2 2.7 3.6
★★ Invesco India Credit Risk Fund (G) . . . . . . . . . . . . . . . . . . . . . . . . . . . . . . . . .. . . . . 1476.1 127 1.5 2.3 4.0 2.6 3.8
★ UTI-Credit Risk Fund (G) . . . . . . . . . . . . . . . . . . . . . . . . . . . . . . . . . . . . . . . . . . . . . . . . . . .. . . . . . . . . . 11.7 411 1.6 3.6 6.5 -10.1 -3.8
- AXIS Credit Risk Fund (G) . . . . . . . . . . . . . . . . . . . . . . . . . . . . . . . . . . . . . . . . . . . . . . . . .. . . . . . . . . . 16.9 724 1.7 4.9 7.8 6.7 6.5
- BOI AXA Credit Risk Fund - Regular . . . . . . . . . . . . . . . . . . . . . . . . . . . . . . .. . . . . . . . . . . . 4.3 74 1.5 8.9 10.7 -31.6 -18.0
- Franklin India Credit Risk Fund (G) (Wound up) . . . . . . .. . . . . . . . . . 21.7 621 0.0 8.8 16.5 5.5 6.4
- IDBI Credit Risk Fund (G) . . . . . . . . . . . . . . . . . . . . . . . . . . . . . . . . . . . . . . . . . . . . . . . . . .. . . . . . . . . . 13.7 42 1.4 4.6 8.3 -0.8 1.6
- IDFC Credit Risk Fund - Reg (G) . . . . . . . . . . . . . . . . . . . . . . . . . . . . . . . . . . . . . .. . . . . . . . . . 13.4 846 1.6 3.4 6.3 7.4 -
- Mahindra Manulife Dynamic Bond Yojana-Reg (G) . .. . . . . . . . . . 11.9 117 1.6 2.4 4.1 5.8 -
- PGIM India Credit Risk Fund (G) . . . . . . . . . . . . . . . . . . . . . . . . . . . . . . . . . . . . .. . . . . . . . . . 15.0 44 1.8 4.8 8.7 2.5 4.0
- Sundaram Short Term Credit Risk Fund - (G) . . . . . . . . . . . . .. . . . . . . . . . 25.7 116 1.6 - - - -
DEBT - BANKING AND PSU FUNDS
★★★★★ Kotak Banking and PSU Debt Fund (G) . . . . . . . . . . . . . . . . . . . . . . . . .. . . . . . . . . . 52.0 9818 0.8 3.1 5.9 9.2 8.0
★★★★★ Nippon India Banking & PSU Debt Fund (G) . . . . . . . . . . . . . . . .. . . . . . . . . . 16.6 6785 0.8 3.2 5.8 9.3 7.9
★★★★ AXIS Banking & PSU Debt Fund (G) . . . . . . . . . . . . . . . . . . . . . . . . . . . . . . .. . . . . 2106.6 16786 0.6 2.7 5.0 8.9 8.0
★★★★ HDFC Banking and PSU Debt Fund (G) . . . . . . . . . . . . . . . . . . . . . . . . .. . . . . . . . . . 18.4 9735 0.8 3.0 5.9 9.0 7.7
★★★ DSP Banking & Psu Debt Fund (G) . . . . . . . . . . . . . . . . . . . . . . . . . . . . . . . . .. . . . . . . . . . 19.2 3312 0.6 2.6 5.4 8.8 7.6
★★★ Edelweiss Banking & Psu Debt Fund (G) . . . . . . . . . . . . . . . . . . . . . .. . . . . . . . . . 19.8 451 0.6 3.9 6.8 10.8 8.7
★★★ Franklin India Banking & PSU Debt Fund (G) . . . . . . . . . . . . . .. . . . . . . . . . 18.0 844 0.5 3.0 5.6 9.1 7.8
★★★ ICICI Pru Banking & PSU Debt Fund - Regular (G) . . . .. . . . . . . . . . 25.8 14152 0.8 3.5 6.2 8.4 7.5
★★★ IDFC Banking & PSU Debt Fund (G) . . . . . . . . . . . . . . . . . . . . . . . . . . . . . . .. . . . . . . . . . 19.7 19284 0.6 2.8 5.3 9.7 7.9
★★ L&T Banking and PSU Debt Fund (G) . . . . . . . . . . . . . . . . . . . . . . . . . . . .. . . . . . . . . . 19.9 5164 0.6 2.6 5.4 8.3 7.5
★ Invesco India Banking & PSU Debt Fund (G) . . . . . . . . . . . . . . .. . . . . 1857.4 392 0.7 2.8 5.2 8.1 7.3
★ UTI-Banking & PSU Debt Fund (G) . . . . . . . . . . . . . . . . . . . . . . . . . . . . . . . . .. . . . . . . . . . 16.5 227 0.3 2.1 4.1 4.2 5.3
- Aditya Birla SL Banking&PSU Debt Fund - (G) . . . . . . . . . . .. . . . . . . . 291.8 18125 0.7 2.9 5.9 9.0 7.8
BL Rating Scheme Name
Trailing Returns (%)Latest
NAV(₹�)
Latest
Corpus (₹� Cr)
Expense
Ratio(%)
YTDAbsolute
1 YearCAGR
3 YearCAGR
5 YearCAGR
BL Rating Scheme Name
Trailing Returns (%)Latest
NAV(₹�)
Latest
Corpus (₹� Cr)
Expense
Ratio(%)
YTDAbsolute
1 YearCAGR
3 YearCAGR
5 YearCAGR
BL Rating Scheme Name
Trailing Returns (%)Latest
NAV(₹�)
Latest
Corpus (₹� Cr)
Expense
Ratio(%)
YTDAbsolute
1 YearCAGR
3 YearCAGR
5 YearCAGR
CMYK
MUMBAI
BusinessLine 11SUNDAY • SEPTEMBER 19 • 2021 STAR TRACK MF RATINGS
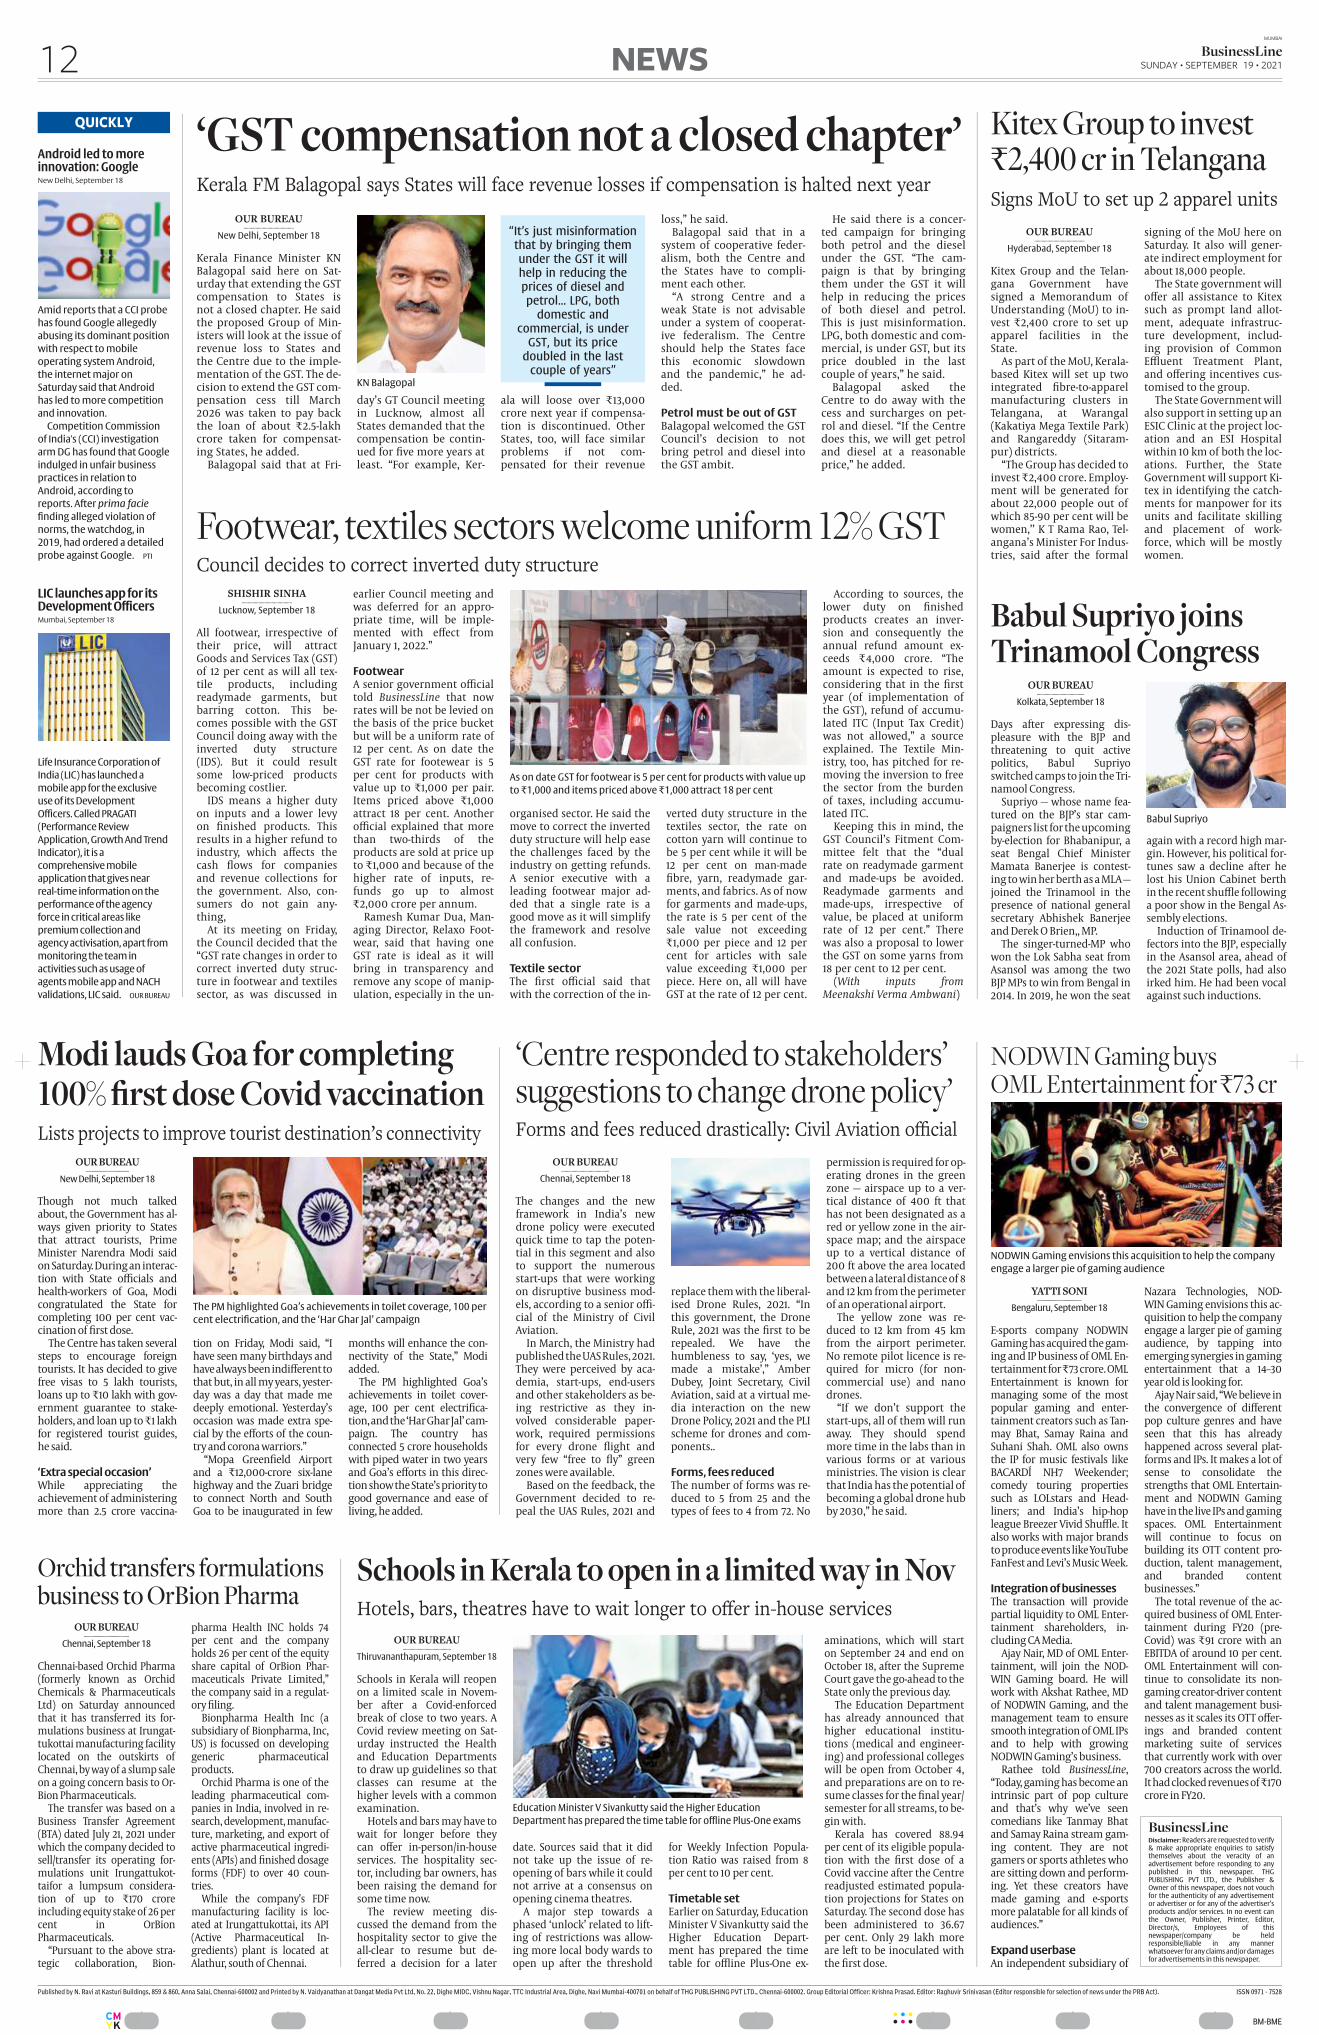
................BM-BME
Published by N. Ravi at Kasturi Buildings, 859 & 860, Anna Salai, Chennai-600002 and Printed by N. Vaidyanathan at Dangat Media Pvt Ltd, No. 22, Dighe MIDC, Vishnu Nagar, TTC Industrial Area, Dighe, Navi Mumbai-400701 on behalf of THG PUBLISHING PVT LTD., Chennai-600002. Group Editorial Officer: Krishna Prasad. Editor: Raghuvir Srinivasan (Editor responsible for selection of news under the PRB Act). ISSN 0971 - 7528
Android led to moreinnovation: Google New Delhi, September 18
Amid reports that a CCI probe
has found Google allegedly
abusing its dominant position
with respect to mobile
operating system Android,
the internet major on
Saturday said that Android
has led to more competition
and innovation.
Competition Commission
of India's (CCI) investigation
arm DG has found that Google
indulged in unfair business
practices in relation to
Android, according to
reports. After prima facie
fi�nding alleged violation of
norms, the watchdog, in
2019, had ordered a detailed
probe against Google. PTI
QUICKLY
LIC launches app for itsDevelopment Officers Mumbai, September 18
Life Insurance Corporation of
India (LIC) has launched a
mobile app for the exclusive
use of its Development
Officers. Called PRAGATI
(Performance Review
Application, Growth And Trend
Indicator), it is a
comprehensive mobile
application that gives near
realtime information on the
performance of the agency
force in critical areas like
premium collection and
agency activisation, apart from
monitoring the team in
activities such as usage of
agents mobile app and NACH
validations, LIC said. OUR BUREAU
OUR BUREAU ..........................................
New Delhi, September 18
Kerala Finance Minister KNBalagopal said here on Saturday that extending the GSTcompensation to States isnot a closed chapter. He saidthe proposed Group of Ministers will look at the issue ofrevenue loss to States andthe Centre due to the implementation of the GST. The decision to extend the GST compensation cess till March2026 was taken to pay backthe loan of about ₹�2.5lakhcrore taken for compensating States, he added.
Balagopal said that at Fri
ala will loose over ₹�13,000crore next year if compensation is discontinued. OtherStates, too, will face similarproblems if not compensated for their revenue
loss,” he said.Balagopal said that in a
system of cooperative federalism, both the Centre andthe States have to compliment each other.
“A strong Centre and aweak State is not advisableunder a system of cooperative federalism. The Centreshould help the States facethis economic slowdownand the pandemic,” he added.
Petrol must be out of GST Balagopal welcomed the GSTCouncil’s decision to notbring petrol and diesel intothe GST ambit.
He said there is a concerted campaign for bringingboth petrol and the dieselunder the GST. “The campaign is that by bringingthem under the GST it willhelp in reducing the pricesof both diesel and petrol.This is just misinformation.LPG, both domestic and commercial, is under GST, but itsprice doubled in the lastcouple of years,” he said.
Balagopal asked theCentre to do away with thecess and surcharges on petrol and diesel. “If the Centredoes this, we will get petroland diesel at a reasonableprice,” he added.
‘GST compensation not a closed chapter’ Kerala FM Balagopal says States will face revenue losses if compensation is halted next year
“It’s just misinformationthat by bringing themunder the GST it willhelp in reducing theprices of diesel andpetrol... LPG, both
domestic andcommercial, is under
GST, but its pricedoubled in the last
couple of years”
day’s GT Council meetingin Lucknow, almost allStates demanded that thecompensation be continued for fi�ve more years atleast. “For example, Ker
KN Balagopal
SHISHIR SINHA ..........................................
Lucknow, September 18
All footwear, irrespective oftheir price, will attractGoods and Services Tax (GST)of 12 per cent as will all textile products, includingreadymade garments, butbarring cotton. This becomes possible with the GSTCouncil doing away with theinverted duty structure(IDS). But it could resultsome lowpriced productsbecoming costlier.
IDS means a higher dutyon inputs and a lower levyon fi�nished products. Thisresults in a higher refund toindustry, which aff�ects thecash fl�ows for companiesand revenue collections forthe government. Also, consumers do not gain anything,
At its meeting on Friday,the Council decided that the“GST rate changes in order tocorrect inverted duty structure in footwear and textilessector, as was discussed in
earlier Council meeting andwas deferred for an appropriate time, will be implemented with eff�ect fromJanuary 1, 2022.”
FootwearA senior government offi�cialtold BusinessLine that nowrates will be not be levied onthe basis of the price bucketbut will be a uniform rate of12 per cent. As on date theGST rate for footewear is 5per cent for products withvalue up to ₹�1,000 per pair.Items priced above ₹�1,000attract 18 per cent. Anotheroffi�cial explained that morethan twothirds of theproducts are sold at price upto ₹�1,000 and because of thehigher rate of inputs, refunds go up to almost₹�2,000 crore per annum.
Ramesh Kumar Dua, Managing Director, Relaxo Footwear, said that having oneGST rate is ideal as it willbring in transparency andremove any scope of manipulation, especially in the un
organised sector. He said themove to correct the invertedduty structure will help easethe challenges faced by theindustry on getting refunds.A senior executive with aleading footwear major added that a single rate is agood move as it will simplifythe framework and resolveall confusion.
Textile sectorThe fi�rst offi�cial said thatwith the correction of the in
verted duty structure in thetextiles sector, the rate oncotton yarn will continue tobe 5 per cent while it will be12 per cent on manmadefi�bre, yarn, readymade garments, and fabrics. As of nowfor garments and madeups,the rate is 5 per cent of thesale value not exceeding₹�1,000 per piece and 12 percent for articles with salevalue exceeding ₹�1,000 perpiece. Here on, all will haveGST at the rate of 12 per cent.
According to sources, thelower duty on fi�nishedproducts creates an inversion and consequently theannual refund amount exceeds ₹�4,000 crore. “Theamount is expected to rise,considering that in the fi�rstyear (of implementation ofthe GST), refund of accumulated ITC (Input Tax Credit)was not allowed,” a sourceexplained. The Textile Ministry, too, has pitched for removing the inversion to freethe sector from the burdenof taxes, including accumulated ITC.
Keeping this in mind, theGST Council’s Fitment Committee felt that the “dualrate on readymade garmentand madeups be avoided.Readymade garments andmadeups, irrespective ofvalue, be placed at uniformrate of 12 per cent.” Therewas also a proposal to lowerthe GST on some yarns from18 per cent to 12 per cent.
(With inputs fromMeenakshi Verma Ambwani)
Footwear, textiles sectors welcome uniform 12% GST Council decides to correct inverted duty structure
As on date GST for footwear is 5 per cent for products with value up
to ₹�1,000 and items priced above ₹�1,000 attract 18 per cent
OUR BUREAU ..........................................
Chennai, September 18
The changes and the newframework in India’s newdrone policy were executedquick time to tap the potential in this segment and alsoto support the numerousstartups that were workingon disruptive business models, according to a senior offi�cial of the Ministry of CivilAviation.
In March, the Ministry hadpublished the UAS Rules, 2021.They were perceived by academia, startups, endusersand other stakeholders as being restrictive as they involved considerable paperwork, required permissionsfor every drone fl�ight andvery few “free to fl�y” greenzones were available.
Based on the feedback, theGovernment decided to repeal the UAS Rules, 2021 and
replace them with the liberalised Drone Rules, 2021. “Inthis government, the DroneRule, 2021 was the fi�rst to berepealed. We have thehumbleness to say, ‘yes, wemade a mistake’,” AmberDubey, Joint Secretary, CivilAviation, said at a virtual media interaction on the newDrone Policy, 2021 and the PLIscheme for drones and components..
Forms, fees reducedThe number of forms was reduced to 5 from 25 and thetypes of fees to 4 from 72. No
permission is required for operating drones in the greenzone — airspace up to a vertical distance of 400 ft thathas not been designated as ared or yellow zone in the airspace map; and the airspaceup to a vertical distance of200 ft above the area locatedbetween a lateral distance of 8and 12 km from the perimeterof an operational airport.
The yellow zone was reduced to 12 km from 45 kmfrom the airport perimeter.No remote pilot licence is required for micro (for noncommercial use) and nanodrones.
“If we don’t support thestartups, all of them will runaway. They should spendmore time in the labs than invarious forms or at variousministries. The vision is clearthat India has the potential ofbecoming a global drone hubby 2030,” he said.
‘Centre responded to stakeholders’suggestions to change drone policy’ Forms and fees reduced drastically: Civil Aviation offi�cial
OUR BUREAU..........................................
Kolkata, September 18
Days after expressing displeasure with the BJP andthreatening to quit activepolitics, Babul Supriyoswitched camps to join the Trinamool Congress.
Supriyo — whose name featured on the BJP’s star campaigners list for the upcomingbyelection for Bhabanipur, aseat Bengal Chief MinisterMamata Banerjee is contesting to win her berth as a MLA —joined the Trinamool in thepresence of national generalsecretary Abhishek Banerjeeand Derek O Brien,, MP.
The singerturnedMP whowon the Lok Sabha seat fromAsansol was among the twoBJP MPs to win from Bengal in2014. In 2019, he won the seat
again with a record high margin. However, his political fortunes saw a decline after helost his Union Cabinet berthin the recent shuffle followinga poor show in the Bengal Assembly elections.
Induction of Trinamool defectors into the BJP, especiallyin the Asansol area, ahead ofthe 2021 State polls, had alsoirked him. He had been vocalagainst such inductions.
Babul Supriyo joinsTrinamool Congress
Babul Supriyo
YATTI SONI..........................................
Bengaluru, September 18
Esports company NODWINGaming has acquired the gaming and IP business of OML Entertainment for ₹�73 crore. OMLEntertainment is known formanaging some of the mostpopular gaming and entertainment creators such as Tanmay Bhat, Samay Raina andSuhani Shah. OML also ownsthe IP for music festivals likeBACARDÍ NH7 Weekender;comedy touring propertiessuch as LOLstars and Headliners; and India’s hiphopleague Breezer Vivid Shuffle. Italso works with major brandsto produce events like YouTubeFanFest and Levi’s Music Week.
Integration of businessesThe transaction will providepartial liquidity to OML Entertainment shareholders, including CA Media.
Ajay Nair, MD of OML Entertainment, will join the NODWIN Gaming board. He willwork with Akshat Rathee, MDof NODWIN Gaming, and themanagement team to ensuresmooth integration of OML IPsand to help with growingNODWIN Gaming’s business.
Rathee told BusinessLine,“Today, gaming has become anintrinsic part of pop cultureand that’s why we’ve seencomedians like Tanmay Bhatand Samay Raina stream gaming content. They are notgamers or sports athletes whoare sitting down and performing. Yet these creators havemade gaming and esportsmore palatable for all kinds ofaudiences.”
Expand userbaseAn independent subsidiary of
Nazara Technologies, NODWIN Gaming envisions this acquisition to help the companyengage a larger pie of gamingaudience, by tapping intoemerging synergies in gamingentertainment that a 14–30year old is looking for.
Ajay Nair said, “We believe inthe convergence of diff�erentpop culture genres and haveseen that this has alreadyhappened across several platforms and IPs. It makes a lot ofsense to consolidate thestrengths that OML Entertainment and NODWIN Gaminghave in the live IPs and gamingspaces. OML Entertainmentwill continue to focus onbuilding its OTT content production, talent management,and branded contentbusinesses.”
The total revenue of the acquired business of OML Entertainment during FY20 (preCovid) was ₹�91 crore with anEBITDA of around 10 per cent.OML Entertainment will continue to consolidate its nongaming creatordriver contentand talent management businesses as it scales its OTT off�erings and branded contentmarketing suite of servicesthat currently work with over700 creators across the world.It had clocked revenues of ₹�170crore in FY20.
NODWIN Gaming buys OML Entertainment for ₹�73 cr
NODWIN Gaming envisions this acquisition to help the company
engage a larger pie of gaming audience
BusinessLineDisclaimer: Readers are requested to verify& make appropriate enquiries to satisfythemselves about the veracity of anadvertisement before responding to anypublished in this newspaper. THGPUBLISHING PVT LTD., the Publisher &Owner of this newspaper, does not vouchfor the authenticity of any advertisementor advertiser or for any of the advertiser’sproducts and/or services. In no event canthe Owner, Publisher, Printer, Editor,Director/s, Employees of thisnewspaper/company be heldresponsible/liable in any mannerwhatsoever for any claims and/or damagesfor advertisements in this newspaper.
CMYK
MUMBAI
BusinessLine12 SUNDAY • SEPTEMBER 19 • 2021NEWS
OUR BUREAU..........................................
Hyderabad, September 18
Kitex Group and the Telangana Government havesigned a Memorandum ofUnderstanding (MoU) to invest ₹�2,400 crore to set upapparel facilities in theState.
As part of the MoU, Keralabased Kitex will set up twointegrated fi�bretoapparelmanufacturing clusters inTelangana, at Warangal(Kakatiya Mega Textile Park)and Rangareddy (Sitarampur) districts.
“The Group has decided toinvest ₹�2,400 crore. Employment will be generated forabout 22,000 people out ofwhich 8590 per cent will bewomen,’’ K T Rama Rao, Telangana’s Minister For Industries, said after the formal
signing of the MoU here onSaturday. It also will generate indirect employment forabout 18,000 people.
The State government willoff�er all assistance to Kitexsuch as prompt land allotment, adequate infrastructure development, including provision of CommonEffluent Treatment Plant,and off�ering incentives customised to the group.
The State Government willalso support in setting up anESIC Clinic at the project location and an ESI Hospitalwithin 10 km of both the locations. Further, the StateGovernment will support Kitex in identifying the catchments for manpower for itsunits and facilitate skillingand placement of workforce, which will be mostlywomen.
Signs MoU to set up 2 apparel units
Kitex Group to invest₹�2,400 cr in Telangana
OUR BUREAU ..........................................
New Delhi, September 18
Though not much talkedabout, the Government has always given priority to Statesthat attract tourists, PrimeMinister Narendra Modi saidon Saturday. During an interaction with State offi�cials andhealthworkers of Goa, Modicongratulated the State forcompleting 100 per cent vaccination of fi�rst dose.
The Centre has taken severalsteps to encourage foreigntourists. It has decided to givefree visas to 5 lakh tourists,loans up to ₹�10 lakh with government guarantee to stakeholders, and loan up to ₹�1 lakhfor registered tourist guides,he said.
‘Extra special occasion’While appreciating theachievement of administeringmore than 2.5 crore vaccina
tion on Friday, Modi said, “Ihave seen many birthdays andhave always been indiff�erent tothat but, in all my years, yesterday was a day that made medeeply emotional. Yesterday’soccasion was made extra special by the eff�orts of the country and corona warriors.”
“Mopa Greenfi�eld Airportand a ₹�12,000crore sixlanehighway and the Zuari bridgeto connect North and SouthGoa to be inaugurated in few
months will enhance the connectivity of the State,” Modiadded.
The PM highlighted Goa’sachievements in toilet coverage, 100 per cent electrifi�cation, and the ‘Har Ghar Jal’ campaign. The country hasconnected 5 crore householdswith piped water in two yearsand Goa’s eff�orts in this direction show the State’s priority togood governance and ease ofliving, he added.
Lists projects to improve tourist destination’s connectivity
The PM highlighted Goa’s achievements in toilet coverage, 100 per
cent electrifi�cation, and the ‘Har Ghar Jal’ campaign
Modi lauds Goa for completing100% first dose Covid vaccination
OUR BUREAU ..........................................
Thiruvananthapuram, September 18
Schools in Kerala will reopenon a limited scale in November after a Covidenforcedbreak of close to two years. ACovid review meeting on Saturday instructed the Healthand Education Departmentsto draw up guidelines so thatclasses can resume at thehigher levels with a commonexamination.
Hotels and bars may have towait for longer before theycan off�er inperson/inhouseservices. The hospitality sector, including bar owners, hasbeen raising the demand forsome time now.
The review meeting discussed the demand from thehospitality sector to give theallclear to resume but deferred a decision for a later
date. Sources said that it didnot take up the issue of reopening of bars while it couldnot arrive at a consensus onopening cinema theatres.
A major step towards aphased ‘unlock’ related to lifting of restrictions was allowing more local body wards toopen up after the threshold
for Weekly Infection Population Ratio was raised from 8per cent to 10 per cent.
Timetable setEarlier on Saturday, EducationMinister V Sivankutty said theHigher Education Department has prepared the timetable for offline PlusOne ex
aminations, which will starton September 24 and end onOctober 18, after the SupremeCourt gave the goahead to theState only the previous day.
The Education Departmenthas already announced thathigher educational institutions (medical and engineering) and professional collegeswill be open from October 4,and preparations are on to resume classes for the fi�nal year/semester for all streams, to begin with.
Kerala has covered 88.94per cent of its eligible population with the fi�rst dose of aCovid vaccine after the Centrereadjusted estimated population projections for States onSaturday. The second dose hasbeen administered to 36.67per cent. Only 29 lakh moreare left to be inoculated withthe fi�rst dose.
Hotels, bars, theatres have to wait longer to off�er inhouse services
Education Minister V Sivankutty said the Higher Education
Department has prepared the time table for offline PlusOne exams
Schools in Kerala to open in a limited way in Nov
OUR BUREAU..........................................
Chennai, September 18
Chennaibased Orchid Pharma(formerly known as OrchidChemicals & PharmaceuticalsLtd) on Saturday announcedthat it has transferred its formulations business at Irungattukottai manufacturing facilitylocated on the outskirts ofChennai, by way of a slump saleon a going concern basis to OrBion Pharmaceuticals.
The transfer was based on aBusiness Transfer Agreement(BTA) dated July 21, 2021 underwhich the company decided tosell/transfer its operating formulations unit Irungattukottaifor a lumpsum consideration of up to ₹�170 croreincluding equity stake of 26 percent in OrBionPharmaceuticals.
“Pursuant to the above strategic collaboration, Bion
pharma Health INC holds 74per cent and the companyholds 26 per cent of the equityshare capital of OrBion Pharmaceuticals Private Limited,”the company said in a regulatory fi�ling.
Bionpharma Health Inc (asubsidiary of Bionpharma, Inc,US) is focussed on developinggeneric pharmaceuticalproducts.
Orchid Pharma is one of theleading pharmaceutical companies in India, involved in research, development, manufacture, marketing, and export ofactive pharmaceutical ingredients (APIs) and fi�nished dosageforms (FDF) to over 40 countries.
While the company’s FDFmanufacturing facility is located at Irungattukottai, its API(Active Pharmaceutical Ingredients) plant is located atAlathur, south of Chennai.
Orchid transfers formulationsbusiness to OrBion Pharma