Identifying early adopters, enhancing learning, and the ...
44
Identifying early adopters, enhancing learning, and the diffusion of agricultural technology Kyle Emerick, Alain de Janvry, Elisabeth Sadoulet, and Manzoor H. Dar * March 11, 2016 Abstract We introduced a new seed variety to a subset of farmers across 100 rural Indian villages. Initial adopters were either identified by participatory meetings or by con- sultation with a local political figure. In addition, we randomly allocated half of the villages to receive a traditional form of agricultural extension where the variety is ex- plained in a village meeting and villagers are taken to the field to observe the crop. We find that allowing villagers to participate in the selection of early adopters reduces patronage, but has no effect on future uptake. In contrast, the farmer field days had a strong positive effect on demand. This result indicates that traditional methods of agricultural extension can be effective at enhancing learning and speeding up the diffusion of agricultural technology. JEL codes: O13, O33 * Emerick: Tufts University, 8 Upper Campus Road, Medford, MA 02155-6722 (e-mail: [email protected]); de Janvry: University of California at Berkeley, 207 Giannini Hall, Berkeley, CA 94720-3310 (e-mail:[email protected]); Sadoulet: University of California at Berkeley, 207 Giannini Hall, Berkeley, CA 94720-3310 (e-mail:[email protected]). Dar: International Rice Research Institute, New Delhi India (e-mail:[email protected]). We acknowledge financial support from the Agricultural Technology Adoption Initiative of the Bill and Melinda Gates Foundation. We are grateful to Ritadhi Chakravarti, Manaswini Rao, and Xinxin Lyu for excellent research assistance. 1
-
Upload
khangminh22 -
Category
Documents
-
view
2 -
download
0
Transcript of Identifying early adopters, enhancing learning, and the ...

Identifying early adopters, enhancing learning, and thediffusion of agricultural technology
Kyle Emerick, Alain de Janvry, Elisabeth Sadoulet, and Manzoor H. Dar∗
March 11, 2016
Abstract
We introduced a new seed variety to a subset of farmers across 100 rural Indianvillages. Initial adopters were either identified by participatory meetings or by con-sultation with a local political figure. In addition, we randomly allocated half of thevillages to receive a traditional form of agricultural extension where the variety is ex-plained in a village meeting and villagers are taken to the field to observe the crop.We find that allowing villagers to participate in the selection of early adopters reducespatronage, but has no effect on future uptake. In contrast, the farmer field days hada strong positive effect on demand. This result indicates that traditional methodsof agricultural extension can be effective at enhancing learning and speeding up thediffusion of agricultural technology.
JEL codes: O13, O33
∗Emerick: Tufts University, 8 Upper Campus Road, Medford, MA 02155-6722 (e-mail:[email protected]); de Janvry: University of California at Berkeley, 207 Giannini Hall, Berkeley, CA94720-3310 (e-mail:[email protected]); Sadoulet: University of California at Berkeley, 207 Giannini Hall,Berkeley, CA 94720-3310 (e-mail:[email protected]). Dar: International Rice Research Institute, NewDelhi India (e-mail:[email protected]). We acknowledge financial support from the Agricultural TechnologyAdoption Initiative of the Bill and Melinda Gates Foundation. We are grateful to Ritadhi Chakravarti,Manaswini Rao, and Xinxin Lyu for excellent research assistance.
1

1 Introduction
The adoption of improved technologies is an important engine of growth for smallholder
farmers in developing countries. Yet, levels of technology adoption often remain disappoint-
ingly low and information constraints are considered to be an important barrier to adoption
(Jack, 2011). Focusing on learning, there is a long list of studies showing that peers serve as
important sources of information (Foster and Rosenzweig, 1995; Bandiera and Rasul, 2006;
Conley and Udry, 2010). Building on these findings, recent work has turned to methods for
identifying initial adopters in order to maximize the spread of information across individuals
(Banerjee et al., 2014; Beaman et al., 2015). At the same time, there are few studies that
rigorously test alternative approaches to facilitating information diffusion once this group of
peer adopters has been identified.
In this paper we combine these two ideas by considering two related questions. First,
we ask whether allowing villagers to jointly determine the early adopters of an improved
seed variety results in increased future demand for that variety. Second, we ask whether
information diffusion can be further facilitated by adding a farmer field day — a traditional
method of agricultural extension where a short village meeting is followed by a visit to the
field where the new seed variety is being grown. The first question tests an alternative method
to identifying early adopters with the objective of maximizing technological diffusion.1 The
second question steps back and asks whether a more traditional — but untested — method
of agricultural extension can be effective.
Understanding the efficacy of learning-related interventions such as these is important
for policy. Low productivity in the agricultural sector is tightly associated with low levels
of aggregate productivity (Restuccia, Yang, and Zhu, 2008). At the same time, modernizing
agricultural technology is an important driver of structural transformation and hence long-
term growth (Yang and Zhu, 2013; Bustos, Caprettini, and Ponticelli, 2016). The policy
challenge that arises is how to make proven agricultural technologies diffuse faster in devel-
oping countries? Our work tests a new method for identifying early adopters and a different
method for encouraging learning once these adopters are identified.
We find that setting up village meetings to identify early adopters had small and statis-
tically insignificant effects on future demand. In contrast, simple farmer field days increased
adoption of the improved seed variety by approximately 40 percent. These findings were
generated by a two-step randomized experiment in the Indian state of Odisha. In the first
1Beaman et al. (2015) show that a network model of diffusion can reliably identify injection points andincrease adoption of pit planting for Maize in Malawi. BenYishay and Mobarak (2015) show that adoptionthe same technique is larger when both more representative “peer farmers” are selected and compensatedfor diffusing information.
2

step we introduced 25 kilograms of a new high-yielding and flood-tolerant rice variety called
Swarna-Sub1 in 100 villages. Importantly, the technology has been shown to dominate
existing technology, indicating that it should diffuse rapidly in the absence of barriers to
adoption.2 Each village was randomly allocated to one of three different methods for intro-
ducing the variety. In one third of the villages we used the status-quo approach of delivering
the seeds to locally-elected village officials — ward members in the Gram Panchayat — who
then chose how to further distribute the seeds amongst villagers.3 In another third of the
villages we used a participatory meeting where villagers were invited to jointly determine
how the seeds should be allocated. Finally, we used village meetings with local women’s
groups (Self Help Groups or SHG’s) in the remaining villages.
In the second level of randomization our partner NGO carried out farmer field days in 50
villages. These field days occurred approximately four months after the seeds were introduced
and while the crops of the initial beneficiaries were approaching time for harvest. The field
days were simple two hour events where the variety was described, initial beneficiaries spoke
about their experience, questions were answered, and then attendees were taken to the fields
of initial beneficiaries if possible.
We then offered the new variety for sale after harvest and immediately prior to planting
for the next growing season. Our survey teams went door-to-door and asked a random sample
of 15 households per village whether they were interested in buying seeds. Importantly, we
fixed the price to be near the prevailing market price of the variety.4 Therefore, offering seeds
directly to farmers in this way allows us to measure demand in an environment without either
supply constraints or high subsidies.
This design allows us to measure three parameters. First, we measure whether identifying
early adopters in consultation with villagers leads to greater future diffusion. This approach
could dominate the use of locally-elected officials if villagers as a whole are better able to
compile information on who is most suitable to demonstrate the new variety.5 Second, we
2The variety was released in 2009. It offers flood tolerance without reducing yield during non-flood years(Dar et al., 2013). The technology also leads to significant welfare gains by inducing farmers to modernizeproduction (Emerick et al., 2016)
3The minikit is a popular seed dissemination approach in South Asia. India’s National Food SecurityMission program uses minikits and relies on members of the Gram Panchayat to help identify beneficiaries.
4The new variety was not yet available at the government block offices where most farmers purchasesubsidized seeds. One other large NGO in the area was selling seeds of this variety at prices higher thangovernment subsidized prices.
5Participatory community meetings have been shown to improve targeting of anti-poverty program inIndonesia (Alatas et al., 2012). One possible explanation of this finding is that community meetings aggregatemore information on who is poor relative to other approaches. Other studies have considered an oppositeapproach where welfare programs are targeted using local elites (Basurto, Dupas, and Robinson, 2015).This approach could be superior if local elites possess better information. Our use of meetings to identifyinjection points is based on a similar idea that villagers may be able to better aggregate information on the
3

measure the efficacy of farmer field days under the status quo environment where farmers
can only learn from early adopters identified by local political figures. Third, we measure
whether farmer field days are any more or less effective under the alternative mechanism
where early adopters are identified with village meetings.
We have four main results. First, we show that both forms of village meetings reduce
patronage. The initial recipients of the technology are 31 percent and 62 percent less likely
to be close family or friends of the ward member in village meeting and SHG meeting
villages, respectively. In addition, 11 percent of recipients in ward member villages are
elected representatives (including the ward member him or herself). These percentages fall
to 5 percent and 3.2 percent in village meeting and SHG meeting villages, respectively.
Thus, the first intervention of changing the method of identifying initial adopters of new
seed varieties did succeed in reducing patronage and increasing adoption by farmers less
connected to political figures.
Second, we show that despite reducing patronage, identifying early adopters with meet-
ings does not lead to increases in future demand. Differences in adoption between ward
member, SHG meeting, and village meeting villages are small and statistically insignificant.
Our estimated standard errors allow us to reject increases in adoption of around 33 percent.
The data therefore indicate that using village meetings to identify the first generation of
adopters of a new technology does not strongly increase future demand. In addition, the
results suggest that the consequences of patronage in terms of future technological diffusion
are minimal in this context.
Third, we estimate strong effects of farmer field days on demand. Adoption increased by
around 12 percentage points from 30 to 42 percent in villages where farmer field days took
place. This effect is concentrated more heavily on adoption of a single seed package. We
find that purchases of one 5 kilogram packet rose by 59 percent, while purchases of two or
more packages rose by only 25 percent.6 In addition, we show that the effect of field days on
demand is the largest for the poorer farmers in the village. More specifically, the effects of
farmer field days on buying a single package of seeds is significantly larger for farmers that
are in lower caste groups and farmers that are below the poverty line (BPL) as defined by
the government’s well-known entitlement program.
Fourth, we show that the effects of field days on demand are no larger in villages where
initial adopters were selected with meetings. If anything, the effects of farmer field days
on demand are largest in ward member villages. However, the differences in the effect of
best farmers to demonstrate a new technology.6Almost all farmers that purchased seeds bought only one or two packages. This amount of seeds is
enough to cultivate around 10-30 percent of their land.
4

field days across the three methods of introducing the seeds are not statistically significant.
Nonetheless, we can rule out that field days are more effective when meetings are used to
determine the first adopters in the village. In other words, the field day is effective regardless
of the identities of the farmers cultivating the new variety.
One immediate possible explanation of our finding is that farmer field days are effective
because they simply generate demand by farmers that do not interact with early adopters
and thus otherwise would not have had the opportunity to learn about the variety.7 The
data are generally inconsistent with this explanation. Using either common surnames or
geographic distance as measures of connectedness, we show that the effect of field days is
no larger for farmers that are less connected to the first-year recipients. Focusing on the
SHG villages only, we find that if anything, field days only have an effect on demand for
SHG member households and households that are friends or family of the president of the
SHG. These results suggest that field days either convey additional information or re-enforce
existing knowledge about the variety.
Taken together, our results imply that relying on early adopters to automatically transmit
information on new technologies may not maximize short-term adoption. Further, allowing
the village as a whole to aggregate information for identifying injection points does not
change this finding. Instead, further intervention can make learning via networks more
effective. In our context, adding a traditional approach of agricultural extension appears
to be a cost effective way of increasing technology adoption by smallholder farmers. In
addition, the approach leads to a more equitable distribution of improved technology by
inducing adoption by the poorest farmers.
Our paper is most closely related to the literature on learning in developing country
agriculture. Numerous studies have established the importance of peers as a source of in-
formation about new agricultural technology.8 Building on this, recent work has sought to
improve methods of selecting entry points of new technology (Beaman et al., 2015). How-
ever, farmers may not transmit information automatically if it is costly to do so. In this
context, BenYishay and Mobarak (2015) show that compensating early adopters for trans-
mitting information can be effective at increasing future adoption. Our work tests both a
different and scalable method for identifying injection points as well as another approach to
improving learning outcomes conditional on the identities of these injection points. Thus,
7As shown by Golub and Jackson (2012), diffusion of information between individuals is limited bycertain network structures where individuals only interact with people that have similar characteristics.Alatas et al. (2015) show empirically that community-based targeting of anti-poverty programs in Indonesiais more effective when network structures are more dense.
8Conley and Udry (2010) is the leading example where peers are shown to be an important source ofinformation about pineapple cultivation in Ghana.
5

we consider our experiment to be more of a hybrid approach where local farmers are relied
upon for peer influence and demonstration, but a traditional extension technique is also used
to further enhance learning.
There is a widespread view that the traditional system of agricultural extension is mas-
sive in scale, but underperforming (Anderson and Feder, 2007). However, we possess less
information about whether this is due to various competing explanations such as inadequate
incentives for extension workers, ineffective methods, or lack of accountability. We focus on
method and show that a traditional extension method can be effective when combined with
demonstration of new technology by varying types of farmers.
The most recent literature on information-sharing in agriculture has focused on the im-
portance of mobile phones for spreading information about farming (Aker, 2011; Fafchamps
and Minten, 2012; Cole and Fernando, 2014). While these studies tend to find positive im-
pacts of mobile-phone-based extension, we are not aware of a rigorous evaluation of engaging
adopters with non-adopters via field days. The closest empirical studies focus on field schools
which are distinct because they are usually carried out over multiple days, provide general
information about agriculture rather than details about a specific technology, and don’t
engage peer adopters as a source of learning. In addition, these studies have relied on obser-
vational data and non-experimental methods such as matching (Godtland et al., 2004; Davis
et al., 2012). Our paper instead uses an experiment to address whether a relatively simpler
approach to diffusing information can increase the adoption rate of a profitable agricultural
technology.
The rest of this paper is organized as follows. In section 2 we give further background
on the technology that we use in the study. We focus on why the particular technology is
suitable for our study. We also walk through the conceptual motivation for our experiment.
Section 3 discusses the experimental design and some basic characteristics of the population
we study. Section 4 discusses our main results. Finally, section 5 offers concluding remarks.
2 Background and conceptual framework
In this section we start by giving more details on the specific technology used in the ex-
periment. We focus on its key benefits and how they make it a worthwhile technology for
studying diffusion. We then discuss the conceptual reasoning behind the interventions that
we chose for the experiment.
6

2.1 Details about technology
Swarna-Sub1 — the rice variety introduced as part of the experiment — offers flood tolerance
as its key benefit. Swarna-Sub1 is otherwise similar to Swarna, which is a popular type of
rice cultivated throughout eastern India and Bangladesh. The technology was developed
by moving a group of flood tolerance genes from a traditional rice landrace to the popular
variety Swarna.9 Plant breeders were able to rely on modern breeding techniques to create
the improved variety without introducing other undesirable characteristics (Xu et al., 2006).
This is important because it guarantees that the technology offers added benefit without any
obvious disadvantages such as lower yields during normal years.
Previous randomized experiments have conferred two channels through which this new
variety improves farmer welfare. First, the variety does improve output under flooding
without compromising output when there is no flooding (Dar et al., 2013). Second, Swarna-
Sub1 induces farmers to invest more in inputs such as planting methodology and fertilizer
at planting. These effects likely arise due to the risk-reducing property of the technology
(Emerick et al., 2016). As a result, the new variety improves outcomes even in years when
flooding does not occur.
The technology is appropriate for our purposes because it offers benefits in one state
without affecting outcomes in the other state. The technology therefore dominates existing
technology and should diffuse rapidly in a perfect environment with no information barriers or
supply constraints. This dominance makes it a worthwhile technology for studying different
mechanisms to encourage diffusion. Most importantly, we can be confident that adoption is
the appropriate outcome variable because there are no groups in the population for which
adoption is strictly unprofitable.
2.2 Conceptual motivation
The first arm of our experiment considers a new alternative for identifying early adopters
of agricultural technology. We consider a planner who has the objective of maximizing
the adoption rate of a profitable new technology. The initial supply of seed is scarce and
therefore the planner must allocate the initial supply in a way that facilitates the spread of
information and maximizes future demand once additional supply becomes available. This
setup is similar to the way new seeds are often introduced in practice. The Indian government
uses a system of demonstrations and minikits and has to choose the initial beneficiaries as
part of this process. Locally elected members of the gram panchayat are the main source
9The biological mechanism is that Swarna-Sub1 suppresses the plant’s natural response of elongationduring flooding. This allows the plant to retain the necessary carbohydrates for regeneration after theflooding is over (Voesenek and Bailey-Serres, 2009).
7

of information for identifying these beneficiaries. Using local elites may offer advantages.
Basurto, Dupas, and Robinson (2015) show that chiefs in Malawi account for productivity
differences when allocating subsidized inputs to villagers. If the batch of recipients identified
by local elites is more productive, then this could have positive effects for future diffusion.
Beaman et al. (2015) assume that the planner knows the structure of the social network
and therefore can identify the most suitable entry points based on a network model of
information diffusion. Their main finding is that using the theory in this way can identify
injection points that lead to increased diffusion relative to those identified by government
extension workers or geospatial data alone. Thus, the planner can make diffusion more rapid
if her information set includes these detailed network data.
Banerjee et al. (2014) propose a different method of simply asking villagers the identity
of the best person for spreading information in the village. They show a strong correlation
between the individuals identified and their diffusion centrality — a theoretical measure of
importance for diffusion outlined in Banerjee et al. (2013). This work suggests that the
planner may be able to rely on villagers themselves to identify the best entry points.
We borrow from the literature on targeting of poverty programs to pose village meetings
as an alternative for identifying suitable entry points of new technology. The basic reasoning
underlying this approach is that villagers possess private information that is unobservable to
the planner on who are the best farmers for demonstrating a new technology. The literature
on targeting of anti-poverty programs has found that villagers possess information on poverty
status that is otherwise unobservable to a principal (Alatas et al., 2012). In addition, village
meetings showed to be a reliable way of getting villagers to reveal this information. Turning
back to agricultural technology, peers are a common source of information about new seeds
and there is likely variation across farmers in not only network centrality but in quality of
demonstrating new varieties. As an example, a small farmer with limited access to fertilizer
would not be suitable for demonstrating a new seed variety requiring large amounts of
fertilizer. We investigate whether village meetings can identify the most suitable farmers for
demonstration and diffusion of information in order to maximize future adoption.
From a policy perspective, scalability is an additional benefit of testing this approach.
The advantage of using a village meeting is that it eliminates the need to survey households
to either directly identify entry points or to collect data on their network connections. If
the approach works then it would offer a more scalable alternative to other potentially more
costly methods.
We chose not to stop at investigating these alternative injection mechanisms because it is
unclear whether information will diffuse alone or whether further intervention can enhance
social learning. BenYishay and Mobarak (2015) show that spreading information may be
8

costly and thus incentivizing farmers to disseminate information has positive impacts on
future adoption. In our context the initial seed recipients do not have direct incentives to
spread information to other farmers regarding Swarna-Sub1. However, seed systems in rural
India are generally based on informal networks and farmers will provide information — or
seeds directly — if approached by other farmers. The more relevant cost in our context is
likely to be a cost of obtaining information rather than a cost of providing it.
Farmer field days were built into our experimental design as a way of reducing some
of these barriers to information flow. There are two mechanisms through which this could
be achieved. First, field days could overcome the deficiencies that arise in network-based
learning due to network structure alone. Put differently, some farmers may not have the
opportunity to learn about a new technology because would otherwise never talk to early
adopters. In this case field days would increase adoption by allowing information to flow to
these least connected individuals. Certain network structures where connections are sparse
or concentrated between similar individuals have been shown to prohibit learning (Golub and
Jackson, 2012; Alatas et al., 2015). Second, field days could provide additional information
that would not spread in networks. Or, field days could make existing knowledge more
precise by aggregating the experiences of several adopters, rather than just a single adopter
sharing a connection with a given non-adopting farmer. One example would be a farmer that
learns about the new variety from a peer and thus possesses some signal of its effectiveness
on her land. In this case the field day would aggregate the experiences of other adopters
that this farmer would not have otherwise interacted with. This additional information gives
more data to the farmer for deciding whether the adopt the technology herself. We attempt
to decompose these two explanations at the end of our analysis that follows.
3 Details of the experimental design
In this section we give specific details on the experimental design. We give more information
on how the treatments were carried out and the timing of data collection. We also describe
some basic summary statistics as well as randomization balance.
Our experiment took place in 100 villages in Balasore — the northernmost district in the
state of Odisha. The experimental villages are located in three blocks — an administrative
unit two levels above villages — where our partner NGO frequently works. We randomly
selected these villages from the subset of villages that were affected by flooding for at least 2
days in 2011 or 2013. We used satellite images of flooding during these years to classify which
villages were affected. Our sample is focused on flood-prone areas to ensure that adoption
of Swarna-Sub1 is a profitable outcome and therefore diffusion is important to study. We
9

next describe the timing of events, which we also display graphically in Figure 1.
We administered a baseline survey to 10 farmers in each village prior to carrying out any
activities in the village.10 Enumerators first visited a local village leader and identified the
names of 10 villagers that cultivate land in flood-affected areas. These farmers were then
administered with a short survey. The baseline included basic demographics, information
on assets, and detailed information on rice production — including usage of rice varieties
and production at the plot level. Swarna-Sub1 was entirely new at the time of the baseline
survey: only two farmers that were surveyed at baseline had cultivated Swarna-Sub1 during
the previous season in 2013.
Shortly after completion of the baseline in May 2014, enumerators from our partner NGO
returned to each village to distribute seeds of the new rice variety. Each village was provided
with 25 kilograms of seed. This amount of seed is sufficient to cultivate one to two acres in
total. But more importantly, the seeds were already packaged into five kilogram packages
to encourage that at least five farmers be selected as adopters. A five kilogram package
contains enough seed for sowing around 0.3 acres, or around 10 percent of the average
farmer’s landholdings.
Villages were randomly assigned to one of three methods for identifying beneficiaries.
The seeds were delivered to the locally elected village ward member in 33 villages. The
ward member is elected to represent the village in the local Gram Panchayat, or the next
administrative unit above villages. A representative from our partner NGO delivered the
seeds directly to the ward member and informed them that the NGO was giving the seeds
to the village. The enumerator then asked the ward member to identify the most suitable
cultivators of the new seeds. In all cases the seeds were left to the ward member and she
independently decided about their further distribution, including whether to keep some for
herself. This approach simulates the common approach of both government and NGO’s of
using local political figures to distribute seed minikits, as in Bardhan and Mookherjee (2006,
2011).
We used two types of village meetings to identify recipients in the remaining villages.
In 34 meeting villages NGO staff first visited the village and informed as many villagers as
possible that they were carrying out a short meeting to describe a new flood-tolerant rice
variety. Enumerators were specifically instructed to put the seed minikits at the front of the
meeting and describe the benefits of the new variety relative to Swarna — the parent variety
that is familiar to all farmers. Importantly, enumerators instructed villagers to jointly decide
on who would be best to cultivate the variety. In all cases villagers were able to come to
an agreement and all 25 kilograms of seed were distributed to farmers that were willing to
10Enumerators were unable to carry out the baseline survey in one of the 100 villages.
10

plant. We used a process that was nearly identical to this in the remaining 33 villages. The
only difference was that only Self Help Group (SHG) members were invited to the meeting.
This approach makes the meeting inclusive of entirely women.
Enumerators returned to all villages in September 2014 to survey all of the minikit recip-
ients, whom we refer to as early adopters. This short survey had two main purposes. First,
the survey allows us to compare characteristics of early adopters across the three different
treatment arms. These characteristics include household assets or wealth, landholdings, and
most importantly the relationship between the seed recipient and the ward member. Second,
we collected information on how much area was planted with Swarna-Sub1, the current sta-
tus of the crop, and the GPS boundaries for the plots of farmers that actually transplanted
the seedlings.11 Overall, we have plot locations for 452 (67 percent) of the farmers that
received seeds.
Farmer field days were then carried out in 50 randomly selected villages during the
month of November 2014. The field days were purposefully timed to take place slightly
before harvest when the adopters had built some experience with the technology but while
the crop was still in the ground for demonstration. The field days were short. Staff from
our partner NGO again described Swarna-Sub1 and its properties, spoke about seed quality
and how to distinguish quality seeds, and then gave the first-year adopters an opportunity
to discuss their experience with the technology. The meetings were fairly well attended:
an average of 41 farmers — or 59 percent of rice-farming households — attended the field
days. Table A1 shows that basic household characteristics in general do not strongly predict
attendance of the field days. The meetings appear to have been attended by a broad group
of villagers and not just the wealthiest or most elite farmers.
We then carried out a survey with approximately 15 farmers in each village in order
to measure knowledge about Swarna-Sub1. We refer to this group as the non-adopting
farmers, i.e. those that were not in the group of early adopters. The surveys took place
during February to March 2015. We used the list of households from the 2002 Below the
Poverty Line (BPL) census to randomly select households.12 We removed the early adopters
before randomly selecting the households. Each respondent was asked several questions to
measure their knowledge of Swarna-Sub1. These included whether they knew about it at all,
knowledge of its main benefit, which areas are suitable for cultivation, the duration (time
from planting to harvest), and a question on how the current adopters received seeds. We use
these information to estimate the degree to which knowledge of these basic characteristics
11Some farmers were affected by flooding during the nursery stage before seedlings had been transplantedin the main field. No rice variety is tolerant to submergence at this stage. As a result, 29 percent of farmerslost their seedlings and were unable to plant the crop in the main field.
12We selected all households in the villages where there were fewer than 15 non-adopting households.
11

was affected by the different treatment arms in our experiment.
Our NGO sent a new team of staff members to each village in May 2015. Each farmer
that was surveyed in February-March was visited and given the opportunity to purchase
Swarna-Sub1 seeds. There was only one other NGO selling Swarna-Sub1 to farmers for a
price of around 20 rupees. Our price was set to 20 rupees in order to mimic this market price.
Thus, farmers benefitted mostly from free delivery when given this purchasing opportunity.
Most of the farmers in our sample did not know how to obtain Swarna-Sub1.13 The door-to-
door sales were used to eliminate these barriers and allow us to reveal demand at the market
price and in the absence of supply barriers. We observed a strong demand for the technology
in the door-to-door sales: 36 percent of farmers bought at least one package of seeds.
The inability to record adoption from other sources — largely other farmers in the village
— is the disadvantage of measuring adoption with the door-to-door sales. Swarna-Sub1 is
an inbred rice variety that can be multiplied, reused, and traded with other farmers. Many
estimates indicate that this informal seed system of either reusing one’s own seed or obtaining
from neighbors accounts for a large portion of seed use in South Asia. It is possible that the
different methods of identifying early adopters could generate variation in the propensity for
these early adopters to sell or trade seeds. We would miss this source of adoption with our
door-to-door sales.
We remedied this issue by carrying out a door-to-door adoption census starting in July
2015. Survey teams went door-to-door in each village and asked each household a small
set of questions, including whether they were currently cultivating Swarna-Sub1. A total
of 6,511 households were surveyed during these door-to-door visits. The data do show the
importance of supply barriers. Only 14 percent of all households adopted Swarna-Sub1.14
This compares to a 36 percent adoption rate in the sample of farmers that received door-to-
door visits. We use this additional dataset for investigating whether different entry points
were any more (or less) effective at physically transferring seed to other farmers.
Table 1 shows summary statistics from the baseline sample. The sample consists of
mainly small farmers practicing rainfed cultivation. Average cultivated area is about 2.8
acres and only 40 percent of farmers report any access to irrigation. Importantly, Swarna
is a popular variety in the sample: 74 percent of farmers cultivated Swarna at baseline.
In other words, a majority of the sample already had experience with the variety that is
otherwise identical to Swarna-Sub1. This experience makes learning less complex than if the
13One of the main questions that came up during the field days was how to obtain the seed. Private seeddealers do not operate in this area and the seeds were generally not available at the local block office wheremost farmers buy their seeds. There was only one other NGO with access to seeds and most farmers wereunaware of this NGO.
14This figure includes the households that were endowed with seed the previous year.
12

new technology was entirely different.
Table 1 also considers covariate balance by regressing each baseline characteristic on
indicator variables for SHG meeting, village meeting, and farmer field day villages. This is the
same form of regression used in the main analysis that follows. A handful of characteristics
are not well-balanced across the different arms of the experiment. We show that our results
are unchanged by controlling for these and various other household characteristics.
Another methodological concern is that our primary sample of households consists of the
farmers that were not selected as early adopters during the first year. Part of the reason
we introduced only 25 kilograms was to sharpen selection of the first-year adopters. As a
consequence, this limits the selection of the group of non-adopters because the early adopters
represent a small share of the village. More concretely, around 6 to 8 farmers were selected
as early adopters across the three treatment arms. This represents about 10 percent of the
rice farmers in the average village of our sample. Table A2 shows balance of household
characteristics for the random sample of non-adopter households. The treatment variables
are jointly significant at the 10 percent level in 2 of the 17 regressions. Thus, our sample
of non-adopting households appears to be similar across the different treatment arms. We
also show similar effects on adoption for the entire village, which effectively shuts down the
possibility that selection into the group of non-adopting farmers drives the results.
4 Results
We divide this section into separate components for our different groups of results. We
first outline the empirical framework, which is simple given the experimental design. We
start the analysis by documenting the differences in characteristics of early adopters across
the village meeting, SHG meeting, and ward member villages. We then show how various
measures of production varied across the different injection points — including the number
of adopters, area planted, and the number of successful adopters. We then show effects of the
different treatments on knowledge diffusion and revealed demand. We conclude the analysis
by showing suggestive evidence on whether farmer field days can be characterized as a source
of information for only those that are less likely to communicate with early adopters.
13

4.1 Regression framework
Our experimental design affords us a simple estimating equation. In most specifications we
estimate the regression
yivb = β0 + β1Meetvb + β2SHGvb + β3FieldDayvb + β4Xivb + αb + εivb, (1)
where yivb is some outcome (usually seed adoption) for household i located in village v and
block b. We include indicator variables for village meeting and SHG meeting villages, denoted
as Meetvb and SHGvb, respectively. In our main specification we pool the effect of farmer
field days across the different entry points by including a single indicator variable for field
day villages. In some specifications we verify that our results are unaffected when including
household covariates Xivb. The villages in the experiment were spread across three blocks
(an administrative unit which was a stratification variable) and therefore we include fixed
effects for blocks, i.e. the αb terms. Finally εivb is a random error term which we allow to
be correlated within villages but assume to be uncorrelated across villages.
4.2 Characteristics of early adopters
Table 2 shows estimates of equation (1) where we focus our estimation on the chosen early
adopters and only include the indicator variables for village meeting and SHG meeting vil-
lages.15 We show these coefficient estimates for various characteristics that were collected
when our survey teams returned to villages after seed distribution to gather additional in-
formation from early adopters.
Our first main result is that patronage exists when seeds are distributed via ward mem-
bers. The first row in column 1 shows that 30.5 percent of early adopters are either the ward
member, or family / close friends with the ward member. 20.9 percent of early adopters fell
under the same category in meeting villages and this number fell to 11.7 percent in SHG
meeting villages. The second row shows that part of this effect is the ward member keeping
seeds for him or herself. 11 percent of early adopter households had an elected panchayat
representative in ward member villages. The share of households having an elected panchayat
representative was significantly lower in village meeting and SHG meeting households.16
15These regressions are meant to measure selection. The block fixed effects are dropped from the regressionto avoid absorbing any selection effects.
16We removed the ward member households from the data and re-estimated the regression in the firstrow. The coefficient for village meeting villages decreases and becomes statistically insignificant, but thecoefficient for SHG meeting villages remains negative and statistically significant. In addition, both variablesjointly explain the likelihood that the adopter is connected to the ward member (p-value of F statistic =0.05). This helps ensure that this effect is not entirely driven by the ward member keeping seeds for their
14

One possible outcome at the onset of the experiment was that local political elites would
be able to capture village meetings and ensure that early adopters were there closest family
members or friends. The pattern of results suggest that this is not the case. Table 1 showed
that around 21 percent of villagers report being family or close friends with the ward member.
The share of early adopters in the two types of meeting villages that report the same thing
are either near or below this value, suggesting that the meetings were not dominated by
political figures.
In addition to closeness with elected officials, there are several other differences between
entry points across the treatments. Not surprisingly, early adopters in SHG meeting villages
come from entirely SHG households. This is a consequence of using SHG meetings which
consist entirely of women. The fourth row shows that early adopters in SHG villages are
significantly more likely to be family or close friends with the SHG president — relative to
village meeting villages. Focusing on the other rows, adopters in SHG villages are more likely
to be part of agricultural cooperatives, are younger, and are less likely to come from disad-
vantaged castes. Differences in livestock ownership appear to be the only wealth differences
across the treatments.
In sum, there are some differences in observable characteristics of early adopters across
the different mechanisms for injecting the new seed variety. What remains unclear is whether
changing the pool of adopters in this way has any positive consequences for learning and
ultimately diffusion of the technology.
4.3 Differences in production and information diffusion to non-
adopters
This in-season visit also included various questions about the production of early adopters.
Table 3 shows results where we aggregate these outcomes to the village level in order to study
how production varies across the three different methods of introducing the seed. Starting
with column 1, almost all 25 kilograms were distributed and planted in the nursery.17 This
varies little across the three treatments. Columns 2 and 3 show somewhat weak evidence
that village meetings gave access to a larger number of farmers. The average number of
recipients in meeting villages increases by 28 percent, however this effect is not statistically
significant (p=0.12). The difference between SHG and village meeting villages is however
own household.17At this stage we define planting as accepting the seeds and planting them in a nursery bed. The common
planting technique in our sample is then to uproot these seedlings after three weeks and transplant them inthe larger field where the crop is to be grown. These two things are distinct because some farmers experiencedflooding in the nursery and thus were unable to transplant the variety in the main field.
15

statistically significant. Column 3 shows this is driven by the increased likelihood of dividing
the five packages into smaller packages; only 22 percent of ward member villages had more
than five adopters, while there was more than five adopters in just over 50 percent of meeting
villages. Column 4 shows that relative to SHG meeting villages, the number of farmers not
losing the crop during the nursery phase — and thus actually transplanting Swarna-Sub1 —
is highest in village meeting villages. A similar result is found in column 5 with total acreage
transplanted.
These results are useful for first understanding how demonstration varied across the
different arms of the experiment. If farmers learn only from peers and the size of the
cultivated field is irrelevant, then dividing the seeds into small packages and distributing
to different pockets of the village network would be optimal for diffusion. The data show
moderate evidence that village meetings are the most effective at generating the largest pool
of early adopters.
A final useful question before turning to demand effects is did information flows to non-
recipient households vary across the different arms of the experiment? Before selling seeds
we surveyed 15 households in each village to assess their knowledge of Swarna-Sub1. We
asked respondents several questions, starting with whether they had ever heard of Swarna-
Sub1 and how many farmers they had spoken to about the variety. We then asked several
multiple choice questions such as the two differences between Swarna-Sub1 and Swarna18,
the length of flooding that Swarna-Sub1 can tolerate, and the duration of Swarna-Sub1 (days
from planting to harvesting).
Table 4 indicates that selecting early adopters with village or SHG meetings does little
to increase the spread of information to non-adopting households. Across all seven mea-
sures in the table, the only statistically significant difference between the different injection
strategies is a moderate increase in the probability that non-adopting households in SHG
meeting villages had ever heard of Swarna-Sub1. In contrast, farmer field day villages show
moderately higher levels of knowledge about Swarna-Sub1. Non-adopting farmers are 5.6
percentage points more likely to have ever heard of Swarna-Sub1 in field day villages. Col-
umn 2 shows that a non-adopting farmer in field day villages reports talking to an additional
0.12 adopting farmers. We also estimate positive effects on knowledge of maximum survival
length and duration of the growth cycle in farmer field day villages. Thus, farmer field days
appear to have succeeded at improving information diffusion, while using village meetings
to select early adopters did not.
We used SHG meetings to explicitly ensure that women were involved in the selection
of early adopters. One of the disadvantages of this is that concentrating early adopters
18In addition to flood tolerance, Swarna-Sub1 has a white husk, making it distinguishable from Swarna.
16

amongst SHG households may limit the flow of information to non-SHG households. Table
A3 shows evidence consistent with this. In short, SHG households possess more knowledge
in villages where SHG meetings were used. As a result, one disadvantage of introducing a
new technology through an existing organization is the lack of knowledge dissemination to
households outside of that organization. This is important because NGO’s in South Asia
often partner with established groups such as village farmers clubs when introducing new
technologies or farming practices. This common approach limits diffusion of information
outside of these groups.
4.4 Main results: Effects on revealed demand
The experiment was designed with the policy objective of increasing the diffusion of a new
agricultural technology that has been proven as beneficial to farmers. Adoption is therefore
the most important measure of efficacy in our experiment. We measure adoption directly
with our door-to-door sales experiment that was carried out approximately one year after
seeds were originally introduced in each village. We measure adoption in an environment
where free delivery — in contrast to heavy subsidies — is the main benefit introduced by
our experiment.
We first show in Table 5 our two main results: identifying early adopters with participa-
tion from villagers does not increase future adoption and that learning opportunities created
by farmer field days translate into greater future adoption. As seen in the first two rows, we
estimate small and statistically insignificant effects of both SHG meetings and more broad
village meetings. In column 1, adoption decreases in village meeting villages by 1.8 percent-
age points. This effect is statistically insignificant. The 95 percent confidence interval on
this point estimate allows us to reject increases in adoption of larger than 9.6 percentage
points. Put differently, the data allow us to reject that using village meetings to identify
early adopters increases adoption by any more than 26.9 percent. Similar results are ob-
tained with SHG meetings. The point estimate for SHG villages is effectively zero. In terms
of precision, we are able to reject increases in adoption of 11.8 percentage points or higher.
Given that 35.7 percent of farmers in ward member villages adopt, we have the power to
reject that SHG meetings cause increases in adoption of 32.7 percent or higher. We of course
lose some statistical precision by estimating separate effects of village and SHG meetings.
The online appendix shows that we obtain slightly more precise null results when pooling
both types of villages together and estimating a single effect of meetings.19
19Table A4 shows that the marginal impact of meetings on adoption is a negative 0.5 percentage pointdecline in adoption. The upper bound on the 95 percent confidence interval is 8.8 percentage points —meaning that we can reject that meetings in general led to increases in adoption of 24.7 percent or higher.
17

In addition to measuring overall adoption, we separate our adoption measure into different
indicators for farmers that purchased one or two five kilogram packages of seeds. We estimate
null effects of both types of meetings on adoption of five and ten kilogram packages (columns
2 and 3). In other words, there is no evidence that selection of early adopters via meetings
did anything to induce farmers to even “try” a small amount of seed. We further add several
household control variables to the same specifications in columns 4 through 6. The main
conclusion that both types of meetings have little effect on adoption is unchanged — an effect
that is expected since the sample of non-adopting households is largely similar on observable
characteristics across the different methods of identifying early adopters.
In combination, we don’t find any evidence that engaging villagers to participate in
selection of early adopters drives future technology diffusion. These estimated null effects
are only interesting alongside the result that meetings reduce patronage by generating a pool
of early adopters that are on average less connected to local political officials. In practice the
result means that although relying on elected officials to identify early program beneficiaries
does induce favoritism, this favoritism has no consequences on the rate at which the new
technology diffuses to other villagers. In our context allowing for a more participatory
method of identifying beneficiaries does no better at inducing faster diffusion. Importantly,
this is not due to the early adopters being any less productive farmers. If anything, the
early adopters in village meeting villages are the the largest in number and the most likely
to successfully cultivate the new technology. Given that village meetings involve a time cost
of farmers, our results indicate that relying on the knowledge of the locally elected officials
is a more cost effective approach to identifying early adopters.
In contrast to the null effects of our selection treatments, farmer field days led to signifi-
cant gains in adoption. We estimate that field days led to a 12.2 percentage point increase
in adoption In the main specification without household controls. The rate of adoption in
villages without field days was 29.7 percent. Our point estimate therefore indicates that this
relatively simple method of bringing farmers together to discuss a new technology leads to
a 41 percent gain in adoption. Interestingly, column 2 shows that the effect appears larger
on adoption of a single package of seeds. Adoption of a single package of seeds increases
by 8.6 percentage points — or 59 percent. On the other hand, adoption of two packages
increases by only 3.7 percentage points and this effect is statistically insignificant. Our data
do not allow us to pinpoint an exact reason for this difference. Nonetheless, one possible
reason is that the field days provided additional information to farmers that were near the
threshold of simply trying the new seed. But field days were less impactful for farmers that
had already decided to plant the variety on a larger share of their land.
Similarly to the other estimates, incorporating several household control variables does
18

not change this result (columns 4 through 6). The point estimates are almost identical to
those that only use the variation created by the experiment.
Figure 2 helps understand this effect by showing the distribution of the village-level
adoption rates for the two types of villages. Two things stand out from the figure. First,
the field days decreased the frequency of little or no adoption at the village level. 35 percent
of villages without field days had adoption rates lower than 10 percent. In contrast, only
12 percent of field day villages had adoption rates lower than 10 percent. Second, the
distribution for field day villages puts much more mass on adoption rates greater than 50
percent. 38 percent of field day villages had adoption rates of 50 percent or higher, while
only 19 percent of the remaining villages had at least half of the farmers adopt.
A back-of-the envelope calculation suggests that field days are likely cost effective. The
average village in our sample has 69 rice-farming households. Thus, a field day would be
expected to generate around 8.3 additional adopters of Swarna-Sub1. In Emerick et al.
(2016) we find that this technology leads to revenue gains of 10 percent or around 2,969
rupees. This effect arises largely due to the crowd-in effect of inducing farmers to use more
inputs. Thus, field days generate one-year revenue gains of around 24,643 rupees, or around
410 dollars. Our partner NGO required only approximately 200 dollars per village to execute
the farmer field days. Therefore, farmer field days appear to pay for themselves after just a
single growing season. One the one hand this calculation is very encouraging because the one-
year benefits are an extreme lower bound on the flow of benefits that farmers will receive
from continued adoption. On the other hand, the calculation has to be interpreted with
caution for two reasons. First, it is unclear whether there would be dis-economies of scale
with wider implementation. There would likely be additional costs of incorporating a larger
number of villages outside of the coverage area where our partner NGO operates. Second,
our estimated adoption effects are conditional on the absence of other supply barriers. We
can only think of field days as being cost effective when seeds are delivered to farmers at
market prices.
It does not appear that the field days were any more effective when early adopters were
identified with meetings. Table 6 shows the complete specification where the field day indi-
cator is interacted with the indicators for village and SHG meetings. The second two rows
of the table show that if anything, the field days were less effective when early adopters were
selected by meetings. The coefficient on the interaction term between field days and SHG
meetings is negative, somewhat large, but statistically insignificant. The coefficient on the
interaction between field days and village meetings is also negative and equally imprecise.
Nonetheless, our findings are not compatible with the idea that managing the learning pro-
cess with field days is more effective when the adopters are more representative of the village
19

and less likely to be connected to local political figures. Farmers appear to learn just as well
— if not better — from the experiences of the early adopters that are identified by locally
elected officials.
Finally, Table 7 considers which types of farmers benefitted the most from the added
learning opportunities afforded by field days. More succinctly, we show suggestive evidence
that the field days were more effective for poorer farmers. We use two indicators which are
readily available in our data. 33 percent of our sample belongs to the scheduled castes or
tribes, the most disadvantaged castes in the country. Column 1 shows that the marginal
impact of field days on adoption for higher caste farmers is 8.1 percentage points. This
impact increases to 20.4 percentage points for farmers belonging to the scheduled castes and
tribes — however the large differential effect is not statistically significant (p=0.13). Column
2 shows that this differential effect is largely driven by inducing scheduled caste and tribe
farmers to purchase a single package of seeds. The effect of field days on adoption of a single
package is only 4.7 percentage points for higher caste farmers. In contrast, the effect is over
three times larger for scheduled castes and tribes and the differential effect is statistically
significant at the 10 percent level. Column 3 shows that there is virtually no differential
effect for scheduled castes and tribes on the probability of purchasing two packages.
In addition to caste status, we also use possession of a “below the poverty line” card,
which is meant to deliver various social assistance benefits to poor households. About 62
percent of our sample holds one of these cards. We observe a similar pattern where field
days are more likely to induce BPL households to purchase a single package of seeds. In
particular, column 5 shows that the effect of field days on adoption of five kilograms is larger
by 10.1 percentage points for BPL households. Overall, the results suggest that field days
may increase equity by causing the largest adoption gains for the poorest farmers.
In addition to purchasing seeds from us, farmers could have obtained seeds directly from
early adopters. Adoption from our door-to-door sales would present an inaccurate picture if
either of the two meeting types were more successful at identifying early adopters that are
better seed distributors. We surveyed every farming household in each village to test this
more explicitly.
There is no evidence that meetings induced more adoption at the village level. Column 1
in Table 8 shows our main specification for all villagers — including the first-year adopters.
The coefficients for both village and SHG meetings remain small and statistically insignifi-
cant. However, we continue to estimate large positive effects of field days on seed demand
at the village level. Field days caused in increase in adoption of 6.2 percentage points, or
around 60 percent.20 Column 2 shows that we still fail to detect significant interaction effects
20The much lower adoption rate at the village level is indicative of supply constraints. 35 percent of our
20

between meetings and field days in this larger sample.
Measuring adoption for the entire village eliminates any concern that selection into the
non-adopting sample is responsible for the results. The relatively small number of early
adopters — relative to village size — seems to limit this particular type of sample selection.
4.5 Do field days only spread information to farmers that don’t
interact with early adopters?
One interpretation of our findings is that field days simply transmit information to farmers
that do not regularly communicate with early adopters. Put differently, learning from peers
is imperfect and slow because some people simply do not communicate with each other.
If this explanation drives our findings, then field days should be most effective for farmers
that otherwise would not have interacted with early adopters. We test this idea using
several different measures of how likely non-adopting farmers are to communicate with early
adopters.
This additional heterogeneity is in general not compatible with field days only being
effective for farmers that are unlikely to communicate with early adopters. Starting with
column 1 in Table 9, we interact the field days indicator with the number of early adopters
sharing the same surname.21 We would expect the interaction effect to be negative if field
days are most effective for the unconnected farmers. The point estimate on the interaction
term is effectively zero. Columns 2 and 3 use the GIS data we collected on the plot locations
of early adopters and the houses of non-adopting farmers. We calculate for each farmer the
number of Swarna-Sub1 plots of early adopters within a given radius from their household.
We allow this radius to vary from 250 to 500 meters.22 We again find that the field days
do not appear to be more effective for farmers that lived the furthest from the places where
the new technology was being cultivated. Therefore these additional tests do not favor the
idea that field days simply substitute for peer-to-peer learning for farmers that have less of
an opportunity to learn from peers.
We next show additional analysis suggesting that if anything, the field days were com-
plementary with having an opportunity to learn from peers. More specifically, we focus
sample that received door-to-door sales adopted, but this falls to around 15 percent when considering theentire village.
21Surnames are a common marker of social connection in rural India, largely because of their tight associ-ation with caste. The average farmer in the sample of non-adopters shares the same surname with one earlyadopter. Figure A1 shows the distribution of this measure. 60 percent of farmers have a surname that iscommon with zero early adopters. At the maximum, one farmer in the sample has the same surname as 11early adopters.
22Figure A2 shows the distribution of the two measures across the sample of non-adopting households.
21

our estimation on the SHG villages and test whether the field days were less effective for
households having an SHG member. Essentially all of the early adopters were SHG member
households in SHG meeting villages. Therefore, we would expect field days (with the whole
village) to be the least effective for SHG households if field days substitute for peer learning.
The interaction effect between field days and the SHG household indicator in column 4 is
large and positive, but not statistically significant (p=0.22). Column 5 estimates a larger
— and marginally significant — interaction effect when we use an indicator for households
that report being a friend or family member of the SHG president. In short, the field days
were only effective for households that are close friends or family of the SHG president. We
interpret these findings to suggest that the field days enhanced the learning ability of people
that were already familiar with early adopters — rater than substituted for peer-to-peer
learning for people that are less familiar with early adopters.
As a final piece of evidence, we show in Table A5 that these two interaction effects increase
in size and significance with the addition of household controls. More importantly, we also
estimate the same two models for the ward member and village meeting villages. The field
days had no differential effect for SHG households in these villages. Thus, the differential
effects observed in SHG villages are unlikely to result from unobserved correlates of SHG
membership that cause these households to more generally gain more from field days.
5 Concluding Remarks
This paper shows that there is room for further interventions to increase the efficacy of
peer-to-peer learning in agriculture. We tested two such interventions. First, we considered
whether ex-ante the selection of the first generation of adopters can be improved by seeking
the input of various farmers through village meetings. We found that these meetings do
change the composition of the group of early adopters. More specifically, using meetings
shifts the pool of early adopters away from friends and family of the locally elected political
figures. However, we find that this has no meaningful effect on technology adoption one
season later. This result does not undermine the importance of careful selection of early
adopters for maximizing technological diffusion. The result instead indicates that relying
on villagers to jointly decide this in meetings is unlikely to improve selection in a way that
speeds diffusion. Thus, we conclude that further research is required to uncover alternative
and cost-effective ways to identify the early adopters that maximize diffusion.
Second, we have shown that ex post — once the early adopters have already been iden-
tified — learning outcomes can be improved by nudging farmers to learn from each other.
We found that organizing a simple farmer field day where a local NGO discussed the new
22

technology and allowed early adopters to directly share their experiences causes adoption to
increase significantly a few months later right before planting. These field days are likely
cost effective. Finally, we find limited evidence that field days simply substitute for peer-to-
peer learning for farmers that otherwise were unlikely to interact with early adopters. We
found that if anything, the field days enhanced the learning ability of those that were the
most likely to interact with early adopters. More concretely, the field days appear to be a
complement to learning from peers rather than a substitute.
Despite a large number of papers on social learning and technology adoption, there have
been few studies that test alternative policy instruments for improving peer-to-peer learning
and making technology diffuse faster. Our results suggest that diffusion can be improved
when a new technology is injected into a village and farmers are brought together explicitly
to improve learning. Organizing meetings in this way is a fairly traditional technique in
agricultural extension. However, we found no rigorous evidence on the efficacy of these
meetings at driving technology adoption. At the same time, traditional agricultural extension
is often considered to be ineffective. In our case this conclusion does not appear to result
from solely the methods of traditional extension.
More generally, our results indicate that despite the firm establishment of peer influence
by the literature, there is room to build on this by finding ways to make social learning more
effective. Simply relying on farmers to share information without any further intervention
will damper adoption of improved agricultural technology.
23

References
Aker, Jenny C. 2011. “Dial A for agriculture: A review of information and communication
technologies for agricultural extension in developing countries.” Agricultural Economics
42 (6):631–647.
Alatas, V, A Banerjee, R Hanna, BA Olken, and J Tobias. 2012. “Targeting the Poor: Evi-
dence from a Field Experiment inIndonesia.” The American economic review 102 (4):1206–
1240.
Alatas, Vivi, Abhijit Banerjee, Arun G Chandrasekhar, Rema Hanna, and Benjamin A
Olken. 2015. “Network structure and the aggregation of information: Theory and evidence
from Indonesia.” Tech. rep., National Bureau of Economic Research.
Anderson, Jock R and Gershon Feder. 2007. “Agricultural extension.” Handbook of agricul-
tural economics 3:2343–2378.
Bandiera, Oriana and Imran Rasul. 2006. “Social networks and technology adoption in
northern mozambique*.” The Economic Journal 116 (514):869–902.
Banerjee, Abhijit, Arun G Chandrasekhar, Esther Duflo, and Matthew O Jackson. 2013.
“The diffusion of microfinance.” Science 341 (6144):1236498.
———. 2014. “Gossip: Identifying central individuals in a social network.” Tech. rep.,
National Bureau of Economic Research.
Bardhan, Pranab and Dilip Mookherjee. 2006. “Pro-poor targeting and accountability of
local governments in West Bengal.” Journal of development Economics 79 (2):303–327.
———. 2011. “Subsidized Farm Input Programs and Agricultural Performance: A Farm-
Level Analysis of West Bengal’s Green Revolution, 1982-1995.” American Economic Jour-
nal: Applied Economics :186–214.
Basurto, Pia, Pascaline Dupas, and Jonathon Robinson. 2015. “Decentralization and Effi-
cienty of Subsidy Targeting: Evidence from Chiefs in Rural Malawi.” Unpublished .
Beaman, Lori, Ariel BenYishay, Mushfiq Mobarak, and Jeremy Magruder. 2015. “Can
Network Theory based Targeting Increase Technology Adoption?”
BenYishay, Ariel and A Mushfiq Mobarak. 2015. “Social Learning and Incentives for Exper-
imentation and Communication.” Tech. rep., National Bureau of Economic Research.
24

Bustos, Paula, Bruno Caprettini, and Jacopo Ponticelli. 2016. “Agricultural productivity
and structural transformation. Evidence from Brazil.” forthcoming, American Economic
Review .
Cole, Shawn Allen and A Nilesh Fernando. 2014. “The value of advice: Evidence from
the adoption of agricultural practices.” Harvard Business School Finance Working Paper
(13-047).
Conley, Timothy G and Christopher R Udry. 2010. “Learning about a new technology:
Pineapple in Ghana.” The American Economic Review :35–69.
Dar, Manzoor H, Alain de Janvry, Kyle Emerick, David Raitzer, and Elisabeth Sadoulet.
2013. “Flood-tolerant rice reduces yield variability and raises expected yield, differentially
benefitting socially disadvantaged groups.” Scientific reports 3.
Davis, Kristin, Ephraim Nkonya, Edward Kato, Daniel Ayalew Mekonnen, Martins Odendo,
Richard Miiro, and Jackson Nkuba. 2012. “Impact of farmer field schools on agricultural
productivity and poverty in East Africa.” World Development 40 (2):402–413.
Emerick, Kyle, Alain de Janvry, Elisabeth Sadoulet, and Manzoor H Dar. 2016. “Techno-
logical innovations, downside risk, and the modernization of agriculture.” forthcoming,
American Economic Review .
Fafchamps, Marcel and Bart Minten. 2012. “Impact of SMS-Based Agricultural Information
on Indian Farmers.” World Bank Economic Review 26 (3):383–414.
Foster, Andrew D and Mark R Rosenzweig. 1995. “Learning by doing and learning from
others: Human capital and technical change in agriculture.” Journal of political Economy
:1176–1209.
Godtland, Erin M, Elisabeth Sadoulet, Alain De Janvry, Rinku Murgai, and Oscar Ortiz.
2004. “The impact of farmer field schools on knowledge and productivity: a study of potato
farmers in the Peruvian Andes.” Economic development and cultural change 53 (1):63–92.
Golub, Benjamin and Matthew O Jackson. 2012. “How Homophily Affects the Speed of
Learning and Best-Response Dynamics.” Quarterly Journal of Economics 127 (3):1287–
1338.
Jack, Kelsey. 2011. “Market inefficiencies and the adoption of agricultural technologies in
developing countries.” White paper, Agricultural Technology Adoption Initiative (Abdul
Latif Jameel Poverty Action Lab/MIT, Cambridge, MA .
25

Restuccia, Diego, Dennis Tao Yang, and Xiaodong Zhu. 2008. “Agriculture and aggregate
productivity: A quantitative cross-country analysis.” Journal of Monetary Economics
55 (2):234–250.
Voesenek, Laurentius ACJ and Julia Bailey-Serres. 2009. “Plant biology: Genetics of high-
rise rice.” Nature 460 (7258):959–960.
Xu, Kenong, Xia Xu, Takeshi Fukao, Patrick Canlas, Reycel Maghirang-Rodriguez, Sigrid
Heuer, Abdelbagi M Ismail, Julia Bailey-Serres, Pamela C Ronald, and David J Mackill.
2006. “Sub1A is an ethylene-response-factor-like gene that confers submergence tolerance
to rice.” Nature 442 (7103):705–708.
Yang, Dennis Tao and Xiaodong Zhu. 2013. “Modernization of agriculture and long-term
growth.” Journal of Monetary Economics 60 (3):367–382.
26

Figures
Figure 1: Timeline of the experimental design
May2014
June2014
Sep/Oct2014
Nov2014
Feb/Mar2015
May2015
Jul/Aug2015
Baselinesurvey(N=990)
Seedsdistributedvia3channels
Plan;ng
Surveyallearlyadopters:measurecharacteris;cs(N≈676)
Farmerfielddaysin50villages
Surveywithrandomsubsetofnon-adopters:measureinforma;ondiffusion(N=1,387)
Door-to-doorsalestomeasurerevealeddemand
Ricevarietyadop;oncensus,allfarmersineachvillage(N=6,511)
Notes: The figure shows the timing of the activities that were carried out as part of the experiment.Planting for each season occurs in June and harvesting generally occurs in late November to December.
27
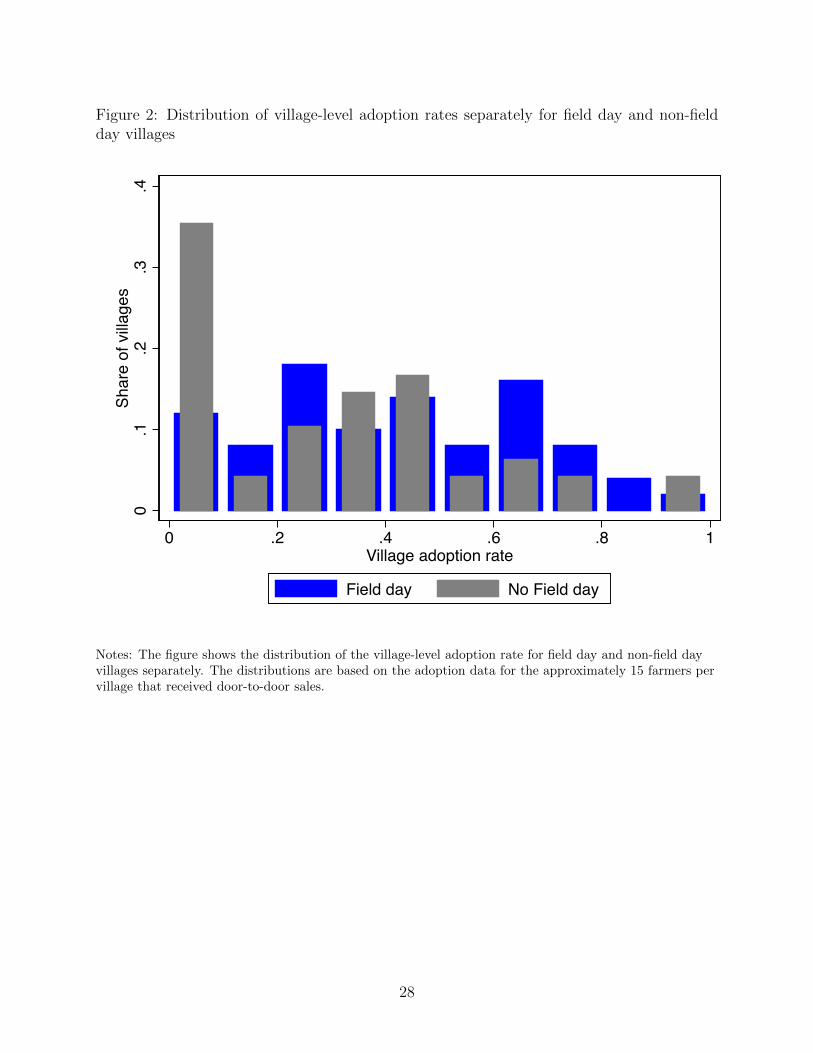
Figure 2: Distribution of village-level adoption rates separately for field day and non-fieldday villages
0.1
.2.3
.4Sh
are
of v
illage
s
0 .2 .4 .6 .8 1Village adoption rate
Field day No Field day
Notes: The figure shows the distribution of the village-level adoption rate for field day and non-field dayvillages separately. The distributions are based on the adoption data for the approximately 15 farmers pervillage that received door-to-door sales.
28

Tables
Table 1: Baseline summary statistics and balance testsCoefficients:
(1) (2) (3) (4) (5)Mean Meeting SHG Field Day Joint p-value
Household size 6.137 0.171 0.119 0.231 0.775
Access to electricity 0.894 0.040 0.034 0.007 0.810
Mud walls 0.618 0.071 0.062 0.067 0.365
Thatched roof 0.462 0.064 0.166∗∗∗ 0.074 0.042
Number rooms in house 2.406 -0.032 -0.077 -0.039 0.918
Years education 5.583 -0.812∗ -0.145 -0.076 0.362
Area cultivated in wet season (acres) 2.847 0.106 0.193 -0.003 0.821
Private tubewells in house 0.352 -0.166∗∗ -0.146∗∗ 0.046 0.035
Number of cows owned 1.573 0.002 -0.196 -0.043 0.652
Some irrigated area 0.402 -0.098 -0.094 -0.009 0.345
Swarna user 0.744 0.048 -0.009 0.064 0.320
HH operates business other than farming 0.081 0.003 -0.025 -0.022 0.544
Sharecrops land 0.573 -0.055 -0.109∗ -0.042 0.247
HH has member of SHG 0.516 0.070 0.189∗∗∗ 0.016 0.020
Family or close friend of ward member 0.212 -0.008 -0.003 0.036 0.876
Owns mobile phone 0.840 -0.011 0.008 0.006 0.979
BPL card holder 0.571 0.068 0.003 0.049 0.470
NREGS job card holder 0.668 0.023 0.045 0.118∗∗ 0.044
Scheduled Caste or Tribe 0.357 0.123 -0.088 0.069 0.039
Cognitive ability 3.201 -0.218 -0.270 -0.002 0.294
The table shows summary statistics and balance tests using the baseline survey of 990 farmers. Column 1displays the mean value of each characteristic across the entire sample. Columns 2-4 show the coefficientsfrom regressing each characteristic on indicator variables for village meeting, SHG meeting, and field dayvillages. Each regression includes fixed effects for the three blocks which were randomization strata.Column 5 shows the p-value of the joint test of all three treatment variables. BPL card holders are familieseligible for the national government’s below the poverty line scheme. NREGS job card holders are thosewith access to the employment guarantee scheme. The measure of cognitive ability is the score on a reversedigit span test. The standard errors in each regression are clustered at the village level. Asterisks indicatethat coefficient is statistically significant at the 1% ∗∗∗, 5% ∗∗, and 10% ∗ levels.
29

Table 2: Characteristics of early adopters across treatmentsCoefficients and SE:
(1) (2) (3) (4)Ward Mean Village meeting SHG meeting p-value (2)-(3)
Ward member, family, 0.305∗∗∗ -0.096∗ -0.188∗∗∗ 0.074or close friend (0.040) (0.054) (0.054)
HH has elected 0.114∗∗∗ -0.064∗∗ -0.082∗∗∗ 0.319panchayat representative (0.023) (0.026) (0.026)
HH has member of SHG 0.476∗∗∗ 0.056 0.508∗∗∗ 0.000(0.071) (0.092) (0.071)
Family or close 0.138∗∗∗ -0.030 0.064 0.039friend with an SHG president (0.033) (0.041) (0.050)
Self reported 0.257∗∗∗ -0.023 -0.028 0.922village leader (0.033) (0.044) (0.054)
Cooperative member 0.210∗∗∗ -0.001 0.179∗∗ 0.035(0.051) (0.068) (0.088)
Scheduled Caste or 0.462∗∗∗ -0.034 -0.196∗ 0.066Tribe (0.088) (0.111) (0.104)
Education 5.652∗∗∗ -0.293 0.092 0.497(0.599) (0.710) (0.729)
Age 49.010∗∗∗ 1.526 -7.646∗∗∗ 0.000(0.992) (1.344) (1.337)
Area cultivated 2.232∗∗∗ -0.096 -0.305 0.312(0.212) (0.279) (0.234)
Mud walls 0.533∗∗∗ 0.053 0.041 0.881(0.059) (0.073) (0.088)
BPL card holder 0.610∗∗∗ 0.026 0.023 0.973(0.062) (0.078) (0.081)
Cows owned 2.790∗∗∗ -0.509∗ -0.806∗∗∗ 0.247(0.234) (0.296) (0.296)
Sharecrops land 0.452∗∗∗ -0.024 -0.037 0.856(0.067) (0.079) (0.088)
Cognitive ability 3.015∗∗∗ -0.033 -0.119 0.552(0.086) (0.130) (0.136)
The data are from the first survey with all 676 early adopters of Swarna-Sub1. Each row shows regressioncoefficients of the listed characteristic on indicators for village meeting and SHG meeting villages. Theomitted category is the ward member villages and thus the coefficient reported in column 1 is the constantfor each regression. Column 4 reports the p-value for the test of equality of the village meeting and SHGmeeting villages. Standard errors that are clustered in the village level are in parentheses. Asterisksindicate that coefficient is statistically significant at the 1% ∗∗∗, 5% ∗∗, and 10% ∗ levels.
30

Table 3: Village-level production characteristics of early adopters across treatments(1) (2) (3) (4) (5)KG Number > 5 Number not Acres
planted adopters adopters losing crop transplantedVillage meeting 0.112 1.862 0.236∗∗ 1.088 0.052
(0.597) (1.200) (0.115) (1.044) (0.126)
SHG meeting -0.339 -0.498 0.104 -1.513∗ -0.197(0.991) (0.936) (0.113) (0.815) (0.133)
p-value Village=SHG 0.63 0.03 0.28 0.01 0.07Mean in Ward member villages 24.31 6.56 0.22 5.09 0.86Number of Observations 96 96 96 96 96R squared 0.003 0.054 0.043 0.072 0.040
The data are from the first survey with all 676 early adopters of Swarna-Sub1 and are collapsed to thevillage level. The dependent variables are the total amount of kilograms planted in the nursery bed in thevillage (column 1), the total number of farmers that received any seed during year 1 (column 2), anindicator variable if there were more than 5 recipients in the village (column 3), the number of recipientsthat did not lose the crop during nursery-stage flooding (column 4), and the total acres transplanted in themain field (column 5). Heteroskedasticity robust standard errors are in parentheses. Asterisks indicate thatcoefficient is statistically significant at the 1% ∗∗∗, 5% ∗∗, and 10% ∗ levels.
31

Tab
le4:
Eff
ects
onknow
ledge
diff
usi
on(1
)(2
)(3
)(4
)(5
)(6
)(7
)E
ver
Nu
mb
erad
op
ters
Diff
eren
cew
/M
axim
um
surv
ival
Most
suit
ab
leH
ow
vari
ety
Du
rati
on
hea
rdof
talk
edto
Sw
arn
aw
hen
flood
edla
nd
typ
ew
as
dis
trib
ute
din
days
Villa
ge
mee
tin
g0.0
50
-0.0
45
0.0
33
0.0
79
0.0
20
-0.0
16
0.0
20
(0.0
38)
(0.0
79)
(0.0
54)
(0.0
59)
(0.0
44)
(0.0
90)
(0.0
43)
SH
Gm
eeti
ng
0.0
62∗
0.0
34
0.0
13
0.0
51
-0.0
22
0.1
13
0.0
25
(0.0
35)
(0.0
79)
(0.0
46)
(0.0
54)
(0.0
48)
(0.0
79)
(0.0
43)
Fie
ldd
ay
0.0
56∗
0.1
16∗
-0.0
38
0.1
30∗∗
∗0.0
57
-0.0
13
0.0
68∗∗
(0.0
29)
(0.0
64)
(0.0
42)
(0.0
45)
(0.0
39)
(0.0
69)
(0.0
34)
p-v
alu
eV
illa
ge=
SH
G0.6
60.3
40.7
00.5
90.3
90.1
20.9
0M
ean
inW
ard
villa
ges
0.7
95
0.6
27
0.3
84
0.2
63
0.7
47
0.6
56
0.8
32
Nu
mb
erof
Ob
serv
ati
on
s1385
1369
1387
1387
1387
1387
1387
Rsq
uare
d0.0
76
0.0
27
0.1
10
0.1
38
0.0
83
0.1
22
0.1
28
Data
are
for
1,3
87
non
-ad
op
tin
gh
ou
seh
old
sth
at
wer
esu
rvey
edin
bet
wee
nh
arv
esti
ng
du
rin
gth
efi
rst
seaso
nan
dp
lanti
ng
for
the
seco
nd
seaso
n.
Th
ed
epen
den
tvari
ab
les
are
as
follow
s:C
olu
mn
1is
an
ind
icato
rfo
rw
het
her
the
resp
on
den
th
as
ever
hea
rdof
Sw
arn
a-S
ub
1p
rior
toth
ein
terv
iew
.C
olu
mn
2is
the
nu
mb
erof
oth
erfa
rmer
sin
the
villa
ge
talk
edto
ab
ou
tS
warn
a-S
ub
1.
Colu
mn
3is
an
ind
icato
rfo
rse
lect
ing
both
flood
tole
ran
cean
dhu
skco
lor
as
the
main
diff
eren
ces
bet
wee
nS
warn
aan
dS
warn
a-S
ub
1.
Colu
mn
4is
an
ind
icato
rfo
rkn
ow
led
ge
that
Sw
arn
a-S
ub
1ca
nsu
rviv
eu
pto
2w
eeks
wh
enth
efi
eld
isfl
ood
edd
uri
ng
the
veg
etati
ve
stage
of
the
gro
win
gse
aso
n.
Colu
mn
5is
an
ind
icato
rfo
rkn
ow
ledge
that
Sw
arn
a-S
ub
1is
most
ap
pro
pri
ate
for
med
ium
lan
dw
her
efl
ash
flood
ing
occ
urs
.C
olu
mn
6is
an
ind
icato
rfo
rkn
ow
led
ge
of
how
Sw
arn
a-S
ub
1w
as
dis
trib
ute
din
the
villa
ge
(eit
her
SH
Gm
eeti
ng,
villa
ge
mee
tin
g,
or
via
ward
mem
ber
).C
olu
mn
7is
an
ind
icato
rfo
rkn
ow
led
ge
that
the
du
rati
on
(tim
efr
om
pla
nti
ng
toh
arv
est)
of
Sw
arn
a-S
ub
1is
ap
pro
xim
ate
ly140
days.
All
regre
ssio
ns
incl
ud
eb
lock
fixed
effec
ts.
Sta
nd
ard
erro
rsth
at
are
clu
ster
edat
the
villa
ge
level
are
inp
are
nth
eses
.A
ster
isks
ind
icate
that
coeffi
cien
tis
stati
stic
ally
sign
ifica
nt
at
the
1%
∗∗∗,
5%
∗∗,
an
d10%
∗le
vel
32

Table 5: Effects on revealed demand(1) (2) (3) (4) (5) (6)Buy Buy 5 KG Buy 10 KG Buy Buy 5 KG Buy 10 KG
Village meeting -0.018 0.009 -0.027 -0.014 0.014 -0.029(0.057) (0.049) (0.038) (0.057) (0.049) (0.038)
SHG meeting 0.008 0.004 0.004 0.006 0.010 -0.004(0.055) (0.051) (0.038) (0.053) (0.050) (0.038)
Field day 0.122∗∗ 0.086∗∗ 0.037 0.122∗∗∗ 0.084∗∗ 0.039(0.047) (0.043) (0.032) (0.046) (0.042) (0.032)
HH Controls No No No Yes Yes Yes
Strata FE Yes Yes Yes Yes Yes YesMean in non-field day villages 0.297 0.147 0.150 0.297 0.147 0.150Mean in Ward villages 0.357 0.185 0.172 0.357 0.185 0.172Number of Observations 1384 1384 1384 1384 1384 1384R squared 0.043 0.028 0.014 0.063 0.043 0.029
The dependent variable in columns 1 and 4 is an indicator for whether the farmer purchased Swarna-Sub1when given a sales offer. The dependent variable in columns 2 and 5 is an indicator for purchase of 1 seedpackage (5 kg). The dependent variable in columns 3 and 6 is an indicator for purchase of 2 seed packages(10 kg). Household controls are indicator for ST or SC, indicator for BPL card, indicator for NREGS jobcard, cultivated area, indicator for thatched roof, indicator for mud walls, education of the farmer, age ofthe farmer, indicator for SHG membership, indicator for private tubewell ownership, and elevation of thehousehold. Standard errors that are clustered at the village level are in parentheses. Asterisks indicate thatcoefficient is statistically significant at the 1% ∗∗∗, 5% ∗∗, and 10% ∗ levels.
33

Table 6: Interaction effects between farmer field days and meetings(1) (2) (3) (4) (5) (6)Buy Buy 5 KG Buy 10 KG Buy Buy 5 KG Buy 10 KG
Field day 0.184∗∗ 0.139∗∗ 0.045 0.188∗∗∗ 0.143∗∗ 0.045(0.070) (0.058) (0.044) (0.068) (0.057) (0.043)
Field day * SHG -0.125 -0.148 0.023 -0.136 -0.156 0.021meeting (0.108) (0.100) (0.071) (0.105) (0.099) (0.069)
Field day * Village -0.066 -0.020 -0.047 -0.066 -0.027 -0.039meeting (0.113) (0.098) (0.075) (0.111) (0.096) (0.073)
SHG meeting 0.073 0.082 -0.009 0.071 0.087 -0.016(0.082) (0.073) (0.042) (0.082) (0.073) (0.042)
Village meeting 0.015 0.017 -0.002 0.008 0.017 -0.009(0.078) (0.055) (0.058) (0.075) (0.055) (0.057)
HH Controls No No No Yes Yes Yes
Strata FE Yes Yes Yes Yes Yes YesMean in non-field day villages 0.297 0.147 0.150 0.297 0.147 0.150Mean in Ward villages 0.357 0.185 0.172 0.357 0.185 0.172Number of Observations 1384 1384 1384 1384 1384 1384R squared 0.046 0.035 0.015 0.057 0.039 0.030
The dependent variable in columns 1 and 4 is an indicator for whether the farmer purchased Swarna-Sub1when given a sales offer. The dependent variable in columns 2 and 5 is an indicator for purchase of 1 seedpackage (5 kg). The dependent variable in columns 3 and 6 is an indicator for purchase of 2 seed packages(10 kg). Household controls are indicator for ST or SC, indicator for BPL card, indicator for NREGS jobcard, cultivated area, indicator for thatched roof, indicator for mud walls, education of the farmer, age ofthe farmer, indicator for SHG membership, indicator for private tubewell ownership, and elevation of thehousehold. Standard errors that are clustered at the village level are in parentheses. Asterisks indicate thatcoefficient is statistically significant at the 1% ∗∗∗, 5% ∗∗, and 10% ∗ levels.
34

Table 7: Heterogeneity of effect of farmer field day(1) (2) (3) (4) (5) (6)Buy Buy 5 KG Buy 10 KG Buy Buy 5 KG Buy 10 KG
Field day 0.083∗ 0.047 0.037 0.074 0.021 0.052(0.050) (0.048) (0.038) (0.061) (0.056) (0.039)
Field day * ST or SC 0.121 0.114∗ 0.007(0.079) (0.065) (0.055)
Field day * BPL card 0.079 0.101∗ -0.022(0.060) (0.055) (0.043)
SHG meeting 0.006 0.009 -0.004 0.006 0.009 -0.003(0.053) (0.050) (0.038) (0.053) (0.050) (0.038)
Village meeting -0.017 0.012 -0.029 -0.014 0.015 -0.029(0.056) (0.049) (0.038) (0.056) (0.048) (0.038)
HH Controls Yes Yes Yes Yes Yes Yes
Strata FE Yes Yes Yes Yes Yes YesMean in non-field day villages 0.297 0.147 0.150 0.297 0.147 0.150Mean in Ward villages 0.357 0.185 0.172 0.357 0.185 0.172Number of Observations 1384 1384 1384 1384 1384 1384R squared 0.066 0.047 0.029 0.064 0.047 0.029
The dependent variable in columns 1 and 4 is an indicator for whether the farmer purchased Swarna-Sub1when given a sales offer. The dependent variable in columns 2 and 5 is an indicator for purchase of 1 seedpackage (5 kg). The dependent variable in columns 3 and 6 is an indicator for purchase of 2 seed packages(10 kg). Household controls are indicator for ST or SC, indicator for BPL card, indicator for NREGS jobcard, cultivated area, indicator for thatched roof, indicator for mud walls, education of the farmer, age ofthe farmer, and elevation of the household. Standard errors that are clustered at the village level are inparentheses. Asterisks indicate that coefficient is statistically significant at the 1% ∗∗∗, 5% ∗∗, and 10% ∗
levels.
35

Table 8: Effects on adoption for the entire village(1) (2)
Village meeting -0.008 -0.003(0.028) (0.031)
SHG meeting 0.016 0.040(0.025) (0.029)
Field day 0.062∗∗∗ 0.079∗∗
(0.022) (0.033)
Field day * SHG -0.044meeting (0.046)
Field day * Village -0.007meeting (0.056)
Strata FE Yes YesMean in non-field day villages 0.103 0.103Mean in Ward villages 0.147 0.147Number of Observations 6511 6511R squared 0.054 0.055
The dependent variable in both columns is an indicator for whether the farmer adopted Swarna-Sub1 forthe 2015 season. The data are from a census of varietal adoption that was carried out with all householdsin each village shortly after planting decisions were made for the 2015 season. Standard errors that areclustered at the village level are in parentheses. Asterisks indicate that coefficient is statistically significantat the 1% ∗∗∗, 5% ∗∗, and 10% ∗ levels.
36
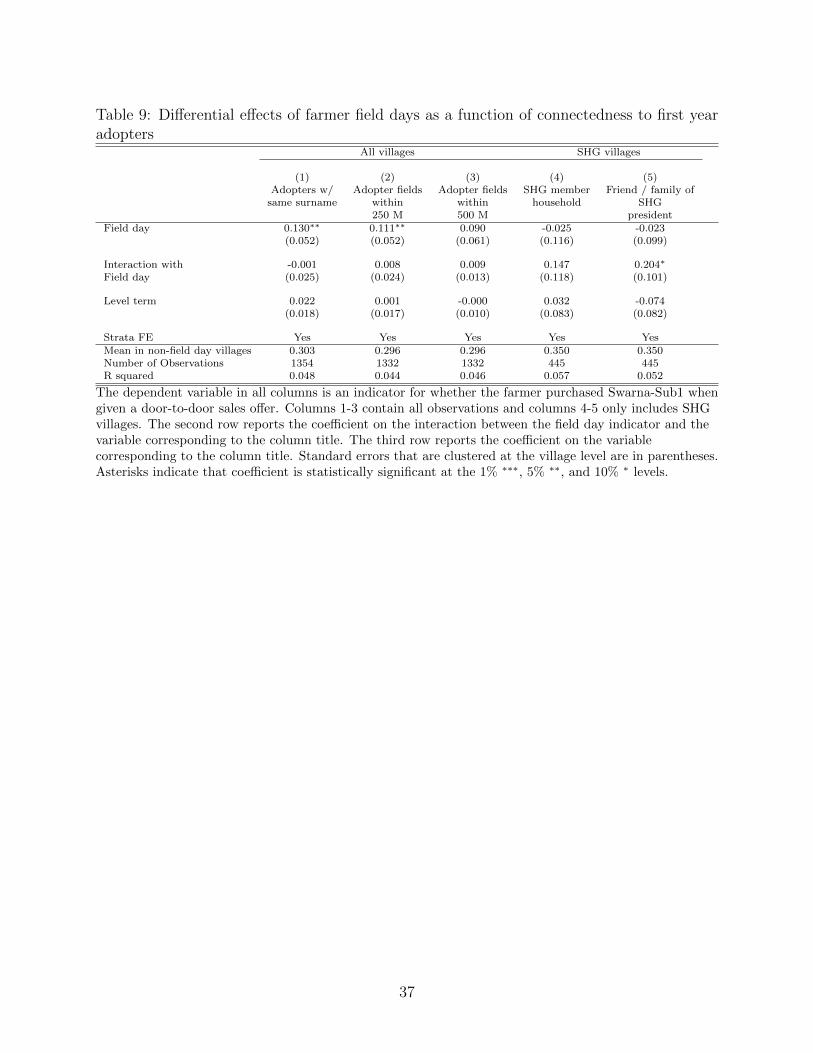
Table 9: Differential effects of farmer field days as a function of connectedness to first yearadopters
All villages SHG villages
(1) (2) (3) (4) (5)Adopters w/ Adopter fields Adopter fields SHG member Friend / family of
same surname within within household SHG250 M 500 M president
Field day 0.130∗∗ 0.111∗∗ 0.090 -0.025 -0.023(0.052) (0.052) (0.061) (0.116) (0.099)
Interaction with -0.001 0.008 0.009 0.147 0.204∗
Field day (0.025) (0.024) (0.013) (0.118) (0.101)
Level term 0.022 0.001 -0.000 0.032 -0.074(0.018) (0.017) (0.010) (0.083) (0.082)
Strata FE Yes Yes Yes Yes YesMean in non-field day villages 0.303 0.296 0.296 0.350 0.350Number of Observations 1354 1332 1332 445 445R squared 0.048 0.044 0.046 0.057 0.052
The dependent variable in all columns is an indicator for whether the farmer purchased Swarna-Sub1 whengiven a door-to-door sales offer. Columns 1-3 contain all observations and columns 4-5 only includes SHGvillages. The second row reports the coefficient on the interaction between the field day indicator and thevariable corresponding to the column title. The third row reports the coefficient on the variablecorresponding to the column title. Standard errors that are clustered at the village level are in parentheses.Asterisks indicate that coefficient is statistically significant at the 1% ∗∗∗, 5% ∗∗, and 10% ∗ levels.
37

Appendix - For Online Publication
Table A1: Correlates of farmer field day attendance(1) (2)
SHG meeting 0.015 0.014(0.097) (0.094)
Village meeting 0.025 0.024(0.089) (0.088)
ST or SC 0.056(0.046)
Age 0.001(0.001)
Educ. in years 0.011∗
(0.006)
HH has Below Poverty -0.025Line Card (0.044)
Rice area -0.009(0.014)
Strata FE Yes Yesp-value Village=SHG 0.88 0.88Mean in Ward villages 0.671 0.671Number of Observations 724 722R squared 0.130 0.142
The dependent variable in both regressions is an indicator for attending the farmer field day. The data arefor the 50 villages where field days took place. Standard errors that are clustered at the village level are inparentheses. Asterisks indicate that coefficient is statistically significant at the 1% ∗∗∗, 5% ∗∗, and 10% ∗
levels.
38

Table A2: Balance of household characteristics for sample of non-adopting farmersCoefficients:
Mean Meeting SHG Field Day Joint p-valueAccess to electricity 0.765 0.008 -0.055 -0.027 0.475
Mud walls 0.570 0.002 0.042 -0.028 0.592
Thatched roof 0.337 -0.021 0.068 -0.006 0.300
Number rooms in house 2.122 0.009 0.068 0.146 0.500
Years education 5.983 -0.084 0.289 0.038 0.860
Area cultivated in wet season (acres) 2.197 0.225 0.783 -0.243 0.521
Private tubewells in house 0.342 -0.055 -0.037 -0.002 0.842
Number of cows owned 1.835 0.041 0.004 0.079 0.969
Swarna user 0.570 -0.022 -0.099 0.094∗ 0.100
HH has member of SHG 0.642 -0.068 -0.021 0.026 0.490
Owns mobile phone 0.815 -0.066∗ -0.043 0.050∗ 0.127
BPL card holder 0.616 0.092∗∗ 0.093∗∗ 0.032 0.093
NREGS job card holder 0.656 0.056 0.067 -0.034 0.502
Scheduled Caste or Tribe 0.325 0.041 -0.134∗∗ 0.021 0.048
Owns television 0.536 0.012 -0.062 0.021 0.494
Owns motorbike 0.186 0.016 -0.014 0.025 0.636
Owns refrigerator 0.052 0.017 0.001 0.019 0.244
The table shows summary statistics and balance tests using the sample of 1,387 non-adopting farmers.Column 1 displays the mean value of each characteristic across the entire sample. Columns 2-4 show thecoefficients from regressing each characteristic on indicator variables for village meeting, SHG meeting, andfield day villages. Each regression includes fixed effects for the three blocks which were randomizationstrata. Column 5 shows the p-value of the joint test of all three treatment variables. BPL card holders arefamilies eligible for the national government’s below the poverty line scheme. NREGS job card holders arethose with access to the employment guarantee scheme. The measure of cognitive ability is the score on areverse digit span test. The standard errors in each regression are clustered at the village level. Asterisksindicate that coefficient is statistically significant at the 1% ∗∗∗, 5% ∗∗, and 10% ∗ levels.
39

Tab
leA
3:H
eter
ogen
eity
inth
esp
read
ofin
form
atio
nac
cord
ing
toSH
Gm
emb
ersh
ip(1
)(2
)(3
)(4
)(5
)(6
)(7
)E
ver
Nu
mb
erad
op
ters
Diff
eren
cew
/M
axim
um
surv
ival
Most
suit
ab
leH
ow
vari
ety
Du
rati
on
hea
rdof
talk
edto
Sw
arn
aw
hen
flood
edla
nd
typ
ew
as
dis
trib
ute
din
days
Villa
ge
mee
tin
g0.0
41
-0.0
53
0.0
22
0.0
73
0.0
21
-0.0
21
0.0
22
(0.0
38)
(0.0
80)
(0.0
57)
(0.0
60)
(0.0
43)
(0.0
89)
(0.0
42)
Fie
ldd
ay
0.0
61∗∗
0.1
21∗
-0.0
32
0.1
33∗∗
∗0.0
58
-0.0
08
0.0
68∗∗
(0.0
29)
(0.0
65)
(0.0
44)
(0.0
46)
(0.0
39)
(0.0
68)
(0.0
34)
SH
Gm
eeti
ng
-0.0
24
-0.0
80
-0.0
99
-0.0
29
-0.0
48
-0.0
34
0.0
10
(0.0
47)
(0.0
98)
(0.0
67)
(0.0
69)
(0.0
64)
(0.1
00)
(0.0
64)
SH
Gm
eeti
ng*S
HG
0.1
28∗∗
0.1
72
0.1
67∗∗
0.1
20∗
0.0
41
0.2
23∗∗
0.0
23
hou
seh
old
(0.0
53)
(0.1
11)
(0.0
72)
(0.0
67)
(0.0
66)
(0.0
89)
(0.0
57)
SH
Gh
ou
seh
old
-0.1
30∗∗
∗-0
.112∗
-0.1
51∗∗
∗-0
.084
0.0
14
-0.0
68
0.0
27
(0.0
30)
(0.0
67)
(0.0
44)
(0.0
52)
(0.0
40)
(0.0
48)
(0.0
30)
p-v
alu
eV
illa
ge=
SH
G0.1
20.7
90.0
70.1
20.2
90.9
00.8
4M
ean
inW
ard
villa
ges
0.7
95
0.6
27
0.3
84
0.2
63
0.7
47
0.6
56
0.8
32
Nu
mb
erof
Ob
serv
ati
on
s1385
1369
1387
1387
1387
1387
1387
Rsq
uare
d0.0
94
0.0
30
0.1
24
0.1
43
0.0
84
0.1
34
0.1
30
Data
are
for
1,3
87
non
-ad
op
tin
gh
ou
seh
old
sth
at
wer
esu
rvey
edin
bet
wee
nh
arv
esti
ng
du
rin
gth
efi
rst
seaso
nan
dp
lanti
ng
for
the
seco
nd
seaso
n.
Th
ed
epen
den
tvari
ab
les
are
as
follow
s:C
olu
mn
1is
an
ind
icato
rfo
rw
het
her
the
resp
on
den
th
as
ever
hea
rdof
Sw
arn
a-S
ub
1p
rior
toth
ein
terv
iew
.C
olu
mn
2is
the
nu
mb
erof
oth
erfa
rmer
sin
the
villa
ge
talk
edto
ab
ou
tS
warn
a-S
ub
1.
Colu
mn
3is
an
ind
icato
rfo
rse
lect
ing
both
flood
tole
ran
cean
dhu
skco
lor
as
the
main
diff
eren
ces
bet
wee
nS
warn
aan
dS
warn
a-S
ub
1.
Colu
mn
4is
an
ind
icato
rfo
rkn
ow
led
ge
that
Sw
arn
a-S
ub
1ca
nsu
rviv
eu
pto
2w
eeks
wh
enth
efi
eld
isfl
ood
edd
uri
ng
the
veg
etati
ve
stage
of
the
gro
win
gse
aso
n.
Colu
mn
5is
an
ind
icato
rfo
rkn
ow
ledge
that
Sw
arn
a-S
ub
1is
most
ap
pro
pri
ate
for
med
ium
lan
dw
her
efl
ash
flood
ing
occ
urs
.C
olu
mn
6is
an
ind
icato
rfo
rkn
ow
led
ge
of
how
Sw
arn
a-S
ub
1w
as
dis
trib
ute
din
the
villa
ge
(eit
her
SH
Gm
eeti
ng,
villa
ge
mee
tin
g,
or
via
ward
mem
ber
).C
olu
mn
7is
an
ind
icato
rfo
rkn
ow
led
ge
that
the
du
rati
on
(tim
efr
om
pla
nti
ng
toh
arv
est)
of
Sw
arn
a-S
ub
1is
ap
pro
xim
ate
ly140
days.
All
regre
ssio
ns
incl
ud
eb
lock
fixed
effec
ts.
Sta
nd
ard
erro
rsth
at
are
clu
ster
edat
the
villa
ge
level
are
inp
are
nth
eses
.A
ster
isks
ind
icate
that
coeffi
cien
tis
stati
stic
ally
sign
ifica
nt
at
the
1%
∗∗∗,
5%
∗∗,
an
d10%
∗le
vel
40

Table A4: Effects on revealed demand when pooling village and SHG meeting villages to-gether
(1) (2) (3) (4) (5) (6)Buy Buy 5 KG Buy 10 KG Buy Buy 5 KG Buy 10 KG
Village or SHG -0.005 0.007 -0.012 -0.005 0.012 -0.017meeting (0.047) (0.041) (0.031) (0.046) (0.040) (0.031)
Field day 0.123∗∗ 0.086∗∗ 0.037 0.123∗∗∗ 0.084∗∗ 0.039(0.047) (0.042) (0.032) (0.046) (0.041) (0.032)
HH Controls No No No Yes Yes Yes
Strata FE Yes Yes Yes Yes Yes YesMean in non-field day villages 0.297 0.147 0.150 0.297 0.147 0.150Mean in Ward villages 0.357 0.185 0.172 0.357 0.185 0.172Number of Observations 1384 1384 1384 1384 1384 1384R squared 0.043 0.028 0.013 0.062 0.043 0.029
The dependent variable in columns 1 and 4 is an indicator for whether the farmer purchased Swarna-Sub1when given a sales offer. The dependent variable in columns 2 and 5 is an indicator for purchase of 1 seedpackage (5 kg). The dependent variable in columns 3 and 6 is an indicator for purchase of 2 seed packages(10 kg). Household controls are indicator for ST or SC, indicator for BPL card, indicator for NREGS jobcard, cultivated area, indicator for thatched roof, indicator for mud walls, education of the farmer, age ofthe farmer, indicator for SHG membership, indicator for private tubewell ownership, and elevation of thehousehold. Standard errors that are clustered at the village level are in parentheses. Asterisks indicate thatcoefficient is statistically significant at the 1% ∗∗∗, 5% ∗∗, and 10% ∗ levels.
41
Figure A1: Distribution of surname connections for sample of non-adopting farmers
0.2
.4.6
Shar
e of
farm
ers
0 1 2 3 4 5 6 7 8 9 10 11Early adopters with same surname
Notes: The figure uses the data for 1,387 non-adopting farmers to plot the histogram of the number ofearly adopters with the same surname. The average farmer in the sample shares a surname with one earlyadopter.
42

Figure A2: Distribution of number of early adopter plots within 250 and 500 meters of thehousehold
0.2
.4.6
Shar
e of
farm
ers
0 5 10Early adopter fields w/in 250m
0.2
.4.6
Shar
e of
farm
ers
0 5 10 15 20Early adopter fields w/in 500m
Notes: The figure uses the data for the sample of 1,340 non-adopting farmers to plot the histogram of thenumber of early adopter fields within 250 meters (the left panel) and 500 meters (the right panel) of thehousehold. There are 47 households for which we did not have GIS coordinates.
43

Table A5: Effects of farmer field days in SHG villages with household controls(1) (2) (3) (4)
SHG villages SHG villages Other villages Other villagesField day -0.093 -0.080 0.148∗ 0.144∗
(0.119) (0.097) (0.088) (0.073)
Field day * HH has 0.208∗ 0.006SHG member (0.120) (0.091)
HH has SHG member -0.009 0.065(0.089) (0.054)
Field day * 0.276∗∗ 0.024Friend/family of SHG president (0.106) (0.082)
Friend/family of SHG -0.120 0.078president (0.096) (0.059)
Strata FE Yes Yes Yes Yes
HH Controls Yes Yes Yes YesMean in non-field day villages 0.350 0.350 0.273 0.273Number of Observations 445 445 939 937R squared 0.113 0.112 0.064 0.068
The dependent variable in all columns is an indicator for whether the farmer purchased Swarna-Sub1 whengiven a door-to-door sales offer. The data are for SHG villages only in columns 1 and 2 and for wardmember and village meeting villages in columns 3 and 4. Household controls are indicator for ST or SC,indicator for BPL card, indicator for NREGS job card, cultivated area, indicator for thatched roof,indicator for mud walls, education of the farmer, age of the farmer, elevation of the household, and anindicator for ownership of a private tubewell. Standard errors that are clustered at the village level are inparentheses. Asterisks indicate that coefficient is statistically significant at the 1% ∗∗∗, 5% ∗∗, and 10% ∗
levels.
44