IDENTIFIRS - ERIC
227
ED 101 478 TITLE INSTITUTION SPONS AGENCY PUB DATE NOTE AVAILABLE FROM DOCUMENT RESUME 80 EA 006 763 School Finance in Transition. Proceedings of the National Conference on School Finance (16th, Atlanta, Georgia, April 1-3, 1973.) Florida Univ., Gainesville. Inst. for Educational Finance.; National Educational Finance Project, Gainsville, Fla. Bureau of Elementary and Secondary Education (DHEW/OE), Washington, D.C. Apr 73 227p. Institute for Educational Finance, 1212 S.W. 5th Avenue, Gainesville, Florida 32601 ($2.75, PB; $3.75, HB) EDRS PRICE MF-$0.76 HC-$12.05 PLUS POSTAGE DESCRIPTORS Capital Outlay (for Fixed Assets); *Educartional Economics; *Educational Finance; Educational Legislation; Elementary Secondary Education; Equal Education; *Finance Reform; Full State Funding; Private Schools; Productivity; *School Support; *School Taxes; State Aid; Supreme Court Litigat_nn; Teacher Supply and Demand IDENTIFIRS Elementary Secondary Education Act Title V; ESEA Title V ABSTRACT This document contains the proceedings of the 16th annual National Conference on School Finance. The Conference participants included representatives of State education agencies, professional associations, and State legislatures, as well as professors of school finance. Topics discussed include fiscal neutrality, cost differentials and cost indices, the supply and demand of educational personnel, measuring productivity in education, full State funding of capital outlay, public funds and nonpublic schools, equal educational opportunity, educational legislation, and court decisions. Presentations also consider alternative fiscal solutions to equity problems in public school finance the prospects for alternative tax sources for education, and school finance reform in the States. (Author/DN)
-
Upload
khangminh22 -
Category
Documents
-
view
5 -
download
0
Transcript of IDENTIFIRS - ERIC
ED 101 478
TITLE
INSTITUTION
SPONS AGENCY
PUB DATENOTEAVAILABLE FROM
DOCUMENT RESUME
80 EA 006 763
School Finance in Transition. Proceedings of theNational Conference on School Finance (16th, Atlanta,Georgia, April 1-3, 1973.)Florida Univ., Gainesville. Inst. for EducationalFinance.; National Educational Finance Project,Gainsville, Fla.Bureau of Elementary and Secondary Education(DHEW/OE), Washington, D.C.Apr 73227p.Institute for Educational Finance, 1212 S.W. 5thAvenue, Gainesville, Florida 32601 ($2.75, PB; $3.75,HB)
EDRS PRICE MF-$0.76 HC-$12.05 PLUS POSTAGEDESCRIPTORS Capital Outlay (for Fixed Assets); *Educartional
Economics; *Educational Finance; EducationalLegislation; Elementary Secondary Education; EqualEducation; *Finance Reform; Full State Funding;Private Schools; Productivity; *School Support;*School Taxes; State Aid; Supreme Court Litigat_nn;Teacher Supply and Demand
IDENTIFIRS Elementary Secondary Education Act Title V; ESEATitle V
ABSTRACTThis document contains the proceedings of the 16th
annual National Conference on School Finance. The Conferenceparticipants included representatives of State education agencies,professional associations, and State legislatures, as well asprofessors of school finance. Topics discussed include fiscalneutrality, cost differentials and cost indices, the supply anddemand of educational personnel, measuring productivity in education,full State funding of capital outlay, public funds and nonpublicschools, equal educational opportunity, educational legislation, andcourt decisions. Presentations also consider alternative fiscalsolutions to equity problems in public school finance the prospectsfor alternative tax sources for education, and school finance reformin the States. (Author/DN)

School Finance In Transition
U S DEPARTMENT OF HEALTHEDUCATION t WELFARENATIONAL INSTITUTE OF
EDUCATIONTIPS DOCuMLN .las RI EN REPROOUCED C*A,.t,v A, 14f CI OA I) IROMTHE PE R',ON CA:,,NI/AT ON ORIGIN
Nc. T Ao 014 OPINIONSSTATED NI, Y RE PRE%I NT OI ,C .Ai NA,IONi.: INST. TOTE OfI MICA T.ON ION OW POI ICY
Proceedings of the 16th National Conference on School Finauce
April 1.3, 1973Sheraton Biltmore Hotel
Atlanta, Georgia
Sponsored by the
National Educational Finance Projectand the
Institute for Educational Finance1212 S.W. 5th Avenue
Gainesville, Florida 82601
111

CONFERENCE PLANNING COMMITTEE
KERN ALEXANDER, National Educational Finance Project
JEAN FLANIGAN, National Education Association
JAMES GIBBS, School Finance Task Force, U.S. Office of Education
BYRON HANSFORD, Council of Chief State School Officers
ALAN HICKROD, Illinois State University
K. FORBIS JORDAN, 1:\ a tional Educational Finance Project
WILLIAM McLURE, University of Illinois
HARRY PHILLIPS, School Finance Task Force, U.S. Office of Edu-cation
JAMES ROSE, University of Colorado
NATIONAL EDUCATIONAL FINANCE .PROJECTKERN ALEXANDER, Project Director
ROE L. JOHNS, State Assistance Director
K. FORBIS JORDAN, Research Director
PROJECT COMMITTEEFLOYD CHRISTIANCommissioner of Education,Florida Ministering
State
KENNETH MADDENCommissioner of Education,Delaware
LYMAN GINGERSuperintendent of PublicInstruction, Kentucky
GARVIN H. JOHNSTONSuperintendent of PublicInstruction, Mississippi
DON BARNHARTState Superintendent,South Dakota
J. W. EDGARCommissioner of EducationTexas
I-
PROGRAM ADMINISTRATORSU.S. Office of EducationHARRY PHILLIPS
.JAMES GIBBSDAVID PHILLIPS
Financed by Funds Provided Under The Me-mentary and Secondary Education Act of 1965(Public Law 89.10, Title V, Sec. 505) and Spon-soring States.
This public document was promulgated at thecost of $5.93 per copy to provide information toand strengthen state education agendes.

CONTRIBUTORS
KERN ALEXANDER, Professor of Educational Administration andDirector, Institute for Educational Finance, University of Florida,Gainesville
%V. MON FORT BARR, Professor of Education, Indiana University,Bloomington
CHARLES S. BENSON, Professor of Education, School of Education,University of California at Berkeley
WILFRED J. BROWN, Coordinator of Economic Studies, CanadianTeaci.ters Federation, Ottawa, Ontario
BOB N. CAGE, Director of Institutional Research, University of Mis-sissippi, Oxford
JOHN J. CALLAHAN, Advisory Commission on IntergovernmentalRelations, Washington, D.C.
ALFORD R. SKIP CAREY, JR., Executive Director, State of Mary-land Public School Construction Program
PAUL D. CARRINGTON, Professor of Law, University of Michigan,College Park
CARL J. DAEUFER, College of Education, Curriculum Research De-velopment Group, University of Hawaii, Honolulu
EDI) DOERR, Director of Educational Relations, Americans Unitedfor Separation of Church and State, Silver Spring, Maryland
ROBERT J. GOETTEL, Associate Director, Educational Finance andGovernance Program and Administrative Director of the PolicyInstitute, Syracuse University Research Corporation
JAInstitute,
A. HALE, Assistant Professor of Educational Administration,University of New Mexico, Albuquerque
G. ALAN HICKROD, Professor of Educational Administration, Il-linois State University
RODNEY J. KUHNS,Business Manager of Area Schools, Towanda,Pennsylvania
THEODORE H. LAVIT, Attorney-At-Law, Lebanon, KentuckyJACK I. MARCUSSEN, Work-Study Programs Coordinator, Mil-
waukee Public Schools, Milwaukee, WisconsinS.P. MARLAND, JR., Assistant Secretary for Education, Department
of Health, Education, and Welfare, Washington, D.C.THOMAS H. MORAN, Department of Educational Administration,
University of Wisconsin, MadisonJAMES A. PAPKE, Professor of Economics, Purdue University, Lafay-
ette, IndianaSCOTT N. ROSE, Assistant Superintendent for Business Affairs,
School Board of Brevard County, Titusville, FloridaRICHARD A. ROSSMILLER, Professor, Department of Educational
Administration, University of Wisconsin, MadisonWILLIAM H. WILKEN, Assistant Professor, Political Science De-
partment, Georgia State University, AtlantaWILLIAM R. WILKERSON, Associate Professor of School Admin.
istration, Indiana University, Bloomington

TABLE OF CONTENTS
GETTING BACK TO BASICS
Page
S. P. Mar land, JrSCHOOL FINANCE REFORM IN THE STATES: WHAT SHOULD BE DONE?
John W. Callahand andWilliam Wilken 9
ALTERNATIVE TAX SOURCES FOR EDUCATION: PERSPECTIVE ANDPROSPECTS
James A. Papke 31
APPROACHES TO EQUITABLE FINANCING OF EDUCATION IN CANADA:FEDERAL PROVINCIAL TAX-SHARING AND PROVINCIAL FINANCING
Wilfred J. Brown 47
ACCOMPLISHING FISCAL NEUTRALITYCharles S. Benson 55
COST DIFFERENTIALS AND COST INDICES: THE ASSESSMENT OF VARI-ATIONS IN EDUCATIONAL PROGRAM COSTS
Rossmiller and Moral 63
EDUCATIONAL PERSONNEL: SUPPLY AND DEMAND (THE TEACHERCASE UNDER OLIGOPOLY)
James Hale 79
MEASURING PRODUCTIVITY IN EDUCATIONBob N. Cage 93
CONSTITUTIONALITY OF THE TITLE I ESEA FORMULA: INVERTEDAND REG:IESSIVE
Theodore H. Vavit andKern Alexander 109
RECENT COURT DEr:ISIONS AND SCHOOL. CAPITAL OUTLAYWilkerson and Barr 135
THE MARYLAND EXPERIENCE: FULL STATE FUNDING OF CAPITALOUTLAY
Alford R. "Skip" Carey, Jr. . . . 145
PUBLIC FUNDS AND NONPUBLIC SCHOOLSEdd Doerr 151
"EQUAL JUSTICE UNDER LAW" AND SCHOOL FINANCE: AN APPRECIA-TION OF RODRIGUEZ
Paul D. Carrington 159
ALTERNATIVE FISCAL SOLUTIONS TO EQUITY PROBLEMS IN PUBLICSCHOOL FINANCE
C. Alan HickrodABSTRACTS OF NATIONAL SCHOOL FINANCE CONFERENCE AWARD
WINNING DISSERTATIONS
179
219

ForewordThe 16th annual National Conference on School Finance provided
another outstanding forum for the discussion of school finance issues.The Conference participants included representatives of state educa-tion agencies, professional associations, and state legislatures, as wellas professors of school finance. Sponsorship for the 16th National Con-ference was provided by the National Educational Finance Projectand the Institute for Educational Finance at the University of Florida.The National Education Association's decision to drop sponsorship forthe Conferences has resulted in the necessity to seek other avenues forcontinuation of the Conference. The 1974 Conference will again besponsored by the Institute of Educational Finance, but continued spon-sorship after 1974 remains uncertain.
In the aftermath of the U.S. Supreme Court's ruling in Rodriguezthere was a very high level of interest in various portions of the Con-ference. Attendance was very high in the various group discussionsrelated to state school finance proposal, under consideration by vari-ous states.
The continuing goal of the Conference has been to provide aforum for the expression of different points of view and thereby con-tribute to a better understanding of the multiple problems involvedin developing state school finance programs. The views expressed bythe presenters were their own and do not necessarily reflect views orpolicies of the Conference Sponsors.
Once again, the winners of the awards presented abstracts of theirdoctoral dissertations in school finance. The sponsors wish to expressappreciation to those members of the Conference Planning Committeewho served as a committee of judges for the awards.
Special recognition should be given to the program presenters,reactors, and Conference participants. This group of dedicated edu-cators provides the continuing life thread of the Conference. TheConference CoChairmen wish to express their appreciation to themembers of the Conference Planning Committee for their assistanceand to the staff of the Institute who contributed to the Conference andproceedings: Nelda Cambron, Carol Hanes, Thomas Melcher, HansMercer, Juhan Mixon, James Stultz, Stephen Thomas, Sandra Watson,and Jerry Wiblemo.April, 1973
0'1
K. Forbis JordanKern AlexanderCoChairmen

Getting Back to BasicsS. P. MARIAN% JR,
Assistant Secretary fur Education. Department of Health. Education, and Wel-fare.
In an interview published a couple of weeks ago, Walter Lipp-mann, now 83 years old and looking back over many decades of inti-mate observation of U.S. political experience, said he has come to theconclusion that he doesn't believe in trying to achieve human perfec-tion through government action.
"I believe," he said, "in what we used to call meliorism. You canmake things better, but you can't make them perfect."
In this sense, I think most of us in this room would happily con-sent to call ourselves meliorists, too. For "making things better," asLiepmann puts it, seems to aptly express the necessarily limited socialobjectives we have set for the 70's, echoing a new mood of restraintthat surrounds great issues such as school finance reform and theproper Federal role in the education enterprise. We are no longermaking headlong excursions and excessive promises, but in the lightof 10 years' experience with Federal initiatives, making reform thetheme of our work.
The Administration's advocacy of education revenue sharing af-firms this total departure from the absolutism that prevailed in re-cent years, particularly in Washington. The President is saying thatin order for this Nation to go forward, it must first restore certainfundamental principles of our governmental system, restore an atti-tude of respect and tolerance for all partners in this Federal educa-tional enterprise, andperhaps most importantrestore a humanlymodest appraisal of just what it is we are capable of doing with Fed-eral dollars, assuming, as I hope, a continuing and increasing Federalrole constructed in a spirit of self-appraisal by Congress and the Ex-ecutive Branch.

2 School Finance in Transition
I think that appraisal should go something like this:We can ameliorate the problems of America, but we cannot Wit-
crate them, and it is explosively harmful, as we have learned, to mis-lead the public into thinking that we can. Thus, all the theories wedevise and all the programs we design amount only to hopeful at-tempts, nothing more, to unravel the knotted strands of America'seducational problems, and then to knit them back together into whatwe believe will be a more orderly, useful, and just pattern.
But we will not know, and cannot know, whether what we do iswholly right, or even fractionally right, until the solutions succeed,or fail. We recognize, in short, as Alfred North Whitehead observed,that all truths are in reality half-truths, and it is trying to treat themas whole truths that plays the devil.
I hope you realize what a tremendous act of self-denial it is fora Washington type to concede that the complete truth may be moreavailable to God and the States than to our everlasting bureaucracy,particularly when, not long ago, reform of education, among otherthings, seemed to be rapidly turning into a Washington monopoly.
Now, many billion dollars later, some people question whetherthe Federal Government should intrude at all in educational matters,other than continuing to mail out checks. These theorists are busyformulating a newer but equally invalid species of the truth. Theysee revenue sharing and the general thrust for governmental decen-tralization reducing the Federal education establishment to the som-nolence of 15 years ago, a time that is, when few people knew whatthe government was doing about, education or took the trouble tofind out.
I dispute this ovetreactive, oversimplified version of the Federalfuture. It could well he, for example, that the Supreme Court's de-cision of March 21 will have the effect of stimulating a !Feat deal ofFederal involvement in the drive to correct the economic disparitiesof our school support system. Certainly the decision does not ruleout such an expanded Federal role consistent with the President'scommitment to school finance reform in his 1972 State of the Unionmessage. He spoke in the document of "providing both fair and ade-quate financing for our children's educationconsistent with the prin-ciple of preserving the control by local school boards over localschools."
There arc several way; the Federal Government could help dothis. In the grants consol!dation proposal before Congress, for ex-ample, there are five ams in which the States and localities wouldhe directed to spend the shared revenuesthe disadvantaged, thehandicapped, vocational education, impact aid, and supporting serv-ices.
A fifth area of aidthe priority to achieve equality of educationalopportunitycould easily be added if needed, enabling the Govern-ment to pick up part of the cost of education in any State that agreedto equalize its own school resources. Let me stress that I am not de-claring a new Federal policy on this subject. But I find the idea rea-sonable and attractive, and worth your close examination.
9

Back to Basics 3
My own feelings regarding the Rodriguez decision are mixed. Ido see it as a strong reaffirmation of the principle of shared powersand the ultimate authority of the State in education. It underscoresthe spirit of cooperative trust which is the real foundation of gov-ernment in this country and without which no education laws, orany others for that matter, can have any useful effect. And, finally,the decision shuns the assumption that all issues must ultimately beresolved by the Federal Government.
But I'll be honest: I was expecting and perhaps even anticipatinga vote that would have thrown out the property tax as the economicfoundation of the schools, as Mr. Rodriguez had petitioned. Perhapsin my anxiety to correct financial inequity, I was willing to counte-nance what would amount to governmental inequity, assuming un-consciously, as do opponents of revenue sharing, that the States simplyaren't up to the job, or that they need inescapable legal coercion tomove purposefully toward ensuring true equality of educational op-portunity.
But if some States are indeed giving inequitable support to educa-tionand some undoubtedly arethe Court's view is that they shouldbe shored up, not that the system should to all practical ends be aban-doned. The Court recognized that its decision may well delay theadvance of necessary fiscal reform in education, but was willing totake that chance because it believes that the proper instrument foraction is the State legislature, and the proper reason to act is thereasoned conviction of responsible State officials, and certainly not acourt order. Much as 1 want to see fiscal reform in education, I donot want it at the price of further abdication of educational leader-ship to the bench at any level.
Whatever the arguments that can be made about the question ofwho should do what, the Court has spoken and the responsibility forfiscal reform now lies with the governors and legislatures of the States,as well as with the State courts, should it be necessary to resolve thisthrough the judicial process, which I hope can be avoided. The greatquestion now is, how well will the States respond? For with the ballin their court, it becomes clearly their responsibilityone many ofthem have not discharged with distinction in the pastto lift up thepoorer school districts with increased funding. Some may take theCourt's decision as a reason to slough off and even to abandon theentirely hopeful beginnings of reform that are now under way. I hopethey will not and, indeed, 1 am confident they will not. For surround-ing this issue, I believe we can see at the State level a new and neces-sary commitment to equality of opportunity.
Governors and legislators in a number of States are respondingaffirmatively to Justice Powell's caution in the majority opinion thatthe Court "is not to be viewed as placing its judicial imprimatur onthe status quo," and his warning, further, that "the need is apparentfor reform in tax systems which may well have relied too long andtoo heavily on the local property tax." The Court does not believethat school finance calls for intervention from the Federal bench, butall nine justices were agreed that the Texas school finance system,

School Finance in Transition
and by implication all the rest save Hawaii, are ter ibly wrong andunjustly erratic in the quality of education th:, t %milts from districtto district.
In Maryland, for example, the decision found the legislature inthe middle of putting together an effort to help equalize school financ-ing between rich and poor counties. An editorial in a Baltimore paperobserved that rich-county spokesmen immediately seized upon thedecision as a "victory" in that the Supreme Court was apparently say-ing that the equalizing task was no longer necessary.
But Governor Mandel, fortunately, hasn't seen it that way, andhe is going ahead with all determination, intending that his Statewill face up to the public educational responsibilities spelled out inits own constitution.
Likewise, the Oregon legislature approved on the day followingthe Court's decision a plan under which the State would assume vir-tually all public school operating casts. The plan will be- offered tothe people in a special election May 1.
I am confident that reform efforts will continue to be backed bygovernors, legislative leaders, and chief State school officers, not nec-essarily because there are more than 50 lawsuits pending in 32 Statesthough I admit legal pressure helpsbut because these men andwomen are responsible. humane individuals who understand and re-ject the educational deprivation and the long-standing deficits inequity that are the inevitable result of the severe economic disparitiesamong and within the States. Illustrative is the new policy positionadopted by the National Governor's Conference last Lune whichstated:
"The State role in financing elementary and secondary educa-tion is the most vital issue currently facing the States. . . . Stateaction to achieve equal educational opportunity must beginimmediately, progress rapidly, and have the aggressive leader-ship of elected officials in State Government."II.
. . Review of the issues and approaches underscores onecritical pointthe wide variety of alternatives prevents a 'bestsolution.' Nevertheless, States must focus on one prime objec-tiveelimination of local wealth as the major determinant ineducational opportunity."
The HEW School Finance Task Force, under the direction ofReed Saunders, has gathered further evidence of the active pursuitof economic justice at the State level:
The Wisconsin legislature, for example, is considering legislationsponsored by Governor Lucy which would provide property tax re-lief, increase the State's share of the cost of public education, and in-sure that all districts have an equal capacity to provide high qualityeducation .programs.
In Maine, Governor McCarter has sponsored legislation whichwould provide for full State funding at levels of $630 per elementaryschool pupil and $945 per secondary school pupil. In addition, ex-
1

hack to Basics 5
ceptional operating costs for special education, vocational etiMati011,and those due to geographic isolation would under this proposal beprovided by the State.
In California, Governor Reagan last December won a five-ye--battle to reform the. State's educational financing system when thelegislature enacted II $1 billion-plus tax-shift plan hicreasing theState's share of the cost of publk schools from 35 percent to 50 per-cent over a period of years, including an easing of the really heavyburden borne by property owners in that State. Serrano, 1 am sure,helped hem.
Governor Milliken of Michigan has, of course, been a long-timeproponent of reform and was, 1 believe, the first governor to advocatenear total State funding of schools. At this moment he is sponsoringlegislation which stipulates an "equal yield" formula of State aiddistribution to assure, among other things, that equal property taxeffort will bring in the same number of dollars per pupil in virtually
_every school_ilistrict in the State.Governor Wendell Anderson of Minnesota was able, just about
the time of the Serrano decision, to persuade his legislature to raiseliquor, cigarette, sales, and income taxes, and to use the extra reve-nues produced to, first, lower real estate taxes and, second, come upwith $600 million in new funds to increase State education supportfrom the 43 percent of 1971 to 70 percent today. Anderson is nowasking the legislature for still more funds for educational purposesover the next two years in order to raise per-pupil expenditures inall the poorer districts to a statewide average within six years.
While the legislatures of these and many other States have beenmoving to ease fiscal inequities among their districts and studyingother alternatives to the financing problem, you may be wonderingwhat's been happening back at the HEW ranch.
A very general answer would be that we are planning how ourorganization can most effectively adjust to the conditions of large-scale grant consolidation which this Administration has proposedand, at the same time, do the best we can to help the States resolvesuch problems as finance. The Better Schools Act of 1973, as youknow, would consolidate some 30 existing State formula grant pro-grams into a vastly simplified aid package, sharing the Federal reve-nues while shifting administrative responsibility to the States andlocalities. As you can appreciate, this means a major overhaul at theFederal level, particularly in the Office of Education which operatesmost of the various categorical programs which we now propose toconsolidate into five broad national-purpose areas.
Simply stated, we must now assume a new role that will best fitour capacities -Ind san resources as well as match the needs of theclients we serve. My conviction is that this role will be largely metthrough expanded technical assistance by the entire Education Di-vision of HEW. In this as yet unrefined conception, we would serveas a national resource, a cooperative centralized bank of information,counsel, discretionary funds, and research, linking the problems andexperiences of the States and communities into a national network

6 School Finance in Transition
of educational knowledge.There has been ample opportunity in the past to fashion ration-
ally a Federal role of this kind, but the onset of massive Federal as-sistance to elementary and secondary education in th! 1960's com-manded that OE exercise stewardship over these funds and developgrants management procedures as distinct from educai Tonal leader-ship procedures. Consumed by these responsibilities, the agency's ca-pacity to render technical assitance waned. But now the movementfrom a categorically based funding posture toward a :lore generalfinancial support means that it is not simply desirable but essentialthat we construct the new role, mission, and purpose in life, consistentwith what we should have been doing over the years.
The technical assistance function that I am speaking about wouldbe quite apart and distinct from the programmatic roleand bear inmind that there will continue to he categor' .1 programs under reve-nue sharing. Actually, we will still be responsible for several billiondollars' worth, including a greatly expanded higher education studentaid effort as well as continuing discretionary resources for educationalreform. Thus, technical assistance would encompass, first, our researchand dissemination functions which are now centralized in the Na-tional Institute of Education; second, the new Fund for the Improve-ment of Postsecondary Education; and, third, a reoriented role forthe Office of Education itself as a center for professional expertise inteaching and learning as distinct from paper passing.
Correspondingly, the emerging movement toward increased Stateresponsibility for the expenditure of Federal funds, and the immenseimpact this shift in policy will produce at the State level, make itimperative for the Education Division to provide leadership andassistance and direction through presenting to State and local systemsalternative means of dealing with pressing problems.
How will this work? In a thousand ways in actual practice, ofcourse, but, in general, the various Education Division componentsmust study deeply and advise on matters of national educational needand inform Congress on progress toward meeting them. Further, theorganization could be a prompter, facilitator, and advocate in a va-riety of constructive Federal and State or Federal, State, and localjoint initiatives in education and in this way eliminate some of theroadblocks to delivery of Federal services. This new position would,of course, be entirely advisory in contrast to the authoritarian regu-lation-enforcing characteristics of the categorical design. This intri-guing metamorphosis is a direct expressinn of the philosophy under-lying the Better Schools Act of 1973 which looks to the States as theinitiators and leaders of the reform and renewal of their own housesof education. Helping them do their job will be our basic purpose.
The conception really isn't all that new as far as the Office of Edu-cation is concerned, however, and we intend to build carefully andsubstantially upon OE's already extensive experience in providingtechnical assistance to SEA's a. LEA's, The agency has worked formore than a decade, for example, in helping districts desegregateunder the provisions of Title IV of the Civil Rights Act, a role we

Back iv Basics 7
hav'l expanded under the new Emergency School Assistance Program;our Right to Read specialists, in another area of technical assistance,find themselves at this point literally swamped !I requests for help,and are quite frankly unable to. do all they are asked to do; anotherexample can be found in the ESEA Title I State Program Reviewswhich were designed to determine how the State, were handling thelaw's mandates; still another is the State Management Review ac-tivity in the later 60's and early 70's under the ESEA Title V pro-gram. The SMR's started out only as a check on State administrationof Federal funds, but later expandedat the States' request, of courseto embrace review and recommendations in all areas of State agencyadministrative functions. SN1R teams have visited all 50 States at leastonce and were in some States two or more times over the past twoyears.
The School Finance Task Force itself is right now 4ivinq us a
Federal
extensive and valuable insight into the possibilities forFederal technical assistance.
The Task Force was established in direct response to a commandfrom President Nixon to design solutions to elementary and second-ar) finance problems. Thus, its mission at first was to examine theschoo, finance situation in the States in the wake of the Serranodecision and to sort out the implications for large-scale Federal ac-tion. But its functions have gone well beyond that stage.
Over the past year this 10person team has been asked by 28States for technical assistance of some kind or other and in 17 Statesthis involved at least one and as many as five on-site visits. TwentyState education agencies, seven legislative staffs and four governorscommissions have been given assistance one or more times. But thatis not all. Analyses are being made, mostly under contract with out-side experts, of outstanding finance study procedures and of majorlegislation introduced this year. As part of a long-range strategy, aseries of substantial papers are now underway, partly by staff andpartly by outside experts, dealing with problems and issues rangingfrom property taxation to the dimensions of local control, that areof concern to State lawmakers in their efforts to improve financing ofthe schools. Thus, from this first year of substantial progress, we mayexpect the School Finance Task Force role to be an integral and con-tinuing part of the Education Division's responsibility for assisting theStates. We also see NIE as having a significant role in providing longoverdue answers to pressing questions. We need to know a lot morethan we do about such things as the correlation between educationalexpenditures and the quality of the instructional programs; abouthow to measure educational need and translate it into financial terms;about the variations in educational costs associated with differentcurriculum approaches and different children including the gifted,the handicapped, the geographically dispersed, and always the disad-vantaged.
The States in most instances have neither the facilities, the man-power, the time, or the money to dig out information through ex-tended research to analyze their own problems, to explore alternative

schwa Finance in Tramition
answers, or to find out what the other States are doing and whetherpractices and procedures developed in New York, as an example,might not be verlectly applicable in Ohio or Nevada or New Mexico.I believe the talucation Division can bridge that information gap andhelp in an important way to develop solutions that will work in allthe States, not as the expression of an inflexible, paper-theory nationalpolicy, but as a sensitively blended compound of national resource,State initiative, and local understanding.
In theory, of course, there. is nothing new in what I have told youtoday. The Federal education establishment has always been intendedto act as the catalyst that would facilitate and speed up the reactiontime between the kind of studies you are pursuing in public and pri-vate institutions and the implementation of usable new theories atthe classroom level. We were supposed to give the push that wouldfinally put educational reform in action.
Like the talent in the Bible, that sterling purpose of ours hadbeen lost, but is found again. This time, with your help, we intendto expand our capacity to help, not deluded that we are on the highroad to perfection and determined to sweep aside all that barn ourway, but in a humbler, wiser, and certainly more realistic comprehension of just what the Federal Government can do for educationto help make things better.
Gazing into my crystal ball at 400 Mary:and Avenue, I predictthat over the next 10 years the Federal role in education will at leasttriple in dollars, diminish in categorical, dictatorial authority, andgreatly increase in the deliveryon callof sound, workable solutionsto the eternal problems which dog our pursuit of educational excel-lence.
41 J

School Finance Reform in the States:What Should Be Done?
JOHN J. CALLAHAN AND WILLIAM H. WII.KEN
Mr. Callahan, Advisory Commission on Intergovernmental Relations, Wash.ington. D.C.; Mr. Wilken is a member of the Political Science Department, GeorgiaState University,
Powerful judicial and political forces are now producing the mostsweeping revision of state school finance systems in American history.Since 1970, state courts have invalidated the school finance systemsof California, Michigan and New Jersey.' State legislatures have approved major revisions in the educational funding systems of Minnsota, Kansas, North Dakota and Utah.a Equally important, significantrevisions are now being discussed in states ranging from Maine toOregon.a
Regardless of the state, most proposals for school funding reformshare a common objective: equalization of school district taxes andexpenditures. Accordingly, it would be reasonable to anticipate thatreform programs would convey the greatest benefits to school districts with the most extraordinary fiscal needs and the most deficientfiscal resources. There is an increasing amount of evidence, however,which indicates that this expectation may prove unfounded, apecially for school districts in major cities.
Clearly, most major city school districts have exceptional fiscalproblems. Much more than most other school districts, they musteducate concentrations of minority pupils, must compete with municipalities for available tax dollars, most meet exceptional operatingcosts, and are deeply in debt.4 Close analysis of existing reform plans,however, indicates that many are unlikely to deal with these problemsany more effectively than existing state finance systems.
Wilken and Levin, for example, show that Minnesota's widely
9

10 School Finance in Transition
heralded school finance reform plan has produced significant reduc-tions in property tax rates and some increases in expenditures, buthas yielded very little redistribution of resources from the status quoante. Consequently, the state's city school districts are not much betteroff relative to all other districts today than they were prior to reform.
In the same vein. Berke-and Callahan suggest that one widely dis-cussed reform, full state funding, is likely to reduce major cities'school expenditures while increasing their school taxes.e Similarly, ananalysis of seven school finance reform plans proposed in Kansas,Michigan, Minnesota and New York indicates that only two wouldprovide cities with more than $200 per pupil in additional aid. Allthe others would cause cities to lose aid either to suburban or ruraldistricts.?
What, then, should be done? One recent and widely-read study ofschool funding argues that states can achieve "fair" equalization ofschool district finances by distributing aid in inverse relation to theper pupil revenue yield of local educational tax effort." Correspond.ingly, it asserts that several other widely discussed criteriaincome,municipal overburden, factor cost, and educational need are basicallyirrelevant, dismissing them as ". . . important to think about but notessential to act upon . . ." in any initial reform program.9 Focusingon the nation's major cities and their respective states, this paper eval-uates this judgment.
TAX EFFORT-REVENUE YIELD PARITY
On the face of things, equalizing school district revenues on thebasis of educational tax effort seems to be quite fair. As its proponentscontend, it would guarantee equal treatment to both taxpayers andschoolchildren regardless of their school district. Put another way, itwould make school finance a function of state wealth. Simulationanalysis, however, suggests that this prescription may be much lessequitable than it seems.
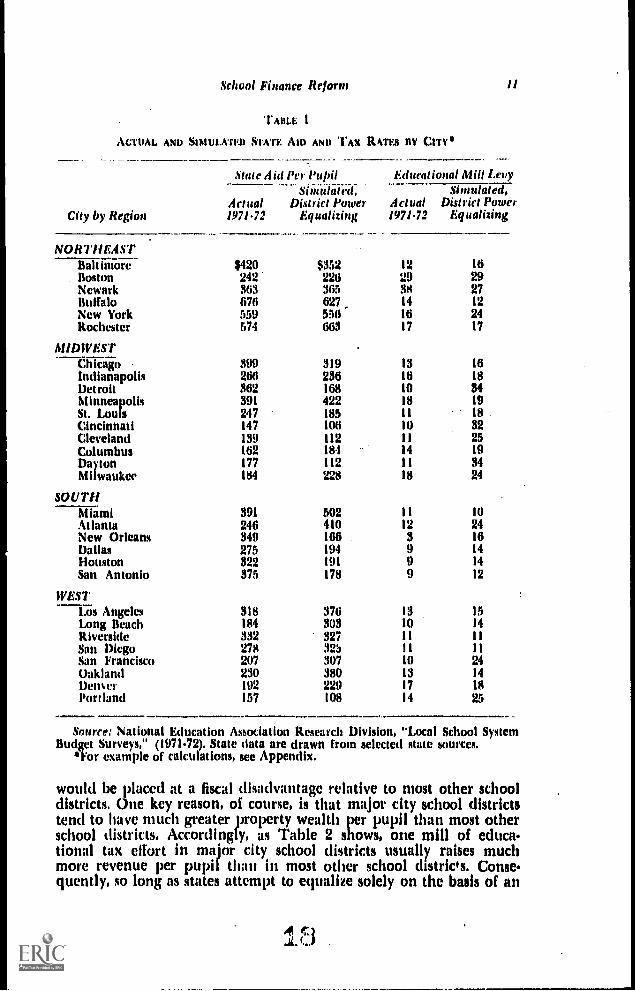
Assume, tor instance, that states with major city school districtsdecide to guarantee parity between educational tax effort and perpupil revenue through district power-equalizing aid systems. Assume,moreover, that the district power-equalizing aid systems require nonew state funds and that all school districts maintain their 1971.72expenditure levels. As Table 1 shows, this would result in a reduc-tion of state aid to about half of the nation's major city school dis-tricts, the unweighted mean aid occasionally decreasing by about 50percent. Additionally, almost all majo- city school districts would beforced to raise their tax ratesand owing to their relative propertywealth, often substantially. As Table 1 reveals, educational tax rateincreases of over 100 percent would be common with the average in-crement ranging between 50 and 60 percent.
But what if tax effort-revenue yield parity were assured throughanother type of state aid system? Or what if school districts elected ex-penditure levels greatly different from the 1971.72 levels? In eitherevent, most signs point to the fact that major city school districts
A 1^44
.
School Finance Reform
TABLE I
ACTUAL AND SIMULATED STATE Am AND TAX Rkms ay CITY
City by Region
Stale Aid
Actual1971.72
Per PupilSimulated,
District PowerEqualizing
Educational Mill LevySimulated,
Actual District Power1971.72 Equalizing
NORTHEASTBaltimore ;420 $332 12 16Boston 242' 226 29 29Newark 363 365 38 27Buffalo 676 627, 14 12New York 559 556 16 24Rochester 574 663 17 17
MIDWESTChicago 399 319 3 16Indianapolis 266 236 6 18Detroit 362 168 0 34Minneapolis 391 422 8 19St. Louis 247 185 1 18
Cincinnati 147 106 0 32Cleveland 139 112 I 25Columbus 162 184 4 19Dayton 177 112 1 34Milwaukee 184 228 8 24
SOUTHMiami 391 502 II 10Atlanta 246 410 12 24New Orleans 349 166 3 16Dallas 275 194 9 14
Houston 322 191 9 14
San Antonio 375 178 9 12
WESTLos Angeles 318 376 3 15Long Beach 184 303 0 14
Riverside 332 327 I IISan Diego 278 32S I 11
San Francisco 207 307 0 24Oakland 230 380 3 14Dent er 192 229 7 18Portland 157 108 4 25
Source: National Education Association Research Division, "Local School SystemBudget Surveys," (197142), State data are drawn from selected state sources,
For example of calculations, see Appendix,
would be placed at a fiscal disadvantage relative to most other schooldistricts. One key reason, of course, is that major city school districtstend to have much greater property wealth per pupil than most otherschool districts. Accordingly, as Table 2 shows, one mill of educa-tional tax effort in major city school districts usually raises muchmore revenue per pupil than in most other school districts. Conse-quently, so long as states attempt to equalize solely on the basis of an

12 School Finance in Transition
effort-yie.d relationship, major city school districts are likely to faceboth an increase in relative school taxes and a decrease in relativestate aid.
'FABLE 2
CrrvSTATE 1/111 PUPIL TAX YIELDS, 1971.72
City by Region
Revenue Yield Per Mill ofProperty Tax Effort
City/State RatioCity State
NORTHEASTBaltimore $ 23.38 S34.74 67Boston 20.79. 26.66 78Newark 11.76 26.72 44Paterson, CliftonPassaic N.A. N.A. N.A.Buffalo 25.19 34.99 72New York City 50.04 34.99 143Rochester 38.13 34,99 109Philadelphia 22.73 19.77 115
MIDWESTChicago 57.13 42.01 136Indianapolis 17.64 17.82 99Detroit 18.60 18.79 99Minneapolis 57.40 25.51 225Kansas City 26.99 23.07 117St. Louis 28.15 23.07 122Cincinnati 30.18 25.15 120Cleveland 31,94 25.15 127Columbus 21.88 25,15 87Dayton 26.66 25.15 106Milwaukee 29.91 27.95 107
SOUTHMiami 35.71 28.57 125St. Petersburg 21.11 28.57 74Atlanta 48.28 17.12 282Louisville 38.11 29.16 131
New Orleans 42.56 25.64 166Dallas 57.60 16.99 339Houston 42.31 16.99 249San Antonio 25,99 16.99 153
WEST-Ens Angeles-Long Beach (30.09/40.07 45.53 132/88
San Bernardino-Riverside-Ontario 53.88 45.53 118San Diego 49.63 45.53 109San Francisco-Oakland 112.63/66.01 43.53 247/145Denver 47.75 29.66 161
Portland 35.29 32.38 100
Source: National Education Association Research Division, "Local School SystemBudget Surveys," (1971.1972). State data are drawn from selected state educationdepartment reports.

School Finance Reform 13
Equalization and Income
But is this fair? This, of course, is debatable. It is quite clear, how-ever, that it ignores the fact that major city school districts must col-lect their property taxes, in part, from individuals whose incomes arenot very much higher than those living in most other school districts.As Table 3 indicates, per pupil property values yields in 42 of thelargest American cities are 26 percent greater than the unweightedaverage of their respective states, yet per capita incomes in the samecities are only 5 percent greater.
In one respect, however, even per capita incomes overstate thewealth of major city school districts. Although major city school dis-tricts have slightly above average per capita incomes, they not onlyhave a far greater concentration of poor families than most otherschool districts, but also have a relative lack of affluent families.As Table 4 reveals, the proportion of poverty families in the nation'smajor cities during 1969 was 10 percent greater than in their respec-tive states; moreover, the proportion of affluent families was 7 percentless.
Equalization and Wsnicipal Overburden
Equalization on the basis of educational tax yield not only failsto recognize that cities have a high concentration of poor people, butalso ignores the fact that cities face extraordinary noneducationalneeds and demands. As Table 5 shows, the nation's largest cities haveper capita, police expenditures that are 53 percent higher than theaverage of their respective states, have fire protection expendituresthat are 91 percent higher, and have refuse and disposal expendituresthat are 87 percent greater. Similarly, where the same cities have re-sponsibility for the function, health and hospital costs are 75 percenthigher, and sewage costs are 66 percent higher.
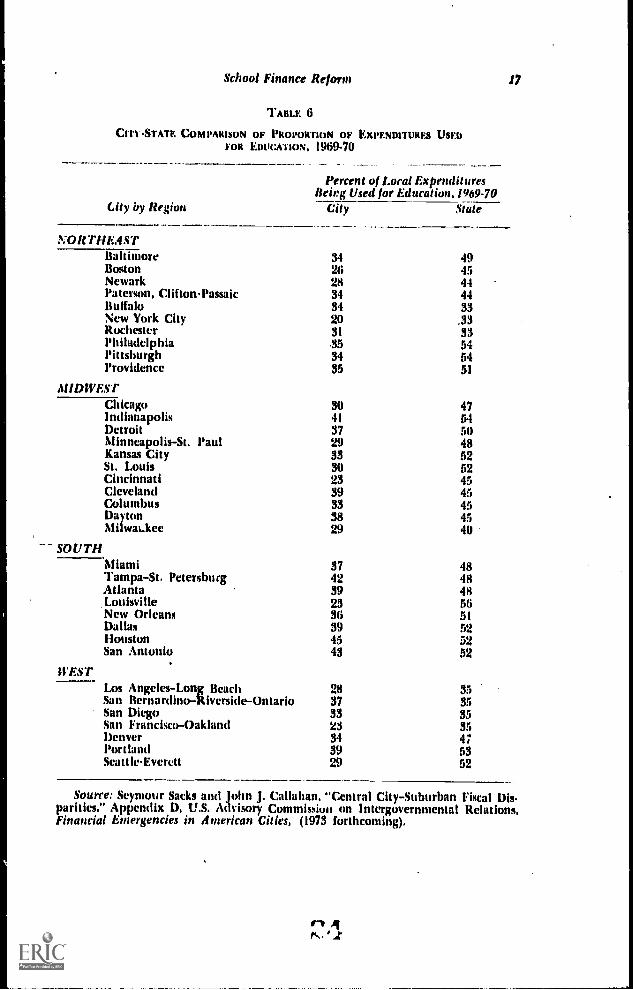
The higher cost of these services reflects itself in the much lowerproportion of local budgets that cities can allocate to education. AsTable 6 shows, central cities in the nation's 36 largest metropolitanareas allocate 33 percent of their budget for education, while theirsuburbs and local governments in the same states devote 57 percentand 46 percent respectively. Hence, if cities could devote the sameshare of their local expenditures to education as their surroundingsuburbs, they would outspend suburban and rural districts by far.
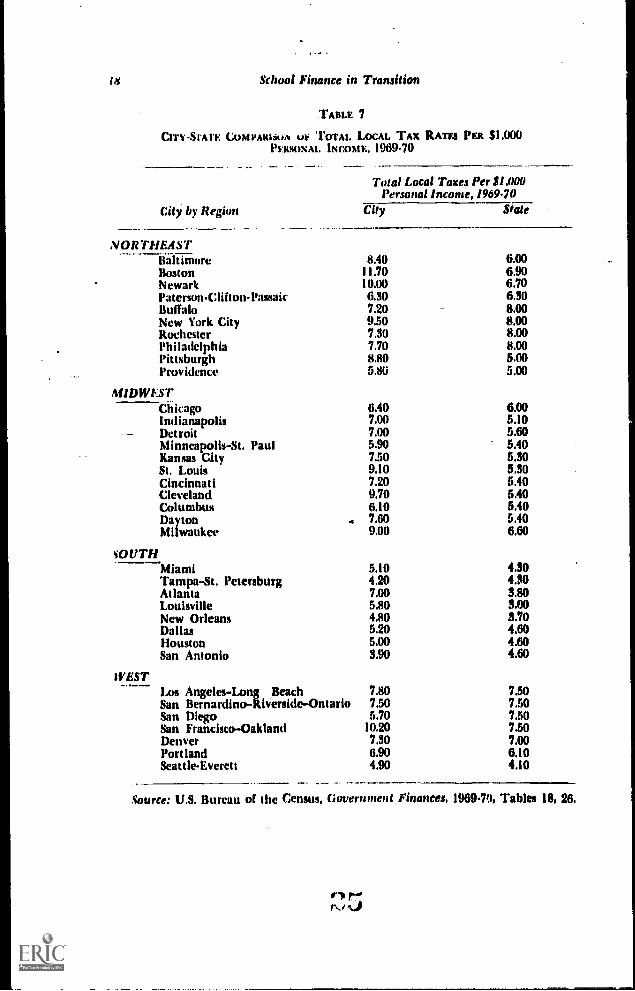
The retarding effects of municipal overburdens are especially no-table when one notes the level of effective major city local tax rates.As Table 7 shows, major city school districts not only have consider-ahle non-educational fiscal requirements, but they also have local taxrates that are rarely surpassed by other jurisdictions in a state. Thus,in the 36 central city areas surveyed, 16 have total local tax rates thatare more than 20 percent above the state average; while several havetax rates that range as high as 70 percent above the state average.These excessively high effective local tax rates make it virtually im-possible for these jurisdictions to raise their taxes for education or
rs.

14 School Finance in Transition
TABLE 3
CITY-TOSTATE RATIOS OF PER PUPIL PROPERTY VALUES AND PER CAPITAINCOME. 1970-1972
City.toState Ratio of:
PupilPupilPropertyValues,
(2)
Per CapitaIncome,
City by Region 1971.72 1970 (1)1(2)
NORTHEASTBaltimore 67 81 83Boston 78 88 88Newark 44 89 49Buffalo 72 83 87New York City 143 102 140Rochester 109 95 115Philadelphia 115, 95 121
MIDWESTChicago 136 100 136Indianapolis 99 114 87Detroit 99 108 92Minneapolis 225 122 184
Kansas City 117 109 107
St. Louis 122 95 128Cincinnati 120 105 114Cleveland 127 92 138Columbus 87 105 83Dayton 106 96 1WMilwaukee 107 109 98
SOUTHMiami 125 110 114
St. Petersburg 74 107 69Atlanta 282 127 222Louisville 131 118 I11New Orleans 166 115 144Dallas 339 128 265Houston 249 118 211San Antonio 153 85 180
WESTis Angeles-Long Beach 132/88 112/110 118/80San Bernardino-Riverside-Ontario 118 96 123San Diego 109 96 114
San Francisco-Oakland 247/145 116/106 213/137Denver 161 119 135
l'ortland 109 118 92
Source: National Education Association Research Division, "Local School SystemBudget Surveys," (1972). Sales Management's Survey of Buying Power, (1971).
any °dux pressing service. Indeed, by further raising taxes, centralcities ate promoting the continued flight of middle and upper incomefamilies and taxable property values ;rom city to suburban areas. Theloss of tax base, in turn, creates further tax pressure on the central city.
M..... J.

School Finance Reform 15
T ABLE 4
CITYSTATE PROPORTIONS OF POOR AND Rtot FAMILIES, 1969
%
City by Region
of Families HavingIncome Less Than
Poverty Level1969
% of FamiliesEarning MoreThan $15,000
1969
City State City State
NORTHEASTBaltimore 14.0 7.7 16.7 28.6Boston 11.7 6.2 18.1 25.2Paterson, CliftonPassaic 9.2 6.1 21.9 29.5Newark 18.4 6.1 12.4 29.5Buffalo 11.2 8.5 14.1 26.5New York City 11.5 8.5 23.6 26.5Rochester 8.9 8.5 20.5 263Philadelphia 11.2 7.9 18.2 18.3Pittsburgh 11.1 7.9 16.3 18.3Providence 11.7 8.5 17.4 18.9
MIDWESTChicago 10.6 7.7 23.3 P5.4Indianapolis 7.1 7.4 24.9 19.4Detroit 11.3 7.3 22.6 26.7Minneapolis-St. Paul 6.9 82 22.2 20.3Kansas City 8.9 113 20.2 17.1St. Louis 14.3 11.5 13.0 17.1Cincinnati 12.8 7.6 17.6 21.6Cleveland 13.4 7.6 15.3 15.3Columbus 9.8 7.6 18.5 18.5Dayton 10.6 7.6 19.0 19.0Milwaukee 8.1 7.4 19.2 19.8
SOUTHMiami 10.9 12.7 21.5 16.8Tampa-St. Petersburg 10.7. 12.7 14.2 16.8Atlanta 15.9 16.7 18.9 15.2Louisville 13.0 19.2 15.1 11.6New Orleans 21.6 21.5 19.9 12.8Dallas 10.1 14.6 25.1 16.5Houston 10.7 14.6 22.9 16.5San Antonio 17.5 14.6 13.3 16.5
WESTLos Angeles-Long Beach 9.7 8.4 27.7 26.7San Bernardino-Riverside-Ontario 10.2 8.4 20.9 26.7San Diego 9.3 8.4 24.4 26.7San Francisco-Oakland 10.7 8.4 25.8 26.7Denver 9.4 9.1 21.4 19.7Portland 8.1 8.6 20.5 18.0SeattleEverett 6.2 7.6 26.5 22.8
Source: U.S. Bureau of the Census, 1970 Census of Population: General Socialand Economic Characteristics, PC1C, Tables 184, 188.
r)e-sP.41.1

16 School Finance in Transition
TARTE 5
CITY-STATE PER CAPITA NON-EDUCATIONAL EXPENDITURE. ComPaatsons, 1969.70
CityState Per Capita Expenditure Ratio, 1969.70Health/
City by Region Police .sire Refuse Sewers Hos-pitals
NORTHEASTBaltimore 231 224 192 54 224Boston 230 158 179 122 339Newark 251 286 223 N.A. 178Paterson.
Clifton-Passaic 126/87/101 194/176/159 74/118/105 N.A. N.A.Buffalo 95 171 153 55 N.A.New York City 160 153 151 73 180Rochester 72 144 188 547 N.A.Philadelphia 274 262 277 71 396Pittsburgh 267 371 291 N.A. N.A.Providence 154 162 190 58 68
MIDWESTChicago 198 174 2'28 N.A. 64Indianapolis 200 193 195 229 N.A.Detroit 202 169 289 72 78Minneapolis-St. Paul 165/153 238/269 248/247 149/144 N.A.Kansas City 164 197 167 177 90St. Louis 281 204 250 N.A. 280Cincinnati 190 269 196 185 160Cleveland 259 239 314 95 218Columbus 167 182 135 196 141Dayton 158 2N2 213 105 N.A.Milwaukee 194 169 258 116 N.A.
SOUTHMiami 134 152 213 103 108Tampa-St. Petersburg 110/85 146/89 104/121 92/105 122Atlanta 203 263 328 268 N.A.Louisville 267 289 . 258 268 86New Orleans 184 422 172 208 N.A.Dallas 175 191 184 148 N.A.Houston 129 195 99 194 N.A.San Antonio 107 103 120 136 N.A.
WESTLos Angeles -
long Beach 144.127 122.145 156.158 N.A. N.A.San Bernatilino-
Riverside-Ontario 94/75/75 136/119/139 164/184/135 124/101/37 N.A.San Diego 74 77 103 102 N.A.San Francisco-Oakland 156/127 225/154 99/41 N.A. 219Denver 169 199 262 101 206Portland 185 230 214 155 N.A.SeattleEverett 210 206 238 143 N.A.
Source: U.S. Bureau of the Census, City Finances, 1969.70, Table 7. U.S. Bureauof the Census, Government Finances, 1969.70, Tables 18, 26.
School Finance Reform 17
TABLE 6
CM' STATE COMPARISON OF PROPORTION OF EXPF.NDITURFS USEDFOR Eutawriox, l969-70
Lily by Region
Percent of LoralBeing Used for Education,
Expenditures1969-70
City State
NORTHEASTBaltimore 34 49Boston 26 45Newark 28 94Paterson, Clifton-Passaic 34 44Buffalo 34 33New York City 20 .33Rochester 31 33Philadelphia .85 54Pittsburgh 34 54Providence 35 51
MIDWESTChicago 30 47Indianapolis 41 54Detroit 37 50Minneapolis-St. Paul 29 48Kansas City 33 52St. Louis 30 52Cincinnati 23 95Cleveland 39 45Columbus 33 95Dayton 38 95NlilwaLkee 29 90
SOUTHMiami 37 48Tampa-St. Petersburg 92 98Atlanta 39 48Louisville 23 56New Orleans 36 51Dallas 39 52Houston 45 52San Antonio 43 52
Los Angeles-Long Beach 28 35San Bernardino-Riverside-Ontario 37 35San Diego 33 35San Francisco-Oakland 23 35Denver 34 97Portland 39 53Seattle-Everett 29 52
Source: Seymour Sacks and John J. Callahan, "Central City-Suburban Fiscal Disparities," Appendix D, U.S. Advisory Commission on Intergovernntental Relations,Financial Emergencies in American Cities, (1973 forthcoming).
ripMN.
18 School Finance in Transition
TABLE 7
CITYSrATE COMPARSiiiiv or TOTAL. LOCAL TAX RATES PER $1,000PERSONAL. INCOME, 1969.70
Total Local Taxes Per $1,000Personal Income, 1969.70
City State
NORTHEASTBaltimore 8.40 6.00Boston 11.70 6.90Newark 10.00 6.70PatersonClifton-Passaic 6.30 630Buffalo 7.20 8.00New York City 930 8.00Rochester 730 8.00Philadelphia 7.70 8.00Pittsburgh 8.80 5.00Providence 5.80 5.00
MIDWESTChicago 6.40 6.00Indianapolis 7.00 5.10Detroit 7.00 5.60Minneapolis-St. Paul 5.90 5.40Kansas City 7.50 5.30St. Louis 9.10 5.30Cincinnati 7.20 5.40Cleveland 9.70 5.40Columbus 6.10 5.40Dayton . 7.60 5.40Milwaukee 9.00 6.60
SOUTHMiami 5.10 4.30Tampa-St. Petersburg 4.20 430Atlanta 7.00 3.80Louisville 5.80 3.00New Orleans 4.80 3.70Dallas 5.20 4.60Houston 5.00 4.60San Antonio 3.90 4.60
WESTLos Angeles-Long Beach 7.80 7.50San Bernardino-Riverside-Ontario 7.50 730San Diego 5.70 7.50San Francisco-Oakland 10.20 7.50Denver 7.30 7.00Portland 6.90 6.10SeattleEverett 4.90 4.10
Source: U.S. Bureau of the census, Government Finances, 1969.70, Tables 18, 26,
rib

School Finance Reform 19
TABLE 8
DIFFERENTIAL ASSESSMENT RATIOS BY TYPE OF PROPERTY, 1966.67
City by Region
Assessment Ratio for:
AllProperty
ResidentialProperty
High ValueResidentialProperty
Low ValueResidentialProperty
NORTHEASTBaltimore 68.6 67.1 60.8 86.9Boston 37.1 31.7 23.8 39.4Newark 73.7 70.1 58.7---: 75.8PatcrsonC3iftonPassaic 71.1 73.4 65.7 79.7Buffalo 69.1 61.8 :All 79.4New York City 49.0 44.0 35.6 50.0Rochester 38.9 39.4 30.0 46.4Philadelphia 58.1 58.5 53.1 67.8Pittsburgh 43.6 41.0 33.8 48.5Providence 67.9 65.5 60.5 76.6
AtilDwE.srChicago 39.4 36.3 28.1 41.6Indianapolis 32.3 30.4 26.7 36.4Detroit 40.3 42.2 34.5 47.9Minneapolis-St. Paul 10.0/9.0 9.7/8.4 8.1/6.4 10.9/9.3Kansas City 26.4 26.1 20.8 30.4St. Louis 41.0 36.2 30.0 43.7Cincinnati 44.5 44.2 37.9 48.6Cleveland 36.3 35.0 30.6 38.5Columbus 38.2 38.4 35.0 41.6Dayton 37.3 36.8 30.8 43.4Milwaukee 51.1 49.2 47.0 60.1
SOUTHMiami 71.6 83.6 72.4 96.8Tampa-St. Petersburg 49.3 49.9 44.9/68.4 56.5/92.6Atlanta 25.3 18.9 16.1 21.8Louisville 91.8 92.6 82.6 100.4New Orleans 21.8 22.6 18.0 28.7Dallas 18.1 19.5 16.5 22.0Houston 17.7 18.9 16.5 21.2San Antonio 22.3 24.2 fi. N.A. N.A.
WESTI.oa Angeles-Long Beach 19.6/19.0 17.6/19.8 17.0/16.9 24.1/22.3San Diego 20.7 22.9 18.9 22.9San Francisco-Oakland 11.1/14.7 9.7/14.7 7.0/13.3 11,6/16.4Denver 28.7 28.9 26.6 31.7Portland 20.6 21.5 18.6 24.3SeattleEverett 16.3 15.7 13.6 17.5
Source: U.S. Bureau of the Census, 1967 Census of Governments, Taxable Prop.erty Values vol. 2, Tables 19.21.

20 School Finance in Transition
Given this combination of municipal and total tax overburden,do major cities have any way of circumventing this chain of fiscaldependence? The answer has to be negative. Indeed, cities have at-tempted to follow tax policies that would alleviate these tax burdens,yet many eventually may prove counterproductive. As Table 8 indi-cates, many major cities attempt to cope with the overburden problemby overassessing higher-priced residences and nonresidential property.This practice, of cows:, increases tax burdens on more wealthy prop-erties and provides an inducement for their owners to locate elsewhere.
Another policy cities attempt to follow is the adoption of taxesthat effectively tap the incomes of suburb a residents. Thus, munici-pal income taxes have been adopted in 12 of the 47 largest cities inhe country; local sales taxes are utilized in 21 of these same cities.Yet, as the economic dominance of most large cities wanes, the useful-ness of these taxes will subside. Indeed, the phenomenal growth ofsuburban sales and employment may already herald the futility ofcities adopting these local revenue instruments. M'reover, in a num-ber of other cases, overlying governments, particularly counties, aretaking responsibility for the use of these revenue instruments, As thisoccurs, cities are preempted from using these instruments.
Cities also have to contend with a host of countervailing forcesthat hinder their attempts to offset their local tax burdens. Thus, ina number of cities, overlapping governments such as counties andareawide special districts have control over taxing and spending poli-cies that affect central city areas. Indeed, as Table 9 indicates, thesejurisdictions account for 17 percent of all local expenditures in thenation's major cities, with the share ranging as high as 40 percent inLos Angeles.
Given all these problems in reducing cit*,' tax burden, urban areashave increasingly turned to higher levels of government for assistance.Indea analysis done since .957 indicates that cities are generally re-ceiving higher levels of mend! te and federal aid since 1957. At thesame time cities' expenditures have increased at an even faster rateso that State and Federat aid as a percent of local expenditure is gen-erally no higher in large cities now than it was in 1957. Especiallysince State and Federal aid is mill a minor part of many noneduca-tional functions, cities will continue to be financing functions that donot receive overly substantial external support. Thus, higher levels ofgovernment have not aided city-type functions at the same rate aseducation.
WAWA TION AND EDUCATIONAL COSTS
Just as school tax yield equalization fails to acknowledge majorcities' municipal overburden, it also does nothing to relieve their ex-ceptional educational costs. Well-financed educational _ost corrections,however, would benefit most major city school districts dramatically.Data provided by the U.S. Office of Education indicate that major cityschool districts exceed all other school districts in all but wo costcategories: administration and transportation. And as Table 10 shows,
!Val114.. a

School Finance Reform 21
TABLE 9
CEIV AREA EXPENDITURES, 1969..70
City by Region
City Area Expenditure, 196910
AmountProportion Attributable to
City and School District
NORTHEASTBaltimore $638 100%Boston 531 100Newark 735 91PatersonCliftonPassaic 381 100Buffalo 528 70New York City 894 94Rochester 699 76Philadelphia 495 96Pittsburgh 450 77Providence 392 97
MIDWESTChicago 498 76Indianapolis 355 76Detroit 474 87Minneapolis-St. Paul 540 64Kansas City 485 85St. Louis 463 87Cincinnati 761 92Cleveland 512 80Columbus 398 82Dayton 456 87Milwaukee 562 72
SOUTHMiami 481 70Tampa-St. Petersburg 372 79Atlanta 554 82Louisville 508 100New Orleans 334 92Dallas 352 86Houston 305 83San Antonio 252 84
WESTLos Angeles-Long Beach 624 60San Bernardino-Riverside-
Ontario 635 66San Diego 484 67San Francisco-Oakland 768 89Denver 502 95Portland 486 79SeattleEverett 524 69
Source: Seymour Sacks and John J. Callahan, "Central City-Suburban Fiscal 1)18parities," Appendixed D, U.S. Advisory Commission on Intergovernmental Relations,Financial Emergencies in American Cities, (1973 forthcoming).

22 School Finance in Transition
the cost gap is especially great when major city school districts arecompared to their respective suburbs. On the average, major cityschool district expenditures exceed those of their suburbs by an aver-age of about $25 per pupil in all of the following categories: profes-sional and nonprofessional salaries, auxiliary services, attendance.maintenance of plant, and fixed charges.
'FAKE 10
l'ER PUPIL EDUCATIONAL COSTS DV EXPENDITURE CATEGORIESLARGE Cmrs, CENTRAI. CITIES, SUBURBS, ANO RURAL AREAS
1968.1969
District Type
Per Pupil Expenditure
Total Instruction HealthPlant
OperationFixed
Charges
Large Central CtyCentral CitySuburbanRuralTotal U.S.
$719675670562632
$523498490411464
$66635
4":554250
$0556503747
Source: U.S. Office of Education, Statistics of Local Public School Systems: Fi-nances, 1970, Table G.
No doubt, part of the expenditure gap between cities and suburbscan be explained by differences in educational preferences. There is asubstantial amount of circumstantial evidence, however, which sug-gests that much of the gap results from differences in three cost..fac-tors. One is the nature of the pupil population. Often poor, oftenhostile to public schools, pupils in major city school districts tend torequire greater expenses for such items as attendance and healthservices than their counterparts in suburban and rural school districts.Another factor is the nature of major city factor costs. Owing to thehigh cost of land, for example, major city school district capital costsare almost always higher than those of most other school districts.Similarly, and as Tables 11 and 12 indicate, cities must pay signifi-cantly higher teacher salaries than most other areas, these higher sala-ries being necessitated in part by the competitiveness of the labormarket, in part by unionization of teachers, and in part by the highercost of living,
EQUALIZATION AND EDUCATIONAL NEED
In the final analysis, perhaps the greatest shortcoming of schooltax yield equalization is that it would fail to acknowledge variationsin educational need. As Table 13 suggests, however, major city schooldistricts face extraordinary need, with nearly one-third of their pupilshaving mental handicaps, physical handicaps or special learning diskorders, Additionally, they must educate large cumbers of pupils re-quiring either vocational or compensatory education,
trit',km/

School Finance Reform
TAIILE
CITYSTATE TEACHER SALARL St: BELAU: DIFFERENTIALS la St:11001. DISTRICT SIZE, 1972
District SiteSchOul Dist Heti 411 Surveyed100,000+ Pupils Districts
Salary Minimums and Maximums by Degree (N r" 27) (N = 1,179)
Bachelor's DegreeMean Minimum Salary $ 7,503 $ 7,061% Systems Paying $7,500+ 22.2% 14.0%Mean Maximum Salary 11,684 10,299% Systems Paying $13,000+ 25.9% 8.4%
Master's DegreeMean Minimum Salary 8,215 7,837% Systems Paying $8,500+ 29.6% 22.4%Mean Maximum Salary 13,170 11,973% Systems Paying $15,000+ 25,9% 9.4%
Six Years of CollegeMean Minimum Salary 8,805 8,501% Systems Paying $9,000+ 32.0% 32.1%Mean Maximum Salary 14.208 13,308% Systems Paying $16,000i 24,0% 11.0%
Doctor's Degree or Seven Years CollegeMean Minimum Salary 9,186 8,9436,, Systems Paying $9,750+ 26.1% 24.1%Mean Maximum Salaryw Systems Paying $17,000+/0
14,37121,7%
13,80518,4%
Source: National Education Association Research Division, Salary Schedules forTeachers 197041, Table 6A, 611,
Not only do these students make up a considerable proportion ofcentral city enrollments, as Table 14 indicates, they are more heavilyconcentrated in city areas than in other parts of most states. Indeed,looking at the relative city and state concentrations of compensatoryeducation pupils it is not uncommon to see city concentrations exceedthe state average by a ratio of more than two to one, While data forother types of pupils are not immediately available, all indicationspoint to the concentration of major city school districts,
The disproprotionate loading of these students in city districtsadds another dimension of the urban educational crisis. Due to thehigher expenditure requirements for these students, cities must devotemore fiscal resources to these students, They either must drasticallylower teacher.pupil ratios as has been suggested or make available awhole host of other types of resources for such pupils. Given the factthat those resources also cost more on the average in cities, the fiscalbind is indeed a cruel one,
The magnitude of the fiscal burden imposed by these pupils canbe indicated by calculating the expenditure or teacher requirementsthat would be necessary it all these pupils were weighted in accord

24 School Finance in Transition
l'Ant.r. 12
CICVSTA'11 COMPARISON OF TEACHER SALARIES, 1971_ -- - ._ - -_-_-_-_--
l'erage Classroom Share of Teachers Earn-Teacher Salary ing More Than $15,000
District by Region- City State City Slate
-V----_NORTHEAST
liiiiiiiioii $ 9,373 $10,091 15.1% 6.2%Boston 9,900 9,500 N.A. 4.8Newark 10,207 10,050 24.1 8.7PatersouCliftonPassaic 9,802 10,050 4.7 22.0Buffalo 10,035 11,100 13.1 22.0 .New York City 10,971 11,100 33.9 22.0Rochester 10,524 11,100 22.4 22.0Philadelphia 11,170 9,300 36.4 12.2
M/D WEST-efikijo 11,017 10,233 29.3 9.6
Indianapolis 9,927 9,272 3.4 1.6Detroit 11.414 10,647 45.4 11.0Minneapolis-St. Paul 10,484 0,271 26.9 8.0Kansas City 10,001 8,375 3.2 0.0St. Louis 9,858 8,373 .2 0.0Cincinnati 9,944 8,798 6.1 3.2Cleveland 9,681 8,798 5.8 3.2Columbus 9,236 8,798 6.9 3.2Dayton 10,030 8,798 1.7 3.2Milwaukee 10,575 9,640 16.0 4.2
SOUTHMiami 9,999 8,805 13.9 2.0Tampa-St. Petersburg N.A. N.A. N.A. N.A.Atlanta 8,962 7,778 .4 N.A.Louisville N.A. N.A. N.A. N.A.New Orleans 8,657 8,340 N.A. .2Dallas 8.813 8,325 N.A. .1
Houston 8,962 8,325 N.A. .1
San Antonio 8,113 8,325 N.A. .1
WESTCos Angeles-Long Beach 11,555 11,022 34.8 20.0San Bernardino- Riverside-
Ontario N.A. N.A. N.A. N.A.San Diego 11,158 11,022 4.9 20.0San Francisco-Oakland 11,465 11,022 7.6 20.6Denver 10,014 8,260 21.7 1.8Portland 9,762 9,298 N.A. .7SeattleEverett 10,791 9,250 33.9 5.9
Source: National Education Association Research Division, 25th Annual SalarySurvey of Public School Personnel, 1970.71.
with the findings of the National Educational Finance Project (NEFP).As Table 15 reveals, applying NEFP weights would require manymajor city school districts to increase their per pupil expenditurelevels about 50 percent.
31

School Finance Reform 25
TABLE 13
SHARI.: or Tarn ENROLLMENT in SPECIAL N VED CATMOR VI 1971.72
City by Region
NORTHEAST
rrr
Atonally11andicapped
Share ofWith isspecial
tem ningDisorder
Tota/ Enroll
Title/Eligible
mart:
VocationalTechnical
TotalspecialStudents
Boston 361 % 1.5% 48.0Buffalo 4.0 N.A. 81.4 9.0 44.4Pittsburgh 3.s .5 48.9 7.2 60.5
MIDWEST2.5 .1 60.8 27.1 90.5
Detroit 2.6 .3 32.7 .6 36.2Minneapolis 3.8 7.8 16.8 2.9 31.3St. Louts 5.2 .,... 29.8 7.0 42.2Cleveland 1.3 .1 43.1 6.7 51.2Milwaukee 2.7 N.A. 37.2 N.A. 39.9
SOUTHAtlanta .8 .1 7.3 . 4.9 13.1
Houston 2.2 N.A. 25.7 7.8 35.2
WESTLos Angeles 1.9 5.2 34.6 12.9 54.6San Diego 1.5 .5 9.5 6.1 17.6San Francisco 2.2 .8 32.4 1.9 37.3Denver 3.6 .9 16.4 5.2 26.1Portland 5.2 2.3 52.7 10.2 70.4
Source: Authors' survey of pupil enrollments inSchool Council. 1972. U.S. Department of Health.Assistance Statistics of 1972 (SRS 73.03100), Table
member cities of the Great CitiesEducation, and Welfare, Public
7.
The strain this education overburden places on urban districtsmight be expressed in another way. As indicated earlier, many statesexpress school district wealth on a per pupil basis. But as Table 16indicates, using NEFP weights in calculating fiscal capacity would re-duce the apparent wealth of many major cities by about 50 percent.Similarly, using pupil weights suggested by the President's Commission on School Finance would reduce the wealth of major city schooldistricts even further.
CONCLUSION
In brief, it is clear that parity between tax effort and revenueyield will not by itself insure fiscal justice for most major city schooldistricts. This, of course, is not to assert that tax effortrevenue yieldparity is undesirable as an equalization mechanism. Rather it is toargue that it is insufficient as an equalization mechanism. But how dowe create at adequate mechanism?

33
Tw
at. :
14
CO
NC
EN
ITA
TIO
NS
OF
AM
C w
pmi P
upas
BY
Scu
m'.
Ths
nuci
s, 1
972
Scho
ol D
istr
ict
Titl
e I
Elig
ible
sas
% o
f L
ocal
Scho
ol E
nrol
lmen
t(1
)
Scho
ol A
ge A
FDC
as%
of
Stat
eE
nrol
lmen
t(2
)(1
)42)
City
Enr
ollm
ent
as %
of
Stat
eE
nrol
lmen
t
Loc
al T
itle
Ias
% o
f St
ate
AFD
C
NO
RT
HE
AST
Bos
ton
36.1
%10
.8%
3.34
8.1%
28.0
%B
uffa
lo31
.416
.11.
952.
03.
6
Pitts
burg
h48
.912
.14.
0I2.
813
.4
MID
WE
STC
hica
go55
.613
24.
2125
.191
.1
Det
roit
32.7
11.o
2.97
129
555
Min
neap
olis
16.8
5.8
2.90
7.0
17.7
St. L
ouis
29.8
8.4
355
9.9
33.6
Cle
vela
nd43
.165
6.63
6336
.8
Milw
auke
e37
.25.
87.
2712
.880
.0
SOU
TH
Atla
nta
7.3
11.0
.66
8.9
6.2
Hou
ston
25.7
524.
948.
440
.2
WE
ST Los
Ang
eles
34.6
13.0
2.66
12.6
326
San
Die
go9.
513
.0.7
32.
61.
8
San
Fran
cisc
o32
.313
.02.
4816
.439
Oak
land
182
13.0
2.94
1.2
3.4
Den
ver
16.4
752.
1916
.034
.9Po
rtla
nd52
.77.
86.
7615
5E
9.8
Sour
ce: A
utho
r's s
urve
y of
pup
il en
rollm
ents
in m
embe
r ci
ties
of th
e G
reat
Citi
es S
choo
l Cou
ncil,
197
2. U
S. D
epar
tmm
tof
Hea
lth.
Edu
catio
n an
d W
elfa
re, P
ublic
Ass
ista
nce
Stat
istic
s of
197
2 (S
RS
73-0
3100
), T
able
7..
Ot

School Finance Reform 27
TABLE 15
Cm FISCAL AND TEACHER REQUIREMENTS ARISING FROM NEFP WEIGHTINGS1972
Expediture Per PupilCity by Region in 1972 NEFP Requirement
NORTHEASTBoston $ 918 $1,271Buffalo 1,293 1,917
MIDWESTChicago 1,024 1,789Detroit 803 1,159Minneapolis-St. Paul 1.085 1,576St. Louis 689 1,017Cleveland 744 1,158Milwaukee 962 1,420
SOUTHAtlanta 856 1,057Houston 685 973
WESTLos Angeles-Long Beach 1,078 1,719San Diego 813 I,047San Francisco-Oakland 1,388 2,163Denver 1,143 1,543Portland 852 1,500
TABLE 16CITY PROPERTY VALUES WEIGHTED AND UNWEIGHTF.D FOR EDUCAT.uNAL NEED
City by Region
Per Pupil Property Value in 1972
UnweightedWeighted for Education
Need on NEFP Basis
NORTHEASTBaltimore $ 20,794 $15,024Buffalo 27.305 18,417
MIDWESTChicago 52,490 30,046Detroit 40,063 27,757Minneapolis-St. Paul 57,010 39,249St. Louis 44,203 30,338Cleveland 60,260 38,728
SOtTMAtlanta 47,612 38,558Houston 38,120 26,837
WESTLos Angeles-Long Beach 60,096 37,686San Diego 50,000 38,828San Francisco-Oakland 112,630 72,275Denver 50,780 37,616Portland 44,770 30,120
28 A School Finance in Transition
Part of the answer seems to be in the realm of classification. Weneed to know which school districts are really poor, which ones areoverly taxed, which ones have concentrations of educational need, andwhich ones are paying high prices for their factor inputs. This infor-mation. if comprehensive enough, not only would provide a realisticpicture of the fiscal environment, but also, and more important, mightprovide vital clues for developing policies consistent. with both fiscalJustice and political expediency.
In the time being, however, we believe that those concerned withfair school finance
!. should continually emphasize the need, cost, capacity, andeffort differentials that cities face, differentials which makethem deserving of additional external assistance.
9. tillOtiln press for a pupil weighting system that reflects thedifferential educational needs in large cities. Weights alongt1u order of those developed by the National EducationalFinance Project or other more empirically testable weightsshould be developed. Consideration should also be, given tograduating weights for a given type of pupil when they reachhigh concentrations in a school district.
3. should insist on aid for the differential costs of urban educa-tion. Generally, cost correction factors might have two com-ponents, one reflecting the differential a city district pays forproviding a service and the second recognizing the highercosts cities must pay for educational inputs not always re-quired by other school districts.
1. should give prime consideration to developing a fiscal capac-ity measure which is income, rather than property based innature and which uses total population rather than schoolenrollment as the unit by which to measure wealth.
5. should take into account the problem of municipal over-burden. Cities invariably have higher total tax burdens thanmost other types of school districts. Consequently, they areburdened by aid programs which make the implicit or ex-plicit judgement that cities are "free" to choose a level oftax effort that will be sufficient to meet their educationalrequirements. Municipal overburden corrections, taking intoaccount the higher tax effort in cities, should be a basic com-ponent of a revised aid formula.
ti, should give attention to the form of school finance revisionsas well as their initial fiscal impact on city school finances.Full State funding programs, in particular, should be scru-tinized insofar as the!: have a "leveling" effect on urbanschool finances. Power equalizing schemes should be exam-ined to see that they do not demand extraordinarily high taxeffort in large urban centers. And all school finance revisionsshould be studied as to their tax-expenditure impacts on ur-ban areas. Cities should be especially careful or not endingup paying the major share of school finance revision pro-grams.

School Finance Reform 29
APPENDIX
The simulated state aid and tax rate data in Table 1 were calcu-lated as follows. State aids were determined for each school districtby multiplying the average per pupil state aid in 1971.72 by the localto state school tax effort ratio for the same fiscal year. Tax rates weredetermined for each school district by subtracting the simulated stateaid from 1971-72 state-local revenue, then by dividing the remainderby the local tax base, and, finally, by multiplying that product by thelocal to state per pupil tax base ratio.
To be sure, this procedure does not correspond perfectly with dis-trict power equalizing in its pure form. This is unavoidable, however.unless one makes assumptions about guaranteed revenue schedules,that is, the number of dollars that states will provide school districtsfor each level of tax effort. Although there is nothing inherently wrongabout making such assumptions, stating them raises very difficult ques-tions, especially in the area di interactance between guaranteed reve-nue yields and potential changes from present levels of tax effort.
FOOTNOTES
I. Serrano v. Priest, 5 Cal. 3d 584. 96 Cal. kph, 601. 487 P. 2d 1241 (Sup. Ct.1971). Also. Milliken v. Green, ....... Mich. , 203 N.W. 2d 457 (Sup. Ct.1972), And, Robinson v Cahill, . (Sup. Ct. 1973),
2. See, for example. Education Commission of the States, Newsletter, selecteddates.
3. Ibid.4. The Urban Institute, Public School Finance: Present Disparities and Fiscal
Alternatives (Washington, 1972).5. Betsy Levin and Thomas Muller. The Financing of Schools in Minnesota
(Washingtov. 1973). William II. Wilken, Minnesota School Finance: The Need forContinued Prform (Washington, 1).C.: National Education Association, 1973).
(I. Joel S. Berke and John J. Callahan. "Serrano v. Priest: Milestone or Mill-stone." loqnal of Public Law, 21 (Summer. 1972), pp. 23-71.
7. National Legislative Conference, A Legislator's Handbook to School Finance(Denver: Education Commission of the States, 1972).
8. John Coons. William Chine and Stephen Sugarman, Private Wealth andPublic Education (Cambridge, Mass.: Belknap Press, 1970), pp. 201-242.
9. Ibid., p. 242.

Alternative Tax Sources for Education:Perspectives and Prospects
JAMES A. PAPKE
Professor of Economics, Herman C. Krannert Graduate School of IndustrialAdministration, Purdue University.
The topic under review today could be retitled "Financing Educa-don Ten Years From NowWhat Will It Look Like?" It would beequally interesting to put the topic in historical perspectives and re-flect upon what was said on the same topic ten or even twenty yearsago. A comparison could be made of the policies and predictions thatwere set forth then with the situation today. And although the his-torical data have not been thoroughly researched, some brief comments about school finance in the early 1970's compared with the early1960's and 1950's provide useful insights and a backdrop for a lookinto the future.
First, the basic character of educational finance appears to changeslowly over time. The finance specialist who took a ten or even twenty-year sabbatical leave would not experience much of a handicap inunderstanding the present system and in reacquainting himself withits major strengths and weaknesses. In the early '50's, revenues fromlocal sources provided approximately 60 per cent of total Federal,State and local expenditures for elementary and secondary education.By the middle '60's, this proportion had been reduced to just over 50per cent, which is about the current level.
Second, despite the fairly stable relationship of support for edu-cation by governmental level, the data show a substantial increase indollar aggregate school outlays. Between 1957 and 1970, annual spend-ing for education jumped from $12 billion to over $37 billion, andnow exceeds $40 billion. No small part of this expansion was due to
31

32 School Finance in Transition
TABLE
STATE. AND LOCAL Exm.sintrai.: FOR ELENIFSTARY AND SFE0NDARN EDULATION.RV GOVERNNIENTAL SOURCE or FixAsciNG. Sri.tanTo VAtts 1957.1970
Percent Financed FromFiscal Amount Federal State LocalYear (in millions) Aid funds f ands
...___.
1970 $37..161 10.1 38.8 51.11969 35.687 8.6 .10.8 50.61967 23.986 10.2 38.6 51.21957 11,994 3.1 36.7 60.3
Source: Governments Division. U.S. Bureau of the Census.
population growth and price increases, but there is ample evidence tosupport the contention that qualitative and quantitative improve-ment explain the largest share of the dollar increase.
Statistical relationships of this kind illustrate the extent to whichthe growth in educational expenditures has taken place within theframewoi k of a system of fiscal federalism in which education remainsprimarily a State and more importantly a local government responsi-bility. And though there have been notable swings in the role ofthe Federal government (e.g., the 1965 Elementary and SecondaryEducation Act), the record suggests that, for the most part, the Fed-eral contribution has not kept pace with the growth in school costs.
Third, the share of school costs financed locally declined over thedecade of the '50's and '60's, but has stabilized since. What has notremained static, however, has been the school system's increasing re-liance on the local property tax. In 1952, school districts required alittle over one-third of the then $8.2 billion local property tax yield tofinance their 60 per cent share of school costs. By 1970, the schoolsaccounted for one-half of the S33 billion local property tax bill tofund roughly 50 per cent of total school expenditures. In a word, itwas and is virtually impossible to separate school finance from thelocal property tax. Further, because most local government units arefishing in the same property tax pond, it is obvious even to the mostcasual observer that an increase in the property tax levy of one unitmakes it increasingly difficult for another, serving the same area, tomeet its needs from this source.
And fourth, the most striking feature in school finance over theperiod under discussion has been the revenue-generating performanceof the property tax. This is all the more surprising because few taxeshave so little to recommend it and so much to condemn it. As late as1956, one among many critics of the property tax forecast that intwenty years, "the property tax will . . have become an all-but-forgotten relic of an earlier fiscal age. . . ."1 Somewhere along theline, new life was breathed into the property tax and rather than d+s-appearing or withering away as some had prophesied, it has continuedto outperform and overshadow other sources of State-local revenues.
33

Alternative Tax Sources 33
TABLE 2
ticit001. S11.11t1' TAXI.S.PEAKS 1952.1970
Percent distribution by type of government
I.oi atproperty
Fiscal taxes School Townships andYear (millions) districts Cities Counties special districts
1970 $32,963 50.3 24 I 18.1 7.91969 29.02 50.0 24.1 18.1 7.8191i7 25.418 . 48.9 21.8 18.5 7.81957 12.285 42.8 29.7 19.2 851952 8.232 39.2 32.7 19,8 8.3
Sourer: Computations based on data from U..)veriitnents 1)ivisioii. U.S. Bureauof thr' Crocus.
Attitudes toward the property tax have apparently not changedmuch. The ramparts defending the property tax are still not crowded.In a recent poll conducted for the Advisory Commission on Intervoy.ernmental Relations, respondents picked the property tax more oftenthan any other tax as the worst tax.2 When asked what would be thebest way to raise additional State revenue, respondents placed theproperty tax at the bottom of the list. There seems little doubt thatgiven the choice, the majority of taxpayers would prefer sales andincome taxes to further increases in the property levy. Despite taxpayer preferences, at least one source projects property tax yields of550 billion by 1975 and $70 billion by 19140. the latter would consti-tute over a 119 per cent increase above 1971) levels.3
With these few retrospective comments, what can we say abouthow the system of educational finance will look ten years in the fu.tune? Is the past really prologue? 1Vill the process of change be as slowas in the past or will there be a change of pace of fiscal developmentsthat will drastically alter the tax base for educational expenditures;While prophesy is not my particular expertise, there are sonic signifi.cant current trends that seem likely to extend into the future. In ad.aim, sonic possible new developments may change the tax landscape.
ALTERNATIVE TAX SOURCES
It is not the primary purpose of this discussion to examine thelocal property tax: the question of alternative tax sources for financing education cannot, however, be meaninglully explored if it isnored. As all are now aware. in rejecting by one vote last month thechallenge to the system of financing public schools in Texas, the U.S.Supreme Court also gave respite to the forty-eight other States underphessltre to reform sctiool financing. If a single justice had shifted hisvote, the system of school finance as presently constituted would have

34 School Finance in Transition
been drastically altered. Most important would have been the changedrole of the local property tax. Clearly if the Court had gone the otherway, the locally determined property tax could no longer be reliedupon to provide the majority of support of a school district's expendi-tures. What then would have been the alternative approaches to afull-fledged restructuring of educational finance? It is the positionhere that the Court's decision constitutes a postponement, not a de-feat for financial revision. Changes in educational finance may notbe as abrupt or rapid perhaps as they would otherwise have been, butthey will come. The question is not whether revision will take place,but how long will the process take.
In this context, the Advisory Commission on IntergovernmentalRelations prophetically stated in a January, 1973 release.4
"Even if the Supreme Court overturns the Rodriguez deci-sion, Serrano-type litigation has so dramatized the existence ofintrastate school finance disparities that State political leaderswill hereafter be under constant pressure to improve the State'sdistribution of school funds. If the Supreme Court sustainsRodriguez, this act will spur corrective State action."
.1 he Commission concluded ". that the interests of our federalvstem are best served when States retain primary responsibility for
sloping policies dealing with general property tax relief and intra-state equalization of school financestwo areas that traditionally havebeen within the exclusive domain of State policy-makers."
Increasing emphasis on State government solutions to the problemsof educational finance is also clear in two recent major federally fi-nanced studies: the National Educational Finance Project and thePresident's Commission on School Finance. Both studies concludedthat the State should assume full funding of elementary and secondaryeducation, though the suggested procedures for accomplishing this ob-jective were somewhat different. Thus, with the same forces and pres-sures at work to revitalize educational finance, with or without a Courtdecision there is a finite number of options available. The differentoptions (not mutually exclusive), however, have different subjectiveprobabilities attached to them in terms of actual realization and im-plementation.
The first alternative approach to 111,2401' reliance on the local prop-erty tax would allow local governments to impose local sales and/orincome taxes. Local financing of education would remain essentiallyunchanged, as world local control of educational policy. The realitiesof intrastate disparities in tax bases (e.g., "bedroom" communitiesversus shopping centers), however, suggest that this option would havelimited adaptability and acceptability. This policy option is not ratedhigh on the scale of fiscal neutrality. Nor is it attuned to current de-velopments, though at last count, some twenty-five States permittedlocal governments to tax retail sales and nine States extended localtaxing power to income.° These taxes were generally of the "piggy-back" variety, where the local rate is added to an existing State levy.
dinA...,

Alternative Tax Sources 35
School. districts in only two of these StatesLouisiana and Pennsyl-vaniashared in these local nonproperty tax options.
All States presently provide financial assistance to local school dis-tricts. A second approach to structural change in the educational fi-nancial system would retain the local property tax in its present rolebut modify the hash !ur determining the distribution of State aid.This is essentially a "zero-sum" game, where a fixed number of dollarsis simply reordered among school districts. Some districts would getmore aid, but only at the expense of others. Unfortunately, this alter-native has some political appeal for it amounts to a type of ceiling onthe local property tax and no tax increases at the State level. Hereagain, however, the policy is out of step with current political andeconomic realities. The redistribution of fiscal resources among gov-ei?mental units is never a simple task, particularly where it involveschanges in what has become accepted policy. Further, the presentstructure of most State tax systems has insufficient built-in growth(i.e., elasticity) to assure even constant quality levels of educationalexpenditures./
A third type of fiscal system is presently under consideration inseveral States whereby a uniform Statewide property tax for localschools would be combined with modifications in the allocation ofState aid to education. Presumably the State takeover of the adminis-tration of the property tax would serve to rehabilitate and rejuvenatethe levy to make it a more effective and equitable revenue instrumentfor funding a portion of local school costs. Primary emphasis herewould P. on improvements in property assessments and taxing pro-cedures among taxing units and types of property. Any efforts alongthese lines should be applauded and encouraged, and school financinghas a big stake in the upgrading of the organizational base of prop-erty tax administration.
There are currently some 14,500 prim'ary property assessing areasin the U.S.; Illinois, Indidna, Michigan, North Dakota and Wis-dnsineach has over 1,000 units. Thirty States require no training or certifi-cation of local tax assessors either before or after they take office.Twenty-one States do not ever require the use of tax maps for assess-ment purposes. It is not surprising that the present local property taxis chaotic and unjust; what is surprising is that the situation has per-sisted for so long. Fortunately, the current is now running strongly infavor of professionalization and centralization of property tax admin-istration, with the utilization of modern data processing equipnentto achieve prompt, effective, and evenhanded property tax adminis-tration.
The fourth available option involves a reduction in the relianceon the local property tax as the primary source of school finance andthe substitution of revenues derived from State tax sources, namelyincome and sales taxes. This policy option is consistent with the vocaldemands for property tax relief for more intrastate uniformity inschool expenditures, and for shifting the major responsibility for fi-nancing education to the State. The key issues in this approach arethe capability and willingness of the States to strengthen and balance

36 School Finance in Transition
their own tax structures as well as those of their local governments.1)o the States have untapped taxable capacity? The answer to this
question is a qualified yes; qualified in the sense that there are alter-native measures of tax effort and tax capacity. Applying the "leaststringent" capacity testthe aMMVIt of potential revenue a State couldraise it' it made the same tax effort as the highest tax effort State inits regionin the aggregate an estimated $16 billion of untapped Statetax revenue would be available." This amount would he more thansufficient to cover the additional required outlay ($13 billion) forState financing of 90 per cent of public school costs: alternatively, thisrevenue would provide the necessary resources to raise per-pupilspending in all low spending school districts to the 90th pupil per-centile, or approximately $7 billion."
Applying the "most stringent" capacity testthe amount of po-tential revenue a State could raise if it made the same tax effort asthe nation's highest tax effort Stategenerates some $35 billion of un-tapped tax capacity." What all this suggests insofar as the overall ca-pability of the States to fund property tax replacement and additionalschool expenditures is obvious.
Ever the State tax bases or sources in the great majority of casesare known. Thirty-five States now have broad-based income and salestaxes. The States are clearly moving toward more balanced tax struc-tures utilizing property, sales and income as tax bases, but more needsto be done to equalize further the relative contributions of the threetax bases. State personal income taxes are stiti providing only about 11per cent of the total yield of State-local taxes, and general sales taxes,though somewhat higher, account for less than 20 per cent. In con-trast, property tax collections are running about 40 per cent of totalState-local tax receipts.
The frequency distribution of reliance on property taxation inState-local systems for the fifty States and the District of Columbia, isthe following:
- -- _ - -^ ,_Properly tax as per rent
of State-local taxcollections
Less than 20%20.29.930,39.94019.950.59.9Over 60%
No. ofStates
411
1:1
1661
Impetus for more adoptions and more intensive use of existing per-sonal incoinr! taxation might increase as a result of the 1972 Federalrevenue sharing program. Not widely publicized is a provision of theprogram which permits States to "piggyback" on federal personal in-come tax collections. Such a collection program could become effectiveas early as 1974. The legislation requires that at least two States
42

4;ternative Tux Sources 37
counting for at least 5 per cent of the taxmen.. in the U.S. must re-quest Federal collection of their income taxes for piggybacking tobegin. If the 5 per cent requirement is not met by January 1, 1974,its introduction will be delayed year to year until the requirement issatisfied. In addition to the savings in administi ative and enforcementcosts to State governments, piggybacking should simplify taxpayercompliance. If greater reliance is placed on income taxation, the ob-jectives of both equity and revenue adequacy (i.e., the automatic re-sp(msiveness of tax collections to economic growth) will be served.
Not to he overlooked is the apparent preference of taxpayers forsales taxes. In the poll earlier referred to, when asked: "If your Stategovernment must raise taxes substantially, which would be the bestway to do it: State income tax, State sales tax, or State property tax?"The answers to the question were as follows:
State income tax 25 per centStates sales tax . per centState property tax ...... ..... l4 per centOther . 5 per centDon't know
. .......10 per cent
To summarize to this point, there will probably be significant shift-ing in current State-local tax relationships, particularly away from thelocal property tax. Experience in both the economics and the politicsof providing property tax relief and replacement is gaining, thoughthe politics often intrudes on the economics. Thus, for example, thepolitical attitudes surrounding the necessity and feasibility of provid-ing general, across-the-board property relief are receding, and in theirplace are more realistic approaches to providing relief to specificgroups (re: the so-called "circuit breaker" system for protecting lowincome households from property tax overloads). Equipped with moreproductive and diversified tax systems, the States- would be in a betterposition to provide the revenue required to adequately Rnnce publicschools.
BARRIERS TO CHANGE
The remarks above are suggestive of some developments that mayoccur in State-local tax systems and indirectly in school finance. Per-Imps a few remarks are in order on some of the obstacles to theirachievement.
Reference was earlier made to "untapped tax capacity." The cen-tral issue in the prospects for changing the structure of school financ-ing is whether or not the States will in fact convert taxable capacityto actual tax collections. Currently, political antipathy to associationwith tax increases is widespread antong State elected officials. The highmortality rate in candidates for re-election is commonly explainedby their sponsorship of tax increase programs. Right or wrong, theallegation is making political leaders cautious of associating themselveswith tax-raising policies. The problem is becoming particularly acute
43

)8 School Finance in Transition
because of comparatively optimistic revenue projections and thewidely publicized economy/no-tax-increase myopia in Washington.The country seems to have been massaged and mesmerized into be-lieving that all tax changesincluding reformsare bad and thatmaintenance of the status quo is the best that can be hoped for.
These attitudes portend difficult times ahead unless the basic issuesof tax policy and fiscal reforms arc made understandable and are ef-fectively communicated to policy-makers in the executive and legisla-tive branches of State government and to the general public. This isby no means an easy task. The judicious selection of the basic issueiin educational finance to be considered by governing bodies is impor-tant. Legislative battles over taxes are difficult and time consuming.Consequently, they should be constantly focused on substantive changewithin a framework of a long-range optimal plan. There is no substi-tute for careful and objective analysis, communication and planning.
This then is one observer's partial list of the more important in-fluences which can be expected to shape the character of public schoolfinance in the future. Notice, the role of the Federal government hasgone virtually unmentioned. It is the position here that States andschool districts cannot look to Washington for reform in educationalfinancing for several reasons. First, its current importance, in dollarterms, is small, providing only about 8 per cent ($3.8 billion) of pub-lic school expenditures in the 1970.71 school year. Second, Federalr venue sharing seems to be providing the rationale for cutbacks inexisting Federal grants. New York State has estimated its potential re-ductions at approximately $36 million.tt Third, the President's 1974budget proposes the replacement of some thirty existing categoricalgrant-in-aid programs Into five broad categoriesfor the disadvan-taged, for the handicapped, for vocational education, for support serv-ices ranging from library materials to school lunches, and for "Im-pact" aid for districts with large numbers of Federal employees livingon Federal property. It is intended to effect economies, to eliminatered tape, and to allow States and localities to determine spending pri-
3
SCHOOL FINANCE. DATA, 1970.1971 SCHOOL YEAR
(Billions)Total expenditures for public schools $45.5
Current expenditures $39.6Capital outlay 4.6interest on Khoo] debt 1.3
Revenue receipts for public schools 44,5Local governments 22.3State governments 17.6Federal government 3,5Intermediate sources .9
Local property tax collections* 42.0School districts 23.0Other local governments 19.0
4,1

Alternative Tax Sources 39
orities. State and local funds previously required to match the cate-gorical Federal grants will be freed for use at the discretion of State-local officials, In other words, Federal incentive programs will beminimized or eliminated and education will have to compete for thereleased dollars with other functions (e.g., police protection, trans-portation, etc.). This is what is referred to as the "new fiscal fed-eralism."
Politicians are fond of quoting Chief Justice John Marshall's state-ment in the famous McCultock vs. Maryland case, ". . that the powerto tax involves the power to destroy . . .." Interestingly, they too oftenoverlook his next few words: ". . . that the power to destroy may de-feat and render useless the power to create." The: real danger of out-moded and unbalanced local revenue structures for the support ofeducation is that it inhibits the creativity of the government and sup-presses the creative impulses of the citizens who support it. Such inhi-bition and suppression can profoundly affect the quality of life ofsociety.
FOOTNOTES
I. George W. Mitchell, "is This Where We Came In?" Proceedings of theForty-Ninth Annual Conference, National Tax Association (1956), p. 494.
2. Advisory Commission on Intergovernmental Relations, Public Opinion andTaxes, Washington, D.C. (May, 1972).
3. Tax Foundation, Inc., The Financial Outlook for StateLocal Government to1980: A Sumar), New York, 1973,
4. Advisory Commission on Intergovernmental Relations, Financing Schools andProperty Tax ReliefA State Responsibility, Washington, D.C. (January, 1973),A.40, page 14.
5. /Ind., p. 3.6. Advisory Commission on Intergovernmental Relations, StateLocal Finances:
Significant Features'and Suggested Legislation, 1972 Edition, M74, pages 192, 194,226, 229.
7. Ibid., p. 49.8, ACIR, Financing Schools, A.40, pp. 24.25.9. Ibid., p. 28, and StateLocal Finances, op. cit., p. 45.10. Financing Schools, op. cit., pp. 24.25.II. The New York Times, Sunday, April 1, 1973, p. 39.
fa
5

Approaches to Equitable Financing ofEducation in Canada: Federal Provin-
cial Tax-Sharing and ProvincialFinancing
WILFRED J. BROWN
Canadian Teachers' Federation, Ottawa, Ontario.
As in other areas of activity, there are many similarities betweenthe Uni;ed States and Canada in the arrangements and mechanismsfor financing education. For example, the foundation concept forstate-local cost sharing has been widely adapted by Canadian prov-inces. Rather than concentrate on these or other aspects of our systemswhich may be quite familiar to you, this paper will deal with twofeatures of our systems which have not been widely used in the UnitedStates, namely, tax-sharing with unconditional equalization at thefederal-provincial level and an interesting experiment in centralizedfinancing of education by the Province of New Brunswick.
Following a brief overview of the growth of educational spendingin absolute and relative terms and of the rapid changes in sources offunds for education in Canada, it is proposed to examine the federal-provincial tax sharing arrangements by means of which the provinceshave been given access to fiscal resources sufficient to carry out theireducational and other constitutional responsibilities. It is then pro-posed to discuss some aspects of our provincial-local arrangementsfor financing elementary ane. secondary education, with particular at-tention to the New Brunswick experience with centralized financing.
The British North America Act of 1867, the Canadian equivalentof the U.S. Constitution, gave each province the right and respond-
41

42 School Finance in Transition
bility to develop and administer its own system of education. Thus,ten distinct provincial systems of elementary and secondary educationhave evolved. While there are some important differences among thesesystems, most of them have local school boards and use property taxesas a major source of funds.
EDUCATION IN CANADA'S NATIONAL ECONOMY
In common with most other Western countries educational spend-ing in Canada has increased greatly in recent decades, particularly inthe sixties. Between 1961 and 1971 total spending on Formal Educa-tion and Vocational Training in Canada increased from $1.9 billionto $8.0 billion for an average annual rate of 15.7 per cent. In relativeterms, the growth of educational spending has also been quite remark-able, rising from 4.7 per cent of GNP in 1961 to 8.6 per cent in 1971.'In relaticel to Personal Income, the comparable percentages were 6.4in 1961 and 10.9 per cent in 1971.
While a tremendous expansion in post-secondary education duringthe sixties contributed sharply to this growth in total costs, spendingon elementary and secondary education also grew very rapidly, from$1.4 billion in 1961 to $5.0 billion in 1971 for an average annualgrowth rate of 13.5 per cent. In relation to national output, spendingfor elementary and secondary education increased from 8.6 per centof GNP in 1961 to 5.4 per cent in 1971 and the comparable percent-ages in relation to Personal Income were 4.8 per cent in 1961 and 6.8per cent in 1971.
The reasons for the above developments are familiar: more chil-dren staying longer in school and demanding wider educationalchoices.
The most notable structural change in Canada's arrangements forfinancing education in recent years has been the assumption by theprovinces of a much larger share of local school spending:
Publicly. Change A1.L ChangeControlled 1958 FOlt AfAL 1958
Elementary ir to EMMA- toSources of Funds Secondary 1968 T1ON 1968
(1968) ( 1968)
A. Local government taxation 39.8% (-9.2) 25.3% (-14.9)11. Provincial and territorial
governments 52.2 (+11.6) 54.6 (+12.3)C. Federal government 5.2 (+0.7) 11.5 (+3.4)D. Non-government (private) 2.8 (-3.1) 8.6 (-0.8)
TOTAL 100.0% - 100.0%
SMILLIONS 3,595.5 5,668.9
'Includes elementary and secondary, teacher training, university and vocationaleducation.
(17

Financing Education in Canada 43
In the decade 1958 to 1968 the share of local taxation as a sourceof funds for total educational spending fell from 40 to 25 per centwhile the provinces' share increased from 42 to nearly 55 per cent.This takeover of major financial responsibility by the provinces hasbeen most pronounced at the elementary and secondary level wherethe share of local taxation fell from 49 to 40 per cent and the provin-cial share rose from 41 to 52 per cent.
Similar shifts have taken place at the post-secondary level but theshift has been from the provinces to the federal government. In 1960,the provinces contributed 41 per cent of the funds to post-secondaryeducation in Canada, the federal government provided 22 per centand the private sector (i.e., fees, endowments, etc.) made up the re-maining 37 per cent. By 1969, the federal share had doubled to 44per cent while the provincial share had declined to 32 per cent andthe relative importance of the private sector had dropped to 24 percent. Having documented the growth in our total financial commit-ment to education and the shift in the burden of financing from themunicipalities to the provinces, it will be useful to examine the meansby which the provinces were permitted to assume this additional bur-den, namely, tax-sharing or tax credits, as you may know them.
PROBLEMS OF FISCAL BALANCE AND EQUITYIt will be useful at this point to review some of the problems of
post-war fiscal federalism in Canada which have had to be overcome.Those problems are endemic to federal states but have been morepronounced in Canada during the past two decades than at any othertime.
Dynamic Imbalances Between Spending Responsibilitiesand Revenue Means
While spending responsibilities and revenue sources are usuallyroughly in balance for the senior governments when a federation isnegotiated, it is unlikely that they will remain in balance over anysubstantial period of time. Social and economic conditions change and,with these changes, the priorities for desired public services alsochange. In addition, the relative importance of various sources of reve-nue wax and wane. These twin problems are not as serious in a uni-tary state where the central government can alter spending responsi-bilities and tax powers at will, as they are in a federal state where theoriginal division of powers and responsibilities was the political compromise which made nationhood possible and is usually firmly en-trenched in a written constitution.

44 School Finance in Transition
Aggregate imbalances between spending responsibilities and reve-nue-raising powers have been particularly apparent in Canada in re-cent decades. Most peacetime priorities have arisen in the social serv-ice field which, in Canada, is the domain of the provinces. The ex-pansion of education has already been documented and there havebeen similar expansions in health and welfare.
In an attempt to keep pace with the explotiing demands for serv-ices in their domain, provincial and local governments raised the ratesand enlarged the bases of old taxes and, at the provincial level, newtaxes were added, chiefly general sales taxes. Despite these measures,the pressure to enlarge spending exceeded the ability of the provincesand their localities to increase tax )ields from their own sources.
The principal reason for the failure of provincial and local revenuesources to keep pace with their spending needs is that the yields ofthe taxes on which they rely do not respond well to normal growthin the economy. This fact is illustrated by comparing revenue elastici-ties of the major taxes in Canada with respect to Gross National Ex-penditue over the period 1933 to 1965. The revenue elasticity ofwealth taxes, primarily the real property tax on which municipalitiesrely, was 0.87 while that of consumption taxes, on which the provinceshave traditionally depended most heavily was 1.12. The revenue elas-ticity of income taxes, exploited mainly by the federal governmentwas 1.66. The higher revenue elasticity of income taxes is explainedby progressive rate structures and rising income distribution profiles.
Interprovincial Differences in Levels of Real Income
The second major problem in our federal financial arrangementsarises because of differences hi levels of real income among provincesand, it must be added, among localities within provinces. jurisdictionswith relatively low levels of real income must levy heavier tax bur-dens On their citizens to provide similar standards of public servicesprovided in wealthier communities. To the extent that prevailingideas of social justice (or political expediency) require alleviation ofthis situation, a redistribution of tax revenues is required.
In the past two decades there has developed in Canada a verystrong sentiment favouring government intervention to reduce thegap between "haves" and "have nots," whether it involves adjustmentsin the economic well-being of individuals or the fiscal capacities ofprovincial governments to provide comparable standards of socialsery ices.
FEDERAL-PROVINCIAL FISCAL ARRANGEMENTS
The Canadian approach to solving the problems of aggregate im-balances between spending needs and revenue sources and to offsettinginter-provincial disparities in standards of social services has evolvedfrom the historical circumstances out of which the federation emergedand from subsequent events. The modern history of Canadian inter-governmental fiscal relations began itt 1940 with the reporting of the
119

Financing Education in Canada IS
Royal Commission on DominionProvincial Relations (RowellSiroisCommission). The Commission had been appointed to examine thehopeless jumble of income and consumption taxes which had grownup in most of the provinces and to recommend rationalization offederal-provincial finances. Despite the rejection of the RowellSiroisreport at the time, the debate and controversy surrounding its rec-ommendations created an atmosphere hi which all parties were morereceptive to change than might otherwise have been the case. In fact,the system of federal-provincial fiscal arrangements which has evolvedover the past 30 years is similar in many respects to that recommendedby the Rowell -Sirois Commission.
Tax Rental (1942.1962)
Early in World War II, the federal government was able to per-suade the provinces to relinquish their own personal and corporationincome tax fields in return for unconditional "rental" payments. Pos-session of uadisputed control of the income tax permitted the federalgovernment to pursue the war effort to the fullest extent. Rentalagreements, first made in 1942, were renegotiated every five years andeventually covered the period 1942 to 1962 using rental formulaswhich became progressively more generous from period to period.
Tax rental requires that a provincial or state government refrainfrom exploiting a tax source to which it has legal access, in return fora negotiated percentage of the collections made within its region bya higher level of government. The advantages of tax rental for suchlevies as income taxes are that they (1) help facilitate equitable treat-ment of individual taxpayers among provinces, and (2) permit a cen-tral government to pursue ecoomic policies with less likelihood ofhaving them neutralized by the provinces. The proceeds of tax rentalsare, of course, derivation transfers in that, in the absence of equaliza-tion or stabilization clauses, they are proportional to the revenue de-rived from the recipient's own jurisdiction.
The rental system worked well for Canada during the wartime andin the early post-war years, providing the federal government with astrong revenue base, establishing a standard income tax structureacross the country and guaranteeing the provinces certain basic reve-nues at fairly low political risk. However, tax rental had some seriousdisadvantages. First the provinces who sign rental agreements forfeita degree of autonomy in that they are not free to vary the tax rate.Since the productivity of provincial consumption taxes is low and theirincidence slightly regressive, there is little a province can do to in-crease revenues significantly during the course of an agreement. Sec-ond, tax rentals violate the principle of fiscal responsibility in that thepolitical pain of raising the funds does not fall on the same level ofgovernment which has the political pleasure of spending them. Fi-nally, a tax rental system penalizes any province which prefers not torefrain from imposing its own income or succession taxes. In Canada,Quebec refused to participate on grounds that the concept of tax rental was incompatible with its constitutional rights.

46 School Finance in Transition
Tax-Sharing (1982-1972)The disadvantages of tax rental led to their replacement in 1962
by a form of tax-sharing arrangement. After negotiating a mutuallyacceptable tax base, parties to a tax-sharing deal are free to vary therates as they choose, thus overcoming some of the major disadvantagesof tax rental. Under the 1962-67 agreement as it applied to personalincome tax, the federal government imposed a national "basic tax"which it then reduced or abated by a negotiated percentage in orderto "make room" for the provincial taxes.
For the first time in 1962 the federal government and the provincesalso entered into Formal tax collection agreements under which thefederal government agreed to collect, free of charge, provincial per-sonal and corporate income taxes without any limit on the amountcollected. Thus, the provinces were free to tax at rates beyond thefederal abatement, the only condition being that the provincial andfederal tax bases had to be identical. All provinces except Quebecchose to have their personal income taxes collected by Ottawa. In ad-dition, Ottawa collected corporation income taxes for all provincesexcept Ontario and Quebec.
Throughout the series of tax rental and tax-sharing agreementsthere has been an incessant struggle by the provinces to increase theirshare of the tax pie and the Federal government has, in fact, given upmore and more of the federal "basic tax" to the provinces. The fol-lowing are the basic percentages by which the federal governmentwithdrew from the personal income tax field:
1957 Arrangements (tax rental)1957to 13
1961
1962 Arrangements (tax-sharing)1962 161963 171964 181965 221966 24
1967 Arrangements (tax-sharing)1967to 28
1971
The additional four percentage points of personal income tax abatedto the provinces in 1967, together with one percentage point of cor-porate Income tax (not shown above), were ranted to the provincesfor post-secondary education and will be discussed inure fully fur-ther on.
The successive abatements of federal tax collections throughoutthe sixties was the major factor enabling the provinces to increase
4..9L.

Financing Education in Canada 47
their share of educational costs, documented earlier. The remarkableaspect of this period in Canadian federal-provincial fiscal relations isthat the provinces have been able to meet the exploding demand forsocial services in their domain, including education, without increas-ing the income tax burden on their taxpayers. In fact, except in thoseprovinces which taxed beyond the federal abatements, the income taxburden remained almost constant from 1961 until 1971.
By means of federal-provincial negotiations, it has been possibleto shift effective taxing power from the federal to the provincial levelin recognition of urgent provincial priorities in the social service fields.Thus, it has been possible, with a minimum of disruption to the taxstructure, to strike a new balance between expenditure needs andrevenue sources at each level of government.
Revenue Equalization Grants
As early as 1957, the federal government began to make uncondi-tional tax revenue equalization payments .to the provinces with theobjective of better enabling all provinces to provide comparable lev-els of services with comparable levels of taxation. The 1957 agreementprovided for equalization payments to bring the per capita yield ofthe three "standard" taxes (i.e., personal income, corporate incomeand succession duties) up to th, weighted average yield from thesetaxes levied at "standard' rates in Ontario and British Columbia, thetwo provinces with the highest per capita yields. Payments were madeto all provinces, including Quebec, even though it did not participatein the rental agreements. In 1962, a measure of natural resources reve-nue was introduced into the equalization formula but the level towhich revenues were being equalized was reduced from the average ofthe top two provinces to the national average. One year later, however,and for the balance of the 1962.67 Agreement, the formula waschanged back to the "top two" basis but with a deduction for prov-inces with above-average per capita yields from natural resources.
A major change in the equalization formula took place in 1967when the tax base used to determine entitlement to equalization wasbroadened to include virtually all sources of provincial revenue in-stead of the four revenue sources used in the previous agreement. Theformula attempts to measure the amount by which each province'srevenues, as calculated using a "representative tax system" fall shortof the national average because of weak revenue sources. These equali-zation payments ensure that each province can receive revenue equalto the national per capita average regardless of the deficiencies in itsown revenue sources and without subjecting its taxpayers to aboveaverage tax rates.
In 1972, the federal government distributed approximately $1 bil-lion in unconditional equalization transfers under the Federal-Provin-cial Fiscal Arrangements Act. The following are the percentages of1972 gross general revenue made up of unconditional equalizing grantsunder this program:
0(4
48 School Finance in Transition
Newfoundland 26.2%Prince Edward Island 20.7Nova Scotia 17.7New Brunswick 21.1Quebec 9.2Manitoba 8.0Saskatchewan 16.8
7 Provinces 12.3%
In the Federal Budget brought down on February 19, 1973, theGovernment announced that the revenue equalization formula wouldbe expanded, effective April 1, to include local taxes. The net effectof this measure will be to transfer substantial extra funds each yearto the above provinces. The transfer will amount to about 28 per centof the local school taxes collected in these provinces and will increasetotal equalization payment by $190 million to $1.4 billion in 1973-74.The Minister of Finance indicated that he expected to see the prov-inces affected pass on substantial benefits from these extra funds totheir local property ratepayers.
Conditional Grants in Health and Welfare
What have just been described are the major features of federal-provincial arrangements for ensuring the provinces a high degree offiscal balance and equity. In addition to the program of tax abate-ments described previously, the federal government makes use of an-other mechanism to promote fiscal balance, namely, conditional grantsin the fields of health and welfare. These programs are worthy of notein this paper because the policies which have been adopted with re-gard to these programs are indicative of the philosophy of the Ca-nadian Government toward involvement in the provincial domain.
By conditional grants, I mean cost-sharing schemes under whichthe federal government pays approximately 50 per cent of the cost ofprovincially administered programs, not categorical grants which canonly be used for specific purposes. The provinces retain a wide lati-tude in undertaking programs eligible for federal cost-sharing.
These programs have been designed primarily for stimulation andtax relief rather than equalization, although there is an implicit ele-ment of equalization in the distribution formulas which usually re-sults in the federal sham being larger in the less affluent provinces.There has been no attempt in Canada to build a "fiscal need" com-ponent into our conditional grants at the federal-provincial level ashas been done in the United States with many of the categorical grantsin health, education and welfare. Serious efforts at equalization aremade through provincial revenue equalization grants.
The conditional shared-costs grants are for three programs inhealth and welfare: The Canada Assistance Plan, Hospital Insuranceand the Medical Care Program. These programs were established bythe federal government to ensure that all provinces could meet certainbasic standards of health and welfare service.
.
Financing Education in Canada 49
The federal government now regards these three programs as "wellestablished" in the sense that they are felt to have sufficient popularsupport in all provinces to ensure their continuation without directfederal involvement. Accordingly, Ottawa has proposed to withdrawfrom these programs by eliminating the conditions which have ap-plied to the federal contribution and substituting a fiscal equivalentin the form of tax points.
The federal government made its first "opting-out" proposal in1964, renewed and altered it in 1966 and 1968 and then withdrew italtogether in 1969 pending major tax reform. These details are of nogreat interest here. The essential point is that, once a program in asocial service field has been initiated and become "well established"the Canadian Government has adopted the philosophy that it is betterto terminate direct financial assistance in exchange for tax points.
Post-Secondary Education Fiscal TransferIn 1967 the federal government introduced an unusual type of
transfer to assist the provinces in financing post-secondary education.This program was in partial replacement for a per capita grant touniversities which was being phased out. The Post-Secondary Educa.Lion Fiscal Transfer is unusual in that it is unconditional and con-ditional at the same time.
The unconditional feature of this program consists of the abate-ment of four equalized points of personal incr, tax and one equal.ized point of the corporation income tax bas p ed earlier in the de-scription of general tax abatements. If necessary, the tax abatementrevenue is augmented to bring the total transfer up to 50 per centof the operating costs of post-secondary institutions or to an amountequal to $15 per capita of the provincial population in 1967, which-ever the province in question prefers. Newfoundland, Prince EdwardIsland and New Brunswick have chosen the latter option. Total fed-eral transfers to the provinces under this program increased from$422 million to $870 million between 1967 and 1971 absorbing a substantial share of the increased costs of post-secondary education in thelate sixties. When the 1972.77 fiscal arrangements were negotiated withthe provinces the federal government only agreed to continue thisprogram for two additional years and placed a limit of 15 per centper annum on the growth of payments for the final two years. Studiesconcerning the federal role in financing post-secondary education arein progress at this time.
PROVINCIAL-LOCAL SCHOOL SUPPORT PLANSAs noted at the outset, this paper will give major attention in con
sidering provincial-local financing of !ducation to the New Brunswickexperience with centralized financing. Before doing this, however, itis necessary to provide an overview of the kinds of programs employedin the other provinces.
It is useful to begin by examining the sources of school board reve-nue by province for a recent year (1968). In both Newfoundland and
3
40 School Finance in Transition
SOURCES OF' Scnoo1. BOARD REVENUE, 10 PROV I N CES1968
Province Gratits /.oral Other Total
Percentage Distribution MILLIONSNewfm. idland 90.0 2.0 8.0 41.5
Prince Edward Island 70.0 2P.7 1.3 11.9
Nova Scotia 53.9 45.0 1.1 82.1
New Brunswick 99.7 .... 0.3 55.3Quebec 57.1 41.3 1.6 913.5Ontario 46.0 51.0 3.0 1242.3Manitoba 77.0 20.5 2.!, 131.0
Saskatchewan 43.0 53.6 3.4 137.2
Alberta 50.8 45.5 3.7 262.8British Columbia 41.0 56.3 2.7 284.5
,111 Provinces 52.1 45.3 2.6 3162.1
New Brunswick the provincial government pays virtually the totalcosts of education.Among the mixr eight provinces the provincial share varies from 701,er cent to 41 per cent. Only in Ontario, Saskatchewan and BritishColumbia does local government contribute more than half of schoolboard revenue.
Several Canadian provinces use variations of the foundation pro-grant concept for allocating provincial funds to local school boards.Alberta and British Columbia have variations of the Mort Plan inthat they define the minimum prograth in terms of a weighted teacheror classroom. Saskatchewan, Manitoba and Quebec all have planswhich use features of the Maryland Plan. Ontario which, until recentyears, had a form of the Mort Plan has now ddopted a variable per-centage scheme but retained some features of its former plan. In thelast two or three years several of the provinces have introduced sometype of budgetary controls curbing local initiative in exceeding thefoundation program.
New Brunswick, one of our At'arair Provinces, covers 28,000square miles, similar in physical ciia acteristics and resource endow-ment to Maine. It has a preominantly rural population of about640,000, 60 per cent English-speaking and 40 per cent French-speakingand a per capita personal income substantially below the nationalaverage. Until. 1967 the Province t I over 400 school districts, tmmycontaining one-room schools mid t. ch child's educational opportu-nities depended essentially on the vagaries of property tax geography.
In the early 1960's the Governmi. of New Brunswick set up theRoyal Commission on Finance and 'Municipal Taxati Jli co stIldy allaspects of .provincial-local finances and functional assignments. Theresult, beginning in 1967 was a complete reorganization of provincial-local relationships lnd finances including assumption by the Provinceof full responsibility for financing elementary and secondary educa-tion,' and the financing and provision of health, welfare and justice.To accomplish these purposes there was a complete restructuring of
rr

Financing Education in Canada !1
the provincial-local tax system including the elimination of outmodedtaxes such as the personal property and poll taxes and the levyingof a uniform province-wide real estate tax at an effective rate of 1.5per cent of market value, to be determined by provincial assessors. Inaddition the Province took over the billing and collection of all prop-erty taxes.
The existing school districts were consolidated into 33 districts or-ganized in seven regions each having a regional .superintendent whoserole it is to provide leadership in those districts which required up-grading and, in all cases, to provide contact and liaison between thedistricts and the Department of Education.
The responsibility for the administration of education in each ofthe 33 distracts is delegated to a board of school trustees. Ti- ce boardshave either nine or fiLeen members, six or nine of which, rc p'ctively,are elected while the remainder are appointed by the Lieutenant-Covernor-in-Council.
Funds for operating and capital expenditure are distributed to theschool districts on a budgetary basis by the Department of Educationand each board of trustees is responsible for administering the financesof its district. Budgets are submitted by each district to the Ministernot later than November 15 each year. Overall budgetary policy isdiscussed at a conference of Departmental, Regional and District per-sonnel in December and this is followed by individual discussions be-tween departmental and district officials at which realistic operatingbudgets are established. The budgets of all school districts are thensubmitted to Treasury Board as part of the Department of Educationbudget. The districts are usually advised in April of the actual budgetallotments which are finally approved by the provincial Legislatureand distribution to the districts begins on a monthly basis in July.Beginning in 1970, the Province initiated a centralized payrolling sys-tem for issuing bi-monthly salary cheques to approximately 8,000teachers and 2,000 non-teaching employees.
Centralization of financing in New Brunswick has undoubtedly ad-vanced the goal of equalization of educational opportunity in a waythat no provincial-local cost-sharing arrangement seems capable ofdoing, at least not in Canada. Since there are no more than slightvariations in costs per child between school districts, there has un-doubtedly been a considerable reduction in the wide discrepanciesin resources available for each child's education across the Province.To this extent, the goal of more equal provision of educational serv-ices seems to have been advanced. At the same time, load decision-making in important policy areas such as the hiring of teachers hasbeen retained, albeit after a sweeping consolidation of local schoolhoards.
The process of equalization has been a Wilful and costly one forNew Brunswick. In order to improvt. the :ducational and other pro-grams of those in areas poorly served in the past, it has been necessaryto raise taxes. Moreover, people in the larger and more affluent, mainlyEnglish-speaking areas of the Province have had to "mark time" Our-ing the "evening-up" process and this has made them unhappy. Ai-

52 School Finance in Transition
though the ambitious program he fathered goes on, Louis Robichaud'sLiberal Government was defeated at the polls in November 1970.
Early in this paper two problems of fiscal federalism were identi-fied which, if not solved or alleviated, have serious consequences forthe financing of education, in particular. The first is dynamic imbal-ances between spending responsibilities and revenue sources at thefederal-provincial level. The pattern of arrangements which hasevolved in Canada for meeting this problem has consisted of tax-shar-ing agreements under which both the federal government and theprovinces exploit the lucrative income tax to which they have jointconstitutional access. By successive reductions in its own taxes through-out the sixties, thereby giving the provinces more "tax room," thefederal government implicitly recognized that provincial prioritiesin education, health and welfare should have precedence over fed-eral priorities.
Where the federal government has identified national prioritiesin the social service field it has assumed a form of flexible leadershipby using loosely defined conditional cost-sharing grants until the pro-grams are established and then relinquishing control over these fieldsto the provinces. In this way, provincial needs and asph ations havebeen better accommodated and the principle of "fiscal responsibility"better served.
The second major problem of fiscal-federalism affecting the financ-ing of education consists of intergovernmental differences in fiscal ca-pacity necessitating redistribution. By means of the federal-provincialrevenue equalization program, each province can, without subject-ing its taxpayers to above average tax rates, receive revenue equal tothe national average regardless of its own revenue sources.
It would be less than honest to suggest that these reasonably effec-tive and simple solutions to the problems of fiscal balance and equitycame about by either design or by generosity on the part of the fed-eral government. In fact, the Province of Quebec has held out inces-santly against most federal-provincial fiscal arrangements viewingthem as infringements on her constitutional rights. In recent years,some of the other provinces have been almost as insistent in their de-mands for fiscal decentralization. In short, the major factor in deter-mining the pattern of intergovei mnental fiscal relations in Canadahas tlen the desire to preserve our national unity.
Despite numerous transitional problems, it appears at this timethat the New Brunswick program of provincial financing of educa-tion has resulted in more equal provision of educational servicesamong the children of the Province, while at the same time preserv-ing a significant amount of local decision-making. Many of the prob-lems encountered in New Brunswick stem from the fact that thescheme was not phased in gradually and from the persistence of di-visions among the population which are centuries old,
The measures to achieve better fiscal balance and equalization atthe federal-provincial level have resulted in a decentralization of fi-nancial power into the hands of the provinces on their own terms, TheNew Brunswick program is a rather dramatic example of the utilica-

Financing Education in Canada 53
tion of this power by one province to improve the distribution ofeducational service among its people. Other provinces are movingtoward a similar end in gradual steps. For example, Prince EdwardIsland recently initiated its own version of the New Brunswick pro-gram, Alberta has just enacted a province-wide property tax, the Min-ister of Education of British Columbia has predicted province-wide fi-nancing during the seventies and several provinces have adoptedprovince-wide negotiation of teachers' salaries. All of this suggests thatwithin a decade ur so most Canadian provinces will have achieved es-sentially the same end as New Brunswick.
FOOTNOTE
!All statistics Tuned in this paper were obtained from or derived from pub-lished reports of Statistics Canada. Educational data was obtained from reports ofthe Education Division of Statistics Canada.
4

Accomplishing Fiscal NeutralityCHARLES S. BENSON
Professor, University of California, Berkeley.
To speak of accomplishing "fiscal neutrality" requires that we firsthave an understanding about what the term means. The heuristic useof the concept of fiscal neutrality in Serrano and related cases hasno thorough development in the literature of public finance. I sug-gest we are free, those of us who are interested in social policy, todefine the term in any sensible way that we wish.
TAX NEUTRALITY
It is true that economists have established a principle of neutralityin analyzing the relative worth of different instruments of taxation. A"neutral" tax is one that is free of "side effects." Whereas a tax existsmainly to transfer command of economic resources from private sectorto public, the use of a given tax may create certain specific incentivesfor households to modify their behavior in the marketplace, either intheir capacity as producers or consumers.1 Such kinds of influences onhouseholds, insofar as they stand aside from the general transfer-of-economic-resources process, are generally regarded as undesirable fea-tures of a particular tax instruments
What arc some examples of side effects? A progressive income taxmay discourage entrepreneurs from taking risks and salaried personsfrom engaging in some especially demanding kind of work. The ideais that after one has reached a comfortable level of income, a personfinds that much of the extra income derived from a risky venture orfrom some especially difficult assignment must be surrendered to gov-ernment; hence, the fact that one can keep only half of any additionalincome, say, reduces willingness to put oneself out. It is a psychologi-cal response, and possibly one of importance.
55

56 School Finance in Transition
Excise taxes serve to raise the prices of commodities on which theyare levied and, reteris paribus, reduce consumption of those articles.Excise taxes drive a wedge between market price and cost of produc-tion; thus, they make impossible an attainment of maximum level ofweliare, for such a maximum implies no such interference in exerciseof household tastes. Property taxes have effects on location of inch's-trial and commercial properties; accordingly, they effect, inter alia,commuting patterns."
None of the side effects cited as examples reflect economic ration.ality. If a government chooses to use a progressive income tax, it doesso on grounds of equity and revenue productivity. The fact that thetax may constrict risk .:aking and the matching of high level skillsto eseecially demanding work assignmentsthe establishment of anegative incentive on work effort in generalis deplored. Tax neu-trality, then, is a criterion of relative worth of tax instruments. Thatnon-neutral taxes are used reflects the condition that the most neutralkinds of tax instruments, such as the value added tax, are deficienton equity criteria.
FISCAL NEUTRALITY DEFINED
Fiscal neutrality implies a principle broader than tax neutrality,for it deals simultaneously with the revenue-raising process and withthe distribution-of-benefits process. In their findings in the Serranocase, the majority of members of the California Supreme Court ex-pressed dismay that a property-poor school district -lacked means topurchase high quality school service. They noted that poor districtswould have had to levy a tax rate more than double state average toenjoy the benefits of high educational expenditure. It is immediatelyclear that the Court had tax burden and service benefits simultane-ously under consideration. Strange as it may seem, such a logical typeof analysis is new in social policy, at least with respect to the opera-tions of local government.
The view that fiscal neutrality connotes joint examination of taxrates and benefits does not, however, bring us completely to a work-able definition of fiscal neutrality. We need a more precise renderingof the principle involved. We also must consider the unit, whetherschool district, class of taxpayer, household, or student, toward whichthe principle is to be applied.
Though I must cast it in negative terms, 1 offer the following asthe general definition of fiscal neutrality: fiscal neutrality exists whenwe see no warping or distortion of choice in consumption of tax.financed goods and services on irrational or socially-undesirablegrounds.' We shall now examine how this principle may be appliedto different units of analysis.
FISCALLYNEUTRAL SCHOOL DISTRICTS
So far, school districts are the units most commonly mentionedin discussions of fiscal neutrality. The California Supreme Court could
Fiscal Neutrality 57
find no compelling reason for fiscal decisions of school districts to be50 thoroughly constrained by the amount of locally-taxable propertyper student contained within the boundaries of those units of gov-ernment. The existing wistem appears to Lail the test of rationality,for no one has so far suggested a logical connection between require-ments of a district for school services and the existenceor lack ofexistence, sayof a large private public utility within its borders.The Serrano case, hence, might have been argued strictly on rational-ity groundsthis is what choice of school district as unit of analysismeans to me. It is irrelevant if a property-poor school district happensto be populated by upper-middle income households. The penaltysuffered by the district, i.e., by failing to have commercial and indus-trial properties available to tax, exists without regard to the incomelevel of the people who live in it.
CLASS OF TAXPAYERS AS UNIT OF ANALYSIS
Yet, we should not forget that plaintiffs in Serrano were poor peo-ple and that their case was pressed by poverty lawyers. In its rulingon demurrer the California Court held that education is a funda-mental interest which, under equal protection clauses of the UnitedStates and California Constitutions, should not be distributed undera suspect classification. The suspect classification displayed to theCourt was district wealth. However, the Court appeared to assumethat wealth of school district was a proxy for household income. Thus,the existing system of finance was seen as one which penalizes poorpeople.
One might go on to say that an educational system which favorsthe rich and penalizes the poor is fiscally non-neutral in that it ac-cepts a distortion of choice on the basis of a socially undesirable cri-terion. To so assert would be to hold that the development of humantalent is a process of sufficient value that it should stand free of inter-generational forces, such as parental income, as long as privacy is notunduly invaded.5
We must now begin to think about how the selection of a unit ofanalysis affects policy to accomplish fiscal neutrality. If the unit isthe school diss,rict, then a property-based district power equalizingscheme might be saki to serve the purpose. Assume that district ex-penditure decisions are made by a cabal without regard to educa-tional tastes of the inhabitants of the district or lien.' income. Letmembers of the cabal, however, prefer lower local tax rates to higher,other things equal. District power equalizing would allow the cabalsin all the districts of the state to make their decisions on school pro-grams without having to take account, presumably, of local taxablewealth.
Suppose. on the other hand, that the unit of analysis is class oftaxpayer and suppose, further, that the objective of fiscal neutralityis to see that poor people have equal means to express their tastes foreducation as do the rich. Then property-based district power equalizing simply would not serve the objective. If some poor families today

58 School Finance in Transition
are excluded from superior educational opportunities by lack of meansto purchase land in affluent, educationally-minded suburbs or to paythe rents that high land values in those places connote, then theywould he excluded tomorrow by inability to pay the top tax rates ofDPE schedule. I would expect, furthermore, to see poor families whotoday live in middle inc itte communities segregate themselves intolow income communities where school taxes would be low. I wouldalso look for a clustering of commercial and industrial properties andretirement villages into low tax areas, but, unlike now, the tax yieldof such properties would not offer benefits to local residents.
Fiscal neutrality in terms of class of taxpayer might be served byDPE with a different local tax base, namely, surtax on Federal incometax liability. The surtax rates could run in the range of 5 to 15 per-cent. Because Federal income tax liability recognizes size of fami:yand special family hardships (e.g., unusual medical expenses), andbecause the schedule of rates is quite progressive up to high incomelevels, DPE based on income tax liability, though not a completelyneutral system by class of taxpayer, would be, nevertheless, a systemunder which a group of poor families could elect to live in a comemunity that sought to receive high quality educational services, forthe high DPE surtax rates of that community would be laid on asmall or non-existent income tax liabilities of the poor families. Theplan would also favor persons of moderate income who desire to havethe combination of expensive housing and good education (both kindsof items being favorable for the development of youth, one wouldthink). Taxation of residential property for schools would be aban-doned. Non-residential property might become subject to taxationfor schools at a statewide rate. This would make taxation of industrialand commercial properties itself more rational, for the benefits fromschool levies received by the owners of such properties are not ordi-narily drawn from a single school district but from the collectivity ofdistricts.
FISCAL NEUTRALITY AND THEINDIVIDUAL HOUSEHOLD
At the present time, the quality and type of educational servicesconsumed directly by a household are intimately linked to its choiceof place of residence. This condition is especially characteristic ofstates which have maintained an administrative structure that includeslarge numbers of small school districts, but it may exist as well-instates with a county district structure if families are restricted in choiceof school by attendance areas within the county.
There is no logical connection between household desires withrespect to place of residence and household demand for educationalservices; hence, fiscal neutrality demands that the nexus be broken.For all except the very richest, education is an item of group con-sumption. Power to choose one's group may be equally important aspower to command an adequate supply of dollars to purchase serv-ices. In states which have large school districts, such as counties, the

Fiscal Neutrality
solution is relatively simple, in principle: allow choice of school in-dependently of intra-county attendance cones."
For states which have many small school districts, the approachmust be somewhat more complicated. I suggest the following plan.Along with IRE based upon surtax on Federal income tax liability,add the following provisions. 1) Allow families to choose any schoolfor their children to which school or public transport is available orto which the household is able to provide its own means of transport.2) School tax payments levied on a household should follow pro ratathe children of the household to whatever school they attend. 3) Thetax rate paid by the family should be a weighted average of the taxrates levied in all the districts used by the given family. 4) However,the school tax rate paid by any family should never be less than therate it would pay if it chose to enroll all its children in its district ofresidence.
The last provision exists to assure that parents are not allowedto achieve a school tax rate advantage over non-parents, i.e., by send-ing all their children to a low tax rate district. This might be, ofcourse, a bona fide choice for some households. In that case, the givenfamily would be paying an excess amount of tax as compared withthe families of the same income who lived in the district to whichthey were sending their children to school. This sum might be creditedto them to allow them to purchase supplementary educational serv-ices. Or it might be deposited in an "educational improvement fund"of the district.
These proposals, I believe, would go quite a long way towardfreeing choice of educational services from choice of residence. Forexample, I might wish to live in a small school district because of theview, congenial neighbors, etc., but I might wish to send my childrento central city schools to benefit from the more diversified programtheir economies of scale allow them to offer. The plan I have proposedwould allow me to do so, and the maximum extra sum I would paywould be the differential, if any, between the central city's school taxrate and that of my home district, plus possibly transport.
This set of proposals admittedly places government in a positionof risk. A given district might enjoy a high demand for its servicesand build physical facilities to accommodate that demand. Later, itmight suffer a loss of esteem and find itself with excess capacity. How-ever, risk carries with it gains as well as losses, and I feel that somecompetitive pcssure in the public sector is generally a good thing.Moreover, the possibility of having excess capacity could be mini-mind by making use of a certain amount of leased space, along withportable facilities.
THE STUDENT AS THE UNIT OF ANALYSIS
In some cases the tastes of students may differ from those of par-ents in the matter of quality and type of educational services desired.As long as too much in the way of social benefit was not sacrificedand as long as parents did not become too upset, I would favor stu-

1;0 School Finance in Transition
dents having more choice about their educational experiences from,say, the junior high years on. One case where this might be importantwould he the following. Suppose I choose to live at some distancefrom a central city in a cluster of small school districts. Let me assume,to make the case as value-free as possible. that I have good reason todo so and that all members of my family approve my choice of resi-dence except for the fact that my children want to have more highlyspecialized educational services than any of the surrounding small dis-tricts can give them. Thus, not even providing for fiscal nentralityof the individual household serves to protect their choice against anirrational constraint.
Chokes of students can he served, at least to some degree, by es-tablishing regional educational authorities which, exploiting econo-mies of scale, would offer very specialized courses on an optional basis.Specifically, the regional authorities might issue a "spring catalogue,"listing courses ordinary and exotic. Whenever a sufficient number ofstudents signed up to take a given course, they would be guaranteedit, let us say, at the most convenient place available. In this manner,those persons in their teens who have any strong measure of desire,intellectual or otherwise, to study some particular thing, be it harpsi-chord or design of computers or boat building, should be able to findinstruction, either in an academic or practical manner, as made sensein their particular case. The program would allow more specializationby subject and instruction of a deeper, more intensive sort as well.'
4 CONCIAMING NOTE
We have offered a definition of fiscal neutrality and we now seethat plans to provide fiscal neutrality may be different as the unitschool district, income class, household, or studentwhich is to beprotected is different!' However, plans to provide fiscal neutrality canin a certain sense be additive. That is, as we accept a progressivelysmaller unit of analysis, going, say, from school district finally to stu-dent. we move from property-based DPE to income-based DPE, com-bined with choice of enrollment across district lines and combinedfurther with regionalized provision of specialized educational services.
Two short additional comments must be made. Full state fundingis another approach to fiscal neutrality and it is an approach muchsimpler, in principle, than the one we have worked through here.The other comment is that we must recognize in concentrating oneducation that we are adopting a very partial approach to fiscal. neu-trality. True fiscal neutrality would deal simultaneously with all localpublic services.
FOOTNOTES
'Taxation is employed as an instrument of fiscal policy as well, though mainlyby central. not state or local. governments.
On the other hand. the effect of VXCiSes Olt liquor and tobacco products incurbing their consumption may be regarded as socially desirable.
:IA thorough discussion of lax criteria is given in Carl S. Shoup, Public Finance.Chicago, Aldine Publishing Company, 1969, Part 11.

Fiscal Neulralily
4Compalsion as well as 0114re has its place in social police. This article is aboutchoice. not compulsion. because the basic economic principle of neutrality implieschoice.
5F.X1111p104 of undue invasion of pri)acv might be the attempt by the Slate todetermine 11w mating process or 10 control the amount of reading materials. etc.that educationally-minded families give to their children.
dAt this point. the reader will see that the objective of fiscal neutrality possibl)may stand conflict with that of social class integration. The matter ()I trying toreconcile conflicting objecti)es is for separate study.
1This proposal is to be found in the Report of the New York State Commissionon quality. Cost, and Financing of Elementary and Secondary Education (Fleiscb-mann), 1912, 1'ohnne 1, Chapter 2.
sasome readers may feel that discussion of student choice goes beyond the defi-nition of anything "fiscal." However, the student is the one and only direct clientof educational programs. From his point of view, it makes little difference whetherhis opportunities are restricted by lite fact that he lives in a poor school district orby the fact that he lives in a school district too small to give him specialized serv-ices sunder any conceivable set of tax rates, Fiscal opportunities can relate to costsas well as to wealth.
C. .5

Cost Differentials and Cost Indices: TheAssessment of Variations in Educational
Program CostsRICHARD A. ROSSMILLER AND THOMAS H. MORAN
Department of Educational Administration, University of Wisconsin, Madison.
Educators and laymen alike have long recognized that not all edu-cational programs are equally costly. From the time of Ellwood P.Cubberley's first school finance studiesi at the turn of the century tothe present time, some school districts have spent substantially moremoney than other districts to educate the same number of students.The development of specialized educational programs to meet moreadequately the needs of particular types of students has also served tocall attention to the fact that some students require relative' moreexpensive programs to approach equality of educational oppor nity.Until the recent efforts of the National Educational Finance Prnjerthowever, very little has been known with regard to the magnitudeand nature of the cost of providing educational programs tailoredto meet the needs of specific types of studentsstudents who deviatefrom the average or normal child in mental, physical, or social char-acteristics to such an extent that they require a modification of schoolpractices, or special educational services, in order to develop to theirmaximum capacity.2
As the concept of equality of educational opportunity has been expanded to require that every child be educated to the limits of hisabilities, the development of special education programs has keptpace. Early programs for the deaf, the blind, the hard of hearing andthe partially-sighted were developed in private schools many yearsago. Recently, the programs have been supplemented in the public
63
C

64 School Finance in Transition
schools of the various states by extensivclitirogam offerings for theeducable and trainable mentally retarded, the orthopedically handi-capped, the socially and emotionally maladjusted, the intellectuallygifted, the speech handicapped, and for students with various types oflearning disabilities. And as these special educational prowamsevolved and became defined according to the differing categories ofexceptional children receiving spedal educational services, changesin the methods of delivering educational services also evolved so thattoday a broad array of educational delivery systems are used to pro-vide educational services to students with similar exceptionalities.Whereas traditionally the characteristics of the students were theprimary criteria for defining a special educational program, increas-ingly, the characteristics of the delivery system used to provide thatprogram are being recognized as representing ,.mother crucial dimen-sion in defining special educational programs.
If it is to be meaningful for financial planning purposes, any at-tempt to assess variations in educational program cost must considernot only the different types of exceptional children for whom pro.grants are provided, but must also consider variations in the educa-tional services provided to those children. Furthermore, if the assess-ment of variations in educational program cost is to be of much useto those who make programmatic decisions, it must be related to evi-dence concerning the effectiveness of the differing program alterna-tives.
Typically, school funds have been accounted for on a district-widerather than on a school -by- school basis. Thus, if different deliverysystems are used in different schools in a given district to provide edu-cation for the same category of exceptional children, it is extremelydifficult to develop the data necessary to assess the variation in coststhat are attributable to the type of delivery system. Furthermore, onlya small percentage of school districts maintain expenditure accountswhich enable one to determine the cost of educational programs fora particular category of students defined in terms of either grade levelor type of exceptionality. Hance, at the present time it is exceedinglydifficult to evaluate the financial inputs to the various educationalprograms provided in American schools.
But if it is exceedingly difficult to evaluate the financial inputs,it is next to impossible to assess the program outputs which are nec-.essary for any cost-benefit analysis of special educational programs.Until such time. as school districts maintain financial, personnel andpupil records au a programmatic basis, the assessment of variationsin educational program costs will be an inexact and haphazard affair.And until such time as school districts develop meaningful measuresof program effectiveness, financial and program planning for educat-ing exceptional children will likewise be haphazard if not chaotic.
PROCEDURES FOR ASSESSING VARIATIONSIN EDUCATIONAL PROGRAM COSTS
The process of assessing the variations in costs associated with

Cost Differentials 65
different types of educational programs in a gken state consists ofidentifying the differentiated educational program structureinclud-ing the types of delivery systems for which cost differentials and costindices are desired, selecting a simple of school districts to be includedin the study, collecting the (1;11;1 necessary for computing the varia-tions in program costs, developing program cost configurations, andprojecting potential program populations. Although the specific de-tails of the process will vary from si ate to state depending upon theavailability and composition of the necessary data, and the programstructure and delivery systems selected for analysis, the following gen-eral description of the procedure provides ;, composite overview ofthe methods employed in several of the studies to date.
Identification of Differentiated Educational Program Structure
Identification of the differentiated educational program structureto be analyzed is the first step in the process and one with many hid-den pitfalls. The literature in the field of special education generallysupports a taxonomy of special education programs which 'includesprograms for the intellectually gifted and for the intellectually handi-capped: programs for the speech handicapped, visually handicappedand auditorily l'andicapped; programs for the orthopedically handl.capped, programs for students with learning disabilities, programs forthe emotionally disturbed and/or socially maladjusted, and in manycases programs for students with multiple handicaps. In addition,many of these categories are further subdivided. Thus, programs forthe intellectually handicapped are often identified as being directedto the educable mentally retarded and the trainable mentally re-tarded, and programs for the auditorily handicapped are identifiedas being directed to the hard of hearing or partially (leaf and the (leaf.Furthermore, these various programs arc provided at several levels ofthe educational system.
Preschool programs are often categorized as early childhood specialeducation programs and kindergarten programs and at the secondarylevel occupational education programs are often distinguished fromregular educational programs. Table 1 illustrates a typology of edu-cational programs which provides a high level of detail. The use ofsuch a typology will, if the needed data are available, result in a com-prehensive and detailed set of cost differentials and cost indices which_could be very useful in the financial planning of an educational sys-tem. But it should be noted that the data requirements posed by adetailed structure like that in Table I are very high indeed. In thefirst place, the adoption of a particular program structure has impli-cations for the sin of the sample of school districts to be included inthe study since each program must occur with sufficient incidence toenable meaningful conclusions to be drawn from the data. Secondly,the usefulness of a particular program structure must he evaluatedin terms of its consistency with the availability and composition ofthe data necessary to compute the cost differentials and indices. Athird consideration relates to the use to which the resultant data are

an School Finance in Transition
to be put. The level of detail necessary for projecting costs for statesupport programs may he very different from that needed to evaluatethe cost differentials between various program delivery systems. A finalconsideration is that the program structiu e which is adopted shouldbe sufficiently detailed to identify .he meaningful distinctions betweenprograms being offered in the ,t..t yet not so detailed as to createartificial distinctions which an: tut evidenced in the program deliverysystems.
TABLE.
TTPOLOGY OE EDUCATIONAL PROGRAM STRUM/RR
I. Preschool Programs
A. Early Child1,011.1 Special Education11. Kindergarten
II. Elementary Programs
A. Regular Program11. Programs for the Intellectually GiftedC. Programs for the Intellectually Handicapped
1. Programs for the Educable Mentally Retarded2. Programs for the Trainable Mentally Retarded
D. Programs for Students with Learning DisabilitiesE. Programs for the Emotionally Disturbed any! Socially MaladjustedF. Programs for the Speech HandicappedG. Programs for the Visually Handicapped
I. Programs for the Partially Sighted2. Programs for the Blind
H. Programs for the Auditorily Handicapped1. Programs for the Hard of Hearing2. Programs for the Deaf
I. Programs for the Orthopedically HandicappedJ. Programs for Students with Multiple Handicaps
Secondary Programs
A. Regular ProgramB. Programs for the Intellectually GiftedC. Programs for the Intellectually Handicapped
I. Programs for the Educable Mentally Retarded2. Programs for the Trainable Mentally Retarded
D. Programs for Students with Learning DisabilitiesE. Programs for the Emotionally Disturbed and Socially MaladjustedF. Programs for the Speech HandicappedG. Programs for the Visually Handicapped
I. Programs for the Partially Sighted2. Programs for the Blind
H. Programs for the Aottlitorily HandicappedI. Programs for the Hard of Hearing2. Programs for the Deaf
1. Programs for the Orthopedically HandicappedPrograms for Students with Multiple Handicaps
K. Occupational Education Programs
r
.

Cost Differentials 67
Identification of Differentiated Program Delivery SystemsThe second step in the process of as trig variations in educa
tional program costs is identification of the alternative delivery sys-tems which may be employed to provide the programs under consid-eration. Although this step is often not expo caly considered in prac-tice, the magnitude of the differentials in educational cost are inex-tricably linked to the type of delivery system used in providing thevarious educational programs. 'Table 2 presents a typology of deliverysystem, cfsr educational programs which includes delivery systemsbased upol regular classroom organization, special classroom organi-zation, special day schools, resid.mtial schools, and homebound or hos-pitalized ;nstructional systems. Delivery systems based upon regularclassroom organization are those in which the exceptional child is"mainstrezi.ned," i.e., spends all or a major portion of the school dayin a regular classroom. Variations on this theme include the regularclassroom itself where regular students receive instruction and nospecial educational services are provided for the exceptional child;regular classrooms with special consultants where the regular class-room teacher is provided with consultative support concerning theteaching of exceptional children in the classroom; regular classroomswith itinerant teachers where the exceptional children in the regularclassroom receive a portion of their instruction from an itinerant spe-cial teacher; and regular classrooms with a resource room where theexceptional child spends a portion of his or her day receiving instruc-tion from a special education teacher in a specially equipped resourceroom. The special classroom organizational pattern can be subdividedinto two typesthe full-time segregated special education classroomand the part-time classroom where the exceptional child spends themajor portion of his or her day in the special classroom but attends"specials" such as art and music with regular children.
The conclusion that an educational program directed toward chil-dren with special educational requirements varies in cost from theregular educational program provided at a given school is based upon
TAnt.r. 2
TvroLoGv OF EDUCATIONAL PROGRAM DFLIVERY Sis'rEMS
I. Regular Classroom OrganizationA. Regular Classroom
Regular Classroom with Special ConsultantC. Regular Classroom with Itinerant TeacherD. Regular Classroom with Resource Room
H. Special Classroom OrganizationA. Part-Time Special Education
Full.Tinte Special Education
III. Special Day School
IV. Residential School
V. Homebound or Hospitalized

68 School Finance in Transition
the assumption of differing delivery systems for the (filleting programs.Thus, by explicitly considering the types of delivery systems used inspecial education programs when designing a study. the meaningful-ness of the cost dillerClitialS atid cost indices obtaincd can be substan-tially enhanced. Instead of obtaining a composite cost differentialbased on a mix of delivery systems for a given special education pro-gram, discrete differentials for various delivery systems for a givenspecial education program can be obtainedthereby greatly expand-ing the utility of the study as a financial planning tool. Again it mustbe noted that the degree of detail adopted in the typology of deliverysystems imposes requirements on the data collection phase of the studywhich can be very high and, as with the educational program struc-ture, a balance based upon the particular needs of those who will uti-lize the results of the study should be sought. Ideally, an educationalprogram structure can be developed which reflects the discrete pro-gram delivery systems and which is not so detailed as to be unman-ageable.
Selection of School Districts
The third step in the process of assessing variations in educationalprogram costs is to select a representative sample of school districtswhich reflect those educational program attributes thac are consideredimportant. The size of the sample of school districts must be sufficientlylarge so as to include all of the educational programs and deliverysystems which have been included in the program structure with suf-ficient frequency to permit meaningful conclusions to be draw's. Thesample should be composed of school districts which provide kinder-garten and regular educational programs of acceptable quality forgrades 1.12 and likewise provide acceptable special educational offer-ings. The sample should also be structured so as to reflect the social,economic and demographic characteristics of the state and its geo-graphical diversity.
Assessment of Variations in Educational Program Costs
The fourth step in the assessment of variations in educational pro-gram costs is collection of the data and computation of the cost differ-entials mid cost indices. The first item of data which must he collectedfor the study is the full-time equivalent student enrollment in eacheducational program in each school district by grade level. Averagedaily membership is preferable to average daily attendance in devel-oping hill-time equivalent enrollment data since the planning of edu-cational programs should generally. be based upon the number of chil-dren enrolled in the schools, not upon the exigencies of attendancepatterns. Students in part-time programs such as a halfday kinder-garten class must be converted to full-time equivalencies for compu-tational purposes.
The second Rom of data which must be collected for the study isthe current expenditure for each educational program in each school
oft

Cost Di Iferentiuts 69
district by grade level. Since most school districts do not maintain ac-counting records based On educational program structures, this stepusually requires that current expenditures be allocated to programsand grade levels within the school district. Various rules can he usedto allocate different categories of expenditures to program and gradelevel depending upon the availability of supporting data and theaccuracy desired in the final results. For instance, if records show%silk!' students are transported and the distance each student is trans-ported, transportation costs can be allocated accurately to iifogramsby calculating the transportation mileage for students in a particulareducational program as a percentage of the total transportation mile-age for all students in the school district. Many categories of expen-diture may he assumed to apply equally to each student regardles, ofthe educational program they are receiving, unless evidence to thecontrary is provided. Instructional costs represent the largest singlecategory of expenditure which influence cost differentials and cost in-dices and the allocation of instructional costs is a primary determinantof the final results. The number of full-time equivalent teachers ina special elication program as a perceotage of the total number offull-time equivalent teaching stall is one method which has been usedto allocate instructional costs among programs. If this is done, it mustbe remembered that the type of delivery system employed will affectthe full-time equivalency of the teaching staff in a particular program.For instance, in the situation where a program for the educable men-tally retarded is delivered through the use of a regular classroom withan itinerant teacher, the full-time equivalent teaching stall serving theeducable mentally retarded includes not only the itinerant teacher,but also that portion of the regular teacher which represents the per-centage of students in the regular classroom who are educably men-tally retarded. Thus, for a teacher with a class of twenty-five students,of which five are ENIR's, 20 percent of the regular teacher's time wouldhe allocated to the special program for educable mentally retarded
-students and 80 percent of the teacher's time would be allocated tothe regular program.
After current expenditures have been allocated to programs andgrade levels, the cost per student by program within grade level is cal-culated by dividing the total program cost by the number of full-time equivalent students in the program. The difference between theregular program cost per student and the special program cost perstudent represents the cost differential for the special program. Thecost index is computed by dividing the special program cost per stu-dent by the regular program cost per student. Table 3 illustrates thevariations in educational program costs for educable mentally retardedelementary school students and regular students in six school dis-tricts. District C has the highest special program cost per student of$1,152 and also the largest cost differential of S528. The resulting costindex is 1.85. District B has the lowest special program cost per stu-dent hut, since it also has the lowest regular program cost per student,its cost differential and cost index arc higher than District A's. Notethat District A and District 1) have special program costs which are
fro/

70 School Finance in Transition
almost identical but, because of the great difference in their regularprogram costs, the cost differential and cost index of District A arethe lowest of the six districts whereas District 1) has a cost index higherthan any other district with the exception of District C. The meanspecial program cost per student is $957 and the mean regular programcost per student is $570. The mean cost differential is $386 and themean cost index is 1.69 for the six school districts.
TABLE 3
VARIATIONS IN EnticATIoNAL PROGRAM CowsCost PER FULI..11SIE EQUIVALENT ELEMENI'ARY unENT IN SPF.ciAL EDUcAON
PRoLRASIs FOR THE EDUCABLE MENTALLY RETARDED
District
SpecialProgram Cost
Per PupilProgram Cost
Per PupilCost
DifferentialCost
Index
$ 851 $600 $251 1.42795 460 335 1.73
1.152 624 528 1.85847 476. 371 1.78999 572 427 1.75
F 1.096 690 406 1.59
HighLow 11 li A A
Mean 957 570 386 1.69
Assessment of Program Cost Configurations
Examination of the differences in cost configurations of specialeducational programs is the next step in the process of assessing varia-tions in educational program costs. By comparing the regular andspecial program cost per pupil by category of expenditure for thelowest, the mean, and the highest cost school districts, the sources ofcost variations can be analyzed.
Table 4 presents the program cost configuration for elementaryspecial educational programs for the educable mentally retarded forthe districts whose cost differentials and cost indices were described inTable 3. The cost indices shown in Table 4 are based upon theregular program cost for each particular category of expenditure inthe school district under consideration. The highest cost school dis-trict spent considerably more for administration of its EMR programthan for its regular program-3.44 times as much in factyet it spentless on the administration of its EMR program than did the lowestcost district$36 as opposed to $40. The highest cost district spent$781 per pupil for teachers' salaries for its EMR staff, which is 2.71times the cost per pupil for its regular staff. The lowest cost districtspent only $320 per ENIR pupil lot teachers' salaries, which is 1.53

times the cost per regular pupil for teaching staff salaries. The cost
in the lowest cost district the cost was $5.1, or 1.50 times the regular
per EMR pupil for operation and maintenance of plant was $107 inthe highest cost district, or 3.13 times the cost for its regular program;
per pupil cost. The highest cost district appears to have concentrateda large portion of its costs in teachers' salaries and operation and main-tenance of plant; the cost indices indicate these to be the areas where
cost district, therefore, evidently uses a delivery system for its ENIRthe EMR.program differs most from the regular program. The highest
program which is characterized by a low teacher/pupil ratio and thushas relatively few pupils in a given classroom compared with the regu-lar
system not radically different from that used in the regularclassroom-possibly a regular classroom with a special consultant.
Instruction
Management
Instructional Support
Services
Transportation
Excpaetnegdoit41.r:
Total -Current
Operations
Current Operation 1,15182
AdministrationClerical & Secretarial
TeachersTeacher Aides
Guidance & CounselingSupplies & Equipment 8168 28..411'61
Other
OtherOperation
&
Fringe Benefits
FoodHealth
Maintenance
BY FUNCMON FOR ELEMENTARVPROGRAM Cost Cos
781 2.71
Pupil index
FOR THE EDUCABLE MENTALLI
C04/ Cost Cast%Cost
107 3.13
13 1.00
41 18.18
27 1.00
53 1.0024 12.00
15 1.32
10 9.00
9 1.80
Highest
Cost Differentials
TABLE 4
School District
6 'A:
FICURATI,.
$ 31 1.30
Pupil index
598 1.25
957
141 2.9431) 1.7349 1,00
18 1.00
17 1.67
19 1.46
15 1.09
14 1.00
11 11.00
9 1.00
5 1.00
Mean
olitr).DUCATION
$ 40 1.60
Pupil IndexCost/ Cost
320 1.53
795
164 1.00
34 1.36
20 1.11
59 9.28
54 1.5045 1.46
30 1.00
12 ''.00
7 1.21
8 3.58
2 1.00
Lowest

72 School Finance in Transition
Projection of Potential Target Populations
The final step in the study of variations in educational programcosts consists of projecting the potential target populations by area ofexceptionality thereby enabling future cost projections to be made.If the cost study is to be used for developing cost estimates for statesupport programs for special education, the projection of potentialtarget populations, taking into consideration the increasing emphasison early identification and treatment of exceptional children, will pro-vide the data necessary for assessing future revenue requirements.
COST DIFFERENTIALS AND COST INDICES FORSPECIAL EDUCATIONAL PROGRAMS
Cost differentials and cost indices for special education programswere compiled in the pioneering effort of the National EducationalFinance Project and in several more recent studies undertaken byvarious states. Because of the difficulties inherent in obtaining ex-penditure data organized by educational program and type of deliv-ery system, in the more recent efforts in the states it has generally beennecessary to resort to procedures for allocating expenditures whichare not comparable to those used in the national project. The Na-tional Educational Finance Project research found that all componentsof expenditure contributed to the cost differentials in programs forexceptional children with the exception of clerical and secretarial serv-ices and expenditures for food services. The generally less detailedsystems for allocating expenditures in the state studies probably understate the true cost differentials and cost indices. For instance, inthe state studies the allocation of expenditures for the operation andmaintenance of plant is often made on the basis of the total studentpopulation assuming all students occupy au equal amount of space,whereas the NEFP research allocated operation and maintenance ofplant on the basis of actual allocations of space to special educationalprograms.
The National Educational Finance Project's stud) of cost differ-entials in .educational programs for exceptional children utilized anational sample of districts selected as being exemplary in their pro -gramming and which probably represented districts with among thehighest per pupil expenditures for special educational programs inthe state. Thus, the difference in samples also serves to undermine thecomparability of the state and national studies.
The National Educational Finance Project used a composite regu-lar program cost which included both the elementary and secondarylevels as the base for determining cost differentials and cost indices.Several of the state studies have related elementary special educationprogram costs to elementary regular program cost and secondary spe-cial education program costs to secondary regular program cost. Stillother state studies have related special education program costs re.gardless of level to the elementary regular program cost. Furthermore,the educational levels used were generally not comparable. In one

Cost Differentials 73
state study the elementary grades were defined as K-6 while anotherdefined them as 1.8 and a third as 1-6. The secondary level was vari-ously defined as 7-12, 912 and as 1012 in a state where a middle levelof 7-9 was included.
Another area of incomparability in the various studies conductedto date concerns the definitions of special educational progams andthe exceptionalities included. The studies also examined differentschool years 'and reflect differences in the cost of hiring associated withthe different geographical areas they represent and the different yearsin which they were conducted. Keeping in mind these differences, someof the findings of these studies are summarized in Table 5.
Regular Educational Program
The National Educational Finance Project study computed theregular educational program cost to include both the elementary andsecondary grade levels. The mean regular program cost per pupilwas $692 and the cost ranged from a low of $468 per pupil to a highof $1,193 per pupil. The state studies generally have found regularprogram costs slightly lower than those found in the NEFP study.
Programs for the Intellectually Gifted
The NEFP found a mean cost index of 1.13 for programs for theintellectually gifted while the only state study which included pro-grams for gifted pupils found a mean cost index of 1.88 for elementarygifted programs and 1.49 for secondary gifted programs.
Programs for the Educable Mentally Retarded
A mean cost index of 1.92 was found in the national study witha low index of 1.14 and a high index of 3.21 for educable mentallyretarded programs. The state studies reported mean indices of 1.48for elementary (K-6) and 1.68 for elementary (1.8) educable mentallyretarded programs while the secondary' indices were 1.35 and 1.49,respectively.
Programs for the Trainable Mentally Retarded
The NEFP reported cost indices ranging from a low of 1.18 to ahigh of 3.62 and a mean of 2.20 for trainable mentally retarded pro-grams whereas the state studies reported indices of 1.66 for elemen-tary (K-6), 1.73 for elementary (1.8), 1.24 for secondary (7-12), and1.48 for secondary (9-12).
Programs for Students with Learning Disabilities
Programs for students with learning disabilities were reported tohave cost indices of 2.31 for elementary (K-6), 1.52 for elementary(1.8), and 2.25 for secondary (7.12) by the suite studies. (The econd

Tat
um 5
CO
ST I
ND
ICE
S FO
R S
PEC
IAL
ED
UC
AT
ION
PR
OG
RA
MS
AN
EFP
DPr
esch
ool P
rogr
ams
Ear
ly C
hild
hood
Kin
derg
arte
n
1.05
1.05
Ele
men
tary
Pro
gram
s1.
71(K
-6)
1.76
(1-8
)-
2.21
(1-6
)
Gif
ted
1.88
1.13
Edu
cabl
e M
enta
lly R
etar
ded
1.48
1.68
1.92
Tra
inab
le M
enta
lly R
etar
ded
1.66
1.73
2.20
Lea
rnin
g D
isab
ilitie
s2.
3113
22.
50
Soci
ally
& E
mot
iona
lly M
alad
just
ed1.
971.
603.
70
Spee
ch H
andi
capp
ed1.
621.
251.
36
Blin
d1.
833.
48
Dea
f1.
653.
15
Part
ially
Sig
hted
1.83
1.79
3.48
Har
d of
Hea
ring
3.03
1.62
3.15
Ort
hope
dica
lly H
andi
capp
ed1.
751.
543.
26
Mul
tiple
Han
dica
pped
....
1.65
2.80
Seco
ndar
y Pr
ogra
ms
1.5
(742
)1.
80(9
-12)
2.30
(7-9
)2.
71(1
042)
1.88
Gif
ted
-11.
491.
13
Edu
cabl
e M
enta
lly R
etar
ded
1.35
1.49
1.92
Tra
inab
le M
enta
lly R
etar
ded
124
1.48
2.20
Lea
rnin
g D
isab
ilitie
s22
52.
50
Soci
ally
& E
mot
iona
lly M
alad
just
edSp
eech
Han
dica
pped
1.96
1.-i
-51.
913.
7012
513
21
5 7
Blin
d2.
483.
48
Part
ially
Sig
hted
2.48
1.17
03.
48
Dea
f_
.12
23.
15
Har
d of
Hea
ring
3.05
1.25
3.15
Ort
hope
dica
lly H
andi
capp
ed1.
33_.
.-3.
26
Mul
tiple
Han
dica
pped
1.65
2.80
Occ
upat
iona
l Pro
gram
s1.
601.
i5-
,E
lem
enta
ry &
sec
onda
ry le
vels
wer
e no
t dis
tingu
ishe
dan
d th
e ba
se c
ost w
as 1
-12
incl
usiv
e.-*
*Ele
men
tary
, mid
dle,
& s
econ
dary
leve
ls w
ere
dist
ingu
ishe
dan
d th
e ba
se c
ost w
as th
e el
emen
tary
leve
l.E
lem
enta
ry &
sec
onda
ry le
vels
wer
e no
t dis
tingu
ishe
dan
d th
e ba
se c
ost w
as th
e el
emen
tary
leve
l.

Cost Differentials 75
ary [9.12] differential was not included in any study.) The cost indi-ces found by the NEFP were 2.50 for the mean, 1.40 for the low and5.20 for the high.
Programs for the Socially and Emotionally Maladjusted
The NEFP study reported cost indices ranging from a low of 1.58to a high of 11.64 and with a mean of 3.70 for programs for emotion-ally disturbed students. The state studies found indices of 1.97 forelementary (K-6), 1.60 for elementary (1.8), 1.96 for secondary (7-12)and 1.35 for secondary (9.12) for socially and emotionally maladjustedstudents.
Programs for the Speech Handicapped
Cost indices for speech programs of 1.62 for elementary (1.8) and1.91 for secondary (9.12) were reported by one state, while anotherstate reported indices of 1.36 for elementary (1.6), 1.52 for middle(7.9) and 1.57 for secondary (10.12) using the regular elementary pro-gram as the base for all three indices. The National Educational Fi-nance Project found indices of 1.09 for the low 2.12 for the high and1.25 for the mean.
Programs for the Visually Handicapped
Visually handicapped programs had cost indices of 1.83 and 1.79for elementary (K-6) and (7.12), respectively, and 2.48 and 1.70 forthe comparable secondary programs in the state studies while a meancost index of 3.48, a high index of 11.45 and a low index of 1.05 werefound in the National Educational Finance Project study.
Programs for the Auditorily Handicapped
The national study found cost indices of 8.15 for the mean, 1.05for the low and 5.88 for the high in programs for the auditorily han-dicapped. One state study found a mean cost index of 3.03 for ele-mentary (K-6) hard of hearing programs and 3.05 for secondary (7.12)hard of hearing programs. A second state study found cost indices of1.65 for deaf and 1.62 for had of hearing programs at the elementary(1.8) level and 1.22 for deaf and 1.25 for hard of hearing at the sec-ondary (9.12) level.
Programs for the Orthopedically Handicapped
The national project found the mean cost index for orthopedicallyhandicapped programs to be 3.26 with a range from a low of 1.52 toa high of 4.64. The state studies found indices of 1.75 for elementary(K-6), 1.54 for elementary (1.8) and 1.33 for secondary (7.12). Thestate studies did not include an orthopedically handicapped programat the secondary (9.12) level,
1.1"c)I.J

76 School Finance in Transition
Programs for the Multiple Handicapped
The NEFP found a mean cost index of 2.80 for multiple handi-capped programs with a low index of 1.90 and a high index of 186,Only one state study included multiple handicapped programs andthat was only at the elementary level where a cost index of 1.65 wasfound.
Special Educational Programs.
Several state studies calculated cost indices for special educationalprograms generally without distinguishing the indices for each of theprograms included. One state found cost indices of 1.71 for elementary(K-6) and 1.51 for secondary (7-12). Another stare found indices of1.76 for elementary (1-8) and l.80 for secondary (9-12). A third statefound elementary (1-6) special educational programs to have a meancost index of 2.21, middle (7-9) special educational programs to havea mean cost index of 2.30 and secondary (10-12) special educationalprograms to have a mean cost index of 2.71 using the regular elemen-tary program as the base for all three indices. A fourth state studyfound an index of 1,88 for all special educational programs using thecost of the regular elementary program as the base.
Occupational Educational Programs
Cost indices of 1.60 for secondary (7-12) and 1.55 for secondary(9-12) were found in two state studies. The NEFP did not include costindices for occupational programs. A third state study found a costindex of 1.60 based on the cost of the 'regular elementary program.
THE APPLICATION OF COST INDICES
Considerable misunderstanding exists with regard to the applica-tion of cost indices in planning for the financing of educational pro-gras. Cost indices are most appropriately used for state-wide planningpurposes. The availabality of accurate cost indices for the state as awhole should permit more accurate estimates of the amount of reve-nue needed to provide adequately for the special educational needsof all pupils. It must be emphasized, however, that an average is justthat. Aperoximately one-half of the school districts in the state willbe spending more than the state-wide average and the remaining one-half will he spending less. It is clear that using the average cost indexfor all educational programs, state-wide, as a basis for allocating fundsto individual districts will not necessarily provide adequately for thespecific educational needs of pupils in those districts. Even using theaverage cost index for a particular educational program state-wide asa basis for allocating funds confronts the same problem.
A second limitation of cost indices lies in the fact that they reflectcurrent educational practice. The cost indices developed in most stud-ies in no way reflect the efficacy or efficiency of the educational pro-

Cost Differentials 77
grams upon which the cost indices are based. Thus, cost indices typi-cally reflect what is currently being clone rather than what could beor what should be done in the way of educational programming.
A third limitation is closely related to the second. Cost indicesshow the relative cost of educating pupils in special programs com-pared with the cost of educating pupils in regular programs. Theyprovide no information as to how wisely and how efficiently fundsare being expended for either regular or special educational programs.A particular special education program may be offered to equal num-bers of students, provide the same educational services and cost thesame amount per pupil in two school districts where the regular orbase educational programs differ in efficiency and effectiveness. As aresult, the cost indices for the special educational program may vary'widely. This points to the need for a well developed, carefully moni-'tored evaluation of all educational programs based upon the desiredoutcomes if cost indices are to be interpreted properly.
Finally, it should be noted that for a variety of reasons, costs willdiffer between districts for identical programs. For example, in somedistricts, the cost of transporting pupils involved in special programswill be much greater than in other districts. A very important factorin determining the relative cost of educational programs is the pupil/teacher ratio. Some districts will have too few pupils to operate aprogram at maximum efficiency, but pupils who live in such districtscertainly should not be denied access to the educational programsthey need simply because there arc not enough of them to operate aclass at maximum efficiency. Differences in salaries and in the cost ofeducational supplies and materials will be found between districtsand these differences also will be reflected in the educational programcosts.
While educational cost indices and cost differentials provide avaluable planning tool, we wish to point out their limitations and toemphasize the importance of securing the most detailed informationconcerning program inputs and their relationship to program effec-tiveness and efficiency in order that planning decisions will be basedon a full appreciation of the implications of the supporting evidence.
FOOTNOTES
lEllwood P. Cubberley, School Funds and Their Apportionment, (New York:Teachers College, Columbia University, 1905).
2This definition of the exceptional child is a paraphrase of that of Samuel A.Kirk. See Samuel A. Kirk. Educating Exceptional Children (Iloston: Houghton.Mifflin. 1962), pp. 4.5. Although the definition includes children who suffer en-vironmentally-related disadvantages, compensatory programs for the socially, eco-nomically, and /or culturally disadvantaged are generally excluded from the costdifferential studies discussed in this paper.
E 0

Educational Personnel:Supply and Demand
The Teacher Case Under Oligopoly
JAMES A. HALE
Assistant Professor of Educational Administration, University of New Mexico.
In the past few years I have had the opportunity to again considersome of my undergraduate training in economics. Not so much inthe classical, neo-classical and Keynesian sense (or non-sense) of thoseearlier days, but more the writings of Becker,' Schultz,3 Hansen,3Weisbrod,4 Bowman' and others relating to both the qualitative andquantitative aspects of investment in human capital (education). And,I might add, I find those notions most attractive primarily becausethey deal with people, and people developmentwhich is a significantconceptual leap from the classical concept that the marginal produc-tivity of labor equals one. However, the purpose here today is neitherto explore Balogh and Streeten's treatment of the Cobb-Douglas pro-duction functions and their accounting for the unaccounted factorsrelating it to the Gross National Product, nor to assess Bowles' linearprogramming model for the educational sector.' I do feel that theArrow-Capron model explaining the market dynamics of the scientist-engineer shortages of another decade does have some relevance to ourpurpose of exploring the supply-demand relationships for educationalpersonnel, as to sonic of the more esoteric neo-classical notions ofyesterday.
First, I shall briefly describe the Arrow-Capron model and providea limited critique of its constructs as they may or may not apply toour purpose. Second, I would like to explore other framework forassessing the supply-demand relationships for educational personnel
79
1

80 Schaal Finance in Transition
which may prove fruitful to our understanding of the dynamics ofthose relationships. And finally, I would like to suggest several topicsfor our consideration relative to what the future might hold for bothour professional hiring practices within school districts and ourteacher-training practices at colleges and universities.
Now, with that introduction and my having displayed my erudi-tion with the contemporary literature on the economics of education,and concomitantly punching again my cademic union card, let meauspicate the presentation by suggesting that we view what followsas a series of puzzles. And further, that we focus our thinking upona few attempts to piece together a somewhat clearer picture of a por-tion of that reality which projects the conditions of supply and de-mand for public school teachers.
A time-honored technique employed by men to relate to eachother either abstract or quasi-abstract notions has been to argue fromanalogy (in literature class we called it a metaphor and in Sundayschool class we called it a parable). Those who select to employ thistechnique take care in developing the analogy such that little or noth-ing is lost in the translation from analogy to reality. With that cau-tion in mind then, let us proceed to review the Arrow-Capron modelfor purposes of analogy.
THE ENGINEER-SCIENTIST SUPPLY & DEMAND PUZZLE
First, let us tstablish the conditions which precipitated the Arrow-Capron analysis. Based upon data from the Blank and Stigler studyof The Supply and Demand of Scientific Personnel" and the Beste"case study of the chemical industry, Arrow and Capron sought to ex-plain the dynamics of the supply-demand relationship and the asso-ciated "shortage" of the trained engineer-scientist population in theUnited States during the 1950's.
Drawing primarily from Marsha llian analysis of the equilibratingprocess, the model builders first assumed stability of the market mech-anism and postulated that (in the classical sense) the shortage ob-served during the equilibrating process is transitory and tends to dis-appear as the price approaches equilibrium. That is to say, as in Fig-ure 1, if p, represents the average salary of the scientist-engineer pro-fession then q, is the number of trained individuals who will beavailable for employment. However, the market demands q2 numberof individuals at price p, and therefore the industry is experiencinga shortage of trained individuals in the amount of q, minus q1. Theobvious short-un equilibrium average salary is P and the price differ-ential of P p, is the causative factor of the shortage and marketforces then operate to pressure' average salary p, toward P. However,they hasten to add that if the demand curve is steadily shifting upwardat the same time that a shortage in supply exists, then the short supplywill persist and the price will continue to rise.
The latter condition is presented in Figure 2 where D, representsthe original demand curve for engineers and D2 re ,resorts the newdemand arising from changes in external conditions. The equilibrium
fibL., Aar

pRKE
Educational Personnel
is iiQUANTITY
Figure ISupply and Penland for ScientistsEngineers (ArrowCapion)
position attained through market forces in Figuee 1 is now a positionof short supply in Figure 2. Arrow and Capron suggest that this condition will also be accommodated through market forces as salaries arcadjusted to attract more individuals to enter the field. And, they seem
PRICE
pa
Issiner mr,QUANTITY
Figure 2Increase in Demand for ScientistsEngineem (ArrowCapron)
E3

.v2 School Finance in Transition
to be aware of the training time-lag constraining that adjustment asthey proceet' to model the dynamic shortages and price rises as func-tions of the e.-1,ticities of supply and demand.
I shall not prevail upon you patience by reviewing the calculusof the Arrow. apron model but they are essentially computing themagnitude of the dynamic shortage as functions of:
(1) the Tate (s1 ittcveast in demand,(2) the reaction speed of the market, and(3) the elasticity or supply and demand.
Finally, their argument is that the interaction of rising demand withprice movements, tvhich do not instantaneously equate supply anddemand, provides a plausible interpretation of the scientist-engineershortage of the 1950's.
CRITIQUE: VIS-A-VIS THE EDUCATION PUZZLE
I find the ArrowCapron model most attractive for its simplicity..1tid, if they were to look at more contemporary dad I wonder if themodel would accommodate the oversupply of engineers in the spaceindustry resulting from N.A.S.A. program cutbacks and the cancella-tion of the S.S.T. Certainly they could test the contrary case but Isuspect demand elasticity would not highly correlate to price.
I do feel that the model may have some application to the supply-demand relation ,ps experienced within the education industry.howeve, 1 do no: feel that we can accept the model as it exists be-cause of the competitive market assumption upon which the modelis based. If we consider inter-school district competition for teachersthen we may give more weight to the pricing function. But, if we areconsidering the whole industry, as the model does, then I feel wehave to look for another model since we cannot meet the assumptionthat industry prices (salaries) are a function of the competitive mar-ket. The education industry simply has too many individuals provid-ing second or supplementary. family incomes on a job that followstheir children's school calendar; and for those reasons alone we can-not assume individual job choice to be a function of price.
And too, as Arrow and !:apron point out, the price-mechanismcannot be expected to function if indeed there is external interferencewith the mechanism, i.e., if prices are controlled. I would suggest thatin the education industry that is exactly what happens and thus accen-tuates my concern for a different set of assumptions to precede supply-demand analysis.
THE EDUCATION INDUSTRY PUZZLE
It is a common practice among those who piece together picturepuules to first assemble the edge pieces, and beginning with the fourcorners to complete the perimeter and then attempt to fill-in the cen-ter through color and pattern discriminations. I too began this puule

1
Educational Personnel 83
of supply-demand relationships by looking for edge-pieces, i.e., whateconometric model or framework might I use to overlay the data. Themost obvious solution seemed to be the Arrow-Capron model so
. proceeded to determhie what data 1 might use to explicate the modelfor our purposes. However, alter assembling numerous NEA ResearchBulletins and other data-laden publications, 1 reviewed the Arrow-Capron model onl) to discover the weakness of their assumptions forour purposes as outfitted Id love. Therefore, 1 out to employ theGestalt approach to punle building, i.e., look t. r whole relationshipsamong the pieces. (1 think that process is what my intermediate sta-tistics professor once called the "bi-optic trauma analysis"the datahits one between the eyes.)
NUM
Figure 3'reacher Education Graduates as a Percent of New Teachers Employed
in Selected StatesSource: Teacher Supply and Demand in Public Schools, 1972,
NEA Research Report 1972.118.
One of the more direct approaches to assessing market conditions.for a product is to determine how well the product is movingthatis in our case, to what extent are college graduates holding teachingcertificates gainfully employed within the education industry. rgurerepresents the data from a 1972 NEA study on "Teacher Supply andDemand in Public Schools." By establishing demand as 100% deter-mined need (as reported by school districts) and then plotting theteacher education graduates as a percent of new teachers employedone is immediately confronted by two facts. First, there has neverbeen a shortage of secondary teachers for the years reported. Thatfact is readily mediated when one remembers that the graphs repre-sent aggregated data. A closer inspection of the data reveals that we
"3'

84 School Finance in Transition
have consistently over produced secondary teachers of agriculture, art.biology, physical education, and social studies, among others, whilea short supply is evidenced for some years in the areas of chemistry,mathematics, library science and a few others. Currently our deficientsupply seems to be in the areas of mathematics and special educationalthough not critically so.
The second obvious fact illustrated by the graph is that about 1970the elementary teacher supply-demand relationship was equilibrated.Again, this does not mean some districts were not experiencing un-filled positions, but that industry-wide the supply was and continuesto be sufficient to fulfill demand. This relationship is further demon-strated in Figure 4 which depicts the long-run supply and demand forelementary teachers. Note that until 1970 the demand curve was up-ward sloping and almost paralleled the supply curve. However, weare not relating supply and demand to price at this juncture so onemust be careful not to read more into Figure 4. than it represents.
11104110,Tii4011. %( MN)
1200
1150
1100
1050
1000 '
950
900
850
800
750
S.
oe
56 60 64 66 71
Malt
Figure 4Imprint Supply and nentand far Elementary Teachers
Now one may expect that even the NEA would. report an over-supply of teachers when confronted with their own data. Not so, theyproceed to rationalize what they call the Quality Criterion and duti-fully calculate a dubious statistic demonstrating not an oversupply,but a demand for almost one-million more teachers. Let me hasten toadd that I find no quarrel with their reducing the pupil-teacher ratiofrom 34:1 to 24:1 at the elementary level and a similar reduction forthe secondary level. I'm not sure how that relates to quality but I canagree that it would increase the demand for teachers.
.C14.,

Educational Personnel 85
THE INDIFFERENCE CURVE PUZZLE
Although 1 have no evidence of wide-spread practices of a pupil-teacher ratio of 34:1, 1 feel that musing the merits of pupil-teacherratios is beyond the scope of this discussion. We must however, notethat the pupil-teacherratio is one of the trade-offs local school boardsmake, among others, when faced with increased demands for teachersalaries. 1 do think that fruitful research could be done to determinetbe extent to which teacher positions arc traded, both individually andsimultaneously, against pupil-teacher ratios and so called paraprofes-sionals. I would further suggest the indifference map model may bean appropriate framework for that analysis. Although I had hopedto provide some data relative to that important dimension of ourtopic, time prohibited my inquiry.
Essentially. the model is a set of indifference curves that, takenover time, allows one to determine the substitution propensities asso-ciated with various decisions to employ public school teachers. I wouldfurther suggest that for a primer on this subject one consult ON:, ap-pendices of Benson's earlier edition" and advance to Allen" for thecomputational aspects. Because 1 have not prepared data for yourconsideration relative to indifference mapping 1 shall not explore itsstructural aspects further but turn to another puzzle for your comic!.eration.
THE OLIGOPOLY-OLIGOPSONY PUZZLE
Leftwich" has clearly articulated three classifications of oligopolis-tic industries. Those classifications include:
Class 1: Organized, collusive oligopoly,Class II: Unorganized, collusive oligopoly, andClass III: Unorganized, noncollusive oligopoly.
I shall not review the underlying assumptions of each class butwill proceed by suggesting that the assumptions of Class Ill seem tocorrelate highly to the modus operandi of the educational industryand its firms, the local private and public school districts.
Oligopoly describes those market situations in which there are fewenough sellers of a particular product, such that the activities of oneseller are of sufficient importance to other sellers. Although it maynot have been true in the past century, I think we have sufficient evi-dence to suggest that public elementary and secondary education dom-inates the field today.
The assumptions of the Class III oligopoly are:
(I) The industry is unorganized and noncollusive. That sim-ply means there are no formal cartel-like arrangements asone would expect in (:lass I. This designation does notdeny the National or State School Boards Associations be-cause they do not transfer management decisions and func-tions of their individual districts tollie-scentral association.

J
86 School Finance in Transition
Although I ani paralleling the public sector to the privatesector, 1 see no 'reason for toot developing a Class 1V whichwould accommodate professional associations and thus be-come an organized, gioncollusive class of oligopoly.
(2) Independent action of hiclividual firms (school districts)is characteristic. 1 think we have sufficient evidence of pro-gram and policy differentiation between.school districts toaccept this assumptionwithout explication.
Given the above definition and assumptions, I would further sug-gest that the education industry is that special case of Class III oli-gopoly characterized by price, rigidity. Therefore, the industry mustmeet the following assumptions:14
(1) The industry is a mature one, either with or withoutproduct differentiation.
(2) If one firm lowers price others will follow. Although I donot see school districts cutting the total operational fundsso much, I do see them following each other relative to spe-cific economy moves, e.g., closing their doors for part of thescl'ool year, eliminating selected programs, etc. And, wehave some evidence of taxpayer revolt when we considerthe number of bond and millage elections lost over the past6 or 7 years.
(3) If one firm raises prices, other firms will not follow. Al-though Mort and his students significantly stimulated ex-penditures for education within school districts, today Ithink we exeerienfe less acceptance of the assumed cost-quality relationship. And, school boards are increasinglypressured to restrain product cost as evidenced by the ac-countability debates and the capital outlay example above.
Technically speaking, public school (Usti icts do not compete witheach other for product production (students) and therefore the lattertwo assumptions may only be applicable to private ed!cation.
Let us proceed now with the demand for resources within anoligopolist,c industry. Oligopsony is a resource market situation inwhich there are only a few buyers of a particular resource which mayor may not be differentiated. That is, trained teachers may .teach ineither the private or public sector of the education industry. Themarket is further characterized by having one buyer taking such alarge portion of the total supply of the resource so that it is able toinfluence the market price of the resource.
Figure 5 illustrates the supply-demand relationships of the Class Illoligopolistic industry. The significant difference between this rein-tionship and the competitive market. relationship is the "kinked"demand curve. The "kinked" demand curve is an analyt*.al way ofinterpreting the Class III oligopoly assumptions. For example, if schooldistricts are faced with a higher per teacher cost they are likely tooffer fewer new contracts than they would prefer. And thus they may

4conPI TWA%
P
Educational Personnel 87
Figure 5Supply Demand Relationship for Public School Teachers
re-align the districts programming by not initiating new programs.closing marginal programs, increasing pupil-teacher ratios, and othersuch strategies.
The "kinked" demand curve further illustrates that if cost perteacher unit is less than P, then the district may expand its profes-sional teaching staff by initiating new programs, providing more sup-plemental services, lowering pupil-teacher ratios, and so forth.
Figure 6 represents an application of the oligopolistic concept tothe supply and demand for public elementary teachers for the tenyear period 1960 to 1970. The supply-demand relationship was deter-mined by first plotting the long-run supply curve. Then the pointsof intersection along that curve were correlated with the average ele-mentary teachers salaries for various years. The disconnected demandcurves d d2, and d, illustrate the short supply conditions for thoseyears. For example, the conditions at d were such that, at the estab-lished price of approximately $5,100 average salary the industry ex-perienced a short supply of elementary teachers amounting to ap-proximately 35,000. This does not mean that approximately 35,000more elementary teachers were needed in the qualitative sense; onlythat the industry was seeking that number of trained individuals fordeclared positions.
Increasing elementary school enrollments and lack of supply re-sponse did little to improve the conditions within the next yearperiod (d2). However, conditions improved somewhat by 1968 (d,)evidenced by the narrowing of the gap between supply and demand.The final 2 year period closed (d4) with conditions equilibrated.

MOM SALARY(In current dollars)
$9000
$00001.
MOO,
$6000
$500
Li
School Finance in Transition
1Ito
t I90 too
I 4II
I talcEstimatedNumber (000)
Figure 6Supply anti flentand for Elementary Teachers as a Function of Price
Source: NEA Publications, 1971-R4 & 19738
If the shifting "kicked" demand curve illustrated in Figure (i seemsto parallel the Arrow-Capron analysis presented earlier, it does. Thesignificant difference being the set of lssumptions underlying eachmodel and especially the to control assumption of the oligopolymodel. I am suggesting that wages in the education industry areovertly controlled rates where Arrow and Capron were suggesting thatcompetitive market forces established the engineer-scientist wage rates,And, unlike the Arrow-Capron analysis to the effect that increases inbeginning salaries tend to adjust salaries of all engineers in the long-run; any increases in salaries of beginning teachers immediately ad-justs all teachers salaries in the short-run.
Now let me turn briefly to the local school district puzzle.
DEMAND FOR INPUTS PUZZLE
In its simplest form, the overriding constraint facing the produc-tion capability of the firm is the total dollars available for productionas a function of output costs. That is to say, as in equation (1),
(1) C =10),where, C is total cost and 0 is output costs.
Further, (0) is a function of associated pi Auction cost elements in-cluding wages, machines, plain, capital, and other, This relationshipmay be sho%vn as:
(2) (1= f(W, M, P, C, X)where, %V = wages, . = machines, P = plant, C capital, and

Educational Personnel 89
X = other.Combining equations (I) and (2) yields:
(3) C =1(W, M, P, C, X).Having developed the production function in this manna, the
firm proceeds to vary its independent variables (cost elements) suchthat it maximizes production and minimizes costs.
A similar analysis may be made for the school district. The otaldollars available for education (production) in any one time periodare a function of federal, state and local revenue sources, and the fac-tors of production likewise include wages, machines, plant, capital,time and other. Thus, at this conceptual level, although we may beconsideriu. total cost (C), the condition is equivalent to Thomas'output on .rated production function."
It is lot uncommon for school district budget-builders to first con-sider total dollars expected to be available before they engage theoften arduous task of programming those dollars toward the associ-ated cost elements. Even those individuals who employ the Zero BasedBudgeting techniques have some notion about their expected totalrevenue throughout the fiscal programming process.
Although it is beyond the scope of this paper to explore the func-tional relationships between sets of cost elements," the ceteris patibusassumption ("other things" being-equal) is not being made. Althoughthe indifference mapping suggested earlier is an example of costvariable relationships and trade-off matrices, the purpose here is toestablish the context within which one may investigate factors af-fecting demand for professional educational personnel. Therefore,it is conceded that total revenue dollars in any one time perioddetermines the maximum number of dollars available for professionalsalaries which arc then reduced as a function of decision-makers pastand present propensities and requirements to allocate portions of thosedollars to other production cost elements.
For purposes of example, let us assume that the cost elements ofequation (3) above, for a particular time period, have been dollarizedsuch that we now have the relationship established in equation (4),
(4) C = Wt -4- Y,where C = total cost of education, Wt = teachers wages andY = all other costs.
Therefore. the total dollars available for teachers wages becomes,(5) C Y = Wt.
In this manner the total dollars available for teachers wages be-comes fixed for any given time period. The issues surrounding theestablishment of equation (5) and the subsequent analysis below arebest mediated by exampling historical data. In this way we do not atthis point of development become entangled in the economics of col-lective bargaining and the decisioning rules applied to cost-elementtrade-off matrices.
Figure 7 illustrates the relationships established by a particularschool district between total cost (C), total instructional wages (I.)and K-12 teachers wages (Wt) for the period 1964 to 69. Excludedfrom teachers wages are personnel costs for administration, special edit.

90
MINN,1.410).
150
110
IN
110
110
IN
30
10
70
SO
School Finance in Transition
1961 IAN 1 Il11 Ijil
C .1081 cost
I Introetleml NUN
IV *Mirk"
So
U& vimFigure 7
Relationship Between Total Cost, Instructional Wages and K-12Teachers Wages, 1964.68
cation, vocational education, guidance and other professionals whichare reflected in the :gure as the difference between I and We Thedifference, between C and 1,, include costs for support prsonnel, capi-tal outlay, debt Jervice, and other expenses. The example district wasallocating approximately 50 million dollars for K-12 regular programteachers salaries in 1964 and over 70 million dollars for those salariesfour years later.
At the time the school district was making its preliminary costcalculations for each of the cost elements, it was faced with the supplyand demand relationship demonstrated by Figure 8. That is, for 1964the district could (did) employ approximately 7500 teachers for theK-12 regular program at an average cost of just under $7000. For 1968the district was employing almost 9000 teachers in the K-12 programat an average cost of approximately $8000. The "kinked" demandcurve satisfies the market assumptions and further demonstrates thedecision sets one would expect should the average price of teachersincrease or decrease in the short-run.
No data were available to me relative to the "shortage",of teachersin the K-12 program for the period used. 1 do suspect that some short-ages did exist for 1964. If that suspicion is correct the demand curved1 would be disjointed as presented in Figure 6 earlier.
OTHER PUZZLES
I shall not extend this discourse much farther so that we mighthave some time for discussion purposes. In the introduction it was

Educational Personnel 91
Av.' S Wen
DOUARS
S7750
X.14)
441)(1:1ti I
nto $00 moo MO MO 000011&W. Is
>c 51
Figure 8Supply and Demand for Teachers (K-12) in a Particular School District, 1964.68
suggested that the supply-demand relationships for educational per-sonnel facing us today may have some implications for our hiring prac-tices. Certainly it is not naïve to assume that personnel officers andschool principals will have an increasing number of applicants fortheir open positions. In that regard we would expect more selectivitybeing employed by those individuals. However, the question arises.selectivity relative to what? What professional qualities do we lookfor in an elementary or secondary teacher? And, if for example, oneestablished criteria suggested by the Bulkhead studies" and by Levin";'to the effect that pupil achievement is highly correlated to the teacher'sverbal ability, then what will be the courts response to such discrimi-natory criteria? And, what protectionist provisions might we face in fu-ture collective bargaining agreements?
Also, what might be the implications for our teacher-training prac-tices at colleges and universities? Should we, for example, begin lim-iting our enrollment in teacher training programs? Some would re-spond with a resounding yes! Others rationalize, as does NEA, thatlower pupil-teacher ratios are necessary and projected and dm train-ing should continue; or, we should train to replace the less qualifiedindividuals now teaching, or at least cause the less qualified to enterskill development in-service offerings. However, we arc also hearingsome proposals to allow school districts to certificate their own teach-ing staff.
I think that I have probably raised more than enough issues forour exploration in the time left, and I'm sure the panels have others.Two decades ago it would have been heresy to examine and critiqueeducational qualities in the manner we do today. And, it places the
w
92 School Finance in Transition
teacher somewhat in the position that Daniel Webster found himselffollowing tne Compromise of MO, when Whittier wrote about himin his lealmtl poem:
So fallen, SO lost,The light withdrawn which he once wore,The glory of his grey hairs goneForever more, Forever more.
F'OO'TNOTES
I. Becker, C. S.. Human Capital, Princeton: Princeton University Press. 1964.2. Schultz, T. %V.. "Investment in Human Capital," American Economic Re-
view, v. 51 (1961).3. Hansen, %V. -Total and Private Rates of Return to Investment in School-
jug," Journal of Political Economy, v. 81 (1963), u. 2.4. Weishrotl, B, A., "Education and Investment in Human Capital," Journal of
Political Economy, v. 70 (1962), n. 5.5. Bowman, M. J., 'Ube Human Investment Revolution in Economic Thought."
Sociology of Education. v. 39 (1966).6. Balogh, T. and P. P. Streeten, "The Planning of Education in Poor Coun-
tries." in M. Blaug (ed.) Economics of Education I, Baltimore: Penguin Books, 1968.7. Bowles, S., 'A Linear Programming Model of the Educational Sector, in
M. Blaug (ed.) tummies of Education :I, Baltimore: Penguin Books, 1969.8. Arrow. K. J. and W. M. Capron, "Shortages and Salaries: The Engineer-
Scientist Case in the United States," in M. Blaug I. op. cit. pp. 318.337.9. Blank, D. M. and G. J. Stigler, The Demand and Supply of Scientific Per-
sonnet New York: National Bureau of Economic Research, 195/,10. Beste, C. W., "A Case Study of the Shortages of Scientists and Engineers in
the Chemical Industry," paper presented at the second meeting of the NationalCommittee for the Development of Scientists and Engineers, June 21. 1956.
II. Benson, C., The EronoMics of Public Education. (1st ed.), Boston: Houghton-Mifflin 'Co., 1961.
i2. Allen, R. G. D., Mathematical Analysis jor Economists, New York: St. Mar.tin's Press, 1938, reprint 1967.
13. Leftwich, R. N.. The Price System and Resource Allocation, N.Y.: Rinehart& Co., 1955.
14, Ibid., p. 245.15. Thomas, J. A., The Productive School, New York: John Wiley & Sons, 1971,
p. I I16, See Thomas' chapt'r 4.17. Burkhead, J. Input and Output in Large City High Schools, Syracuse; Syra
cuse University Press, 1967.18, Levin, H. M., "A CostEffective Analysis of Teacher Selection," Economicseducation, D. Rogers and H. Richliu (eds.), N.Y.: The Free Press, 1971, pp.
1:14 ff.
0

Measuring Productivity in EducationBOB N. GAG!,
Director of Institutional Research, University of Mississippi.
My remarks today concerning the measurement of school systemproductivity will be three-ibld. First, I will attempt to summarize theresearch that has recently been done on input-output relationships inschool systems. Second, I will describe a methodology that seems in-herent in this type of research and describe, hopefully, in layman'sterms the statistical techniques utilized in this research and finally 1will point out sonic policy implications that seem to follow from thefindings of the research.
INPUT-OUTPUT RELATIONSHIPS
The study of input and output relationships is not new to the.American businessman, manufacturer or educator. Business and in-dustry in America have utilized data these areas for over dcenturywith education becoming more inclined within the last five decades.The definition of output has been difficult for educators because ofthe complexity of measuring- human productivity. Schools have con-sistently "measured" students with standardized and teacher madetests and have equated this type of productivity with output. Inherentin this assumption is that school system output can best be measuredby pencil and paper reporting of its students; that is, educators havenot been able to identify other "measureable" means of school systemproductivity.
Nlost of the literature relating to school system productivity dealswith studies of variables associated with student achievement. ,Johnsand Nlorphet in llHi9 provided an excellent review of studies dealingwith the economics of financing education and concluded that a strongg,relationship exists between student achievement as a measure of quar-
93
School Finance in Transition
ity of education and expense of education. The Michigan Departmentof Education (1970), having made a comprehensive review of studiesreporting on the correlates of school performance, concluded thatstandardized achievement tests were most used and perhaps the bestsingle measure of output.
Strang (1967) and others have claimed that reading proficiencyis not only essential to success in all academic subjects, but that it isthe ClIII7aftCe into almost all Avocations." 'Mt -tisemy of rdiationships
between reading and other academic subjects is reported by Harris(1962) to have been verified by a number of studies. Success in read-ing has been correlated with success in problem-solving ability, vari-ous forms of oral and written communication, spelling, all ninthgrade subjects except mathematics, and with scholastic grade averagein secondary schools. Although achievement tests have not been de-veloped for all areas of the school curriculum, the ability to read doesaffect all areas and tests are available to measure reacting.
Measures of School System Input
Most of the research done on school system input-output relation-ships has concentrated on variables or characteristics that are 1) di-rectly school related or controlled and 2) those considered non-schoolrelated variables. School related variables are further classified asteacher oriented, materials and supplies, class size, and characteristicsof graduates. Per pupil expenditure as a measure of input' encompassesboth school and community. The school system is responsible forexpending; its finances wisely, but is controlled by the community(local, state and federal) as to amount of revenue it receives.
The non-school variables that have been considered in these typesof study can be further categorized into 1) socio-economic and 2) com-munity related variables. It is often difficult to classify some variableswithin one of these two broad categories, but generally those datarelated in any way to socio-economic status are classified in the formerand all others are considered to be the latter.
School Related Variables
Several variables associated with school system input are teacheroriented and have been shown to be related to student achievement;for example, years of teaching experience (Thu vas, 1962; Bulkhead,1967; Katzman, 1967; Levin, 1970), teacher verbal ability (Hanushek,1968; Bowles, 1969; Levin, 1970), teacher salary (Thomas, 1962; Burk-head, 1967; Cohn, 1968; KieF'ing, 1969), and teacher certification(Benson and others, 1965). The amount of materials and suppliesprovided by a school system has been identified as related to studentachievement (Fox, 1969; Flanagan and oters, 1962; Kicsling, 1967).Some studies are quite specific in naming certain materials and facili-ties, e.g. science laboratory facilities (Bowles, 1969) and number ofbooki in the school library (Kiesling, 1967). Average class size andpupil -teas ier t atio have been shown to be related to student achieve-
o p

Productivity in Education 93
went (Mollenkopf, 1956; Thomas, 1962; Bowles, 1969; Kies ling andAverch, 1971). Kies ling (1967) also identified percentage of graduatesattending college as related to school achievement.
Project Talent, a massive research ellort involving 400,000 high,chool students, seeking the correlates of a number of pupil outcomes,indicated the most important treatment factors found to date (1967)were teocher teacher experience, number of books in theschool lilbs.ty and Fe: pupil expenditure. These remained importanteven when socio-economic factors were held constant.
Teacher quality was found to explain achievement changes forlow income children in California. Teacher quality was defined asteachers holding certification, teaching in field, and teacher salary.
Cooper and Bemis (1967) in a study designed to examine teacherpersonality variation in relation to pupil gains in achievement con-eluded that teachers who were critical, willing to accept leadershipand interested in influencing and persuading others result in pupilgains. These variables of motivation, drive for success, and interestin helping other human beings are illusive measures. In a. era ofcompetency based teacher training attention must be given to develop-ing these skills in teachers and assessing them as a part of the compe-tency based skills expected of teachers.
Per pupil expenditures have been cited as contributing to the re-lationship between school input and output. The more financial re-sources behind a student, the more academic achievement seems tobe produced (Flanagan, et. al., 1962; Kiesling, 1969; Bowles, 1969).There is alternative evidence, as well, showing no relationship'betweenper pupil expenditure and academic achievement (Kieshng, 1968;1970; Burkhcad, 1967; Cohn, 1968). Two recent studies (Rose, 1972;DeRuzzo, 1972) correlated current expenditure per pupil with aca-demic achievement and found very low and non-significant positivecorrelations.
Lyle (1968) concluded that it takes a great increase in input togain a small amount of output and that rather than massive spendingincreases, per se, emphasis should be placed upon input-output studiesthat yield information on the best combination of services. Thomas(1962) found correlation between levels of resources and mean testscores, but also concluded that the manner in which the money wasspent appeared to be more important than the level of expenditure.
NoSchool Related Variables
Those variables considered to be socio-economic in nature havebeen studied in much greater detail in recent years. In justifying cud-Lure as a variable Bernard (1965) stated that the "culturally different"youth is lacking in those experiences and skills related to high educa-tional achievement. Educational performance is related to environ-mental experiences, motivation and self-esteem. The Coleman Reportof 1966 was probably the milestone for this type of study and reportedthat socio-economic variables related more to school achievement thandid school variables. The influence of family background was pin.
11!'. 141

96 School Finance in Transition
pointed as being highly related to student achievement. This studycollected data from some 600,000 students in 5,000 schools locatedthroughout the country in both rural and metropolitan areas. Highlycorrelated with achievement was student attitude, such as his feelingof control over his own destiny. and family background influences. Ofthe small amount of variation that was attributed to school character-istics, teacher qualities accounted for more than all others taken to-gether.
Criticism has been made of the Coleman Report because of thestatistical analysis of the data. Bowles and Levin (1968) contendedthat once amounts of variation were attributed to socio-economic vari-ables, the attempt to identify the school's contribution to the remain-ing unexplained variation was of little value. The procedureof hold-ing background variables constant reduced the apparent effect ofschool variables since school and background variables are intercorre-lated. George Mayeske (1968) also criticized the data treatment of theColeman Report because of the intercorrelated variables. Re-analyz-ing some of the data, he found school variables more highly corre-lated to achievement than did Coleman.
Members of the Harvard University faculty initiated a seminarconcerning the Coleman report and have widely published and dis-cussed the report. Mosteller and 'Moynihan (1972) edited a publica-tion which pulled together much of the seminar participants' re-analyses. In general. the results of the re-examination affirmed theoverall conclusion of the Coleman Report: that is, what the childbrings with him to school is most important. Schools have .been ableto provide little influence on achievement that has been completelyindependent of the child's socio-economic background.
Studies other than Coleman (1966) have emphasized the relation-ship between family income, social class, family background and .theschool achievement of children (Parelius, 1967; Burkhead, et. al..1967; Pierce and Mallory, 1968). As mentioned previously it is difficultto classify as socio-economic or community some of the variables beingused. Dunnell and Greene, two separate studies in 1970, speak ofsocio-economic environment which perhaps marries the two morecomfortably than others.
Still another source supporting the influence of socio-N-onomicvariables on school performance is Christopher Jencks. In re-evaluat-ing some of the Coleman data Jencks (1972) concludes that schoolsdo almost nothing to close the economic gap between rich and poor.To quote, 'lime character of a school's output depends largely on asingle input, namely the characteristics of the entering children," (p.53);. Jencks challenges the efforts made or proposed by educatorsto create equal educational opportunity for American school childrenin the public schools.
In mummify, research has hem cited to support and in some in-stances negate the effect of school input variables on student achieve-ment or school output. A greater emphasis has recently been placedon die effect of socio-economic and community related variables onschool achievement. Educators are at a strategic point in time as we
Productivity in Education
face the challenge of criticism concerning the tiled of the publicschool system on equating educational opportunity and in producingevidence that our schools are in fact "productive."
IDENTIFICATION OF VARIABLESLiherent in all input.output productivity studies is the need to
identify, quantitatively, th,%se variables that represent the school sys.tern in terms of its facilitie., faculty, stall, students, as well as the so-cial and economic makeup ('I the community. Any data availablefrom the Census, state dcpartaients of education or other governmentagencies can be titilind as "input data". if it can be broken out asbeing demographically consistent.
The question of what is relevant output data remains pertinent.Most studies, as cited earlier, have used achievement data at someparticular grade level as the measure of school system productivity.Various of achievement data, such fourth grade readingachievement on the California Achievement Test Battery, fifth gradereading achievement on the Men opolitan Achievement 'rest, andninth grade composite score on the School and College Aptitude Testhave been utiliied in three recent studies completed for the N.E.F.P.
Tlw basic research design employed tor these studies has chosenone or more input variables and regressed these against an outputvariable, The statistical techniques of linear and curvilinear regres-sion analysis have been used to establish the relationship betweenthese variables. Linear regression models assume a moderate to highcorrelation (AO to .95) between the two sets of variables before anyprediction analyses can be made. If the data do not fit a straight lineor linear model, then curvilinear techniques are used to provide abetter fit.
Once the regression line is determined and plotted those schooldistricts which fall above the line are considered to lie high prothic-tive school districts and those which fall below the line are considcredto be low productive. Sixth grade reading achievement on the verti-cal axis was plotted against current expense per pupil on the hurl-/mud axis and a regression line fitted to the data, The 12 districtsabove the line represented school districts which have produced highermean sixth grade reading achievement scores than one would vedictbased upon the current expense per pupil in that district. The inversewas true for the 12 school districts below the line. Based upon theircurrent expenditures per pupil, their mean sixth grade readingachievement Was hiwer than %mild be expected.
These statements lose their validity when the. correlation betweenthe input and output variables approach /elm That is. it the corre-lation or relationship between the two sets of data is not sighilicant(again .44to .95), then little confidence can is placed on the cafer
gori/ation of these districts into high and low productivity groups.When the linear relationship between one input measure and one
output measure is low and mm-significant, the possibility exists thatthe relationship may be 1) curvilinear or 2) that a combination al

98 School Finance in Transition
two or more input variables would correlate higher with the one out-put measure. A linear regression line fit the data very well, however,when a squared term was introduced into the equation, the best fitwas determined to be curvilinear, not linear. The measure to deter-mine best fit is the Pearson coefficient of correlation and in an exam-ple such as this can be increased substantially by using curvilinearanalysis.
When more than two input measures are used in this type ofanalysis, it is impossible to graphically display with accuracy whatthe relationship looks like. We would have to talk about planes ratherthan lines; however, with the aid of the computer three dimensionalgraphs of the relationships of three variables can be generated fordisplay purposes.
The choice ,f the input or independent variable when dividingschool district tato high and low productive groups is of extremeimportance. less this measure correlates highly with the outputmeasure, a soostantial amount of variation in school achievementamong school districts may not be accounted for. Variation or vari-ance, to use the statistical term, is defined as the square of the coeffi-
ocr cient of correlation between the two sets of data. The coefficient ofcorrelation (r) = .71 between an input and output measure, 14= .50or as a percent, 50(,);,. 'thus, in this example only one half of the varia-tion in achievement scores among school districts was statistically re-laced to current expenditures per pupil.
An advisable way to choose the one or more input variables toregress against an output measure is to compute all possible inter-relationships or correlations of all input and output measures. Findwhich input variables have the highest correlation with an outputmeasure and at the same time have low intercorrelations among them-selves. This can be clone with just school related input variables, orwith just community and socio-economic variables, or with the entireset of input variables. A question of philosophy arises here. Shouldone determine high and low productive groups based on input vari-ables that a school system can control, given they have the finances,or based on community and socio-economic variables that a schoolsystem cannot control? If the former, one could argue that school vari-ables alone do not consider the one underlying link that completesthe chain and that is financial ability of the community to pay forits education. IF, on the other hand, high and low productive groupsarc chosen based on only community variables, then one could arguethat the school's wise utilization of what resources it has available isnot credited for any effect on the achievement level of the students.
It seems most advantageous to find which input variables, regard..less of origin, most highly predict the output measure and to use themjudiciously in the regression analysis. One important variable hasseemingly been omitted from this type of research, however, and thatis time. Benchmark or one-shot data analyses arc fine, but shouldserve only as that. The expectation is that longitudinal analysis willbe conducted to show change over time and the trends that undoubtedly occur.

Productivity in Education 99
An example of actual data will be used to describe the dividingcif school districts into high and low procbictive groups. These dataare from the 87 school systems in Florida where the school systemis coterminous with the government entity of county. Of the severaloutput measures available for use. School and College Aptitude TestTotal scores for 1970 were chosen. The Total score is the sum ofthe Verba". and Quantitative subtest scores. These data were obtainedfrom ninth graders in the spring of the year.
The SCAT-Total score was correlated with 2 input measures rep-resenting school related. community and socio-economic variables.Three "vat tables, adult education level of the school district. the per-cent of non-white students in grades K-12. and family median incomein the school district had the highest correlation either positive ornegative with the SCATTotal score. When multiple regression analy-sis was applied to the variables the adult education level of the schooldistrict and "the percent of non-white students in grades K-I2 ac-counted for the maximum amount of variance among the outputmeasures. Because of the high correlation between adult educationlevel and family median income, the Tatters contribution was over-ridden or masked out by the adult education level variable. The mul-tip c coefficient of correlation was .86 explaining approximately 74%of clic. variation among the county school systems SCAT-Total scores.
On the average a county having a high mean on the SCAT-Totalscore .ilso had a high mean adult education level and a low percentof nowyltite children. Of the difference in county SCAT-Total scoresacross the state of Florida, 74% of the difference or variation in scorescould be related to adult education level of the community and per-cent of non-white students in the school system.
A partial listing of 1) actual mean SCAT-Total scores, 2) predictedSCAT-Total scores based upon the two input variables adult educa-tion level of the county and the percent of non-white students attend-ing school in grades K-12, and 3) the residuals or differences betweenthe actual SCAT-Total score .and the predicted SCAT-Total areshown in Table 1. Residual values bear a minus sign when the actualSCAT-Total score is less than what. is predicted (as in district #1) orare positive when the inverse is tree (district #2). One asterisk besidethe residual value indicates that this district's actual SCAT-Totalscore was less than its predicted score by more than 1/2 standard devi-ation and is placed in the low productive group. Two asterisks indi-cate the actual SCAT-Total score was higher than its predicted SCAT-Total score by inure than 1/2 standard deviation and is considered ahigh productive district. The choice of 1/2 standard deviation' for acut -oil is arbitrac ). In this study it classified approximately of thecounties in the high group and tit in the low group. This is consistentwith the grouping of a normal distribution which the set of residualsapproximates.
The means and standard deviations for each of the remaining 40input variables were calculated for the high productive districts andthe low productive districts. The F statistic was calculated to ascer-tain any statistical differences between groups on each of the 40 vari-

100 School Finance in Transition
I' A111.1 I
SCI1001. ASO (:01.1.1.4:F .11.1O POE 1 FST SCORES-TOTAL. PREDICTED SCORES.CAIA:ULATFI) RI.sIDUALS, .11)1.14 1'1111:CA110N I.FVFI. ANU l'FItUFS r (n:
SinENTS (K.12) FOR 35 Fi.0i00,% (:01511. 84:0040. sysTEms
Dish iaNumber
ActualsC.4 TSeine
PredictedSC..ttStorrs
ifrviduut,(Dille truce.%)
.4 dullEduration
revel
PercentNonIVIati
(X12)
I 58.35 59.01 1.29 2.10 5.61_" r4;.40 56.20 0.21) 1.111) 12.773 57.03 58.117 1.94 2.10 9.46
50.89 511.25 '2.36 2.30 10.155 53.33 53.03 0.30 1 mu 31.19
6 55.93 50.17 - 0.21 2.10 25.757 19.65 51.34 -1.090 0.00 29.358 8.78 52.18 3.0 9.50 18.689 5339 55.0-1 -1.450 2.00 31.14
to 53.38 55.55 -2.17* 2.00 28.18
II 54.00 51.97 2.03 1.20 39.7012 52.76 52.01) 0.67 9.90 23.8713 11.37 40.73 0.04 8.90 78.181 1 55.1.1 52.84 . 2.30 9.10 10.21IS 6.71 51.1-1 -4:130 9.80 28.18
16 5:1.90 5335 0.11 I 0.IN) 269717 47.02 5.82 1.20 8.90 48.02I8 55.56 54.32 1.2.1 9.90 10.8!)19 49.7 53.19 3.5* 10.10 23.2620 .55.21 54.58 0.63 111.70 18.68
21 54,47 53.78 0.69 11.00 26.8322.. 55:19 56.87 - I .3s* 11.90 19.3723 55.02 53.78 1.24 8.90 2.3921 50.14 55.74 0.70 12.10 28.2225 5339 9.37 4.22" 9.70 37.39
20 13.55 41.31 2.21 8.811 7:1.51
27 53.16 51.48 1.98 8.90 15.7528 50.73 55.08 1.115 11.70 23.9529 59.46 57.16 2.00 12.10 18.283o 55.81 55.65 0.16 12.60 3437
31 031 50.57 -4.03* 11,18) 32.68$2 53.2 I 50.12 2.79** 8.611 18.4113 13.78 44.75 0.97 9.18) 56.0331 50.55 56.56 -11.01 12.10 23.4915 53.45 54.01 -0.56 I 1.00 32.50
_ .... _......
aides.As seen in Table 2 front the Florida productivity study, the input
variables of percent of students attending some form of Lost highschool education, the percent of teachers in the school district for twoyears or les,. (negative relationship) and percent of teachers in the_school district from 7-14 years, were significant contributors to the dif-ferences between high and low productive groups.
lIvo other recently completed studies mentioned earlier used data

TA
BL
E e
.
ME
AN
S. S
TA
ND
AR
D D
EV
IAT
IG.:S
AN
D C
AL
CU
LA
TE
D F
VA
LU
ES
IN T
HE
HIG
H A
ND
LO
UPR
OD
UC
TIV
E G
RO
UPS
FO
R S
EL
EC
TE
D I
NPU
T V
AR
IAB
LE
S
Var
iabl
eN
umbe
r
1
Var
iabl
eT
itle
Tw
enty
One
Hig
hPr
oduc
tive
Dis
tric
tsN
inet
een
Pom
ba-l
ive
Mea
n
Lou
.D
istr
icts
Nta
ndar
dD
evia
tion
Ca
Irri
tate
dM
ean
Stan
dard
Dev
iatio
n
Adj
uste
d G
ross
Inc
ome
per
pupi
l (A
DA
). 1
970.
$11.
558.
;1S
5,39
3.29
S10.
2(J2
.10
S 3.
1903
6.7
9
-1Pe
rcen
t inc
ome
unde
r 53
.000
40.0
5%6.
00%
37.8
0%3.
96e;
1.90
3Pe
rcen
t inc
ome
over
510
.000
1121
%6
99(1
)10
.11%
3.57
e;45
4Pe
rcen
t ESE
A T
itle
1el
igib
le p
upils
12.4
5%8.
86%
8.76
(;.
3.68
%2.
86
5Pe
rcen
t ESE
A T
itle
Ipa
rtic
ipan
ts10
.70%
6.75
%9.
08'
4.24
e:,
.81
6Fa
mily
med
ian
inco
me.
197
0$
6,75
5.00
S 1,
672.
84S
7.03
1.47
51.
04r;
.21
.40
8Pe
rcen
t stu
dent
s no
n-w
hite
(Gra
de 3
)24
.40%
14.7
9%22
39%
8.40
7,.
2710
Perc
ent o
f at
tend
ance
93.4
1%SI
';,93
.17%
.84g
y,.9
0
I1Pe
rcen
t fur
ther
edu
catio
n.to
tal
53Si
%14
.07%
45.1
0%10
.43%
4.97
12Pe
rcen
t fur
ther
edu
catio
n.co
llege
47.4
7%13
.32%
39.7
3%9.
47%
4.40

TA
BL
E 2
Con
tinue
dM
EA
NS,
ST
AN
DA
RD
DE
vIA
TIO
Ns
AN
D C
AL
CU
LA
TE
D F
VA
LV
ES
IN T
ILE
HIG
H' A
ND
Low
PRO
DU
CT
IVE
GR
OU
PS F
OR
SE
LE
CT
ED
IN
PU-1
. VA
RIA
BL
ES
Var
iabl
eN
umbe
rT
itle
Tw
enty
-O
ne H
igh
Prod
uctiv
e D
istr
icts
Nin
etee
n L
ou,
Prod
uctiv
e D
istr
icts
Cal
cula
ted
Mea
nSt
anda
rdD
evia
tion
Mea
nSt
anda
rdD
evia
tion
13A
vera
ge d
aily
mem
bers
hip
per
dist
rict
$21.
912.
86$2
8.06
4.07
$182
36.6
3$3
4,74
7.90
.14
14Pe
rcen
t of
age
5-13
inpu
blic
sch
ools
96.6
3(;,
354,
!;.,
96.7
7%42
5%.0
1
15T
rans
port
atio
n co
st p
erpu
pil i
n A
DA
S29
.92
S15
.30
S27
.57
S11
.48
.30
16L
ocal
fis
cal e
ffor
t 197
0-71
.023
7.0
092
.027
4.0
134
1.04
17Po
pula
tion
mob
ility
perc
ent
1960
-197
026
.78%
30.2
6%31
.13%
32.6
1%.1
9
ISPo
pula
tion
dens
ity-1
970
175.
3942
324
99.7
218
5.97
.52
19St
uden
t mob
ility
I970
-71
84.5
2%2.
30%
82.9
6%2.
97%
3.47
20St
uden
t den
sity
-197
0-71
33.8
069
.61
22.8
141
.43
.36
21Pe
rcen
t ann
ual c
ontr
act
(AC
) St
atus
0-2
yea
rs44
.97%
10.3
9%53
.50%
10.8
9%6.
41
22Pe
rcen
t con
tinui
ng c
ontr
act
(CC
) St
atus
3.6
yea
rs11
24%
5.83
%11
.47%
2.78
%.0
3
ea

23Pe
rcen
t con
tinui
ng c
ontr
act
(CC
7) S
tatu
s 7-
9 ye
ars
24Pe
rcen
t con
tinui
ng c
ontr
act
(CC
IO)
Stat
us 1
0-14
yea
rs25
Perc
ent c
ontin
uing
con
trac
t(C
CI5
) St
atus
15+
yea
rs26
Perc
ent R
ank
I C
ertif
icat
e(1
971-
72)
27Pe
rcen
t Ran
k IA
Cer
tific
ate
(197
1-72
)
28Pe
rcen
t Ran
k II
Cer
tific
ate
(197
1-72
)
29Pe
rcen
t Ran
k 11
1 C
ertif
icat
e(1
971-
72)
30B
egin
ning
Ran
k II
I te
ache
rsa
lary
- 1
970
-71
31T
he a
vera
ge te
ache
r sa
lar}
1970
-71
857%
1254
%
22.6
7%
.60%
.28%
25.4
4%
73.3
2%
S 6.
338.
09
$ 8,
571.
66
6.00
%
9.21
%
19.8
2%
.59%
.43%
.41%
.361
".7.
6.97
%22
.90%
6.60
%75
50%
$14
6.55
$ 6.
434.
63
S69
2.60
S 8,
383.
89
2.70
%
4.33
%
7.40
%
5.99
°
7.18 .89
.57%
.11
.47%
.34
5.09
%1.
70
5.15
%1.
33
$26
7.91
2.05
S57
8.82
.86

1o1 Silioal Finance in Transition
from school systems in Delaware and Kentucky. Rose (1972) who con-ducted the Delaware study also found that adult education level ofthe community, teacher experience and pre )aration, percent of mi-nority enrollment, and percent of high school graduates pursuing fur-ther education to be significant contributing variables distinguishingbetween high and low productive groups of school districts. Rose usedreading achievement at the fifth grade level for his measure of output.
DeRuzio's (1972) study in Kentucky found that the number ofeconomically deprived students in the school district eligible for Title1 funds was the best single predictor of school achievement. This againwas a negative relationship. Average teacher salary and percent ofschool budget expended for instructional purposes were the next twohighest contributors to a difference between high and low productivedistricts. Deltutto's output measure was fourth grade reading achieve-ment scores.
RESEARCH FINDINGS
Several thiio can be learnrcl from this type of research. Perhapsmost important is that educational achievement and attainment mour public school system is not as completely dependent upon sock)economic factors as current sociologists would have us believe. Schoolrelated variables of teacher experience, training and maturity do re-late and account for a substantial amount of the variance in theachievement of school children.
Those currently pursuing this type of research are upon the thresh.old of ascertaining more clearly and concisely those attributes held byteachers that positively effect achievement in children. There areteacher qualities of attitude toward profession, attitude toward chiledren, and commitment to the profession that need to be assessed andused in these analyses. The quality of performance and the best teach-ing style to produce the maximum amount of learning for a particulargroup of learners are but two more of the areas that need attention.Robert Soar in 1972 documented that higher level cognitive growthin children is produced by a different teaching style than lower levelcognitive growth. This implies perhaps that the generalist concept ofteacher training for the early grades may need to be reconsidered. Or,prospective teachers need to develop a variety of teaching styles forteaching children at the various levels of the cognitive taxonomy.
1 think the lay public needs to be critical of educational perform-ance. They need to stir us to act, to seek out better ways to teatil allchildren. I can offer no excuse why nationally only approxim itely70% of our "Johnies can read." Nor, on the other hand, am I con-vinced that our schools today should be just a "nice place to be."
This type of research suggests a compromise between the adamantcritics and professional educators. A host of research (Gordon, 1969;Gray, 1971; Hess, et. al., 1968; and Schaefer, 1969) supports the conecepts that the educational experiences received at the pre-school levelare the most critical of any stage in development. If the input of syste-matic learning experiences for this age group can produce successful

Prothselivigy in Education 105
output measures and these can be documented on a longitudinal basis,then serious consideration should be given to publicly supporting pre-school education. If the evidence is sufficient to say that children bringto school those experiences (or lack of experiences) that destine theireducational achievements, then the public should be willing to sup-port free public education for three and four year old children.
Finally. from a research and statistical point of view, the method-ology by which we study inpui-output relationships needs to be im-proved. The use of path coefficients. canonical correlations, and this-ter analysis shGuld enhance the usefulness and significance of thedata. A closer look at various econometric techniques should also im-prove our schema for educational productivity studies. The produc-tivity of a school system is reflected in its students, both in numberand in quality. who in turn as graduates determine to a large extentthe productivity of the community. The people of the community inturn have children who enroll in the school system to complete thecycle. Measurements need to be taken at all points on this continuumso as to account for the totality of relationships and timing of inputs.Low achievement scores in a school may reflect the value system of theadults in the community, not the school faculty or its facilities.
The procedures described here can be used at the school or systemlevel as well as at the state level. This was substantiated yesterday inthe presentations of Bill McClure and Dick Rossm.11er. Providing thebest way to spend the educational dollar remains a high priority.
The use of inout-output relationship research remains a feasibleway to provide a dynamic model for decision making. School relatedvariables of teaching styles, delivery systems, teacher attitudes andmotivation, as well as others. should be studied more closely to de-termine the maximum output for x numbers of expended. Adecision model based on reliable and specific program data can be themost useful tool an administrator can use.
To sumntarize, the research to date implies that teacher profes-sional maturity relates to high student achievement. Or its corollary,school systems having high teacher turnover within the first two yearshave lower student achievement. The educational dollar can perhapsbe well spent in a salary schedule that provides incentive for the pro-fessional teacher to stay in the system. Second, the research impliesthat high adult education level in the district is related to high sal.(lent achievement. Perhaps the gAncational dollar can be well spenton improving the educational level of the adults in the community.The apparent spinoffs of such an educational program could affect thepre-school children and help resolve my earlier concern of public sup-ported education for three and four year olds.
Finally, the research implies that the higher the percentage of non.white student enrollment in grades K-12, the lower the achievement.Should the educational dollar be spent on busing to equalize thisratio or should school funds be allocated to school systems based upontheir ratio?
J..

106 School Finance in Transition
REFERENCES
Averch. Harvey and Herbert J. Kies ling, The Relationship of School and En-vironment to Student Performance: Some Simultaneous Models for the ProjectTalent High Schools, The Rand .;:urporation. Santa Monica, California, 1971.
Benson, Charles S. and others, Report of the Senate Fact Finding Committee onRevenue and Taxation, State and Local Fiscal Relationships in Public Educationin California, Sacramento. California; Senate of the State of California, 196L.
Bernard, Harold W., Psyrhology of Learning and Teaching, New York: McGraw.Hill Book Co., 1965.
Bowles, Samuel S. and Levin, Henry M. "'I he Determinants of ScholasticAchievement, An Appraisal of Some Recent Evidence," The Journal of HumanResources. Vol. 3: No. I. pp. 3.24 (Winter, 1968).
Bowles, Samuel, Educational Ptodiwtion Function, Final Report, U.S. Departmeet of Health, Education, and Welfare, U.S. Office of Education. OEC1-7-09451.2651, ED 037 590. Harvard University, Cambridge. Mass., February, 1969.
Burkhead, Jesse; Fox, Thomas G. and Holland, John W. Input and Output inLarge-City High Schools. Syracuse. New York: University Press. 1967.
Coleman, James S. and others. Equality of Educational Opportunity. Washing.ton, D.C.: U.S. Department of health, Education and Welfare, Office of Education,1966.
Cooper, James G. and Bemis, Katherine. Teacher Personality. Teacher Behaviorand Their Effects Upon Pupil Achievement, Final Report. Albuquerque, NewMexico: New Mexico University, 1967. Cited in Education Research informationCenter, microfilm number ED 012707.
DeRnzio. David. "Identification of Variables to Predict Local School DistrictProductivity." Ed.P. Dissertation, University of Florida, 1972.
Donnell, John Peter. "Input and Output Analysis of Suburban Elementary.School Districts." Ed.D. Dissertation. Illinois State University, 1970. Cited in Pis-serration Abstracts International, 31:1532A.
Flanagan, John C. and others. A Survey and Follow-up Study of EducationalPlans and Decisions in Relation to Aptitude Patterns: Studies of the AmericanHigh School. Pittsburgh: University of Pittsburgh. 1962.
Fox, Thomas G., "School System Resource Use in Production of InterdependentEducational Outputs." The Joint National Meeting, American Astronautical So-ciety and Operations Research Society, paper presented at Denver. Colorado, 1969(mimeo.)
Gordon, I. J. and Associates, eds. "Reaching the Child Through Parent Edu-cation: The Florida Approach." Institute fur Development of Human Resources.College of Education, University of Florida, Gainesville. Florida, February, 1969.
Gray. S. W. "Home Visiting Programs for Parents of Young Children." PeabodyJournal of Education, January, 1971, 106.111.
Greene, Robert Taylor. "An Anavlsis of the Relationships of Selected Factorsto Academic Achiesement of Pupils." Ed.D. Dissertation, University of Virginia,1970. Cited in Dissertation Abstracts International, 31:4416A-4417A.
Hanuslich, Eric A., The Education of Negroes and Whites (unpublished Ph.D.dissertation, microf.), Massachusetts Institute of Technology Libraries, Cambridge.Massachusetts, 1968.
Harris. Albert J. How to Increase Reading Ability, Fourth Edition, New York:David McKay Co., Inc., 1962.
Hess, R. D. and et al. The Cognitive Environments of Urban Presheol Children. Report to Children's Bureau, Social Security Administration, U.S. Departmentof Health, Education and Welfare, 1968.
Jencks, Christopher, Mew "Sill', A Reassessment of the Effect of Family andSchooling in Amerna. New Yt..k, New York: Basic Books, Inc., 1972.
Johns, Roe L. and Morphet, Edgar 1,. The Economics and Financing of Edu-cation, A Systems Approach, Second Edition, Englewood Cliffs, New Jersey: Prentice.Hall, Inc., 1969.
Katzman, M. T., Distribution and Production in a Big City Elementary SchoolSystem, Yale University Library, New Haven, Conn. (unpublished Department ofEconomics Ph.D. dissertation).
Kiesling. Herbert J.. The Relationship of School Inputs to Public School Per-
(

Productivity in Education 107
formanre in New York Stale, The Rand Corporation. P4211, Smut' Monica. Cali-fornia. October, 1969.
Kiesling. Herbert J. "Measuring a Local Government Service: A Study of SchoolDistricts in New York State." Review of Economics and Statistics, Vol. 49: No. 3,pp. 356.'167 (August, 19671.
Kies ling. Herbot J. High School Cost Floors. U.S. Department of Health, Edu-cation, and Welfare. Office of Education, Final Report DEC34.061590.0372, Wash.ington, D.C.. March. 1968. pp. 1.134.
Kies ling. Herbert f.. A Study of the Cost and Quality of New York School Dis.Grins. Final Report, Bloomington, Indiana, Project No. 8.0264, U.S. Department ofHealth. Education and Welfare. U.S. Office of Education. Washington, D.C., 1970.
Levin, Henry M., "A New Model of School Effectiveness," Do Teachers Make aDifference, U.S. Department of Health, Education. and Welfare. U.S. Office ofEducation, 0E58042. Washington, D.C., 1970.
Lyle, Jerolyn R. Research on Achievement Determinants in Educational Sys-tems: A Survey. National Center for Educational Statistics. Division of OperationsAnalysis. Washington, D.C.: U.S. Department of Health, Education, and Welfare,Office of Education. Cited in Education Research Information Center. microfilmnumber ED 018858. 1968.
Michigan Department of Vocation. Research Into the Correlates of SchbolPerformance. A Review and Summary of Literature. Assessment Report No. 3, 19711.
Mayeske, George W. and others. "Correlational and Regression Analris of Differences Between the Achievement Levels of Ninth Grade Schools front the Edu-catim. ! Opportunities Surrey." Washington, D,C.: National Center fee EducationalStatistics, 1968 totimeograrhed). Cited in Education Research Info coition Gen.ter. microfilm number ED 037398,
Mollenkopf, William C., .4 Study of Secondary School Characteristics as Relatedto Test Scores, Research Bulletin 1111.56-h, Edoannual 'testing Service, Princeton,New Jersey. 1956.
Mosteller, Frederick and M3inihan. Daniel. P., editors, On Lquatty of EduraIlona! Opportunity. New York: Vintage Books, 1972.
Parent's. Robert James. Sociological Influences on the AchiPverent of LowetClass Nigro Children. 11'itshinzon. D.C.: I'S. Department of health. Educationand Welfare, Office of Education, \member, 1967. Cited in Education ResearchInformation Center. microfilm number ED 016790.
Pierce. Louise and Mallory. Richard. Analysis ot Achievement Proje.t Design,Interagency Planning for Urban Educational News, Number 5. Fresno City UnifiedSchool District. California. Washington, D.C.: 11.S. Dep,:rtment of Health, EducaHon. and Welfare, Bureau of Elementary and Secondary Education, Office ofEducation. October. 1968. Cued in Education Research Information Center, micro.film number Ed 039747.
Rose, Scott N. "A Study to identify Variables to Predict Local School DistrictProductivity in Two States." Ed.D. Dissertation, University of Florida. 1972.
Schaefer, E. "Home Tutoring. Maternal Behavior, and Infant Intellectual De.velopment." Symposium paper presented at the American Psychological AssociationAnnual Convention, 1Vitshingtott, D.C.. Sept. 1969.
Strang. Ruth: McCullough, Constance M. and Traxler. Arthur E. Theprovemeni of Reading. Fourth Edition. New York: McGraw.Hill Book Co., 1967.
Thomas. James A. "Efficiency in Education: A Study of the Relationship be-tween Selected Inputs and Nleati Test Scores in a Sample of .Senior High Schools."Ph.D. Dissertation, Stanford University, 1962. Cited in Dissertation Abstracts.13:4203.
109

The Constitutionality of the Title I ESEAFormula: Inverted and Regressive
AllocationsTHEODORE H. LAVIT AND KERN ALEXANDER
Mr. Lavit is a graduate of the Vanderbilt University Law School and is amember of the Kentucky liar. He practices law ili Lebanon, Kentucky. Mr. Alex.ander is a professor of Educational Administration, University of Florida, Gaines-ville, Florida.
In the case of Downs v. Marland, which is now pending in theUnited States District Court, Western District of Kentucky, at Louis-ville, the Plaintiffs are school age children from a low-income family,who, with their mother, are seeking a declaratory judgment restrain-ing the U.S. Commissioner of Education from unconstitutionally allo-cating and distributing funds under Title I of the Elementary andSecondary Education Act of 1965, 20 U.S.C. 241a. The children andtheir mother maintain that the formula under which Title I is allo-cated to the various states is discriminatory and is unconstitutionalas being violative of the Due Process Clause of the Fifth Amendment.
Title I was enacted in 1965 with the purpose of expanding andimproving educational programs for educationally deprived children.That Act provides for financial assistance
"to local educational agencies serving areas with concentrationsof children from low-income families to expand and improvetheir educational programs by various means . . . which con-tribute particularly to meeting special educational needs of edu-cationally deprived children." 20 U.S.C. 241a
The purpose of the Act is therefore to provide federal financialassist:.nce for the education of educationally deprived children. Thesechildren are uniformly identified as children from low-income families,
109

II0 School Finance in Transition
The purpose of the Act certainly constitutes a valid governmental pur-pose and is not in contest in the case of Downs v. Marland. Theconstitutional question arises from the method by which funds arcallocated among the states to effectuate the stated purpose of the Act.
Title I provides for funds to be allocated among the states in thehollowing manner:
"Mlle mashninn grant which a local educational agency in aState shall he .eligible to receive under this part for any fiscalyear shall be . an amorist equal to the Federal percentage(established pursuant to subsection (c) of this section) of theaverage per pupil expenditure in that Slate if greater, in theUnited States, multiplied by the number of children in theschoot district of such agency who are aged five to seventeen,inclusive, and are (A) in families having an annual income ofless than the low-income factor. (established pursuant to sub-section (c) of this section), (B) in families receiving annual in-come in excess of the low-income factor (established pursuantto subsection (c) of this section) from payments under the pro-gram of aid to families with dependent children under a Stateplan approved under Title IV of the Social Security Act or(C) living in institutions for neglected or delinquent children(other than institutions operated by the United States) but notcounted pursuant to paragraph (7) of this subsection for thepurpose of a grant to a State agency, or being supported in fos-ter homes at public funds, 20 U.S.C. 241c(a)(2)(emphasis added)
The Federal percentage in subsection (c) is fifty percent and thelow-income factor provided in the same subsection is $3,000 for the
. fiscal year ending June 30, 1973.More simply stated, the formula provides for grants to states based
on the .number of educationally deprived children (children fromfamilies with $3,000 annual income or less) times fifty percent of theaverage per pupil expenditure of either the state or the United States,whichever is greater.
The net effect of this formula is that although it identifies an edu:cationally deprived child in Kentucky in the sante manner as it identi-fies a similar child in New York, it nevertheless grants substantiallymore funds to the educationally deprived child in New York. Thechild with the same educational needs such as the ?hand& in Downsv. Mariam& from Marion County, Kentucky, is giver. much less federalassistance than his counterpart in the wealthy state of New York,thereby violating the Due Process clause of the Fifth Amendment,
THE ISSUE
The issue raised in Downs v. Marland, simply stated, is whetherthe United States Congress, through the Title I formula, can consti-tutionally provide the educationally deprived child in the wealthyhigh expenditure state with greater resources than the educationally

rti
Constitutionality of Title 1, ESEA 111
deprived child in the poor, low expenditure state of Kentucky.The Plaintiffs in Downs v. Mar land did not seek to require the
Congress to fiscally equalize by providing more funds to educationallydeprived children in the poor. low expenditure states than in thewealthy, high expenditure states, but merely demanded that the Courtdeclare that the Title I formula be declared unconstitutional becauseof its effect of disequalizing among the children by distributing morefunds per targeted child to the wealthy states than to the poor states.In other words the Plaintiffs, in Downs v. Marland, as educationallydeprived children, from the poor, low expenditure state of Kentucky,sought only to be provided the same Title I resources as other educa-tionally deprived children living in wealthy, high expenditure states.The Plaintiffs therein, on behalf of themselves and as a class action, forand on behalf of all the Kentucky school children similarly situated,contended that they are discriminated against by the Title I alloca-tion formula simply because they resided and attended school in arelatively poor state.
EFFECTS OF THE FORMULA
To fully fund the Act to its maximum authorization for all stateswould create the following disparities between selected rich and poorstates.
CHART IMAXIMUM TTILT: I AUTHORIZATIoN TO LOCAL EDUCATION AGENCY
PER EDUCATIONALLY DEPRIVED CHILD FOR 1972
New York $652.80RICH Connecticut
New Jersey $495.54Rhode Island $447.10
Kentucky $383.48POOR Arkansas $383.48
Mississippi $383.48Tennessee $383.48
The Bureau of the Census for 1971 has calculated the per capitapersonal income of the following selected states:
New York $5,021Connecticut 5,032New Jersey 4,832Rhode Island 4,077Kentucky 3,288Arkansas 3,036Mississippi 2,766Tennessee 3,325(U.S. Bureau of Economic Ana ly-sis Survey a/ Current Business,August, 1971)
4 41J1,..1,a4d

112 School finance in Transition
For the U.S. Congress in 1972 to have fully funded the prograntias authorized would have resulted in the wide disparities indicated
in Chart I. New York would have received $249.12 more per educa-tionally deprived child than would any of the poorer states whoseexpenditures were at the national average or below. New Jersey, un-der the formula, would have received over $112 more per deprivedchild than the poorer states. In the Downs case the Plaintiffs thereinacknowledged that comparing states' maximum authorizations may besomewhat illusory since Congress seldom, if ever, appropriates themaximum authorization. Chart 1, nevertheless, indicates the preciseeffect and impact of the formula as the law prescribes, excluding tem-porary amendments and aepropriation limitations.
When the state per child formula allotments are compared usingactual appropriations and excluding temporary amendments, the poorstates again receive proportionately much less than the wealthy states.(See Chart II for comparisons)
CHART IIAMOUNT APPROPRIATED FOR TITLE I LOCAL EDUCATION AGENCY GRANTS pER EIHMA
tioNALLY DEPRIVED CHILD (WITHOUT TEMPORARY AMENDMENT) 1972
New York $251.80RICH Connecticut $182.10
New Jersey $197.24Rhode Island $177.96
Kentucky $152.64l'OOR Arkansas $152.64
Mississippi $152.64'Tennessee $152.61
Charts 1 and 11 show the true effect of the Title I allocation for-mula indicating that in using either fully authorized funding or theactual appropriation, the educationally deprived children in wealthystates receive substantially more funds than do the same children inpoor states. According to the Title I formula the state of New Yorkwould receive $99.16 more per educationally deprived child than thestate of Kentucky. As one can readily see, this amount per targetedpupil is not a mere "mathematical nicety." The difference representsabout 65 percent of Kentucky's entire Title I allotment per education-ally deprived child. The educational importance of this wide varia-tion in per child allocation can he better illustrated by noting that fora classroom of 25 educationally deprived pupils there is a variation inallotments of some $2,475 per year. This much additional money canbe the difference between an enriched and an inferior educationalprogram. The disparity created by the Title I formula representsa financial deprivation for the targeted children in Marion county.Kentucky, of no less than $149,000 per year. For the five Downs Chi!.

Constitutionality of Title I, ESbA 113
den alone, the formula provides over $495 per year less than for thesame five children if they were attending school in the state of NewYork. If all the 226,878 educationally deprived children in Kentuckywere valued the same by the formula as the educationally deprivedchildren in New York, the state of Kentucky would receive an addi.tional Title I allocation of over $22.4 million.
The actual amounts appropriated per Title I child during fiscalyear 1972 do not present a true picture of the formula under contestin the Downs case. Although is is acknowledged that this was theamount actually allocated, the variations among states are measurablyreduced by a one-year temporary "fail safe" clause to prevent stateswith out-migration of educationally deprived children from receivingless than they received in a designated base year. That amendment isnot continuing, and was, in fact, attached to the Appropriations Actand not the body of the Title I formula.' Flowerer, even with theAmendment, the educationally deprived child in New York is given$81 more than the same educationally deprived child in Kentucky.
THE TITLE I FORMULA IS NEITHER COMPELLINGNOR RATIONAL
In the Downs case the Plaintiffs contend that the government.under Title I, has no rational basis to treat these Plaintiffs differentlyfrom their counterparts in wealthier states.
STANDARD
The government, in Downs, in defense of the Title I formulaclaims that the "rational relationship" standard should be appliedinstead of the compelling interest standard. This standard merelyprovides that the classification must be reasonable and must fairlyand substantially relate to the object of the legislation.
I. The Title I Formula Has No Rational Relationship to theExpressed Purpose of the Act.
In defense of the Title I formula, the government claims that therational relationship standard should be applied instead of the cont.'Jelling interest standard. It is the contention of the Downs children,however, that the method of allocation used in Title I is not reasonably related to the purpose of time Act and cannot even withstand thelesser requirement of rational relationship.
Aid provided by the federal government to educationally deprivedchildren is not a "gift" nor a" "privilege" which the government cangrant, take away, or treat the recipient unequally. Not only will theCourts prevent time government from being a "Indian giver" but alsothey will restrain the government from being unfair in the distribu-tion of its revenues. This is to say, that once the government hasundertaken to provide a distribution of funds, time recipients thereof

11 I School Finance in Transition
are entitled to them as a matter of "right." Goldberg v. Kelly, 397 U.S.262 (1970): Shapiro v. Thompson, :19.1 U.S. 618 (1969); Sherbert v.rerner, 394 U.S. 398 (19(13); Slochower v. Board of Higher Education,350 U.S. 55l (1956). All children in the designated class are entitledto that same rightunder the holding in Slohower, supra.
With the declaration of policy set forth in Title 1, the Congressassumed a responsibility for the education of educationally deprivedchildren in all states. The Congressional Declaration of Policy stated:
An recognition of the special educational needs of children oflow-income families and the impact that concentrations of low-income families have on the ability of local educational agenciesto support adequate educational programs, the Congress herebydeclares it to be the policy of the United States to provide fi-nancial assistance to local educational agencies serving areaswith concentrations 01 children front low-income families toexpand and hit prove their educational proems by variousmeans which contribute particularly to meeting special educa-tional Mai of educationally deprived children." 20 U.S.C. 241a
Pursuant to the purpose of educating educationally deprived chil-dren, the Congress identified these children uniformly, as a class,among all the states by designating a family low-income factor, 20U.S.C. 241c (c). The Congress thereby created a special and discreteclass of children to whom the benefits of Title I were to accrue. Thisclassification is obviously reasonable and rationally related to the pur-pose of the legislation. However, Congress at this point, after specifi-cally naming and identifying a discrete class of children, perniciouslycreated an allocation formula which treats equals unequally. In Rey.molds v. Sims, 377 U.S. 533 (1964), the Supreme Court stated that:"The concept of equal protection has been traditionally viewed asrequiring the uniform treatment of persons standing in the same rela-tion to the government action questioned or challenged." By Congressitself identifying the group of children to be aided, a primary errorin San Antonio v. Rodriguez, as observed by Justice Powell noting alack of a discrete class, is removed from Downs.
There can be no doubt that the educationally deprived childrenunder Title I stand in the "same relation" to the government becausethe Congress has specifically identified the class and the persons tobe included in the class, 20 U.S.C. 24k (a)(B)(2). However, Congressthereafter enacted an allocation formula which treated that same classunequally. To treat liersons standing in the same relation to govern-ment unequally was held unreasonable by the Supreme Court as earlyas 1920 in Royster Guano Co. v. l'irginia 953 11.S. 412, when it statedthat a classification "must be reasonable, not arbitrary, and must restupon some ground of difference having a fair and substantial relationto the object of the legislation, so that all persons similarly circum-stanced shall be treated alike."
In 1971, the Supreme Court, applying the same rational relation-ship standard, held an Idaho statute unconstitutional because two

Constitutionality of Title I, ESEil
persons, standing in the same relation to government, were treatedunequallyReed v. Reed, 404 U.S. 71 (1971). Therein, the Courtapplied the rational basis test to Idahir's legislation which providedthat "males must be preferred to females" in the designation to per-sons to administer intestate estates, 101 U.S. 76. The Court held thatthe Idaho statute violated the Fourteenth Amendment based on sexd:scrimination in that disputes over administration of the estate ofestie who dies intestate could be eliminated by some other statute orplan without the necessity of relying upon an arbitrary classificationby sx. In Reed v. Reed, the Court applied a less stringent test thanthe "compelling interest" test. This less stringent test, or reasonablebasis test, was used to strike down discrimination of a fundamentalrightthe right to be free of sex discrimination. Here, Justice litirrrstated that the Idaho legislation had no relationship to the objectiveof the statute. Further, the Com t stated:
"In applying that clause [equal protection], this court has con-sistently recognized that the Fourteenth Amendment does notdeny the States the power to treat different classes of personsdifferent ways. (citations omitted) The equal protection clauseof that Amendment does, however, deny the States the power tolegislate that different treatment be accorded to different per-sons placed by statutes into different classes on the basis of cri-teria wholly unrelated to the objective of that statute." supra.
As in Reed, Title I identifies and creates a class of persons stand-ing in the same relation to government and then through the allo-cation formula treats them unequally. What relationship to purposedoes the granting of Title 1 funds to a poor eligible child in thewealthy state of New York have when the basic and fundamentaleducation needs of a poor eligible child in the relatively poor stateof Kentucky are greater? What relationship does the formula of Title Ihave to the objectives provided in 20 U.S.C. 4241a "CongressionalDeclaration of Policy"? The above policy certainly is inconsistent withthe formula. A strong argument can be stated that the formula is in-verted and regressive and rather than being based on wealth, theformula should be based on need. However, the case of need has notbeen contended by the Plaintiffs in Downs v. Marland.
For instance, the defendants in Downs would assert that there isno question of the existence of some discrimination or variation ordisparity, but applying Lindsh'y v. Natural Carbonic Gas Co., 220 U.S.61 (1911), a comparison is made between education involved in thiscase and the New York statute enacted to safeguard the natural min-eral springs against waste and impairment. Therein, the Gas Com-pany was engaged in collecting and vending as a separate commoditythe carbonic acid contained in natural mineral waters existing in acommon underground reservoir.
The Court in Lindsley held that the landowner was not deprivedof any rights secured through the Fourteenth Amendment by the NewYork Statute prohibiting the extracting of carbonic acid gas.
1 4 If'k.)

116 School Finance in Transition
"[T]he statute is directed against pumping from wells boredor drilled into the rock, but not pumping from wells not pene-trating the rock, and . . it is directed against pumping forthe purpose of collecting the gas and vending it apart from thewaters, but not against pumping for other purposes . ..." supraat page 78.
The gas company contended that the statute was arbitrary inits classification and therefore it was denied the equal protectionof the laws to whom it affects. The court held that the lourteenthAmendment does not take from the state "the power to classify in theadoption of police laws," supra at page 79.
The Court in Lindsley listed four tests in determining whether theclassification was purely arbitrary in "such a case," supra. It would beshallow if we failed to grasp the meaning of the phrase "such a case."The Court was speaking of the right of the state to classify in policepower cases. There were no mechanics involved or discrimination in-tended at a targeted group of school children of our nation. The Courtconcluded that the classification wits reasonable because it "may resttqxm some substantial difference between pumping from wells pene-trating the rock and pumping from those not penetrating it . . , andthis difference may afford a reasonable basis for the classification,"supra.
Besides, said the Court: "The allegations of the bill shed but littlelight upon the classification in question," supra.
In Lindsley, the Fourteenth Amendment was in issue over a statutewhich fell within the police pewer of the State of New York. InDowns, the Court is dealing with a federal statute which does notcover an entire classification of children. It covers a targeted group,a situation much different from that of San Antonio v. Rodriguez aswell as Lindsley. It attempts to assist local school children by identify-ing a specific group of children (ages 5 to 17 in families havint; anannual income of less than $3,000) and apply a formula for distribut-ing Title I funds.
Under the circumstances in Lindsley, the Plaintiffs in Downswould he the first to agree that the application of the reasonable basistest was appropriate.
Dandridge v. Williams. 397 U.S. 471 (1970) is cited by the dampdants in Downs and the following particular language has been pin-pointed by the defendants therein:
"In the area of economics and social welfare, a state does notviolate the Equal Protection Clause merely because the classi-fications Made by its laws are imperfect." 397 U.S. at page 485
To begin with, the Plaintiffs in Downs have contended that Dan -dridge is not applicable to their cases because education is of greaterimport and has been of great import to the Supreme Court than casesinvolving welfare paymentscompare Brown v, Board of Education,347 U.S. 489 (1954) with Jefferson v. Hackney, 406 U.S. 535 (1972).

Constitutionality of Title 1, ESE/1 117
In Dandridge, the State of Maryland enforced a regulation whichlimited or imposed anoverall ceiling of 5250 per month as the totalamount of welfare assistance any one family unit could receive underits aid to families with dependent children program (AFDC). As a'result, while most families received benefits sufficient to meet theirstate-defined standards of need, the large families (whose needs ex-ceeded S250 per mouth) received less than their computed need.
The Plaintiffs in Dandridge succe.sfully attacked the FourteenthAmendment initially but were reversed by the Supreme Court whichheld that the maximum grant regulation did not violate the Four-teenth Amendment because' it was of a .social and economic natureand therefore could be reviewed only under "traditional standards ofrestrained equal protection review." The Court stated that "a statu-tory discrimination will not be set aside if any state of facts reasonablymay be conceived to justify it," supra.
But the Court went further. justice Stewart recognized the differ-ence between the regulation of business and welfare and, althoughhe refused to apply. a different constitutional standard, he thoughtthe regulation was attempting to relieve the "disincentive to work"however imperfect. lit the Court's opinion this made the Nlaylandregulation reasonable.
For the first time the Court in Dandridge had now decided a caseinvolving maximum grant legislation or regulation. And in this re-gard, the Court held that since the focus of the act was on the familyunit rather than on individual dependents eligible children born intofamilies receiving a maximum grant were not excluded from cover-age but were merely forced to share the same benefits with otherhousehold members. The Court stated at page 48.1, 11.16 that the"stria review test applied to a constitutionally protected freedom."
Therefore, the Court's primary point of law was to indicate thatthe reasonable basis test was used to uphold the Nlaryland regulationbecause there was no discrimination of the family unit which was theprincipal object of the regulation. In other words, each family unitso designated under the regulation received the maximum of 5250.The focus of the regulation had nothing to do with an individual'sneeds and there could be 110 discrimination against families becauseeach family unit was treated equally.
In Downs v. Marian& there is a wide difference between the dis-crimination alledged by the Plaintiff in Dandridge and that practicedby the government through the use of the formula in Title 1. Notonly does Title I identify a targeted age group of children but alsoit classifies a certain group within those age limits and on a low-incomefactor which is 53,000. After the targeted group is identified its mem-bers received different benefits because of where they happen to live.Under that formula a poor child is much better off in the State ofNew York than he would be in the State of Kentucky in tants ofrecipient power.
The Dandridge Court simply bought the defendant's argumentand applied the reasonable and rational test and found affirmativelythat (1) the needs of the ntaximum provisions encouraged gainful ern.

118 School Finance in Transition
ployment; (2) maintained the balance between welfare families andthe wage earner; (3) encouraged family planning; (4) allocated pub-lic funds in a manner which would meet the needs of the largest num-ber of families; and (5) treated all family units precisely the same orequally in the maximum grant range.
Dandridge is markably different from Downs for several reasons:First, the unit of classifications utilized by the State of Maryland wasthe family unit but, secondly, and probably more important, the Mary-land regulation was involved with the vague standard of need con-cept which suggest a lack of "judicially manageable" standards. Ap-propriate standards of need arc illusive and the courts have beentraditionally hesitant to substitute their judgment on an.area as vagueas welfare or educational needs, Mchints v. Shapiro, 293 F.Supp. 327(1968) affirmed, 394 U.S. 122 (1969).
In McInnis children tioni school districts of better than averagewealth sought more funds than children in other school districts be-cause of an alledged greater educational need. The Court thereinheld that there were no "judicially manageable" standards on whichit could rely to provide more funds to children in one district thanin another.
The issues in both Dandridge and McInnis are, therefore, basicallydifferent from the issues raised by the Downs children. In both ofthose cases the Plaintiffs asked the C01/11 to hold statutes unconsti-tutional because the Plaintiffs did not receive more funds than theircounterpart in the sante classification. The issue of need was notraised in Downs. Therein, the Plaintiffs only pled to be treatedequally with other children within the same classification.
Although redundant, it is important to bear in mind the equalitystandard which the Court focused on in Dandridge and similar stand-
i ards upon which the Plaintiffs requested relief in Downs. The consti-tutionality of the formula under Title I is an issue in Downs and inorder to apply the correct standard for judging this formula, the Courtshould consider whether the formula classifies the amount a childreceives by the wealth of the state he happens to reside in. In Dan-dridge the entire group of individuals eligible for welfare were poor.The Plaintiffs in Dandridge were merely attacking the limitations onlarge families to a basic monthly allotment without considerationgiven to the number of people in the family unit. But in Downs, theCongress created the statute which admittedly discriminates (but ac-cording to the government, "not substantially"). In Dandridge theState of Maryland had no role in the creation of large families whichwas the element which led the plaintiffs to comulain. And yet, theelement which brought the plaintiffs in Downs to the bar of justicewas born of our Congress and thrust upon a disadvantaged minoritythrough the Title I lormula. The class effected could not preventthe results of discrimination, as could the effected Llas... in Dandridge,said the Court therein. Justice Stewart recognized in Dandridge thateducation is not completely an economic anti social welfare issue:
"ftliere we deal with a state regulation in the social and eco.

Constitutionality of Title I, ESEA II'
nomic field, tiot affecting freedoms guaranteed by the Bill ofRights that claims violate the Fourtetmth Amendment onlybecause the regulation results in some disparity in grants fromwelfare payments to the largest AFDC families." Dandridge v.Williams, 397 U.S. 471 at page 484
In a dissenting opinion, justice Marshall indicated that he wasgrateful that the majority was protecting all of the fundamental in-terests of the plaintiffs therein and that he was sure that all the plain-tiffs had to worry about thereafter was merely the acquiring of enoughfunds for basic needs of clothing, shelter and food!
In Richardson v. Belcher, .104 U.S. 78 (1971) the Court appliedthe rational basis test citing the Dandridge case, upholding the con-stitutionality of the disability provisions of the Social Security Actwhich were reduced because the Plr.intilf there was a recipient of StateWorkmen's Compensation benefits. The Plaintiff alledged that thiswas unconstitutional denial of the due process rights under the 'FifthAmendment,
The government in Richardson v. Belcher, supra, defended thepractice as being reasonable and rational because without the offset,a typical worker injured in the course of his employment would re-ceive benefits in excess of his take home pay prior to his disability.The government contended that such a situation enduced the workerto become non-employable.
The Court states at page 79:
"If the goals sought are legitimate, and the classificationadopted is rationally related to the achievement to those goals,then the action of Congress is not so arbitrary as to violate theDue Process Clause of the Fifth Amendment.""While the present case, involving as it does the federal statute,does not directly implicate the Fourteenth Amendment EqualProtection Clause, the classification that meets the test articu-lated in Dandridge is perforce and consistent with the DueProcess requirement of the Fifth Amendment." (citing Bollingv. Sharpe, 347 U.S. 97 [1954]).
The Court in Richardson v. Belcher, went further at page 79 andstated the following:
"To characterise an Act of Congress as conferring a 'publicbenefit' does not of course, immunize from the scrutiny of theFifth Amendment."
As we relate Richardson v. Belcher to Title 1 funding formula, itshould be noted that in Richardson the Federal government assumedthe role of equalizer by bringing the disabled Social Security recipi-ents up to an established amount per month of $329.70. Were theState of West Virginia unable to produce as great a Workmen's Com-

120 Schou! Finance in Transition
pensaition benefit, thenthe federal contribution would increase, thus,equalizing the hind available to the recipient. just the opposite istrue tinder the Title I formula. The more a state expends the moreit is granted front the federal government. The poor state cannot ex-pend as mulch. and therefore it receives less. Inversely, the wealthystate has the ability to extend inure and so it receives more. Thus,the relationship between Richaason and Belcher and the Title Iformula becomes even more graphic in terms of the opposing rolesof the government. Under Title I the federal government is cast ina role of the disequalizer and disequalization increases as the disparityof wealth between the states is increased.
In Flemming v. Nestor, 363 U.S. 603, (1960) the Plaintiff, afteraccruin:.; old age benefits, was deported because of membership in thecommunist party, a condition prohibited by the Social Security Act.The Plaintiffs contended that his depsrtation was unconstitutionaland the curtailing of accrued old age benefits was a violation of hisFifth Amendment rights. The Court held that the Social Security Actwhich curtailed said rights was not unconstitutional in that there wasno arbitrary classification lacking in rational justification that wouldrender the statute invalid.
The Court concluded that there was obvious relevance to the pur-pose of the act from the fact that the Plaintiffs held residence abroad,was a deportee and presumably a foreign resident. In this regard, theCourt stated:
"One benefit which may be thought to accrue to the economyfrom the Social Security system is the increased over-all nationalpurchasing power resulting from taxation, of productive ele-ments of the economy to provide payments of the retired anddisabled who might otherwise be destitute or nearly so, andwho would generally spend a comparatively large percentageof their benefit payments. This advantage would be lost as topayments made to one residing abroad." 363 U.S. at 618
Further, the Court found that it was irrational for the Congressto conclude that the public purse of the United States would not beutilized to contribute, support to those deported or residing in anothercountry.
Applying Flemming v. Nestor to Title I, we arc confronted withan entirely different situation. The children living and attendingschool in Kentucky and other poor states are very much a part of theUnited States, its economy, and its future. The purse of our country,today as well as tomorrow, depends upon the education these childrenreceive and to deny them equal educational benefits would undoubt-edly have a profound detrimental effect on their private lives as wellas on the welfare of the country as a whole.

Coustitutionaiily of Title 1, ESEA 121
II. The Funding Formula for Title I is Subject to the DueProcess Clause.
(a) INTRonucTioN.In Shapiro v. Thompson. 94 U.S. 618 (1969), the Court struck
down a one year residency requirement imposed by a state uponwelfare applicants as a condition for obtaining benefits. One of theprincipal arguments advanced by the state Was that: "It had a validinterest in preserving the physical integrity of its programs." 394 U.S.at page 633. The Court responded as follows:
"But a state may not accomplish such a purpose by invidiousdistinctions between classes of its citizens. It could not for ex-ample reduce expenditures- for education by barring indigentchildren from its schools." supra (emphasis added)
Thereafter, the Court in Shapiro rejected the rational relation-ship argument advanced by the state which allegedly connected thewaiting period and the states objectives. The Court held that bymoving into a new state, or the District of Columbia, an individualwas "exercising a constitutional right and any classification whichserves to penalize the exercise of that right, unless shown to be nec-essary to promote a compelling governmental interest is unconstitu-tional," supra at page 634.
The Court in Shapiro cwicluded the Opinion:"The waiting period requirement in the District of ColumbiaCode . . . is also unconstitutional even though it was adoptedby Congress as an exercise of federal power. In terms of federalpower the discrimination created by the one-year' requirementviolates the Due Process Clause of the Fifth Amendment."[W)hile the Fifth Amendment contains no equal protectionclause, it does forbid discrimination that is so unjustifiable asto be violative of due process." Schneider v. Rusk, 377 'U.S. 163,168 (1964); Bolling v. Sharpe, 347 U.S. 497 (1954)."
In Flemming v. Adams, 377 F. 2d 975 (1967) the Court stated atpage 977:
"The U.S. Constitution does not secure to the appellant theright to an education; rather the Constitution secures the ap-pellant's right to equal treatment where the state has under-taken to provide public education to the person within itsboundary.
If the Congress has undertaken to provide funds for public education, it has the duty to do so in a manner consistent with due process of the laws under the Fifth Amendment in order to afford thesame protection to the targeted school children under Title I regard.less of their state's wealth.
4 ortril

122 School Finance in Transition
III. The Culturally Deprived Child's Education is Based onWealth Under the Title I Formula.
Citing Harper v. Virginia State lid. of Elections., 383 U.S. 663(1966), the Serrano opinion at page 1250 stated that lately "the Su-preme Court has demonstrated a marked antipathy towards legislativeclassifications which discriminate on tile basis of certain 'suspect per-sonal characteristics.' " In Harper the high court stated that "lnrsdrawn on the basis of wealth or property like those of race (citationsomitted) are traditionally disfavored." 383 U.S. at 668,
Harper added:
"To introduce wealth or payment of a fee as a measure of avoter's ,ualification is to introduce a capricious or irrelevantfactor." supra.
Harper also stated that once wealth is determined to be a classi-fication it becomes suspect "and thereby demands a more exactingjudicial scrutiny." 383 U.S. at 668.
Although the Supreme Court has given special attention to casesinvolving race and wealth, this does not mean that the particularclassification was stricken. It is the effect that the classification hason the interest which has determined the Court's treatment. For in-stance, to classify by wealth for purposes of voting is unconstitutional.Harper v. Virginia Bd. of Elections, 383 U.S. 663 (1966). But the Courtheld that to classify by wealth for purposes of progressive taxationis constitutional. Similarly, to classify by race for purposes of marriageis unconstitutional, Loving v. Virginia, 385 U.S. 1 (1967); but to doso for school integration purposes may be valid.
Professor Bernard Schwartz in his Constitutional Law, A Text-book, (1972) discurted unreasonable classifications stating:
"The most important traits coming within the concept of in-herently unreasonable classifications arc connected with the}.goad notion of human equality. Whatever else that notionmay mean, it includes denial that differences in race or creed,wealth or status, or sex are legally significant. These differencesate all constitutionally irrelevantmere accidents of birth orcondition, which fade into insignificance in the face of ourco.mmou humanity. To such difference, the law must remainblind, not distinguishing the basis of who a person is orwhat he is, or what he possesses.From this point of view, the first justice Harlan made his cele-brated assertation that 'our constitution is color-blind.'senting in Messy v. Ferguson, 163 U.S. 537. 559 (1896)). Butthat same constitution Is also creed-blind, wealth-blind, status-blind, and sex-blind. The law regards man as man and takesno account of those traits that are constitutional irrelevancies.Law, that classify on the basis of such traits must be repug-nant to equal protection." (emphasis added)

Constitutionality of Title 1, ESE4 123
At this point our inquiry must turn to the benefits which the vari-OM targeted groups of school c!iildren in their respective states receiveunder the Title. I formula that will justify unequal treatment of theadmitted disparity. These reasons may he perceived by Congress tojustify the classification by wealth as it did in Fleming v. Nestor, 363U.S. 603 (1960). The Court held therein that the plaintiff forfeitedhis old age benefits under the Social Security Act by joining the Com-munist Party and being deported as a result thereof.
But tinder Title I, what purpose is being served by the disparityin the formula? We assume that wealth is a criterion for drdon of more money to such states as New York, Illinois, ,t( Cali-fornia than to states such as Kentucky, West Virginia, and New Mex-ico. Is it just by chance that the latter three states are rural and agrar-ian in nature as compared to the former three states being moreurban? Or is it not a truism and common knowledge that revenuesraised by New York, California, and Illionis for school purposes aregreater because there is more per capita income in those states andthat there is more wealth to tax in those states and that, as a directresult thereof, there is a greater input into the educational systems ofthose states and that such inputs add greatly to the educational ad-vantages of their children as compared to the school children of Ken-tucky, 'Vest Virginia, and New Mexico? Because of all of the fore-going, the formula in Title 1 rewards the educationally deprivedchildren in the wealthier states (who have an average annual ex-penditure per child above the national average) with more dollarsthan the same targeted group of educationally deprived childrenin states which expend less than the national annual average perpupil expenditure such as Kentucky.
The constitutionality of Title I in Downs v. Marland is not beingfought on the question of need as it was in McInnis v. Shapiro, 293F.Supp. 327 (N.D.111. 1968) aff'd sub nom. However, it must be ap-parent that the Title 1 funding formula is really inverted andamounts to regressive legislation. For instead of assisting to a greaterextent the recipient school children in the state of Kentucky andother pomer states who enjoy less dollars for education from theirstate, the Title I money is distributed to recipients in New York, ad-mittedly in greater proportions. The need of the targeted school chil-dren in Kentucky is obviously more. Educational input as it affectseach of the school children in Kentucky is less. The formula admitsthis. The state of New York has greater input per school child andis able to.provide and afford greater educational benefits as a directresult of its wealth. And yet the need is greatest where the wealthis least.
There are many factors isolated by the opinions of the Courtswhich may be used in identifying unconstitutional classifications:
1. Whether the group whose interest is injured and so politicallydisadvantaged that It cannot adequately protect its own interest fromexcessive and unjust impairment, Railway Express Agency, Inc, v.New York, 336 U.S. 106, 112 (1949). Therein, Justice Jackson statedthat:

124 School Finance in Transition
"'Special care must be exercised when the minority is such thatit is unrealistic to rely upon 'the operation of those politicalprocesses ordinarily to he relied upon to protect minorities.' "
At least two federal courts have identified the poor as a minoritywhich is too defenseless to be able to enforce adequately its rights.Rothstein v. 303 F. Stipp. 339, 347 (S.D.11 Y 1969), vacatedand remanded, 398 U.S. 275 (1970); Hobson v. Hansen, 269 F.Supp.401, 508 (D.1).C. I96) a(ld sub nom. Smack v. Hobson, 408 F.2d 175(1).C. Sir. 1969).
2. Whether the very act of classification will deter the exerciseof constitutionally protected rights by denying satisfaction of anportant want to those who have recently exercised one of those rights;Shapiro v. Thompson. 394 11.S. 618 (1969). Our situation applies justas it did in the welfare residency requirement case.
3. Whether the classifying trait is one over which the affected in.dividual has no control; Levy v. Louisiana, 391 U.S. 68 (1968), Glonap. American Guarantee 1M Liability Ins. Co., 391 U.S. 73 (1968) Ohlegitimacy). Race also falls into the category of immutable traits.
4. Whether the classification may stigmatize a group discriminatedagainst, Brown v. Board of Education, 347 U.S 483 (1954),
And in Skinner v. Oklahoma, 316 U.S. 535 (1942) the.Court struckclown a law distinguishing larcenists from embezzlers for purposes ofmandatory sterilization, holding that there was no factual basis forsuch a distinction. Despite the fact that this classification was notsuspect it still was "invidious" as a standard for depriving some people of a fundamental interest because there was no factual link be-tween the classifying trait and the state's alledged objective.
(The foregoing analysis was taken from 84 Harv. 14. Rev. 1, 66.67 (1970)).
The first unconstitutional classification applies to Title I in thatthe poNtically disadvantaged group is composed of poor school chil-dren. The Title I formula refers to this grup as "educationally de-prived school children" and as this paper points out the school chil-dren have been the subject of special protection by the Court.
As concerns the second factor in identifying the suspect trait above,we raise the issue of whether or not education is a fundamental inter-est. But we do not consider the issue of fundamentality critical sincegovernment must treat persons standing h! the same relationship withgovernment equally. The Court must decide whether there is a denialof due process rights by failure to distribute equal funds to like classesof children based OH state wealth. It cannot be denied that specialprolgums paid for by Title 1 funds benefit recipient school childrenin the wealthier states to a higher degree than they do in the state ofKentucky or at least in those states whose annual average per studentexpenditure exceed! the national average.
Concerning the bird factor, the children in the poor states haveno control over the distribution of funds under Title 1. They rm.

Constitutionality of Title 1, ESEA 125
not help themselves as the plaintiffs could in Dandridge v. Williams,397 U.S. 471 (1970).
Finally. concerning the fourth factor used in identifying a suspecttrait, certainly language in Serrano v. Priest, 487 P.2d 1241, at page1259 (1971) applies:
"[lit has been suggested that 'a poor child assigned willie-nillieto an inferior state school takes on the complexion of a pris-oner, complete with a minimum sentence at 12 years.' " (citingCoons, Clune & Sugarman, 57 Cal. L. Rev. 305 at page 388)
The Title I formula under contest classifies children on the basisof wealth. Per pupil expenditures of the states are undeniably re-lated to the wealth of the states as indicated in the previous charts,Further evidence that high and low. expenditures are a function ofwealth can be shown by simply correlating state per pupil expendi-tures for all SO states against the states' per capita personal income.Rather conclusively, these data show a correlation of over .7 whichis significant at the .01 level. In other words, the possibility of thisrelationship happening by chance is less than one in a hundred. Tocategorize children in a targeted popul o ion according. to the expendi-tures of their state for education is to make the child's education afunction of the wealth of the sue. To provide funds proportionalto the state's fiscal inability is certainly a factor which is irrelevantto the education of an educationally deprived child. While it maybe rationally argued that a child from a poor state should be givenmore federal funds in order to equalize expenditures between poorand wealthy states, there is no constitutional justification for the fed-eral government to allocate less money to the children from poor, lowexpenditure states.
The unequal treatment of equals is therefore clearly present inthe Downs case. The children arc identified by Title I criteria as beingeducationally deprived from low-income families. The criterion (chil-dren ages five to seventeen from families with incomes of $3,000 orless) for identifying these children is uniform among all states, as es-tablished by Congress itself. However, once the children needing thisspecial educational assistance are identified, the Title I formula pro'ceeds to treat the children within the class differently. Those educa-tionally deprived children from wealthy states are given more moneythan those from poor states,
The Formula in Review, The uniqueness of the case at bar is thatthe Congress, through the Title I formula, specifically circumscribesa specific class of children to be the recipients of federal aid and thenit without reason or rationale discriminates within the class. This initself is sufficient to hold the act unconstitutional if the time honoredstandard of equal protection, "equal treatment of equals," is followed,whether the court subscribes to either the "compelling interest" orthe "rational relation" standard. The discrimination is certainly invidious when one considers that the government does not just treat
P., icet'.

126 School Finance in Transition
the children unequally. but there is a pattern to its inequality, it pro-vides the rich more and the poor less.
IV. The Protection of a Discrete Class of School Children,Should Receive the Court's Special Solicitude.
Coons, Chine & Sugarman. 57 Cal. L. Rev. 305, 389-391, state thatthere is a case for treating children as people in a victimized class. InBrent v. Massachusetts, 321 U.S. 158, 165 (1944), the Court stated: "Itis the interest of youth itself, and of the whole community that chil-dren be both safeguarded from abuses and given opportunities forgrowth into free and independent well-developed men and citizens."
Under Title 1, we are not only dealing with children but a targetedgroup of "educationally deprived children"poor children. And theargument in favor of the children as a special handicapped class takeson greater moment when considering that, within that class, specialfunds are distributed to them based on state wealth.
This problem was considered in 82 Harv. L. Rev. 1065, 1124 (1969)"Developments in the LawEqual Protection (a) Suspect Classifica-tions":
"Consequently, when politically disadvantaged minorities arcaffected, the legislative judgment should be more critically re-garde(' for such disadvantaged groups yield less influence inlegislative councils than their proportion in the populationwould seem to warrant."
The footnote to the above quotation is also noteworthy:
"That minorities might be unable to find protection in the po-litical process and that therefore the Court might appropriatelyregard their interest with special solicitude was in fact sug-gested by Mr. Justice Stone in his famous footnote to theUnited States v. Carolene Prod. Co. 304 U.S. 144, 153 n. 4(1938): '(P]rejudice against discrete and insular minorities maybe a special condition which tends seriously to curtail the op-eration of those political tirocesses ordinarily to be relied uponto protect minorities, att. which may call for a correspond-ingly more searching judicial inquiry.' See Hobson v. Hansen,269 F. Stipp. 401, 507.08 n 198 (l).D.C. 1967), aff'd. sub. nom.Smut* v.-Hobson, No. 21, 167 (D.C. Cir. Jan. 21, 1969). In thissense, those whose political strength has been diluted either bylack of home rule as in Hobson or by malapportionment maybe seen as members of a disadvantaged minority. With regardto the proper scope of judicial review, Eugene Rostow has re-marked: 'The freedom of the legislatures to act within widelimits of constitutional construction is the wise rule of judicialpolicy only if the processes through which they act are reason-ably democratic.' Rostow, The Democratic Character of Judi-cial Review, 66 Harv. L. Rev. 193, 202 (1952)."
r..r r
3-L

Constitutionality of Title 1, ESE,. 127
The above article added that race and lineage are such basic char-acteristics "over which an individual has no control and for whichhe should receive neither blame nor reward," supra at page 1127. How-ever, Plaintiffs in Downs contend that there should be added to thesecharacteristics the targeted group of school children identified by anAct of Congress. These individuals likewise have no control over themanner in which the Title 1 monies are distributed and they shouldnot be blamed or disparaged by the Title I formula with respect tothe amounts allotted the targeted group living in Kentucky whencompared to those same targeted children living in New York.
V. The Due Process Clause of the Fifth Amendment Appliesto Invalidate the Title I Formula.
Despite the fact that the due process and equal protection clausesare not always interchangeable as indicated in Bolling v. Sharpe. 847
U.S. 499 (1954), the present situation warrants invocation of sub-stantive due process.
As it applies to the Title 1 formula the critical language in Bollingv. Sharpe is as follows:
"In view of our decision that the Constitution prohibits thestates from maintaining racially segregated public schools, itwould be unthinkable that that same Constitution would impose a lesser duty on the federal government." supra.
The government would contend that because the equal protectionand due process clauses are not always interchangeable phrases (keep-ing in mind that the equal protection clause is explicit and that thedue process clause is implicit, states Bolling v. Sharpe), that the hold-ing in Bolling does not require that all federal laws adopted for le-gitimate social purposes be subject to as strict an equal protectionanalysis as state legislation under the Fourteenth Amendment. Butthe government cannot show that legitimate social purpose is servedin Title I by classifying educationally deprived children according towealth.
Because of Bolling v. Sharpe, 347 U.S. 497 (1954) and Shapiro v.
Thompson, 394 U.S. 618 (1969). each of which cases fell on the heelsof similar cases from state jurisdictions under the Fourteenth Amend-ment, the government could contend that, unless the case is a com-panion case in a similar state situation, the due process clause cannotpossibly apply to the invidious discrimination fostered by the Title Iformula. This theory is, on its face, void of any legal merit. No casescan be cited to support it and one could easily have stated that, sinceBolling v. Sharpe and Shapiro v. Thompson were decided in the 50'sand 60's, the law should not be otherwise in the 70's and 80's.
There are numerous cases outside the District of Columbia inwhich the Courts have applied the Due Process Clause. To such casesthe Supreme Court has required that the state show a lack of anyother alternative to accomplish its legislative or regulatory goals. Cats-

128 School Finance in Transition
treaux v. Romney, 448 F.2d 731 (1971); Skinner v. Oklahoma, 31611.S. 535 (1942); Yick Wo v. Hopkins, 118 U.S. 356 (1886); Griffin v.Illinois, 351 U.S. 12 (1956) and Reynolds v. Sims, 377 U.S. 533 (1964).Certainly here the federal government has the %Try reasonable al-ternative of treating all the culturally deprived children equally byallocating each the same amount of money.
The government may further argue that the Fifth Amendment isnot applicable to the safeguarding against discrimination based onwealth and would state that the Plaintiff's' argument in Downs ignoresthe Court's assertion in Bolling v. Sharpe, 347 U.S. 497 (1954), thatthe guarantees under the Fifth and Fourteenth Amendment are notcoextensive.
But there are no cases to indicate that the Fifth Amendment guar-antee of due process does not protect the interest of education whendiscrimination is fostered on school children through an Act of Con-gress which refers to said children as "educationally deprived undera wealth classification."
It is true that the Equal Protection Clause in the FourteenthAmendment is more explicit than the Due Process Clause of the FifthAmendment. This simply means that what is protected by the equalprotection clause in the Fourteenth Amendment is not implied.
In Shapiro v. Thompson, 394 U.S. 618 (1969), the Supreme Courtapplied the Due Process Clause in holding a one-year waiting periodfor welfare assistance unconstitutional. Here the District of Columbiawaiting period I,' .1 been adopted by Congress as an exercise of fed-eral power. As to application of the Due Process Clause the Courtsaid;
"In terms of federal power, the discrimination created by theone-year requirement violates the Due Process Clause of theFifth Amendment. 'While the Fifth Amendment contains noequal protection clause, it does forbid discrimination that "un-justifiable as to be violative of due process" [Citations omit-ted. For the seasons we have stated in invalidating the Penn-sylvania and Connecticut provisions, the District of Columbiaprovision is also invalidthe Due Process Clause of the FifthAmendment prohibits Congress from denying public assistanceto pour persons otherwise eligible solely (xi the ground thatthey have not been residents of the District of Columbia forone year at the time their applications are filed." 394 U.S. at642.
While the situations die certainly not identical, the words of theSupreme Court in Shapiro bear striking application to the Title Iformula, The targeted children in states, at or below the nationalaverage, are denied equal Title I funds solely on the grounds thatthey reside in a poor state. The elements of poverty and residenceare present in both situations.
This argument was reinforced in Gautreaux v. Romney, 448 F.2d731 (1971). Here the United States Court of Appeals for the Seventh

Constitutionality of Title 1, ESE44 129
Circuit held that the Department of Housing and Urban Developmenthad knowingly acquiesced in Chicago Housing Authority's discrimitummy housing program. HUD violated the Fifth Amendment by itsapproval and funding of segregated CHA housing sites. AlthoughGautreaux involves racial segregation. it is nevertheless a clear ex.ample of the power of toe courts to invoke the Due Process Clauseto prevent discrimination by an agency of the federal government.
The discrimination in the Title 1 formula bears striking parallelwith the Hobson cases, 2 F.Supp. 101, affirmed, sub nom. Smack v.Hobson, 132 U.S. App. D.C. 372, 408 F.2d 175 (1965) en bane: Hob.son v. Hansen, 327 F'.Supp. 844 (1971), emanating from the Districtof Columbia. In both situations the court invoked the Due ProcessClause of the Fifth Amendment to hold racial and economic discrimination in the District of Columbia public schools unconstitutional.The first Hobson case in 1967 did not require equal expendituresamong the schools of Washington, D.C., but assumed the other porlions of its decree requiring desegregation and proscribing trackingof students would have the secondary effect of equalizing the overallresource allocation among the District's public schools. The financialequalization of expenditures did not, however, come about automati-cally. In 1970. the plaintiffs in Hobson 11, 327 F.Supp. 844, (1971)requested a specific remedy to alleviate the disparity in per pupil expenditures which continued to exist. The court found a pattern ofhigher expenditures per pupil among the schools in the more affluentsections of the District. In arriving at this finding the court merelyanalyzed the expenditure patterns, in much the same pattern as underTitle 1, and concluded that:
". . . these figures make out a compelling prima facie case thatthe District of Columbia school system operates discrimina-torily along racial and socioeconutnic lines (emphasis added)
The words "socio.economic" are emphasized because of their obvi.ous applicability to the children discriminated against under Title 1.In the District of Columbia the schools in the wealthier areas of thecity had both higher expenditures per pupil and also higher achievement test scores, Hobson v. Hansen, supra, p. 858. The Court in Hob.son not only invoked due process of the Fifth Amendment to hold theDistrict's financing stem unconstitntional, but it further proposed aremedy which mandated that the school board not deviate more thanfive percent front the mean per pupil expenditures for teachers' sala.ries and benefits. The situation in the District of Columbia is to agreat extent a microcosm of the nation as viewed in Downs v. Mar.(and. It should lie again pointed out that the high expenditure andwealthy states of the North and West are also the high achievementstates, indicating a nationwide pattern of affluence, hip expenditures,and superior knowledge which is reinforced and increased by theTitle I formula. herefoe, there is substantial reason to invoke the"Due Process Clause- of the Fifth Amendment to correct this graveand invidious discrimination,
130

130 School Finance in Transition
THE GOVERNMENT'S RATIONALE FOR TREATINGEDUCATIONALLY DEPRIVED CHILDREN UNEQUALLY
In Downs v. Marlaiul, the government advanced three basic rea-sons in attempting to constitutionally justify the Title 1 formula.
The first and foremost argument is that "it costs more to providethe same attention to the deprived child in a high cost of living statethan it does in a low cost of living state." This is the same argumentadvanced by many wealthy school districts, when faced with the ne-cessity to defend their educational affluence. Even though one mightperceive this to be true in the district, there is simply no evidenceto indicate that the poor state with low expenditures has as good aneducational program as a rich state with high expenditures. In McIn-nis v. Shapiro, 293 F.Supp. 327, 331 (1968), the federal district courtcommented that: "Presumably, students receiving a $1,000 educationare better educated than those acquiring a ,4;600 schooling."
Certainly, it would be foolhardy to maintain that less moneywould result in better education. Only last year, an Associate UnitedStates Commissioner of Education in a speech before the Great CitiesSchool Council effectively denied the government's contention thatricher states should receive more because they have an alledged highercost of living. He said:
"Wide variations in school expenditures exist within andamong states. These variations often result from the differencesin financial resources available to different communities . . . .
Although research has not demonstrated the precise relation-ship between the amount of money a community spends oneducation and the quality of its schools, it is assumed that largerexpenditures generally eoduce better education." (emphasisadded) Duane J. Nlatthefs, The Emergency in School Finance,Council of Great City Schools, March 15, 1972, Washington,1).C., p. 4.
The Associate Commissioner's refutation of government's cost ofrising argument is echoed by a federal district court in Hargrave v.Kirk. 313 F. Supp. 944 (1970); vacated and remanded on othergrounds sub. nom; Askew v. Hargrave, 401 U.S. 476 91 S.Ct. 856 (1971),the Court said:
"It may be that in the abstract the difference in dollars avail-able does not necessarily produce a difference in the quality ofeducation. But this abstract statement must give way to proofto the contrary."
With most of the poorer low expenditure states in the South, andthe wealthier, high expenditure states in the North and far West, itwould be logical to assume that if the government's argument is true,that the educational systems of these areas of the country would be
131

Constitutionality of Title 1, ESE! 131
equal in quality and product regardless of expenditure. In otherwords, the difference in the expenditures lies in the high cost of Hy-ing rather than in superior educational programs. This assertion iscontradicted by data from the famous Coleman (James S. Cole-man, et al., Equality of Educational Opportunity, U.S. GovernmentPrinting Office, Washington, 1966, pp. 219.220) report. Regard-ing the pupil achievement in the North. West and South. the studysaid:
"The regional variation is rather consistent for both Negroesand whites. Consistently lowest for both groups is the nonmetro-politan South. Consistently highest is the metropolitan North.In general, both whites and Negroes show higher achievementin the North and West than in the South and Southwest, andhigher achievement in metropolitan areas than outside metro-politan areas.""The regional variation is much greater for Negroes than forwhites. The achievement disadvantage suffered by whites as aresult of living in the rural South compared to the urban Northis three or tour points in the standard scores, or about 15 per-centile points in the distribution of white scores. The achieve-ment disadvantage by 12th grade Negroes as a result of livingin the rural South compared to the urban North is seven oreight points in the standard scores, or about 30 percentilepoints in the distribution of Negro scores."
This study suggests that wealthier, high expenditure, northernstates are also the states with better education programs and products.
The Bureau of Labor Statistics of the U.S. Department of Laborhas no data to support the cost of living argument by the government(See: The Consumer Price Index, A Short Description, 1971, U.S. De-partment of Labor, Bureau of Labor Statistics). The Bureau producesno Consumer Price Index for any state. About the only data whichare available are between and among metropolitan areas. Coleman'sdata however, would indicate that it is metropolitan areas whichhave the highest pupil achievement. (John E. Coons, William 14.Clune, III and Stephen D. Sugarman, Educational Opportunity: AWorkable Cons!itutional Test for State Financial Structures, Vol. 57Calif. L. Rev. 305, April, 1969, p. 310. See also: Bowles and Levin,The Determinants of Scholastic AchievementAn appraisal of SomeRecent Evidence, 3 J. Human Resources, (1968] have commented:"Thus far, no one has come near demonstrating the actual cost-benefitrelation of educational expenditures."
The data today just Jo not support the cost of living interest ad-vanced by the government to justify providing more funds to wealthy,high expenditure states. All evidence, in fact, is to the contrary, wherewe find high expenditur.i, we also find better education and superioreducational products. From the evidence, or lack of it, no one can
A 4", fl

132 School Finance in Transition
rationally assume that more dollars do not buy a better educationor that less dollars buy au equivalent education.
The second argument advanced by the government is that theTitle I formula operates as an incentive for states to appropriatemore state and local resources to public education. This assertioncould be true except for two obvious facts to the contrary, the firstof which is the formula itself. Under the formida a ::fate can nowreduce its expenditure to nothing and it will still get the nationalaverage. Incentive is, therefore, obviously not a rational defense be-cause the formula itself contradicts this purpose. If incentive were thejustification, the formula would only be an incentive for those wealthystates already above the national average. As for the poor states, itis not reasonable for the Congress to assume or by formula attemptto force the states of Kentucky or Mississippi to put forth nearly twicethe fiscal effort of the wealthy states to raise equivalent expendituresper pupil. To place such an imposition on the poor state is not fairto the school child or the taxpayer.
The second reason that we can safely assume that the basic Title Iformula was not intended to be an incentive grant is that the Con-gress, in fact, enacted a separate provision in the Title I law to pro-mote incentive. This portion of the Act was Part BSpecial Incen-tive Grants, 20 U.S.C. 241d. If the Congress intended the basic grantto he an incentive grant, why did it feel it necessary to provide an-other separate, unrelated formula to encourage state incentive? tinderthis provision. which is strictly designed to encourage tax effort, thefiscal ability of the state is taken into account. This is accomplishedby establishing an effort index not only from expenditures, but alsothe personal income of the state. This formula effectively holds wealthconstant and rewards the state's true tax effort for education. It doesnot simply give the rich states more because they spend more as doesthe basic Title I grant provision which is under contest here.
Wealthy states in many instances, have low fiscal effort for educa-tion, but have comparatively high expenditures. In fact, nationwide,there is a tendency for the poorer states to put forth greater effort foreducation than the wealthy states (Kern Alexander and K. ForbisJordan, Constitutional Reform of School Finance, Lexington Books.Lexington, Massachusetts, 1979, p. 89. See also: Serrano v. Priest, 96Cal. Rptr. (101, 487 P.2d 1241, 1252 [1971j). To simply give moremoney per child to the high expenditure states does not encourageeffort, it simply gives more money to the wealthy than to the poor.
The government further contends in Downs that the formula, asnow derived, is "a pragmatic one from the Federal Government'spoint of view." At the outset, it should be observed that pragmatismitself is not necessarily reasonable nor rational. It is undoubtedly truethat school segregation, Brown v. Board of Education of Topeka, andnonreappoctionment, Baker v. Carr, were politically pragmatic butcertainly not constitutional. Be that as it may, the government in de-veloping the "pragmatism" argument poses the hypothetical that "If,for example, the Title I grants were awarded on an increasing basisas the level of state expenditures decreased, the most economic and
e)
Constitutionality of Title 1, ESE4 133
efficient state results would be reached by providing as little as pos-sible for education, shifting the burden to the Federal Govermnent."
This example completely misses the mark; the situation drawnand the conclusion reached are unrelated to the constitutionality ofthe issues raised. For instance, the plaintiffs in Downs v. Mar landhave never contended to assert a right to more money because theyattend school in a low expenditure state. It is clear from the purposeof the Title 1 torniula that it was not intended to relieve state andlocal taxes, and the plaintiffs in Downs v. Marla;id would certainlyanTee that the Title I formula should not be used to this end. Theydo not ask that educationally deprived children in poor, low expendi-ture states he given more money than their counterparts in wealthy,high expenditure states; they simply plea that educationally deprivedchildren be treated equally. regardless of where they live or the eco-nomic condition of their state. The Downs children, as equals, seekonly to be treated equally.
WO' l'N 'E
I. As out-migration of educationally deprived children has occurred, some stateshave faced the possibility of having an ti%ecall reduction in total Title I resources.In 1967 a "floor" provision was placed in the Title l law which guaranteed allstates would receive at least as much as they received in the base year of 1967until appropriations reached the $1.5 billion level. Section 144, Public Law 89-10.
In addition, in 1967, a temporary one-year amendment was attached to the ap-propriation bill, not to the body of Title t formula, which, also, guaranteed that"No state shall receive less than the amount expanded during the previous year."(Public Law 89.697.)
The provision providing a base allocation of at least the 1967 amount wassoon out of date and the states with out-migration were unable to change thebasic Title I formula. so each year they fought to amend the appropriation billwith the "fail safe" clause. In 1968, the provision was attached which provided"No state shall receive less than received the previous year." (Public Law 90.132.)In 1969 another temporary "floor" was attached to the appropriations bill, thistime providing that "No state shall receive less than 92 percent of the money re-ceived the previous year." (Public Law 90-557.) In 1970 the language was the sameas the 1968 provision. (Public Law 91.204.) In 1971 the amendment guaranteedno state would receive less than in 1968. (Public Law 91-380.) In 1972 a similarattempt to amend the appropriat4ms bill was made but was challenged on thenow on a point-of-order, (Public Law 92-480.) Following this the guarantee wassalvatted by a supplemental appropriation in Public Law 92.148. There are no"floor" provisions in the law for 1973 other than the original Section 144. PublicLaw 89-10 provision in the basic Title I law which guaranteed a 1907 minimumlevel of funding for each state.
n

Recent Court Decisions and SchoolCapital Outlay
WILLIAM R. W1LKERSON AND W. MONFoRT BARR
School of Education, Indiana University, Bloomington. Indiana.
"lf we think there are inequities in state systems for fundingcurrent expenditures of public schools, wait until we examinethe way we finance school buildings!" Governor Calvin Ramp-ton, address to Utah Conference on School Finance, April, 1972.
Governor Rampton spoke with full knowledge that in half of thestates in the nation funds available for school buildings and debtservice were a function of the wealth of a child's parents and neigh-bors. Governor Rampton also indicated awareness that school facili-ties affect the quality of a child's education.
Literally hundreds of decisions in courts of record chart the guide-lines regarding the issuance of bonds for school building purposes andthe acquisition of school property. Many of these decisions reflect theconventional wisdom of the nineteenth century. During the last halfcentury a number of decisions have centered around Jchool construc-tion by state or local school building authorities, leasing of facilities,and lease purchase. Our interest today, however, is not in these deci-sions. Rather it is in the broad area of state and local funding ofpublic schools. with particular attention to the implications for capi-tal outlay financing of recent "landmark" court decisions in Califor-nia, Minnesota, Texas, New Jersey and other states. Alexander andJordan have referred to these as second generation decisions. The cen-tral theme of these decisions is that the quality of a child's educationcannot constitutionally be contingent upon the wealth of the localschool districil
Shannon has referred to these decisions as the "Western Tide" of131
.n._Jtj

116 School Finance in Transition
public school financing reforni.2 While none of these decisions hasbecome the "law of the land" as yet, the "Serrano theory" of schoolfinance first clearly expressed in the California case of Serrano v. Priesthas palmated recent decisions.
One charateristic of the recent "landmark" court. decisions andother cases awaiting decisions is their preoccupation with current op-crating costs ;mil their virtual exclusion of consideration of the costsof other programs and the whole gamut of costs of school services.
Vise calls attention to some of the exclusions which characterizefinancial data presented in recent court decisions. Current expensesfor the operation of the instructional program exclude such items aspupil transpirtation, school lunches, debt service, capital outlay, andlease rental payments. I During 1971.72 capital outlay and intereston school debt in the nation's public schools exceeded $13 billion, asizable exclusion which can not long be ignored.
All states except Hawaii have consistently violated the basic con-cept that the costs of all public school prop ams and services are anintegral part of our state and local public school finance systems. Theconcept has been equally violated in the recent landmark court de-cisions.
Rossmiller has pointed out that there can be little doubt that thequality of buildings and equipment available to support a child'seducation affects the quality of educational opportunity offered tothe child.4
Another series of court decisions has implications for state andlocal funding. The desegregation cases, particularly the Richmond,Virginia, decision which ;las been appealed to the United States Su-preme Court. have implications for state and local systems of publicschool financing of school facilities, debt service, and busing. The prec-edent shattering decision of Federal District Judge Robert H. Mei%
hige, Jr., ordered the merger of the school systems of Richmond, Vir-ginia, and two neighboring counties. An attorney for the defense re-garded the decision as of major importance, since it offered a way ofequalizing funds between cities and suburbs!.
The recent action of the United States Supreme Court in over-turning the Rodriguez (Sail Antonio, Texas) decision may at firstglance appear to classify the second generation court decisions as moot.This is not necessarily true. The inequities which these decisions at-tacked still remain. State and local finance policy may not be uncon-stitutional, but it remains inequitable and immoral. Presumably re-lict must be sought by legislative action and not through judicialreview.
Let us now turn our attention to a summary of the inequities offinancing capital outlay and debt service and among the states.This will be followed by applitation of the theory developed in recentcourt decisions to the state and local funding of school facilities andequipment and related debt service and/or lease-rental obligations.
Table 1 shows that only 25 of the 50 states were allocating statefunds to local districts for either construction or debt service. Onlythree states were sharing per pupil costs for capital outlay at the 50
ribi,,.1
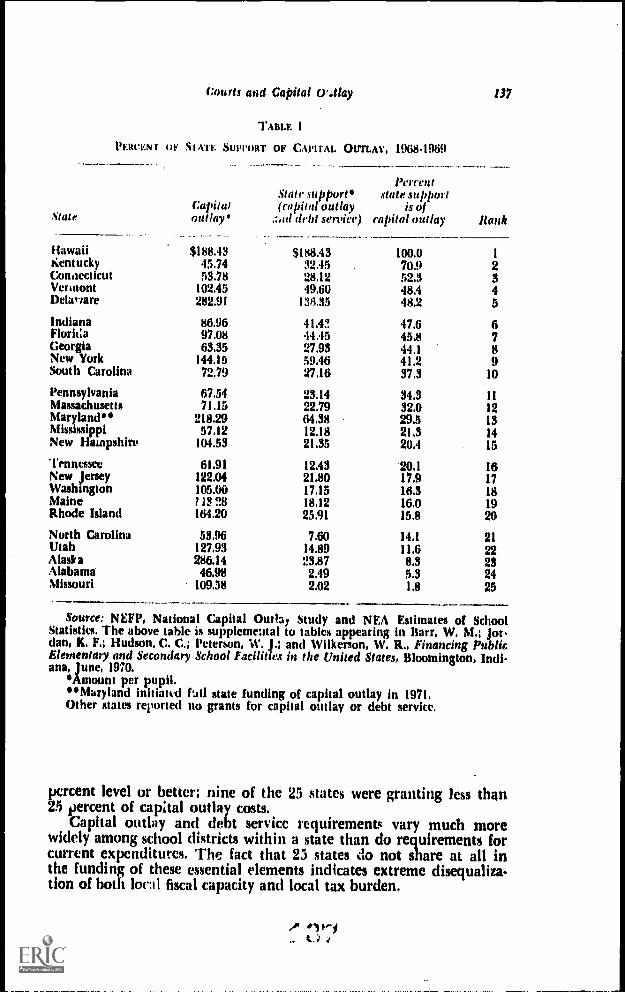
Courts and Capital a:tlay 137
TABLE I
PERCEN 1. (ii! S I ATV SUPPORT OF CAPITAL OtrrLAY, 1968.1969
SlateCapitaloutlay
Perrelifstate support
is ofcapital outlay
-^
Rank
---_-__Shit f' SUPPOrf(capital outlay
debt service)
Hawaii $188.43 $188.43 100.0 1
gentucky 45.74 32.45 70.9 2Condecticut 53.78 28.12 52.3 3Vermont 102.45 49.60 48.4 4Delatare 282.91 1;18.35 48.2 5
Indiana 86.96 41.42 47.6 6Florit:a 97.08 44,45 45.8 7Georgia 63.35 27.93 44.1 8New York 144.15 59.46 41.2 9South Carolina 72.79 27.16 37.3 10
Pennsylvania 67.54 23.14 34.3 11Massachusetts 71.15 22.79 32.0 12Maryland" 218.29 64.38 29.5 13Mississippi 57.12 12.18 21.3 14New Hampshire 104.53 21.35 20.4 15
'Tennessee 61.91 12.43 20.1 16New Jersey 122.04 21.80 17.9 17Washington 105.00 17.15 16.3 18Maine 113 9.8 18.12 16.0 19Rhode Island 164.20 25.91 15.8 20
North Carolina 53.96 7.60 14.! 21Utah 127.93 14.89 11.6 22Alaska 286.14 23.87 8.3 23Alabama 46.98 2.49 5.3 24Missouri 109.58 2.02 1.8 25
Source: NEFP, National Capital Outlay Study and NEA Estimates of SchoolStatistics. The above table is supplemeutal to tables appearing in Barr, W. M.; Jot,dan, K. F.; Hudson, C. C.; Peterson, W. J.; and Wilkerson, W. R., Financing PublicElementary and Secondary School Facilities in the United States, Bloomington, Indi-ana, June, 1970.
Amount per pupil."Maryland initiaml full state funding of capital outlay in 1971.Other states reported no grants for capital outlay or debt service.
percent level or better; nine of the 25 states were granting less than25 percent of capital outlay costs.
Capital outlay and debt service requirements vary much morewidely among school districts within a state than do requirements forcurrent expenditures. The fact that 25 states do not share at all inthe funding of these essential elements indicates extreme disequaliza-don of both lord fiscal capacity and local tax burden.
,01 #.1E.J 4

138 School Finance in Transition
ANALYSIS OF REPRESENTATIVEEXISTING STATE PROGRAMS
State programs for financing school 'construction or debt servicecan be generally categorized as follows:
1. Total state support.2. Construction grants based upon a fixed or variable percentage
of approved project cost.3. Construction or debt service grams which are closely related to
or part of, a foundation program.4. Flat or variable grants ior debt service.5. State loan programs.6. No state participation.
Total state funding programs, such as those now existing in Ha-waii and Maryland, probably can satisfy all of the requirements offiscal neutrality if local debt service is also assumed by the state. Letus examine data from selected states which use differing methods forfunding school buildings.
Delaware. Delaware's program for financing school constructionwas analyzed recently in an NEFP study.6 Delaware has, for severalyears, granted 60 percent of approved project costs to local districts,v.:0. the local snare obtained from bond issues. Even with relativelyheavy state support, the following key findings point out that equali-zation was not attained.
1. While the typical Delaware school district had sufficient localdebt leeway to permit construction of needed buildings, leeway wasnot uniform and some poorer districts could not raise the requiredlocal share because of the debt limitation of ten percent of assessedvaluation. With average per pupil debt leeway for all districts valuedat 100, leeway range, expressed as an index number, ranged from a lowof 12 to a high of 206. Expressed in dollars, the range was $101 to$1,735 per pupil.
2. The range of debt service tax rates was from 60 to 4F 90 per$100 of full valuation,
3. As might be expected, rich districts typically had high bondeddebt per pupil, relatively low debt service tax rates, and high debtleeway. The reverse was generally true for poorer districts. Variationsin prior effort and in need for facilities were other significant determi-nants of a given district's standing with respect to debt, leeway, andtax rates.
Kentucky. The Kentucky program provides for allotment of $1,$00per classi oom unit as part of the foundatio Program. Local districtsmay use these funds for construction or debt ser.ice, and in certaincases, for current operation purposes. Local districts may also estab-lish a special voted building levy, and may allocate current operationfunds fur construction.
13

Courts and Capital Outlay 139
Two recent studies of the Kentucky program provided the follow-ing findings:7. "
1. There is wide disparity among districts in terms of bonding andtax leeway and in terms of local effort.
2. Some districts, particularly those with rapid increases ,n enroll-ment, have little means to finance needed projects even with heavylocal effort.
3. Other districts have little need for new construction and receivemore money from the state than is needed for construction or debtservice.
4. Capital outlay funds are frequently transferred to the generalfund, primarily by districts who did not have immediate buildingneeds.
5. The state was assuming nearly 80 percent of the costs of cur-rent operation but less than 40 percent of the costs of school construc-tion and debt service in 1970-71.
6. The bonded debt per pupil ranged from 0 to $1,958. Debt lee-way ranged from $66 to $1.384 per pupil.
7. Local willingness to incur debt or to establish special votedbuilding funds was instrumental in determining local capacity.
Indiana. Hat grants of S40 per pupil are allocated to each Indianaschool district, with proceeds to be used for debt service. Excess fundsnot needed for debt service may be used for current operation. Analy-sis of 1971.72 statistics for the ten wealthiest, ten poorest, and 20 dis-tricts with approximately average wealth revealed the following:
1. The median debt service tax rate for the ten wealthiest schooldistricts was zero, for average wealth districts was 420, and for thepoorest districts was $1.13 per 5100 of taxables.
2. The range of total tax rate for school building purposes for the40 selected districts was zero to $2.56 per $100, with poorer districtshaving higher rates. Debt per pupil ranged from zero to $2;690. Thedistrict with highest debt per pupil. one of the wealthy districts, hada total school building tax rate of only 770.
Hile,9 in his 1971 study, listed the following among major findingsin his analysis of the Indiana program.
1. Ninety-one districts (of 301) had debt service requirementswhich were less than the amount granted by the state. Approximately22 percent of the flat grant funds was used for current operation; In-dianapolis allocated more than $2 million of grant proceeds to op-eration.
2. Local tax effort for facilities ranged from zero to $3.36 per $100.Illinois and Iowa. Loud school districts in Illinois early virtually
the entire burden of school construction financing, since grants aremade only for special education facilities. Districts which have ex-hausted their bonding power can obtain loans from the state.
liattint" observed, after studying a sample of 134 Illinois districts,that median per pupil expenditure for debt service 1..as $42.14 witha range of zero to $223.21.

10 School Finance in Transition
Whiten studied school construction financing in Iowa, where localproperty taxation 1111111tilICti all hinds for capital outlay and debt serv-ice. Iowa, in addition to restricting percentage of debt in relation toassessed valuation, also limits the funding of debt service. Among hisfindings were:
I. Seventeen of the 453 school districts had no debt service. Thehighest per pupil expenditure was $154.39, while the median wasS50.47. All of the districts with no debt service had above averageassessed valuation and below average enrollment.
2. The wealthier school districts spent more per pupil for debtservice than did the less wealthy.
3. The tax rate necessary to fund the state average debt serviceper student ranged from 1.3 mills to 9.7 mills with the poorer districtsneeding to exert greater effort.
Summary. This admittedly cursory examination of data from se-lected states utilizing varying programs for financing school buildingsshows that none of the programs do very much toward achievingequalization of either local tax effort or ability to finance needed con-struction.
IMPLICATIONS OF THE SERRANOTHEORY FOR CAPITAL OUTLAY FUNDING
Funding .1 public school facilities clearly violates the principlethat the level of spending for a child's education may be a functiononly of the wealth of the state, not of the school district in which thatchild happens to residea principle which the United States SppremeCourt struck down in its recent decision. Possible exceptions exist inHawaii and in Maryland. None of the "landmark" court decisionshave been concerned with the state and local finance systems for fund-ing construction of facilities, debt service, or lease-rental payments.Plaintiffs' contentions were confined to consideration of funding cur-rent operating expenses of public schools.
California. Let us consider the Baldwin Park Unified School Dis-trict and the Gorman Elementary District in Los Angeles County,California. The local property tax base in 1968.1969 was $147,902per pupil in average daily attendance in Gorman District and was$3,706 in Baldwin Park, a ratio of 0 to 1. The basic state aid andequalization aid to California school districts is not available forcapital outlay and debt service funding. The state loan plan is avail-able to "poor" districts and could result in eventual forgiveness ofpart of the loan in districts such as Baldwin Park. However, there isno way that inequities in the quality of facilities as well a!, of programscan be avoided, using conventional California financing.
Texas. The seven San Antonio school districts, in Bexar County,Texas, showed! a 9 to 1 range in local assessed valuation per student.Texas has no state grant or loan program for school facilities. Con.sequently the 9 to 1 ratio in local wealth results in unmitigated in
.10

Courts and Capital Outlay. 141
equities. The range among all school districts in Texas was from$71,311 assessed valuation per pupil to $1,581, a range of 45.1 to 1.Since capital outlay and debt service are a function only of localwealth in Texas, the inequity in financing is readily apparent.
Even though the Rodriguez decision was not upheld, extensionof the theory to statelocal funding of facilities and attendant debtservice may he anticipated. What would be the probable effect?
1. Full state funding of capital outlay and debt service might berequired.
2. Alternative funding plans may be considered, ranging frompower equalizing through percentage equalizing to a federal surtax.
3. State bonding might supplant local bonding.4. Reorganization of local school districts will undoubtedly result.5. Local control of school construction decisions may be further
eroded.
Application of Serrano theory to the funding of school facilitiesor attendant indebtedness will necessarily encounter problems whichmay differ from those encountered in financing current operatingprograms. Rossmiller has pointed out some of the complications whichmay affect full state funding of school facilities.'? The measurementof need may include depreciation, approved project cost, or debtservice.
1. Need varies among districts.2. Need does not occur in regularly predictable patterns.3. Facilities are entirely locally financed in many states.4. Bond ratings vary among districts.5. Debt can smooth the tax burden.
Approximately 35 states have had some experience with stateparticipation in financing school construction through grants, loanplans, or authority financing. Other states have simply depended onlocal financing of public school facilities.
Per pupil expenditures for capital outlay in 1968.1969 ranged fromabout $45 per pupil in average daily attendance in Arkansas to aboutS286 in Alaska. The range within a state was from zero to severalhundred dollars per pupil. State support ranged from zero to ap-proximately 70 percent, excluding Hawaii. Local support ranged fromzero in Hawaii to 100 percent. These wide variations indicate thecomplexities of applying Serrano theory to funding public schoolconstruction. The appropriate relief seems to be full state fundingof public school capital outlay and debt service,
A FINANCE MODELSpecial Study No. 7 of the National Educational Finance Project
suggested eight models for financing capital outlay. Program No. 5 wasentitled State and/or Federal Assumption of School Building Costs."A possible adaptation of this model would be the inclusion of exist-ing debt hervicc as well as of construction costs.
111

142 School Finance in Transition
Suggested operating procedures of the above full state fundingmodel included:
1. The state wouli be authorized to fund the costs of approvedtwmtruction projects and of existing debt service.
2. Local school districts would develop and submit plans for theconstruction project to the state education agency for review and ap-proval.
3. Upon approval by the state. funds would be advanced by thestate to local districts for site purchase and architectural and engineer-ing fees.
4. Total project cost would he determined as a result of bids andcontracts.
5. The local school district would be responsible for the construc-tion program.
6. A schedule for disbursement of the grants would be drawn upby the state in accordance with the construction schedule.
7. The local district would be responsible for payments duringconstruction, final acceptance of the completed project, and final pay-ment upon completion, using granted funds.
Among the positive features of the full state funding model wouldbe:
1. Only needed projects at logical attendance centers would befunded.
2. Full state funding would meet the requirements of equitablefinancing.
3. Local school districts would retain the responsibility for plan-ning and operating the school facility.
4. Sulyttitution of state for local credit would reduce interest costs.
Among the negative features would be:
1. Local decisionmaking might be eroded.2. Local leeway for innovative features could be curtailed.3. The state budget would hear the impact of costs associated with
school facility construction.4. Prior local effort would not be rewarded unless debt service
was included in the program.5. Local decision-making without local fiscal responsibility might
he unwise public policy.
SOURCE OF FUNDS
If state funds are to be allocated, what are appropriate sources4)f funds?" Among those readily apparent are:
1. A state-wide property tax.2. State bond issuesgeneral obligation or revenue.3. Allocations from the general fund,4. Earnings on investment of state funds,
6.11..'11#1

Courts and Capital Outlay
5. Increased rates on existing state taxes.6. New state taxes.7. Federal funds.
143
RECENT COURT CASESIn a 1972 lower court case Jensen v. State of Indiana, unequal dis-
tribution of funds within a school district became an issue. The ratioof funds among Indianapolis high schools ranged from 2 to 1. Thesame situation occurred in Hawaii where "equal dollars-equal schol-ars" was not the rule.
Even with their emphasis on equity the recent court cases did notstipulate several principles. 1. The property tax was not outlawedfor school purposes. 2. Equal expenditures per pupil were not re-quired. 3. The relationship between quality of programs and expendi-ture pet pupil was asserted but not proved. 4. Full state funding wasnot required. 5. Total school expenditures were not taken into con-sideration.
Regardless of the disposition of the Rodriguez case, the currentcontroversy will eventually result in changes in existing state-localfunding of public schools. The concepts expressed by Coons, Clune,and Sugarman are provocative, and will have their influence in legis-lative halls as well as in the courts. (Our present systems of state-localfunding of courts may be constitutional but they are certainly in-equitable.) As researchers and leaders in school finance theory it isour obligation to strive for equalization of educational opportunityand for equitable funding in every -tate in the nation.
FOOTNOTES
I. Johns, Roe L.; Alexander, K.; and Jordan, Forbis, editors, Financing Educa.lionFiscal and Legal Alternatives, Charles E. Merrill Publishing Company, Co.lumbus, Ohio, 1972, Chapter 15.
2. Shannon. Thomas A., and Benson, Charles, Schools Without Property Taxes:Hope or Illusion, Phi Delta Kappa Educational Foundation, Bloomington, Indiana,1972.
3. Wise, Arthur E., Rich Schools, Poor Schools, University of Chicago, Chicago,1968, p. 122.
4. Rossmiller. Richard A., "Full State Funding of Education," in Six CrucialIssues in Education. National Association of State Boards of Education, The Assn.dation, Denver, Colorado, 1972.
5. Barr, W. Monfort, "Recent Court Decisions: Whither Education?," Theschool Administrator, Washington, D.C., April, 1972.
6. Wilkerson, W. K.. and Barr, W. M.. A Study of Financing School Constructionin Delaware, Center for Administrative Studies, School of Education, Indiana University, Bloomington. November, 1972.
7. Mataraszo. Salvatore, Financing Capital Outlay in Kentucky, National Educa.tional Finance Project Study, 197$.
8. Hehr, G. P.. An Analysis of Kentucky's Capital Outlay State Support Formula,unpublished doctoral dissertation, Indiana University, Bloomington, 1973.
9. Bile, Jetty L., A Study of the Indiana Flat Grant Program, unpublished (loc.total dissertation, Indiana University. Bloomington. 1971.
10. Haulm George L. The Development and Application of a State Plan of DebtService Aid for the Public Schools of Illinois, unpublished doctoral dissertation. In.(liana University, Bloomington, 1972.

144 School Finance in Transition
11. White, Louis P., A State did Program for Debt Service for Iowa PublicSchool Districts, unpublished doctoral dissertation, Indiana University, Blooming.ton, 1972.
12. Rossini ller, Ibid., pp. 12.13.13. Barr, W. M.; Jordan, K. F.; Hudson. C. C.; Peterson, W. J.: and Wilkerson.
W. R., Financing Public Elementary and Secondary Schools in the. United States.School of Education, Indiana University, Bloomington, Indiana, (97(1, Chapter 7.

The Maryland Experience: Full StateFunding of Capital Outlay
ALFORD R. "SKIP" CARLY, JR.
Executive Ditetor. Maryland Public School cunitucliou plogrum,
Any discussion of Maryland's program of full funding of publicschool construction can be fruitful only through a general under-standing of the totality of the State program; that is, how it developed,what it provides, how it differs from previous State-aid programs forconstruction, and how it is administered.
Prior to July I, 1967, State aid for assisting the Maryland localsub-divisions with schoolhousing consisted of the State paying $70pi.; new pupil in the system and $22 per continuing pupil to the ex-tf:nt that this amount exceeded the yield from a tax of 5 cents perhundred dollars of assessed valuation, obviously an inappropriateamount of aid for construction costs in the 1960's.
Beginning on July 1, 1967, the State of Maryland began to sharein the costs of school construction in a manner somewhat Imilar toits sharing in the current expense operations of public schools, but ata SO% level. The formula for this aid was relatively easy to use but
difficult to explain; nevertheless, I shall try a capsule summary.Each construction project was sired according to the number of
pupils it housed. The amount of the construction costs to he sharedby the State was then determined as the product of "pupils housed"and $1500 discounted by 20'';,. The $1500 was a 1967 estimate of thecost of providing educational space for one pupil. Again, this was aninappropriate amount for construction costs in the 1970's. Under thissharing plan, no local subdivision received less than 35% of the cal-culated amount per construction project, and some of the less wealthycounties received as much as 70% State aid. I think it is worthy to notethat the State of Maryland did not share at all in those costs of con-struction which exceeded S1500 per "pupil housed."
/45

146 School Finance in Transition
In addition to sharing in the costs of construction, the State alsoshared in 80% of the outstanding debt repayments of the local sub-divisions for construction projects underway prior to July 1, 1967,the date when the construction aid just described became effective.
The amount of State aid generated by the above formulas and dis-tributed to the local sub-divisions for Fiscal Year 1968 through FiscalYear 1971 was found to be inadequate and unrealistic in terms ofpresent-day construction costs. During 1970, a commission appointedby Governor Mandel, under the Chairmanship of Senator HarryHughes, studying the overall problem of financing education reachedthe conclusion at the end of their study that the State of Marylandcould not then afford to assume all of the costs of public education.The commission recouunended that as a first step in the movementtoward greater State aid consideration should be given to the fullfunding by the State of the construction programs of the local educa-tional agencies.
Such a program was recommended by Governor Marvin Mandelin his State of the State message of February 1, 1971; and during theGeneral Assembly, two acts were passed: (1) establishing the publicschool construction program, and .(2) authorizing the sale of Statebonds to the extent of 150 million dollars to finance the first 17months of the program. This legislation increased State aid from aprogram of sharing in 80% in the first $1500 per pupil of the costsof construction to a 100% share of all construction costs, as well as,100% of the costs of retiring outstanding bonded indebtedness exist-ing on July 1, 1967. With this assumption of costs, the local govern-ments would no longer need to sell local bonds for school construction.
The legislation establishing the State bond authorization of 150million dollars was a standard State bond bill, with the required pro-vision for a State real estate tax to guarantee retirement of the bonds.Historically, Maryland has been able to meet its annual obligationswithout use of this taxing authority. The legislation which establishedthe program is unique and is worthy of examination in some detail.
Most legislation establishing State-aid programs specifies the for-mula for distribution of the State aid and describes rather specificparameters for the program operation. However, the bill which es-tablished the Maryland Public School Construction Program gaveauthority and responsibility to the State Board of Public Works toestablish the rules and regulations which would determine the pa-rameters of the program. As in most states, the State Board of Edu-cation (under Public School Law) is charged with full responsibilityfor the administration and supervision of public schools includingconstruction. In effect, the new legislation said that the State Boardof Public Works rather than the State Board of Education would establish the rules and regulations for schoolhouse construction; andif there were any conflict with existing legislation, the action of theState Board of Public Works would prevail.
To implement Chapters 624 and 625 of the Acts of 1971, GovernorMandel appointed a committee of 15, chaired by Lieutenant GovernorBlair Lee, to recommend rules and regulations. The rules and regular
Al h r

Capital Outlay in Maryland 147
dons adopted by the Board of Public Works on June 29, 1971 were.substantially those recommended by Lieutenant Governor Lee's Com-mittee.
The rules were as follows:
1. Establish an interagency committee to administer the program,said committee consisting of the State Superintendent of Schools asChairman and the Secretaries of the Departments of General Servicesand State Planning,
2. Provide for an annual and a projected 5-year capital improve-ment program for each local subdivision,
3. Establish eligible expenditures as:
a) construction costs of instructional, administrative, and auxil-iary support buildings,b) purchase or lease of facilities, including transportable build-ings, when such is necessary to meet short-term needs,c) costs of renovation or remodeling of existing school buildingswhen deemed by the Interagency Committee to he other thanmere maintenance or repair,d) architectural and engineering fees to the extent of the StateFee Schedule.e) costs of capital equipment and furnishings necessary in elac-ing a building in operation (with the Interagency Committeeto determine those items eligible for purchasing from bondmonies),f) costs of on-site development,g) costs of physical education facilities with a 1A1 limitation ofState assistance for the construction of swimming pools,
4. Define as ineligible expenditures those operational costs of:a) program development or inspection of construction projects,b) purchase of site,c) off -site development,d) remodeling of stadiums, and lighting systems for outdoorathletic fields,e) fine art embellishment,f) exclusively noneducational use portions of building,
5. Assign responsibility to the Interagency Committee to reviewand approve site acquisition proposals, plans and specifications forprojects, contract awards (including change orders),
6. Provide for the right of appeal of commitee decisions to theState Board of Public Works,
7. Subject employment of architects to State approval,8. Provide for a monthly advance of funds based upon a prior
approved schedule of payments,9. Authorize the Department of General Services to contract with
the local educational agencies for assistance in carrying out a schoolcapital improvements project, and finally,
10. Provide for emergency funding when a school building islost from fire or other disaster.

118 School Finance in Transition
To describe how it functions in accordance with the Rules, Regu-lations and Procedures for the Administration of the Public SchoolConstruction Program in the State of Maryland, you must understandthe tripartite agency designated to administer the statewide schoolconstruction program known as the Interagency Committee on SchoolConstruction. The Secretaries of the Departments of Planning andGeneral Services and the State Superintendent of Schools are repre-sented by designees who act for them in the day to day operations ofthe agency under the direction and supervision of the Executive Di-rector who represents the State Board of Public Works. The Com-mittee meets on a monthly basis and passes on the recommendationsof the Executive Director and designees as to approvals of architects,sites, drawings, contracts and matters of policy.
Each fiscal year the local boards of education submit a capital im-provement program for their respective subdivision. These individualprograms are reviewed by the Committee staff and a statewide con-struction program is recommended to the State of Maryland Board ofPublic Works. After review and approval by the Board of PublicWorks, a bond bill is prepared for the State Legislature to act upon.The Legislature authorized bond bills of 150 million in 1971 and300 million for 1972 and at the present time a 220 million bond au-thorization bill for 1973 is pending before the Legislature. You cansee the magnitude of this program-670 million in three years with aprojection of almost a billion dollars for construction in five years.
The State of Maryland School Construction Program was designedto allow the greatest amount of initiative and control at the local levelin the development of school facilities. The local education agencyis responsible for the initiation of the project; the development ofeducational specification; the selection of sites and architects; thebidding and awarding of construction contracts. In the case of thearchitectural and construction agreements, the local educationalagency is the Owner. The local education agency retains title to thesite and the completed facility; the State agencythe InteragencyCommitteeis responsible for review and approval of all steps in theconstruction process of a facility.
The agency is staffed with 32 peoplemost of them professionalsarchitects, educational consultants and planners.
The responsibilities of the three agencies involved in the pro-gram, Education, State Planning and General Services are as follows:
1. The Education Section is primarily responsible for developmentof educational specifications, the architectural program and the con-cepts leading up to and including the schematic design of the project.Nluch of this development work is done in the field in conjunctionwith the local educational planning staff.
2. The Planning Section is primarily responsible for the develop-mein and up-dating of the master plans for education of each sub-division, the annual and five year capital improvement programs, theverification for the location and siting of schools and other demo-graphic data.
Capital Outlay in Maryland 149
3. The General Services Section is primarily responsible for thereview and approval of the design development and constructiondrawings, fire and building code requirements, contract reviews, andrecommendations for contract award approvals.
The responsibilities of the Executive Director include direction ofthe entire stall and operation of the Agency on a daily basis. He rep-resents the Committee at all Legislative hearings relating to schoolconstruction and is responsible for any administrative bills relatingto school construction such as the bond bills. He is directly responsi-ble to the Governor, the State Comptroller and the State Treasurer.
,44 41

Public Funds & Nonpublic Schools
BY EDD Donut
Educational relations director of Americans United for Separation of Churchand Slate and managing editor of Church 6, Stale magazine, 8120 Fenton Street,Silver Spring, Md. 20910
Should public funds be used to aid or support sectarian and/orsecular nonpublic schools? For nearly two centuries controversies overthis question have raged in the United States, Canada, GreFrance, Belgium, the Netherlands, and other countries, gc,. r.tting agreat deal of emotional heat, interfering with educational progress,and causing bitter social divisions.
In the last dozen years or so, the controversy has embroiled Con-gress and half of our state legislatures as intensive campaigns havebeen waged to get laws passed to provide federal or state aid directlyor indirectly to parochial and Private schools. Victories for the "pa-rochiaid" lobby have invariably led to litigation. There have evenbeen six state referendum elections on the issue inthe last six years(New York in 1967; Michigan and Nebraska in 1970; Maryland, Ore-gon, and Idaho in 1972). State aid for nonpublic schools was voteddown decisively in each instance despite the fact that in each theparochiaid lobby outspent the antiparochiaid coalitions by very widemargins.
(Parenthetically, it might be mentioned that in the most recentschool year for which we have complete Figures, 1970-71, of the 51,-175,089 students in U.S. elementary and secondary schools, 89.7%attended public schools and 10.3% attended nonpublic schools, with82.8% of the latter attending Roman Catholic schools.')
As spring arrived in 1973 parochiaid battles we,e occurring in theHawaii, Kentucky, Maryland, Massachusetts, Missouri, Nebraska,Washington and Wisconsin legislatures. But the most significant ac-tion is taking place in the courts and in Congress. The House of Rep-
'5'
I
152 School Finance in Transition
resentatives is considering a proposal, ll R.9, to provide approxi-mately SI billion annually to nonpublic schools through the deviceof federal income tax ci edits to reimburse parents for nonpublic schooltuition. The current proposal would reimburse parents for 50% oftuition up to a maximum credit per student per year oi $200. ThePresident has supported this proposal vocally .,el frequently. andthe powerful 101)1::. working for passage of the plan claims that ithas enough votes to get it through the House.
The whole question may be rendered academic, however, by theUnited States Supreme Court, which appears to be an immovableblock in the path of the advocates of public aid for nonpublic schools.In 1971. in Lemon v. Kurtzman (103 U.S. 602), the Court struck downas unconstitutional Pennsylvania and Rhode Island programs of aid-ing parochial and private schools through the "purchase of seculareducational services" and "teacher salary supplement" gimmicks. In1972. in Wolman v. Emex (93 S.Ct. 61), the Court found the tuitionreimbursement plan unconstitutional. Meanwhile, a three-judge fed-eral district court in Vermont acted in 1972, in Americans United v.Oakey (No. 6393, 40 U.S.L.W. 2597, D. Vt.), to strike clown a statelaw providing for the "let. ling" at public expense of teachers, books,and other seces to nonpublic schools. This titling was not appealed.The Supreme 0 art also ruled in 1972, in lirusce v. Missouri, that astate's refusal to provide aid to nonpublic schools does not violatethe parents' free exercise of religion or deny them due process or equalprotection of law.
With most major parochiaid plans shot down by the courts, theparochiaid advocates seem to view the tax credit tuition reimburse-ment method as their last and best hope. This plan, however, is atthis moment before the Supreme Court on appeals from three-judgefederal district court rulings in Ohio and New York. The Ohio courtfound the plan to be unconstitu ional in 1972 in Kosydar v. Wo lman,while the New York court upheld a similar plan in 1972 in Pearlv. Nyquist. The Supreme Court will probably rule in these cases be.fore summa,.
If the ..x credit tuition reimbursement plan is struck down, theparochiaid lobby may attempt to seek an amend aent to the UnitedStates Constitution to allow such aid. Alternatirdy, it may fail backon "shared time" or "reverse shared time" plans. These involve hav-ing public schools take over part of the nonpublic school teachingload, either by bringing nonpublic students i , the public schoolsfor part of the day or by sending public school p. sonnet into speciallyleased space in the nonpublic schools. The latter plan, known as "re-verse shared time," is currently being challenged '!y Americans Unitedin federal courts in Michigan, Kentucky, and New Hampshire, tby the American Civil liberties Union in Oregon.
Wt snould note, at this point, that successful litigation to endprograms of public aid for nonpublic schools has rested on two pillars,race and religion. Following the Supreme Court's 1954 Brown decisionagainst racial segregation, several state legislatures attempted to pre-serve segregation by various devices for providing state funding for

Public Funds and Nonpublic Schools 153
private schools. These plans were all quashed because they involvedgovernment in sponsoring racial segregation. The courts were not con-fused by ingenious indirect or "parent aid" gimmicks. Following theracial segregation cases, the federal courts took on the problems ofpublic financing of the religious schools which enroll over 90% ofthe students in nonpublic schools. In Lemon and Wolman the Su-preme Court struck down state aid to nonpublic school plans on FirstAmendment grounds. The Court in these cases spoke of "excessiveentanglement" between religion and government, of the sectarian na-ture of the schools aided, of the transparency of devices to circumventthe constitution, of the potential for political division along religiouslines, and of the limited and sectarian nature of the class of benefi-ciaries of the legislation (Wo ltnan).
ALTERNATIVES AND COSTS
While waiting for the Supreme Court and lower courts to rule ontax credit, "reverse shared time," and other parochiaid plans, we canturn to an analysis of the alternatives for nonpublic school financeand of the economic and social costs of these alternatives.
There are only two basic policy alternatives for public financingof nonpublic schools. We can either provide no public support fornonpublic schools, or we can provide some support. if the latter courseis followed, it should be obvious that there will be prolonged andperhaps even permanent controversy over how much aid will be pro-vided. If some aid is provided the nonpublic school lobby will surelyexert tremendous pressure for greater and greater support, movingtoward parity of public support with the public schools. The expert-ences of Canada, Britain, the Netherlands, Australia, Belgium, andother countries bear this out. One obvious social cost of the struggleover the if and how much of public aid for nonpublic schools is thereligious, class, and racial divisiveness that it causes.
THE COSTS OF TAX AID TO NONPUBLIC SCHOOLS
Before dealing with the possible economic (osts of providing pub-lic aid to nonpublic schools, we need to examine the claim that suchaid would make economic sense because nonpublic schools can be op-crated more cheaply than public schools. While secular private schoolsgenerally cost tunic to operate than public schools, it is true that inactual dollars paid out, denominational schools up to the present timehave generally operated somewhat more cheaply than public schools.
The reasons for this are not hard to find. A great many parochialschools have less favorable teacher-pupil ratios than public schools.Some, with small enrollments, mix several grade levels together inone room. Church-related schools pay teachers lower salaries thanthose paid by public schools; in the case of Catholic schools, teachersand administrators were traditionally nuns and brothers paid bare
In the period since this paper was presented the Supreme Court has ruledunta,..rably on the "tax credit" option.

154 School Finance in Transition
subsistence wages, and these underpaid people, while their numbersare dwindling, still account for about half of Catholic school teachingpersonnel. Nonpublic schools are generally academically selective, es-pecially on the secondary level, and thus have fewer hard to teachor problem students than the public schools. Further, nonpublicschool programs generally fall well behind the public schools in pro-viding expensive vocational, arts, remedial, driver education, physicaleducation, guidance, and other enrichment offerings. No wonder pa-rochial schools claim they are cheaper to operate!
But if nonpublic schools upgrade their programs, services, salaries,and teachor-pupil ratios to compare favorably with public school pro-grams, their costs will match those of public schools. They wouldprobably even exceed public school costs because of the obvious econo-mies of scale enjoyed by the public schools. The various nonpublicschools operating in our metropolitan areas generally serve smallerand more widely scattered populations, and therefore are less efficientand require more expensive and extensive transportation services. Thiswas admitted with regard to Catholic schools in early 1972 by theRev. C. Albert Koob, president of the National Catholic EducationalAssociation. "By 1980," Koob reported, "we'll be lucky if we can keepthe cost under $1,000 for an elementary school student and $2,000 fora high school stodent."2
The average public school per pupil cost for 1972-73 is $1,084 forpueils in Average Daily Attendance, or $966 per pupil in AverageDaily Membership.3 If the tax credit parochiaid scheme is upheld bythe courts and passed into law by Congress and state legislaturesascredits against federal and state income taxes, not to mention creditsagainst property and sales taxes, as in the Ohio grogram struck downin Kosydarit is easy to see that more than $5 billion annually couldsoon be flowing to nonpublic schools. This figure, then, would bethe cost of tax aid to nonpublic schools. This sum would be availablefor nonpublic schools only by raising taxes or by cutting other publicprograms, such as public education.
This $5 billion figure assumes that nonpublic enrollment wouldremain at five million students. It is more likely, however, that massivetax aid to nonpublic schools would cater these to expand and pro-liferate, for a variety of religious, racial, and other reasons. A Gallupstudy in 1969, while showing that Americans oppose tax aid for non-public schools by i margin of 59% to 37%, showed also that, if nonpublic schools were free, 40% of pareots nationally and 59% of par-ents in metropolitan areas would prefer to place their children inparochial or private schools." Thus, not only amid public aid to non-public schools cost American taxpayers an additional $5 billion annually, but it would probably destroy the American public schools.This is precisely what happened when the public treasury in the Neth-erlands was opened to the parochial schools 50 years ago.
Parochiaid, then, could rather quickly cost Americans billionsof dollars annually and destroy our public schools. But the financialand social costs of parochiaid would be even higher. Splintering andbalkanizing education into a multiplicity of larger or smaller sectarian,
Public Funds and Nonpublic Schools 1St
racial, ethnic, ideological, and other sorts of enclaves would surelyreduce overall educational efficiency and raise overall educational costs.
Socially, this fragmentation would increase the divisions and cen-trifugal forces straining the seams of our society. Government spon-sored and supported sectarian segregation in education in NorthernIreland is an obvious example of where this can lead. Since parochialschools tend to closely approach 100% denominational homogeneityof faculties and student bodies, (Catholic schools are 97.3% Catholicin enrollment6; Protestant and Jewish schools are similarly homoge-neous) it should be obvious that tax support for nonpublic educationwould deprive increasing numbers of students of the healthy plural.ism, diversity, and religious neutrality of our public schools.
In addition, nonpublic school aid would subject all citizens to tax-ation for the support of private schools which are, in theory and prac-tice, religious institutions. It would also tend to increase interfaithtensions both in legislative bodies and in our communities.
Further, the tax credit parochiaid plan would aid only those non-public schools serving families above a certain poverty level. It wouldbe of no benefit to nonpublic schools serving the poorest families inour society. This plan would cause worse class cleavages than mostother aid plans.
The financial, social, and educational costs of a policy of publicsupport of nonpublic education are thus seen to be quite high.
THE COST OF A NO-AID POLICY
What would be the financial and social costs of a policy of nopublic aid for nonpublic schools?
First of all, nonpublic schools are not going to close wholesale ifpublic aid is not granted them. Further, they will probably continuetheir slow and gradual decline until they reach a lower plateau. Ac-cording to the Notre Dame study done for President Nixon's Com-mission on School Finance, total nonpublic enrollment is expected todecline approximately 46% between 1970 and 1980.e This decline willinvolve a Catholic school enrollment drop of about 52% for the dec-ade and a non-Catholic nonpublic enrollment decline of about 2.5million students by 1980. Some of this decline will be due to lowerbirth rates, but the bulk of it will be due simply to changing parentalpreferences.
This nonpublic enrollment decline, which began around 1965,should produce no burdensome costs, however. Birth rates havedropped so sharply in the last five years that transfers from nonpublicto public schools are being and can be readily absorbed. During thetwelve year period during which our present school jiopulation wasborn, 195466, births averaged 4.13 million per year, But from 1966to 1972 the average number of births per year fell to 3.6 million peryear./ (The Catholic birth rate, incidentally, is falling more rapidlythan that of the general population, due to a widespread but belatedacceptance of birth control.) According to the latest N.E.A. figures,the total school age population slid from 52.5 million in July 1970
e*.

Ito School Finance in Transition
to 51.78 million in July 1972, a decline of 718,000 children or 1.4%."And while students were shifting from nonpublic and public schoolsfrom 1971.72 to 1972.73, total public school enrollment fell from 45,-887,095 to 45,821,743, a drop of 65,952. According to Martin A. Lar-son's 1972 study When Parochial Schools Close, total school enroll-ment, public and nonpublic:, in 1979 should be less than 47 million."Thus all expected shifts of students front nonpublic to public schoolsshould be rather easily accommodated in our public schools, with roomto spare.
The percentage of students in nonpublic schools varies, of course,from state to state and within states. New York, with 17.7% of itsstudents in nonpublic schools, would seem to be the state with thebiggest adjustments to make. Yet Governor Rockefeller's FleischmannCommission reported in 1972 that it would be $415 million cheaperfor New York State to absorb parochial school transfers into publicschools between 1972 and 1980 than to provide state aid sufficient tomake up projected parochial school deficits.") The Fleischmann Com-mission strongly recommended against providing state aid to non-public schools.
Shifts of students from nonpublic to public schools will not onlybe accommodated to greater or lesser extents in existing public class-rooms, but state funds will be automatically redistributed to ease anyburdens on the local tax structure. Of course, as the Supreme Courtagreed when it reversed Rodriguez in March, most state school financesystems need reform. Increasing the percentage of a state's children inpublic schools will surely increase public pressure for such reform. Itshould also lead to pressure for legislation to secure special stateand/or federal aids to school districts facing abnormal enrollmentincreases. Such "influx aid" was recommended by the FleischmannCommission.
It seems safe to conclude that the shift of 2.5 million nonpublicstudents to public schools by 1980 should require little or no outlay ofadditional public funds.
The social effects of the expected shift of students from nonpublicto public schools should generally be beneficial. Interfaith, intrafaith,and community tensions and conflicts over parochiaid proposals andlegislation should diminish. Communities should pull more closelytogether. Interfaith and interracial contacts among children shouldhicrea%e. increasing the percentage of a community's children in pub-lic schools should increase parental pressure for educational reformand for move adequate holding for public schools. School bond andmillage referenda should pass more easily. Patents of .fiutner non-public school children will be relieved of the burden of tuition pay-ments. Churches abandoninli parochial schools will reali/e savingswhich can be applied to religious education and other church endeav-ors. Qualified former nonpublic teachers can be hired by publicschools, while suitable nonpublic school buildings can be purchasedby public school districts. Shifts of children into public schools shouldmake education more efficient and reduce the expenses of school trans-portation, since abht half of the states provide some form of taxpaid
1

Public Funds and Nonpublic Schools 137
transportation for nonpublic schools.Concern for various alternatives in education can be met within
a public school system, as the San Jose, California, experiment fundedby the 0E0 is demonstrating.
Nonpublic schools will undoubtedly survive in some strength solong as they meet the strongly felt needs of their patrons and spon-sors. Consolidations and reforms of nonpublic schools should enablethem to operate more economically and to draw greater tax-deductiblesupport from their patrons. Nonpublic schools should engage in morecooperative endeavors among themselves.
In sumnidi y, I believe that the vast majority of informed personswould have to agree that a policy of providing public aid to nonpublicschools would have unacceptably high financial, social, and educa-tional costs, while confining public support to public schools willprove in the long run to be the most economically, socially, and edu-cationally desirable policy.
OUTNOTES
I. Statistics of Public Schools, Fall 1970, U.S. Office of Education, Washington,1971; A Report on U.S. Catholic Schools !.970.71, National Catholic EducationalAssociation, Washington. 1972: Bulletin on Nonpublic Schools and Enrollment1970.71. National Center for Educational Statistics, 1972.
2. Church & Stale, March 1972.3. N.E.A. Reporter, March 1973.4. Church ' State. December 1969.5. A Statistical Report on Catholic Elementary and Secondary Schools for the
years 1967.68 to 1969-70, National Catholic Educational Association, 1970.6. Office for Educational Research, University of Notre Dame, Economic Prob.
lems of Nonpublic Schools, 1971.7. Church & State, September 1972.S. N.E.A. Reporter, March 1973.
M9. Larson, Martin A., When Parochial Schools Close, Robert B. Luce, Wash.ington-New York, 1972.
10. The Fleischmann Report on the Quality, Cost, and Financing of Elementaryand Secondary Education in New York State, Volume 1, Viking Press, New York,1973.

"Equal Justice Under Law" And SchoolFinance:
An Appreciation of San Antonio IndependentSchools v. Rodriguez
PAUL D. CARRINGTON
Professor of Law. University of Michigan.
San Antonio Independent School District v. Rodriguez is the lat-est chapter of a saga which might be described as the elevation of theAmerican dream to a principle of constitutional law. The legal formof the dream is the right to equal educational opportunity.
In undertaking to give vitality to that right, our courts have, asperhaps never before, expressed an ideal which lies at our nation'sheart. That every child should have a fair opportunity to rise abovehis humble origins and claim the rewards that his efforts and abilitiesleseive is the essence of the American tradition. It is perhaps ourhighest expression of the Judeo-Christian ethic preached from ourpulpits. It is the message of the Statue of Liberty and the feature ofour national ideology which most commends us to people around theworld, It is an idealism that was powerfully activated by the eventssurrounding World War II, as we reacted against the despotic deismof our adversiarks, and gained heart that we might, collectivelyas well
. as individually, attain almost any goal by sufficient national effort. Itis an ideal that forms the best reason for our vast commitment to pub-lic education. It is the best basis for our national self-esteem.
Ennobling as such idealism is, it is to be expected that the prin-ciple of equal educational opportunity has gained a powerful -holdon those who are privileged to devote their careers to the most exaltedof our political institutions, the Supreme Court, which, even over its
139
r-t,a1AA)
160 School Finance in Transition
portals, proclaims its commitment to "equal justice under law." Yet inthe most recent and much-noted decision of the Court in Rodriguez,the argument for equal educational opportunity failed to carry theday. Some have seen the decision as a major reversal of the Court'scommitment to the ideal. This view is somewhat supported by thefact that the decision was made in accordance with party lines, thefive Republicans rejecting the egalitarian position, and the four Demo-crats accepting it. On the other hand, there are a number of circum-stances which suggest that such an interpretation is unsound.
As a proposition of federal law, the right to equal educational op-portunity is derived entirely from the clause of the Fourteenth Amend-ment which forbids the states to deny their citizens the equal protec-tion of the laws. That amendment was, of course, adopted for therather explicit purpose of assuring that the newly freed black citizensin the South would not be disadvantaged by the laws of the states.By its terms, the equal protection clause grants no particular rightsto any citizens; rather, it speaks to how the legislatures may classifythem for purposes of conferring rights and duties of a substantive sort.
For most of its history, the equal protection clause has been littleused. It was given new vitality by the Warren Court, beginning withperhaps its most important decision, Brown v. Board of Education,the case which first recognized a right to equal educational opportu-nity. "Today," Chief Justice Warren then said, "education is perhapsthe most important function of state and local governments. Com-pulsory school attendance laws and the great expenditures for educa-tion both demonstrate our recognition of the importance of educationto our democratic society. It is required in the performance of ourmost basic public responsibilities, even service in the armed forces.It is the very foundation of good citizenship. Today, it is a principalinstrument in awakening the child to cultural values, in helping himfor later professional training, and in helping him to adjust normallyto his environment. In these days, it is doubtful that any child mayreasonably be expected to succeed in life if he is denied the opportu-nity of an education. Such an opportunity, where the state has under-taken to provide it, is a right which must be made available to all onequal terms." The Chief Justice further explained that the separationof the black children by the state "generates a feeling of inferiorityas to their status in the community that may affect their hearts andminds in a way unlikely ever to be undone." It was clear that theCourt in Brown regarded the educational sv:tera as the linchpin ofthe caste system, which the Fourteenth Amendment .W.413 intended todissolve, and which 'postwar America was determined to break.
The Brown decision was, of course, more than a judicial decision;it was a battle cry for a social movement which touched the lives ofall of us. Schools and children were a central focus of that movement.It is perhaps useful to recall that ten years ago next month, the great-est champion of that movement, and perhaps the greatest Atlantan,thundered his peroration to the Civil Rights March of 1963 by pre-dieting from the steps of the Lincoln Monument that on the red hillsof Georgia, black children and white will soon join hands to sing
41 q

Equal Justice and School Finance 161
a hymn to their dual liberation.But, by the time of his assassination almost exactly five years ago
tonight, the movement led by Martin Luther King had changed itsfocus. Social, political, and legal change seemed to require economicchange. The Civil Rights March gave way to the Poor Peoples' Marchand Resurrection City. King's presence in Memphis on that fatefulclay, at the side of the garbage workers, bore testimony to his ownchange in goals. As the civil rights movement became a war on pov-erty, it lost some of its sharpness of focus; but it gained some addi-tional strength by broadening the base of its appeal to include chi-cams, Indians, Appalachians, and the urban poor.
The equal protection clause developed with the social movementand the midsixties witnessed the beginning of a series of cases up.holding the rights of indigents. It was certain that the Court wouldhave to consider the relevance of the right to equal educational op-portunity to poverty. The issue first took shape in the minds of manyof us with the publication of a book by Arthur Wise which bore thearresting title, Rich Schools, Poor Schools. Wise and others broughtto our notice the significant disparities which had developed in thetaxable resources available to the nation's many school districtS. Asyou are well aware, our schools have always been financed, to varyingdegrees, but in almost every state by a locally imposed tax on prop-erty. Because this fact, together with the differing propensities of localdistricts to tax themselves, r
joducesgreat disparities in school spend-
ing. the relevance of Chief justice Warren's rhetoric about equal edu-cational opportunity was obvious. On the face of it, a five hundreddollar education is not equal to one that costs three times that much,and it is easy to assume that the children receiving the cheap educa-tion are the poor who most need the help of public schools if theyare to participate in the national ideal.
The first efforts to invoke the right on behalf of poor children wereunsuccessful. Counsel representing school districts which served theurban poor filed a series of suits seeking to compel the states to pro-vide additional funds for the education of pool children who were ad-versely affected by the inrmisingly common problem of school failure,which was and is plaguing the urban schools. Tile first of these casesto rcach a decision was that brought in Illinois and the trial courtdismissed it, finding that it had no plausible basis for defining thelimits of the plaintiffs' needs for additional money. The Warren Courtsummarily affirmml.
It was at this point that a small group of scholars led by ProfessorCoons of the University of California presented the theory which wasargued by the Rodriguez plaintiffs. They contrived to escape the ap-parently insurmountable problem of giving legal definition to the fis-cal needs of schools by recasting the right to equal educational op-portunity in a different form which would require no judicial meas-urements of need. They succeeded by expressing a negative principleor a prohibition, which might be expected to permit the courts toapply the egalitariau.criterion of the Fourteenth Amendment withoutappraising the sufficiency of any appropriation. The states might, at:.
1.59

162 School Finance in Transition
cording to their .onception, use any formula for the distribution ofschool money, provided that the distribution not be keyed to thewealth of the district in which the school children live.
There can he no doubt of the great charm of this "no wealth" prin-ciple. It can be simply stated, rather simply applied, and is faithfulto the rhetoric of equal educational opportunity. Moreover, it is pre-sented as conservative in the sense that it involves very little politicaljudgment by the courts and leaves a substantial range of freedom forstate legislatures in choosing systems of school finance. In a truly re-markable triumph of legal scholarship, the concept was quicklygrasped by the Supreme Court of California last year in Serrano v.Priest. Despite the fact that the school finance systems of every statebut Hawaii were subjected to fundamental challenge, the decision waswidely hailed on all sides. The press, Jegislative groups, educators atall levels in the administrative hierarchy, and taxpayer organizationswere all enthused. Liberal civil rights adherents rejoiced at the ap-parent triumph of egalitarianism and conservative property owners re-joiced at the apparently impending demise of the local property tax.A series of lower federal courts adhered to the Serrano decision, in-cluding the court which initially dethled the Rodriguez case, and astate trial court in New Jersey. And, most recently, the Supreme Courtof Michigan reached the same result, although departing from theformulation of principle presented in Serrano.
The legal analysis which underlies the no-wealth principle can besummarized. As presented by Professor Coons and his associates, itrests upon the principles of equal protection which were developedby the Warren Court. Prior to the Brown case, the traditional test ofproeriety of a legislative classification challenged under the equal pro-tection clause had been whether it rationally served a legitimate legis-lative purpose. The Warren Court excepted from this generally per-missive test certain kinds of legislation which were said to be subjectto strict scrutiny; this meant that the legislation in question wouldhave to be justified by a "compelling state interest,' a justificaionwhich almost always proved impossible to supply. Whether a particu-lar law was subjected to strict scrutiny, or the more relaxed traditionaltest, depended on whether it affected a fundamental interest of thecitizens classified, or whether it made an invidious or suspect distinction in its classification.
While both terms, "fundamental interest" and "invidious discrimi-nation" are somewhat problematic, Professor Coons and his associatesargued that traditional school finance systems involve both: the chil-dren of poor districts are, he and his colleagues assert, denied a fun-damental interest by a suspect classification as long as the quality oftheir education is a function of local wealth.
It was important first to establish that education was a fundamen-tal interest different from other services provided by local government,lest the plaintiffs be said to he striking at the foundations of the wholeof local government. They feared to he asked whether their analysisof equal protection would require that all services now provided bylocal government be equalized statewide. The Supreme Court had
Equal Justice and School Finance 163
relied upon the fundamentality of the interest involved to apply strictscrutiny to state laws affecting the rights of indigents to counsel incriminal proceedings, to travel, and to vote in state elections. Althoughtendering other make-weight distinctions, Professor Coons and hisassociates ultimately sought to liken the right to education to the rightto vote and the right to counsel, and to distinguish it from the rightto sewers and police protection, primarily on the ground that educa-tion is essential to the exercise of other constitutional rights, such asthe right to vote and the right to speak, and is therefore fundamental.This analysis carried the day in the Supreme Court of California.
Secondly, it was contended that the Texas system of school financeinvolved a suspect or invidious discrimination. The concept of in-vidiousness arose in cases involving racial discrimination, but has beeninvoked in cases which involved legislation which was deemed burden-some to indigents. It was never asserted that the plaintiffs in the schoolfinance cases were themselves indigent. Rather it was asserted that thedisadvantages created as a result of the inequities of school financefell indirectly more heavily on poorer citizens than wealthier ones,because the latter were better equipped to take evasive action. Richercitizens may, indeed, choose to live in richer districts, whereas poor'ones are less able to do so.
Indeed, two Justices were persuaded that school finance legislationshould be subject to strict scrutiny. In supporting the contentions ofthe plaintiffs, Justices Marshall and Dou 51as agreed that the plaintiffsasserted a fundamental interest in their right to aim education and thatthe classification was suspect. Justice Marshall asserted that discrimina-tions based on group wealth, as distinguished from the individualwealth discriminations involved in the indigency cases, were the moregrave because they were even further beyond the control of the in-dividual or his family. Moreover, he emphasized, it will be as difficultfor citizens of poor districts, as for indigent citizens, to invoke thestate's political process to obtain redress because they will be opposedby those who benefit from the existing scheme of distribution.
As to the third possible issue to be raised under the Warren Court'sformulation of the strict scrutiny test, the State of Texas concedeu thatthere was no compelling justification for the existing scheme of Texasschool finance. Thus, if the plaintiffs had prevailed on the fundamen-tal interest and invidiousness arguments, they might have prevailedforthwith.
But only two Justices were willing to adhere to the analysis so care-fully and imaginatively provided by counsel. There were, however,two other Justices, White and Brennan, who were prepared to votewith the plaintiffs, in favor of the claim to equal educational oppor-tunity. In an opinion by Mr. Justice White, they invoked the moretraditional language of equal protection cases and declared the Texasschool finance system to be irrational. Texas argued that the systemreflected a compromise between the obligation of the state to providean education and the right of local communities to spend their r'vnmoney on their own children. This was rejected on the ground thatthe system was not a plausible method to effectively promote local

164 School Finance in Transition
control of schools. Justices White and Brennan did not go so far, itmay be noted, as Justices Marshall and Douglas; the latter Justiscesdeclared that the Texas contention was bogus, being belied by thelack of actual control exercised by local school boards in that state.But Justice White did emphasize that Texas had not been as earnestas it might have been about local control because there is, indeed,very little local control to be exercised over school spending in adistrict which has few taxable resources. Although they did not them-selves take notice of the fact, the analysis used by Justices White andBrennan seems to demand less justification by the state of its legis-lation than the strict scrutiny test of the Warren Court would re-quire, but more than would have been required by traditional equalprotection law. Their opinion reflects a trend of the Burger Courtto develop an intermediate position between strict scrutiny and thetraditional minimal rationality test. Justice White's opinion wouldseem to apply with equal force to other local government activities,but would not proscribe all wealth relationships. His opinion was tosome degree anticipated by that of Justice Mennen Williams of theMichigan Supreme Court.
What can now be said of the application of the right to equal edu-cational opportunity to school finance? Has the no-wealth principlebeen subjected to a mere delay in its meteoric rise, so that furtherconsideration, or a few Democratic appointments to the Supremecourt, will assure its acceptance? May It nevertheless continue itssweep through the state courts? My guess is that the no-wealth prin-ciple has had its clay in the sun, regardless of the political compositionof the courts to which it is proposed. Indeed, I am doubtful that theefforts to judicialize the state systems of school finance will be re-warded with many more victories in the foreseeable future, until an-other and yet sharper analysis can be provided which will be lessdrastic and more responsive to the historic aims and values of theFourteenth Amendment than any which has yet emerged. Such ananalysis will also have to be supported by stronger proof than has sofar been adduced.
The Rodriguez case was lost not because five Justices are insensi-tive to the American dream and its legal embodiment, but becausethe application of that idealism in the manner proposed did not standclose inspection. Despite its charm and strong ethical base, the no-wealth principle suffers from the following frailties:
(1) the children who would benefit from its application may notbe those who need help to overcome difficulties of caste or class;
(2) the children who would benefit may not benefit in durablysignificant ways;
(3) the primary beneficiaries may be teachers and other school em-ployees;
(4) the secondary beneficiaries may include land speculators andthe secondary losers may well include the urban poor;
(5) its application would impose a general drain on the public

Equal Justice and School Finance 165
fist:, very probably requiring the diversion of public monies from otherimportant and desirable services;
(ii) its application might eliminate the last vestiges of effectivelocal control of educational policy,
(7) its enforcement could lead to a constitutional crisis.
Some of these considerations have direct legal significance; others areof greater practical than doctrinal importance. Some, but not all, areidentified in the Court's opinion in Rodriguez, which was preparedby justice Powell. It seems likely that each of them influenced thedecision in some measure. As these considerations become more widelyunderstood. the no-wealth principle seems likely to lose suppurt,..be-cause the consequences described are cause for concern to all of uswithout regard to party affiliation. And these consequences are becom-ing increasingly apparent. Many are visible in the report of the SelectSenate Committee of California, which has published its study of post-Serrano school finance. Some arc visible in the New York FleischmanCommission Report. Some are visible in the events occurring in Cali-fornia, Michigan, and elsewhere.
The first, and perhaps the most important, fact that is becomingincreasingly apparent is that the childt,:n who are served by poorschool districts are not generally otherwise particularly disadvantaged.Obviously, this fact, if it is a fact, bears heavily on the legal contentionof the plaintiffs that they are the victims of invidious discrimination.lf, as seems intended, the idea of invidiousness is that the FourteenthAmendment should be given more rigorous application to protectthose who are in special need of protection because of their generalsocial, economic, and political disabilities, the children of poor dis-tricts are not such a class.
The plaintiffs in Rodriguez did make an effort to establish thatthey were relatively poorer than the residents of wealthier districts.Their evidence took the form of an affidavit by Professor Berke ofSyracuse who had classified a number of Texas districts according tomedian incomes. Indeed, the poorest group of districts had the lowestmedian and the richest group of districts had the highest, but the dif-ferences were not dramatic and the middle groups were reversed, thesecond richeA group having the next to lowest median income level.More detailed studies of Connecticut and Kansas districts tend toindiCate an inverse correlation between individual poverty and thewealth of the taxing district. The Yale Law Journal ha; already con-cluded that "the popular belief that the poor live in poor districts isclearly mistaken.''
This point gains force as we consider the problem of urban schoolFailure in its relation to the problem of school finance. Thus, the Cali-fornia Senate Committee identified five urban districts as the sceneof much of the school failure problem in California. None of the fivewould have been helped by a significant increase in funds availablefor general use by either of the plans protosed by the Committee Re-port. And one, San Francisco, would undergo a substantial deprive-lion; ite funds available for unrestricted use would, under either

166 School Finance in Transition
plan, have decreased from over $1700 per pupil to about $1100. Bymeans of a substantial increase in categorical aid and a hefty speciallocal tax which would have been permitted, San Francisco might haveto keep its school spending at a level within $150 of its present level.There appears to be no practicable way of complying with the no-wealth principle without taking public money away from San Fran-cisco, which is one of the places in the state where it is most needed.Similarly, in Michigan, any process of equalization is almost certainto reduce or limit school spending in the southeastern quadrant ofthe state, wile: most of the school failure problems exist, in order toincrease spending in the northwest, where school achievement levelsare highest.
The character of the population of poor districts is troublesomeon three additinlal counts. One is that the wealth of the district ispartly dependent on property assessment practices which are by nomeans uniform in many states. To the extent that a community suf-fers its taxable resources to be undervalued, it is difficult to see it asthe victim of invidious discrimination by the state. A second is thatit is becoming increasingly difficult to accept as a standard of relativedeprivation any financial criteria which proclaim the rural popula-tion to be the disadvantaged. A rural dollar and an urban dollar arenot the same, either in value or social significance. While the no-wealth principle does not necessarily require that such dollars betreated as equal, it would create momentum for such an assumption.Thirdly, it is true within metropolitan areas that the residents of poordistricts are partly self-selected-. The economists who adhere to thepure analysis of Professor Tieboldt tell us that differing levels of tax-ation and public spending within a metropolitan area assure freedomof choice to individuals and optimize the utilization of public servicesas each family chooses the combination of taxes and services bestsuited to it. To some extent, at least, this pure theory does work, andto the extent that it does, it is hard to see those families who choosea poor district as the victims of invidious discrimination. In many met-ropolitan areas, even the poorest citizens can afford to live as well ina high valuation district as a poor one, if they are willing to live closeto industrial land users.
The plaintiffs contrived to overcome this weakness in their caseby emphasizing that there are at least some poor, indeed indigent, chil-tken among the groups which are disadvantaged by the uneven dis-tribution of school money. There must, indeed, be some poor childrenwho get Jess school service because their parents, who exercise verylittle control over their lives or the lives of their children, reside inunderfinanced districts rather than overfinanced ones. Justice Powelldid not respond directly to their plight, although a concern for suchchildren is a major preoccupation of the dissenters Marshall andDouglas. One reason for not doing so is that the no-wealth principlelogically extends far beyond this beleaguered group to benefit manywho can make no such claim to justice, at the cost of many who canmake similar claims. A second reason is that it is wholly unmanage-able for the Court to attempt to require the states to correct every

Equal Justice and School Finance 167
situation ln which the law creates burdens that are more heavy, orrights which are less available to the poor than the rich. To decreethat all indirect discriminations against poorer citizens must endwould he to decree nirvana. As Justice Stewart, in his special con-curence, notes: "There is hardly a law on the hooks that den notaffect some people differently front others." And it is very natureof individual wealth that it empowers the possessor :0 !lain access tosome services, including those provided by goverm::%11 and to avoidor near easily some burdens imposed by govern :,) ents. Most of thecriminal law, and most of the private law, inevitably falls harder onthe less wealthy. One recalls Anatole France's epigram about the law,in its majestic equality, forbidding both rich and poor to sleep underbridges.
Thus, despite the efforts of plaintiffs to describe their plight aspoignant, the fact is that they bear little resemblance to the plaintiffsin the Brown case who established tlyt they as a group were harmedby the badge of inferiority which was placed on them by their segre-gated schools. As Justice Powell proclaimed, "The system of allegeddiscrimination and the class it defines have none of the traditionalindicia of suspectness: the class is not saddled with such disabilities,or subjected to such a history of purposeful unequal treatment, orrelegated to such a position of political powerlessness as to commandextraordinary protection from the majoritarian political process."
A second problem is that the benefits to be derived by the chil-dren of poor districts front the application of the no-wealth principleseem likely to be marginal. will be recalled that the plaintiff's analy-sis depended, in part, on a characterization of the interest they assert.as "fundamental," and hence entitled to special constitutional pro-tection.
The plaintiffs sought to carry the day on this question by de-scribing their interest as the right to an education. While the Califor-nia court had accepted that characterization in the Serrano case, theSupreme Court in Rodriguez did not. Justice Powell was alert to pointout that the plaintiffs were being provided w'cl, an education, onewhich the state, at least, described as "adequate"; what the plain-tiffs sought was a more expensive education. It is noteworthy that theinjury they complain of is the reverse of that asserted in the Browncase. Where the Brown plaintiffs conceded that the dollars investedin their education were adequate, they complained of the educationaloutcome, which common sense observation (Immigrated to be defi-cient. In Rodriguez, there is no specific grievance about the educa-tional outcome, but only about the level of financial effort by thestate. The question can and should be asked, what are these dollarsreally likely to accomplish for the plaintiffs?
The question of course evokes a consideration of the controversysurrounding the Coleman Report of 1966 on the relation betweenquality and cost of education. Professor Coons and his associates dis-missed that controversy by asserting that, whatever the relation, thepoor should have the same right as the rich to be disappointed by theresults of school spending. But, that dismissal is.a bit abrupt. The

168 School Finance in Transition
plaintiffs' interest ought not be accorded "extraordinary protectionfrom the majoritarian political process" if it is not fundamental, andfundamental implies, at least. that the interest . substantial. Onerecalls the words of Chief Justice Warren in Brthi,n as he expressedconcern that the children would be aftocted in heart and mind "in away nlikely ever to be undone." Are the Rodriga plaintiffs plausi-bly so harmed?
The assumption implicit in the Coons analysis is that school spend-ing is an investment in youth which results in increased productivity;to invest nu- ^ u some children than others thus produces greaterlifetime ea.nings for the advantaged group. The Coleman Reportdoes not, a some people orposed to ;chool spending have suggested,prove that sth.euis cannot so invest to increase productivity if thatwere their operative goal. But, it does tend to confirm, despite its meth-odological lunit:. ions, at obvious fact which we may have concealedfrom ourselves Ly the excesses of rhetoric in school millage elections.This is that schools but rarely try to spend money in a manner thataffects the acquisition of basic cognitive skills or other characteristicswhich might affect the longterm productivity of youth. And there isa very good reason why this is so. It is not because school administra-tors and trustees are indifferent to the need for acquiring reading andmath skills, it is because we really know very little about how to im-prove them with money beyond that needed for the most rudimentaryof school programs. Except for a few publishing houses no one isreally trying to persuade education spenders that particular expendi-tures will materially increase the durable cognitive skills of their chil-dren.
What then do rich school districts spend their money on, that isdenied to the children of poor districts? The California Senate Com-mittee found that the great bulk goes into the school payroll. Abouttwo-thirds of the difference is spent on lowering class size, and an-other fifth on higher salary scales. It is unlikely that the proportionswould differ much elsewhere. We can therefore assume that the pri-mary advantage of attending a wealthier school is that the teacher isbetter paid and less harried, that there will be somewhat more aux-iliary services in the form of school nurses and school social workers,zttni that there will be a somewhat broader program in such areas asart, music, and athletics. Common sense would seem to say that theseexpenditures are not, in any economic sense, significant investmentsin children; rather they are. for most students, consumption itemswhich add to the pleasures of the moment but have very little to dowith the children's adult lives. To speak of the largest item, classsize, as affecting the minds and hearts of the students in a mannerunlikely ever to be undone would be a bit extravagant.
I hasten to add that I do not perceive such expenditures as waste-ful r rely because they lack durable significance. I.ike expenditureson j ilk parks or museums or concerts, they enrich the lives of citi-zens more than comparable private expenditures on liquor, gasoline,or cosmetics. Rut we would not, for example, regard acce:,s to a publicgolf course as a fundamental interest, and there is no reason to change

Equal Justice and School Finance 169
that assessment because the golf course is operated by a school districtrather than a city, To locus more directly on the argument whichwas embraced by justice Marshall in his dissent, it is very hard toaccept his assertion that children are disadvantaged in their abilityto exercise their constitutional political rights and their right to freeexpression because they attend school in larger classes in a schoolwhich has no orchestra, and is stalled by teachers with fewer graduatedegrees.
Unfortunately, Justice Powell was moved to go beyond the re-quirements of the case to declare flatly that education is not a funda-mental interest. Taking a how in the direction of the popular notionof stilt t construction, he emphasized that education was not a rightidentified in the federal constitution. On this basis, he distinguishedthe right to an educatton from the right to counsel in criminal pro-ceedings or the right to vote or the right to travel. In fact, as Justice1arshall forcefully demonstrates, the Federal Constitution is none tooexplicit about some of the other interests which have been treated asfundamental by the Court. One might also question whether a strictconstructionist ought not he satisfied to find the right to an educationin the state constitutions inasmuch as the equal protection clause isaddressed only to the manner in which the state classifies rights whichit creates. In fact, as Justice Marshall again points out, almost everystate constitution establishes the right to an education. It was this ex-cess assertion by Justice Powell which brought forth a special dissentof protest from justice Brennan. And it seems quite possible that theCourt will have to reconsider and withdraw that comment if they areconfronted with a case in which the right to an education is totallyabridged. Such abridgements have occurred in some southern coun-ties and may occur more frequently in some northern urban areas af-flicted with financial crises and labor difficulties. I offer Detroit as arecent close call. Perhaps Justice Powell would propose to deal withsuch a situation by applying a more flexible test than the WarrenCourt's strict scrutiny test; such an approach would be consistentwith the recent observations and argument of-Professor Gunther ofStanford.
The third problem which I identified is but a corollary of thesecond; yet, it seems to me to deserve some attention. It is that adults,not children. are the likeliest beneficiaries of increased state expendi-tures in poor school districts. This fact has little legal significanceunless it can he said to rationalize the inaction of the Texas legisla-ture in failing to correct the inequity. But it should neverthelessweigh. on the minds of those who may in the future appraise theutility of the no-wealth principle.
There is nothing unusual about this phenomenon to those whoare accustomed to the problems of mounting an attack on povertythrough the public budget. I am told that there is a principle knownin Washington as the elephant feeding principle, which dictates thathe who feeds sparrows in the elephant pen must supply enough breadto sate the elephants so that there will he leftovers for the sparrows.As the biggest beneficiaries of health insurance are doctors, so the big.

170 School Finance in Transition
gest beneficiaries of education expenditures are teachers. Let therebe no mistake that teachers are, by and large, useful citizens who de-serve to be well paid. Rut it is far from clear that a program whichwould equalize the wages and working conditions of teachers hasanything to du with the aims and values of the Fourteenth Amend-ment.
It is useful to resit)l that almost every teacher in America has anincome above the national mean. Devoting public money availablefor other purposes to increasing teachers' incomes does not increase thegeneral equity of distribution in the society. Indeed, to the extentthat the public money is derived from taxes imposed on taxpayerswho are less fortunate than teachers, it tends toward the opposite ef-fect. Moreover, it seems likely, although not inevitable, that compance with the no-wealth principle would tend to raise rural teachingsalaries in relation to urban salaries. If so, this would encourage anouunigration of teachers which is hardly welcome, and hardly con-sistent with the substance of the right to equal educational opportu-nity.
The fourth problem with the non-wealth principle is also pri-marily a practical, political one, with a legal significance limited toproviding a just reason for legislative inaction. It is that the secondaryconsequences of adjustments in local tax levels are not necessarilydesirable. There is still some truth in the old adage that an old taxis a fair one. Any compliance with the no-wealth principle must havea substantial impact on the rates of taxation in both rich districtsand poor. Economists assert, fairly convincingly, that lax levels are atleast partly capitalized in the values of land. As tax levels rise or fall,relative land values change. Hence, a decrease in tax levels in poordistricts will enrich land speculators there; while a corresponding in-crease in tax levels in rich districts will be costly to owners there. Ashift to a different form of taxation changes the nature of the impacton those whose taxes are increased, but there must, in any event, bean impact on some taxpayers somewhere, who will be the lucklessgroup to take up the financial slack left by mandated tax relief inthe poor districts.
It can be imagined that the secondary consequences could be ad-verse to poor urban children, The possibility is suggested by the rec.ommendations of the California Senate Committee. Under eitherof the plans suggested by that committee, it was contemplated thatSan Francisco might raise a special local levy in order to maintaincurrent school spending levels. One plan called for about a 50% in-crease in taxes on San Francisco property; the other called for abouta 70% increase. It seems unlikely that the voters of San Franciscowould opt for such precipitous increases. To the extent that they didso, however, it would be at the risk of some loss of marginal industry.It is at least possible that the existence of those jobs in the city isfar more important to the educational growth of the poor childrenof California than any possible result of fiscal equalization could beto the children of poor districts. In any event, whoever may be thewinners or losers in such transfers of capital, it seems clear that the

Equal Justice and School Finance 171
consequences have no positive 'elation with the aims and values ofthe Fourteenth Amendment.
A fifth difficulty, which is related to the fourth, is that the imple-mentation of the no-wealth principle almost surely requires the de-velopment of some substantial new sources of public revenue for edu-cation. Indeed, it is no secret that much of the popular enthusiasmfor the Serrano decision was derived from dissatisfaction with theproperty tax and an expectation of ( Jiverance from its burdens.
The conventional wisdom is that the property tax is regressive.Indeed, the champion of the conventional wisdom, our President, hassaid that it is "one of the most oppressive and discriminatory of alltaxes." And George McGovern also identified himself with what hedescribed as a property tax revolt.
Unfortunately, those who object to the property tax have notmanifested any eagerness to pay other taxes which might be regardedless unfavorably. The voters of Michigan have emphatically rejectednew and more progressive taxation. The California Senate Committeeresigned itself, with some reluctance, to a primary dependence on thestatewide property tax. The New York Fleischmann Commission wasunable to unite behind any recommendation as to new forms of tax-ation.
In fact, the property tax is not as bad. as the President proclaims.Its worst features cm be remedied, as the California report clearlydemonstrates. It is old and we are used to it. And there is reason tobelieve that the primary hearers of the tax on rental property arelandlords, not tenants, so it may not be so regressive. For these reasons,the property tax will surely survive, even if it is de-localized, as maybe required in some states, and may result in others.
The real difficulty lies in the fact that the property tax, in what-ever form, is not likely to be adequate to meet the demands createdby a program of equalization. As can be seen in both the Californiaand New York reports, it is very difficult to contemplate equalizingby reducing the expenditures of rich districts. Thus, new monies haveto be found. The California Committee thought that it had developeda workable scheme that could be implemented for under a billiondollars of new school money. They did not say where that money wasto conic from; six months, they said, was not long enough to solvethat problem.
In appraising the practical desirability of the no-wealth principle,it would seem to be useful to know who is going to pay this price. Ifthe cost is to be borne by taxpayers who are less able to bear the costthan those who will benefit, the implementation will be somewhatself-defeating. And, even if the source of the new money is highly pro-gressive, or even if it came from a private donation to the state, therewould he the question of whether implementation of the no-wealthprinciple would be the best use of the available funds. Those whohave never participated in the budgeting process are prone to assumethat public budgets are infinitely elastic. If only the budget-makerswant to, they can find the money for any use. But those with experi-ence know well that, no matter how generous the supply of funds,

172 School Finance in Transition
there are always worthy competing uses to be considered. If the stateof California had a billion dollars to spend for the purpose of pro-* noting greater equality, and better social and economic opportunity,it is far trom clear that the expenditures suggested by the Senate Com-mittee, or those adopted by the legislature last December, are the bestavailable. Housing and transportation needs, for example, must becompared to the needs for higher teachers' salaries and smaller classsizes in poor districts. Indeed, there is a paradoxical feature of theCalifornia report: it proposes to devote a half billion to categoricalaid for disadvantaged youth, but the bulk of that money to be di-rected to the five urban school districts identified as the scenes of muchschool failure would do little more than offset the funds which arediverted from that district in the pursuit of equalized financing, andthey would have been inadequate for that in San Francisco. Obviously,from the point of view of those intended to be benefitted by a com-pensatory program, it would be more desirable to apply the half bil-lion on to it the existing financial scheme without the other accom-modations which seem to be required by the Serranodecision.
A lost horizon in the no-wealth discussion has been the historicfunction of local school boards. Their primary on has been toraise money for public use by persuading fell Azens to foregocosmetics or liquor in favor of spending on cluid,en. Much of themoney so raised is not otherwise available for public use because onlya local school board is in a position to exploit this somewhat selfishinstinct of parents. The biggest beneficiaries of the traditional patternof local finance have been the poorer children in the wealthier dis-tricts, because they have been privileged to share the pleasures oftheir wealthier neighbors on an equal basis. Thus, within local com-munities, the system has been a source of social equality. Consump-tion items like golf and music have been socialized. If school spend-ing is to he standardized, this source of public revenue is eliminated,
iand the parental spending is diverted into the private sector whereeconomic class lines are sharply drawn.
Let me emphasize this problem by reference to a homely exampleof concern to me, For many years, the Ann Arbor Schools have de-voted three to five percent of their budget to a first class music pro-Frain, providing instrumental instruction to all children beginningin the elementary grades, and producing school orchestras and choralgroups second to none anywhere. This investment of funds has beenthe result of long-term efforts by perhaps two percent of the parentsof Ann Arbor, who care enough about quality music to speak up forit. The result of their efforts has been the enrichment of the lives ofmany children, some poor, some not so poor, and many from familieswhose interests in music was outgrown when Tommy Dorsey wentoff the air. To be sure, this social benefit weighs lightly against thegreat social needs of our time. I one would choose to spend moneyon such a program as an alternative to mass transit. But as long L, itis the rich people of Ann Arbor (rich culturally, as much as economi-cally) who are willing to pay the price themselves, or who are willingto bear political responsibility for raising the revenue by taxing their

Equal Justice and School Finance 11)
neighbors, who is hurt by such expenditures? What kind of egali-tarianism is it that compels those super-caring parents to devote theirefforts to upgrading private music lessons, where the poor and themusically ignorant 1%111 be shut out? The response of some casualequalizers is to direct these parents to Lansing, where they can urgea first-class music program for all the children of the state. Bless them,it would indeed be wonderful to share that program so widely. Butin Lansing their voices will be among the smallest of the many clam-oring to be sponsored in the state budget. First class, elite, music in-struction has no better chance in Lansing than a palm tree. Indeed,even within Ann Arbor, the continuation of the program has beenthreatened by the reluctance of Ann Arbor Schools to continue spend-ing so significantly above average levels. Perhaps such islands of elitismin the public sector are all doomed, anyway, but it is hard to see thattheir abolition will, as a practical matter, advance the historic aimsand values of the Fourteenth Amendment.
Thus, if the state is unwilling to exploit the protective instinctsof middle class parents for a constructive use, others will exploit itfor profit. Meanwhile, I would emphasize, money which these parentswould not be supplying to the public would be partly replaced bymoney which must be taken from other public uses, perhaps publictransportation or housing. At the least, this would seem to provide areason for some legislative reliance on the local property tax, sufficientto withstand justice White's inspection, assuming the foundationgrant provided by the state can he demonstrated to provide a reason-ably adequate basic program for all children.
The sixth practical difficulty listed was the fate of local control ifthe no-wealth principle is embraced. It will be recalled that Texassought to justify its program as a rational accommodation to the needfor local control, that Justice White expressed the view that therewas no reasonable relation between that policy and the Texas law, andthat Justice Marshall challenged the sincerity of the assertion on theground that there is no local control in Texas, anyway.
The position of justice White that there is no necessary relationbetween local financing and the measure of local control is not with-out support. A study by the Urban Institute found no correlationbetween the measure of local autonomy and the proportion of schoolmoney provided by the states. Experience in Scandinavia confirmsthat local control can be exercised over centrally provided funds. Nev-ertheless, common sense indicates that there must be some relation be-tween local control and local funding. While state legislators can takepolitical responsibility for raising the revenue and might refrain fromexercising authority over its expenditure, there is steady political pres-sure to intervene. As Professor Simon of Yale has pointed out, thistendency is likely to he powerfully activated by the probable develop-ment of state wide collective bargaining. If the state is the primarysource of funds, the economic pressure must be applied at that level,and the bargaining process will prove difficult to contain. Contractswill often control a variety of issues such as class size, level of auxil-iary services, tenure practices, and discipline, which are now cone
1'1

174 School Finance in Transition
trolled in significant measure at the local level.The forecasts arc to some extent confirmed by contemporary be-
havior. State school officials greeted the Serrano decision with a una-nimity and vigor which bespoke an enthusiasm for egalitarianism nottheretofore revealed by their actions. Their instinctive reach for powerseems also to be reflected in the New York Fleischmann Commissionreport. That report advocates full state funding as g means to greaterequality in education, and also strongly advocates greater communitycontrol over education. One of the arguments advanced for full statefunding is that it will enable the state to exercise greater control overhow the money is spent. Insensitive to any paradox, the report thenelaborates, for hundreds of pages, new standards to be imposed onlocal schools, including some requiring greater community control.
Concern for local educational autonomy is also confirmed by theadvocates of the no-wealth principle themselves. It will be recalledthat a major reason for the efforts of Professor Coons and his associ-ates to identify the interest they sought to advance as fundamental wasto leave the rest of local government in tact. Moreover, they also wentto considerable length to develop an alternative method of school fi-nancing which they have advanced as a more constitutional methodof preserving local choice of school spending levels. This system,known as District Power Equalization, would, in short, move funds-from richer districts to poorer districts in such a way that a dollar oftax would produce the same return in school spending wherever it iscollected, each district receiving an equal public fisc for equal taxeffort. As Justice Powell noted, however, this method of finance hasnot been tried. Is it not clear that it would work, that it is politicallyviable, or that it is, indeed, really consistent with the no-wealth idealinasmuch as spending discrepancies would remain and might be moreclosely linked to median family incomes within districts. In additionto District Power Equalization, Professor Coons is laboriog to developother methods of promoting local control in state-funded schools.
Given all these circumstances, it is very difficult to agree with Jus-tice White that there is no reasonable relationship between local con-trol and the use of a local finance base. It is equally difficult to agreewith Justice Marshall that local control of education in Texas is asham. As Justice Powell noted, the local districts in Texas do retainthe power of eminent domain, the power to choose school sites, thepower to hire and fire teachers, the power to maintain discipline, and,most relevantly, the power to fund or not to fund a variety of educa-tional programs. Justice Powell was correct in finding that the Texassystem was a rough accommodation of the conflicting forces identifiedby Professor Coleman of Johns Hopkins as: "the desire by members ofsociety to have educational opportunity for all children, and the de-sire of each family to provide the best education it can afford for itsown children."
On the other hand, it seems timely to question the desirability ofthe goal of local control. This is an heretical question, but a relevantone nonetheless. It is a fairly well established feature of Americanpolitics that minority interests are more heavily weighed in decisions
fr.,-116 F 1 4.0

Equal Justice and School Finance 175
made in larger units of government. There are several apparent causesfor this phenomenon. One is that smaller groups tend to produce morestable political organizations which are less dependent on the supportof marginal minorities. Another is that smalltime political activitiesattract less attention and are thus the preserve of the most attentiveconstituency, which tends to be the majority groups. It is, thus, hardenough to turn out minority voters in a presidential election, andalmost impossible in a school board election. Accordingly, althoughthere will be local exceptions, effective programs of compensatoryeducation are more likely to emerge from statewide policymaking thanfrom local policymaking, and still more likely to emerge from federalpolicymaking. Reduction of local influence on schools might, indeed,be the most benign consequence of the implementation of the no-wealth principle, but it is the consequence which its authors are atthe most pains to minimize or prevent.
Thus, it is especially painful to read the suggestion advanced inboth the California Senate Committee report and the New YorkFleischmann Commission report that local school boards will be re-lieved of the onerous duty of raising money so that they can devotemore time to school policy. This is visdom reversed. If school politi-cians like myself, and their camp followers, had solutions to the prob-lems of school failure which beset our most needful children, thoseproblems would have been solved. While there is a visible tendencyof educators to sink into uncreative routines, and thus to require oc-casional external prodding, it is very doubtful that low-visibility, part-time politicians provide any such constructive stimulation. If localschool boards are not to be permitted to perform their historic func-tion of raising money that is not otherwise available to the public,it would seem the better course to eliminate those bodies altogether.
This observation bears on what seems to many the ultimate solu-tion to all the difficulty, federal funding. Even the federal budget isfinite. If some of it is available to provide for more equal educationalopportunity, how should it be spent? Reasonable minds may differabout the answer to that question, but few who are attentive to theconsequences would urge that the best course is to put the money inthe hands of local school districts to spend on tax relief and pay oramenities for teachers. Equalizing the money available to local schoolpoliticians may provide a kind of equality for them and for teachers,but it won't do much for the children most in need of better school-ing. This has been made very clear by our experience with Title I ofthe Elementary and Secondary Education Act. Although money dis-tributed under that legislation was earmarked for the educationallydisadvantaged, one local district after another diverted those fundsto non-compensatory uses. The lesson of that experience is that morefederal control, not less, is needed. Generalized revenue-sharing, withless rigorous federal control, is not responsive to the needs of disad-vantaged children. Those whose primary commitment is to the socialideal embodied in the Fourteenth Amendment must find any pro-posal for unrestricted local spending of federal money to be a mis-direction of scarce public resources.
.111 101.4 dr)
d.

176 School Finance in Transition
The complexity of the local control issue may be illuminated bya note of comparison. Post-revolutionary French governments, stronglymotivated by the goals of equality and fraternity, emphasized a na-tional educational policy which obliterated family, community, andlocal control. French children, from Provence to Brittany, study bythe same lesson plan. Partly as a result of this system, as is well known,the French people came not "to care what you do as long as you pro-nounce it properly." The elimination of French dialects. which werethought to be sytnbols of class distinction, was a major program ofcompensatory education which worked. It worked because of tightnational control. On the other hand, such systems do have a price,even in equalizing effects. Those families who care the most aboutschools and learning, whose children have the most to give to theirpeers, go to private schools if they can. It is perhaps not an unrelatedfact that public education in such countries gets little support fromthe intellectual and economic elite and is endemically underfinanced.
The seventh and final dlificulty with the no-wealth principle is thatit poses a grave problem of judicial administration. This is very mucha legal consideration, although Justice Powell made no reference tothe difficulty in his Rodriguez opinion, but it was clearly raised by thedecree entered in the trial court. That decree created a significant pos-sibility of a kind of constitutional crisis which might have been verycostly to resolve.
The court below did allow the Texas legislature an extended pe-riod in which to create a new system of school financing which wouldcomply with what the court perceived to be the constitutional require-ments of equality. One need not suppose that the Texas legislaturewould defy the federal court in order to consider the possibility thatlegislation might not be forthcoming: legislation does require con-sensus and it is easily imaginable that none would form. In the eventthat the legislature did not act, the court decreed that the state Boardof Education would reallocate the funds derived from local schooltaxes in a manner that would conform to the constitution. It seemsalmost probable that if this should occur, local districts would repealtheir levies rather than provide funds for use elsewhere. The resultwould be that the court and the state board would be left to equalizespending with a reduced total outlay for schools. Chaos would be themost probable result. The court and the legislature would have toshare responsibility for closing the schools. In order, presumably, tosave our schools. we would first destroy them. Such arrogance is morethan unseemly. It would be far more harmful to public confidencein all the institutions involved than continued inequality, howeverviewed.
To be sure, the Supreme Court has assumed similar risks in issuingdecrees which called for legislative responses. The reapportionmentcases are the best examples. But the alternatives of at-large electionsor provisional court-drawn districts were far less harmful as ultimatejudicial responses if the legislature should fail to act. judicializationof the public fist poses a remediation problem of a different order ofmagnitude than reapportionment because the courts have no way of
/44

Equal Justice aad School Finance 177
generating revenue. Or so it would seem. It would, to say the least,be a new departure in judicial activism for the court to establish andenforce its own revenue measure. Yet that would seem to be the onlyeffective alternative open to the court if it were to opt for the no-wealth principle and yet avoid the risk of a destructive challenge tothe legislature such as the one the trial court in Rodriguez had posed.
Some of the practical difficulties which have been identified mighthave been avoided if the architects of the attack on unequal financehad considered the remediation problem first. One advantage of thisapproach is that it might have helped them to maintain eye contactwith the historic Fourteenth Amendment goals which they sought toserve. Thus, there is one remedy which a court might employ to cor-rect some financial inequities, which would have the apparent effectof increasing the resources available to those most in need of bettereducation. The remedy would be to order the fiscal federation, orthe consolidation for fiscal purposes only,. of rich and poor districtswithin a metropolitan area. This remedy could be achieved by courtorder without direct challenge to the legislature. and with much lessdisruption of continuing educational programs. Although by no meansfree of adverse social consequences of the sort identified, the remedywould he more attuned, in its practical results, to the aims and valuesof the Fourteenth Amendment than fuller implementation of the no-wealth principle in a manner involving all the schools in a state. Un-fortunately, the more constructive remedy of metropolitan fiscal fed-eration is so poor a fit with the no-wealth principle that it is unsuitedto enforce it.
It would seem to have been a better service, if it were possible,for the architects to design a principle that would have fit that rem-edy. I have elsewhere tried my hand at that task, without, alas, anyapparent success, But there may be reason to hope that the SupremeCourt of Michigan will use such a remedy if the Michigan legislaturedoes not respond to its initial proclamations declaring the existingscheme unlawful. Perhaps such a remedy might have commended it-self to Justice White if 16 had prevailed in Rodriguez.
I have elsewhere declared the advocates of the no-wealth principleto be quixotic. They did, indeed, mount a myopic attack on a service-able mill, the local property tax. And there was a significant risk thatthey would be more harmful than helpful to the ultimate intereststhey sought to advance. It is my impression that this appraisal is be-coming somewhat more widely shared. As it does so, the no-wealthprinciple seems likely to subside. Practical men, alert to all the social,economic, and political consequences, will join in the Court's ap-praisal that the cost is too high, if all that we accomplish is an ethicalgesture.
For the time being, therefore, the problem of equity in school fi-nance remains a legislative problem. It is well that this is so, I think,because the problem is so complex, so polycentric, that almost anyjudicial intervention promises to be counter productive. Courts mustact on principles; principles are realistic only if they nre nkiressedto simpler problems than those of school finance; only those having
.1.745
178 School Finance in Transition
no such commitments to clear reason, can accommodate all the con-flicting values involved. Legislatures are such organizations. There wassomething quite awry that a novel, complex, and consequential ideasuch as district power equalization should be designed for presentationto a court, for no court is suited by composition or process to give ita fair appraisal. The legislative work will be tedious, and at timesdisheartening. but it will be done.
On the other hand, it should not be assumed that no school financelitigation will succeed. If the plaintiffs can identify themselves as atruly broadly disadvantaged group, and can show that they really aredeprived of effective basic educational services, and can limit the focusof their attack in a manner that makes a judicial remedy manageable,they may well prevail. All dna the Supreme Court has demonstratedin Rodriguez is that it will not challenge forty-nine legislatures to apolitical variation on the game of chicken, for the purpose of confer-ring an uncertain benefit, on children who have demonstrated no spe-cial need, at the expense of unidentified taxpayers and consumers ofother public services. Less demanding plaintiffs may well get a morefavorable reaction.
Meanwhile, we should give the champions of the no-wealth prin-ciple their due. What could be more becoming to Justice Marshallthan to invoke, on behalf of children who are neither black nor poor,the very right which he won so bard as the advocate of those poor,black children in his great victory of thirty years ago? His action andhis words bespeak a commitment to principled decision-making whichis the blood of the judicial enterprise. And of Professors Coons, Clune,and Sugarman, it must be said that they overran their target becauseof what may seem to some of us an excessive commitment to an ethi-cal ideal. But it is just such ethical idealism which redeems Americanlaw from being a harsh oppressor of the powerless. Over the longerarc of time, the future is with them.

Alternative Fiscal Solutions to EquityProblems in Public School Finance
G. ALAN HICKR0D
Professor of Educational Administration, Illinois State University.
"The ultimate wisdom as to these and related problems of edu-cation is not likely to be devined for all time even by thescholars who now so earnestly debate the issues."
Justice Powell in San Antonio Independent SchoolDistrict, et al. v. Rodriguez, et al.
APICES RODRIGUEZ
In the short time that has elapsed since the announcement of theRodriguez decision a heavy gloom has descended upon some membersof the school finance reform movement. It seems appropriate thereforeto devote some opening remarks toward lightening this pessimisticmood. In the first place the writers of the majority opinion did goout of their way to indicate that they were not endorsing the statusquo. Specifically they said, ". . . certainly innovative new thinking asto public education, its methods and its funding, is necessary to as-sure both a higher level of quality and a greater uniformity of op-portunity. These matters merit the continued attention of the scholarswho already have contributed much by their challenges."1 While thecourt was thus inviting the academic community to continue the in-vestigation of fiscal systems for education, it was also placing the re-sponsibility for upsetting the status quo squarely on the heads of thestate legislators: ". . . the ultimate solution must come from the law-makers and from the democratic pressures, of those who elect them."2Any state legislator therefore who believes now that the "heat is off"has badly misinterpreted the intent of the court and is indulging in
179
Al 110t-0$
180 School Finance in Transition
wishful thinking. To the contrary, this particular kitchen is onlybeginning to get warm.
There are some other points that might be made for the benefitof those reformers who find their enthusiasm at low ebb after Rod-riguez. There is still hope for reform in the state courts in suits whichrely upon specific items in different state constitutions." The out.comeof these cases will, it is true, give the school finance world even morethe appearance of a "coat of many colors" than it already has. Muchwill turn on the language of the education articles in each of thestate constitutions. It is probable that some of the older constitutions,particularly dose modeled after the Northwest Ordinance, will offermore possibilities for litigation than constitutions which have beenmore recently revised, or in the case of Illinois, completely rewritten.A great deal will also rest on the "strict constructionist" versus "broadconstructionist- traditions of each of the state courts. School financereformers will also now be.turning their attention to plans for amend-,ing the federal constitution to make it speak more directly to thequestion of whether education is a "fundamental right." The notionof adding an education article to the federal constitution is not new-,but it usually has been torn to pieces on the reefs of the church-stateissue before it has had a chance to make even a maiden voyage.
The silver lining in the Rodriguez cloud may be that it will affordus a sorely needed breathing spell in this hectic race for school financereform that has been so obvious in the _last eighteen 'IL-midis. No mancan say with certainty just how many "alternatives" have been pre-sented to state legislatures since August of 1971 when the SupremeCourt of California handed down the Serrano decision. By referringto the reporting facilities of organizations like the Education Com-mission of the States, the Lawyers Committee on Civil Rights UnderLaw, the National Organization on Legal Problems of Education, thevarious divisions of the United States Office of Education, and ofcourse the National Educational Finance Project, it is apparent thatthe number of serious fiscal proposals before state legislatures cannow be counted in the hundreds. Even those of us who have beenactive in this field for some time find it quite difficult to keep postedon all the proposals being put forward by responsible groups andindividuals. We do, indeed, need time to step back and observe theforest instead of being lost in the trees. Such is the purpose of thispaper, to consider again the ancient problems of equity in school fi-nance and then to analyze briefly the strengths and weaknesses ofsome alternative solutions that have been proposed for these prob-lems. That we have been working this forest for no less than sevendecades is perfectly true. Elwood Cubberly first pointed out the equityproblems III school finance at the turn of this century.4 We wouldnot have the audacity to take up the axe again were it not for thecertain knowledge that each new generation reinterprets these oldequity concerns in a different perspective as the years progress. Surelynone would deny that the recent wave of school finance litigation hasadded new and interesting dimensions and this fact, we hope, justifiesyet another logging expedition.

Alirmalive Fiscal So lutions 181
Before we start felling the trees, however, it might be a good ideato remind ourselves that the solutions that men pose to serious socialand economic problems do have a way of baknring on them. Thatgreat legendary figure of the North. Paul Bur you. learned this thehard way. It seems the forests of the North were plagued by swarmsof particularly discomforting mosquitoes. Word reached Runyon thatin Louisiana they had developed a specie of fighting bee that de-stroyed mosquitoes. Bunyon was delighted to hear this good news andlie promptly sent for a sample of the bees. For while 'things werefine and the insect civil war proceeded in excellent fashion as thesouthern bees kept the northern mosquitoc,; in check. thifortunatey,the bees and the mosquitoes started behaving like people; that is, theygot tired of fighting. settled down, and intermarried. To his horror,Bunyan then discovered that the progeny of this miscegenation turnedout to have stingers on both ends. It would not be t:Ifficult to findstate department personnel, or members of state legislatures, whchave discovered that imported new ideas in school finance, whengrafted without proper inspection on native stock, turn out to havestrange and bitter fruit. States who have invited outside experts toinvestigate their educational fiscal structure would be well advisedto inspect their "southern bees" carefully.
ASPECTS OF THE EQUITY PROBLEM
Rodriguez has not changed the economic and fiscal facts, only thelegal interpretation of those facts. In this section of the paper weshall endeavor to show that the equity problems persist no matterwhat the courts have said about them in the past, or are likely to sayabout them in the future. After all, if we are to believe Mr. JusticeStewart, a method of financing the public schools can he both "chaoticand unjust" and still remain "constitutional." and it might also berecall "d that even Justice White, who found for Rodriguez, was con-strained in another caw to note that ". . . the Constitution does notprovide judicial remedies for every social and economic ill."
First, there i the matter of possible inequities among taxpayers.Table cne contains some basic data which sets the stage for considera-tion of this aspect of the equity problem. In this and other illustra-tions in this paper the author has drawn upon data from Illinoisfor two reasons. First, he is inure familiar with that state than withother states, and secondly, that state has recently completed no lessthan six volumes of school finance stitches that provide a good dealof material for everyone interested in these matters." Parentheticallyit might be .iaid that Illinois is also a particularly good place to studythe many aspects of the general equity problem. States which arelarge in size, which have many school districts, and which have ex-tremes of wealth are particularly prone to equity problems and !lli-nois, unfortunately, fits all three requirements very well.
It will be observed in table one that if two taxpayers of equalindividual wealth resided in the Maple Grove Elementary School andthe Metropolis City Elementary School the unfortunate taxpayer re-

182 School Finance in Transition
TABLE IBASIC TAXI,AVER Equal l'anntxm
(h.timns DATA)
District
1964 YotalFAuc. Tax Bale
(per $100)
1970 oprr,Expenditure
per pupil
-_-_.1968 Ass.Valuationper pupil
Maple CraveElementary 0.41 1,583 387,835
Metro. CityElementary 1.72 628 11.68(1
Joppa H.S. 0.83 1,901 257,853Metro. City
Elementary 1.74 814 27,769Chicago Unit 2.53 1,053 23,407Brockport Unit 2.73 669 3,612
Note: All except Chicago are in Massac County.
siding in Metropolis City will pay a rate over four times as great asthe taxpayer residing in Maple Grove and yet that unfortunate tax-payer would receive a bundle of goods and services priced at less thanhalf of those received by his more fortunate neighbor in Maple Grove.Lest it be argued that these differences are really cost differentialsand do not reflect quality levels it should be pointed out that theseare neighboring districts located in the same county in southern 1111-
nois. A similar situation exists r. the fortunate citizen in the Joppahigh school district and for his infortunate neighbor in the Metropo-lis City high school district. Citizens in Chicago versus Brookport.which are located at opposite ends of the state of Illinois, are notquite so far apart in terms of tax effort, but their similar tax effortproduces quite different results. This lack rot equity for taxpayersexists in varying degrees in all states of the Union. Even in the stateof Hawaii, where full state funding has been the rule, some localamounts of "add-ons" have been allowed in recent years which thenreintroduce the equity problems. Although economists are far frombeing in agreement as to how to evaluate this situation, at least somebelieve that this state of affairs violates the principle of public financeknown as the "equal treatment of economic equals."
Perhaps, however, one is not interested in this "horizontal" tax-payer inequity matter but rather in what is sometimes termed "ver-tical" equity; that is, the equal treatment of economic tinequals. Ifsuch is the case then the soape of the distribution of expenditures perpupil will likely become the focus of attention. Those who study thisfacet of ti,c equity coriplex are usually more concerned with effectsupon students than with "fairness" among taxpayers. Figure one showsthe distribution of expenditures pet pupil in most states outlinedwith a solid line. The evidence indicates that this is a skewed distri-bution.' Malty would argue that the desired distribution is that indi-cated by the dashed line, that is, a distribution whose variance hasbeen reduced by making the distribution approach the shape of a

Alternative Fiscal Solutions 18)
normal or bell-shaped distribution. This school of thought frequentlyconcentrates upon "leveling up" expenditure levels for the poorerschool districts, or, in terms of the diagram, shifting the curve to theright. In some cases this school of thought holds that the expenditurelevels of the more affluent districts must be frozen in order to ap-proach this desired "normal" distribution. A closely related school ofthought argues that there is some "permissible" variance that societywill be willing to tolerate among economic unequals. It i, !..t.1:1 thatperfect equality is not desired, but that the variance should be heldwithin socially "permissible" limits. The works of Arthur Wise con-tain several references to this notion." In this theoretical formulationequity is to be sought by reducing the variation in expenditures perpupil, in tax rates, and in wealth among school districts. Many amongthis group would also insist that the real desideratum is to eventuallyreduce the variance in achievement test scores or in some other meas-urements of school output. Titus all students would leave the commonschools (K.-12) on a more equal footing than when they entered thoseschools, and the race for rewards after the common schools would be-gin on a more equal basis.
The defense of this particular notion of social and educationalequity is more political than economic, and is of very ancient deri-vation. Relying on a stream of thought that is traceable at least toJefferson, and probably to Aristotle, it is maintained that the bodypolitic is neither safe nor stable if there exists great variations inpower, wealth, and knowledge. The defenders of this view of societywould seek to establish a broad middle class, well educated citizens,and active participants in the political process. This "golden mean"would then become the major underphuung of a democratic society.Ii Iced, the notion of "one man, one vote" itself assumes a configura-tion of society not greatly unlike the one sketched here. Extremes ofwealth, knowledge, and power would be allowed, but would be con-trolled, hence the origin of the normal curve shape. Such an ideologyalso assumes correlations among the three factors of knowledge,wealth, and power, and that assumption would be challenged now bysome educational analysts.°
There is a third dimension of equity that has arisen out of recentschool finance litigation. This has understandably been expressed inlegal and constitutional terms; however, it is not necessary, nor is iteven desirable to always address the issue from the point of view ofthose who wear the coif. We have reference to the notion of "fiscalneutrality." This aspect of equity can also be approached from asocio-political frame of reference, in fact, as the efforts of Aiken andClime tend to show, a defense on strictly economic grounds may provedifficult." It can be argued that status in an open and democratic so-ciety should be achieved by individuals through their own meritori-ous behavior rather than being ascribed to them by the conditions oftheir birth. This ascription of opportunity can very well include thewealth of a school district into which a student happens to be born,or into which his parents happen to move. Grubb and Michelson/speak of this in terms of 11. . . disassociating school resources flowing

184 School Finance in Transition
Actual---- Desired
LowExpenditures, Services, or Product
Figure 1Permissible Variance Model
to children from certain inequities among their parents . . ." andcorrectly point out that the fiscal neutrality concept views children as
. . . Independent of their parents and equal citizens of the state"Much broader philosophical justifications for this support of achievedstatus over ascribed status can be found in Vilfredo Pareto's conceptof a "circulation of elites" or in Arnold Toynbee's similar notion ofa "creative minority.""
On a more practical plane the goal of fiscal neutrality is simply astate of affairs in which local district wea!th will no longer determinethe level of goods and services that are provided to students in anarea as crucial to their life chances and upward social mobility as isK12 education, It is also maintained that where local wealth hasacted to create unequal ascribed levels of educational services thenstate, governments have a positive duty to redres3 this situatioa. Infact, it has even been argued by some that this is the first and fore-most duty of state departments of education." All of this may soundto some like quite revolutionary talk, but actually the fiscal neutralityconcept is much more conservative than at least some versions of thepreviously described 'permissible variance" notion. In the first place,as Guthrie and Levin are continually reminding us, if we reallyarc to take the "permissible variance'' notion seriously then we mustproceed to allocate sonic multiple of the dollars to the poor districtsthat we now allocate to the rich districts. To put the matter anotherway, for all adolescents to start the race for rewards in life on an equalfooth$ at the time they divest themselves of mortarboard and gownfolowmg high school gradua ion requires that the state governmentsmake considerable investmen s in students from the poorer districts.This is true since there has been such a low level of human capital
1. ,ftd

Alternative Fiscal Solutions 185
formation prior to formal schooling. Fiscal neutrality would requireno such large compensatory investment schedule since it restricts stateresponsibility to countervailing only local school district wealth. Thosewho advance fiscal neutrality as a proper state goal are much morelikely to talk in terms of school inputs rather than in terms of schooloutputs. It can not be denied, however, that a state which moves to-ward fiscal neutrality may also find itself reducing the variance inexpenditures, services, and perhaps even output, but that is not themajor purpose of the fiscal apparatus.
Fiscal neutrality is also conservative in another context. To makeeducational service level decisions independent of local wealth levelsis to enhance local control rather than to restrict it. The joint dissentby justices White, Douglas, and Brennan held that the states, ". .
must fashion a financing scheme which provides a rational basis formaximization of local control, if local control is to remain a goal ofthe system. . . :45 Adoption . of fiscal neutrality would provide asetting in which, for the first time, poor school districts would haveas much meaningful local control as would rich districts. Fiscal neutrality certainly does not prohibit, and may in fact promote, differentlevels of educational spending due to differences in local school boardsand differences in the preferences of local populations for educationas opposed to other forms of goods and services. In this light it can
4.Ca)
a.Low 00
Students Ranked by Wealth
Gs 0.30100
Figure 2Disequalizing Effects of Local Resources Shown by Lorenz Curve
e)L.

186 S....haal Finance in Transition
be argued that the notion of fiscal Neutrality enhances local consumersovereignty rather than restricts it. Indeed, it is exactly this continuedvariance in expenditures that worries most of the critics of fiscal nett-trality. Later in this paper we shall review such criticisms.
If one does accept the notion of fiscal neutrality as a desirablegoal of state educational fiscal policy then still further questions re-main to be answered. Bow are we to know when this "neutrality"has been achieved; in prior. research cattchtcted lay the author andby others it has been held that a statistical tool from the discipline ofeconomics. known variously as the Gini coefficient, Gini index, or in-dex of concentration is an appropriate technique for operationalizingthe concept of fiscal neutrality. It appears to have several advantagesover tilt Pearson product moment correlation and other statisticalwchniqrs.1° Figure two shows how this measurement works. Thecumulative percentage of students ranked by wealth is compared withthe cumulative percentage of expenditures from state and localsources. It is also possible to make this comparison separately for ex-penditures locally raised, and then for expenditures raised both locallyarid front state sources. When absolute fiscal neutrality is reached thelowest 10 per cent of the students ranked by wealth will then receive10 per cent of the expenditures available for education, the lowest20 per cent will receive 20 per cent, etc., etc. Such a function is thenthe straight line described in figure two. The. conservative nature ofthe fiscal neutrality concept is now fully revealed since a truly com-pensatory fiscal model would require that the lowest 10 per cent ofthe students ranked by wealth should receive more than 10 per centof the total funds available for education. To the extent that anygiven state's educational allocation system then departs from fiscalneutralitiy a curve will be described which departs from the straightline, This curve, sometimes called a Lorenz curve, will pass. throughpoint B rather than point A. In such a case the lowest 10 per centof the students ranked by wealth will receive less than 10 per centof the state and local funds available for education, the lowest 20 percent will receive less than 20 per cent, etc., etc. A numerical valuecan be assigned to the degree to which the curve departs from thestraight line by a number of ft,cans. An appendix to this paper pre-pared by professor R; mesh Chaudhari sets forth one possible calcu-lation procedure. Readers interested in the computer software neces-sary for su. u a calculation are urged to correspond with professOrChatulliari.17 The Gini coefficient can have either positive or negativevalues depending upon what variables are placed upon the ordinateand the abscissa of the graph. The difference between figure two andfigure three illustrates the effect of state aid in moving a state towarda conditi in of fiscal neutrality.
EQUITY IN LONGITUDINAL PERSPECTIVE
It seems particularly appmpriate for state departments to conductlongitudinat investigations of progress toward, or perhaps departurefrom, some of these equity goals. In order to encourage such studies
14

Alternative Fiscal Solutions 187
this portion of the paper will extract some data from such a study in111inois.'s In figures four, five, and six the "permissible variance" no-tion discussed previously has been used. The operational specificationof this concept was in terms of the so-called "coefficient of variation,"that is, the standard deviation divided by the mean and multiplied by100. Division by the mean is necessary to partially offset inflationaryeffects on these measurements. Other Widowed techniques could havebeen used; for example, one might have placed all the variables intotheir logarithms and then compared the simple variances of these re-sulting log distributions.
Figures four and five indicate that the relative variance has indeedbeen dropping in Illinois with regard to expenditures per pupil andwith regard to tax rates for educational purposes. If the equity goalis to reduce the variance and therefore make it more "permissible' or"acceptable," then Illinois has moved in that direction. That thismovement has aot been due to equalization of wealth among schooldistricts can be seen from figure six. While high school districts showa reduction in wealth variance this is not true for unit districts, noris it true for elementary districts. One should not
inautomatically
to the conclusion, however, that this reduction in expenditure andtax effort variance has been the result of deliberate state fiscal policy.Some of the reduction might be attributed to selected state fiscal poli-cies such as raising the minimum teacher salaries allowed in Illinois,
High 100
Low 00
Percent100
Students Ranked. by WealthFigure 3
Combined State and Local Resource Effects Shown by Lorenz Curve
1"., .11

188 School Finance in Transition
VARIATION OF PER PUPILOPERATING COST
29-
27
HIGH SCHOOLDISTRICTS
Z 25 ELEMENTARY
FE 23
u.o 21- v= ST. DEV. /00MEAN
UNIT DISTRICTS
1363 64 65 66 67 68 69 70 71
YEARFigure ,1
(a to the effects of certain aspects of the general aid formula, However,it is much more likely that these reductions in variance among schooldistricts within states are due to broader social and economic forcesoperating in the society such as the effects of collective bargaining byteachers or the rising expectations of rut, areas for better educational

30
Alternative Fiscal Solutions
VARIATION OF TOTALiAX RATE
189
29
284.
0 27 ELEMENTARY
z 26-25-
HIGHE 24- SCHOOL
> 23-wo 22-i-z 21-w5 20-tt 19
U 10.iu17
16-
1563 64 65 66 67 48 69 70 71YEAR
Figure 5
services. Some support for this broader interpretation can be foundin table two which reproduces data compiled by Marian Bendixsenfor the National Committee for the Support of Public Schools.'D Itwill be noted that variation among distrtcts in expenditure per pupil
r did drop strikingly in the United States from 1940 through 1960 butthat the reduction since 1960 has not been so pronounced. The prowress of the states on this criterion does vary and may be due in partto various degrees of district consolidation and reorganization that
UNIT
4.""*1

190 School Finance in Transition
87
86
85
84
83
82
81
54
53
52
51
50
49
48
47
46
45
44
43
Variation of Wealth Per Pupil
63 64 65 66 67 68 69 70 71Year
Figdre 6

Alternative Fiscal Solutions 191
have taken place during this period of time. The particular measure-ment used, i.e., the range between the 98th and 2nd percentiles, takenin the form of a ratio, is unfortunately quite sensitive to a few deviatedistricts and may therefore not be quite ah reliable as the variance. Onthe other hand such a ratio does not need to be corrected for infla-tionary effects, which is necessary when the variance is used.
TABLE 2RATIOS OF EXPENDITURES OF 98TH TO 2TO PEACENTILE
(SELECTIONS FROM BENDIXSEN DATA
39.40 19.50 59.60 66.67
United States 15.50 5.53 3.86 3.14New York 4.03 2.78 1.84 1.98Illinois 5.30 4.93 2.49 2.46Michigan 4.77 4.08 3.49 1.88California 2.86 2.17 1.91 2.27Colorado 4.38 3.36 1.86 1.73Nevada 4.36 2.86 1.37 1.14Utah 1.68 1.33 1.42 1.32Wyoming 4.97 5.13 1.98 2.08
It might be tempting to some to draw a policy conclusion fromthis reduction of variance which could be described as "do nothingand let time tAke care of the inequity problem." There are at leastthree reasons why that would be unsound. In the first place we don'thave enoirg-IFIdngitudinal studies to be perfectly sure of this trend.Secondly,-In the event that what we are observing. is due primarilyto school district reorganization and consolidation, then there is goodcause to expect this variance to stabilize and reduce not much further.In many states school district reorganization can not proceed muchfurther without encountering problems of morale and motivation in-herent in very large school systems. Illinois, one should very quicklyhasten to add, is not such a state. There are still over eleven hundredschool districts in Illinois and this accounts for much of the equityproblems in that state. But there are logical limits on the degree thatconsolidation can solve inequity problems even in Illinois. Consoli-dation and reorganization can make the greatest contribution whenit possible to merge richer districts with adjoining poorer districts.Unfortunately we know that in many metropolitan areas the rich dis-tricts are found contiguous to one another in geographic clusters andpoor districts are likewise grouped geographically together. Very littleprogress CAI be made toward greater equity by merging a cluster ofsmall poor districts into one larger poor district.2° Finally, we aretalking of trends here over at least twenty years and probably longer.It is unlikely that the social and political forces desiring more equalityof educational opportunity are willing to wait decades for the 'auto-matic" accomplishment of such a goal.
Figures seven, eight, and nine illustrate the application of the Ginicoefficient. Illinois, like California and a few other states, is plagued

192 School Finance in Transition
Gini Coefficients for Elementary School Districts
.25
Local
Local 8i State
1965 66 67 68 69 70 71
YearFigure 7
110

.25
Alternative Fiscal Solutions
Gini Coefficients for High School Districts
19.7,
20 -
.05 -
.001965
Local 8 State
66 67 68 69 70 71
YearFigure 8
:"

191 School Finance in Transition
.25
Gini Coefficients for Unit Districts
.20-
.15 -
.05 Local & State
.001965 66 67 68 69 70 71
YearFigure 9
Abet waive Fiscal Solutions
with so-called "dual districts,- that is separate elementary and highschool district. as well as the normal K-I2 jurisdictions. This greatlcomplicates all fiscal an:11Ws in the state. With regard to these %ilia-tate elementary and high schtail districts. it appears that some limitedprogress has been made toward achieving fiscal neutrality; however.the progress is so slight that one need hardly call attention to it. Inthe important category of unit distrit Is. e.g., the K.I2 jurisdictions.there has been no progress toward achieving fiscal neutrality duringthe period under analysis, 1965-I97 I. To put this matter another Way.in the unit districts of Illinois. the poorer students were receiving justabout the same slice of the pie at the end of the time period thatthey were at the beittning of the time period studied. A major limi-tation upon this knid of analysis must be acknowledged, however."Poor" students are operationally defined in this study in terms of theproperty valuation per pupil of the district in which they happen toreside. This may well be a weak specification of wealth in spite ofthe tact that it is the definition currently used in most grant-in-aidlormulas throughout the United States. The literature on the dis-agreement over how to measure the wealth of districts is large and oflong standing. We shall look at a new twist on this old problem atthe conclusion of this paper. It is certainly possible that elilierent find-ings might emerge it income were used in the longitudinal studiesrather aim property valuations per pupil. However, in many statesincluding Illinois, this verges on idle speculation since the possibilityof obtaining a time series of district income data is virtually nil.
ALTERNATIVE SOLUTIONS TO THE EQUITY PROBLEMS
Assuming state legislatures and state departments of education arcat least mildly interested by the foregoing recital of equity problems,what alternative solutions are available? School funat.ce analysts haveshown a proclivity for manipulating the allocation side of the generalfiscal equation rather than the revenue side to achieve equity goals.This may well be a mi.itake since equity goals can also he sought onthe revenue side of fiscal matters. However, a tradition that is seventyyears ohl is not easily broken and this paper wilt also concentrateupon equity solutions that stress allocation procedures. NVe shall firstdescribe saute haste choices that a state must make and then explorethe specific problems connected with each of these choices.
Conceptually, one can think of four levels of choice that the statemust make in designing its educational fiscal system. The most basicchoice consists of whether funds will be raised entirely from the statelevel, or whether the state will operate a system in winch some fundsare raised locally, and some funds are raised by the state. History aunttradition in the United States have largely made this first choice forus since only one state in the Union, Hawaii, operated with no localfunding until Mg. and with only very limited local funding there-after. There have been students of school finance in the past, andthere are certainly those in the present who arc not at all happy withthis inherited fiscal structure. These scholars believe, and believe very

Ign Nrhool Finance in Tramitiaa
strongly sometimes, that lull state funding is the only ultimate soliction to our equity problms.' If. however. society allows history andtradition to make the choice in favor of partial sta1 funding, or itwe deliberately select partial state funding over hit state funding,then that very action sets the stage for the next cla.ice that most bematte. This second choice is whether we shall have in allocation sywtern based on the notion that one should try to equalize local re-sources, or whether we should do nothing about unequal local re.sources.
%%Ali le most states base chosen to establish an allocation system thatdoes provide state funds inversely to local wealth and thus attemptsto compensate for unequal local resources, it should be pointed outthat even this basic decision is still open to clebati: in some circles. Ifone has very strong fiscal convictions of a comervative nature, it canbe argued that selecting a school district in which to reside and inwhich to raise one's children is essentially an exercise in consumersovereignty by individual families and that the state has no businessinterfering in this marketplace transaction." In the terms of this Ide-ology, citizens should tote with their feet. that is, they should moveto the district that otters them the bundle of educational goods andservices they desire and that they can afford. If they desire snore thanthey can afford, then they should simply work harder to get the re-sources to spend for this pureose.
However. when one considers the spillover and social benefit ef-fects that K-12 education is presumed to have, and perhaps equallyimportant, when o to is confronted with the vast wealth inequalitiesamong school districts in some states, even the most dedicated follow-ers of the doctrine of "the hidden hand" begin to waver. There arealso assumptions made in the "pure consumer sovereignty model"aliout the rights of minors and about the case of family geographicmobility that many would not accept. It is also obviously quite diffi-cult to square the pure consumer sovereignty model with some of theequity assumptions made in the first part of this paper.
On a more practical level, it might he recalled that there are afew states that do rely primarily upon local resources to support theirschools aided only by state flat grants, with no specific equalizationprovisions. Connecticut is the example usually cited to illustr -e thisstate of affairs. This may be somewhat unfair to that state since Con-necticut does provide equalisation in a more general sense by providing special purpose grants to districts with concentrations Of disad-vantaged children.
Once a state has decided that it will operate an allocation systembased upon equalization principles it has reached the third level ofdecision-making. At this point three alternatives are open. The firstis to provide for equalization by flat grants, but to increase those flatgrants to stich a site that the poorer districts are brought to nearequality with the vealthier districts entirely from state resources. Ob-viously such an action increases greatly the amount of state fundsrequited, and such states rapidly approach full state funding eventhough they may not be so classified by those who devise typology
4f)A

'I Uri native' t it( 197
systems lor school finance. Ilk slaIL of 'New Mexico is an example ofthis kind of at rattgentent. It one wishes to observe the quite differentelle( t. that Ilat grants (an haw when used in conjunction with differ-ent degiees oI local support a com.nism. 1)1 the two states of NewMexico and Connecticut is ittstructtve.
This 'Nati( ular large that grant option has not proven %ei point.tar; however. and moo of the states have selected a second option forhandling then (lints ploblems. litis second option is known vari-ously as the "foundation approach," or the "minimum adequate foncation' or by the name ()I the men who worked to develop it. e.g.. the-Strayer-flaig-Nfort" approach. As nearly everyone knows who hasever been subjected to a basic (ourse in school finance. and that in-chides almost all certified school administrators in the United States,the essentials at this system are that the state sets an expenditure levelbelow which no child's education will be allowed to drop: the localdistrict is then repined to also make a minimum local tax effort, andthe state then makes up the difference between the foundat'on leveland the amount raised by Mc minimum required tax effort. More hasbeen written on this particular allocation formula than on any othertopic in the whole field of school finance."
Since we do not wish to add here to the already ex:ensive litera-ture on the foundation approach all that we shall do is to imint outthat local districts need exert very little local incentive to take advan-tage of the benefits offered by the state under these arrangements.Specifically. all the local districts have to do is to set the requiredtax rate and spend the required minimum amount for a child's edu-cation. This much they must do since many states have penalty pro-visions for those districts that tax less than the required rate, andspend below the foundation. Strictly within the framework of theequalisation formula. however. these foundation systems place verylittle emphasis upon local decision-making or upon local tax effort.Outside the formula, in the so-called "local leeway" area, there isof course room for the operation of local incentive and local effort. butunder the Strayerl{ail; -Mort approach that focal effort goes unre-warded.
A state may de,ide. however, that it wishes to reward local effortor to stimulate 1wu I incentive to spend for public education. It maydo this in the name of pros iding that "op/a/ exproditurrs shouldresult from rqual (Wort.- -It such is the case a third option will be se-lected. This third option will be a system which still disburses moneyinversely to local wealth. but which will also take into considerationthe effort the local district is exerting for education. This in turndepends upon the willingness of a local district to allocate a largerpart of its scarce resources to education rather than some other publicfunction, or for that matter to reserve thaw resources for utili/ationin the private sector. Unfortunately there arc some semantic problemsat this point since this third option goes by different names in (*.ilk:r-ent parts of the country. In various places it has been called per-centage equalisation. resource eguali/ation, guaranteed tax yield, andguaranteed valuation. The most recent entry into this local incen-

IVY St ht?' FituiPitr in TtaniiVun
Live tategor is "district power equali/ation." There are some Billetelites among thew local incentise %%stems. bin to detail all these clif-Icicnrrs take us 1.11 111101111 the ACOIR* of this papet.
FhiS 11% to the loin th loci of decision making which is themu." technical of the him levels and has proven the )Host frustratingto legislator 5. 14)inen. aitil even some professional educators. Ilow-CVO% if our really wishes to 110(1(1st:1nd the mechanics of educationalfund distribution there is nothing for it but to enter the esoteric andfrequent') abstruse realm 01 equaliiation equations. An important de-cision at this level may be to select a general limn for the equalisationequation. Fabl three illustrates the three most common equationsl,rescrrtli used in the United States.
In the first formula: 1: is the loundation level per P is thepupil wont. capital R is the requited local tax rate, and V subscript ithe local propel valuation !KT pupil. This dilation has liven usedextensiiel in many states since the early 1920s in the East and inthe I930., and .10., in the West. The second two equations are mosvalise of the Icxal incentive pthicy option. In the second equation Eis an exileuditurc per pupil figure that is subject to several definitions.linen it is the current operating expenditure per pupil in the district.although it can be defined as the expenditure locally raised; V sub-script s is the state average valuation per pupil. In the third equationsmall taw r is a local tax rate. again subjet t to several definitionsbut usually the tax rate for operating expenses and V subscript g isa property valuation per pupil guaranteed by the state.
Although the "pure form" approach to equalitation formulae isa useful typological techiiiiie. it does have definite limitations. Eachstate uses slightly inherent definitions of the variables and constants,rearranges those parameters within the equations, and then proceedsto add weightings of one sort or another. The result is that there ishardly a state in the Union that does not depart in some importantrespect from the equations shown in table three. For example, NewJersey. Wisconsin, and in some respects Utah all have allocation sys-tems whk are similar in a general way to the bottom equation oftable three, labelled here a "guaranteed tax yield" approach. A similarsstem is under active consideration in Illinois." [however, in Newjersey the small case r is not really the actual tax rate in the district.
Tun.F. 3Mon commorav Um) EQUALIZATION FORMULAE
---l'hc Foundation or Strayer. Haig Formula:
= FP RV
The Percentage Equalization Formula:
Vi= FP (I 5)Vs
l'he Guaranteed Tax Yield Formula:G = [r(Vg Vi)]

.4 lit I native fiscal Sulutions 199
but rather the local operating expenditmes taken as a ratio to theguaranteed %%dilation hgure. It is tIiti it li011 "COMptiled- tax raterather than the actual tax rate.
The Utah system is interesting in many respects and educationalfiscal analysts in that state are to be congratulated for anticipatingmany of the deyeklanents elsewhere in the United States. Originallythe allocation system in Isiah had two levels of guaranteed tax yieldoperating 011 of a coliventional Strayer-I laig or foundation levelformula. Locally these two levels were labeled the "broad leeway pro-gram" and the "voted leeway program." The lack of uniformity inschool finance terminology is quite apparent here since the term"leeway" in the usage of mans educational fiscal analysts refers 10the ability of local districts to add monies from their own tax basesunavviqed by the state over and above the foundation kW!. In Utakthis was not the case since in both the "broad leeway" and the "votedleeway- programs the state govei mein guaranteed a certain yieldliont vault increment of tax effort in excess of the amotmt mandatedfor the foundation program. I knee the Utah system could be classifiedin the guaranteed tax yieltl category, or more precisely it 7'. a modelmixing the top and bottom equations of table three. Me shall havemore 1.0 say ut these "mixed later in this paw-. RecentlyUtah has folded its "broad leeway" program back into the. generalStrayer -1 laig model and now operates a "two tier" system rather thana "three tier" system. '11w tiled of this is to move Utal..away some-what front the "reward for local effort" principle which so lung domi-nated that allocation system. It appears that this was done )11 the beliefthat "reward for local ellort" aided the wealthy districts more than wasoriginally thought. The many states which are now cunt( ',winingadding incentive provisions to their allocation systems wont do wellto study the Utah experience carefully."
There are also a good many permutations and comb:nations ofthe middle equation of table three. While New York at d Pennsyl-vania have been using the equation in something clew to the formshown here, there was one year in which Massachusetts -.vas ,fixing alocal share parameter set at .65 rather than .50 (as intik 'nett in thetable). and Iowa was using .25. In that same year Rhode Island andVermont operated the equation without a specified local share parameter. For those interested in exploring different equation possibilities there is no better place to start than the compilation madeat regular intervals by Thomas L. Johns."
Allocation systems are not always expressed too well by formulae.For example, while it is possible to express the "district power equali-sation" notion in a single equations it is perhaps more understand-able to the average reader if left in the form of the schedules in whichit was originally expressed by Coons, Chine, and Sugarman." Tablefour illustrates such a schedule recommended for Illinois by RaymondLows." In this system the tax rate the district has selected on the rightis matched with an expen.ature level guaranteed on the left. Thestate then makes up the difference when the selected tax rate doesnot yield the guaranteed expenditure level when that rate is multi-

:on Nei t inanre in Transition
'ABLE IPROPOS' I) St III OF /IMF TAX RATIo
%MI .511 %DI I 1111- I IS i'tK Writatriv NTH.
Expenditure revelPer II rightrd Pupil
Rase Tax Rate(Per $100 AI')
S I.210.00 $ 2.50
S I.127;00 $ 2:25
1000.00 S 2.00
S 87500 $ 1.75
750:00 $ 1.50
S 625:00 S 1.25
$ 520:0 $ 1.08
plied by the local assessed valuation This particular function is linearthat is, a constant rate of increase in guaranteed expenditures isrelated to a constant rate of increase in tax rates. Benson and hisassociates have experimented with functions which are uon-linear: spe-c ucally they provide greater guarantees at the lower tax rates thanat the higher tax rates.'"' These "DPE" systems frequently have pro-visions whereby the district that raises more than the guaranteedamount is required to contribute the surplus to a pool which is thenused for the less fortunate districts. However, the DPE system neednot contain such a "Robin Hood.' provision, if the state is willingto finance the added cost of the formula from other sources. Due tothe forceful advocacy of Coons, Clune, and Sugarman and the help-fl development by Benson, DPE is probably the most ntlar ex-perimental knot of educational grant-in-aid in the United States. As
..t, however, tut state has adopted a completely UPI? system and aswe shall see later there nut% be good reasons for not depending en-tirely on the DPP: concept.
'There are not only differences among states but also among schoolInfant analysts who try to classify and interpret these many alloca-tion sstems. For example. Erick Litultuatt in a recent article treats thesecond and third equations of table three as the same general form."'
:'`_3

.111rinotive Hirai Solutions 201
We are less inclined to do that since in Illinois we do not find thatE and r are closels cos related, and hence the two equations give adifferent panel n of mons distribution. Of course it is perfectly pos-sible for two float jOli to 11;1L similar general theoretical chat ;titer-istics and set sield quite different (Usti ibutions 01 money due to dif-ferences in how certain satiable% are defined or simply due to theconstants selected in the equations. Such nuts well be the case inthis situation.
I'o the frequent!) posed inquiry, "how many different kinds ofrqualiiation sirens ate there?", there are two kinds of responses.If one has in mind the kind of major ixtlicy decisions we have de-scribed here as "choice levels" that there can not be more than threeor possibly Poor. floweser. at the lowest level of decision-making the.number. nt.ts %yell be infinite since all manner and kind of pupilweightings can he introduced and the variables and constants re-arrang'.tl in many different ways. To any given local school district,however, decisions maul' at the most technical level are neverthelesswry important since it may mean millions in state support, especiallyto the largeANy:tritts. The fear that a local district sometimes Mani-fests that it will he "hurt" in a formula change may be well foundedin the long run but in the short run "save harmless" clauses in thenew legislation usually protect the district for at least a year or twoafter the adoption of a new formula. 'There is no denying, however,the powerful motivation that local superintendents have for under-standing even the most minor changes in the state allocation system.This partially accounts for the great number of "formula experts"that enterge from the walls each time a major change in the allocationsystem is considered by any state legislature.
Decision-making at the most technical level can, unfortunately, bequite divisive among educators. Urban districts very quickly learn thatall thesc! formulae can be loaded with different kinds of weightingswhich are, in fact, correlates of the poverty found in central cities,and can hence be of use to them. Rural districts learn to seek out andpromote thc inclusion of variables that will benefit them. In Illinoisthere is a continual battle between representatives of unit districtsversus those from dual districts. Professors of educational administra-tion may not have helped this situation very much since many of thembecome much too ego-involved with the formulae they have created,or helped to create. Members of state legislatures can also come in fora share of the blame here since the introduction of successful formulalegislation confers a certain amount of status among legislative col-leagues. A certain amount of this competition in the allocation for-mula field is probably useful or at least inevitable. On the other handwhen these "formula fights" become too personal and too intense theyweaken the chances of meaningful fiscal reform.
COMBINATION SYSTEMS OR MIXED MODELS
Professors of school finance like many of thk .r other colleagues inacademia try to make the world understandable by putting reality
iat

202 finance in Transition
into little boxes anti neatly labelling the boxes. !Sut reality has a petsistent way of creeping out of those boxes and becoming all mixed upagain. Our modern world of rapid ccnumunications greatly facilitatesthis. Organizations mentioned earlier in this paper. especially theNational Educational Finance Project and the Education Commissionof the States have greatly facilitated the flow of school finance infor-mation between states with the result that relatively "pure" allocationsystems are becoming almost as rate as "pure" races among mankind.It is therefore likely that any classification system for allocation for-mulae can have but limited durability and usefulness.
To illustrate this a number of "combination" systems have beenextracted from recent state reports and appear in table five. The firstproposal, put forward in New Jersey. would seek a solution to theequity problems by establishing a large flat grant and then operatinga percentage equalization system over the top of this flat grant." Thesecond, suggested by Richard Rossmiller, would operate a guaran-teed tax yield plan over the top of a similar large flat grant." InOregon Governor McCall is proposing a combination of a flat grant
TABLE 5COMBINATION SYSTEMS
I. Flats Plus Equalization:
A. New Jersey Tax Policy Committee:1. Pat Grant set at average expenditure per pupil in state.2. Equalization above Flat Grant by the percentage equalization formula:
ViG = E Pw [I .5
Vs
B. Richard Rossmiller:1. Flat Grata set at 81,000 per pupil2. Equalization above Flat Grant by Tax Yield formula.
G = l'w R pig Vi]
II. Foundation Plus Equalization:
A. William McLure:
G= F TR --) Pw TR (Vi)QR
where:
F = Foundation LevelTr = Tax RateQr = Qualifying RateI'w = Weighted PupilsVi = l'roperty Valuation per pupil
B. Utah Two Tier System
C. Power Equalization Schedule Operating over present Foundation Formula.
dr, .

iris anntire Fiscal Solutions 203
of $900 rith an equalization provision operating to the SI200A number of proposals also operate from a notion that a basic foun-dation formula can be operated first. alit: then incentive elementscan be built into the s)stem to operate over the top of the existingfoundation program. Such is the nature of sstems suggested for con-sideration in Illinois by William NIcIaire.''. and Robert Pyle." TheUtah "two tier" system is also of this "combination" .nature as hasbeen previously noted.. proposal gaining ground in sonic circles isthe notion of simply grafting a district power equalization scheduleon top of the many existing foundation level schemes. Essentially thisis the Lows approach since the base of the schedule shown in tablefour is the actual required tax rate and the required foundation levelin the Illinois Strayer-Haig-Mort type formula. Some of this may besimply "faddism" as the i)pitlar;ty of the DM system continues tosweep across the country. On the other hand there have always beenserious stnilents of school finamr who have maintained that some localincentive elements should he incorporated into the allocation proce-dures irrespective of whether it is DPF. or some other mechanism forencouraging "reward for local effort." For example, William Mc Lurehas maintained this position in Illinois for a number of years."
Recent proposals in Kansas 3$ and Florida by Walter Garms andMichael Kirst also illustrate this mixed model approach." In theKansas case a linear district power equalization schedule is proposedoperating from a foundation level of $777 and a qualifying rate of$1.75 per hundred valuation for districts with enrollments in excessof 1,000. For districts with less than 1.000 enrollments the foundationlevel rises to S1000. The Kansas proposal contains additional aid forsmall school districts which is bou al to be controversial. Proeonentswill argue that the proposal accurately reflects the needs, particularlythe sparsity needs of rural small districts ill Kansas, while opponentswill maintain that it simply builds in rewards for diseconomies ofscale and thus insures inefficient spending in the small school districts
The Florida proposal is part of a broad and far-reaching plan forimproving education in that state which includes recommendationsin the personnel, governance and curriculum areas as well as in schoolfinance. What is of interest to this paper is the provision that all theremaining local leeway in Florida be power equalized up to the state-wide property tax ceiling or "cap- of 10 mills. Thus there would re-main no local leeway not equalized by the state. Should this provisionbe adopted. the basic equalization grant system in Florida would re-semble that in Utah. There would remain, however, sonic importantdifferences between the Florida system and the Utah system. especiallywith regard to categorical aid for disadvantaged students.
The Florida proposal contains sonic other interesting features in-cluding a sixty-three million dollar cost of living index and a seventy-seven million dollar state compensatory education program. Thesetwo special provisions are very important parts of the proposed financepackage and they are seen as trade-offs between different kinds of dis-tricts. The comeensatory education prow am tends to help the ruraldistricts of Florida, while the cost-of-living adjustment helps the lir-
0 1,

201 5chuul itl rttAitit)/1
ban districts. It should he noted that !tower Nuali/ing tax rate tiff-revenus of 0.70 per hundred valuation to IMO per bundled valuationis a vely dillelent matter than attemptiog to do the same for diller-clus as large as 1.1.) per bandied valuation to pet. hundred valu-ation. This latter iange was noted in a lecent e; for a certain silt"category of twit districts in Illinois.'" Power equali/ing dillemics this!mge tould require vastly more state finals than were needed inFlorida. Notiag the mandated seven mills and the state-wide ten stilllimit Guilts and First accurately observe: -In effect, local t hone isalready coustraiiid to very large degree. Because of this Florida al-ready meets the -Serrano- criteria better than most hta WS:. II
WEALTH. NEEDS. AND CATEGORICAL AIDSIn our exposition of the alternatives for treating equity problems
in school finance we have conveniently itmored some very difficultdefinitional problems and sonic policy choices not directly concernedwith the selection of allocation sstems. We shall make brief mentionof these here. primarily for the sake of completeness. reali/ing thatnone of these items will he given an adequate coverage. First. thereis an ancient problem in the school finance literature concerning whatconstitutes an adequate definition of a "poor" school district. Tradi-clonally this debate was cast up in terms of whether property taxper pupil was an adequate definition of the "fiscal capacity- of a ills-trict. or whether additional measures of wealth, particularly differentkinds of income measurements, should be included within the defini-tion of "fiscal capacity:42 With the passage of years the distinction be-
tween "needs- and -fiscal capacity" became blurred. it was thenargued that income was a good measure of the "human resources' ofa school district and that a human resource poor district was a "needy"district regardless of its property valuation status." Carms and hisassociates have developed some interesting ways of including a "needs"dimension into pupil weightings if the basic assumption that socio-economic poor districts are "needy" districts is accepted.4
Due largely to the efforts of Betsy Levin and her colleagues andJoel Berke and his colleagues we know much more now about theconsequences of introducing an income measurement into grant-in-aidformulae." It came as something Of a surprise to some to discoverthat the introduction of an income measure was of greater use torural districts than to turban districts. It is also apparent now that thespecific type of income measurement introduced has a great deal todo with the resultant pattern of state tumid distribution. Per capitaincome will not produce the same distribution as per pupil income,and family iticome produces one distribution while corporate incomeproduces another distribution. Considerable regional shifts in stateaid are also likely to occur. In Illinois. Indimia, and Ohio the southernportions of those states would probably profit from the introductionof an income measurement into the gram-in-aid formula as wouldnorthern Wisconsin. eastern Kentucky, northern Michigan, etc. Shiftsof this magnitude would Ix! bound to produce considerable politicalconflict.
E) #\.10.0% el*/

Alternative Fisenl Solutions 225
'0 111111'11 to the "Heeds- (chart' the Miner of that ColltIOVvls'seems to rest on whether educational "needs" should be determineddirectly. Of whether certain socio-economic measurements can he ac-cepted as surrogate or substitute variables to stand for those educa-tional needs. The present wt:imiit of professional opinion is probablyon the side of tr,olig to measure these educational needs thrctiv. Thisis due to the iiillneme of extensive studies completed by the NationalEducational Finance Project concerning cost dillerentials for differentcategories of "'wetly- soldents. some of the most important of whichwere conducted by William NIcIant. and Richard Rossini Iler.t. Therecommendations of the Fleishman!' (:ommission in New Turk Staticrclittive to including a direct measurement of educational needs inthe form of achievement test scores has also strengthened the case ofthose %du world prefer to work directly with educational needs,rather than with some soioeonomic substitute for these needs.4'
But the inclusion cost differentials in grantin-aid formulae is.like so man other matters in school finance, still debatable. (:riticsof this approach argue that the inclusion of these cost differentials ingrartin aid nwillulac constitutes a sort of circular reasoning or atbest a "sell-lulfilling prophecy.- Unit cost studies art. conducted bythe state. and then these same parameters are introduced into thefunding formulae. The result is that the costs established at one pointin time. and frequently on the' basis of a small sample of districts,are froin- into the allocation ssteni until such a time as the legis-lature sees fit to change them. Further, there are some very difficultproblems involved iU identifying the target populations on whichthese cost diflerentials were first established, and to which they oursubsequently to be alplied. In a sense, giving a cost differentialweighting to a particular kind of student establishes a preminin or abounty Oil that kind of student and the state may siuldenlY find thatit has far more special educ..,. students, vocational education stu-dents, compensatory students, etc., than it ever thought th;.t it had.Strict scrutiny of classifications to prevent double cllIltillg of rodentswould also be necessary. There would also seen! to be sonic phycho.logical and sociological problems colinected with labelling studentsin groups for funding purposes. None of this is said to discourageresearch in the cost dilleremial tradition, but only to emphasite thatimportant problems remain when this approach to "needs" has beentaken.
. new twist on the old wealth problem will bring us finally to theconsideration of categorical or special purpose aids versus generalpurpose aids. Recent studies by Churgin Berke et W., and (;Tubband Nlicl.t.lsotil" have reopened the question of whether poor studentsare really to be found ru poor school districts, or more specificallywhether income poor students are not also to be found in propertyvaluatimt wealthy districts. Apparently this was a very important con-sideration in the majority onion in Ilmirigu:, the majority of thecourt acoepting the contention that aid to property valuation poordistricts might not necessarily aid income poor students. At presentthis contention seems far froth well elblisheti empirically. However,
r( 1'3

hol I 'Miner OS Tia JOH
W 11111st resist the 11.1111 ati011 t establish t est a ble ettlpirit al 11)1)0111eses on this subject and comment lather on a possible policy implicit.tlull IA this claw 0%ns%. It Inas well I r that state itolic make' s willIlOW Avkil le \atIlill ingelltial 01 slate categot alsfor 111 dis,Ithatttagetl.
Slate tatemolicals in m..ttctal have 11%14111v been loom' to bet'illi:111/111.4 1)111 Itillit'S 11Nliall% ill*Vi CO1111)111111 1)1
Stall' dl) 111)1 locus it:wind:iris upon (-mewl-it-al% kmthe disadvantaged.'" It is noteworthy that (:alilornia recentiv wrote11111) law an eimht%-two million dollar stale categorical grant lot thedisadvantaged oet though that same lemislatow has not seen fit topass e thel district power equaliiation aiiv ol the other generalpurpose educational finance %%stems that haw liven la esented II) themIII the last eighteett months.'" it is also of mote than passing interestthat major slate school f.nance studies in New Volt, t:alifornia. andFlorida have all called for the establishment of huge st tie special pur-pose grants for the disadvantaged.11 A smaller grant program has beenrecommended for
hete ate some good arguments lor seeking et ualitation goalsthtottgh tatemot ical or special potpow grams rather than through thegeneral purpose grant-in-aid formula. in the first place if there reallyis a serious problem of income poor students in property valuation%scantly districts, as some analvsts now allege. then the siwcial purposegrant will target money directly to these students. Secondly. the fundsin a special purpose grant call be followed more closely and the ef-fectiveness of those investments checked more carefully than when
thebinds are comingled with the general flow of state aid. Thirdly.the special purpose grant tends to satisfy those legislators who claimthat increasing teachers' salaties will simply eat tip any increase putinto the general purpose trmula, and the effects or the additionalmolter for the disadvantaged will he lost in the process. Fourthly, requirements for innovative new expenditure patterns call be placedmote easily into special purpose grams attd this tends to counter thearguments of those %dm express doubt ;it spending more money for"the same out thing" in the public schools. Finally. if the definitionof "disadvantaged" students is established ill terms of students frontlow income [amities, it will be found that ninth of this aid will goto rural areas of the state. as well as into the central city school dis-tricts. and this will help greatly in mustering enough votes to pass themeasure in the state legislature.
As would be expected there is a debit side to these state cate-gorical% for the disadvantaged. In the first place they lend themselvesto a "band aid" approach to serious problems. There is a constanttemptation tot the kgklattire to establish a small and inoostxptett-tial program and then proceed to imome the basic problem lot severalYears thereafter. Special purpose of categorical grains also tend toIntik! state department bureaucracies. 01 (1)111SC the legislature nutcontrol this partially by limiting the amount of funds made available to administer the program, but seriously limiting the :Rimini.trative overhead money will probably cause the programs to be badly.
q,

.diti.rnathw F .al Solutions 207
supervised. The result will be that the iitent of the legislaure willthen be thwarted. special pm pose Or categorical programs also quicklyattract their own lobby groups among state legislators and frequentlythe chief state school officer finds that he has less than the full controlover his own shop. The special purpose or categorical programs tendto develop a political power base of their own with cousequent prob-lems for coordination and efficiency within stale departments of edu-cation.
BRIEF EVALUATION OF THE ALTERNATIVES
A thorough evaluation of all these alternatives would require much11101°C time and space than can be given the subject here. Nevertheless,we shall outline at least some cot the 11101°C important weaknesses of thealternatives described above. Let us start with the full state fundingproposal.
If and when hill state. funding is adopted the effect of the "dem-onstration phenomena- ends. No longer will it be possible for a su-perintendent to cry %volt (Am. the fact that the kmrents of the childrenin an adjoining district have seen ht to provide better educationalservices than do the parents in his own district. We professional ecru-tutors have played this convenient little game of "catch up" for yearsand it has worked rather well. It must be admitted that there is evena sense in which we don't really want the equity problems discussedpreviously completely solved. For years we have traded on the guiltof the affluent districts to raise the expenditure levels for the poor.With the outset of full state funding our little game is over, and theentire responsibility for decisions concerning the level of funding foreducation shifts to the state legislature. Some authorities do believethat the state legislatures will discharge their responsibilities in acreditable fashion." Regrettably there is no way of knowing whetherthis faith is justified or not. The experience of the Canadian provinceof New Brunswick is not reassuring, but that particular area has somany economic development problems that it is probably not a fairtest of hill state funding.'" Certainly the record of state legislatures inkeeping foundation levels current with rising prices is not such as togive one much confidence in their performance should they take overthe entire funding decision. A good many legislators arc also notoverly thrilled about the prospects of state-wide teacher negotiationsand the concomitant possibilities of statewide labor disputes thatwould probably attend full state funding. Nor is it clear that teacherorganisations will endorse a proposal to transfer most or all of thenegotiations from the local to the state level.
The criticism of lull state funding that is offered first is usuallythat such a fiscal arangement would destroy local control. We arc in-clined not to stress this point. however. The amount of research avail-able on this matter is quite small and understandably so. A generali-tation as vague as "local control- is hard to operationally define. Somestudy has been clone on the subject. however, and these efforts do notseem to support the contention that local control must necessarily

schut Finance is tiiition
suffer as the percentage ul funds provided h state governments in-creases. We are inclined (c) believe that much %mild depend uponjust how the funds were delivered to local school districts under lullstate fundii.g. if funds were delivered to local districts in large unrestricted block grants that a considerable amount of local controlmight remain. flowerer, it is 1 ;u' bum certain that state legislatureswould be willing to pass such unrestricted grants. In any event, itshould he remembered that school finance is very much a part of "po-litical economy- and that myths are frcitttently just as important inthis area as reality. If enough legislators believe that full !AMC Wild-mg will destroy local control then the necessar legislation simplywill not pass.
If full state binding is rejected. (or whatever reasons, then we shallcontinue to struggle with piolems of partial state support. 'lime ma-jor question will then become just how much is "partial..? OF to putthis another way. just how much funding will flow through the equali-/ation systems, assuming twitter that at least must of the states willcontinue to operate equaliiation gram-in-aid systems. This is a verycrucial tptesiion. It is far 1110re 1111VEtallt than some of the mote tech-
Cal questions concerning the exact form and detailed nature of thedistribution tumid:ie. Even a formula with relatively weak equaliza-tion ellects will nvrtheless equalile matters greatly between thepoorer and the richer districts it enough money flows through it. Anumber of analsts now agree that the percentage of total funds po-vided by the state government is more impoitant than the shape ortom of the equali/ation formula." This is closely related to the mat-ter of local leeway. Equit can be also accomplished IA limiting theI.)cal leeway; limiting, that is, the power of the more affluent districtsto use the resources available to them. Those interested in equity goalsmight he Ivell advised to concentrate upon these two related matters.increasing state ail! and limiting local leeway, tattier than becomingcaught up in blood) and fratricidal wars over equalitatio formulae.
in spit, of this imjxrtant consideration we will continue to makedecisii.n. over formulae and therefore treatments of the strengths andweaknesNes of specific tumuli.' types will likely remain an importantpart of the literature. Sensing correctl the rising interest in variouskinds of incentive grant sstenis. including district 1mA-el. equalization.a number of school finance analysts. e.g.. Jordan. .klexandur. Benson.and Guthrie, have started pointing out the limitations of those ap-proaches..'" lit the first place these sstems might result in increasedsocial stratification and geographic: segregation of social classes as thedillerent social strata each sought the tax rate they preferred. Shouldsuch a phenomenon occur this would rim directly vomiter to the goalof increasing upward social mobility. Secondly. local decision-makersma not decide to meet the needs id their districts, even it these needsclearly exist. .s Jordan and Alexander point out. this could easilyhaplien in the South where many segregated white private academieshave draiiicd on children of the decision-makers from the publicschools. It takes no great silenth of the imagination to also see thishappening in rural areas of the midwest where far too many "com-
f

Altomitive fiscal Sulutiun3 209
pan store- type %dux)1 boards are primarily colicertted with keepingtax rates down rather than with providing adequate levels of school-ing. I'llird, %hat% districts might have a particularly difficult time mt.der the gum unveil tax yield !town! shut. problems of municipal ot.1-burden, that is the competing costs of other public services act tokeep educational tax rates down. Fourth, formulae of a guaranteed tax%kid nature might also stimulate local property taxation and thiswould he running tlirectl% counter to a strong trend toward localpopert tax relief. Fifth. there is a special problem of low incomehouseholds located ill the property affluent school districts. This haspaitirulaly concerned Ptenson auct his associates. Under 1)11 F.. guar.anteed tax yield, or some other local inentive system, the more af-fluent districts might decide to ittcrease their tax effort in order toobtain more state funds. The low income famil living in the shadowof a factor% or commercial complex would then Fuld its residentialpropert tax Mere:ism% greatly. Mote likel. the low income tomily.reali/ing this would occur. would simply not rote for the increasedlets and hence the students living in these districts would not be ableto take advantage of the local hiceutive sstin. I'o correct this situahim Benson and his associals have strongly suggested that a so-called"circuit breaker" be adopted wherever DPI'. is seriously considered.fit. "circuit breaker" is a tax credit given to householders where theproperty tax exceeds a certain percentage of the family income."Unlortunately. t.tx credits as broad .is this can cosi the state a gooddeal 1,1 revenue. Sixth, students of general local public finance hatenever been especially pleased with these educational "incentive"grams since they see these grants encouraging local governments tospend hinds on education that might is ll go into other needed pub-li services were it not for the stale reward for ellort with regard toeducation. Finally. local iucentive systems. perhaps especially percent.age equali/ation. could have the effect of keeping small inefficientschool districts in business. since the higher costs or higher tax ratesin these small inefficient districts would be rewarded by the state.
II iliac ate ohjectioos to toll state funclittg and there ate also oh-jectioos to local incentive %%stems. are we theu to return to the foun-dation program as the most defensible program for school finance? Agood many students of school finance would find that titipleasant as
remark made by I lelih Levin in a slightly different contextplobaLlY adequately describes the standing of foundation systemsamong many current students of school finance': . . such subsistenceprograms represent insurance against civil disruption much more thanserious attempts at emu:di/Mg o1)portutrities."'.4 Rut traditional Strayer.llilig.Niort approaches can In' Made to speak to toe equity problemsif the foundation level is raised high enough and if the local leewayportion beyond the foundation !evil is sufficiently curtailed. Attteresting use of a "computational rate" rather than all actual qualifyhug rate has been suggested for Illiuois by .\. James Ileitts.'..' Thiswould have the effect of (Hirt ting much of the state money into imorerdistricts raising local property taxes. Some of the difficultiesof adjusting both the founclatiou level and the qualifying rate simul-
frpe %Ply

.5111(1411 Finance in Transition
taneously are at aided by the Ileitis procedure. Change is so highlyvalued, however, in the field of education t hat the more likely "waveof the future- will be some type of "combination system" 0 " ''mixedmodel- discused earlier in this paper.
It should be obvious to the reader by now that the "experts" arenot going to agree on the "best" way to finance the public schools.lids was made painfully clear in a recent school finance study in Illi-nois in which the study group split three was in its "final" report.one gronp advocated full state funding, a second advocated incentivesystems, and a third advocated modifications of the foundation sys-tems."" In such situations it is under:Amid:dile that legislators, gover-nors, chief state school officers. and other decision makers might wishto turn directly to the people for advice on how the electorate wishesto finance their schools. This apparently is to be the case in Oregon.Before this paper is printcd and distributed a referendum will havetaken place in that state concerning how schools arc to be financed.In Illinois a similar bill calling for a referendum has been introducedinto the legislature but its late is uncertain as of this writing."e Ifthese referenda are limited to what we have termed here "major choicelevels" that th may well provide some guidance where the expertscan not. flowever, it would be a serious mistake to try to cast thesereferenda in terms of the inure technical levels of decision-making de-scribed in this paper. The result would only be a confused and frus-trated public.
REVENUE AND TAX RELIEF CONSIDERATIONS
Although this paper has been concerned with problems of meas-uring and defining equity problems, and with exploring suggestionsfor overcoming these problems on the allocation side, we wish toclose by making some comments on the revenue side of the fiscal equa-tion. Occasionally, allocation formulae will be developed with athought toward giving some tax relief, although this is not too com-mon. An examvle of this sort of thing can be found in a recent pro-posal for Illinois by Ben Hubbard." Basically this proposal is a localincentive system in the form of a guaranteed tax yieltl. However, ithas been modified so that it also provides for local property tax roll.hacks to a specified tax ceiling. The general property tax freeze pro-posals that have been put forward in some states simply lock in theexisting inequities and are therefore of little use in solving the prob-lems wt. have outlined in this paper. Local property tax ceilings or"caps,- on the other hand, do have a beneficial effect on the equityproblems since they limit the power of affluent districts to use theirresources and hence move further away front the poorer districts. Thedifficulty here is that the poorer districts approach these "caps" orceilings much more rapidly than the more affluent districts. The mar-ginal increment limitations found in many western states, that is, leg-islation that prevents local property taxes from increasing over a statedpercentage in any given year. may also hobble the more affluent dis-tricts slightly and hence be of some limited utility in solving the equity

:thematic.. Fiscal Solutions 2U
problems. In a ver global sense, the tax ceilings, free/es, niargiirdincrement laws. etc., do contribute to the long 11111 solution of theetiuitv problem since they discourage local contributions and encour-age state contributions. These tax iestriction mechanisms ate tradi-tionall unpopular, of course. with many professional educators.
Politicians who promise to provide general tax relief. :110. at thesame time. promise to equalise educational opportunities are eitherfinancial wi/ards. or the!, arc being somewhat less than holiest with theelectorate. The only way this could occur would be to level down ex-penditures rather than level up expenditures, and such a system isusually considered a political impossibility. It is true that it is notonly possible. but probably necessary, to provide relief from localproperty taxes at the same time that one provides greater educationalopportunity. After all, the equity problem arises in the first instancefrom inequalities in these local tax resources. But this is a far, farcry front providing genet al tax relief. The solutions we have discussedin this paper will all require more state funds from some source. Ourestimates for Illinois indicate that the revenue requirements for sub-stantial equali/ation in that state run almost a full billion in newdollars, although this could be spread out over four or five years.
These hard-to-come-In new state fonds could be derived from astate-wide property tax, or perhaps from a state-wide tax only on busi-ness and commercial valuations, the so-called, "split-roll" proposals.However. there are sufficiently difficult political and economic prob-lems connected with the reimposition of state property taxes that theshort run solution is much more likely to be increases in both stateincome and state sales taxes. The point to be stressed is that solvingthe problw of equali/ing educational opportunity is just like tryingto solve most other social problems; more taxes are almost always re-quired. This was the reason we spent so much time discussing thebasic nature of the equity problems. Now that some of the judicialclout has been removed from the scene, elected officials will have tobe presented with compelling argumentation and evidence before wecan expect them to pursue the always unpowlar and often politicallydangerous path of increasing taxes. Recent events in Illinois have notmarls us particularly optimistic about the ability of educators to dothis. Of course, it is perfectly tiossible that these equity problems donot trouble the average voter and taxpayer very much and, in thatevent, we very well still be writing about these problems sevendecades from today.
FourNatEs1. Majority Opinion. San Antonio Independent School District rt al. v. Rodri-
guez et al.. March. 1973. p 54.2. ibid.3. See for ex:maple. William (.. Milliken rt al. e. Allison Green et al.. Supreme
Court, State of Michigan. June. 1972; also Kenneth and Frnestine Robinson et al.v. William T. Cahill. Supreme Court, New jersey. Sept.. 1972.
4. Cohberly. Elwood P.. School Funds and Their Apportionment. 1905. Teach.rs College Press. New York.

Si/rood financ in Transition
5. Majority ()pinion. /it/dreg/re:. p. 25. also Continuing ()pinion of Justit rStwatt, p. I.
!he tollosing %ohmic% are asailable from Robert (:lark. 1)cpartment of StateRelations. Odor of the Superintendent tit Public Instruction, 302 State ()Bice I%ldg..spi inglichl. 6270O: 'ithons i!) I 'nitre, occasional Papers (); theSupc,intendent'A (.1/MMiiie CM Seht)(// Finance. and I inal Ifrport of theSuperintrodent't Advisory Committee on school Finatirc. April. 1973; availablefrom the !Inman of the Budget. Exeunt Ise Otlice of the Gmeritor. are these mono-gtaphs: Design: Financing for Effective hhicalion in Illinois. Finance FaskForce. (;Iner .s Commission on the St hools. December, 1972 and Survey awl !leiommendat lllll v of the School Business Alanagentent 'task Force. \member. 1972.
7. James. II. 1 1 :1!4. Thomas. J. Alan. and 1)vek, Harold J.. School Itn#'nurSystems in Five Slates 1961. Stanford University School of Education; lames,I homas et al.. Wealth. Expenditure. and IlectsionAluking for Education, 1963.
Stanford Ioivi*:h% School of Education; Dart-ism'. F. W. and NIcLoone. E. P.. Pro/arc in School Suppm-1. U.S. (Mice of Education. 1965. Washington. D.C.; !lurkhead. 1.. "Uniformity in (i scerrtme tl Expenditures and Resources in a Meno-pidilan .%ea. National Tax Journal. Dec.. 1961.
S. Wise. .lithos F Rich Sc /tools. Poor Schools. 196$. llitiyeisitv of ChicagoPress. also "Flo. Constitution and Etinal Educational Opportunity." in 1)all. C. U.ted.1, The (Viality of Inequality.: Urban amf Snburhan Public Schools, 19104. Uni%visit% of (liicago Press.
9. We !Lise reference of course to Jencks. ( :hristopher. Inequality. 1972. Bashstooks : .t "whet ted" wading list on this issue %could doubtless include Ilou Flfecticis \clouding!. Rand Cotporation. 1962. and l)o Teachers .links a l)incrence. 1970.U.S. 011ice of .ducation. The Jencks position has been thoroughly discussed in anumber of bark resiews and comments the most complete of which is probablyPerspeeti..cs au Inequaltiv. a special section of the February. 1973 issue of theIlanard Educational Review.
10. John S. and (:Ittn. 1Villiant H.. ill. "Economic and Legal justificathins of Fiscal Neutrality. I.:duration and Cilia» Society. February. 1973.
II. Gmbh. 11". Notion and Michelson. Stephan. "Public School Finance in aPostselrano %Voila." Center for Educational Policy Research. Hilliard GraduateSchool of Education. (:ambiidge. Nlassathustts. 02138.
12. Parent. Vilfredo. The :Wind and Society: Tinnbee..thlold. Study of Ihstory.13. Ilit knit!. G. .1Ian and Illibbard. Ben C.. "Social Stratification. Educational
Oppoitunits. and the Role 01. State Departments of EtInt anon." Educational Ad.ministration Quarterly. Winter. I96S.
H. Guthrie. J. W.. Kleindorfer. (. R.. Irvin. II. M.. and Stout. R. T.. Schoolsand Inequality. 1971. Nlassachtisetts Institute of Technology Press: Levin. Ilnry M.."Equal Educational Opportunity and the Distribution of Educational Expentlinull.. Education and Urban Society. February. 1973.
I" Joint 1)issem, Justices Iiite. houghs. and Itivitsiass, lIodriguet. pp. 67.It . .11au and Chatidliari. Ranted'. "% Longitudinal Stink of Fiscal
hpiali/t in 111. paper presented to the 1973 .%nitual Meeting of the%intik an hIntatitdial Research .%ssociation. Sec also Ilickrod. Chandhari. R.
and rchettg. Tse.thati. "Definition. Me;isurentent. and :%pplication of the Conceptof hilt:di/anon in St hool Einance."Superintrodent's .4dvisory Committee on Schoolfinance. of,asO oaf rape's. robioir One. 1972. ()Bite of Superintendent of PublicInstruction. Spri 1 1 1 ni (asailable also as docnment El) 0o0 51.1 in theERIC %%stem'. For additional illustrations of the use of the (,ini (:oefficient inst hoot finance rtsearcb we !Jamison and NIcLoon. nl,. cit.: Markin, D.. The Ermali:big Impact of .Starr Aid to I.:duration. 19117.1Vasfungtost Univrsits Institute forlt ban and Regional Studies. St. !ands; Wilensky. G. R.. State Aid and EducationalOpportunity. 1'170, Sage Publications. Beverly !Wk. Michelson. Stephan."lite Political Economy of Public Schtiol Finance." in Carnoy. M.. S/ ling in aCr» pi» lir.ict v. 1972. McKay: Grubb. W. Norton and Michelson. Stephan. 'Statesand St hook." manuscript. 1973. Ilaird Center for Educational Policy Research.Cambridge. Massachusetts.
17. Piotessor Ramesh Chandliari, Computer Servit es Division. Illinois StateI 'in% ersit Not mal. I II inois. firth!.
IS. ifickrod and Chamihari. op. cit.
tr-

Al let natit'e Fiscal Solutions 213
1:1 Nlallim ht scalds of Fitoulifv: school tinanee Bee/sited. 1972.National Committee for the Summit of the Public Schools. 1121 Sixteenth St.. N.W.,Washington.
20, Hi( ktod. and sahnho. ccsat iorluilong viuna find ttttt iclt.tqualt:tcs .1 numg Suba t Nlnr Ne I HialA, ILd.. lutmatv inttl. and PubliAivls.Inc.. IMin illy. Illinois. 61832.
21. SV 1(11 4."1"Pit% 0131/1e1 ht t% Final Herfi,1 511pc1inictolen6 AdvtAttryonnindici fur selmol thume. Office of the Superintendent of Public. Instruenon. Spr.oghld. Illinois. I his Ompter was contriloted Is Arthur E. \Vise and1. Alan I homas. Sec also Rossmiller. Richard A.. "hill State Funding: An Analssisand Critique. in Alexander. Kern and Jordan. nbk. Constittuionni nlorntschool Finance. 1972. National Echtcational Finance Project. Gainesville. Florida:also Benson. Charles S.. -State Assumption of Educational Costs." a paper pre-sented at the SixtsFoulth Annual Conference on Taxation. National Tax Asso-ciation. September. 1971.
22. iebout. Charles II.. "A Pure Musa.% of Local xpenditures." Journal ofl'olitical ttttt Huy. Oct_ 1956.
3. For an excellent historical treatment we Johns. Roe "The Developmentof State Support for the Public. Schools." ill Status and impact of Educational Fi-wince Prot; N. 1971. National Educational Finance Project. Gainesville. Florida:tor a more detailed allaIVSIS we chapters nine and ten of Alternative Programs forFinancing ducali(ut. 1971. National Educational Finance Project: both of thesesluices ccmtrast the foundation or StraverHaig grant with other types of grants.For shorter ticatments of the "comparatise formula" type see Benson. Charles S.."State Aid Patterns." in Buckhead. J. fed.). Public Mum! Finance: Fcootnics andPolitics. Sracuse University- Press. 1964; also Cornell. Francis G.. "Forms of theEqualization Model for State Aid Apportionment." !marital of Educational Re.search. June,
24. Hubbard. Ben C. and Hit kind. G. Man. "Equalizing Educational °ppm-omit,/ by Means of a Resource Equalizer or Guaranteed Valuation GrantinAid."in Volume Two. ()erosional Papers of the Superintendent's Advisory Committeeon School Finance. 1972. Office of the Superintendent of Public. Instruction, Spring-field. Illinois.
25. Hansen. Kenneth II.. "Utah's School Finance Program." a paper presentedto the Regional Interstate Planning Project. Department of Education. State ofCAilorado. Conference on School Finance, l.as Vegas. Nevada. March. 1973.
26. Johns. Thomas I... Public School Finance Programs. 1971.72. United StatesOffice of Education. Publication No. (OE) 71-00001.
27. Grubb and Michelson. op. cit.2$. Coons. John E.. Clime. William II.. and Sugarman. Stephen D.. Psayite
Wealth and Public Education. 19711. Harvard University Press.29. Lows. Raymond 1_ "District Power Equalization: An Initial Effort to Simu-
late Application to Illinois Public Schools" in Volume Three. Occasional Papers ofthe Superintendet's .-Idisory Committee on Sehool Finance. Office of the Superin-tendent of Public Instruction. Springfield. Illinois; see also Final Report of theVuperintendent's Advisory Committee on School Finance.
30. Benson. Charles S.. Guthrie. James W.. et al.. Final Report to the SenateSelect Committee on School Marie/ Finance. 1972. Senate of the State of California.Sacramento; sec also Benson. Charles C.. "Developing a Workable Response inEducation Finance to Sertano v. Priest." Education and Urban Society, February.1973.
11. Lindman. Erick I... "Full State Funding: Requirements and Options. II.I he Serrano Problem." in Hansen. Kenneth H.. The Gmernance of Mate Educa-tio Ssstes: Pressures. Problems. Options, 1972. Institute for Chief State SchoolOfficers. U.S. Office of Edlicatical.
32. State Tax Policy Committee Recommendations Siumnarized." New Jersey\lannfacturers Association. Feb. 1972. "I'renton. New Jersey.
33. Rossmiller. Richard A.. "Full State Funding of Education." in Six Crucialblues in Education. 1972. National Association of State Boards of Education. Den.et. Colorado.
54. Legislative Bulletin. Oregon Education Association. March 23. 1973.Mclurc. William P.. Chapter Four: "Equal Expenditure for Equal Effort."
et Al 4

21I salon/ knottier in transition
Final Report of the Supetintundent's AtIci%oty Committee on School Finance, 1973.Offict. of I iprimndent Of Public instruction. Springfield. Illinois.
36. Inert, pp. 5557, Final Report ot the Superintendent's Advisory Coin1551 t Blau rr. su 0.
37. !Auk. William I'.. Lducaiiiiii for the Insure of Illinois. 1966, °thee ofthe Sop/Timer:dem of Public Imam thin. Swill:OnId. Illinois.
38. Senate Bill No. 92 as Amended by the House Committee. Session of 1973.State of Kansas.
39. Gams. %Valter 1. and Kirst. Michael W., Improving Education in Florida.Report of the Coverstar's Citizens Committee on Education, March. 1973, Tallahassee.
10. lisle. Robert E. and Bradshaw. Fred..4 Study of Illinois School District EItort and .Ibility Factors, 1972. Office of the Superintendent of Public Instruction.Splinglield, Illinois.
41. Giants. %Valter I. and Kirst. Michael W.. ibid.. p. 85.12. Burke. Anid J.. "local Fiscal Ability," Print Legislative Committee on
.school Finance: Final Report, 1963, Albany. New York.43. Ilickrod and tialmlao. op. cit.44. Garms, W. I. and Smith. M. C.. Development of a Measure of Educational
Need and its Use in a Mule Support Formula. 1969. New York State EducationalConference Board.
41. Loin. Betsy. Muller. Thomas. Scanlon, William J.. and Cohen. Michael.Public Schaal Finance; Present Disparities and Fiscal Alternatives. 1972. The UrbanInstitute. Washington, D.C.: Berke. Joel S.. Campbell. Alan K. and Comte!. Rob.ert J., Financing Equal Educational Opportunity, 1972. McCutchan PublishingCompany. Berkeley. California.
46. SIclatre, William P. and Tense, Andra May. Early Childhood and ResitElementary and Secondary Education. National Educationai Finance Project, Special Study No. 1. Bureau of Educational Research. University of Illinois, Urbana.Illinois.
47. Benson. Charles S., Guthrie, James W.. and Other. Report of the Ness'York stair Commission on the Quality. Cost, and Financing of Elementary andSecondary Eduration. January, 1972. New York. N.Y.
45. Burke. J.. Carnevale. Morgan and White. "The texas School Finance Case:A Wrong in Search of a Remedy." Journal of Lair and Education. vol. I, 1972:Chugin. Ehrenburg. and Crossi. "A Statistical Analysis of the School Finance De-cisions: On Winning Battles and Losing Wars." The Yale Law Journal, 1972; W.Norton Grubb and Stephan Michelson, op. cit.
49. Briley. William P.. "Variation Between School District Revenue and Fi-nancial Ability." in Status and Impact of Educational Finance Programs, 1971.National Educational Finance Project. Gainesville, Florida.
50. Chapter 6.19, "Educationally Youth Program." EducationCode of the State of California.
51. Benson and Guthrie, Report of the New York Slate Commission, etc.; alsoFinal Report to Senate Select Committee. supra. Cams and Kirst, supra.
"Financing the Education of the Disadvantaged" in A New Desi;m:of Effective Education in Illinois, Bureau of the Budget, Evecutive Office of
the Governor, Springfield. Illinois.53. Benson. Charks S.. "State Assumption of Educational Costs." supra.54. Should Pay for Public Schools?, Achisory Commission on Intergovern
mental Relations. Washington, D.C.55. For supporting evidence see Briley. William P.. "Variation Between School
District Renenite and Financial Ability" in Status and lrntact of Educational Fi-nance Programs. National Educational Finance Project. 19,1; sec also Grubb, W.Norton and Michelson. Stephan, States and Schools. 11172. Center for EducationalPolicy Research. Harvard Graduate School of F./titration: for conflicting evidencesee James. II. Thomas, Thomas. J. Alan. and Dyck. Itarol l., Wealth. Expenditure,and DecisionMaking for Education. 1963. Stanford University School of Education.
56. Jordan. K. Forbis and Alexander. Kern. "Constitutional Methods of Financ-ing Public Schools." in Constitutional Reform of School Finance, 1972. NationalEducational Finance Project; see also Benson. Charles S.. "Developing a WorkableResponse in Education Finance to Serrano v. Priest." and Guthrie. James W., "Edu

kical So lutioas 21!
cational Imp hi:Ilium of Srrano.- in Ft Meat '' '''' and l'ihan socirtv. Feb., 197:117. Benson, Charles S. and Guthrie. James W.. Final Repoli to the Senate Select
Committee. etc.. sapra.bz4. in. Henry M.. -Equal Educational Opportunit% and the Disbibulion of
Edioational Evnt Mims, himatom and l /ban .5ofoo. Feb.. 197 :1. p.59, see chapter Two, Final 11 !Tort of the Superintendent's Adviwr Committr
on School Finanre. Office of the Superintendent of Public Instruction. Springfield.Illinois.
60. Final Iteport of the Superintendent's Advisory Committee. supra.61. hicale Rill 909. 'Nth General Assembly. State of Illinois,62. Ifubbard. Ben C. and Ificknid. (:, Man, "Equalising Educational Opportn.
tam In Means of a Resource Equa liter or Guaranteed Valuation antinAid." inro/ume Two. ()erosional Papers of the Superintendent's Advisory Committee noSchool Finance. Springfield. Illinois.
APPENDIX ACOMPUTATION OF GINI COEFFICIENT
For measuring equalization. the districts are sorted in ascendingorder of wealth which is defined as assessed valuation per pupil inAverage 1)aily Attendance. The cumulative proportions of total openating expenditures accounted for by these distric . epresented lipthe vertical axis. The curve thus plotted
Yr%
a Xi...1 XiADA
(wealth )
xnADA
(wealth 4)
would be a straight line at 45" to both axes if the total operatingexpenditures were equal in all districtspoor as well as wealthy. However, a sagging curve represents lesser expenditures in poor districtsand suggests some inequity. The measure of this inequity as definedby gini coefficient G is given by the formula:
Area A
Area (A + B)or after further simplification
1145 Arca B
0.5
= I 2 Area B

kilmul Finance. in Transition
Area is the ;ilea tinder the curve and if n is the ntinther of districts.
, clintulatie inoinntin of .1). tor the ith district) t 11111 till I t* I ij tn 1 ' to) the ith district
Then Area 8ft: (xi - xt_1) + yl)
i=12
or 2 Area 8 " " xi-lYi)iQi
= (xiyo - x0y0 + sly]. - x0y1
x211 x1Y1 x212 x1Y2
xan-1 xn xan " mit-lYn)
to (x211 - x112) (x3Y2 x213)
(xan-1 xn-lYn) xan
tn =2
(xiYi -1 ' xi -131i) 1
a 1 .1 n); (xi-lYi 2iYi-1)=
substituting the value of area 8 in eq I
G rm I:2
(xi-lYi "I2
pint Coefficient for State Ai4:
1.0
0.00.0 ADA
(wealth --.)1.0
-7 4/.. .:
+
(2)
(3)
0.00.0 ADA 1.0
(wealth-44

Alternative Fiscal Solutions 217
Since poor districts get more state aid than wealthy districts, thecurve in this case will be above the diagonal and formula 3 wouldresult in a negative vahte of G. To avoid confusion we reverse thesign of G to make it positive. However, Gini coefficient as applied tostate aid must be interpreted differently. The higher the value of Gin this case, the better it is for poor districts and the higher is theequalization. On the other hand higher values of Gini coefficients fortotal expenditure and local revenue indicate lesser equalization.

School Finance Research Studies
As a part of the program of the National School Finance Confer-ence nominations arc solicited for outstanding research conductedby doctoral students in the area of school finance. During the 1973conference the following dissertations were recognized as having madea contribution to the field of research in school finance.
A STUDY TO IDENTIFY VARIABLES WHICH PREDICTELEMENTARY SCHOOL PRODUCTIVITY
BY CARL J. DAF.UFF.RAuctisT, 1972
CHAIRMAN: DR. KERN ALEXANDER, JR.MAJOR DEPARTMENT: EDUCATIONAL ADMINISTRATIONINSTITUTION: UNIVERSITY OF FLORIDA
The primary problem of this study was to identify school and non-school variables which would differentiate high and low productivityin urban elementary school centers. The problem was investigated intwo phases. Phase one used simple regression analysis to identify adichotomous criterion of elementary school productivity through themeasured relationship of pupil achievement and per pupil expendi-tures. Sixty-eight elementary school centers which served grades onethrough six and administered the 1969-1970 district-wide fourth gradeachievement tests constituted the sample in phase one. Phase two em-ployed stepwise discriminant analysis to find a discriminating functionfor each of several combinations of input variables that would predicthigh or low productivity. The criterion variable was the identified 30high and low productive elementary school centers, and the independ-ent predictor variables used in phase two represented a composite of
219
v. 4 rsf
220 Nrhool Eittanre in Transition
25 school and nonschool input measures and five combinations organ.i/ed into problem sets for analysis. These hihuled (I) one problemset %chid! used student rooted variabh.s. (21 two problem sets, onewhit It focused on school %chile tine odic' on all nonschool 'elated variable,: aucl (:I) I )WI/Milli W1S G11111,01'1 /MI 111I0 administrative dei-sion making and inutilet ision making related variables.
Indelientlent %.ariable -rata were obtained from urban district rec-ord. for school %Cal' I 9(.1:11969. :11111 1111011W data were obtained froma merger of 1968-I1109 U.S. Office of kimono!' records and the Inter-nal Revenue records of 19(;0.
In predicting high or low prodotivity, the discriminant analysespoduced discriminating equalums which classified the itleutifie..1 ele-mentary school centers into one of the IWO productivity groups.IVithin each set of equations a maximal mix of predictor 'variableswas ohm.' Yeti. The efficacy of these prediction equations was tested bycalculating both the percent of accurately classified elementary schoolcenters and the efficiency Of disriinination. or amount of variance ex-plained by the variables inc hided in the discriminant function of each
problem set.The major findings and conclusions were:
I. High mid low productive elementary school centers ate ascer-tainable when using simple regression analysis to measure the relation-ship of achievement to exixlitlittire.
`' In the composite and admiiiistrative decision making problemsets, student socioeconomic and teacher preparation predictors tendedto be the maximal discriminating %.ariables of productivity. The find-ings suggest that %.aryin percentages of pupils bum low income fami-lies and certificated stall without a degree mav explain most of thevariance between elementary school center productivity groups.
3. In the school related problem set stall sociocultural character-istics and teacher preparation and experience tended to be the maxi-mal discriminating sari:dile% of school productivity. The results sug-gest that vorving percentages of nonwhite professional staff. certifi-cated stall without a degree and dilleretices in years of teaching experi.owe may accanint for most of the %qu:nice ill school productivity.
.1. In the administrative nontlecisiou making problem set predic-tors relating to pupil atteudance and the income level of residents ofa geographical area served by a school center tended to be the maxi-mal discriminating variable's. The findings suggest that different levelsof average daily attendance b students and varying percesitages ofincome above S10,000 may explain most of the variance in elementaryschool center productivity.
5. The input-output analytical procedures employed in this studywere generally definitie itt itlemilying input variables predictive ofhigh and low productivity. The findings suggest that the discriminantfunctions derived hi these six problem sets accurately predicted highor low productivity 110 to 100 pt...cent of the time and accounted forIkUi to .100 percent of the variance between the productivity groups.
rr 4 "1

Winning Dissertations 221
.1.1 I F. REIATIONSIIIP 11111V1:FN S1,1:1 :1) FIS(:AI ANI).CONONIIC F.\( .1 ORS ANI) VOTING BE1t,A%'1014.
IN SC1 10O1. !WI 161.-1. 1 1.1:CTION1
IN Rolit J. (to rit.t., 1970
CtIAINNIA\ : DR. jAmt s vi I vMAJoR I)I 1.-.NktNitT: 1:.11etA1ioNAI .MAIINIsikArto
1,1NiVi NEIN
The purpose or this st tidy Iva% . ) :11)1)1 llitpilkal tests to COMMUIII%held notions 01 tilt' ft1OrS Which intlucnrlr voting behavior in schoolbudget elections. It has been suggested that when large numbers of ,
voters go to the polls at school budget elections, they go to expresstheir Ernstrations about steadily mounting taxes at the local. stateand national levels. as yell as to protest increases in etlitCatiOlial Costs.This stitch tests these assumptions by measuring the extent to which(1) fiscal decisions made 1,5 1)011(1% of education, (2) fiscal cohlitlitMehl. not ciiirenti controllable h hoards ill education. awl (l) ex-vnifitures and lax rates for nonschool governmental units influencevoting behavior in school budget elections.
Data on increases 111 stbool Inn :gets. teacher salaries, school prov-en) ta rates. debt service payments. the influence of the %tate aidformula. county and town Inulots and the comitytown property taxrate were collected front 121i school districts in Neu. York State inwhich the first budget submitted to the electorate lot approval in 11169was defeated, and from 135 randomly selected districts in which thebudget passed. Background data on pupil enrollment, communitygrowth, and wealth in terms of real property valuation and median'mudy income as yell number of ners in the election and thenumber who cast negative votes were also collected.
The literature on voting beim\ lilt he partisan and school financialelections suggests that voter affiliation and p;:uticipat;011 fit stable pat-terns met. time. (:hinges in stable patterns can occur when latentopinions are aeivated by certain stimuli. It tl.ese newly activatedopinions reach sufficient intensiO, they can l'esult in changed behavior.particularly a decision to participate in the election, provided theindividual experiences a sense of efficacy, a belief that his vote Will
Fins study sought to determine, then, which fiscal and m1,-11111161 factors tlo indeed (unction as the stimuli which activate analchange voter behavior in school budget elections ;Intl what is the eteIt of their contribution.
To answt1- that question, data lor the state as a whole were ana-lyted in lour categories (passing-participation, passing-tlissent,participation and ..ailing(issent) using a multiple regression techniqueclesigne.C. to indicate the extent to which each predictor variableuniquek contlibutes to variations in voter participation and dissott.
results of this analysis were surprising. Only one fiscal factorthe percentage of the budget raised locallyhad an important effectOn the criterion variables L' pla i fling 5 to 19 percent of the 'al iancv
0' -7

School Finance. in Transition
depending upon the category. Moreover, once the background factorswere excluded. the fiscal and economic factors together accounted foronly ls to 29 percent. More surprising is the almost total lack of hit-ixatance of the two categories of vat Wiles expected to be strong pre-dictors consistent with the common notion about causes of voter be-havior: budget decisions controlled by a hoard of education and non-school (municipal) fiscal factors.
These results plus the higher wealth of defeating districts suggestthe influence of the regional context of fiscal behavior on electoral be-havior. Therefore, the 261 districts were grouped by metropolitan NewYork City SN1SA, upstate SNISA and non-SNISA and analysis per-formed for each group independently. Changes from the originalanalysis were notable. All variables now explain 23 to 53 percent ofthe variation in electoral behavior. But the more striking result is thedifferences among regional groups. In rural districts (non-SMSA) thefiscal and economic factors explain approximately one-fifth of thevariance in dissent, upstate of SALSA 53 percent and metropolitanNew York 47 percent. The influence of decisions controllable by aboard of education becomes more important. The six conclusions ofthis study are:
1. Approximately one-half of the variance in voter participationand dissent is not explained by the factors used in the study.
2. The most consistent stimuli of participation and dissent arenot controllable by boards of education in the year in which the elec-tion occurs.
3. Teacher salary increases have no effect on participation anddissent.
4. Non-school fiscal and economic factors are not important pre-dictors of electoral behavior in school budget elections.
5. The influence of fiscal and economic factors on electoral be-havior differs according to the geographical area in New York Statein which the school district is located.
6. Participation and dissent in school budget elections are highlyrelated.
The increase in school property tax rates anti tax levies as a pro-portion of the total budget over a period of several years were sug-gested as additional fiscal factors with potential explanatory power.
The findings of this study suggest that the act of voting in a schoolfinancial election is often conceptualized in much too narrow terms.It is seen only as support of or failure to support a particular spend-ing plan. While in effect support of the board of education on a fi-nancial issue is the immediate question at hand, voters are motivatedto participate and cast "yes" or "no" ballots as a result of a configura-tion of stimuli. School budget elections arc not just an opportunityfor voters to express their concerns about spending for schools or evenpoor economic conditions in general. They are all too often the onlyopportunity available to most electorates to play a direct role that canhave immediate impact in affecting board of education policy deci-
el 4

AtthlFil Winning Dissertations 223
sions. The school budget election becomes for at least some voters,then, a refetendutu on the effectiveness of the schools in general ratherthan sitnply a judgment a holt t the wi.dotu of a particular spendingplan.
The specific relationship between non-fiscal stimulus factors andvoting beim ior involves the notion of latent negativism: negative at-titudes toward the school distt lit are activated at occasional schoolbudget elections when there are stimuli present sufficiently strong to=mate the (-Wien to vote. Three non-fiscal factors were suggestedthat could activate the latent negativism with the result that voterswithdraw their support front the school district by casting negativeballots in the school budget elation. They are:
1. Community conflict over a non-fiscal educational issue:2. Organiied opposition to the board of education:3. Contests For seats on the board of education.
INPUT-OUTPUT ANALYSIS OF SECONDARY SCHOOLSIN PENNSYLVANIA
BY RODNEY J. KUHNS, 1972
CHAIRMAN: DR. WALTER J. DELACYMAJOR DEPARTMENT: EDUCATIONAL ADMINISTRATIONINSTITUTION: PF.NNISYLVANIA STATE UNIVERSITY
In this investigation theoretical input-output models of Penn-sylvania secondary schools were examined. The purposes of the studywere 1) to explore the predictive relationships among certain specifiedmanipulative inputs and selected outputs as measured by the Penn-sylvania Department of Education's Bureau of Educational QualityAssessment, and 2) to construct and vilidate a better empirical pre-dictive model. This model should enable managers to discern the im-pact of various mixes of manipulative inputs on educational outputs.Manipulative inputs referred to those resources that can be con-trolled or changed over a short-run planning horizon by educationaldecision makers.
If schools are to allocate resources more efficiently, then educa-tional managers obviously must be
inputswith more relevant in-
formation concerning the effect of nputs on outputs. The Pennsyl-vania Plan for statewide assessment was created by legislative man-date to determine the adequacy and efficiency of public schools in theCommonwealth. To accomplish this task an educational input-outputmodel was designed to measure the impact of three broad categoriesof educational inputs. They were: I) school and community; 2) in-structional staff; and 3) student characteristics. Output was measuredby a battery of instruments that include both cognitive and affectivetypes of learning.
riff-0

224 Nrhool Finance in Transition
After reviewing the Pennsylvania Plan's findings, a major limita-tion of the current Pennsylvania input-output model was observed.Insufficient consideration was given to dynamic organizational vari-ablesthat is, inputs that could be manipulated from year to year byadministrators to observe the impact On output. Most of the variationin school outputs was accounted for by inputs that would be difficultto change or alter in a sortrun planning horizon. For example,teacher characteristics like sex. age, background, education, experience.and parental occupational level. ale near immutables over a short timeperiod. Therefore. educational decision makers wishing to employthese findings to effect rational change or to alter resource allocationwere seriously impaired due to the selection of inputs utilized in themodel.
There were two primary sources used for data collection. ThePennsylvania Department of Education, Bureau of Educational Qual-ity Assessment, generously provided the entire set of 1971 inputs andoutputs. The data used to construct the manipulative inputs werecollected by questionnaires sent to the participating secondary schools.There were fifty-three schools in the sample with 100 percent responserealized
Multiple linear regression was the analytical model chosen to vali-date the input-output models. An important result of multiple linearregrIssion analysis is the capacity to assess the efficacy of each inputvariable in the presence of other inputs in predicting or explainingschool outputs. However, a basic problem is to choose a predictor setfront the available predictors (inputs).
There arc a number of methods for selecting a set of "p" predic-tors from a larger set of "P" predictors. The analytical procedureutilized in this study was the true step-up regression procedure. In theabsence of a learning theory which specified a priori the order of inputentrance to the model, this step-up regression procedure was deemedpreferable.
Three different input-output models were analyzed and comparedto accomplish the stated goals of this research; the proposed modelusing inanity manipulative inputs, the current Pennsylvania Plan'smodel, and the amalgamated modela merger of the other two. Thecriterion for input selection to the predictor set was at least a onepercent contribution to R.
The major findings were:1) The amalgamated model, a merger of both sets of inputs to pre-
dict the same outputs, performed substantially better in terms of itspredictive potential (R2) than either of the other two models.
2) The proposed model, containing mainly manipulative inputs,exceeded or equalled the predictive power of the current BEQA modelon six of twelve regres,ious.
3) A major determinant of student performance, on school outputmeasures. was nonschool inputs such as family socioeconomic status.
4) Manipulative input performance can be summarized as follows:
4r, ripOW, .1..

elwald Winning Mar:Wilms 22'
a) Teacher salaries had a positive association with outputs;b) Preparation coefficient (teacher specialization) was posi
tively related with a few outputs:c) Teacher load had a consistently negative association with
outputs;d) Class site, a new index, had mixed predictive effects un out-
puts:e) Administratke man-hours and outputs were positively as-
soc i a ted:1) Auxiliary man-hours and outputs were veakly and nega-
tively related;g) Paraprofessionals related negatively to output;It) Curriculum units per grade performed perversely by its
negative association with outputs:i) Students/academic faculty had mixed predictive effects with
strength demonstrated in both directions;j) Average extracurricular expenditure was only nominallv
related to output:k) The facilities components, as measured by (I) the building
ratio (crowding) and (2) school site, were relatively weakpredictors of learning outcomes.
') The predictive strength of manipulative inputs was dead) seenin the amalgamated model where numerous nonmanipulative type in-puts were displaced or selectively excluded from entering the model.
A basic concern of school finance is the allocation o: ace re-sources to various competitive educational programs. The generalproposition underlying the development and analysis of the variousinput-output models in this study was that specified manageable schoolinputs would have a measurable impact upon the prediction of learn-ing outcomes production. With the identification of those controllablefactors of production that might contribute to improving educationalproductivity, the possibility for increasing rationality regarding re-source allocation is enhanced.
Some of the conclusions that can be derived [ruin this study arepresented below:
I) The amalgamated model. a merger of Nelccted PennsylvaniaPlan inputs and manipulative inputs made a substantially better pre.diction of learning outcomes production than the other two modelsby themselves. Therefore. it is clear that what educators do with cer.fain resources does taake a difference in learning outcomes. if agree-ment could be reached on selection of a single output from the multi-plicity of educational goals and input costs identified, then variousalternative combinations of inputs could he examined in relation tothe costs and the predicted effects.
2) Schools paying higher teacher salaries tended to have higher stu-dent performance on school output measures. This probably reflectedthe schools' ability to attract better qualified teachers or older, moreexperienced and more educated teachers.
S) Teacher specialization tended to decrease school outputs. In

:26 School Finanre in Transition
most economic organizations, increased specialization is normally as-sociated with increased productivity. The relevance of this assumptionin education is questioned by the results of this study.
1) 'Teacher ellecti. (mess in producing learning was related to lowerteaching loads in classroom work. Schools where teachers taught morehours per week tended to have a negative effect upon school outputs,other things equal.
5) The school facilities component as measured by the buildingratio (crowding) and enrollment (Ace) were more related to affectiveoutputs than cognitive. Crowded schools tended to reduce their effec-tiveness in developing better student attitudes of understanding differ-imi others, interest in school, and citizenship. Large schools tended tocontribute to lower student self-images but improved their attitudestoward others different from themselves. These conclusions seem rea-sonable in that the acquisition of impersonal and more bureaucraticcharacteristics. an unfortunate dysfunctional consequence of schoolsize, probably interferes with the delicate development of sound stu-dent self concepts. However, the exposure to larger numbers of stu-dents of different races, religions and subcultures seems to be func-tional in making students more tolerant of differing others.
6) Curriculum growth and expansion may be dysfunctional. Per-haps by increasing course selection there has been an inadvertant in-crease in student confusion in how best to achieve their individuallyprescribed goals. Or, increases in course offerings may be creating com-petitive courses that divert the student's attention away from the ac-quisition of bask skills and the development of acceptable attitudes.Obviously, there is more to the production of learning outcomes inschools than mere increases in curriculum breadth or depth.
7) Utilization of management science models in educatione.g.,the constrained input-output modelis in its embryonic stage. Al-though the research findings only provide at best nominal evidencefor moving toward decision models concerning resource allocations,it does provide revealing insights into the complexities of schoolsystems.
EFFECT OF HIGH SCHOOL SIZE ON COST ANDINSTRUCTIONAL PROGRAM
BY JACK IRVIN MARCUSSEN, 1972
CHAIRMAN: DR. WII.I.IAM MCI,URF:MAJOR DEPARTMENT: EDUCATIONAL. ADMINISTRATIONINSTITUTION: UNIVERSITY OF ILLINOIS
There are many facets to the question of school size which schoolhoards and superintendents must consider as they attempt to moreefficiently meet the academic, career and social needs of their students.

Aatal Winning Dissertations 227
The question of prow ant effectiveness and cost, in relation to schoolsite, has been a continuing concern of those who have recognited theneed for mosolidmion of small schools and se howl systems into largercilia:ado:IA units.
Since these early efforts toward rural school consolidation. new so-cial and economic issues have given impetus to the study of school or-ganitation, site, student population, program. and economic support.The financial problem is one that plagues almost every school systemin the nation. The situation grows more critical each year when schooldistricts must again budget limited resources in an attempt to provideneeded services in a constantly expanding economy.
The major purpose of this study is to identify the critical siteschool, defined by the author as that (enrollment) size at which thecost of the program for a school of any smaller site is too prohibitiveto support an acceptable level of educational opportunity.
The study also seeks to answer severa' other qu,:stions concerningschool site. cost and the instructional program: (1) What percent ofthe per-pupil unit cost of the entire instructional program as devotedto required components of the program? (2) At what point in schoolsize do casts of operating the total instructional program tend tolevel off? (3) To what extent do differential costs of certain subjectmatter areas inhibit their inclusion in the instructional program? (4)To what extent do academic and vocational schools meet the needsof their respective populations?
A "Program Analysis and Planning Approach" is applied to twoexisting schools which serve as the "criterion" schools. The techniqueinvolves four steps: (I) statement of assumptions, (2) cost analysis ofcriterion school programs. (3) cost-utility analysis of programs, and(4) identification of the critical size school.
Three criteria were considered in the selection of the schools usedin this study: (1) program emphasis. (2) socio-economic characteris-tics of the student population. and (3) location.
The cast analysis is applied to the criterion schools in order toidentify current costs of each course in the program on a per pupilbasis. Current costs include direct instructional costs and indirect cur-rent costs.
The cost-utility analysis provides for the projection of alternativeschool sizes and programs, based on the cost analysis of the criterionschools. This is accomplished by selecting courses on a priority basis,required courses first, and pricing out their costs on a fixed budgetbasis for each smaller size (simulated) school. The programs of thesimulates: schools are then measured against a set of criteria whichestablish r&nimum standards for an acceptable program. The smallestsize (simulated) school meeting those standards is identified as thecritical size school.
It was found that the percent of the total budget allocated to therequired program increases as school size decreases. Likewise, the per-cent of the total program devoted to required courses increases asschool size decreases. There appears to be some evidence of a breakingpoint in school size where the required program tends to dominate
el dr' qe .0..

228 .b hoot Finance in Transition
the curriculum. While small schools attempt to oiler adequate pro-grams, it can be WM that required courses seriously impede theirefforts Ixqh in a cost sense and consequently, in the number and va-riety of curricular choices available to students.
Costs for both the vocational schools and the academic schoolstend to level off considerably when enrollment site reaches 1,500 stu-dents, with au almost total "leveling oft" in schools of 2,000 or over.A breaking point at which costs cease to spiral upward and tend tolevel off seems to occur at approximately 750 enrollment size.
Differential costs of subject matter ares are generally the samefor the academic and vocational schools. High cost subjects includemusk. business education and industrial arts. As might be expected,vocational education is the most expensive program offering in thevocational school.
An analysis of the extent to which the criterion schools serve theneeds of their particular student populations indicates that neitherschool effectively meets the needs of students who require remedialcourses. Generally, the vocational school appears to better serve itsstudent population.
On the basis of the data presented, the critical site school for anacademically oriented school appears to be approximately 750 studentenrolliument. Vhile the vocational and academic -criterion schoolsused in this study are not similar in site, extrapolation of the dataestablishes that a vocational school of approximately 800 to 850 en-rollment site cyuld meet the criteria necessary to be identified as acritical site school. Thus it would appear, from an analysis of the datapresented in this study. that the critical site school would fall withinthe site range of 750 to $30 student enrollment.
The increasing demands for educational services and the associatedrising costs of education arc well known. As the sources of financialsupport reach a point of depletion, educational leaders must searchfor avenues of economy.
The analytic technique applied in this study can hopefully serveas one administrative procedure for analyting costs and projectingviable alternatives to meet increasing educational needs in a time ofeconomic crisis. The Program Analysis and Planning Approach canserve as an evaluation procedure which permits decision makers totake an in-depth look at their school programs.
This study measured utility objcctises in terms of a program pre-scription that was considered adequate by the writer. It did not touchupon actual pupil benefit objectives which involves the measurementof behavioral changes that are expected to take place in students asa result of the various course offerings in an instructional program.This is a much more complicated evaluation of program, size andcost relationships, which needs to be researched when appropriatemeasurement procedures arc developed.

Award ;firming Dissertations 229
A STU DV TO IDENTIFY VARI.111.E.S TO PREDICT LOCALSCI tool . pRoDucrivrry IN TWO STATES
Ils- Scort N. Ito,F. 1;x1-.. 197"
CnAnatAN: KERN Al ExAxmrtMAjoa DEP.miNtEsi: Entleivtiosi.u. AuNtmsTRAIos:INsatmosi: UNtvEksrly or Ftottm.%
This study was 0111' cat two studies sponsored by the National Edu-cational Finance Projed to identify variables associated with schooldistrict productk itv.
The problem of the study was to find a function of several meas-urements of socioeconomic. community. and inschool variables whichpredicted high and low productivity in two states.
To identif high and low productive districts, pupil readingachievement was related to per pupil expenditure, deriving a regres-sion line which predicted the amount of reading achievement ex-pected for a given level of expenditure. The residual value, differencebetween actual achievement and predicted achievement, was used tomeasure school district deviation from the expected level of produc-tivity. Districts that deviated beyond an established minimum wereidentified as belonging to either a high productive group or a low pro-ductive group.
A list of variables postulated as having au association with produc-tivity was developed through a review of the literature. Variables weredescriptive of sentient socioeconomic background. community and in-school inputs into the educational process. Data for the variables weregathered from the two state departments of education and from theNational Educational Finance Project.
Stepwise disci iminant analysis was used to identify the variablesassociated with pi oductivity. The statistical technique developed a setof predictor equations. This predictor function was the best combina-tion of weighted variables to differentiate between the two produc-tivity groups. A separate function was developed for each of thesocioeconomic. community and in-school groups of variables. In addi-tion, a con site function including variables from all three categorieswas der lye(
The best combination of variables ill both states was the ompos-ite function. The accuracy of classification was 81 per cent in State Aand 90 per cent ill State P. Seventy-two per cent of the variation be-tween productivity groups was accounted for by the composite func-tion in State A and 90 per cent in State B.
The two states were different in size, populatio characteristics,economy and geogiaphy. Similarly, the predictor fun..tions were dif-ferent. Only the variable, percentage of attendance, was common toboth states. Predictor variables of the composite function in State Awere median education level of the adult population. percentage ofpupils eligible for ESF.A Title I programs, and percentage of schoolattendance. Predictor variables of the composite function in State 11
arle)I f 1

210 S.11001 Finance in Transition
were percentage of personal incomes over $10,000, percentage of schoolattendance, percentage of graduates entering post secondary schooleducation, percentage of teachers with less than 1 years of profes-sional preparation, percentage 01 enrollment from a minority ethnicor racial group, average class sir, percentage of teachers with 30 hoursof training beyond the bachelor's degree or with an advanced degree,and the number of children per nonteaching certified personnel.
Socioeconomic and community variables accounted for more vari-ati.o titan did in-school variables. 11;:wever, in State B, the in-schoolfunction was able to classify accurately 75 per cent of the districts andaccounted for 9 per cent of the variation between productivitygroups.
Major conclusions of the study were:
(1) The procedure used to study productivity was successful inthat high and low productive districts and the variables that discrimi-nated between them were identified.
(2) More of the variation between productivity groups was ac-counted for by socioeconomic and community variables than in-schoolvariables.
(3) In- school variables acted in combination with socioeconomicand community vat fables in predicting productivity.
(4) The tiiirerent functions derived suggest that there may be aunique combination of variables in each state to predict productivity.Each state should be studied independently to consider the state'sunique circumstances.
ir? ar-'t !aye'er .