Identification of the chloride-binding site in the human red and green color vision pigments
6
-m 0 Copyright 1993 by the American Chemical Society Volume 32, Number 9 Accelerated Publications March 9, 1993 Identification of the C1--Binding Site in the Human Red and Green Color Vision Pigment s+ Zhiyan Wang,i Ana B. Asenjo,s and Daniel D. Oprian’J Graduate Department of Biochemistry and Biology Graduate Program, Brandeis University, Waltham, Massachusetts 02254 Received December 7, 1992; Revised Manuscript Received January 19, 1993 ABSTRACT: Chloride ions are known to bind and alter the absorption spectra of some but not all visual pigments. In this report, the human red and green color vision pigments are shown to bind C1- and to undergo a large red shift in their absorption maxima. Mutation of 18 different positively charged amino acids in these pigments identified two residues, Hislg7 and Lys200, in the C1--binding site. Hislg7 and Lys200 are strictly conserved in all long-wavelength cone pigments but are absent in all rhodopsins and short- wavelength cone pigments. This fact suggests that the evolutionary branch of the long-wavelength pigments was established when an ancestral pigment acquired the ability to bind C1- and, as a result, shift the absorption maximum to longer wavelengths. The spectral properties of many, but not all, visual pigments are known to be influenced significantly by the binding of chloride ions to high-affinity sites on the proteins. This effect was first observed by Crescitelli (1977) for pigments of the Tokay gecko (Gecko gecko). G. gecko have two visual pigments, one blue (467-nm maximum) and one green (521- nm maximum). The spectral properties of the blue pigment are independent of chloride. However, the green pigment absorption maximum undergoes a 10-15-nm blue shift in chloride-depleted medium. Similarly, iodopsin, the red pigment from chicken, displays a sensitivity to chloride ion (Knowles, 1976). In the presenceof chloride,iodopsin absorbs maximally at 562 nm. Upon removal of chloride, the maximum undergoes a blue shift to about 520 nm. The dissociation constant (&) for binding of chloride to iodopsin is about 1 mM (Fager & Fager, 1979; Shichida et al., Besides chloride, several other inorganic ions are known to bind to these pigments (Fager & Fager, 1979;Shichida et al., 1990;Crescitelli, 1980;Crescitelli & Karvaly, 1991; Imamoto 1990). ?Supported by NIH Grants EY07965 and EY09514. t Graduate Department of Biochemistry. Biology Graduate Program. 0006-2960193 10432-2 125%04.0010 et al., 1989). The binding of Br- results in an absorption spectrum for both the chicken and gecko pigments that is indistinguishablefrom that of C1-. The ions F, I-, and Sod2- do not induce spectral shifts in either pigment. In contrast, NOS- and SCN- bind to the pigments but cause a blue shift in the absorption maximum (relative to the spectrum of the C1--depleted form). Thus, although previous work has not shown that theseionscompetefor thesamesite on thepigments, it is probably more accurate to speak of an anion-binding site rather than a C1--binding site. However, since C1- is the ion most likely to be bound under physiological conditions, we will continue to use the term C1--binding site. We show here that the human red and green color vision pigments also undergo large spectral shifts upon binding of C1-. We further use site-directed mutagenesis to identify the C1--binding site and show that this site is present in all long- wavelength absorbing visual pigments that have been se- quenced but absent from all rhodopsins and short-wavelength absorbing pigments. EXPERIMENTALPROCEDURES Expression, Purification, and Mutagenesis of the Human Color Vision Pigments. The human green and red pigments 0 1993 American Chemical Societv
Transcript of Identification of the chloride-binding site in the human red and green color vision pigments
- m
0 Copyright 1993 by the American Chemical Society Volume 32, Number 9
Accelerated Publications
March 9, 1993
Identification of the C1--Binding Site in the Human Red and Green Color Vision Pigment s+
Zhiyan Wang,i Ana B. Asenjo,s and Daniel D. Oprian’J
Graduate Department of Biochemistry and Biology Graduate Program, Brandeis University, Waltham, Massachusetts 02254
Received December 7, 1992; Revised Manuscript Received January 19, 1993
ABSTRACT: Chloride ions are known to bind and alter the absorption spectra of some but not all visual pigments. In this report, the human red and green color vision pigments are shown to bind C1- and to undergo a large red shift in their absorption maxima. Mutation of 18 different positively charged amino acids in these pigments identified two residues, Hislg7 and Lys200, in the C1--binding site. Hislg7 and Lys200 are strictly conserved in all long-wavelength cone pigments but are absent in all rhodopsins and short- wavelength cone pigments. This fact suggests that the evolutionary branch of the long-wavelength pigments was established when an ancestral pigment acquired the ability to bind C1- and, as a result, shift the absorption maximum to longer wavelengths.
The spectral properties of many, but not all, visual pigments are known to be influenced significantly by the binding of chloride ions to high-affinity sites on the proteins. This effect was first observed by Crescitelli (1977) for pigments of the Tokay gecko (Gecko gecko). G. gecko have two visual pigments, one blue (467-nm maximum) and one green (521- nm maximum). The spectral properties of the blue pigment are independent of chloride. However, the green pigment absorption maximum undergoes a 10-15-nm blue shift in chloride-depleted medium. Similarly, iodopsin, the red pigment from chicken, displays a sensitivity to chloride ion (Knowles, 1976). In the presence of chloride, iodopsin absorbs maximally at 562 nm. Upon removal of chloride, the maximum undergoes a blue shift to about 520 nm. The dissociation constant (&) for binding of chloride to iodopsin is about 1 mM (Fager & Fager, 1979; Shichida et al.,
Besides chloride, several other inorganic ions are known to bind to these pigments (Fager & Fager, 1979; Shichida et al., 1990; Crescitelli, 1980; Crescitelli & Karvaly, 199 1; Imamoto
1990).
?Supported by NIH Grants EY07965 and EY09514. t Graduate Department of Biochemistry.
Biology Graduate Program.
0006-2960193 10432-2 125%04.0010
et al., 1989). The binding of Br- results in an absorption spectrum for both the chicken and gecko pigments that is indistinguishable from that of C1-. The ions F, I-, and Sod2- do not induce spectral shifts in either pigment. In contrast, NOS- and SCN- bind to the pigments but cause a blue shift in the absorption maximum (relative to the spectrum of the C1--depleted form). Thus, although previous work has not shown that theseionscompete for thesamesite on thepigments, it is probably more accurate to speak of an anion-binding site rather than a C1--binding site. However, since C1- is the ion most likely to be bound under physiological conditions, we will continue to use the term C1--binding site.
We show here that the human red and green color vision pigments also undergo large spectral shifts upon binding of C1-. We further use site-directed mutagenesis to identify the C1--binding site and show that this site is present in all long- wavelength absorbing visual pigments that have been se- quenced but absent from all rhodopsins and short-wavelength absorbing pigments.
EXPERIMENTALPROCEDURES
Expression, Purification, and Mutagenesis of the Human Color Vision Pigments. The human green and red pigments
0 1993 American Chemical Societv
2126 Biochemistry, Vol. 32, No. 9, 1993
1
Accelerated Publications
r , 1.:, , , , , , c4
0 2
5C0 600
WAVELENGTH ( n m )
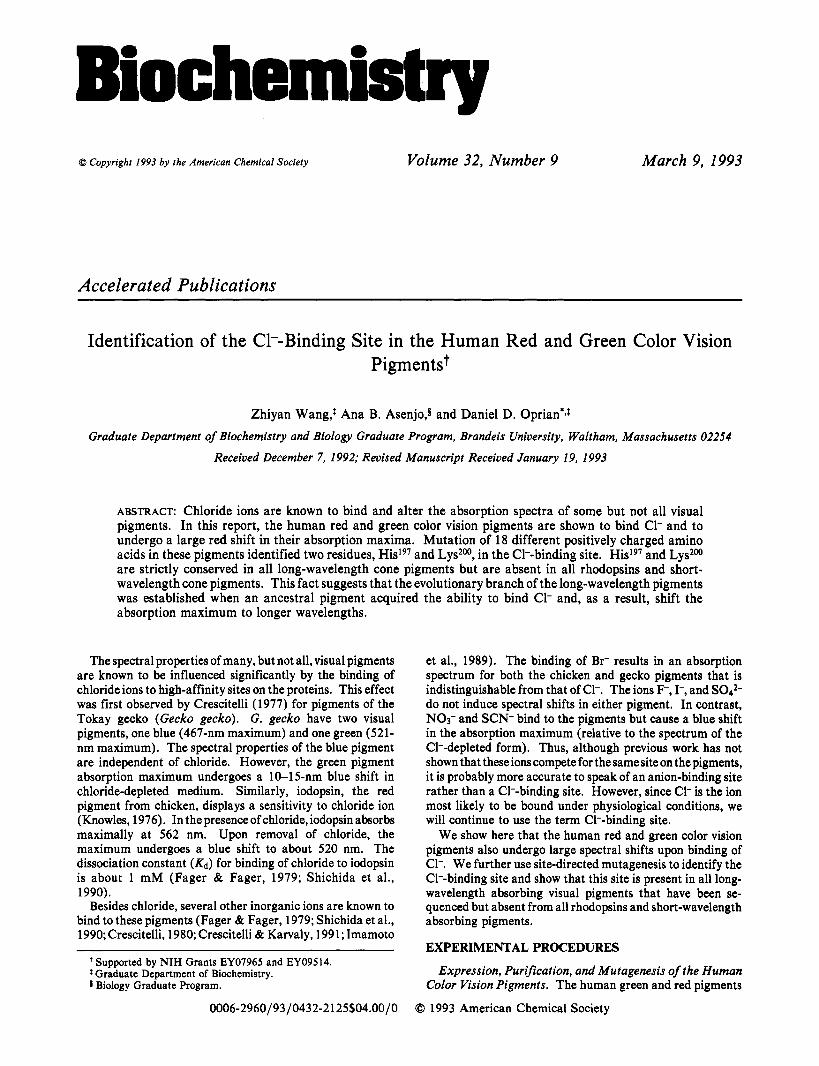
FIGURE 1: CI--dependent spectral change in the human green and red color vision pigments: (A) spectra for the human green pigment; (B) spectra for the human red pigment. The genes for the green and red color vision pigments were expressed in COS cells and purified as has been described (Oprian et al., 1991), except that isolation of the pigments was in CI--depleted medium. After the spectrum was recorded (curve l) , NaCl was added to 125 mM final concentration and another spectrum was recorded (curve 2). The spectra have not been corrected for a 3% dilution resulting from the addition of NaCI.
used in this study were isolated from COS cells that had been transfected with synthetic genes for the proteins. The genes and all procedures for their expression in C O S cells, recon- stitution of the pigments with chromophore, and purification of the proteins using an “epitope tag” and anti-rhodopsin monoclonal antibody have been described (Oprian et al., 1991). Mutagenesis of the color vision genes was by the technique of restriction fragment replacement as detailed in earlier publications (Zhukovsky & Oprian, 1989; Zhukovsky et al., 1991, 1992; Robinson et al., 1992). Bovine rhodopsin was isolated from transfected C O S cells as has been described (Oprian et al., 1987).
CI--Depleted Pigments. To prepare CI--depleted pigments, the final wash steps and elution from the immunoaffinity matrix were in 50 m M N-(2-hydroxyethyl)piperazine-N’-2- ethanesulfonicacid (HEPES) buffer, p H 6.6, containing 0.75% 3- [ (3-~holamidopropyl)dimethylammonio] - 1 -propanesul- fonate (CHAPS), 0.8 mg/mL L-a-phosphatidylcholine, 1 m M DTT, 1 m M PMSF, and 33% (v/v) glycerol. When anions were present, they were added as the N a + salts: NaCI, NaBr, NaF , NaI , N a S C N , NaNO3, and NaXS04.
Other Procedures. All other procedures and materials were as previously described (Zhukovsky & Oprian, 1989; Zhuk- ovskyet al., 1991; Oprian et al., 1991; Robinson et al., 1992; Zhukovsky et al., 1992). 11 -cis-Retinal was the generous gift of Dr. Peter Sorter and Hoffman-La Roche (Nutley, N J ) .
RESULTS
The Human Red and Green Color Vision Pigments. The human color vision pigments have not previously been characterized with respect to the effect of ions on their absorption spectra. However, given the high sequence similarity to iodopsin (Nathans et al., 1986; Kuwata et al., 1990), it seemed likely that the spectral properties of these pigments would also be influenced by CI-. As is shown in Figure 1, the absorption spectra for both the purified human red and green color vision pigments a re highly dependent upon CI-. The green pigment absorbs maximally a t about 5 15 nm in CI--depleted medium. Upon addition of 125 m M NaCI,
5 c‘ 0 5cc C l i 3 4 5 0 L 400
h’aC1 Concentrat;on (IN) V/AJE_EIUGTb (n-
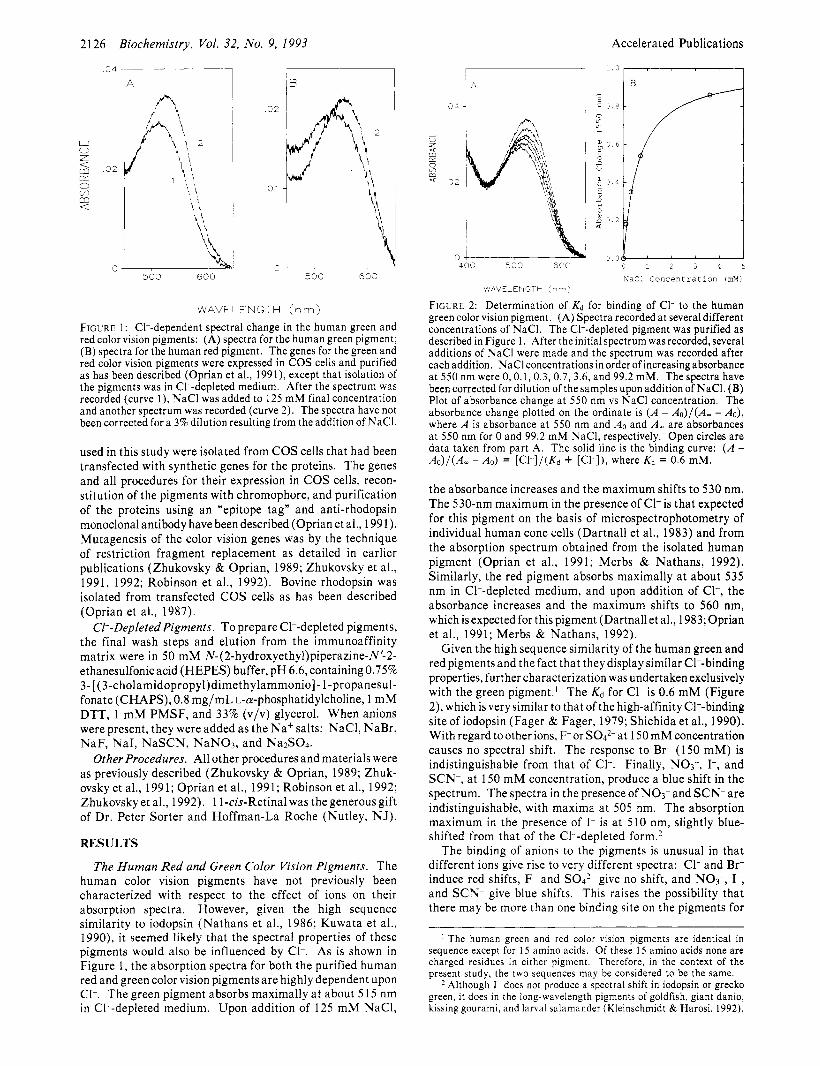
FIGURE 2: Determination of Kd for binding of C1- to the human green color vision pigment. (A) Spectra recorded at several different concentrations of NaC1. The CI--depleted pigment was purified as described in Figure 1. After the initial spectrum was recorded, several additions of NaCl were made and the spectrum was recorded after each addition. NaCl concentrations in order of increasing absorbance at 550 nm were 0, 0.1,0.3,0.7,3.6, and 99.2 mM. The spectra have been corrected for dilution of the samples upon addition of NaC1. (B) Plot of absorbance change at 550 nm vs NaCl concentration. The absorbance change plotted on the ordinate is ( A - & ) / ( A - - Ao), where A is absorbance at 550 nm and A0 and A , are absorbances at 550 nm for 0 and 99.2 mM NaC1, respectively. Open circles are data taken from part A. The solid line is the binding curve: ( A - Ao)/(A, - Ao) = [Cl-]/(Kd + [cl-I), where Kd = 0.6 mM.
the absorbance increases and the maximum shifts to 530 nm. The 530-nm maximum in the presence of CI- is that expected for this pigment on the basis of microspectrophotometry of individual human cone cells (Dartnall et al., 1983) and from the absorption spectrum obtained from the isolated human pigment (Oprian et al., 1991; Merbs & Nathans, 1992). Similarly, the red pigment absorbs maximally at about 535 nm in CI--depleted medium, and upon addition of C1-, the absorbance increases and the maximum shifts to 560 nm, which is expected for this pigment (Dartnall et al., 1983; Oprian et al., 1991; Merbs & Nathans, 1992).
Given the high sequence similarity of the human green and red pigments and the fact that they display similar CI--binding properties, further characterization was undertaken exclusively with the green pigment.’ The Kd for C1- is 0.6 m M (Figure 2), which is very similar to that of the high-affinity CI--binding siteof iodopsin (Fager & Fager, 1979; Shichida et al., 1990). With regard to other ions, F-or S04*- a t 150 m M concentration causes no spectral shift. The response to Br- (150 mM) is indistinguishable from that of C1-. Finally, NO3-, I-, and SCN-, a t 150 m M concentration, produce a blue shift in the spectrum. The spectra in the presence of NO3- and SCN-a re indistinguishable, with maxima a t 505 nm. The absorption maximum in the presence of I- is a t 510 nm, slightly blue- shifted from that of the C1--depleted form.2
The binding of anions to the pigments is unusual in that different ions give rise to very different spectra: CI- and Br- induce red shifts, F- and S04*- give no shift, and NO3-, I-, and SCN- give blue shifts. This raises the possibility that there may be more than one binding site on the pigments for
I The human green and red color vision pigments are identical in sequence except for 15 amino acids. Of these 15 amino acids none are charged residues in either pigment. Therefore, in the context of the present study, the two sequences may be considered to be the same.
Although I- does not produce a spectral shift in iodopsin or grecko green, it does in the long-wavelength pigments of goldfish, giant danio, kissing gourami, and larval salamander (Kleinschmidt & Harosi, 1992).
Accelerated Publications Biochemistry, Vol. 32, No. 9, 1993 2127
the various ions. However, when we measured the Kd for C1- in the presence of 150 mM SCN-, we found that it was increased to 30 mM, 50 times greater than in the absence of SCN-, as if the two ions were competing for the same site on the pigment. S042- apparently does not bind to the protein since the Kd for C1- in the presence of 150 mM S042- was found to be about 1 mM, unchanged from the& in the absence Of SQ2-. F-apparently also does not bind to the protein since 100 mM SCN- induced exactly the same spectral shift in the presence and absence of 70 mM F-. In summary, we conclude that the human green pigment (and by extrapolation the human red pigment) has a single binding site for the anions C1-, Br-, I-, NO3-, and SCN-. The & for C1- and the selectivity for different anions are very similar to the anion-binding site that has been described for iodopsin and the gecko green pigment.
Identification of the el--Bindingsite. To identify the amino acids that comprise the C1--binding site in the human green and red visual pigments, we used the following strategy. We first assumed that C1- will bind to positively charged amino acid side chains on the protein (Lys, Arg, or His). We then noted that no rod pigments, rhodopsins, have been reported to undergo a C1--dependent spectral shift. We confirmed that the spectrum of bovine rhodopsin is indeed independent of C1- in the medium (not shown). Since bovine rhodopsin does not bind C1-, but the green and red pigments do, we further assumed that the C1--binding site consisted of amino acid residues that are positively charged in the green and red pigments but not positively charged in rhodopsin. A com- parison3 of the sequence for bovine rhodopsin (Ovchinnikov et al., 1982; Dratz & Hargrave, 1983) with those of the green and red pigments identified 18 amino acid residues that fit this criterion (Figure 3). These amino acids were mutated in the human green pigment as outlined in Table I. In most cases, the amino acid was changed to the corresponding amino acid found at that position in rhodopsin. Residues at the amino terminus of the green pigment, which have no counterpart in rhodopsin, were either changed to Ala (Arg9, ArgI3) or deleted (Arg9, ArgI3, and HisI4 in mutant AI5). His*97 is the only amino acid in the set which is replaced by a negatively charged amino acid in rhodopsin (Glu). Out of concern for possible secondary effects (see below) stemming from the negative charge, we also changed His197 (and Lys2O0) to Ala. The mutants were expressed in COS cells and purified for spectral analysis.
We reasoned that mutation of the C1--binding site would result in two unique properties of the mutant pigment. First, the mutant should have an absorption maximum that is shifted to the blue from that of wild type. Second, the dependence of spectral properties on C1- should be considerably modified in the mutant. We first screened the mutants for the spectral shift. Of all the mutants, only those with changes at positions 197 and 200 displayed a spectral shift (Table I).
The double mutant H197E,K200Q4 has a spectrum with a maximum at 500 nm (shifted from 530 nm in the wild type) which is independent of C1- (Figure 4A). To determine which of the two amino acids, His197 or Lys2O0, was responsible for the spectral shift and loss of dependence on C1-, we prepared the two single mutants, H197E and K200Q, as shown in Table I. K200Q has a significant spectral shift relative to wild type, but it retains a dependence on C1-, as shown in Figure 4C. In
54
352 340 I
254 /
v
O0 .““oq..*~14 13 N 9
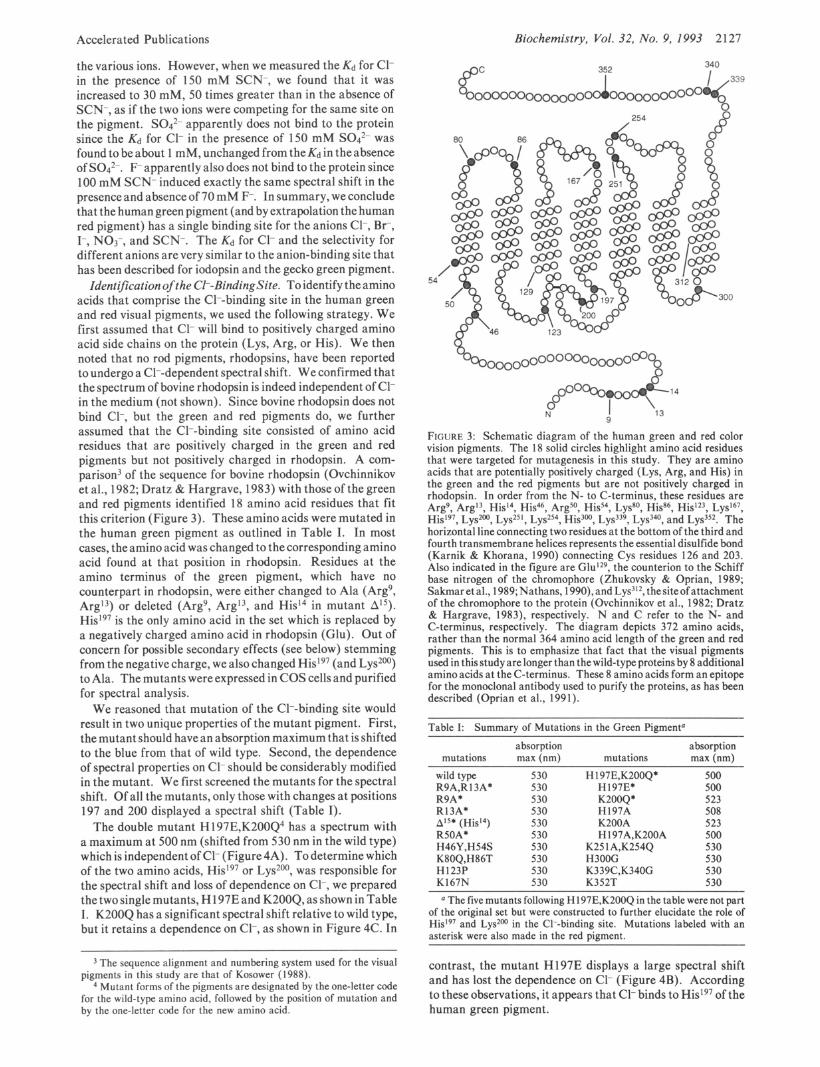
FIGURE 3: Schematic diagram of the human green and red color vision pigments. The 18 solid circles highlight amino acid residues that were targeted for mutagenesis in this study. They are amino acids that are potentially positively charged (Lys, Arg, and His) in the green and the red pigments but are not positively charged in rhodopsin. In order from the N- to C-terminus, these residues are Arg9, ArgI3, His14, Argso, Hiss4, Lyssa, Hiss6, His123, LysI6’
Lys2O0, L Y S ~ ~ I , Lys254, His3”(), Lys339, LYS~~O, and LYS~’~. Thd horizontal line connecting two residues at the bottom of the third and fourth transmembrane helices represents the essential disulfide bond (Karnik & Khorana, 1990) connecting Cys residues 126 and 203. Also indicated in the figure are G l ~ l ~ ~ , the counterion to the Schiff base nitrogen of the chromophore (Zhukovsky & Oprian, 1989; Sakmar et al., 1989; Nathans, 1990), and Lys3I2, the site of attachment of the chromophore to the protein (Ovchinnikov et al., 1982; Dratz & Hargrave, 1983), respectively. N and C refer to the N- and C-terminus, respectively. The diagram depicts 372 amino acids, rather than the normal 364 amino acid length of the green and red pigments. This is to emphasize that fact that the visual pigments used in this study are longer than the wild-type proteins by 8 additional amino acids at the C-terminus. These 8 amino acids form an epitope for the monoclonal antibody used to purify the proteins, as has been described (Oprian et al., 1991).
Table I: Summary of Mutations in the Green Pigmenta absorption absorption
mutations max (nm) mutations max (nm) wild type R9A,R13A* R9A* R13A* AI5* (Hid4) R50A* H46Y,H54S K80Q,H86T H123P K167N
530 530 530 530 530 530 530 530 530 530
H 197E,K200Q* H197E* K200Q* H 197A K200A H 197A,K200A
K25 1A,K254Q H300G K339C,K340G K352T
500 500 523 508 523 500 530 530 530 530
~~
a The five mutants following H 197E,K200Q in the table were not part of the original set but were constructed to further elucidate the role of His197 and Lys2O0 in the C1--binding site. Mutations labeled with an asterisk were also made in the red pigment.
The sequence alignment and numbering system used for the visual pigments in this study are that of Kosower (1988).
Mutant forms of the pigments are designated by the one-letter code for the wild-type amino acid, followed by the position of mutation and by the one-letter code for the new amino acid.
contrast, the mutant H197E displays a large spectral shift and has lost the dependence on C1- (Figure 4B). According to these observations, it appears that C1- binds to His197 of the human green pigment.
2128 Biochemistry, Vol. 32, No. 9, 1993 Accelerated Publications
32
31 -
< m c h l ! . ! ? h 5c3 600 5 G C 600 500 600
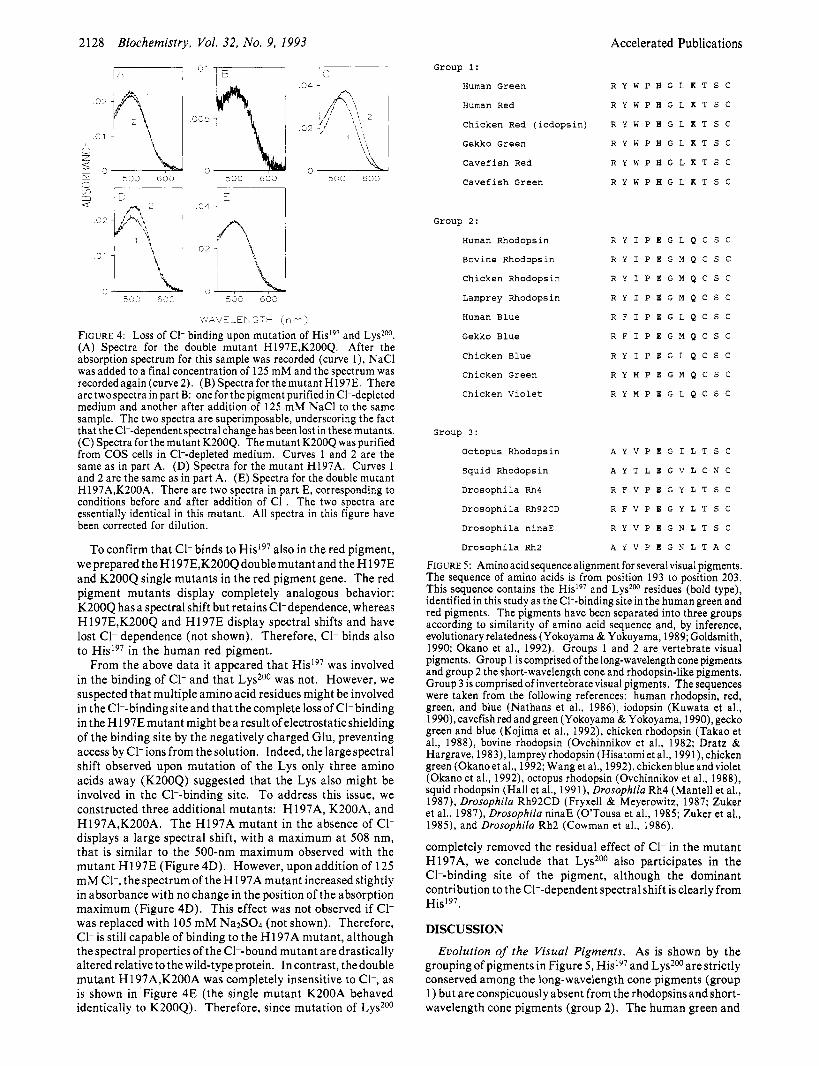
Wk J L _E N G- i i ( n T ) FIGURE 4: Loss of C1- binding upon mutation of His197 and Lys2O0. (A) Spectra for the double mutant H197E,K200Q. After the absorption spectrum for this sample was recorded (curve l) , NaCl was added to a final concentration of 125 mM and the spectrum was recorded again (curve 2). (B) Spectra for the mutant H197E. There are two spectra in part B: one for the pigment purifiedin Clk-depleted medium and another after addition of 125 mM NaCl to the same sample. The two spectra are superimposable, underscoring the fact that the CI--dependent spectral change has been lost in these mutants. (C) Spectra for the mutant K200Q. The mutant K200Q was purified from COS cells in CI--depleted medium. Curves 1 and 2 are the same as in part A. (D) Spectra for the mutant H197A. Curves 1 and 2 are the same as in part A. (E) Spectra for the double mutant H197A,K200A. There are two spectra in part E, corresponding to conditions before and after addition of CI-. The two spectra are essentially identical in this mutant. All spectra in this figure have been corrected for dilution.
To confirm that C1- binds to His197 also in the red pigment, we prepared theH197E,K200Qdoublemutant and theH197E and K200Q single mutants in the red pigment gene. The red pigment mutants display completely analogous behavior: K200Q has a spectral shift but retains C1- dependence, whereas H 197E,K200Q and H197E display spectral shifts and have lost C1- dependence (not shown). Therefore, C1- binds also to His197 in the human red pigment.
From the above data it appeared that His197 was involved in the binding of C1- and that LysZoo was not. However, we suspected that multiple amino acid residues might be involved in the C1--binding site and that the complete loss of C1- binding in the H 197E mutant might be a result of electrostatic shielding of the binding site by the negatively charged Glu, preventing access by C1- ions from the solution. Indeed, the large spectral shift observed upon mutation of the Lys only three amino acids away (K200Q) suggested that the Lys also might be involved in the C1--binding site. To address this issue, we constructed three additional mutants: H 197A, K200A, and H197A,K200A. The H197A mutant in the absence of C1- displays a large spectral shift, with a maximum a t 508 nm, that is similar to the 500-nm maximum observed with the mutant H197E (Figure 4D). However, upon addition of 125 m M C1-, the spectrum of the HI 97A mutant increased slightly in absorbance with no change in the position of the absorption maximum (Figure 4D). This effect was not observed if C1- was replaced with 105 m M Na2S04 (not shown). Therefore, C1- is still capable of binding to the H197A mutant, although the spectral properties of the C1--bound mutant a r e drastically altered relative to the wild-type protein. In contrast, the double mutant H197A,K200A was completely insensitive to C1-, as is shown in Figure 4E (the single mutant K200A behaved identically to K200Q). Therefore, since mutation of Lys2O0
Group 1:
Human Green
Human Red
R Y W P H G L K T S C
R Y W P H G L K T S C
Chicken Red (iodopsin) R Y W P H G L K T S C
Gekko Green R Y W P H G L K T S C
Cavefish Red
Cavefish Green
R Y W P H G L K T S C
R Y W P H G L K T S C
Group 2:
Human Rhodopsin R Y I P E G L Q C S C
Bovine Rhodopsin R Y I P E G M Q C S C
Chicken Rhodopsin R Y I P E G M Q C S C
Lamprey Rhodopsin R Y I P E G M Q C S C
Human Blue R F I P E G L Q C S C
Gekko Blue R F I P E G M Q C S C
Chicken Blue R Y I P E G L Q C S C
Chicken Green
Chicken Violet
R Y M P E G M Q C S C
R Y M P E G L Q C S C
Group 3:
Octopus Rhodopsin A Y V P E G I L T S C
Squid Rhodopsin A Y T L E G V L C N C
Drosophila Rh4 R F V P E G Y L T S C
Drosophila Rh92CD R F V P E G Y L T S C
Drosophila ninaE R Y V P E G N L T S C
Drosophila Rh2 A Y V P E G N L T A C
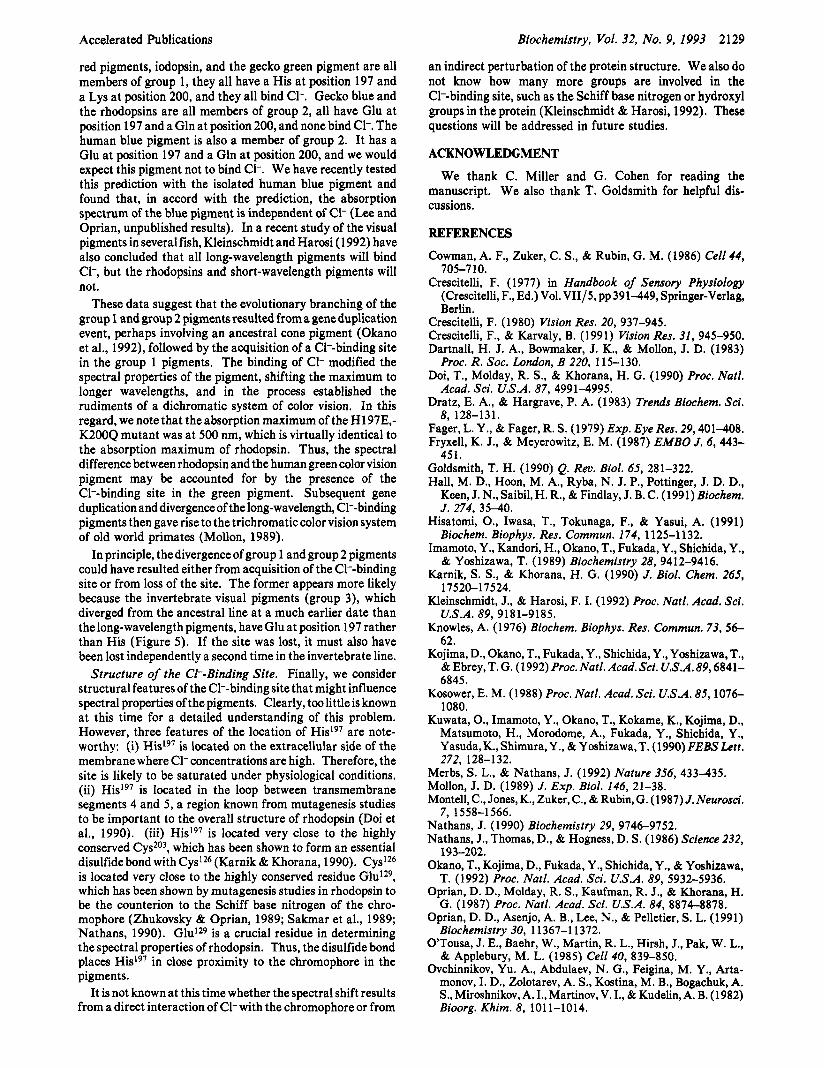
FIGURE 5: Amino acid sequence alignment for several visual pigments. The sequence of amino acids is from position 193 to position 203. This sequence contains the His'97 and Lyszoo residues (bold type), identified in this study as the CI--binding site in the human green and red pigments. The pigments have been separated into three groups according to similarity of amino acid sequence and, by inference, evolutionary relatedness (Yokoyama & Yokoyama, 1989; Goldsmith, 1990; Okano et al., 1992). Groups 1 and 2 are vertebrate visual pigments. Group 1 is comprised of the long-wavelength cone pigments and group 2 the short-wavelength cone and rhodopsin-like pigments. Group 3 is comprised of invertebrate visual pigments. The sequences were taken from the following references: human rhodopsin, red, green, and blue (Nathans et al., 1986), iodopsin (Kuwata et al., 1990), cavefish redandgreen (Yokoyama & Yokoyama, 1990), gecko green and blue (Kojima et al., 1992), chicken rhodopsin (Takao et al., 1988), bovine rhodopsin (Ovchinnikov et al., 1982; Dratz & Hargrave, 1983), lamprey rhodopsin (Hisatomi et al., 1991), chicken green (Okano et al., 1992; Wang et al., 1992), chicken blue and violet (Okano et al., 1992), octopus rhodopsin (Ovchinnikov et al., 1988), squid rhodopsin (Hall et al., 1991), Drosophila Rh4 (Mantel1 et al., 1987), Drosophila Rh92CD (Fryxell & Meyerowitz, 1987; Zuker et al., 1987), Drosophila ninaE (O'Tousa et al., 1985; Zuker et al., 1985), and Drosophila Rh2 (Cowman et al., 1986).
completely removed the residual effect of C1- in the mutant H197A, we conclude that LysZoo also participates in the C1--binding site of the pigment, although the dominant contribution to the C1--dependent spectral shift is clearly from His197.
DISCUSSION
Evolution of the Visual Pigments. As is shown by the grouping of pigments in Figure 5, His197 and Lys2O0 are strictly conserved among the long-wavelength cone pigments (group 1) but a re conspicuously absent from the rhodopsins and short- wavelength cone pigments (group 2). The human green and
Accelerated Publications
red pigments, iodopsin, and the gecko green pigment are all members of group 1 , they all have a His at position 197 and a Lys at position 200, and they all bind C1-. Gecko blue and the rhodopsins are all members of group 2, all have Glu at position 197 and a Gln at position 200, and none bind C1-. The human blue pigment is also a member of group 2. It has a Glu at position 197 and a Gln at position 200, and we would expect this pigment not to bind C1-. We have recently tested this prediction with the isolated human blue pigment and found that, in accord with the prediction, the absorption spectrum of the blue pigment is independent of C1- (Lee and Oprian, unpublished results). In a recent study of the visual pigments in several fish, Kleinschmidt and Harosi (1992) have also concluded that all long-wavelength pigments will bind C1-, but the rhodopsins and short-wavelength pigments will not.
These data suggest that the evolutionary branching of the group 1 and group 2 pigments resulted from a gene duplication event, perhaps involving an ancestral cone pigment (Okano et al., 1992), followed by the acquisition of a C1--binding site in the group 1 pigments. The binding of C1- modified the spectral properties of the pigment, shifting the maximum to longer wavelengths, and in the process established the rudiments of a dichromatic system of color vision. In this regard, we note that the absorption maximum of the H197E,- K200Q mutant was at 500 nm, which is virtually identical to the absorption maximum of rhodopsin. Thus, the spectral difference between rhodopsin and the human green color vision pigment may be accounted for by the presence of the C1--binding site in the green pigment. Subsequent gene duplication and divergence of the long-wavelength, C1--binding pigments then gave rise to the trichromatic color vision system of old world primates (Mollon, 1989).
In principle, the divergence of group 1 and group 2 pigments could have resulted either from acquisition of the C1--binding site or from loss of the site. The former appears more likely because the invertebrate visual pigments (group 3), which diverged from the ancestral line at a much earlier date than the long-wavelength pigments, have Glu at position 197 rather than His (Figure 5 ) . If the site was lost, it must also have been lost independently a second time in the invertebrate line.
Structure of the el--Binding Site. Finally, we consider structural features of the C1--binding site that might influence spectral properties of the pigments. Clearly, too little is known at this time for a detailed understanding of this problem. However, three features of the location of His197 are note- worthy: (i) Hid9' is located on the extracellular side of the membrane where C1- concentrations are high. Therefore, the site is likely to be saturated under physiological conditions. (ii) His197 is located in the loop between transmembrane segments 4 and 5, a region known from mutagenesis studies to be important to the overall structure of rhodopsin (Doi et al., 1990). (iii) His197 is located very close to the highly conserved Cys203, which has been shown to form an essential disulfidebond with Cys126 (Karnik & Khorana, 1990). CYS'*~ is located very close to the highly conserved residue G ~ u ' ~ ~ , which has been shown by mutagenesis studies in rhodopsin to be the counterion to the Schiff base nitrogen of the chro- mophore (Zhukovsky & Oprian, 1989; Sakmar et al., 1989; Nathans, 1990). Glu129 is a crucial residue in determining the spectral properties of rhodopsin. Thus, the disulfide bond places His197 in close proximity to the chromophore in the pigments.
It is not known at this time whether the spectral shift results from a direct interaction of C1- with the chromophore or from
Biochemistry, Vol. 32, No. 9, 1993 2129
an indirect perturbation of the protein structure. We also do not know how many more groups are involved in the C1--binding site, such as the Schiff base nitrogen or hydroxyl groups in the protein (Kleinschmidt & Harosi, 1992). These questions will be addressed in future studies.
ACKNOWLEDGMENT
We thank C. Miller and G. Cohen for reading the manuscript. We also thank T. Goldsmith for helpful dis- cussions.
REFERENCES Cowman, A. F., Zuker, C. S., & Rubin, G. M. (1986) Cell 44,
Crescitelli, F. (1977) in Handbook of Sensory Physiology (Crescitelli, F., Ed.) Vol. VII/5, pp 391449, Springer-Verlag, Berlin.
Crescitelli, F. (1980) Vision Res. 20, 937-945. Crescitelli, F., & Karvaly, B. (1991) Vision Res. 31, 945-950. Dartnall, H. J. A., Bowmaker, J. K., & Mollon, J. D. (1983)
Doi, T., Molday, R. S., & Khorana, H. G. (1990) Proc. Natl.
Dratz, E. A., & Hargrave, P. A. (1983) Trends Biochem. Sci.
Fager, L. Y., & Fager, R. S. (1979) Exp. Eye Res. 29,401408. Fryxell, K. J., & Meyerowitz, E. M. (1987) EMBO J. 6 , 443-
Goldsmith, T. H. (1990) Q. Rev. Biol. 65, 281-322. Hall, M. D., Hoon, M. A., Ryba, N. J. P., Pottinger, J. D. D.,
Keen, J. N., Saibil, H. R., & Findlay, J. B. C. (1991) Biochem. J . 274, 3540.
Hisatomi, O., Iwasa, T., Tokunaga, F., & Yasui, A. (1991) Biochem. Biophys. Res. Commun. 174, 1125-1 132.
Imamoto, Y., Kandori, H., Okano, T., Fukada, Y., Shichida, Y., & Yoshizawa, T. (1989) Biochemistry 28, 9412-9416.
Karnik, S . S., & Khorana, H. G. (1990) J. Biol. Chem. 265, 17520-17524.
Kleinschmidt, J., & Harosi, F. I. (1992) Proc. Natl. Acad. Sci.
Knowles, A. (1 976) Biochem. Biophys. Res. Commun. 73, 56- 62.
Kojima, D., Okano, T., Fukada, Y., Shichida, Y., Yoshizawa, T., & Ebrey,T. G. (1992) Proc. Natl. Acad.Sci. U.S.A.89,6841- 6845.
Kosower,E. M. (1988) Proc. Natl. Acad.Sci. U.S.A. 85,1076- 1080.
Kuwata, O., Imamoto, Y., Okano, T., Kokame, K., Kojima, D., Matsumoto, H., Morodome, A., Fukada, Y., Shichida, Y., Yasuda, K., Shimura, Y ,, & Yoshizawa,T. (1990) FEBS Lett.
705-710.
Proc. R. SOC. London, B 220, 115-130.
Acad. Sci. U.S.A. 87, 4991-4995.
8, 128-131.
451.
U.S.A. 89, 9181-9185.
272, 128-132. Merbs, S. L., & Nathans, J. (1992) Nature 356, 433-435. Mollon, J. D. (1989) J. Exp. Biol. 146, 21-38. Montell, C., Jones, K., Zuker, C., & Rubin, G. (1987) J. Neurosci.
Nathans, J. (1990) Biochemistry 29, 9746-9752. Nathans, J., Thomas, D., & Hogness, D. S. (1986) Science 232,
Okano, T., Kojima, D., Fukada, Y., Shichida, Y., & Yoshizawa, T. (1992) Proc. Natl. Acad. Sci. U.S.A. 89, 5932-5936.
Oprian, D. D., Molday, R. S., Kaufman, R. J., & Khorana, H. G. (1987) Proc. Natl. Acad. Sci. U.S.A. 84, 8874-8878.
Oprian, D. D., Asenjo, A. B., Lee, N., & Pelletier, S. L. (1991) Biochemistry 30, 11367-1 1372.
O'Tousa, J. E., Baehr, W., Martin, R. L., Hirsh, J., Pak, W. L., & Applebury, M. L. (1985) Cell 40, 839-850.
Ovchinnikov, Yu. A,, Abdulaev, N. G., Feigina, M. Y., Arta- monov, 1. D., Zolotarev, A. S., Kostina, M. B., Bogachuk, A. S., Miroshnikov, A. I., Martinov, V. I., & Kudelin, A. B. (1982) Bioorg. Khim. 8, 1011-1014.
7, 1558-1566.
193-202.
2130
Ovchinnikov, Yu. A., Abdulaev, N. G., Zolotarev, A. S., Artamonov, I . D., Bespalov, I . A., Dergachev, A. E., & Tsuda, M. (1988) FEBS Lett. 232, 69-72.
Robinson, P. R., Cohen, G. B., Zhukovsky, E. A., & Oprian, D. D. (1992) Neuron 9, 719-725.
Sakmar, T. P., Franke, R. R., & Khorana, H. G. (1989) Proc. Natl. Acad. Sci. U.S.A. 86, 8309-8313.
Shichida, Y., Kato, T., Sasayama, S., Fukada, Y., & Yoshizawa, T. (1990) Biochemistry 29, 5843-5848.
Takao, M., Yasui, A., & Tokunaga, F. (1988) Vision Res. 28, 471-480.
Wang, S. Z., Adler, R., & Nathans, J. (1992) Biochemistry 31,
Biochemistry, Vol. 32, No. 9, 1993
3 309-33 1 5.
Accelerated Publications
Yokoyama, S., & Yokoyama, R. (1989) Mol. Biol. Euol. 6,186-
Yokoyama, R., & Yokoyama, S. (1990) Proc. Natl. Acad. Sci.
Zhukovsky, E. A., & Oprian, D. D. (1989) Science 246, 928-
Zhukovsky, E. A., Robinson, P. R., & Oprian, D. D. (1991)
Zhukovsky, E. A., Robinson, P. R., & Oprian, D. D. (1992)
Zuker, C. S., Cowman, A. F., & Rubin, G. M. (1985) Cell 40,
Zuker, C., Montell, C., Jones, K., Laverty, T., & Rubin, G. M.
197.
U.S.A. 87, 9315-9318.
930.
Science 251, 558-560.
Biochemistry 31, 1040&10405.
851-858.
(1987) J . Neurosci. 7 , 1550-1557.