Identification of novel HPFH- like mutations by CRISPR base ...
32
Ravi et al. eLife 2022;11:e65421. DOI: https://doi.org/10.7554/eLife.65421 1 of 32 Identification of novel HPFH-like mutations by CRISPR base editing that elevate the expression of fetal hemoglobin Nithin Sam Ravi 1,2 , Beeke Wienert 3,4,5 , Stacia K Wyman 3 , Henry William Bell 5 , Anila George 1,2 , Gokulnath Mahalingam 1 , Jonathan T Vu 3 , Kirti Prasad 1,6 , Bhanu Prasad Bandlamudi 1 , Nivedhitha Devaraju 1,6 , Vignesh Rajendiran 1,2 , Nazar Syedbasha 1 , Aswin Anand Pai 2,7 , Yukio Nakamura 8 , Ryo Kurita 9 , Muthuraman Narayanasamy 1,10 , Poonkuzhali Balasubramanian 2,7 , Saravanabhavan Thangavel 1 , Srujan Marepally 1 , Shaji R Velayudhan 1,2,7 , Alok Srivastava 1,2,7 , Mark A DeWitt 3,11 , Merlin Crossley 5 , Jacob E Corn 3,12 , Kumarasamypet M Mohankumar 1,2 * 1 Centre for Stem Cell Research (a Unit of inStem, Bengaluru), Christian Medical College Campus, Vellore, India; 2 Sree Chitra Tirunal Institute for Medical Sciences and Technology, Thiruvananthapuram, India; 3 Innovative Genomics Institute, University of California, Berkeley, Berkeley, United States; 4 Institute of Data Science and Biotechnology, Gladstone Institutes, San Francisco, United States; 5 School of Biotechnology and Biomolecular Sciences, University of New South Wales, Sydney, Australia; 6 Manipal Academy of Higher Education, Karnataka, India; 7 Department of Haematology, Christian Medical College & Hospital, Vellore, India; 8 Cell Engineering Division, RIKEN BioResource Center, Ibaraki, Japan; 9 Research and Development Department, Central Blood Institute Blood Service Headquarters, Japanese Red Cross Society, Japan, Tokyo, Japan; 10 Department of Biochemistry, Christian Medical College, Vellore, India; 11 Department of Microbiology, Immunology and Molecular Genetics, University of California, Los Angeles, Los Angeles, United States; 12 Institute of Molecular Health Sciences, Department of Biology, Zurich, Switzerland Abstract Naturally occurring point mutations in the HBG promoter switch hemoglobin synthesis from defective adult beta-globin to fetal gamma-globin in sickle cell patients with hereditary persistence of fetal hemoglobin (HPFH) and ameliorate the clinical severity. Inspired by this natural phenomenon, we tiled the highly homologous HBG proximal promoters using adenine and cytosine base editors that avoid the generation of large deletions and identified novel regulatory regions including a cluster at the –123 region. Base editing at –123 and –124 bp of HBG promoter induced fetal hemoglobin (HbF) to a higher level than disruption of well-known BCL11A binding site in eryth- roblasts derived from human CD34+ hematopoietic stem and progenitor cells (HSPC). We further demonstrated in vitro that the introduction of –123T > C and –124T > C HPFH-like mutations drives gamma-globin expression by creating a de novo binding site for KLF1. Overall, our findings shed light on so far unknown regulatory elements within the HBG promoter and identified additional targets for therapeutic upregulation of fetal hemoglobin. Editor's evaluation RESEARCH ARTICLE *For correspondence: mohankumarkm@cmcvellore. ac.in Competing interest: The authors declare that no competing interests exist. Funding: See page 22 Preprinted: 01 July 2020 Received: 03 December 2020 Accepted: 11 February 2022 Published: 11 February 2022 Reviewing Editor: Stephen C Ekker, Mayo Clinic, United States Copyright Ravi et al. This article is distributed under the terms of the Creative Commons Attribution License, which permits unrestricted use and redistribution provided that the original author and source are credited.
-
Upload
khangminh22 -
Category
Documents
-
view
0 -
download
0
Transcript of Identification of novel HPFH- like mutations by CRISPR base ...

Ravi et al. eLife 2022;11:e65421. DOI: https://doi.org/10.7554/eLife.65421 1 of 32
Identification of novel HPFH- like mutations by CRISPR base editing that elevate the expression of fetal hemoglobinNithin Sam Ravi1,2, Beeke Wienert3,4,5, Stacia K Wyman3, Henry William Bell5, Anila George1,2, Gokulnath Mahalingam1, Jonathan T Vu3, Kirti Prasad1,6, Bhanu Prasad Bandlamudi1, Nivedhitha Devaraju1,6, Vignesh Rajendiran1,2, Nazar Syedbasha1, Aswin Anand Pai2,7, Yukio Nakamura8, Ryo Kurita9, Muthuraman Narayanasamy1,10, Poonkuzhali Balasubramanian2,7, Saravanabhavan Thangavel1, Srujan Marepally1, Shaji R Velayudhan1,2,7, Alok Srivastava1,2,7, Mark A DeWitt3,11, Merlin Crossley5, Jacob E Corn3,12, Kumarasamypet M Mohankumar1,2*
1Centre for Stem Cell Research (a Unit of inStem, Bengaluru), Christian Medical College Campus, Vellore, India; 2Sree Chitra Tirunal Institute for Medical Sciences and Technology, Thiruvananthapuram, India; 3Innovative Genomics Institute, University of California, Berkeley, Berkeley, United States; 4Institute of Data Science and Biotechnology, Gladstone Institutes, San Francisco, United States; 5School of Biotechnology and Biomolecular Sciences, University of New South Wales, Sydney, Australia; 6Manipal Academy of Higher Education, Karnataka, India; 7Department of Haematology, Christian Medical College & Hospital, Vellore, India; 8Cell Engineering Division, RIKEN BioResource Center, Ibaraki, Japan; 9Research and Development Department, Central Blood Institute Blood Service Headquarters, Japanese Red Cross Society, Japan, Tokyo, Japan; 10Department of Biochemistry, Christian Medical College, Vellore, India; 11Department of Microbiology, Immunology and Molecular Genetics, University of California, Los Angeles, Los Angeles, United States; 12Institute of Molecular Health Sciences, Department of Biology, Zurich, Switzerland
Abstract Naturally occurring point mutations in the HBG promoter switch hemoglobin synthesis from defective adult beta- globin to fetal gamma- globin in sickle cell patients with hereditary persistence of fetal hemoglobin (HPFH) and ameliorate the clinical severity. Inspired by this natural phenomenon, we tiled the highly homologous HBG proximal promoters using adenine and cytosine base editors that avoid the generation of large deletions and identified novel regulatory regions including a cluster at the –123 region. Base editing at –123 and –124 bp of HBG promoter induced fetal hemoglobin (HbF) to a higher level than disruption of well- known BCL11A binding site in eryth-roblasts derived from human CD34+ hematopoietic stem and progenitor cells (HSPC). We further demonstrated in vitro that the introduction of –123T > C and –124T > C HPFH- like mutations drives gamma- globin expression by creating a de novo binding site for KLF1. Overall, our findings shed light on so far unknown regulatory elements within the HBG promoter and identified additional targets for therapeutic upregulation of fetal hemoglobin.
Editor's evaluation
RESEARCH ARTICLE
*For correspondence: mohankumarkm@cmcvellore. ac.in
Competing interest: The authors declare that no competing interests exist.
Funding: See page 22
Preprinted: 01 July 2020Received: 03 December 2020Accepted: 11 February 2022Published: 11 February 2022
Reviewing Editor: Stephen C Ekker, Mayo Clinic, United States
Copyright Ravi et al. This article is distributed under the terms of the Creative Commons Attribution License, which permits unrestricted use and redistribution provided that the original author and source are credited.

Research article Chromosomes and Gene Expression | Genetics and Genomics
Ravi et al. eLife 2022;11:e65421. DOI: https://doi.org/10.7554/eLife.65421 2 of 32
This paper describes the innovative use of base editing to mutagenize an enhancer region in the iconic globin locus, demonstrating a new method while also finding a potential novel locus for downstream therapeutic approaches.
IntroductionFetal hemoglobin (HbF) is a tetramer consisting of two alpha- globin chains and two gamma- globin chains, which are highly expressed during the fetal stage of human life. The expression of HbF is silenced progressively after birth until it constitutes only about 1% of total hemoglobin (Bauer and Orkin, 2012). Naturally occurring mutations in the regulatory regions of the gamma- globin (HBG) genes have been shown to reactivate expression and increase HbF levels during adult life (Jacob and Raper, 1958). This inherited genetic condition is benign and is known as hereditary persistence of fetal hemoglobin (HPFH). Individuals, who inherit HPFH alongside other genetic disorders affecting the adult beta- globin gene, such as sickle cell disease or beta- thalassemia, were shown to have fewer, if any, symptoms (Jacob and Raper, 1958; Thein, 2018). Hence, high levels of HbF expression have been shown to be beneficial for improving the clinical outcomes of patients with sickle cell anemia and beta- thalassemia.
Genome editing approaches have largely focused on the beneficial effects of HPFH mutations to increase HbF levels in sickle cell disease (Traxler et al., 2016). These mutations either create de novo binding sites for erythroid activators or disrupt the binding sites of repressors, thereby increasing the expression of HbF. For example, the –175T > C, –198T > C and –113A > G HPFH point mutations create de novo binding sites for the erythroid master regulators TAL1, KLF1, and GATA1, respectively (Fischer and Nowock, 1990; Martyn et al., 2019; Stoming et al., 1989; Wienert et al., 2017; Wienert et al., 2015). Similarly, the introduction of HPFH- associated mutations around –115 bp from the transcription start site (TSS) of HBG (–114C > A, –117G > A, and a 13 bp deletion [∆13 bp]), and around –200 bp from the TSS (–195C > G, –196C > T, –197C > T, –201C > T and –202C > T/G), were shown to disrupt the binding sites of the two major fetal globin repressors, BCL11A and ZBTB7A/LRF, respectively (Martyn et al., 2018). However, the roles and locations of other regulatory elements in the HBG promoter that are involved in activation or de- repression are less well understood. Thus, tiling the HBG promoter using base editors could unravel molecular mechanisms of human hemo-globin switching and reveal additional point mutations that could be useful for therapeutic gamma- globin upregulation.
Targeted introduction of HPFH mutations into the HBG promoter by nuclease- mediated homology- directed repair is relatively inefficient and can result in high rates of random insertions and deletions (indels) through non- homologous end- joining DNA repair pathways (Cavazzana et al., 2017). In addi-tion, due to the high homology between the duplicated HBG1 and HBG2 genes, simultaneous editing of both HBG promoters by programmable nucleases that cause double- stranded breaks (DSBs) some-times results in ~4.9 kb deletion comprising the HBG intergenic region with uncertain consequences (Li et al., 2018; Métais et al., 2019; Wienert et al., 2017).
To overcome these limitations, we implemented a strategy to screen and identify potential regula-tory mutations within the proximal promoters of the two human fetal globin genes HBG1 and HBG2. We employed CRISPR base editing to introduce an array of point mutations into the HBG promoters and then screen for those mutations that induce HbF to therapeutic levels, without the confounding effects of creating DSBs. Similar to previous findings, we observed that base editing using adenine and cytosine base editors (ABEs and CBEs, respectively) is highly efficient in creating point mutations without inducing high levels of indels (Gaudelli et al., 2017; Komor et al., 2016). We identified several novel point mutations that are associated with a significant increase in gamma- globin expres-sion and could be of therapeutic interest. Our results demonstrated that base editors are a powerful tool for mapping the so far unknown regulatory elements within the HBG promoters and provide a proof- of- concept approach for the treatment of beta- hemoglobinopathies.
ResultsPrevious studies have shown that the highly homologous HBG1 and HBG2 proximal promoters play a crucial role in the gamma- globin expression. Several non- deletional forms of HPFH- associated point
Research article Chromosomes and Gene Expression | Genetics and Genomics
Ravi et al. eLife 2022;11:e65421. DOI: https://doi.org/10.7554/eLife.65421 3 of 32
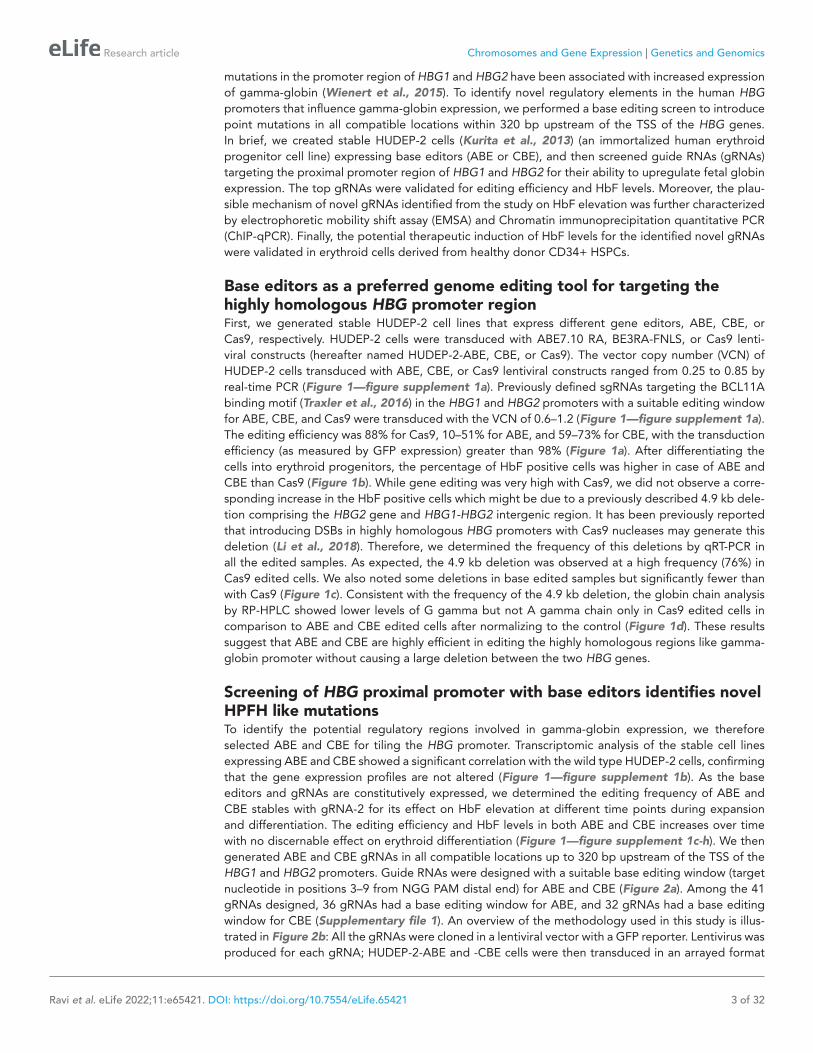
mutations in the promoter region of HBG1 and HBG2 have been associated with increased expression of gamma- globin (Wienert et al., 2015). To identify novel regulatory elements in the human HBG promoters that influence gamma- globin expression, we performed a base editing screen to introduce point mutations in all compatible locations within 320 bp upstream of the TSS of the HBG genes. In brief, we created stable HUDEP- 2 cells (Kurita et al., 2013) (an immortalized human erythroid progenitor cell line) expressing base editors (ABE or CBE), and then screened guide RNAs (gRNAs) targeting the proximal promoter region of HBG1 and HBG2 for their ability to upregulate fetal globin expression. The top gRNAs were validated for editing efficiency and HbF levels. Moreover, the plau-sible mechanism of novel gRNAs identified from the study on HbF elevation was further characterized by electrophoretic mobility shift assay (EMSA) and Chromatin immunoprecipitation quantitative PCR (ChIP- qPCR). Finally, the potential therapeutic induction of HbF levels for the identified novel gRNAs were validated in erythroid cells derived from healthy donor CD34+ HSPCs.
Base editors as a preferred genome editing tool for targeting the highly homologous HBG promoter regionFirst, we generated stable HUDEP- 2 cell lines that express different gene editors, ABE, CBE, or Cas9, respectively. HUDEP- 2 cells were transduced with ABE7.10 RA, BE3RA- FNLS, or Cas9 lenti-viral constructs (hereafter named HUDEP- 2- ABE, CBE, or Cas9). The vector copy number (VCN) of HUDEP- 2 cells transduced with ABE, CBE, or Cas9 lentiviral constructs ranged from 0.25 to 0.85 by real- time PCR (Figure 1—figure supplement 1a). Previously defined sgRNAs targeting the BCL11A binding motif (Traxler et al., 2016) in the HBG1 and HBG2 promoters with a suitable editing window for ABE, CBE, and Cas9 were transduced with the VCN of 0.6–1.2 (Figure 1—figure supplement 1a). The editing efficiency was 88% for Cas9, 10–51% for ABE, and 59–73% for CBE, with the transduction efficiency (as measured by GFP expression) greater than 98% (Figure 1a). After differentiating the cells into erythroid progenitors, the percentage of HbF positive cells was higher in case of ABE and CBE than Cas9 (Figure 1b). While gene editing was very high with Cas9, we did not observe a corre-sponding increase in the HbF positive cells which might be due to a previously described 4.9 kb dele-tion comprising the HBG2 gene and HBG1- HBG2 intergenic region. It has been previously reported that introducing DSBs in highly homologous HBG promoters with Cas9 nucleases may generate this deletion (Li et al., 2018). Therefore, we determined the frequency of this deletions by qRT- PCR in all the edited samples. As expected, the 4.9 kb deletion was observed at a high frequency (76%) in Cas9 edited cells. We also noted some deletions in base edited samples but significantly fewer than with Cas9 (Figure 1c). Consistent with the frequency of the 4.9 kb deletion, the globin chain analysis by RP- HPLC showed lower levels of G gamma but not A gamma chain only in Cas9 edited cells in comparison to ABE and CBE edited cells after normalizing to the control (Figure 1d). These results suggest that ABE and CBE are highly efficient in editing the highly homologous regions like gamma- globin promoter without causing a large deletion between the two HBG genes.
Screening of HBG proximal promoter with base editors identifies novel HPFH like mutationsTo identify the potential regulatory regions involved in gamma- globin expression, we therefore selected ABE and CBE for tiling the HBG promoter. Transcriptomic analysis of the stable cell lines expressing ABE and CBE showed a significant correlation with the wild type HUDEP- 2 cells, confirming that the gene expression profiles are not altered (Figure 1—figure supplement 1b). As the base editors and gRNAs are constitutively expressed, we determined the editing frequency of ABE and CBE stables with gRNA- 2 for its effect on HbF elevation at different time points during expansion and differentiation. The editing efficiency and HbF levels in both ABE and CBE increases over time with no discernable effect on erythroid differentiation (Figure 1—figure supplement 1c- h). We then generated ABE and CBE gRNAs in all compatible locations up to 320 bp upstream of the TSS of the HBG1 and HBG2 promoters. Guide RNAs were designed with a suitable base editing window (target nucleotide in positions 3–9 from NGG PAM distal end) for ABE and CBE (Figure 2a). Among the 41 gRNAs designed, 36 gRNAs had a base editing window for ABE, and 32 gRNAs had a base editing window for CBE (Supplementary file 1). An overview of the methodology used in this study is illus-trated in Figure 2b: All the gRNAs were cloned in a lentiviral vector with a GFP reporter. Lentivirus was produced for each gRNA; HUDEP- 2- ABE and -CBE cells were then transduced in an arrayed format

Research article Chromosomes and Gene Expression | Genetics and Genomics
Ravi et al. eLife 2022;11:e65421. DOI: https://doi.org/10.7554/eLife.65421 4 of 32
with equal transduction efficiency (~1 VCN/cell). The mean transduction efficiency for all these gRNAs in both ABE and CBE samples were around 97%. The gRNA transduced cells were then expanded for 8 days, successful base editing was then confirmed by NGS and Sanger sequencing.
First, we determined the overall efficiency of ABE- induced A- to- G conversions and CBE induced C- to- T conversions at different target sites of HBG promoter by NGS. The gRNAs associated with lower base editing efficiency (<10%) were excluded from further analysis as they do not provide
GFP
A110
A>G
A110
A>G
A112
A>G
A112
A>G
A113
A>G
A113
A>G
A116
A>G
A116
A>G
GFP
C11
4 C
>T
C11
4 C
>T
C11
5 C
>T
C11
5 C
>T
GFP
Inde
l
Inde
l
0
20
40
60
80
100
120
Perc
enta
ge (%
)Transduction efficiencySubstitution /InDel efficiency before differentiationSubstitution /InDel efficiency after differentiation
gRNA 2 edited by ABE gRNA 2 edited by CBE gRNA 7 edited by Cas9
HbF
+ C
ells
HbF
+ C
ells
CD
235+
CD
71+
HbF
+ C
ells
HbF
+ C
ells
CD
235+
CD
71+
HbF
+ C
ells
HbF
+ C
ells
CD
235+
CD
71+
HbF
+ C
ells
HbF
+ C
ells
CD
235+
CD
71+
HbF
+ C
ells
HbF
+ C
ells
CD
235+
CD
71+
HbF
+ C
ells
HbF
+ C
ells
CD
235+
CD
71+
0
20
40
60
80
100
120
Perc
enta
ge (%
)
ABE gRNA 2ABE Control CBE gRNA 2CBE Control Cas9 gRNA7Cas9 Control
Differentiation profileAfter differentiationBefore differentiation
gRNA 7gRNA 2
ABE CBE Cas90.0
0.2
0.4
0.6
0.8
1.0
1.2
Fold
cha
nge
in G
gam
ma
due
to 4
.9kb
del
etio
n(C
ompa
red
to c
ontro
l)
**
ABE CBE Cas9-5
0
5
10
15
20
G g
amm
a gl
obin
cha
in (%
)(n
orm
aliz
ed w
ith c
ontr
ol)
**gRNA 7gRNA 2
a)
b)
c)
d)
Figure 1. Base editors are preferred tool over Cas9 for editing the highly homologous HBG1 and HBG2 promoter. Highly homologous HBG promoter was edited by adenine base editor (ABE), cytosine base editor (CBE), and Cas9 with suitable guide RNAs (gRNAs) that target the well- known BCL11A binding site (–115 transcription start site [TSS]). (a) Transduction efficiency of gRNA- 2 (for ABE and CBE) or gRNA- 7 (for Cas9), percentage of individual base conversion for ABE and CBE (with gRNA- 2) and insertions and deletions (indels) for Cas9 (with gRNA- 7) before and after erythroid differentiation are represented. The transduction efficiency was analyzed by FACS, the individual base substitution and indel percentage were analyzed by EditR and ICE software respectively after sanger sequencing. (b) Flow cytometry analysis of fetal hemoglobin (HbF) and erythroid maturation markers (CD235a and CD71) expression in edited HUDEP- 2 cells. The percentage of HbF- expressing cells were analyzed before and after differentiation into erythroblasts. (c) Analysis of HBG2 deletion (due to 4.9 kb deletion) by qRT- PCR in the base edited and Cas9 edited HUDEP- 2 cells. (d) Expression of G gamma- globin chain in ABE, CBE, and Cas9 edited HUDEP- 2 cells, measured by RP- HPLC after differentiation into erythroblasts. The data were normalized with respective controls. Data are expressed as mean ± SEM from three biological replicates, asterisks indicate levels of statistical significance (**p < 0.01).
The online version of this article includes the following figure supplement(s) for figure 1:
Figure supplement 1. Characterization of the HUDEP- 2 cells expressing adenine (ABE) and cytosine base editor (CBE).

Research article Chromosomes and Gene Expression | Genetics and Genomics
Ravi et al. eLife 2022;11:e65421. DOI: https://doi.org/10.7554/eLife.65421 5 of 32
a)
b)
c)
d) Control
gRNA32
gRNA33
gRNA01
gRNA34
gRNA43
gRNA42
gRNA36
gRNA39
gRNA41
gRNA40
gRNA05
gRNA08
gRNA02
gRNA09
gRNA10
gRNA11
gRNA13
gRNA14
gRNA15
gRNA16
gRNA03
gRNA24
gRNA25
gRNA04
gRNA45
gRNA46
gRNA21
gRNA20
gRNA22
gRNA30
0
20
40
60
80
100
Percentage%
Total editing percentageTransduction efficiency (GFP%)
HbF by FACS
Control
gRNA32
gRNA33
gRNA34
gRNA44
gRNA38
gRNA36
gRNA42
gRNA41
gRNA40
gRNA05
gRNA08
gRNA02
gRNA10
gRNA11
gRNA12
gRNA15
gRNA16
gRNA17
gRNA18
gRNA03
gRNA45
gRNA46
gRNA21
gRNA20
gRNA22
0
20
40
60
80
100
Percentage%
Cloning sgRNA intoexpression vector
Transfection of Lenti plasmidin HEK-293T for virus production
Lentivirus withdesired gRNA
HUDEUP 2 cell lines with CBE/ABE
Expand for 8 days
Lentiviraltransduction
Genotype
Sanger Seq+EditR NGS+CRISPResso 2
Erythroid differentiation for 9 days
HbF FACS Real time PCR HPLC globin chains HPLC Hemoglobin
PhenotypePhenotype
Figure 2. Screening of HBG promoter using base editors to identify novel point mutations that elevate fetal hemoglobin (HbF) expression. (a) Schematic representation of the overall screening approach, adenine base editor (ABE) or cytosine base editor (CBE) expressing HUDEP- 2 cells were transduced with guide RNA (gRNAs) that target the proximal promoter of the HBG gene. The edited cells were expanded for 8 days. Editing efficiency was evaluated by Sanger sequencing and NGS, while functional analysis was carried out using FACS and qRT- PCR. Top targets from both the ABE
Figure 2 continued on next page
Research article Chromosomes and Gene Expression | Genetics and Genomics
Ravi et al. eLife 2022;11:e65421. DOI: https://doi.org/10.7554/eLife.65421 6 of 32
insights on HBG regulation (gRNAs -37, -38, -7, -18, -19, -29 in ABE, and gRNAs -1, -35, -37, -6, -7, -13, -19 in CBE) (data not shown). After excluding the low editing gRNAs, the total base editing efficiency (overall conversion achieved by a gRNA) varied from 12% to 81% and 13% to 80% for ABE (n = 30) and CBE (n = 25) respectively (Figure 2c and d) as determined by CRISPResso- 2 analysis. The individual base conversion frequency (base conversion at single base pair resolution) of ABE (A:T to G:C) and CBE (C:G to T:A) ranged from 0% to 74% and 0% to 61%, respectively (Figure 2—figure supplement 1a and c). Sanger sequencing data analyzed by EditR further confirmed the base substitution effi-ciency at the target loci (Figure 2—figure supplement 1b and d). The base substitution efficiency for each gRNAs varied drastically depending on the base editing window for ABE and CBE. The average editing efficiency observed was high (>30%) in the canonical positions for ABE (A5- A7) and CBE (C5- C7), while it varied between 1% to 27% in the non- canonical positions for ABE (A1- A4, A8- A12) and CBE (C1- C4, C8- C16) for the different gRNAs used in this study (Figure 2—figure supplement 2e- f).
Subsequently, we explored the product purity and indel percentage for all gRNAs in ABE and CBE, as previous studies have shown that the base editors generate a low frequency of unintended edits at the target sites (Koblan et al., 2018). Most of the gRNAs in CBE transduced cells showed unantic-ipated C- to non- T edits (C- R/G- Y), among which C- to- G conversion was predominant. In the case of ABE, we observed a minimal level of unexpected base conversions (A- Y/T- R) at a few on- target sites, consistent with previous studies (Gaudelli et al., 2017; Komor et al., 2016, Figure 2—figure supple-ment 2a- b). The indel frequency obtained from deep sequencing data was less than 2% in both ABE and CBE (Figure 2—figure supplement 2c- d). Our results suggest that ABE exhibits higher product purity and lower indel frequency than CBE in all cases. In summary, we show that both ABE and CBE can effectively introduce A- to- G and C- to- T nucleotide substitutions respectively in the proximal promoters of HBG1 and HBG2.
To evaluate whether the targeted base substitution at the HBG promoter by using ABE or CBE has increased HbF expression, we analyzed the HbF positive cells in ABE and CBE edited cells by flow cytometry after intracellular HbF staining. The percentage of HbF positive cells ranged from 2% to 44% in ABE and 1% to 35% in CBE (Figure 2c–d). In our preliminary analysis, among the 30 gRNAs in ABE and 25 gRNAs in CBE that we have screened for editing the HBG promoter region, five gRNAs in ABE and one gRNA in CBE showed a greater increase in the number of HbF positive cells (in a range of 40–50%).
We identified several gRNAs in ABE (gRNA -39, -41, -42, -08) and in CBE (gRNA -33, -44, -38, -41, -40, -15, -17, -46, -20, -21) which have higher total editing efficiency (>40%) at the target site but resulted in low HbF level (<10%). We were curious to know whether these gRNAs can affect the binding sites of activators resulting in downregulation of gamma- globin expression. To test this hypothesis, we transduced the selected gRNAs in K562 cell lines stably expressing ABE or CBE, a cell model which has high basal level of HbF expression. The transduction efficiency was more than 98% and achieved a higher individual base editing efficiency for each of the gRNAs in both ABE and CBE (Figure 2—figure supplement 3a- b). However, we did not observe any decrease in the number of HbF positive cells (98% of cells were HbF positive) in any of the samples suggesting that the targeted
and CBE screens with the highest induction of HbF were validated and differentiated to erythroid cells. The differentiated cells were further subjected to FACS, qRT- PCR, RP- HPLC, and HPLC analysis to determine the number of HbF positive cells, HBG expression, individual gamma- globin chains, and fetal hemoglobin levels, respectively. (b) Representation of gRNA targeting HBG promoter region in HUDEP- 2 cell line, gRNAs targeting –320 bp upstream of transcription start site (TSS) in HBG genes (HBG1 and HBG2) promoter regions are represented in the figure. gRNAs common for HBG1 and HBG2 promoters are represented in blue, while the gRNAs specific to HBG1 promoter are represented in orange color, the primers used for deep sequencing are represented as a red bar. Comparison of transduction efficiency, base editing frequency, and HbF expression in HUDEP- 2 cells expressing ABE (c) and CBE (d) transduced with different gRNAs targeting the HBG proximal promoter. The base edited cells were sequenced by NGS and analyzed for total editing frequency using CRISPResso- 2. The transduction efficiency (GFP+ cells) and HbF positive cells were analyzed by FACS.
The online version of this article includes the following figure supplement(s) for figure 2:
Figure supplement 1. Analysis of base substitution efficiency at single base pair resolution in HBG promoter by adenine base editor (ABE) and cytosine base editor (CBE) through NGS and Sanger sequencing.
Figure supplement 2. The product purity and preferred editing window of adenine (ABE) and cytosine base editors (CBE) at the target site.
Figure supplement 3. Base editing of HBG promoter to identify nucleotide substitutions that suppress fetal hemoglobin (HbF) expression.
Figure 2 continued

Research article Chromosomes and Gene Expression | Genetics and Genomics
Ravi et al. eLife 2022;11:e65421. DOI: https://doi.org/10.7554/eLife.65421 7 of 32
regions did not have binding sites for essential transcriptional activators (Figure 2—figure supple-ment 3c- d).
Interestingly, some of the top candidates from the screen include target regions that were previ-ously identified as binding sites for BCL11A (gRNA- 2), KLF- 1 (gRNA- 4), and TAL- 1 (gRNA- 3), but we also identified a few other novel target sites (gRNA- 10, gRNA- 11, gRNA- 15, gRNA- 16, gRNA- 21, gRNA- 32, gRNA- 34, gRNA- 42). The gRNAs- 2, -3, and -4 recreates the well- known naturally occur-ring HPFH mutations –114C > T, –117G > A, −175T > C and –198T > C (Liu et al., 2018; Martyn et al., 2018; Stoming et al., 1989; Wienert et al., 2018; Wienert et al., 2017). We compared the percentage of HbF positive cells with the editing efficiency for each of gRNAs at the target region in both ABE and CBE cells (Figure 2c–d). The total base editing efficiency was generally higher when compared to the proportion of HbF positive cells except in few cases (gRNA- 3, -4, -13, -14, -37, and -38 in ABE edited cells). Together, the candidate gRNAs which upregulated HbF from the primary screening of the HBG promoter by ABE and CBE provides targets for further validation.
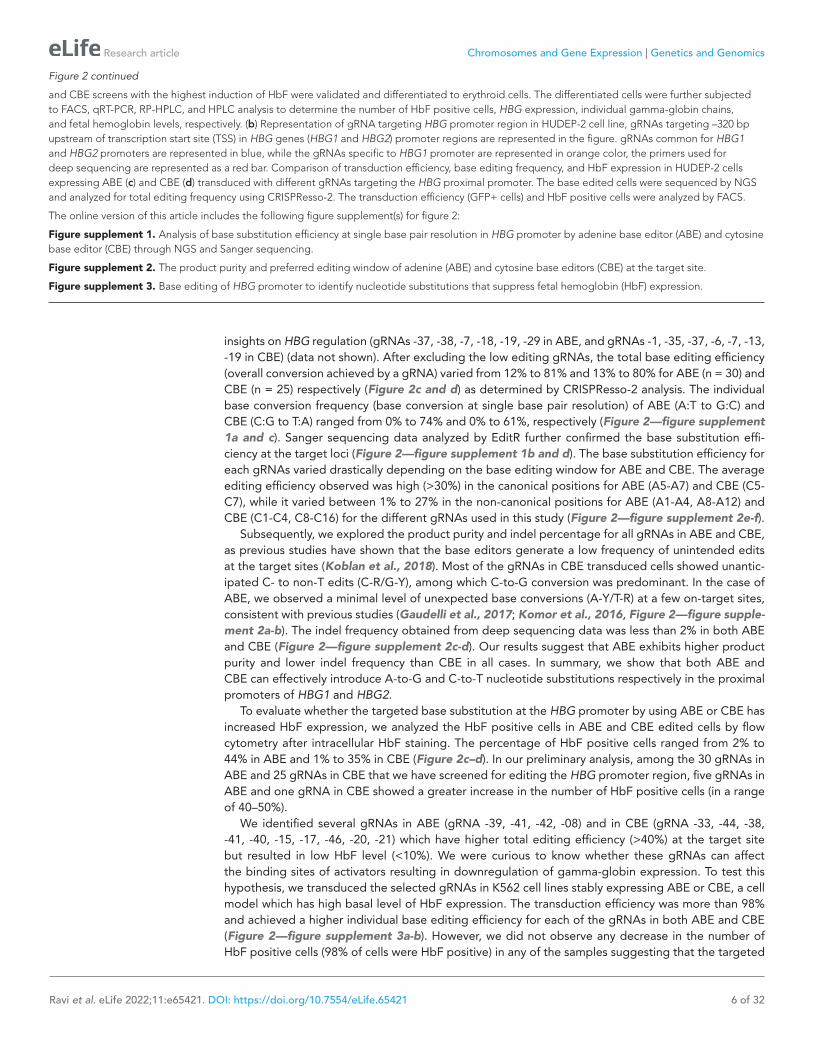
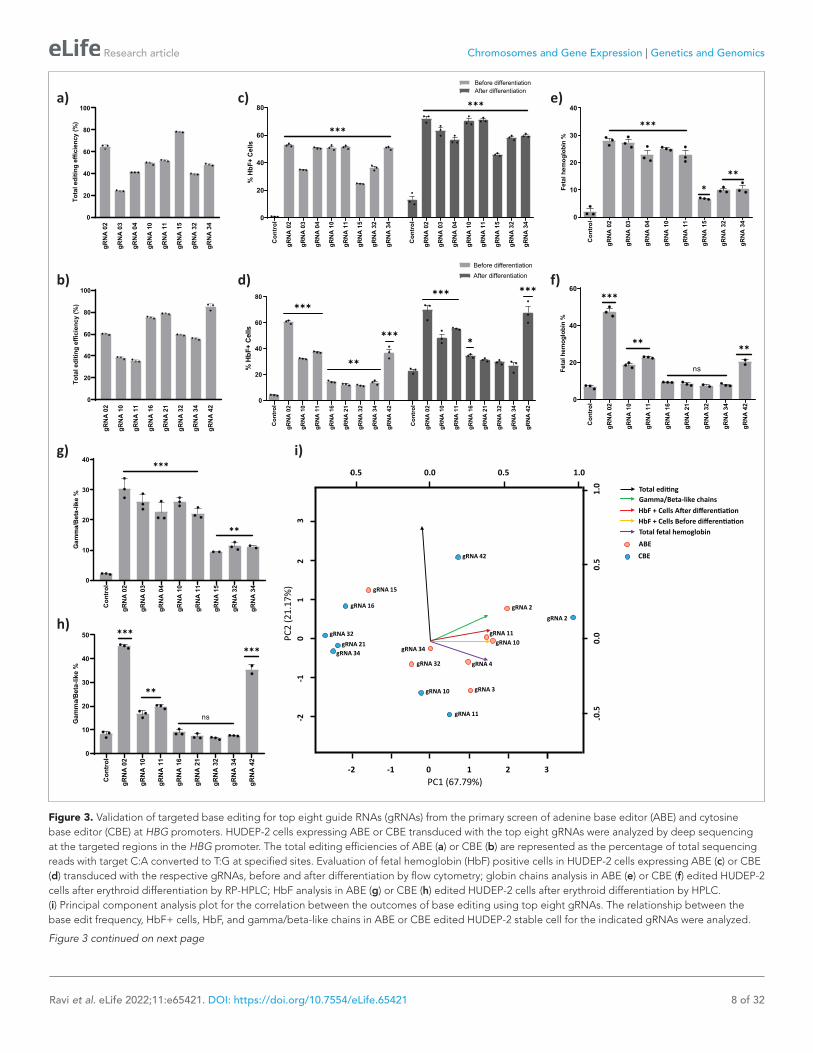
Base editing at potential target sites in the HBG promoter substantially induces HbF expressionThe top eight gRNAs from the ABE screen (gRNAs -2, -3, -4, -10, -11, -15, -32, and -34) and the CBE screen (gRNAs -2, -10, -11, -16, -21, -32, -34, and -42) which resulted in the highest levels of HbF posi-tive cells were further validated. Out of the top eight gRNAs identified from the base editor screen, five gRNAs (gRNA- 2, gRNA- 10, gRNA- 11, gRNA- 32, and gRNA- 34) were common in both ABE and CBE, indicating that these target regions might play an important role in HBG silencing. The edited cells were cultured in erythroid differentiation media after the initial expansion, and a set of func-tional assays were carried out (Figure 2b). Corresponding to the screening results, the total editing efficiency ranged from 24% to 78% and 36% to 85% with mean transduction efficiencies of 96% and 90% for ABE and CBE, respectively (Figure 3a–b and Figure 3—figure supplement 1f). We observed individual base conversion of A- to- G (ranging from 0% to 65%) or C- to -T (ranging from 1% to 57%) at the respective target regions with less than 2% indel frequency (Figure 3—figure supplement 1a- b and e). Further, we also observed the undesired non- C- to- T conversions (i.e., C- to- A or C- to- G) at the on- target site by CBE but not with ABE (Figure 3—figure supplement 1a- b and Figure 3—figure supplement 2a- b). The distribution of specific nucleotide substitution mediated by ABE or CBE for all the top eight gRNAs are highlighted in Figure 3—figure supplement 2a- b, respectively. ABE showed higher base editing efficiencies of the cognate A and Ts (A113 and A116 for gRNA- 02, T175 for gRNA- 03, T198 for gRNA- 04) than the bystander A and Ts (A110 and A112 for gRNA- 02, T181 for gRNA- 03, T199 for gRNA- 04) for the creation of HPFH mutations. In the case of CBE, we also observed the C- to- T base conversion at the nucleotides adjacent to the protospacer sequence as previously observed (Arbab et al., 2020; Webber et al., 2019). One such example is gRNA- 10 and gRNA- 11 in CBE; we observed the base conversion outside the protospacer sequence (–117 site) in addition to on- target editing at –122 site within the base editing window (Figure 3—figure supplement 1b and Figure 3—figure supplement 2b). The base conversion at –117 site disrupts the core binding motif of the major fetal globin repressor – BCL11A (Martyn et al., 2018; Wienert et al., 2018; Yang et al., 2019). We distinguished the editing frequency in HBG1 and HBG2 promoters by phasing the edits with single nucleotide variations at positions −271, –307, –317, and –324 which are unique in HBG1 and HBG2 promoters, using Bowtie 2 and IGV software (Robinson, 2012; Langmead and Salzberg, 2013). Our analysis showed that base editing rates were highly similar and there is no variation in base substitution efficiency between the highly homologous HBG1 and HBG2 promoters (Figure 3—figure supplement 1c- d).
We analyzed the HBG expression before and during differentiation by qRT- PCR. We observed a significant increase in the HBG mRNA expression for all the top eight gRNAs in ABE edited cells (p < 0.01 - p < 0.0001) (Figure 3—figure supplement 3a). In the case of CBE, gRNAs -2, -10, -11, and- 42 showed a substantial increase in HBG mRNA expression (p < 0.05 - p < 0.0001), while gRNAs -16, -21, -32, and -34 showed a modest level of expression as compared with the control (Figure 3—figure supplement 3g) before differentiation. The globin mRNA expression pattern in both ABE (Figure 3—figure supplement 3b) and CBE (Figure 3—figure supplement 3h) edited cells also followed a similar trend during erythroid differentiation. We also determined the number of HbF positive cells before and after erythroid differentiation using FACS. As expected, the percentage of HbF positive
Research article Chromosomes and Gene Expression | Genetics and Genomics
Ravi et al. eLife 2022;11:e65421. DOI: https://doi.org/10.7554/eLife.65421 8 of 32
a)
b)
g)
h)
gRN
A 0
2
gRN
A 0
3
gRN
A 0
4
gRN
A 1
0
gRN
A 1
1
gRN
A 1
5
gRN
A 3
2
gRN
A 3
40
20
40
60
80
100
Tota
l edi
ting
effic
ienc
y (%
)
gRN
A 0
2
gRN
A 1
0
gRN
A 1
1
gRN
A 1
6
gRN
A 2
1
gRN
A 3
2
gRN
A 3
4
gRN
A 4
2
0
20
40
60
80
100
Tota
l edi
ting
effic
ienc
y (%
)
Con
trol
gRN
A 0
2
gRN
A 0
3
gRN
A 0
4
gRN
A 1
0
gRN
A 1
1
gRN
A 1
5
gRN
A 3
2
gRN
A 3
4
Con
trol
gRN
A 0
2
gRN
A 0
3
gRN
A 0
4
gRN
A 1
0
gRN
A 1
1
gRN
A 1
5
gRN
A 3
2
gRN
A 3
4
0
20
40
60
80
% H
bF+
Cel
ls
After differentiationBefore differentiation
✱✱✱
✱✱✱
Con
trol
gRN
A 0
2
gRN
A 1
0
gRN
A 1
1
gRN
A 1
6
gRN
A 2
1
gRN
A 3
2
gRN
A 3
4
gRN
A 4
2
Con
trol
gRN
A 0
2
gRN
A 1
0
gRN
A 1
1
gRN
A 1
6
gRN
A 2
1
gRN
A 3
2
gRN
A 3
4
gRN
A 4
2
0
20
40
60
80
% H
bF+
Cel
ls
After differentiationBefore differentiation
✱✱✱
✱✱✱
✱✱✱
✱✱
✱✱✱✱
Con
trol
gRN
A 0
2
gRN
A 0
3
gRN
A 0
4
gRN
A 1
0
gRN
A 1
1
gRN
A 1
5
gRN
A 3
2
gRN
A 3
4
0
10
20
30
40
Feta
l hem
oglo
bin
%
✱
✱✱✱
✱✱
Con
trol
gRN
A 0
2
gRN
A 1
0
gRN
A 1
1
gRN
A 1
6
gRN
A 2
1
gRN
A 3
2
gRN
A 3
4
gRN
A 4
2
0
20
40
60
Feta
l hem
oglo
bin
%
✱✱✱
✱✱✱✱
ns
Con
trol
gRN
A 0
2
gRN
A 0
3
gRN
A 0
4
gRN
A 1
0
gRN
A 1
1
gRN
A 1
5
gRN
A 3
2
gRN
A 3
4
0
10
20
30
40
Gam
ma/
Beta
-like
%
✱✱✱
✱✱
Con
trol
gRN
A 0
2
gRN
A 1
0
gRN
A 1
1
gRN
A 1
6
gRN
A 2
1
gRN
A 3
2
gRN
A 3
4
gRN
A 4
2
0
10
20
30
40
50
Gam
ma/
Beta
-like
%
✱✱✱
✱✱✱
✱✱
ns
Total edi�ngGamma/Beta-like chainsHbF + Cells A�er differen�a�onHbF + Cells Before differen�a�onTotal fetal hemoglobinABECBE
-0.5 0.0 0.5 1.0
-0.5
0.0
0.5
1.0
-2 -1 0 1 2 3
-2-1
0
1
2
3
PC1 (67.79%)
PC2
(21.
17%
)
gRNA 2
gRNA 3
gRNA 4
gRNA 10gRNA 11
gRNA 15
gRNA 32
gRNA 34
gRNA 2
gRNA 10
gRNA 11
gRNA 16
gRNA 21gRNA 32
gRNA 34
gRNA 42
c)
d)
e)
f)
i)
Figure 3. Validation of targeted base editing for top eight guide RNAs (gRNAs) from the primary screen of adenine base editor (ABE) and cytosine base editor (CBE) at HBG promoters. HUDEP- 2 cells expressing ABE or CBE transduced with the top eight gRNAs were analyzed by deep sequencing at the targeted regions in the HBG promoter. The total editing efficiencies of ABE (a) or CBE (b) are represented as the percentage of total sequencing reads with target C:A converted to T:G at specified sites. Evaluation of fetal hemoglobin (HbF) positive cells in HUDEP- 2 cells expressing ABE (c) or CBE (d) transduced with the respective gRNAs, before and after differentiation by flow cytometry; globin chains analysis in ABE (e) or CBE (f) edited HUDEP- 2 cells after erythroid differentiation by RP- HPLC; HbF analysis in ABE (g) or CBE (h) edited HUDEP- 2 cells after erythroid differentiation by HPLC. (i) Principal component analysis plot for the correlation between the outcomes of base editing using top eight gRNAs. The relationship between the base edit frequency, HbF+ cells, HbF, and gamma/beta- like chains in ABE or CBE edited HUDEP- 2 stable cell for the indicated gRNAs were analyzed.
Figure 3 continued on next page

Research article Chromosomes and Gene Expression | Genetics and Genomics
Ravi et al. eLife 2022;11:e65421. DOI: https://doi.org/10.7554/eLife.65421 9 of 32
cells in differentiated erythroid cells was slightly higher than that of the undifferentiated edited cells (Figure 3c–d). Further, we determined the effect of base editing on erythroid differentiation using flow cytometry analysis with CD235a and CD71 markers. The shift in expression of CD71 positive cells alone to CD71/CD235a double positive cells reflects the erythroid differentiation pattern of HUDEP- 2 cells (Kurita et al., 2013). The percentage of double positive cells was 83–90% for CBE and above 95% for ABE edited cells compared to the control, which was 77% and 97%, respectively, suggesting that the differentiation ability of the edited cells was not affected (Figure 3—figure supplement 3d and Figure 3—figure supplement 3j).
Furthermore, the level of globin chains was analyzed by using reverse- phase HPLC in differentiated erythroid cells from both ABE (Figure 3—figure supplement 3c) and CBE edited samples (Figure 3—figure supplement 3i). We observed a significant induction of gamma- globin chain expression, which represented 10% to30% of total beta- like globin content in all the ABE edited samples (gRNAs -2, -3, -4, -10, -11, -15, -32, and -34) (Figure 3g). In the case of CBE, the gamma- globin chain levels were around 6% to45% of total beta- like globin content, among which gRNAs -2, -42, -10, and -11 showed significant elevation when compared to the control (Figure 3h). In both ABE and CBE edited cells, the increase in gamma- globin chains was consistently associated with a reciprocal reduction in beta- globin chains thereby maintaining the alpha to beta- like globin chain ratio (Figure 3—figure supplement 3c and Figure 3—figure supplement 3i). Even though the HBG1 and HBG2 promoters were base edited with equal efficiency, HBG1 showed moderately higher expression levels compared to HBG2 in most of the ABE and CBE edited cells. The decrease in HBG2 expression in these samples might be due to biased HbF regulation or the 4.9 kb deletion that deletes the HBG2 gene.
To find whether decrease in HBG2 expression is due to the 4.9 kb deletion, gRNAs which showed significant reduction in HBG2 over HBG1 expression in ABE (gRNA- 4, -10, -11, -15, -32, -34) and CBE (gRNA- 2, -10, -11, -32, -34, -42) edited cells were further investigated by qRT- PCR. Interestingly, the frequency of 4.9 kb deletion in ABE ranged from 2% to 32% while in CBE it ranged from 0% to 12% (Figure 3—figure supplement 3e and Figure 3—figure supplement 3k). To determine the correla-tion between the reduction in HBG2 chain expression and the frequency of large deletion, Pearson correlation analysis was performed in the above- mentioned gRNAs in ABE and CBE edited cells. We observed a high correlation (r = 0.71) in the case of ABE, whereas much lower correlation was observed with CBE (r = 0.26) (Figure 3—figure supplement 3f and Figure 3—figure supplement 3i). These data suggest that the reduction in G gamma chain expression is due to higher frequency of deletions in the ABE edited samples, while in the case of CBE, the decrease in the G gamma chain expression is independent of larger deletions and might be due to the biased expression of gamma- globin.
We observed a substantial difference in deletion rates across gRNAs as well as between base editors (Figure 3—figure supplement 3e and Figure 3—figure supplement 3k). The difference in the DNA sequence composition which often affects the editing efficiency might also be responsible for varied deletion observed across the gRNAs targeting the HBG promoter. On the other hand, processivity of the editors could account for the difference in deletion observed with the same gRNA while editing with CBE and ABE. As the base editors cannot dock on an already edited strand, CBE with a higher rate of editing (~50% editing on day 1) is prevented from interacting again with the DNA, thus reducing the chances of deletion compared to ABE which takes longer to achieve similar editing (~50% editing on day 8) (Figure 1—figure supplement 1b and c). This observation is further supported by the minimal deletion seen in samples edited with ABE8e which has a higher processivity
The first two principal components are plotted, and the variance accounted for by each principal component is shown. Data are expressed as mean ± SEM from three biological replicates (p > 0.05). Asterisks indicate levels of statistical significance **p < 0.01, ***p < 0.001.
The online version of this article includes the following figure supplement(s) for figure 3:
Figure supplement 1. Assessment of base editing efficiency at the highly homologous HBG1 and HBG2 promoter.
Figure supplement 2. Summary of alleles frequency for top eight guide RNAs (gRNAs) at target site by adenine base editor (ABE) and cytosine base editor (CBE).
Figure supplement 3. Adenine and cytosine base editing of HBG promoter on globin chain mRNA and protein expression.
Figure supplement 4. Evaluation of the low efficiency guide RNAs (gRNAs) that induced fetal hemoglobin (HbF) with hyperactive variant adenine base editor (ABE)8e .
Figure 3 continued
Research article Chromosomes and Gene Expression | Genetics and Genomics
Ravi et al. eLife 2022;11:e65421. DOI: https://doi.org/10.7554/eLife.65421 10 of 32
(~90% editing within 24 hr) compared to both CBE and ABE 7.10 (Figure 3—figure supplement 4c, Richter et al., 2020).
Next, we analyzed the level of hemoglobin tetramers in the differentiated cells by HPLC to deter-mine whether increase in HBG chain expression resulted in functional HbF production. We observed a significant induction of HbF in all the top eight target gRNA transduced cells in ABE (gRNAs- 2, -3, -4, -10, -11, -15, -32, and -34), whereas only gRNA- 2, -10, -11, and -42 expressed higher levels of HbF in CBE edited cells (Figure 3e–f). Consistent with globin chain analysis, we observed that the increase in HbF variant is associated with compensatory downregulation of adult hemoglobin levels in the edited cells. The relationship between the editing efficiency and HbF expression was analyzed for all the top- scoring gRNAs in ABE and CBE edited cells (Figure 3i). Among the validated top eight gRNAs in ABE and CBE, gRNA- 2, -10, -11 with ABE and gRNA- 2 with CBE resulted in a high target editing efficiency with a corresponding increase in HbF expression. In case of gRNA- 42 with CBE, only a modest level of HbF elevation was achieved even with higher editing efficiency. On the other hand, gRNAs -3 and -4 with ABE and gRNAs -10 and -11 with CBE showed higher elevation of HbF levels despite lower base conversion efficiency. The higher number of HbF positive cells with minimal base editing might be due to heterogenous editing at target site per cell since there are two copies each of HBG1 and HBG2. Further, irrespective of editing at the target region, the binding of CRISPR- Cas9 complex through the gRNAs at the HBG promoter might disrupt the binding of major transcriptional repressor that are involved in globin expression (Shariati et al., 2019).
Among the samples which resulted in higher HbF induction with lower editing efficiency, we vali-dated gRNA- 03 and -11 with a hyperactive variant of ABE (ABE8e) to determine whether further elevation in HbF level can be attained by increasing the editing efficiency. The HUDEP- 2 cells stably expressing ABE8e were transduced with gRNA- 03 and -11, with a VCN of 0.28% for the editor and 0.56% for the gRNA (Figure 3—figure supplement 4e). We observed a high percentage of base substitution at the target site (more than 95%) with the corresponding increase in the HbF positive cells and gamma- globin chains in both the gRNAs (Figure 3—figure supplement 4a- c). The eryth-roid differentiation capacity of the edited cells was equivalent to that of control (Figure 3—figure supplement 4b). The frequency of larger deletions was also significantly reduced perhaps because of the higher processive rate of ABE8e (Figure 3—figure supplement 4d). Thus, the ABE8e variant has improved the base editing efficiency at the target region and provided higher level of HbF induction with a reduced frequency of larger deletion.
Through this screen, we identified multiple novel individual regulatory regions and validated well- known HPFH mutations in the HBG proximal promoter that are important for gamma- globin regula-tion. Interestingly, gRNA- 2 (with ABE or CBE) and gRNA- 4 (with ABE) disrupt the binding site for the major gamma- globin repressors, BCL11A and LRF/ZBTB7A, and generate the binding motif for the transcriptional activators, GATA1 and KLF1, thus resulting in overall activation of HBG expression. Base editing of –114C > T, –115C > T and –116A > G mutations disrupts the binding of BCL11A and the base conversion at –198T > C and –199T > C affect the binding of LRF/ZBTB7A to the HBG promoter. Further, the installation of –113A > G and –198T > C mutations by gRNA- 2 and gRNA- 4, generate a binding site for GATA1 and KLF- 1, respectively. Moreover, the base conversion at −175T > C by gRNA- 3 (with ABE) creates a TAL1 binding site. The novel gamma- globin regulatory region identified includes the target base substitution mediated by gRNA- 10, -11, -15, -21, -32, and -34 with ABE or CBE. With gRNAs -10 and -11, ABE converts nucleotide at –123T > C and –124T > C position, whereas CBE converts nucleotide at –122G > A (on- target editing site) and –117G > A (outside the editing window) positions. Target base substitutions at –123T > C and –124T > C positions result in greater induction of HBG expression, equivalent to that of the known HPFH mutations that disrupt the binding of BCL11A. Overall, the potential gRNAs include gRNA- 2, 3-, -4, -10, and -11 with ABE and gRNA- 2 with CBE that exhibit high induction of HbF expression.
Base editing of the –123 region of HBG promoter in human CD34+ HSPCsTo further determine the therapeutic potential of novel targets identified from this study on induc-tion of gamma- globin expression, we performed base editing of CD34+ HSPCs from healthy donor (Figure 4a). Electroporation of the ABE8e mRNA with gRNA targeting the BCL11A binding site (gRNA- 2) and –123 novel cluster (gRNA- 11) effectively generated highly efficient base editing at the

Research article Chromosomes and Gene Expression | Genetics and Genomics
Ravi et al. eLife 2022;11:e65421. DOI: https://doi.org/10.7554/eLife.65421 11 of 32
a) b) c)
d)
SSC
HbF (APC)
Control 28.51±1.68% gRNA 2 88.20±01.18%gRNA 11 95.17±0.65%
T123
T124
A11
0
A11
2
A11
3
A11
6
0
20
40
60
80
100
A to
G o
r T to
C e
ditin
g (%
)
Control AAVS1 gRNA 11 gRNA 02 gRNA2
gRNA11
0.0
0.2
0.4
0.6
0.8
1.0
1.2
Fold
cha
nge
in G
gam
ma
due
to 4
.9kb
del
etio
n(C
ompa
red
to c
ontro
l)
α- globin mRNA β- globin mRNA γ- globin mRNA0
2
4
6
8
Rel
ativ
e Ex
pres
sion
gRNA 11
gRNA 02
AAVS1
nsns
✱✱
✱✱
✱✱✱
✱✱
Time (min)
0 1 2 3 4 0 1 2 3 40 1 2 3 4
HbF – 5.83 ±
HbF – ± 0.50%HbF – ± 0.44%
% egatnecreP
HbAo
HbA2
0.31%
Control
HbAo
HbA2
34.53
HbAo
HbA2
48.50
gRNA 11 gRNA 2
e)
g)f)
h) i)
-
Figure 4. Therapeutic induction of fetal hemoglobin (HbF) in erythroblast derived from healthy donor CD34+ hematopoietic stem and progenitor cells (HSPCs) upon base editing of HBG promoter. (a) Schematic representation of steps involved in based editing of CD34+ HSPCs. Mobilized CD34+ HSPCs from healthy donor were nucleofected using MaxCyte system with adenine base editor (ABE)8e mRNA and respective guide RNAs (gRNAs) on day 2 of expansion. During expansion, CD34+ HSPCs were analyzed at day 6 for the editing efficiency and 4.9 kb deletion. (b) Efficiency of individual base conversion at the target sites were measured by EditR after Sanger sequencing. (c) Analysis of HBG2 deletion (due to 4.9 kb large deletion) by qRT- PCR. The based edited CD34+ HSPCs were cultured in a three- phase liquid culture system for erythroid differentiation and enucleation. (d) Relative expression of globin transcripts analyzed by qRT- PCR (ΔΔCT) in erythroblasts derived from base edited CD34+ HSPCs on day 9 of differentiation. The functional validation of HbF elevation was analyzed in erythroblasts derived from the indicated samples by FACS, HPLC, and RP- HPLC on day 12 of erythroid differentiation. (e) HbF positive cells analyzed by flow cytometry are represented as zebra plots. (f) RP- HPLC chromatogram profiles of individual globin chains and (g) HPLC chromatogram profile of hemoglobin variants. On the final day of erythroid differentiation, the expression of maturation markers and enucleation fraction were measured by FACS analysis. (h) Flow cytometry for the erythroid maturation markers CD235a+ and CD71+. (i) Enucleation pattern was determined by flow cytometry analysis for CD235a with NucRed in erythroid cells derived from CD34+ HSPCs. Asterisks indicate levels of statistical significance **p < 0.01, ***p < 0.001.

Research article Chromosomes and Gene Expression | Genetics and Genomics
Ravi et al. eLife 2022;11:e65421. DOI: https://doi.org/10.7554/eLife.65421 12 of 32
target site. The editing efficiency observed at individual base positions were –110 (31%), –112 (37%), –113 (80%), and –116 (66%) with gRNA- 2 and –123 (89%), –124 (91%) with gRNA- 11 (Figure 4b). In case of gRNA- 11, the base editing events generated a high proportion of –123 and –124 muta-tions in combination at the target site. We cultured the base edited CD34+ HSPCs under erythroid differentiation conditions and analyzed HbF expression. The relative levels of HBG expression were significantly higher in gRNA- 11 (>6- fold) and gRNA- 2 (>5- fold) edited samples when compared to control (AAVS1 edited sample) by qRT- PCR (Figure 4d). In contrast, a significant downregulation of HBB and unchanged levels of HBA expression were observed in both the tested targets. Simi-larly, we observed a substantial increase in HbF protein expression in erythroblast derived from base edited CD34+ HSPCs. Flow cytometry and HPLC variant analysis confirmed the robust increase in the proportion of HbF positive cells and their HbF content compared with control samples for all the tested targets, with the higher effect in gRNA- 11 (Figure 4e and g). The globin chain analysis showed an increase in expression of HBG1 and HBG2 globin chain levels and a reduction of HBB globin chain level (Figure 4f). Importantly, base editing of the HBG proximal promoter with gRNA- 2 or -11 did not alter enucleation potential or the expression of erythroid maturation markers CD235a or CD71 (Figure 4h–i). Finally, we determined the frequency of the 4.9 kb deletion in CD34+ HSPCs electroporated with ABE8e and gRNA- 2 or -11. We observed a very minimal frequency of the 4.9 kb deletion which might be due to higher processivity and transient expression of the base editor mRNA (Figure 4c). The present results suggest that the level of HbF induction mediated by the installation of novel –123 cluster HPFH- like mutations (through gRNA- 11) is comparable to the naturally occurring –115 cluster HPFH mutations (through gRNA- 2) that disrupt the binding site of BCL11A. Together, our data demonstrate that adenine base editing of the HBG1 and HBG2 promoters to recreate the novel –123 cluster HPFH- like mutations is a potential approach for the therapeutic induction of fetal globin level and treatment for beta- hemoglobinopathies.
The –123 T>C and –124 T>C HPFH-like mutations creates a de novo binding site for KLF1Finally, we investigated the possibility that novel HPFH- like mutations introduced by the base editor might either create or disrupt the binding site for transcriptional regulators. Interestingly, we observed that the base editing at –123T > C and –124T > C sites by ABE with a single gRNA creates the consensus binding site for the master erythroid transcription factor KLF1 (Figure 5a and b; Tallack et al., 2010). We performed EMSA to verify binding of KLF1 to a probe containing this core element. We observed modest but clear binding of KLF1 to the –123T > C and –124T > C mutated probe in EMSA but not with the wild type probe (Figure 5—figure supplement 1a- b) or probes containing either –123T > C or –124T > C mutations alone (Figure 5c–d). This confirms that the combination of –123T > C and –124T > C mutation is important for the KLF1 binding to the HBG promoter. Next, we performed ChIP experiments to determine whether the KLF- 1 directly interacts with –123T > C and –124T > C mutated region of HBG promoter in vivo. The KLF1 ChIP was performed in three indepen-dent HUDEP- 2 clones sorted from wild type cells or the double mutant edited cells, respectively. The ChIP results were normalized to an unrelated positive control, a KLF1 binding site at the SP1 locus. We observed a weak increase in the signal of KLF1 binding to the HBG promoters in the cells edited to contain the –123 and –124 mutations, but the effect was modest, and a similarly weak enhancement was also observed at an arbitrary negative control locus, VEGF (Figure 5—figure supplement 1c). Thus, as seen in the EMSA, the KLF1 binding is at best weak and may be below the level of detection by ChIP. Future investigations would be required to confirm that KLF1 binding to this site is the main in vivo mechanism of –123T > C and –124T > C HPFH driven upregulation of gamma- globin.
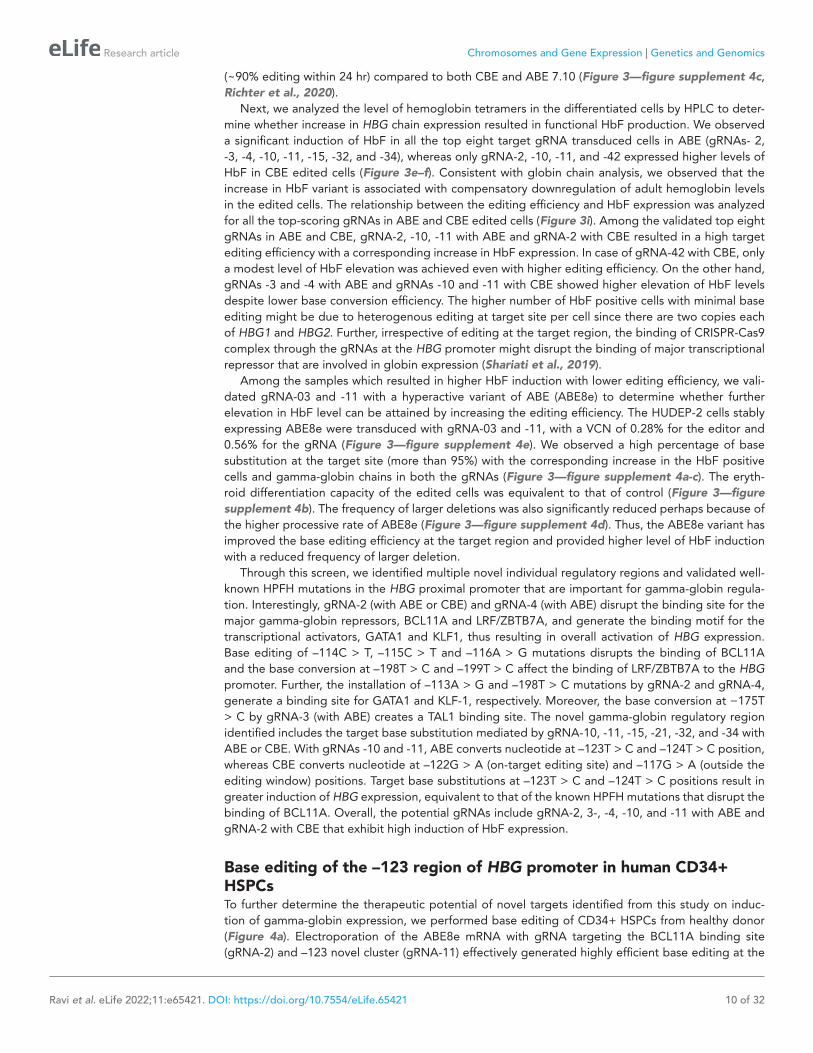
Off-target and gene expression analysis after base editing at the HBG promoterABE and CBE are known to create Cas- dependent DNA off- target and transient Cas- independent RNA off- target at low levels (Anzalone et al., 2020). It has been reported that the Cas- independent DNA off- target is very low and undetectable (Anzalone et al., 2020). We used Cas- OFFinder tool to predict the Cas- dependent DNA off- target for the novel gRNA (gRNA- 11). The identified target regions were deep sequenced by NGS. Despite the higher on- target efficiency, off- target editing was not observed at the top target sites (Figure 6a). Next, we performed transcriptome- wide RNA

Research article Chromosomes and Gene Expression | Genetics and Genomics
Ravi et al. eLife 2022;11:e65421. DOI: https://doi.org/10.7554/eLife.65421 13 of 32
a)
b)
c)
d)
GCCAGCCTTGCCTTGACCAATAGCCAGCCCCGCCTTGACCAATA
WT γ-globin-123/124T>C
-124
-123
-118 to -113
BCL11A binding siteTallack, M. R. et al. 2010KLF1 CHIP-seq
Martyn, G. E. et al.2019BCL11A CHIP-seq
WT
-124 T
>C
-123 T
>C
-124T
>C/-1
23 T>C
0.0
0.5
1.0
1.5
Rela
tive
inte
nsity
Figure 5. KLF1 binds to the −123T > C and -124T > C region of the HBG proximal promoter in vitro. (a) Introduction of T- to- C mutation at –123 and –124 of the HBG promoter (–132 to –110 bp) creates the de novo binding site for the KLF1, the wild type and novel KLF binding motif is highlighted in blue and red, respectively. (b) In vivo binding motifs of transcription factors KLF1 and BCL11A as determined by ChIP- Seq as previously reported. (c) Electrophoretic mobility shift assay (EMSA) showing KLF1 binding to –123T > C/–124T > C probe but failing to bind to –124T > C probe, –123T > C probe and WT probe with the –123T/–124T region of the HBG promoter in vitro. Lanes 1, 4,7, and 10 contain nuclear extracts from COS cells transfected with a pcDNA3 empty vector. Lanes 2–3, 5–6, 8–9, and 11–12 contain nuclear extracts from COS cells overexpressing KLF1. Binding of KLF1 to the –123T > C/–124T > C HPFH mutant probe can be observed in lane 11, with a super shift of KLF1 in the presence of anti- KLF1 antibody in lane 12. (d) Quantification of relative intensity of bands (KLF1 binding to the probe) from the EMSA using Image Lab 6.0.1 (Bio- Rad) software.
The online version of this article includes the following source data and figure supplement(s) for figure 5:
Source data 1. Electrophoretic mobility shift assay (EMSA) showing KLF1 binding to –123T > C/–124T > C probe but failing to bind to –124T > C probe, –123T > C probe, and wild type (WT) probe with the –123T/–124T region of the HBG promoter in vitro.
Figure supplement 1. Recruitment of KLF1 to site at –123 bp of HBG proximal promoter were analyzed by electrophoretic mobility shift assay (EMSA) and ChIP- qPCR.
Figure supplement 1—source data 1. Electrophoretic mobility shift assay (EMSA) showing the binding of KLF1 to the –123T > C/–124T > C probe but fails to bind to a wild type (WT) probe containing the −123/–124 region of the HBG promoter in vitro.
Research article Chromosomes and Gene Expression | Genetics and Genomics
Ravi et al. eLife 2022;11:e65421. DOI: https://doi.org/10.7554/eLife.65421 14 of 32
sequencing on ABE and CBE stables with or without gRNA- 2 and -11 to check whether base editing induced major spurious RNA deamination. The distribution frequency of A- to- I (in ABE) or C- to- U (in CBE) conversion across the base edited samples was very similar to that of the parental stable cell line (Figure 6b–e). To further verify that editing the gamma- globin promoter is not affecting the expres-sion of other genes involved in globin regulation, we performed the differential analysis on these samples for the specific genes involved in globin regulation. We observed that there is no significant difference between the edited and control cells except for both gamma- and delta- globin genes (Figure 6—figure supplement 1).
Overall, these results support that the ABE and CBE are useful in creating specific point muta-tions in the homologous HBG1 and HBG2 promoters, leading to a potential increase in the number of HbF positive cells and overall HbF production with a significant reduction in the larger deletion frequency.
a)
b) c) d)
T123
T124
T123
T124 T1
4T1
2T1
4T1
2T1
2T1
2A
12A
12 A1
A12 A
1A
12 A1
A1
A12
A14
A12
A14
A12
A12 T1
2 T1 T12 T1 T12 T1 T12 T1 T12
T12
A1
A9
A12
A13 A
1A
9A
12A
13
0.00.20.4
10
20
30
40
A to
G o
r T to
C e
ditin
g %
ON-Target OT-1 OT-2 OT-3 OT-4 OT-5 OT-6 OT-7 OT-8 OT-9 OT-10 OT-11
Base editing inunedited sample
ABE Control
ABE g2
ABE g110.0
0.1
0.2
0.3
0.4
0.5
Tran
scrip
tom
e-w
ide
freq
uenc
y of
A-to
-I ed
iting
(%)
CBE Control
CBE g2
CBE g110.00
0.05
0.10
0.15
0.20
0.25
Tran
scrip
tom
e-w
ide
freq
uenc
y of
C-to
-U e
ditin
g(%
)
ABE Control
ABE g2
ABE g110.0
0.2
0.4
0.6
Tran
scrip
tom
e-w
ide
freq
uenc
y of
A-to
-N e
ditin
g(%
)
CBE Control
CBE g2
CBE g110.0
0.1
0.2
0.3
0.4
Tran
scrip
tom
e-w
ide
freq
uenc
y of
C-to
-N e
ditin
g(%
)
e)
Figure 6. Evaluation of Cas- dependent DNA off- target and Cas- independent RNA off- target editing by adenine base editor. (a) Base conversions at the top 11 Cas- dependent DNA off- target sites in adenine base editor (ABE) 7.10 stable edited with guide RNA (gRNA)- 11, along with the on- target events. The positions of the off- target and on- target loci are represented in their respective chromosome. The frequency of transcriptome- wide cellular levels of A- to- I (b), A- to- N (c), C- to -U (d), and C- to- N (e) RNA editing in BE3 stables (CBE), ABE 7.10 stables (ABE), BE3 stables edited with gRNAs- 2 or -11, and ABE edited with gRNAs- 2 or -11 are represented. The data are mean ± SD of two technical replicates.
The online version of this article includes the following figure supplement(s) for figure 6:
Figure supplement 1. Expression profile of HBG regulators after base editing.

Research article Chromosomes and Gene Expression | Genetics and Genomics
Ravi et al. eLife 2022;11:e65421. DOI: https://doi.org/10.7554/eLife.65421 15 of 32
DiscussionDuring normal globin switching, interactions of cis- acting elements with several different transcrip-tion factors lead to the silencing of fetal globin and in turn the activation of beta- globin (Ikuta et al., 1996). To obtain insights into the regulation of gamma- globin gene expression, we have used two complementary base editing approaches to screen the HBG promoter at single nucleotide resolution. This approach allowed us to identify several novel nucleotide substitutions in the HBG promoter that elevate HbF levels by altering the binding site for transcriptional activators or repressors.
Current approaches to studying fetal globin regulation by programmable nucleases often result in the deletion of the HBG2 gene due to the introduction of DSBs in both HBG promoters (Traxler et al., 2016). The elimination of the 4.9 kb intergenic region (including the HBG2 gene) appears to allow the locus control region (LCR) to directly interact with the HBG1 promoter and drive its expression (Métais et al., 2019). It can be challenging to determine the exact role of different HPFH mutations on individual gamma- globin expression because mutations can occur in either or both HBG2 and HBG1 promoters. Further, the CRISPR- Cas9- based editing produces different combination of indel at the target sites which makes it difficult to pinpoint the precise mutations involved in the gene regu-lation. A base editing strategy converts target bases in the editing window without the generation of DSBs and hence largely avoids splicing of the HBG locus. Using this strategy, we targeted regions in both HBG1 and HBG2 promoters and were able to efficiently edit sites in the promoters with fewer or no large deletions, which gave us the opportunity to evaluate gamma- globin expression from two active promoters.
We did observe a small percentage of 4.9 kb deletions even with base editors that use a nickase variant of the CRISPR/Cas9 system in our study. The larger deletions may be mainly a result of simul-taneous CRISPR- Cas9- induced DSBs or by paired nickase- mediated two single- strand breaks (SSBs) on opposite DNA strands of the HBG1 and HBG2 gene (Ran et al., 2013a). Interestingly, recent studies have shown the possibility of adjacent SSB on the same DNA strand leading to the forma-tion of genomic deletions in plants. The deletion frequency depends upon the initial release of the single- stranded fragment between the two SSBs (Schiml et al., 2016). Further reports suggest the conversion of the persistent nick into DSBs by the replication fork. The R- loop primed replication fork encounters the single- strand nick site in DNA template and collapses to produce a DSB (Kuzminov, 2001; Wimberly et al., 2013). Based on these findings, we predict the concurrent introduction of SSB by base editors at the editing site of the HBG1 and HBG2 promoter might generate some 4.9 kb larger deletions, though we observed very few.
Several different HPFH point mutations have been reported in the HBG promoters; and the effect of these mutations on gamma- globin expression in the native cellular environment has been deci-phered for this limited set of mutations (Bauer and Orkin, 2012; Liu et al., 2018; Martyn et al., 2019; Wienert et al., 2017; Wienert et al., 2015). Our findings are in agreement with previous reports that the point mutations in three different regions of the HBG promoters centered around positions −198, –175, and −115 mimic the HPFH- associated point mutations affecting essential regulators of HbF expression (Liu et al., 2018; Martyn et al., 2019; Martyn et al., 2018; Stoming et al., 1989; Wienert et al., 2017; Wienert et al., 2015). Among the known HPFH point mutations, base conversion within the –115 cluster (from –110 to –116) showed the highest increase in promoter activity, confirming previous studies (Fucharoen et al., 1990; Gilman et al., 1988; Zertal- Zidani et al., 1999; Motum et al., 1994). CBE- mediated base conversion (C- to- T) at positions –114 and –115 resulted in a significantly greater induction of HbF than the multiple A- to- G nucleotide substitutions at −110, –112, −113, and –116 positions made by ABE. Recently, it has been shown that the major HbF repressor BCL11A directly binds to the core TGACC motif located at – 114 to –118 (Liu et al., 2018; Martyn et al., 2018). Naturally occurring HPFH mutations at –117G > A, –114C > A, –114C > T, –114C > G, and ∆13bp disrupts binding of BCL11A to the promoter (Martyn et al., 2018). The –113A > G HPFH mutation within the –115 cluster creates a binding site for the master erythroid regulator GATA1 without disrupting the binding of BCL11A (Martyn et al., 2019). Our results are consistent with these previous reports showing that disruption of the core binding region of BCL11A and the creation of a de novo binding sites for GATA1 results in the elevation of fetal globin in wild type HUDEP- 2 cells (Wienert et al., 2017). ABE- mediated T- to- C substitution at position –198 of the HBG gene promoter has previously been shown to be associated with British HPFH and substantially elevates expression of HbF by creating a de novo binding site for the erythroid gene activator KLF1 (Tate et al., 1986;

Research article Chromosomes and Gene Expression | Genetics and Genomics
Ravi et al. eLife 2022;11:e65421. DOI: https://doi.org/10.7554/eLife.65421 16 of 32
Wienert et al., 2017). Another known HPFH mutation (–175T > C) has been shown to promote enhancer looping to the HBG promoter through recruitment of the activator TAL1 (Wienert et al., 2015). Further, increased editing efficiency at the –175T > C position with the hyperactive variants of ABE (ABE8e) resulted in the highest induction of HbF synthesis in human erythroid cells.
In this study, we have identified several new point mutations in the HBG promoter associated with high HbF levels. HBG promoter base editing by ABE- mediated conversion (A- to- G) revealed multiple potential HbF regulatory regions compared to CBE since the targeted region had more ABE- compatible gRNAs than CBE. In addition to the known mutations, we have identified novel substitutions at –69 (C -to- T), –70 (C- to- T), –122 (G -to -A), –123 (T -to- C), and –124 (T -to -C) of the HBG promoters as potential new regulatory mutations that can elevate gamma- globin expression. The levels of gamma- globin expression resulting from these mutations were very similar to those of well- characterized, naturally occurring HPFH mutations. Our study has predicted that nucleotide substitutions at –123T > C and –124T > C positions of the HBG promoter might result in reactiva-tion of gamma- globin expression through the creation of a binding site for KLF- 1, which was then confirmed by EMSA. This result, together with the observation that a de novo KLF1 site formed by the –198T- to- C mutation can upregulate fetal globin (Tate et al., 1986; Wienert et al., 2017) raises the possibility that introduction of a KLF1 binding site anywhere around the HBG promoter could potentially upregulate HBG gene expression. In contrast to our finding in EMSA, we observed only a very weak signal for the binding of KLF1 at the edited site of the HBG promoter by ChIP. Thus, our hypothesis, primarily on the basis of observing in vitro binding of KLF1 in EMSAs, is that the –123 and –124 mutations create a new KLF1 binding site, that is relatively weak and difficult to detect using ChIP but other hypotheses are possible. For instance, it could create a binding site for another activator. The relative proximity of this site to the BCL11A site, that begins around –117, suggests it may also directly or indirectly affect BCL11A binding. Further work needs to be done to assess these possibilities.
The current screening approaches that we used to identify the regulatory element in the proximal promoter of HBG is limited by several technical issues. The availability of NGG PAM sequences in the target region confines the resolution of the screening approach. The editing efficiency for ABE7.10 RA or BE3RA- FNLS is not uniform across the target regions (Koblan et al., 2018). The effect of trans-verse mutation in the target region on gene regulation is not possible as the current base editors are mainly involved in the installation of transition mutations (Gaudelli et al., 2017; Komor et al., 2016). The bystander mutation introduced by the base editors at the target regions makes it difficult to identify functional regulatory single nucleotides responsible for the gamma- globin regulation. These limitations can be overcome by the use of several different strategies including the use of alternative base editor variants that recognize the non- canonical PAM site (Richter et al., 2020). In addition, recently developed hyperactive variant of base editors will improve the increasing editing efficiency at the target site with the broader editing window (Richter et al., 2020). The scope of this study can be further increased by the dual ABE and CBE that can mediate both conversions (A- to- G and C- to- T) simultaneously, and also by prime editing approach which can widen the range of precise conversions in the desired region (Anzalone et al., 2019; Zhang et al., 2020).
The translational potential of genome edited HSPCs depends on long- term engraftment and repopulation ability. However, genotoxicity and cytotoxicity that can arise as a result of DSBs gener-ated by programmable nucleases can be a limiting factor (Cullot et al., 2019; Yu et al., 2016). A previous study in nonhuman primates observed that the HBG promoter editing by Cas9 resulted in HBG2 deletion with up to 27% frequency and that cells with this deletion were under- represented after engraftment (Humbert et al., 2019). Base editing at the target sites of HBG1 and HBG2 promoter by ABE and CBE does not result in high frequency of large deletions in the intergenic region as seen with Cas9 and only showed low levels of indel formation. ABEs have an inherent advantage over CBEs as they generate desired edits (A:T to G:C) with high fidelity, whereas the latter generate unanticipated edits. In corroboration with existing findings, our results also suggest that ABE is a better base editor than CBE with respect to purity of base conversion and indel formation (Lee et al., 2018). Moreover, preliminary results from our study suggest that the base editing of the HSPCs by ABE8e variant with the novel site (by gRNA- 11) elevated HbF to therapeutic levels in erythroid progeny. Further, our study did not observe any significant DNA and RNA off- target in the ABE and CBE edited cells. Our proof of principle study validated the various gRNAs that can elevate the HbF levels to therapeutic

Research article Chromosomes and Gene Expression | Genetics and Genomics
Ravi et al. eLife 2022;11:e65421. DOI: https://doi.org/10.7554/eLife.65421 17 of 32
levels laying the groundwork for potential clinical applications. This approach could address a range of beta- globin disorders avoiding the need to develop specific therapeutic products for each of them.
In summary, we have demonstrated that CRISPR base editing can be utilized to drive the expres-sion of HbF to therapeutically relevant levels in an erythroid progenitor cell line and in HSPCs. After screening every gRNAs within the 320 bp region of the HBG promoter, we identified nine gRNAs that, when paired with the appropriate base editor, can introduce HPFH- like mutations without the genera-tion of indels. We identified five novel regulatory regions for HBG1 and HBG2 that are required for the silencing of gamma- globin in adult erythroid cells shedding light on the molecular mechanisms behind hemoglobin switching (Figure 7). Our work is an exemplification of base editors in mapping gene regulatory elements in highly homologous locus and we hope base editing strategy will be among the pre- eminent therapeutic strategies for monogenetic disorders like beta- hemoglobinopathies in the future.
Materials and methodsDesigning and cloning of the gRNAThe gRNAs for targeting the HBG1 and HBG2 promoter region were designed using SnapGene and Benchling. The gRNAs for CBE were designed using design- type ‘gRNAs for base editing’ in the Benchling tool; from the 43 hits, we selected 32 non- overlapping gRNAs. The gRNAs for ABE were designed manually using SnapGene software. The forward oligonucleotide consists of the gRNA sequence without PAM (20 bp) and ‘CACCG’ overhang at the 5' end, while the reverse oligonu-cleotide consists of reverse complement of gRNA without PAM (20 bp), ‘AAAC’ overhang at the 5' end and a ‘C’ added at 3' end. The synthetic complementary oligonucleotides listed in Supplemen-tary file 1 were annealed (Ran et al., 2013b; Shalem et al., 2014) and cloned into BsmBI digested pLKO5.sgRNA.EFS.GFP/RFP vector (gift from Benjamin Ebert, Addgene #57822/#57823) (Heckl et al., 2014). The oligo- annealed products were diluted 1:200- fold, from which 6 μl was taken along with 50 ng of vector backbone and ligation reaction was set up as per the manufacturer’s instruction from NEB. The ligated product was transformed into DH10B competent cells and plated in LB agar containing 100 μg/ml of ampicillin for selection (Sambrook and Russell, 2006). Three colonies were picked from the plate and inoculated in LB for colony PCR. Colony PCR was carried out using GoTaq Hot Start Polymerase premix (Promega) and 1 μl each of forward and reverse sequencing primers (10 picomoles) (Supplementary file 2) along with 1 μl of processed cells in a thermocycler (Applied Biosystems Veriti). The cyclic conditions were as follows: initial denaturation at 95°C for 10 min, 35
Figure 7. Schematic representation of known and identified point mutations in HBG promoter region that elevates fetal hemoglobin (HbF): The proximal promoter region of HBG2 and HBG1 is represented from transcription start site (TSS) till –205 bases. Novel clusters identified from this study are highlighted in Sage (five clusters), and known clusters are highlighted in Melon (two clusters). Among these clusters, known base conversions are represented in black and identified hereditary persistence of fetal hemoglobin (HPFH)- like mutations are represented in red text. The novel base conversions from our study are represented in bold font. Transcriptional activators (lavender) and repressors (orange) that bind to the known clusters are also depicted in the figure.

Research article Chromosomes and Gene Expression | Genetics and Genomics
Ravi et al. eLife 2022;11:e65421. DOI: https://doi.org/10.7554/eLife.65421 18 of 32
cycles of 95°C for 30 s, 55°C for 30 s, 72°C for 45 s, followed by a final extension at 72°C for 7 min. After confirming the expected amplification in 1% agarose gel, second round of PCR was carried out using the 20 ng of pre- cleaned product from the first round of PCR using BigDye Terminator v3.1 Cycle Sequencing Kit as per manufacturer’s protocol and given for Sanger sequencing.
Plasmid constructsThe plasmids used in this study, pLenti- FNLS- P2A- Puro (Addgene#110841- CBE) and pLenti- ABERA- P2A- Puro (Addgene#112675- ABE), were a gift from Lukas Dow (Zafra et al., 2018), and pMD2.G and psPAX2 (second- generation lentiviral packaging construct, Addgene #12259, 11260) were a gift from Didier Trono. The pLenti- ABE8e- puro vector was constructed by amplifying ABE8e from the TadA- 8e V106W plasmid (a plasmid gifted from David Liu, Addgene#138495) (Richter et al., 2020) using the primers mentioned in Supplementary file 2. The amplified PCR product was then cloned into pLenti- ABERA- P2A- Puro backbone after digestion with BamH1 and Nhe1 by HIFI assembly (NEB). The gRNA sequence from lentiCRISPR V2 vector (a construct gifted from Feng Zhang, Addgene#52961) was removed by digestion with EcoR1 and Kpn1 enzyme (NEB). The digested plasmid was then re- ligated with NEB Ligase after a exonuclease treatment (NEB Exonuclease 1) to generate a lentiCRISPR V2.1 vector (Sanjana et al., 2014). The plasmids were isolated using NucleoBond Xtra Midi EF (Macherey- Nagel) according to the manufacturer’s instruction.
Cell cultureHUDEP- 2 cell lines were cultured in StemSpan SFEM II (STEMCELL Technologies) supplemented with 50 ng/ml SCF (ImmunoTools), 3 U/ml EPO (Zyrop 4000 IU injection), 1× Pen- Strep (Gibco), 1 μM dexa-methasone (Alfa Aesar), 1 μg/ml doxycycline (Sigma- Aldrich), and 1× L- glutamine 200 mM (Gibco) (Kurita et al., 2013). The cells were culture at 37°C with 5% CO2 and were confirmed negative for mycoplasma (Universal Mycoplasma detection kit- ATCC). K562 cell line was cultured in RPMI (Roswell Park Memorial Institute media) (Hyclone) supplemented with 1× penicillin- streptomycin- glutamine (Gibco) and 10% fetal bovine serum (FBS) (Gibco). COS- 7 cells and HEK 293T cells were cultured in Dulbecco’s modified Eagle medium (DMEM, Gibco) supplemented with 10% (v/v) FBS and 1× Pen- Strep.
The left- over peripheral blood mononuclear cells (PBMNCs) were obtained from a healthy donor after infusion according to the clinical protocols approved by the Intuitional Review Boards of Chris-tian Medical College, Vellore. The PBMNCs were purified by density gradient centrifugation (Lymph-oprep Density Gradient Medium|STEMCELL Technologies) followed by RBC lysis. CD34+ cells were isolated from the purified PBMNCs by EasySep Human CD34 positive selection kit II (STEMCELL Technologies) and expanded in HSC expansion media as described earlier (Genovese et al., 2014). The isolated cells were analyzed for primitive cell surface markers (CD34+ CD133+ and CD90+) after 24 hr of expansion (Genovese et al., 2014).
Lentivirus productionHEK293T cells (1 × 10⁶) were cultured in 10 cm cell culture dish (Corning). Around 80% confluency, 2.5 μg of pMD2.G (envelope plasmid), and 3.5 μg of psPAX2 (packaging plasmid) along with 4 μg (construct with gRNA) or 5 μg (construct with ABE/CBE/Cas9) of lentiviral vector were transfected using FuGENE- HD as per the manufacturer’s protocol. The viral supernatants were separately collected at 48 and 72 hr; and concentrated using Lenti- X Concentrator (Takara). The concentrated pellet was resuspended in 200 µl of 1×PBS, and the aliquots were stored at –80°C.
Lentiviral transductionThe desired lentivirus (100 µl aliquot) along with 6 μg/ml polybrene (Sigma- Aldrich), and 1% HEPES 1 M buffer (Gibco) were added to HUDEP- 2 or K562 cells (0.5 million cells in one well of a six- well plate) and spinfected at 800 g for 30 min at room temperature. The cells were incubated for 48 hr with lentivirus at 37°C and then incubated in fresh medium. For the stable cell line generation, the cells transduced with pLenti- FNLS- P2A- puro or pLenti- ABERA- P2A- puro or pLenti- ABE8e- puro or lentiCRISPR V2.1viral vector were then treated with 1 μg/ml puromycin (Gibco) for 10 days. In case of gRNA transduction with pLKO5.sgRNA.EFS.GFP/RFP vector, the transduced cells were analyzed by FACS for GFP/RFP expression.
Research article Chromosomes and Gene Expression | Genetics and Genomics
Ravi et al. eLife 2022;11:e65421. DOI: https://doi.org/10.7554/eLife.65421 19 of 32
In vitro transcriptionThe template for in vitro transcription (IVT) was prepared by linearizing ABE8e plasmid (Addgene#138495) with Pme1 (NEB) and purified using PCI (phenol- chloroform- isoamyl alcohol). IVT was carried out using T7 mScript Standard mRNA Production System (CELLSCRIPT) components by previously described method with full substitution of pseudouridine- 5'-triphosphate (Jena Bioscience) for uridine (Mahalingam et al., 2022). The purified mRNA was stored as aliquots (5 µg/vial) in –80°C.
Electroporation of CD34+ cellsCD34+ cells were expanded in HSC expansion media for 48 hr. Around 1 million of CD34+ cells were pelleted then resuspended in 19 µl MaxCyte buffer (Hyclone) along with 5 µg ABE8e mRNA (5 µl) and 100 pmole desired gRNA (1 µl) (Synthego) (target information in Supplementary files 1 and 2). The resuspended cells were loaded into one well of OC25 × 3 Maxcyte cuvette and electroporated with program ‘HSC- 3’. After electroporation, the content was transferred to single well of 12- well plate (Corning) and allowed to recover for 20 min in the incubator (5% CO2, 37°C). To the recovered cells, 1 ml of HSC expansion media was added and then expanded for 48 hr before performing any further experiments.
Erythroid differentiationFor the erythroid differentiation of HUDEP- 2 cells, we followed previously established protocol with slight modification (Trakarnsanga et al., 2017). After 8 days of expansion, around 1 million of edited cells were seeded in 65 mm cell culture dish (Eppendorf) with 5 ml of differentiation media consisting of IMDM glutamax (Gibco), 3% AB serum (MP Biomedicals), 2% FBS, 0.1% insulin solution human (Sigma- Aldrich), 3 U/ml Heparin sodium salt (MP Biomedicals), 200 μg/ml Holo Transferrin (BBI Solu-tions), 3 U/ml EPO, 10 μg/ml SCF, 1 ng/ml IL3 (Immuno Tools), 1× Pen- Strep, and 1 μg/ml doxycycline. Erythroid differentiation was carried out in 10 cm dish with regular media change (on days 3 and 6) up to the end of differentiation (for 9 days). On day 6, these cells were cultured in erythroid differentiation medium with 500 μg/ml of holotransferrin and devoid of doxycycline.
For erythroid differentiation of CD34+ cells, HSPCs were cultured in a three- phase liquid culture system and subjected to enucleation analysis as previously described (Psatha et al., 2018). The eryth-roid differentiation pattern was evaluated in the erythroblast obtained from HUDEP- 2 cells (on day 9) and CD34+ cells (on day 21) by FACS analysis of CD235a and CD71 markers.
Analysis of base editing efficiencyGenomic DNA was isolated from the edited samples using DNA isolation kit (NucleoSpin Blood – Macherey- Nagel). For Sanger sequencing, the targets were PCR amplified using GoTaq Hot Start Polymerase premix (Promega), the primers used are listed in Supplementary files 1 and 2. For NGS, the targets were PCR amplified (the primers listed in Supplementary files 1 and 2) using GXL premix (Takara Bio) and sequenced using MiSeq System (Illumina). The library preparation and sequencing was carried out as per previously described protocol (Corn, 2017). The Fastq files obtained were analyzed for base editing using CRISPResso- 2 (Clement et al., 2019). The data obtained from Sanger sequencing were used to analyze indels and the base editing efficiency by tools like Inference of CRISPR Edits (ICE) (Synthego) and EditR, respectively (Hsiau et al., 2018; Kluesner et al., 2018).
For characterization of editing in individual HBG1 and HBG2 promoter, NGS 4F and NGS 2R primers (Supplementary files 1 and 2) were used to amplify HBG promoter. After NGS , the Fastq file obtained were aligned to HBG1 and HBG2 sequence using Bowtie2 based on nucleotide variation at −307, –317, and –324. The aligned reads were visualized using IGV (Robinson, 2012; Langmead and Salzberg, 2013) and the editing efficiency was computed individually for both the genes ((edited reads/total reads) ×100).
Real-time PCRTotal RNA from the edited cells were isolated using the NucleoSpin RNA kit (Macherey- Nagel) and reverse transcribed using cDNA Synthesis Kit (iScript Bio- Rad). The relative expression (∆∆CT) of HBB, HBA, and HBG genes was determined using the respective primers (Supplementary file 2) by qRT- PCR using SsoFast EvaGreen Supermixes (Bio- Rad) in QuantStudio 6 Flex Real- Time PCR System (Applied Biosystems). The qRT- PCR mixture (10 μl) contains 1 μl each of respective forward and reverse primer

Research article Chromosomes and Gene Expression | Genetics and Genomics
Ravi et al. eLife 2022;11:e65421. DOI: https://doi.org/10.7554/eLife.65421 20 of 32
(5 µM), 5 μl of SYBR green master mix, 2 μl of H2O, and 1 μl of 5- fold diluted cDNA template. GAPDH was used as an internal control gene to normalize the data for ∆∆CT (relative expression analysis). The cycling condition was performed as per the manufacturer’s protocol (Bio- Rad). A dissociation curve analysis was carried out to ensure there is no unspecific amplification.
The VCN was assessed in genomic DNA isolated from the transduced samples using qRT- PCR as previously described with a few modification (Barczak et al., 2015). Primers targeting U6 promoter (for gRNA integration), Cas9 gene (for Cas9 and base editors’ integration), and WPRE (for gRNA and Cas9 variant integration together) were used. Exon 2 of HBB gene was used as a single copy gene- specific reference. The primers used are listed in Supplementary file 2. pLKO5.sgRNA. EFS.GFP (Plasmid #57822, Addgene) and an inhouse plasmid carrying HBB CDS (details not provided) were used as standards.
HbF intracellular stainingTo evaluate the frequency of HbF positive cells, the cells were fixed, permeabilized, and intracellular staining was performed using Fetal Hemoglobin Monoclonal Antibody (HBF- 1), APC (Invitrogen) as previously described (Canver et al., 2015). The stained cells were analyzed by FACS (BD FACSAria III Cell Sorter or CytoFLEX LX Flow Cytometer – BC) to measure the number of HbF positive cells.
Hemoglobin detection by HPLCThe differentiated cells were collected and washed with 1× PBS and resuspended in 1100 μl cold ddH2O. The cells were sonicated for 30 s with 50% Amp in ice and centrifuged at 14,000 rpm for 15 min at 4°C. The supernatant (1000 μl) was analyzed for hemoglobin variants by VARIANT II Hemoglobin Testing System (Bio- Rad). The hemoglobin percentages were calculated by the Bio- Rad’s Clinical Data Management (CDMTM) Software. Reverse phase HPLC (Shimadzu Corporation- Phenomenex) (Loucari et al., 2018) was performed in remaining 100 μl of the supernatant for the analysis of indi-vidual globin chains expression . The ratio of gamma (A and G gamma)/beta- like (gamma, beta, and delta) globin was calculated and represented in percentage.
Validation of 4.9 kb large deletionTo quantify the large deletion in HBG promoter region, qPCR was carried as previously reported (Li et al., 2018) (using primers from Supplementary file 2). To verify the effect of larger deletion on gamma- globin expression, the globin chain analysis was carried out using RP HPLC in the differen-tiated erythroid cells. The A gamma- and G gamma- globin chain percentage obtained from each sample were normalized with control.
COS-7 cell transfections and nuclear extractionCOS- 7 cells were transfected with 5 µg of mammalian expression plasmids pcDNA3- empty (Invit-rogen) or pSG5/mEKLF- Mouse (Miller and Bieker, 1993) using FuGENE 6 (Promega) in 10 cm culture dish, according to the manufacturer’s instructions. Transfected cells were incubated at 37°C for 48 hr before harvest. Nuclear extractions were performed as previously described (Andrews and Faller, 1991).
Electrophoretic mobility shift assayOligonucleotides used in radiolabelled probes are listed in Supplementary file 2. The sense strand for each probe was labelled with P- 32 from γ-32P ATP (Perkin Elmer) using T4 PNK (NEB), before annealing the antisense strand by slow cooling from 100°C to room temperature. The annealed probes were purified using quick spin columns for radiolabelled DNA purification (Roche). Plasmids were overex-pressed and harvested from COS- 7 cells, and ‘empty’ extract without the target protein was used to aid identification of background bands caused by endogenous protein binding. Antibody for KLF1 was used as indicated to identify the protein on the gel (Crossley et al., 1996). Complexed samples were loaded on 6% native polyacrylamide gel in TBE buffer (45 mM Tris, 45 mM boric acid, 1 mM EDTA). Electrophoresis was performed at 4°C and 250 V for 1 hr and 40 min, and then vacuum dried before exposing a FUJIFILM BAS Cassette2 phosphor screen overnight. Imaging was performed on a GE Typhoon FLA 9500 fluorescent image analyzer.

Research article Chromosomes and Gene Expression | Genetics and Genomics
Ravi et al. eLife 2022;11:e65421. DOI: https://doi.org/10.7554/eLife.65421 21 of 32
ChIP qPCREach immunoprecipitation was performed using 5 × 10⁷ cells of wild type and edited HUDEP- 2 cells before differentiation. Cells were cross- linked in 1% formaldehyde solution and incubated at room temperature for 10 min before the reaction was quenched by addition of glycine to a final concentra-tion of 125 mM. Cross- linked cells were lysed and sonicated for 10 cycles of 30 s with 30 s intermis-sions at 4°C to obtain chromatin fragments of approximately 200–300 bp. Immunoprecipitations were performed using 100 µl of Dynabeads Protein G (ThermoFisher Scientific) complexed to 15 µg of KLF1 antibody (OriGene, #TA305808) or normal rabbit IgG (Cell Signaling Technology #2729S) at 4°C over-night. Magnetic beads were separated and washed thoroughly before elution and cross- linking was reversed by incubation at 65°C overnight. DNA was then purified and quantified within reference to whole cell extract on a ViiA 7 Real- Time PCR System using SYBR green reagents and the ∆∆Ct method for specific targets (Supplementary file 2).
RNA sequencing and analysisTotal RNA extracted using NucleoSpin RNA kit (Macherey- Nagel) was quality assessed by Agilent 2100 Bioanalyzer (Agilent Technologies). From 1 μg of total RNA polyadenylated transcripts was puri-fied using oligo- dT beads (TruSeq RNA Sample Preparation Kit, Illumina). Fragmentation was carried out in the presence of divalent cation followed by reverse transcription using Superscript II Reverse Transcriptase kit (Life Technologies). Following cDNA purification by Ampure XP SPRI beads (Beckman Coulter) Illumina adapter ligation and amplification were carried out. The quantification and the quality were assessed by NanoDrop spectrophotometer (Thermo Scientific) and Bioanalyzer (Agilent Technologies), respectively. Libraries were sequenced by using Illumina NovoSeq 6000 platform as 150 bp paired- end reads. Fastq files were generated with bcl2fastq and then trimmed to remove low- quality bases, adapter seq, and unpaired sequence using TrimGalore. Homo sapiens genome assembly GRCh38 was used as a reference to align the trimmed reads. NFCore RNA Seq pipeline was used to resolve the expressed transcripts quantitatively and qualitatively (Ewels et al., 2020). The files are accessible through the GEO Series accession number GSE192801.
Transcriptome analysis was carried out in wild type HUDEP- 2, ABE, and CBE stable cells with or without gRNA- 2 and -11 in duplicate. The transcript was counted from the sorted bam files by the aligner mentioned above. Interactive Gene Expression Analysis Kit (iGEAK) RNA- seq v1.0 a R and JavaScript- based tool was used to normalize gene expression levels and perform differential expres-sion analysis (Choi and Ratner, 2019).
Off-target analysisCas- OFFinder was used to find the Cas- dependent DNA off- target, up to three mismatches were allowed in selecting targets (target information in Supplementary file 3). The targets were amplified and sequenced using Illumina MiSeq platform (using primers mentioned in Supplementary file 2). CRISPResso2 was used to align the reads, only high- quality reads were used for this analysis (q = 30). REDItools v2 was used to calculate the transcriptome- wide A- to- I and C- to- U conversion in ABE and CBE edited samples. Except the respective nucleotide (A for ABE and C for CBE), all nucleotides were removed from the analysis. Read coverage and read quality criteria were followed as described earlier (Koblan et al., 2021). The frequency of A converted to I/N and C converted to U/N was calculated by dividing the total number of converted nucleotides by the respective nucleotides after filtering (A- to- (I or N)/A*100 or C- to- (U or N)/C*100). The experiment was carried out as two biological replicates.
Statistical analysisThe statistical tests were performed using GraphPad Prism 8.1. Since all the data were normally distrib-uted, unpaired two- sided t- test or one- way ANOVA was used as appropriate. In all the tests, p < 0.05 was considered statistically significant. Linear regression was carried out to find out if any correlation exists between two variables. Also, to find the relationship between the samples, Pearson correlation was performed. Principal component analysis (PCA) was performed using R statistical package.
Acknowledgements

Research article Chromosomes and Gene Expression | Genetics and Genomics
Ravi et al. eLife 2022;11:e65421. DOI: https://doi.org/10.7554/eLife.65421 22 of 32
The research reported in this work was supported by NAHD grant: BT/PR17316/MED/31/326/2015 (Department of Biotechnology, New Delhi, India), EMR grant: EMR/2017/004363 (Science and Engi-neering Research Board [SERB], New Delhi, India), Indo- US GETin Fellowship_2018_066 (Indo- US Science & Technology Forum [IUSSTF]), and DBT grant: BT/PR38392/GET/119/301/2020. We sincerely acknowledge CSCR (a unit of inStem, CMC Campus, Vellore, India) for providing the startup funds. NSR and AG is supported by Senior Research Fellowship from Council of Scientific & Industrial Research India. VR is supported by Senior Research Fellowship DBT India. BW is supported by an Early Career Research Fellowship, and HWB and MC were supported by a grant from the National Health and Medical Research Council Australia. HWB is additionally supported by an Australian Government Research Training Program Scholarship. SM is supported by gene editing task force (DBT); Grant No# BT/PR25841/GET/119/162/2017. We thank Mrs Sumithra and Mr Neelagandan at the Department of Hematology, CMC, for help with HPLC variants; Keerthivasan. RC, IISER Mohali, and Ashis Kumar S, CSCR, for bioinformatics. Also, we like to acknowledge the CSCR core facility for supporting us with all the required instrumentations.
Additional information
Funding
Funder Grant reference number Author
Ministry of Science and Technology
BT/PR17316/MED/31/326/2015
Kumarasamypet M Mohankumar
Science and Engineering Research Board
EMR/2017/004363 Kumarasamypet Murugesan Mohankumar
Indo-US Science and Technology Forum
Indo-U.S. GETin Fellowship_2018_066
Kumarasamypet Murugesan Mohankumar
Ministry of Science and Technology
BT/PR38392/GET/119/301/2020
Kumarasamypet M Mohankumar
Council of Scientific and Industrial Research, India
Senior Research Fellow Nithin Sam RaviAnila George
Ministry of Science and Technology
Senior Research Fellow Vignesh Rajendiran
National Health and Medical Research Council
Early Career Research Fellowship
Beeke Wienert
Ministry of Science and Technology
BT/PR25841/GET/119/162/2017
Srujan Marepally
National Health and Medical Research Council
National Health and Medical Research Council (NHMRC)
Henry William Bell
National Health and Medical Research Council
Grant Merlin Crossley
National Health and Medical Research Council
Henry William Bell
The funders had no role in study design, data collection and interpretation, or the decision to submit the work for publication.
Author contributionsNithin Sam Ravi, Data curation, Formal analysis, Investigation, Methodology, Resources, Software, Validation, Visualization, Writing – original draft, Writing – review and editing; Beeke Wienert, Resources, Visualization, Writing – review and editing; Stacia K Wyman, Methodology, Resources, Software; Henry William Bell, Jonathan T Vu, Aswin Anand Pai, Poonkuzhali Balasubramanian, Meth-odology, Resources; Anila George, Formal analysis, Writing – review and editing, Methodology; Gokulnath Mahalingam, Kirti Prasad, Bhanu Prasad Bandlamudi, Nivedhitha Devaraju, Vignesh

Research article Chromosomes and Gene Expression | Genetics and Genomics
Ravi et al. eLife 2022;11:e65421. DOI: https://doi.org/10.7554/eLife.65421 23 of 32
Rajendiran, Nazar Syedbasha, Methodology; Yukio Nakamura, Ryo Kurita, Resources; Muthuraman Narayanasamy, Writing – review and editing; Saravanabhavan Thangavel, Srujan Marepally, Resources, Writing – review and editing; Shaji R Velayudhan, Mark A DeWitt, Methodology, Resources, Writing – review and editing; Alok Srivastava, Project administration, Resources, Writing – review and editing; Merlin Crossley, Investigation, Methodology, Resources, Visualization, Writing – review and editing; Jacob E Corn, Methodology, Resources, Visualization, Writing – review and editing; Kumarasamypet M Mohankumar, Conceptualization, Data curation, Formal analysis, Funding acquisition, Investigation, Methodology, Project administration, Resources, Supervision, Validation, Visualization, Writing – orig-inal draft, Writing – review and editing
Author ORCIDsNithin Sam Ravi http://orcid.org/0000-0002-8063-6935Henry William Bell http://orcid.org/0000-0003-4677-8208Anila George http://orcid.org/0000-0002-6016-976XJonathan T Vu http://orcid.org/0000-0002-4950-7967Jacob E Corn http://orcid.org/0000-0002-7798-5309Kumarasamypet M Mohankumar http://orcid.org/0000-0001-9407-1800
EthicsThe left- over peripheral blood mononuclear cells (PBMNC) were obtained from a healthy donor after infusion according to the clinical protocols approved by the Instituitional Review Boards of Christian Medical College, Vellore. IRB Min. No. 12309 (OTHER) dated 30. 10.2019.
Decision letter and Author responseDecision letter https://doi.org/10.7554/eLife.65421.sa1Author response https://doi.org/10.7554/eLife.65421.sa2
Additional filesSupplementary files• Supplementary file 1. The guide RNAs (gRNAs) used in this study to screen the HBG promoter region and their respective primer for sequencing.
• Supplementary file 2. All the PCR, qRT- PCR primers and probes used in this study.
• Supplementary file 3. The targets analyzed for DNA off- target.
• Transparent reporting form
Data availabilityThe transcriptome data have been deposited in GEO under accession code GSE192801 All the raw data from this study have been deposited in Dyrad (https://doi.org/10.5061/dryad.bzkh1897h).
The following datasets were generated:
Author(s) Year Dataset title Dataset URL Database and Identifier
Ravi N, Wyman SK, Mohankumar KM
2022 Identification of novel HPFH- like mutations by CRISPR base editing that elevate the expression of fetal hemoglobin
http://www. ncbi. nlm. nih. gov/ geo/ query/ acc. cgi? acc= GSE192801
NCBI Gene Expression Omnibus, GSE192801
Mohankumar KM 2022 Data from: Identification of novel HPFH- like mutations by CRISPR base editing that elevate the expression of fetal hemoglobin
http:// dx. doi. org/ 10. 5061/ dryad. bzkh1897h
Dryad Digital Repository, 10.5061/dryad.bzkh1897h
ReferencesAndrews NC, Faller DV. 1991. A rapid micropreparation technique for extraction of DNA- binding proteins from
limiting numbers of mammalian cells. Nucleic Acids Research 19:2499. DOI: https://doi.org/10.1093/nar/19.9. 2499, PMID: 2041787

Research article Chromosomes and Gene Expression | Genetics and Genomics
Ravi et al. eLife 2022;11:e65421. DOI: https://doi.org/10.7554/eLife.65421 24 of 32
Anzalone AV, Randolph PB, Davis JR, Sousa AA, Koblan LW, Levy JM, Chen PJ, Wilson C, Newby GA, Raguram A, Liu DR. 2019. Search- and- replace genome editing without double- strand breaks or donor DNA. Nature 576:149–157. DOI: https://doi.org/10.1038/s41586-019-1711-4, PMID: 31634902
Anzalone AV, Koblan LW, Liu DR. 2020. Genome editing with CRISPR- Cas nucleases, base editors, transposases and prime editors. Nature Biotechnology 38:824–844. DOI: https://doi.org/10.1038/s41587-020-0561-9, PMID: 32572269
Arbab M, Shen MW, Mok B, Wilson C, Matuszek Ż, Cassa CA, Liu DR. 2020. Determinants of Base Editing Outcomes from Target Library Analysis and Machine Learning. Cell 182:463-480.. DOI: https://doi.org/10. 1016/j.cell.2020.05.037, PMID: 32533916
Barczak W, Suchorska W, Rubiś B, Kulcenty K. 2015. Universal real- time PCR- based assay for lentiviral titration. Molecular Biotechnology 57:195–200. DOI: https://doi.org/10.1007/s12033-014-9815-4, PMID: 25370825
Bauer DE, Orkin SH. 2012. Update on fetal hemoglobin gene regulation in hemoglobinopathies. Current Opinion in Pediatrics 23:617–632. DOI: https://doi.org/10.1097/MOP.0b013e3283420fd0.Update
Canver MC, Smith EC, Sher F, Pinello L, Sanjana NE, Shalem O, Chen DD, Schupp PG, Vinjamur DS, Garcia SP, Luc S, Kurita R, Nakamura Y, Fujiwara Y, Maeda T, Yuan GC, Zhang F, Orkin SH, Bauer DE. 2015. BCL11A enhancer dissection by Cas9- mediated in situ saturating mutagenesis. Nature 527:192–197. DOI: https://doi. org/10.1038/nature15521, PMID: 26375006
Cavazzana M, Antoniani C, Miccio A. 2017. Gene Therapy for β-Hemoglobinopathies. Molecular Therapy 25:1142–1154. DOI: https://doi.org/10.1016/j.ymthe.2017.03.024, PMID: 28377044
Choi K, Ratner N. 2019. iGEAK: an interactive gene expression analysis kit for seamless workflow using the R/shiny platform. BMC Genomics 20:1–7. DOI: https://doi.org/10.1186/s12864-019-5548-x, PMID: 30841853
Clement K, Rees H, Canver MC, Gehrke JM, Farouni R, Hsu JY, Cole MA, Liu DR, Joung JK, Bauer DE, Pinello L. 2019. CRISPResso2 provides accurate and rapid genome editing sequence analysis. Nature Biotechnology 37:224–226. DOI: https://doi.org/10.1038/s41587-019-0032-3, PMID: 30809026
Corn JE. 2017. Preparation of PCR amplicons from edited cells for deep sequencing. Protocols. https://www. protocols.io/view/preparation-of-pcr-amplicons-from-edited-cells-for-6ruhd6w
Crossley M, Whitelaw E, Perkins A, Williams G, Fujiwara Y, Orkin SH. 1996. Isolation and characterization of the cDNA encoding BKLF/TEF- 2, a major CACCC- box- binding protein in erythroid cells and selected other cells. Molecular and Cellular Biology 16:1695–1705. DOI: https://doi.org/10.1128/MCB.16.4.1695, PMID: 8657145
Cullot G, Boutin J, Toutain J, Prat F, Pennamen P, Rooryck C, Teichmann M, Rousseau E, Lamrissi- Garcia I, Guyonnet- Duperat V, Bibeyran A, Lalanne M, Prouzet- Mauléon V, Turcq B, Ged C, Blouin JM, Richard E, Dabernat S, Moreau- Gaudry F, Bedel A. 2019. CRISPR- Cas9 genome editing induces megabase- scale chromosomal truncations. Nature Communications 10:1136. DOI: https://doi.org/10.1038/s41467-019-09006- 2, PMID: 30850590
Ewels PA, Peltzer A, Fillinger S, Patel H, Alneberg J, Wilm A, Garcia MU, Di Tommaso P, Nahnsen S. 2020. The nf- core framework for community- curated bioinformatics pipelines. Nature Biotechnology 38:276–278. DOI: https://doi.org/10.1038/s41587-020-0439-x
Fischer KD, Nowock J. 1990. The T----C substitution at -198 of the A gamma- globin gene associated with the British form of HPFH generates overlapping recognition sites for two DNA- binding proteins. Nucleic Acids Research 18:5685–5693. DOI: https://doi.org/10.1093/nar/18.19.5685, PMID: 1699206
Fucharoen S, Shimizu K, Fukumaki Y. 1990. A novel C- T transition within the distal CCAAT motif of the G gamma- globin gene in the Japanese HPFH: implication of factor binding in elevated fetal globin expression. Nucleic Acids Research 18:5245–5253. DOI: https://doi.org/10.1093/nar/18.17.5245, PMID: 1698280
Gaudelli NM, Komor AC, Rees HA, Packer MS, Badran AH, Bryson DI, Liu DR. 2017. Programmable base editing of A•T to G•C in genomic DNA without DNA cleavage. Nature 551:464–471. DOI: https://doi.org/10.1038/ nature24644, PMID: 29160308
Genovese P, Schiroli G, Escobar G, Tomaso TD, Firrito C, Calabria A, Moi D, Mazzieri R, Bonini C, Holmes MC, Gregory PD, van der Burg M, Gentner B, Montini E, Lombardo A, Naldini L. 2014. Targeted genome editing in human repopulating haematopoietic stem cells. Nature 510:235–240. DOI: https://doi.org/10.1038/ nature13420, PMID: 24870228
Gilman JG, Mishima N, Wen XJ, Stoming TA, Lobel J, Huisman TH. 1988. Distal CCAAT box deletion in the A gamma globin gene of two black adolescents with elevated fetal A gamma globin. Nucleic Acids Research 16:10635–10642. DOI: https://doi.org/10.1093/nar/16.22.10635, PMID: 2462713
Giudice CL. 2022. REDItools2. GitHub. https://github.com/BioinfoUNIBA/REDItools2Gluzman Y. 1981. SV40- transformed simian cells support the replication of early SV40 mutants. Cell 23:175–182.
DOI: https://doi.org/10.1016/0092-8674(81)90282-8, PMID: 6260373Heckl D, Kowalczyk MS, Yudovich D, Belizaire R, Puram RV, McConkey ME, Thielke A, Aster JC, Regev A,
Ebert BL. 2014. Generation of mouse models of myeloid malignancy with combinatorial genetic lesions using CRISPR- Cas9 genome editing. Nature Biotechnology 32:941–946. DOI: https://doi.org/10.1038/nbt.2951, PMID: 24952903
Hsiau T, Conant D, Rossi N, Maures T, Waite K, Yang J, Joshi S, Kelso R, Holden K, Enzmann BL, Stoner R. 2018. Inference of CRISPR Edits from Sanger Trace Data. [bioRxiv]. DOI: https://doi.org/10.1101/251082
Humbert O, Radtke S, Samuelson C, Carrillo RR, Perez AM, Reddy SS, Lux C, Pattabhi S, Schefter LE, Negre O, Lee CM, Bao G, Adair JE, Peterson CW, Rawlings DJ, Scharenberg AM, Kiem H- P. 2019. Therapeutically relevant engraftment of a CRISPR- Cas9- edited HSC- enriched population with HbF reactivation in nonhuman primates. Science Translational Medicine 11:1–14. DOI: https://doi.org/10.1126/scitranslmed.aaw3768, PMID: 31366580

Research article Chromosomes and Gene Expression | Genetics and Genomics
Ravi et al. eLife 2022;11:e65421. DOI: https://doi.org/10.7554/eLife.65421 25 of 32
Ikuta T, Papayannopoulou T, Stamatoyannopoulos G, Kan YW. 1996. Globin Gene Switching. Journal of Biological Chemistry 271:14082–14091. DOI: https://doi.org/10.1074/jbc.271.24.14082, PMID: 8662960
Jacob GF, Raper AB. 1958. Hereditary persistence of foetal haemoglobin production, and its interaction with the sickle- cell trait. British Journal of Haematology 4:138–149. DOI: https://doi.org/10.1111/j.1365-2141.1958. tb03844.x, PMID: 13536251
Kluesner MG, Nedveck DA, Lahr WS, Garbe JR, Abrahante JE, Webber BR, Moriarity BS. 2018. EditR: A Method to Quantify Base Editing from Sanger Sequencing. The CRISPR Journal 1:239–250. DOI: https://doi.org/10. 1089/crispr.2018.0014, PMID: 31021262
Koblan LW, Doman JL, Wilson C, Levy JM, Tay T, Newby GA, Maianti JP, Raguram A, Liu DR. 2018. Improving cytidine and adenine base editors by expression optimization and ancestral reconstruction. Nature Biotechnology 36:843–846. DOI: https://doi.org/10.1038/nbt.4172, PMID: 29813047
Koblan LW, Erdos MR, Wilson C, Cabral WA, Levy JM, Xiong ZM, Tavarez UL, Davison LM, Gete YG, Mao X, Newby GA, Doherty SP, Narisu N, Sheng Q, Krilow C, Lin CY, Gordon LB, Cao K, Collins FS, Brown JD, et al. 2021. In vivo base editing rescues Hutchinson- Gilford progeria syndrome in mice. Nature 589:608–614. DOI: https://doi.org/10.1038/s41586-020-03086-7, PMID: 33408413
Komor AC, Kim YB, Packer MS, Zuris JA, Liu DR. 2016. Programmable editing of a target base in genomic DNA without double- stranded DNA cleavage. Nature 533:420–424. DOI: https://doi.org/10.1038/nature17946, PMID: 27096365
Kurita R, Suda N, Sudo K, Miharada K, Hiroyama T, Miyoshi H, Tani K, Nakamura Y. 2013. Establishment of Immortalized Human Erythroid Progenitor Cell Lines Able to Produce Enucleated Red Blood Cells. PLOS ONE 8:e0059890. DOI: https://doi.org/10.1371/journal.pone.0059890
Kuzminov A. 2001. Single- strand interruptions in replicating chromosomes cause double- strand breaks. PNAS 98:8241–8246. DOI: https://doi.org/10.1073/pnas.131009198, PMID: 11459959
Langmead B, Salzberg S. 2013. Fast gapped- read alignment with Bowtie 2 Ben. Nature Methods 9:357–359. DOI: https://doi.org/10.1038/nmeth.1923.Fast
Lee HK, Willi M, Miller SM, Kim S, Liu C, Liu DR, Hennighausen L. 2018. Targeting fidelity of adenine and cytosine base editors in mouse embryos. Nature Communications 9:7–12. DOI: https://doi.org/10.1038/ s41467-018-07322-7, PMID: 30442934
Li C, Psatha N, Sova P, Gil S, Wang H, Kim J, Kulkarni C, Valensisi C, Hawkins RD, Stamatoyannopoulos G, Lieber A. 2018. Reactivation of γ-globin in adult β-YAC mice after ex vivo and in vivo hematopoietic stem cell genome editing. Blood 131:2915–2928. DOI: https://doi.org/10.1182/blood-2018-03-838540, PMID: 29789357
Liu N, Zhu Q, Xu J, Bulyk ML, Orkin SH, Liu N, Zhu Q, Hong J, Kim W, Sher F. 2018. Direct Promoter Repression by BCL11A Controls the Fetal to Adult Hemoglobin Switch Article Direct Promoter Repression by BCL11A Controls the Fetal to Adult Hemoglobin Switch. Cell 173:1–13. DOI: https://doi.org/10.1016/j.cell.2018.03.016
Loucari CC, Patsali P, van Dijk TB, Stephanou C, Papasavva P, Zanti M, Kurita R, Nakamura Y, Christou S, Sitarou M, Philipsen S, Lederer CW, Kleanthous M. 2018. Rapid and Sensitive Assessment of Globin Chains for Gene and Cell Therapy of Hemoglobinopathies. Human Gene Therapy Methods 29:60–74. DOI: https://doi. org/10.1089/hgtb.2017.190, PMID: 29325430
Mahalingam G, Mohan A, Arjunan P, Dhyani AK. 2022. Using Lipid Nanoparticles for the Delivery of Chemically Modified mRNA into Mammalian Cells. JoVE 2:e62407. DOI: https://doi.org/10.3791/62407
Martyn GE, Wienert B, Yang L, Shah M, Norton LJ, Burdach J, Kurita R, Nakamura Y, Pearson RCM, Funnell APW, Quinlan KGR, Crossley M. 2018. Natural regulatory mutations elevate the fetal globin gene via disruption of BCL11A or ZBTB7A binding. Nature Genetics 50:498–503. DOI: https://doi.org/10.1038/s41588-018-0085-0, PMID: 29610478
Martyn GE, Wienert B, Kurita R, Nakamura Y, Quinlan KGR, Crossley M. 2019. A natural regulatory mutation in the proximal promoter elevates fetal globin expression by creating a de novo GATA1 site. Blood 133:852–856. DOI: https://doi.org/10.1182/blood-2018-07-863951, PMID: 30617196
Métais J- Y, Doerfler PA, Mayuranathan T, Bauer DE, Fowler SC, Hsieh MM, Katta V, Keriwala S, Lazzarotto CR, Luk K, Neel MD, Perry SS, Peters ST, Porter SN, Ryu BY, Sharma A, Shea D, Tisdale JF, Uchida N, Wolfe SA, et al. 2019. Genome editing of HBG1 and HBG2 to induce fetal hemoglobin. Blood Advances 3:3379–3392. DOI: https://doi.org/10.1182/bloodadvances.2019000820, PMID: 31698466
Miller IJ, Bieker JJ. 1993. A novel, erythroid cell- specific murine transcription factor that binds to the CACCC element and is related to the Krüppel family of nuclear proteins. Molecular and Cellular Biology 13:2776–2786. DOI: https://doi.org/10.1128/mcb.13.5.2776-2786.1993, PMID: 7682653
Motum PI, Deng ZM, Huong L, Trent RJ. 1994. The Australian type of nondeletional G gamma- HPFH has a C-->G substitution at nucleotide -114 of the G gamma gene. British Journal of Haematology 86:219–221. DOI: https://doi.org/10.1111/j.1365-2141.1994.tb03284.x, PMID: 7516698
Psatha N, Reik A, Phelps S, Zhou Y, Dalas D, Yannaki E, Levasseur DN, Urnov FD, Holmes MC, Papayannopoulou T. 2018. Disruption of the BCL11A Erythroid Enhancer Reactivates Fetal Hemoglobin in Erythroid Cells of Patients with β-Thalassemia Major. Molecular Therapy. Methods & Clinical Development 10:313–326. DOI: https://doi.org/10.1016/j.omtm.2018.08.003, PMID: 30182035
Ran FA, Hsu PD, Lin CY, Gootenberg JS, Konermann S, Trevino AE, Scott DA, Inoue A, Matoba S, Zhang Y, Zhang F. 2013a. Double nicking by RNA- guided CRISPR Cas9 for enhanced genome editing specificity. Cell 154:1380–1389. DOI: https://doi.org/10.1016/j.cell.2013.08.021, PMID: 23992846
Ran FA, Hsu PD, Wright J, Agarwala V, Scott DA, Zhang F. 2013b. Genome engineering using the CRISPR- Cas9 system. Nature Protocols 8:2281–2308. DOI: https://doi.org/10.1038/nprot.2013.143, PMID: 24157548
Research article Chromosomes and Gene Expression | Genetics and Genomics
Ravi et al. eLife 2022;11:e65421. DOI: https://doi.org/10.7554/eLife.65421 26 of 32
Richter MF, Zhao KT, Eton E, Lapinaite A, Newby GA, Thuronyi BW, Wilson C, Koblan LW, Zeng J, Bauer DE, Doudna JA, Liu DR. 2020. Phage- assisted evolution of an adenine base editor with improved Cas domain compatibility and activity. Nature Biotechnology 38:883–891. DOI: https://doi.org/10.1038/s41587-020-0453-z, PMID: 32433547
Robinson JT. 2012. Integrative Genomics Viewer. Nature Biotechnology 29:24–26. DOI: https://doi.org/10.1038/ nbt.1754.Integrative
Sambrook J, Russell DW. 2006. Preparation and Transformation of Competent E. coli Using Calcium Chloride. CSH Protocols 2006:pdb.prot3932. DOI: https://doi.org/10.1101/pdb.prot3932, PMID: 22485377
Sanjana NE, Shalem O, Zhang F. 2014. Improved vectors and genome- wide libraries for CRISPR screening HHS Public Access Supplementary Material. Nature Methods 11:783–784. DOI: https://doi.org/10.1038/nmeth. 3047.Improved
Schiml S, Fauser F, Puchta H. 2016. Repair of adjacent single- strand breaks is often accompanied by the formation of tandem sequence duplications in plant genomes. PNAS 113:7266–7271. DOI: https://doi.org/10. 1073/pnas.1603823113, PMID: 27307441
Shalem O, Sanjana NE, Hartenian E, Shi X, Scott DA, Mikkelson T, Heckl D, Ebert BL, Root DE, Doench JG, Zhang F. 2014. Genome- scale CRISPR- Cas9 knockout screening in human cells. Science (New York, N.Y.) 343:84–87. DOI: https://doi.org/10.1126/science.1247005, PMID: 24336571
Shariati SA, Dominguez A, Xie S, Wernig M, Qi LS, Skotheim JM. 2019. Reversible Disruption of Specific Transcription Factor- DNA Interactions Using CRISPR/Cas9. Molecular Cell 74:622-633.. DOI: https://doi.org/10. 1016/j.molcel.2019.04.011, PMID: 31051141
Stoming T, Stoming G, Lanclos K, Fei Y, Altay C, Kutlar F, Huisman T. 1989. An A gamma type of nondeletional hereditary persistence of fetal hemoglobin with a T----C mutation at position -175 to the cap site of the A gamma globin gene. Blood 73:329–333. DOI: https://doi.org/10.1182/blood.V73.1.329.329
Tallack MR, Whitington T, Yuen WS, Wainwright EN, Keys JR, Gardiner BB, Nourbakhsh E, Cloonan N, Grimmond SM, Bailey TL, Perkins AC. 2010. A global role for KLF1 in erythropoiesis revealed by ChIP- seq in primary erythroid cells. Genome Research 20:1052–1063. DOI: https://doi.org/10.1101/gr.106575.110, PMID: 20508144
Tate VE, Wood WG, Weatherall DJ. 1986. The British form of hereditary persistence of fetal hemoglobin results from a single base mutation adjacent to an S1 hypersensitive site 5’ to the A gamma globin gene. Blood 68:1389–1393. DOI: https://doi.org/10.1182/blood.V68.6.1389.bloodjournal6861389, PMID: 2430647
Thein SL. 2018. Molecular basis of β thalassemia and potential therapeutic targets. Blood Cells, Molecules & Diseases 70:54–65. DOI: https://doi.org/10.1016/j.bcmd.2017.06.001, PMID: 28651846
Trakarnsanga K, Griffiths RE, Wilson MC, Blair A, Satchwell TJ, Meinders M, Cogan N, Kupzig S, Kurita R, Nakamura Y, Toye AM, Anstee DJ, Frayne J. 2017. An immortalized adult human erythroid line facilitates sustainable and scalable generation of functional red cells. Nature Communications 8:14750. DOI: https://doi. org/10.1038/ncomms14750, PMID: 28290447
Traxler EA, Yao Y, Wang Y- D, Woodard KJ, Kurita R, Nakamura Y, Hughes JR, Hardison RC, Blobel GA, Li C, Weiss MJ. 2016. A genome- editing strategy to treat β-hemoglobinopathies that recapitulates a mutation associated with a benign genetic condition. Nature Medicine 22:987–990. DOI: https://doi.org/10.1038/nm. 4170, PMID: 27525524
Webber BR, Lonetree C- L, Kluesner MG, Johnson MJ, Pomeroy EJ, Diers MD, Lahr WS, Draper GM, Slipek NJ, Smeester BA, Lovendahl KN, McElroy AN, Gordon WR, Osborn MJ, Moriarity BS. 2019. Highly efficient multiplex human T cell engineering without double- strand breaks using Cas9 base editors. Nature Communications 10:5222. DOI: https://doi.org/10.1038/s41467-019-13007-6, PMID: 31745080
Wienert B, Funnell APW, Norton LJ, Pearson RCM, Wilkinson- White LE, Lester K, Vadolas J, Porteus MH, Matthews JM, Quinlan KGR, Crossley M. 2015. Editing the genome to introduce a beneficial naturally occurring mutation associated with increased fetal globin. Nature Communications 6:1–8. DOI: https://doi.org/10.1038/ ncomms8085, PMID: 25971621
Wienert B, Martyn GE, Kurita R, Nakamura Y, Quinlan KGR, Crossley M. 2017. KLF1 drives the expression of fetal hemoglobin in British HPFH. Blood 130:803–807. DOI: https://doi.org/10.1182/blood-2017-02-767400, PMID: 28659276
Wienert B, Martyn GE, Funnell APW, Quinlan KGR, Crossley M. 2018. Wake- up Sleepy Gene: Reactivating Fetal Globin for β-Hemoglobinopathies. Trends in Genetics 34:927–940. DOI: https://doi.org/10.1016/j.tig.2018.09. 004, PMID: 30287096
Wimberly H, Shee C, Thornton PC, Sivaramakrishnan P, Rosenberg SM, Hastings PJ. 2013. R- loops and nicks initiate DNA breakage and genome instability in non- growing Escherichia coli. Nature Communications 4:1–10. DOI: https://doi.org/10.1038/ncomms3115, PMID: 23828459
Yang Y, Xu Z, He C, Zhang B, Shi Y, Li F. 2019. Structural insights into the recognition of γ-globin gene promoter by BCL11A. Cell Research 29:960–963. DOI: https://doi.org/10.1038/s41422-019-0221-0, PMID: 31467406
Yu K- R, Corat MAF, Metais J- Y, Dunbar CE. 2016. 564. The Cytotoxic Effect of RNA- Guided Endonuclease Cas9 on Human Hematopoietic Stem and Progenitor Cells (HSPCs). Molecular Therapy 24:S225–S226. DOI: https:// doi.org/10.1016/S1525-0016(16)33372-X
Zafra MP, Schatoff EM, Katti A, Foronda M, Breinig M, Schweitzer AY, Simon A, Han T, Goswami S, Montgomery E, Thibado J, Kastenhuber ER, Sánchez- Rivera FJ, Shi J, Vakoc CR, Lowe SW, Tschaharganeh DF, Dow LE. 2018. Optimized base editors enable efficient editing in cells, organoids and mice. Nature Biotechnology 36:888–893. DOI: https://doi.org/10.1038/nbt.4194, PMID: 29969439

Research article Chromosomes and Gene Expression | Genetics and Genomics
Ravi et al. eLife 2022;11:e65421. DOI: https://doi.org/10.7554/eLife.65421 27 of 32
Zertal- Zidani S, Merghoub T, Ducrocq R, Gerard N, Satta D, Krishnamoorthy R. 1999. A novel C-->A transversion within the distal CCAAT motif of the Ggamma- globin gene in the Algerian Ggammabeta+-hereditary persistence of fetal hemoglobin. Hemoglobin 23:159–169. DOI: https://doi.org/10.3109/03630269908996160, PMID: 10335983
Zhang X, Zhu B, Chen L, Xie L, Yu W, Wang Y, Li L, Yin S, Yang L, Hu H, Han H, Li Y, Wang L, Chen G, Ma X, Geng H, Huang W, Pang X, Yang Z, Wu Y, et al. 2020. Dual base editor catalyzes both cytosine and adenine base conversions in human cells. Nature Biotechnology 38:856–860. DOI: https://doi.org/10.1038/s41587-020- 0527-y, PMID: 32483363

Research article Chromosomes and Gene Expression | Genetics and Genomics
Ravi et al. eLife 2022;11:e65421. DOI: https://doi.org/10.7554/eLife.65421 28 of 32
Appendix 1
Appendix 1—key resources table Reagent type (species) or resource Designation Source or reference Identifiers Additional information
Genetic reagent (Homo sapiens) GRCh38 GenBank 883148
Strain, strain background (Escherichia coli)
DH10B ECOS, Yeastern Biotech CAT # FYE507- 10VL
Recombinant DNA reagent
pLKO5.sgRNA. EFS.GFP Addgene
Addgene_57822; RRID:Addgene_57822
Recombinant DNA reagent
pLKO5.sgRNA. EFS.RFP Addgene
Addgene_57823; RRID:Addgene_57823
Recombinant DNA reagent
pLenti- FNLS- P2A- Puro Addgene
Addgene_110841; RRID:Addgene_110841
Recombinant DNA reagent pLenti- ABERA- P2A- Puro Addgene
Addgene_112675; RRID:Addgene_112675
Recombinant DNA reagent pMD2.G Addgene
Addgene_12259; RRID:Addgene_12259
Recombinant DNA reagent psPAX2 Addgene
Addgene_12260; RRID:Addgene_12260
Recombinant DNA reagent TadA- 8e V106W Addgene
Addgene_138495; RRID:Addgene_138495
Recombinant DNA reagent lentiCRISPR V2 Addgene
Addgene_52961; RRID:Addgene_52961
Recombinant DNA reagent lentiCRISPRV2.1 This study
Cas9 expressing lentiviral plasmid without gRNA scaffold
Recombinant DNA reagent pLenti- ABE8e- P2A- Puro This study
ABE8e expressing lentiviral plasmid
Recombinant DNA reagent pcDNA- 3 Invitrogen
Recombinant DNA reagent pSG5/mKLF Miller and Bieker, 1993
Antibody
PE Mouse Anti- Human CD34 (mouse monoclonal) BD Pharmingen
CAT # 550761; RRID:AB_393871 FACS (2 µl/test)
Antibody
APC Mouse Anti- Human CD133 (mouse monoclonal) BD Pharmingen
CAT # 566596; RRID:AB_2744280 FACS (2 µl/test)
Antibody
BV421 Mouse Anti- Human CD90 (mouse monoclonal) BD Pharmingen
CAT # 562556; RRID:AB_2737651 FACS (2 µl/test)
Antibody
PE- Cy7 Mouse Anti- Human CD235a (mouse monoclonal) BD Pharmingen
CAT # 563666; RRID:AB_2738361 FACS (2 µl/test)
Antibody
BV421 Mouse Anti- Human CD71 (mouse monoclonal) BD Pharmingen
CAT # 562995; RRID:AB_2737939 FACS (2 µl/test)
Antibody
PE Mouse Anti- Human CD235a (mouse monoclonal) BD Pharmingen
CAT # 555570; RRID:AB_395949 FACS (2 µl/test)
Antibody
FITC Mouse Anti- Human CD71 (mouse monoclonal) BD Pharmingen
CAT # 555536; RRID:AB_395920 FACS (2 µl/test)
Antibody
Fetal Hemoglobin Antibody, APC (mouse monoclonal) Invitrogen
CAT # MHFH05; RRID:AB_10374595 FACS (2 µl/test)
AntibodyAntibody for KLF1 (rabbit polyclonal) Crossley et al., 1996
EMSA (1:30 final dilution)
Appendix 1 Continued on next page

Research article Chromosomes and Gene Expression | Genetics and Genomics
Ravi et al. eLife 2022;11:e65421. DOI: https://doi.org/10.7554/eLife.65421 29 of 32
Reagent type (species) or resource Designation Source or reference Identifiers Additional information
AntibodyAnti- KLF1 antibody (goat polyclonal) OriGene #TA305808 ChiP (15 µg/IP)
Antibody Normal rabbit IgG Cell Signaling Technology #2729S ChiP (15 µg/IP)
Commercial assay or kit
NucRed Live 647 ReadyProbes Reagent Invitrogen CAT # R37106 FACS (2 µl/test)
Commercial assay or kit
Zymoclean Gel DNA recovery kit Zymo Research CAT # D4001
Commercial assay or kit NucleoBond Xtra Midi MN REF # 740410
Commercial assay or kit NucleoSpin RNA MN REF # 740955
Commercial assay or kit
NucleoSpin Blood – DNA kit MN REF # 740951
Commercial assay or kit
EasySep Human CD34 Positive Selection Kit STEMCELL Technologies CAT # 17856
Commercial assay or kit
T7 mScript Standard mRNA Production System Cell Script C- MSC100625
Commercial assay or kit
Radiolabelled DNA column Roche G25DNA- RO
Commercial assay or kit
iScript cDNA Synthesis Kit Bio- Rad CAT # 1708891
Commercial assay or kit
BigDye Terminator v3.1 Cycle Sequencing Kit Applied Biosystem CAT # 4337458
Commercial assay or kit
SsoFast EvaGreen Supermix
Bio- Rad CAT # 172–5200
Commercial assay or kit
Universal Mycoplasma detection kit
ATCC CAT # 30–1012K
Chemical compound, drug T4 Polynucleotide Kinase NEB CAT # M0201
Chemical compound, drug T4 DNA Ligase NEB CAT # M0202
Chemical compound, drug
NEBuilder HiFi DNA Assembly Master Mix NEB CAT # E2621
Chemical compound, drug
BamHI- HF NEB CAT # R3136
Chemical compound, drug
NhEI- HF NEB CAT # R3131
Chemical compound, drug
BsmB1 NEB CAT # R0580
Chemical compound, drug
KpnI- HF NEB CAT # R3142
Chemical compound, drug
EcoRI- HF NEB CAT # R3101
Chemical compound, drug
Exonuclease I (E. coli) NEB CAT # M0293
Chemical compound, drug
Pme1 NEB CAT # R0560
Chemical compound, drug
GoTaq Green Master Mix Promega CAT # M712B
Chemical compound, drug
PrimeSTAR GXL Premix Takara Bio CAT # R051A
Chemical compound, drug
DynaBeads PGInvitrogen 10003D
Appendix 1 Continued on next page
Appendix 1 Continued

Research article Chromosomes and Gene Expression | Genetics and Genomics
Ravi et al. eLife 2022;11:e65421. DOI: https://doi.org/10.7554/eLife.65421 30 of 32
Reagent type (species) or resource Designation Source or reference Identifiers Additional information
Chemical compound, drug
FormaldehydeSigma- Aldrich F8775
1% v/v final concentration
Chemical compound, drug
GlycineAjax Finechem AJA1083
125 mM final concentration
Chemical compound, drug γ-Kuzminov, 2001P ATP Perkin- Elmer BLU502A250UC
1 µl/15 pmol probe
Chemical compound, drug
Insulin Sigma- Aldrich CAT # 11061- 68- 0
Chemical compound, drug
Heparin MP Biomedicals CAT # 9041- 08- 1
Chemical compound, drug
Holotransferrin BBI Solutions #SKU T101- 5
Chemical compound, drug
SCF Immuno Tools CAT # 11343325
Chemical compound, drug
EPO Zydus Nephrosciences
Zyrop 4000 IU Injection
Chemical compound, drug
IL6 Immuno Tools CAT # 11340066
Chemical compound, drug
IL3 Immuno Tools CAT # 11340035
Chemical compound, drug
FLT3 Immuno Tools CAT # 11343305
Chemical compound, drug
TPO Immuno Tools CAT # 11344863
Chemical compound, drug
Hydrocortisone MP Biomedicals CAT # 2930949
Chemical compound, drug
AB Serum MP Biomedicals CAT # 101996
Chemical compound, drug
Penstrep Gibco CAT # 15140122
Chemical compound, drug
Dexamethasone Alfa Aesar CAS# 1177- 87- 3
Chemical compound, drug
Doxycycline Sigma- Aldrich CAS# 24390- 14- 5
Chemical compound, drug
Glutamine Gibco CAT # 25030081
Chemical compound, drug
FBS Gibco CAT # 10270106
Chemical compound, drug
PBS Hyclone CAT # SH30256.02
Chemical compound, drug
Polybrene Sigma- Aldrich CAS # 28728- 55- 4
Chemical compound, drug
Hepes Gibco CAT # 15630080
Chemical compound, drug
Puromycin Gibco CAT # A1113803
Chemical compound, drug
Pseudouridine Jena Bioscience CAT # NU- 1139
Chemical compound, drug
Lymphoprep STEMCELL Technologies CAT # 07851
Chemical compound, drug
StemSpan SFEM- II STEMCELL Technologies CAT # 09655
Chemical compound, drug
DMEM Hyclone CAT # SH30243.01
Appendix 1 Continued
Appendix 1 Continued on next page

Research article Chromosomes and Gene Expression | Genetics and Genomics
Ravi et al. eLife 2022;11:e65421. DOI: https://doi.org/10.7554/eLife.65421 31 of 32
Reagent type (species) or resource Designation Source or reference Identifiers Additional information
Chemical compound, drug
RPMI Hyclone CAT # SH30027.01
Chemical compound, drug
IMDM- Glutamax Gibco CAT # 31980030
Chemical compound, drug
Fugene HD Promega Corporation
CAT # E2312
Chemical compound, drug
Lenti- X concentrator Takara CAT # 631232
Chemical compound, drug
Maxcyte buffer Hyclone CAT # EPB1
Chemical compound, drug
LB Agar HIMEDIA M1151
Chemical compound, drug
LB Broth HIMEDIA M1245
Chemical compound, drug
Ampicillin Sodium Salt SRL 61,314
Chemical compound, drug
Triton X- 100 Fisher Scientific CAS #:9002931
Chemical compound, drug
Glutaraldehyde MP Biomedicals CAT # 198,595
Biological sample PBMNCs CMC IRB Min. No. 10,549 (others) dated 15/02/2017
Cell line (Homo sapiens)
HEK 293T ATCC
Cell line (Homo sapiens)
HUDEP- 2 Cell Engineering Division, RIKEN BioResource Center
Cell line (Homo sapiens)
K562 ATCC
Cell line (African green monkey) COS- 7 Gluzman, 1981
Sequence- based reagent
gRNAs This paper Check Supplementary file 1
Sequence- based reagent
Probes, RT- qPCR and PCR primers
This paper Check Supplementary file 2
Software, algorithm Reditools 2 GitHub - BioinfoUNIBA/ REDItools2, Giudice, 2022
RNA off- target
Software, algorithm Synthego ICE Synthego InDel for Sanger sequenced data
Software, algorithm EditR EditR: Edit Deconvolution by Inference of Traces in R ( shinyapps.io)
Base editing efficiency for Sanger sequenced data
Software, algorithm IGV Home | Integrative Genomics Viewer ( broadinstitute.org)
Visualize Aligned data
Software, algorithm CRISPResso- 2 CRISPResso2 (partners.org) Base editing efficiency for NGS data
Software, algorithm Snapgene SnapGene | Software for everyday molecular biology
gRNA designing
Software, algorithm Benchling CRISPR gRNA Design Tool | Benchling
gRNA designing
Software, algorithm FlowJo 10.7.1 Home | FlowJo, LLC FACS data analysis
Appendix 1 Continued
Appendix 1 Continued on next page

Research article Chromosomes and Gene Expression | Genetics and Genomics
Ravi et al. eLife 2022;11:e65421. DOI: https://doi.org/10.7554/eLife.65421 32 of 32
Reagent type (species) or resource Designation Source or reference Identifiers Additional information
Software, algorithm Cas off- finder CRISPR RGEN Tools ( rgenome.net)
DNA off- target prediction
Software, algorithm Cosmid CRISPR Target Search ( gatech.edu)
Primer designing for predicted DNA off- targets
Software, algorithm Bowtie 2 Bowtie 2: fast and sensitive read alignment ( sourceforge.net)
Sequence alignment
Software, algorithm TrimGalore Babraham Bioinformatics - Trim Galore!
FastQ files processing
Software, algorithm NFCore RNA Seq pipeline
rnaseq » nf-core RNA sequencing pipeline
Software, algorithm Interactive Gene Expression Analysis Kit (iGEAK)
iGEAK! (google.com)
Software, algorithm GraphPad Prism 8.0.1 GraphPad Prism (https:// graphpad.com)
RRID:SCR_015807
Appendix 1 Continued