Identification of Harmonic Source at the Point of Common Coupling Based on Voltage Indices
21
Jurnal Teknologi, 43(D) Dis. 2005: 11–32 © Universiti Teknologi Malaysia IDENTIFICATION OF HARMONIC SOURCE AT THE POINT OF COMMON COUPLING BASED ON VOLTAGE INDICES NORALIZA HAMZAH 1* , AZAH MOHAMED 2 & AINI HUSSAIN 3 Abstract. This paper presents a new method to determine harmonic source either at the utility or the customer based on voltage indices. In the method, both Thevenin and Norton equivalent circuits are first derived for harmonic source identification. Based on these circuits, two cases are analyzed, that is a circuit with a single harmonic source and a circuit with two harmonic sources. In a single harmonic source, harmonic circuit is simplified to a Thevenin equivalent circuit which is used to derive the voltage indices. The voltage measured at the point of common coupling (PCC) is compared with the voltage at the utility sides. In a two harmonic source system, the superposition theorem and Norton equivalent circuits are employed to derive the voltage indices at utility and customer sides based on the voltage and current measurements at the PCC. For both systems, the voltage index based on the higher voltage magnitude is identified as the main harmonic source. Several case studies and a series switching tests are performed in the simulations using the PSCAD/EMTDC program. Comparisons are made with the Critical Impedance (CI) method to verify the accuracy of the proposed method in harmonic source identification. Results proved that the identification of harmonic source at the point of common coupling based on voltage indices is more accurate when compared to the CI method. Keywords: Harmonic, superposition theorem, harmonic impedance Abstrak. Kertas kerja ini membentangkan teknik baru untuk mengesan punca gangguan harmonik, samada pembekal atau pengguna. Dalam kaedah ini, litar-litar setara Norton dan Thevenin diperolehi untuk tujuan pengesanan punca gangguan harmonik. Berdasarkan kedua-dua litar setara tersebut, dua kes telah dianalisa iaitu litar yang mempunyai satu punca harmonik dan litar yang mempunyai dua punca harmonik. Di dalam litar yang mempunyai satu punca harmonik, litar setara diringkaskan kepada litar setara Thevenin untuk memperolehi indeks voltan. Voltan yang diperolehi di titik gandingan sepunya (TGS) dibandingkan dengan voltan di pihak pembekal. Di dalam litar yang mempunyai dua punca harmonik, teorem tindihan dan litar setara Norton digunakan untuk menerbitkan indeks voltan daripada bacaan yang diperolehi di titik gandingan sepunya. Beberapa kes dan ujian suis dijalankan menggunakan perisian PSCAD/EMTDC. Perbandingan dilakukan dengan teknik galangan kritikal (GK) untuk membuktikan kesahihan teknik yang dicadangkan dalam pengesanan punca gangguan harmonik. Keputusan yang di perolehi membuktikan teknik pengesanan punca gangguan harmonik berdasarkan indeks voltan lebih baik daripada teknik galangan kritikal (GK). Kata kunci: Harmonik, teorem tindihan, galangan harmonik 1,2,&3 Faculty of Electrical Engineering Universiti Kebangsaan Malaysia, Bangi 43600, Selangor, Malaysia. * Corresponding author: Tel: 603-8921 6322; Fax: 603-8921 6246; Email: [email protected] JTDIS43D[02].pmd 02/15/2007, 16:18 11
-
Upload
nuardiblogspot -
Category
Documents
-
view
0 -
download
0
Transcript of Identification of Harmonic Source at the Point of Common Coupling Based on Voltage Indices
IDENTIFICATION OF HARMONIC SOURCE AT THE POINT OF COMMON COUPLING 11
Jurnal Teknologi, 43(D) Dis. 2005: 11–32© Universiti Teknologi Malaysia
IDENTIFICATION OF HARMONIC SOURCE AT THE POINT OFCOMMON COUPLING BASED ON VOLTAGE INDICES
NORALIZA HAMZAH1*, AZAH MOHAMED2 & AINI HUSSAIN3
Abstract. This paper presents a new method to determine harmonic source either at the utility orthe customer based on voltage indices. In the method, both Thevenin and Norton equivalent circuitsare first derived for harmonic source identification. Based on these circuits, two cases are analyzed, thatis a circuit with a single harmonic source and a circuit with two harmonic sources. In a single harmonicsource, harmonic circuit is simplified to a Thevenin equivalent circuit which is used to derive thevoltage indices. The voltage measured at the point of common coupling (PCC) is compared with thevoltage at the utility sides. In a two harmonic source system, the superposition theorem and Nortonequivalent circuits are employed to derive the voltage indices at utility and customer sides based on thevoltage and current measurements at the PCC. For both systems, the voltage index based on the highervoltage magnitude is identified as the main harmonic source. Several case studies and a series switchingtests are performed in the simulations using the PSCAD/EMTDC program. Comparisons are madewith the Critical Impedance (CI) method to verify the accuracy of the proposed method in harmonicsource identification. Results proved that the identification of harmonic source at the point of commoncoupling based on voltage indices is more accurate when compared to the CI method.
Keywords: Harmonic, superposition theorem, harmonic impedance
Abstrak. Kertas kerja ini membentangkan teknik baru untuk mengesan punca gangguan harmonik,samada pembekal atau pengguna. Dalam kaedah ini, litar-litar setara Norton dan Thevenin diperolehiuntuk tujuan pengesanan punca gangguan harmonik. Berdasarkan kedua-dua litar setara tersebut, duakes telah dianalisa iaitu litar yang mempunyai satu punca harmonik dan litar yang mempunyai duapunca harmonik. Di dalam litar yang mempunyai satu punca harmonik, litar setara diringkaskankepada litar setara Thevenin untuk memperolehi indeks voltan. Voltan yang diperolehi di titik gandingansepunya (TGS) dibandingkan dengan voltan di pihak pembekal. Di dalam litar yang mempunyai duapunca harmonik, teorem tindihan dan litar setara Norton digunakan untuk menerbitkan indeks voltandaripada bacaan yang diperolehi di titik gandingan sepunya. Beberapa kes dan ujian suis dijalankanmenggunakan perisian PSCAD/EMTDC. Perbandingan dilakukan dengan teknik galangan kritikal(GK) untuk membuktikan kesahihan teknik yang dicadangkan dalam pengesanan punca gangguanharmonik. Keputusan yang di perolehi membuktikan teknik pengesanan punca gangguan harmonikberdasarkan indeks voltan lebih baik daripada teknik galangan kritikal (GK).
Kata kunci: Harmonik, teorem tindihan, galangan harmonik
1,2,&3Faculty of Electrical Engineering Universiti Kebangsaan Malaysia, Bangi 43600, Selangor, Malaysia.* Corresponding author: Tel: 603-8921 6322; Fax: 603-8921 6246; Email: [email protected]
JTDIS43D[02].pmd 02/15/2007, 16:1811
NORALIZA HAMZAH, AZAH MOHAMED & AINI HUSSAIN12
1.0 INTRODUCTION
Harmonics problem have been a significant issue in three-phase power systems. Theproblems of harmonics keep on increasing due to the growth of the modern technologywhich converts the old bulky power system loads into small size power electronicloads. These loads use diodes, silicon-controlled rectifiers, and power transistors toconvert 50/60Hz ac to dc. In Adjustable Speed Drives (ASD), the dc is converted tovariable-frequency ac to control a motor speed. These efficient and controllable powerelectronic loads are proliferating and can be found at all power levels. This phenomenonleads to a pertinent issue on who should be responsible for power system harmonicdistortion. To counteract this issue, another more technically important issue has to besolved first, that is, the technique to discriminate utility and customer harmoniccontribution at the point of common coupling (PCC).
Harmonic identification at the PCC becomes more complex when the onlymeasurement available are the current and voltage at a single point only. In order todetermine the utility and customer harmonic contribution, many methods have beenproposed in the literature. The real power direction method [1-3] is the earliest methodproposed in identifying harmonic sources. In fact, some power quality monitors usethis method to detect the source of harmonic as to whether at the utility side or thecustomer side. In [4,5], the real power direction method has been found to be only 50percent reliable should the customer change loads. A better method to clarifyinteraction between utility and customer harmonic contribution has been used in [6,7].This method is based on Thevenin’s Theorem where harmonic at PCC is decomposedinto outflow harmonic current (from customer) and inflow harmonic current (fromutility). References [6,7] developed active harmonic measurement instrument usingcurrent injection of inter-harmonic frequency to measure utility and customer harmonicimpedances. However, the inter-harmonic current injection is not popular because itis considered as an invasive method [8]. Reference [5] proposed the superposition-based current and voltage indices to quantify the harmonic sources using a Nortonequivalent circuit. In [5], the principle of superposition theorem has been mathematicallyanalyzed and proven to be a good indicator for determining harmonic contributors atthe PCC. However, the implementation of superposition theorem will only be possibleif utility and customer impedances are known. To date, the most recent method usedto discriminate harmonic contribution at the PCC is the critical impedance method[10]. This method used the critical impedance index to locate the harmonic source.Results based on simulation using the method are presented for comparison in thispaper.
This paper presents a method to locate the harmonic source from the measurementat the PCC between utility and customer based on the voltage indices. This principleis similar as the superposition theorem [4,5,9] but to the best of our knowledge,emphasize on voltage indices as harmonic sources location indicator has not beenverified in the literature. Two configuration of test system cases are considered in the
JTDIS43D[02].pmd 02/15/2007, 16:1812
IDENTIFICATION OF HARMONIC SOURCE AT THE POINT OF COMMON COUPLING 13
simulation, which are the system with correction capacitor connected and the systemwithout correction capacitor connected. This paper also employed the single-phase-impedance measurement to obtain the impedance values. The results obtained fromsimulations are promising for both test configurations using the voltage indices.
2.0 HARMONIC VOLTAGE INDICES AT PCC
For harmonic indices derivation, all values are referred to harmonic component.Harmonic currents at PCC can be from a single source, in which it is from eitherutility or customer side. On radial utility distribution feeders and industrial plant powersystems, the main tendency is for the harmonic currents to flow from the harmonic-producing load to the power system source [11]. Harmonic current at the PCC canalso come from both utility and customer sides. Therefore, these two scenarios ofharmonic currents flow will be used to derive the harmonic voltage indices at PCC.
2.1 Derivation of Voltage Indices for a Single Source System
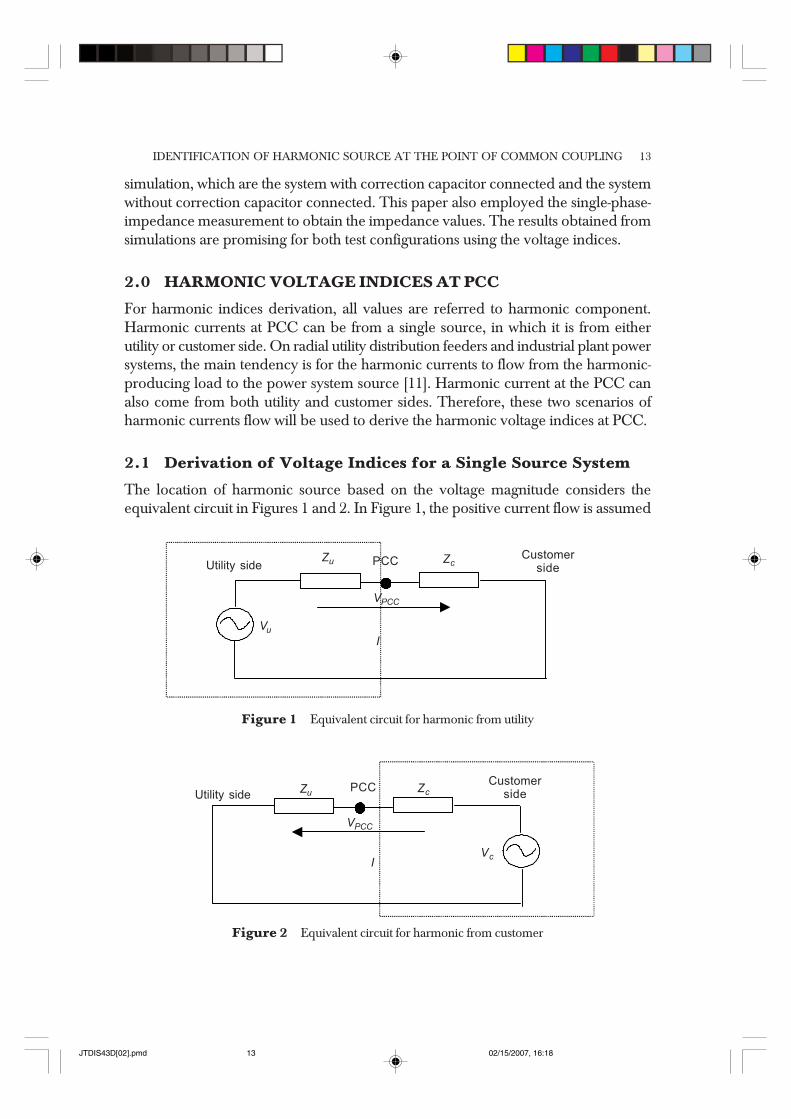
The location of harmonic source based on the voltage magnitude considers theequivalent circuit in Figures 1 and 2. In Figure 1, the positive current flow is assumed
Figure 1 Equivalent circuit for harmonic from utility
Utility sideCustomer
sidePCC
VPCC
Vu
Zu Zc
I
Figure 2 Equivalent circuit for harmonic from customer
Utility sideCustomer
sidePCC
VPCC
Vc
Zu Zc
I
JTDIS43D[02].pmd 02/15/2007, 16:1813
NORALIZA HAMZAH, AZAH MOHAMED & AINI HUSSAIN14
from utility to customer. On the other hand, in Figure 2, the positive current flow isassumed from customer to utility.
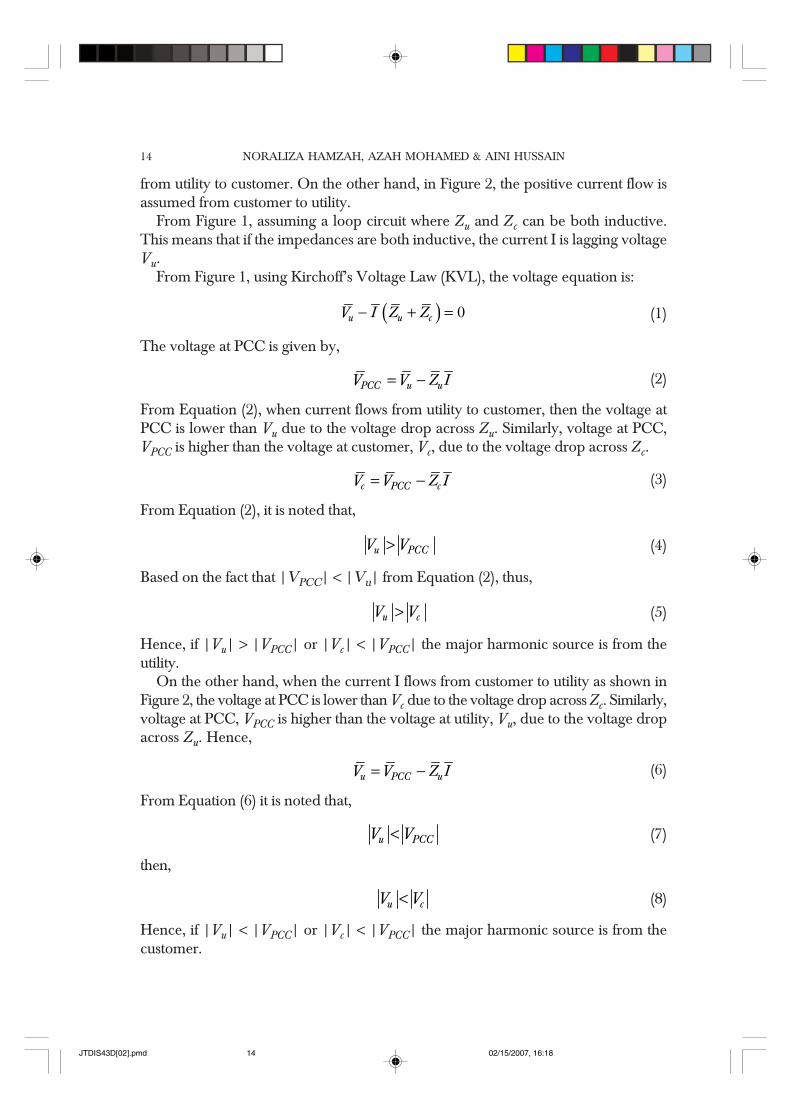
From Figure 1, assuming a loop circuit where Zu and Zc can be both inductive.This means that if the impedances are both inductive, the current I is lagging voltageVu.
From Figure 1, using Kirchoff’s Voltage Law (KVL), the voltage equation is:
( ) 0− + =u u cV I Z Z (1)
The voltage at PCC is given by,
= −PCC u uV V Z I (2)
From Equation (2), when current flows from utility to customer, then the voltage atPCC is lower than Vu due to the voltage drop across Zu. Similarly, voltage at PCC,VPCC is higher than the voltage at customer, Vc, due to the voltage drop across Zc.
= −c PCC cV V Z I (3)
From Equation (2), it is noted that,
>u PCCV V (4)
Based on the fact that |VPCC| < |Vu| from Equation (2), thus,
>u cV V (5)
Hence, if |Vu| > |VPCC| or |Vc| < |VPCC| the major harmonic source is from theutility.
On the other hand, when the current I flows from customer to utility as shown inFigure 2, the voltage at PCC is lower than Vc due to the voltage drop across Zc. Similarly,voltage at PCC, VPCC is higher than the voltage at utility, Vu, due to the voltage dropacross Zu. Hence,
= −u PCC uV V Z I (6)
From Equation (6) it is noted that,
<u PCCV V (7)
then,
<u cV V (8)
Hence, if |Vu| < |VPCC| or |Vc| < |VPCC| the major harmonic source is from thecustomer.
JTDIS43D[02].pmd 02/15/2007, 16:1814
IDENTIFICATION OF HARMONIC SOURCE AT THE POINT OF COMMON COUPLING 15
Therefore, the conditions |Vu| > |VPCC| or |Vc| < |VPCC| and |Vu| < |VPCC| or|Vc| < |VPCC| can be used for harmonic source determination in a distribution systemprovided that the circuit is only a single loop where Zu and Zc can be both inductiveand |VPCC| ≠ 0.
2.2 Derivation of Voltage Indices for a Two Sources System
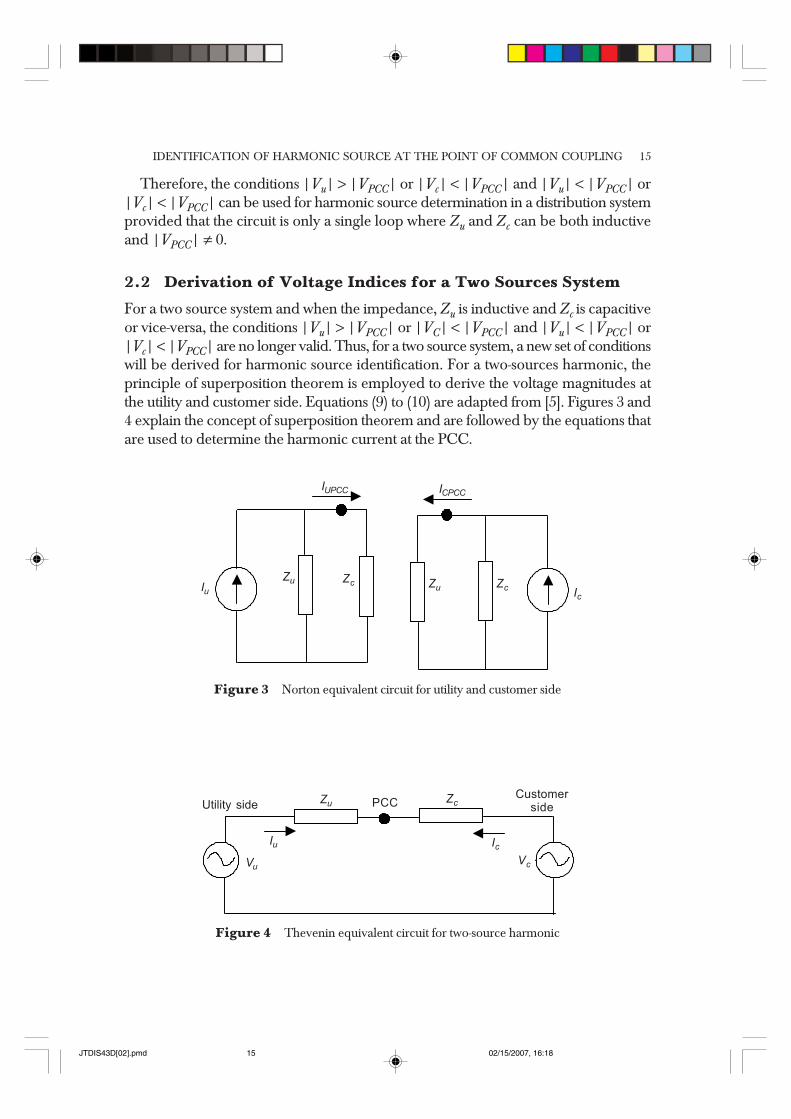
For a two source system and when the impedance, Zu is inductive and Zc is capacitiveor vice-versa, the conditions |Vu| > |VPCC| or |VC| < |VPCC| and |Vu| < |VPCC| or|Vc| < |VPCC| are no longer valid. Thus, for a two source system, a new set of conditionswill be derived for harmonic source identification. For a two-sources harmonic, theprinciple of superposition theorem is employed to derive the voltage magnitudes atthe utility and customer side. Equations (9) to (10) are adapted from [5]. Figures 3 and4 explain the concept of superposition theorem and are followed by the equations thatare used to determine the harmonic current at the PCC.
Figure 3 Norton equivalent circuit for utility and customer side
ZcZuZc
Zu
ICPCCIUPCC
Iu Ic
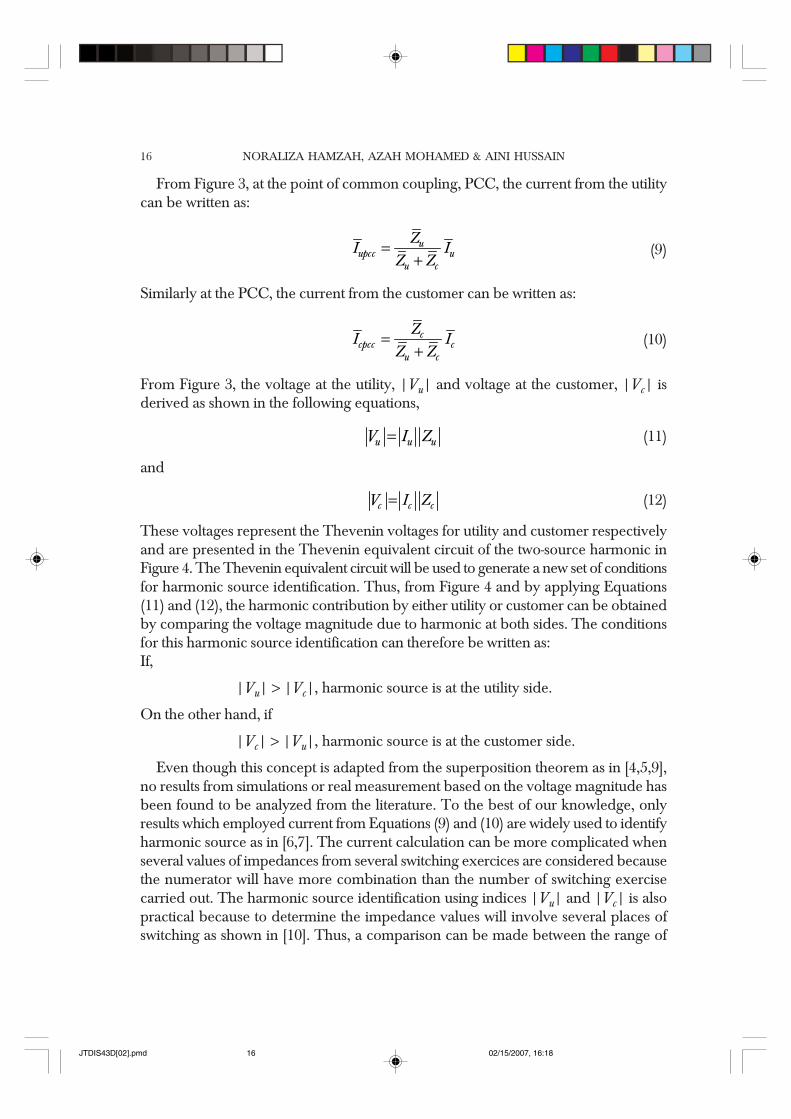
Figure 4 Thevenin equivalent circuit for two-source harmonic
Utility sideCustomer
side
Iu
Vu
Ic
Vc
Zu ZcPCC
JTDIS43D[02].pmd 02/15/2007, 16:1815
NORALIZA HAMZAH, AZAH MOHAMED & AINI HUSSAIN16
From Figure 3, at the point of common coupling, PCC, the current from the utilitycan be written as:
=+u
upcc uu c
ZI I
Z Z (9)
Similarly at the PCC, the current from the customer can be written as:
=+c
cpcc cu c
ZI I
Z Z(10)
From Figure 3, the voltage at the utility, |Vu| and voltage at the customer, |Vc| isderived as shown in the following equations,
=u u uV I Z (11)
and
=c c cV I Z (12)
These voltages represent the Thevenin voltages for utility and customer respectivelyand are presented in the Thevenin equivalent circuit of the two-source harmonic inFigure 4. The Thevenin equivalent circuit will be used to generate a new set of conditionsfor harmonic source identification. Thus, from Figure 4 and by applying Equations(11) and (12), the harmonic contribution by either utility or customer can be obtainedby comparing the voltage magnitude due to harmonic at both sides. The conditionsfor this harmonic source identification can therefore be written as:If,
|Vu| > |Vc|, harmonic source is at the utility side.
On the other hand, if
|Vc| > |Vu|, harmonic source is at the customer side.
Even though this concept is adapted from the superposition theorem as in [4,5,9],no results from simulations or real measurement based on the voltage magnitude hasbeen found to be analyzed from the literature. To the best of our knowledge, onlyresults which employed current from Equations (9) and (10) are widely used to identifyharmonic source as in [6,7]. The current calculation can be more complicated whenseveral values of impedances from several switching exercices are considered becausethe numerator will have more combination than the number of switching exercisecarried out. The harmonic source identification using indices |Vu| and |Vc| is alsopractical because to determine the impedance values will involve several places ofswitching as shown in [10]. Thus, a comparison can be made between the range of
JTDIS43D[02].pmd 02/15/2007, 16:1816
IDENTIFICATION OF HARMONIC SOURCE AT THE POINT OF COMMON COUPLING 17
|Vu| and |Vc| from several switching exercises. Thus, with more than one values of|Vu| and |Vc| available, the degree of confidence in the harmonic source identificationcan be increased using the voltage indices.
2.3 Critical Impedance (CI) Indices
The CI indices are presented in this section to be used as comparisons in this paper.Only the CI indices at the utility side are derived based on equations given in [10].The equations used to calculate the CI indicator, ZcrVu is adapted from [10] as follows,when both Zu and Zc are inductive impedance,
( )2 sin θ β= − +pcccrVu
pcc
VZ
I(13)
For Zu inductive and Zc capacitive, additional equation is derived as follows,
− = −cr zc crVu uZ Z Z (14)
where, θ = θV -θI, β = 90° – α and α = tg-1 Zu. The voltage and current magnitude atthe PCC are |VPCC| and |IPCC| respectively. The values are referred to the utility sideparameters Iu and Zu. From Equation (13), it is obvious that the impedance angles willinfluence the value of the CI indices.
3.0 HARMONIC SOURCE IDENTIFICATIONIMPLEMENTATION
Harmonic voltage indices are verified using the current and voltage data obtained atthe PCC from simulations carried out on a test system. Switching method is employedto obtain the values of utility and customer impedances. Details of the test systemused in this simulation, the utility and customer impedances determination and theprocedure for implementing harmonic source identification are described as follows.
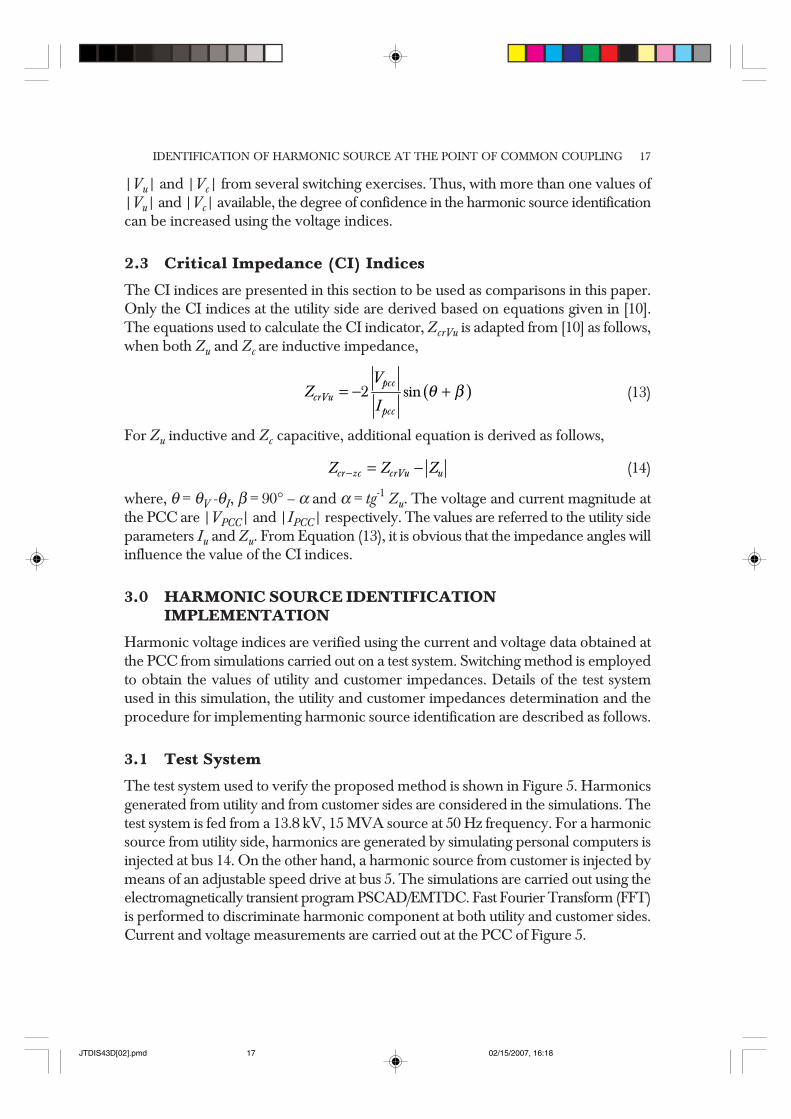
3.1 Test System
The test system used to verify the proposed method is shown in Figure 5. Harmonicsgenerated from utility and from customer sides are considered in the simulations. Thetest system is fed from a 13.8 kV, 15 MVA source at 50 Hz frequency. For a harmonicsource from utility side, harmonics are generated by simulating personal computers isinjected at bus 14. On the other hand, a harmonic source from customer is injected bymeans of an adjustable speed drive at bus 5. The simulations are carried out using theelectromagnetically transient program PSCAD/EMTDC. Fast Fourier Transform (FFT)is performed to discriminate harmonic component at both utility and customer sides.Current and voltage measurements are carried out at the PCC of Figure 5.
JTDIS43D[02].pmd 02/15/2007, 16:1817
NORALIZA HAMZAH, AZAH MOHAMED & AINI HUSSAIN18
3.2 Impedance Determination Using Steady-StateMeasurements
In this simulation, the values of Iu, Zu, Ic and Zc can be obtained by applying theswitching method adapted from references [10,12-14]. Details of the switching tests areshown in Table 1 where switching tests at the customer side will provide impedance,Zu, and current Iu, for the utility whilst switching test at the utility side will provide theimpedance, Zc and current Ic for the customer.
The values of Iu and Zu for dominant harmonic components at utility side arecalculated using the following equations:
−∆=∆
hu
h
VZ
I(15)
and
= +hu h
u
VI I
Z(16)
Figure 5 Test system for harmonic source location
13
Point ofCommonCoupling
(PCC)
2
1
14 Utility side
12
F
B A
3
9
10 11
Customerside
8
7
E
Off
DC
6
4
ASD
5
JTDIS43D[02].pmd 02/15/2007, 16:1818
IDENTIFICATION OF HARMONIC SOURCE AT THE POINT OF COMMON COUPLING 19
where ∆Vh and ∆Ih are the difference between harmonic voltage and current,respectively for each switching test. On the other hand, the values of Ic and Zc fordominant harmonic components at customer side are calculated using the followingequations:
∆=∆
hc
h
VZ
I(17)
and
= −hc h
u
VI I
Z(18)
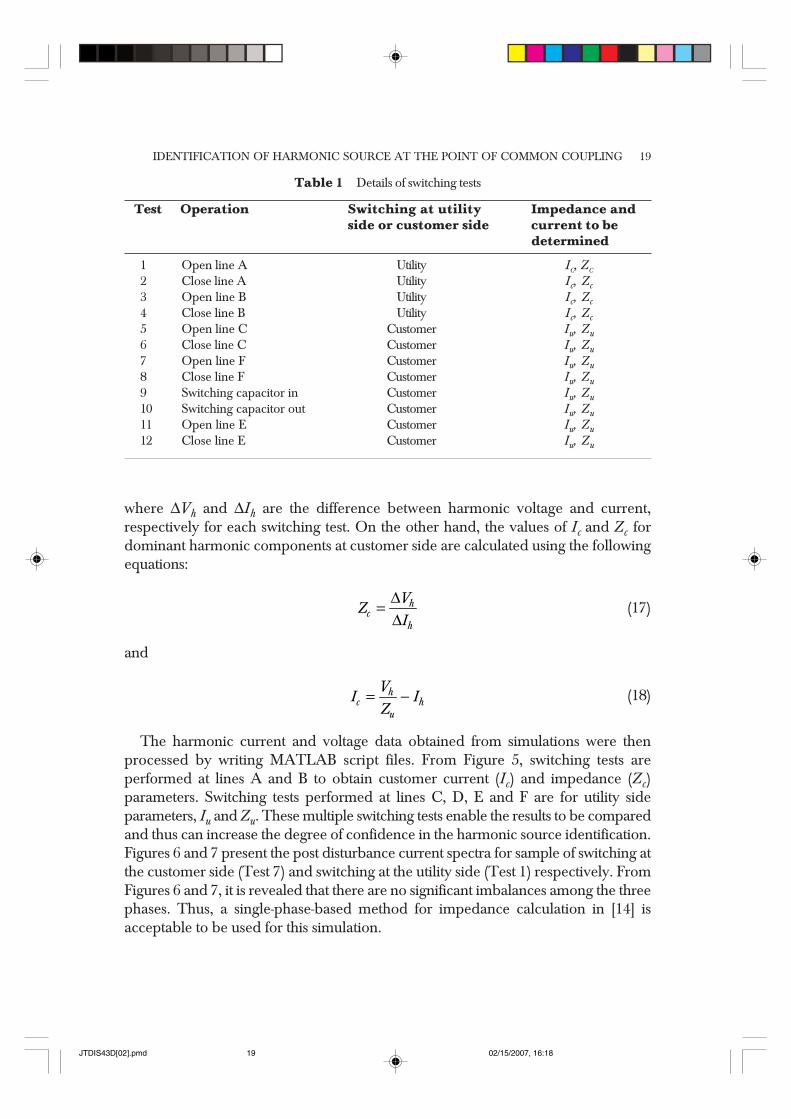
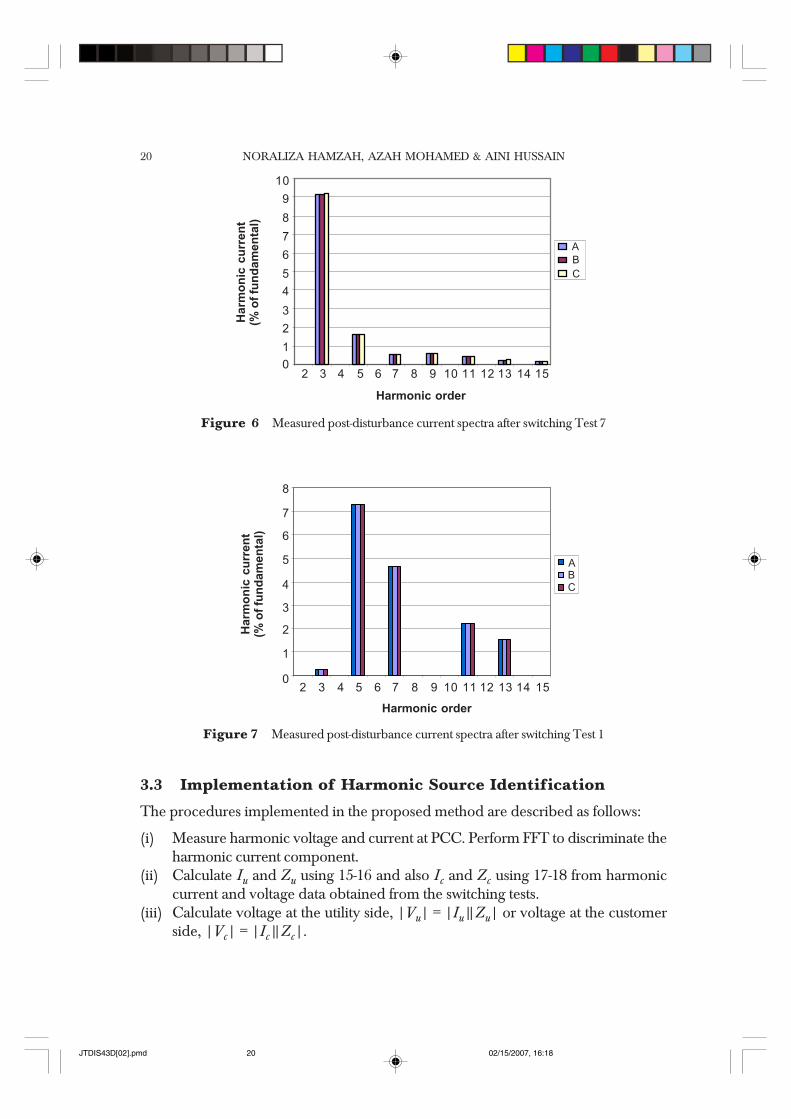
The harmonic current and voltage data obtained from simulations were thenprocessed by writing MATLAB script files. From Figure 5, switching tests areperformed at lines A and B to obtain customer current (Ic) and impedance (Zc)parameters. Switching tests performed at lines C, D, E and F are for utility sideparameters, Iu and Zu. These multiple switching tests enable the results to be comparedand thus can increase the degree of confidence in the harmonic source identification.Figures 6 and 7 present the post disturbance current spectra for sample of switching atthe customer side (Test 7) and switching at the utility side (Test 1) respectively. FromFigures 6 and 7, it is revealed that there are no significant imbalances among the threephases. Thus, a single-phase-based method for impedance calculation in [14] isacceptable to be used for this simulation.
Table 1 Details of switching tests
Test Operation Switching at utility Impedance andside or customer side current to be
determined
1 Open line A Utility IC, ZC
2 Close line A Utility Ic, Zc3 Open line B Utility Ic, Zc4 Close line B Utility Ic, Zc5 Open line C Customer Iu, Zu6 Close line C Customer Iu, Zu7 Open line F Customer Iu, Zu8 Close line F Customer Iu, Zu9 Switching capacitor in Customer Iu, Zu10 Switching capacitor out Customer Iu, Zu11 Open line E Customer Iu, Zu12 Close line E Customer Iu, Zu
JTDIS43D[02].pmd 02/15/2007, 16:1819
NORALIZA HAMZAH, AZAH MOHAMED & AINI HUSSAIN20
3.3 Implementation of Harmonic Source Identification
The procedures implemented in the proposed method are described as follows:
(i) Measure harmonic voltage and current at PCC. Perform FFT to discriminate theharmonic current component.
(ii) Calculate Iu and Zu using 15-16 and also Ic and Zc using 17-18 from harmoniccurrent and voltage data obtained from the switching tests.
(iii) Calculate voltage at the utility side, |Vu| = |Iu||Zu| or voltage at the customerside, |Vc| = |Ic||Zc|.
Figure 6 Measured post-disturbance current spectra after switching Test 7
Harm
on
ic c
urr
en
t(%
of
fun
dam
en
tal)
10
9
8
7
6
5
4
3
2
1
0
Figure 7 Measured post-disturbance current spectra after switching Test 1
Harmonic order
2 3 4 5 6 7 8 9 10 11 12 13 14 15
Harmonic order
2 3 4 5 6 7 8 9 10 11 12 13 14 15
Harm
on
ic c
urr
en
t(%
of
fun
dam
en
tal)
8
7
6
5
4
3
2
1
0
ABC
A
B
C
JTDIS43D[02].pmd 02/15/2007, 16:1820
IDENTIFICATION OF HARMONIC SOURCE AT THE POINT OF COMMON COUPLING 21
(iv) For a single source system without correction capacitor connected, compare themeasured harmonic voltage at PCC, |VPCC| and the voltage at the utility, |Vu|,or between |VPCC| and the voltage at the customer side |Vc|. If |Vu| > |VPCC|or |Vc| < |VPCC| , the major harmonic source is from the utility. If |Vc| >|VPCC| or |Vu| < |VPCC|, the major harmonic source is from the customer.
(v) For a single source system with correction capacitor connected and a two-sourcesystem, compare harmonic voltage at the utility |Vu| and the voltage at the utilitythe customer side |Vc|. If |Vu| > |Vc|, the major harmonic source is from theutility. If |Vc| > |Vu| the major harmonic source is from the customer.
4.0 RESULTS
In the following section, results from simulations are presented to verify the theories insection 2. Results based on CI method are also calculated and presented forcomparison. Results presented are obtained from simulation of switching tests carriedout in the test system. Some switching events do not produce significant change incurrent and voltage, in which ∆Vh and ∆Ih are zeroes. These conditions do not enablethe impedance to be calculated. Therefore, only switching tests, which producesignificant change in harmonic voltage and current, are presented in this paper foreach case.
4.1 Harmonic from Single Source
In this simulation, the harmonic source is injected at either side of the PCC, utility orcustomer respectively. Simulations are carried out with and without correction capacitorconnected at bus 3 of the system in Figure 5. The objective of implementing these twotypes of simulations is to find out the effect of correction capacitor on harmonicsdistortion. Current spectra from FFT will then be used to determine the dominantharmonic component and the most dominant harmonic is selected for harmonic sourceidentification.
4.1.1 Harmonic Source without Capacitor Connected
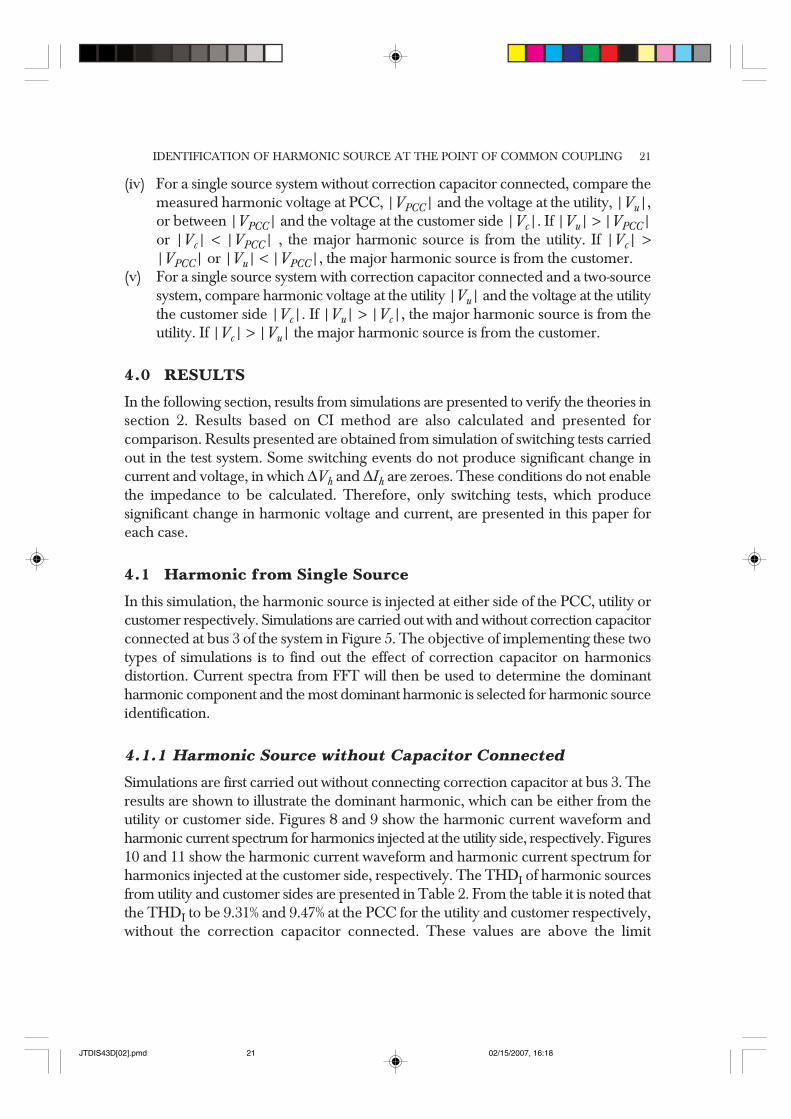
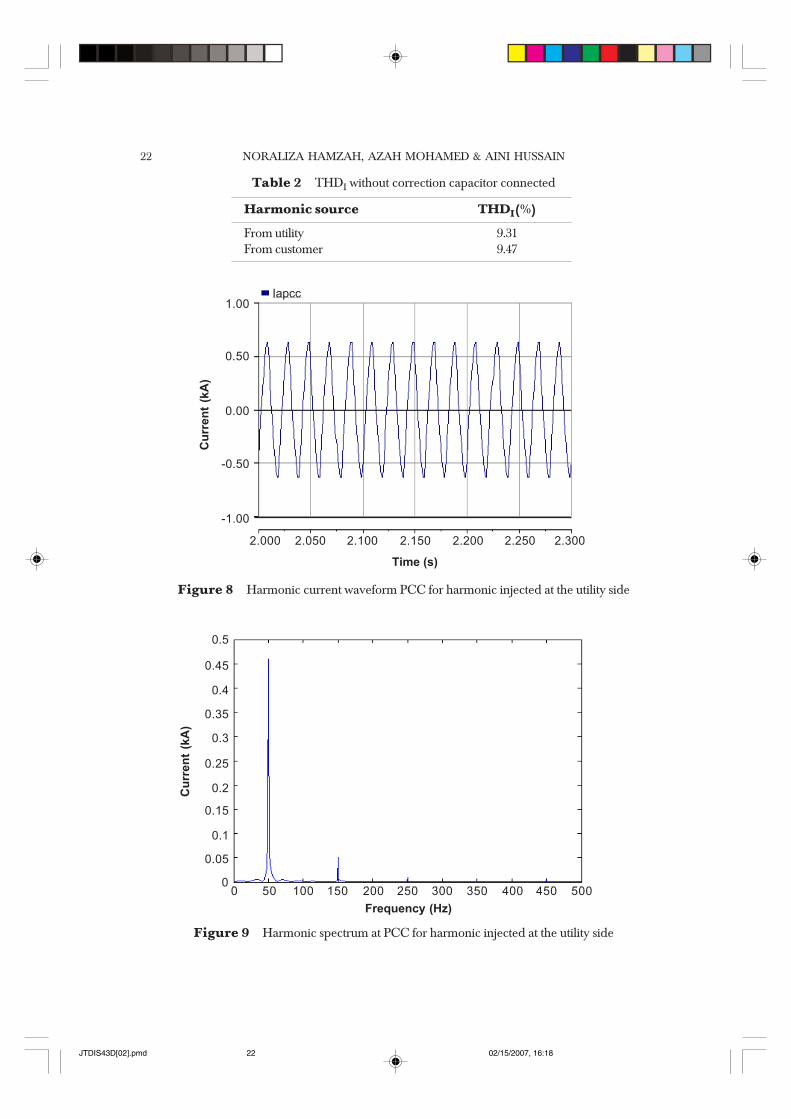
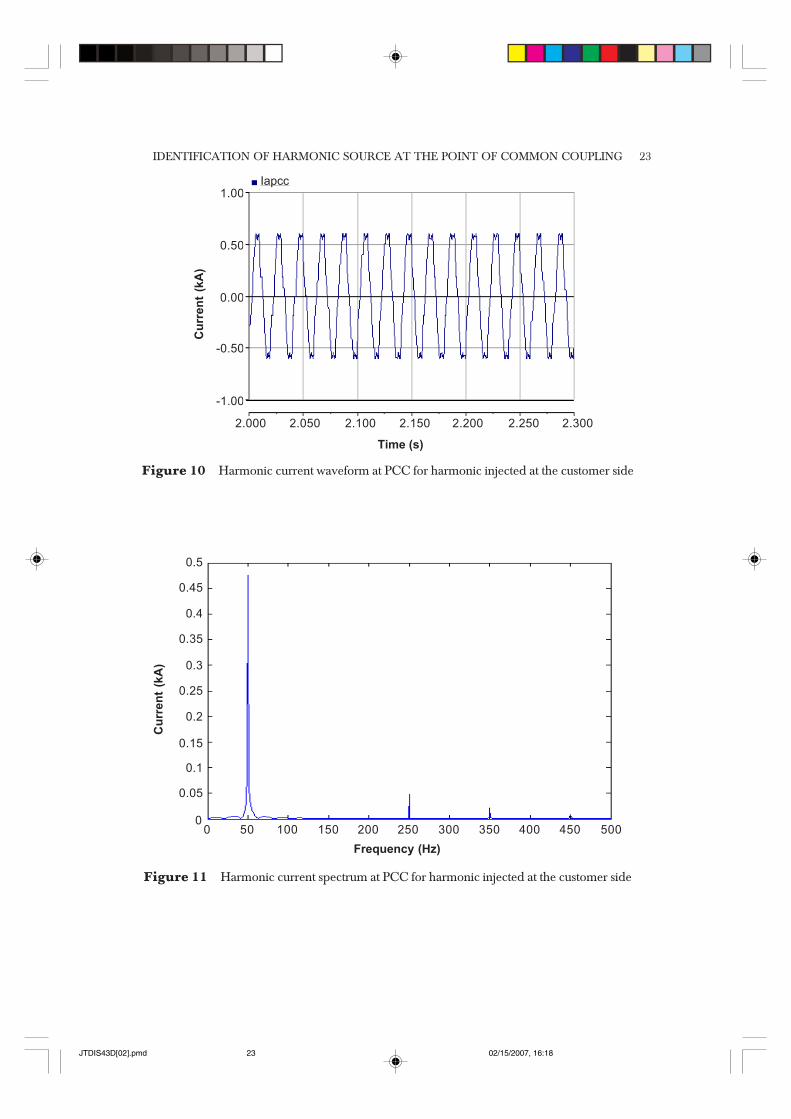
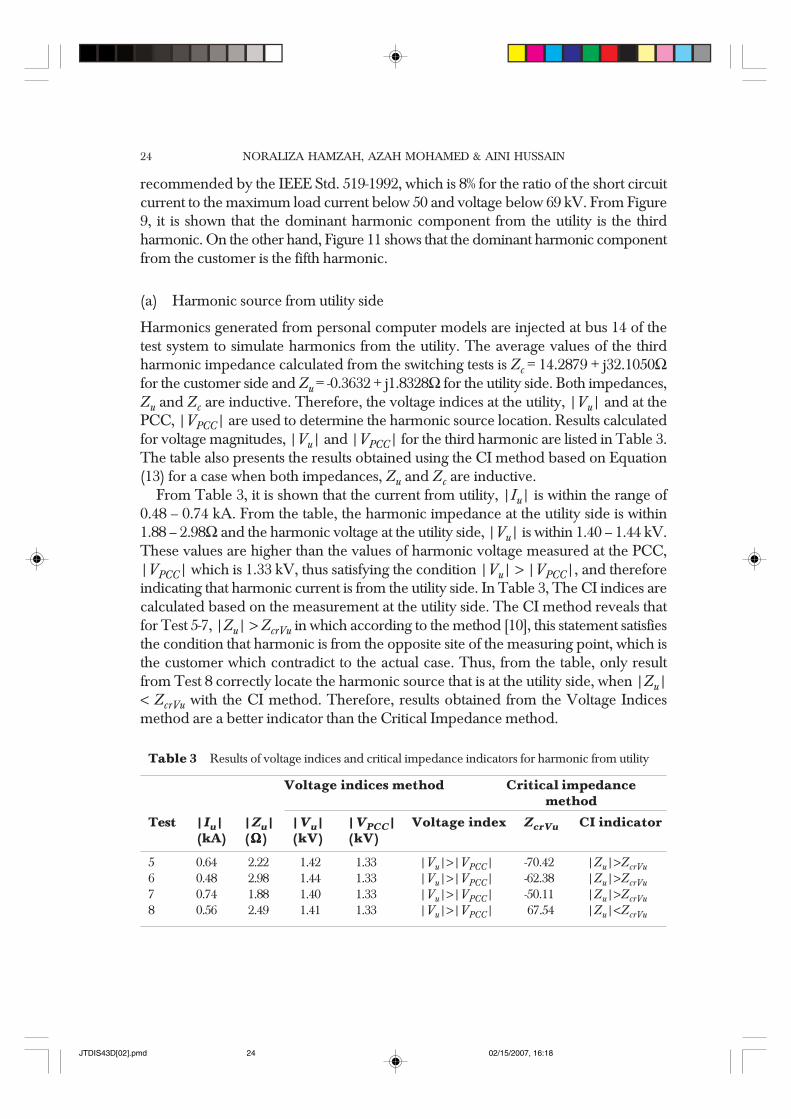
Simulations are first carried out without connecting correction capacitor at bus 3. Theresults are shown to illustrate the dominant harmonic, which can be either from theutility or customer side. Figures 8 and 9 show the harmonic current waveform andharmonic current spectrum for harmonics injected at the utility side, respectively. Figures10 and 11 show the harmonic current waveform and harmonic current spectrum forharmonics injected at the customer side, respectively. The THDI of harmonic sourcesfrom utility and customer sides are presented in Table 2. From the table it is noted thatthe THDI to be 9.31% and 9.47% at the PCC for the utility and customer respectively,without the correction capacitor connected. These values are above the limit
JTDIS43D[02].pmd 02/15/2007, 16:1821
NORALIZA HAMZAH, AZAH MOHAMED & AINI HUSSAIN22
Table 2 THDI without correction capacitor connected
Harmonic source THDI(%)
From utility 9.31From customer 9.47
Figure 9 Harmonic spectrum at PCC for harmonic injected at the utility side
Frequency (Hz)
0 50 100 150 200 250 300 350 400 450 500
Cu
rren
t (k
A)
0
0.05
0.1
0.15
0.2
0.25
0.3
0.35
0.4
0.45
0.5
Figure 8 Harmonic current waveform PCC for harmonic injected at the utility side
Time (s)
Cu
rren
t (k
A)
1.00
0.50
0.00
-0.50
-1.00
2.000
Iapcc
2.050 2.100 2.150 2.200 2.250 2.300
JTDIS43D[02].pmd 02/15/2007, 16:1822
IDENTIFICATION OF HARMONIC SOURCE AT THE POINT OF COMMON COUPLING 23
Figure 11 Harmonic current spectrum at PCC for harmonic injected at the customer side
Cu
rren
t (k
A)
0
0.05
0.1
0.15
0.2
0.25
0.3
0.35
0.4
0.45
0.5
Frequency (Hz)
0 50 100 150 200 250 300 350 400 450 500
Figure 10 Harmonic current waveform at PCC for harmonic injected at the customer side
Time (s)
2.000 2.050 2.100 2.150 2.200 2.250 2.300
Cu
rren
t (k
A)
1.00
0.50
0.00
-0.50
-1.00
Iapcc
JTDIS43D[02].pmd 02/15/2007, 16:1823
NORALIZA HAMZAH, AZAH MOHAMED & AINI HUSSAIN24
recommended by the IEEE Std. 519-1992, which is 8% for the ratio of the short circuitcurrent to the maximum load current below 50 and voltage below 69 kV. From Figure9, it is shown that the dominant harmonic component from the utility is the thirdharmonic. On the other hand, Figure 11 shows that the dominant harmonic componentfrom the customer is the fifth harmonic.
(a) Harmonic source from utility side
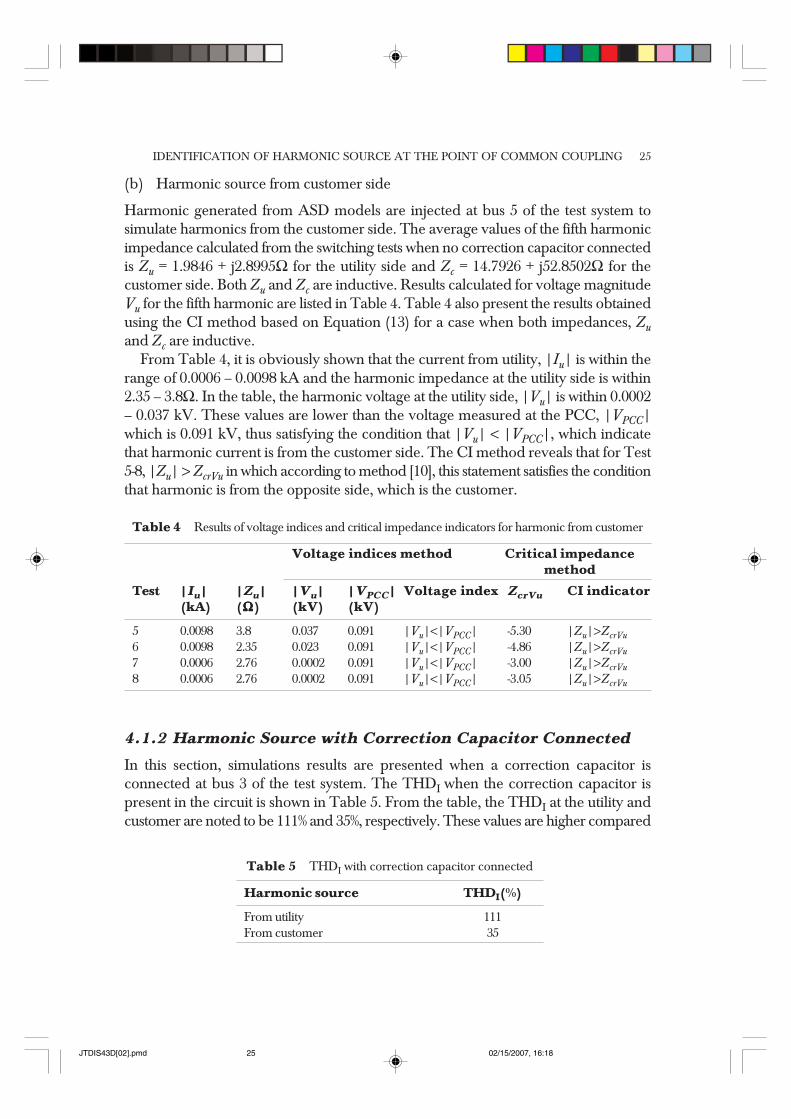
Harmonics generated from personal computer models are injected at bus 14 of thetest system to simulate harmonics from the utility. The average values of the thirdharmonic impedance calculated from the switching tests is Zc = 14.2879 + j32.1050Ωfor the customer side and Zu = -0.3632 + j1.8328Ω for the utility side. Both impedances,Zu and Zc are inductive. Therefore, the voltage indices at the utility, |Vu| and at thePCC, |VPCC| are used to determine the harmonic source location. Results calculatedfor voltage magnitudes, |Vu| and |VPCC| for the third harmonic are listed in Table 3.The table also presents the results obtained using the CI method based on Equation(13) for a case when both impedances, Zu and Zc are inductive.
From Table 3, it is shown that the current from utility, |Iu| is within the range of0.48 – 0.74 kA. From the table, the harmonic impedance at the utility side is within1.88 – 2.98Ω and the harmonic voltage at the utility side, |Vu| is within 1.40 – 1.44 kV.These values are higher than the values of harmonic voltage measured at the PCC,|VPCC| which is 1.33 kV, thus satisfying the condition |Vu| > |VPCC|, and thereforeindicating that harmonic current is from the utility side. In Table 3, The CI indices arecalculated based on the measurement at the utility side. The CI method reveals thatfor Test 5-7, |Zu| > ZcrVu in which according to the method [10], this statement satisfiesthe condition that harmonic is from the opposite site of the measuring point, which isthe customer which contradict to the actual case. Thus, from the table, only resultfrom Test 8 correctly locate the harmonic source that is at the utility side, when |Zu|< ZcrVu with the CI method. Therefore, results obtained from the Voltage Indicesmethod are a better indicator than the Critical Impedance method.
Table 3 Results of voltage indices and critical impedance indicators for harmonic from utility
Voltage indices method Critical impedancemethod
Test |Iu| |Zu| |Vu| |VPCC| Voltage index ZcrVu CI indicator(kA) (ΩΩΩΩΩ) (kV) (kV)
5 0.64 2.22 1.42 1.33 |Vu|>|VPCC| -70.42 |Zu|>ZcrVu6 0.48 2.98 1.44 1.33 |Vu|>|VPCC| -62.38 |Zu|>ZcrVu7 0.74 1.88 1.40 1.33 |Vu|>|VPCC| -50.11 |Zu|>ZcrVu8 0.56 2.49 1.41 1.33 |Vu|>|VPCC| 67.54 |Zu|<ZcrVu
JTDIS43D[02].pmd 02/15/2007, 16:1824
IDENTIFICATION OF HARMONIC SOURCE AT THE POINT OF COMMON COUPLING 25
(b) Harmonic source from customer side
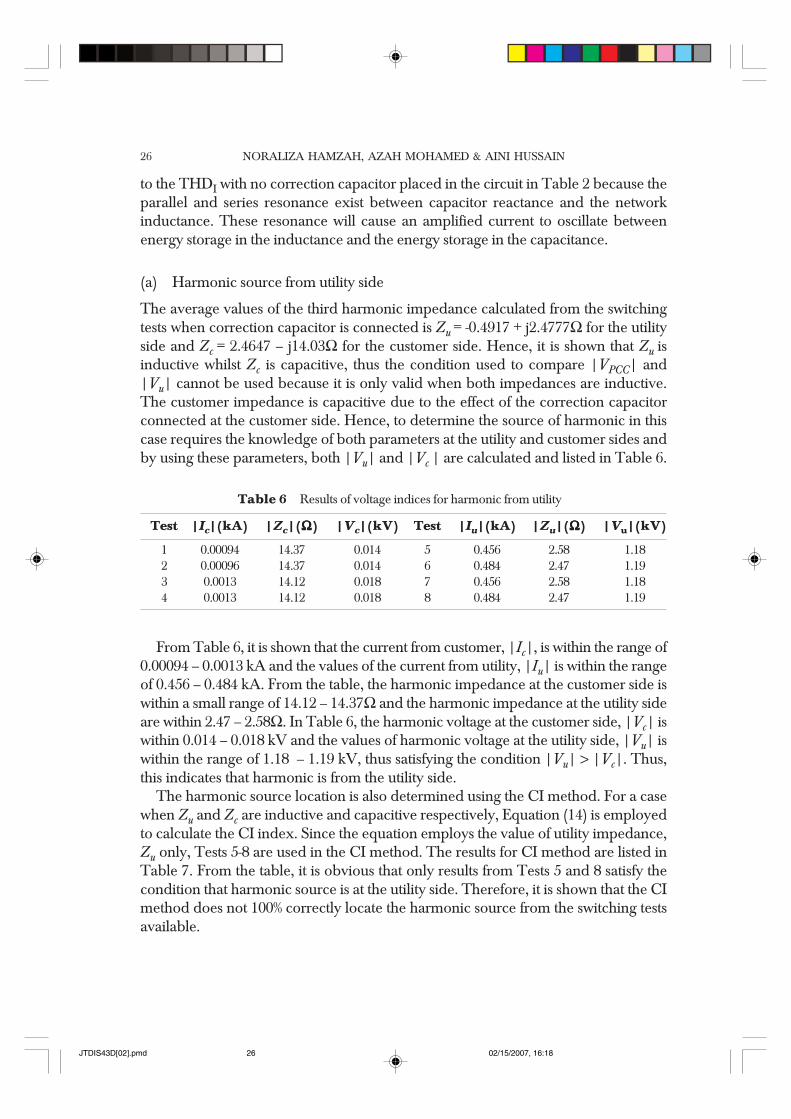
Harmonic generated from ASD models are injected at bus 5 of the test system tosimulate harmonics from the customer side. The average values of the fifth harmonicimpedance calculated from the switching tests when no correction capacitor connectedis Zu = 1.9846 + j2.8995Ω for the utility side and Zc = 14.7926 + j52.8502Ω for thecustomer side. Both Zu and Zc are inductive. Results calculated for voltage magnitudeVu for the fifth harmonic are listed in Table 4. Table 4 also present the results obtainedusing the CI method based on Equation (13) for a case when both impedances, Zuand Zc are inductive.
From Table 4, it is obviously shown that the current from utility, |Iu| is within therange of 0.0006 – 0.0098 kA and the harmonic impedance at the utility side is within2.35 – 3.8Ω. In the table, the harmonic voltage at the utility side, |Vu| is within 0.0002– 0.037 kV. These values are lower than the voltage measured at the PCC, |VPCC|which is 0.091 kV, thus satisfying the condition that |Vu| < |VPCC|, which indicatethat harmonic current is from the customer side. The CI method reveals that for Test5-8, |Zu| > ZcrVu in which according to method [10], this statement satisfies the conditionthat harmonic is from the opposite side, which is the customer.
Table 4 Results of voltage indices and critical impedance indicators for harmonic from customer
Voltage indices method Critical impedancemethod
Test |Iu| |Zu| |Vu| |VPCC| Voltage index ZcrVu CI indicator(kA) (ΩΩΩΩΩ) (kV) (kV)
5 0.0098 3.8 0.037 0.091 |Vu|<|VPCC| -5.30 |Zu|>ZcrVu6 0.0098 2.35 0.023 0.091 |Vu|<|VPCC| -4.86 |Zu|>ZcrVu7 0.0006 2.76 0.0002 0.091 |Vu|<|VPCC| -3.00 |Zu|>ZcrVu8 0.0006 2.76 0.0002 0.091 |Vu|<|VPCC| -3.05 |Zu|>ZcrVu
4.1.2 Harmonic Source with Correction Capacitor Connected
In this section, simulations results are presented when a correction capacitor isconnected at bus 3 of the test system. The THDI when the correction capacitor ispresent in the circuit is shown in Table 5. From the table, the THDI at the utility andcustomer are noted to be 111% and 35%, respectively. These values are higher compared
Table 5 THDI with correction capacitor connected
Harmonic source THDI(%)
From utility 111From customer 35
JTDIS43D[02].pmd 02/15/2007, 16:1825
NORALIZA HAMZAH, AZAH MOHAMED & AINI HUSSAIN26
to the THDI with no correction capacitor placed in the circuit in Table 2 because theparallel and series resonance exist between capacitor reactance and the networkinductance. These resonance will cause an amplified current to oscillate betweenenergy storage in the inductance and the energy storage in the capacitance.
(a) Harmonic source from utility side
The average values of the third harmonic impedance calculated from the switchingtests when correction capacitor is connected is Zu = -0.4917 + j2.4777Ω for the utilityside and Zc = 2.4647 – j14.03Ω for the customer side. Hence, it is shown that Zu isinductive whilst Zc is capacitive, thus the condition used to compare |VPCC| and|Vu| cannot be used because it is only valid when both impedances are inductive.The customer impedance is capacitive due to the effect of the correction capacitorconnected at the customer side. Hence, to determine the source of harmonic in thiscase requires the knowledge of both parameters at the utility and customer sides andby using these parameters, both |Vu| and |Vc | are calculated and listed in Table 6.
Table 6 Results of voltage indices for harmonic from utility
Test |Ic|(kA) |Zc|(ΩΩΩΩΩ) |Vc|(kV) Test |Iu|(kA) |Zu|(ΩΩΩΩΩ) |Vu|(kV)
1 0.00094 14.37 0.014 5 0.456 2.58 1.182 0.00096 14.37 0.014 6 0.484 2.47 1.193 0.0013 14.12 0.018 7 0.456 2.58 1.184 0.0013 14.12 0.018 8 0.484 2.47 1.19
From Table 6, it is shown that the current from customer, |Ic|, is within the range of0.00094 – 0.0013 kA and the values of the current from utility, |Iu| is within the rangeof 0.456 – 0.484 kA. From the table, the harmonic impedance at the customer side iswithin a small range of 14.12 – 14.37Ω and the harmonic impedance at the utility sideare within 2.47 – 2.58Ω. In Table 6, the harmonic voltage at the customer side, |Vc| iswithin 0.014 – 0.018 kV and the values of harmonic voltage at the utility side, |Vu| iswithin the range of 1.18 – 1.19 kV, thus satisfying the condition |Vu| > |Vc|. Thus,this indicates that harmonic is from the utility side.
The harmonic source location is also determined using the CI method. For a casewhen Zu and Zc are inductive and capacitive respectively, Equation (14) is employedto calculate the CI index. Since the equation employs the value of utility impedance,Zu only, Tests 5-8 are used in the CI method. The results for CI method are listed inTable 7. From the table, it is obvious that only results from Tests 5 and 8 satisfy thecondition that harmonic source is at the utility side. Therefore, it is shown that the CImethod does not 100% correctly locate the harmonic source from the switching testsavailable.
JTDIS43D[02].pmd 02/15/2007, 16:1826
IDENTIFICATION OF HARMONIC SOURCE AT THE POINT OF COMMON COUPLING 27
(b) Harmonic source from customer side
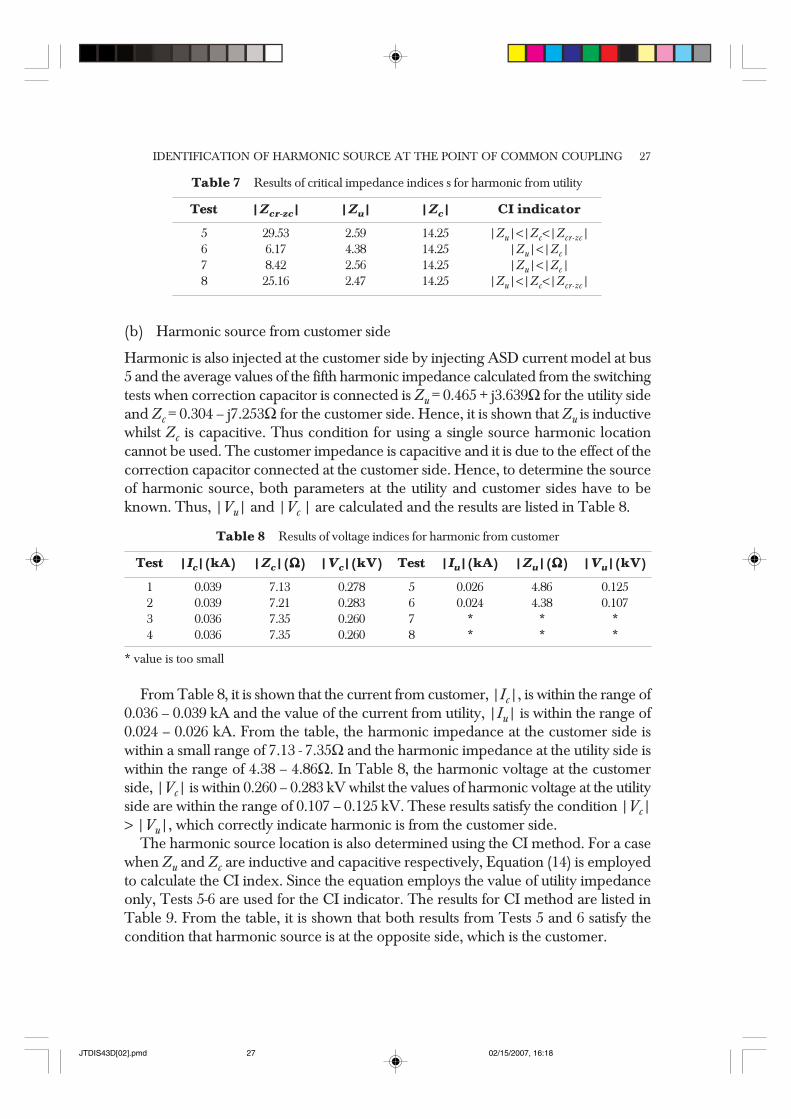
Harmonic is also injected at the customer side by injecting ASD current model at bus5 and the average values of the fifth harmonic impedance calculated from the switchingtests when correction capacitor is connected is Zu = 0.465 + j3.639Ω for the utility sideand Zc = 0.304 – j7.253Ω for the customer side. Hence, it is shown that Zu is inductivewhilst Zc is capacitive. Thus condition for using a single source harmonic locationcannot be used. The customer impedance is capacitive and it is due to the effect of thecorrection capacitor connected at the customer side. Hence, to determine the sourceof harmonic source, both parameters at the utility and customer sides have to beknown. Thus, |Vu| and |Vc | are calculated and the results are listed in Table 8.
Table 8 Results of voltage indices for harmonic from customer
Test |Ic|(kA) |Zc|(ΩΩΩΩΩ) |Vc|(kV) Test |Iu|(kA) |Zu|(ΩΩΩΩΩ) |Vu|(kV)
1 0.039 7.13 0.278 5 0.026 4.86 0.1252 0.039 7.21 0.283 6 0.024 4.38 0.1073 0.036 7.35 0.260 7 * * *4 0.036 7.35 0.260 8 * * *
* value is too small
Table 7 Results of critical impedance indices s for harmonic from utility
Test |Zcr-zc| |Zu| |Zc| CI indicator
5 29.53 2.59 14.25 |Zu|<|Zc<|Zcr-zc|6 6.17 4.38 14.25 |Zu|<|Zc|7 8.42 2.56 14.25 |Zu|<|Zc|8 25.16 2.47 14.25 |Zu|<|Zc<|Zcr-zc|
From Table 8, it is shown that the current from customer, |Ic|, is within the range of0.036 – 0.039 kA and the value of the current from utility, |Iu| is within the range of0.024 – 0.026 kA. From the table, the harmonic impedance at the customer side iswithin a small range of 7.13 - 7.35Ω and the harmonic impedance at the utility side iswithin the range of 4.38 – 4.86Ω. In Table 8, the harmonic voltage at the customerside, |Vc| is within 0.260 – 0.283 kV whilst the values of harmonic voltage at the utilityside are within the range of 0.107 – 0.125 kV. These results satisfy the condition |Vc|> |Vu|, which correctly indicate harmonic is from the customer side.
The harmonic source location is also determined using the CI method. For a casewhen Zu and Zc are inductive and capacitive respectively, Equation (14) is employedto calculate the CI index. Since the equation employs the value of utility impedanceonly, Tests 5-6 are used for the CI indicator. The results for CI method are listed inTable 9. From the table, it is shown that both results from Tests 5 and 6 satisfy thecondition that harmonic source is at the opposite side, which is the customer.
JTDIS43D[02].pmd 02/15/2007, 16:1827
NORALIZA HAMZAH, AZAH MOHAMED & AINI HUSSAIN28
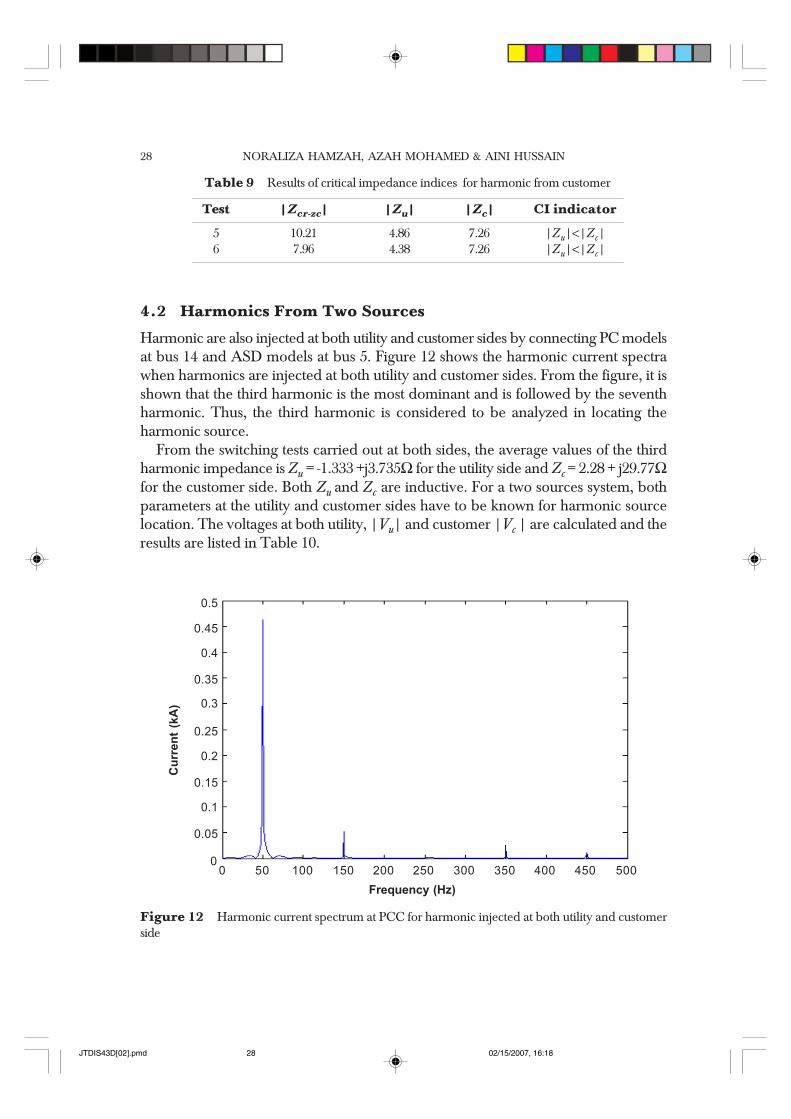
4.2 Harmonics From Two Sources
Harmonic are also injected at both utility and customer sides by connecting PC modelsat bus 14 and ASD models at bus 5. Figure 12 shows the harmonic current spectrawhen harmonics are injected at both utility and customer sides. From the figure, it isshown that the third harmonic is the most dominant and is followed by the seventhharmonic. Thus, the third harmonic is considered to be analyzed in locating theharmonic source.
From the switching tests carried out at both sides, the average values of the thirdharmonic impedance is Zu = -1.333 +j3.735Ω for the utility side and Zc = 2.28 + j29.77Ωfor the customer side. Both Zu and Zc are inductive. For a two sources system, bothparameters at the utility and customer sides have to be known for harmonic sourcelocation. The voltages at both utility, |Vu| and customer |Vc | are calculated and theresults are listed in Table 10.
Table 9 Results of critical impedance indices for harmonic from customer
Test |Zcr-zc| |Zu| |Zc| CI indicator
5 10.21 4.86 7.26 |Zu|<|Zc|6 7.96 4.38 7.26 |Zu|<|Zc|
Figure 12 Harmonic current spectrum at PCC for harmonic injected at both utility and customerside
0.35
0.4
0.45
0.5
Cu
rren
t (k
A)
0
0.05
0.1
0.15
0.2
0.25
0.3
Frequency (Hz)
0 50 100 150 200 250 300 350 400 450 500
JTDIS43D[02].pmd 02/15/2007, 16:1828
IDENTIFICATION OF HARMONIC SOURCE AT THE POINT OF COMMON COUPLING 29
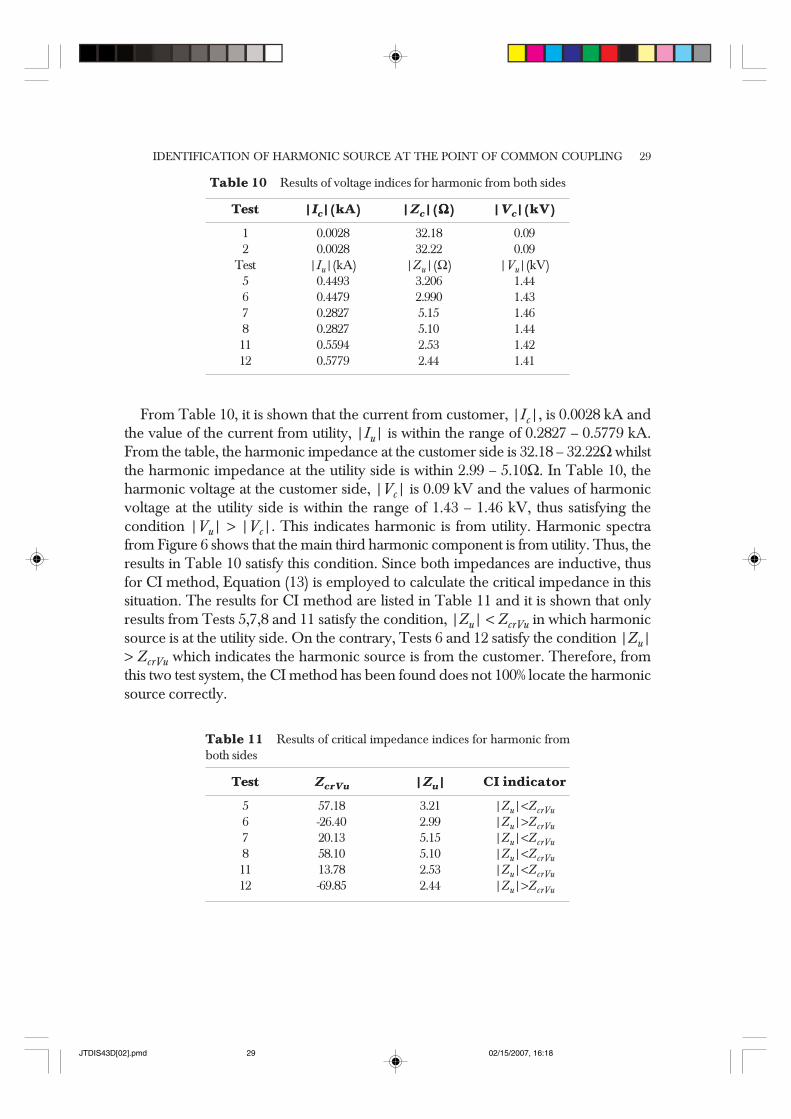
From Table 10, it is shown that the current from customer, |Ic|, is 0.0028 kA andthe value of the current from utility, |Iu| is within the range of 0.2827 – 0.5779 kA.From the table, the harmonic impedance at the customer side is 32.18 – 32.22Ω whilstthe harmonic impedance at the utility side is within 2.99 – 5.10Ω. In Table 10, theharmonic voltage at the customer side, |Vc| is 0.09 kV and the values of harmonicvoltage at the utility side is within the range of 1.43 – 1.46 kV, thus satisfying thecondition |Vu| > |Vc|. This indicates harmonic is from utility. Harmonic spectrafrom Figure 6 shows that the main third harmonic component is from utility. Thus, theresults in Table 10 satisfy this condition. Since both impedances are inductive, thusfor CI method, Equation (13) is employed to calculate the critical impedance in thissituation. The results for CI method are listed in Table 11 and it is shown that onlyresults from Tests 5,7,8 and 11 satisfy the condition, |Zu| < ZcrVu in which harmonicsource is at the utility side. On the contrary, Tests 6 and 12 satisfy the condition |Zu|> ZcrVu which indicates the harmonic source is from the customer. Therefore, fromthis two test system, the CI method has been found does not 100% locate the harmonicsource correctly.
Table 10 Results of voltage indices for harmonic from both sides
Test |Ic|(kA) |Zc|(ΩΩΩΩΩ) |Vc|(kV)
1 0.0028 32.18 0.092 0.0028 32.22 0.09
Test |Iu|(kA) |Zu|(Ω) |Vu|(kV)5 0.4493 3.206 1.446 0.4479 2.990 1.437 0.2827 5.15 1.468 0.2827 5.10 1.4411 0.5594 2.53 1.4212 0.5779 2.44 1.41
Table 11 Results of critical impedance indices for harmonic fromboth sides
Test ZcrVu |Zu| CI indicator
5 57.18 3.21 |Zu|<ZcrVu6 -26.40 2.99 |Zu|>ZcrVu7 20.13 5.15 |Zu|<ZcrVu8 58.10 5.10 |Zu|<ZcrVu11 13.78 2.53 |Zu|<ZcrVu12 -69.85 2.44 |Zu|>ZcrVu
JTDIS43D[02].pmd 02/15/2007, 16:1829
NORALIZA HAMZAH, AZAH MOHAMED & AINI HUSSAIN30
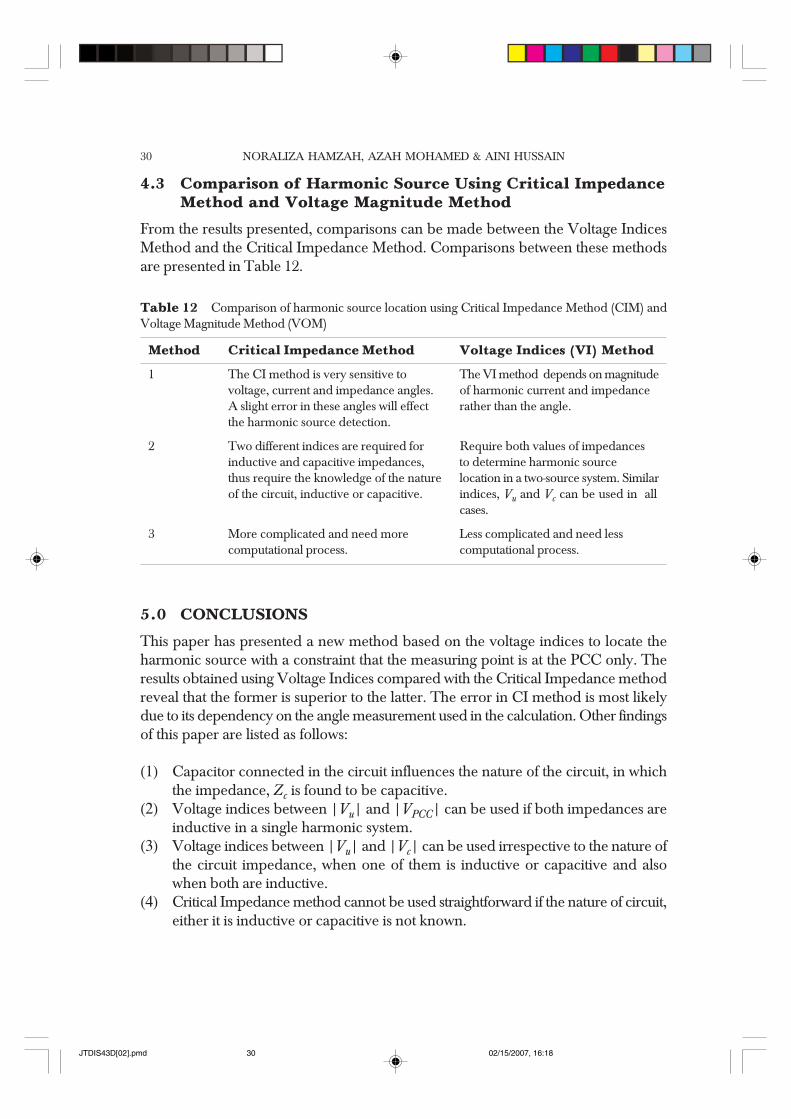
4.3 Comparison of Harmonic Source Using Critical ImpedanceMethod and Voltage Magnitude Method
From the results presented, comparisons can be made between the Voltage IndicesMethod and the Critical Impedance Method. Comparisons between these methodsare presented in Table 12.
5.0 CONCLUSIONS
This paper has presented a new method based on the voltage indices to locate theharmonic source with a constraint that the measuring point is at the PCC only. Theresults obtained using Voltage Indices compared with the Critical Impedance methodreveal that the former is superior to the latter. The error in CI method is most likelydue to its dependency on the angle measurement used in the calculation. Other findingsof this paper are listed as follows:
(1) Capacitor connected in the circuit influences the nature of the circuit, in whichthe impedance, Zc is found to be capacitive.
(2) Voltage indices between |Vu| and |VPCC| can be used if both impedances areinductive in a single harmonic system.
(3) Voltage indices between |Vu| and |Vc| can be used irrespective to the nature ofthe circuit impedance, when one of them is inductive or capacitive and alsowhen both are inductive.
(4) Critical Impedance method cannot be used straightforward if the nature of circuit,either it is inductive or capacitive is not known.
Table 12 Comparison of harmonic source location using Critical Impedance Method (CIM) andVoltage Magnitude Method (VOM)
Method Critical Impedance Method Voltage Indices (VI) Method
1 The CI method is very sensitive to The VI method depends on magnitudevoltage, current and impedance angles. of harmonic current and impedanceA slight error in these angles will effect rather than the angle.the harmonic source detection.
2 Two different indices are required for Require both values of impedancesinductive and capacitive impedances, to determine harmonic sourcethus require the knowledge of the nature location in a two-source system. Similarof the circuit, inductive or capacitive. indices, Vu and Vc can be used in all
cases.
3 More complicated and need more Less complicated and need lesscomputational process. computational process.
JTDIS43D[02].pmd 02/15/2007, 16:1830
IDENTIFICATION OF HARMONIC SOURCE AT THE POINT OF COMMON COUPLING 31
(5) A single-phase-based method for impedance calculation in [14] has been provento be acceptable to be used when no significant imbalanced is found among thethree phases.
ACKNOWLEDGEMENTS
The authors gratefully acknowledge the Universiti Teknologi MARA for the financialsupport in terms of scholarship and Universiti Kebangsaan Malaysia (IRPA code 02-02-0014-EA188) for the financial support on the project.
REFERENCES[1] Heydt, G. T. 1989. Identification of Harmonic Sources by a State Estimation Technique. IEEE Trans.Power
Delivery. 4: 569–576.[2] Teshome, A. 1991. Harmonic Source and Type Identification in a Radial Distribution System. IEEE 1991
Industry Applications Society Annual Meeting. Dearboran, Michigan. Paper No.32025.[3] Islam, K. M. S., and A. H. Samra. 1997. Identification of Harmonic Sources in Power Distribution Systems.
Proc. IEEE Engineering New Century, South Eastcon. 301-303.[4] Xu, W., and Y. Liu. 2000. A Method for Determining Customer and Utility Harmonic Contributions at the
Point of Common Coupling. IEEE Trans. Power Delivery. 15: 804-811.[5] Xu, W. X. Liu, and Y. Liu. 2003. An Investigation on the Validity of Power-direction Method for Harmonic
Source Detection. IEEE Trans. Power Delivery. 18:214-218.[6] Tsukamoto, M., I. Kouda, Y. Natsuda, Y. Minowa, and S. Nishimura. 1998. Advanced Method to Identify
Harmonics Characteristic Between Utility Grid and Harmonic Current Sources. 8th Int. Conference onHarmonic and Quality of Power. 419-425.
[7] Tsukamoto, M., S. Ogawa, Y. Natsuda, Y. Minowa, and S. Nishimura, 2000. Advanced Technology toIdentify Harmonics Characteristics and Results of Measuring. Nineth Proc. Harmonics and Quality of Power.1:341-346.
[8] Robert, A., and T. Deflandre. 1997. Guide for Assessing the Network Harmonic Impedance CIRED 97.Conf. Publication No. 438: 2.3.1-2.3.10.
[9] Li, C., and W. Xu. 2002. On Defining Harmonic Contributions at the Point of Common Coupling. IEEEPower Engineering Review. 45-46.
[10] Chen, C., X. Liu, W. Xu, and T. Tayjansanant. 2004. Critical Impedance Method-A New DetectingHarmonic Sources Method in Distribution Systems. IEEE Trans. Power Delivery. 19: 288-296.
[11] Dugan, R. C., M. F. McGranaghan, S. Santoso, and H. W. Beaty. 2002. Electrical Power Systems Quality. 2nd
Edn. Mc Graw Hill.[12] Thunberg, E., and L. Soder. 1999. A Norton Approach to Distribution Network Modeling for Harmonic
Studies. IEEE Trans. Power Delivery. 14: 272-277.[13] Xu, W., E. E. Ahmed, X. Zhang, and X. Liu. 2002. Measurement of Network Harmonic Impedances:
Practical Implementation Issues and Their Solutions. IEEE Trans. Power Delivery. 17: 210-216.[14] Gonbeau, O., L. Berthet, J. L. Javerzac, and D. Boudou. 2003. Method to Determine the Contribution of the
Customer and the Power System to the Harmonic Disturbance. 17th International Conference on ElectricityDistribution (CIRED).
JTDIS43D[02].pmd 02/15/2007, 16:1831