Identification of candidate markers associated with agronomic traits in rice using discriminant...
9
ORIGINAL PAPER N. Zhang Y. Xu M. Akash S. McCouch J. H. Oard Identification of candidate markers associated with agronomic traits in rice using discriminant analysis Received: 19 July 2004 / Accepted: 1 December 2004 / Published online: 28 January 2005 Ó Springer-Verlag 2005 Abstract Plant genetic mapping strategies routinely uti- lize marker genotype frequencies obtained from progeny of controlled crosses to declare presence of a quantita- tive trait locus (QTL) on previously constructed linkage maps. We have evaluated the potential of discriminant analysis (DA), a multivariate statistical procedure, to detect candidate markers associated with agronomic traits among inbred lines of rice (Oryza sativa L.). A total of 218 lines originating from the US and Asia were planted in field plots near Alvin, Texas, in 1996 and 1997. Agronomic data were collected for 12 economi- cally important traits, and DNA profiles of each inbred line were produced using 60 SSR and 114 RFLP markers. Model-based methods revealed population structure among the lines. Marker alleles associated with all traits were identified by DA at high levels of correct percent classification within subpopulations and across all lines. Associated marker alleles pointed to the same and different regions on the rice genetic map when compared to previous QTL mapping experiments. Re- sults from this study suggest that candidate markers associated with agronomic traits can be readily detected among inbred lines of rice using DA combined with other methods described in this report. Keywords Association genetic mapping Discriminant analysis Marker-assisted selection Oryza sativa Quantitative trait locus Introduction Marker-assisted selection has been proposed as a com- plementary tool in plant improvement when reliable phenotyping and selection of complex traits is difficult or inefficient (Xu et al. 2002; Morgante and Salamini 2003). The initial task in this process typically requires screening potential parents for polymorphic molecular markers and the subsequent production of segregating or recombinant inbred populations. Loci or intervals are then defined on pre-existing genetic maps that are linked with a trait of interest by single-factor ANOVA (Jermstad et al. 2003), regression (Wang et al. 2004), interval (Lincoln et al. 1992), or other standard mapping procedures. For complex quantitative traits, ‡300 recombinant inbred lines are generally evaluated, which require 3 to 4 years to develop. Moreover, relatively few meiotic events in F 2 or recombinant inbred lines limit the power of linkage analysis to dissect traits governed by multiple loci, and examination of genetic diversity in diploids is restricted to only two alleles segregating per locus (Flint-Garcia et al. 2003). Production of large segregating or intermating populations can promote recombination, but substantial investments in time, la- bor, and financial resources over multiple generations are required. Association or linkage disequilibrium (LD) map- ping, based on pairwise comparisons between observed and expected haplotype frequencies, has been used extensively in human studies (Cardon and Abecasis Communicated by F. Salaminni N. Zhang and Y. Xu contributed equally to work and considered as first authors. Approved for publication by the Director of the Louisiana Agricultural Experiment Station as paper no. 04-14-0335. N. Zhang J. H. Oard (&) Department of Agronomy and Environmental Management, LSU AgCenter, Louisiana State University, Baton Rouge, LA 70803, USA E-mail: [email protected] Tel.: +1-225-5781301 Fax: +1-225-5781403 Y. Xu S. McCouch Department of Plant Breeding, Cornell University, Ithaca, NY 14853, USA M. Akash Department of Agronomy, Iowa State University, 2101 Agronomy Hall, Ames, IA 50011, USA Theor Appl Genet (2005) 110: 721–729 DOI 10.1007/s00122-004-1898-z
-
Upload
independent -
Category
Documents
-
view
0 -
download
0
Transcript of Identification of candidate markers associated with agronomic traits in rice using discriminant...

ORIGINAL PAPER
N. Zhang Æ Y. Xu Æ M. Akash Æ S. McCouch
J. H. Oard
Identification of candidate markers associated with agronomic traitsin rice using discriminant analysis
Received: 19 July 2004 / Accepted: 1 December 2004 / Published online: 28 January 2005� Springer-Verlag 2005
Abstract Plant genetic mapping strategies routinely uti-lize marker genotype frequencies obtained from progenyof controlled crosses to declare presence of a quantita-tive trait locus (QTL) on previously constructed linkagemaps. We have evaluated the potential of discriminantanalysis (DA), a multivariate statistical procedure, todetect candidate markers associated with agronomictraits among inbred lines of rice (Oryza sativa L.). Atotal of 218 lines originating from the US and Asia wereplanted in field plots near Alvin, Texas, in 1996 and1997. Agronomic data were collected for 12 economi-cally important traits, and DNA profiles of each inbredline were produced using 60 SSR and 114 RFLPmarkers. Model-based methods revealed populationstructure among the lines. Marker alleles associated withall traits were identified by DA at high levels of correctpercent classification within subpopulations and acrossall lines. Associated marker alleles pointed to the sameand different regions on the rice genetic map whencompared to previous QTL mapping experiments. Re-
sults from this study suggest that candidate markersassociated with agronomic traits can be readily detectedamong inbred lines of rice using DA combined withother methods described in this report.
Keywords Association genetic mapping Æ Discriminantanalysis Æ Marker-assisted selection Æ Oryza sativa ÆQuantitative trait locus
Introduction
Marker-assisted selection has been proposed as a com-plementary tool in plant improvement when reliablephenotyping and selection of complex traits is difficult orinefficient (Xu et al. 2002; Morgante and Salamini 2003).The initial task in this process typically requiresscreening potential parents for polymorphic molecularmarkers and the subsequent production of segregatingor recombinant inbred populations. Loci or intervals arethen defined on pre-existing genetic maps that are linkedwith a trait of interest by single-factor ANOVA(Jermstad et al. 2003), regression (Wang et al. 2004),interval (Lincoln et al. 1992), or other standard mappingprocedures. For complex quantitative traits, ‡300recombinant inbred lines are generally evaluated, whichrequire 3 to 4 years to develop. Moreover, relatively fewmeiotic events in F2 or recombinant inbred lines limit thepower of linkage analysis to dissect traits governed bymultiple loci, and examination of genetic diversity indiploids is restricted to only two alleles segregating perlocus (Flint-Garcia et al. 2003). Production of largesegregating or intermating populations can promoterecombination, but substantial investments in time, la-bor, and financial resources over multiple generationsare required.
Association or linkage disequilibrium (LD) map-ping, based on pairwise comparisons between observedand expected haplotype frequencies, has been usedextensively in human studies (Cardon and Abecasis
Communicated by F. Salaminni
N. Zhang and Y. Xu contributed equally to work and considered asfirst authors.
Approved for publication by the Director of the LouisianaAgricultural Experiment Station as paper no. 04-14-0335.
N. Zhang Æ J. H. Oard (&)Department of Agronomy and Environmental Management,LSU AgCenter, Louisiana State University,Baton Rouge, LA 70803, USAE-mail: [email protected].: +1-225-5781301Fax: +1-225-5781403
Y. Xu Æ S. McCouchDepartment of Plant Breeding, Cornell University,Ithaca, NY 14853, USA
M. AkashDepartment of Agronomy, Iowa State University,2101 Agronomy Hall, Ames, IA 50011, USA
Theor Appl Genet (2005) 110: 721–729DOI 10.1007/s00122-004-1898-z
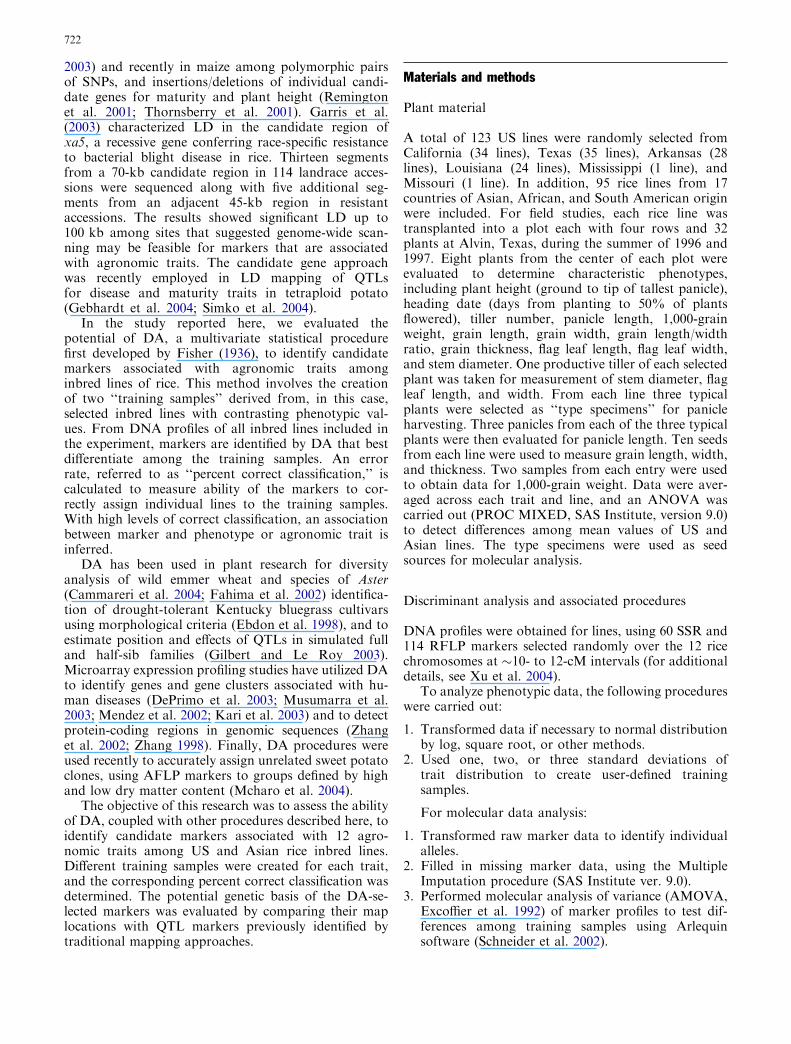
2003) and recently in maize among polymorphic pairsof SNPs, and insertions/deletions of individual candi-date genes for maturity and plant height (Remingtonet al. 2001; Thornsberry et al. 2001). Garris et al.(2003) characterized LD in the candidate region ofxa5, a recessive gene conferring race-specific resistanceto bacterial blight disease in rice. Thirteen segmentsfrom a 70-kb candidate region in 114 landrace acces-sions were sequenced along with five additional seg-ments from an adjacent 45-kb region in resistantaccessions. The results showed significant LD up to100 kb among sites that suggested genome-wide scan-ning may be feasible for markers that are associatedwith agronomic traits. The candidate gene approachwas recently employed in LD mapping of QTLsfor disease and maturity traits in tetraploid potato(Gebhardt et al. 2004; Simko et al. 2004).
In the study reported here, we evaluated thepotential of DA, a multivariate statistical procedurefirst developed by Fisher (1936), to identify candidatemarkers associated with agronomic traits amonginbred lines of rice. This method involves the creationof two ‘‘training samples’’ derived from, in this case,selected inbred lines with contrasting phenotypic val-ues. From DNA profiles of all inbred lines included inthe experiment, markers are identified by DA that bestdifferentiate among the training samples. An errorrate, referred to as ‘‘percent correct classification,’’ iscalculated to measure ability of the markers to cor-rectly assign individual lines to the training samples.With high levels of correct classification, an associationbetween marker and phenotype or agronomic trait isinferred.
DA has been used in plant research for diversityanalysis of wild emmer wheat and species of Aster(Cammareri et al. 2004; Fahima et al. 2002) identifica-tion of drought-tolerant Kentucky bluegrass cultivarsusing morphological criteria (Ebdon et al. 1998), and toestimate position and effects of QTLs in simulated fulland half-sib families (Gilbert and Le Roy 2003).Microarray expression profiling studies have utilized DAto identify genes and gene clusters associated with hu-man diseases (DePrimo et al. 2003; Musumarra et al.2003; Mendez et al. 2002; Kari et al. 2003) and to detectprotein-coding regions in genomic sequences (Zhanget al. 2002; Zhang 1998). Finally, DA procedures wereused recently to accurately assign unrelated sweet potatoclones, using AFLP markers to groups defined by highand low dry matter content (Mcharo et al. 2004).
The objective of this research was to assess the abilityof DA, coupled with other procedures described here, toidentify candidate markers associated with 12 agro-nomic traits among US and Asian rice inbred lines.Different training samples were created for each trait,and the corresponding percent correct classification wasdetermined. The potential genetic basis of the DA-se-lected markers was evaluated by comparing their maplocations with QTL markers previously identified bytraditional mapping approaches.
Materials and methods
Plant material
A total of 123 US lines were randomly selected fromCalifornia (34 lines), Texas (35 lines), Arkansas (28lines), Louisiana (24 lines), Mississippi (1 line), andMissouri (1 line). In addition, 95 rice lines from 17countries of Asian, African, and South American originwere included. For field studies, each rice line wastransplanted into a plot each with four rows and 32plants at Alvin, Texas, during the summer of 1996 and1997. Eight plants from the center of each plot wereevaluated to determine characteristic phenotypes,including plant height (ground to tip of tallest panicle),heading date (days from planting to 50% of plantsflowered), tiller number, panicle length, 1,000-grainweight, grain length, grain width, grain length/widthratio, grain thickness, flag leaf length, flag leaf width,and stem diameter. One productive tiller of each selectedplant was taken for measurement of stem diameter, flagleaf length, and width. From each line three typicalplants were selected as ‘‘type specimens’’ for panicleharvesting. Three panicles from each of the three typicalplants were then evaluated for panicle length. Ten seedsfrom each line were used to measure grain length, width,and thickness. Two samples from each entry were usedto obtain data for 1,000-grain weight. Data were aver-aged across each trait and line, and an ANOVA wascarried out (PROC MIXED, SAS Institute, version 9.0)to detect differences among mean values of US andAsian lines. The type specimens were used as seedsources for molecular analysis.
Discriminant analysis and associated procedures
DNA profiles were obtained for lines, using 60 SSR and114 RFLP markers selected randomly over the 12 ricechromosomes at �10- to 12-cM intervals (for additionaldetails, see Xu et al. 2004).
To analyze phenotypic data, the following procedureswere carried out:
1. Transformed data if necessary to normal distributionby log, square root, or other methods.
2. Used one, two, or three standard deviations oftrait distribution to create user-defined trainingsamples.
For molecular data analysis:
1. Transformed raw marker data to identify individualalleles.
2. Filled in missing marker data, using the MultipleImputation procedure (SAS Institute ver. 9.0).
3. Performed molecular analysis of variance (AMOVA,Excoffier et al. 1992) of marker profiles to test dif-ferences among training samples using Arlequinsoftware (Schneider et al. 2002).
722

4. Identified potential population structure by geneticdistance (http://www.powermarker.net) or model-based (http://www.stats.ox.ac.uk/�pritch/home.html) method.
5. Performed parametric discriminant analysis (PROCSTEPDISC, SAS Institute ver. 9.0, forward method,select up to 15 alleles, minimum criteria set with de-fault SLENTRY=0.15) to identify marker(s) thatbest differentiate training samples within each sub-population.
6. Used nonparametric method within the DISCRIMprocedure (SAS Institute ver. 9.0) to perform k-nearest-neighbor classification of inbred lines intopre-defined groups.
7. Calculated percent correct classification with cross-validate option within the PROC DISCRIM proce-dure (SAS Institute ver. 9.0).
SSR and RFLP markers were located on theRice–Cornell SSR 2001-1 and /or Rice–Cornell RFLP2001–2002 genetic maps (http://www.gramene.org).Polymorphism information content (PIC) and genediversity index (GDI) values were calculated using thePowerMarker program (http://www.powermarker.net).Linear correlations among traits were obtained usingPROC CORR (SAS Institute ver. 9.0).
Results and discussion
The US and Asian lines exhibited a wide range of phe-notypic diversity for all 12 traits measured under Texasfield-plot conditions (Table 1). Mean values for flag leafwidth, panicle length, and 1,000-grain weight were notsignificantly different between US and Asian lines. TheUS material produced greater grain length and grainlength/width ratio than the Asian germplasm, whileplant height, heading date, flag leaf length, tiller number,stem diameter, grain width, and grain thickness showedgreater mean values in Asian versus US lines. Headingdate was weakly to moderately correlated with plantheight, stem diameter, and flag leaf length (r=0.38, 0.31,and 0.36, respectively, P<0.001 for all). Plant heightwas moderately correlated with panicle length, stemdiameter, and flag leaf length (r=0.58, 0.61, and 0.51,P<0.001 for all). While productive tiller number wasnot correlated with any character, 1,000-grain weight asa component of grain yield was associated with grainwidth and thickness (r=0.61 and 0.66, P<0.001 forboth). The high level of trait diversity across the US andAsian germplasm was reflected in high levels of mole-cular variation, with 1,153 alleles detected across the 60SSR and 114 RFLP sampled loci. When all lines werecombined, the average number of alleles per locus, allelefrequencies, and PIC values were similar to those pre-viously reported by Xu et al. (2004). Greater diversity inthe Asian versus US material was observed in all com-parisons. For example, the mean PIC value for Asianlines was greater (0.499, range 0–0.913) than the US
germplasm (0.269, range 0–0.882), and the mean numberof Asian alleles per locus of 6.3 (range 1–29) was greaterthan the US accessions with a mean of 4.20 and a rangeof 1–25. The 12 monomorphic loci observed across allUS and Asian lines (RZ386, CDO328, CDO524, RZ69,CDO244, RZ495, CDO89, RZ593, CDO544, CDO412,RZ900, and CDO1338) were produced using cDNAprobes during the RFLP analysis. The markersCDO118, CDO395, CDO962, RZ2, RZ14, RZ87,RZ103A, RZ166, RZ499, RZ599, RZ783, and RZ836were monomorphic in the Asian lines, but not in the USor combined material. The number of detected USmonomorphic loci was the same as the combined anal-ysis plus six additional markers (BCD349, CDO36,CDO127A, CDO686, RZ141A, and RZ141B). Popula-tion structure analysis revealed three subpopulations,where subpopulation 1 consisted of 159 individuals, ofwhich 136 (86%) were classified as japonica lines, and117 (74%) were US lines. Subpopulations 2 and 3 werecomposed of 16 and 43 individuals, respectively, with6/16 (37%) and 11/43 (25%) classified as japonicaaccessions and 3/16 (19%) and 3/43 (7%), respectively,were of US origin. The remaining individuals wereclassified as indica accessions. The range of phenotypicvalues overlapped for all traits among the three sub-populations (data not shown) as well as the US, Asian,and combined lines (Table 1). Mean values across sub-populations were similar for most traits except for thegrain measurements, where subpopulation 1 producedgreater grain length, width, and weight values than thoseof subpopulation 2 and 3. GDI values of 0.29, 0.50, and0.34 were observed for the three respective subpopula-tions, indicating that population 2, which is the smallest,is also the most diverse. A similar trend in mean PICvalues for subpopulations 1, 2, and 3 showed moderatevalues of 0.26, 0.46, and 0.31, respectively, that brack-eted the PIC value for the 236 US and Asian lines re-ported by Xu at al. (2004). Mean frequencies across allalleles within each subpopulation were nearly identicalwith each other (0.22, 0.24, and 0.26), but when the USmaterial was compared with the Asian material, themean frequency of alleles in the combined US group(0.24) was larger than in the Asian (0.16) or in thecombined dataset (0.15). Overall, these results suggestthat the extent of phenotypic and molecular diversity ofeach of the subpopulations was comparable to all linescombined, but that the Asian material was considerablymore diverse that the US accessions.
Table 2 shows that the DA procedure correctlyclassified the rice lines into early or late heading groups,using 5–10 markers. For the remaining traits, 86–100%correct classification was obtained with 1–15 markers,using the 1 standard deviation (SD), 2SD, or 3SDtraining samples. Accuracy did increase in all cases, withincreasing numbers of markers used within each definedgroup or training sample. Population structure appearedto have little impact on accuracy of classification forheading date (Table 2), most likely due to similar char-acteristics among subpopulations and combined lines
723
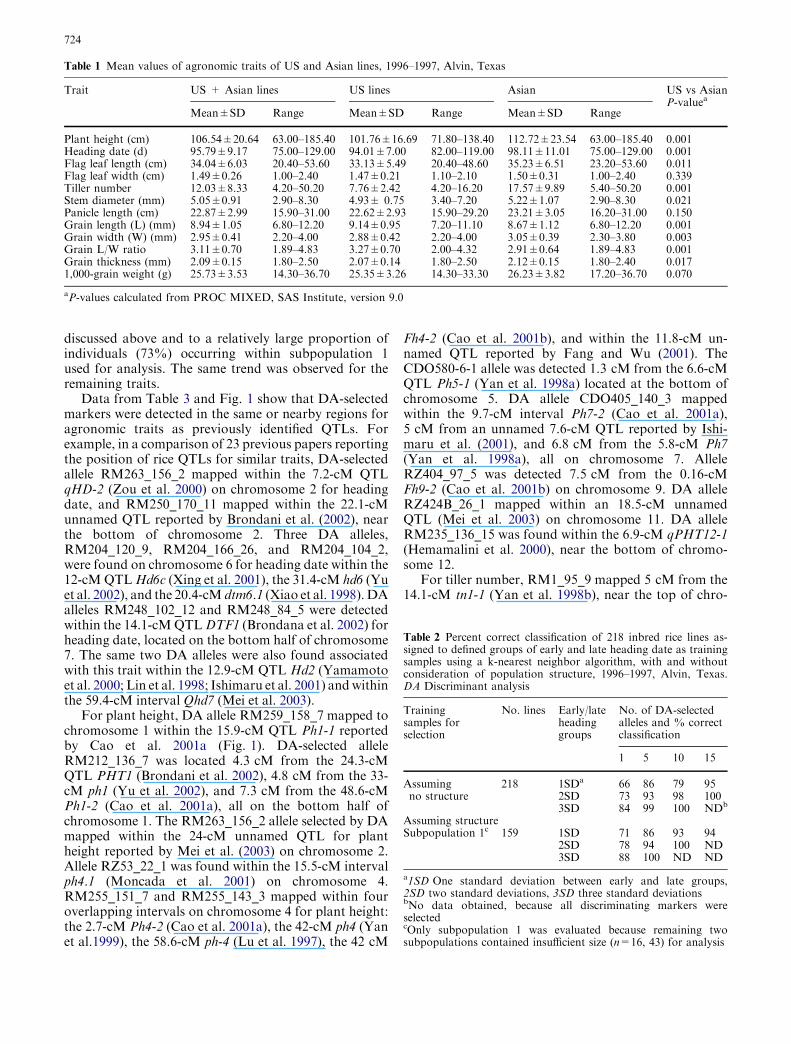
discussed above and to a relatively large proportion ofindividuals (73%) occurring within subpopulation 1used for analysis. The same trend was observed for theremaining traits.
Data from Table 3 and Fig. 1 show that DA-selectedmarkers were detected in the same or nearby regions foragronomic traits as previously identified QTLs. Forexample, in a comparison of 23 previous papers reportingthe position of rice QTLs for similar traits, DA-selectedallele RM263_156_2 mapped within the 7.2-cM QTLqHD-2 (Zou et al. 2000) on chromosome 2 for headingdate, and RM250_170_11 mapped within the 22.1-cMunnamed QTL reported by Brondani et al. (2002), nearthe bottom of chromosome 2. Three DA alleles,RM204_120_9, RM204_166_26, and RM204_104_2,were found on chromosome 6 for heading date within the12-cMQTLHd6c (Xing et al. 2001), the 31.4-cM hd6 (Yuet al. 2002), and the 20.4-cM dtm6.1 (Xiao et al. 1998).DAalleles RM248_102_12 and RM248_84_5 were detectedwithin the 14.1-cMQTLDTF1 (Brondana et al. 2002) forheading date, located on the bottom half of chromosome7. The same two DA alleles were also found associatedwith this trait within the 12.9-cM QTL Hd2 (Yamamotoet al. 2000; Lin et al. 1998; Ishimaru et al. 2001) andwithinthe 59.4-cM interval Qhd7 (Mei et al. 2003).
For plant height, DA allele RM259_158_7 mapped tochromosome 1 within the 15.9-cM QTL Ph1-1 reportedby Cao et al. 2001a (Fig. 1). DA-selected alleleRM212_136_7 was located 4.3 cM from the 24.3-cMQTL PHT1 (Brondani et al. 2002), 4.8 cM from the 33-cM ph1 (Yu et al. 2002), and 7.3 cM from the 48.6-cMPh1-2 (Cao et al. 2001a), all on the bottom half ofchromosome 1. The RM263_156_2 allele selected by DAmapped within the 24-cM unnamed QTL for plantheight reported by Mei et al. (2003) on chromosome 2.Allele RZ53_22_1 was found within the 15.5-cM intervalph4.1 (Moncada et al. 2001) on chromosome 4.RM255_151_7 and RM255_143_3 mapped within fouroverlapping intervals on chromosome 4 for plant height:the 2.7-cM Ph4-2 (Cao et al. 2001a), the 42-cM ph4 (Yanet al.1999), the 58.6-cM ph-4 (Lu et al. 1997), the 42 cM
Fh4-2 (Cao et al. 2001b), and within the 11.8-cM un-named QTL reported by Fang and Wu (2001). TheCDO580-6-1 allele was detected 1.3 cM from the 6.6-cMQTL Ph5-1 (Yan et al. 1998a) located at the bottom ofchromosome 5. DA allele CDO405_140_3 mappedwithin the 9.7-cM interval Ph7-2 (Cao et al. 2001a),5 cM from an unnamed 7.6-cM QTL reported by Ishi-maru et al. (2001), and 6.8 cM from the 5.8-cM Ph7(Yan et al. 1998a), all on chromosome 7. AlleleRZ404_97_5 was detected 7.5 cM from the 0.16-cMFh9-2 (Cao et al. 2001b) on chromosome 9. DA alleleRZ424B_26_1 mapped within an 18.5-cM unnamedQTL (Mei et al. 2003) on chromosome 11. DA alleleRM235_136_15 was found within the 6.9-cM qPHT12-1(Hemamalini et al. 2000), near the bottom of chromo-some 12.
For tiller number, RM1_95_9 mapped 5 cM from the14.1-cM tn1-1 (Yan et al. 1998b), near the top of chro-
Table 2 Percent correct classification of 218 inbred rice lines as-signed to defined groups of early and late heading date as trainingsamples using a k-nearest neighbor algorithm, with and withoutconsideration of population structure, 1996–1997, Alvin, Texas.DA Discriminant analysis
Trainingsamples forselection
No. lines Early/lateheadinggroups
No. of DA-selectedalleles and % correctclassification
1 5 10 15
Assumingno structure
218 1SDa 66 86 79 952SD 73 93 98 1003SD 84 99 100 NDb
Assuming structureSubpopulation 1c 159 1SD 71 86 93 94
2SD 78 94 100 ND3SD 88 100 ND ND
a1SD One standard deviation between early and late groups,2SD two standard deviations, 3SD three standard deviationsbNo data obtained, because all discriminating markers wereselectedcOnly subpopulation 1 was evaluated because remaining twosubpopulations contained insufficient size (n=16, 43) for analysis
Table 1 Mean values of agronomic traits of US and Asian lines, 1996–1997, Alvin, Texas
Trait US + Asian lines US lines Asian US vs AsianP-valuea
Mean±SD Range Mean±SD Range Mean±SD Range
Plant height (cm) 106.54±20.64 63.00–185.40 101.76±16.69 71.80–138.40 112.72±23.54 63.00–185.40 0.001Heading date (d) 95.79±9.17 75.00–129.00 94.01±7.00 82.00–119.00 98.11±11.01 75.00–129.00 0.001Flag leaf length (cm) 34.04±6.03 20.40–53.60 33.13±5.49 20.40–48.60 35.23±6.51 23.20–53.60 0.011Flag leaf width (cm) 1.49±0.26 1.00–2.40 1.47±0.21 1.10–2.10 1.50±0.31 1.00–2.40 0.339Tiller number 12.03±8.33 4.20–50.20 7.76±2.42 4.20–16.20 17.57±9.89 5.40–50.20 0.001Stem diameter (mm) 5.05±0.91 2.90–8.30 4.93± 0.75 3.40–7.20 5.22±1.07 2.90–8.30 0.021Panicle length (cm) 22.87±2.99 15.90–31.00 22.62±2.93 15.90–29.20 23.21±3.05 16.20–31.00 0.150Grain length (L) (mm) 8.94±1.05 6.80–12.20 9.14±0.95 7.20–11.10 8.67±1.12 6.80–12.20 0.001Grain width (W) (mm) 2.95±0.41 2.20–4.00 2.88±0.42 2.20–4.00 3.05±0.39 2.30–3.80 0.003Grain L/W ratio 3.11±0.70 1.89–4.83 3.27±0.70 2.00–4.32 2.91±0.64 1.89–4.83 0.001Grain thickness (mm) 2.09±0.15 1.80–2.50 2.07±0.14 1.80–2.50 2.12±0.15 1.80–2.40 0.0171,000-grain weight (g) 25.73±3.53 14.30–36.70 25.35±3.26 14.30–33.30 26.23±3.82 17.20–36.70 0.070
aP-values calculated from PROC MIXED, SAS Institute, version 9.0
724

Table
3SSR/R
FLPalleles
identified
byDA
from
1SD,2SD
and3SD
trainingsamplesamong218USandAsianrice
inbredlines
Trait
DA-selectedRFLP/SSR
alleles
producing86–100%
correctclassification
1SD
trainingsample
2SD
trainingsample
3SD
trainingsample
Plantheight(cm)
CDO405_140_3a,CDO580_6_1,RZ424B_26_1,
RM212_136_7,RM263_156_2,RM247_154_12,
RM21_132_2,RM235_96_2,RM1_89_6,
RG716_154_4,RM232_156_10,RM22_187_3,
RZ53_22_1,RM232_150_7,RM205_155_12
RM255_151_7,RM212_136_7,RM20B_207_1,
RZ53_22_1,RM259_158_7,
RM38_238_3,RM241_130_8,RM38_266_17,
RM22_185_2,RM10_164_2
RM18_159_4,RM235_136_15,
RM248_80_3,RZ404_97_5
Headingdate
(d)
RM263_156_2,RM248_92_8,RM255_149_6,
RZ740_60_5,RG716_96_3,RM219_210_9,
RG146_31_1,RM204_178_30,RM255_141_2,
RM44_130_13,RM224_140_7,RM55_231_3,
RM22_193_6,RZ53_22_1,RZ537A_64_8
RG716_96_3,RM248_102_12,RM263_156_2,
RM247_154_12,RM204_120_9,RM84_110_3,
RM255_153_8,RM202_180_10,RM204_166_26,
RM250_170_11,RZ574_102_1,RM209_159_15
RM10_163_1,CDO78_63_2,
RG716_96_3,RM10_179_12,
RM248_84_5,RM11_125_2,
RZ206B_69_2,RM204_104_2,
CDO78_68_3,RM19_246_7,
RM19_225_5,RM204_180_31
Flagleaflength
(cm)
CDO456_36_6,RZ424B_26_1,RM235_136_15,
RM19_222_4,RM263_160_4,RM230_259_6,
RM257_173_24,RM204_144_18,
CDO202_250_4,RM223_161_10,RZ424A_11_1,
RM228_152_19,RG716_154_4,RM224_132_2
RM205_155_12,RM259_171_18,RZ424A_36_2,
RM202_178_9,RM204_144_18,RM240_132_5,
RM240_136_7,RM255_147_5,RZ405_43_1,
RM20B_216_3
CDO456_36_6,RM224_134_3,
RM224_156_11,RG1109_36_3
Flagleafwidth
(cm)
RM44_130_13,CDO78_63_2,RM44_120_12,
RM215_148_3,RZ599_38_2,RM44_112_8,
RZ53_22_1,RM233B_142_5,RM239_144_3,
RM38_250_9,RM255_143_3,BCD98_44_3,
RM14_189_8,RM14_171_2,RM10_179_12
RM11_127_3,RZ599_38_2,RM215_148_3,
RM23_136_2,RZ588_190_3,RM209_163_18,
RM14_209_15,RM19_249_8,RZ740_55_3,
RM209_127_4,RM219_222_14,RM226_197_3,
RM250_170_11,RM207_137_15
RM232_162_13,RM21_154_9,
CDO545B_48_1,
RM20A_285_13
Tillernumber
RZ400_15_2a,RM212_116_4,RM14_187_7,
RM1_95_9,RZ404_33_2,RM259_162_11,
RM204_140_16,RM226_193_1,RM13_151_10,
RM240_132_5,RZ599_78_5,RM48_211_4,
RZ141A_70_3,RM257_170_21
RM262_141_1,RM204_168_27
RM262_141_1
Stem
diameter
(mm)
RM255_151_7,RZ424A_11_1,RM222_213_9,
RZ284_67_1,RM19_216_2,RM235_136_15,
RM222_209_7,CDO405_180_5,RM21_164_14,
RZ405_160_9,CDO98_50_1,RM27_158_4,
RZ143_91_2,RZ103A_54_3
RM232_158_11,RZ53_200_5,RM262_157_6,
CDO718_39_1,RM259_171_18,
RM21_162_13,RM22_187_3,RM204_148_20,
RZ53_22_1,RM257_177_27,RM222_201_3,
RM259_158_7
RM228_114_5,RM259_156_5,
RM263_156_2,RM232_156_10,
RM44_130_13
Panicle
length
(cm)
RM7_175_7,RM232_144_4,RZ424B_26_1,
RM224_134_3,RM20A_276_10,RM263_160_4,
RM212_112_2,RZ141B_240_2,CDO405_170_4,
RM38_266_17,RG716_86_2,RM235_96_2
RM14_183_6,RM55_235_5,RM207_117_6,
RZ103A_46_1,RM7_175_7,RM20A_302_19,
RM228_150_18,RM209_145_9,
RM38_266_17,RM219_202_5
CDO405_170_4,RM224_157_12,
RM207_125_10
Grain
length
(L)(m
m)
RZ574_215_2,RM16_184_6,RG757_150_2,
RM19_237_6,RM20B_207_1,RM1_93_8,
RM228_120_8,RM1_117_16,RM205_127_6,
RM239_144_3,RM257_185_31,RM14_187_7,
RZ537A_26_1,RM219_212_10,Z599_78_5
RZ574_215_2,RM11_127_3,RZ405_158_8,
RM18_151_2,RM253_140_15,
RZ405_77_5,RM19_225_5,RM257_177_27
RM11_127_3
Grain
width
(W)(m
m)
RM248_82_4,RM202_159_4,RM14_183_6,
RM51_132_2,RM263_184_17,RZ625_180_4,
RM232_164_14,RM247_162_16,RM247_172_20,
RZ599_40_3,RZ400_32_3,RM207_117_6,
RM10_175_10,RZ783_40_2
CDO365_160_4,RM14_183_6,RM232_160_12,
RM55_219_1,CDO405_89_2,RM1_95_9,
RM202_157_2,RM13_133_2
RM14_183_6,RM11_123_1
725

mosome 1, and RM14_187_7 was found 3.5 cM fromthe 8.3-cM tp1 (Hua et al. 2002) at the bottom of thesame chromosome (Fig. 1). Allele RM212_116_4 wasfound within a 45.5-cM unnamed QTL reported byLafitte et al. (2002) on chromosome 1, and alleleRM262_141_1 mapped within the 22.9-cM unnamedQTL detected by Shen et al. (2001) on chromosome 2.RM240_132_5 was observed within the 4.9-cM tn2-2(Yan et al. 1998b), the 0.6-cM ppl2.1 (Xiao et al. 1998),and within an 8-cM unnamed QTL reported by Lafitteet al. (2002) at the bottom of chromosome 2. AllelesRM204_140_16 and RM204_168_27 were detectedwithin the 25-cM QTL tp6a (Hua et al. 2003) on chro-mosome 6. DA-selected allele RZ404_33_2 was foundwithin the 12.9-cM tp9 (Hua et al. 2003) and within an11.8-cM unnamed QTL (Liao et al. 2001), near thebottom of chromosome 9. Finally, DA allele RZ400_15_2 mapped 8.3 cM from an 8-cM unnamed QTLreported by Liao et al. (2001), near the bottom ofchromosome 10. Figure 1 shows seven loci (RM259,RM263, RM212, RM255, RM204, RM248, and RZ404)on chromosomes 1, 2, 4, 6, 7, and 9 associated with morethan one trait, which suggests that these markers may beassociated with pleotropic or closely linked genes for thecorresponding characters. DA-selected markers associ-ated with the remaining nine traits also mapped withinor nearby previously reported QTLs (data not shown).
In addition to the DA alleles that pointed to the sameor nearby regions as previously reported QTLs, Fig. 1shows several DA-selected markers not found by tradi-tional methods. For example, the following alleles se-lected for heading date were not found associated withpreviously reported QTLs: RM84_110_3 on chromo-some 1, RM255_153_8 on chromosome 4, RG716_96_3on chromosome 6, RM10_163_1 and RM10_179_12 onchromosome 7, RM38_259_13 on chromosome 8,RZ596 _200_3 on chromosome 9, RM202_180_10 onchromosome11, and RM247_154_12 on chromosome12. Similarly, DA alleles not associated with reportedQTLs for plant height include RM18_159_4 andRM248_80_3 on chromosome 7 and RM20B_207_1 onchromosome 11. For tiller number, DA-selected allelesRM259_162_11 on chromosome 1, RZ599_78_5 onchromosome 2, and RM226_193_1 on chromosome 4were found at positions other than the correspondingQTLs reported in the literature. These markers identifiedby DA may therefore represent new loci associated withplant height, maturity, and vigor. Similar results wereobtained for the remaining nine agronomic traits eval-uated in this study (data not shown).
Conclusions
Results from this study indicate that marker allelesassociated with all traits were identified by DA amonginbred rice lines at high levels of correct percent classi-fication within subpopulations and across all lines.Cross-validation results and a comparison of DA- andT
able
3(C
ontd.)
Trait
DA-selectedRFLP/SSR
alleles
producing86–100%
correctclassification
1SD
trainingsample
2SD
trainingsample
3SD
trainingsample
Grain
L/W
ratio
RZ574_215_2,RM258_150_7,RM21_162_13,
RM21_154_9,RM202_184_12,RM209_161_16,
RZ405_158_8,RM240_132_5,RM10_166_4,
RM226_269_17,RM262_143_2,RM13_151_10,
RZ599_78_5,RM226_219_9
RM14_183_6,RM21_160_12,RZ405_58_2,
RM222_219_12,RM248_86_6,RM263_154_1,
RM204_142_17,RM20A_269_7
RZ400_32_3
Grain
thickness(m
m)
ND
bRM14_183_6,RM18_161_5,RM14_197_12,
RM257_177_27,RM224_157_12,
RM259_162_11,RM209_127_4,RG322A_25_2,
RM204_176_29,RM232_152_8
RZ329_33_2
1,000-grain
weight(g)
RM248_82_4,RM205_161_15,RG901_144_4,
RM223_147_3,RM204_178_30,RM205_153_11,
RM224_138_6,RM259_159_8,RM38_266_17,
RM226_221_10,RM205_127_6,RM226_273_18
RM7_175_7,RM255_147_5,RZ424B_54_2,
RM16_184_6,RZ599_38_2,
RM215_156_7,RM202_159_4,RZ206B_69_2,
CDO456_28_3,RM21_152_8
RZ329_43_3,
RM44_92_2,
CD0118_69_1,
RM241_138_13
aFirst
componentofalleledesignationis
SSR
marker,secondis
allelesize
inbp(SSR)or100bp(R
FLP),thirdis
allelenumber
atlocus.
Alleleorder
correspondsto
itsrelative
contributionto
calculateddiscrim
inantrule
bNumber
ofalleles
identified
byDA
analysisto
differentiate
contrasting1SD
trainingsamples
726

QTL-selected markers on the rice genetic map suggestthat this approach can efficiently identify markers frommultiple germplasm sources. The DA statistical model isbuilt upon various assumptions, including normality ofdata and homogeneity of covariance matrices that ap-pear to be poorly satisfied by SSR/RFLP marker data inthis study. However, Lachenbruch (1975) and Klecka
(1980) point out that even with modest violations ofthese assumptions, DA is relatively robust when usingcategorical data such as the molecular profiles from thisstudy. Therefore, our conclusions of marker–trait asso-ciations based on DA analysis should not be adverselyaffected, which is supported by our DA–QTL geneticmap comparisons.
Fig. 1 Chromosomal locations of markers identified by discrimi-nant analysis (DA) and quantitative trait locue (QTL) mapping forplant height, maturity, and tiller number. Solid, empty, and stripedboxes represent QTLs detected in previous research using standardIM/CIM methods for plant height, heading date, and tiller number,
respectively. DA-selected SSR or RFLP markers associated withplant height are underlined. DA-selected SSR or RFLP markersassociated with heading date are labeled with an asterisk. DA-selected SSR or RFLP markers with no label are associated withtiller number
727

Relatively high levels of molecular and phenotypicdiversity of the US and Asian lines, compared withtypical progeny from a single cross, most likely con-tributed to the ability of DA to identify putative allelesassociated with the agronomic characters. Populationstructure appeared to have minimal impact on the abilityof DA-selected markers to correctly assign individuals inthis study to predefined phenotypic groups or to map toregions identified in previous QTL experiments. How-ever, population structure has been shown to have adramatic effect on DA analysis of other rice populations(Aluko and Oard, unpublished results), so this stepshould always be included as part of the DA proceduredescribed here. Because the level of linkage disequilib-rium, i.e., the nonrandom association of loci, can beaffected by breeding history, additional DA studies ofthis issue will be required.
The potential advantages of the DA approach re-ported here include the ability to simultaneously evalu-ate numerous loci with multiple alleles across a widerange of inbred lines for association with simple orcomplex agronomic traits. Additional genetic analysis ofthe DA-selected markers in segregating populationsderived from controlled crosses will be required toconfirm the putative association of the alleles identifiedin this research with the agronomic traits.
Acknowledgement We thank the LSU AgCenter BiotechnologyEducation for Students and Teachers (BEST) program for partialfunding of this research.
References
Brondani C, Rangel N, Brondani V, Ferreira E (2002) QTLmapping and introgression of yield-related traits from Oryzaglumaepatula to cultivated rice (Oryza sativa) using microsat-ellite markers. Theor Appl Genet 104:1192–1203
Cammareri M, Errico A, Sebastiano A, Conicella C (2004) Geneticrelationships among Aster species by multivariate analysis andAFLP markers. Hereditas 140:193–200
Cao G, Zhu J, He C, Gao Y, Yan J, Wu P (2001a) Impact ofepistasis and QTL x environment interaction on the develop-mental behavior of plant height in rice (Oryza sativa L.). TheorAppl Genet 103:153–160
Cao GQ, Zhu J, He CX, Gao YM, Wu P (2001b) QTL analysis forepistatic effects and QTL ·environment interaction effects onfinal height of rice (Oryza sativa L.). Acta Genetica Sinica28:135–143
Cardon LR, Abecasis GR (2003) Using haplotype blocks to maphuman complex trait loci. Trends Genet 19:135–40
DePrimo SE, Wong LM, Khatry DB, Nicholas SL, Manning WC,Smolich BD, O’Farrell AM, Cherrington JM (2003) Expressionprofiling of blood samples from an SU5416 Phase III metastaticcolorectal cancer clinical trial: a novel strategy for biomarkeridentification. BMC Cancer 3:3
Ebdon JS, Petrovic AM, Schwager SJ (1998) Evaluation of dis-criminant analysis in identification of low and high-water useKentucky bluegrass cultivars. Crop Sci 38:152–157
Excoffier L, Smouse PE, Quattro JM (1992) Analysis of molecularvariance inferred from metric distances among DNA haplo-types: application to human mitochondrial DNA restrictiondata. Genetics 131:479–491
Fahima T, Roder MS, Wendehake K, Kirzhner VM, Nevo E (2002)Microsatellite polymorphism in natural populations of wild
emmer wheat, Triticum dicoccoides, in Israel. Theor Appl Genet104:17–29
Fang P, Wu P (2001) QTL · N-level interaction for plant height inrice (Oryza sativa L.). Plant Soil 236:237–242
Fisher RA (1936) The use of multiple measurements in taxonomicproblems. Ann Eugen 7:179–188
Flint-Garcia SA,Thornsberry JM,Buckler ES IV (2003) Structure oflinkage disequilibrium in plants. Ann Rev Plant Biol 54:357–374
Garris AJ, McCouch SR, Kresovich S (2003) Population structureand its effect on haplotype diversity and linkage disequilibriumsurrounding the xa5 locus of rice (Oryza sativa L.). Genetics165:759–769
Gebhardt C, Ballvora A, Walkemeier B, Oberhagemann P, SchulerK (2004) Assessing genetic potential in germplasm collections ofcrop plants by marker–trait association: a case study forpotatoes with quantitative variation of resistance to late blightand maturity type. Mol Breed 13:93–102
Gilbert H, Le Roy P (2003) Comparison of three multitrait meth-ods for QTL detection. Genet Sel Evol 35:281–304
Hemamalini GS, Shashidhar HE, Hittalmani S (2000) Molecularmarker assisted tagging of morphological and physiologicaltraits under two contrasting moisture regimes at peak vegetativestage in rice (Oryza sativa L.). Euphytica 112:69–78
Hua JP, Xing YZ, Xu CG, Sun XL, Yu SB, Zhang Q (2002) Ge-netic dissection of an elite rice hybrid revealed that heterozyg-otes are not always advantageous for performance. Genetics162:1885–1895
Hua J, Xing Y, Wu W, Xu C, Sun X, Yu S, Zhang Q (2003) Single-locus heterotic effects and dominance by dominance interac-tions can adequately explain the genetic basis of heterosis in anelite rice hybrid. PNAS 100:2574–2579
Ishimaru K, Yano M, Aoki N, Ono K, Hirose T, Lin SY, MonnaL, Sasaki T, Ohsugi R (2001) Toward the mapping of physio-logical and agronomic characters on a rice function map: QTLanalysis and comparison between QTLs and expressed sequencetags. Theor Appl Genet 102:793–800
Jermstad KD, Bassoni DL, Jech KS, Ritchie GA, Wheeler NC,Neale DB (2003) Mapping of quantitative trait loci controllingadaptive traits in coastal Douglas fir. III. Quantitative trait loci-by-environment interactions. Genetics 165:1489–1506
Kari L, Loboda A, Nebozhyn M, Rook AH, Vonderhied EC,Nichols C, Virok D, Chang C, Horng WH, Johnston J,Wysocka M, Showe MK, Showe LC (2003) Classification andprediction of survival in patients with the leukemic phase ofcutaneous T-cell lymphoma. J Exp Med 197:1477–1488
Klecka WR (1980) Discriminant analysis. Quantitative applica-tions in the social sciences series, no.19. Sage, Thousand Oaks
Lachenbruch PA (1975) Discriminant analysis. Hafner, New YorkLafitte HR, Courtois B, Arraudeau M (2002) Genetic improvement
of rice in aerobic systems: progress from yield to genes. FieldCrops Res 75:171–190
Liao CY, Wu P, Hu B, Yi KK (2001) Effects of genetic backgroundand environment on QTLs and epistasis for rice (Oryza sativaL.) panicle number. Theor Appl Genet 103:104–111
Lin SY, Sasaki T, Yano M (1998) Mapping quantitative trait locicontrolling seed dormancy and heading date in rice,Oryza sativaL., using backcross inbred lines. Theor Appl Genet 96:997–1003
Lincoln S, Daly M, Lander E (1992) Constructing genetic linkagemaps with MAPMAKER/EXP. Whitehead Institute TechnicalReport. Available via http://www-genome.wi.mit.edu/ftp/dis-tribution/software
Lu CF, Shen LH, Tan ZB, Xu YB, He P, Chen Y, Zhu LH (1997)Comparative mapping of QTLs for agronomic traits of riceacross environments by using a doubled-haploid population.Theor Appl Genet 94:145–150
Mcharo M, Labonte D, Oard JH, Kays SJ, McLaurin WJ (2004)Linking quantitative traits with AFLP markers in sweet potatousing discriminant analysis. Acta Hortic 637:285–293
Mei HW, Luo LJ, Ying CS, Wang YP, Yu XQ, Guo LB, PatersonAH, Li ZK (2003) Gene actions of QTLs affecting several agro-nomic traits resolved in a recombinant inbred rice population andtwo testcross populations. Theor Appl Genet 107:89–101
728

Mendez, MA, Hodar C, Vulpe C, Gonzalez M, Cambiazo V (2002)Discriminant analysis to evaluate clustering of gene expressiondata. FEBS Lett 522:24–28
Moncada P, Martinez CP, Borrero J, Chatel M, Gauch H, Gui-maraes E, Tohme J, McCouch SR (2001) Quantitative trait locifor yield and yield components in an Oryza sativa · Oryzarufipogon BC2F2 population evaluated in an upland environ-ment. Theor Appl Genet 102:41–52
Morgante M, Salamini F (2003) From plant genomics to breedingpractice. Curr Opin Biotechnol 14:214–219
Musumarra G, Barresi V, Condorelli DF, Scire S (2003) A bioin-formatics approach to the identification of candidate genes forthe development of new cancer diagnostics. Biol Chem 384:321–327
Remington DL, Thornsberry JM, Matsuoka Y, Wilson LM, WhittSR, Doebley J, Kresovich S, Goodman MM, Buckler ES (2001)Structure of linkage disequilibrium and phenotypic associationsin the maize genome. Proc Natl Acad Sci USA 98:1147–1184
Schneider S, Roessli D, Excoffier L (2002) Arlequin ver 2.000: asoftware for population genetics data analysis. Genetics andBiometry Laboratory, University of Geneva, Switzerland
Shen L, Courtois B, McNally KL, Robin S, Li Z (2001) Evaluationof near-isogenic lines of rice introgressed with QTLs for rootdepth through marker-aided selection. Theor Appl Genet103:75–83
Simko I, Costanzo S, Haynes KG, Christ BJ, Jones RW (2004)Linkage disequilibrium mapping of a Verticillium dahliaeresistance quantitative trait locus in tetraploid potato (Solanumtuberosum) through a candidate gene approach. Theor ApplGenet 108:217–224
Thornsberry JM, Goodman MM, Doebley J, Kresovich S, NielsenD, Buckler ES IV (2001) Dwarf8 polymorphisms associate withvariation in flowering time. Nat Genet 28:286–289
Wang D, Graef GL, Procopiuk AM, Diers BW (2004) Identifica-tion of putative QTL that underlie yield in interspecific soybeanbackcross populations. Theor Appl Genet 108:458–467
Xiao JH, Li J, Grandillo S, Ahn SN, Yuan L, Tanksley SD,McCouch SR (1998) Identification of trait-improving quanti-tative trait loci alleles from a wild rice relative, Oryza rufipogon.Genetics 150:899–909
Xing YZ, Xu CG, Hua JP, Tan YF, Sun XL (2001) Mapping andisolation of quantitative trait loci controlling plant height andheading date in rice. Acta Bot Sinica 43:721–726
Xu Y (2002) Global view of QTL: rice as a model. In: Kang MS(ed) Quantitative genetics, genomics and plant breeding. CABInternational, pp 109–134
Xu Y, Beachell H, McCouch SR (2004) A marker-based approachto broadening the genetic base of rice (Oryza sativa L.) in theUSA. Crop Sci 14:1947–1959
Yamamoto T, Lin H, Sasaki T, Yano M (2000) Identification ofheading date quantitative trait locus Hd6 and characterizationof its epistatic interactions with Hd2 in rice using advancedbackcross progeny. Genetics 154:885–891
Yan JQ, Zhu J, He C, Benmoussa M, Wu P (1998a) Moleculardissection of developmental behavior of plant height in rice(Oryza sativa L.). Genetics 150:1257–1265
Yan JQ, Zhu J, He CX, Benmoussa M, Wu P (1998b) Quantitativetrait loci analysis for the developmental behavior of tillernumber in rice (Oryza sativa L.). Theor Appl Genet 97:267–274
Yan J, Zhu J, He C, Benmoussa M, Wu P (1999) Molecularmarker-assisted dissection of genotype · environment interac-tion for plant. Crop Sci 39:538–544
Yu SB, Li JX, Xu CG, Tan YF, Li XH, Zhang Q (2002) Identifi-cation of quantitative trait loci and epistatic interactions forplant height and heading date in rice. Theor Appl Genet104:619–625
Zhang MQ (1998) Identification of protein-coding regions inArabidopsis thaliana genome based on quadric discriminantanalysis. Plant Mol Biol 37:803–806
Zhang CT, Wang J, Zhang R (2002) Using a Euclid distance dis-criminant method to find protein coding genes in the yeastgenome. Comput Chem 26:195–206
Zou JH, Pan XB, Chen ZX, Xu JY, Lu JF, Zhai WX, Zhu LH(2000) Mapping quantitative trait loci controlling sheath blightresistance in two rice cultivars (Oryza sativa L.). Theor ApplGenet 101:569–573
729