Ideas for Modeling and Simulation of Supply Chains with Arena
10
Proceedings of the 2004 Winter Simulation Conference R .G. Ingalls, M. D. Rossetti, J. S. Smith, and B. A. Peters, eds. ABSTRACT This paper presents a research project being developed at the Industrial and Systems Engineering Graduate Program at the Catholic University of Paraná (Brazil). The objective is to develop a system to aid professionals from manage- ment and logistics areas to evaluate the performance of supply chains through computer simulation. Among the several possibilities for analysis, simulation can allow one to perform detailed studies on the bullwhip effect in supply chains, caused by the demand variation from the point-of- sale to the suppliers. Two performance measures are of particular interest: average inventory level and service level, both for each stage at and for the whole supply chain. The structure considered in this project is the tradi- tional supply chain composed by suppliers, manufactures, distributors (or wholesalers), retailers and customers. A first version of the proposed Arena simulation models is under development and is presented in this paper. 1 INTRODUCTION Until some time ago, the marketplace forced companies to compete against each other – individually. Nowadays, this is changing – companies still compete with each other, but more in terms of supply chain against supply chain. This is a tendency that should remain for a while. For this reason, being able to manage the supply chain (SC) as a single, in- terconnected and interdependent structure can lead the par- ticipating companies to the success. With this view in mind, one can better identify low performance points (stages or strategies) incurring high costs to the final prod- uct. This will benefit all chain members and not just one or two – usually the big ones. In this sense, companies now tend to collaborate more, “working as a team” in several operational and logistics aspects, as for instance, dealing with demand, making it available from the point-of sale to all stages of the supply chain. One can see that such inte- gration has a significant impact on the SC performance. Computer simulation can play an important hole in this scenario, since it can be used to evaluate the impact of the integration (or the lack of it) in the chain. The project de- scribed go towards these ideas. The structure considered is the traditional supply chain mentioned by Ching (2001) composed by sources, suppli- ers, processors, distributors, retailers and consumers, since one knows that most corporations do in fact adopt this macro-vision (Figure 1). In this approach, there exist two types of flows, the information flow, in the upstream direc- tion, that is, customers to suppliers, and the material (prod- ucts or services), in the downstream direction – suppliers to customers (Slack, Chambers, and Johnston 2001). Figure 1: Traditional Logistics Chain (Ching 2001) In general terms, this project regards the development of a computer environment in Arena (Rockwell Software Inc.) to aid the responsible for operations to better analyze and test new ways to improve supply chain performance (increase its profitability), under the idea of having all of its chain members collaborating. More specifically, a simu- lation environment to allow the study of new technologies to supply chain management, like, for instance, implemen- tation of collaborative planning, forecasting and replen- ishment (CPFR) ideas. Secondly, the overall project will show that the bullwhip effect can be more easily study with high-level computer simulation – instead of spreadsheets, which can perform very limited analysis of dynamic and stochastic systems like supply chains. This paper also describes the first version of the simu- lation models under development. In fact, usually the lit- erature on SC simulation shows very little detail on how to simulate the intricacies inherent of supply chains. Authors mention results, but lack detailed explanations on how they have built the supply chain simulation structure (most of the time this is due to the simplifications made, like “only one product”, “one or two SC stages”, or “no order, IDEAS FOR MODELING AND SIMULATION OF SUPPLY CHAINS WITH ARENA Guilherme Ernani Vieira Imaculada Conceição 1155 Industrial and Systems Engineering Graduate Program 2 o Andar – Bloco 3 – Parque Tecnológico Pontifícia Universidade Católica do Paraná (PUCPR) Curitiba, PR 81215-901 BRAZIL Sources Suppliers Processors Distributors Retailers Market
-
Upload
independent -
Category
Documents
-
view
3 -
download
0
Transcript of Ideas for Modeling and Simulation of Supply Chains with Arena
Proceedings of the 2004 Winter Simulation Conference R .G. Ingalls, M. D. Rossetti, J. S. Smith, and B. A. Peters, eds.
IDEAS FOR MODELING AND SIMULATION OF SUPPLY CHAINS WITH ARENA
Guilherme Ernani Vieira
Imaculada Conceição 1155 Industrial and Systems Engineering Graduate Program
2o Andar – Bloco 3 – Parque Tecnológico Pontifícia Universidade Católica do Paraná (PUCPR)
Curitiba, PR 81215-901 BRAZIL
ABSTRACT
This paper presents a research project being developed at the Industrial and Systems Engineering Graduate Program at the Catholic University of Paraná (Brazil). The objective is to develop a system to aid professionals from manage-ment and logistics areas to evaluate the performance of supply chains through computer simulation. Among the several possibilities for analysis, simulation can allow one to perform detailed studies on the bullwhip effect in supply chains, caused by the demand variation from the point-of-sale to the suppliers. Two performance measures are of particular interest: average inventory level and service level, both for each stage at and for the whole supply chain. The structure considered in this project is the tradi-tional supply chain composed by suppliers, manufactures, distributors (or wholesalers), retailers and customers. A first version of the proposed Arena simulation models is under development and is presented in this paper.
1 INTRODUCTION
Until some time ago, the marketplace forced companies to compete against each other – individually. Nowadays, this is changing – companies still compete with each other, but more in terms of supply chain against supply chain. This is a tendency that should remain for a while. For this reason, being able to manage the supply chain (SC) as a single, in-terconnected and interdependent structure can lead the par-ticipating companies to the success. With this view in mind, one can better identify low performance points (stages or strategies) incurring high costs to the final prod-uct. This will benefit all chain members and not just one or two – usually the big ones. In this sense, companies now tend to collaborate more, “working as a team” in several operational and logistics aspects, as for instance, dealing with demand, making it available from the point-of sale to all stages of the supply chain. One can see that such inte-gration has a significant impact on the SC performance. Computer simulation can play an important hole in this
scenario, since it can be used to evaluate the impact of the integration (or the lack of it) in the chain. The project de-scribed go towards these ideas.The structure considered is the traditional supply chain mentioned by Ching (2001) composed by sources, suppli-ers, processors, distributors, retailers and consumers, since one knows that most corporations do in fact adopt this macro-vision (Figure 1). In this approach, there exist two types of flows, the information flow, in the upstream direc-tion, that is, customers to suppliers, and the material (prod-ucts or services), in the downstream direction – suppliers to customers (Slack, Chambers, and Johnston 2001).
Figure 1: Traditional Logistics Chain (Ching 2001)
In general terms, this project regards the development of a computer environment in Arena (Rockwell Software Inc.) to aid the responsible for operations to better analyze and test new ways to improve supply chain performance (increase its profitability), under the idea of having all of its chain members collaborating. More specifically, a simu-lation environment to allow the study of new technologies to supply chain management, like, for instance, implemen-tation of collaborative planning, forecasting and replen-ishment (CPFR) ideas. Secondly, the overall project will show that the bullwhip effect can be more easily study with high-level computer simulation – instead of spreadsheets, which can perform very limited analysis of dynamic and stochastic systems like supply chains.
This paper also describes the first version of the simu-lation models under development. In fact, usually the lit-erature on SC simulation shows very little detail on how to simulate the intricacies inherent of supply chains. Authors mention results, but lack detailed explanations on how they have built the supply chain simulation structure (most of the time this is due to the simplifications made, like “only one product”, “one or two SC stages”, or “no order,
Sources Suppliers Processors Distributors Retailers Market
Vieira
transportation and/or production lot sizes”. To make it trustworthy, a supply chain simulation model has to con-sider, at least:• Four SC stages: Customers, Retailers (wholesalers or distributors), Manufactures and Suppliers;
• Different customer demand behaviors; • Different product types; • For each product type, different bill-of-materials
(each product is manufactured from different raw materials
• and/or components; • Minimum production lot sizes; • Safety inventory levels; • Several retailers and suppliers; • Information and material (components or prod-
ucts) flows: • Distribution (delivery) lead-times; and • Minimum order and delivery quantities.
The models presented here are not finished, but al-
ready show that all the consideration made above can be easily implemented (in fact most of them are already done so). However, these ideas are a first step towards more re-alistic SC simulation studies.
This paper is organized as follows: Next section makes a quick review on computer simulation and supply chains. The third section proposes a structure for the modeling and simulation of supply chains. Section four shows initial re-sults (Arena simulation models). Conclusions and next phases for the project are presented in the last section.
2 A BIRD´S EYE VIEW ON SIMULATION AND SUPPLY CHAINS
This section presents a brief review about the main topics considered in this study: Computer simulation and supply chains.
2.1 Computer Simulation in Manufacturing
Nowadays, simulation is synonymous to computer simula-tion, which is, informally, the activity of imitating (or mimicking) the behavior of a system (being designed or not), through the creating of a computer mathematical model. But there are several formal definitions for simula-tion. According to Hollocks (1992), for instance, simula-tion is an operations research technique that involves the creation of a computer program representing a portion of the real world, such that experiments in the simulation model can predict what will happen in the reality. To Pedgen et al. (1990), simulation is the process of designing a computer model of a real system and conduct experi-ments with this model to understand its behavior or to evaluate strategies to its operations. Basically, a simula-
tion model gives support to the decision-making, allowing the reduction of risks and costs involved in a process (or project). Therefore, more and more simulation is being ac-cepted and being part of daily activities of analysts as a technique (or tool) to check and propose solutions to prob-lems commonly found at different industry sectors.
A simulation project normally involves a sequence of steps. According to Banks & Carsen (1984), Pedgen et al. (1990), and Law & Kelton (1991), these steps can be summarized as:
• Conceptual problem formulation and analysis; • Data and information collection; • Model building; • Verification and validation; • Experiment design; • Experiment execution and results analysis; • Refinement of experiment design; • Final results analysis; and • Process documentation.
Among these steps, data collection is probably the
most time consuming and maybe the most important (re-member: “garbage in - garbage out”). Validation is right next. One needs to make sure the model created corre-sponds to the real system in order to perform the experi-ments and propose changes.
The dynamics inherent of manufacturing systems are usually too complex to be dealt with from an analytical point-of-view, especially when manufacturing processes have characteristics like high variety and low quantity production, unexpected events, too many planning decisions, routing flexibility, etc. In such scenarios, simulation comes up as a powerful tool for performance analysis and optimization
In manufacturing, simulation has been used at several different applications. Objectives varies, but based on past works, simulation is usually related to:
• Inventory reduction – setting appropriate levels according to the production planning;
• Performance improvement; • Making sure that new processes are tested and ap-
proved before their actual implementations; • Reaching the optimal use of resources (machines,
production lines, personnel, etc.); • Obtaining better logistics results within the supply
chain; • Use of a model to foresee the future behavior, that
is, the effects produced by changes in the system or by new operations methods (Pedgen et al., 1990);
• Study of capacity usage, inventory levels, control logic, integration, sequencing/scheduling, bottle-necks, search for better layouts (Lobão & Porto, 1996).
Vieira
Among the advantages of using simulation in sys-tems modeling and performance evaluation, one can find, for instance:
• “What…if analysis” – where decision policies can be rapidly tested and compared (Corrêa, Gianesi, Caon 2001);
• Hypothesis about how or why certain phenomena happen can verified (Pedgen et al., 1990);
• A simulation study usually shows how a system really works, in opposition to how people think it works (Banks and Carsen 1984);
• The development of a simulation model helps the company to separate controllable from non-controllable parameters and study the influence of each parameter in the system performance;
• Analysis of long time periods in short execution times;
• Problems that are usually solved by intuitive rules can be solved (and tested) formally.
Beyond manufacturing (logistics and supply chains),
simulation can be applied to many other fields, like hospi-tals, supermarkets, airports, banking, computer networks, etc. Next section defines the context of this project.
2.2 Supply Chains
A supply chain should be understood as a net encompassing all the organizations that comprise the material (component or product) supply, production, distribution and selling of goods to the final customer. According to Ballou (2001), a company usually is not able to completely control the prod-uct flow, from raw material sources to the point-of-sale. Managing these channels is the core of supply chain man-agement, and its key activities are related to keeping high customer service levels, transportation efficiency, inventory management, information management and order process-ing. These logistics (management or planning) activities go beyond a single organization’s limits.
A supply chain forms a complex net of physical (mate-rial/products and capital) flows and non-physical flows (in-formation). Decision made in one stage of the chain will usually have an unpredictable impact on other stages of the chain. The relationships among the stages (and their func-tions) are non-linear and the results of an action may not be estimated precisely before hand. As mentioned by Kuo & Smiths (2003), the focus has shifted from individual com-panies competition to competition among business net-works, and from an individual firm performance to the per-formance of the whole supply chain.
Managing a supply chain concerns activities that pro-mote functional interactions, both within a single company and amongst distinct ones. Based on Ho, Au, and Newton (2002), one can see that such activities include the access
to SC members planning systems, sharing of production plans, information exchange via EDI (electronic data inter-change) or simply through the internet, knowing inventory levels, standardized procedures, packaging, demand fore-casting, promotional events, etc. This behavior increases the complexity in managing and analyzing supply chains.
Methods for supply chain management should be able to simplify such complexities, probably by taking a sys-temic view of the functioning of the whole chain. The overall system performance will depend not on isolated ac-tions but on collective ones, which will benefit everyone in the chain and not one or two.
Turbam, Rainer, and Potter (2003) state that a supply chain involves three basic parts: the upstream (suppliers and suppliers´ suppliers), internal part (include all of the organization processes that transform materials into prod-ucts) and the downstream part (distribution and delivery of products to the final customers). A supply chain simulation model must consider all of these parts.
The literature, although quite vast on the SC subject, is limited on simulation of supply chains. Based on Banks et al. (2002), Payne (2002), Ramakrshnan, Lee, and Wysk (2002), Armbruster, Marthaler, and Ringhofer (2002), Linn, Chen, and Lozan (2002), Ritchie-Dunham et al. (2000), Chang & Makatsoris (2002), Jain et al (2001), Yee (2002), Bansal (2002), and Khator & Deshmukh (2002), one can note that works on SC simulation usually lack de-tailed description on what the SC models considered, stages, functions, interactions among the companies, pro-duction and logistics rules adopted (as, for instance, mini-mum truck load, production or safety stock levels, order processing times, bullwhip effect). Lots of simplifications are made and are briefly explained, like, single product, no bill-of-material, a product is made of only one component or raw material, very simple chains, demand is constant or well known, etc. The supply chain simulation models over-come these (and other) simplifications.
The SC structure presented in the following section is used to aid the development of the first version of the simulation models being created in ARENA (Section 5).
3 A SIMPLE STRUCTURE FOR SIMULATING SUPPLY CHAINS
As mentioned by Ching (2001), the traditional logistics chain is composed by six stages: suppliers´ suppliers (sources), suppliers, processors (manufacturers), distributors (or wholesalers), retailers and consumers. The simplified SC structure initially considered in this project has four stages: suppliers, manufacturer(s), retailers and consumers. There are two main objectives in the development of a simulation structure: to analyze the benefits of CPFR and to study the bullwhip effect on supply chains. It is known that companies using CPFR have reported a 67% reduction on lead times, 60% reduction of forecasting errors, 40% reduction on in-
Vieira
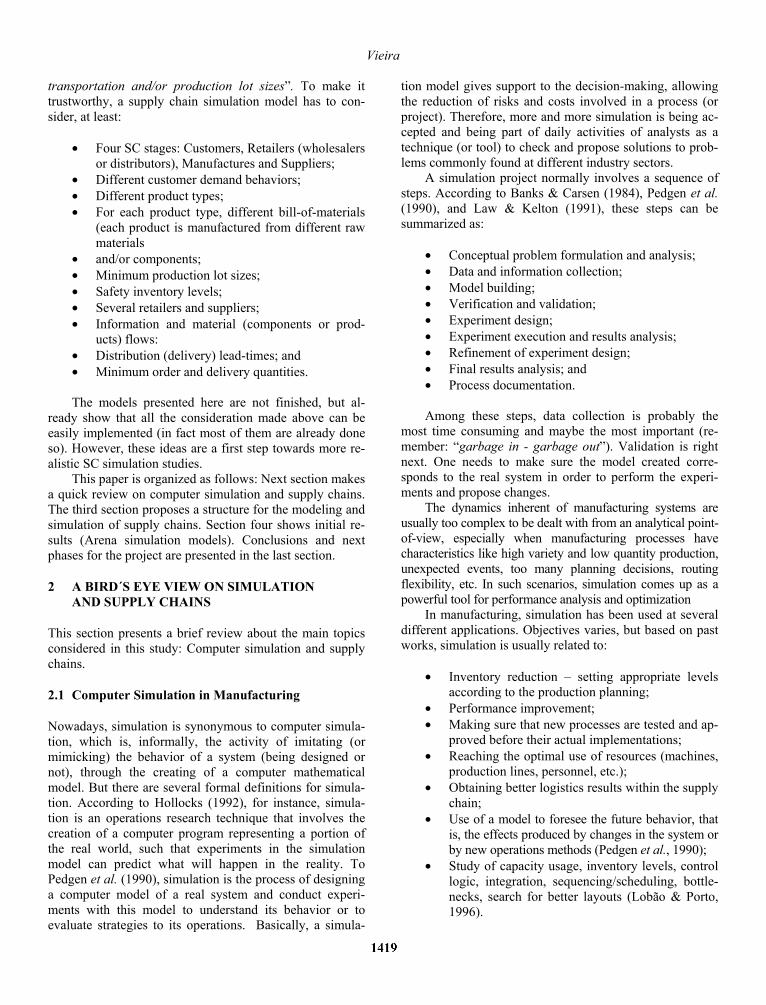
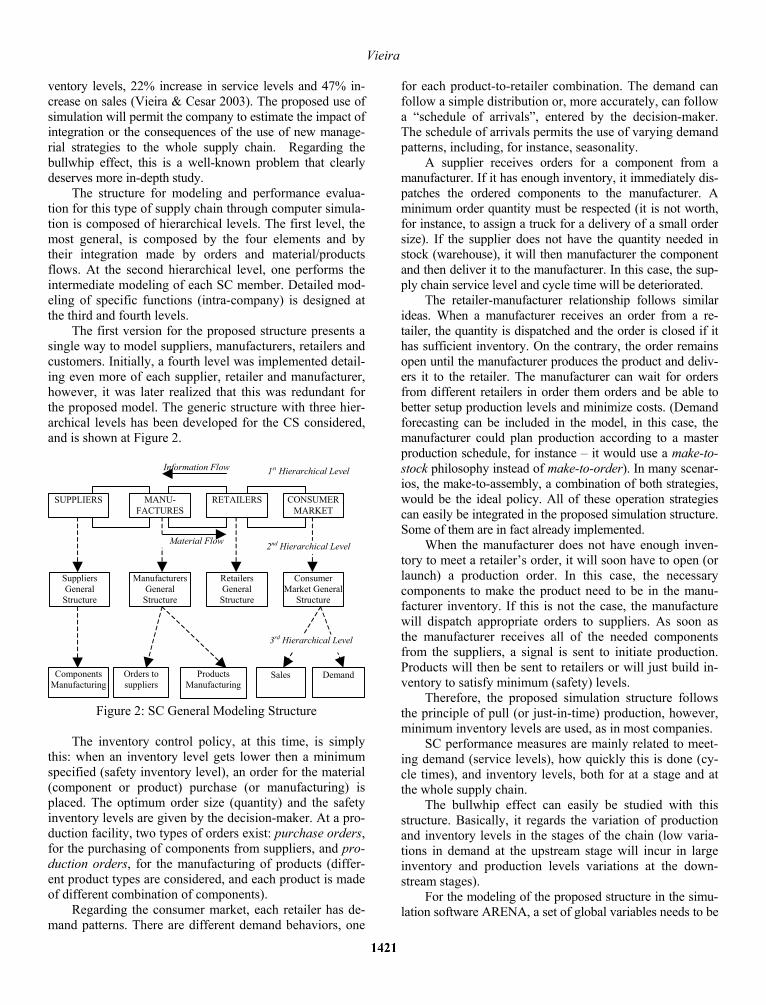
ventory levels, 22% increase in service levels and 47% in-crease on sales (Vieira & Cesar 2003). The proposed use of simulation will permit the company to estimate the impact of integration or the consequences of the use of new manage-rial strategies to the whole supply chain. Regarding the bullwhip effect, this is a well-known problem that clearly deserves more in-depth study.The structure for modeling and performance evalua-tion for this type of supply chain through computer simula-tion is composed of hierarchical levels. The first level, the most general, is composed by the four elements and by their integration made by orders and material/products flows. At the second hierarchical level, one performs the intermediate modeling of each SC member. Detailed mod-eling of specific functions (intra-company) is designed at the third and fourth levels.
The first version for the proposed structure presents a single way to model suppliers, manufacturers, retailers and customers. Initially, a fourth level was implemented detail-ing even more of each supplier, retailer and manufacturer, however, it was later realized that this was redundant for the proposed model. The generic structure with three hier-archical levels has been developed for the CS considered, and is shown at Figure 2.
SUPPLIERS MANU-FACTURES
RETAILERS CONSUMER MARKET
Information Flow 1st Hierarchical Level
Suppliers General
Structure
Components Manufacturing
Manufacturers General
Structure
Orders to suppliers
Products Manufacturing
Material Flow
Retailers General Structure
Consumer Market General
Structure
Sales Demand
3rd Hierarchical Level
2nd Hierarchical Level
Figure 2: SC General Modeling Structure
The inventory control policy, at this time, is simply
this: when an inventory level gets lower then a minimum specified (safety inventory level), an order for the material (component or product) purchase (or manufacturing) is placed. The optimum order size (quantity) and the safety inventory levels are given by the decision-maker. At a pro-duction facility, two types of orders exist: purchase orders, for the purchasing of components from suppliers, and pro-duction orders, for the manufacturing of products (differ-ent product types are considered, and each product is made of different combination of components).
Regarding the consumer market, each retailer has de-mand patterns. There are different demand behaviors, one
for each product-to-retailer combination. The demand can follow a simple distribution or, more accurately, can follow a “schedule of arrivals”, entered by the decision-maker. The schedule of arrivals permits the use of varying demand patterns, including, for instance, seasonality.
A supplier receives orders for a component from a manufacturer. If it has enough inventory, it immediately dis-patches the ordered components to the manufacturer. A minimum order quantity must be respected (it is not worth, for instance, to assign a truck for a delivery of a small order size). If the supplier does not have the quantity needed in stock (warehouse), it will then manufacturer the component and then deliver it to the manufacturer. In this case, the sup-ply chain service level and cycle time will be deteriorated.
The retailer-manufacturer relationship follows similar ideas. When a manufacturer receives an order from a re-tailer, the quantity is dispatched and the order is closed if it has sufficient inventory. On the contrary, the order remains open until the manufacturer produces the product and deliv-ers it to the retailer. The manufacturer can wait for orders from different retailers in order them orders and be able to better setup production levels and minimize costs. (Demand forecasting can be included in the model, in this case, the manufacturer could plan production according to a master production schedule, for instance – it would use a make-to-stock philosophy instead of make-to-order). In many scenar-ios, the make-to-assembly, a combination of both strategies, would be the ideal policy. All of these operation strategies can easily be integrated in the proposed simulation structure. Some of them are in fact already implemented.
When the manufacturer does not have enough inven-tory to meet a retailer’s order, it will soon have to open (or launch) a production order. In this case, the necessary components to make the product need to be in the manu-facturer inventory. If this is not the case, the manufacture will dispatch appropriate orders to suppliers. As soon as the manufacturer receives all of the needed components from the suppliers, a signal is sent to initiate production. Products will then be sent to retailers or will just build in-ventory to satisfy minimum (safety) levels.
Therefore, the proposed simulation structure follows the principle of pull (or just-in-time) production, however, minimum inventory levels are used, as in most companies.
SC performance measures are mainly related to meet-ing demand (service levels), how quickly this is done (cy-cle times), and inventory levels, both for at a stage and at the whole supply chain.
The bullwhip effect can easily be studied with this structure. Basically, it regards the variation of production and inventory levels in the stages of the chain (low varia-tions in demand at the upstream stage will incur in large inventory and production levels variations at the down-stream stages).
For the modeling of the proposed structure in the simu-lation software ARENA, a set of global variables needs to be
Vieira
defined, as exemplified at Table 1. All these variables are bi-dimensional, with their respective sizes represented by the variables in between brackets. In this table and on the Arena models, some of the notations used were:Table 1: Notations and Variables for the SC Simulation Structure Notations: General Variables: SS : safetey stock IL : inventory level dnm : demand not met comp : component prod : product qty : quantity sup : supplier mft : manufacturer ret : retailer
nc: number of components np: number of products ns: number of suppliers nm: number of manufacturers nr: number of retailers
Specific Variables: To suppliers: To manufacturers: To retailers: sup_IL_comp [ns, nc] sup_SS_comp [ns, nc] sup_dnm_comp [ns, nc] sup_prod_rate [ns, nc] sup_qty_needed_comp [ns, nc]
mft_IL_comp [nm, nc] mft_SS_comp [nm, nc] mft_IL_prod [nm, np] mft_SS_prod [nm, np] mft_qty_needed_comp [nm, nc] mft_qty_needed_prod [nm, np] mft_prod_rate [nm, np] mft_dnm_prod [nm, np]
ret_IL_prod [nr, np] ret_SS_prod [nr, np] ret_dnm_prod [nr, np] ret_qty_needed_prod[nr, np]
4 AN EXPERIMENTAL EXAMPLE
To illustrate how these ideas can be implemented, this sec-tion shows the implementation of the supply chain presented previously. The figures, taken directly from the simulation program show how the hierarchical levels were imple-mented, through the use of sub-models, as well as the spe-cific and managerial functions of suppliers, manufacturers, retailers, and the consumer market, mentioned previously.
In this example, the supply chain is composed of three suppliers, which supply eight different types of compo-nents to a single manufacturer. The manufacturer can pro-duce three types of products: A, B, and C. The chain also has three retailers and a consumer market that generates demand for them. Supplier 1 manufacturers components 1 and 2; supplier 2 produces components 3, 4, and 5; and supplier 3 manufacturers components 6, 7, and 8. The adopted bill-of-material (BOM) shows that product type 1 is made from components 1, 3, and 6; product 2 is made of components 2, 4 and 7; and product 3 uses components 5 and 8. Note that the manufacturer will often order compo-nents from more than one supplier.
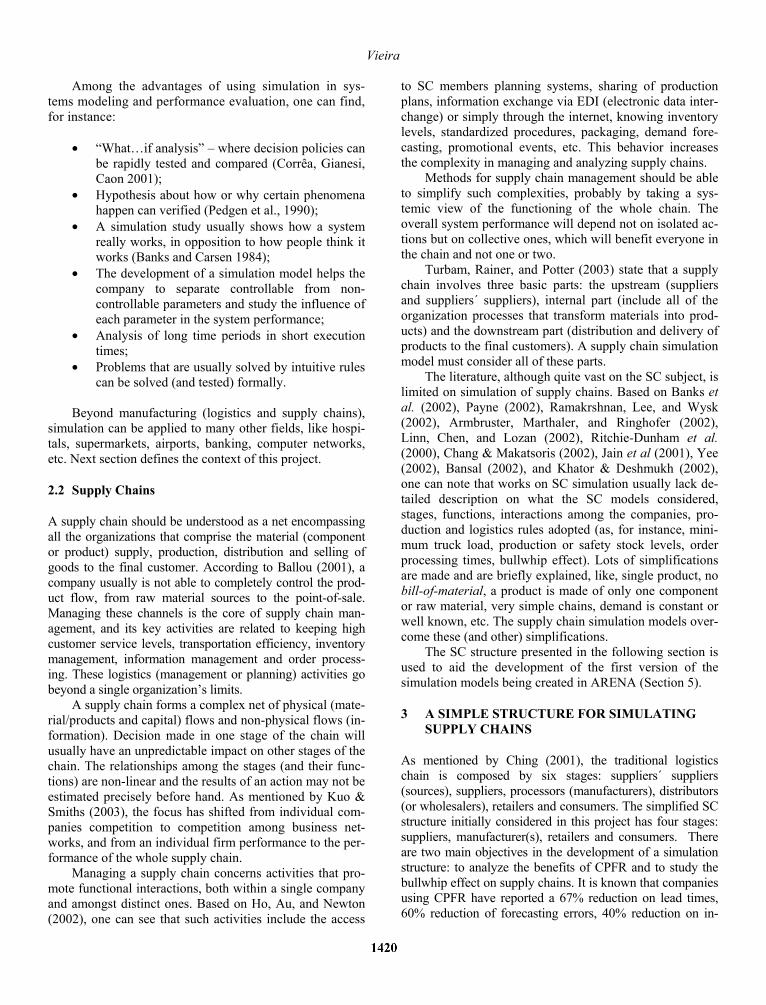
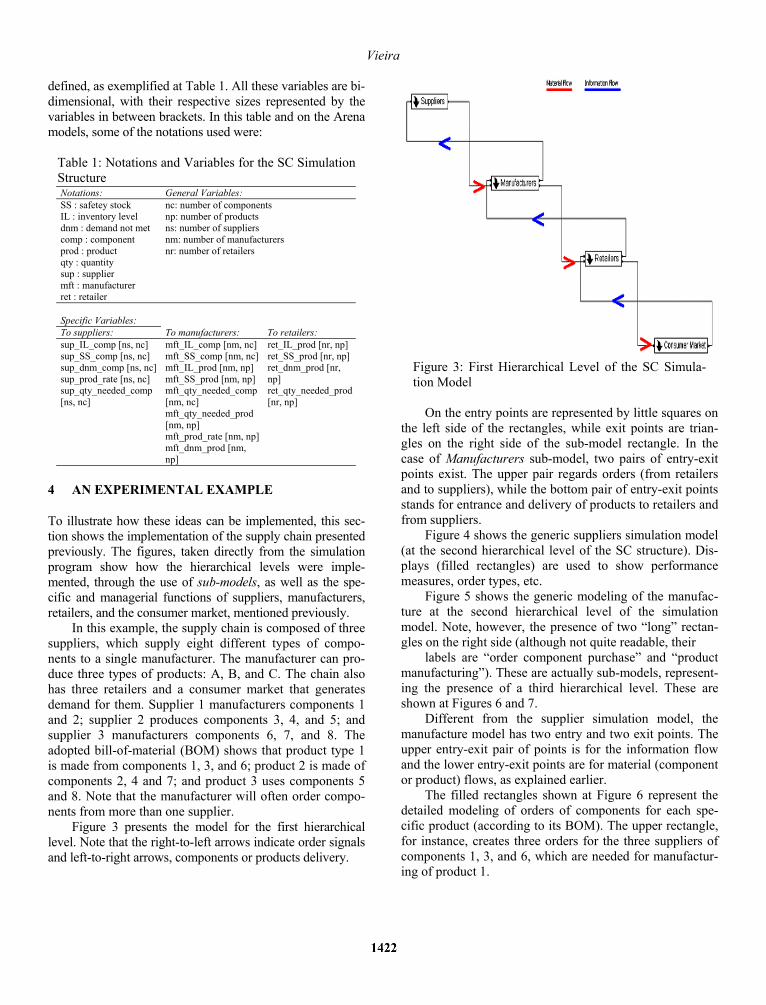
Figure 3 presents the model for the first hierarchical level. Note that the right-to-left arrows indicate order signals and left-to-right arrows, components or products delivery.
Figure 3: First Hierarchical Level of the SC Simula-tion Model
On the entry points are represented by little squares on
the left side of the rectangles, while exit points are trian-gles on the right side of the sub-model rectangle. In the case of Manufacturers sub-model, two pairs of entry-exit points exist. The upper pair regards orders (from retailers and to suppliers), while the bottom pair of entry-exit points stands for entrance and delivery of products to retailers and from suppliers.
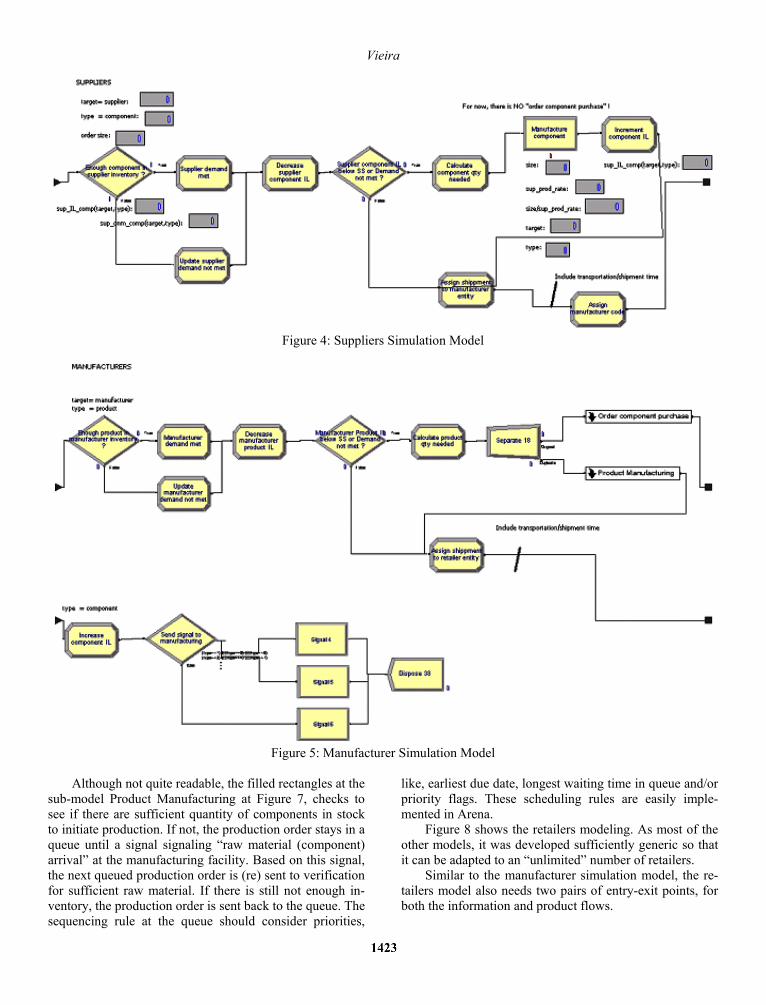
Figure 4 shows the generic suppliers simulation model (at the second hierarchical level of the SC structure). Dis-plays (filled rectangles) are used to show performance measures, order types, etc.
Figure 5 shows the generic modeling of the manufac-ture at the second hierarchical level of the simulation model. Note, however, the presence of two “long” rectan-gles on the right side (although not quite readable, their
labels are “order component purchase” and “product manufacturing”). These are actually sub-models, represent-ing the presence of a third hierarchical level. These are shown at Figures 6 and 7.
Different from the supplier simulation model, the manufacture model has two entry and two exit points. The upper entry-exit pair of points is for the information flow and the lower entry-exit points are for material (component or product) flows, as explained earlier.
The filled rectangles shown at Figure 6 represent the detailed modeling of orders of components for each spe-cific product (according to its BOM). The upper rectangle, for instance, creates three orders for the three suppliers of components 1, 3, and 6, which are needed for manufactur-ing of product 1.
Vieira
Figure 4: Suppliers Simulation Model
Figure 5: Manufacturer Simulation Model
Although not quite readable, the filled rectangles at the
sub-model Product Manufacturing at Figure 7, checks to see if there are sufficient quantity of components in stock to initiate production. If not, the production order stays in a queue until a signal signaling “raw material (component) arrival” at the manufacturing facility. Based on this signal, the next queued production order is (re) sent to verification for sufficient raw material. If there is still not enough in-ventory, the production order is sent back to the queue. The sequencing rule at the queue should consider priorities,
like, earliest due date, longest waiting time in queue and/or priority flags. These scheduling rules are easily imple-mented in Arena.
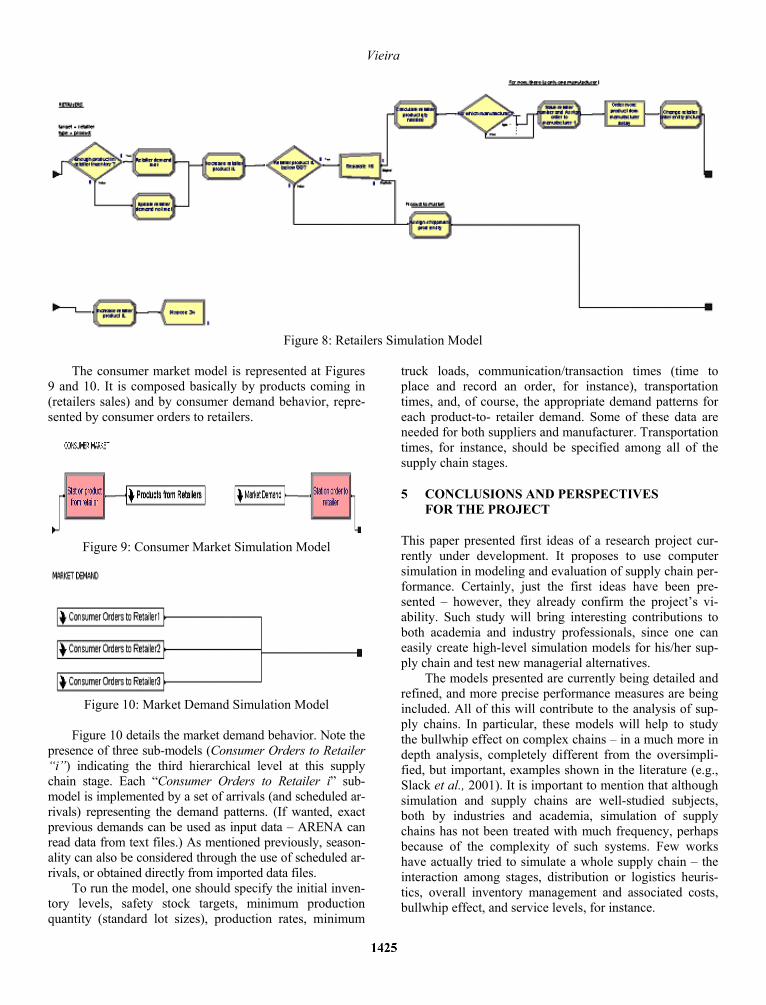
Figure 8 shows the retailers modeling. As most of the other models, it was developed sufficiently generic so that it can be adapted to an “unlimited” number of retailers.
Similar to the manufacturer simulation model, the re-tailers model also needs two pairs of entry-exit points, for both the information and product flows.

Vieira
Figure 6: Sub-Model for the Component Ordering
Figure 7: Sub-Model for the Product Manufacturing
Vieira
Figure 8: Retailers Simulation Model
The consumer market model is represented at Figures
9 and 10. It is composed basically by products coming in (retailers sales) and by consumer demand behavior, repre-sented by consumer orders to retailers.
Figure 9: Consumer Market Simulation Model
Figure 10: Market Demand Simulation Model
Figure 10 details the market demand behavior. Note the
presence of three sub-models (Consumer Orders to Retailer “i”) indicating the third hierarchical level at this supply chain stage. Each “Consumer Orders to Retailer i” sub-model is implemented by a set of arrivals (and scheduled ar-rivals) representing the demand patterns. (If wanted, exact previous demands can be used as input data – ARENA can read data from text files.) As mentioned previously, season-ality can also be considered through the use of scheduled ar-rivals, or obtained directly from imported data files.
To run the model, one should specify the initial inven-tory levels, safety stock targets, minimum production quantity (standard lot sizes), production rates, minimum
truck loads, communication/transaction times (time to place and record an order, for instance), transportation times, and, of course, the appropriate demand patterns for each product-to- retailer demand. Some of these data are needed for both suppliers and manufacturer. Transportation times, for instance, should be specified among all of the supply chain stages.
5 CONCLUSIONS AND PERSPECTIVES FOR THE PROJECT
This paper presented first ideas of a research project cur-rently under development. It proposes to use computer simulation in modeling and evaluation of supply chain per-formance. Certainly, just the first ideas have been pre-sented – however, they already confirm the project’s vi-ability. Such study will bring interesting contributions to both academia and industry professionals, since one can easily create high-level simulation models for his/her sup-ply chain and test new managerial alternatives.
The models presented are currently being detailed and refined, and more precise performance measures are being included. All of this will contribute to the analysis of sup-ply chains. In particular, these models will help to study the bullwhip effect on complex chains – in a much more in depth analysis, completely different from the oversimpli-fied, but important, examples shown in the literature (e.g., Slack et al., 2001). It is important to mention that although simulation and supply chains are well-studied subjects, both by industries and academia, simulation of supply chains has not been treated with much frequency, perhaps because of the complexity of such systems. Few works have actually tried to simulate a whole supply chain – the interaction among stages, distribution or logistics heuris-tics, overall inventory management and associated costs, bullwhip effect, and service levels, for instance.
Vieira
This paper presented a new way to analyze all of this through simulation models, which break down the system’s complexity on different hierarchical levels. Hierarchical levels facilitate the modeling and the supply chain analysis. Three levels compose the proposed SC model. The overall chain is done at the first level. At the second level, the overall suppliers, manufacturers (only one was considered in the experimental model), retailers and consumer market. At the third level, specific functions for some of these models were implemented, like the product ordering, manufacturing processes, and customer demand patterns.
As suggestions and goals from this point of the pro-ject, more detailed modeling of the several components and hierarchical levels are needed (perhaps more then three levels will exist). A clearer definition of performance measures needs to be defined, along with the parameters to be used to calculate these measures. Besides inventory, production and service levels, it is also suggested the inclu-sion of costs and due-dates. Certainly, a strategy that groups orders and deliveries must be included in the model. The ARENA software allows for the creation of templates. This project also comprises the development of a supply chain simulation template. This will greatly facili-tate the development of other models by decision-makers, especially in industrial environments. Lastly, more com-plex supply chains should be considered, having, for in-stance, six stages (the fours stages proposed plus distribu-tors, wholesalers, or supplier’s suppliers, for instance.)
ACKNOWLEDGMENTS
The author would like to thank the Conselho Nacional de Desenvolvimento Científico e Tecnológico – CNPq (a Bra-zilian research funding agency) for the financial support, the Pontifical Catholic University of Paraná (PUCPR) and the Department of Industrial and Systems Engineering for the interest and incentive given to this research.
REFERENCES
Armbruster, D., Marthaler, S., & Ringhofer, C. (2002) Ef-ficient simulations of supply chains. Proceedings of the 2002 Winter Simulation Conference. E. Yücesan, C.-H. Chen, J. L. Snowdon, and J. M. Charnes, edi-tors. Institute of Electrical and Electronics Engineers. Piscataway, New Jersey. pp.1345-1348.
Ballou, R. H. (2001) Gerenciamento da cadeia de suprimentos: planejamento, organização e logística empresarial. 4a Edição. Editora Bookman, Porto Alegre.
Banks, J., Buckley, S., Jain, S., Lendermann, P., & Mani-vannan, M. (2002) Panel session: Opportunities for simulation in supply chain management. Proceedings of the 2002 Winter Simulation Conference. E. Yücesan, C.-H. Chen, J. L. Snowdon, and J. M. Charnes, editors. In-
stitute of Electrical and Electronics Engineers. Piscata-way, New Jersey. pp.1652-1658.
Banks, J. & Carsen, J. S., (1984) Discret Event System Simulation, Prentice-Hall.
Bansal, S. (2002) Promise and problems of simulation tech-nology in SCM domain. Proceedings of the 2002 Win-ter Simulation Conference. E. Yücesan, C.-H. Chen, J. L. Snowdon, and J. M. Charnes, editors. Institute of Electrical and Electronics Engineers. Piscataway, New Jersey. pp.1831-1837.
Behlau, T., Strothotte, C., Ziems, D., Schurholz, A., & Schmitz, M. (2003) Modeling and simulation of supply chains [online]. Available online via <http://www. unimagdeburg.de/ifsl/~tine/istanbul/ paperIstanbul.pdf> (accessed June 10, 2003).
Chang, Y. & Makatsoris, H. (2002) Supply chain modeling using simulation. International Journal of simulation - Vol.2, No.1.
Ching, H. Y., (2001) Gestão de Estoques na Cadeia de Logística Integrada – Supply Chain. 2a Edição, Editora Atlas S.A.
Corrêa, H. L., Gianesi, I. G. N., & Caon, M. (2001) Planejamento, Programação e Controle da Produção MRP II/ERP: Conceitos, Uso e Implantação, 4ª Edição, Editora Atlas.
Ho, D. C. K, Au, K. F., & Newton, E. (2002) Empirical re-search on supply chain management: a critical review and recommendations. International Journal of Pro-duction Research, Vol.40, No.17, pp.4415-4430.
Hollocks, B. (1992) A well-kept secret: Simulation in manufacturing industry review. OR Insight. Vol.5, No.4, pp.12-17.
Jain, S., Workman, R. W., Collins, L. M., Ervin, E. C., & Lathrop, A. P. (2001) Development of a high-level supply chain simulation model. Proceedings of the 2001 Winter Simulation Conference. B. A. Peters, J. S. Smith, D. J. Medeiros, and M. W. Rohrer, editors. In-stitute of Electrical and Electronics Engineers. Pis-cataway, New Jersey. pp.1129-1137.
Khator, S. K., & Derhmukh, M. (2002) System dynamics modeling of agility in a supply chain. IX International Conference on Industrial Engineering and Operations Management – PUCPR – Curitiba – Brazil.
Kuo, D. C. L., & Smiths, M. (2003) Performance of inte-grated supply chains – an international case study in high tech manufacturing. Proceedings of the 36th Ha-waii International Conference on Systems Sciences, IEEE Computer Society.
Law, A. M. & Kelton, W.D. (1991) Simulation Modeling and Analysis, 2nd Ed., McGraw-Hill.
Linn, R. J., Chen, S-C, & Lozan, J. A. (2002) Development of distributed simulation model for the transporter en-tity in a supply chain process. Proceedings of the 2002 Winter Simulation Conference. E. Yücesan, C.-H. Chen, J. L. Snowdon, and J. M. Charnes, editors. In-
Vieira
stitute of Electrical and Electronics Engineers. Pis-cataway, New Jersey. pp.1319-1326.
Lobão, E. C., & Porto, A. J. V. (1996) Proposta Para Sistematização de Estudo de Simulação. Escola de Engenharia de São Carlos – EESC/USP.
Payne, T. (2002) ASC-3 Simulating the supply chain. Are-naSphere 2000 Presentation Summary
Pegden, C. D., Shanon, R. E., & Sadowsky, R. (1990) Intro-duction to Simulation Using SIMAN, McGraw-Hill.
Pio, F. (2003). Cliente só paga o que usa no novo comércio eletrônico. Sebrae-SC News [online]. Available online via <http://www.sebraesc. com.br/Noticias/mostrar_materia. asp?cd_noticia=4846> (accessed January 10, 2003).
Ramakrshnan, S., Lee, S., & Wysk, R. A. (2002) Implemen-tation of a simulation-based control architecture for supply chain interactions. Proceedings of the 2002 Win-ter Simulation Conference. E. Yücesan, C.-H. Chen, J. L. Snowdon, and J. M. Charnes, editors. Institute of Electrical and Electronics Engineers. Piscataway, New Jersey. pp.1667-1674.
Ritchie-Dunham, J., Morrice, D. J., Scott, J., & Anderson, E. G. (2000) A strategic supply chain simulation model. Proceedings of the 2000 Winter Simulation Conference. J. A. Joines, R. R. Barton, K. Kang, and P. A. Fishwick, editors. Institute of Electrical and Electronics Engi-neers. Piscataway, New Jersey. pp.1260-1264.
Slack, N., Chambers, S., & Johnston, R. (2001) Operations Management. 3rd Edition. Prentice Hall.
Strategym (2002). Application of agent based simulation to supply chain management [online]. Available online via <http://www.jbims.edu/downloads/ Agent%20Based%20Simulation.pdf> (accessed July 15, 2003).
Turbam, E., Rainer Jr., R. K, & Potter, R. E. (2003) Administração de tecnologia da informação: teoria e prática. Editora Campus.
Vieira, G. E., & César Jr., O. (2003). CPFR to improve the efficiency of productive chains: An overview of concepts, characteristics, implementation and solu-tions. X Simpósio de Engenharia de Produção. Bauru, SP, Brazil.
Vieira, M. (2002). CPFR The Union between Industry and Retailer [online]. Available online via <http:// www.revistafluxo.com.br/arquivo/ setembro_2002/index_painel.php> (ac-cessed April 14, 2002).
Yee, S-T., (2002) Establishment of product offering and production leveling principles via supply chain simula-tion under order-to-delivery environment. Proceedings of the 2002 Winter Simulation Conference. E. Yücesan, C.-H. Chen, J. L. Snowdon, and J. M. Charnes, editors. Institute of Electrical and Electronics Engineers. Pis-cataway, New Jersey. pp.1260-1268.
AUTHOR BIOGRAPHY
GUILHERME ERNANI VIEIRA is an Associate Professor at the Control and Industrial Engineering Undergraduate Program and at the Industrial and Systems Engineering Graduate Program at the Catholic University of Paraná (Brazil). He holds a Ph.D. from the University of Maryland at College Park (USA) and a M.Sc. from the Federal University of Santa Catarina (Brazil). He has worked as a Technical Support Manager for almost two years in the USA and his current research interests are in supply chain management, logistics, computer simulation and artificial intelligence techniques applied to solve pro-duction planning and control optimization problems. For further information, contact him at (+55 41) 271 2473 or <[email protected]>.