(ID # 4584) City Council Staff Report
70
City of Palo Alto (ID # 4584) City Council Staff Report Report Type: Study Session Meeting Date: 4/21/2014 City of Palo Alto Page 1 Summary Title: Earth Day Staff Report Title: Update of the Climate Protection Plan From: City Manager Lead Department: City Manager Recommendation This is an informational report and requires no Council action. Executive Summary Since adoption of Climate Protection Plan (CPP) by the City Council in December 2007, and the adoption of updated goals in 2010, the City of Palo Alto’s municipal operations (City) and the Palo Alto Community (Community) have made considerable progress in reducing their carbon footprint and adopt sustainable practices. The 2012 and 2013 greenhouse gas (GHG) emissions from City operations are both estimated to be 53% below 2005 levels, well exceeding the Council’s goal to reduce these emissions by 20% by 2012. The activities that led to these reduced emission levels also resulted in reduction of the cost to the City for electricity and natural gas utility services and for vehicular fuel by approximately $500,000 per year in the past two years. Staff’s preliminary estimate is that the 2012 and 2013 combined greenhouse gas (GHG) emissions from City and Community were 20% and 29% below 2005 levels, respectively, well exceeding the Council’s goal to reduce these emissions by 20% by 2012. (This is based on estimated community mobile fuel use and consumption of electricity and natural gas.) If these estimates are confirmed by the next Climate Plan, Palo Alto has made a strong head start towards the state’s goal of reducing 2050 emissions by 80% below 1990 levels–but still has a long way to go. The GHG reductions since 2005 were largely achieved by the greening of electricity supplies, aggressive electricity and natural gas efficiency programs, conservation efforts, and utilization of landfill gas at the water quality control plant. The City’s adoption of carbon neutral electric supply in 2013 was the main driver of emission reduction between 2012 and 2013, accounting
-
Upload
khangminh22 -
Category
Documents
-
view
1 -
download
0
Transcript of (ID # 4584) City Council Staff Report

City of Palo Alto (ID # 4584) City Council Staff Report
Report Type: Study Session Meeting Date: 4/21/2014
City of Palo Alto Page 1
Summary Title: Earth Day Staff Report
Title: Update of the Climate Protection Plan
From: City Manager
Lead Department: City Manager Recommendation This is an informational report and requires no Council action. Executive Summary Since adoption of Climate Protection Plan (CPP) by the City Council in December 2007, and the adoption of updated goals in 2010, the City of Palo Alto’s municipal operations (City) and the Palo Alto Community (Community) have made considerable progress in reducing their carbon footprint and adopt sustainable practices. The 2012 and 2013 greenhouse gas (GHG) emissions from City operations are both estimated to be 53% below 2005 levels, well exceeding the Council’s goal to reduce these emissions by 20% by 2012. The activities that led to these reduced emission levels also resulted in reduction of the cost to the City for electricity and natural gas utility services and for vehicular fuel by approximately $500,000 per year in the past two years. Staff’s preliminary estimate is that the 2012 and 2013 combined greenhouse gas (GHG) emissions from City and Community were 20% and 29% below 2005 levels, respectively, well exceeding the Council’s goal to reduce these emissions by 20% by 2012. (This is based on estimated community mobile fuel use and consumption of electricity and natural gas.) If these estimates are confirmed by the next Climate Plan, Palo Alto has made a strong head start towards the state’s goal of reducing 2050 emissions by 80% below 1990 levels–but still has a long way to go. The GHG reductions since 2005 were largely achieved by the greening of electricity supplies, aggressive electricity and natural gas efficiency programs, conservation efforts, and utilization of landfill gas at the water quality control plant. The City’s adoption of carbon neutral electric supply in 2013 was the main driver of emission reduction between 2012 and 2013, accounting

City of Palo Alto Page 2
for 75,000 Metric Tons (MT) of GHG emissions reduction. An initial assessment of transportation-related emissions based on regional estimates suggests that GHG emissions from this sector have also declined 10% since 2005 based on regional estimates. In the coming year, with input from Council, staff expects to develop a new CPP and an overall sustainability roadmap, in coordination with the planned update to the City’s Comprehensive Plan. If the community chooses to further reduce emissions and allocate commensurate resources towards this effort, Palo Alto could become a model city as California embarks on the journey to meet the state’s aspirational goal of 80% reduction (from 1990 levels) by 2050. Aspects of adaptation to climate change will also be considered in this assessment. Background Climate change has become, in the eyes of many, the most important threat facing the global environment and economy, with large potential impacts from sea level rise and severe storm events; human dislocation; macroeconomic effects; and even US competitiveness, as other countries move more dramatically on these concerns. In California, the effects of climate change are likely to reduce the availability of hydroelectric generation, impact the availability of our water supplies, increase the incidence of forest fires and extreme weather events, and lead to a rise in sea level, which would impact Palo Alto's shoreline and flood prone areas. The City took an early leadership role in 2007 as one of the first U.S. cities to develop a Climate Protection Plan (also referred to as the Climate Action Plan by other cities), which described measures that could be taken to reduce the City's GHG emissions and set GHG reduction goals. The City’s Climate Protection Plan (CPP) and GHG emissions reduction goals are described in detail in Attachment A. The City’s initial GHG emission reduction goals were:
By 2012, the City will reduce GHG emissions by 20% below 2005 levels.
By 2012, the City and Community will reduce emissions by 5% below 2005 levels.
By 2020, the City and Community will reduce emissions by 15% below 2005 levels. (The State considers 15% below 2005 to be equivalent to 1990 emissions, so the City’s initial goal was consistent with AB 32, which required the State to reduce its emissions to 1990 levels by 2020.)
In 2010, based on the rapid progress being made, Council increased the City reduction goals to 20% by 2012. The City’s achievements to date have exceeded these targets:
City emissions for 2013 were 53% below 2005 levels
Combined City and emissions for 2013 were 29% below 2005 levels

City of Palo Alto Page 3
These are impressive accomplishments and continuation of current programs will produce additional gains. However, the context for this study session is increasingly different than when Council first set these programs in motion. It includes:
The growing seriousness of climate impacts, from sea level rise to the intensity and frequency of storm events;
The effect of these trends on hydropower, water supply and food supplies;
The increasing concern of capital markets and corporate leadership with climate risk and the “carbon bubble”;
The rapidly dropping price of renewable energy (and anticipated drops in the cost of energy storage);
The mounting evidence of the economic benefits of low-carbon strategies and the economic costs of delay;
The disruptive challenges that Distributed Generation (DG) poses to the traditional utility industry business model;
The rising expectation of what constitutes “climate leadership.” The next phase of the City’s climate and sustainability planning will need to take these trends into account, as well as the State’s ongoing planning (through the California Air Resources Board “scoping plan”) for the year 2050. At the end of this document, following a summary of the City’s accomplishments, we will offer some suggestions of possible next steps to focus and address these concerns. Discussion Greenhouse Gas Emission Measurement and Reporting Protocols To quantify and report on GHG emissions related to City operations, the City has followed the Local Government Operations Protocol (LGOP), which is widely recognized by the industry and regulators. These reports were voluntarily filed with California Climate Action Registry (CCAR) since 2005 and with The Climate Registry (TCR) since 2010. In the beginning, the reports were verified by independent auditors. In recent years, due to the high cost of the audits, the City has filed the reports but has not commissioned independent verification audits. The City also separately voluntarily reports to the US EPA on the management of SF6
1, a highly potent GHG used in electrical equipment by the electric utility. City emissions shown in this report were based on these filings. With respect to the electric supplies, beginning in 2014 for calendar year 2013, Utilities will report annually using TCR’s Electric Sector Protocol to ensure that the claim of carbon neutral electric supplies can be substantiated.
1 SF6 is a highly potent greenhouse gas used in electrical switchgear as an insulation medium in the past,
but at present being gradually phased out. In addition to voluntary TCR reporting, the City also has a number of mandatory GHG reporting under California Air Resources Board (CARB) regulations to implement state law AB32 for the electric utility, gas utility and WQCP operations. Several of these reports also are subject to mandatory independent verification audits.

City of Palo Alto Page 4
With respect to the Regional water Quality Control Plant (RWQCP) operated by the City, beginning in 2013 RWQCP submits a separate, abbreviated report, to the California Air Resources Board (CARB) for the RWQCP emissions only. In addition to reporting ‘corporate entity’2 level GHG emissions for City operations to TCR, ‘ICLEI protocols’3 provide for total community level measurement and reporting of GHG emissions. The City and Community level emissions provided in this report conform to this protocol. GHG Emissions from City Operations As illustrated in Figure 1 below, emissions from City operations in 2013 have been reduced by 53% since 2005, exceeding the 20% reduction goal in the CPP. The reductions are primarily from improvements at the Regional Water Quality Control Plant (RWQCP), efficiency improvements undertaken at many facilities including the City Hall building, participation in recycling and other waste management programs, greater use of renewable electric supply, and reduced utilization of the back-up electrical generator at the Municipal Service Center, as well as the provision of carbon-neutral electricity starting in 2013. Descriptions of these improvements are provided in Attachment B. The annual operational cost saving from these improvements total approximately $500,000 per year, with $350,000 of savings attributable to improvements at the RWQCP, $50,000 related to lower utility bills for City facilities, and more than $100,000 in reduced fuel consumption by the City fleet. The total emission estimates between 2012 and 2013 has largely remained constant, but individual component variation is explained in detail in Attachment B. (See Figure 1 and Table 1 below.)
2 TCR requires corporate level filing of the GHG emission inventory (in this case the City municipal
corporation operations) to report all emissions that are within the control of that legal entity. For Palo Alto this excludes emissions such as those related to community transportation. As an electric and gas utility, the City does have some control over emissions related to these two energy sources, and, therefore, must count them in the inventory. 3 The International Council for Local Environmental Initiatives (ICELI) protocol is a premier GHG reporting
standard for local governments and communities.

City of Palo Alto Page 5
Figure 1: City Operations GHG Emissions: 2005, 2012, 2013 (Total Emissions Reduced from 42,000 MT to 20,000 MT4, a 53% reduction5)
92
5,024
2,399
0
6,642
29
5,502
64
4,659
2,546
387
4,349
3,008
4,643
74
11,269
2,835
767
6,878
9,308
10,698
0 2,000 4,000 6,000 8,000 10,000 12,000
Water Delivery Facilities
Wastewater Facilities
Vehicle Fleet
Streetlights & Traffic Signals
Solid Waste Facilities
Power Generation Facilities
Buildings & Other Facilities
2005
2012
2013
4 MT refers to metric tons of carbon dioxide equivalent (CO2e) emissions.
5 For 2012, the emissions reduction excluding adjustments to account for variations in hydro-electricity
production and PaloAltoGreen purchases is 31%. This is primarily because 2012 was a relatively dry year which resulted in hydro electric supply providing 42% of electric needs, instead of the 52% supply Palo Alto would have received in an average hydro year or about 62% of supply in a wet year. In 2013, the carbon emissions related to electric supplies is zero. In 2012, staff has revised its baseline calculations for City operations emissions to be in line with the current calculation methodology known as the Local Government Operations protocol (LGOP). The LGOP was developed by California Air Resources Board (CARB) staff in partnership with the Climate Action Reserve (CAR), The Climate Registry (TCR), and Local Governments for Sustainability.

City of Palo Alto Page 6
Table 1: City Operations GHG Emissions: 2005, 2012, 2013
GHG Emissions comparison (Scope 1 & 2) 2005 2012 2013
Water Delivery Facilities 74 64 92
Wastewater Facilities 11,269 4,659 5,024
Vehicle Fleet 2,835 2,546 2,399
Streetlights & Traffic Signals 692 387 0
Solid Waste Facilities 6,878 4,349 6,642
Power Generation Facilities 9,308 3,008 29
Buildings & Other Facilities 10,698 4,643 5,502
TOTAL 41,754 19,655 19,689
53% 53%
City of Palo Alto Page 7
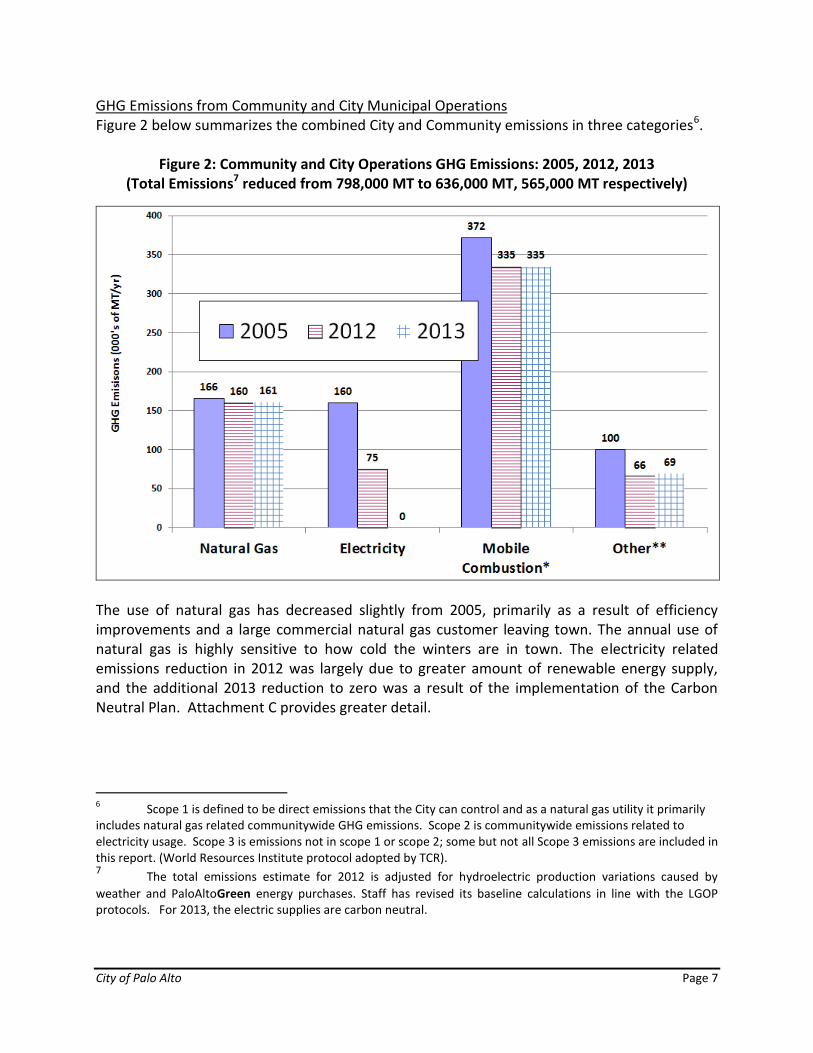
GHG Emissions from Community and City Municipal Operations Figure 2 below summarizes the combined City and Community emissions in three categories6.
Figure 2: Community and City Operations GHG Emissions: 2005, 2012, 2013
(Total Emissions7 reduced from 798,000 MT to 636,000 MT, 565,000 MT respectively)
The use of natural gas has decreased slightly from 2005, primarily as a result of efficiency improvements and a large commercial natural gas customer leaving town. The annual use of natural gas is highly sensitive to how cold the winters are in town. The electricity related emissions reduction in 2012 was largely due to greater amount of renewable energy supply, and the additional 2013 reduction to zero was a result of the implementation of the Carbon Neutral Plan. Attachment C provides greater detail.
6 Scope 1 is defined to be direct emissions that the City can control and as a natural gas utility it primarily
includes natural gas related communitywide GHG emissions. Scope 2 is communitywide emissions related to electricity usage. Scope 3 is emissions not in scope 1 or scope 2; some but not all Scope 3 emissions are included in this report. (World Resources Institute protocol adopted by TCR). 7 The total emissions estimate for 2012 is adjusted for hydroelectric production variations caused by
weather and PaloAltoGreen energy purchases. Staff has revised its baseline calculations in line with the LGOP protocols. For 2013, the electric supplies are carbon neutral.

City of Palo Alto Page 8
The following chart clearly shows our significant GHG reductions, especially with regard to landfill and renewable portfolio standards. It also highlights our biggest remaining GHG challenges: transportation and natural gas use.

City of Palo Alto Page 9
Figure 3: Community and City Operations GHG Emissions: 2005, 2012, and 2013 (Total Emissions8 reduced from 798,000 MT to 636,000 MT and 565,000 MT, respectively)
8 For 2012, the total emissions estimate is adjusted for hydroelectric production variations caused by
weather and PaloAltoGreen energy purchases. For 2013, the electric supplies are carbon neutral. In 2012, staff revised its baseline calculations in line with the LGOP protocols.

City of Palo Alto Page 10
An assessment of transportation-related emissions was conducted by consultants last year, and preliminary results suggest a 10% reduction in vehicle related emissions despite an increase in the ‘service population’ in Palo Alto. This decrease was driven by a reduction of per capita miles travelled and improved vehicular fuel efficiency. A detailed description of the study results and assumptions is provided in Attachment F. Table 1 below summarizes the results: shows that emissions were reduced by 13.6%, from 371,870 MT in 2005 to 321,200 MT in 2012, but remain our largest contributor—and our biggest challenge, since it is tied to our urban form and patterns or life, as well as technology opportunities. It also shows the corresponding emission estimates for year 1990, the base year utilized by the state for emission reduction goals under state law AB32.
Table 2: Estimates of Vehicle Emissions within Palo Alto City Limits
Source: Fehr and Peer Report of 03/19/2013 Assessment of GHG Emission Trends Since 1990 California’s Global Warming Solutions Act (AB32) of 2006 calls for statewide GHG emission reduction and establishes a goal of reducing emissions to 1990 emission levels by 2020. Staff’s preliminary estimate is that the Community’s GHG emissions in 2013 are 41% below 1990 emission levels based on estimated mobile fuel use and consumption of electricity and natural gas as outlined in Table 3 below.

City of Palo Alto Page 11
Table 3: Community and City Greenhouse Gas Emission Estimates for 1990, 2005, 2012, 2013
1990 2005 2012 2013 1990 2005
Natural Gas 194 166 160 161 -17% -3%
Electricity 186 160 75 0 -100% -100%
Mobile Combustion* 382 372 335 335 -12% -10%
Other** 100 100 66 69 - -
Total 962 798 636 565 -41% -29%
Emissions DriversGreenhouse Gas Emissions (000’s of MT)
(City Operations and Community)% Change 2013
* Consultant estimates based on population, employment, vehicle miles travelled and vehicular emission profiles ** Includes landfill, refuse and water WQCP emissions; estimate for 1990 is held at the same level as that of 2005,
to be revised at a later time
In addition to the emission reduction goals, the City’s CPP also set other goals. These goals and the progress made in achieving them are tabulated below.
Table 4: CPP Goals and Progress
CPP Goals Update on Progress
Incorporate carbon reduction into the City's Comprehensive Plan goals to ensure continuity with other City priorities
The new CPP is expected to be developed in the same time frame as an update to the City’s Comprehensive Plan, which will include goals and policies related to GHG emissions. This coordinated development process will allow the plans to inform each other and to be consistent. The schedule adopted for the Comprehensive Plan Update anticipated adoption around the end of 2015.

City of Palo Alto Page 12
CPP Goals Update on Progress
Explore and evaluate a policy whereby all of the Palo Alto Utilities would become climate neutral and enable customers to choose climate neutrality through various voluntary mechanisms.
The City developed PaloAltoGreen program, which became the nation's top-ranked voluntary renewable energy program. In March 2013 Council approved the Carbon Neutral Plan for electricity supply for all customers starting in 2013,9 as a result the PaloAltoGreen program was suspended in 2013. A new voluntary PaloAltoGreen Gas program to allow gas customers to neutralize their natural gas related emissions with certified carbon offsets is expected to be launched in July 2014. With the same participation of the PaloAltoGreen (electric) program, this program has the potential of neutralizing 10% of the GHG emissions associated with natural gas combustion in town within a few years. The merits of residential customers switching from natural gas appliances to electric appliances were analyzed in the past year. While initial results suggest that ‘fuel switching’ may not be cost effective yet for typical retrofits, the analysis found that such options could be cost effective for new construction. The study results are being socialized within the community and other stakeholders, and staff is looking at various programs to facilitate fuel switching by residents in the short- and long-term.
Maintain and report GHG inventories on a regular basis
Staff has compiled and reported on annual GHG emissions inventory of City operations to national registries (CCAR, TCR) since 2005. Since 2010, Utilities has also been reporting to CARB and starting in 2013, RWQCP also reports to CARB.
Promote participation by Palo Alto businesses in GHG inventory efforts
A number of large companies in the City quantify their carbon footprint and the City assists them in providing utility related emission coefficients. Participating in the natural gas off-set program will help them neutralize these emissions too. Staff will continue to be active in Sustainable Silicon Valley, Joint Venture Silicon Valley, Santa Clara County Sustainable Office, California Air Resource Board (CARB), Green Cities California, ICLEI/Local Governments for Sustainability, the Urban Sustainability Directors Network (USDN) and other related regional and state forums.
A more detailed list of accomplishments by the City is provided in Attachment D. It summarizes many of the City’s sustainability efforts, and includes the following sections.
I. Utilities Operations II. Sustainable Purchasing, IT and Administrative Practices
III. City Fleet Operations IV. City Facilities Operations and Capital Projects; Public Works Projects
9 Electric supply was carbon neutral with RECs in 2013, and will be carbon neutral with direct supply of
approximately 50% renewable and 50% hydro supply by 2017.

City of Palo Alto Page 13
V. Green Building VI. Zero Waste and Landfill Operations
VII. Water Quality Control Plant (RWQCP) Operations VIII. Education, Motivation, and Community participation The City’s Sustainability Policy and organizational structure is described in Attachment E. Descriptions of Transportation and Land-use related activities are provided in Attachment F. Cost-Benefit Analysis and Impacts on City Budget The City undertakes cost-benefit analyses to prioritize GHG emission reduction actions for large City projects. For example, when evaluating efficiency and conservation programs Utilities uses a ‘Total Resource Cost10’ approach. The RWQCP’s decision to replace chlorine disinfection with an Ultra-Violet light based disinfection process was based on a life-cycle cost assessment. Replacement of street lights with Light Emitting Diode (LED) based fixtures had an 8-year payback on the investment. Though most of the City Hall building capital projects were justified based on non-energy efficiency related factors (maintaining occupant comfort and extending the life of the building), when selecting energy consuming equipment such as boilers, lighting, and motors for various applications, cost-effective energy efficiency improvement was an integral part of the decision making process. In evaluating alternate fueled vehicles for the City fleet, a similar analysis is undertaken. As a result of these efforts, the City again saved an estimated $500,000 in utilities and vehicle fuel costs in 2013. The City will continue to emphasize cost-effectiveness whenever making purchasing decisions and will continue to include the cost of carbon in such assessments. The waste-to-energy project at the WQCP is also looking at the cost effectiveness of the project, and this will be a key metric as the community decides on the merits of such a project in town versus hauling the waste to another location. How the Climate Protection Plan fits into other Environmental Sustainability Efforts The CPP intersects with and influences many other City programs and initiatives—both that explicitly address environmental sustainability as well as other concerns. For example:
The Carbon Neutral electricity plan was also driven by the community’s desire to reduce its carbon footprint.
The initiative to replace bio-solids incineration at the RWQCP will eliminate a large component of the emission associated with City operations. Digesting the bio-solids and generating electricity has the potential of overall sustainability of the community by sourcing electricity locally.
The City's transportation management initiatives will reduce the impact of the Community’s largest source of emissions, as well as reduce traffic congestion and parking demand.
10 The Total Resource Cost test measures the net costs of efficiency programs based on the total costs of
the program, including both the participant and utility costs, and includes cost of carbon. .

City of Palo Alto Page 14
The City's Green Building code, currently being modified to reflect the new Title 24 standard, will further reduce energy consumption while improving the economic performance of our building stock.
The Zero Waste plan calls for an increase of the diversion rate of several categories of solid waste which will further reduce Community GHG emissions.
The Urban Forest Master Plan will expand the carbon sequestration properties of an urban canopy, and could reduce air-conditioning related energy costs by strategically locating trees to shade buildings.
The City’s Office of Emergency Services (OES) is working with regional partners to develop plans and mitigation strategies for utility disruption (earthquake, terrorism, accident, etc.). The City is one of the first of our size to have a Local Energy Assurance Plan.11
Attachment D provides an update on all these activities and results to date. Economic Development and City’s GHG Reduction Goals Staff is in the process of creating a methodology to assess the impact of the City’s GHG reduction goals on the community’s economic activities. The data collected as part of the “Downtown CAP” study and the anticipated business registry is expected to be very useful in gathering baseline and trend data over time for this analysis. In the meantime, State and regional data continues to be useful to inform the City of the economic impacts of our GHG reduction goals. The State of California (in its economic analysis of the impact of regulations in implementing GHG emission reductions measures related to state law AB32) concluded that:
“ … successful implementation of measures designed to reduce greenhouse gas emissions by increasing the efficiency with which California uses all forms of energy and by reducing its dependence on the fossil fuels that produce greenhouse gases…will mean that we can achieve the goals of AB 32 without adversely affecting the growth of California’s economy over the next decade, especially as the state recovers from the current economic downturn.12”
In addition, the following examples demonstrate that the Community’s forward looking sustainability goals only strengthen community cohesion and contribute to Palo Alto’s economic and social vitality: The community surveys conducted (2012) when developing the electric Carbon Neutral Plan
and participation in the PaloAltoGreen program indicate that there is wide support in Palo Alto to pay more for sustainable growth and to reduce the Community’s GHG emissions.
11
www.caleap.org 12
Updated Economic Analysis of California’s Climate Change Scoping Plan. Air Resources Board, March 2010.

City of Palo Alto Page 15
Utility bill savings from efficiency and conservation measures undertaken by Palo Alto residents (since 2007) are estimated at approximately $5 million per year—a 9% reduction in customer bills.13 --savings which can spur economic growth.
The growth of cleantech companies in Palo Alto and Silicon Valley has clearly added to the economic vitality of the community. In fact, a small but significant percentage of the Stanford Research Park is now occupied by cleantech firms.
Adaptation to Climate Change In addition to our GHG emissions reduction efforts, Palo Alto will also play a leadership role in developing regional approaches and state/national level efforts to adapt to the impacts of climate change, and pursue available options to reduce local risk. Low-lying areas of Palo Alto (generally east of Louis Road) are subject to tidal flooding and mandatory flood insurance purchase requirements due to the inadequacy of the network of earthen levees along the San Francisco Bay shoreline. The risk of tidal flooding will rise in the future due to anticipated increases in sea level and severe weather events associated with global climate change. Although Palo Alto has lessened the risk to life, property and infrastructure by preserving large areas east of Highway 101 as dedicated open space, there are still several thousand mostly residential parcels within the tidal floodplain. For detailed information and maps, including critical infrastructure that would be impacted by sea level rise, see the Local Hazard Mitigation Plan.14 The City’s primary local response to sea level rise will be to advocate for raising and strengthening of the system of Bayfront levees. The two agencies with primary responsibility for improving the levees are the US Army Corps of Engineers (Corps) and the Santa Clara Valley Water District (District). The Corps-sponsored South San Francisco Bay Shoreline Study is addressing the need for levee improvements in the South Bay. This study has been progressing very slowly, however, due to a lack of federal funding. The District has taken steps to accelerate the improvements through the use of local funding and State grant monies. The District has received a grant from the State Department of Water Resources to conduct design and environmental assessment of local levee improvements. In addition, the District ballot measure approved in the November 2012 election has $20 million earmarked for the study and design of levee improvements in Santa Clara County. Palo Alto staff continues to stay engaged in ongoing discussions with the District, as well as the San Francisquito Creek Joint Powers Authority and the City of Mountain View, on the need for levee improvements to protect the community from the impacts of sea level rise. The Office of Emergency Services (OES) is working in collaboration with these local agencies to improve local mitigation, response, and recovery plans and capabilities. Some of these activities may improve our Community Rating System posture in the National Flood Insurance Program.
13
See Fig D-4 in Attachment D, which shows that per capita electricity, natural gas and water consumption has dropped considerably since 2007. 14
http://quake.abag.ca.gov/wp-content/documents/2010LHMP/PaloAlto-Annex-2011.pdf

City of Palo Alto Page 16
Sustainability Governance In the past year, staff has developed new organizational approaches to support the City’s commitments to greater sustainability, through the efforts already underway and with new initiatives now being developed. Attachment E presents the enhanced sustainability governance structure, coordinated by the City’s new Chief Sustainability Officer, which will continue to spur sustainability action within City operations and the Community, and to provide leadership at the regional and national level. Future Vision for Climate Protection and Sustainability In the coming year, in coordination with the development of the City’s Comprehensive Plan, staff will develop a new CPP, and broaden the CCP’s scope into a comprehensive sustainability action roadmap. The new plan will continue Palo Alto’s leadership role by addressing the state’s aspirational GHG reduction goal of 80% reduction (from 1990 levels) by 2050, a stretch goal set by the California Governor’s order S-3-05 of June 200515. While the City has made substantial progress toward that goal—the 41% reduction already achieved—the easy parts have been done; meeting or exceeding the 80% target will require innovation as well as commitment, and it will have costs. CARB has begun regulatory proceedings in 2014 to examine how to reach this goal, though actual recommendations may be years away. In order to meet—or exceed—such an ambitious goal, the City will have to address big challenges with regard to Resource Flows and Efficiency; Structures and Infrastructure (including buildings, transportation and land use); Behavior (including purchasing, transparency, and coordination) including such topics as:
Reducing reliance on fossil fuels by switching fuel sources from natural gas and gasoline/diesel to carbon neutral electricity;
continued emphasis on EVs and supporting infrastructure;
reducing the need for vehicle traffic through smart transportation/land-use development, and a focus on mobility, access and convenience;
accelerating the evolution of both the City's new and existing building stock to more energy efficient and more economically viable structures, potentially through enhanced building codes and standards, incentive programs and education of property owners, developers and builders;
encouraging the development and deployment of breakthrough greening technologies through collaborative programs with the technology community;
applying the City’s “open data” and sustainability commitments to support engagement and innovation from government, business and residents;
embedding sustainability commitments into budgeting, procurement, management and performance-tracking systems;
15
Since CARB is also expected to delve into ways of meeting this long term aspirational 80% reduction goal for the state in 2013, the development of the new CPP could also be coordinated with this state effort.

City of Palo Alto Page 17
understanding the impact of City and Community economic decisions on Scope 3 GHG emissions (the emissions generated by our purchases of goods and services) and on sustainability for future generations;
actively collaborating with neighboring jurisdictions, and the Bay Area region, to effectively address issues that are beyond our ability to influence on our own.
NEXT STEPS In addition to these and other specific measures, the City will also need to revisit and examine—in the context of the new Climate Plan—our aspirations, goals and commitments.
Will we focus on meeting California’s goal of reducing GHG emissions to 80% below 1990 levels by 2050? Or by 2030?
Will we step from carbon neutral electricity by 2017 to a carbon neutral utility by 2020? A carbon neutral city by 2025? A 100% renewables city by 2030?
Will we be content to reduce our water use to meet each year’s drought requirements? Prepare to adapt to a new, drier normal, reducing water use 20% by 2020? Or begin to think about net zero water as well as net zero energy?
How will we engage with ecosystems and biodiversity, in our parks, gardens, forests and food systems?
And the all-important question that each organization and each person will ask: What would that mean to me?
Each of these feeds the three fundamental questions that the City will need to address, both for our own well-being, and for the contribution one small, innovative city can make to the sustainability revolution:
How good do we really want it to be?
What would it take—in technology, investment, innovation and personal change—to get there?
In view of those requirements, are we willing to do it—to make the necessary commitments, and to act to deliver the world we want?
These are some of the questions we will need to address in the planning process of the next year. Attachments:
Attachment A - Summary of 2007 Climate Protection Plan (PDF)
Attachment B - City Municipal Operations Emissions (PDF)
Attachment C - Palo Alto Community and City Municipal Operations GHG Emission (PDF)
Attachment D - Sustainability Initiatives of the City (PDF)

City of Palo Alto Page 18
Attachment E - Sustainability Policy and Organizational Structure (PDF)
Attachment F - Transportation and Sustainable Landuse (PDF)
Attachment G - Contributors to report (PDF)

Attachment A: Summary of 2007 Climate Protection Plan & Updates from 2010
Page 1 of 3
Summary Description of the 2007 Climate Protection Plan NOTE: Emissions estimate have been updated since 2007, and is reflected in the body of the report. This summary is for reference purposes only. In December 2007 Council approved a Climate Protection Plan (CPP) that set a short, medium, and long term goals to reduce City operations and community greenhouse gas (GHG) emissions. These goals were:
1. Short Term Goal: By 2009, the City Operations will reduce emissions by 5% from 2005 emission levels for a total reduction of 3,266 metric tons of CO2.
2. Medium Term Goal: By 2012 the City Operations and Community will reduce emissions by 5% from 2005 emissions level for a total reduction of 29,702 metric tons of CO2.
3. Long Term Goals: By 2020, the City Operations and Community will reduce emissions by 15% of 2005 levels, equal to 119,140 metric tons of CO2, and bring the community in line with State emission reduction goals.
Outlined below in Figure 1 and Figure 2 are the City’s and Community’s GHG emissions profiles, as outlined in the 2007 CPP. The City’s emissions of 65,329 Metric Tons of CO2e (MT CO2e) and the community’s emissions of 728,720 MT CO2e combined is equivalent to approximately 14 tons per resident. Electricity and natural gas related emissions account for approximately 40% of the 793,621 MT CO2e total municipal plus community emissions. (Note: the natural gas leakage estimate has since been substantially revised downwards, from 19,358 MT CO2e to 4,717 MTCO2e.)
Figure 1: Municipal (City Operations) GHG Emission Sources in 2005 (65,329 MT CO2e)
Source: Climate Protection Plan: December 2007
Note: Natural gas leakage numbers were updated with more accurate numbers since 2007 that resulted in considerable reduction in leakage estimates.

Attachment A: Summary of 2007 Climate Protection Plan & Updates from 2010
Page 2 of 3
Figure 2: Community GHG Emission Sources in 2005 (726,720 MT CO2e)
Source: Climate Protection Plan: December 2007
B. Short Term GHG Reduction Goals The City operations undertook a number of departmental level initiatives to meet the goal to reduce municipal GHG emissions by 5% at the end of 2009. Utilities energy efficiency and conservation programs were integral part of this effort. The initiative was classified under five main categories: employee education, electricity conservation and efficiency upgrades, paper use reduction, commute reduction, and waste reduction. A revised 2005 benchmark of 29,364 MT CO2e was established. This lower benchmark down from 65, 329 MT, figure 1 above) reflects the reduced estimate for natural gas leakage and biogenic emissions from the waste water treatment plant because the facility serves other cities too and Palo Alto has minimal control over those emissions.

Attachment A: Summary of 2007 Climate Protection Plan & Updates from 2010
Page 3 of 3
April 2010 Update In April 2010, staff reported to Council that municipal GHG emissions declined by 11% in 2009 relative to the revised baseline year of 2005 (excluding employee commute estimates) (CMR: 194:10). Emissions were down from 29,364 MT CO2e to 25,518 MT CO2e. The principle contributors to this reduction are outlined below:
Major upgrades and process improvements at the water quality plant, accounted for 75% of the reduction
o Replace natural gas used in the biosolids incinerator emission control equipment with landfill gas that had previously been burned in a flare
o Improve aeration system and replace air diffusers o Install more efficient motors and lighting fixtures
Upgrade building systems and fixtures o Lighting fixture upgrades at the Elwell Court building o Reduced lighting levels at selected locations o City hall upgrades: motors, boilers, HVAC system
Updated 2012 GHG Reduction Goal for the City Based on the progress made since 2007, City Council in 2010 increased the City municipal GHG reduction goal to 20% below 2005 levels by 2012.

Attachment B: GHG Emissions of City Municipal Operations
Page 1 of 3
Attachment B: GHG Emissions of City Municipal Operations: Year 2005 versus 2013 City municipal operations related emissions drivers and associated emissions are shown below.
Table B1: City Operations GHG Emission in 2005, 2012 and 2013 (in MT of CO2 equivalent) – Biogenic and Anthropogenic, no adjustment for hydro conditions of PAG purchases -
2005
2012 2013
Scope
1 Biogenic
Scope 2
Scope 1
Biogenic Scope
2
Scope 1
Biogenic Scope
2
Buildings and Other Facilities
8,723 0 1,819
7,016 0 1,155 5,502 0 0
Streetlights and Traffic Signals
689
534 0
Water Delivery Facilities
2 0 67
34 0 42 92 0 0
Wastewater Facilities
8,504 16,689 2,546
6,414 15,602 1,950 5,024 11,183 0
Vehicle Fleet 2,835 1 0
2,546 0 0 2,399 0 0
Power Generation Facilities
0 0 8,570
227 0 3,839 29 0 0
Solid Waste Facilities
6,846 5,853 29
4,336 3,827 19 6,642 5,789 0
Other Processes & Fugitive Emissions
3
9
9
26,912 22,543 13,720
20,582 19,429 7,539 19,697 16,972 0
Scope 1 and Scope 2 emissions are non-biogenic emissions and caused by human activity. Biogenic emissions are assumed to be net carbon neutral and not reported under GHG emission reporting protocols. Table B2 below shows the transformation of the Table B1 above by excluding biogenic emissions, and shows an emission reduction, since 2005, of 52%.
Table B2: City Operations GHG Emission in 2005, 2012 and 2013 (in MT of CO2 equivalent) – Excludes Biogenic, not normalized for hydro conditions of PAG purchases -
GHG Emissions comparison (Scope 1 & 2) 2005 2012
Water Delivery Facilities 69 76
Wastewater Facilities 11,049 8,364
Vehicle Fleet 2,835 2,546
Streetlights & Traffic Signals 689 534
Solid Waste Facilities 6,876 4,354
Power Generation Facilities 8,570 4,067
Buildings & Other Facilities 10,542 8,172
TOTAL 40,629 28,112
30.8%

Attachment B: GHG Emissions of City Municipal Operations
Page 2 of 3
Table B2 does not include the effects of the purchase of PaloAltoGreen resources and the normalization of the vagaries of hydroelectric supply conditions. The Table B3 below accounts for these two effects and shows a 53% reduction in emissions since 2005.
Table B3: City Operations GHG Emission in 2005, 2012 and 2013 (in MT of CO2 equivalent)
– Excludes Biogenic, normalized for hydro conditions and PAG purchases –
GHG Emissions comparison (Scope 1 & 2) 2005 2012
Water Delivery Facilities 74 64
Wastewater Facilities 11,269 4,659
Vehicle Fleet 2,835 2,546
Streetlights & Traffic Signals 748 387
Solid Waste Facilities 6,878 4,349
Power Generation Facilities 9,308 3,008
Buildings & Other Facilities 10,698 4,643
TOTAL 41,811 19,655
53.0% Note: There is not much of a change in emissions related to electric supply portfolio becoming carbon neutral in 2013 is because, the City electric supplies were largely neutralized with the purchase of PaloAltoGreen REC products in 2012.
Figure below graphically illustrates Table B3 and is a reproduction of Figure 1 from the body of the report.
Figure 1: City Operations GHG Emissions: 2005, 2012 and 2013 Total Emissions Reduced from 42,000 MT to 19,700 MT, a 53% reduction)
The primary drivers for GHG emission reduction since 2005 are:

Attachment B: GHG Emissions of City Municipal Operations
Page 3 of 3
Building and Other Facilities – Due to reduction in electricity consumption enactment of the Carbon Neutral Plan in March 2013, all electricity consumed by the City in 2013 had zero carbon emissions. With the purchase of RECs through the PaloAltoGreen program, city facilities electricity related carbon footprint was low in previous years too.
Power Generation Facilities – This category accounts for transmission and distribution system losses. City divested its ownership of the COTP transmission line in 2009 resulting in lower loss allocation to the City. Distribution loss related emissions also were eliminated in 2013 due to carbon neutral electric supplies.
Solid Waste Facilities – Closure and capping of the landfill, resulting in less methane production and leakage in CY 2012. Higher collection in CY 2013 likely to be attributable to additional capping during the year and a regulated fraction of CO2 in collected LFG (33%) remaining constant.
Streetlights and Traffic Signals – Conversions to LED streetlight (note, only metered fixtures are shown)and greener electric supply; 2013 no emissions due to carbon neutral supply
Vehicle Fleet – A slight reduction in consumption of gasoline and CNG fuels, along with a large reduction in diesel fuel.
Wastewater Facilities – Combustion of biogenic methane from landfill in incinerator (replacing natural gas), combined with greater level of renewable energy in regular electricity supply and purchase of PaloAltoGreen RECs.
Water Delivery Facilities – fluctuating energy use for water pumping

Attachment C: GHG Emissions of Palo Alto Community and City Municipal Operations
Palo Alto Community & City Municipal Operations GHG Emission: Reduction of 29% since 2005
City Municipal Operations* & Palo Alto Community GHG Emissions Summary Excludes Biogenic Emissions**, All units in Metric Tons (MT) of CO2 equivalent
Consumption
Quantity
2005
Emissions
in 2005 (MT of CO2e)
Consumption
Quantity
2012
Emissions in
2012 (MT of CO2e)
Consumption
Quantity
2013
Emissions in
2013 (MT of CO2e) Notes
Scope 1 Emissions
Natural Gas Use (in Therms) 31,374,970 166,350 30,086,536 159,519 30,336,076 160,842 1
Natural Gas Distribution Leakage 4,718 4,718 4,718 2
Palo Alto Landfill Fugitive Emissions 6,811 4,336 6,640 3
Wastewater Process Emissions 8,504 6,414 5,024 4
Scope 2 Emissions -- Actual
Total Electric Load in MWh 996,091 966,839 986,241
Hydro Supply (MWh) 548,760 413,584 406,570
Renewables Supply (MWh) 49,980 188,566 177,027
Brown Power Supply (MWh) 397,352 158,427 364,689 145,404 402,644 0 5a
Palo Alto Green Purchases (MWh) 30,601 (12,201) 75,805 (30,224) N/A 6
Scope 2 Emissions -- Weather
Adjusted***
Total Electric Load 996,091 966,839 986,241
Hydro Supply (MWh) 514,073 514,073 514,073
Renewables Supply (MWh) 49,980 188,566 177,027
Brown Power Supply (MWh) 432,038 172,257 264,200 105,339 295,141 117,675 5b
Palo Alto Green Purchases (MWh) 30,601 (12,201) 75,805 (30,224) 0 0 6
Scope 3 Emissions
Commute into, from, and within City 371,870 335,390 335,390 7
Life Cycle Emissions From Annual Total
Waste Placed in Landfills
69,491 24,823 43,947 15,698 45,411 16,221 8
Landfilling Recyclable meterial 54,838 34,680 35,836 8
Total (weather adjust., biogenic excl.) 797,970 635,870 564,671
Emission
Reduction
(since 2005)
20% Emission
Reduction
(since 2005)
29%
1
2
3
4
5
6
7
8
*
**
***
Notes
Total Community supply of natural gas use/delivery.
Calculated using total captured landfill gas, actual methane percentage; fugitive gas assumed to be 33% of captured. rate. 2005 estimate has been revised to
reflect current methodologies.
Represents N2O emissions from biological treatment process and release of Nitrogen.
a. Represents actual quantity of brown power related emission @879/lbs/MWh in 2005 and 2012; not applicable in 2013.
b. Weather normalized (for hydro electric generation) quantity of brown power. No GHG impact in 2013.Emissions saved due to purchase of PaloAltoGreen related RECs. PAG related RECs not included in 2013 due to Carbon Neutral electric supply.
Leakage from the natural gas distribution system- modelled result, unchanged over the period.
Study results from Fehr and Peer (03/19/2013) using Valley Transportation Authority regional transportation model based Vehicular Miles Travelled (VMT) and
vehicular profiles - does not account for Palo Alto specific parameters related to greater penetration of alternate fuel vehicles, bicylce use, etc. Study results
under review. 2013 assumed to be same as 2012.Based on characteristics and tons of material landfilled: 2005, 2011 and 2012 figures; Landfilled amount in 2013 up 3% in 2012 compared to 2011.
Table excludes biogenic emissions related to: Landfill gas flaring and WQCP sludge incineration.
Normalized to account for the vagaries of weather on hydroelectric supplies. No GHG impact in 2013.
Municipal emissions related to electricity and natural gas consumption included within utility load numbers; fleet vehicle emissions also assumed to be included
in community wide commute related emissions estimates made by consultant.
Attachment D: City Departmental Level Initiatives
Page 1 of 30
Attachment D: Highlights of Sustainability Initiatives by City Municipal Operations
This discussion is compiled in the order of the sections in the 2007 Climate Protection Plan (CPP). In each section, staff has evaluated actions taken to reduce City and Community GHG emissions. To the extent possible, staff has reviewed existing programs, described results and the potential actions or programs that will help reach future goals. The topics contained in this attachment are:
I. Utilities OperationsII. Sustainable Purchasing, IT and Administrative PracticesIII. City Fleet OperationsIV. City Facilities, Operations and Capital ProjectsV. Green BuildingVI. Zero Waste and Landfill Operations 95% needs Shiva reviewVII. Water Quality Control Plant (WQCP) Operations 95%, needs Shiva reviewVIII. Education, Motivation, and Community participation 50% needs Gil review
Attachment F discusses the topic of Transportation and Sustainable Land Use, an important area that accounted for more than half of the Community GHG emissions in 2013.
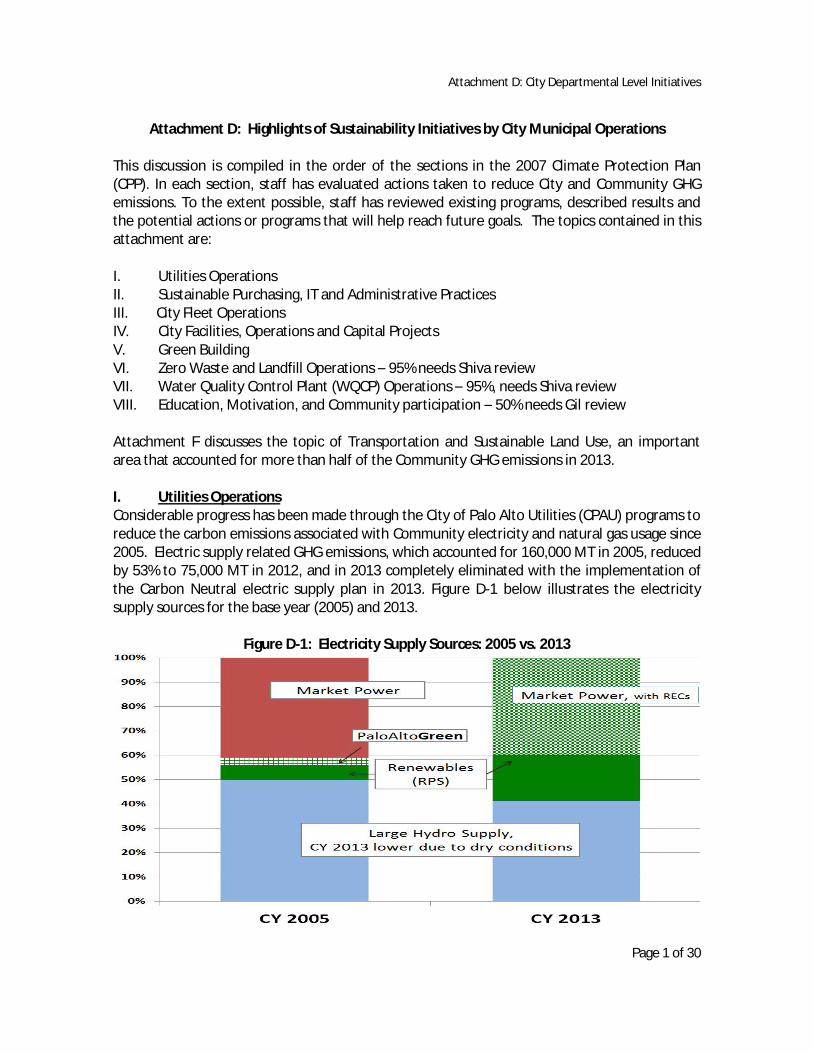
I. Utilities OperationsConsiderable progress has been made through the City of Palo Alto Utilities (CPAU) programs to reduce the carbon emissions associated with Community electricity and natural gas usage since 2005. Electric supply related GHG emissions, which accounted for 160,000 MT in 2005, reduced by 53% to 75,000 MT in 2012, and in 2013 completely eliminated with the implementation of the Carbon Neutral electric supply plan in 2013. Figure D-1 below illustrates the electricity supply sources for the base year (2005) and 2013.
Figure D-1: Electricity Supply Sources: 2005 vs. 2013

Attachment D: City Departmental Level Initiatives
Page 2 of 30
electric supply in 2013 was either large hydroelectric generation, long-term contracts for renewable energy, or market purchases which were made carbon neutral with the purchase of Renewable Energy Certificates (RECs). The lower hydro supply in 2013 is due to drier conditions. Renewable energy supplies are expected to increase from 19% in 2013 to 33% by end of 2015.
electric needs are expected to be supplied by carbon-free hydro supplies and long-term renewable resources.
Natural gas supply related GHG emissions have remained relatively flat since 2005, with efficiency and conservation programs and reduced customer consumption accounting for a 2.6% reduction in load. Natural gas related emissions in 2013 were estimated at 161,000 MT. CPAU is seeking Council approval of a PaloAltoGreen Gas program whereby customers could negate the GHG impact related to the use of natural gas at their homes and businesses by purchasing high quality environmental offsets.
Energy Efficiency and Conservations in the CommunitySince 2005, onservation programs for the community have contributed to considerable reductions in customer energy usage and bills, along with the associated GHG emissions reduction. Figures D-2 and D-3 illustrate the impact of energy efficiency on the projected electric and gas sales, respectively.
Figure D-2: Impact of Energy Efficiency on Electric Sales

Attachment D: City Departmental Level Initiatives
Page 3 of 30
Figure D-3: Impact of Energy Efficiency on Gas Sales
In addition to CPAU efficiency and conservation programs1, state and federal energy and water efficiency appliance and equipment standards help residents reduce energy consumption further as illustrated below. Figure D-4 shows that per capita residential electricity, natural gas, and water consumption have declined by 11%, 15%, and 17%, respectively since 2007. Energy efficiency improvements and more stringent building codes and standards explain much of this trend.
Figure D-4: Residential Per Capita Utility Consumption Declining
1
and conservation program related savings are computed based on specific measurement criteria mandated by state law. This tends to undercount actual savings and does not account for improved appliance and equipment efficiency standards. Improved building codes and appliance efficiency standards are included in the sales forecasts.

Attachment D: City Departmental Level Initiatives
Page 4 of 30
On the other hand, absolute resource consumption has not moved as dramatically, as shown in Figures D5, D6 and D7. Staff is in the process of closely examining the reasons behind this trend, in order to be able to more effectively reduce both normalized and absolute resourceconsumption and impacts in the future.
Figure D-5: Natural Gas Use (Therms/year)
Figure D-6: Electricity Use (kWh/year)

Attachment D: City Departmental Level Initiatives
Page 5 of 30
Figure D-7: Water Use (ccf/year)
CPAU Energy Efficiency Program AchievementsState and Federal agencies continue to tighten appliance efficiency standards and code requirements leading to additional energy savings for the community. These savings contribute to the overall decline in per capita energy and water consumption as shown in Figure D-4, but cannot be counted to meet Council-established gas and electric energy efficiency goals. CPAU continues to aggressively pursue those goals and expects to achieve an additional reduction of 4.8% of electricity usage and 2.8% of natural gas usage by 2023.
In FY 2013, customer DSM programs achieved electric, gas and water savings of 0.85%, 1.13% and 0.53%, respectively, of projected annual consumption. Key CPAU program achievements in FY 2013 are highlighted below:
The Labs Efficiency program, administered by third-party vendor Willdan Energy Solutions, delivered gas and electric savings from two project sites.
Two new programs were added during FY 2013 providing direct installation of energy and water efficient devices to hard-to-reach customers (small businesses and multi-family buildings).
In April 2013, -based non-profits
to raise awareness about water resources, conservation and drive participation in conservation programs. The second annual Great Race to Save Water is on April 19, 2014.
In April 2013, the City Council approved a contract renewal with OPower for the continued delivery of quarterly Home Energy Reports (with online access to monthly

Attachment D: City Departmental Level Initiatives
Page 6 of 30
data) to approximately 17,700 residential customers for three years beginning July 2013. Additionally, a new Home Water Report produced by WaterSmart will be sent separately to residential customers until the two platforms can be integrated into asingle report.
In May 2013, the City Council approved a contract with the Center for Sustainable Energy California to administer the state-mandated solar water heating (thermal) program, with the option to extend the program for up to four additional years.
As required by state law, in December 2012 the City Council adopted updated ten-year energy efficiency (EE) goals to be achieved between 2014 and 2023. These updated electric and gas efficiency goals were based on an extensive analysis of the potential,achievable, and cost-territory.
Water efficiency and conservation programs have achieved more than 5% reduction in waterconsumption since 2005; these savings have minimal impact on the Csince the Hetch Hetchy supplies are largely gravity powered.
Specific DSM programs include: direct installation of efficiency measures for low income customers, rebates for installation of efficient appliances and equipment, education programs, residential energy use audits, home energy reports, commercial customer programs (by end use and type of business), a green building construction program, and many others. CPAU continues to review and enhance its programs for all members of the community, whether low income or a major international corporation.
The City is in the process of issuing an RFP to retain new contractors to assist with the administration, marketing, and management of DSM programs starting in the fall of 2014. The July 2014 introduction of new, upgraded Title 24 building and appliance energy standards will further enhance energy efficiency baseline standards, but this also will result in reduced potential for CPAU to influence additional and incremental energy efficiency savings over and above the more stringent energy code. CPAU staff is working collaboratively with the
optimally use utility energy services.
Utility Distribution System OperationsCPAU also continues to minimize the impact of the operation of its distribution systems on the environment. Such initiatives include:
Replacing Street Lights with LED Fixtures: of the com Over the past 3 years, with the help of Federal grants, the City has invested $1.3 million to replace approximately half of the lights with new LED based street lighting which has alower energy consumption, reduced maintenance cost, and a higher illumination level.

Attachment D: City Departmental Level Initiatives
Page 7 of 30
This investment is expected to reduce annual maintenance cost by 30% and annual energy consumption by 60%, resulting in a simple payback of 8 years.
Another 2,300 streetlights will be replaced by the end of 2014. The remaining 15% of the streetlights, which are mostly decorative or special type lighting, is expected to be replaced at a later time when suitable fixtures become available.
Control and Management of Sulfur-hexafluoride Equipment and Replacement: Sulfur-hexafluoride (SF6) is a highly potent GHG. Due to its characteristics as a good electrical insulator, SF6 gas based electrical equipment gained popularity three decades ago. The City purchased several of these devices for substation and distribution system installation. Since the impact of this gas on the climate was identified, CPAU has stopped purchasing them, has maintained strict protocols to ensure the gas does not leak from existing equipment, and has begun replacing them with more benign equipment when equipment end of life approaches. To date a few pieces of equipment have been replaced, but 30 circuit breakers and 35 switches remain. The reminder is expected to be replaced over the next decades as they age.
Upgrade of Electric Distribution Voltage: Over the past few decades, CPAU has been converting the voltage of the distribution system from 4 kV to 12 kV to reduce distribution line losses, reduce the type of spare equipment purchased and stored for emergencies, and reduce maintenance cost.
Customer Engagement with Advanced Meters: A 300-home pilot program called was launched in December 2013 with advanced electric, gas and
water meters that will enable customers to have access to hourly utility consumption data and analytical tools to assist with better utilization of utility services. The objective of the program is to gauge interest and applicability of this technology within Palo Altoand to observe how residents might reduce energy usage through such feedback.
An early anecdote illustrating the value of this technology came in January 2014, when a customer discovered a large leak in his irrigation system by viewing the utility portalprovided through the program. The early detection of the leak, instead of waiting until the monthly utility bill arrives, saved this customer more than $200. Shown below is the illustration of the customer portal that shows high water use for 8 days at the end of December, before the leak was discovered and fixed.

Attachment D: City Departmental Level Initiatives
Page 8 of 30
For further information, see: www.cityofpaloalto.org/ULTcustomerconnect
Purchase of Battery Powered Bucket Truck Lifts: CPAU is exploring the purchase of two bucket trucks that will have battery-powered bucket lifts to eliminate the need for the engine to idle while construction is in progress. This will enhance safety, and reduce noise pollution and GHG emissions.
Emerging Technology Demonstration: In 2012, CPAU launched a program to open up the
prove their value another way the City is helping to meet the challenge of climate change. Since its launch, 24 applications were received and 6 technologies are in the process of being demonstrated. See: www.cityofpaloalto.org/UTLinnovation.
Utilities Plans for the Coming Years (2014 to 2020)CPAU plans to continue its programs to reduce GHG emissions, and has many plans in place including the following:
Continue to aggressively pursue energy efficiency and conservation opportunities, as well as support the Planning and Community Development Department in encouraging green buildings and permitting processes. These programs are expected to reduce electricity usage by an additional 4.8% and natural gas usage by an additional 2.8% by 2023.
Encourage local solar PV resource investments through rebates and guaranteed energy buy-back program in the Palo Alto CLEAN program. In addition staff plans to implement three new programs under the proposed Local Solar Plan scheduled for Council consideration on 4/21/2014. The three new programs under the plan are: 1) a

Attachment D: City Departmental Level Initiatives
Page 9 of 30
community solar share program for residents who do not have suitable roofs to obtain the output of a local solar project, 2) a donation program to get solar on the roof of schools and local not-for-profit organizations; and - program whereby residents who are interested to have solar on their roofs could collectively buy and install systems and enjoy the economies of scale associated with bulk-buying, potentially bringing down cost by 10-25%. The overall objective of the Local Solar Plan initiatives is to generate about 4% of the Citywide load through local PV system by 2023, a 5 fold increase from current levels.
Under the proposed new PaloAltoGreen Gas program, which Council is scheduled to consider on 4/21/14, customers will have the opportunity to neutralize the GHG emissions related to their natural gas combustion. If 20% of the households participate in the program (as in the PaloAltoGreen (electric) program), the program has the potential to reduce GHG emissions by approximately 16,000 MT, a 10% reduction from the 160,000MT of GHG emission associated with natural gas combustion in Palo Alto.
Staff analyzed the opportunities and cost effectiveness of switching from natural gasappliances to electric appliances in single-family homes and provided the results to the Council in February 2014 (Staff Report ID #4422). The results suggest that fuel switchingfor residential appliances is not cost effective at this time, and that the purchase of
environmental off- cost-effective way to neutralize GHG emissions associated with natural gas combustion. However, staff is evaluating whether to encourage all-electric homes, especially for new construction opportunities, when fuel switching opportunities could be more cost effective compared to retrofitting.
The Georgetown University Energy Prize is a $5 million prize to be awarded to a small to mid-sized community that demonstrates substantial progress in implementing energy efficiency and conservation programs. Communities will be judged on their ability to save energy (electric and natural gas) from January 1, 2015 to December 31, 2016 in residences, public schools and municipal buildings. Communities will also be evaluated on the extent their programs spur innovation, are replicable and scalable, and on their plans to continue to decrease their energy consumption even after the evaluation period.
The City is planning to participate in this competition with active community support, but the chances of winning the prize may be low, due to success of already implemented energy efficiency and conservation measures in Palo Alto.
Continue to procure renewable resources to meet Renewable Portfolio Standard (RPS) of at least 33% of electricity sales coming from renewable energy sources by 2015and to implement the Carbon Neutral Plan so that renewable energy supplies are close to 50% of supply by 2017.

Attachment D: City Departmental Level Initiatives
Page 10 of 30
After successful implementation of the pilot, make residential Electric Vehicle (EV) Time-Of-Use rates available to all residents in the City because:
o Charging EVs during peak use times could impact local distribution transformers and require expensive upgrades.
o Charging EVs at night and in the early morning reduces the cost to purchase electricity
o Faster adaptation and lower cost of operating EVs will also reduce Community GHG emissions.
Based on California Energy Commission (CEC) projections, Palo Alto may have 3,000 to 10,000 residential and commuter EVs charging in the City by 2020, which would reduce Community GHG emissions by 1.5% to 5% by 2020. These EVs are expected to increase Community electrical usage by 1% to 3% in the same timeline an increase that should largely be offset by new local solar generation.
Low Carbon Fuel Standards (LCSF) regulation provides a mechanism for electric utilities to claim GHG credits, to the extent EVs charge within the utilit service territory. The LCSF allowance thus allocated to the electric utility must then be monetized and used for EV-related programs. CPAU is in the process of claiming these emission allowances and will bring to the Council a recommendation of how this value could be channeled back to the benefit of EV owners. The allowances are expected to have a value of approximately $60,000 per year in 2014, but would grow with greater EV adoption in town.
Evaluate the implementation of advanced metering infrastructure and smart gridsystems throughout the city based on the results of the pilot projects underway.Preliminary results suggest a 1-2% energy/water consumption reduction could be achieved by diligently implementing and maintaining smart grid systems, and establishing effective communication channels with customers.
Evaluate the use and benefits of Distribution Automation equipment to improve electric system operating efficiency, improve service reliability, and increase energy efficiency.
II. Green Purchasing, IT & Administrative Practices
Green PurchasingProducts and services acquired by the City will have an environmental impact during their manufacture, distribution, use, and disposal. Incorporating environmental performance criteria into procurement decisions can have a significant impact on the as supporting other sustainability policies and programs such as Zero Waste, green building,
services, in conjunction with the environmental purchasing efforts of other Bay Area or State

Attachment D: City Departmental Level Initiatives
Page 11 of 30
Public Agencies, has impacts beyond City of Palo Alto operations, as these purchases contribute to expanded market demand and access to these products and services.
Many purchases that are environmentally preferable are also fiscally preferable because of less material use (e.g., paper when copiers and printers are set to duplex), reduced maintenance (e.g., structural pest control which relies on long-lasting structural repairs instead of expensive automatic monthly spraying or other chemical control), and direct costs, (e.g., remanufactured toner cartridges, which when specified correctly cost approximately 30-60% less per copy than new cartridges). Other cost savings can be seen through the use of reduced-risk products whichdecrease potential harm to users and to the environment and reduced disposal and end-of-life costs.
The CPP authorized the implementation of a green purchasing program in 2007, and adopted a Green Purchasing Policy in 2008 which supports existing environmental policies and Council direction to reduce GHG, pesticides, mercury and achieve Zero Waste and pollution prevention goals. The existence of a green purchasing policy allows the City to qualify for certain state wide grants, including a $250,000 grant the City received from CalRecycle for street maintenance. Palo Alto has greened many of its goods and services and received the 2011 Green California Summit and Exposition Award for Leadership in Green Purchasing
The following products and services are purchased using green purchasing criteria:
Office Supplies: In 2013, The City approved a new office supply contract with Staples. The new contract allows staff to purchase materials over the Staples website. Staples is working with staff to block the purchase of those items that are prohibited by City environmental policies or other established goals a function that was not available in the previous contract. The website also encourages the purchase of greener items by guiding users to a convenient drag-down list of greener selections for an array of products (e.g., pens, paper, folders, binders).
Staples has a robust program to right-size boxes and reduce packaging and it can provide a reporting function on environmental impacts of purchasing certain commodities such as recycled-content copy paper and remanufactured toner cartridges.
The City is currently transitioning from its use of 30% post-consumer content recycled copy paper to 100% which is less energy-intensive to manufacture. When the transition is complete Staples estimates that the City will reduce approximately 80 metric tons of C02 emissions through its copy paper purchases. The City is offsetting the greater cost of 100% recycled paper by purchasing high-quality remanufactured toner cartridges which by themselves reduce waste and GHG emissions, for projected net savings of $9,400.
In 2014, staff will work to further increase the purchase of recycled content office paper and other supplies and revisit the status of priority goods and services to green. It will

Attachment D: City Departmental Level Initiatives
Page 12 of 30
also be able to provide more detailed metrics about the impacts of this contract after one full year of use.
Copiers and printersduplex capability, preset to provide that function before they are deployed for use. Printers with a duplex function are replacing older models as they are phased out. Through these efforts an initial assessment in 2010 (based on 2009 use) indicated a 15% reduction in paper use and annual savings of approximately $7,000 in paper costs. This number has not yet been revised to reflect more recent paper purchases. In 2014, staff will work with IT to update these efforts to ensure that these settings are in check for all new computers that were deployed in 2013.
IT also requires that computer and monitor purchases ds. EPEAT criteria incorporate environmental attributes that attempt to address the full lifecycle of electronic products, including the reduction or elimination of environmentally sensitive materials, material selection, design for end of life, energy conservation, corporate performance and packaging.
Low-mercury fluorescent lighting
Discontinued use of hand soaps containing triclosan anti-bacterial product associated with water quality and potential human health issues
Discontinued use of spray insecticides and poison rodenticides. Structural pest control requires the rigorous EcoWise Certification (Palo Alto was the first to require this certification) and additional requirements for local reporting and bee protection.
Use of locally-sourced mulches, OMRI certified organic fertilizers and other waste reducing measures mentioned in the Bay-Friendly landscaping standards in landscape maintenance contracts.
place an emphasis on reduced-toxicity and higher recycled content (these same standards for City staff use will be explored in the coming months).
Out-sourced printing services must use a minimum 30% recycled-content paper when available and utility inserts are printed on 100% post-consumer content paper.
These following additional measures seek to avoid the purchase of certain materials which can indirectly reduce GHG emissions:
Expanded foam food ware and plastic bags are not distributed at City-sponsored events.

Attachment D: City Departmental Level Initiatives
Page 13 of 30
A portable drinking water station is available for use at some special events to reduce the use of single-use water bottles. (The City adopted a policy of no bottled water at City sponsored events, but this appears to be honored inconsistently.)
Boilerplate language in Purchasing contract Terms and Conditions has been revised to require, where feasible, extended producer responsibility, disallow the use of expanded foam plastics as packaging material, and standards for energy and water efficiency and Zero Waste. This revision was part of a larger regional effort led by Palo Alto staff and City of Sunnyvale and City of San Jose partners to encourage other municipalities to follow suit.
In addition:In select contracts, additional evaluation points are given to those companies that are Certified as a Bay Area Green Business
Multiple life cycle costing workshops have been held by Utilities for key accounts and staff. Staff will explore extension of LCC methods to other spending categories, and will schedule additional workshops as needed.
On the other hand, these new purchasing requirements are not yet implemented consistently. While the City has made good strides on its green purchasing program, the very limited staff time available to run this program has not supported regular tracking of implementation and
and other environmental goals. In FY 2015, staff will determine priorities and goals for strengthening this initiative, and develop plans for expanding and leveraging green purchasing,and quantifying the impacts of the program.
IT & Administrative Service Department Related Initiatives Effort to switch to laptops from desktops could assist with reducing energy consumption by more than 50%
Increased the temperature setting in the server room, reducing the air-conditioning loads marginally
Established duplex printing capability, to reduce single-sided printing
Established Green IT Purchasing guidelines striving for the procurement of EPEAT Gold-rated IT equipment as well as the reduction of expanded plastics in packaging materials
Deployed video conferencing capabilities in City facilities to support more virtual meetings allowing for less travel

Attachment D: City Departmental Level Initiatives
Page 14 of 30
Make the Budget and Audited financial statements available electronically and reduce the amount of printed copies over the past 5 years approximately 40% paper reduction.
Planned Activities
for any new technology initiatives reducing energy costs for power and cooling in the Data Center. Establishing a Data Center Footprint Reduction initiative performing consolidation via virtualization and Cloud technologies
III. City Fleet Operations
Fleet Operations has strived to reduce the carbon foot print of the fleet. These efforts and accomplishments include:Reinstated a vehicle replacement program to remove older, more polluting and less-fuel efficient vehicles, and replace them with newer more efficient ones. The city will invest approximately $3.5 Million to purchase new vehicles. Fleet Maintenance has committed to the use of CNG fueled vehicles and initiated the purchase of 17 new Honda CNG Civics. The Honda
CNG Civics are on the road and all of the older civics have been sold. Fleet Maintenance also put in
service one new CNG pickup truck, one new CNG van, and are looking at adding purchasing one additional CNG pickup truck.
Maintaini -up electric generators (COBUG), reducing the required testing run time down from 8 hours per week to 2 hours per month and saving natural gas usage
Completed an under- inated vehicles from the fleet thus reducing fuel usage on those older vehicles.
Completed retrofit of heavy duty diesel equipment with particulate filters to reduce the harmful diesel particulates generated (PM10 level) by diesel engine.
Fleet staff is working with the Utilities Department on the evaluation of two battery powered bucket truck lifts and with Public Works on a battery supported pavement parking truck to eliminate truck idling during maintenance.
Following all OEM recommended oil change interval to help reduce used oil and oil filters added to the waste stream. Also use several re-refined oil and antifreeze products in service inventory to further reduce additional waste products from entering the waste stream. Waste oil filters are recycled and waste oil is re-refined and reused thus reducing demand for new oil.
Decreasingmiles (2005) to 1.50 million in 2012- a 19% drop. The resulting reduction in transportation fuel use is illustrated below.

Attachment D: City Departmental Level Initiatives
Page 15 of 30
Elimination of the city landfill operations allowed for the disposal of several pieces of large construction equipment
Figure D5: Illustration of Fuel Use Pattern by Fleet - 2005 to 2013
Correspondingly the fuel related emissions have also dropped from 2,833 MT (2005) to 2,399 MT in 2013, a 15% reduction as shown in the table below. It is also estimated that the resulting fuel cost savings is $100,000 to $150,000 per year.
Table D1: Fuel Use and Corresponding GHG Emission Trends: 2005 to 20132005 2006 2007 2008 2009 2010 2011 2012 2013
Fuel Use
Gasoline gal. 149,861 156,142 152,153 146,398 131,096 137,850 146,595 147,849 146,479
Diesel gal. 97,676 103,888 131,810 131,423 122,341 126,500 134,262 95,036 83,539
Biodiesel (B20) gal. 46,667 27,261 0 0 0 0 0 0 0
CNG (City operations) gge. 20,217 18,799 28,197 36,387 36,713 49,948 36,554 40,136 37,854
CNG (including PASCO, PAUSD) gge. 44,273 60,928 80,491 88,088 86,786 87,635 85,872 91,125 86,570
Fleet Emissions
Gasoline tons 1,316 1,371 1,336 1,285 1,151 1,210 1,287 1,298 1,286
Diesel tons 997 1,061 1,346 1,342 1,249 1,292 1,371 970 853
Biodiesel (B20) tons 381 223 0 0 0 0 0 0 0
CNG (City operations) tons 139 129 193 250 252 343 251 275 260
CNG (including PASCO, PAUSD) tons 304 418 552 604 595 601 589 625 594
Total 2,833 2,783 2,875 2,877 2,652 2,845 2,909 2,544 2,399
Planned Activity in the next 5 yearsApproximately 200 vehicles are scheduled for replacement over the next five years which will remove older, less fuel-efficient, vehicles (some over 20 years old) with newer cleaner burning vehicles. 73 vehicles scheduled for replacement between FY's 13 and 14, 32 vehicles in FY16, 53 vehicles in FY17, 24 vehicles in FY18, and currently have 16 vehicles on the replacement list for FY19. Included in those 200+ vehicles are 38 CNG vehicles that will be replaced "in-kind" with new CNG. Replacement vehicle specifications have focused on fuel efficiency, low emissions, and modern build techniques.
Staff is considering Electric Vehicle Zero Emission units for specific uses or as pool use replacement vehicles. Questions to be addressed include increased initial purchase cost plus the cost of needed charging infrastructure.

Attachment D: City Departmental Level Initiatives
Page 16 of 30
IV. City Facilities Operations & Capital Improvements, and Public Works Projects
The Public Works department is committed to building, managing and operating City buildings and infrastructure in a sustainable manner. Sustainable practices are incorporated into major building renovations and everyday work practices.
Building Retrofits
The City Hall building upgrade project over the past 7 years has resulted in noticeable reduction in energy and water consumption. The project included the installation of new boilers, chiller fans, upgrading motors to premium efficiency, converting electric reheat coils to hot water reheat system, replacing the variable air volume (VAV) box and associated controls, installing a modern building management system, lighting sweep control systems, etc. It is estimated these upgrades have reduced City Hall electricity and natural gas bills by about $50,000 per year (a reduction of about 9%) in 20122.
Other recent building renovations include LEED certified buildings such as the Art Center, Downtown Library, and the soon to be completed Mitchell Park Library and Community Center.
Focused energy efficiency and conservation efforts in all city facilities resulted in close to 9% reduction in electricity consumption and 21% reduction in natural gas consumption between 2005 and 2012, resulting in utility bill savings of more than $50,000 per year> However, utility usage began increasing in 2013 due the new air-conditioning load at the Art Center and the larger footprint of the Mitchell Park library. .
Building Management
In addition to implementing sustainable practices, the overarching operational objective of Facilities is to maintain the building in good order for the comfort of the occupants and users, reduce the operating cost of maintaining the buildings, and extend the useful life of the buildings. In this regard, reducing the energy and water usage is an important consideration.
Facilities recently purchased building energy management software that allows individual building managers to better track, analyze, and report on utility consumption and cost. Improved data reporting creates more accountability of energy usage. Data from the
result of a water leak or faulty equipment. It also makes it simpler to track the outcome of conservation efforts. The application can also be utilized to determine which buildings are consistently using more energy than others of a similar size and usage and if needed, be used as a basis to propose a Capital Improvement Project for building system upgrades. Th
2 Most of this equipment was replaced because they were near the end of their useful life. However, computing simple payback in purely financial terms, the estimated payback was approximately 22 years.

Attachment D: City Departmental Level Initiatives
Page 17 of 30
Manager software, with similar buildings in the state and the nation.
Building Maintenance
Sustainable work practices for cleaning maintenance include cleaning with environmentally friendly chemicals that are Green Seal Certified and using paper towels in restrooms that contain no chlorine and high in post-consumer content. Pest management also focuses on prevention and then using non-toxic pesticides.
Sustainable work practices for building system maintenance include improvements in mechanical, electrical, and plumbing systems. Mechanical improvements include the use of cool roofing materials to meet Title 24 Building Energy Efficiency Standards, replacing air conditioning units with more energy efficient units (when existing units need replacement) and using Building Management Systems (BMS) to control and monitor and mechanical and electrical equipment (including lighting) via computers in some facilities. Electrical improvements include the use of high efficiency T8 lamps, some beginning implementation of LED parking lot lighting, the use of occupancy sensors for office lighting, and bi-level lighting for parking garages. Plumbing improvements include the use of low flow urinals and low flow toilets.
Land and Water
Public Works staff continues to promote measures that reduce storm water runoff and associated urban pollutants in order to improve the health of local creeks and San Francisco Bay. Using specially-designated revenue from the monthly storm drainage fees charged to developed properties throughout the City, the Storm Water Rebate Program offers financial incentives to residents and businesses for the installation of rain barrels, rainwater cisterns, permeable pavement, and green roofs.
deficiencies in the Southgate neighborhood. The project includes the construction of bio-retention planters at selected intersections that will intercept, infiltrate, and filter storm water runoff. The planters will be filled with native plants and permeable soil media that will treat and reduce runoff before it is discharged to the storm drain system. A number of existing concrete/asphalt walkways and crosswalks in the neighborhood will also be replaced with permeable interlocking concrete pavers to further reduce storm runoff.
Park renovation projects managed by Public Works incorporate sustainable landscaping and turf elimination to conserve water whenever possible. The Cogswell Plaza project and Eleanor Pardee Park project are projected to save more than 360,000 gallons per year.
EV chargers

Attachment D: City Departmental Level Initiatives
Page 18 of 30
With state grant funds, Facilities installed 5 electric vehicle chargers at 3 downtown garages in 2011 and an additional 5 chargers in 2013. In CY 2013, 9,600 charging sessions took place at the 5 smart chargers, up 50% from CY 2012 levels. These chargers using 70,000 kWh of electricity at a cost of $7,500 to the City. The estimated GHG reduction as a result on such charging is estimated at 35 MT of CO2 equivalent.
The City just received Notice of Proposed Award of $34,500 funding from CEC (solicited in collaboration with BACC) for 3 additional dual-port charging units. Two units are to be located at the Cowper/Webster Lot J Garage and one unit to be located at High Street Lot R Garage. That totals 6 J1772 ports. The dollar value is approximately $11,500 per unit for a total of $34,500. All costs for the units and installation are covered by the grant. (Matching funds are supplied by equipment discount from ChargePoint). Palo Alto will be responsible for network service charges of $230/port/year over the 2 year term of the grant.
Urban Forestry
January 2011 a resource analysis which qustreet trees found that street trees provided about $6.6 million in annual benefits, at a benefit/cost ratio of $3.22 for every $1 spent. Notable benefits included reducing annual electric energy consumption by 3,729 megawatt hours (MWh) and natural gas consumption by 75,183 therms, sequestration of 2,264 tons of carbon plus an additional 1,567 tons avoided due to decreased energy use, and interception of 42.6 million gallons of stormwater. (This analysis only quantified street tree benefits--accounting for less than 10% of the total tree population.) Some benefits were not included such as consumer preference which has been shown with healthy trees and landscaping to increase willingness to pay for retail goods and services by 11% (correlating to increased sales tax), or longer asphalt duration of 5-10 years due to shading, or reduced gasoline volatilization from parked cars. Many ecosystem services cannot be effectively monetized such as benefits to human health, sense of place, or enhanced learning environment, but are nonetheless essential to the quality of life enjoyed in Palo Alto. Staff plans to repeat this analysis on an annual basis starting in FY 2015, and is exploring research methods to analyze the entire urban forest across ownerships and resource types..
Staff participated in developing the draft Urban Forest Protocol with Climate Action Reserve, posted in March 2014 on the Urban Forest Revision webpage, along with the public workshop notice and online form to submit public comments.

Attachment D: City Departmental Level Initiatives
Page 19 of 30
V. Green Buildings
The City of Palo Alto Green Building Program celebrated ten years of operation during the 2013 Fiscal
Year. Over the past decade, the City of Palo Alto established itself as a national leader for its progressive, high-level program for a new generation of efficient buildings in Palo Alto, which are environmentally responsible and healthy places in which to live and work.
-profit organization. The City has required Green Point Rated recognition, the Build it Green home rating system, on residential projects since 2008.
City of Palo Alto Green Building Program: Ten Years in Review
checklists at early stages (Architectural Review) of an application to ensure an integrated approach for projects. In 2007, zoning ordinance changes outlined voluntary compliance criteria, followed in 2008 by a Green Building ordinance requiring Green Point Rated (Build It Green) compliance for residential projects and Leadership in Energy and Environmental Design (LEED) Silver level compliance for non-residential projects meeting certain size thresholds.
Following the 2008 ordinance, City staff has recommended updates to the ordinance to Council each year, including addition of Home Energy Rating System (HERS) requirements for existing
amendments to CalGreen required a higher level (Tier 2) compliance as mandatory (approximately LEED Silver level plus 15% additional energy efficiency for buildings beyond Title
Neighborhoods as a voluntary program, intended to measure the success of a project in meeting community goals for walkability, access to transit, provision of mixed uses and services, and open space design, etc.
ment expanded to include these project types. The inclusion of Alterations and Additions significantly increased the total amount of projects that required green building mandatory requirements.
2003-2013 Accomplishments:
The City uses Green Halo, a cloud-based tracking software, to monitor construction and demolition waste. The software enables customers and Development Services personnel to monitor and manage the Construction & Demolition waste diverted from

Attachment D: City Departmental Level Initiatives
Page 20 of 30
local landfills. The program has streamlined the process for contractors in the field to track their waste diversion tags in a simple and streamlined manor.
The City passed an ordinance to pre-wire new homes to fit electric vehicle (EV) charging stations. The ordinance requires that new residences install a 208/240V, 50 amp grounded AC outlet (Level 2 Electric Vehicle Supply Equipment).
The first LEED-ND pilot program (LEED for Neighborhood Development) in the nation for hborhood project,
including features that reduce dependence on automobile use, increase walkability, and encourage healthy living. The program lasted one year.
The city developed an initiative to disclose energy use for existing buildings undergoing small renovation work. This initiative helped city staff to better understand the performance of these existing buildings to assist in the development of future energy efficiency policy.
r new City buildings (e.g., the Downtown Library; Mitchell Park Library and Community Center and the Art Center) and new private buildings over 5,000 square feet; increased energy efficiency 15% beyond the state mandatory level, with rebates available through the Utilities department for even higher levels of savings;
Palo Alto was an early adopter of the California Green Building code during the CA voluntary adoption phase. During this period, the city
developed a strong knowledge base of how to enforce the Code. In 2011, the code became mandatory for all cities in California. Due to its early adoption of the code, Palo Alto became a leader in green building code enforcement. Palo Alto continues to maintain a reputation for aggressive green building code enforcement.
Staff continues to work with Utilities staff on publicizing energy efficiency and solar rebate programs;
New single-family residential construction required to have a minimum level of green building compliance (70 GPR points, with increasing points required for larger homes.).
California Green Building Code (CalGreen) was adopted by reference in 2010 and 2013,
building performance thresholds.
In 2011, it was estimated that a little over 2,000 people are either working or living in
building projects were on record throughout the City. At the end of FY 2011, over 240

Attachment D: City Departmental Level Initiatives
Page 21 of 30
had been completed or were under construction. Projects are using one of the following standards: LEED, Build It Green GreenPoint Rated (GPR), or the California Green Building Code with locally adopted enhanced measures (CALGreen).
The City has monitored its progress with annual updates to the codes through 2011. The 2011 report noted a practice of annual tracking of the numbers and square footage of completed green building projects as well as the number of LEED and Green Point Rated certifications and point ratings achieved. In the last half of FY 12 and during FY13, consultants were used to manage the green building program while the sustainability planner vacancy went unfilled.
The City Photovoltaic (PV) Partners Program, an innovative solar energy incentive program, enables Development Services to promptly issue permits and perform inspections for residential photovoltaic systems reducing the time to issue permits from 70 days to over the counter. In 2014, the CityPartners Program from the Solar Power Generation USA Congress.
FY 2013 Statistics
Green Building permit applications processed: 1037 (up from 887 in 2012)
Green Building valuations subject to mandatory regulations: $569 million (up from $543 million in 2012)
Green Building square feet subject to mandatory regulations: 2.44 million square feet (up from 1.34 million in 2012)
Energy savings: 2,703 kBtu/yr (up from from 1,701 kBtu/yr in 2012)
Waste diversion from landfill: 53,629 tons (down from 69,095 tons in 2012)
CO2 emissions reduction: 62 tons; less than 10 projects reported CO2 emissions reduction estimates. This is up from 21 tons reduced in 2012.
Community InvolvementDevelopment Services is approaching green building with strong community involvement. The current working groups are contributing to the next generation of green building efforts in Palo Alto:
Green Building Advisory Group The Green Building Advisory Group is an interdisciplinary team of city staff and community members tasked with providing recommendations for the new Green Building Ordinance. The team currently meets bi-monthly to develop suggested framework and revisions.
Electric Vehicle Supply Equipment Task ForceThe Electric Vehicle Supply Equipment Task Force is a group of community experts and city staff. The team meets to define how the City of Palo Alto will meet the

Attachment D: City Departmental Level Initiatives
Page 22 of 30
install of Electric Vehicle charging stations in new development.
VI. Zero Waste and Landfill Operations
mid-term target of achieving 77 percent diversion by 2011 and striving to reach Zero Waste (virtual elimination of waste to landfills) by 2021
A total of 69,491 tons of Palo Alto solid waste was sent to landfills in 2005. The most recent landfill tonnage figures from the State of California indicate that the amount of solid waste landfilled in 2012 totaled 45,411tons, up about 3% from 2011 [Note: the 2011 landfilled was 43,947 tons, and not 32,434 tons as reported in the April 2013 report). The 2012 State of California annual report provides a Palo Alto per capita disposal rate, in pounds per person per day, which is equivalent to a diversion percentage of 77 percent, up slightly from 2012 estimates. The Life Cycle Fugitive Emissions listed in Table D2 below were estimated using 2012 numbers.
A primary factor responsible overall long term decrease in landfilled waste from Palo Alto is the Zero Waste services that are included in the collection and processing contract with
for collecting and composting commercial food waste and compostables, a shift to a single stream recycling program, and the processing of all construction and demolition debris boxes
nd Demolition Debris Recycling and Reuse Ordinance, Zero Waste program outreach on recycling and waste prevention, and the economic downturn.
greenhouse gas emissions. The Climate Protection Plan considered three types of greenhouse gas emissions related to solid waste:
1. Fugitive emissions of landfill gas from the Palo Alto Landfill that are not captured and flared by the landfill gas control systems, thereby releasing methane into the atmosphere. These emissions are calendar year-based and are calculated using measured volumes of landfill gas flared and assuming a capture rate percentage for the control systems. This is considered Scope 1, anthropogenic emission and tracked in the GHG reporting protocol.
2. Life cycle fugitive emissions are GHG emissions calculated from the amount of solid
Protection (CACP) software. Inputs to the software are the total tons of Palo Alto solid

Attachment D: City Departmental Level Initiatives
Page 23 of 30
waste landfilled and the amounts of paper products, food waste, plant debris, and wood/textiles in the landfilled waste.
3. Emissions from landfilling of recyclable materials, where failure to recycle the materials results in emissions from manufacturing using virgin materials that are greater than the emissions that would have resulted from recycling the materials. These emissions were calculated using the total tonnage of Palo Alto solid waste land-filled, the results of a 2006 Palo Alto Waste Composition Study, and US EPA emissions factors. This was not estimated this year, and needs further review.
The table D2 below provides a comparison between the solid waste-related greenhouse gas emissions estimates for 2005 and 2012.
Table D2: Solid Waste Related GHG Emissions3
Emissions Source 2005 Emissions
(MT)
20114
Emissions(MT)
2012Emissions
(MT)
Difference (MT)
Difference (percent)
Landfill fugitive emissions during the year
6,8114336
7,2505 171 3%
Life cycle fugitive emissions 24,823 15,698 16,2216 8,602 -35%
Life cycle, landfilling recyclable materials
54,83834,680
35,8367 19,002 -35%
The Palo Alto landfill fugitive emissions figure for 2010 was calculated using the volume of landfill gas captured by the landfill gas controls system and assuming a 75 percent capture rate. Life cycle fugitive emissions and landfilling of recyclable materials emissions for 2012 have been calculated using the ratio of waste landfilled in 2012 to waste landfilled in 2005. There are several factors that may introduce error into the estimates for life cycle fugitive and landfilling of recyclable materials. The 2005 estimates relied on a 2006 Waste Composition Study, and the method used for the 2012 estimate is based on a 2013 waste characterization study. However,
waste tonnage, such as the Construction and Demolition program and the commercial compostables program, also affected the composition of the waste. Another factor to consider is that the 2005 baseline emissions for solid waste did not include calculating emissions from the PASCO collection fleet. The fuel used for GreenWaste collection vehicles includes CNG provided by the City at the MSC and purchased diesel fuel. The CNG fuel use is captured in
3
Waste related life cycle emissions estimates lag by a year, hence 2013 information is still not available. 4 The 2011 life cycle emission estimates were revised from the ones reported in the 2013 Earth-day report.5
These emissions are related to methane generated in the landfill that was not captured and flared. Assumed to be 33% of the collected landfill gas in accordance with LGOP protocol. 6
Is Scope 3 emission, included in Attachment C as community emissions. 7
Is Scope 3 emissions, included in Attachment C as community emissions.

Attachment D: City Departmental Level Initiatives
Page 24 of 30
another section. In 2013, GreenWaste used 175,279 gallons of diesel fuel in the collection vehicles, up 6% from prior year.
This report does not estimate greenhouse gas emissions from processing activities such as recycling recovery from garbage at the SMaRT Station in Sunnyvale, single stream recycling sorting at the GreenWaste MRF in San Jose, or the composting of the materials at Z-Best in Gilroy. Emissions from these activities are calculated by the host cities.
VII. Water Quality Control Plant (WQCP) Operations
Electricity and Natural Gas Use at the Plant
The Palo Alto Regional Water Quality Control Plant (WQCP or plant) is the largest municipal energy consumer, accounting for approximately 80% of the electricity and natural gas used in City operations. Since 2005, the plant has implemented numerous steps to reduce its energy consumption and institutionalize sustainability policies in plant operations and maintenance, and when evaluating capital improvement projects.
Figure D# below illustrates the decline in natural gas usage by 50% since 2004, due to:
Figure D6: Natural Gas Usage at WQCP Declined more than 40% since 2004
Use of landfill gas from the Palo Alto Landfill as a substitute for natural gas in the incinerator afterburner (2005).

Attachment D: City Departmental Level Initiatives
Page 25 of 30
Incinerator burner fine tuning (2011 and 2012): In 2011 and 2012, both incinerator 1 and 2 were fine-tuned, resulting in lower natural gas consumption. It was found that the incinerators were operating rich, or burning more natural gas than needed. The air fuel mixture was adjusted and plant personnel were trained on the maintenance of the new set points.
year (a reduction of about 43%) compared to 2005.
to the natural gas that must augment the landfill gas in the afterburner.
The electricity use has remained relatively flat since 2005 as illustrated in Figure D7 below. This is the net effect of reduced load due to various energy efficiency measures which offset the increased load due to the installation of the more sustainable technology of UV based disinfection of treatment plant effluent. In 2013, the City began purchasing all of its power from carbon neutral sources.
Figure D7: Electricity Usage at WQCP Relatively Flat, but Greener Supplies
stantially in 2009 as energy efficiency improvements were made to the activated sludge aeration basins and the trickling filter lift pumps. Electricity use increased in 2011 and 2012 due to increased recycled water pumping and the startup of the new ultraviolet light disinfection process that replaced chlorine disinfection in August 2010. A new aeration basin process control system was installed in 2012. This system was expected to further reduce energy consumption, but is still being optimized.

Attachment D: City Departmental Level Initiatives
Page 26 of 30
Figure D8: Illustration of Components of Electricity Usage at WQCP in 2009
Detailed description of the electricity consumption related projects are as follows:
Aeration Basins Optimization and Dome Replacement: As discussed above, the aeration basin blowers compbegan using fine bubble diffusers and high speed single stage centrifugal blowers over ten years ago. This technology is much more efficient than previous equipment. Beginning in late 2008, the RWQCP began tracking blower use more carefully to avoid adding excess air to the aeration basins beyond necessary dissolved oxygen level process set-points. In summer 2009, all of the 19,000 dome diffusers in the aeration basins were replaced with new diffusers. The old diffusers had been in service for over ten years, and laboratory tests showed they had lost much of their efficiency. Typical daily electricity use by the blowers has decreased from nearly 13,000 kWh per day in 2008 to an average of 9,500 kWh per day in late 2010.
The RWQCP made further improvements to the blower control equipment and software in early 2012. These improvements were expected to optimize the blower control sequence and further reduce electricity use. Unfortunately, no significant reduction has been seen to date, however we are hopeful that we will see reductions in the future.
Trickling Filter Variable Frequency Drives: Trickling filter lift pumps (also called tower lift ity. In December 2009, RWQCP staff
completed a new trickling filter lift pump control program. Additionally, two of the six lift pump controls were replaced with variable frequency drives (VFD). Use of the VFD controllers reduces the amount of water that is re-circulated and pumped over the trickling filters a second time. Although the improvements to this system are recent and more data needs to be collected, preliminary data appear to show that electricity use by the pumps has decreased by about 1,000 kWh/day; this equates to approximately 15% of the total
Aeration Basin
Blow ers, 23.4%
Tow er Lift Pumps,
15.5%
RSP from (9/4/08),
10.9%Blend Tank Pumps,
4.3%
Old RAS, 4.3%
New RAS, 3.7%
#4 Water, Injection,
3.4%
Other, 7.2%
Biofilter Fans, 6.4%
DMF Lift Pumps,
6.4%
LFG Compressor ,
2.1%
Incinerator
Induction Fans,
6.4%

Attachment D: City Departmental Level Initiatives
Page 27 of 30
trickling filter lift pump electricity use. The RWQCP is also considering options for making greater use of VFDs in the trickling filter lift pumps.
Estimated Incremental Impact of Flow-rate on RWQCP Electricity Demand: The impact of influent flow-rate on RWQCP electricity usage was assessed using daily electricity demand and influent flow data for January 2009 through May 2010. The results suggest that at flows less than 26 million gallons per day (MGD), the flow-rate is not the primary factor impacting electricity usage. A superior correlation between influent flow and electrical demand was found when flows exceeded 27 MGD. It is recommended that 436 kWh/MG be used to estimate the impact on electrical demands due to an incremental increase in flow-rate. For every 1 MGD increase in influent flow, one may expect an increased demand of 436 kWh per day. The RWQCP is to confirm the accuracy of this factor following the installation of automated aeration controllers.
Investment in Technology for Sustainable Operations and Cost Effectiveness
The plant has made numerous technology upgrades since 2005 which has enabled more sustainable and reliable operations. These upgrades have also resulted in operational cost reduction. A classic example of such a project is the use of landfill gas to supplement natural
$1,000,000 project came online in 2005 with a payback period of 5 years. It is estimated that the use of landfill gas continues to save the plant an
become more sustainable as the once discarded landfill gas is utilized.
In 2008, the plant upgraded office lighting by installing 576 energy efficient lamps, ballasts, and motion sensors. The $36,000 project had a simple payback of 8 years, reduced annual overall energy use by approximately 46,500 kWh, and reduced the annual plant greenhouse gas emissions by 19 metric tons.
In 2011 and 2012, the plant fine-tuned the incinerator burners to limit the quantity of natural gas consumed. This $12,400 project had a simple payback of 21 days. It is estimated that this project has decreased the average annual natural gas consumption by approx. $200,000 and has reduced annual greenhouse gas emissions by 1136 MT.
GHG Emission of the Plant
The plant generates Scope 1, Scope 2, and biogenic GHG emissions. However, the GHG reporting protocols exclude biogenic emissions from being reported to The Climate Registry
electricity related emissions were eliminated when City electricity supplies became carbon neutral in 2013.

Attachment D: City Departmental Level Initiatives
Page 28 of 30
Table D3: Plant Emission: 2005, 2012, and 2013
2005 2012 2013Scope 1 Biogenic
8Scope 2 Scope 1 Biogenic
9Scope 2 Scope 1 Biogenic Scope 2
Wastewater Facilities 8,504 16,689 2,546 6,414 9,493 1,950 5,024 9,274 0
Reduction since 2005 41% n/a 100%
Future Actions
Palo Alto incinerator retirement is being planned for 2019, when the incinerators will have been in service for 47 years. The incinerators are of an older generation and are not amenable for conversion to a renewable bioenergy facility that would recover energy from the bio-solids.
A Biosolids Facility Plan is currently being drafted and will evaluate options for sludge disposal such as anaerobic digestion and gasification options. The current incinerators are the largest source of greenhouse gas (GHG) emissions from City facilities. In contrast to incinerators, which release the greenhouse gas carbon dioxide to atmosphere, gasification or anaerobic digestion convert carbon from bio-solids into renewable fuels.
VIII. Education, Motivation, and Community Participation
The City plays a pivotal role in facilitating sustainable community practices. Staff collaborates with many organizations and groups throughout the community on many levels and on many projects to promote sustainable behaviors. Much of this has already been discussed. The new governance structure to further enhance sustainability effort will greatly aid future efforts. The
Facilitating Community Environmental Action Partnership (CEAP) efforts to work with a variety of different groups within Palo Alto to further sustainable business and living.
Encouraging and facilitating staff volunteer action through the Green Team. The City Employee Green Team was founded in 2008 in accordance with recommendations made by a
to identify, create and implemen -stakeholder group allows employees to cultivate ideas for resource efficiency, climate protection and other environmental projects that align with personal values and interests, often dovetailing with the
-out,
8 The 2005 biogenic emission estimates were based on a different methodology and hence are not comparable.9 2012 biogenic emission estimates were revised from those in the April 2013 Earth day report. The corrections were based on a new higher heating value estimate for municipal sludge made available by USEPA. Additionally, the 2012 sludge amount incinerated was revised from 7,068 short tons up to 7,342 short tons. The 2013 sludge amountincinerated was 7,115 short tons.

Attachment D: City Departmental Level Initiatives
Page 29 of 30
two City demonstration gardens. The Green Team is instituting an on-
and effectiveness of these initiatives. The Chief Sustainability Officer (CSO) serves as liaison for the Green Team to the City Mana
Working with the Palo Alto School District, Acterra, neighborhood associations and a variety of other agencies and groups to encourage innovation and provide education on a variety of sustainability issues at events.
Conducting community level classes and workshops on:
Building a sustainable home: Leading tours and workshops through the EcoHome demonstration house.Organizing water conservation workshops on such topics as alternatives to lawn, care of trees in a low water use garden, irrigation systems and more during the period around Earth Day in April and Fix a Leak Week in March, as a part of the Summer Workshop Series and in the fall.Leading workshops on solar electric and solar water heating systems at least twice per year.Providing electric efficiency and sustainable home practices throughout the year, but particularly during the Summer Workshop Series.Attending many events at business sites to provide employees with information
Providing the quarterly OPower Home Energy Reports that give residents a comparison of with those of 100 homes in the vicinity. These homes are of
similar size, use the same type of heating and are occupied to provide a greater ability for residents to see how their energy use compares. The paper and online reports provide a variety of tips and tools for ways to reduce electric and natural gas consumption and
Delivering monthly newsletters to residents and businesses with a great variety of information on how to be more efficient and reduce GHG consumption.
Working with the school district on a variety of in-class workshops on energy and water saving. Providing the PAUSD with an annual $50,000 grant to enhance curricula on sustainability issues. Also, coordinating with the parent-sponsored group Zilowatt to develop a curriculum, coordinated with science class requirements, to provide hands-on and relevant information on solar electric systems and efficiency.

Attachment D: City Departmental Level Initiatives
Page 30 of 30
Forum facilitated by Utilities about three times per year; The soon to be established Sustainability Executive Advisory Group to advise the City Manager will provide a another channel to seek input and support local businesses in their own efforts.
Working with Clean Cities Challenge to pilot an intensive, block-by-block community engagement to enroll 25% of Palo Alto residents in reducing their energy use 25%.
Working with regional networks (including Public Sector Climate Task Force, League of Cities, Local Government Commission, and others), and national networks (including ICLEI, Green Cities California, Urban Sustainability Directors Network, and others) to share best
two key questions:
olife, prosperity and resilience of this community?
o What can one small innovative city continue to advancing the regional and global sustainability revolution?

Attachment E: Sustainability Policy and Organizational Structure
Page 1 of 3
Attachment E: Sustainability Policy & Organization Structure Shown below is the City’s Sustainability Policy approved by the Council in 2007.
POLICY AND PROCEDURES 5-01/MGR First adopted in April, 2000
Revised June 18, 2007
CMR: 260:07
SUPPORT FOR SUSTAINABILITY
POLICY STATEMENT
It is the intent of the City of Palo Alto to be a sustainable community – one which meets
its current needs without compromising the ability of future generations to meet their
own needs. In adopting this policy, the City of Palo Alto accepts its responsibility,
through its operations, programs and services to:
Economy: Maintain a healthy, thriving and well-balanced economy comprising a
blend of large and small business, which encourages the development of
independent businesses and is resilient to the economic changes common to
California’s economy
Social Equity: Continuously improve the quality of life for all Palo Alto
community members without adversely affecting others
Environment: Enhance the quality of the air, water, land and other natural
resources by minimizing human impacts on local, regional and global ecosystems
through greater conservancy, reduced pollution, increased efficiency, and
protection of native vegetation, fish, wildlife habitats and other ecosystems.
In working toward these goals, the City will, when appropriate, align and partner with
community groups, businesses, non-profits, and neighboring communities.
NOTE: Questions and/or clarification of this policy should be directed to the City
Manager’s Office.

Attachment E: Sustainability Policy and Organizational Structure
Page 2 of 3
Organizational Structure to Facilitate Sustainability Actions and to Achieve Goals City Manager determined that the City’s many cross-departmental environmental sustainability activities requires a clear organizational structure to succeed. In preparation for the recruitment of the new position of Chief Sustainability Officer (CSO), roles and responsibilities for each part of the organization was established. Sustainability Board: Comprised of Directors from key departments, will establish the vision and goals for the overall effort, approve the CSO’s work plan, and identify and approve resources to complete the work plan tasks. Sustainability Executive Advisory Group: To solicit input from outside the City, the City Manager will organize and lead such an ad hoc group, whose membership will include key executives from Palo Alto institutions, community leaders, and representatives from Stanford and large companies. The function of the group is to give advice and feedback to the City Manager, get input from the “real world”, forge and leverage international relationships/partnerships, build excitement, and model and motivate behavioral changes. Chief Sustainability Officer: The CSO will report to the City Manager and take direction from the Sustainability Board. A critical task of the CSO is to develop the long-term sustainability work plan and prioritize tasks for each fiscal year. The CSO will work with a larger group of individuals from many City departments to complete the tasks on the work plan. That larger group, the Sustainability Team, will organize itself into committees to implement the work plan as prioritized by the CSO. Participants in the Sustainability Team will be embedded in job descriptions and annual appraisals to ensure that team members understand that the sustainability work plan tasks are key City priorities. The CSO will also be responsible for community outreach on sustainability efforts and will act as the co-chair of community based Community Environmental Action Partnership (CEAP). Green Team: This is a long standing individual employee initiative driven team with voluntary membership. The Green Team includes employees from many work groups and has historically been project-based with the goal to complete projects and a bias towards action. This group of engaged employees will be a valuable asset for the CSO to work with as they act as ambassadors to their own work groups and spread the word on sustainability throughout the City. Many Green Team members will also be on the Sustainability Team. The CSO will act as the liaison to the Green Team co-chairs and will convey information to and from the Sustainability Board. One of the key tasks for the CSO and the Sustainability Board, the Sustainability Team and the Green Team is to update the 2007 Climate Protection Plan. In addition, measuring performance with respect to the goals of the plan must be done on an annual basis. Attached is the line-diagram of the proposed governance structure.

Attachment E: Sustainability Policy and Organizational Structure
Page 3 of 3

Attachment F: Transportation and Sustainable Land Use
1
Transportation and Sustainable Land Use Transportation and land use continues to represent the largest contributors to GHG emissions, with transportation related emissions accounting for more than 50% of Community emissions according to the most recent survey. In 2013, the City made great strides towards taking a more comprehensive approach to reducing GHG emissions through coordinated Transportation Demand Management (TDM) policies. In addition to recent Council direction on TDM and related parking policies (explained below), the Comprehensive Plan, Zoning Ordinance, and Capital Improvements Program direct the City to develop projects and programs to facilitate pedestrian and transit-oriented development, safer and more convenient pedestrian and bicycle travel, particularly related to school routes, traffic calming for safety of drivers and other road users, and facilitation of greater use of Caltrain, buses, and shuttles. In general, every single-vehicle auto trip diverted to another mode reduces greenhouse gas emissions. The City has also encouraged and facilitated the use of low emission, including all-electric, vehicles. Staff is working on many programs to enable a reduction of such emissions, as described below. Short and Medium Term Goals from 2008-2013
Develop land use patterns that reduce travel-related emissions by supporting pedestrian, bicycle and transit use
Reduce and/or offset community travel-related emissions by 5%
Coordinate with Green Building efforts to ensure compatibility between built environment and sustainable land use initiatives.
Reduce emissions by an additional 10% by 2015
Increase Caltrain and other transit use by 25% by 2015
Increase Electric Vehicle (EV) infrastructure
Begin process to establish citywide and district level coordinated Transportation Demand Management and Parking policies and programs.
Coordinate parking policies to work in tandem and support of TDM efforts
Expand City-wide shuttle system
How did we do on short and medium term actions? 1. Facilitate and enhance potential for mixed-use development. Several mixed use
developments were approved through the entitlement process 2011-2013, or approved in previous years through planning entitlement process, but not yet completed the building permit process. Some of the mixed use projects of significance include:

Attachment F: Transportation and Sustainable Land Use
2
2180 El Camino Real (College Terrace Center): Planned Community approved by Council with 30,000 square feet of office space, a small grocery store and other retail, and 8 below-market rate rental units. Construction anticipated in 2014.
3445 Alma Street (Alma Plaza): Planned Community including a grocery store and other retail space with 14 below-market rate rental housing units above the grocery store and 37 single-family homes immediately to the rear of the site. Construction completed 2012 for commercial space and BMR housing units above. New grocery store opened in April 2014.
1080 Channing Avenue (Edgewood Plaza): a grocery store, other retail space, and 10 single-family homes. Approved by Council; grocery store construction completed in 2013, housing construction underway.
102 University Circle: two stories of office and retail space, with four residential units on the third and fourth floors. Construction completed and occupied by 2011.
A handful of smaller projects on El Camino Real include 2-3 stories of office/commercial space with one or two residential units above (4073 El Camino Real, 1845 El Camino Real)
3159 El Camino Real: In 2013 the City Council approved the planning entitlements for this mixed-use project at the corner of Portage Avenue and El Camino Real. The development of this new four-story, 55 foot tall, mixed use building includes 74,122 square feet of floor area. There are 48 smaller apartments, and 31,262 sq. ft. of commercial square footage for office, retail, restaurant, and commercial recreation uses. It is expected the construction will begin in 2014.
2. Zone for Mixed Use and Higher Density Around Transit Stations
The City has adopted Pedestrian-Transit Oriented Development (PTOD) zoning near the California Avenue station. Existing zoning allows for mixed use and higher density around the downtown transit station, though parking remains an obstacle to successful projects. Two mixed use PTOD projects noted above have been approved (and one constructed) in the California Avenue PTOD area. In 2012, the 195 Page Mill Road/2865 Park Boulevard mixed use project was approved by Council. This project is now under construction. The 102 University Circle project provides a mix of uses downtown, and high density housing near the downtown Caltrain station was approved 50 affordable housing units at 801 Alma Street now ocupied. Another high density affordable housing project was approved and constructed at 488 W. Charleston Road, which is proximate to a future Bus Rapid Transit stop on El Camino Real. Finally, the Lytton Gateway project, which contains 50,000 square feet of office and retail space, is finalizing construction directly across the street from the train station and will open shortly, in 2014.
3. Project Level Transportation Demand Management (TDM) Programs
Transportation Demand Management (TDM) programs have been proposed and approved in recent years for several projects, including 901 San Antonio, 2180 El Camino Real, 1601 California Avenue (Facebook, since departed), 3401 Hillview

Attachment F: Transportation and Sustainable Land Use
3
(VMWare) and the pending 355 Alma Street (Lytton Gateway). TDM programs have included such measures as transit passes (such as Caltrain “Go-Pass”) for building occupants, Zip Cars or similar rentals, and/or vanpool or carpool priority, etc. TDM programs are required whenever parking reductions are requested or where required as environmental mitigation. The programs typically specify performance objectives, and monitoring information is provided to the City at 2 years and 5 years after project occupancy.
4. Establishment of a Transportation Management Association. In October 2013, the City Council gave direction to staff to investigate the establishment of a Transportation Management Association in order to coordinate TDM efforts. Since that time, regional experts have presented to the Council regarding best practices. In addition, in February 2014, the Council gave direction to staff to move forward with a Request for Proposal for a consultant to establish a Transportation Management Association (TMA). The City will release the RFP in mid-April. A Transportation Management Association (TMA) could effectively market and manage TDM strategies, and monitor their effectiveness on a district- or city-wide basis. As an independent non-profit organization, a TMA can also build collaboration between businesses and government, working towards a common goal of decreasing trips by single occupancy vehicle
5. Civic Center Caltrain Go-Pass Program: The Council recently authorized staff to
move forward with a City Hall TDM program, to reduce the number of employees that are driving to work. This program went into effect in April 2014. This program grants free, Caltrain Go-Passes to any civic center employee in exchange for giving up their parking pass. The overall goal is to “free-up” spaces in the City Hall garage by increasing the number of people who taking transit and frequency in which they take transit.
6. Citywide Transportation Survey
In March 2013, the Transportation Division released a first of its kind, city-wide transportation survey. The goal of this survey is to determine the mode share of various forms of transportation. This survey has been sent out to those who live, work or visits the City of Palo Alto. Based on information gained from this survey, the City will be able to better plan for transportation improvements, and create the programs and incentives necessary to support alternative forms of transportation. City staff will also be taking this survey, in order to develop a City Hall TDM program as identified above. The next iteration of this survey will be released in Fall 2014.
7. Downtown Studies: The City has recently embarked on the first phase Downtown
Development Cap Study. As part of the first phase, the City has hired a survey firm to conduct two critical surveys. The first will determine travel mode share for downtown workers (how people are getting to and from work). The second survey will determine building intensity/occupancy is for various office uses (how many

Attachment F: Transportation and Sustainable Land Use
4
people per square foot). Together these two surveys will provide information that will help guide future decision making related to parking and transportation policy. The study will also help quantify the impact of automobile traffic has on the Downtown area, and will project conditions into the future. One of the primary goals of the second phase of this study, will to be to create policies which help to reduce automobile traffic in the Downtown area by encouraging transit use and other alternative forms of transportation.
8. Implement Plans for Transportation Improvements around California Avenue
Caltrain Station. The City has developed a concept for streetscape improvements along California Avenue to provide for a “complete street” approach benefiting all modes of travel, enhancing pedestrian and bicycle safety, and enhancing the aesthetics of the streetscape. Project construction started in March 2014 and is expected to be completed by the end of the year. The City’s Bicycle and Pedestrian Transportation Plan designates Park Blvd., serving as a key connector to California Avenue and the train station, as a “bicycle boulevard”.
9. Bicycle and Pedestrian Plan and Infrastructure a) Bicycle Plan and Programs: The City of Palo Alto is currently a Gold Level Bicycle
Friendly City, and bicycle use comprises an estimated 7% of commute trips to and from the city (2009-2011 American Community Survey 3-Year Average Estimate, United States Census Bureau). The Palo Alto Bicycle and Pedestrian Transportation Plan, adopted in July 2012. The Plan is intended to enhance the use of bicycles for commuter, convenience, and recreational uses, with a goal of becoming a “Platinum” Bicycle Friendly Community. The Plan objectives and other anticipated programs include:
Increasing bike boulevard mileage by 18 miles to 22 miles.
Increasing bike lane mileage by 3 miles to 44 miles
Increasing Class I trails (separated bikeways) from by 7 miles to 20 miles of facilities; and
Participation in the Regional Bike Share program. Palo Alto has four current Bike Share Stations in the Downtown and California Avenue Business Districts; and
b) Safe Routes to School: On March 1, 2012, the City initiated an expansion of its
highly successful Safe Routes to School program, thanks to a two year grant from the Vehicle Emission Reductions Based at Schools (VERBS) program of the Santa Clara County Valley Transportation Authority. This grant provides funding for a broad range of efforts to reduce auto congestion and increase greener school commute choices, including comprehensive Walk and Roll to School maps for every PAUSD school, updated and expanded bicycle safety education for students and parents,

Attachment F: Transportation and Sustainable Land Use
5
and school-level promotions of walking, biking, taking the bus/shuttle, and carpooling to/from school. Since 2005, there has been a dramatic growth in cycling at PAUSD secondary schools, a very different picture than in virtually any other city in the state or nation. In Fall 2013, there were 1640 PAUSD high school students biking to school, or 43% of the total number of students. This was a dramatic increase over Fall 2005, when there were 580 student bicyclists or 17% of the student population at the two high school campuses. The middle schools historically have had higher rates of bicycling, as indicated by the 2005 baseline year counts showing 830 bicyclists (34% of all middle school students). In 2013, , the counts increased to 1400 bicyclists (more than 50% of the students). This growth in biking has substantially outpaced the increase in student population at both levels compared to the baseline year for the Climate Protection Plan as shown in the table below: PAUSD High Schools Student population Bikes % Biking Fall 2005 3450 580 16.8% Fall 2013 3900 1640 43.2% Increase 2005-13 +450 +1060 PAUSD Middle Schools Student population Bikes % Biking Fall 2005 2420 830 34.5% Fall 2013 2760 1400 50.6% Increase 2005-13 +340 +570 Between April 2012 and March 2014, VERBS funded initiatives included the developing of Walk and Roll maps at all 17 PAUSD schools. These maps show suggested walking and biking routes to school, based on community input and updating safety signage and striping on these routes. This process also led to the identification of a list of recommended longer term improvements on school commute routes, to be implemented as funding becomes available. All secondary schools are going through a second round of increasing bike parking, and many of the elementary schools identified expanded and secure bike parking as key improvement needed. The Walk & Roll maps are posted online at www.cityofpaloalto.org/saferoutes and include “share the road” safety tips for pedestrians, bicyclists and drivers. They are used in back to school promotions, and in the expanded promotion of green ways to get to school in both fall and spring. Seven schools are also piloting an online “Schoolpool” program to help reduce peak period congestion near schools by encouraging more parents to share the ride to school with another family, or form

Attachment F: Transportation and Sustainable Land Use
6
parent-led bikepools or walkpools, thereby reducing the number of solo family vehicle trips to school each day. The program evaluation incorporated into the grant will include GHG reduction calculations for Palo Alto's Safe Routes to School program, based on a regional methodology now being developed by the Metropolitan Transportation Commission.
10. Expanded Palo Alto Shuttle System The City sponsors and jointly funds the Crosstown Shuttle and Embarcadero Shuttle, providing transit service to students, seniors and others in areas not served by other public transportation. The following chart provides the ridership numbers of the past four years:
Fiscal Year 2009-2010 137,825
Fiscal Year 2010-2011 118,455
Fiscal Year 2011-2012 140,321
Fiscal Year 2012-2013 134,504
The number of riders on the City’s shuttles dipped in the 2010-2011 fiscal year, due to cuts in funding that resulted in the Crosstown shuttle being served on an hourly basis, rather than twice per hour. In March 2011, The City introduced School Service rout which helped to increase ridership again.
The City has released a Request for Proposal (RFP for expanded shuttle services, which include one base route (the existing Crosstown shuttle service) and eight suggested optional routes upon which transit providers may choose to bid. The shuttle provider may also propose additional routes and/or alter proposed routes if they feel they would be ineffective.
11. Ride Share (Carpooling) Apps
The City entered into an agreement with SAP for a one-year trial of the software company’s TwoGo app, which provides a ride-sharing service for members companies. The tool also provides powerful data analytics for users of the program, including information about where they are coming from going to. The City is exploring incentive structures to help employees consider trying carpool, and is also looking at other apps including Hovee which has offered the City a free one-year trial.
12. Electric Vehicle Infrastructure
The City has taken steps to facilitate the implementation of infrastructure, particularly charging stations, for electric vehicles (EVs). In the past year, five charging stations have been installed in City garages. Right charging stations have

Attachment F: Transportation and Sustainable Land Use
7
been approved in conjunction with development proposals. This includes 4 charging stations at the Lytton Gateway project and 2 at the Edgewood Plaza project. In addition, the City is planning for 6 additional chargers at City facilities as follows:
City Hall Garage (1)
Cowper-Webster Garage (1)
Bryant St Garage (1)
Cal Avenue – West Garage (2)
Cal Avenue – East Garage (1)
13. Bicycle & Pedestrian Transportation Plan Implementation/Neighborhood Traffic Calming In 2013 there were no new traffic calming projects in the City. The City is planning for an expansion of traffic calming measures as a part of the implementation of the Palo Alto Bicycle & Pedestrian Transportation Plan. The City has 20 active bicycle projects, each of which will include focused pedestrian improvements and traffic calming measures, pending community outreach. A list of active projects is provided below:
Alma Street Enhanced Bikeway (San Antonio Av to E Charleston Rd)
Barron Park Neighborhoods Bicycle Routes
Bryant St Bicycle Boulevard Extension (South of E Meadow Dr)
Bryant St Bicycle Boulevard Update (North of E Meadow Dr)
Charleston Rd-Arastradero Rd Corridor Project (Fabian Wy to Miranda Av)
Churchill Av Corridor Improvements (Castilleja Av to El Camino Real)
Cubberly Community Center Bicycle Route
Fabian Way Enhanced Bikeway (E Meadow Dr to Charleston Rd)
Greer Road Bicycle Boulevard (Edgewood Dr to Louis Rd)
Homer Av-Channing Av Enhanced Bikeway (Guinda Av to Alma St)
Matadero Av-Margarita Av Bicycle Boulevard (Bol Park Path to Park Blvd)
Matadero Creek Trail – Phase 1 Midtown Feasibility Study (Hwy 101 to Alma St)
Maybell Av Bicycle Boulevard (E Meadow Dr to Arastradero Rd)
Moreno Av-Amarillo AV Bicycle Boulevard (Middlefield Rd to W Bayshore Blvd)
Park Blvd Bicycle Boulevard (Castilleja Av to W Charleston Rd)
Ross Rd Bicycle Boulevard (N California Av to Louis Rd)
San Antonio Av Bicycle Route (Byron St to Alma St)
San Antonio Rd Bicycle Route (Hwy 101 to W City Limit)
Stanford Av Bicycle Boulevard (El Camino Real to Park Blvd)
Wilkie Way Bicycle Boulevard (Park Blvd to San Antonio Rd) Long Term Goals (2014-2020) • Reduce emissions by an additional 10% by 2020 • Increase Caltrain and other transit use by an additional 50% by 2020, or as

Attachment F: Transportation and Sustainable Land Use
8
otherwise determined through the Comp Plan public outreach process and EIR. What is planned for Long Term Actions? 1. Evaluate Pedestrian and Transit Oriented Development Zoning Intensity, Including
Along El Camino Real. As part of the City’s Comprehensive Plan update, an Environmental Impact Report will be completed. This EIR will evaluate various alternative land use patterns that are developed through a public outreach process. Given the requirements to meet regional housing needs, focused TOD will need to be evaluated. This evaluation, along with other alternatives, will assist the City in making land use and transportation decisions. Finally, it will also help us better understand how are land use and transpiration decisions are connected.
2. Develop a Vision for the Intermodal Transit Center & Surrounding Area. As part of the Comprehensive Plan process, the City will also study how the Intermodal Transit Center can best be used to support increased transit use. This includes evaluated the impact of increased Caltrain usage, upcoming VTA Bus Rapid Transit and expanded private and public shuttle networks. Furthermore, land uses surrounding the train station must be studied as part of the Comprehensive to ensure they are developed to take advantage of the proximity of the transit center.
3. Climate Action Plan: [For Gil to fill in] As part of the Climate Action Plan process
this year, and in coordination with the Comp Plan, staff will reassess and update our estimates of transportation contribution to the City’s GHG emissions; assess the strategies described here for their GHG reduction potential; and consider other strategies that could contribute to the our goals of improving mobility and access while reducing impacts.
4. Establish a Self-Sufficient Transportation Management Association. In February, Council directed staff to distribute a Request for Proposal to establish a TMA. Staff sees this as the first step in a 3 year process to establish a self-sufficient TMA. The TMA is envisioned as an independent non-profit organization that would work in collaboration with the City and the business community. Establishment of a TMA would require seed funding from the City, but the organization would ultimately seek financial support from large employers and other sources for its ongoing operations. New development projects could be required to participate. The TMA’s primary responsibilities would be to coordinate and market an expanded City shuttle program, to coordinate and market incentive programs aimed at increasing the use of transit, carpooling, and bicycling, and to pursue additional incentives and initiatives consistent with this mission.
5. Expanded Shuttle Network: In February, the Council also gave direction to staff to request proposals from shuttle operators for an expanded Palo Alto shuttle network.

Attachment F: Transportation and Sustainable Land Use
9
In the absence of a robust regional transit network, an effective shuttle service is crucial for the success of Transportation Demand Management. It provides an alternative to solo driving for local commuting and errand-running; it requires no additional infrastructure other than potential additional stops, and it can help Caltrain riders get to other parts of the City without the use of a car. Based on this Council recommendation, the City is now in the process of soliciting proposals from shuttle service providers to build an expanded shuttle network, including new routes and more frequent service, with the aim of significantly increasing ridership within three years (concurrent with the development of the TMA).
Transportation Related Community Emissions - Methodology & Summary of Findings The City commissioned a short study by consulting firm Fehr and Peer in early 2013 to provide an assessment of transportation related community emissions. This high level assessment used the Santa Clara Valley Transportation Authority (VTA) regional Travel Demand Forecasting (TDF) model for developing long-range citywide daily vehicle miles traveled (VMT) estimates for streets and highways in the greater Palo Alto area. The VTA TDF model includes a 2005 base year, and a 2035 future year (with 5 year incremental planning years) that reflects future planned growth in San Francisco Bay Area and nearby counties. The model assigns traffic volumes for a typical weekday during the morning (AM) peak period, midday, evening (PM) peak period, and late night, as well as the morning one-hour peak and evening one-hour peak. The regional transportation network coverage (roadway and transit network) captures regional travel patterns and behavior to be accounted for in the focused study area of Palo Alto, which is more important with the recent legislative requirements associated with GHG quantification and impacts. VTA staff provided daily VMT estimates for the planning years of 2005, 2010, and 2015. A review of the traffic analysis zones (TAZs) for the City of Palo Alto was undertaken to determine which TAZs should be included in the calculation of VMT and CO2 emissions. TAZs within the City’s boundary were included along with some TAZs within the Stanford University Boundary where the City of Palo Alto controls land use decisions (i.e. Stanford Shopping Center and Stanford Medical Center). The Palo Alto specific VMT estimates were primarily a function of service population defined by residents plus employees within City limit. In the absence of reliable employment number, a constant 90,000 was used for the assessment.

Attachment F: Transportation and Sustainable Land Use
10
The assessment did not consider Palo Alto specific data related to bicycle use, alternate transportation modes, or vehicles profiles. Based on the above described assumptions and methodology, the study found:
VMT per service population decrease from 1990 to 2012
CO2 emissions per service population decrease from 1990 to 2005 and 2012
The combination of reduced VMT per service population, improved vehicle technology, and improved fuel efficiency are all key factors in the decreased CO2 emissions per mile.
The Community CO2 emissions reduced by 13.6% from 371,870 MT in 2005 to 321,200 MT in 2012. It also found 2005 emissions were 15.9% below those of 1990 levels.
Role of Electric Vehicles in Reducing GHG Emissions With a Carbon Neutral electric supply, Electric Vehicles (EVs) provide an avenue for the Palo Alto Community to reduce its carbon footprint with vehicular fuel switching. The City took a first step in adopting an Electric Vehicle Infrastructure Policy in December 2011. The policy encouraged night time EV charging and passing on the lower cost of electric supply through lower time-of-use electric rates to EV owners who charge at night. The policy also called for the City to facilitate community adoption of this technology. Responding to community interest, City is the process of exploring a pilot program designed to facilitate home owners in residential neighborhoods, with adequate street parking, to install, own, and maintain EV chargers or 240 volt outlet on the publicly owned planting strip across their homes. Building code related efforts to facilitate EVs are discussed in the Green Building section of this report. Working with BACC, the City has received a Notice of Proposed Award (with final approval expected at the CEC business meeting on April 22) for $34,000 to support upgrading of EV charging infrastructure in City facilities. The City has also applied for the California EV Readiness Award, recognizing the cities that have done the most to prepare for this transition.

Attachment F: Transportation and Sustainable Land Use
11
Staff is also working with Recargo, a local start-up company, that has the technology to enroll EV owners and provides them helpful information related to their vehicle charging patterns and provide useful information to the electric utility. Palo Alto Utilities plans to use this information to inform participating EV owners when ‘Demand Response’ events occur and to urge them not to charge their cars when the electrical grid is under distress on hot summer days. City is also working with SAP Labs and other industry partners to make useful information available to potential EV owners at EV dealerships via a mobile application to enhance customer experience. With vehicular emissions making up 54% of community emissions in 2013, EVs are likely to play a large role in further reducing community GHG emissions. In addition to EVs, there is nascent effort to introduce hydrogen fuel cell vehicles in California by 2015 to meet the state’s objective of having Zero Emissions Vehicles (ZEVs) make up 15% of all auto sales by 2025. City will be monitoring this development and will be evaluating ways of facilitate this technology in town.