I: MAMA . - ERIC
236
ED 152 496. - I: MAMA . ..Fiiestone, Marx A. , . . TITLE .Computer,Programs in darine Scibucef Key to ./. Oceanographicliecords Documentation No. 5. INSTITUTION National Oceanic and Atmospheric Administration 1 . (DOC), Nashington, D.C. Environmental Data , Service. 1 E ORT NO MOAA-S/T-76-2250 . i PO DATE, Apr 76 ' . . , ! NOTE ..... 237g.; Not available in hard` ard Copy due to siall print throughout entire doetmeit AVAILABLE FROM Superintendent of Documents, U.S. Government Printing .,... Office, Washington,.D.C. 20402 (13.50) EDRS PRICE NF- $0.83- Plus Pbstage. BC Rot Available from EDRS.. DESCRIPTORS *Abstracts; *Computer Programs; CCmputers; Marine - I A :. Biology:. *Oceanology; *Programing Languages; Researchers; Science Education; *Science Eleipeent; Scientists . DOCUMENT 125010 A St 023 767 ,, ABSTRACT Presented are abstracts of 700 computer programs in marine science. The programs, listed are categorized under a wide range of headings which include physical oceanography, chemistry, coastal and estuarine processes, biology*, pollution, air-sea interaction and heat budget, navigation and charting, curve fittiig, and applied mathematics. The introduction explains where programs are available and how to obtain them. It also explains the procedures . involved for submitting a program. For each program, the titles, language, and hardware are given along with a brief description of what the programdcr., who wrote it, and where it is available. A list of other Naffional Oceanographic Data Center (NODC) programs, a f. general index, a.language index, eia hardware index,' an institution index, and a Federal information processing standard-softvare summary are also included. IMR) , . *********************************************************************** * Reproductions supplied by EDRS are the best 'that can be side * .s, * from the original docuient. . : * ********************************************************************** I . .
-
Upload
khangminh22 -
Category
Documents
-
view
0 -
download
0
Transcript of I: MAMA . - ERIC

ED 152 496. -
I: MAMA . ..Fiiestone, Marx A. , .
.
TITLE .Computer,Programs in darine Scibucef Key to./. Oceanographicliecords Documentation No. 5.
INSTITUTION National Oceanic and Atmospheric Administration1
. (DOC), Nashington, D.C. Environmental Data, Service.
1
E ORT NO MOAA-S/T-76-2250 .
i PO DATE, Apr 76 '
.
. ,
! NOTE ..... 237g.; Not available in hard`ard Copy due to siall printthroughout entire doetmeit
AVAILABLE FROM Superintendent of Documents, U.S. Government Printing.,... Office, Washington,.D.C. 20402 (13.50)
EDRS PRICE NF- $0.83- Plus Pbstage. BC Rot Available from EDRS..DESCRIPTORS *Abstracts; *Computer Programs; CCmputers; Marine -
I A
:. Biology:. *Oceanology; *Programing Languages;Researchers; Science Education; *Science Eleipeent;Scientists
. DOCUMENT 125010
A
St 023 767
,, ABSTRACTPresented are abstracts of 700 computer programs in
marine science. The programs, listed are categorized under a widerange of headings which include physical oceanography, chemistry,coastal and estuarine processes, biology*, pollution, air-seainteraction and heat budget, navigation and charting, curve fittiig,and applied mathematics. The introduction explains where programs areavailable and how to obtain them. It also explains the procedures
. involved for submitting a program. For each program, the titles,language, and hardware are given along with a brief description ofwhat the programdcr., who wrote it, and where it is available. Alist of other Naffional Oceanographic Data Center (NODC) programs, a
f. general index, a.language index, eia hardware index,' an institutionindex, and a Federal information processing standard-softvare summaryare also included. IMR)
, .
************************************************************************ Reproductions supplied by EDRS are the best 'that can be side *
.s,
* from the original docuient. . : *
**********************************************************************
I
. .

,costrt OP coatt.KEY.TO OCEANOGRAPHIC RECOROS DOCUIVIENTATION. NO. 5
Computer frograms.lit:0 'Ilt,
STATES CO I. Matine Sciente)0 .4 a
4. . U.S. DEPARTMENT. OF COMMERCE
iv National ,Oceanic and Atmospheric AdministrationEnvironmental Data Service ,. 41."N
.441154.44.414141411/
U S. DEPARTMENTDf HEALTH,
EDUCATION &WELFARE
NATIODUCATIONAI:INSTITUTE OF
E
THIS DOCUMENTNM SEEN REPRO-
OUCED EXACTLYM RECEIVED FROM
THE PERSONOR ORGIZATION
ORIGIN-
STING IT POINT6OF VIEW iNOR OP IONS
STATED DO NOT NECESSARILYREPRE-
SENT OFFICIALNAVONAL
INSTITUTE OF
EDUCATIONPOS1TIOWOR POLICY
April 1876
tr
.)*;) :,
.S. DEPARTMENT OF COMMERCE
Elliot L. Richardson, Secretary
NATIONAL OCEANIC AND ATMOSPHERIC ADMINISTRATION. lipbert M. White, Administritor
ENVIRONMENTAL DATA SERVICE
Thomas S. Austin, Director 1,
k
KEY TO OCEATIOGRAMIC RE ORDSIOCVNIENTATION NO. 5
Computer rog rams
MarineS,ciebeir
Compiled by Mary .A. Firestone
NATIONAL OCEANOGRAPHIC DATA CENTER
WASHINGTON, D.C.
AprIl 1976
3
f'
r4-
'a
N

1 .
Mention of a commercial coppany or product does not constitute an
endorsementlby the NOAA National Oceanographic Data Center. Use for
.publicity or ;advertising purposes of inforinatiolt Irma this publi-
cation concerning proprietary produCts or the tests of such Products
is not authorized.
I
For sale lay_theSuperintendent of'Documents, U.S. Gozeintwent Printing Office, Washington, D.C., 20462.
, e Price $3.50o
7
S

TABLE- OF CONTENTS
Introtuction
Physical Oceanography
Chemistry
Coastal and Estuarine Processes
Engineering1
Geology and Geophysics
Biology.6,
Fisheries
NPollution
Currents and Transfer Processes
Tides
Waves , - '82
Ai;i6ea Interaction and Heat Budget
Ice V1
Sound,
Sound Velocity
9
-.
.
i
1
.
/ .
'
.
.
i
1
22
24P
30
38
50
56
72
74
80
i
'ft
Sound - Ray Path . . . ,
Navigation and Charting ..
Graphic Display 1
4
Time andIppectral Series Analysis
Curve. Fitting..!
I
I.Applied Mathematics
1.
Data Reduction, Editing, conversion, Inventory, Retrieval,and Special Input /Output ,
General Index
Language Index.
Hardware Index
,Institutiqn Index 1federal Information Processing Standard ware SSoftummary
iii
'f-
. 87
91
k 93 I
97,.
, 1 99' 47
1103
, 116
, 125 . .
138.
: ,,... , 141
t
t" 4)43
%155
. . 181
.
1 .
4 194
208
226
A

INTRODUCTION --
Since the list edition If "Computer Programs in Oceanography" (compiled by Cloyd Dinger) waspublished in 1970, the National Oceanographic Data Center (NODC) has4received many requestsfrom Scientists throughout the international oceanographic community'tor updited informationonravailable programs. T1a present edition Is in answer to this demand. Abstracts of sevenhundred programs, have been supplied lay nearly eighty institutions in ten countries iSee table,pages vii-viii).
Those familiar with the previous edition will note several changes. Four new chapters havebeen added -- Fisheries, Engineering, Coastal'and Estuarine ,Processes; Pollution -- and thetitle has-been changed. to reflect a broadei interest than was implied in the term "oceanography".In addition to the institution, language, and hardware indexes, a general index has been pro-vided, all the reader to sefrch by parameter, method, author, etc. And, most Importantly,the number tracts has nearly doubled., --
Most of the programs listed herein are not available from the NODC. If the NODC holds ,a copyof the program, it will be so noted at the end of the abstract, and the form'will be described(listing, deck, etc.): copies of these materials can be supplied. ,Requests which involve smallamdunts materials and labor will be answered free of charge; for larger regAests, an itemizedcost estimate will be provided, and work will begin after funds or a purchase order have beenreceived. (Contact the Oceanographic, Services Branchr telephone (202) 634 -7439
Many programs available in published form can be obtained from the fol),owing sources, as notedin the abstracts:
National Technical In ormation Service (NTIS)U. S: Department of era&5285 Port Royal RoadSpringfield, VA 22161 Telephone (703) 321-8543
. ,
Assistant Public PrinterU.. S. Government Printing Office (GPO)Washington, DC 20402 Telephone (202) 783-3238
When orderIng from NTIS or GPO, include the order number of the document, as well as payment inthe form of check or money order. Telephone orders are accepted .by both agencies if the pur-chaser has a deposit account.
Inclusion of information on a particular program does not guarantee that the program will alwaysbe available. When the originator feels thatka program has become obsolete, support for thatprogram often is discontinued. Every effort has been made to exclude all programs which defin-.
iiely are not available to anyone.. About one hundred programs from the previous edition havebeen retained because the NODC holds a reproducible, documented copy. or the originators havestated that they still support the programs. judging from the requests received at NODC, manyof these older programs are still of interest to the scientific community.
Th¢ NODC cannot assume responsibility for the accuracy of the abstracts, except those originatedb our organization, or for the proper functioning of the programs. Most of these proiTaas willnot work, without modification, on a system other than the system for which they were designed.
Reports describing program libraries are available from several other federal-agencies. "Scien-tific Program Library Abstracts" describes programs in the following categories:. Regression andcurve -fit, statistical analysis, matrix operations, simultaneous equations, numerical analysis,approximation of special function, operations research, computer simulittion, time series:Analy-sis, sorts, applications programs, and miscellaneous. These programs were either written for oradapted to run on a Burroughs B5500 computer containing 32.6K 48-bit words of magnetic corestoragek magnetic disk mass storage, and seven-channel tape drives. Contact:
Bureau of Mines, Division of ADPU. S. Department of the InteriorP. 0..Box 25407, Federal CenterDenver, CO 80225
v '1(
6/

"Computer Software for Spatial Data Handling" is scheduled for publication in the summer 0 '-1976;.addrese inquiries to the Commission on Geographical Data Sensing and Procebsing of theInternational Geographical Union, 226 O'Conner Street, Ottawa, Ontario, Canada.
Several general-purpose programs are documented in "Computing Technology Center NumericalAnalysis Library," report number CTC-39, available from NTIS for $12.00,paper copy, $2.25
microfiche. The Computing Technology Center is operated Wthe Nuclear Division of Union
Carbide Corporation at the Oak Ridge National Laboratory in Oak Ridge, Tennessee.
"Argonne'COde Center: Compilation of Program Abstracts,".report number AND-7411, supplement
8, may also be obtained from NTIS, for $13.60 paper copy, $4.25 microfiche. ThaagonneCode Center is located at the Argonne National Laboratory, 9700 SoUth Cass Avenue, Argonne,
IL 60439. Programs maintained by the Center are dhiefly intended for' use in nuclear reactor
research. Included in the Environmental and Earth Science category are programs for the
following: Erivironmental impact studies, geology, seismology, geophysics, hydrology and
ground water studies,: bjoenvironmental syst,ems analyses, meteorologicaeOalculationsrelating to the atmosphere and its phenomena, studies of airborne particulate matter,
climatology, etc.
Persons or organizations wishing contribute program information for use'in future editionsand for reference in answering rdiquests are asked to use standard foilm185, PederalInformationProcessing Standard Software Summary; several copies of the form are printed as the last pages
in this book., beginning on page 226.
The technical assistance orthe following NODC personnel is. acknowledged, with appreciation:
)
Albert 1.1.Bargeski4
Dean DaleGeorge F. HeimerdingerNelson C. RossJohn SylvesCr\Robert W. TaberRosa T. WashingtonJudith YawnerThomas Yowell
vi
00'
1
'I ,

I
Contributors to "Computer Programs in Marine Science".
.'
National Oceanic and AtmosphericAdministration
U.'S. Departmentof Commerce.
I A. ,
U. S. Department of Defense
,
0\
.
Other Federal Agencies
. -
Environmental Data Service: -
National Oceanographic Data CenterNational Geophysical end Solar-Terrestrial Data Center .
Center for Experiment" Design iiind
Data AnalysisNational,. Environmental Satellite
Service
National Ocean Survey ,
,
National Weather Service:Techniques Development Laboratory
Environmental Research Laboratories:Pacific Marine EnvironmentalLaboratory
ographic andAtlantic OceanographicMeteorolo ical Laboratories
ational Marine Fisheries Service:Southwest Fisheries Center:La Jolla taboratoryHonolulu Laboratory -
`Southeast Fisheries Center
9 ,
1
.
Department of the Army:Coastal Engineer4rg Research Center. '4 .
Department of the Navy:Civil Engineering Laboratory
(Port Hueneme, CA)Naval Postgraduate School
(Monteiey, CA) ,
Fleet Numerical Weather Central(Monterey, CA)
Naval Undersea Research andDevelopment Center (San Diego, CA)
Naval Electronics LatIbrntory(San Diego, CA) l'
Naval Unaersea Center (JPaaadena, CA)y Naval Underwater Systems Center
(New London, CT, and Newport,,RI)
,
Naval Surface Weapons Center(Silver Spring, MD)
Naval Research Laboratory(Washington, DC)
Fleet Weather Facility(Suitland, MD)
Naval Oceanographic Office(Washington, DC)'
Defentie Mapping Agency HydrographicCenter (Washington, DC)
Naval Academy (Annapolis, MD)
..,--
U. S. Department of the Interior:Geological Suryey:
National Center CReston, VA)Woods Hole, MA '
Menlo Park, CA '
Corpus Christi, TXK. S. Department of Transportation:Coaq Guard:
Oceanographic Unit (Washington, DCIce Patrol °New York, NY)
Environmental Protection, ency:Gulf Breeze, FL
(
1
. .
..
// .
// k...
.
t(
..
8

.
.,
Contributors to "Computer Programs.
.in Mariqe Science"
. - .
U.S. Academic' /Research Institutions
/ .
. I I.
OthOr U.S. Contributors
..
.
t,
Foreign and International -.
Cohtributors , .
.
P
Columbia University:Hudson LaboratoriesLamoht-Ddherty Geological
ObservatoryCornell UniversityUniversity of DelawareUniversttyof Hawaii -
University of Illinois' Johns Hopkins University
Massachusetts Institute ofTechnology
University of MaineUniversity of MarylandUniversity ,of Miami .
University .of MichiganNorth Carolina State UniversityOregon State UniversityUliversity of PittsburghUniversity of Rhode Island
.
Rixe University. Scripps Institution of
OceanographySouthampton. College '
University of TexasTexas.A&M UniversityVirginia Polytechec Instituteand State University
University of WashingtonWilliams CollegeUniversity of WisconsinWoOds Hole OceanographicInstitution
.
.,
Los Angeles City SanitationDepartment
California Department ofWater Ilsources
es- .
- Arthur.D. Little, Inc.
. Rand Corporation
'
.
.
o.
.
.
.
..
0 .. '
-
ay .
,
v .
G.
.
.
.
,
k "
. .
*
.
.
ca
.
Q.
Fisheries Research, Board of CanadaMarine Environmental Data Service (Canada)Bedford Institute of.Oceanography.(Canada)
National Institute of Oceanography (England)Institute of Oceanographic Sciences (Wales) '
. University of Bergen (Norway).. .
, -
BCO Nacional de Dados Oceanograficos (Brazil). --
BNDO, Centre National pour ,
des Oceans (France)
.
'Centro Argentine de Datoa Oceanograficos, - .
University of.
Puerto Rico a
'
,Univeraidad N. A. de Mexico.
,
.
Inter-American Tropical Tuna Commission ,
,
.
- .
.
'
/
.'
.,
, 4 .
tr ,.*
/.
.
.
.
.
.
0
11
t

J
(.
PHYSICAL. OCEANOGRAPHY.
Transport Computations fromAtmospheric Pressure
Computes the steadyZstate mass transport in the ocean from atmospher4 pressure datat'accordingto a system of analysis designed by Dr. N.P. Fofono(f. Input: Sea level pretsure cards from
the extended forecast division of the U.S. National Weather Service. Output: Meridional and
Language - FORTRAN I and TVHardware - IBM 1620/I9M 1130
zonal components of Ekman.transport, total meridigrated geostrophic transport (mean monthly valuegrees of latitude and longitude in the northern hFRB manuscript series report (Ocean. and Limnol.)
Pacific BiOlogical Station Copy on
Fisheries Research Board of Cana da IBM 1620P. 0."Box 106,Nanaimo, B. V9R 5K6
transport, integrated transport, and inte-e specified grid of alternate five de-
. FORTRAN I program is listed inby Dr. Charlotte Froese, 1963.
at NODC (FORTRAN I version,fot- above report)
STD Computations Langu ge.- FORTRAN IV
STP02 Hard re - IBM 1130.
Computes derived ncaanographic quantities fox Bisset-Berman STD casts. Print output: Pres-
sure, temperalure,,salinity, depth, sigma-t, specific volude anomaly, poten al' temperature and
density, dynamic height, potential energy anomaly, oxygen content; sound velocity otional.FRB Manuscript Report (unpublished) No. 1071,by C.A. Collins, R.L.K. Tripe, and Stk. Wong, Dec.
4.
1969.
Pacific Biological StationFisheries Research Board of CanadaP. O. Box 100Nanaimo, B. C. V9R 5K6
Hydrographic Cast ComputationsHYDRO
Copy on.file at NODC (above report
Language - FORTRAN IVHardware - IBM 1130
Computes derived oceanographic quantities for hydrographic casts. Printed output: Pressure,
temperature, salinity, depth, sigma-t, specific volume anomaly, potential temperature and den-sity, dynamic,height, potential energy anomaly, oxygen content; sound velocity optional. FRB`
Manuscript Report (unpublished) No. 1071,by C.A. Collins, R.L.K. Tripe, and S.K. Wofig, Dec.
149.0 ,
Pacific Biological StationFisheries Research Board of CanadaP. O. Box,100Nanaimo, B. C. V9R 5K6
Copy on file. at NODC (above report)
/
a
Digitizes STD Data \ Language - FORTRAN
DEEP Hardware - Hewlett-Packard 2115A
Digitizes salinity-temperature-depth data on line, u sing time as a criterion for selecting
points. Input are frequencies,from the Bisset-Berman STD system and station heading datathrough a teletype. Output, on paper tape, has station identification fields, time istervalbetween data points, and the STD data. Technical report No. 152 (unpublished manuscript), by
.
1 A. Huyer and C.A. Collins, Dec. 1969. §ee program WET, next page) 'C
Pacific Biological St ion
Fisheries Research rd of Canada
P. O. Box 100Nadaimo, B. C. V9R 5K6 4
Copy on file at.NODd (above report)
a

STD Processing.W T ,K
t.Language,- FORTRANHardware - Hewlett-Padkard 2115A
For shipboard processing of digitized.salinity-temperature-depth data. Input is on paper tape
(output from program DEEP). Output: The following parameters at standard pressutes tempnr-
ature, salinity, sigma-t, delta -d, specific gravity anomaly, specific volume anomaly, geopoten-
tial anomaly, and potential energy. Technical Report No. 152 (unpublished manuscript),. by A.
Huyer and C.A. Collins, Dec. 1969. "
Pacific Biological Station . - Copy on file at NODC (above teport)- :
Fisheries Research Board of CanadaP. O. Box 100Nanaimmo, B. C. V9R 5K6
I,
Station Data Retrieval Languap - ALGOLHYDROSEARCH. Hardware - Burroughs 6700
. '
Provides easy, 1 ensive retrieval of hydrographic station data, with selection criteria ex-pressed in termsof to properties. Output: Summary listing,. detailed listing, cards., tape,
or dipir file. The program can be run either in batch mode or interactively; users can be rocal,46or remote via dial-np,'ARP4MET or FTS, Vser's Guide :Viable.
.
. . .
Ed Coughran Available from originator onlyUniversity of California, San Diego .
P.O. Box 109La Jolla, CA 92037 061 Telephone (714).452-4050 .'
,STD Data Processing Language -'FORTRAN IVHardware -tDC 3300
Processes salinity-temperature-dep th recorded in.the field. BCF Spacial Scientific Repbrt-Fish-
eries No. 588, "Processing of Digital Oata Logger STD Tapes at the ScrippOInstitution ofOceanography and the Bureau of Commercial Fisheries, La Jolla, California," by.Dr. James k.Jones, June 1969.
Oceanic Reiearch Division Copy,on file at'NOUC (above report)
N Scripps Institution of OceanographyP.O. Box 109
a
La Jolla, CA 92037 "
Salinity Anomaly
;ISALBP. .
Language - FOR PAN IIHardware - CDC 3100
Calculates the salinity anomaly from astandard T/S or Theta/S curve for North Atlantic.Central
water developed by L.V. Worthington. The results are output on the line printer. Author -'A.B.
Gralt,(Juip 1968).111-
Director Available from originator only
Bedford Institute of OceanographyP. O. Box 1006Dartmouth, N. S. B2Y 4A2
2
J t .x0 .
Oxyged SattWation, Oxygen Anomaly' Language =. FORTRAN II'
ISATBP 1 dIP..... Hardware - CDC 0100
,Calculates the percentage of oxy gen saturation in seawater, according to tables and forMulaeby Montgomery (1967), as well as an oxygen anomaly on a sigma-tssurface,according, to a tabu-lated curve 6y Richards aid Redfield (1955). The results are output on the line printer) sta
t o by sidtion. Author - AJB. Grant (June 1968).. .
. ,
L
4.
2
r"
1 2,
ora

r
DirectorBedford Instituteof OceanographyP. 0: Box 1006Dartmouth, N. S. B2Y -4A2
/
, Available from originator only
f
PlotoTheta-S Curves . Language - .FORTRAN IIHardware CDC 3100/PDP-8/CalComp Plotter
APlots potential temperature vs. salinity. Input` on cards. Output:. Printed listing and
. punched papa'. tape. Station plot uses a PDP.r8 computer, pager tape reader, and CalComp Plot-
ter: Author - R. Reiniger.
Director *09
.Availablp from originatoronly
Bedford Institute of OceanographyP. O. Box 1006Dartmouthe-N.' S.. d2Y -4A2 m
Plts Station Positions Language - FORTRAN IIHardware - CDC 3100411P-8/CalComp Plotter
Plots cruise station positions on Mercator projection and writes in station number. "PLOTL"
plotting routine used with PDP-8 and CalComp'plotter. Author - R.Reiniger (Sept. 1968).
Director Available from originatlr onlyBedfard'Institute of Oceanography t
P. 0. .Box 1006
Dartmouth, N.S. B2Y 4A2 .
1'
4,
Narient,ioncentrationsPEAK§
Language - FORTRAN IIHardware - CDeli50
Reduces a set of discretely sampled voltages from the Technicon AutoAnalyzer to a set of peakheights and thence to a set of nutrient concentrations. Input: Magnetic tape produced by aTechalDigitizer and Kennedy Incremental Recorder; card deck containing identifiers for Ill sam-
ples and standards. Output: Tables of peak heights and of derived nutrient ancientrations. ,
-Up to 8 parameters and 400 samples can be accamodated per run.
John L. Barron Available from originator.only_Bedford Institute of Oceanography
P. O. Box 1006Dartmouth, N. S. B2Y 4A2
Telephone (902) 426-367
STD Tables and Plots Language -
STD ;Hardware:-TRAN IV100A/Disk/CalComp
'Nop onal
4'
Reduces data from Guildline STD and Hewlett Packard data logger to tables of salini temper-
ature-depth information and prepares it for plotting. The equation giving salinity as a func-
tion of conductivity ratio, temperature, and pressure is due tolOr. Andrew Bennett.
John L. BarronBAdford Institute of OceanographyP. O. Box 1006Dartmouth, N. S. B2Y 4A2
Available from originator only
Telephone (902) 426-3676
3
J

Codsiatancy of Physical ada Chemical DataC 18 A 18 X.
Language - COBOL and FORTRAN subroutinesHardware - IBM 360-50/48K/Disk/2 tape units
Performs consistency check of physical and chemical data obtained during oceanographic cruises.Input,: Disk pack with recorded and sorted data, parameter card indicating wbether.the inputcorresponds to physical or chemical data. Output: Listing of inconsistent data. ,
capitan de Fragata Nestor Available from originator only'Lopez Ambrosioni
Centro Argentino de Datos OceanograficosAvenida Montes de Oca 2124Buenos Aires, Republica Argentina Telephone 21-0061
Calculation of Thermometric Va).ues Language = COBOL ar11 FORTRAN subroutinesC 18 A 23' X ' Hardware - IBM 360-50/58K/Disk/2 tape units
Calculites thermometric depth and corrected temperatures. Input: Disk with physical data andcalibration table of reversingthermometers. Output: Listing of evaluated and accepted physi-cal data. .
Capitan de Fragata Nestor Available from originator onlyLopez Ambrosioni
Centro Argentino de Datos OceanograficogAvenida Montes de Oca 2124Buenos Aires, Republica Argentina Telephone 21-0061
' Station Data System Final ValuesC 18 A 32 X FQ
Language - COBOL and FORTRAN subroutinesHardware - IBM 360-50/64K/pisk/2 tape units
Interpolates temperature, salinity, and oxygen at standard depths; calculates sigma-t and soundvelocity at observed and standard depths; also calculates specific volume anomaly and dynamicdepth anomaly atorandard depths. Input: Disk. pack with accepted primpry data recorch. Out-put: Listing of,observed and computed values at observed and standard depths.
Capitan de Fragata Nestor, Available from originator pnlyLopez-Ambrosioni
Centro Argentino de Datos OceacraficosAvenida Montes de Oca 21F4Buenos Ares, Republipa Argentina Telephone 21i0061
aily'Seawater Observhtions Language - FORTRAN IV-' Hardwaie - CDC CYBER 74
.Input: Daily observations of temperature and salinity. Output: (1) Quarterly statistics, (2)annual statistics, (3) listing of seven-day normally weighted means for one year, Sild (4) plotbf normally weighted means for one year. Author - H. Somers. Early version in FORTRAN II-D
e IBM 1620,
Marine Environmental, Data
580 Booth StreetOttawa, Ont. K1A ORS
Service'
Data ManageMA System for Physicaland Chemical Data
-----OCEANS V
Available from originator only
Telephone (613)995-2011
Language - COBOL, FORTRAN, kL/1, machine lang.Hardware - CDC 6400 under SCOPE 3.3, 125K octal
words/IBM-360-85 under MVT,decimal bytes
The OCEANS V system is designed to make available any physical, chemical, or meteorological.
14

I
data collected as manual recordings or analog traces. TM system is divided into a number ofmodules and presently processes data collected using Nansen bottles and mechanical bathythermo-
graphs.° There are three stages to the system: (1) edit and quality control of newly collected
data, ("2) addition of these data to existing historical data, and (3) retrieval/report from
these historical data.
R. Branch Available from originator only
,Marine Environmental Data Service580 Booth StreetOttawa, Ont. KlA OH3
- '
Mass Transport and VelocitiesGEOMASS
Telephone (613) 995-2011
Language - FORTRAN IIHardware - PDP 8 E/12K
Calculates velocities it standard depths between two stations relative to deepest common depth;also calculates trapezoidally mass transport between successive depths and culumative miss
transport from surface. Assumes deepest common depth is level of no motion. Author - C. 'Peter
Duncan.
Donald K. AtwoodMarine Sciences Department'University,of Puerto RicoMayaguez, PR 00708
Station DataTWIRP
Available from originator only
Telephone (809) 892-2482
Language - FORTRAN IVHardware - PDP 10
Interpolates oceanographic data; calculates sigma-t, dynamic depth anoaaly,,potential tempera-
ture, and delta-t. Input: Observed thermomet4c depths, temperature, salinity, and chemistry.
Output: Temperature, salinity, sigma-t,.potential temperature, delta-t at observed depths and
all of these plus dynamic height anomaly interpolated to standard depths. Author - C. Peter
Duncan.
Donald K. Atwood Available from originator only
Marine Sciences DepartmentUniversity of Puerto Rico
of' Mayaguez, PR 00708 Telephone (809) 892-2482
Thermometer Correction, Thermometric Depth Language -,FORTRAN IV
GIESE 04 Hardware - PDP 10.
Corrects thermometers'and calculates thermometric depth, as per formulae by Keyte. Input:
ThermometerNnumber, uncorrected reading, auxiliary thermometer reading, data, cruise number,
station number, wire out. Output: Corrected temperatures, corrected unproteeted thermometer
readings, and thermometric depth. Author - Mary West.
Donald K. Atwood Available from originator only
Marine Sciences DepartmentUniversity of Puerto RicoMayaguez, PR 00708 Telephone'(809) 892-2482
Oceanography' Station Computer Program Language - FORTRAN IVHardware - Burroughs 6700/2125 words
Processes observed station data to pbtain interpolated values of temperature, salinity, oxygen,specific volume anomaly, dynamic depth, sigma-t, and sound velocity. The three-point Lagrange
interpolation. equation and the Wilson sound velocity formula are used in the computations: fr
Running time is two seconds per station. '
15
5
1
.

Itignel Angel AlatorreInetituto de GeofidicaUniversidad N.A. de MexicoCiudad VniversitariaMexico 20, D.P.
copy on file at NODC:,
Telephone 548-65-00, ext. 537
in r
Flexible System for Biological, Physical,0
, Language - FORTRANNIV
and ChemicalData. .
i Hardware - XDS Sigma 7/40K 32 bitmeds withSEDHYP ( System d'Exploitation des Donnees overlayen Hydrologie Profonde) .
. .,
.
A very flexible system of about 5,000 cards which computes, interpolates, lists, and plotsphysical, chemical, and biological parameters:, Input includes: List of the parameters to belisted, computed, interpolated, plotted, and copied on files; method of computation and inter-polation; name of the parameter to be used as "interpolater";%list of the interpolation levels,;
l'*-foxmat of the processed data. Output: listings of the observed, oomputer, or interpolatedai
l'''format
plots of one parameter versus another parameter with all the curves on the samegraph, or by groups of N curves pn the same graph; copy of the values of one parameter on aworking file for further use by other programs. The options, input on cards, are analysed andcontrolled; each station is stored in "common" area; then paramete eke computed and interpo-lated. 'Files in a new format (FICPAR) are created; each file tont ns all the values of all
.-t-liet stations for'one parameter. The plot is realized from two fi es of.the FICPAR type. Docu-mentation: Presentation de SEDHYP, Dec. 1973; allo, Catalogues d s methodes de calcul, d'in-terpolation et dereduction, Dec. 1973.
Mr. Stanislas, BNDOCentre National pour l'Exploitation
des OceansBoite.Postale 33729273 Brest Cedex, Frande
Available from originator only
Telephone 80.46.50, telex. 94-627
Subroutines for Physical, Chemical and Language - PO IVBiological Parameters Hardware - XDF=ma 7.-
. -
5Pi, C04 SAL, C44 TETA, C 46.SIGM Z, etc. .
.. . .. ."
Subroutines compute the following parameters: Depth, pressure, salinity, potential tempera-ture, sigma-o, oxygen saturation percent, sigma-t, delta-pt, potential sigmas alpha, delta-al-pha, sigma-stp, nitrate, saturated oxygen, apparent oxygen utilization, sound velocity, dynamicdepth, potential energy anomaly, salinity or temperature flux, Vaisala frequency. rinput:Witte of all parameters to be used in the computations and the catalog identification number ofthe choben method. Documentation. ,"Catalogue des methodes de calcul des parameters physiques,
i chimiques et biologiques," Dec. 1973.
(,
Mr. Stanislas, BNDO Available from originator onlyCentre National pour l'Exploitation
des Oceans ',.
Boite Postale 33729273 Brest Cedex, France Telephohe 80.46.50,. telex 94-627
v.
Interpolation Subroutines Language --FORTRAN IVINTERP1, INTERP2, etc. Hardware - XDS Sigma 7
Subroutines interpolate the values of a parameter at different levels; for each subroutine, themethod is different: spline function, polynomial interpolation, linear interpolation, La-grange polynomial interpolation. Input: The values of the parameter to be interpolated, thecorresponding values of the parameter to be used as "interpolater" (e.g., depth), list of the'levels .of the "interpolater" for which interpolation is asked, the number of points to be used.Documentation: "Catalogue des methodes d'interpolation," Dec. 1973.
6
p
r

Mr. Stanislas; BNDO Available from originator only
Centre National pdur l'Exploitationdes Oceans'
Boite Postale 33729273 Brest Fedex, France Telephone 80.46.50, telex 94-627
Processes STD and CTD Data Language.- FORTRAN IV
' SEDSTD (Systeme d'Exploitation des HaOware XDS Sigma 7/25K words,
DONNEES STD, CTD)
The systemincludes programs to copy the raw data from paper tape onto magnetj.c tape, to pro-
4ce validated data from the raw data using calibration information, and to process the vali-
dated seta... It is possible to reprocess the stations from raw data or validated data on mag-
netic tape. Option information to be supplied includes: identification number of the stations
to be processed, whether the data are raw or validated, liOt of the depth levels to be listed,
and scale of the parameters to bp plotted. Output: Listings of depth or pressure, tempera-
ture,.salinity (observed lir computed from conductivity), oxygen, oxygen saturation percent,
sigma -t, potential temperature, potential sigma, delta-plpha, and delta-d for each station;
plots of temperature, salinity, oxygen and sigma-t vs. depth, and temperature vs. salinitrfor
each station; magneticvtape files of raw, and validated data. Documentation: Pieeentation de
SEDSTD, Dec. 1973.
Mr. Stenisles, BNDO .
Centre National pour'l'Exploitationdes Oceans
Boite Postal 33729273 Brest Cedex, Fiance '.
Reads, Calidlates, Interpolates Station Ddta
CAPRICORN
Available from originator only
-Telephone 80.46.50, telex 94-627-
Language - FORTRAN IVHardware - IBM 360=65/3201 bytes
Reads oceanographic station data from care or NODC formatted 120-character-per-record tape.
If desired, it can edit the NODC tape and/or calculate and interpolate oceanographic parameters
for each,station or calculate and interpolate variables at specified sigma theta surfaces or
,potential temperatures. (See subroutines F3, SECPG, EDIT, and PLTEDT
Ruth McMathDepartment of Oceanography
Texas AIM UniversityCollege Station, TX 77843
Available from originator only
Telephone (713) 845-7432
41
Station Data Calculations Language - FORTRAN IV
"F3 Hardware - IBM 360-65'
This subroutine takes as input, through.its common blocks, the observed values for depthotem
perature, salinity, and, if available, oxygen, phosphate, silicate, nitrate, and nitrite. It
then interpolates salinity and temperature to_standard depths, using either a linear means -or
by weighting two Lagrangian three-point polynomials (depending o whether there are three or
four properly distributed data points). The subroutine calcula s the followina for both the
observed and standard depths: potential temperature, thermoster a aly, specific volume
A anomaly, sigma-t, the sigma values for depths of 0y 1000, 2000, 3000, 4000, and 5000 meters.
Computations of sound velocity, dynamic height,-aid transport functions are made for standard 11"
depths only. The computation for stability is made at the observed depths only. The values of
oxygen, phosphate, silicate, nitrate, and nitrite are simply minted Cut, if they are read.
Subroutine F3 is a composite of programs written by,various authors: The original "F" program
was written by Kilmer and Durbury for the IBM 650. This program was expanded by Nowlin and
McLellan for the IBM 7094 and again by Eleuterius for the%IBM 360. The Scripps SNARKI program
provided the basis for much of the present version. (See program CAPRICORNO
rri
7 vi,

..`'-%
Ruts McMathDepartment of, graphyTexas A4M Unive t,y
College Station, TX 77843'
Plots Station DataPLTEDT
.1.111,1Mbalwray.1111,
Available from originators only
Telephone (713) 845-7432
Language - FORTRAN IVHardware - IBM 360 -65 /Houston Omnigraphic
notterP
-
This subroutine generates a plot tape.to,make any of the following 13 plats: Temperature vs.depth, salinity vs: depth, sigma-t vs. depth, temperature vs. salinity, oxygen vs. sigma-t,oxygen vs. temperature, temperature vs. silicate, potential temperature vs. salinity, phosphatevs. depth, sound velocity vs. .depth, stability vs. depth, silicate .Vs. depth, oxygen vs. depth.The size of the plots -ls,J1 x 17 inches. (See program CAPRICORN)
Ruth McMathMcMathDepartment of Oceanography .
Texas A&M UniversityCollege Station, TX 77843
Calculates Station DataSECPda
Available from originator only
Telephone (713)45-7432
Language - FORTRAN IVHardware - /BM 360-65
This subroutine compute& the-depths that correspond to input density surfaces. It then inter-polates temperature, salinity, oxygen, phosphate, nitrate, and nitrite to these computed,depths. Using these interpolated values for temperature and salinity, the following,are calcu-lated at each computed depth: Potential temperature, thermosteric anomaly, specific volumeanomaly, sigma theta for depths of-0, 1000, 2000, 3000, 4000, and 5090 meters, transport, dy-namic height and acceleration potential. Uses Lagrangian interpolation or linear interpola-tion, depending on poinV,distribution. (See program CAP CORN)
Ruth McMath Aval ble from originator onlyDepartment of OceanographyTexas 'A&M University
dr College Station, TX 77843 Telephone (713) 845-7432
Station DataHYD2 .>4
Language - HP ASA Basic FORTRANHatdware -.41P 2100/13K words/Keyboard/CalComp
PlOtter, paper tape punch, and- magnetic tape unit option 1
-Computes station
1data. Input: Header information, depth, tempergture, salinity, oxyge and
silicate from a user-specified device. Output: Station data including depth, temperature,salinity, oxygen, silicate, pressure, potential ,temperature, dynamic height, etc. Plot or tapeoutput optional.
Chris Polloni . Available'from originator onlyWoods Hole Oceanographic InstitutionWoods Hole, MA 02543. 'Telephone (716) 548-1400
\
Brunt-Vaisala Frequency 'Language - FORTRAN IV
T71 Hardware' - XDS Sigma 7/204 words V'
Subprogram computes the Brunt-Vaisala frequency (radians/sec) from station data. Input:itational acceleration, pressure, temperature, salinity. Requires double precision of prograATG.
8
18

I
DynDYNH
Subpr gram'calculates an array of dynamic heights for'specified arrays of prdssure and specific
vol e anomalies.
Jacqueline WebsterWoods Hole Oceanographic Institution,Woods Hole, MA 02543
'.. .
Information. Processing Center Available ffom originator only
Woods Hole OcefinograPhic InstitutionWoods Hole, MA 02543 . 1 Tdlephone (617) 54871400
c Height Languagi - FORTRAN IVHardware - XDS Sigma 7/85 words
Potential Energy Anomaly`4 PEN
Available from originator only
Telephone (617) 548-1400
Language - FORTRAN IVHardware 'L XDS Sigma 7/103 words
Subprogram computes the potential
4e ergy anomaly from pressure and specific, volume anomaly.
Jacqueline WebsterWoods Hole Oceanographic InstitutionWoods Hole, MA 032543
Various Parameters from Station Data
OCCOMP
Computes various oceanographic parametersters to standard depths; computes geostro
tions.
Available from originator only
Telephone (617) 548-1400
' Language - FORTRAN IVHardware - XDS'Sigma
from NODC format
23K words
stati data; interpolates parame-s,
is velocity and volume transport for successive sta-
Mary Hunt Available from originator only
Woods Hole Oceanographic fniatutionWoods Hole, MA 02543 Telephone (617) 548-1400;
.
.
.. N.
,Specific Volume Anomaly r Language FORTRAN IV -H
SVANCO Hairdware - XDS Sigma 7
.. \ \
Subroutine computes the specific volume anomaly, given the pressure and the Specific volume;
from an empirical formula,devised by Fofonoff and Tabata. ,
Mary Hunt' Copy,on file at NODC (lisping; documentation)
Woods Hole Oceanographic InstitutionWoods Hole, MA 02543 Telephone (617) 548 -1400
-N
Pressure Subroutine Language - FORTRAN I1/=H
. PRESS Hardware XDS Sigma 7
Subroutine computes a series of pressures from a given series of depths, temperatures, salini-
e ties, and their latitude. The equation for, pressure is integrated by successive approxima-
tons:
'Mary Hunt Copy on file at NODC (listing, documentation)
Woods Hole Oceanographic InstitutionWoods Hole, MA 02543 Telephone (617) 548-1400
9

4
Reads Station Data .' Language - FORTRAN IV-HC-DATA .
Hardware - XDS Sigma 7 /-"
,.
Subroutine reads oceanographic station data cards and returns the information therein to theuser, one station for each calf..
ik
Mary°Hunt Available from originator onlytWoods Hole Oceanographic Iptitution
. Woods Hole, MA 02543 . Telephone (617) 548.-1400
Geostrophic Velocity Difference SubroutineVEL
Language - FORTRAN IV-HHardware - XDS SigMa.7.
Computes geostrophic velocity difference between two oceanographic stations; according to aformula described by N.P, Fofonoff and Ch4rlotte Froese.
Mary Hunt Copy on file at NODC (listing; documentation)Woods Hole Oceanographic Institut ).on
A IWoods Hole, MA 02543 TelephOne (617).548-1400 ,
Volume Transport Language - FORTRAN IV-HVTR Hardware - XDS Sigma 7
'Computes volume transport between two Stations.
Mary Hunt Available from originator onlyWoods Hole Oceanographic Institution%Woods Hole, MA 102543 Telephone (617) 548-1400
Sigma -t
SIGMAT and DSIGMT
t!)
_Language - FORTRAN IV-5Hardware - XDS Sigma 7'
.
I
Subroutine myomputes sigma-t from temperature and salinity by Knudsen's formulas rewritten byFofonoff,Ind Tabata. DS'IGMT is the double-precision form of SIGMAT.
,. '
Mary Hunt, Copy on file at NODC (list'ing, documentation)Woods Hole Oceanographic InstitutionWoods Hole, MA 02543 Telephone (617) ,48-1400
Adiabatic Temperature Gradien1ATG
1
Language - FORTRAN IV-HHardware -1 X[ Sigma 7
Subroutilhe calculates adiabatic temperature gradient for specified values of pressure, temper-ature, and salinity, using an empirical formula developed by N.P. Fofonoff.
Mary Hunt Copy on file at NODC (listing, docuMentation)Woods Hole Oceanographic InstitutionWoods Hole, rig. 02543 Telephone (617) 548-1400
Potential Temperature Language - FORTRAN IVPOTEMP -Hardicare - XDS Sigma 7/100 words
Subprogram compqtei the 1otential temperatures at a given temperature, salinity,. and pressure,using a formula derived from a polynomial fit to laboratory measurements of, thermal expansion.
lO 20
4
.r

1.
.
Mary Hunt Available from origin or only
.WOods Hole,Oceanographic Institution . 9
Woods Hole, MA 0254i Telephone (617) 548-1400
r .
Specif0 Volume Languige - FORTRAN IV
SPVOL Hardware - .XDS Sigma 7/129 words. ,
...
1 ,
Subprogram computes the specific. volume (ml/g) of seawate at acgiven temperature, pressure,
oisigma-o,..and sigma-t, using formula by V.W. Ekman (rewritteenn by,Fofonoff and Tabata). Input:.
valuesof SigmaLt as calculated by subprogram SiGMAT.. .
4P3 ( Mary Hunt --..
" Available from o atoi only..»
\,.. Woods Hole Oceanographic Institution . .
Woods Hole, MA 02543 Telephone (617 48-1400
11
Oiygeng OPLOT
Computes oxygen in m1/1 and phcent saturation.
U.S. Coast Guard Oceanographic Unit ,imailable fiom originator only.
F Bldg. 159-E, Navy Yard AnnexWashington, DC 20590
\-
Telephone (202) 426-4642
Language - FORTRAN IVHardware - CDC 3300
4
ChlorophylCHL0
Language - FORTRAN IVHardware - CDC 3300
Computes chlorophyl in mg/l.
U.S. Coast Guard Oceanographic Unit Available from originator only
Bldg. 159-E, Navy Yard AnnexWashington, DC 20590
Salinityc.4441414.0
SALTY
Telephone (202) 426-4642
Language - FORTRAN IV
-" Hardware - CDC 3300
4
Computes salinity,in ppt with temperature correction and shear correction between each standard
'water sample.k.,
Available from TIsinato,only (-
Telephone (202) 426-4642
Temperature7-Salinity Class ume Language - FO RTRAN IV )
TSVOL Hardware - CDC 3300
U.S. Coast Guard Oceanographic Un1tBldg. 159-E, Navy Yard AnnexWashington DC 20590
4
Calculates volume of water by -S class, area within which station is located (in sq. k=) and
total volume for each T-S class:
U.S.-past Guard,Oceanogiaphic Unit Available from originator only
159-i,. Navy Yard Annex
Washington, DC 20590 Telephone (202)'426-4642'
.44 w.
s%
.

lbe;pameterTorrectionTHERZ Hardwa e - CDC 3300
. .
,. s
Corrects deep-sea reversing thermometers using calibration factors; computes thermometric depthfor unprotected thermometers, listsCbad thermometers and their malfunctions, computes observed
,
I± Z, pots L-Z curve Oil line), computes used L-Z and picks from the L-Z curve the depths forthe other bottles.
U.S.
fs
..
.
Coast Guard Oceanographit, Unit Available froM originattol. only
.40°-
Languar - FORTRAN IV
4
7
TransportXPORT
159-E, Navy Yard AnnexWashirigton, DC 20590 Telephone (202) 426-4642
11 Language - FORTRAN IVHardware - CDC 3300/CalComp Plotter
Calculates sigma-t, dynamic heights, solenoidal values of average temperature and salinity vol-ume floe, current velocity at top of each solenoid, distance (n.m.) between stations,.specificheat, heat and'salt transport, net volume flow for each pair of stations, net volume flow inform of cold core and warm water for_each station and plots solenoid graph on off-line plotter.
U.S. Coast Guard Oceanographic Unit Available from originator onlyBldg. 159-E, Navy Yard 'AnnexWashington, DC 20590 Telephone (202) 426-4642
Plots Temperatures, Lists Mixed Layer Depths ianguage - FORTRANWEEKPLOT ' Hardware - Burroughs 6700/Less than 20K words/
CalComp Plotter
Plow sea temperature for one-degree quadrangles for the eastern tropical Pacific Ocean; also,computes and lists mixed layer lepths. Mixed layer depths are computed by an empirical for-mula.and modified by reports received from tuna fishing vessels. Input: Disk files of synop-tic ryDarine radio weather reports, preparea separately from punched cards.
r-
A.J. Good Available from originator onlySouthwest isheries/CenterNational Ma ne-Ftsheries Service, NOAAP.O. Box 271 is
La Jolla,- CA kO37 'Telephone (714) 453-2820, ext. 325
Constan for Harm ic Synthesis of Meankea Language r ALGOLTemperatures, IC Hardware Burroughs 6700/ esp than 30lc. words/
Disk input and utput
Computes five constants to be used in harmonic synthesis of mean sea temperatures, by one-de-gree.quadrangles Monthly variations of mean sea temperature are treated by a Fourier seriesanalysis. Disk file of constants, by one-degree quadrangles for the Pacific Ocean.
J.
A.J. Good Available from originator onlySouthwest.Fisheries Center
,National Marine Fisheries Service, NUAP.O. Box 271La"Jolla, CA
.t92037 Telephone (714) 45362820, ext. 325
Vertical Section PlotsESTPAC
Language - FORTRAN 63Hardware - CDC 3600/32K words/3 tape units/
Calcomp Plotter
Constricts vertical tgacefatures and salinity sections from STD magnetic tepepon 30-inch-wide
12
22
plotting p per. The product of the two dimensions (station distance X depth) of
es fou mustnot exceed 32,000. NOAA Technical Report NMFS CIRC-365.. .
Kenneth A. Bliss Available from originator'onty
Southwest Fisheries CenterNational Marine Fisheries Service, NOAAP.O. Sol! 271
La Jolla, CA 92037*A
Converts STD DataRDEDTP
Telephone (714) 453-2820
a data array
Nk.
A 5,
Language - FORTRANHardware - CDC 360G/15K,woids/2'tape units
rt
'Reads raw STD data from tape, converts to engineering units, xemoP extraneous values, smooths
and writes a new tape. U.S. Fish and Wildli! Service Spec. Sci. Rept.lish. 588, by James H.
Jones, 1969. This program is presently in the state of revision.
Kenneth BlissSouthwest Fisheries CenterNatioarMarine Fisheries Service, NOAAP.O. Box 271
Available from originator only
La Jolla, CA '92037 Telephone (714) 453-2820
1Corrects-STD Data Language - FORTRAN
,TPMOD . S Hardware
Reads STD data from output of program RDEDTP,and writes a final corrected tape. U.S. Fish
' Jame,44 Joao; 1969.
Kenneth Bliss° Southwest Fisheries CenterNational Maripe Fisheries Service, NOleP.O. Box 271La Jolla, CA 92037
- CDC 3600/10K words/2 tape units
g
calibrates data, adds etAtion location and data,and Wildlife Service Spec. Sept. Fish. 588, by
Available from originator only
,
Environmentaklynamics SubroutinesOCEANLIB
A seAes of subroutines: ALPHA calculatesand values from a random dcess file; GRAVIng the international gravity formula. SI
formulas of Knudsen for eigma-o and LaFond
sity of seawater, using empirical formulas-sound velocity using the qmpirical formularection and distance between points on thelowing the earth's radius to vary.
Telephone (714) 453-2820
Language - BASICHardware - IBM 360/Dartmouth DTSS
N
Alpha 35, 0, P for any depth by interpolating 'stand-computes the resultant gravity at'any latitude, us-
GMAT calculates sigma-o and sigma-t using empiricalfor sigma-t. DENSITY cakttlates the in situ den-
developed by LaFond and others. SOUND computesdeveloped by Leroy iii 1968. 'PosIT computes the, di-berth's surface, using spherical trigonometry, 'al-
Lpit W.C. BarneyEnvironmental Sciences DepartmentU.S. Naval icademyAnnapolis, MD 21402
Geostrophic Current
CURRENT
Calculates geostrophic current at
ti
Available from originator only
Telephone (301) 267-3561
Language = BASKHardware - IBM 360/Dartmouth DTS / . K
standard depths between adjacent stations using method of
13
2:3
4

s
t
dynamic height Or geopotential anomalies. Requires OCEANLIB subroUtines.
, LCDR W.C. OrneyEnvironm ta1,8ciences DepartmentU.S. Naval AcademyAnnapolis, MD 21402
,Monthly Sdnic Layer Depthh
Available from originator only
Telephone (301) 267-3561
Language - FORTRANHardware - IBM 7094
Calculates sonic layer depth from BT traces and converts position to plot on Mercator basewithout overprints. OS No. 53480. Author - 1.B. Nix.
0."\Available from originator onlyData Systems Office
U.S. Naval Oceanographic OfficeWashington,, DC 20373
e
a Vertical Temperature Gradients
Telephone (301) 763-1,A49
Language - FORTRANHhrdyare - IBM 7.074
Computes, from geographic station data, the vertical temperature gradient largest in absolutemagnitude between successive standard depths, for each station. These gradients are tabulatedin frequency distribution format, and averages are calculated for earth one - degree square. OSNo. 20126 Part 2. Author - C.S. Caldwell.
7
Data Systems Office Available from originator oilyU.S. Naval Oceanographic OfficeWashington, DA. 20373 a . Telephone (301) 763-1449
WateriClarity Language - FORTRAN V.Hardware - UNIVAC 1108/3K ictrdsfprtms
P
Combines datil taken with Scripps illuminameter, transmissometer, SeAchi disk and Porel-UleScale. Logarithmetic combination of parameters are summed over observation intervals to yipldmeter by meter results. Input: Diffuse attenuation coefficients, transparency readings, -depths of observations vi*scar8s. Output: Visibility loss at specific levels of the watercolumn and contrast loss expressed in decibel values.
9
Philip Vinson Available-from originator onlyU.S. Naval Oceanographic OfficeWashington, DC 20373
Oceanographic Data ComputationTPCONV
Telephone (202) 433-3878
Language - FORTRAN EXTENDEDHardware - CDC 6500/15K 60 birwords4wo;p1pe
units
Assembles temperature, salinity, and sound velocity at forty standard oceanographic depths fromany preselected ocean srea_anto magnetic tape. Also included for each oceanographic station isthe layer depth, layer sound velocity, inola.Yer gradient, below-layer graaxis; depth Bound velocity. Output used by program SUMMARY. NUC Tech. N
Jain J. RussellNaval Undersea CenterCode 14San Diego, CA 92132
u ""
ient, axis depth ande 1223.
Available from originator only
Telephone (714) 225-6243
"641:1144ts.
14
24

ariance and Standard Deviation Language
UMMARY Hardware.
.
1
- FORTRAN EXTENDED- CDC 6500/63K 60 bit words/Disk/1,
Two tape units - 0
Orders selected oceanographic data at each of forty standard,levels and selects maximum, 10,
0, 30,.40, 50°, 60, 70, 80, 90, 2A and 75th percentiles, and minimum. Also computes variance
and standard deviation at each of the forty standard depths. Input: Data generated by the
program TPCONV: Output: Deck of eighty-one cards - two cards at each of the forty standard
depths. First card contains maximum,,percentiles (above), minimum, number of observations,
and,identification a't one depth. The second card contains variance, number of observations,
mean, depth numbef7-mnd identification. NUC Tech. Node 1224-,
John J. RussellNaval Undersea Center
'( Code 14San Diego, CA 9'2132
Sigma -T
INVREJ
Removes inversions.in sigma-t profiles prior
following options are available: binomial
local smoothing.
K.; Crocker
Naval UnderWater SysNewport, RI 02840
ems Center
Available from originator only
Telephone (714) 225-6243
Language - ANSI FORTRAN I.Hardwire - CDC 3300
to calculation of buoyance-frequency profile. The
smoothing, minima rejection, maxima rejection,,and
Availablfrom originator only
Telephone (401) 841-3307
'.-Z177PrOceaping Languag - ANSI FORTRAN
OCEANDATA ' Hardware - CDC 3300 /ucq plotter
Converts raw Plessey CTD-STD data (frequency or pe;Iblaverage) to Parametric form, correctsr----"`,-*salinity for4time constant mismatch, rejects invalid data, averages,data by designated inter-
vals (normally 1 decibar). Provides listing, plots, disk and tape files of corrected raw data
and reduced data. Several special purpoie editions available.
K. CrockerNaval Underwater Systems CenterNewport, RI 02840
t
Availatit from originator only
Telephoner(401) 841-33Q7
Internal Waves , Language - USASI FORTRAN
WITCONB HardWare - CDC 3300/26K words
Calculates intArnal wave eigenvalues (dispersion curves) and eigenfunctions as solutions to`fhe1
linear internal wave equation. Input: Depsity as a function of depth in the ocean from the
4 surface to the bottom. Data points do not have to be equally spaced in depth. Output: Den-
sity profile (smoothed), buoyance-frequency profile, dispersions curves, (all listings); plotter
tape for preceding plus eigenfunctions. Performs numerical integration of internal wave equa-
tion using assumed values of frequency and wavenumber until boundary conditions are satified by
trial and error.
Alan T. MasseyNaval Underwater SystemfOCenter
Newport, RI 9840
0
Interpolation for Oceanographic Data
4
Available from originator only
Telephone (401) 841-4772
Language - FORTRANHardwap -*CDC 3200/IBM 1620.
S.
,e

Interpolates the values of depth, temperature, and salinity at isentropti leveA (Cons:Ntgrangian polynomial. Exception: Modi-
driitort thg pplynomaal. - Technical
values of the density functions). Uses a four-pointfications are made where common oceanographic conditioeReport-1E-3129)y J. Farrell and R. Lavoie, Feb. 1964..
Naval Underwater Systems. Center Copy on file at NODC (above report}'Atrport?.RI 02840
. ..
STb--9/V Data
S2049 .
P
Language - FORTRAN V' HardWare - UNIVAC 1108/CalComp Plotter
Performs general purpose processing of STD-S/V data; includes conversion to oceanographicunits, editing, ordering relative to increasing depth, calculation of dependent variables, andplotting of results. Input:, Presstde or depth, temperature, salinity or conductivity, andsound speed in units of frequency, periodor geophysical units., Density computed by,integra-tion of P, T, S throughout the water column; sound-speed'by Wilson's equation; potential tem-perature byliofonoff's equation. Output: Maghetic tape, listing, plots of profiles, T vs. S,cross-sectio%, geographic contours; measured parameters plus density, sound speed, potential.,quantities,,Brunt-Vaisala frequency.
MichaeFFecher bevailable from originator onlyNaval Underwater Systems Center , .
New London, CT 06320 Telephone (203) 442-0771.:ext. 283%
-
Thermometric Depth Calculation Language - HP FORTRAN IV under RTECAST Hardware - HP 2100S412K words-core/lOK
for RTE /OalComp Plotter
g Uses thermometer readings from Nansed bottles to cklculate therr,logetr4 depths of the bottles,tIolloing method described in instructions for filling out Naval Vceadographic Office "ASheet." Thermonetris_selpr.ha are printed with input data; L-Z graph is plotted.
J. Dean'Clamons Available from originator only:Shipboard Computing Group, Code 8003Naval Research LaboratoryWashington, DC 20375
rN
Telephone (202) 767 -2024
Thermometer Data File Handler- Language.- HP FORTRAN IV under RTESr.THERMO - HP, 21005/12K words core/10K for RTE
r'
Maintains and-buildsdisk file containing4
casts. Zugram ie interactive and can add,
J. Dean Clamoss'Shipboard Computing Group, Code 8003Naval Research Laboratory t ,.1/4
Washington, DC 20375 .
tr
correction factors for thermometers used 'on Nansendelete, change:'or list data fores2h thermometer.
Available from originator
Internal Gravity Waves Language - FORTRANDISPER Hardware - CDC 3800
Telephone (202) 767-2387
44,
)61
Calculates frequency - Oavenumber,disperSion relations for internal gravity wave odels. In-
put: B unt-Vaisala frequency distribution, wavenumber range, mode number range. Output: Fre-
quency :s a function of wavenumber for specified modes, in tabular or line printer plot form.NRL Report 72$4, "Numerical Calculation of Dispersion Relations for Internal Gravity Waves," byT.H. Bell, Sept. 197'1. , ,
16 26
is
l&F
at

T. H. Bell Available from originator onlyOcean Sciences DivisionNaval Research LaboratoryWashington, DC 20375 Telephone (202) 767-3122
Sea Surface TemperatureAnalysis Model
MEDSST
A
I
Language - FORTRAN/COMPASS ,
Hardware"- CDC 3100/CDC 3200/32K 24 bit words
Perfdrms a synoptic sea-surface temperature analysis, using a Laplacian relaxation techniqueto ggnerate the final field. EPRF Program Note 5, "Mediterranean Sea-Surface Temperature Anal-ysis Program MEDSST," by A.E. Anderson, Jr., S.E. Larson, and L. I'Anson.
Sigurd LarsonEnvironpentAl PredictionReseaivkjacility
Naval Postgraduate SchoolMonterey, CA 93940
Available from originator only ,
Telephone (408) 646-2868
Objec ive'Thermocline Analysis Language - FORTRAN IV-H ...
1p, / /
r
. Hardware - IBM 360/CDC 6500( \
Reads digitized baihythermograph traces and then analyzes them objectively by Gaussian and non-Gaussian methods for the top, center, and base of the main thermocline. Additionally, suchfeatures as. multiple thermoclines, inversions, and thermal transients are identified and theirkey points are included in the information data printout. "Objective Digital Analysis ofBathythermograph Traces," thesis by Eric F. Grosfils, Dec. 1968.
Naval Postgraduate School Available from NTIS, Order No. AD 689 121/LK,Monterey, CA 93940 $5.75 paper, $2.25 microfiche.
Wet Bulb TemperatureWETBLB
Language - FORTRAN IVHardware - CDC 6600
Computes the wet bulb temperature from the inputs of dry bulb temperature, pressure, and rela-tive hwaidity. This, is sometimes useful for generating homogeneous archive outputs (filling in
'missing wet bulb temperatures from the other variables).
Available from originator onlyJerry SulliyanCenter for Experiment Design andData Analysis, NOAA/EDS
Washington, DC 20235
,Internal Wave OscillationsMODE
Telephone (202) 634-7288
Language - FORTRANHardware - CDC 660d & 7600 (original program),',
UNIVAC 1108 (modified version) /311(words
Computes eigenfunctions and dispersion relations-for internal wave oscillardons in a density-stratified water column, using Newton-Raphson approximation technique to obtain solutions foreigenfrequenciesmandassociated mode functions. Input: STD data on cards. Output: Tabular
output of density, Brunt-Vaisala frequency, dispersion relations, eigenfunctions. User's Man-ual (RDA-TR-2701-001) by R&D AsSociates, Santa Monica, California, for implementation on CDC6600 and CDC 7600; modified User's Manual by A. Chermak for AOML's UNIVAC 1108.
17
0/

Anidrew CherMakOcean Rpmote Sensing LaboratoryAtlantic Oceanographic andMeteorological Laboratories, NOAA
15 RickeAacker CausewayMiamif FL 33149
Isentropic Interpolation
Available from originators only
Telephone (305) 361-3361
Language - FORTRANHardware - IBM 360-65/61K bytes
Provides values of several variables at selected dqpsity (sigma-t) levels; interpolation by
cubic spline, with modifications for oscillation. Input: NODC SD2 (station data) file, Out-
put: Interpolated values of depth, temperature, salinity, pressure, specific volume anomaly,dynamic height and acceleration potential, on magnetic tape. Author - Douglas R. Hamilton.
Oceanographic Services BranchNational Oceanographic Data CenterNOAA/EDSWashington, DC _20235
Copy on file at NODC
Telephone (202) 634-7439
Potential Temperature and/or Density Language - Assembler
POTDEN Hardware - IBM 360-65/50K bytes
Reads the NODC SD2 (station data) file and replaces temperature and' /or sigma-t with potential
temperature and/or density. Requires subroutine PODENS. Author - Walter Morawski.
Oceanographic Services BranchNational Oceanographic riata Center
NOAA/EDSWashington, DC 20235
Copy.on file at NODC
Telephoi (202) 634-7439
OSIGMAT Language - FORTRAN
Hardware =-IBM 360-65/740 bytes (object form)
Computes sigma-t, giving a rounded floating point answer accurate to four significant decimal
4 digits (xx.xx); also returns the computed variable FS (a function of sigma-t), a short floating
point number. Author - Robert Van Wie.-
. Oceanographic Services Branch Copy-on file at NODC
National Oceanograhic Data CenterNOAA/EDS N-
.-Washington, DC 20235
Dynamic Depth AnomalyLWANOM
Telephone (202)' 634-7439
Language - FORTRAN IV -G
Hardware - IBM 360-65
Subroutine computes dynamic depth anomaly. Author - Robert Van Wie.
Oceanographic Services BranchNational Oceanographic Data Center
NOAA/EDSWashington', DC 20235
Copy on file at NODC
'Telephone (202) 634-7439
t
Computes Salinity from Conductivity, T,,P Language - FORTRAN
SALINE IF Hardware - IBM 360-65..-
182(3 4

Computes salinity from conductivity in milli mhos/cm, pressure in decibars, and temperatuie indegrees C. Valid for temperature range 0-30 degrees C, salinity range 20-40 ppt, pressurerange 0 -3,000 decibars; measurements outside these ranges may cause a significant error in theresulting salinity computation. Author - Philip Hadsell.
Oceanographic Services Branch Copy on file at NODCNational Oceanographic Data CenterNOAA/EDSWashington, DC 20235 Telephone (202) 634-7439
Volume Transport Function Language - FORTRANQFUN Hardware - IBM 360-65
Computes the volume transport.function at each depth of a hydrographic station. Author -RalphJohnson.
Oceanographic Services Branch Copy on file at NODCNotional Oceanographic Data CenterNOAA/EDSWashington, DC. 20235 Telephone4202) 6344,7439
Potential%Temperature, Potential Density Language - FORTRAN IV-GHardware - IBM 360-65PODENS
. Computes potential temperature and potential density from depth, temperature, and salinity.-Author - Dave Pendleton.
II
Oceanographic Services Branch Copy on file at NODCNationar Oceanographic Data CenterNOAA/EDS'Washington, DC 20235 Telephone (202) 634-7439
Volume TransportVOLTRN
Language FORTRAN IVHardware IBM 360-65
Computes volume transport between any two stations, according to the formulas in D. Andleton's"Specifications for a subroutine which computes the transport function," NODC,August 29, 1972.Author - Ralph Johnson.
Oceanographic Services Branch Copy on file at NODC .
National Oceanographic Data CenterNOAA/EDSWashington, DC. 20235
Computes Pressure
PRESSR
Telephone (202)634-7439
Language FORTRAN IVHardware - IBM 360-65
Computes pressure from latitude, depth, temperature, salinity, and sigma-t. Must be calledserially through a cast since the calculation of pressure at each depth after the surface in-,volves the depth, density, and pressure of the preceding depth. Author - Sally Heimerdinger.
Oceanographic ServicesNational Oceanographic Data CenterNOAA/EDSWashington, DC 202
Branch Copy on file at NODC
Telephone (202) 634 -7439
19
23ti

Temperature Difference CalculationsTEMPDIFF -
Language - AssemblerHardware - IBM 360-65/36K bytes
Takes selected BT's 4T sections of the BT geofile and sums the temperature difference for eachMarsden square, one degree square and month; these may be summed over 10-, 15; or 20-meter inter-
vals. Input BT records sorted by Marsden tten-degree) squares. .Author - Walter Mprawski.
Oceanographic Services Branch Copy on file at NODC
National Oceanographic Data Center A
NOAA/EDS'Washington, DC 20235
RAS Dilta Pr ceasing and AnalysisPrograms; a Management System (DMS)
Telephone (303) 634-7439
Language - FORTRAN*Hardware - UNIVAC 1106/PDP-11
Data Processing:
DMSED is a general-purpose editor for DMS files; editing may be by hand or by algorithm%(PDP-11)
D,MSCHP automatically chops a DMS time series into profiles. (PDP-11)
RACAL aligns, calibrates, and pre-edits data from Aanderaa current meter; output is DMS file.
(PDP-11)
MK2CAL transcribes and calibrates Mark II Cyclesonde (unattended current profiler) data; out-
put is DMS file. (POP-11)
DERIVE appends to a DMS file new quantities derived from the input file; repertoire is expaed-able. (UNIVAC, PDP-11)
DMSORT concatenates DMS files from various sources, sortsinto class intervals, and outputs a DMS file. (UNIVAC)G
MATRIX 01 interpolates data in depth-time coordinates to aoutput options. (UNIVAC)
Datl Analysis:to it
PLSADcomputes a wide Variety of statistical and dynamical quantities from title series of STDand/or PCM profiles;prequires dqta on a uniform, rectangular grid. (UNIVAC)
IWEG computes Internal wave eigenvalues-and eigenfunctions. (UNIVAC).
.
qpittsEc computes dynamical fields and internal wave rays for x, a sections; requires mean sigma-t
and mean velocity fields on a common level but otherwise nonuniform grid. (UNIVAC)
according to selected key , segments
uniform.grid with variou input and
SPKTRA computes auto-and cross-spectra by Tukey (correlation) method. (UNIVAC)
CMXSPC computes auto- and cross-spectra in polarized form for single or a pair of complex-val-
ued series; input is selected output of SPKTRA. (UNIVAC)
0
TIDES4 computes amplitude and phases for specified frequencies= by least-squares; for pairs of
series, tidal ellipse parameters are computed.. (UNIVAC)4
NETTIX computes all meteorological fluxes from observed meteorological parameters by bulk for-.
mules. (UNIVAC)a
EMPEIG1 computes cross covariance matrix and finds its eigenvalue and (orthogonal) eigenvectors.
(IJNIVAC)
(Reading and writing DMS files in machipp-level language)
20 30

r
1.
Christopher N.K. Mooers or HenryT. Perkins
Division of Physical OceanographyRosenstiel School* of Marine and \Atmospheric Science
University of Miami10 Rickenbacker Causeway
P Miami, FL 33149
V
1
3
Available from originator only
Telephone T305) 350-7546
2
of,
A
1.

CHEMISTRY
CO2 and D.O. SAT Language - FORTRAN
AHardware - IBM 360/less than 5000 bytes
ACalcUlates percent saturation of dissolved ox gen and concentration of free CO2. Followsstandard methods (American Public Health Asso iation, 1971) for oxygen and Carrels and Christ
' (1965) for CO2 ("Minerals, Solutions, and Eq libria," R.M. Carrels and C. Christ, Harper and
Row). Input: Data cards with sample identi ication, temperature, pH, phenolpthalein alkalin-ityy,bicarbonate alkalinity, and dissolved ygen. An average correction factor for total dis-
solved solids is included in each run. Out ut: Printed and punched sample identificatiOn,_temperature, dissolved oxygen, percent saturation, carbonate alkalinity, bicarbonate alkalinity,bicarbonate, Kpand free CO2. "A Computer Program Package for Aquatic Biologists," by Paul J..Godfrey, Lois White, and Elizabeth Keokosky.
Paul J. GodfreyDepartment of Natural ResourcesCornell University, Fernow HallIthaca, NY 14850
AlkalinityALCT
Copy on file at NODC (listing, doeumentftion)
Telephone (607) 256-3120
Language - FORTRAN IVHardware - CDC 3150
Calculates total alkalinity, carbonate alkalinity, pH, and log (k(A)) for a potentiometric al-
kalinity titration. Endpoints are found by Gram plot method; complete procedure has been de-scribed by Dyrssen and Sillen. Input: Paper tape from DATOS data set and ASR-33 Teletype; aset of sample salinities on disk, tape, or cards; one or two cards containing run information.
Output: Line printer plots of the titration curves; extensive information about each samplerun; and a summary sheet with the four parameters for each sample.
John L. Barron Available from originator onlyBedford Institute of OceanographyP. O. gox 1006Dartmouth, N. S. B2Y 4A2
Telephone (902) 426-3676
Specific Conductivity with Pressure Effect Language - FORTRANHardware - IBM 360
Computes specific condudtiviti9s from measured values of resistance for the electrolytic solu-tion and the pressures, at which the measures were made. Also determine:: other useful quanti-
ties needed to determine the effect of pressure on the ionic conductance through the upper 2000meters of the ocean's water column. The conductivity increase whichtresults solely from solu-tioh concentration changes during' compression is determined and found to be a significant error
source. Thesis by Michael E. Mays, Dec. 1968..
U.S. Naval Postgraduate SchoolMonterey, CA 93940
Available from NTIS, Order No. AD .i86 654,
$4.75 paper copy, $2.25 microficke.
Percentage Saturation of Oxygen in Language - FORTRAN IV-G
Estuarine Waters, B528 Hardware - IBM 369-65
Computes the percentage saturation of dissolved oxygen in estuarine or brackish water. Bedause
Of the temperature compensation at a fixed 25 degrees C in the conductivity measurements, sa-linity is given as input and is used to compute chlorinity. This computed chlorinity, with the
22
wN
32

I !
accompanying taperltuse, is used to determine the oxygen solubility of the water. The maximum.
percentage aaturet on of the dissolved oxygen in the water is calculated from the given oxygencontent and the com uted oxygen solubility. The 'ame procedure is used to ascertain the mini-
ono percentage satu ation of oxygen. Independent of the dissolved oxygen data, there is an-
: other set of measur a temperatiye and conductivity from which salinity is computed. Author -
Patricia A. Fulton. 4.°01,10
Computer.Center DivisionU.S. Geological SurveyNational CenterReston, VA 22092
".7
Copy on file at NODC (listing, 'documentation)
Telephone (703) 860-7106
Water Chemistry - Dielectric Constant Language - FORTRAN IV
A 14.0101 Hardware - IBM 360-65
Calculates the dielectric constant of water (0 to 360 degrees C (water saturated for T over 100degrees C)), the density of water (0'to 360 degrees C), the extended Deye-uueckel activity co-efficients of aarged species, the activity products for 33 hydrolysis reactions including ox-ides, hydroxides, carbonates, sulfides, and silicates, the concentrations and activities of tenion pairs or complexes, and of 22 aqueous species, the oxidation potential calibrations, thestandard state oxidation potentials and Eh values at equilibrium for 13 redox reactions,cinolesand ppm Acations at equilibrium with,42 solid phases and the chemicql potentials for each ofthe 42 reactions along with activity product/equilibrium constant ratios for the hydrolysisreactions.
Computer Center DivisionU.S. Geological SurveyNational CenterReston, VA 22092`1
if
Copy qn file at NODC (deck, documentation)
Telephone (703) 860-7106
23
O
,
41. pi'

COASTAL AND ESTUARINE PROCESSES
Three-Dimensional Estuarine Language -
Circulation Model Hardware -
Produces a fully three - dimensional simulation of estuarine,and bottom geometry, inflowing riders, openings to the sea
lated parameters. 4
Alan J. PullerDepartment of Meteorology .(IFDAM)Uniliersity of Maryland.
Space Science BuildingCollege Park, lip 20742
FORTRAN, IV
UNIVAC 1108/40K
circulation for, salinity, wind
6 character
arbitrary lateraleffect, and other re-
Available from originator only
Telephone (301) 454-2708.
Multi-Layer Hydrodynamital- .Language - FORTRAN IV
'Numerical Model Hardware r CDC 6500/CDC 7600
Computes the current patterns using a two-layer hydrodynamical-numerical model for bays, estu-aries, and sections of coastline, This program applies the finite differencqhydrodynamic equg-
tions to a two-layer system. As'optional output, it can produce currents and layer elevation
fields? surface pollutant diffusion fields,and.detailed special point information. EPRF Tech.
Note. 2-74, "A Multi-Layer Hydrodynamic - Numerical Model," by T. Laevastu.
.0
k
LaevastuEnvironmental Prediction
Research FacilityNaval Postgraduate SchoolMonterey, CA 93940 s Telephone (408) 646-2937
Available from originator only
. Single Large HydcodynamicalNumerical Model
Language- FORTRAN'IVHardware CDC 6500/IBM 360
Computes tidal, permanent, and wind-induced flows for bays, estuaries, or sections of the
coastline, using the finite difference form of the hydrodynamic equations. Input includes bot-
tom bathymetry and tides at an open boundary. Output: Wave elevation and current speed and
direction fields, diffusion of pollutants field;'if desired; detailed data for up to twelve
points. EPRF Technical Note 1-74, "A Vertically Integrated Hydrodynamical-Numerical Model," by,
T. Laevastu.4
Kevin M. RabeResearch' Facility Environmental
Naval Postgraduate SchoolMonterey, CA 93940
Es;gre ModelNO
Solves aSalinity
Available from originator onlyPrediction
Telephone (408) 646-2842`,4
Language - FORTRANHardware IBM 370-165/150K characters
system of non-linear algebraic equations for a vertical plane estuary model. Output:
and two velocity component profiles, as
L.J. PietrafesaCenter for Marine and CoastalStudiesNorth Carolina State UniversityRaleigh, NC 27607
a function of two space variables.
Available from originator only
)T ephone (919) 787-6074
24
34
a
MIT Salinity Intrusion Program
114,...,1
Language - FORTRAN IVHardware - IBM 360 - 6/120 K bytes
3"Provides predictions of unsteady salinity intrusion in a one-dimensional estuary of varyingcross-section, usi
%g finite difference solution to tint equations of motion and tonservation off%16salt; coupling is a nted for through a density term in the momentum equation. Input: Sche-
Watized geometry, ups reameam inflows as a function of time, ocean salinity and tidal eleVationsat the ocean. Output: . (1) Surface elevations, cross-sectional discharges and salinities as afunction of time; (2) high-water slack salinities by tidal cycle; (3) lopgitudindl.dkspersioncoefficients; (4) plot . Tecfnical Report No. 159, "Prediction of Unsteady Salinity Intrusionin Estuaries: Mathemat del and User's Manual," by M.L. Thatcher and D.R.F. Harleman,Ralph M. Parsons Laboratoiy, Massachusetts Institute,of Technology, 1972. Also MIT Sea GrantPublications 72-21. , r .
M. LlewellydThatcherSouthampton CollegeSouthampton, NY 11968
Dynamic Deterministic SimulationSIMUDELT
Ye/Available fro MIT or from they 'author.
Telephone (516) 283-4000 I.0'
Language = FORTRAN IVHardware - IBM 360/5 tape units/CalComR,
potter optional
Simulates growth of a subaqueous deposit where a fresh water stream enters a saline basin.Tidal effectsand longshore transpoIalso are included. Input: Stream width and depth, waterdischarge, sediment load, profile.of:basin bottom, tidal range, Npgth of tidal cycle, andtransport Parameter: Output: Tables of particle trajectories, graphs of distribution of dif-ferent size grains in deposit, plots of delta development in plan,and elevation views.
K. Kay ShearinUniversity of Dew aware'P.O. Box 2826Lewes, DE 19958
Beach Simulation Model ,
Available from originator only
F-%
4/1Telephone -(302) 645-6674
Language - FORTRAN IVHardwaTe - IBM 1130/16K words/3 disks/
CalComp Plotter
A computer simulation model to study relationships'among barometric pressure, wind, waves,longshore currents, beach erosion, and .bar migration. Fourier series are used to representmajor trends in weather and wave parameters. Barometric pressure plotted as a function dftime; longshore currentvelocity computed as function- of first derivative of barometric pres-sure. Nearphore area represented by kci linear plus quadratic surface with bars and troughs gen-
* erated by normal and inverted normal curves. Wave and current energies computed for storm andpoststorm recovery periods are used to'simulate coastal processes which cause erosion and de-
,position. A series of maps are produced to show changes id nearshore topography through time.
%J.ONR Tech. Report No. 5, "Computer Simulation Model of Coastal Processes in Eastern Lake Michi-gan," Williams College.
. .
William T. Fox. Available from originator onlyDepartment of GeoliogyWilliams College ,
WilliamstoWn, MA- 01267 Telephone (413) 597-2221- , J
S.....
Estuarine Density Currents and SalinityDENSITY
Language,- FORTRANHardware - IBM 370-155/250K bytes,
Performs numerical calculation of steady density currents and salinities. in an,.estuary in threedimensions by numerical solution of finite-difference equations for a number of quasi- timesteps.Input: Local gemmetry04depths, tidal currents, latitude, boundary salinities. Output: x-y-z
4
444
25

,4141
paper plot of velocities and vector representation of circulation patterns with complementary
35mm color slides. Determines primary orientation of 45° oblique photographs, identifies spe-
cific dye patch mO4mpta, and averages velocity over a known time span:' "Airphoto Analysis of
Estdarine Circulation," by H.G. Weise, M.Oc,E. Thesis.
Dennis Best or L.S. Slotta Available from originatot only
Ocean Engineering Program. .
Oregon State UniversityCorvallis, OR 97331 Telephone (503) 754631
UpwellingCSTLUPWL
Language = FORTRANHardware - CDC 6400/150K characters/2 tape units
Provides sigma-t and three velocity component profiles as a function of two space variables for
a steady - state] two-dimensional upwelling. Input. Independent variable and indeperident param-
eter sizes.
L.APietrafesa Available from originator only. .
Center for Marine and CoastAl StudiesNorth Carolina State UniversityRaleigh, NC 27607 Telephone (919) 787-6074
Mathematical Water Quality Model Language -.FORTRAN IV
for Estuaries Hardware - IBM 360/350k
Computationof water quality parameters of dissolved oxygen',-bio gical oxygen demand, etc.,
for the Neuse Estuary, North Carolina. 'Input: Upstream disqharge and water quality data. Out-
put! Water levels, velocities, and water quality parameters at downstream locations. Uses nu-
iierical solutidn of shallow-water systems matched with explicit solutions of the mass balance
1,4equation. Sea Grant RePort, yin preparation.
9Michael Amein
, Available from, originator only .
Dept. of Civil Enginee ing .
,..North 'Carolina State U ivprsity
Raleigh, NC 27607 Telephone (919) 737-2332
A
Computatfft, of Flow through LanguagS - FORTRAN IV
Misonboro.fnlet, North Carolina , tHaidwar - IBM 360/350K
Computation of discharges -and water levels at complextion of"ene-dimensional shallow water equations. Inp
on the land side of inlets., output: Velocity, disc
UNCrSG-7315. Also, .Yournal of Waterways and Harbor e
ruary 1971,, pp. 93-k10.5 ).
oastal inlets. Implicit numerical solu-t:. Tidalelevations at sea, water levelsrg,s, and watergtevels. Sea Grant ReportDiv., Proc. ASCE: Vol. /04 No. WW1, Feb' 4
r--*".
Michaei7AMeih Ava4able from originator
Dept. of Civil EngineeringNorth Carolina4StaCe UnivdrsityRaleigh, 4; 27607 '. , ,
0.
Circulation in Pamlico Sound"
Telephone (919) 737-2332
Language - FORTRANHardware - IBM 360/320K
0
Provides the water surface elevations, water velocity plots, and flows through inlets for-Pam-
lico and Albemarle Sounds, North Carolina: Input: *Wind fields, inflowsi ocean tides.
26
36
"'
4

Michael AmeinDepartment of Civil EngineeringNorth Carolina State UniversityRaleigh, NC 27607
Available from originator only
Telephone (919) 737-2332,r
Three-Dimensional Simulation Package Language - FORTRAN IV/COMPASSAUGUR Hardware - CDC 6400/SCOPE 3.4 Operating System
4
AUGUR is a general Ehree-dimensional simulation package designed to handle general spatialbookkeeping problems and basic input-output of data, thus leaving the main problem of modelingto the user. The spedifications are:
(,) to handle 1 to a maximum of 33;000 volumes;(2) to handle a one-, two-, or three-dimensional space in ady one of the following
structures:
4,
(a) 1 x 1 x 1 (e) NC x 1 x 1 where NC = maximum volumes'along therwelg-io(b) 1 x NR x 1 (f) NC. x NR x 1 east axis l
(c) 1 x NR x ND (g) NC x NR x ND NR maximum volumes along the south tonorth axis
(d) lxlmND (h) NCxlx ND ND maximum volumep along the lower toupper axis
(3) to determine the following information of each volume:
(a) corner coordinates(b) volume centroid(c) centroids of the
volume's faces
(d) projected areas onto XY, XZ, and YZ planes of the,.volume's faces
(e) the Volume measurement
(4) to a w the user to handle:
(a) 1 to 40 state variaBles in each volume(b) velocities at the centroid of each volume or (but not both) at the centroids
. of each face of the volume4 (c) boundary conditions for state variables and velocities
(5) to allow the user to initializekell state variables and velocities of each volume;(6) to allow the user to define the corner coordinates of each volume;(7) to set up the space in, aright-handed coordinate system;(8) to allow free field data input,(to a certain extent);(9) to use Adams-Bashforth predictor equation for the simulation with Euler's equation
as a starter with the option to replace these equations.;(10) to be able to save the simulated data on tape in order to continue the situlation
later on or to plot the data;(11) to provide the option of suppressing certain output.
4Due to the generality of the specifications, AUGUR requires much more computer core storagethin a program written for a specific model. In order to reduce the core requirement, AUGURhas been subdivided into semi-independent parts called overlays, thus allowing only currentlyneeded programs to occupy core while keeping the unneeded ones on disk until later. Furtherreduction of core is made possible by keeping in core only those data arrays of volumes whichare to be used immediately and storing the data arrays of volumes not currently in use on disk.University of Washington Ref. No. M74-88, NiF GX 33502, IDOE/CUEA Technical Report 7, "AUGUR,A Three-Dimensional Simulation Program for Non-Linear Analysis of Aquatic Ecosystems," by D.L.Morishima, P.B. Bass, and J.J. Walsh, November 1974.
Department yf Oceanography Copy on file at NODC (Program code on magneticUniversity. SS/Washington 'tape). Documentadon (above report) availableSeattle, WA 98195 i from NTIS, Order No. PB 245 566, $8.00 paper,
$2.25 fiche.
27
,/

°
Salinity Diairtbution in One-Dimensional
Estuary, ARAGORN
Language - FORTRANHardware -
A model is constructed for an estuary to predict the salinity distribution for a given freph-water inflow, with application to the upper Chesapeake Bay and the Susquehanna River. Basedon a salt continuity equation in which the seaward salt advection is balanced by turbulenkodif-fusion toward the head of the bay. In final form, it is a linear, second-order, and parabolicpartial differential equation with variable coefficients which are functions of both space andtime. Tech. Report 54, Ref. 69-7, by. William Boicourt, May 1969. "t
Chesapeake Bay InstituteThe Johns Hopkins UniversityBaltimore, MD 21218
Copy on file at NODC (above report)
Modeling an Ocean Pond Language - FORTRAN :Hardware - IBM 370-1455
Models hydrodynamic characteristics of coastal waters, using the Galerkin wei d-residual
method through which the finite element scheme can be implemented without a knowledge of theparticular Nariationalp.rinciple of the governing equation. Marine Technical Report.40, "Mod-eling An Ocean Pond: A Two-Dimensional, Finite Element Hydrodynamic Model of Nigigret Pond,Charlestown, Rhode Island", by Hsin-Pang Wang, University of Rhode Island, 1975.'
Department of Mechanical Engineer- Copy on file at NODC (Above report,'ing and Applied Mechanics includes listing)
University of Rhode IslandKingston,, RI 02881
Estuarine Chemistry Language - FORTRAN IV/WATFIV
MYACHEM Hardware - IBM 370
From raw hydrographic data and nutrient chemistry data absorbences, computes actual values ascompared with standards, along with instantaneous tide height of station. Estuarine low salin-ity procedures are applied. Output: 'Formatted concentrations of nitrite, nitrate, ammonia,urea, dissolved oxyg en, silicate, and phosphate. Author - Stephen A. Macko. I
B.J. cAlice Available from originator only
Ira C. D rling Ceriter (Marine_ Laboratory) ' '
University of Maine at OronoWalpole, ME 04573 Telephone (207) 563-3146
.4*
a '
Estuarine TidesTIDES
Computes instantaneous tide height, range,Stephen A. Macko.
4B.J. McAlice
Ira C. Darling Cepter (Marine LaUniversity of Maine at OronoWalpole, ME 04573
Language - WATFIV FORTRANHardwAre - IBM am
and tide character, given corrections. Author r
Available from originator onlyboratory)
Telephone (207) 563 -3146
Mathematical Model of Coastal Upwelling: Language - FORTRAN IVDrift, Slope, and Littoral Currents Hardware - IBM 360-40/23K bytes
OCEO1P07
N,Calculates and prints drift, slope, and littoral current tables, as well as their corresponding
*. I
28
33

flux tables - a total of 33 tables. Input: Orientation of e coast, latitude of the site,
_direction of the wind, velocity of the wind. Output: For d ift currents, the results are pre-
sented in en tables, Corresponding to each tenth of the HID ratio, where H is the depth of thesite and 1. is the depth of the friction layer (a function of latitude and wind velocity); ineach table the drift currents are shown at 20 levels of the local depth; at each level, valuesfor the following elements are given - velocity, angle with the wind, direction, angle with theslope, slope component of velocity, hnd component of velocity parallel to the coast. The driftfluxes ire presented in an eleventh table and calcu4ated at each tenth of the H/D ratio, givingvalues-fqs the following elements - rate of flow (e/sec), angle with the wind, angle with theslopeogYection, slope component of the rate of flow, and component of the rate of flow par- 41.
allel to the coast. Slope currents and fluxes and littoral currents and fluxes are presentedin tables similar to those of drift and fluxes, but without values for angle of cur-
rents and fluxes with the wind.
CF Emmanuel Gana de Almeida , Copy on file at NODC (listing,Diretoria de Hidrografih e Navegacao documentation in English andBCO Nacional de Dados Oceanograficos. Portuguese)Primeiro Distrito Naval - Ihla FiscalRio de Janeiro - GB-20.000, Brasil
,Beach and Nearshore Maps Language - FORTRAN IVHardware - IBM 1130/8K words
Topographics maps of the beach and nearshore area ate computed and plotted based o nine pro-
files from a baseline across the beach. Profiles are spaces at 100-foot interval along the
beach with survey points at five-foot intervals along each profile. Linear interpolation ismade parallel to the baseline between adjacent profiles. _Numbers and symbols are printed toform the maps. Profiles for a series of days are used tlprint maps of erosion and deposition,by subtracting elevations for each day from the elevations for the previous day. 0 Tech. Re
port No. 4, "Beach and Nearshore *namics in Eas,ternitake,Michigan", by Davis and Fox, 971. ,
-1
e William T. Fox - Available -Tom originator only
Williams College.
---
Department of Geology. ,Williamstown4-MA,.01267
a
folapjephone 013) 597-2221
Numerical Model, Dynamics and Kinematics Language - FORTRAN-.
of Partially Mixed Esquiries'
Hardware - -
A real-time numerical model is developed to describe the dynamics and kinematics.of partiallymixed estuaries. Thi.,governing equations are formally laterally averaged and realistic estua-erinerine bathymetty is cluded. The external inputs to Ehe model are salinity and tidal ampli-tude as a function of. time at the ocean boundary and the.freshWater discharge at the riverboundary. The model includes the continuity, salt, and momentum balance equations coupled byequations of state. 'The numerical technique eonserves volume, salt, and momentum in the ELS-sence of dissipative effects. Simulations show that using a constant vertical eddy Viscosityand diffusivity produce unrealistic salinity distributions, but have minor effects on the sur-face,amplitudes; results from the application of phe model, to the Potomac Estuary, using a sta-bility dependent eddy viscosity and diffusivity, yield distributions comparable to field obser-vations. Further numerical experimentation illustrates the response of the circulation tochanges in the boundary friction and the river discharge. Reference 75-9, Technical, Report 91,"A Numerical Investigation into the Dynamics of Estuarine Ci ulation," by Alan Fred Blumberg,October 1975..
Cheaspeake Bay Ins itUieThe Johns Hopkins niversityBaltimore, MD 212
Copy on file at NODC (above report) .
29
3J,

Vt
ENGINEERING
Deep Ocean Load Handling Systems Language - FORTRAN IVDOLLS Hardware,- CDC 6600
/-Provides a capability to evaluate any selected deep ocean load handling system on the basis ofcritical mission parameters; allows comparison of canditate systems, development of an optimumsystem, and sensitivity analyses. Input: Mission objectives, mission scenario, mission param-eters, analytical parameters. Output: Scenario with times and costs in individual step andcumulative form. "A Method for Evaluation and Selection of Deep 0Cean Load Handling Systems,"Vol. I, Final Report, Vol. II, User's Manual; supplementary Letter Repdrt.
L.W. HallangerCivil Engineering LaboratoNy _
Naval Construction Battalion CenterPort Hueneme, CA 93043ry r
Load Motion and Cable StresseCAB1
Determin the transiesuspended load duemethod of orthog cop_a set of ordinary differeInput: Cable length, caband drag coefficient on 1_lotted motion. Output:motion.
Copy on file at NODC (Deck).
Telephone (803) 982-5787
ar
Language,FORTRAN IVHardware - CDC 6600
,
and/or st ady-state load motion and.cable'atresses in a verticallyxcitation toper release from non-equilibriumposition. Uses the
cation in thelrlength" variable in order to reduce the equations totial equations. These are solved by a predictor-corrector method.e density, Ea, load radius, load density, fluid density, added massad (spheres, initial tension at load, frequency. and amplitude ofime history of cable tensions, velocities,aq4 time hiitory of load
511
H.S. Zwibel
Civil En neeri g LaboratoryNaval- Construct on Battalion CenterPort Hueneme, i43
Soil Test DataMAX '
Uses standard techniquef sample, axial load, or
and plire water pressurt.
difference, i, minor a
lff7J. Lee
or
2A
Copy on fil'e at NO Deck)
Telephone (805) 982-4625a
4,
Language - FORTRAN IVHardware - CDC 6600/100K characters
reduction,of triaxial test data. Inpute: Axial displacemen$nal are*, original height, onsolidation,Otessuret volume change,
t: Axial strain, pore water pressure change., rincipalajo incipal--effective stress, principal stress-ratio,
Ciy41,Bngineering Laboratory .
NavAI Construction Battalion CenterPert Hueneme, CA 93043,
-..
N
Copy on file at NODC(Deck)
Tel phone (805) 982-5624'
stress
P, Q.,
,i
Dynamic Stress Response of Languag9 - FORTRAN IVLifting Lines, CABANA Hardware -, CDC 660Q/2-tape Units
Predicts dynamic responses Of a lift line/payload system with, long line length. Response op-'
erators are calculated from explicit equations; the outpyi spectrum is used it a.statidticalcalculation to determine the probability distributions. Inputi Cable physical propeWes andelasticity, payload physical,descriptions, surface excitation in tilexform of displacement spec7
..;Arum or acceleration spectrum. Output. ,Dynamic tension or payload motion operators as a func-tion of frequency., probability distribution of dynamic tension and motion, and design peak
30
4Q 4
S.
a
tension. CEL,Technical Report R-703, "Dynamic Stress Response of Lifting Lines for Oceanic Op-
erations," byC.L. Liu, Ndv./ 11970. 1.
.'-'" Francis C. Liu Copy on file at NODC (Deck)
Civil Engineering Laboratory '
Naval CoAStruction Battalion CenterPort Hueneme, CA 93043 Telephone (805) 982-4613 -----.....,--
Dynamic Response of Cable System Language - FORTRAN IVHardware - CDC 6600
IP
Determines dynamic responses of a two-dimensional cable system in the ocean with in-line
masses, based on lumped mass approximation; equations of motion were solved numerically by
predictor-corrector method; cablt segment takes tension only. Input:. Cable static position,
cable physical and elastic properties, in-line mass characteristics, current profile, surface
excitation in sinusoidal form. Output: Tenslon and mass point location as functpns'Of time.
CEL Tech. Note N-1288, "Snap Loads in Lifting and Mooring Cable SysteMs Induced by Surface
Wave Conditions," by F.C. Liu, Sept. 1973.
SNAPLG
Francis C. Liu Copy on file at NODC (Deck)
Civil Engineering Laboratory xNaval Construction Battalion CenterPort Hueneme, CA 93043 Telephone (805) 982-4613
4
Changes in Electromechanical Cable Language - FORTRAN IV
RAMSC Hardware - CDC 6660
Determines the internal and external changes of a multi-strand electromechanical cable under'
end constraints and loadings. Based on helical wire model, equations are solved numerically\
by progressive iteration. Input: Cable construction details, wire physical properties, ex-1
ternal loadings and constraints. Output:, Cable end torque or torsion, elongation, internal
changes. Note: RAMSC and RADAC have been combined td form program TAWAC.
Francis C. LiuCivil EngineeringaahoratoryNaval Construction Battalion CenterPort Hueneme, CA 93043 Telephone (805) 982-4613
_ 1a
Copy on file at NODC (Deck)
End Responses in Electiomechanical Cable , Lan'g'uage - FORTRAN
RADAC Hardware - CDG#400
Predicts the elongation, end rotation, or en4 moment of a double-armored electromechanical
cable., Based on helical wire Model, the problem is solved numerically by progressive itera-
tion. Input: Cable physical and elastic properties, end loadings and/or conditions, detailed
description of cable construction. Output: End responses in the form of end moment or end
torsions, cable elongation, cable geometric changes, wire tensions. Note; RAMSC and RADAC
have been combined to form programOTAWAC.
FrancOlt. Liu Copy on file at NODC (Deck)
Civil Engineering LaboratoryNavarInnstruction Battalion CenterPoUueneme, CA 93043 Telephone (805) 982-4613
Unmanned Free-Swimming Submersible Language - BASIC
UFSS Plotting Program Hardware - HP 9830A/4K words core/24K woEdsaCidtional/Plotter plus ROM
Calculates, radius of mission possible for theoretical UFSS (Unmanned Free-Swimming Submersible)
when internal energy usage (hotel load) is varied. Uses simple iteratiol to select relative
.31
41
',pow

speed for Most efficient energy usage per actual distance covered. Input: Minimum, maximum,
and increment on external volume and hotel load of UFSS; responses (yes or no) for speed ma-ix; response (yes or no).for another run with an ocean current one'half knot greater than
evious plot. Output: Speed matrix (if desired) up and downstream, matrix of radii coveringplume and Hotel load variations; graphic output of radii matrix as a function of external vol-
ume and hotel load as a parameter. Documentation: OTD-OI-74-02-01.
Edward J. Finn Available from originator only
Ocean Instrumentation BranchNaval Research Laboratory, Code 8422Washington, DC 20375 Telephone (202) 767-2112
Unmanned Free-Swimming Submersible Language - BASIC
UFSS Variable Hotel Load Hardware - HP 9830A/2K words
Calculates ranges possible with theoretical UFSS when internal energy usage (hotel load) isvaried, using iteration to determine speed for most efficient energy,usage per actual distance
covered. Input: Minimum, maximum and increment on external volume of UFSS and on hotel loadin watts; response to question on desire to have most efficient speeds' printed. Output: Ma-
trix of ranges covering volume and hotel load,variations; speed matrix (if desired); terminalplot of data in the matrix. Documentation: OTD-0I-74-01-01.
Edward J. FinnOcean Instrumentation Branch
. Naval Research Laboratory, Code 8422Washington, DC .20375 Telephone (202) 767-2112
Available from originator only
Unmanned Free-Srlimming Submersible
Nominal UFSS PrOgram
' Language - BASICHardware , HP 9830A/2K words
Calculates distance covered by theoretical udbanned free-swimming submersible vehicle withspecific energy package, using iteration to determine speed,for most, efficient energy usage
per actual distance covered. Output: Data about model; most efficient speed with ocean cur-rent and range (one-way) as a function of external volume'-of the UFSS.
.1111
A-
Edward J. Finn Available from originator.onlyOcean Instrumentation BranchNaval Research Laboratory,Code 8422'Washington, DC 20375 Telephone (202) 767-2112
Steady-State TrapezoidalArray Configurations
Language - FORTRAN VHardware - UNIVAC 1108
Steady-state configurations under forces due to currents are determined. Finite element (lump
mass) three-dimensional statics equations are solved using Skop's method of imaginary reac-
tions. NUSC/NL Tech. Memo. SA2302-0170-72, "On the Parameters Governing Steady State Distor-tion of a Bottom Moored, Subsurface Buoyed, Linear Cable Array in Various Current Fields," by
J.D. Wilcox, Sept. 1972. \
J.D. Wilcox Available from originator onlyNaval Underwater Systems CenterNew London, CT ,06320 Telephone (203) 441-0771
Anchor Last, Buoy System Language - FORTRAN V
Development Dynamics Hardware - UNIVAC 1108-
Equations of motion for a surface or subsurface buoy system initially stretched out are solved '
-4P
32

U ,
1
as the anchor is dropped. The equations of motion for buoy, cable (modeled as a number oT
1114 masses) and anchor are integrated in the time domain, using a fourth order Runge-Kutta-
algorithm. Velocity-squared drag and hydrodyriamic masses cp&entrated at each4lump. Input:
Physical parameters of stems to be modeled. Output: x-z positions, tensions and angles,
sequential plots. NUSC/NL Technical Memorandum TA12-134-71, March 1971.
Gary T. GriffinNaval Underwater Systems CenterNew London, CT 06320
Cable-Towed Buoy Configurationsin a Turn
Available' from-originator only
Telephone (203) 442 -0771
Language - FORTRAN VHardware - UNIVAC 1108
Steady-state configurations under forces due to a ship on a turn are determined. The three-
dimensional steady state cable equations are integrated with a fourth order Runge-Kutta al-
gorithm from the towed body up to the ship. Input: Physical parameters of items` to be modeled.
Output: Buoy attitude x-y-z positions, ship speed, buoy speed, tensions and angles. Three-
_dimensional plots available. Project CORMORAN Memo 0132 (4.10.3), "Steady State Towline Con-
figurations in a Turn," Sept. 1973.
Gary T. GriffinNaval Underwater, Systems Center
New London, CT 0320
Available from originator only
Telephone (203) 442-0771
Free-Floating Spar- Language.- FORTRAN V
Array Dynamics Hardware - UNIVAC 1108
1
The equations of motion for spar buoy, cable (lump mass model), and an attended three-leg
structure are solved in the time domain using a, fourth order Runge-Kutta algorithm.Auxiliary
computation of spar buoy bending in the waves is included. Input: Physidal parameters of the
items to be modeled. Output: Spar buoy x-z motions and tilt, hydrophone motions on the ends
of the three-leg structure. NUSC/NL Technical Memorandum No. TA12-257-71, Noy. 1971.
Gary T. GriffinNaval Underwater Systems CenterNew London, q 06320
Available from originator only
Telephone (203) 442-0771
Free-Floating Spar Language -0 FORTRAN V
Buoy Dynamics Hardwiare - UNIVAC 1108
The equations of motion for the spar buoy are solved in the time domain using a fgurth order
Runge-Kutta algorithm. Auxiliary computations of the spar buoy bending due to waves are in-
cluded. NUSC Tech. Memo. No. TA12-257-71, "The Spar Buoy System," by G.T. Griffin, Nov. 1972.
NUSC Tech. Memo. No. 2212-90-67, DA Guide for.the Design of Spar Buoy Systems," by K.T. Paeton,
July 1967.
Gary T. GriffinNaval Underwater Systems Center
New London, CT 06320
Ship Suspended Array Dynamics
Available from originator only
Telephone (203) 442-0771
Language FORTRAN VHardware - UNIVAC 1108
Equations of motion for a vertically suspended cable array,sre,solved in the time domain as the
ship drifts and responds to waves. The cable is broken,4 into q elastically connected lump
masses, each having two degrees of freedom.1" The 2 x.n equations of motion are solved simulta
neously in the time domain using a fourth order Runge-Kutta algorithm. Velocity-squared
4333

viscous forces andoft
masses are concentrated at each lump. NUSC Tech. Memo. No. 2212-.202-68, "A Study of the Stability of the Five-Hydrophone,.Ship-Suspended General Dyndmics Ar-ray,".. by G.T. Griffin, Oct. 1968.
Gary T. GriffinNaval Underwater Systems CenterNew London, CT 06320
Available from originator only
Telephone (203) 442-0771 s'
Boomerang Corer Descent /Ascent Language -Trajectories Hardware -
Bcrom4rIsk corer trajectories due to currents are calculated. The three-dimensional body equa-tions are integrated in the time domain using aiskorth order RungeAutta algorithm.
Gary T. GriffinNaval Underwater Systems CenterNew London, CT 06320
A
Buoy-Ship Dynamics
Available from originator only
Telephone (203) 442-0771
Language - FORTRAN VHardware - UNIVAC 1108
The equations of motion for the buoy moving in a plane (3-D Heave, Surge and Pitch) and con-strained by the A-frame and vangs are solved in the time domain using a fourth order Runge-Kutta.algorithm. Ship response to the quasi-random sea state is computed using Lewis's dimen-sionless RAO's. NUSC letter ser. TA12:83, "Results of First Order Study of Ship-to-Buoy MooringStudy:"
Kirk T. Patton or Gary T. Griffin Available from originator onlyNaval Un4erwater Systems CenterNew-1.°nd n, CT 06320 .Telephone (203) 442-0771
Buoy System Dynamics Language - FORTRAN VHardware - UNIVAC 1108
Six degree-of-freedom -equations of motion for the buoy are solved in the time domain using afourth order Runge-Kutta integration algorithm. These equations are coupled with the set ofpartial differential equations for cable dynamics through tensions and velocities at the buoy.The equations of motion for the cable are solved in the space-time domain using a methodcharacteristics approach, i.e., a modification of Hartree's method. ,Output motions and en-sions for the buoy and along the cable are plotted as power spectra using FFT methods. Theprogram has been used for the design of oceanographic and acoustic buoy systems and for evalua-tion of NOAA Data Buoy design.
Kirk T. Patton and Gary T. Griffin Available from originator onlyNaval Underwater Systems CenterNew 'London CT 06320 Telephone (203) 442 -0771t
, tit
FiXed Thin Line Array Dynamics Language - FORTRAN V'4ardware - UNIVAC 1108
0Equations of motion for the cable array are solved in the time domain for excitation by cur-rents. The array is broken up into n elastically connected lump masses, each having three de-grees of freedom. The 3 x n equations of motion are solved simultaneously, using a fourth or-der Runge-Kutta algorithm. Velocity-squared viscous-forces and hydrodynamic masses are con-centrated at each lump.
4
34 44

Kirk T. Patton'or Gary T. GriffinNaval Underwater Systems CenterNew London, CT 06320
Fixed Thin Line ArraySteady State Configurations '
Available from originator only
Telephone <203) 442-0771
Language - FORTRANN-- Hardware - UNIVAC 1108
Steady-state configurations under forces due to currents are-determined. The three dimensionAl
steady-state cable equationi are integrated using a fourth orderRunge-Kutta algorithm. One'
fiftieth the array length is typically used as the integration' step size.
Kirk T. Patton or Gary T. Griffin Available from originatok only
Naval Underwater Systems CenterNew London, CT 06320 Telephone (203) 442-0771
Marine Corer Dynamics Language- FORTRAN VHardware - UNIVAC 1108
_ r
The equations of motion for a corer Pree-falling through the water column (or, for the case of
a cable-lowered corer, free-falling through its trip height) are integrated in the time domain,
using a fourth order Runge -Kutta algorithm. Upon impact with the bottom, frictional forces
due to the sediment are introduced and the corer comes to rest. Output: Terminal velocity,
velocity at impact, penetration of corer and compaction of recovered sample. "An Analysis of
Marine Corex Dynamics," by K.T4Patton and G.T. Griffin, Marine Technology Society Journal,
Nov.-Dec. 1969.-
Kilk T. Patton and Gary T. Griffin Available fromfriginator,only
Naval.Underwater Systems Center' '..
New London, CT 06320 Telephone (203) 442-0771
Steady -State Buoy System Configurations.
Language - FORTRAN VHardware - UNIVAC 1108
Steady-state configurations under forces due to winds and currents are computed. The three-
dimensional cable equations are integrated with a fourth order Runge -Kutta algorithm from the
buoy down to the anchor. AA iterative method is used to modify the buoy's displacement until
the vertical cable projection matches the water depth; Inom the cable length is used as the
integration step size. Instrument packages mounted in or on the line can be accounted for
also. Output: Buoy drift and cable x-y-z positions, tensions, two angles and stretch as func-
tions of cable length. _Three-dimensional plots also available. NUSC Tech. Memo. 2212-212-68,
"On the Equilibrium Configuration of Moored Surface Buoys in Currents," by K.T. Patton, Oct.
196 USL Tech. Memo. 2212-116-69, "A Study of Three NAFIBuoy Moorings," by O.T. Griffin,
Jun 1969. NUSC Tech. Memo. 2212-170-69, "An Analysii of Optimizing NAFI Buoy Shallow Water
Moorings," by G. Griffin and p. Bernard, Sept. 1969.
Kirk T. Patton or Gary T. Griffin, Available from originator only
Naval Underwater Systems Center
New London, CT 06320 Telephone (203) 442-0771
Steady-State'Subsurface Buoy System Language - FORTRAN V
Configurations Hardware - UNIVAC 1108
Steady-state configuratiops under forces due to.chrrents are computed. The three-dimensional
cable equations are integrated with a fourth order Runge-Kutta algorithm from the buoy down
to the anchor; 1/1000th the line length is typically used as the integration step size. Out-
put: x-y-z cable positions, tensions, stretch and angles (all iri dimensionless form) as a
function of dimensionless cable length. Three-dimensional plots also available. NUSC Report
4tJ 35

4379, "Nondimensional Steady State Cable Configurations," by G.T. Griffin, Aug. 1972; NUSCTech. Memo. TA12-50-73, "Remote Terminal Usage to Compute Subsujface Single Leg Array Configu-rations" by G.T. Griffin, Nov. 1973.
Kirk T. Patton.or Gary T. Griffin Available from originator onlyNaval Underwater Systems CenterNew London, CT 06320 Telephone (203) 442-0771
Towed Array Dynamics Language - FORTRAN VHardware - UNIVAC 1108
Equations of motion for the towline, towed art ,and drogue axe solved in the time domain forresponse to ship motions, etc. The equations are integrated using a fourth order Runge-Kuttaalgorithm. The program first computes the steady-state configuration and tensions which serveas initial conditions for the dynamics section. Also, using the steady-state data, theStrouhal excitation frequencies and amplitudes are computed along the towline.
. N -
Kirk T. Patton or Gary T. Griffin Available e4from originator onlyNaval Underwater Systems CenterNew London, CT 06320 Telephone (203) 442-0771
Towed System Configurations Language - FORTRAN VHardware - UNIVAC 1108
Steady-state configurations for towed systems are determined. Effects of current and shipturns can be included. the three-dimensional cable equations are integrated with a fourth .
order Runge-Kutta algorithm from the towed body up to the ship. For steady ship turns, thecentrifugal.force.is also integrated up the cable. 1/100th to 1/1000th the cable length isused as the integral step size. Output: x-y-z positions, tensions, stretch,and angles asfunctions of cable length. Can be dimensionless. Three-dimensional plots also available.NUSL Tech. Memo. 933-0175-64, "Towline Configurations and Forces" by K.T. Patton, Oct. 1964;'NUSC/N1 Report No. 4379, "Nondimensional Steady State Cable Configurations," by G.T. Griffin,Aug. 1974; Project CORMORAN Memo. D112/4.10.3, "Two- dimensional Steady-State Towed System ton-
.
figuations," by G.T. Griffin, March 1973.
Kirk T. Patton or Gary T. Griffin Available from originator onlyNaval Underwat Systems Center .
New London, CT Telephone (203) 442-0771
Towed, System Dynamics Language - FORTRAN VHardware - UNIVAC 1108
Equations of motion for the towed body and for the cable (when treated as a lump mass model ofn lumps) are solved in the time domain using a fourth order Rune-Kutta algorithm. The towedbody is allowed six degrees of freedom,and each cable element has three. "Dynamics of a Cable-Towed Body System," by G.T. Griffin, MS Thesis, University of Rhode Island, Kingston, Jan.1974.
Kirk T. Patton or Gary T. GriffinNaval Underwater Systems CenterNew London, CT 06320
Available from originator only
Telephone (203) 442-0771
TrapezoidaArray Deployment Dynamics Language - FORTRAN VHardware - UNIVAC 1108
ELions of motion for a trapezoidal array are solved in the time domain as the second anchor
is lowered and the ship is underway. The two subsurface buoys and the four cables are broken
4A
36
46
-...1..-
up into six elastically connected lump masses, each having three degrees of freedom. The <\eighteen equations of motion are solved aimultaneously in, the time domain, using a fourth order
Runge-Kutta algorithm. 1/elocity-squared viscous forces and hydrodynamic masses are concen-
.1 trated at each lump. NUSC Report No. 4141, "DynaMics of Trapezoidal Cable Arrays," by G.T.
Griffin and K.T. Patton, March 1972.
Kirk T. Pittoc:;GLy T. Griffin. ,Available from originator only
Naval Underwater Systems CenterNew London, CT 06320 Telephone (203) 442-0771
Trapezoidal Array Dynamics Language - FORTRAN VHardware - UNIVAC 1108
Equations of motion for a subsurface trapezoidal cable array are solved in the time ,domain for
response to currents. The two subsurface buoys and the three cables, are broken up into six
elastically connected lump masses, each having three degrees of freedom. The eighteen equa-
tions of motion are solved simultaneously using a fourth order Runge-Kutta algorithm. Velocity -
squared viscous forces and hydrodynamic masses are concentrated at each lump. NUSC Report No.
4141, "Dynamics of Trapezoidal Cable. rrays," by G.T. Griffin and K.T. Patton, March 1972.
Kirk T. Patton or Gary T: GriffinNaval Underwater Systems CenterNew London, CT 06320 ,
Available from originator only
Telephone (203) 442-0771
Steady-State Cable Laying Language - FORTRAN IVHardware -
The three-diminsional steady-state cable equations are integrated using an Euler method. Ship
speed and cable payout rate constant. Output: x-y-z positions of the cable and tensions.
"Final Report to NUSL- Analysis of Cable Laying," by J. Schram, 1969.
R,. Pieice 'Available from originator only
Naval Underwater Systems CenterNew London, CT 06320 e Telephone (203) 442-0771
Towed Array Configurations.
Language - FORTRAN V,Hardware - UNIVAC 1108
Steady-state towed array configurations are computed. The two-dimensional cable equations are
integrated with a fourth order Runge-Kutta algorithm from the drogue up to the ship; 1/1000th
the total cable length is used as the integrated step size. Output: x -z positions, tensions,
stretch, and angle as functions of cable length. Plot routine available.
S. Rupinski'Naval Underwater Systems CenterNew London, CT 06320
Cable Configuration
Available from originator only
Telephone (203) 442-0771
Language - FORTRAN IVHardware - IBM 1800
Computes the equilibrium configuration and tensions of a cable towing a submerged body for
faired, unfaired, and discontinuous (lower part faired) cables. The output on the line printer
gives the values of the input data followed by'various calculated values. The solution is
found for the "heavy general cable" law of cable loadings as deperibed by M.C. Eames (1968).
Execution time: About 30 seconds for each case. NIO Program No 168. Author - Catherine
Clayson.
.11(
National Institute of Oceanography Copy on file at NODC (listing, documentation)
Wormley, Godalming, Surrey, England
4
37
A

GEOLOGY AND GEOPHYSICS
Convection in Variable Viscosity Fluid Language - FORTRAN' IVCONVEC Hardware - CDC 6600/140K bytes/Disc/
Tektronix graphics terminal
Computes streamlines, temperatures, and shear heating in a highly viscous fluid of variable vis-cosity (Earth's upper mantle), relief gravity, and hSatflow. "ADI Solution of Free Convectionin i Variable Viscosity Fluid," by M.H. Houston, Jr.,and J.-Cl. De Bremaecker, Jour. Comp.Phys., Vol. 16, No. 3, 1974.
J.-Cl. De Bremaecker Copy on file at NODCRice UniveitityP.O. Box 1892Houston, TX 77001 Telephone (713) 528-4141
Gr tational Attr tion, Two Dimensions/ Language - FORTRAN IV-HBodies, TALWANI 2 D GRAVITY, W9206 Hardware - IBM 360-65
Calculltes the vertical componeht of gravitational attraction of two-dimensional bodies ofarbitrary shape by approximating them to many-sided polygons. The technique is from Talwani,Worzel, and Landisman in J.G.R., Vol. 64(1), 1959. Output: Gravity values are printed in ta-bles; the calculated profile and the observed profile (if one exists) are plotted on the lineprinter in either a page size plot or an extended plot with the x-axis running down the page.Contains option of units in miles, kilofeet, or kilometers.
Computer Center DivisionU.S. Geological SurveyNational CenterReston, VA 22092
'X-Ray Diffraction\Analysis
Copy on file at NOI C (listing, documentation)
Telephone (703) 860-7106
Language - FORTRAN IVHardware - XDS Sigma 7/20K 32 bit words/RAD
Provides mineralogic analysis of marine sediments from X-ray diffraction data. Input: Tapecontaining data generated by X-ray difftactometer.-putput: List of "d" spacings, 20 angles,intensities and peak heights of diffraction maxima, :list of minerals and estimaced 43mounts,insamples analyzed. /,
John C. HathawayOffice of Marine GeologyU.S. Geological SurveyWoods Hole, MA 02543
Sediment Grain Size Analysis
Available 'from originator only
Telephone (617)5188700
Language - FORTRAN IVHardware - IBM 1130
Calculates statistical parameters for sediment grain size analysis. Moment measures routine(Sheppard's correction applied) from'Schlse and Webster (1965); linear interpolation for Folkand Inman Graphic Measures. Input: Phi size, cumulatpe frequency percent couplets. Output:Moment measure of mean, standard deviation, skewness, Aprtosis, Folk.Graphic Measures, InmanGraphic Measures, mode and median values, $istogram plots.
Program maintained by:Computer Center DivisionU.S. Geological SurveyFederal CenterDenver, CO 80225
Gerald L. Shideler ,
U.S. Geological SurveyP.O. Box 6732CorpumChristi, TX 78411Telephone (512) 888 -3241
A A
38
4a .
Magnetic AndMaliesMAG2D
4
Language - FORTRAN IVHardware - XDS Sigma 7/32K 32 bit words/
Plotter
Computes theoretical magnetic anomalies fortwo-dimensionarbodies magnetized in any specified
direction. Vertical, horizontal, and total field anomalies are computed at a series of obser-
vation points equally spaced along a profile. A graphic display of the anomaly and the bodies
may be outpdt to the CalComp or Versatec Plotter. A line printer plot of the anomaly is made.
Modification of program by W.B. Joyner, USGS, Silver Spring, MD. Requires Woods Hole Oceano-
graphic Institution subroutined, MOVE, AXIS, SYMBOL, NUMBER and PLOTDFER.
Sews M. RobbU.S. Geological SurveyOflice'of Marine GeologyWooas'Hole, 111.02543
Copy (main program) on file at NODC
(listing, documentation)
TeIe4one (617) 548-8700
Geophysical Data Reduction and Language - 0S3 FORTRAN IV/COMPASS
-Plotting Programs Hardware - CDC 3300
A system of programs to process and plot marine gravity, magnetic, and bathymetric data. The
programs check for data errors, merge geophysical data with navigation, and plot the processed
data as profiles or on computer-generated Mercator projection charts. Tech. Report. No. 180,
by M. Gemperle and K. Keeling, May 1970.
Geophysics GroupSchool of OceanographyOregon State UniversityCorvallis, OR 9)331
Available from originator only
Processing and Display of Marine Language - 0S3 FORTRAN IV/COMPASS
Geophysical Data Hardware - CDC 3300
A system of programs to process and plot marine gravity, magnetic, and bathymetric' data using
improved navigation techniques-and standard datalforthats. The navigation programs use EM Log
and Dopiler Speed Log data and gyro headings combined with Magnavox 706 satellite navigator
fixes to determine data point positions and Eotvos corrections. All outputs from processing
programs and inputs to plotting programs are in standard NGSDC format for marine geophysical
data. Tech.Report._by M. Gemperle, G. Connard, and K. Keeling (in press, 1975).
Geophysics Group.School of OceanographyOregon State UniversityCorvallis, OR 97331
Availtble from originator only
"T.
Marine Seismic Data Reduction Language - 0S3 FORTRAN IV
and AnalysisHardware - CDC 3300
A series of programs to reduce, display,, and analyze marine seismic &its. These data include
reversed and single- ended' seismic refraction,wide-angle reflection, and marine micro-earth-
quakes. 'Supplementary programs compute seismic wave arrival times and distances using theoret-
ical earth models consisting of plane dipping layers. Tech. Report by S.H. Johnson et al (in
press, 1975).
Geophysics GroupSchool of OceanographyOregon State UniversityCorvallis, OR 97331
446
A Library of Geophysics Subroutines
GLIB
4
Available from originator only
Language - 0S3 FORTRAN IV/COMPASS
, Hardware - CDC 3300
39
43(
4

The library consists of various subioutines commonly used in geophysical data reduct n andplotting and not available in the 0S3 FORTRAN library. The subroutines fall into five generalcategories: (1) Plotting - geneFal purposd plotter subroutines, (2) Time and data conversion,(3) Arithmetic functions not contained in the 0S3 FORTRAN library, (4) File control programs
- peculiar to'the 0S3 operating system, (5) Miscellaneous subroutints. Iech. Report by K.Keeling, N. Gemperle and G. connard (in press, 1975).
Geophysics` Group fie - Available from originator onlySchool of OceanographyOregon State UniversityCorvallis, OR 97331
' AP
Reduction, Display,and Storage of Navigation, Language - FORTRAN IV (most of the programs)Gravity, MagnetiC andaepth Data . Hardware - IBM 1130/Peripherals described below
v .:Processes data recorded by a data logger, prepares profiles and.maps, and provides reduced datain a form suitaie for dale banking and interpretatipn. The first stage of the processing isto de-multiplex the data to s crate disk files, and at the same time automatically edit wherepossible and flag errors that oc . The second stage_is to filter data affected by ship mo-tion, and the third stage is to opti ize the navigation by merging dead-reckoning, hyperbolicor satellite data, and from this calculate depths, and gravity and magnetic anomalies. Graphi-cal presentation of the data is in the form of profiles and maps. The maps include the ship'strack and posted geophysical values or, profiles along the ship's track. The finally reduceddata may be stored on magnetic tape in_any of the International Geophysical Data Exchange For-mats. With this system it is possible to reduce data and produce maps and final reports withinthree weeks of the end of the survey. The complete system can be used at sea with one engineerand one operator/programer, or the data logger alone may be used at sea and then only an engi-neer would be required.
/
The IBM 1130 has a central processing unit with 8K 16-bit words of core storage, an integraldisk drive, and a console typewriter. Peripherals include two extra IBM disk drives, a DataDisc fixed-head disk drive, Tektronix Model!4012 visual display unit with'a4ektronix Model4610-1 herd copy unit, a 76 cm CalComp drum .plotter, Facit punch tape'inputinput)utput, and tWORDL Series 10500 magnetic tape decks. A.Data Dynamics 390 teletypewriter is used for off -linepunch tape preparation and, when necessary, as a remote terminal via a Modem linked in'paral-lel with the visual display unit.
Equipment that has been succesaftilly interfaced with the Decca Data Logger ihcluddia Decca MainChain Mk 21 Receiver, Decca Hifix% Sperry Gyrocompass Mk 227, Microtschnica Gyrocompass, LaCosteand Romberg Shipborne Gravity Meter, Askania Gss2 andpGss3 Gravity Meters, Anschutz yro- Stabil-ized Platform, Barringer Proton Magnetometer, Edo-Western Precision Depth Recorder 033C-26)linked to an Edo-Western Digitrack (261C), Two-Component Magnetic Log,(Walker Electric Log, anda Marquart Doppler Sonar 2015A. *
"CompUhr System for Reduction, Display and Storage of Navigation, Gravity, Magnetic and DepthData Recorded in 'Continental Shelf or Deep-Ocean Areas," a series of twelve software manuals,Aroduced by the Department of ,Geodesy and Geophysics, Cambridge University, Oct. 1974, under'contract to the National Environment Research Council.
,/ Compu r Ut.1 . Copy on file at NODC (Above manuals)Insti to of 0 eanographic SciencesResea eel Base, No. 1 DockBarry, south Glamorgan, Wales, UK '
ComputaAoh and Plotting of MagneticAnomalies did
'
ok anomaly profiles for total field, horizontal and vertical components, first andsecond vertical derivatives, and first and second horizontal derivatives over a uniformly mag-netized twoLdimesional polygon of irregular cross-section. Output may be printed or plotted."Potential Applications of Magnetic Giadients to Marine Geophysics," by William E. Byrd, Jr.,June 1983; program modified and expanded from Talwani and Heirtzler (1964).
A 4 '
Language - FORTRAN II`Hardware - IBM 7094/CalComp plotter-
Computes
40
50
r
A 4

Department of Geology and
'f GeophysicsMassachusetts Institute of
- TechnologyCambridge, MA 02139
Geomagnetic yieldMFIELD
Available from NTIS, Order No. AD 655 892/LK,
$5.75 paper, $2.25 microfiche.
Language - FORTRAN IVHardware - XDS Sigma 7/372 32 bit woi s
CalCulates regional total geomagnetic field at a specified latitude and longitude a d time.
Subroutine is initialized with the harmonic coefficients from any specified input device via a
separate subroutine. Shared variables are placed in COMMON. (See I. A. G. A. Commission 21
Working Group 4, 1969. International Geomagnetic Reference Field 1965. J. Geophys. Res., 74,
4407-4404) *Subroutine COEFF requires 271 words.
Robert C. Groman Available from originator only
Woods Hole Oceanographic InstitutionWoods Hole, MA 02543 'Telephone (617) 548-1400, ext. 469
Marine Geophysical Data Reduction Language - FORTRAN IVHardware - IBM 360-65
Corrects soundings for sound velocity variations (if desired), computes residual magnetic anom-
alies from magnetic total-intensity values, and reduces marine gravity values to free-air anom-
alies corrected for Eotvos effect and drift. Each geophysical data point is associated with a
date Same group, a geographic position, and an approximate mileage along track. The output is
in the form of separate magnetic tapes and listings each for bathymetric,14metic, and gravity
data, in a format suitable for direct input to display or analytical programs. NOAA Technical
Memorandum gra AMOL-11, "A Computer Program for Reducing Marine Bathymetric, Magnetic, and Grave-
ity Data," by Paul J. Grim, Atlantic Oceanographic and Meteorological Laboratories, Miami, Flor-
ida, Januaryr1971.
Paul J. Grim, Code D621 Copy otf file at .NODC (Above report, with'
Marine Geology and Geophysics Branch listing)
National Geophysical and Solar-Terrestrial Data Center, NOAA/EDS
Boulder, CO 80302
Plots Profiles of Bathymetry and Magnetic Language - FORTRAN IV
or Gravity Anomalies Hardware - IBM 360-65/CalComp 563 Plotter--.
i
tkr duces bathymetric and magnetic anomaly profiles in a form suitable for publications with
1 tie or no additional drafting. The horizontal scale can be the distance along the trackline
i inautical miles or kilometers, or degrees of latitude or longitude. The input consists of
digitized bathymetric and magnetic anomaly data on separate magnetic tapes. The horizontal a
vertical axe6 of the profiles are determined automatically with reference to the maximum and
minimum values of the input data. Control cards'contain variables that further determine how
the data. -are to be plotted. The program can also be used for plotting gravity anomaly profiles
by suhstiVaang the gravity anomaly in milligals for the magnetic anomaly in gammas on the input
tape: One of the control card variables causes the vertical axis to be labeled either gammas
or milligals. Magnetics and tathymetry can be plotted together (the bathymetry is always below
the magnetics) or either can be plotted separately. In addition, the same data can be replotted
in a different manner (for example, with a different, vertical exaggeration) if desired. ESSA
- technical Memorandum ERLTM-AOML 8, "Computer Program for Automatic Plotting of Bathymetric and
Magnetic Anomaly Profiles," by Paul J. Grim, Atlantic Oceanographic and Meteorological Labora-
tories, Miami, Florida, July 1970.
\--- Paul 4:Wiiii4ode D621 , Copy on file at NODC (Above report, with
Marine Geology and Geophysics Branch listing)... Natlonal Geophysical and Solar-
Teltdatrial Data Center, NOAA/EDS
Boulder, CO 80302
,s4
41
51

N
id
Lilts Raw DatagLIST
Language -Hardware - UNIVAC 1108
Lists a single file of1MG&G, standard.raw.data tape, according to a standard format. Requiressubroutine DLIST (HRMIN). fmthor - R.K. Lattimore.
Director, Marine Geology andGeophysics
o Atlantic Oceanographic and
Meteorological'Laboratories/NOAA15 Ritkenbacker Causewaydistil, FL 33149 t
Available from originator only
Telephone (305) 361-3361
ewo
Plots Trackline Language -QCKDRAW Hardware - UNIVAC 1108
Using as input the standard MG&G navigation cards, plots a trackline with or without tick marksdelineating time intervals. The user 10 given external control of the map size, latitude andlongitude map boundaries, the number of'files to be mapped, the time marks, and annotation.The trackline is plotted up to the boundary limitd specified, allowing the user to plot only asector of the navigation deck loaded. Because the size of the actual plotting sheet is 28Inches; internal boundaries may also be required. In this case, bookkeeping devices within theprogram will assign trackline to the appropriate submaps and, plot each In sequence. Author -J.W. Lavglle.
Director, Marine Geology andGeophysics
Atlantic Oceanographic andMeteorological Laboratories/NOAA
15 Rickenbacker CausewayMiami, FL 33149
Plots Contour-Crossing IntervalsDOUBLX
Available from originator only
Telephonk (305) 361-3361
Language -Hgrdware - UNIVAC lf08
Calculates contour-crossing intervals, determine highs and lows along a trackline, and plotsboth, using as input a USA Standard format data tape. Annotation of the extreme is also pro-vided. The user is given control of thethap size, the latitude and longitude boundaries, thenumber of files to be mapped, the contouring interval, and the data field from which the datais chosen. If the data which are being handled require more than one plotting sheet, an appro-priate choice of latitude and longitude boundaries will allow the entire job to be-handled atone time, with the plots drawn consecutively. 'Author - J.W. Lavelle.
, ..- .
Director, Marine Geology and ' Avaktble from originator only. Geophysics , 4
A. .
Atlantic Oceanographic and mos
Meteorological Laboratories/NOAA15 Rickenbacker Causgway .
4
-Miami, FL 33149 ' Telephote (305) 361-3361
Plots Geophysical Data Language -PLOTZ Hardware - UNIVAC 1108
. ,°'. .
\rn
Produces a plotter tape to d splay raw depth, magnetic, or gravity. data vs. time, with the as-pect -ratio automatically dete ined to facilitate comparison wIth the original records. Scalefactor (fathoms, gammas, or gravity meter units perinthl....mnst be specified; if maximum and min-imum values are not specified, the raw data will be scanned and the values determined. Re-qqires subroutines LIMITS, DIGICT, HRMIN, PLOT (includes PLOTIS and FACTOR), NUMBER, SYMBOL.Author - R.K. Lattimore. . \
4......."' .,. .
42
52
4 A 4MIL

Director, Marine Geology andGeophysics
Atlantic Oceanographic andMeteorological Laboratories/NOAA
15 Rickenbacker CausewayMiami, FL 33149'
I
Available from originator only
Telephone (305) 361-3361
Lists Every Hundredth Value Language -SNOOP Hardware -
Scans a tape containing data in the standaid MG&G format,last value before an end-of-file mark. Author - R.K. Lat
Director, Marine Geology and AvailableGeophysics
Atlantic Oceanographic andMeteorological Laboratories/NOAA
15 Rickenbacker CausewayMiami, FL 33149
UNIVAC 1108 .
listing every 100th value and thetimore.
from ori'inator only
Telephone (305) 361-3361
Navigation Computations Language -TPNAV Hardware - UNIVAC 1108
Accept' standard MG&G navigation data cards, computes course and 'speed made good and Eotvos cor-rection between adjacent positions, compares this with input course and speed if Wen; createsa binary tape with position, azimuth,and distance information required for intskpolation of po-sition in programs FATHOM, GAMMA, and GAL. Author - R.K. Lattimore.
Director, Marine Geology andGeophysics
Atlantic Oceanographic andMeteorological Laboratories/NOAA
15 Rickenbacker CausewayMiami., FL 33149
Available from originator onlyito
Telephone (305) 36fr3361?
Edits Geophysical Data Language -ZEDIT - Hardware - UNIVAC 1108
Performs two editing functions on MG&G standard raw data tape: .(a) Deletion by index number;(b) insertion of new data by date-time group; such data can be put on tape (e.g., output fromprogram HANDY) or in card format, one value per card. Data to be inserted must be ordered bypate-time group. Requires subroutines DLIST (HRMIN). Author - R.K. Lattimore.
Director, Marine Geology andGeophysics ,
Atlantic OceanogrSkjlic andMeteorological Laboratories/NOAA
15 Rickenbacker CausewayMiami, FL 33149
Geophysical Data Conversion
Available ffom originator only
Telephone (305) 361-3361
. Language -
HANDY Hardware - UNIVAC 1108
Converts data in the MG&G standard data-card f at to a binary tape suitable for input to the
raw -data editing, evaluation, and processing ogres (e.g., FATHOM, PLOTZ, ZEDINkoiteguiressubroutine DLIST (HRMINy. Author - R.K. La amore.
- 43
.53
A-

ArrigimgPWMMIPm
Director, Marine beology andGeophysics
Atlantic Oceanographic andMeteorological Laborptories/NOAA\ 15 Nickenbacker%dauseway - ear
Miami, FL 33149
Lists Geophyspdal DataLIST?
Lirks'the contents of a, tape cOntainyRequire subroutine PPLIST (modiWati n
Director, Marine Geology andGeophysics
Atlantic Oceanographic andMeteorological Laboratories/NOAA
15 Rickenbacker CausewayMiaMi; FL 33149
4.f
'Available from originator only
Teleph 305) 361-3361
Language -Hardware
one or more files reduced marine geophysical date.of PTLIST). Author - R.K. Lattimore.
UNIVAC 1108
t
'C
/p.
ourse, Speed, Eotvos CorrectionLOXNAV
Available from'originator only
Telephone (305) 361-3361
LanguageWardware
vir
Accepts standard MG64 navigation data cards, computescorrection between adjacent positions if coqrse and
'with computed values. Author = R.K. La ore.
Director, Marine GeologyGeophysics
Atlantic Oceanographi and
Meteorological Laboratories/NOAA15 Rickenbacker CausewayMiami, FL 33149
Converts Geophysical Data
r UNIVAC 1108
courses and speed made good and Eotvos ,speed are given on input, co pares input
fAvailable' otiginator
r
4
Telephone (3p) 361-3361
Language -PHONEY Hardware.- UNIVAC 1108
.
only
-to
Converts marine geophysical. data from 120=co1gmarladge (10'images to £hetapeBCD on 7-track e (produced by program UNIFOO on the CDC 6600) to the
format. Author R.K. Lattimore.
Aock), evewaritystandard MG&G storage
Director, Marine'Geology and Available from originator onlyGeophysics
Atlantic Oceanographic andt,
O
Meteorological Laboratories/N5AA15 Rickenbacker CausewayMiami, FL 33149 Telert644.42211.2g73361 49,
4
Sound Velocity Variation and NavigationFATHOM
LanguageHardware UNIVAC 1108
Given smooth-track navigation data and sounding values indexed by time, the programcorrectsfor sound-yelocity variation (if desired), ship's draft (if desired), and computes latitude,longitude, and distance along track for each observation; the output'is in the standard MG&Greduced-data format. Requires subroutines GP, HRMIN" QUIT (TPLIST). Author - R:K. Lattimore.
'es` A
44
I.

° Director, Marine Geology and Avai able-from originator only
GeogphysicsAtlantic Oceanographic and
Meteorological Laboratories/NOAA15 Rickenbacker CausewayMiami? FL 33149 Telephone (305) 361-3361
Regional Field, Residual Magnetic Anomaly Language -
GAMMA Hardware - UNIVAC 1108
Given stitoth-track navigation data and total-field magnetic measurements indexed by time, theprogram computes regional fields residual' magnetic anomaly, latitude, longitude, and distance
along track for each observation. Output is in the standard MG&G reduced-data format. The
regional field is computed as follows: For each input navigation point, or for pac.h 20 n. m.
interval along track (if navigation points are farther apart), a regional-field value is com-puted according to the method of Cain et al using the IGRF 1965 parameters. Regional field
values for each observation are interpolated linearly. Requires subroutines FIELD, GOFIND,
GPMAG, HRMIN, SETUP, QUI1t(TPLIST). Author - R.K. Lattimore.
Director, Marine Geology andGeophysics
Atlantic Oceanographic andMeteorological Laboratories/NOAA
15 Rickenbhcker CausewayMiami, FL 33149
v
Gravity
GAL
Available from originator only
Telephone (305) 361 -3361
Language -Hardware - UNIVAC 1108
Given smoothed-track navigation data and gravity meter dial readings indexed by date/time, this
program will (1) compute Eotvos correction between adjacent navigation points; (2) reduce the
dial reading to observed gravity corrected for instrument drift and Eotvos effect; (3) deter-mine latitude, longitude, and distance along track for the observations; (4) compute the free-air anomaly from the 1930 International formula for theoreticOogravity., Requires subroutinesGOFIND, GPGAL, HRMIN, QUIT (PLIST). Author- R.K. Lattimore.
Director, Marine Geology andGeophysics
Atlantic Oceanographic andMeteorologicalLaboratories/NOAA
15 Rickenbacker CausewayMiami, FL 33149
Plots Profiles of Geophysical DataDISPLOT
Available from originator only
Telephone (305) 361-3361
Langudge -Hardware -.UNIVAC, 1108/offline CalComp plotter
This program will scale and generate the necessary plotter commands to produce a graph ofsounding, depth, magnetic or gravity value vs. distance along track. The source data consist
oas many as four magnetic tapes containing unformdtted standardized geophysical data, such as
are produced by MG&G reduction programs (Grim, 1971). As many as nine Y-quantities may be
plotted against one X-axis. Options provide for: (1) converting distance in nautical miles to
kilometers; (2) scanning the data and annotating the upper X-axis, at the appropriate point,with crossings of even degrees of_litituda or longitude; (3) omitting all axes; (4), plottingthe profile reversed, or front right to left against distance values which increase from left toright; (5) drawing the zero Y ordinate; and '(6) "Assembling" a-single profile from more thanone source, i.e., from different places on a single tape, or from different tapes. The input
data are not edited. Multiple profiles may. overlap one another as indicated by space limita-
tions or aesthetics. NOAA Technical Memorandum'ERL AOML-11, "A Computer Program for ReducingMarine Bathymetric, Mdgnetic, and Gravity," by Paul J. Grim, January 1971. Authof - Robert K.
Lattimore, October 1971. ,
45
Jor- -
01-

Alv
Director, Marine Geology and Available from originator only
GeophysicsAtlantic Oceanographic and 4
Meteorological Laboratories/NOAA15 Rickenbacker CausewayMiami, FL 33149 Telephone (305) 361-3361
Codverts Digitizer Data Language -
DYGYT Hardware - UNIVAC -1108
Converts digitizer data onyunched cards to MG&G standard raw-data tape. Requires subroutine
DUST (HMRMIN). Authors - DevelOped by J.W. Lavelle, modified for 1108 by R.K. Lattimore.
s
Director, Marine Geology and Available from originator only'
GeophysicsAtlantic Oceanographic andMeteorological Laboratories/NOAA
15 Rickenbacker,CausewayMiami, FL 33149 Telephone (305) 361-3361
, /. 0
, Edits, Reduced Geophysical Data Language -
EDIT - Hardware - UNIVAC 1108
Performs editing operatio on a file of reduced marine geophysical data as follows: (a) le-ations (maximum 2,000); (b insertidn of new data or modification of single points (maximum 00);
(c) block adjustments t Zl, At, 23, Z4 (maximum 1,500 points). The total number of editing op-
erations may nclt exceed 4199; with the exception of deletions, like opeiations must be grouped
together and ordered by index number. Permitted modifications (b above) include replacing Zl,
Zr on a card, interpolatin geographic position and mileage given date/time and Z1-Z4, and in-
VIsertion.pf completely-s fied data, i.e., date /time, latitude, longitude, distance along
track, 21, Z2, Z3, Z4. quires subroutines QUE, QTWO, QUETWO, DAY, TPLIST. Author - R.K.
Lattimore.
Director, Marine'Geology andGeophysics
Atlantic Oceariographic andMeteorological Laboratories/NOAA
15 Rickenbacker CausewayMiami, FL 33149
SeaMount Magnetization
Available from originator only.
Telephone (305) 361-3361
Language - FORTRANHardware- IBM 7074
Computes the magnitude and direction of magnetization ofshape_lind magnetic intensity. OS No. 53533. 'Author - G
Data Systems OfficeU.S. Naval Oceanographic OfficeWashington, DC 20373
Observation 1:)aping (Gravity)
Available
Telephone
LanguageHardware
0
a uniformly }magnetized body from its
. Van Voorhis.
from originator only
(501) 763-1449
- `FORTRAN
- IBM 7074
ItReduces observation data taken with Lacoste-Ramberg se air of submarine gravimeters o ob-
served gravity value and free-,:air anomaly. Interpolates geographic position fr9m smoothed fix,
course, and speed. Generate0C-chart and x,y coordinates for Mercator projecpion for each
station. OS No. 53543. AutflAr - R.K. Lattimore. -
-46
fr
5u

Data Systems OfficeU.S. Naval Oceanographic OfficeWashington, DC 20373
True Ocean DepthFATHCR
1
Available from originator only
Telephone (301) 763-1449
Language - FORTRANHardware - UNIVAC 1108/10K words
Given the Fathometer depth and velocity profile, computes the trug ocean depth. The velocity
profile is broken into constant gradient segments, the travel time integrated along the pro-filq, and the profile is extrapolated to continue to the estimated travel time of the Fa-
thometer record..
Peter D. Herstein Available from originator onlyNaval Underwater Syst Center
New London, CT 06320 Telephone (203) 442-0771, ext. 2305
Plots Track and Data Profile Language - FORTRANTRACK Hardware - CDC 3600/3800
Plots a track and the superimposed bathymetry or magnetic profile on a polar stereographicprojection. This profile series is plotted perpendi ar to the track, using uncorrected me-
ters or fathoms. Input: Data on tape, map parameters, nd command words via cards.
James V. MassingillEnvironmental Sciences SectionNaval Research LaboratoryWashington, DC 20375
Available from originator only
Telephone (262) 767-2024
GEODATA Languagt - FORTRANHardware - CDC 3600/3800
Stores navigation, bathymetry, and magnetic data on magnetic tape in BCD form. Uses the format
recommended by the National Academy of Sciences.
James V. MassingillEnvironmental Sciences Sect,ionNaval Research Laboratory,i)Washington,, DC 20375
Available from originator only
Telephone (202) 767-2024
Geophysical Data Storage and Retrieval *Language - FORTRAN IV
.GEOFILE Hardware - CDC 3150/32K words/Disk/3 tape units
Data storage and retrieval system for BIO's geophysical'data. The programs sort, edit, merge,
li
and display dat recorded at sea. Input: Magnetic tapes from BIODAL shipboard data loggingsystem, bathymetry data on pdnched cards, and navigation data. Output: Magnetic tape contain-
ing all informs on recorded during cruises relevant to processing of geophysical data, sorted
by geographical location. Computer note BI-C-73-3. 4
Larry JohnstonBedford Institute of Oceanographi°P. 0. Box 1006
Dartmouth, N: S. B2Y 4A2
Magnetic,SignaturesMAGPLOT
5
Available from originator only
Telephone (902) 426-3410
Language - FORTRANHardware - CDC 3600/CDC 3800/706,768 words/On-
line plotter
479

Separates and characterizes the various components of magnetic noise in magnetometer recordstaken from a sensor towed at sea. Gives a printout of histogram data for each of three wave-length filters: N (amplitude) NS. amplitude; N (wavelength) vs. wavelength. Also produplots of filtered magnetic fiefs as function of distance. Program is briefly describedNRL Formpl Report No. 7760, "Geological and Geomagnetic Background Noise in Two Areas of
North Atlantic.""
Perry B. AlersNavel Research LaboratoryWishington, DC 20375
Sediment Size « LanguageHardware
Available from originator only
Telephone (202) 767-2530
Produces frequency distributions for soil particle size
' Joseph KravitzU.S. Naval Oceanographic OfficeWashington, DC 20373
Bottom Sediment Distribution Plot'
- FORTRAN- UNIVAC 1108/9K 36 bit words
values; applied to marine sedimtnts.
Copy on file at NODC (deck with documentation)
Telephone (202) 433-2490
Language - FOHardware - UN
TRAN V.IVAC 1108/23K/Drum/3 tape units/CalComp 905/936 system
,
Produces a plot of bottom sediment notation on a Mercator projection, and a list of all data,including cores, within specified area.
Berninghausen Copy on file at NODC (deck with documentation)U.S. Naval Oceanographic OfficeWashington, DC 20373 Telephone (301) 763-1189
Sand, Silt, and Clay Fractions Language - ALGOL
DSDP/GRAIN Hardware - Burroughs 6700/19K words
Computes sand, silt, and clay fractions in sediments. .The laboratory method Consists, of dig-persing the sediment in Calgon solution, sieving the .sand fraction, and pipetting the silt and
clay fractions. Input: Three.card files for laboratory data and one card file for interpret-ing an identifier attached to each sedieent sample. Output: Listing with optiOn for ternary
plots.and punched,ca ds..
Peter B. Wodbury .' Avallaflt. froM originator only
Deep Seaebrilling Project 0
Box 1529La Jolla; CA 92037 Telephone (114)452-35/6
Soil and Sediment Engineering Test Data Language - FORTRAN II-DHardware - IBM 1620 II/IBM 1627 Model I Plotter
Engineering ,index of Core Samples: Reduces data and tabulates results ,for tests on bulk wetdensity, vane shear strengths, original water content, liquid limit, plastic limit, and spe-cific gravity of solids; in addition, from the above results, other index properties are simul-taneously computed and tabulated; the output table lists results in columns representing each
depth se ent analyZed.
Grain e Analysis with Direct Plotting: Input data are sample identification, sample weights,
hydr ter readings, and sieve readings. Output on plotter is a particle size distribution
cure . Another program provides output on cards of a table with proper headings and values for
partic e diameters and percent finer by weight:
98
53F
A1

Carbonate - Organic Carbon kagi;11-JE Sediments: Reduces data from the carbon determinatorand tabulates results of the analysis of deep ocean sediments for carbonate and organic carbonpercentages; output is in same format as in program for engineering index properties, to whichthe output from this program is added.
Direct Shear) Test with Direct Plotting: Reduces data and plots shear stress vs. shear dis-placement with appropriate headings and labels; another program, Direct Shear Test, uses thesamedatd formats but presents. the results in the form of tabulations rather than plots.
ariaxial Compression Test with Direct Plotting: Reduces the data from triaxial compresssiontests and plots stress vs. strain with headings for sample identification, lateral pressure,etc. Another program reduces the same raw data and presents the results in the form of tabula-tions, one for each test.
4 Consolidation Test (E vs. log time plot): Reduces the data obtained from consolidation testreadings. Input includes sample identification and characteristics and test characteristics.The output is in two forms: plots and punched cards. The log of time is plotted-vs. the voidratio. The cards are used as input to the next consolidation test program.
Consolidation test (E vs. log P and C(V) vs. log P plots): Develops plots for void ratio vs.,log of pressure and coefficient of consolidation vs. log of pressure. The4input consists ofoutput cards from the previous program, together with the values of void ratio and pressure at100% consolidation and the time and void ratio at 50% consolidation. These data were obtqinedfrom the plots of void ratio vs. log of time in accordance with the Terzaghi consolidationtheory._
"..)
ermeability Test with Direct Plotting: Reduces test data and plots curve of permeability vs.permeabilityime with appropriate headings and labels.°The plotting scale is a variable incorporated. inhe program since permeability values for fine-grained soils vary throughout a wide range.
° .
Settlement Analysis: Estimates settlement values from laboratory test results, for deep oceanfoundation investigations. Input; Sediment properties and structure characteristics. Output:A table listing total settlement, footing dimensions, structure load, change in thickness ofincremental layers and corresponding depth in sediment, initial stress, and change in stress.
Summary-Plots: Plots the results from the laboratory analysis of core samples. The input dataare the output results on cards from the previous programs and miscellaneous analyses. Sincethe link system of programing is used, the, items to be plotted can be increased or decreasedwith slight modifications, depending on the user's requirements. Output is a sequence of plots.The depth into the sediment,column is plotted with reference to the ordinate, and the variousproperties along the abscissa 9n variable scales.
NCEL Report No. R 566, "Computer Reduction of Dattifrom Engineering 'rests on Soils and OceanSediments," by Melvin C. Hironaka.
Civil Engineering Laboratory Available from NTIS Order. No. AD-666 310Naval Construction Battalion Center $5.75 paper, $2.25 microfiche.Port Hudneme, CA 93043
49
1.
'to

'BIOLOGY
WHOI Biology Series
FTAPEFLISHT
, =SPITSELECTCHANAT
'PREPLOTG.PLOTSPECGSTATAB
Language - FORTRAN IVHardware - XDS Sigma 7/plotter optional
9,000 words'9,054 words32,430 words
58 words16,751 words12,200 words18,000 words,4,164 words
04
FTAPE generates a tape containing station data, species data, and systematic ardor information.FLISHT prints a list in systematic order of the species from the tape, including stations, num-bers, sizes, and weights, with a final summary. Subsets can be specified with" subroutine
SELECT.
CHKSPIT summarizes catch igkormation from any specified set of stations on the tape made byFTAPE, .including data for all species, a listing of the top-ranking species by number andweight, various diversity indices, and percent similarity between sets. CHANAT analyzes a
transect for faunal breaks, following, the method of Backus'et al (1965, "The Mesopelagic Fishes pCollected during Cruise 17 of the RV CHAIN, with a Method for Analyzing Faunal Transects," Bull.Mus. Comp. Zool. HarvarA11134 (5):139-158), using the data on the tape made by FTAPE.
-17"
PREPLOTG and PLOTSPECG plot a distribution map for any species on the tape made by FTAPE, withindications of vertical distribution, catch rates, and negative data; the two programs must run
toge4her; input includes A, tape from NODC with world map outlfnes; output can be plotted oo
CalComp or Versatec Plotters. /`
STATAB prints in readable format the information contained in the station data file made by
FTAPE or on the input cards.
R.L. Haedrich Available from originator only
Woods Hole Oceanographic InstitutionWoods Hole, MA 02543 Telephone (617) 548-1406., ext. 354
Optimal Ecosystem PoliciesOEP
4Language - FORTRAN "-
Hardware - IBM 376/180K/REGION..180
To approximate optimal management policy for an aquatic stream etosystem, program produces asequence of converging values oran objective function, optimal values of decision variables,
and simulation of the etosystem using optimal decisions. Input: Parameter values (defaults
built in), program constants, species interaction matrices. Deterministic or Monte Carlo simu-
lations (user, specified) are fit to state equations, from wSich the optimal policy is found,
using the discrete maximum principle.
Robert T. LackeyDepartment of Fisheries and
Wildlife SciencesVirginia Polytechnid Institute
Skid State University.Blacksburz, VA 24601
Available from originator only
O .
Telephone (703) 951-6944
Inverse Problem in Ecosystems Analysis Language - FORTRAN. IVHai8ware - UNIVAC 1108/10K 6 character wards
Performs systematic analysis and modeling of interacting species in complex ecosystems, using a
5060
. previously unpubl shed iterative technique for regression Analysis as well as statistical hy:_pothesis testing. Input: a user-written 4ubroutine defining the general structure of the eco-system and a set o species population vs. time data to be analyzed. Output: -A mathematicalmodel of the ecosystem which has the most simple structure adequate to explain the observations.For an example, see "A Systematic Approach to Ecosystems Analysis," by Curtis Mobley, J. Theo-retical Biology, 41, 119-136 (1973). Program documentation in NRI Tech. Ref. 72-84.
Curtis MobleyDept. of Meteorology (IFDAM)University of MarylandCollege Park, MD 20742
Available from originator only
Telephone (301) 454-2708
Toxicity Bioassay Language - FORTRAN IV Level GPROBIT ANALYSIS Hardware - IBM 360/4K bytes
A routine method for the analysis of all-or-none acute toxicity bioassay data. Input: Numberof concentrations, tabular text statistics (F, "t," Chi-square), number of organisms tested andnumber dead in each concentration and control. In general, mortality must be related to con-centration. A minimum of three concentrations, with a partial kill both above and below 50% isrequired., Output: LC30, 50, 70 90 values with upper and lower 95% confidence limig; inter-cept, slope and standard error of regresdion line, and several additional measures of goodnese."Probit Analysis," by D.J. Finney, Cambridge University Press, 1971. Prograloritten byA.L. Jensen, School of Natural Resources,` University of&Michigan, Ann Arboreilichigan 48104.
yPatrick W. BorthwickGulf Breeze EnvironmentalResearch Laboratory
,E0vironmental Protection AgencySabine Island, Gulf Breeze,FL 32561
Copy on file at NODC (listing, documentation)
Telephone,,(904) 932-5326
Species Affinities Language - FORTRAN
REGROUP Hardware - CDC 3600
The program first determines the numbers of occurrences and joint occurrences of the species inthe set of samples; it then calculates an index of affinity for each pait of species. The spe-
cies,are ordered in terms of the numbers of affinities they have, and this list is printed along
with a list of names, code numbers, and numbers of occurrences. The program then determinesthe largest group that could be formed, tests to see whether that many species all haveAtflin-ity with each other and, if they do, prints out the group. If they do not, it tries theqlext
smaller group, etc. Those species which had affinity only with this group ,r and/or earliergroups -- are listed. 'The remaining species are reordered and the process continues until allspecies Have'been put either in gioups or in the list of species with affinities with groups:
Limits -- 200 species. Author - E.W. Fager.
Scripps Institution of Oceanography Copy on file at NODC (listing, documentation)
P.O. Box 1529La Jolla,'CA 92037
ProductivityOXYGEN
Language - FORTRAN IVHardware - CDC 6600
Determines productivity by oxygen. diurnal curve method. Input includes oxygen concentration
and oxygen probe parameters. Output contains net and gross productivity and R/R plus original
data. 'Author - William Longley.
Marine Science IndtituteThe Univers=ity of TexasPort Aransas, TX 78373
Copy on file at NODC (listing, documentation)
51
614 ''''
O

Species DiversityJOB
A ,
Language - FORTRAN IVHardware - CDC 6600/50 K/60 bit words
Calculates specie; diversity index for numbers of organisms and/or wei t of organisms, utiliz-
ing the diversity index equation derived from Margalef. The program ca is subroutine SEASON,
which calculates seasonal aVerages for a given station, seasonal limits eing indicated by a
control card. This subroutine outputs mean, standard deviatiort, and r nge of diversity indices
for each seasonal group. Other desired groupings may be entered by a groupings control card.
Author,- A.D.'Eaton.
Marine Science InstituteThe University of TexasPort Aransas, TX 78373
Productivity,4300pROD
Copy on file at NODC (listing, documental
Language - FORTRAN IVHardware - CDC 6600/25 K 60 bit words
Computes gross and net productivity, respiration, P/R ratio, photosynthetic quotient, effi-ciency, and diffusion coefficient, given sunlight data and diurnal measures of oxygen and/or
carbon dioxide. Author - William Longley.
Marine Science Institute Copy on tile at NODC (listing, documentation)
The University of TexasPort Aransas, TX 78373
Concentrations per Square Meter of Surface Language - FORTRAN IVHardware IBM 7074-1177040 DCS/2231 words
Computes various chemical and biological compound concentrations aswell as productivi t y rates
per square meter of water surface from integrated values on per volume basis. Ten concentra-
tions and rates are integrated over up to seven pairs of optional depth limits.. Report DUNS-
1006, June 1966. Source deck has 771 cards. Authors - Leilonie Q. Gillespie and Linda S.
t Green.
Department St Oceanography " Copy on file at NODC (hbove'report)
Universityof WashingtonSeattle, WA 98105'
Combined Chlorophyll and Productivity Language - FORTRAN IVHardware - CDC 6400
Ca
Computes assimilation of productivity in seawater; also compytes the quantities of chlorophyll
A, B and C, and the amount of carotenoids in seawater. The chlorophyll program determines
the, amount of plankton pigments using the equations of Richards and Thompson. The productivity
program (Carbon 14) determines the production of marine phytoplankton by using Neilsen's
method. Output consists of both printed matter and of library cards; the Cards may be used as
input to a multiple,iegression program to derive a relation between productivityiand chloro-
phyll A; a plot routine may be called to graph one or several variables as a function of depth,,
or to display the horizontal distribution of any given property. Written by Marsha Wallin,
Nov. 1963, based on, two programs prepared in 1962 for the IBM 7Q9 by M.R. Rona; revised in 1969
for the CDC 6400.
Department of OceanographyUniversity of WashingtonSeattle, WA 98105
Copy on file at NODC (listing, documentation)
52
62
411A

Phytoplankton Numbers, Volumes and Surface Language - FORTRAN IV and MAPAreas by Species - Hardware - IBM 7094-11/7040 DCS/23,836 words
Two programs, differing only in input format, compute concentrations of cell numbers, cell sur-. face areas, and cell and plasma volumes in marine phytoplankton populations, with option to com-
pute mean cell areas, mean cell volumes, and mean plasma volumes, as well as the ratios: cellarea to cell volume and cell area to plasma volume. The input quantities are obtained from mi-croscopic examination of seawater samples. A subroutine computes the atea, volume, and plasmavolume of a cell from measured dimensions of diverse species. Source deck has 1,221 cards.,
. Spacial-Report No. 38, M66-41, July:1966, by Paavo E. Kovala and Jerry D. Larrance.
Depattment of Oceanography Copy on file at NODC (above report)University of Washing-tan -- -
Seattle, WA 98105
Program to Generate a Taxonomic Directory &Language .0 F9RTRAN IV.of Deep-Ocean Zooplankton Hardware - UAIVAC 1108/20KVords
Generates a data file (taxonomic directory) which classifies and catalogs various species ofdeep-ocean'zoopiankton collected in water samples for the purpose of studying the populationand distribution statistics of these species. Input: Cards containing either the phylum,class, order, genus, or species name and the appropriate identifying numbers associated witheach of these categories. NUSC Technical Memorandum No. TL7-104T71, May 1971.
Drew Drinkard`Naval "Underwater Systems Center
New London, CT 06320
Deep - Ocean Zooplankton Distribution
Available from originator onlyP
Cz."Telephone (203) 442-0771, ext. 2127
Language - FORTRAN IVHardware - UNIVAC 1108/30K words
,/The purpose of ?program is to study the distribution statistics of the deep-ocean zooplank-ton species within a articular taxonomic category. The distribution characteristics of the .
individual species are examined for both the individual net samples which have been collectedat.various sampling depths and the combined net samples for a given tow. Input: Station data,sample data, species abundance data on cards, and a hash table species directory (programavailable for generating such a hash table), records total count for each species to which thevarious organisms collected in the samples belong. For the individual net samples, computesthe percentage of the total taxonomic category which each species in the sample represents.For the combined net samples, both the percentage"of the total taxonomic cateery and the per-centage of the entire sample (all taxa included) are computed. Finally, the population den-
, sity of each species within its ta*Cnomtc category is calculated. NUSC Technical MemorandumNo, TL-107-71, May 1971.
1r
Drew DrinkardNaval Underwater Systems CenterNew London, CT 06320
Available from originator only
Telephone' (203) 442-0771, ext. 2127
peep-Ocean Zooplankton Population Statistics Language - FORTRAN IVHardware - liyAc 1108/30K
Produces population statistics for both the individual net samples collected at various deptlzsand for the combined net samples. Input: Station data, sample data, spe ie8 abundante dataon cards, and a taxodbmic directory on mass storage device. Each species is identified by phy-lum and class with the aid of the taxonomic directory. The organisms are counted according tothe phylum or class. Total counts for the entire sample are calculated for each category. The
population densities of each category are computed. Also calculated is the percentage of thetotal sample that each taxonomic category represents. NUSC Technical Memorandum No. 11-106-71,May 1971.
6353
Drew DrinardNaval Underwater Systems CenterNew Londoh, CT 06320'
PIGMENT RADIO
Available from otfginatoi only
Telephone (203) 442-0771, ext. 2127
Language' - PORTR IV
HardWare - IBM 360/less than 500Q bytes
gComputes ratios. chi a/Carot, Pheoarot, (Chl a + Pheo)/Carot, Chl b/Carot,'Chl c/Carot, and
Fluor /(Chl a + Pheo). Input: Sample identification, chlorophylls a, b, c, carotenoids, pheo-
pigments, and fluorescence on cards. Output: Printed sample identification and ratios. "A
Computer Program package for Aquatic Ecologists," by Paul J. Godfrey, Lois White, and Elizabeth
Keokosky. s !
Pgul J. GodfreyDepartment of Natural ResourcesCbrnel; University, Fernow gallIthaca, NY 14850
Copy on file at NODC (listing, documentation)
. Telephone (607) 256-3120
SUCCESSION Langt' , - FORTRAN IVHardware 360/4440 bytes
Gpmputes succession rate of community based on measure proposed by Jassby and Goldman of rela-
tAme-change in each species' biomass. See "A Quantitative Meapure of Succession Rate and Its
Application topthe Phytoplankton of Lakes," by A.D. Jassby and C.R. Goldman, 1974, Amer. Natu-
ralist 108:688-693. Input: Integrated species biomasses and isampling date in calendadays.
Output: Printed sample identification values, dates defining interval in each successi n rate,
and succession rate. "A Computer Program Package for Aquatic Edologists," by Paul J. Godfrey,
White, and Elizabgth Keokosky.'
Paul J. GodfreyDepartment of Natural ResourcesCornell University, Fernow HallIthaca, NY 14850
air
(Copy on file at NODC (listing, documentation)
Telephone (607) 256-3120
Species Abundance Language - PL/1
SPECIES Hardware - IBM 360/250K
This series of three' programs was developed to accept species abundance data iii ied:Aimplest
form, check it for errors, produce lists of species abt,peances where comparisons may be made
between days, depths, lakes, stations or years, and convert the input data to a form accept-
able to packaged programs. Output: Listings of species abundances, summary data including
total abundance, number of species and diversity, and spbtotals within user-determined groUps,
punched output of summary data. "A Computer Program Package for Aquatic Ecologists," by Paul
J. Godfrey, Lois White, and Elizabeth Keok sky.
Paul J. GodfreyDepartment of Natural ResourcesCornell University, Fernow,HallIthaca, NY 14850
on file at NODC (listing, documentation)
Telep ne (607).256-3120
Yield Per Recruit Language - FORTRAN IV -
RYLD, BIOM Hardware - IBM 1130
Computes the approximate yie d of a fish stock per recruitment by either of two methods (arith-1
metic or exponential approximations), or sitply computes the stock biomass when there is no
fishing. Output;,, An equilibrium yield matrix with up to 400 entries corresponding to 20
ages at entry and 20 multipliei.s. Technical Report No. 92 (unpublished manuscript), No. 1968.
54
4.
is
4
0
A
I
Authors - L.V. Pienaar and J.A. Thomson. Earlier version writtenaby L.E. Gales, College ofFisheries, .University of Washington.
'Fisheriel Research Board of Canal Copy on file at NODC (above report)Biological StationNanaimo,
40001r
ChlorophyllCHLOI
Language - FORTRANHardware - IBM370
Calculates chlorophyll in mg/m3according to S&P extraction, spectrophaometric technique.
Input: Raw absorbences. Author - Stephen A. Macko.
McAlice Available from originator onlyIra C. Darling Center (Marine Laboratory)University of Maine at OronoWalpole, ME 04573 Telephone (207) 563-3146
Phytoplankton Population Density Language - WATFIV FORTRANH9kdware - IBM 370
Computes species densities and population percentages and relative diversity from cell counts.Output formatted according to taxonomy in/FAO Fisheries Technical Paper-412. Author - StephenA. Macko.
B.J. McAlice Available from originator onlyIra C. Darling Center (Marine Laboratory)University of Maine at OronoWalpole, ME 04573 f. Telephone (207) 563-3146
Species Diversity Language - WATFIV FORTRANDVRSTY Hardware - IBM 370
From unformatted raw data,-produces-sptctes diversity, and diversity matrix.
B.J. McAlice Available from originator onlyIra C. Darling Center (Marine Laboratory)University of Maine at OronoWalpole, ME -04573 Telephone (207) 563-3146
e
IS*
)1.
55
V
fr
r
a.

415
FISHERIES
Length Frequency AnalysisLENFRE
dos
Language - FORTRANHardware Burroughs 6500
Uses three methods of stratification to expand sample length frequencies in dffferent'straa.
/he program was developed for tuna fishery samples. Input: Sample length frequencies for up
to 80 strata, alpha and beta. for the length-weight relation, von Bertalanffy growthl)arameters.
Output: Tables of sample length frequencies, expanded length frequencies (expanded by totalcatch), weight in each length interval, by strata; total frequencies for all strata combined;average length 4nd weights,and age; catch per unit effort.
Atilio L.,-Cean, Jr. Available from originator only -
Southwest Fisheries Centerrt0ional Marine FisheriesSrrvice, NOAA
. Box 27rLa Jolla, CA 92037
Yield per Recruit for Multi-Gear Fisheries
MGEAR
Telephone (714) 453-2820, ext. 285
Language - FORTRANHardware - Burroughs 6500/6,200 words
Computes estimates of yield per recruit and several related parameters-for fisheries that areexploited by several gears which may have differing vectors of age specific fishing mortality.
The Ricker yield equation is used Input is limited to 4 types of gear, 30 age intervals, and
10 levels of fishing mortality. Output: Besides tables of yield per recruit, landings per
recruit when fish below minimum size are caught and then discarded dead, average weight of fish
arin catch, and yield per effort as functihns of minimum size and amount of fishing
effort are provided for each and for the entire fishery. The program has been used for
evaluating propdsed miritmu i egulations for the yellowfin tuna fishery of the tropical
Atlantic, a fishery eiploit by four types of vessels (fait boats, small purse seiners,, large
purse seiners, and longliners) having quite different vectors.of age specific fishing mortality.
William H. LenarzSouthwest Fisheries CenterNational Marine Fisheries Servite,
P.O. Box.271La Jolla, CA 92037
Available from originator only
NOAA
Telephone (714) 453-2820, ext. 280
Resources All6cation in Fisheries Management Language - FOR IV
Hardware - IBM 370/125K.PISCES0
Uses .a Monte Carlo simulation to predict the effect of fisheries management programs upon the
distribution and abundance of angler consumption. Input: State fisheries agency data and man-
agement plan. Output: (1) Predictions of the number and location of-angler-days throughout a
state; (2) Standard deviations. "PISCES: A Computer Simulator to Aid Planning in State Fish-
eries Management Agencies," by R.D. Clark, MS Thesis, VPI&SU. 't
Robert T. LackeyDepartment of. Fisheries and
Wildlife SciencesVirginia Polytechnic Instituteif and State UniversityBlacksburg, VA 24061
Computer-Implemented Water Resources
. Teaching Game, DAM
I
Available from originator only
Telephone (703) 9514944
ee
Language - FORTRAN IVHardware - IBM 370/120K/Interactive terminal
desirable
56
Im

Using a simulation of an existing reservoir system, this computer-assisted instructional gamefllustrates the management of a large multiple-use reservoir system. Input: Student manage-
ment ddcisions for (1) a regional planningcommissioner, (2) a fisheries manager, (3) a powercomparky, executive, (4) a recreation specialist, and (5) a city mayor. Output: Status of res
ervoir system, including human components.
Robert T. LackeyDepartment of Fisheries and
Wildlife SciencesVirginia Polytechnic Institute
and State UniversityBlacksburg, VA 24Q61
Available from originator only
Telephone (703).951-6944
-\
A Generalized Exploited Population Simulator Language - FORTRAN
GXPOPS Hardware - Burroughs 6500/CDC 3600
GXPOPS is a generalized exploited population simulator designed for tse on a wide variety of
aquatic life history patterns. Population processes programed tato the present version are(1) month-specific and density-independent mortality rates on the recruited population, (2)
S Vdensity-in e ndent growth, (3) sex-specific and age-specific, but density-independent, matu-
ration, (4) eproductive success due to random mating, and.S5) density-dependent or density-
independent recruitment. Myrtality, growth, and maturation can be made density-dependent
through the .addition of subroutines. The unit length of time is the repteductriiicycle, com-
cl.,,t monly a year in teviperate species; computations are performed each one-twelfth of a unit,
thereby representing a month for most species.
ThereIre Three output options. For each year the complete output option lists monthly (1) theaverage year class size, yield in numbers and weight for any six consecutive year classes, (2)
the. total initial population size, (3) the average total fishable population, (4) the totalyield in nu"..ers and weight, and (5) the average sex ratio. Annual summaries of initial popu-
lation, average population, average fishable population, yield in number and weight, wit the.spawning success are provided'by year class for the total population and for the fishable totae
population. The moderate option lists only thelenthly summary totals and the annual summary
by year class. The minimum option, suited for long simulations' lists only the annual summary
by year class and for the total and fishable total population. GXPOP'S is dimensioned to handle
the computations for up to 30 year classes, but, in order to economize on space, the output isdimensioned-to list up to 6 consecutive year classes only. The FORMAT statements must be re-
written to list an additional number of year classes. "A general life history exploited popu-,
lation simuntor with pandalid shrimp as an dxample," by William W. Fox, Jr., Fishery Bulletin,
U.S., 71 (4): 3,019-11)28, 1973.
*William W. Fox, Jr. Available from originator only
, Southwest Fisheries CenterNational Marine Fisheries Service, NOAAP.O. Box 271 lo
.
La Jolla, CA 92037 Telephone (714) 453-2820, ext. 345
Generalized Stock Production ModelPRODFIT
Language - FORTRANHardware - CDC 3600/Burroughs 6500
Inputf (Option 1) A catch and fishing effort history and a vector of significant-year classnumbers are read'in; the catch per unit effort is computed internm1,15, and the averaged fishingeffort'vector is computed with subroUtine AVEFF; (Option 2) The vectors of catch per unit ef-fort and averaged (or equilibrium) fishing effort are read in directly. Output includes a.
listing of the input data, thransformed data, initial parameter estimates t the iterativesolution steps, the management ., lications of the final model *umax, Uopt, ropt, and 'max and
their variability indices, the o., rved and predicted values and error terms, estimates of the
caechability coefficient, and a table of equilibrium values. ( *Umax is the relative density of
the population b4ore exploitation; Uopt is the relative population density providing the malt- 1111imum sustainable yield; ropt is the amoOnt of fishing effort to obtain the maximum sustainable
yield; and Ymax is the maximum sustainable yield.) "Fitting the generalized stock production
57
6 I.

model V least- squares and equilibrium approximation," by William W. Fox, Jr, Fishery gulletin,
4Z,U.S., in press.
tr,
William W. Pox, Jr. Availeble.from originator onlySouthwest Fisheries CenterNational Marine Fisheries Service, NOAAP.O. Box 271 r--La Jolla, CA 92037 Telephone (714) 453-2820, ext. 345
0.,.Normal Distribution-Serrator , Larigbage - FORT AN '.
N
TCPA1 0 ) ,Hardware - Buritulhs 6700
Separates a lengthArequency sampling, distributioh into K component normal distributions. Usedto estimate age g 'roup relative abundance in length samples of tilageable species., The method.isstatistically superia to graphical procedures. Also, the program will produce estimates ofthe percent composition by age group and the number of fi.sh,..in the sample each age group.Output include a plotted histogram, the observed frequeacies, and all eitimated values. The
\evalue of K may from one to ten. "Estimation of parameters for a mixture of normal distribu-tions," by V. Hasselblad, Teechnometrics 8(3):431 -441, 1406. Author - Victor Hasselblad; modi-fied by PatqckLK. Tomlinson.
Christopher T. Psaropulos Availablg ffom originator onlyInter-American Tropical Tuna Commission a
southwest Fisheries CenterRost Office Box 271La; Jolla, CA 92037 Telephone (714) 453-2820,.ext. 310 or 253
406'gi
O
rSpawner-Recruit Curve'Fitting Language.- FORTRANTCPA2 Hardware - Burroughs 6700 i.r
Estimates the parameters of the Ricker spawner-recruit curve, R = ASe bS, from fitting thev,
logarithmic transforms ion Ln(R/S)= 1,11A-bs, by the method ae least squares. S is the spawn-ing biome -mass, R is the l'ecruit biomass, and A and b are' constants. From the fitted curve atable of spawning stocks and resultant recruitments is produced. The curve is discussed in"Handbook of computations for biological statistics of fish populations,' by W.E. Ricker, Bull.Fish.DSs.Bd. Canada (119)1-300, 1958. Author - Patrick K. Tomlin.
istopher T. Psaropulos - Available from originator onlyInter-American Tropical Tuna CommissionSouthwest Fisheries Center
Post Office Box 271LaJolla, CA 92037 Telephone (714 ) 453-2870, ext. 319 ot 253
Weight-Length Curve FittingTCPA3
Language - FOR RANHardware - Burroughs 6700
e
Er
Fits a curve giving weight as a function of len th of the form W=a Lb where W is the weightand L is length. ;t roduces a table of fiiteddeights and lengths and provides various, re-lated statistics. method of fitting involved linearization by common logarithms add theusual least-square iocedure for fitting a straight line. Author - NormanA5. Abramson; modi-fied by Patrick K. Tomlinson and Catherine L. Berude. '
tistopher T. Psaropulos % Available froth originator only-ter-American Tropical Tuna Commission
southwest Fisheries CenterPost Office Box 271_ oes ......
La Jolla, CA 92037 y,Telephone (714)453-2820, ext. 310.or,..,253
,. w I)
58
6a
O

.
III
Age Composition Estimation Language - FORTRAN
TCPB1 Hardware - Burroughs.6700
Estimates pee domposition using a double sampling scheme with length as strata. Also providesestimates Assuming simple random sampling of aged fish. Under the double sampling scheme, thefirst sample is of lengths (length frequency) to estimate length-strata sizes; the second ormain sample is for ages. The second sample can be drawn' (1) independently, (2) as a subsampleof the first, or (3) as a subsample within length strata. "A method of sampling the Pacificalbacore (Thunnus Rermo) catch for relative age compositibn," by D.J. Mackett, Proc.WSrld.Sci.Meot.Biol.Tunas & Rel.Sp., FAO Fish.Rpt. No. 6, Vol. 3, 1963. Author - D.J. Mackett. '
Christopher T. PsaropulosInter-American Tropical Tuna CommissionSouthwest Fisheries CenterPost Office Box 271La Jolla, CA 92037
Available from originator only
Telephone (714)'.453-2820, ext. 310 or 253
erve-
Best Current Estimate of Numbers, Percentages, Language - FORTRANand Weights of Fish Caught, TCPB2 Hardware - Burroughs 6700
Given any number of length detail cards for fish sampled during a given bimonthly (or Other)period, this program calculates by, primary area and gear: (1) The number of fish sampled ateach length-frequency interval; (2) the percentage of fish samplediat each length-frequency in-terval; (3) the smoothed percentage of fish sampled at each length-frequency interval; (4) theaverage weight of the fish. With the input of the corresponding catch data the program makesestimates of the number of fish caught at each length-frequency interval for the given periodby primary area and gear. The program alsormskes estimates for the given period for both gearscombined for each of the primary and secondary areas of (1) through (4) above. It estimatesthe same thing for each gear separately and for each of the secondary areas. Finally the pro-gram makes estimates for the given period and all preceding periods of that year combined foreach gear sepaAtely and both gears combined for each of the primary and secondary, areas of (1)through (4) above and the total weight of fish caught at each length-frequency interval. Limi-tations: (a) The cards for. each period must be kept separatelyPand the periods must be inchronological order; (b) gear 2 must follow gear 1 in the catch cards; (c) although any numberof periods may be run consecutively, it must be kept in mind that all of the periods will besummed to compute the best current estimate; (d) the maximum number of length frequencies is80, gears 2, and primary areas 7.' Author - Christopher T. Psaropulos.
Christopher T. PsaropulosInter-American. Tropical TunaSouthwest Fisheries CenterPost Office Box 271La Jolla, CA, 92037
Available from originator onlyCommission
rITelephone (714) 453;2820, ext. 310 or 253
Length-Frequency Distribution of Market Language - FORTRANMeasurement Sampling, TCPB3 Hardware - Burroughs 6700
GtVn any number of length detail cards for fish sampled with input of corresponding catch dataduring a year period, this program (using the same methods as TCPB2) summarizes, by quarter,market measurement area code, And for each gear, or combined: (1) The average weight, and thenumber of fish caught at each quarter; (2) the raw and smoothed percentage of fish sampled andcaught at each length-frequency inter4a1; (3) the nqmber of fish sampled and caught at eachlength-frequency interval. Author - Christopher T. Psaropulos.
Christopher T. Psaropulos Available from originator onlyInter-American Tropical Tuna CommissionSouthwest Fisheries CenterPost Office Box 271La Jolla, CA. 92037 Telephone F14) 453-2820,0ext. 310 or 253
59
- Von Bertplanffy.Growth Curii4 FittingTCPC1
Language - FORTRANHardware - Burroughs 6700
Fits thu..izoe Berteannffy growth-in-length curve to unequally spaced age groups with unequalsaMple sizegq.or separate ages. It fits the equation Dt length (at age t) A+BRt; -0KR<F1 (1)by least squares when data'of the form (length, age) are given in pairs (Lt, t). The programminimizes the function Q 2(Lt - A BRt)2 by use of the partial derivatives evaluated nearzero.
Output is in the von Bertalanffy form, where A L., R e-k or K -logeR, B -L.Lkto
or to(loge-B)-logeA)/K.
The output gives values of the expected length at age using equation (1) evaluated at ages se-lected by the user. The pairs (Lt, ti may be read into the program in two different ways. Thefirst assumes that no type of ordering or sorting has occurred and that each (Lt, t) represents'a single fish. The second method allows for frequency distilbutions and the user provides atriple (Lt, t, m) where m is the number of times (or some weighting factor) the pair (Lt, t) isto be toed. Author - Patrick K. Tomlinson. d °
Christopher T. Psaropulos .Available from originator onlyInter-American Tropical Tuna CommissionSouthwest Fisheries CenterPost Office Box 271La Jolla, CA 92037
Von Bertalanffy Growth CurveAge Intervals
TCPC2
for Unequal
Telephone (714) 453 -2820, ext. 310 or 253
Langu ORTRANHardware - Burroughs 6700
D
Uses the method of Tomlinson and Abramson to fit length at,age data to the von Bertalanffygrowth equation Lt L. (1 - e-k(t-tio)) where Lt. length at time c, L. asymptotic length, Kgrowth constant, and to theoretical time at which Lt O. The age intervals do not need tobe equal. Limitations: /he number of lengths for each age' groupimust be at .least two and notmore than 500. (If only one length, or a single mean length, is availSble for a giveri agegroup, it may be punched twice.) /hp maximum number of age groupVis 40. The output includes:(1) estimates of L., K, and to from each iteration of the fitting process; (2) final estimatedof L., K, and to-- (3) standard errors of L., Kt and to; (4) fitted lengths fpr age 0-fhroughthe maximum included in the input; (5) mean lengths of the samples at each age group; (6)standard errors of the mean lengths in the samples; (7),the number of lengthsyin each agegroup; (8) variance-covariance matrix; (9) standard error of estimate. "Computer prbgrams for.fisheries problems," by Norman J. Abramson, Trans.Amer,Fish.Soc. 9;(3):31a.1963. Fittifig avon Bertalanffy growth curve by least squares including tables of polynoigals," by Patrick K.Tomlinson and Norman 'J. Abramson, Fish.BuIl.Calif.DeptoFish & Game 116:60 p. 1961. Author -N.J. Abramson. (See also TCPC 3)
Christopher T. PsaropulosIntei-American Tropical Tunasouthwest Fifheries Center-Post Office Box 271La Jolla, CA 92037
4'
Von Bertalanffy GrOWthCurve forEqual,Age Intervals
.TCPC3
Available from originator onlyCommission
o
'
Telephoned (714) 4,53-2820, ext.
Language,- FORTRANHardware -7 Burroughs, 6700.
r
Similar to TCPC2. However, the age.intervals must be equal with at least two obyrve lengthsat each age. %The progral always yields estimates when a least-squares solution exIsa, and !"-''
immediately, terminates'the run when there is(no solution. In thid respect it is superior to (TCPC2, whiW occasionally doe's not converge to estimates even when a splutionexists.thor - N.J. Abramson.
. .
. -
/
310 or 253
,
60
1.
Vo
-
b
r
Christopher T. Psaiopulos Available from originator only
Inter-American Tropical Tuna CommissionSouthwest Fisheries Center
Post Office Box 271La Jolla, CA 92037 . Telephone (714) 453-2820, ext. 310 or 253
too '
Von, Bertalanffy Growth Curve Fitting
TCPC4
Language - FORTRANHardware - Burroughs 6700
Estimates the parameters...K-4nd L. of the von Bertalanffy growth-in-length curve when only thelengths of individual fish at two points in time are *mown. This allows the curve to be fitted
to tag release and recovery data. Fitpequation (1) by least squares when data are of thejorm(initial length, final length,-t4me elapsed). 4
Lt + At Lt RAt +A(1-RAt); 0 <R<1 (1)%
Lt is the initial length; Lt+At is the fintillength, and At is the time elapsed. Given.n
triples (Lt, Lt+Ae, At) and equation (1), the program minimizes the function.
Q = (Lt+At- Lt R
AtA (1-RAt)J2 by use of the partial derivations evaluated
" "near zero. Output is in the von Bertalanffy form, where L ...11 and K logeR. The outputgives values of the expected length using equation (1) evaluated at an initial length and timelapse selected by the user. The user enters one initial length and a time'lapse. The program
computes the final lengths. The triples are punched on cards, with one triple per card. No
provisions are made for frequency distributions or weighting fectois. The program will handle
up to 5,000 triples. Author - Patrick K. Tomlinson.
Christopher T. Psaropulos Available'from originator only
Inter-American. Tropical Tuna CommissionSouthwest Fisheries Center A
Post Office Boii 271
La Jolla, ,CA. 92037 Telephone (714) 453-2820, ext. 310 or 253
N.
Estimation of Linear Growth and von Language - FORTRANBertalanffy Growth Equation from Tag Data - Hardware,- Burroughs 6700
TCPC5
This program is used to -estimate the rate of linear growth per unit time and the parameters L.
:!!knand K of the von Bertalanffy growth equation from data on t lengths at. release and at recap-
ture, anp the times at liberty for twoo,or mole tagged fish. own bias(es) in the lengthsatrelease Or fish of one or two groups can be corrected by use of the constants a and b in theequation y a+bx, where x is the uncorrected length and y is the corrected length. Before es-g
timatineL. and K by the method of progrim TCPC4, the program calculates the mean rate of lin-ear growth per time interval and its standard deviation. If option 1 is specified,-the datafor.any fish which grew at rates which differ by three or more standard deviations from the
mean rate are eliminated; if lion 2"is specified, np data are eliminated. Author - Patrick .
K., Tomlinson; modified by Jo Levatini
# Christopher T. Psaropulos.
Available from. originator only
Inter-American ,Tupital Tuna Commission--: BouthWast FishdiTaq Center °
..=Post Office Box 271,-.
La Jolla, CA 92037 /Telephone (714) 45!Q- 2820,, ext. 310 or 253
Fishing P4Wer Estimation Language 'FORTRAN
TCPD1 Hadware,- Burroughs 6700
r-
Estimates_the fishing power of individual vessels or class relative to a standard vessel or
tt '10
61 .

class and the densities of fish by time -area strata relative to a standard time-area stratum.,Program fitst estimates log fishing powers, using the method described by Robson (1966). Thenthe estimates are converted from log relative fishing power and log density to the originalscales, employi a bias-correcting factor given in Laurent (1963). The program handles up to2000 catch obsery ons frouf.a combined total of not more than 200 distinct boats and time-areastrata; it arbitrarily' selects the lowest numbered boat as the standard vessel and the lowestnumbered area-data in which the standard vessel fished as the standard time-area strata. "Log-normal distribution and the translation method: dedcription and estimation problems" by Andre °
G.'Laurent, Jour.Amer.Stat.Assn. 58(301):231-235, 1963. "Estimation of the relative-fishingpower of individual ships," by D.S. Robson, Res.Bull.Inter.Comm.NW.Atlantic.Fish. (3):5-14,1966, Author - Catherine L. Berude. .
' Christopher T. Psaropulos Available from originator only- ' Inter-American Tropical Tuna Commission .
Southwest Fisheries Center.Post Office Box 271
: La Jolla, CA 92037
Survival Rate EstimationTCPE1 ,
Telephone .(714) 453-2820, ext. 310 or 253
Language - FORTRANHardware - Burroughs 6700
Estimates a survival rate from the age composition of a sample. Computes a numberof statisti-cal measures associated, with a vector of catch number No, N1, ..., NI where NJ = number of fishcaught of (coded) age "j." Four options are available:
Option:1 assumes that (a) recruitment antered in catch vector; (b) all ages in c
1 ages are known for all fish in catch ve
annual survival are constant for all age groups en-tch vector are fully available to sampling gear; (c)or. Computes estimate of survival rate, variance ot
survival rate, standard error of survival rate, 95% confidence inteal for survival rate, in-stantaneous mortality rate, variaApe of instantaneous mortality rate, standard error of Z (to-
: tal. 'mortality), 95% confidence ifterval for Z, and Z interval obtained from S interval.
Option 2 tests the hypothesis that the relative frequency in the 0-age group as compared to theolder ages does not deviate significantly from the expected frequency under option 1 assump-tions and computes a chi-square statistic associated with the difference between the best es-timate and Heinke's estimate. If this stistic exceeds CHI (a chi - square value for desiredconfidence level) the catch numbers are recorded as follows: N1---> No; N2 - - -> Ni; N3--->N2; ... ;N/=-> N1_1 and the above computations. are made for the new vector N0,...Ni_1.; Thistest is repeated until the statistics are less than CHI, a theoretical chi-square 4value withone degree of freedom which specifies the significance level of the test. CHI ie'entered on acontrol card. If'the statistic is less thafi CHI, the ,output is the same as in option 1.
Option 3 is to be used whenassumptions (a) an.age fish whose coded age is greater than "frequencies are not reliable for fish
d of option 1 hold but it is not possible totion 3 assumes that the recorded relative
ages K+1, K+2 ..... I in the vector of catch numbers; itsums the catch for ages K+1 to I and computes the same output as in option 1 using the catchvector N0, N1,...,Ng, m where m= Ng+1+.4N1.
Option 4 permits the user to subdivide the catch curve Into a number'of segments. The assump-tions listed under option 1 may be satisfied for the consecutive age.groups in one segment butnot for age, groups in different segments of a catch curve. because segmentation of a catchcurve may be exploratory, fhe program allow6 the use of pverlapping segments, i.e., one agegroup may appear in more than one segbient. option 4 computes the same output as option 1.
"The analysis of a catch .CUrve," by D.C. Chapman and D.S. Robson, Biometrics 16:354-368,e...,1960. "Catch curves and mortality rates," by D.S. Robson and D.G. Chapman, Trans.Am.Fish.Soc. 90:1810189, 1961. Author.- Lawrence E. Gales.
Christopher T. Psaropulos', . Available from originator onlyIntdr-American Tropical Tuna Commissiontouthwest Fisheries CenterPost Office Box 271La Jolla, ,CA 92037 ) Telephone (719..453-2820, ext. 310 or 253
62
72

,.. .
' Fishing Mortalities Estimation Language - 'FORTRANTCpE2 t Hardware - Burroughs 6700
\ *e-,
the method of Murphy (1965) and Tomlinson (1974 tb estimate the population (P),of a co-((( :.;T of fish at the beginning of each of several consecutive time intervals (i) and the coeffi-
cients of catchability (q) and of fishing mortality (F) for each interval' when the catches (C),effort (f), and the coefficients of natural //immortality (M) for each interval and F for ejther
e
the first or last interval are known. When estimates of F and M are not avails
l, various
trial values can be used to obtain estimates which appear to be reasonable. "A olution of thecatch equation, "by G.I. Murphy, J.Fish.Res.Bd.Can. 22(1):191-202, 1965. "A, generali-
zation of the Murphy catch equation,y by P.K. Tomlinson, J.Fish.Res.Bd.CanD 27(4):82t-825, 1970. Adthor - Patrick K. Tomlinson; modified by Jo Anne Levatin.
Christopher T. Psaropulos Available from originator onlyInter-American Tropical Tuna CommissionSouthwest Fisheries CenterPost Office Box 271 '
La Jolla,, CA 92037
Relative Yield per Recruit at VariousFishing Intensities
TCPF1
Telephone (714) 453-1%820, ext. $10 or 253
Language - FORTRANHardware - Burroughs 6700
Calculates the relative yield in weight per recruit at various fishing intensities by themethod of Beverton (1963: Formula 1)). With option 1, the program calculates the ratios of theyields per recruit at selected values of E (F/(F+M)) to the yield per recruit at E 1. Mis the coefficient of natural mortality; F is ,the coefficient of fishing mortality. With op-tion 2, it calculates the relative yield per recruit at selected levels of F. Limitations: Nomore than ten values of M, nor more than ippo values of E or F, can be used for a single probl-lem; in option 1, M cannot equal O. "Maturation, growth and mortality of clupeid and engraulidstocks in relation to fishing," by,R.J.H. Beverton, Rapp.Proc.-Verb. 154:44-67, 1963. Author -Christopher T. Psaropulos. .
S
Christopher T. Psaropulos Available 406M originator onlyInter-American Tropical Tuna-CommissionSouthwest Fisheries CenterPost Office Box 271La Jolla, CA 92037 Telephone (714) 453-7820,.ext.,310 or 253
Yield Curves with Constant Rates Language - FORTRANTCPF2 Hardware - Burroughs 6700
Using the incomplete beta - function, evaluates the Bevettqn and Holt yield equation and producesan array of coordinates for plotting yield isopleths. "Allometric growth and the Beverton and
22 Holt yield equations".by G.Z. Paulik and,L.E. Gales, Amer.Fish.Soc., Trans. 93(4):-369-381,1964. Author.- Lawrence E. Gales.
Christopher T. Psaropulos Available from originator onlyInter -AmericanZropical Tung CommissionSouthwest Fisheries Center,Post Office Box 271,La Jolla, CA 92037 Telephone (714) 453-2820, ext. 310 ai 253
Eumetric YieldTCPF3
Language - FORTRANHardware - Burroughs t700
Usgs Beverton and Holes ,(1957: 36:4.4) equation to compute the population in numbers, the bio-mass, the yield in numbers, anSI the yield in Obight theoretically obtainable from one recruitwith various combinations of growth, mortality, and age of entry into the fishery. "On the,
*3'
63
7 3 o

,
dynamics of exploited fish populations," by R.J.H. Beveeton and.S.J. Holt, Fish.Inves., Minis.Agr.Fish.Food, Ser.2, 19:533 p., 1957. Author - Lawrence E. Gales; modified by Christopher T.
Psaropulos.
Christopher T. Psaropulos Availab'l'e from originator only
Inter-American Tropical Tuna Commission`Southwest Fisheries ,CenterPost Office Box 271La Jolla, CA 92037
Piecewise Integtation of Yield CurvesTCPF4
Telephone (714) 453-2820, ext. 310 dr 253a
Langdage - FORTRANHardware - Burroughs 6700
Computes an approxim-ate yield isopleth for a given number of recruits to a fishery when bOthgrowth and natural mortality are estimated empirically. The calculations are carried out usinga modified form of Ricker'S method for estimating equilibrium yield. The program is extremelygeneral in that growth, natural mortality and fishing mortality rates need not be measured us-ing the same tithe intervals. Fishing mortality rates can be agespecific (up to 400 differentrates can be applied during the life of the fish) but the oven-all level of fishing mortalitycan be varied by means of multipliers which apply to all of the individual age specific rates.The range and the intervals between ages at first capture can also be varied,by the user.
The program has two approximation options: (1) an exponential mode which assumes that the bio-mass of the stock changes in a'Strictly exponential manner,duripg any interval when growth,natural mortality, and fishing rates are all constant (Ricker, 1958: Equation 10.4); (2) anarithmetic node which uses the arithmetic mean of the stock biomass at the start and at the endof any interval during which all three rates are constant as an estimate6of.the average biomasspresent during the interval (Ricker, 1958: Equation 10.3).
d
The program will compute and print out at specified times the biomass of the stock when onlynatural mortality and growth are present. This biomass vector is useful for determining theoptimum,harvest times for stocks that may be completely harvested at one time. "A generalizedcomputer program for the Ricker model of equilibrium yield per recruitment," by G.J. Paulik andW.F. Bayliff, J.Fish.Res.Bd.Canada 24:249-252, 1967. "Handbook of computations for biologicalStatistics of fish populations," by W.E. Ricker, Fish.Res.Bd.CanadaBull. (119):300 pp. Au-thor - Lawrence E. Gales.
1
Christopher T. Psaropulos \'t Available fev originato only
Inter-American Tropical Tuna CommissionSouthwest Fisheries CenterPost Office Box 271La Jolla, CA 92037 &Telephone (714) 453-2820, ext. 310 or 253
Piecewise Integration of Yield Curves WhenAge is Unknown
TCPF5
Language - FORTRANHardware - Burroughs 6700'
Performs piecewise integration of yield curves when age Is unknown. Different mortality rates
glimay be associated with intervals in the lifespan and growth is calculated as a nction of
length from a transformed von Bertalanffy grpt4th curve. Yiqld isopleths are een as functionsof length-at-entry and fishing mortality. Note that program TCPC4 provides von Bertalanffygrowth parameters from unaged fish which Can be used with this program. The amount of growtha fish will put on during'at interval of time is a function of the size at the beginning of theinterval, not age. Similarly, survival is usually given as a function of time elapsed, notage. Therefore, growth during anlImierval and survival during the interval can be'combined toproduce yield, even though age is unknown. Author - Patrick K. Tomlinson.'
Christopher T. Psaropulos Available from originator onlyInter-American Tropical Tuna CommissionSou hwest Fisheries/CenterP. Afffce Box 271_
qLa . , CA 92037
rt
Telephone (714) 453-2820, ext. 310 or 253
64.
ti

Constants in Schaefer's ModelTCPF6,
Language - FORTRANHardware - Burroughs 6700
Uses three simultaneous equations to solve for the constants, a, M, and k2, in Schaefer's
(1957) model for determining the status of a stock of fish in regard to fishing. Schaefer
(1957) used an iterative procedure to evaluate these constants, but in another publication(Schaefer and Beverton, 1963), it was indicated that evaluation of the constants by the solu-
tion of three simultaneous equations would be acceptable. "A study of the dynamics of the
fishery for yellow-fin tuna in the eastern tropical PacificOcean" by M.B. Schaefer, Bull.,In-.ter-Amer.Trop.TUna Comm. 2(6):245-285, 1957. "Fishery dynamics - their analysis and interpre-
tation," by M.B. Schaefer and R.J.H. Beverton, pp. 464-483 in, M.N. Hill, The Sea, Vol. 2, In-
terstence Publishers, New York, 1963. Author - Christopher T. Psaropulos.
Christopher T. Psaropulos Available from originator only.
Inter-American Tropical Tuna CommissionSouthwest Fisheries CenterPost Office Box 271 .
La Jolla, CA 92037 Telephone <714) 453-2826; ext. 310 or 253.
4
Schaefer Logistics Model of Fish P uctipn Language - FORTRAN
TCPF7 Hardware - Burroughs 6700
Pel an .. linson (1969) discussed a generalization of Schaefer's (1954) lOgistic model to
explain anges in catch as related to effort upon a given population and they presented a'com-
puter p .gram useful in estimating the parameters of the model when observed catch-effort data
are.av liable. However, in their scheme, it is necessary to use numerical methods for approx-
imaiing the expected catch. Also, the user is required to provide guesses of the parameters
and limits to control searching. In general, this program TCPF7 uses the same procedure for
estimating the parameters as that described in Pella and Tomlinson. Exceptions: The user only
needs to supply catch, observed effort, and elapsed time for each of n time intervals; the pro-
gram will make the guesses and set the values used in the search. "A generalized stock produc-
tion model," by J.J. Pella and P.K. Tomlinson, Inter-Amer.Trop.Tuna Comm., Bull. 13(3):421-
496, 1969. "Some aspects of the dyhamics of populations important to the management of the
commercial marine fisheries," by M.B. Schaefer, Inter-Amer.Trop.Tuna Comm., Bull. 1(2):25-56.
Author - Patrick K. Tomlinson.
Christopher, T. Psaropulos Available from originator only.
Inter-American Tropical Tuna CommissionSouthwest Fisheries CenterPost Office Box 271La Jolla, CA 92037
Fits Generalized Stock Production Model
ftPF8
Telephone (714) 453-2820, ext. 310 or 253
Language - FORTRANHardware - Burroughs 670
Fits the generalized stock production model described by Pella and Tomlinson (1969) to catch
and effort data. This model estimates equilibrium yield as a function of effort or population
size. The production curve is allowed to .be skewed. "A generalized. stock model," ,
by Jerome J. Pella and Patrick K. Tomlinson, Inter-Amer.Trop.Tuna Comm., Bull. 13(3):419-496.
Aut4dis - Pella and Tomlinson; modified by Catherine L. Berude.
Christopher T. Psaropulos Available from originator only
Inter-American Tropical Tuna CommissionSouthwest Fisheries CenterPost Office Box 271La Jolla, CA 92037
4
Telephone (714) 453 -2820, ext. 310Dor 253
,..
Biometry - Linear Regression Analysis Language,- FORTRAN
TCSA1 .'Hardware 7Burroughs 6700
'"--. . -
I65
,k

Performs an analysis of regression with one or more Y-vhlues corresponding to each X-value.Abe_Model I Regression is based on the following assumptions: (a) that the independent varia-ble X is measured without error, where the X's are "fixed"; (b) that the expected value for the;variable Y for any given value X is described by the linear function py = a+BX; (c) that forany given value of X the Y's are independently and normally distributed. Y = a+6X+c, 'wherec is assumed to be normally distributed error term with a mean of zero; (d) that the samplesalong the regression line have a common variance, a2, constant and independent of the magnitudeof X or Y. In Model II Regression, the independent variable and the dependent variable areboth subject to error. Biometry, by Robert R. Sakai and F. James Rohlf, W.H. Freeman and Cbm-pany, San Francisco, 1969. Modified by Walter Ritter O.
Christopher T. Psaropulos Available from originator onlyInter-Ameridan Tropical Tuna CommissionSouthwest Fisheries CenterPost Office Box 271La Jolla, CA 92037 Telephone (714) 453-2820, ext. 310 or 253
--Generalized Weighted-Linear Regression Langu a FORTRANfor Two Variables, TCSA2 Hardware Burroughs 6700
4>
Computes the regression line Yi = 1)0 + bixi where the'Yi may have different weights. The usermay transform the data by any of three transformations, natural logarithms of X, Y, and/or W(weight), common logarithmsof X, Y, and/or W, and/er powers of X, Y, and/or W. The two vari=ablea and the weights may be transformed independently. The pwram normalizes the weights (orthe transformation of the Weights) 141. dividling each weight by the mean weight. Producesprinter plots of the data and deviations. Author - Lawrence E. Gales; modified by Patrick E.'Tomlinson and Christopher T. Psaropulos.
Christopher T. Psaropulos Available from' originator onlyInter-American Tropical Tuna CommissionSouthwest Fisheries Center 4Post OffiCe Box 271La Jolla, CA 92037 Telephone *(714) 453-2820,,ext. 3l0 or 253
Linear Regression, Both Vaiiables Subject Language - FORTRANto Error, TCSA3 Hardware - Burroughs 6700
Computes a regression in which both the dependent aria the independent variable are subject toerror. There are several msthods for obtaining solution to the equation in a Model II case,depending upon one's knowledge of the error variances or their ratios. Since thie situationis not tog likely to arise in the biological sciences, the authors adapted a relatively simpleapproach in which no knowledge of these variances" is assumed -- the Bartlett's three-groupmethod: This method does not yield a conventional least squares regression line and consAlleptly special techniques must be used for significance testing (Sokol and Rohlf, 1969). Theuser may transform the data by any of three transformations: natural logarithms of X and/or Y;common logarithms of X and/or Y; powers of X and/or Y. The program producey printer,plofs ofthe data and deriviations. Biometry, by Robert R. Sokol and F. James Rohn'', W.H. Freeman andCompany, San Francisco., 1969. Author - Walter Ritter 671"odified by Christopher T. Psaropulos.
Christopher T. Psaropulos -Available from originator only 9
Inter-American Tropical Tuna Commission,Southwest Fisheries Center
tst Boi3I iiOr 2gi Telephone (714) 453-2820, ext. 310 or 253
Biometry - Product-Moment CorreAtion Language - FORTRANCoefficient, TCSB1 Hardware Burroughs 6700
Computes the Pearson product - moment, correlation coefficient for a, pair of variables and its
66
76.

confidence limits. In addition, the program computes and prints the means, standard devia-tions, standard errors, and covariances for the variable, as well as the equation of the prin--
cipal and minor axes. The confidence limits for the slops of the principal axis are also com-
puted and the coordinates of eight points are given for plbtting confidence ellipses for bivar-
iate means. Biometry, by Robert R. and F. James Rohlf, W.H. Freeman and Company, San Francisco,
1969.
Christopher T. PsaropulosInter-American Tropical Tuna
. Southwest Fisheries CenterPost Office Box 271La Jolla, CA 92037
Available from originator only
Commission
Telephone (710\453-2820, ext. 310 or 53
Cooley-Lonnes MultiplerR ression Analysis Language - FORTRAN .
TCSB2 Hardware - Burroughs. 6700
Computes a multiple-regression analysis foi a single criterion and a maximum of 49 predictor
variables. The Gauss-Jordan method is used in the solution of the normal equations. There
is no restriction in the number of subjects for which score vectors may be presented. Out-
put: Basic accumulations, means, standard. deviations, dispersion matrix, and correlation
matrix are printed and punched as required. Additional printed output, appropriately la-
beled, includes: The mul ple-correlation coefficient; the F test criterion for multiple
with its degrees of freed6m, the beta weights; the squared beta weights; the B weights; and
the intercept constant. Additional punched output includes: The beta weights; the B
weights, and the intercept constant. Multivariate Procedures for Behavorial Sciences, by
William W. Cooley and Paul R. Lonnes, John Wiley and Sorts, Inc., New York. Modified by Wol-f
teF Ritter 0.
Christopher T. Psaropulos Available from originator only
Inter-American Tropical Tuna CommissionSouthwest Fisheries CenterPost Office Box'271La Jolla, CA 92037 Telephone 1714) 453-2420, ext. 310,or 253
Biometry - Goodness of Fit to Discrete Language - FORTRAN
Frequency Distributioh,,TCSC1 , ' Hardware - Burroughs 6700
Provides several options for the following operations: (1) Computes a binomial or Poisson dis-
tribution with specified parameters; (2) computes the deviations of an observed frequency dis-tribution from a binomial or Poisson distribution of specified parameters or based on appropri-
ate parameters estimated from the observed data; AG-test for goodness of fit is carried out;(3) A aeries of up to 10 observed frequency distributions may be read in and individuallytested for goodness of fit to a specific distribution, followed by a test of homogeneity of the
series of observed distributions; (4) A specified expected frequency distribution (other thanbinomial or Poisson) may be read in and used as the expected distributions; this may be entered
1in the form of relative frequ cies or simply as ratios; the maximum number of classes fof all
cases is thirty; in the case o binomial and Poisson, the class marks cannot exceed 29. Biome-
La, by Robert R. Sokol and F. JamesRohlY, W.H. Freeman and Company, San Francisco, 1969.
'Modified by Walter Ritty 0.
Christopher T. PsaropulosInter-American Tropical Tuna Commission
Southwest Fisheries CenterPost Office Box 271La Jolla, CA 92037 ,
Available from or ginator only
Telephone (714) 453-2820, ext. 310 Or 25
Biometry - Basic Statistic for Dngrouped Data Canguage FORTRAi
TCSC2 Hardware Butroughs MOO
67
7.7

r-f
Reads in samples of upgrouped continuous or meristiC variates, then ranks and optimally.....
performs transformations on these data. Output Consists of a table of the various statistics
4\computed: mean, median, variance, stands d deviation, coefficient of variation, gl, g2, andthe Kalmogorov Smirnov statistic Amax res ling from a comparison of,,the observed sample with anormal distribution based on the ..sample mean ,and variance; these are,followed by their standard
A+ errors and 100 (1 - a)% confidence intervals/where applicable. Biometry, by Robert R. Sokaland F. James Rohlf, W.H. Freeman and Company, San Fr'ancisco, 1969. Modified by Walter Ritter O.
,
Christopher T. Psaropulos Available from originator only.Inter-American Tropical Tuna CommissionSouthwest Fisheries CenterPost9ffice Box 271La yalla,'CA 92037 Telephone (714) 453-2820, ext. 310 or 253
7Biometry - Basic Statistic for Data Grouped Language - FORTRANinto a Frequency Distribution, TCSC3 Hardware - Burroughs 611r\O
Similar to TCSC2, but intended for data grouped into a frequency distribution.
Christopher T. Psaropulos Available from originator onlyInter-American Tropical Tuna CommissionSouthwest fisheries CenterPost Office Box 271La Jolla, CA. 92037 Telephone (714) 453-2820, ext. 310 or 253
lir1 7Biometry Single Classification and Nested Language - FORTAN-Anova, TeSD1 -Hardware - Burroughs 6700
4
Performs either a single classification or a k-leyel nested analysis of variance following thetechniques preserited in Sokal and Rohlf (1969): The basic anova table as well as the variancecomponents are computed. The program allows for unequal sample sizes at any level. The inputparameters are reproduced in the output, followed by a standard anova table giving SS, df, MS,and Fs. For nested anovas with unequal sample sizes, synthetic mean squares and their approxi-mate degrees of freedom (using Satterthwaite;sapproximatiop) are given below each MS and df.lEach Fs is the, result of dividing the MS on by the synthetic MS from thetlevel aboveit. When sample sizes are egVal, the synthetic mean squares and, their degrees of freedom arethe same as-their 'ordinary counterparts, but are printed out nevertheless by the progrdm. flo
pooling is performed. The anova table is followed by a list of the estimated variancecompo-nents exprepsed 'both in the Original units and as percentages; these in turn are followed by atable of the coefficients of the expected mea squares. Biometry, by Robert R. Sokal and F.James Rohlf, W. . Freeman and Company, San Fra b$sco, 1969. Modified by Walter Ritter O.
Chltistopher T. Psaropulos
Inter-Amrican Tropical Tuna CommissioSouthwest Fisheries CenterPost Office Box 271La Jolla, CA 92037
vailable .from originator only
hoPe (714) 453-2820, ext. 310 or 25;
4
Biometry - Factorial Anova Language - FORTRANTCS1:12 # Hardware - BurrOughs 6700
Reads in:data for a complete factorial analysis of variance with no replications. Using thetechnique described in Sokal and Rohlf (1969, Section, 12,.5), it is possible to use this programfor single classification anova with equal sample sizes, multi-way analydis of variance withequal replications, and other completely balanced designs. Produces the standard anova tableold provides as well an optional output of a table of deviations for all possible one-, two-,three-, four-way (and more) tables. The output is especially useful as.input to various pro-grams for testing differences among means and can be inspected for homogeneity of interactionterms. Biometry, by Robert R. Sokal and F. James Rohlf, W.H. Freeman and Company, SarrFran-cisco, 1969. Modified by Walter Ritter 0.
68 .
t
'78
1/4

Christopher T. Psaropulos Available from originator only
Inter-American Tropical Tuna Commission a
Southwest,Fiaheries CenterPost Office Box 271La Jalla,CA 92037 Telephone (714) 453-2820, ext. 310 or 253
rBiometry - Sum of Squares s7p Language - FORTRAN
TCSD3 Hardware - Bilrroughs 6700
Tests the homogeneity of all subsets of means in anova, using the sums of squares simultaneous
test procedure of Sokal and Rohlf (1969, Section 9.7). Biometry, by Robert R. Sokal and F.
James Rohlf, Wail Freeman and Company, San Francisco, 1969. Modified by Walter Ritter 0.
Christopher T. Psaropulos Available from originator only
Inter-American Tropical Tuna Commission
Southwest Fisheries CenterPost Office Box 271La Jolla, CA 92037 Telep one (714) 453-2820, ext. 310 or 253
Biamety - Student-Newman-Keuls TestTCSD4
PerfoampleBiometModifie
Language - FORTRANHardware - Burroughs 6700
a Student-Newman-Keuls,a posteriori multiple range test. The SNK procedure is an ex-
a stepwise method using the range as the statistic to measure differences Among means.
, by Robert R. Sokal and F. James Rohlf, W.H. Freeman and Company, San Francisco, 1969.
by Walter Ritter O.
6hristopher T. Psarop os Available from originator only
Inter-American Tropic Tuna CommissionSouthwest Fisheries Ce terPost Office Box 271La Jolla, CA 92037 Telephone (7Y4) 453-2820, ext. 310 or 253
Biometry - Test of Homogeneity of Variances Language - FORTRAN
TSCE1 Hardware - Burroughs 6700
Performs garXlett's test of homogeneity of variances and the Fmax test. Biometry, by Robert R.
Sokal and F. James Rohlf, W.H. Freeman and Company, San Francisco, 1969. Modified by Walter
Ritter 0.
Christopher T. Psaropulos tAmailable from originator only
Inter-American Tropical Tuna CommissionSouthwest Fisheries CenterPost Office Box 271La Jolla, CA 92037 Telephone (714) 453-2820, ext. 310 or 253
71t
Biometry - Test of Equality of Means with Language - FORTRAN
16 Heterogeneous Variances,TTCSE2 HardwAre - Burroughs 6700
Performs an approximate test of the equality of means when the variances are assumed to be het-
erogenous. The methpd differs from an ordinary single classification anova in that the means
are weighted according to the reciprocal of the variance of,the sample from which they were
taken, and a special error MS must be used to take the weighting into account. The input pa-
rameters are reproduced in the output along with a listing of the means and variances for each
sample. These are followed by the sample variance ratio F; and the degrees of freedom re-
quired for looking up the critical F-value. Biometry, by Robert R. Sokal and F: James Rohlf,
W.H. Freeman and Company, San Francisco, 1969. Modified by Walter Ritter 0.
69
79
a

Christopher T. Psaropulos Available from originator onlInter-American Tropical Tuna CommissionsSodthwest Fisheries CenterPost ,Office Box 271
,La Jolla, CA 92037 Telephone(714) 453-2820, ext. 310 or 253
Biometry--"Tukey's Test for Nonadditivity Lang ge - FORTRANTCSE3 6 . 0 Hardwa - Burroughs 670Q .
.. . -
,
Performs Tukey's test for nonadditivity to ascertai ejher the interaction found in a given '
set of data could be explained in terms of multiplic ti e main effects. This test is also use-ful when testing for nonadditivity in a two-way Mode I anova without replication in experi-ments where it is reasonable to assume that interactio , if present at all, could only be dueto multiplicative main effects. It partitions the inte action sum of squares into one degreeof freedom due, to multiplicative effects of the maim effe is on a residual sum of squares torepresent the other possible interactions or to serve as e ror in case the anova as no repeation. Biometry, by,Robert R. Sokal and F. James Rohlf, .H. Freeman and Company, an-cisco, 1969. Modified by Walter Ritter O. N. NN .
ti _Christopher_I,-Psaropulos Available froInter-American Tropical Tuna CommissionSouthwest Fisheries CenterPost Office Box 271La Jolla, CA 92037
Biometry - Kruskal-Wallis TestTSCE4,
iginator
Telephone (714) 453-2820, exo. 310 or 253 '.e.
Language - FORTRANHardware - Burroughs 6700
The Kruskal-Wallis test is a non-parametric method of single classification anova. It iscalled non - parametric because their null hypothesis is not concerned with specific parameters(such as the mean in analysis of variance) but only with distribution of the variates. This isbased on the idea of "ranking" the variates in an example after pooling all groups and consider-ing them as a single sample for purposes of ranking. This program performs the Kruskal-Wallistest for equality in the "location" of several samples. The input parameters' and sample sizesare reproduced in the output, followed by the Kruskal-Wallis Statistic H (adjusted, if neces-sari), which is to be compared with a chi-square distribution for degrees of freedom equal toa-1. Biometry, by Robert R. Sokal and F. James Rohlf, W.H. Freeman and Company, San Francisco,1969. Modified by Walter Ritter O.
Christopher T. Psaropulos Available from originator onlyInter-American Tropical Tuna C ommissionSouthwest Fisheries CenterPost Office Box 271La Jolla, CA 92037 Telephone, (714) 453-2820, ext. 310 or 253
, *
Biometry - Fisher's Exact Test,TCSES
Language -L FORTRAN
Hardware - Burroughs 6700
PerforMs Fisher's exact test for independence in a 2 x 2 contingency table. The computation isbased on the hypergeometric distribution with four classes. These probabilities are computedassuming that the row and.column classifications are independent (the null hypothpais) and thatthe row and column totals are fixed. Biometry, by Robert R. Sokal and F. James Rohlf, W.H.Freeman and Company, San Francisco, 1969. Modified by Walter Ritter O.
Christopher T. Psaropulos Available frdM originator onlyInter-American Tropical Tuna CoMMissionSouthwest Fisheries CenterPost Office Box 271La Jolla, CA 92037 Te ephone (714) 453-2B20, ext. 310 or 253
70
80

4
Biometry - R x GiTest of Independence in Language - FORTRAN -°
Contingency" Tebies, TCgE6 Hardware - Burrou00-6400
Performs a test of independence in an R x C contingency tatke by means of the G test. Option-
ally it carries out an a posteriori test of all subsets of rows and columns in the R x C con-4tingency table by the simultaneous test procedure. Biometry by Robert R. Sokal and F. James
Rohlf, W.H. Freeman and Company, San Francisco, 1969. Modified by Walter Ritter O.A
a
Christopher T. Psaropulos Available from originator only
Inter=American Tropical Tuna Commission
Southwest Fisheries Center,Post Office Box 271La Jolla, CA 92037 Telephone (714) 453-2820, ext. 310 or 253
7
I.
A
I
.0
a
A
71
81a
a'
C-
a
4..

POLLUTION
'Monte Carlo Spill Tracker Language - PL/1 OptimizerHardware -IBM 370-168/216 K bytes (characters)
"N1,)Piovides insight on likely oil spill trajectories in a given region by season, using MonteCarlo sampling of Markov wind model at one- or three-hourly intervals; spill movement assumedto be linear combination of momentary wind and current vectors. Input: Map of area, outputfiles from analysis of TDF-14 data, current hypothesis, postulated spill launch Points. Out- '
put: Estimates of the likelihood of spill reaching various areas; estimates of the statisticsof the time tojeach such areas. See publigations mlysc 74-20, "Priffiary, Physical,Impacts ofOffshore Petroleum Developments," by Stewart and DevarAry, MIT Sea Grant Project Office,,April=/974. e
4
J.W. Devanney III Available froM originator. onlyMassachusetts Id'atitute of TechnologyRoom 5-207 it/ '
Cambridge, MA 02139 Tele ne (617) 253-5941
Thermal Pollution Model Language - FORTRAN IVHardware - CDC 6500/CDC 1604/20K 160 bit words
Simulates the dispersion of heat from a source. Output is a,printout of current an eatfields.
,
Kevin M. Rabe
tivironrnent,aL PredictionResearch Facility
Naval Postgraduate SchoolMonterey, CA 93940
Available from originator only
Telephone (408) .4
Substance Advection/Niffusion Routine Language - FORTRAN.
Hardware - CDC 6500 \. 04.. .., ,.. .
Simdlates the advection and diffusion of pollutants. The program uses alLagrangian aproachwith a Fiak4an diffusion equation. ;pout: Current data, pollutant release location, concept-tratioeand time of release. Output: Pollutant spread fields. EPRF Tech. Note,1-74, "A Ver-tically Integrated Hydrodynamical-Numerical Moddl."
,Taivo LaevastuEnvironmental Prediction
Research FacilityNaval Postgraduate SchoolMonterey, CA 93940
Available from originator' only
Telephone (408) 646-2937
.110
r
Danish Advection Program Language .1. FORTRANft Hardware - CDC 3100/tDC-6500 J
k ,_------- .
Computes advection of pollutants (or mass) in fluid in two,,dimensions. Input: Velocities_in X and Y,, Mass,andgrid spacing-in X and Y, a 1 fdr each grid point; t*step and total time
511..,___:% or advection. Output: initial'gridpointof fi ld advected and final-fieVa.after total advec-."s tion. Quasi-Lagrangian method used utilizin mass, center'of mass, and width of mass distri-;,
bution, all for each grid point. Storage uiredent is grid- size,dependent: for NX by NYgrid, (NX*NY*7) + (NX+1)*28'wo'ids,,,, "A M hod,for Numerical SolUtion of.the Advection Equa7tion," by L.B. Pederson and L.P. Pra m, Meteorological Institute, Denmark, Aug. 1973, 36 pp.
ab
72
4
82
dr . °
a
I
Talvo'LaevastuEnvironmental Predictions
Research FacilityNaval Postgraduate SchoolMonterey, CA 93940
Available from originator only
Telephone .(408) 646-2937
J,/ 9
Ecological Statistical Computer Programs Language - ANS FORTRAN! .
ECOSTAT .'Hardware .-4Iiiti 360/370** '
, .
The.systemwas developed as part of an extensive"stuOy undertaken by the_County SanitatiofiDis-
tricts of Los Angeles Ifid the Southern California Coastal Water Research Project to provide in'
sight into the ecological effects of ocean discharge of treated wastewasdrs. Biological and0
4 physical data for analysis were available from semi-annual benthl.c surveys on-the Palos Verdes .
Shelf.. Due to the nature of the analysis and the probability' that the system would be used by
other agencies, it was decided that thi programs would be made general and easily implemented
and used in other computing environments and sampling studies. The system differs from other.
statistics packages in that it allows the user to define a taxonomic structure on encountefed
species and employ the resultant' groupings in the calculation of diversity indices, T and F
statistics, linear correlation coefficients, one:way analysis of variance, dissimilarity coef-
ficients, and abiotic-biotic relationship tables. The user can also specify station groupings
to be used in computing statistics.. .
. ..
.
Output*: .(1) Summary information: (a) raw data, (b).spAlls distrubution, (c) dominant Spe-
ciee; (2) Univatiate statistics: (a) means, standard deviations by parameter for each station,
(b) community diversity (8 measures - Bfillouin's, Gleason's, Margalef's, Shanfion-Whaver's;
Spopson'ss, pealed Shannon-Weaver's, scaled Simpson's, scaled standard deviation), (c) T and F
statistics between regions by parameter, ( dissimilarity coefficient's bytaxon between re-
4 giofit,.between samples for each station, between surveys by region, (e) ANOVA tahlesamong.sur-4 .
veys by region; (3) Multivariate statistics: (a) linear correlation coefficients by region be- 4,
tween parametesA (4) Abiotic-biotic relationships: (a) means, standard deviations, ranges of
phylical paraMeteis for each partition df reiative2abundaice, (b) dominant species occurring at.
hphysical parameter class interval pairs.. . .
.
(*With the following IBM,extensions:Object-time,dimensions transmitted it COMMON, INTEGER*2,
END parameter in a READ, literal enclosed in apostrophes, mixed-mode eltpressions, NAMELIST,
T format code.) ,
o
. (* *For
0For allprogtams except BIOMASS, ABUNDANCE; and DIVERSITY, a direct access storage device is
..
required. Since all data Sets are aCcessedgeequentially a tape system 18 possible, however;
and with as few as three,drivqp all amilybegrwith,ithe exceptions of those betWean surveys may
be, accomplshed. The generation of Table VO "(ANQVkamdfig surveys) using five surveys, fpr ex-
.ample,,requires a minimum of ten file to be open simultaneously, and, unless there are tefi.
cape drives available, this would,be impossible without using disk storage.)' - ° .
c.
.
' ` "Ecological Statistical. Computer nograths, User Guide," by_Bruce Weinstein, Lsos Angeles County
1"4., SanitationNDistricts, August 1975.
I
, , et.
t
Data Processing f
- jechnical Services4Departmenb.,
Los Angeles'County Sanitat4on Districts
,P.
..
0.
..
.
.
*
''.----,-
,
"1955 Workman Mill.Rmat
Whittier, 90601 Telep"o4ne (213) 699-7511 . : .
.
I
.
, \ "4 n
00 Of
Available from originator onlyti
46 4r
83a
73 ' 4.
O
2
,o
A

CURRENTS AND TRANSFER PROCESSES
41Ft Bottle Statistics Language - PL/1 OptimizerHardware IBM 360-168/200K
I -
Used for-determination of spatial and temporal.conditions in drift bottle trajectories. Input:Standard NODC 80 character drift bottle records,.formatted according to NODC Pub...4-6 in ,eithercaloor,tape fofm. Bottle records must be roughly sorted by launch,point location to facili-tate identification of recoveries occurring from a common launch event. Output: Launch and
- recovery group size distributions; pairwise correlations in recovery location and date. Ile-
colfrery group size'vs. launch group size; Chi-square tests of independent trajectory, hypothe-°74 diir, etc. Brief discussion of result; for U.S. Atlantic Coast available in publication MITSG
74-20, "Primary, Physical Impadts of Offshore Petroleum Developments," by Stewart and Devanney,MIT Sea Grant Project Office, April 1974.
7
Robert J. Stewart Available frgM originator onlyMassachusetts Institute of Technology r
,
Room m207Cam ridge, MA 02139 Telephone (61}5.363-5941
Drift Bottle Plots Language- Pt/1Hardware 7. IBM 370.&168/SC4020 CRT
Plots launch and recovery locations of drift bottles. Input: Data files Areened-and format-till by CNDNSDTA. Output: CRT plots of launch and recovery positions. See publication MITSG94-20, "Primary, Physical Impact6 of Offshore Petroleum Developments," by Stewart and Devanney,MIT Sea Grant,
.Project Office, April 1974.
, . , 6*
'Robert J. Stewart ' . "'-' AvailAble from originator onlyMassachusetts Institute of Technology,
'Room 5-207 '
Cambridge, MA 92139 Telephone (617) 253-5941 .
:1
. It./, .
. \Reformat and Sort Drift Bottle Data Language -.: 0:1/1
.
/CNDNSDTA
-, Hardware / IBM 370-168/2§0K/Disk
"geformats)into condenthh record format (28 characters), screens for bo ttle configuration, andsorts by launch point,-filing into on-line (disk) storage. Input: Standard NODC 80 characterdrift bottle records_per NODC publicationA-6. Output: All drift bottles launched within "r"miles of "N" launch points are reformatted and filed' in "N" separate data file.
rr.
Robert J. Stewart Available from originator onlyMassachusetts Institute of Tech:071)3yRoom 5 -207
Cambridge, MA 02139 Telephone (617) 253-5943
t Current Profiles from Tilt Data Language.-.'Hardware -
.
. / .4 . ,-... 4
Calculates current profil'es generated from tilt-data obtairied from Niskin curr4ht array. Cur-rent magnitude and direction are computed at each sensor from tilt and azimuth data by means ofnumerical algorithms developed from-analysis of the three-dimensional cable equations. Input: .Physical parameters to be modeled. Outsut: Profiles can be generated at a given time.usingone method. Profiles can also be geneated ior'one-hour.incrementg from the avetaged datawhicr h have been curve fitted between sensor stations!
74
a_
8 4
.e
r

Gary T. Griilfin
Naval Underwater Systems, Center
New London, CT 06320
4 Current Meier Data
CREATE-'q
CURRENT.,CURRPLOT
4CREATE-C creates a disk file of raw data digitized from Braincon current metes film and con-
4 eisting of arc endpoints and angles;' listing also produced. CURRENT converts raw data to ur-
rent.speed, direction, etc.', according to particular calibration and gives basic statistics:
minimum and maximum speed, means, standard deviations, etc. Input: disk file from CREATE-C.
and a data card giving information about the data (e.g., format) and about the current meter
used (type, observation time, etc.). Output: Listing of *converted data and stet sties a .a
new disk file of converted data. -Using this data fide and a plot data card, 0 LOTiligrepares
a tape for the UCC Plotter to give plots of speed vs. time, direction vs. ticao', d progres-
' sive vector plot. Plots'are broken up into one-week units.
Available from originator only
Telephone (203), 442-0771
Language - FORTRANHardware. CDC 3300/Disk/UCC P1 tter
20K words20K words28K words
- .
.K. CrockerNaval Underwater Systems Center
Newport, RI 07840
Current. data
SPECTRUM
Available from originator only
Telephone (401) 841-3307
1
Language - FORTRANHardware - CDC 3300
°
g processea, data file from CURRENT and a preprocessing data card, givesautocorrelation
auto power spectrum for'current speed and velocity Componentswith ptl-eprocessing"options
filtering, condensing, etc. \-.-_,, t.
K. Crocker Available from originator'onfy
Naval Underwater SystemsCenter .
Newport, RI 02840 Telephone (401) 841-3307
1Optimized Multi -layerHN Model
:°. .
Language'- CDC FORTRAN EXTENDED . ,
/Hardware - CDC 7600 or 6500 w/CDC 3100/157K -'
octal (60 bit)'words on 7600 0$ 0
Compu tes surfacerdeviations and integrated current velocities bpsed on hydrodynamic equations;for small -scale coastal and operpocean areas for up to three seleceed layers. The finite dit-k,
ference Scheme propqsed by Hansen (1938) is-extended to multiple, layer cases Optimized fbra
ease in practical applicatihn and for computer computation. Intermediate data tape prepared
on pc 3100. EPRF Tech, Paper 15-74,,by R.A. Bauer.
.,,--
T. leevstu or A. Stroud Available from originator only
t invironmenta Prediction,
( *4'Research-Facildty ,
Naval Postgraduate School !
Monterey, CA 93940 'Tel' phone (408) 646-2937 . 0
\
Mean. Drift Routine '
-
Language - FORTRAN ° #
o Hardwate - CDC 6500/CDC 1604
Generalized routine to simulate the drift of an object, hven the Current structure, wind
fields,.and object leeway. NPKF Tech. Note 1-74, "A Vertically Integrated HyarodynamiCal-
14merical Model."
)84
75

I \
Taivo LaevastuEnvironmental Prediction
,Itesegrch Facility
Naval Postgraduate SchoolMonterey, CA 98940
:Search hng,Rescue PlanningNSAR
Available from originator nly
Telephone (408) 6 -2937
.
Language - FORTRAN Extended:Hardware - CDC 6500/54K words
Piovides an estimate'of an object's position in the wean at the 4dme a search is initiated.Computes drift as a resultant of two components. Ln all cases 100 percent of'the surface air-rent is applied. Wind effects are handled through a series of leeway codes options. InputFNWC surface wind and currentlfield analysis and prognosis; object starting time and position,_datum time, last known position, navigation error factors, leeway factors. Output: Datumpoints (laeitude, longitude) for each datum time. OPNAV INST 3130.5A, 7 Dec. 1972, FNWC Tech.Note 60, August 1970.
LCDR Gossner p Available from originator only-Fleet Numerical-Weather CentralMonterey, CA 93940 . Telephone (408) 646-2010
Current Meter Turbulence Language .' - FORTRAN
Hardware - IBA( 7074
r,Gives'an indication of turbulence in the ocean by computing measures of the deviations frommeans over various lengths ortime. ds No. 572-2. Author,- Robet R. Gleason. '
Data SystemfiCes. Available from originator only' U,S. Naval Oceanographic Office
Washington; DC 20373.
4
t
In-Situ Current
Telephone (301) 7,63-1449
.-s-
,,,
Ladgmage - ,FORTRAN VHardware UNIVAC 110B/1K
e.
worde/brum.l i 4 1 ?
AlConvera.ope-minute,averages of Interocean Type II current meter to staddardoectorial varues.Produces vectorial angle and velqcity for,elch data point and then combines vectorially toyield. a mean value for entire period. Input: Card imager; of data points taken from Ruftrak
average values, current speed and
.,
recorders., Output: 'Printout of vectorial and five-minutedirection in knots, anddegrees trues
Philip VinsonU.S..Navg1 Oceanographic OfficeWashington, DC 20373
40 ,
Wat r'Dilsplacement
,DI PLA
1,
/
Available from originator only
Telephone (202) 433-3878
a
Language - FORTRAN -'Hardware - UNIVAC 1108/1,200 36 bit words/
3 tape units
Computes wester displacement resulting from qcean current'direction values on tape produced by current ratter print'cumulative' displacements per selected unit timeor both-
4
,
2>e, A.
,
GOkald Wf1,1i4ms /
IT.5. Naval Oceanographic.
WashingtOn,,DC 2033 ,
A
Office
action Input: Current spe6d andprogram. Output:, Inaividual and
in nautical miles; tabular printout, tape,
Available from originator only
relepha-ne (202) 433-4187
76
c.
9
1

Current Meter Print Language - FORTRANHa ware - UNIVAC 1108/10K 36 bit words/Drum/
3 tapd units
Calculates ocean current speeds and directions from Geodyne A101optical current Meters. Val-
ues are converted to knots ,,d degrees and are vectorially averagoed,over one-minute data frames,
ten scans per frame.. Input: Cbsevcd current parameters from Meter converted from optical
film to magnetic rape; parameters ire-in arb rary.units dependent on meter design. Output:
Current speed and direction data; tabulat printout and tape. Tape output drives plotter pro-
gram.
Available from originator onlyGerald WilliamsU.S. Naval Ocwanographic OfficeWashington, DC 20373
.,.
.Current Meter Plot ti. Language,- FORTRAN' . .._..
v...,
Hardware -'UNIVAC'1108/9K 36 bit words73 tape.. .
A'at.
Wts/CalComp Plotter
7 , ,A .
1rProduces plOtter tatpe to plot ocean current speed and direction information. Program calls'
\ CalComp subroutines. Input: Current speed and direction data on, tape produced by Current Ma-
ter Print Program. Output: 'Histograms, polar, plots, and point plots: . '
.
0 gG .
. .
Gerald Williams4 'A
Telephone 202) 433-4187
,
4
I
Available from-originator only
U.S. Naval Oceanographic' Office .4
Washington, DC 20373 'Telephone (202) 433 -41$7 a
Conveit Current Meter Tape
MAGPACK'
'tangufge: FORTRAN VHardware T UNIVAC 1108/EXEC 8/Instructions 647
twords/Data 707 worddi2 tape units
Converts binary data on tape. from Geodyne MK ITS current meter .to BCD tape, formatted and
blocked for further proc ssing, with editea time, compass, vanetilt,and speedrotor.cotints.
Binary data decoded with FORTRAN field tunctions and output blocked and formatted with sub -
route NAVIO. Author - Peter J. Topoly. .
Data Systems Office Ailable from originator only
U.S. Naval Oceanographic OfficeWashington,.DC' 20373 . Telephone (301) 76371449 '
. _
4 ( h i . 15
Current Meter Data 'Language FORTRAN V 11' dti16
MPRINTO, , Hardware - UNIVAC 1108/ErEC.8/Inst4uctionsOs. .
.
2- tape units.
V. , . .,411,-'''
Computes frame a nd scan values of current meters (Geodyne A101.optical, and MK III magnettpr
calculates normalized unit vectors for vectorial speed, lists data, and, produces packed BCD
, tape. Input: BCD tape woth rotor counts of compads, vane, speed, and alt. Output:, 'ackdB
BCD 'tape of frame data and averaged frame data (pack rate and averaging rate Optional). .Au-
.thy - Peter J,lopoly:
. ..
Data Systems Office 4 . AvailableArdm originator only ,;.
U.S. Naval Oceanographic Office , /7
, N , Washington; DC 20373 Telepale (301Y 663-1449 L,
. ...,., 44'l
§ ." 3`.0 '
. .f.o.'
''),
-
.
,, Y
.
,
jCurrent Meter Clock Sequence Language FORTRAN4V Extended .'--
%,
ma 11, 'Hardware - XDS, Sigma 7/48K,Word's,,a02K byted),
-.--.-Jt 7, .0saar.
Verifies sequence of. crystal )flock count values from VACReotIdeodyne 850 =gent meters. Bdd .
0
To.
77
87 1-
.

clock values,are' j.dentified by use of differencing techniques. 'Input':
'CARP format. Output:' Statistics'of clock performance with catalog of erroneous values.Clock values on
John A. Maltais Available from originator onlyWoods Hole' Oceanographic' Institution
'Woods Hole, MA 02543
Current Meter Calibration.
CA$DEC
hone (617) 548-WO,' .
s
tape in
.
Language - FORTRAN IV, ExtendedHardware - XDS Sigma T/48K words (192K bytes)
Applies calibration parameters to raw VACM current meter data on tape in Cc* format.,fiesand removes,bad values, and stores the output on tape in standard buoy format.
John A. Maltais Avail§ble from originatogWoods Hole Oceanographic InstitutionWoods Hole, MA 02543 Telephone (617) 548-1400
- Current' Meter
'COP*o
Data Reduction and Editing
Transfers cur nc..mece
, track cofnputer compari
Mary HuntWoods Hole 'Oceanographic
J Hole MA 02543
Language
Hardware
only
identi-
- HP Assembly Language *
HP 2100/8K locations/Cassett6reader /Keyboard deyice
data, from IyACM cassette or Geodyne 850 cartridge magnetic tape to nine-e, tape -4,,difl,ags data cycles which have errors.
.,
r
Surface Current SummarySUFCUR
: et'
Ie,
,..ckailablefrom originator onlyt
InstitutiOn- ,
Produces a statistical sumtarysof surfaceaqUare, one-degree square, or five-degreeCOrdon.
oOcganographic Services-
National OceanographicNOAA/EDS '
Washington,,DC% 20235
% t
1/actor Time Series-
CUL_
CompuE's and p ots,statistics, histograms, tIMe-series, progressive vector diagram and spectrafoi time series'of turreXt meter data.' Inptit: ,Current meter tine series on tape in CDC 6400binary format; maximum number of dita'points isA326. Output: Listing and tape for off-lineAptear Perfect Daniel frequency window used Lo compute spectral estimatefrom FFT-generated
9
\--di
Branch.
Data Center
'`ctelePhone'ZbI7) 548,1400
. ,
Language i- Asembler-
Hardware -IBM 360-65
,
current observations for each Marsden ,(ten - degree)square and month for a given area. Author -0Jeffray,
t t
.4,
C
Copy on file,at NOD
Telephone% (202).634 -7439
Lasiguage = FORTRAN IV
Hardwarp,--cpc 64db (ScpPE'1.4)/115K.(octal)10-character wOrds/CalComp36/905 Plottinglystem
pdriodo ram values.
-James R. Holbttok.-.-Pacific Marine Envirohme a
Laborat. , NbAAFiftep Avenu N.E:
Seattle, WA 9
40
/-4
A0ailabla fromn2inator only
(2064442-014
)
Telephone
78
$
wa.
.88
I

-F N I " .,
Processes TAIrreAt Instrument Observatiens ' Language - FONTRAN II
-,." r -: Hardware'- IBR'1620 II, 4...
V
Several programs and subroutine:34a processing Michelsens Conte ner data (automatic currentand temperature measuretent4:Jor processing Rkman current meter data, and for harmonic analy-
sis and ',ewer spect;umffilal:ysis. NATO Subcppmittee on Oceanograp is Research Technical Report
No. 37 (Irminger Sea Pxoject), "Some fORXRAK II Programs for Comp er Processing of Oceano-
aphic Observations," by H. Rweers, Feb. 1907. , N.,...
1 '
Geophysical Inst ute '.,....;
University of Bergen . . . .
Bergen, Norway..
Copy on fiiat NODC (ab6ve report)
0
.
r.
y
Currept Meter Data processing4Bystem, Language , T MS FORTRAN.
Hardwage - CDC 3150/20K words/2 tape units/,-CalComp Plotter
z.°
Processes data primarily frbm Brainqon or Aanderaa ored cu;lat meters; performs automatic
editing, tidal analysis residpals, tide prediction, filtering; plotting; power spectra and sta-tistical means and histograms are generated.' Also performs 'file management.
Doug Gregory Available from originator.only,--
Bedford Institute of Oceanography s,.
"" P. 0. Box 1006Dartmouth, N. S. B2Y 4A2
.
4
/
,
st.
Telephone (902) 426-2390
1
, - ,
s
,
4r-
11
.111.11.11.14111PPIPMPFINFINNIM
A
TIDES
. Astronomical Tide Prediction
Computesmethod.
hourly values and hme and heights oInput: Tidal constituent constants.
N.A. PoreTechniques Development LaboratoryNational Weather Service, NOAH'8060. Thirteenth Street
Silver Spring, MD 20910
Tides in the Open Sea
Language - FORTRAN IVHardware --IBM 360-195/80K bytes
f high and low astronomical tides by haimonicTechnicalemorandum WBTM TDL-6.
Available from originator only
Telephone (301) 427-7614
LanguageHardware
- FORTRAN 60
#1,
Predicts tides in the open sea, utilizing the basic hydrodynamic equations, for the principal.lunar semidiurnal constituent M2. Application is made to,the analysis of the tidal regime in
the bulfof Mexico. Thesis by Thomas,H. Gainer, Jr., May 1966.
Naval Postgraduate SdhoolMonterey, CA 93940
I
, 2
Available NTIS, Order No. AD 489,06/LK,$4.75 paper, /
Yy
f (
4
Al. -
Harmonic Analysis. of'Data , Language -,FORTRAN IV
t at Tidal Fhtmenbies / '\Z.Hardwaft GDC '6600*/140K
'to4enslyzing.equally aplicet short-period data (15 day% or 29 days), this progrntilizes the% .
, . ,,
1hstandard-Fourier analysis and traditional lethoda of the former .Coast and Geodetic rvey.
. Either a vector (polar form) or seal* variable maybe analyzed; fdr vector series, he pr
gram 'allows either a .major -rginor axis anilysis or a north-east component approach. No d
may.series ma exceed ;,0006terms witoui redimensioning in the program, and no serieWof otherthan,15 'or 29 days of uniformly spaced data can be analyzed.,Ae program accepts input viamagnetic tape or)unched cards in.any format with the%restriction that, for vectors with manitude and direction in the same reeord,'the angles must prang-4 the ampli des in the reco d
For vectors specified by one file of amplitudes and one Hate of diiections the aiPlitilde fi
must be read fitst. Output; mean amplitudes and phases of 26 tidal cons[ to s. 90AATsrch-
. nical Report NOS 41, "A User's Guide to. a Computer Program for Harmonic Analys of Data at\,,,,
_
Tidal Frequencies," by R. E. Dennis-and E. E. Long, July 1971.. ..
Ai/
<*The program is executable with minor adjustments-on any cOmpatibl'machine having a 140K ;jilt-
ory and access to arcsine and arecosine.sysfams functions. Compu ng.time is prox mateZy..1.5 seconds per stat on on' the CDC 6600.) ,
C rles R,Ch f, OcNati6001 ExeRockville,
8
. - .1 /
Muirhead '. Deck availableanographic Surveys'Branch report Cincludi
1 Ocean Survey, NOAA Superintendent%
tive latlevard Printini'Offise20852 %
..,$.70, stock num
-- telephone (401)',..
Theoretical
Input: (1)
Radial Tidal Force
.
astronomical data from the nautical almanac; (24), the solar ephemerfa obtained ftomthe same source (only the earth-sun radius vectoj is needed);' 3) list of local constants,
'
roA,oriiitlator'Only; fdr tboveram1isting), 41 act
f cuments,, . rnmen
Washington, DC 20402. Prree:
er'0317-,0022.
3-8501
Language - MAD.Hardware 7 ;BM 7090
/
O
80
90
atit e and longitude in degrees of arc and minutes, elevation in centimeters. Output:. Lunar,,olar, and total tidal forces and the vector Gate. Progiam accomodates maximum of 725 hours 130 d ys) of data in core storage. Author - Henry L. Pollak.
4
Dept. of Earth and PlanetaryA Sciences
414 Spice Research CoordinationCenter
Universityof PittsburgPittsburg, PA 15213
4
*
(Copy on file at NODC (documented listing)
81
91
I
A
1

WAVES
Hurricane Storm Surge ForecastsSPLASH I
LanguagHardwar
- FORTRAN IV- CDC 6600/77K words
Predicts hurricane,stosta surge's for landfalling storm , using numerical solutions of liniarized,transport equations with surface wind forcing and ti history bottom stress. Input: Basindata and storm variables, such ks intensity, size, an ector storm motion. Output: Storm( 1-
surge envelopes, storm definitions, and astronomical t
Celso S. BarrientosTechniques Development LaboratoryNational Weather Service, NOAA8060 Thirteenth Street
Service, NOAA
Spring, MD 20910
4 Hurricane Storm Surge ForecastsSPLASH II
A;cfAvailable from NTIS: Magnetic tape, Ordo.COM-75-10180/AS, $250 domestic, $312 foreign;User's Guide, OrdleNp. COM:75-10181/AS, $3.25domestic, $5.2511ofeign
Telephone (301) 427-7613
Language - FORTRAN IVHardware - CDC 6600/77K octal words
Predicts storm surges for storms with general track and variant store onditionsr using numer-ical solutions of linearized transport equations with surface wind forcing and, time history
"` bottom stress. Input: Basin data, storm variables, and geographical description of stormtrack. Output: Storm surge envelopes, spice -time history of surges. storm characteristics,and astronomical tides.
Celso S. BA-rientosTechniques Development LaboratoryNational Weather Service, NOAA8060 Thirteenth StreetSilver Spring, MD 20910
East Coast Storm Surge
Available from NTIS: Sib SPLASH I
.-41
Telephone (301) 427-7613
Language - FORTRAN IV .
Hardware - IBM 360-195/185K bytes
Predicts storm surges generated by extratropical storms for eleven stations along the U.S. EastCoast. ,Forecast ,equations derived by statistical screening regression. Input: National Mete-orological Center PE model sea -lev p sure forecasts. Output: Stordt purge forecasts \o 48hours at 6-hour intervals, for 11 TOcitt ons. NOAA TechnicalMemorandum NWS TDL-50.
1
N.A. Pore Available 'from originator only
Techniques Development Laboratory'National Weather Service8060 Thirteenth StreetSilver Spring, MD 20910 Telephone (301) 427-7614
'Os
Wave Forecasts.0
ILanitguage - FORTRAN IV
,klardware - IBM 360- 195/410K bytes/
Forpctsts wind waves and swells forte Atlantic and Pacific Oceans, using singular methodbased on the Sverdrup-Munk forecasting system. Input: National Meteorological Center 1000-mbPE model wind forecasts; Output: Wind wave and swell grid printed charts to +48 hours. Tech-nical Memoranda WBTM TDL-13 and TDLr17.
82
92
r-
c.)
fi I

N.A.
p.
Pore'.Techniques Development LaboratoryNational Weather Service, NOAA8060 Thirteenth StreetSilver Spring, MD 20910
Wave Bottom Velocity
Computes and plots maximum bottom (horizontal)Airy waves of given height and period. Outputwater depth fbr each wave; also,ma listing oflength, and celerity is produced.
John McHoneGeology Department-Hdiversity of IllinoisUrbana,IL 61801
Available from originator only
Telephone (301) 427-7614
O
Language - FORTRAN IV G Level 21Hardware - IBM 360-75/96K
orbital velocity versus still".water depth for
: flog-log graph of u(max) at sea floor vs.the wave's steepness, u(max) it bottom, wave
Copy on file at NODS (listing, documentation)
Telephone (217) 333-3542
French Spectro-Angular Wave Model Language - FORTRAN IV/COMPASSHardware - CDC 6500/CDC 7600
Computes sea-state, using a spectral approach involving sixteen directions and six periods,devised by Gelei et al. Input: Wind speed and direction. Output: Sigriificant wave heightperiod of highest energy and direction of maximum energy fields. _Detailed spectral breakdownfor up to twelve points.
Kevin M. RabeEnvironmental PredictionResearch Facility
4'Naval Postgraduate School .
,Monterey, CA 93940
Surf Prediction Model
Available from originator' only
Telephone (408) 646-2842
Language - FORTRAN IVHardware - CDC 1100/16K 48 bit words
Produces calculated wave ray paths, including the wave information and refraction and shoalingcoefficients, using a modified Dobson approach to the solution of the general wave refraction.Tpchnical Report No. 16, by B.S.L. Smith and"F.E. Canfield, College of Marine Studies, Univer-ility of DelSware.
Kevin lc RabeEnvironmental PredictionResearch Facility
Naval Postgraduate SchoolMonterey, CA 93940
Singular Wave Prediction Model
Available from originator only
Telephone (408) 646-2842
Language - FORTRANHardware - CDC 3100/CDC 3200/32K 24 bit words
Produces a wave height analysis for semi-enclosed seas. Uses a modified geostrophic wind de-rived from a local pressure analysis to generate an analysis of the sea state. Output: Waveheight (ft), wave period (sec), wind speed (m sec-1) and wind d ection (degrees). EPRF Pro-gram,Note.8, "TheWave 32 Program," by S. Larson and A.E. And son, Jr.
9383
.4t

Sigurd LarsonEnvironmental Prediction
Research FacilityNaval Postgraduate SchoolMonterey, CA 93940
Available from originator only
Telephone (408) 646-2868
Wave Interaction with Current Language - FORTRAN 4;
CAPGRAY Hardware - IBM 370. 2000K Region
Calculates wave length, wave number, wave slope, and wave energy changes for waves in thecapillary-gravity subrange as they int.eract with non-uniform current. A perturbation schemeusing the gravity contribution of the capillary7gravity wave as the perturbation parameter wasused to integrate the energy equation exactly. Input: Wave number K for waves with no current.
.
Steven R. Long llable£iom originator only Are
Center for Marine and Coastal Studi sNorth Carolina State UniversityRaleigh, NC 27607 Telephone(919) 737 -2212
Shipborne Wave Recorder Analysis
SBWRO
Language - FORTRAN IVHardware - IBM 1800
Given values of the highest and second highest crests, thd low________the_mumber_of zero crossings, and-the-number of crests in_
borne wave recorder, computes the spectral width parametalso the predict,ed maximum height in a period of three ours, o9tputs the results on line-
printer and on isk.f NI@ Program No. 89. Author - Eil en Pagi.
7 r1; e of Oceanography ,,Copy on f le at NODC (listing, documentation)g, Surrey, England
t and second loWest troughs,ecord from the NIO ship-
the significant wave height and
NatioWormley .
SurgeNItyin
4
Language - FORTRAN I
4 Hardware - UNIVAC 08/10K wordi INumerical models, based on the hydrodynamic equation and local depth fields, are used to deer-mine the flood levels expected from specific hypothetical storms. Publication TM-35, "Storm 10..,
Surge on the Open Coast; Fundamenta s and Simp ified Prediction," May 1971.
(1) For pro gram release:
Colonel James L. TrayersCommander and DirectOrCoastal Engineering Research CenterKingman BuildingFort Belvoir, VA 22060
Wave Refraction:
vailable from originator only
) For program information: siRi
D. Lee Harrisief, Oceanography Branch
Coastal Engineering Research Center
Language - FORTRAN IVHardware - UNIVAC 1108/15K words/Plotter
calculates and plots surface wave rays. Input: Depth grid; xy and angle starting point of
f
rays. Output: Plotted output of shoreline and wave rays; listing of wave ray x, y, angle, ',
time nd depth. Publication TM-17, "A Method for Calculating and Plotting Surface Wave Rays,"
Feb. 966.
84
94

3
(1) For program release:
Colonel James L. Trayers
Commander and Directo*,Coastal Engineering ResearchKibgman BuildingFort Belvoir, VA 22060
Available from originator only
(2) For program informationCenter D. Lee Harris
Chief, Oceanography BranchCoastal Engineering Research Center
Water-Wave Teaching Aids Language - FORTRANHardware IBM 360-40
In teaching the engineering applications of water-wave theory, it is often desire to havestudents make numerical calculations based on the various wave theories. This is pre ical,however, only for the simplest of the water-wave theories, as the computations involved thhigher order theories are quite tedious ale time-consuming. This collection of programs andsubroutines represents an attempt to relic students of these lengthy and detailed compute- _
tions, so that they can use -the theoretical results in solving realistic problems. At thesame time, there are dangers inhergift in developing and using computer programs for teachingpurposes. The principal difficulty is the "black box" syndrome, where the students merelypunch dome numbers intola 8brd and, later, get more numbers back from the machine, without thevaguest idea of what hapened in between. In order to avoid this difficulty, and, in addition,to provide wide flekibilty, it was decided that the best format for this collectiqn would bemany.ShOrt, dibgIe2futtrtIon Spbroutines, which compute some of the more tedious intermediateresults fora given problem;, and which can be easily modified or added to by the user. Thedisadvantage of this approsk Is that it requires some knowledge of FORTRAN on the part of thestudent. It is believed, this disadvantage is outweighed by the Tdvantage of making thecomputational processes Pth clear and flexible:
7
LENG1 computes wavelebM'and speed, given the wziter /depth and wave period, using-Small-ampli-tude (and Stokes' second-order) wave theory. Values,ere returned to the calling programthrough the CALL statement and are also printed out during executiion. LENG3 uses Stokes' third-order wave theory.
PROF1 computes water surface elevgtions, eta(x) orieta47, over a wave period, using linearwave theory; returns arrays of x, t, and eta through the CALL statement; prints input data andthe three arrays: Alternate subroutines PROF2 an4 PRpF3 accomplish the same purpose usingStakes' second- and third-order wall equations.
Subroutines UMAX1, WMAX1, UTMAX1, and WTMAX1 compute u(max), w(max), the partial derivative ofu with respect to t(max), or the partial derivative of w with respect to t(max):41..e., themaximum flow velocities:in the x and z directions and their corresponding temporal accelera-tiono, as a function of z, from z = -h to z = eta(max), using linear wave theory. Returns ar-rays of z and u(max) etc., for 2` = -h, -(29/30)h, -(28/30)h,...for Zoless than eta(max),through the CALL statement; prints the input data and the two arrays. Alternative sets of rou-'tines carry out the same purpose using Stokes' liecond- and third-order equations.
Subroutines UO(Il, WOFT1, UTOFT1, and WTOFT1 compute values of u(t), w(t), the partial derive-,
tive of u with respect to t, or the partial derivative, of w with respect to t, i.e., the.hori-zontal and vertical flow velocities and their accelerations, over a wave perio4 (T) at a givendepth (z) using'linear wave theory. Returns arrays of t and u(t), etc., for t Of, T740,
tive sets of routines carry out the same purpos using Stokes' second- andthird-order eqe-2T/40,..., T; through the CALL statetent; print the input data and the two arrays. Alteira-
l,
t ions. ,
IP .
The following four programs, dealing with spectra, were adapted (with permission) from theShare program G1 BE TISR, written at Bell Laboratories by M.J.R: Healy, 1962: DETRNDTremovesthe mean, or tht mean apd linear trend (slope) from a time series X(I), I =-1,N; AUTCOVcomputes the autocovariance, Y(K), K = 0,the auto- and cross-covariances, ZXX(K),lags from 0 to L; FOIIRTR computes eitherthe ser es X(K), K = 1, N + 1 (smoothing.25).
s. a
of the time series X(I), I = 1,N; cRscoy computesetc., of the two sevences X(I), Y(I), I = 1, N, forthe sinetor'tosine transform, Y(KI, K = 1, H + 1.41ofof either is optional, with coefficients .25, .50,
yo' "
85

PROFILE computes and plots the w ve profile given / a spectrum (in the form of the Fourier coef-
ficients). Output: A printer p (on a printer with a 132-character line) of eta vs. t.,
REFL1 computes an8 prints water sur ce profiles for the partial (two-dimensional) reflection
of a linear (small-amplitude) wave rom a structure. . w
FORCE AND MOMENT computes t e tots force and momvnt (about the base, or "mud line"); on a cir-
cular cylindrical pile as a fu don of time, using linear theory integrated to the actual wile
ter surface. A table of F and Mo vs. 4 is'printed out.' . .
EDIST computes the force distribution on a pile, using linear theory. Prints out the data and11/'the force distribution as a function or time. -
4
7 IListed and documented in Hydrodynamics Laboratory Technical
...
Note No. 13, "Water Wave Teaching.../-
Aids; "` by R.H. Cross, Sept. 1968.
S
se
4'
Department of Civil Engineering Copy on file at NODC (above report)_
Massachusetts Institute of Technology , I..
Cambridge, MA 02139 '
to
41)
86
a
#0 rY
7
4.
a

AIR-SEA' INTERAtTIO AND HEAT BUDGET
rkovfan Aialysis of TDF-14 Wind Data S PL/I OPtimii/
1
. )
, , Hardware - IBM 370-180/260K bytes (chatacters)<, .
Produces 9-x 9 and 33 x 33 matr s of wind transition probabilities for user-supplied inter-val. Assumes wind .can be modeled a learicov process, in which likelihood of wind speed anddirection in next interval de ends nly on current wind speed and direction. Input: TDF-14formatted tapes of hourly and three, ourly Wather station data, available from National Cli-matic Cehter, Asheville, NC 28801. Output: Wind transition matrices by season, steady-stateprobabilities, distribution of wind speed by direction. See publication MITSG 74-20, "Primary, /Phydical Impacts o,f Offshore Petroleum Development," by StiWart and Devanney, MIT Sea GrantRroject °Meet, April 1974.- -
4..
J.W. Devanney IIIMassachusetts InstituteRoom 5-207Cambridge, M\ 02139
Available from originator onlyof Technology
Telephone (617) 253-5941'
Summarizes Weather Repbrts Language - FORTRAN (ALGOL input routine)'SYNOP Hardware - BurrouS156700/Less than20K words
I
Processes synoptic marine radio weather reports to produce summaries of various items, bymonth. The validity of the data is checked against long-term mean values. Input: Disk files,prepared separately from punched cards. Output: Printed summaries by one-, two-, and five- .
decree quadrangles', of sea and air temperatures, heat budget information, and barometric pres-sure; also punched cards for selected summary items.
A A.J. Good Available from originator onlySouthwest Fisheriqp CenterNational-Marine Fisheries Service, NOAAP.O. Box 271La Jolla, CA 92037 Telephone (714) 453-2820, ext. 325
A
Pyranometer and,RadiomeieE Time SeriesRAD
Language - FORTRANHardware - CDC 6466/5,K words
0,
Converts pyranometer and new radiometer readings to radiant intensity. Input: Cards withpunched values of time, voltage values from a net radiometer, manometer, humidity sensor,akethermistor, wind spded detecter, and values of sea-surface temperature. Output: Listingof the above values converted to proper units plus comitpted values of net solarradiation,evaporative and conductive fluxes, total flux, effective Back radiation, transmittance, solaraltitude, and albedo.
R.K. Reed'Pacific Kirine Environmental
laboratory, NOAA
.Available from originator only
3711 Fifteenth Avenue N.E.Seattle, WA 98105 Telephone (206)-44/-0199
\Language. - FORTRANHardware - CDC 1604/16K 48 bit words/Drum/
3 tape units
Pioduces monthly climatological data fields. Input: Synoptic fields, first-guass climatologyfield. Uses a Laplacian relaxation technique. Computer Applications, Inc., Tech. Report,
'`AOcean Climatology Analysis ModelANALYS
87
97

"Documentation of Subroutine ANALYS," by J.N
Kevin M. RabeEnvironmental Prediction
Research FacilityNaval Postgraduate SchoolMonterey, CAI 93.940
f
Hurricane Heat Potential Model
Computes-the hurricane heat potential using the station temperakire profiles in the form of'
pinched cards in 4-D format. Output: a profile plot, hurricaneheat potential, final Vaiian
plot of area with all heat potentials plotted. 'TheSis by LCDtR Shuman.
Kevin At Rabe Available from originator only
Environmental Prediction ,Research Facility
Naval Postgraduate SchoolMonterey, CA 93940 Telephone (408) 646-2842. '
Perdue.
Available from originator only
'Telephone (408) 646-2842
Language - FORTRAN IVHardware - CDC 6500/20K 6b bit wordg/Varian
. Plotter optional
Mixed Layer Depth Analysis Model Language -.FORTRAN/COMPASS
MEDMLD Hardware - CDC 3100/CDC 3200/32K 24 bit words/Drum/3 tape units
deberates an analyzed mixed layer depth field using ship reports and a first-guess field in
the form of an a4justed climatological MID field. The program uses a Laplacian :analysis and
relaxation scheme to generate the final field. Output: An analyzed mixed layer d h field
on a synoptic basis. EPRF Programming Note 7, "Meditertanean Mixed Layer Depth An s/.6 'Pro:
gram 'MEMO," by A.E. Anderson, Jr.
.SigurdLarson venal+ from Originator onlyEnvironmental PredictionResearch Facility
Naval Postgraduate School 4'1
Monterey,, CA 93940 Telephone (408)0546:-2868
J
Atmospheric Water Content 411:lel Language FOkTRAN (CDC 3100 MSOS)Hardware - CDC 3100/12K octal words (24 bit)/
15K octal words with system (MSOS)-, o
Computes total grams of Water present in atmospheric column aurrounaing ascentiof radiosonde.The method used is based on Smithsonian tables and formulae. Compressibility of moist air is
assumed ecliel to one. Output: Various intermediastualues pluA,geometric height and total
quantity ot water in grams.
T. Iaetastu or A. StroudEnvironmental Prediction
liasdarch Facility
Naval Postgraduate SchoolMonterdy, CA 93940
,Available from originator only
I
Telephone (408) 646-2937
tIcean-Atmosphdric Feedback Model Language - FORTRAN IVHardware CDC 6500/70K 60 bitliwords
siMulates the response of the surface air to sea-surface .propeiiies and al.so the processes of
am.
88
98
f
....Alb...Y.
..: . NCI.' - . , .
mesoscale feedbuk, mitchanisms: MP Tech. Paper 2-72, "The°Effects.of Oceanic Fronts on Firop-.
, ertienApf the Atmospheiic Dqundary Layer," by T. Laevastu, K. Rabe, and. G.D. Hamilton.. ,..
Kevin M. Rabe Available ftom originator only
'Environmental PredictionResearch Facility
Naval Postgraduate SchoolMonterey, CA 93940 Telephone (408) 646-2842
:Wind4COMputation from Ship ObservationsTRUWIND
Calculates the true wind diiectionspe'ed of the ship and the observed
TRUWIND," by Baldwin van der BM:
Taivo LaevastuEnvironmental Prediction
Research FacilityNaval Postgraduate SchoolMonterey, CA 93940
V
Language, -.FORTRANHardware - CDC 1604/16K 48 bii words
in degrees and 'speed in knots, given the direction andwind direction and speed. EPR}'4rogram Note 16, "Program
,''Available from originator only.
(408) 64 -2937
k
, .... .
Hie Scattering Computations)4
Language - FORTRAN kHarchiare -*CDC 3800/CDC 6§00/32K
% . .
Uses Rie scattering theory to compute the angul4 diatflEtIJ;n of sc ttered radiation ramt
spherical particluq, for a,range of values of index of refraction an size parameter cAvr/),
(where r - particle radius ansitA)=Awavaengthsif incident radiation).
James W. FitzgeraldNaval ResearchLaboratoryWashington, DC 20375 Telephone (Z02). 767-2362
.6" Available from origfnat
/Solar Radiation Conversion Language - FORTRAN
Hardware- IBM 7074
only
4
Averages the radiation readings from the Eppley pyrhelibMeter and Beckman-Whitley radiometer -for, very 15 minutes. Converts from MV to Langi dteys/min. and calculates net radiati front'
both iastryments. A modification of this program was made to include a Th2rnthwaite Att r di-.ameter. utpois - S.Z. d Laianoff; modified by, Mary: E. Myers..1 I
Data Systems 'OfficeU.S. Naval Oceanographic Office1Waahington, DC 20373
Wind Stress
Determines wind stress on the ocean surface.
Data Syitems Office '
U.S. Naval Oceanographic OfficeWashington, DC 20371
Two-Dimensional-Power Spectrum for SWOP/ifl
t '
Available from orftinator only
Telephone (301) 763-1449
; ("1"",-
Language -1FORTRAN.Hardware - IBM 7074
OS No. 53462. Author Gemmill.
Available from originator only
Teleplene (301) 763-1449
Language - FORTRANHardware - IBM 7074
89
%99
)

111
_a
4.
Determination of spectrum associated with the spatial distribution energy as obtained from;
an instantaneous picture, of the ocean taken from aircraft (SWOP II). OS NO. 53484.1 Author -
C.M. Winger. ''\ .
. /Data Systems OfficeU.S. Naval OceanouaphicOfficeWashington, DC 20373.
Available from, originator only
Telephone (301) 763-1449
Prediction of Vertical Temperature.Change Language FORTRAN
Haidware - IBM 7074/Benson-Legner Plotter
/A technique based primarily on'heat budget and wind mixing calculations has been developed for
predicting the.vertical thermal structure of the ocean; the technique essentially modifies the
initial thermal structure through incident solar radiation, back radiation, sensible and evap-
orative heat exchange, convective heat transfer in the water mass, and wind mixing. Predic-
tions are made at six-hour intervalg until 1200Z on the date of forecast. The predicted BT is
printed out, and also can be plotted with a Benson-Lehner Model J plotter. Authors - W.H. Gem-
mill and D.B. Nix. 'Informal manuscript report IMR No. 0-42-65, Oct. 1965. (See also IMR No.
0745-65 by B. Thdhpson and IMR No. 0-13-66 by Barnett and Amst4tza Program listings separate
from reports.
Data Systems OfficeU.S. Naval _Oceanographic Office
.DC 20373
Copy on file at NODC (Above reports 0-42-65 and0-45-65; a-Jo listings)
Telephone (301) 763-1449
Cloud Cover,and Daily Sea Temperature Language - FORTRANHardware - IBM,7074
Divides cloud cover into three groups and computes mean temperature by hodr of day and by day
for each dipth. OS No. 53414. Author,- D.B. Nix.
1)
Ohta Systems Office1
U.S.-Naval Oceanographic OfficeWashington, DC 20373
Available from originator only
Telephone (361) 763-1449
90*,
1.00
O'
re.

ICE
Sea Ice Studies.YAR/t, FLIP, SALPR, -RITE .
Language - FORTRANHardware - IBM 7090-94
A generalized program with several options that allow considerable latitude in the specifica-tion of input and output data. A main program reads in the input data andisummarizea the re:-
:Rats of each year's integration. Subroutine YARIT calculates the temperature and thicknesschanges of the ice and snow for each time step during the year. Subroutine FLIP takes themonthly values of the independent energy ,fluxes at the upper boundary and produces smoothed
o values for each time step. Subroutine SALPR calculates the salinity profile for each timestep. Finally, subroutine RITE writes the temperature profile, heethickness and mass changesfor each ten -day period throughout the year. Memorandum RM-6093-PR, "Numerical Prediction ofthe Thermodynamic Response of ,Arctic Sett,Ice to Environmental Changes," by G.A.' Meykut and N.
Untersteiner, Nov. 1169. Prepared for U.S. Air Force PrOject Rand.
. \ The Rand Corporation1700 Main StreetSanta Monica, CA 90406
Available from NTIS, Order No. Ad 69873,3/LK,$7.00 paper, $2.25 microfiche.
1
.1 -
, .
Wind.Drift and Concentration df Sea Ice Language - FORTRAN 60 1
ICEGRID MODIFIED Hardware - IBM 1604,
..
---------.,
.-.Takes into consideroion the effects of melting on the production of five-day forecasts of thewind drift and concentration or sea ice, using equations after Zubov and an earlier program of
Knodle. Uses a 26x21 grid-poiat array with variable scale. Qutput fields are concentration,
direction, and dibtance of movement. Incorporates programs ICEMELT and ICEGRID. Thesis byKenneth M. Irvine, 1965. .
k4 '
Nal PostgraduateSchool Available from NTIS, Order. NO. AD 475 252/LK,
Monterey, CA 93901- $4.25 paper, 552.25 microfiche._ 4
/
'Iceberg Drift Language - FORTRAN IV
ICE-PLOT Hardware - CDC 3300/31K words00 '
Proldiles twelve hours of iceberg drift, iceberg input for Ice Bulletin, and map Outline fOr
FAX broadcast. Input: Twelve -hour average wind field, monthly surface current, and initialiceberg position (or previous, updated position if not a new berg). Output: Listing of new
iceberg positions, Ice Bulletin message form, and map of approximate new iceberg positions..Vector addition of average winds and currents using four geogtaphical "courses," twenty minutes(lat. /long.) apart.
d.L., .CDR A.D. Super" Available from originator onlyInterna0otel Ice Patrol
,
U.S. Coast Guard . ,
Bldg. 110, Coast Guard Support CenterGovernors Island, NY 10004 A., . Telephone (212) 264-4798 .
c
Ice Drift Analyiis/Forecast r"'" Langutage - FORTRAN IIHardware - CDC 160A/8K 12 bit words/3 tape
11 . ' units);J
Forecast or analyted geostrophic winds and average sea -s rface currents on magnetic tape are
required, input. The geostrophic winds are ,axeraged ove the time period specified' by type-
writer input. The ice drift equations are applied to the resultant wind, and sea surface cur-
rents are added. Output is in the form of forecast or analyzed ice drift.(movement) aeprede-termined locations (points) )o a maximuri of 207.
91
101
f

. 1
_Li. Roland A. Garcia, USNFleet WestherVacility SuitlandSuitland, MD 20373
'
t
T
Copy''u file at NODC (listinkdosumentation)
Telephone (301) 763-5972
92
s
1.
I
102 I
4-1K

e..
1
SOUND ,ad.
NormalMode Calculations Language -,FORXRAN IV
. NORMOD3 Hardware - CDC 6500/60K octal words/CilCompor other plotter
sCalcqlates discrete normal modes and resulting t)ropagation lbss for depths and ranges of in-
.
tarest. This is a deep water version of'a prograff originally written by Newman and Ingenito(NRL Report No. 2381, 1972). Appropriate for deep profiles and moderate frequencies (-loo Hz),the program uses a finite difference technique to generate mode shapes from the bottom up tothe surface. It,searches foi appropriate eigenvalues yielding proper number of zero crossingsand zero pressure at the surfate. AWL Tech. Report 74-95.
Ira M. BlatsteinNaval Surface WeaponenterWhite OakSilver Spring, 19. 20910
Available from originator only
Telephone (202) 3472583
e
Horizontal Range Language - FORTRAN
RANGE Hardware - CDC 6400
Computes hRrizontal range from a receiver tosound spe rofile, the source andthe point bottom reflection.sound speed profile, and a flatNote 9856.
a sound source as a function of the D/E angle, thereceiver depths, and the water depth and bottom slope at
Assumes that the surface is flat, no horizbntal variations inearth. Only tilt' two-dimensional case is considered. NOL.Tech.
M. M. Coate,Naval Surface Weapons CenterCode 221-White OakSilver Spring, MD 20910
Soupd Scaieiing by OrganismsMGT
Available froM originatOr only
'Telephone (202) 394-2334
Language - FORTRAN IVHardware -ADC' 1604/16K 48 bit words
Simulates the scattering of 8pund by organisms of various shfopes and dimensions.
' Available from originator onlyTaivo LaevastuEnvironmental PredictionResearch Facility
Naval Postgraduate SchoolMonterey, FA 93940
N Normal Mode Propigation Model
Produces propagatio4 loss,as a funmode enhancement information, rayas 4npgt sound velocity Rrofiles,composition, and selection of modeReport 4887-11.
William G. KanabisNaval Utdefwater SystemsNew London, CT 06320
TelephOne (408) 646r2937
t. I) 4.
Language - FORTRAN V 2"Hardware - UNIVAC 1108/Drum
'04
ction of range and depth, time history of received pulses,equivalents, group velocity, phase velocity of modes, usingfrequencb,source and receiver depths, bottom topography and
s. For certain plots, plotting programs are required. NUSC
Center
.e
103
Available from originator only
Telephone (203) 442-0771, ext. 2353
93
/-1

Sound ReiractiOn Corrections.
FItITLanguage -.FORTRANHardware -,CDC 3300
Computes data and fits polynomial functions to variable used to correct for bending of non-re-flecting, nonvertexing sound rays. Least-equated -error type fitting (stepwise regressiop notused, but would improve program). Input: Sqund velocity profile, limits of integration, do-main'orpolynomial. Output: First to fifth degree polynomials" accuracy of FIT.
A.E. Vaaa, Available frOm.originator onlyNaval,Underwater Systems CenterNewport, RI 02840. -Telephone (401)841-3435
Beam Patterns and WidthsGBEAM
Language - FORTRANVHardware - UNIVAG 1108/18K woirds/IGS Plotting
System t
Computes beam pattern's and their beam widths for three-di monsio461 array with arbitrary elementspacings, taking into consideration individual element's dIrectionality, selectable delay, andshading. Also chlculates directivity index and/or reverberation index. Formulation based, onthree-dimensional spherical and solid geometry.. Directiptty index and reverberation index cal-Culations are carried out by two-dimensional parabolic numerical integration. NUSC TechnicalReport 4687.
Ding Lee or1Gustave A. Leibtger Available from orighator onlyNaval Underwater Systems Center '
New London, CT 06320 'Jlo Telephone (203) 442-0771
Statistics of Acoustic Measurements and Language - FORTRAN V -a
Predictions - STAMP - Hardware - UNIVAC 1108/60K variable
Mt.
A general purpose processing program which includes a module for performing statistics of \\acoustic measurementt and predictions. Storage requirement is variable; program is segmented.60K is the maximum. Users Guide in preparation.
Richard B. Lauer Available from originator onlyNaval Underwater Systems Center /.New London, CT 06320 Telephone (203) 442-0774: ext. 2827
Peoptgation Loss' Language - FORTRAN IVFAST1FIELD PROGRAM Hardware - UNIVAC-1108'
/$
Calculates underwater acoustic propagation loss as a function of range for a point monochro-matic source in a medium with an arbitrary sound speed profile versus depth. .Spdcial input-output requirement: Soundspeed profile fitting program. NUSC Report Nos. 1046.and 4103.
1 a
Frederick R. DiNapoliNaval Underwater Systems CenterNew London, CI 06320
Available from o iginator only
Telephone (203) 42-0771, ext. 2647
Bottom Reflectivity Language - FORTRAN'II.Hardware - UNIVAC 1108
Computes three acoustic reflection coefficients as a function of incident angle and frequency.The program accounts for differences in path length, depth of source and receivers, water bot-tom sloper velocity gradient, and recorded travel time. USL Tech. Memo. Nos. 913-4-5 and 907-144-65. The later reportalso serves to document a supplemental program (USL No. 0429, inFORTRAN) fot computing meant and standard deviations of the three reflection coefficients.Program No. 0289.
1
94
.104
ti
4

(1.
. f 1
R. WhittakerNavil\Underwater.Systems CenterNew London, CT 06320' .
Battern Function Calculations
Copy on file alt NODC (listing, documentations)
5 .
Telephone (203) 442-0171, ext. 2316 .
,
Language - FORTRAN IVHardware -'UNIVAC 1108
Computes transducer pattern functions needed in the sonar equations when estimating search per-
formance of acoustic torpedoes. The desired paramkters include the transmip and receive direc-
tivity indexes and the volume and boundary reverberation indexes. In a vehicle employed in
circular search, the revert:imitation indexes are functions of turfs rate and elapsed time in the
ping cycle. The output is used by the "Sonar,in Refractive Water" program. Report'AP-PROG-C-
,7035k "Pattern Function Calculations," by Herbert S.Itaplan, Associated Aero Science I.aborato-
;ries, Inc., Pasadena, for yusc, Apr. 1967.
Naval Undersea CeztetPasadena Laboratory'3202 E. Foothill tivd.Pasadena, CA 91107
Copy on'file at NODC (above report)sp.
Leigh -Morse Bottom Reflection Coefficients Language - FORTRAN V
11A OR Hardware - UNIVAC 1108
Computes Rayleigh-Morse bottom reflection coefficients, also pte changes of the reflected and
transmitted acoustic wave. Author Reeves.
Naval Undersea CenterPasadena Laboratory-3202 E. Foothill Blvd.'Basadena,icA 91107
4
.
Copy on file at.NODC (listing, documentation):
Light and Sound Instruction D , Langliage - FORTRAN :-Hardware - IBM 7074 4 P
,* \
Computes the convergence. zone parameters using the Vx method (equations of Donald Cole), by
one - degree quadrangle, by month, and by season. OS No. ,20112. Author - M.C. Church.
Data Systems OfficeU.S. Naval Oceanographic Office
\. Washington, DC 20373
-ND
Available from originator only
Telephone (301) 763 -1449
Propagation Loss Language -FORTRAN V 0S15874 Hardware - UNIVAC 1108/CalComp or'Stromberg-
Carlson 4060 plotter
Produces printed tables and plotted contours of single-frequency near-surface propagation loss...,,NUSCML Technical-Memorandum No. 2070-356-70 and memo serial PA4-101, 2 May ,973.
T.A. Garrett Available from originator on*
Naval Underwater Systems CenterNew London, CT 06320 Teleph(203) 442-0771, ext. 2991
..
I
AMOS Propagation Loss Language - FORTRAN V
S1797 Hardware - UNIVAC 1108/Stromberg-Carlson4060 plotter'
. .
105
95
ir

. / . .
Computes and plots AMOS and modified AMOS propagation loss as a function of range, frequency,or depth. NUSC Technical Memorandtim PA4-225-71 and memoserial PA4-101, 2 May 1973.
e
T.A. Garrett 1 Available from originator only'Naval Underilater Systems tenterNeG London, CT 063204 1 Telephone (203)442-0771,.ext. 2991
. ,- A
S
A
I?"
-
96 .1 06
4.
41,
t.
e
4

4
4
,
- SOUND VELOCITY
Sound Speed Computation Model
SOVEL
Language -, FORTRANHprdware - CDC 3100/CDC 3200/CDC 1604/32K
14 bit words/1 tape unit
Computes sound speed from salinity-temperature-depth data. EPRF Program Note 10,-"Program
---SOVEL,"sby T. Laevastu.
Taivo Laevastu .
Environmental predictionResearch Facility
Neal Postgraduate SchoolM6nterey,SA 93940
Sound Velocity,SONVEL-
Available fro
Telephone (408) 646-
ator only
Language - FORTRAN IV-H.Hardware - XDS4 7
Subroutine computes the speed of sound in seawater from the temp
sure, according to W.D. Wilson's formulas.
Mary Hunt Available from ox43inator °Sly
rature, salinity, and pres-
Woods Hole Oceihographic InstitutionWoods Hole, MA 02543 Telephone (617) -548-1400
( Sound Velocity: Wilson's Formula Language -.FORTRAN
WLSND, SVELFS, VELPRS Hardwaxe - IBM 360 - 65/2218 bytes (object form)
Compu tes sound veloCity using Wilson's equations. WLSND is used when pfessuie is comp ed frOm
depth and FS iscomputed from salinity. SVELFS is used,when pressure is computed from depth
andFS is the entering argument; in this case, FS iCusUhlly computed in SIGMAT. VELPRS is
used when pressure is not computed but is an entering -'argument; atmospheric pressure is in
eluded; successive computation starting at the ocean is not necessary here. Author - Robert
Oceanographic Servides Branch ' Copy on file At7NODC
National Oceanographic Data Center
NOXA/EDSWashington, DC 20'235 Telephone (202) 634-7439
4
A
Depth CorrectionMTCOR
Calculates dth correction for sound velocityare used to approxiyate Matthews' tables. The
Robert C. GromanWoods Hole Oceanographic InstitutionWoods Hole, MA 02543
Language - FORTRAN IV,Hardware - XDS Sigma 7/1419 32 bit words
using Matthews' tables. Established coefficients
Matthews/ table number 1-52 must be specified. .
Available from originator only
Telephone (617)'548=1400
Sound Velocity Language - FORTRANHardware - UNIVAC 1108/6,100 36'bit words
Adjusts sound velocity values for marine sediments, as recovered from laboratdry velocimeter,t
N4001114
A
0
97

. 14.
to in situ vamertiond of.temperatUre, presure, and salinity. Wileen's formulafor sound speed,- Lit water is)usea topply corrections. .
Joseph Kravitz Copy on file at NODC (deck-qwith documentation)
k. U.S. Naval, Oceanographic Office ..--
..-
e
i l j''
Washington, DC 20373 ' Telephone (202) 433-2490
- Sonic Velocities through Solid Samples '0
\--s---DSDP/SOIHJAC .
)
Language = ALGOL
Hardware -.Burroughs 6700/7K words
Computes sonic velocities rough solid samples from technicians' data taken from a Hamiltonframe device (Dr. Edwin R. lion, Naval,Undersea'Center, San Diego, CA 92132), and inter -prets a key associated with each sample wfiich defines its origin. Input: One card file forthe velocitydafa and key, and another card Tile for interpreting the key. Output: Listingwj.th-option for 'punched cards; listing includes five superimposed histograms of vefoaties_gtdifferent levels cif refinement.
Petr B. Woodburyipeep Sea Drilling Project'Box 1529. '
. La Jolla, CA 92037
Light and Sound Instruction B
Available from originator only
. e
Telephone (714,) 452-3256
Language = FORTRAN'Hardware - IBM 7074
got
- a e
Computes the harmonic mean sound' velocity, travel time, and corfectide ratio at 100-fathomdepth intervals by one-degree square. OS No. 20111. Author - M.C. Church.
'
DateSystems Officey
Availale from originator only 4U.S. Naval Oceanographic Office s
Washington,'DC. 20373 Telephone (301) 763-14449,
r .
o ro
t
98

SOUND RAY PATH .
. CpntJ.nuons Gradient Ray Tracing System '4
'CONGRATS
4
Draws ray diagrams, computes eigenrays, and'ealculates propagation loss and reverberation. Usesray tracing method in which sound speed is represented as a function of depth with a continu-ous gradient; and the ray eqdations cah-be intetrated in closed form. Input: Sound speed
profile; bottom profile, sonar and target geometry, ffequenoy, beam patterns, pulse length
' (number f these required depends on output desired). I,Output: Ray diagrams, propagation loss
vs. ra e pulse shape at a point, reverberation vs. time. NUSL Report No. 1052, "CONGRATS I:
otking and Eigenray Generation" by H. Weinberg, Oct. 1469; NUSL Report No. 1069, "Con-
p tinuous Gradient Ray Tracing System (CONGRATS) II: Eigenray Processing Programs," by J.S.
Cohen and L.T.. Einstein, Feb.. 1970; NUSC Report No. 4071, "Continous Gradient Ray Tracing Sys-
tem (CONGRATS) III: Boundary and Volume Reverberatipn,7 by J.S. Cohen and H. Weinberg, April
1971; and other reports. - .
/
Language- FORTAN VHardware - UNIVAC 1108/50K 36 bit words/Disk
drum with 250K words /2.tape
A units/palComp Plotter
Henry Weinberg or' Jeffrey.S. Cohen."' Available from originator only
, Naval Underwater Systems CenterNew London, CT' 06320 Telephone ,(203) 442 -0771, exi. 2589 or 2989;
Acoustic Performance and Evaluation - Language - FORTRAN
Digigraphics, APE-DIGI Hardware - CDC 3300/64K/CDC 274 Digigraphicsconsole, controller,' software
The model simuiates and displays,-on a real time basis, the acoustic propagationcharacteris-tics ()fatly givencceanmedium including ray paths,, intensity loss vs. range curves, and isor
loss contours. Includes provisions for transducer patterns,, target diaragteristics, and cer-
tain receiving cir uit cllaracteristics. Input: Ocean profile (SUP, BT), operating frequency,
db,levels for iso- oss contours. Graphic and tabular output. The ma del employed is a
substantial extension of an ORL program and is based on the theory of ay-path acoustics as
presented in "Physics of Sound in the Sea" and a workby Officer; also cluded are the works
of Schulkin and Marsh for adsorption coefficients, Wilson for sound veloc y, calculations, and
two Vitro Laboratory Atudies of ToreedoI1fK48 acoustic performance. NUSCTD 13b, "Operation
Procedures for-Exercising the Acoustic Performance and Eva/lation-Digigraphics Simulation
Model (APE-DIGI),7 July 1971.
...";4° Navel Underwater SysteMs Center
' , Newport RI 02840
Ronald ' Available from originator only
Ray Path
Telephone (401) 841-3435,
Language - FORTRAN
50434E ,k6 Hardware - UNIVAC 1108/30K/CalComp Plotter. c
7.2..'
Produces plots of travel I. range for D, SR, BR, SRB, BRS, SBSR, BOXpathe, grazing angle
. for first three bottom bounce paths. Estimates ray pathia; and travel times by approximatin
true profile with linear segmented profile. Input: Source, receiver configuration, veloci
profile, and plot requirements..
'
90'
Peter D. Berstein Available from originator only
Naval Underwater Systems Center
New London,,CT 06320 ' Telephone (203) 442-0771, ext. 2305
109
r,
99.
-6
A A
t.

Cr.Atical Acoustic Language - FORTRANHardware - IBM 7074
'Determination of critical ratio of trigonometric functions of acoustic angles involved in con--nection with the convergence interval fdr, a 3-layer model of the ocean. OS No. 53483. Au-4-thor - C.M. Winger.
Data Systems OfficeU.S. Navfl Ocianographid OfficeWashington, DC 20373,
GRASS Underwater AcousticsPrediction System
Available from originator only
Telephone (301) 76-71449
Language - FORTRAN 63
4Hardware - CDC 3806/Drum Scope.1 CalCompPlotter
Elroy , DTSTOV 7,679 48 bit words
0""rcVFC 20,832 48 bit words
VFVF nuR cram 27,452 48 bit words....4PRFPLI PRFPLT 11,622 48 bit words
smik r_t '
SERPENT 36,784 48 bit words''' hRAPLOT RAPLOT 12,118 48 bit words
LOSSPLOT . LOSSPLOT - 19,543 48 bit words
DTSTOV converts salinity, temperature, and depth (STD) data to sound speed profiles, usingLeroy's second equation (Eq. (7) in J. Acoust. Soc. Am. 46: 216-226, (1969J). Input: cardsand data-identifying parameters. Output: Profile ranges, latitudes, longitudes, depths,temperatures, salinities, and sound speeds punched and/or printed. Pressures may bg printedas an option. .
VFC is used: To'examine input bottom-topography and sound speed,dita for consistence andphysical meaningfulness; to extend all input sound speed profiles to the ocean bottom; toperform earth curvature corrections; to determine derivatives of sound speed data. Two-dimensional sound speed fieljs modeled using a combination of cubic spline and 14nearinterpolation schemes. Input: -Bottom topography in the form of non-uniformly spaced range-depth pai's; sound speed profiles (possibly generated by DTSTOV); program control parametersand data identification numbers. Output: A magnetic tape (coefficient tape) containfn/'corrected and extended sound speed profiles and, their first and second derivatives and bottomtopography.; a printer listing and printer plots of input and output profiles.
CTOUR generates three-dimensional isometric,,anh'contour plots of the sound speed fields. Theprogram interpolates value of sound speed at each point using- a combination of cubic splineand linear interpolation schemes, thpn calls contouring and isometric plotting routines.Input: 'Magnetic (coefficient),tape generated by VFC; contour levels, control parameters, andgrid specifications. Output: A CalComp contour and three-dimensional isometric plot of thesound speed field; a printer listing of. contour levels and values of sound speed at grid - -
intersections.
PRFPLT generates CalComp plots of sound'speed profiles. The vertical gradients and curvaturescorresponding to a profile are plotted on the same graph as its sound speeds. A cubic splineinterpolation,setrenie is used. Input: Magnetic (coefficient) tape generated by VFC program'control and dfita identification numbers on cards. Output: CalComp plots showing fhptTt datapoints and' effect of interpolation in depth.
SERPENT traces rays throvib a two-dimensional railge.and depth dependent sound speed fieldbounded by a flat surface and variable bottom topography; calculates random, coherent, and,statistical intensities for multiple receivers at user-selected ranges and depths. An iter-dive ray tracing'scheme is used based upon expansion of ray depth, range, and sine in termsof an increment of ray 04' length. Iteration step'size depends upon sound speed field inrays' vicinity. Input: Coefficient tape from VFC and cards containing source information,receiver information, surface infordation, output requests, parameters governing ray iteration,run identification information,and bottom loss data. Output: A magnetic tape containing raystatistics, (optional), a magnetic-tape containing transmission loss information (optielnal),:aprinter listing of ray information; transmission loss' information, etc.
.IvA
100
V

RAPLOT generates CalComp ray plots (ray depth vs. range from ray sousce). Input: The ray
statiatica plot generated by SERPENT, control parameters on cards which select the number ofplots to be generated, the rays to be displayed on each plot, the plot size, scaling parame-
ters, etc. Output: Labeled CalComp plots showing rays and bottom profile and a printer list-
tag of input and control parameters.
LOSSPLOT generates CalComp plots of transmission loss vs. range. Calculated and experimental
values of transmission loss may be displayed on the same plot. Input: Transmission loss tape
1geneigted by SERPENT; control parameters and graph titles on cards; experimental measurements
or-thedretical values of transmission loss on cards. Output: Labeled Calcomp plots of trans-
mission loss vs. range. If requested, plots will display random, coherent, and statistical
losses together with input experimental data or theoretical curves.`
"GRASS: A Digital Computer Ray Tracing and Transmission Loss Prediction System, Vol. 1 -Over -all description," NRL Report 7621, Dec. 1973;"...Vol. 2 - User's Manual," NRL Report
7642, Dec. 1973.1
John J. Cornyn, Jr.Naval Research LaboratoryCode 5493C '
Wdshington, DC. 20375
Sonar in Refractive Water
Available from originator only
Telephone (202) 767-3585
Language - FORTRAN IVHardware - UNIVAC 1108/30K words
Traces sound rays, computes reverberation, computes acquisition laminae (vertical plane), in alinear gradient or continuous gradient medium. Output: Tape to be used by program RAY SORT.
NUC Technical Publication No. 164, "Digital Computer Programs for. Analyzing Acoustic SearchPerformance in Refractive Waters," by Philip Marsh and A.B. Poynter, Dec, 1969, two volumes.
NUC Programs 800000 and 800001. See also NEWFIT and Pattern Function Calculations, which pre-
pareAaput for this program.i
. Naval Undersea Center Available from NTIS, Order Nos. AD 863 777 and
Pasadena Laboratory AD 863 778, $6.00 each volume in paper,
3202 E. Foothill Blvd. $2.25 each voluMe in microfiche.
Pasadena, CA 9110
Sorts Sound Ray Data -Language - FORTRAN IV .
RAY SORT Hardware - UNIVAC 1108/18 (450 instructions)
Sorts certain sound ray data (from tape written by the "Sonar in Refractive Water" program) bydepth, initial ray angle, and depth-intersection number. $ee reference for above program;
'Naval Undersea CenterPasadena Laboratory3202 E. Foothill Blvd.Pasadend, CA 91107
Acoustic Ray.Tracing
Calculates underwater soundthe field, the surface, andpath, slope, curvature, andtime, wave front curvature;
Available from NTIS: See "Sonar in Refractive
Water.".4
Language- FORTRAN II I .
Hardware - IBM 7090,
propagation. Program requires input,which describes the source,
the bottom. Output is a report on magnetic4tape which gives raylength. Also `given are reflection and extrema statistics, traveland intensity.- Technical Report No. 1470764.
Trident/ASW LibraryArthur D. Little, Inc'35 Acorn ParkCambridge, MA b2140
L. 101
111
Ayailable from 'NTIS, Order No. AD 605 328,$4.75_paper, $2.25 microfiche.
t

.
A series of 19 programs for ttle calculation.of the acoustical field in long-range (several hun-dred to several thousand m4es), low-frequency underwater sound propagation in the deep ocean.Invollies the calculation of ray trpjectories, and intensity calculations that are based on themapping'of ray densities into the far-acoustical field. Input from NODC data tapes or fromFleet Numerical Weather Cent al cards. Technical Report 150, "The Hudson4Laboratories RayTra g Program," by H. Dav s, H. Fleming, W.A. Hardy, R. Miningham, and S. Rosenbaum, June19 "Reference Manual," y M. Klerer and J. May, Hudson Laboratories, Revised July 1965;
ual reprinted inrabove report. Eit '
Available from NTIS: Order No. AD'678 759,' '''''
$10.00 paper, $2.25e microfiche.
.7°
Language -.F9RTRAN/Klerer-May USER langua6Hardware -
The Hudson Laboratories ofColumbia-University
145 Palisade StreetDgbbs Ferry, NY 10522
Language - FORTRAN IVHardware - XDS Sigma 7/CalComp plotter
RAYTRACE is a straightforward, easy-to-use acoustic ray tracing program which produces a plotand a listing. The.user specifies a single-valued velocity profile, source depth, maximumrange, a range increment at which points are computed and the length of the plot axes ininches. All axis scaling and labeling is done automatically. The discretq velocity profilesupplied is smoothed by linear interpolation. Rays are constructed as arcs of circles betweenprofile depths. At surface and bottom rays are reflected according to. the equal angle law.Any number of raya with different initial angles measured from the horizontal may be plotted.In addition to the plot output, RAYTRACE produces the following printqd output for each ray atintegral multiples of the specified range increment: (1) range;(2) ,depth of ray at thatrange; (3) angle of the tangent to the ray at that range measured from the horizontal;(4) total travel time from the source to that range along the rays, (5) itotal,distance frplepesource to that range along Wag,ray path. Whenever a vertex occurs on a ray, the range is setto that of the vertex, an output point is computed, and incrementing of output range continuesfrom that of the vertex. Originally written by C. Olmstead, the program has been modified byBergstrom,' Fink, M. Jones, and- R.,C. Spindel.
Woods Hole Oceanographic Idstitu- -, Copy on file at liODC (listing, documentationltion
I ' 9 1-Woods Hole, MA 02543 .
f,. 1r' * .i% / .
a
102
112

NAVIGA'liON AND CHARTING
Plots Mapg, Grid4010Tracks
MAP
--04
,Generates a plot tape to draw a map according to the user's specifications of latitude and lon-
gitude Itro,jection, kizid of grid, and size_of map. Projection options: Mercator, Miller,
square, cylindrical stereographic, Lambert equal-area cylindrical,'sinusoidal equal -area, flat-
polar sinusoidal equal-area, Mollweide homolographic, and Lambert Conic Conformal, Grid lines
and coast44i-:lines are drawn at the user's option; if coastal lines are plotted, a land mass
data tapeolls needed. There is an entry which returns (x,y) plOtter coordinates for latitude
and longitude of a point, enabling the user to plot station positions, ship's'track, etc.
Ruth Math Available from originator only
Department of OceanographyTexas ABM UniversityCollege Station, TX 77843 Telephone (713) 5-7432
tr
Language - FORTRAN IVHardware - IBM 360-65/CalComp, Houston Outini-
graphic, or Gerber plotter/2 tapeunits
Astronomic Position, Azimuth Method Language'- FORTRAN IV (H or G)
Hardware - IBM 360-65/38K bytes .
-ttatrulates the latitude and longityde of an astronomic observation station, given measured hori-
zontal angles between stars and filed mark along with observation times. A'set of observation
equations is solved by the method of least squares to obtain corrections to assumed values of
latitude, longitude, and the azimuth of the reference mark, as well as probable errors for
these three quantities. The adjustment is iterated five times or until the corrections Iiiecome
less than 0.005 seconds, either of which causes a program halt. Output: A table of input in-
formation and a record of the process of refinement for each set of station data read in. A
previous version of this program was written in ALGOL f the Burroughs 220, in single preci-
sion. Author - Spencer Roedder.
Computer Center Division
U.S. Geological SurveyNational Center .
Reston, VA 22092
Copy on file at NODC (deck, documentation)
Telephone (703) 860-7106
Satellite Rise an% Set Times nguage - FORTRAN IV
ALERT, ASORT . Hardware - IBM 1130/5836 words (ALERT), 12040words (ASORT)
Calculates the rise and stet times,and time of closest approach ofsatellites. Output: Listing
of ALERT information and punched cards for next program, ASORT sorts the' output of rise times
of satellites from program ALERT into chronological order. A listing is printed on the IBM
1132. FRB Manuscript Report No. 1071,by C.A. Collins, R.L.K. Tripe, an0 S.K.'Wong, Dec. 1969:
Pacific Biological Station Copy on file at NODC (listing, documentation)
Fisheries Research Board of Canada
P. O. Box"100Nanaimo, B. C. V9R 5K
Satellite Navigation Language - FORTRAN/Assembler'Hardware - IBM 1800
A set of programs for various aspects of sattellite navigation. The programs /Pall naturally
into"two sections: those involved in the on-line ;eduction of data frdm the satellite, and
those involved in the analysis, both on -line and off-line. Nth Report N. 20, Aug. 1969.
103
113A
,

National Institute of,
Oce raely Copy on file at NODC (listing, documentation),Wormley, Godalming, Surre land
Loran/Decca-Coordinates Calculation 0. Language - FORTRAN IVHNAV ,
, Hardware - IBM 1800
Given a Decca, Loran-A, or Loran-C fix, calculates the latitude add longitude. The method for ,a hyperbolic system with separate master is used for all cases. The constants for the hyper-bolotds are calculated in meters for both Loran and Decca, thus allowing a fix to be calculated'if one Loran reading and one Dacca reading are known. NIO Program No. 165. .Uses SDANO andother subroutines. Author - M. Fasham.
National Institute of Oceanography Copy on' file at NODC Misting, documentation)Wormley, Godalming, Surrey, England
0
Loran/Decca File Initialization Language - FORTRAN IVHNV1 Hardware - IBM 1800
Given input data on a master-slave pair, HNV1 calculates certain geodetic tralues and storesthem on a tape file for later use by program HNAV. NIO Program No. 164. Author - M. Fasham.
,National Institute of Oceanography Copylon file at NODC (listing, documentation)Wormley, Godalming, Surrey, England
Geodetic Distance and Azimuth Language - FORTRAN IVSDANO Hardwarg - IBM 1800
Given the geodraphical coordinates of two points, this subroutine calculates the geodetic dis-tance and azimuths between them. Based on theAethod of E.S. Sodano fora non-iterative solu-tion of the inverse and direct geodetic problems. NIO Program No. 46. Author - M. Fasham.
National Institute of Oceanography Copy on file at NODC (listing, documentation)Wormley, Godalming, Surrey, England
General Map Projection 0 , Language - MAD
Hardwire - IBM 7090/CalComp 763 plotter
Conversion or generation of latitude and longitude values to map projection coordinates. In-cludes all commonly employed projections of sphere. Oblique cases may be automatically ob-tained. Author - W.R. Tobler.
Department of GeographyUniversity of MichiganAnn Arbor, MI 48104
Finite Map, Projection Distortion
4Copy on file at NODC (ligting, documentation)
Language - MADHardware - IBM 090
X
Programs and subroutines to estl1nate the errors introduced by the substitution of map projec-tion coordinates for spherical coordinates. Statistical pomputations of finite distortion arerelated to Tissot's indicatrix as a general contribution to t analysis of map-projections.Technical Report No. 3, "Geographical Coordinate Computations), Part II," by W.R. Tobler, Dec.1964.
104
114
fi

ti
'Department of Geography
The University of Michigan
/4414,4,Arbor, MI 48104
Copy on file at NODC, (above report)
Plots Mercato, id ;Language - FORTRAN
CHART Hardware - IBM 1800/16K words/Plotter
Produces lercatorgrid on 30-inch drum or flatbed plotter, withvarious scale and tick mark
options. Input: Ckrd defining upper right coordinate of chart./ etAlf7
Michael, Moore Available from originator only
Scripps Institution of Oceanography,P.O. Box 1529La Jolla, CA 92037 Telephone (714) 452-4194.
Navigational Satellite PassesrALRTX
Language - FORTRANHardware - IBM 1800/16K words
,q1
Given satellite orbital parameters ands tktion destription cards, produces listing of satellite
passes to occur fop a given area and time.\
Michael MooreScripps Institution of OceanographyP.O, Box 1529La Jolla, CA -92037
Loran or Omega Conversion
GEPOS
Available from originator only
Telephone (714) 452-4194
Language - FORTRAN-IV '
Hardware - HP 2100S/Keyboard aper tape, reader
Converts Loran-C or Omega information from line-of-position reading to geographic coordinates
or geographic coordinates to line-of-position, using method described in Ngval Oceanographic
Office Informal Report NO. N-3-64 by A.C. Campbell. Input: Line -of- position readings, time,
date, initialization parameters; designed to process EPSCO 4010 data logger paper tapes. Out-
put: Listiegs of converted geographic coordinates and magnetic tape with same data in a forma;
compatible with plotting, program TMERC.
Chris Polloni Available from originator only
'Woods Hole Oceanographic Institution, Woods Hole, MA 02543 Telephone (617) 548-1400
Cruise Track Language - FORTRAN IV
TMERC Hardware - HP 3100A/16K yords/Keyboard!CalGomp, Plotter'
,Draws a Mercator chart and cruise track from navigation-data. Data format is fixed, compatible
with progrieu GEP9S. Input: Geographic coordinates and time (normlly GMT).
Chris Polloni Available from originator only
'Woods Hole Oceanographic Institution, Woods Hole, MA' 02543 1 Telephone (617) 548-1400
Transformation of Spherical Coordinates. Language ;FORTRAN IV
ROTGUT Hardware - XDS Sigia 7/5,500 words'
Performs various operations using transformation of spherical coordinates. Output: Rotation
105
r4
'about a pole, transformation to the new coordinate system, weighted or unweighted mean polecomputation using Fisher's distribution, rotation for closest approach and pole of best small-,-
. circle fit.
Christine Wooding Available fr ginator onlyWoods Hole Oceanographic InstitutionWoods Hole, MA' 02543 Telephone ('6l) 548-1400
6
I4 ,t.'.
7"----
Sum of Fisite Rotations on a Sphere. Language- FORTRAN IVSUktROf
.1.*Haidware - XDS Sigma 7
Using coordinat4transfokmatiori, calculates the sum of finite rotations on a sphere. Requires. the latitude and'longitude of the pole of rotation, and amount of rotation for each set. Out-
'putt Listing,of they input rotations plus the iesultant rotation and its tensor."
Loran FixLRFIX
Christine Wooding Available from originator only .
Woods Hole Oceanographic Institution',hoods Hole, MA 02543 Telephone (617) 548-1400
Language - FORTRAN ,
Hardware"- IB1C1800/16K words
Produces position fix from station position and readinelairs cards.
Michael Moore ' Available from originator onlyScripps Institution of OceanographyP.O. Box 1529La Jolla, CA 92037 Telephone (714) 452-4194
:Earth Spherical Subroutine; Language - FORTRANESTCH, ESTC2, ESTPL Hardware - IBM 1800
ESTCH converts earth spherical to plotter coordinates. Input: Decimal latitude and longitude.Output: Chart post an for a calk FnOT X, Y). ESTC2 converts earth spherical -to plottercoordinates with id check. Input and output: Same as ESTCH. ESTPL converts earth spher-,,,(ical to polar c rdinates; not valid for over 200 miles, or over. the poles. Input: Startinglatitude and 1 ngitude, end latitude and longitude. Output: Distance (miles), angle (degrees)
0 relative to true North (decimal units).
, tMichael Moore Available from originator only .
Scripps Institution of Oceanography.
.
s P.O. Box 1529.
La/Jolla, CA 92037 Telephone (714) 45274194
a
AMMOWEini.
c
Plan Course and ScheduleCRUIS and Subroutines
Language - FORTRANHardware - IBM 1800/16K words
CRUIS is used to plan steaming and station time and fuel consumption. Subroutines: SAILS cal-culates the distance between, two points by either great-circle sailing or Mercator sailing,whichever makes the most sense. SAILG calculates great-circle distance and copr&s: SAILMcalculates rhumbline (Mercator) course and distance.
Michael Moore Available from originator onlyScripps Institution of OceanographyP.O. BOx 1529La Jolla, CA 92037 Telephone (714) 452-4194
106
116
ti

J
.Degree Convirsions'DEGFR, DEMI
3.11111111g
language - FORTRAN,Hardware - IBM 1800-'
DEGFR converts integer dggrees and real minutes to real degrees. DEMI converts decimal degrees
Co integer degrees.and decimal'minutes.
.4 *C.
Michael Moore Available from originiton only
Scripps,Indtitution of Oceanography
P.O. Box ;529La Jolla, CA 92037
,
Telephone (714) 0g4194
Q,
-Mercator Degrees. Language -,FORTRAN
DMRCT \. Hardware - IBM 1800
From latitude in degrees, gives Mercator projected latitude in degrees. Expansion (continu
fraction) ± '77 degrees.
Michael Moore6 Scripps Institution of Oceanograhy
:' P.O. Box 1529 t. La Jolla, CA 92037
.).7
Miagnetic"FieldComponenisAmu 4
Available from Originator OnrY
Telephone (714) 45274194
Language - FORTRANHardware - IBM 1800
Converts latitude (N+), Longitude (E+) to colatitudeand east longitude. Input: Geoid lati-
tude, longitude, date (years and liecimals of a year). Output: Magnetic field (gammas), nort
component and east EbNponent of magnetic field, vertical component of magnAtic field.
Michael Moore Available from originator only
Scripps Instil ution of Oceanography
P.O. Box 1529'La Jolla, CA 92037 Telephone (714) 452-4194
.1
Annotated Track on Stereographic Projection Language - FORTRAN
4T:40T 4.
Hardware - CDC 3600/3800/CalComp Plotter..,
plot? an annotated track (bathymetry or magnetics data) Xiong a track (navigation) on a stereo-
graphic projection.
James V. MassingillEnvironmentalipciences SectionNaval Research Labbratory .Washington, pc 2037
Available from originatoron3y '
Telephone (202) 767-2024'
Ahnotates Chart . Language - Hg FORTRAN IV under RTE
\\*-__CORBT Haidware - HP 2100S/15K words
..
,
Reads pbsition and bathymetry informati n,from a disk file and annotates the depth on a Merca-
for chart at the position given. This is a revision of the'athymetry processing section of
program'OCEANO written by the NRL Propagatiof Branch...-
°
Robert A. O'Brien, Jr.- t Available from originator only.
Shipboard'Computing Group, Code 8003
Naval Research Laboratory.Washington, DC 2075 TeUphdne'(202) 767-2387
107
. *lb

A. , ---\,#'
Bathymetric or
2.
MigneticeChart Language -11P FORTRAN IV under RTEPROPL t .., --. ,
Hardware N.- HP 21005/10K words*
]P lots bathymetric or magnetic data as a function of distance along track or distance on a Mer-'critor chart. The data file (disk),.is read,and he track length or chart distance is calculated.
, 4the dependant.variOle is then plotted against, /his value..
,
RobertA. 6PBt4en, Jr.
0
Shipboard 'computing Group, Code 8003Available from originator only
,, Navalltesgarch Laboratory -4 ..,A,
1ashington, DC 2075 Telephone (202) 767-2387 '
' MercatoeChart Dletiietion 0800'1.4figusge - HP FORTRAN under RTEMINK - -Hardware - HP 2100S/8K locations/Disk/
. Summagraphic Digitizing Ta let t o.
The operator digitizes the'ucator chart position, which the program converts to latitude andlongitude; the annotated data value is then entered, and position and value are written on thedisk. Input: Information to define chart and,the output of a digitizing tablet.
Robert; A. O'Brien, Jr. o ',Available from originator only
d .Shipboard Computing Group, Code 8003Naval Research LaboratoryWashingtoi, 20175 Telephone (A02) 767-2387o .
Bathymetric Ch it DigitizationISGBTH
. .N
La ages- HP FORTRAN IV under RTE la..Ha ware - HP 2100S/7200 locations/Disk/
-( Summagraphics digitizing tablet0 Iso
..,
Produces a di' file containing the digitized bathymqtry values as a function of time; alsomessages to the operator. he program has automatic Procedures 00r redefining the origin whenthe chart 'is shifted add when the recording ,instrument changes phase. Input: Control informa-tion necessary to define a coordinate axis and values'from a digitizing tablet,
.s.Robert A. O'Brien, Jr. Available from originator onity
..0 Shipboard Computing Group, Code 8003
.1 Naval Research Laboratory . '
Washington, DC 20375
1 ..-
o
Plots on Stereographic ChartANNOT
thReads a disk file containing bathy6ea stereographic irojection chart at
tx- Robert A. O'Brien, Jr. ',
'Shipboard Computing Group,Naval Research LaboratdryWashington, DC ,20375
Plots Navigation DataOCEAN
Telephone (202) 767-23872vs
Language - HPPORTRANIV under RTEHardware - HP 2100S
(
try and osition, then annotates the depth information onthe posi ion given. Modification of Woods Hole program.
Available frpm originator onlyCode 8003
Telephone (202) 767;2387
Language - HP FORTRAN IV under RTEHardware - HP 2100S/15K background words
4Reads disk file containing navigation ata and plots positions on Mercator chart. This is areyision of the navigation processiDg in program OCEANO written by the NRL Propagation Branch.
o
108
118

fr
4
4obert A. O'B ien, Jr. Available'from originator only
ShipboAxd Com uting Stoup, Code 8003'Naval Resear h LaboratoryWashingtOn-vDC 20375 Telephone (202)' 767-2387
Lig Baseline Acoustic Tracking Language - 112FORTRAN IV under RTEHardwire - HP 2100S'
Real-time local navigation using a bottom djtributed acoustic transponder system. Will navi-
gate the ship and a towed body. Input: Real-timg data from the transpondprssgiving ranges,
depth of towed body;, also requires a sound speed protileeand location of thetransponders. OA-put: Position of `ship and/or towed body; information is logged on magnetic apt%
J. Dean Clemons Available from originator onlyShipboard Computing Group, Code 8008Naval Research LaboratoryWashington, DC 20375 -.4:Telephone (202),767 -2024
FAA Plot Language - FORTRAN J
.`Hardware - UNIVAC 1108/Con6rd Digital Plotter
Accepts three card images and a supplied set of FAA data cards as tgput. The output is a mag-
netic tape to drive the,E-51, E-103, E-108 Concord Digital Plotters,..using the echelon mode.The end product is a film positive with a plus symbol for the position of the FAA plots. The
Mercator, transverse Mercator, and 14embert conic, conformal projection with two standprd paral-lels are the three projections which can be used to plot program outputs. 0.S. No. '65652. Au-
thors - Ronald M. BoltozOIJ. Parrinello.
Automated_taTtography Office, Available from originator on
toile NA r
Defense Mapping AgencyHydrographic CenterWashington, DC 20390
'f
Distance and Azimuth Language - FORTRAN
CIRAZD `NJ Hardware - UNIVAC J.108
"r"
Finds the distance/ and azimuth between two points on the earth's surface when the earth is as-
sumed to be a sphere. If either pole is used for the center point, the angle given is withrespect to grid north. By use of trigoilometric identities and absolute value functions, thisprogram avoids many of the computational problems usually found in distance coMputations. O.S.
No. 55690. Author dk. Barry Turrett.
Automated Cartography Office,' Available'
from origidator only
Code NADefense Mapping AgencyHydrographic CenterWashington, DC 20390
iiiemetric Mapa
Language - FORTRAN IIHardware - UNIVAC 1108
Generates any hyperbolic navigation system by using parametric eq at :anerates plotting
coordinates for loran-A, loran -C, Omega, and Decca charts. Will all lattice lines that
fall.within a specified geographic area. Can.be displayed on any of the llowing map projec-
tions: Mercator, transverse Mercator, Lambert conformal conj.c, oblique Mar ator, polyconic.
O.S. No. 53012. Authors - R.A. Bolton, R.M. Bolton.
4
C.,
109
Automated Cartography qffice,,Code Available from originator -onlyCIA
Defense Mapping. AgenHydrographic CenterWashington, DC 20390
Loran to Geographic and Language - FORTRAN VGeographic to Loran Conversion Hardware - UNIVAC 1108/15K words
mputes a geographic fix, given two loran readings, or computes the time difference reading atageren point for any two specified loran pairs. Uses Sodano inverse method. Informal Mann-script Report IMR No. N-3-64. I
,".Kay Fox Available from originator onlyNavigational Science Division' se
Defense Mapping AgencyHydrographic CenterWashington, DC 20390 Telephone (301) 763-1184
\
Loran Coordieate Computation Language FORTRANAHardwafe - UNIVAC 1108/34K words
Computes charting coordinates along lines of latitude or longitude for loran hyperbolas atspecified intervals. Uses Lambert's method of computing the geodesic and involves converge4eby iteration. Informal Manuscript Report IMR No. N-1-64.
.
Kay/Fox
Navig4tional Science DivisionDefense Mapping AgencyHydrographic Center
'Washington, DC 20390
Available from originator only
Telephone (301) 763-1184
Loran Skywave Correction Language - FORTRANHardware - /15K words
Coeutes the loran-it or loran-C skyvtave corrections over a specitted area. Uses Sodano inversemethod. Input: Station positions, spheroid parameters, propagation velocity, area of coverage.Output: For Loran A, the nighttime skywave corrections from master, from slave, and ftom both;
.e for Loran C, the daytime corrections as well.
S
....-
Kay Fox Available from originator only .
Navigational Science DivisionDefense Mapping AgencyHydrographic Center
;Washington, DC 20390 Telephone (301) 763-1184
Individual Point Generator for Map *Language - FORTRAN IIHardware - IBM 7074°Protections
1
? 4'
Converts geographic positions.to.discrete points in rectangUlar coordinates on the followingprojections: LierdatorAransverse Mercator, gnomonic, polar stereographic, azimuth equidis-tant, Lambert conformal conic (with ope or two standard parallels), Lambert azimut 1 equalarea polar, Lambert equal area cylindrical, Miller, Albers equal-area conic, rect fied skeworthomorphic, acrd oblique Mercator. Cartographic data may be produced in either graphic ortabular form. O No. 55646 main program (each of the 13 projection subroutines has its ownopen shop number). Authors - Ronald Bolton, Louts Rowen, Gregory Vega. Informal report IR No.69-23.
110
120

"Computer P ograms and Subroqtines for Automated Cartography" by J. Parrinello, March 1969.
D tasSystems Office. U.S. Naval Oceanographic OfficEe'
Washington, DC 20373
Available from originator only
Telephone (301) 763-1449
IndDridual Point Generator for Distance Language - FORTRAN II
and Azimuth Computations Hardware - IBM 7074
Uses the geodetic latitude ant-iongitude of two points to computejthe 0.g.tance and azimuth from
one point to the other. Results will be in tabular form with the distance in meters and the
azimuth and back,azimoth in degrees,ominutes, and_seconds. OS'No. 65616. Author - R.M. Bolton.
Data Systems Office,U.S. Naval Oceanographic OEiceWashington, DC 20373
Geodetic Datum Conversion
Available from originator only
Telephone (301) 7631449
1'
Language - FORTRANHardware - IBM 7074
L
.
Transforms geodetic coordinates from one datum to another by utilizing a given shift (in termsof rectangular space coordinates) between the origins of two datums and applying this shift,togetper with differencqs in the spheroidal parameters, in formula, for this pUrpose,
OSNo. 55305. Author - Robert M. Willems. .
Data Systems Office Available from originator only
U.S. Naval Oceanogiaphfc OfficeWashington, DC 20373 .
Telephone (301) 763 -1449
Geodetic Datum Reduction Language - FORTRAN \-
Hardware - IBM 7074AL
Reduces geodetic positions from one geodetic datum to another by use of the Vening Meinesz equa-
tions. The preferred datums involved are European datum, North American datum, and Tokyo datum.
OS No. 55301. Author - D.J. Findlay.
4Data Systems Office' .Available from originator only
U.S. Naval Oceanographic OfficeWashington, DC 20373 Telephone (301) 763-1449
Geodetic Position Computation and Plot
Computes geodetic positions at desired intervals along7incremental or miscellaneous azimuths.
Option to plot or list. Plot uses the LAMB subroutine with two standard parallels. OS No.
55323.. Author - Merle L. Nelson: An informal report IR No. 69-35 lists this and additional '
programs and describes procedures for production of secondary phase correction charts and
tables. These supplementary programs, written by Edwin Stephenson and Barbara Gray, are in
7074 Autocoder or FORTRAN.
Language - FORTRANHardware - IBM 7074
Data Systems OfficeU.S. Naval Oceanographic OfficeWashington, DC 20373
'Astronomic Latitude
Copy on file at NODC (Above report; includeslisting)
Telephone (301) 763-1449
Language - FORTRAN-Hardware -
111
.
\) r4 4
Programs for determination of'first.order astronomic latitude by the Sterneck method and Lattaby the method -of "Polaris and South Star"; subroutines for the Ba ditii, the Carfinke1,and 40a,U.S. Coadt and Geodetic Survey (now National Ocean Survey) refract On modeli. Informal. repott
IR No. 68-:21, "Investigations in,Deterdining,Aetronomic Latitudes an he Computer Programs, "'by Larry Borquin, April 1968.
A4r ,
lta Systems.,,,Office Copy on file at NODC (Above report, inckudesU.g: Naval Oceanographic Office listing)Washington, DC 20373 Telephone (301) 763-1449
sounding Plot,
4ccepts lorac, loran,or Raydist lane values,No: 58419. Author - G.R. Bills.
Data System's Office
U.S. Naval OceanographicWashington, DC' 2Q373I
Single Integration
Office
4
3
LangUage - FORTRAN "
Haidware - CDC 3100/IBM 7074/CalCdmp plottek
plots ship's track and soundings4
Available from originator only
Telephone (301) 76311449
°
Language - FORTRANHardware - IBM 7074,
Equally spaced time series'data are integrated once usingpled at a rate of at least twice the quist frequency.66-akAuthor
D4ta Systems OfficeWaval Oceanographic Office
Washington, DC 20311..-----o
in.UTM mode. OS
Tick's method. The data must be gam-
Informal report IM No, p66-36. :OS No,
Available from6originator onlit
Telephope (301) 763-1449
Sodano Inverse Language - FORTRANHardware - CDC 3100
Computes the normal section"length.and, the forward and reverse azimuths of the geodesic betweentwo points for which the geographic coordinates are known. This computation is useful in deter-mining azimuth and distance between triangulation stations for whith geographic positions havebeen determined but which are not connected by direct o rvation. OS No. 4326. Authors -
drew ampbell; modified by C.E. ierce.
Bata Syslps_OfficeU.S. Naval Oceanographic OfficeWashington, DC4 20373
tateTlene Coordinate Traverse
Copy on file at NODC (Beck, docunrentstiod):.
Telephone (301) 763-1449.
Language - FORTRAN IV,Hardwfre - IBM 360-30/IBM 2311 disk/65K bytes
- -
Computes a plane-coordinate traverse adjustment using condition equations and the method ofleast squares. The normal equations are solved using the Cholesky method. The program will ad-just a network With as many as 250 stations, 600 observed directions, 250 measured distancesand 99 condition equations. It is limited toyither a Lamber or traverse Mercator projectiCorreetions are supplied for the reduction of observed data to grid data and options are avail-able for various types of azimuth and position control. Documentation, "A Computer Program toAdjust a State Plane Coordinate Traerse by the Method- of Least Squares" by Jeanne H. Holdahland Dorothy Dubester, Sept. 1972.
N
112
122
Joseph F. DracupNational Geodetic Survey, NOAA/NOS6001 Executive BoulevardRockville, MD 20852
Geodesy, Marine Surveying and Mapping,Nautical and Aeronautical Charting
NOS SCIENTIFIC SUBROUTINE SYSTEM
Copy on file at NODC (Above report; includeslisting)
Telephone (301) 496-8650
Language - FORTRAN IVHardware - IBM 360-65
The purpose of this system is to make accessible the tools to accelerate and simplify solutionsto various scientific problems encountered in the National Ocean Survey disciplines. The usermay use the system in the development of his subroutine library. Several aspects were consid-ered in the design and organization of the subroutines so that this purpose could be accom-pli ed. The subroutines were designed so.the user need be concerned only with the input andoutput parameters, not with the internal design of the subroutine. The reference to any sub-routine by the problem program is straightforward, thus minimizing user effort. The subrou-tines are purely computational in function and do not contain any reference to input or_outputoperation. The problem program must be designed so that it contains whatever input/output op-erations are needed for the'solution of the.problem. Some routines are in double precisionmode to optimize accuracy of the computations; the problem program must be designed to meetthis requirement. Although the subroutines are FORTRAN IV programs, there is no restrictionon the symbolic programing language which may be used in the problem. The subroutines areuniformly documented and are accompanied by comment statements in sufficient detail to permitthe user to gain familiarity with the techniques and method of use of the routine. Followingare descriptions of individual subrautines:°.
O
ANGLE converts an angle expressed ins seconds of arc to degrees, minutes, and seconds of arc.The angle,which may be positive or negative, is partitioned into its divisions by successiveapproximations foeach of the divisions. A table is then searched for adjusting the decimalseconds to the desired precision to be used in the user's callable routine. (894 bytes)
ANLIS computes the long distance or geodetic distance and azimuths between two stations whosegeodetic positions are known. Evaluation is based on equations of the Andoyer-Lambert methodfor solving the inverse position problem. This method is valid for distances up to 4000 miles.(5612 bytes)
APCTN computes the state plane coordinates from geographic positions and the inverse for sta-tions in zones 2 to 9 of the Alaska plane coordinate system. (4524 bytes)
APCTN computes the state plane coordinates from geographic positions and the inverse for sta-tions in zone 1 of the Alaska plane coordinate system. (Arms bytes)
APOLY computes the American polyconic grid coordinates of a station from geographic positionsand the inverse. (4,320 bytes)
A A
CGSPC computes the geodetic position (latitude, longithde) and azimuth of an observed station:Ta station of known geodetic position, with azimuth and distance to the observed station
en. Evaluation is based on equations for the forward position computation and is valid fordistances up to 600 mileS. (2$06 bytes)
CUBIC approximates a third-order curve.by interpolating coordinates between given points. Theevaluation is based onS method which expresses a cubic curve by using, two parametric equationsend then choosing values for the parameters in the two equations. ( ytes)
EXCES computes the spherical excess of a spherical triangle as determined'from two angles and aside opposite one of them. The method is valid Ar triangles whose aides are less than1100miles in length.' (884-bytes)
GMLIC computes the geodetic distance and azimuths between two stations whose geodetic positionsare known. Evaluation is based on equations-of the Gauss Midlatitude method for solving.theinverse position problem. This method is valid for distances up to 600 miles. (2,452 bytes)
HIFIX computes the hyperbolic coordinates of a ship expressed in HIFIX phase differences, from
113
-123

4
geographic positions, and the inverse. Evaluation is based on Campbell's equations to deter-
, mine the geographic position of ship from HIFIX phase differences. (5t62 bytes)
LORAN computes the hyperbolic coordinates of ship expressed in loran time differences from geo-
graphic positions, and the inverse. The program is applicable to loran-A, loran-C, or a mix-
ture of the two systems. Two configurations of fixed stations may be used. In the triad con-
figuration, two pairs of fixed stations are used, each pair having one station, the master sta-
tion, in common, and a slave station. In the tetrad configuration, two pairs of fixed stations
ate used, each pair having a separate master station and a slave station. Evaluation is based
on Campbell's equations. (6444 bytes)
OMEGA computes the hyperbolic coordinates of a ship expressed in Omega lane values from geo-
graphic positions, and the inverse. Evaluation is based on a modification of Campbell's equa-
tions. (5,708 bytes)
SODIN computes the geodetic distance and azimuths between two stations whose geodetic positionsare known, using the Sodano method for solving the inverse position problem. This method is
valid for distances up to 6,000 miles. (4,622 bytes)
SODPN computes the geodetic position (latitude, longitude) and azimuth of an observed station
from a station f known geodetic position, with azimuth and distance to the observed station
given. Evaluation-is based on equations of the Sodano method for solving the direct position
problem. This problem is valid for distances up to 6,000 miles. (4,986 miles)
TPFIX computes the geographic position, forward azimuth, back azimuth, and distance of an ob-serving station using angles observed at that station to three fixed stations whose geographic
positions are mown. The computations include the effect of spherical excess. Evaluation is
based on,the method of resection to determine the position of an unknown station. (3,178 bytes)
UTMCO computes the universal transverse Mercator (UTM) grid coordinates of a station from geo-
graphic positions, and the inverse. This routine is designed to'work for UTM zones 1 to 60,
zone width 6 degrees, in both the Northern and Southern Hemispheres, within- the latitude band
of 80 degrees and 30 minutes north to 80 degrees and 30 minutes south, and 5 degrees and 45
minutes plus or minus from the central mevidian,of the major UTM zone. (7,930 bytes)
Milton SteinADP Programing BranthNational Ocean Survey,NOAA6001 Executive BoulevardRockville, MD 20852
Computes Geographic Positions
Copy on file at NODC (User's Guide; includeslisting)
Telephone (301) 496-8026
Language - SPSHardware - IBM 1620
Computes geographic positions, given starting position,
spberoids. Three types of computations can be obtained
verse. Control is by job card. Length input may be in
azimuth, and length on any one of sixsingle positions, a loop, or a tra-
meters, feet, statute or nautical
miles, or electronic lanes. USGS Program No. 15.
ADP Programing BranchNational Ocean Survey, NOAA6001 Executive BoulevardRockville, MD 20852
Copy on file at NODC (listing, documentation)
LORAN C (Version 2) Language - SPSHardware - IBM 1620/100K*
Computes tables giving the points Of intersection of LORAN C hyperbolas with meridians and/or
parallels of the earth spheroid: Microsecond values are computed at intervals varying from
1 1/4 minutes to 20 minutes for any or all of four possible pairs of stations. Program can
also/be used to compute microsecond values at grid iseersections. *Can be modified for use on
,IBM 1620 of 60K capacity.
114 . A
124
ADP Programing BranchNational Ocean Survey, NOM6001 Executiye BoulevardRockville, MD 20852
'Compute Great-Ciicle PathGCIRC
Copy on file at.NODC (listing, documentation)
Language - FORTRAN IV-49(
Hardware 1 IBM 360-65/1200 bytes
AP'Computes distance (nautical miles) and i itial course (degrees) of a great-circle path betweentwo locations. Requires subroutines CQ SIN, ARCOS. Author - Ralph Johnson.
Oceanographic Services BranchNational OcAarnographic Data CenterNOAA/EDSWashington, pc 20235
Copy on file at NODC
Telephone (202) 634-7439
Map Projections and Grids I Language - FORTRAN.
MAP Hardware IBM 360-40/CalComp 763 plotter
OlProvides A wide variety of map projections and grids to facilitate the display of geographical-data. The subroutine has been written in as modular a form as possible to'allow for ease ofinsertion or deletion of routines. Provides the following projections: Mercator, Miller,square, cylindrical stereographic, Lambert equal-area cylindrical, flat-polar equal-area sinu-soidal, equal-area sinusoidal, Mollweide homolographic, polar stereographic, Lambert equal-area polart_Colligan's equal-area projection of the sphere, azimuthal equidistant, transversedsinusoidal, transversed Mollweide. Author - John O. Ward.
C
I
Oceanographic Services BranchNational Oceanographic Data CenterROAA/EDSWashington, DC 20235
ti
Copy On file at NODC (tape, including land massdata file; and documentation)
Telephone (202) 634-7439
.4
115
1255
a

,--GRAPHIC DISPLAY
Vertical Bat Graphs Language - MASTER FORTRANHardware - CDC 3300/34 17K words/CalComp
Plotter
Reads and editebar graph parameters and data; calls the CalComp software which generates aplot tape. The CalComp Plottegraws the giaphs as vertical bars for any set of data whichhas less than 101 items. The gram uses numeric data and bar graph descriptive'data as in-put. Major parameter categories are X access, Y access, titles, groups, and bar labels. Fileoutput is prod:Wed (in CalComp continuous line plotter which draws individual tars; bars may .
have labels and may be slAded; there are four different types of shading,
James C. CheapDepartment ofWater ResourcesComputer Systems Division1416 Ninth StreetSacramento, CA 95814
X -Y Plots.
MUDPAK
Available from originator only
Language - FORTRAN,Hardware,- CDC 3600/24K words/CalComp Plotter
Generates plots of several dependent (y) variables vs. a common independent (x) variable. Nu-merous user options control type of plot, titling, etc. Exhaustively plots all data fromfiles, one plot per data set (data sets defined by change in key field value). Input: From1 to 10 card or tape files, Lomprising 15 dependent variables, file definition cards, plot axiscards, title cards. Output:--il -inch or 30-inch CalComp plots (uses standard CCPLOT routine)and diagnostic-listing.
Peter B. WoodburyDeep Sea Drilling ProjectBox 1529La Jolla, CA 92037
Plotting ProgramPROFL
A
Available from originator only
Telephone (714) 452-3526
Language - FORTRAN IVComputer - CDC 1600
Plots data values against depth or other parameters.
Dav d W1rth0 anic Research Divisioncripps Institution of Oceanography
P.O. Box 109La Jolla, CA 92037
SAvailable from originator only
Dendrograph , Language - FORTRAN, ASSEMBLERHardware - IBM 360 or 370/45K for 360 / CalComp
Plotter and/or 132 character lineprinter'
Draws a two-dimensional diagram depicting the mutual relationships among a group of objectswhose pairwise similarities are given. Input: A distance or correlation type matrix. Out.R12.t:
Printeeand/oi CalComp plot of the dendrograph. This program is a modification of a programby McCammon and Wenninger in Computer Contribution 48, Kansas Geological Survey. The changesare dynamic storage allocation and printer plots. The size of the input matrix is limited bythe amount of.core available; core is dynamically allocated at execution time.
16
126

Dennis T. O. Kam -Hawaii Institute of GeophysicsUniversity of Hawaii at Manoa2525 Correa RoadHonolulu, HI 96022'
Available from 14/.1 inator only
c
Telephone (808) 948-8952'
Beach and Nearshore Maps Language - FORTRAN IVHardware - IBM 1130/8K words
Topographic maps of the beach and nearshore area are computed and plotted based on nine pro-files from a baseline across the beach. 'Profiles are spaced at 100-foot intervals along thebeach with survey points at five-foot intervals along each profile. Linear interpolation issmade parallel to the baseline between adjacent profiles. Numbers and symbols are printed'toform the maps. Profilen for a series of days are used to print maps of erosion and depositionby subtracting elevations for each day from the elevations for the previous day. ONR Tech.Report No. 4, "Beach and Nearshore Dynamics in Eastern Lake Michigan'," by Davis and Fox, 1971.
Williesdi. FoxWilliams CollegeDepartment of GeologyWilliamstown, MA 01267
Available from originator' only
Telephone,(413) 597-221
X-Y Plots in a Flexible Format Language - FORTRANMEDSPLOT Hardware - CDC CYBER 74/0K octal words/
CalComp or Zeta Plotter
General purpose program to produce x-y coordinate plots in a flexible format. Point and lineplots are available in either a time-sharing (interactive) or batch mode. The prime objectiveof the program is to permit very flexible control over the got size and labeliRg at run timethrough the use of control cards. Input: (1) Control cards with plot description, (2) anyformatted BCD file with fixed length records containing one pair of x-y coordinates, on tapedi disk. Output: x-y coordinate plot and summary listing. The x-y coordinates are trans-ferred directly from data. User-controlled range checks and multiple plots can be obtained,based on the sort sequence of a control field in each data record. is field will be in ad-dition to the data fields to be plotted. Can use either an off-line 1Comp Pliptter,or an on-line Zeta Plotter connected with a telephone line.
D. BranchMarine Environmental Data Service580 Booth stkeetOttawa, Ont. K1A OH3
Available from originator only
Telephone (613) 995-2011
Plots Hydro Cast Data Language - FORTRAN IVPLOG Hardware:= IBM 1130/IBM 1627 platter
Plots the results orhydrographic casts in a format suitable for publication. Produced 8 1/2-by 10-inch plots of log (10) depth Vs. temperature, salinity, and oxygen.
Pacific Biological Station Copy on file at NODC (documented listing)Fisheries Research Board of CanadaP. O. Box 100Nanaimo, B. C. V9R 5K6
Plots STD Data Language - FORTRAN IVSTP01 Hardware - IBM 1130/IBM 1627 plotter
Plots digitized STD data in a format suitable for publication. The plotter draws and labels,axes and plots temperature and salinity vs. depth.
117'127
Pacific Biological Station -+r
Fisherie Research Board of Canada
P. 0. Bdx 100Nanaimo, B. C. V9R*
Copy on file at NODC (documented listing)
Plots Temperature-Salinity Language - FORTRANHardware -.IBM 1130
Plots T-S. and expanded T-S curves. Another program, PSAL3, plots oxygen, salinity, and tempera-
ture-oxygen curVes. FRB Manuscript Report No. 1071, by C.A. Collins, R.L. Tripe, and S.K. Wong,
Dec. 1969.
PSAL1
Pacific Biologi'al Station Copy on file at NODC (PSAL1 only, documented
Fisheries Research Board of Canada listing)
P. 0. Box 100Nanaimo, B. C. V9R 5K6,_
N;.
Sect ion Plotting Language - FORTRANHardware - CDC 3100/PDP-8/CalComp Plotter
The program uses the CDC 3100 plotting subroutines to generate data for thetPDP-8 plotting pro-
gram. The user may specify a legend (up to 480 characters),, label sizes, scale factors, the
parameter to be plotted, and the isopleths to be determined. The plotting is done on a Cal-.
pomp 31-inch plotter under control-of-the PDP-8. .Cruise data is read from magnetic tape by the
CDC 3100 in modified CODC (MEDS) format or Bedford Institute format. An iterative method is
used in conjunction with an interpolation function to determine isopleth depths. The interpo-
lation function is described in a Bedford Institute report, BIO 66-3 (unpublished manuscript)
by R.F. Reiniger and C.K. Rbss, Feb. 1966.
DirectorBedford institute of OceanographyP. 0. Box 1006Dartmouth, s2Y 4A2 4-
Available from originator only
Horizontal Histograms Language - FORTRAN IV-H
HISTO Hardware A XDS Sigma 7
Produces horizontal bar histograms on a line printer for any Variable on magnetic tape in a
standard WHOI format. Format described in a technical report, Ref. No. 69-55, "A, Nine Channel
Digital Magnetic Tape for Storing Oceanographic Data," by John A. Maitais, July 1969.
Richard E. Payne Available from originator only
Woods Hole Oceanographic InstitutionWoods Hole, MA 02543 telephone (617) 548-1400
Printer Plots Language - FORTRAN TV -H
LISPLO Hardware - XDS Sigma 7
Lists and plots the data stored on WHOI format magnetic tape. See HISTO format reference.
Output is°on the line printer. Three types of plot are possible: (1) Variable vs. time or
.sequencE number, (2) angle and speed vs. time, and (3) two variables (one on a minus and one
on a plus scale) ys. time.
Richard E. PayneWoods Hole Oceanographic InstitutionWoods Hole, MA 02543
t
Available from originator only
Telephone (617) 548-1400
118

.', 1 , e ..4.
Plot of Frequency Distribution Y Language - FORTRAN IV-H
HISTO'r
/1
Hardware - XDS Sigma Z. .
. .
.Pkoducea a two-dimensional frequency distribution of sampl averaged over chosen interval
a4afest 'time. Input: Control cards andfAata on 9-track ape. Output: A line printer plot of.
.". ' averaged'compass, vine, direction, and speed against tim .
.
.
r '" Richard E. Payne Available fr6m originator only ,
Woods Hole Oceanographic InstitutionWoods Hole, MA 02543 Telephone (617) 548 -1500
.
-.
Velocity VectOr Averages Language - FORTRAN IV-HvgctAy A Hardware - XDS Sigma 7
produces a 9-track tape in WHOI format of east and nortVrelocity vector averages and theicorresponding polar representations. (See HISTO format / /referenced
Richard E: Payne , Available from originator onlyWoods Hole Oceanographic InstitutionWoods Role, MA 02543 Telephone (617) 548-1400
Progressive Vectors Language - FORTRAN IV-HPROVEC Hardware - XDS Sigma 7/PDP-5 dfiven CalComp
Plotter optional
Computes progressive vectors from diretion and speed values. Input: Control cards and tape
in WHOI format. See HISTO format reference. Output: Listing of progressive vectors and/ora tape .to be used with a PDP-5 driven Ch1Comp for a plot of the vectors.
Richard E. Payne Available from originator onlyWoods Hole Oceanographic InstitutionWoods Hole, MA 02543 Telephone (617) 548-1400
Plots Data Alopg TrackTRACK
*
Language - FORTRAN IVHardWare - XDS Sigma 7/2986 32 bit words*/
' CalComp or Versatec plotter
Plots data in profile alon§, a ship'sis used to determine the o4entafiondata ,can be in any WHOI format or in
typically from a nine-track magneticand other options. *Another versionand works in a 16K word environment.
track. Map is in Mercator projection. The ship's headingof the data. Standard CalComp software is used. Input
a user, specified foiMet and can be from any device, buttape; also input are run-time parameters to specify scalesof the program exists for the Hewlett - Packard minicomputer
Robert C. Groman , Available from originatoronlyWoods Hole Oceanographic Institu-tionWoods Hole, ,MA 0250 . Telephone (617) 548-1400, ext. 469
4,
i---'
Profile versue,Time or Distance Language - FORTRAN IVPROFILE Hardware - XDS Sigma 7/4010 32 bit words*/
CalComp or Versatec plotter
Plots in profile versus time or cumulative distance, all WHOI standard formats or a ueer-dhp-plied format. Uses standard CalComp software. Input: Date,from any device and run-time pa-
rameters to specify scales and other options. 'Output: Plot tape for offline use and printed
information about the run. *Another version of this program for the Hewlett-Packard
minicomputer and works in a 16K word environment.
119
129

Robert C. Groman Available from originator onlyWeods Hole Oceanographic InstitutionWoods Hole, MA 02543 . Telephone (617) 548-1400, ext. 469
Plots Navigation with Any Other Data Type Language - FORTRAN IV
DEEP6 Hardware - Hewlett-Packard minicomputer/16K 16 bit words/CalComp plotter
4
Merger} and plots x-y navigation with another data type. For each data point a linearly interApolaCed position is calculated. Plots can be annotated x-y charts, data profiles along theship's track, or profiles vs. time or distance. Input:. x-y navigation data in meters or fath-oms; a tine series of data to be merged with the navigation; and input parameters specifying'scales and options.
Robert C. Groman Available from originator onlyWoods Hole Oceanographic InstitutionWoods Hole, MA 02543 Telephone (617) 548-1400, ext.469, 7f
.2
Line Printer Plots Language - FORTRAN, COMPASSGRAPH2 Hardware - CDC 3800/4112 octal (2122 decimal)
locations*
This subroutine is intended to be valuable for scientists who want a fast and economicalmethod of producing plots of their data but do nOt require the high resolution (100 points perinch) of the Ca1Cemriotter. Modified by Dianna L. Denton from a program written at the Uni-versity of Wisconsin. NRL Memorandum report 2046 (NW Computer Bulletin 12), Aug. 1969.(*excluding the Common block (11031 octal - 4633 decimal) and system library routines).
Research Computation Center Copy on filat NODC (tape, above report)Naval Research LaboratoryWashington, DC 20375
Magnetic SignaturesMAGPLOT
Languagd - FORTRANHardware - CDC 3600/CDC 3800/706768 words/On-
line plotter
Separates and characterizes the various compon is of magnetic noise in magnetometer recordstaken Vom a sensor towed at sea. Gives a print t of histogram data for each of three wave-length filters: N(amplitude) vs. amplitude; N (wavelength) vs. wavelength. Also producesplots of filtered magnetic fields as function of distance. Program is briefly described in.NRL Formal ReportrNo. 7760, "Geological and Geomagnetic Background Noise in Two Areas of theNorth Atlantic."
Pdrry B. AlersNaval Research LaboratoryWashington, DC. 20375
Available from originator only
Telephone (202) 767-2530
4
, 49
Sequential Plottirig Language - FORTRANHardware - IBM 360-65
Subroutines produce plots using a digital computer output printer. The consecutive x, y data
points are plotted with symbols consisting of letters and numerals. Permits rapid plotting of
either a single- or a multivalued curve when high resolution is not required. NEI4 Report 1613
by A.G. Rock, March 1969.
Naval Electronics Laboratory Center 'Copy on file at N DC (documented listing)
San Diego, CA 92152
120
130

Machine Plotting on Mercator Projection ' Language - FORTRAN 63. 1
.. , 3 Hardware - CDC 1604/CalComp 165 plotter
, ,,
Utilizes meridional parts to locate data points on Mercator - projection maps, using a shared-. time plotting routine. The con nt outlines can also be plotted by straight-line segments.
NUWC Report TP-89 by L.A. Smother Dec. 1968. Final version of program written by K.K. Starr.
Ocean Sciences DepartmentNaval Undersea ResearchDevelopment Center
San Diego, CA 92132
Overlay PlottingOVLPLT
Performs overlay plots on the FR-80 graphicknowledge of IGS required by user: Fitting
Peter D. HersteinNaval Underwater Systems CenterNew London, CT 06320
Copy on file at NODC (above report)
language,- FORTRAN .
Hardware - UNIVAC 1108/12K plotter comp tiblewith Integrated Graphics S stem
system using the Integrated Graphics System. Noof data into bounds of "good looking" graph.
Available from originato7nly
Telephone (203) 442-0771, ext. 2305
Physical Dafa Plot Language - FORTRAN
FRAME Hardware - CDC 3300.
Using arrays of profile data and specifiCation parameters his subroutide prepares a tape for
the UCC plotter to provide a profile plot of-depth ka. erature, conductivity, salinity,
sigma -t, and sound speed.
K. Crocker Available from originator onlyNaval Underwater SA'stems Center "Newport, RI 02840 '' 7 Telephone (401) 841-3307
Reformats Data, Plots Track Chart language - FORTRAN V
MASTRACK ,Hardware - UNIVAC 1108 /Instructions 5K words/Data 5K words/2K Plotter buffer,
, 3 tape units /CalComp Plotter
tibeaodes blocked BCD data tapes in NGSDC format into UNIVAC SDF format and plots user-scaledMercator track charts Annotated with any and all underway parameters. Author - Peter J. Topoly.
-
Data Systems Office AVailable-from originator onlyU.S. Naval Oceanographic Office
o Washington, DC 20373 Telephone (202) 763-1449
0
Produce Contour Charts , language - FORTRAN;
GRIDIT, REGRIDIT; AUTOkATED CONTOUR Hardware -
Three programs which enable the user to graphically produce a contour chart by the computer-
plotter method. GRIDIT produces a digitized matrix. from data points which have been screened,
for gross errors. REGRJDIT produces a digitized metrix'from raw unchecked data points. AUTO-
MATED CONTOUR construct a contour chart from a digitized matrix. An example is given for use
of the program in contouring the bAthymetry of the ocean bottom. Informal manuscript repoktER No. 67-4, "An Automated Procedurd for Producing Contour Charts," by Roger T. Osborn; Feb.
1967.
t
4
121

-
Data Systems OfficeU.S. Naval Oceanograftic OfficeWashington, DC 20373
Profile Plots; Time AxisP1WFL3 .
A
Makes- profile pl tssof up to threeeasy conversion t Calcomp. Input
titleg, symbols, etc.) and formatsthree values.
Graft McHendrieOffl.ce of Marine GeologyU.S. Geological Survey345 Middlefield RUad'Menlo` Park, CA Y#025
IProfilePlots, Distance AxisPFLDST
Copy on file at NODC,(Above report; includeslisting)
Telephone,(301) 763-1449
Language - FORTRAN IVHardware - IBM 360- 67/110K bytes.for 1500
values Ver profile/Plotter
valueek along a time axis. Uses Benson-Lehrner plotter or
: Cards with specifications for profiles (scales, values,, and data cards with Julian dalk, hour, minute, and one to
° eo
Available from originator only
Telephone (415)'323-8111*, ext. 2174
'Language - FORTRAN IV,Hardware - IBM 360-67/130K bytes for 1500
values per profile /plotter
4'Produces profile plots of up to three values along accumulative distance axis. Uses Benson-
L4rUer plotter or easy conversion to CalComp. Input: Cards with specifications for eachprdfile (scale, values, symbols, title, etc.) and formats, and data cards with Julian day,hour, minute, latitude, longitude, and-one to three values.
Map PlotsMAPPLT
Graig McHeddrieOffice of Marine GeologyU.S. Geological Survey`345 Middlefield RoadMenlo Park; CA 94025
a
)La guage,- FORTRAN IV
°;
,H4dware - IBM 360- 67/244K bytes foriZ500 nay.or 6000 data points/Plotter
. r
Available from originator only
.1.
Telephone (415) 323-8111, ext. 2174
,
Makes, map plots df eider data values or navigatipn data on"a Merca r, transverse Mercator,
conic or Lambert conformal,projection. Maximum map size is 28 x inches. Assumes equator
rial radius of earth-is 251,117,000 inches and that west longitude nd south latitude are inputas negative values. .Uses Benson-Lehrner plotter or easy conversio to CalCoMp. Input: Eleven
cards with title, forMats, and map windoy specifications followed y 4ata,on eithe&cards or
tape. Navigatiqp data: Julian day, hour, minute; latitude, longttude. Data valued: minute
(or sequence no.) valuet latitude, longitude.
Graig.McHendrie Available from
, Office of Marine Geology4.S. Geological Survey345 Mi dlefield RoadMenlo ark, CA 94025
Plots Scattergram
t
originator only
Telephone (415 323 -8111, ext. 2174
O
Language - FORTRAN IV
SCIGM4 and SCTGM5 Hardware - IBM 360-65
These subroutines plot a simple scattergram from a seecif de la pairs. The data are first ad-
justed to fit in a range of 1 to 100, then rounded, and the cattergram is generated by
4'122
.13?..4

4- subtracting Oe origin from each data point and then fixing, or truncating, the number to yield-
a sat of subscript pairs. The location for eah subscript pair in the black array is filledwish the number of occurrences and finally a plot is produced. These routines ignore out of
bound points/.
P ul Sabolnter for eriiiient Design and
Data Analysis, NOAA/EDSahington, DC 20235
( X-Y Plots
EBTPLT
A generalacter plo
plays VHRR Satellite Data)
Available from originator only
Telephone (202)'634-7344
a
Language - FORTRAN IVHardware - CDC 6600/FR80 Precision Microfilm
Recorder
zed x-y plot package. ,Allows various manipulations of axes as well as special char-
ting..
Robert DennisCenter for Experiment Design andData Analysis, NOAA/EDS
Washington, DC 20235
Available from originator only
9
\Telephone (202) 634-7340
Language'- FORTRANHardware - CDC 6600/54K words/Digital Muirhead
Displayer/NESS displayek run byCDC 924
DisplOws VHRR data from the ingest tape on the Digital Muirhead Displayer (DMD) in 5,000 mode(500('picture elements per scan line;'4,000 maximum scan lines per picture). The program uses
a two spot running mean of spq spots of a possiblep6A72 along each scan made by the VHRR in-
strupent. It converts each averaged spot via lookup table to a display grayscale. The s art-
lng scan line, the number of scan lines to be prOcessed, the starting spot, and the grays aleloo up,table are controlled by data cards.
John A. Pritchard.National Environmental Satellite
Service, NOAASuitland, MD 20233 ,
_.0
Microfilm Plots of VHRR Sattellite DataSVHRR4KM
Available from originatoronly\.
.Thlephone (301) 763-8403
Language - FORTRAN H ExtendedHardware - IBM 360-195/FR-80 Precision Microfilm "°.
Recorder /256K 8 bit bytes
/ Displays the VHRR daia from the VHRR ingest tape in the fOrm of printed chartfters on 16mm mi-crofilm in bloc1s of 128 characters by 48 characters., Each printed charactet will representa square four kilometers on a side at the subsatellite point, is obtained. by averaging four
lines and six spots along each scanrline of data from the VHRR ingest tape, and then is deter-
mined by a character lookup table. The program is capable of utilizing 3R40 digital spots of a
possible 4842.
John A: PritchardNational Environmental Satellite
Service, NOAASuitland, MD 20233
AVailable from originator only
Telephone (301) 763-8403
Vertically Analyzed Contours of Oceanographic Language - FORTRAN 63
Temperatures and Salinfties, VACOTS Hardware - CDC 3600/CalComp. plotter/32K words
123
133

--' .
Provides a rapid and accurate means of constructing vertical cross sections of sea00-!..
temperatures1
and salinities. Although this program has been designated to use STD data recorded on magnetictape, other versions are being used to,contour biological, chemical, and other physical oceano-
graphic data. Each vertical section is divided into two parts: the upper section for the con-
tours from the surface to 300.m, aid the lower section from 300 m to voo m. Running time:
To analyze and plot contours at intervals of 1 degree C for temperature a dal parts per thou-sand for salinity from the surface to 1p00 m for 50 stations requires four minutes of computertime on the CDC 3600 and 25 minutes on the 41.Comp 30-inch plotter. Author - Forrest Miller.
Southwest Fisheries Center , Copy on file at NODC (deck, documentation)
National Marine Fisheries Service, NOAAP.O. Box 271La Jolla, CA 92037 Telephone (714) 453-2820
Oxygen, Phosphate, Density Plots Language - FORTRAN IVHardware - IBM 360-65/CalComp plotter/33K bytes
Plots oxygen vs. phosphate, oxygen vs. ,sigma-t, and phosphate vs. sigma-t (single or multiplestation) for purposes of quality...control and study of water types. Input: Hydrographic data
in ICES format. Author - Marilynn Borkowski. -3
Southeast Fisheries Center .Copy on file at NODC (documented listing)National Marine Fisheries Service, NOAA75 Virginia Beach DriveMiami, FL 33149
General Mercator Plot Language - FORTRAN IVHardware - IBM 360-65/CalComp Plot er/42K bytes
Plots any variable on a Mercator projection; has option of writing in value or ing a point
plot, and of connecting the points with lines. Input: Any header bards in / :S format. Pro-
jection plot may be in any scale per degree, and may include a coastline (ob =ined from a digi-
tized world tape layout). Author - Marilyn BorkoNski.
Southeast Fisheries Center Copy on file at NODC documented listing)
National Marine Fisheries Service, NOAA75 Virginia Beach DriveMiami, FL '33149
0
Pldtter Commands Language - Assembly language under RTE
PLOT, DVR10 Hardware - HP 2100S, A
These subroutines are modifications of the HP subroutine PLOT and the RTE drilifLr DVR10. To-
gether they control a CalComp or CalComp compatible .01" or .0025" incremental step drum plot-ter with three-pen operation.' EqUipment type is, identified through subchannel. Plot incre-
ments are calculated in double precision integet.
'Robert A. O'Brien, Jr. Available from originator only
Shipboard Computing Group, C6de 8003
Naval Research LaboratoryWashington,, DC 20375 Telephone (202) 767-2387
124
134

-710.9
TIME AND SPECTRAL SERIES ANALYSIS
Spectral' Analysis Subroutines Language - FORTRANHardware - UNIVAC 1108/30K
n digital time and spectral series, produces autospectral autocorrelation plots and list-and phase' angle vs. frequency plots.
.1
Scalir Time Series'
TEMPLT7
Peter D. Herstein Available from originator only
Naval Underwater Systems Center
New London, CT 06320 telephone (203) 44270771,bext. 2970
Language -.FORTRAN IVHardware L CDC 6400 (SCOPE 3.4)/100K (octal)
10 character words /Cafomp936/905 Plotting System
Computes and plot's statistics, h togram, time series, and spectrum for time series of any sca-
lar quantityy,Input: Scalar time series on tape in CDC 6400 binary format; maximum number of .
data points is 4236. Output:' Listing and tape for off-line plotter. Perfect Daniel frequency
window used to compute spectral estimates from FFT generated periodogram values.
James R. HolbrookPacific Marine EnvironmentalLaboratory, NOAA
3711 Fifteenth Avenue N.E.Seattle, WA 98105
lime pries Plotting
Available fromoriginator,only_
Telephone (206) 442-0199
Language - FORTRAN 32Hardware - CDC 3100/PDP-8/CalCoMP Plotter
the program uses the CDC 3100 plotting subroutines to generate data for the PDP-8 plotting po-
grata. The user may specify a legend (up to 480 characters), label sizes, scale factors, theparameter to be.plotted and the isopleths to be determined. The plotting is done on a CalCoMP
31 inch plotter under control of the PDP-8. Cruise datais"read from magnetic tape by the CDC
3100 in Bedford Institute format. Time is plotted along the X axis (drum movement).and depthi
along the Z axis (pen movement). Stations are plotted to the nearest day. Author - D.J.
Lawrence. June 1969.
DirectorBedford Institute of OceanographyP. O. Box 1006Dartmouth, N.' S. B2YAA2
Available from originator only
Telephone (902) 426-3384'
.'.
. .
Time Series Analysis Programs Language - MS FORTRAN
TSAP Hardware - CDC 4400 or CDC 3150/Disk/3 tape. UnitsiCalCompPlotter.-
' A series of programs that edit digitized time series data, produce plots, prahability distribute
tions, perform fast Fourigr transforms on data and convert Fourier coefficients`into-power and
- cross spectra. Input: Digitized magnetic tape outpu t from program A TO D and data cards.
Output: CalComp plots, printer plots,ttion dump ordata,tape, magnetic tape of Fpurier coef-ficients, listing of spectra, disk fil of spe4ra. ComputS Note BI-C-74-2, May 1974.
-''F. W. DobsAn .4cailable from originator onlyBedford institute of OceanographyP. O. Box 1006 .
Dartmouth, N. S. B2Y 4A2
135
Telephone (902) 426-3584
125
4
Time Series - Analog to Digital
A TO D
Language - MS FORTRANHaidware - CDC 3150/32 Kords/1500 tracks on
scratch disk/2 tape units/Crown:CI822 tape recorder and Airpax
'0. FES24 discriminators for BIO
A-D,converter
Digitizes analog time series data at fixed time intervals; removes means and trendspand writesdata on digital magnetic tape; processes data from sensors used & air-sea interaction studies.
Input: Up to 12-channel magnetic tape read in through on-line A-D converter; control cards.output: Summary listing and digital magn etic-tape. Computer Note BI-C-74-1, Feb. 1974.
.
S. D. Smith Avapable from originator onlyBedford Institute of OceanographyP.' OA Box 1006
Dartmouth, N. S. B2Y 4A2
Time Series RoutinesARAND SYSTEM 0
(Number in parentheses at end ofeach abstract is key to referencesat end of series.)
ACFFT computes the _ei= on
variation of convolution prope
fas r transform algor
or
ty
(2
Telephone (902) 426,-3584
Language - FORTRAN/COMPASS (assembly)Hipware - CDC 3300/OS -3 ti9-sharing
operating system/Less.th;iii-3Z-K
4 character words/Griphics:Tektronix 4002 or 4010 graphicsterminal, CalComp 1627 II dru160-'dremental X-Y plotter. Hewlett-Patkard 7200A graphics pldtt,er
autocovariance function of a single time eries using a
of the.discrete Fourier transform in co unction with a
, 4, 5)
.067:101%,
6060'
ACORR computes the autocorrelatio nction-of a time series fora,givennumber of lags. 943)
ACRPLT is designed to plot estima ed autocorsplation or partial autocarrelation functions;standard error designations are cluded: Provision is made'for the inclusion of confidRope'"
cer-
tain lag are zero. ,'CalComp or ktronix. (3, 6)intervals that correspond to h theses thatuall theoretical cdtrelatioovaluesty24!,1
.,.
ALIGN aligns cross correlatioh orcross covariance values, shi ting the estimate so that a
specified, lag becomes lag zero. tc is interred for use prior t COmputing estigtes of the
squared coherence and,phase spectra,& two time series. (2, 7)
*AMPHCO determines the amplitude, phase\ ana -tre-iquared coherence, given the, spectral density
e ... f
functions, the cospegerrum and.the quadrature spectrum of two time.series. (1, 7, 8) . ,
ARMAP pf?Aluces realizqiO'Os or observed time series of an autoreressive, moving average, ofmix0.fagressive-moving average process. The order of the,autoregressive and/or moving average
..,
`.,voo.*rator. cannot exceed three; one realization is produced per call and there is no restrictionon the length of the observed time series. (3, 6)
AUTO calculates values of the biased autocovariance unction. (1, 9)
i i,
.
AUTOPLT is designed to plot autocorrelation or autocovariance functions onthe CalComp 1627 IIplotter. The routine scales the yalqes, determining the range of the valueEcto be lotted on '
the- Y-axis. (2) 1
AXISL is a plotting aid allowing for general purpose axis din asseaVy language And uses eleinents of the COMPLOT'drive
v
9
c
(4-
/ .
tTng and 1!!belpf.,9Itis writterk
3)
'APCCFFT employs the convolution property of the discrete Fourier transform inconjundtion with
.
0
e
;126 7
136
p,.f

the fast Fourier transform algorithm to compute the cross-correlation (covariance) function.
(2, 4, 5)
CCORR computes the biased auto- and cross-correlation.functions of two time series. (1)
CROPLT accepts squared-coherency spectrum values and plots coherency on a hyperbolic arctangentscale which allows a constant length confidence interval to be constructed. (2, 7)
COMPLOT is a set of subroutines intended to provide a basis for easily programing graphics ap-
plications. These subroutines expand relatively simple instructions specified by the programer
to include all of the necessary details for the plotting device. COMPLOT was designed to be
utilized in a time-sharing environment with any pf the above plotting devices; also, pro$isions
have been made for plotting on combinations of these devices. (3)
CONFID determines multiplicative factors used,in constructing confidence intervals for mean-
lagged product spectral estimation. (1, 7)
CONFID1 determines the multiplicative factors necessary to construct,confidence intervals forpower spectral estimates found by averaging short modified periodograms, as in FOUSPC, FOUSPC1,
FOUSPC2, and YFTPS. (3, 10)
COMMODE is a series of subprograms designed as aids to conversational programing with the fol-
lowing fbur objectives: (1) to allow the user to respond in as natural a way as-possible with-in the limitations of the operating system available; (2) To make all responses entered by the
user consistent in use (3)tTo provide a complete set of input/output subprograms for conversa-tional-mode use; (4) To allow ease in usage from a programing point of view, with fairly fast
and efficient execution. (3)
COPH computes squared-coherence and phase intimates, given power spectral, cospectral, and
ecRiadrature spectrum estimates. The phase estimates can be in either degrees or radians. Simi-
lar to AMPHCO. (2)
CO TR computes the discrete cosine transform of an even function (array of values).. Goertzel's
me od is used. (1)
CPEES is a-conversational program used in modeling. CPEES picks up information output on file
.by the CUSID routine, asks the user a few questions, and then determines initial or final pa-rameter estimates for the identified, model! Calls USPE and USES,, getting preliminary and final
parameter estimates. (3, 6)
CBT1 is a conversational calling program for the plotting routine PLTSPC, used to plot spec=
tral estimates with ionfidence intervals and bandwidth. Theliibitam allows the user to plot as
many data sets as he likes from the same or different files.%(2)
ActCPLT2.is a conversational program to produce plots of frequency dependent.data using routine'
PLTFRQ. The program allows the user to plot as many data sets ae he likes from the same or
different files. (2)
CROPLT is designed to plot the cross correlation (covariance) functions of two time series onthe CalComp 1627 II plotter. The routine automatically scales the values, determining the
range pf values to be plotted on the Y-axis. i2)
CROSS computes the two cross covariance functions (biased) of two time series. (1, 9)
CUSID is the first of a series of three conversatinal programs that collectively perform Model
identification, parameter estimation (see CPEES), and forecasting (see CUSFO) for autoregres-sive integrated moving average models. This program corresponds to the identification phase inthe modeling process, accepting time series data and computing the autocorrelation and partialcorrelation functions of the series after seasonal and/or nonseasonal" difference operators have
been applied. The routine is designed for use at a Teletype or a Tektronix graphics terminal;selection of graphics output of the din and correlatipn functions other the CalComp plot-ter or the graphics terminal is available. (3, 6, 11; 12)
CUSFO computes and plots forecasts from the o iginal data and a fitted ruu e . See CUSID. (3)
127
137 .

.
CET computes z-transform values of a finite sequence of real data pqints using the chirp ztranSfo algorithm. Points at which transform values will be computed must lie on circular orspiral c ntou s in the complex plane. The contour may begin at any point in the plane and the
I..-constant r frequency spacing between points on thig contour is arbitrary. A special con-tour of pa Cular importance is the unit circle in which case a Fourier transform is computed.(2, 13, 14)
DATPLT is a general purpose plot routine for time series data. (3)
DEMOD1 estimates values of the energy spectrum of a time series using complex demodulates. Thefrequencies (in cycles per data interval) at which spectral estimates are to be computed areinput in the form of an array, allowing one to consider isolated frequencies or a collection ofrelated frequencies, such as an arithmetic progression. Only every Lth value of the complexdemodulate at a particular frequency is computed and averaged to fprm the spectral estimate atthat frequency, where L is specified by the user. (1, 15, 16)
DEMOD2 finds' the complex demodulate at the given frequency, given a time series, an array offilter weights, a selection integer, and ,a single frequency. The values of the complex demod-ulate at the given frequency ate returned either as real and imaginary parts of complex numbersor in terms of amplitudes and phases. A.in DEMOD1, the calculations use the method of Goert-zel for the eVafation of discrete Fo ier transforms. (1, 15, 16)
DEMOD3 accepts output from DEMOD2 and calculates an energy spectral estimate at a single fre-quency. 1, 15, 16)
DETREND removes a mean or linear trend from a time series, writing over'the input array. (1)
DIFF12 computes first or second forward differences of a series...(1) '4
EUREKA finds either the solution to the matrix equation R'f g wh s R is a Toeplitz matrix(i.e., a symmetric matrix with the elements along the dAgonals equal) and f,is a column vec -.tor, or the solution of the normal equations which arise in least-square-filtering and predic-tion problems for single-channel time series. (1, 17, 18) ,%
EXISMO computes a triple exponentially smoothed series. (1, 9)
free-form input routine, allows for the reading of numeric inf9rmation in BCD that isrela ly format free,,FFIN returns a single value on each call, and operates by reading 160chafe era (2 cards or 2 card images)*and advancing a pointer through the bufferon eaCh sub-sequent call until more information must be input or reading is complete. A companion routine,FFINI, operates exactly as FFIN except that the buffer is cleared and new ihformation,input oneach call. Bgth routines set the EOF bit if an mid of file is encountered. (3)
co%.,
FFTCNV computes the convolution of a series with a weighting function using the fast Fouriertransform algorithm. The program is designed for the convolution of long series with a rpla-tively short weighting function. (2, 4, 5)
FFTPS uses a fast Fourier transfofm algorithm to compute spectraL estimates by a method of timeaveraging over short, modified periodograms. (1, 7, 10)
Ifor
FFTS -computes the direct or inverse transform of real or complex data, using a power of twofast Fourier transform algorithm. (2)
FFTSPC finds a raw or modified periodogram for a sequence of real data points using a power oftwo fast .Eouriar transform algorithm, i.e., the absolute value squared of raw or Hanned Fouriercoefficients are found and suitably scaled. This subroutine is intended for use with time se-ries whose length is slightly smaller than or equal to a power of two. (3)
FILTER1 designs symmetrical, non-recursive digital filters. It is conversational in form andis intended for usest, a Tektronix 4002 graphic terminal. Two design techniques are supported,corresponding to the subroutines GENER1 and FIVET. Outputs include an array of filter weightsand the attained frequency response. (2) .
,
FIVET designs non-recursive symmetrical digital filters. The design technique is known as the5T's method and requires that the specifications be given for the desired frequency response
128
138

function, the maximum allowable deviation from the desired response, and the bandwidth of tran-
sitions in die attained. response corresponding to discontinuities in the desired response. (2,
19)
FOLD performs polynomial multiplication or, equivalently, the complete transient convolution of
two series. (1, 17) .-
FOURTR takes the 'Fourier transform of real data; many output options are available. (1, 20)
FOUSPC finds the Fourier transforms of segments'of a time series. The segments must be of
equal length, but may abut, overlap, or be in any order relative to the .given time series.
FOUSPC can be used in conjunction with SPEC to estimate power spectra by a method of timeav-
eraging over short, modified periodograms. Note that if one is pt interested it examining the
Fourier-like coefficients of each segment before passing on to s rsl estimates, then FOUSPC1
or FOUSPC2 should be used. (1)
FOUSPC1 computes the power spectrum of a time series by a method of, averaging over short, modi-
fied periodograms. (3, 7)
FOUSPC2 is similar to FOUSPC1, but accepts two time series, computing the cross spectral matrix
at specified frequencies. (1)
FRESPON computes the frequency response of a filter. (1)
GAPH computes and plots estimated gain and phase functions of a time'invariant linear dystem.
The gain values are plotted on a logarithmic scale and both gain and phase plots include con-
fidence interval constructions. Input includes smoothod power and cross spectra estimates.
(3, 7)
GENER1 is a filter design program. It may also be used to generate weights of lag window or
data window, although the routine WINDOW is specifically designed to perform this task and is
therefore somewhat easier to use. (1, 26)
OBNP442 generates an arithmetic progression. (1)
GENER3 designs a symmetrical low -pass filter given an array containing desired frequency re-
sponses at equally spaced frequencies from zero to one-half cycle per data interval. (1)
LOGPLT plots power spectral esttmates on a base ten logarithmic scale, the output device being'
a CalComp 1627 II plotter. Thelpbroutine automatically scales the estimates, determining the
range of values to be plotted on the Y-axis. The estimates must have been computed at equally
spaced frequencies. An 80% or 95% confidence interval (computed using routine CONFID) is also
plotted. (2)
NOIZT tests a time series to determine if it can be considered a realization of a white noise
process. The test is a frequency domain test involving the integrated spictrum of the series.
The results are plotted with 80% and 95% confidence regions. (2, 7, 21)
PHAPLT plots the phase estimates with 95% confidence intervals on the CalComp 1627 II plotter.
The phase estimates must have been computed at equally 'spaced frequencies and, in order to gen-
erate approximate confidence intervals, the associated squared- coherency estimates at these
same frequencies must be given. (2, 7)
PLTFOR graphs an initial segment of.time series data followed by a set of forecasts that in-
clude upper and lower probability limits as generated by CUSFO or USFO. (3).
PLTFRQ allows frequency dependent functions to be plotted versus any arithmetic progression
frequencies, using the CalComp 1627 II plotter. .ghe routine scales the frequency values, de-
termining the range of the values to be.plotted OR the Y-axis. (2
PLTSPC is,designed to plot.power spectra on the CalComp 1627 II plotter.. The routine scales
the spectral estimates, automatically determining the range of valuer4to be plotted on the y-
axis. Also, the plotting of spectral window bandwidth and confideune'intervals is possible.
The bandwidth of the spectral window associated with Illy lag window the user may have used, is
129
139
computed by WINIIOW anti the multiplicative factors needed to determine confidence intervals canbe found using the CONFID routines. (2)
POLRT c putes the real'and comp/ex roots of,a pol4ppial with real coefficients. (1, 9, 17)
POLYDV divides one Rolynomial by another or deconvolves one signal by another. (1, 17)
PROPLT produces a profile plot on either the° Tektronix graphics terminals or the CdlComp plot-ter or both, and is intended for use with the routine TIMSPEC which produces spectra from Begments of a long record, the segments being equally spaced in time."-Thi profile is not a tr(perspective view, as the frequency (horizontal) axis of each spectr s of constan,t_length anseparated on the time (vertical) axis by a constant amount. (3)
. .
PSQRT computesqhoefficients'of the square root of a power serieshor polynomial. (1, 17)
RANDM generates a (pseudo) random sample from one of four possible Population distributions,with the size of the sample specified by the user. The population mean is fixed at zero; thevariance or scale parameter is user definable. Provisions have been made for repeated.Callsto RANDM; that is, one can generate a, number of independent random samples from the same ordifferent populations. (3, 22)
\\
RCTFFT computes the discrete Fourier transform of real data.using the Cooley-Tukey fast Fpu-rier transform algorithm. The number of data points must be a power of two. (1)
RESPON computes the square of the absolute values of the frequency response of a general filter.(1)
REVERS performs bit-reversing on an array of complex data points. REVERS is written in COMPASSand is used in programs employing the fast Fourier transform algorithm. (1)
RPLACE changes specified values of a time series. The indices of the values to be changed andthe new values themselves are read in by RPLACE according to a format specified by the user.(1)
RAVERS performs bit-reversing on an array of real data points; the subroutine is written inCOMPASS and is used in rirPS. (1)
SARIT produces a series by *lel computations on one or two other series; there are seven dif-ferent choices for Che series to be produced. (1)
SERGEN geneiates a time series by adding random numbers or noislato a signal, in this case 'atrigonometric series.' Inputs include amplitudes or coefficients of the trigonometric series,an array of random numbers, and a parameter specifying the desired signal level to noise levelratio. (1, 23)
SHAPE designs a filter which will shape a given series into a desired output series. (1, 17)
SINTR calculates the discrete sine transform of a series of\data points. (1)
SMO calculates a smoothed or filtered series, given a time Berle?, a selection integer, and aweighting function. (1, 9)
SPEC accepts output from iblISPC, computing either the power spectrum of a single time series orthe cross spectral matrix of two time series. In the latter case, FOUSPC must be called twicewith different time series at each call, but with the same arithmetic progression of frequen-cies. (1)
SPECT1 is a conversational main program designed, to estimate, output, and plot the autocorre-lation and auto spectral functions of a single time series. It is intended for use at a tele-typewriter. (2)
SPECT2, a conversational main program for use at a teletypewriter, computes power spectral,squared coherence, and phase estimates. The program allows the correlation functions of thetwo time series involved, the power spectral, squared coherency, and phase estimates to be
I.
fA
130
140

output on a combination of devices, including the Teletype, line printer, CalComp plotter and
disk. (2, 7)
TAUTOPLT is designed to plot autocorrelation or autocovariance functions on a Tektronix 4002
graphics terminal; the routine scales the values, dete;mines the range of the values to be
plotted on the Y-axis. (2)/ - ,
TCOHPLT, designed for use with a Tektronix giaphics terminal, plots coherence estimates on ashyperbolic arctangent scale, allowing the construction of confidence intervals whose length is
independent of frequency. (2, 7)
TCROPLT plots the cross correlation (covariance) functions of two time series.on the Tektronix
graphics terminal; the routine automatically scales the values, determining the range of values
to be plotted on the Y-axis. (2)
TFORM1 calculates values of the spectral density function at any arithmetic progression of fre-
quencies on (0,1/2] cycles per data interval, given autocorrelation or autocovariance function
of a time series and an array to be used as a weighting kernel. This weighting kernel can be
generated using the routine WINDOW. (2, 7, 8)
TFORM2 computes the co- and(quadrature spectrum estimates for an,arithmetic progression of
frequencies on the,interval zero to one half cycles per data interval, given the auto and cross
.correlation functions. Similar to TRANFRM except tat it does not produce the associated auto-
spectral estimates. (2, 7, 8)
11 TIMSPC finds power spectral estimates computed from segments of a long time series, the begin-
ning of each segment'being equally spaced in time. The computational approach is a direct one
via a fast Fourier transform algorithm and the technique, is appropriate for segment lengths
slightly less than or, ideally, exactly equal to a power of two. Thus? the routine allows one
to compute a type of "time varying" spectra and these spectra can be graphically examined with
the aid of a profile plot 6ROPLT) or a contour plottifig routine. (3)
; '
TLOGPLT plots power spectral estimates on a logarithmic scale and is,designed for use with a
Tektronix graphics terminal. The routine automatically scales the eatimates, determining the "
range of values to plot on the Y-axis. The estimates must have been computed at equally spaced
frequencies. An 80% or 95Z confidence interval (computed using routine CONFID) is also plotted.
(2)
TNOIZT performs a frequency domain teat to determine if a time series can be considered a '
white noise or purelyrandom process. The test is appropriate for detecting departures from
whiteness due to periodic effects, and is intended for use id conjunction with a.test based on
the autocorrelation function for detecting local correlation. The routine plots theoretical
integrated spectrum values with 80% and 95% confidence regions, the integrated spectrum esti-
mates of the time series being computed from Fourier coefficients input to TNOIZT. These Fou-
rier coefficients may be computed using the FOURTR or RCTFFT routine. (2, 7, 21)
Ak,
TPHAPLT plots the phase estimates with 95% confidence intervals en a Tektronix 4002 graphics
terminal. The phase estimates must have been computed at equally spaced frequencies and, in
order to galerate approximate confidence intervals, the associated squared-coherency estimates
at these same frequencies must be given. (2, 7)
TPLTFRQ is designed to plot frequency response function (or any function of frequency) on a Tek-
tronix graphics terminal. The routine scales the-frequency values, determining the range of the
values to be plotted on the Y-axis. (2)
TPLTSPC is designed to plot power spectra on a Tektronix graphics terminal. The routine scales
the spectral estimates, automatically determining the range of values to be plotted on the Y-
axis. Also, the plotting of spectral window bandwidth and confidence intervals is. possible.
The bandwidth of the spectral window associated with any lag window the user may have used is
computed by WINDOW and the multiplicative factors needed to determine confidence intervals can
be found using the CONFID routine. (2).
TRISMO_is designed for smoothing spectral estimates evenly spaced over the interval (0,1/2] (in-
cpding end points), or .equivalently, zero to the Nyquist frequency. The spectral window
131
141

applied is a triangular one and the smoothing or convolution is done in a recursive fashion,making it relatively fast. (3, 24)
TSGEN is a conversational program for the generation of a wide variety of time series. Morespecifically, the 'program constructs realizations of autoregressive integrated moving averageprocesses where the noise process or "random shock" termsjmvolved may be input from file orgenerated witlild,the program. In the latter case,.a selection of one of four possible familiesof distributions for the noise is ai1lowed. TSGEN can be run from any Teletype-like terminal,including the, Tektronix graphics terminals. (3, 25, 6)
TSPECT1 and TSPECT2 are respectively versions of SPECT1 and SPECT2 that are suitable for use ata Tektronix graphics terminal. (2)
TRANFR calculates values of the spectral density functiol,given the autocorrelation (or autoco-variance) function of a time series and an array to be used as a weighting' kernel. Thisweighting kernel can be generated using the routine WINDOW. (1, 7, 8)
TRANFRM calculates spectral density functions, the cospectrum, and. the quadrature spectrum,'given the,autocorrelatiod (or autocovariance) functions, the cross correlation (or cross co-variance) functions of two time series and an arrafto be used as a weighting kernel. Thisweighting kernel can be generated using the routine WINDOW. (1, 7, 8)
TTYCON, written in COMPASS, is designed to be used in conVersational Prolimefor the output ofalphanumeric messages and the input of.signed'nuMhers, integer or floa,ing point, and alphany.meric characters. (2)
TTTNUM is designed to be used in conversational programs for the output of one or more alphanu-meric messages and the input of one or more signed numbers (integer or floating point) or eight-
k. character alphanumeric identifiers. (2) ,
UNLEAV is primarily designed for use with RECTFFT. The routine takes an array of interleavedcoefficients and separates them, sending the coefficients into two distinct arrays of one halfthe length of the-input affray. The length of the input array must be of the form,244-2 where Mis a power of 2. (1)
.
'USESaccepts initial parameter estimates for a seasonal or nonseasonal autoregressive-moving$ average model and then employs the (possibly differenced clad transformed) time series.being
modeled, computipg final parameter estimates. These final parameter estimates are output,along with their covariance and correlation matrix, the residuals from the fitted model, andthe sample autocorrelation function of these residuals, and chi-square statistic based on theresidual autocorrelations. (3)
USFO generates forecasts with upper a d lower probability limits, given the original time se-ries data and a fitted nonseasonal or easonal autoregressive-integrated-moving average model.Weightstfor updating forecasts are also utput. USFO thus represents the fourth and finalstage in a successful modeling attempt, beginning with model identification (USID, CUSID), pre-liminary estimation of parameters (USPE, CPEES), and final parameter estimated and diagnosticchecking ;(USES, CPEES). (3)
USID accepts a time series as input, possibly transfarms and differences the series in seasonaland/or nonseasonal fashion, 'and then finds the sample autocovariance, autocorrelation, and par-tial autocorrelation functions. This marks the first of the four programs employed in modelidentification, parameter estimation, and forecasting, the remaining subroutines being USPE,USES and USFO. Conversational programs (CUSID) and support graphics (ACRPLT) are available forUSID. (3, 6, 11, 12)
USPE accepts output from USID and choices for t'e order of the autoregressive and moving aver-age parts in modeling possibly transformed and differenced time series data; a-conversationalcalling routine for USPE is CPEES. (3) \
itlWINDOW generates an al ay to be used as a weighting function or lag window. One of six differ-ent lag windows may be selected: The rectangular or box car window, the Parzen lag window, theBartlett or triangle window, the Tukey or cosine window, the Lanczos data window, and theLanczos-squarA4 data window. (1, 7) -
132
. 142
WINDOW1 generates a symmetrical array of weights for ,use d8 a data window, as required, for ex-
ample, in the spectrum estimation procedures of the nip r utinea FOUSPC, FOUSPC1, FOUSPC2,
and MPS.' Two basic window shapes are available, the fir t having a apeetral window very aim-
, ilar to Vie Tukey or cosine window, while the second,produ es the Parzen spectral window. (1,
10) 4
REFERENCES1. ccr-70-4 (R), OS 3 ARAND SYSTEM: ,Documentation and Examples,.Vol. I (Revised 1973).
2: ccr-71-01, OS -3 ARAND SYSTEML,Documentation and Examples, Vol. II.
3. ccr-73-07, OS 3 ARAND SYSTEM: Documentation and Examples, Vol. III.
4. Cooley, J.W., P.A.W. Lewis and P.D. Welch, "The Fast Fourier Transform Algorithm andits
Applications," IBM Research Pub., No. RC1743, 1967.
5. Stockham, R.G., Jr., "High Speed Convolution and Correlation," 1966_Spring Joint
Conference, AFIPS Proc., Vol. 28, Washington, D.C. Spartan, 1966, pp. 229-233.
Computer
6.' Box, G.E.P."and G.M. Jenkins, Time Series Analysis, Forecasting and Control, Holden-Day,
San'Francisco, 1970.
7. Jenkins, G.M. and D.G. Watts, Special Analysis and its Applications, Holden-Day, San Fran-
cisco, 1968.
8. Parzen, E., Time Series Analysis Papers, Holden-Day, San Francisco,
9. IBM System 360 Scientific Subroutine Package (360A-CM-03X) Version III
10. Welch, P.D., "The Use of the Fast Fourier Transform for the Estimation of Power Spectra:
A Method Based on Time Averaging over Short, Modified Periodograms," IEEE Transactions
on'Audio and Electroacoustics, Vol. AU-15, No. 2, June 1967.
11. Nelson, Charles R., Applied Time Series Analysis for Managerial Forecasting, Holden-Day,
1973.
Wichern, Dean W., "Modeling and Forecasting Discrete Univariate Time Series with Applica--
tions," Information Sciences, vol. 6, 247-264, 1975.
13. Rabiner, L.R., C.M. Rader and R.W. Schaefer, "The Chirp Z-Transford Algorithm," IEEE
Transactions on Audio and Electroacoustics, Vol. AU-17, No. 2, June 1969.
14. Rabiner, L.R., R.W. Schaefer, and C.M. Rader, "The Chirp Z-Transform Algorithm," Bell Sys.
Tech. J., Vol. 48, pp. 1249-1292, May 196'.
15. Bingham, C.,' M. Godfrey, and J.W. Tukey, "ModeIEEE Transactions on Audio andElectroacoust
16. Granger, C.W.J., Spectral Analysis Economic .fle Series, Princeton University Press,
Princeton, NJ, 1960.t
iques of Power Spectrum Estimation,"ol. AU-15, No. 2, June 1967. 4.,
17. Robinson, Enders A., Multichannel Time Series Ana
Holden-Day, San Francisco, 1967.
18. Levinson, N., "The Weiner RMS (root mean square)diction," Journal of Mathematical Physics,
19. Helms, Howard, D., "Nonrecursive Digital Filters:
tione on Frequency Response.6.IEEE Transactions16, Nod 3, Sept. 1968.
is with Digital Computer Programs,
Error Criterion in Filter Design and Pre-25, pp. 261-278, 1946.
Design Methods for Achieving Specifics-on Audio and Electroacouatics, Vol. AU=
6
20. Hamming, R., Numerical Methods for Scientists and Engineers, McGraw-Hill, 1962.a
21. Fisz, Marek, Probability Theory and Mathematical Statistics, Wiley Publications in Statis-
tics, New York, 1963.
4
133
143r
44

22. Marsaglis, G. and T. Bray, "A Convenient Method for Generating Normal Variables," SIAM Re-view, Vol. 6, No. 3, July 1964.
23. Beyer, W.H., ed.,"Randbookof Tables for Probability and Statistics, The Chemical RubberCo., 1966.
24. Singleton and Poulter, "Spectral"Analysis of a Killer Whale Call," IEEE Transactions onAudio and Electroacoustics, Vol. AU-15, No. 2, June 1967.
25. Durbin, J., "The Fitting of Time Series Models," Rev. Int. Inst. Stat., Vol. 28, No. 233,1960.
26. Flom, A System of Programs (for the Analysis of Time Serieq, Institute of Geophysics anyPlanetary Physics, University of California, La Jolla.
'Directoe, Computer, Center Ayeilable from'originator onlyOregon State UniversityCorvall , OR 97331 Telephone (503) 754-2494
c.
Generates Arbitrary FilterHILOW
Language - FORTRAN IVHardware- IBM 1800
oGenerates a lowpass, bandpass, or highpass filter defined by three parameters, with or withoutits conjugate;punches the multipliers on cards; and lists its amplitude response over the fullfrequency'range. NIO Program No. 158. Author - D.E. Cartwright.
National Institute of Oceanography Copy on file at NODC (listing, documentation)Wormley, Godalming, Surrey, England
.
Two-Dimensional Autocorrelation Language - FORTRANHardware - IBM 7090/IBM 1401
Applies regression and correlation analydes to a sample of ocean terrain. Computes variance ,
and covariance as function of position in data field. Ref. Arthur D. Little, Inc., TechihealReport No. 1440464, "Statistical Analyses' Terrain and Contour Plotting Procedures," byPaul Switzer, C. Michael Mohr, and Richard . Heitman, April 1964. Appendices B and C of re-port describe (but do not list) two routines used: (1) "Coirelation Constants" (IBM 7090)1.(2)..."Local Means and Variances" (IBM 1401). /
Trident/ASW Library '
Arthur D. Little,Inc.4.35 Acorn Park .
Cambridge, MA 02140
Time Series AnalysisSLAM
'Copy on file at NODC (listing)1 documentation(above report) available from NTIS, Order No.,AD 601 538/LK, $4.75 paper,, $2.25 microfiche.
Language - FORTRAN IVHardware - IBM 360
Computes, for two simultaneous time series, cross spectra, power spectra, phase and coherence.Subprograms obtain the filtered series, remove thb trend, and compute the auto- and cross cor-relations. This NRGS library program is listed in a thesis by'John G. Hainan, June 1968.The thesis uses digital analysis by program BLACK? in the study of temperature fluctuationsnear the air-sea interface, the wave field at the same point, and the downstream wind velocity.
4 .
Naval Postgraduate School , Thesis available from NTIS,, Order No. AD 855Monterey, CA 93940 533/1K, $3.25 paper, $2.25 microfiche.
Spectral Analysis of Time Series Language - FORTRAN IV/ALGOL 60Hardware - UNIVAC 1108/Burroughs B5500
134
144

Finds the spectra, cospectra, quadspectra, coherence, and phase, of two series or a single spec-
trum of one series, using the fast Fourier transform (algorithm of Cdoley and Tukey, 1965).
Special Report No. 6, by Everett J. Fee, March 1969.
The Librarian-Center for Great Lakes StudiesUniversity of Wisconsin-MilwaukeeMilwaukee, WI 53201
Copy on file at NODC (above report)
Spectra Programs Language - FORTRAN IVr
,DETRND, AUTCOV, CRSCOV, FOUETR Hardware:-, IBM 30-40
.
DETRND removes the mean, or the me and linear trend (slope), from a time series. AUTCOV com-
putes the autocovariance of the tin!! series. CRSCOV computes the auto- and cross-covariances
of two sequences. FOURTR computes either the sine or cosine FoUrier transform. Smoothing of
either is optional. Technical Note 13, "Water Wave Teaching Aids," by Ralph H. Cross. Adapted
(with permisBion) from a program, written at Bell Laboratories by M.J.R. Healy, 1962.
Hydrodynamics Laboratory Copy on file at NODC (above report)
Massachusetts Institute of TechnologyCambridge, MA 02139
Analysis of Non-Linear Response Surface Language - FORTRANIVHardware - IBM 1130
. .
Analyzes the data from response surface experiments when two or three factors are measured.
Options allow calculation of maximum likelihood estimates,of power transformations of both in-
dependent and dependent variables, and the plotting of theft relative maximum likelihood
graphs, as a measure of the precision of the principal estimates. The data is then subjected
to analysis of variance, using orthogonal polynomials, and principle component adalysiit
specified contours of the dependent variable are plotted, bilip without and with transformation.
FRB Technical Report No. 87 by J.K. Linds'ey, Aug. 1968.
'Pacific Biological Station Copy on file at nom (above report)---41sheries,Research Board of Canada
P. 0. Box 100° -
Nanaimo, B. C. V9R 5K6
Multiple Discriminant Analysis Language - FORTRAN IV
MULDA Hardware - IBM 1130
A complete multiple discriminant analysis is performed by six interrelated programs which are
executed in succession through the link feature in 1130 FORTRAN. Will accept up to 25 variates
and as many as 10 groups. Any number of additional data cads can be read and processed after
the discriminant analysis has been completed. The value of the' discriminant function, classi-
fication chi-squares, and probabilities of group membership are computed and printed for each
additional m-variate observation. FRB Technical RepOrt No. 112.(unpublished manuscript), by
L.V. Pienaar and J.A.Jbdmson, March 1969.
Pacific Biological StationFisheries Research Board of CanadaP. O. Box 100Nanaimo, B. C. V9R 5K6
Copy on file at NODC <above report)
Fourier Analysis Language - FORTRAN
L1Q1 Hardware - IBM 7096/32K.46
Obtains amplitudes and phases of frequency components in any record. Standard Fourier analysis
plus use of Tukey cosine window to reduce edge effects. author - Alsop.
135
1
.4 4

r.
/
Lamont- Doherty Geological Obser4a- Copy on file at NODC (deck, documentation)tory . .
..
Columbia UniversityPalisades:NY ,10964
Cluster Analysisr
fib
Language - FORTRANHardware - IBM 1800
'Carries out a single linkage cluster analysis,using,data in the form of an upper triangularsimilarity matrix. Qgtput: (1) similarity level of clusteringmcycle; (2) a list of the link-ages that occur at that similarity level; (3) at the end of the cycle, the cluster numbers anda list of the entities making up each cluster are printed. Running time: A matrix of order 60took
(
pproximately 15 minutes to cluster. NIO Program No. 166. Author - M..Fasham.-y .
National Institute of Oceanography Copy on file at NODC (listing, documentation)Wormley, Godalming, Surrey, England
,
Probability Distribution_WEIBUL
Language - FORTRAN IVHardware - IBM 370/120K
Parameters for a Weibull proBability distribution are calculated from low, most probable, and
/// -
Robert T. Lackey Available from originator only. /,Department of Fisheries and
high estimates of random variables.
Wildlife Bciences /Virginia Polytechnic Institute andState University
Blacksburg,!VA 24061
Statistics from WHOI Format , ,Language - FORTRAN IV-HSTATS Ilardware - mit Sigma 7
Computes and lists statistical quantities related'to variables stored on tape in WHOI standardformat. See HISTO format reference. ,
- oRichard W. Rayne Available from originator onlyWood Holecceanographic Institution
' Woods Hole, MA 0254,4 Telephone,(617) 548-1400
nded Normal egarzir 'Pr g'-am-',,\ ir Language - FORTRAN IVRMSV2,.. Hardware - IBM 360-651/168K where K is 1024
' 17bytes
Separates a polynomial distribution into its component groups where no a priori informationis available on the number of modes, their overlap points, or variance. Transformation offrequency distalBution by pro,hAt analysis, polynomial regression analysis, and program NORMSEP(Hasselblad, 1966);
purposes.Observed frequency distribution together with values for identi-
ficatioit and control purposes. Output: means, _variances, and numerical representation of theseparated groups. , ,
Marian Y.Y. Yont .)
Aational'Marine Fisheries ServiceP.O. Box 3830Honolulu, 14 96812'
Available fr6m originator only
, .
Telephone (808)4,94672181
ti
a
136
116

Single Integration Language - FORTRANHardware - IBM 7074
t '
Equally spaced time series data are integrated once using Tick's method. The data must be Sam-
,r pled at a rate of at least twice the Nyquist frequency. Informal report IM No. 66-36. OS No.
66-3* Author.- E.B. Ross.
Data Office Available from originator only
U.S. Naval Oc nographic Office
Washington, DC 20373 Telephone (301) 763-1449
137
1 4 71
I

CURVE FITTING
-
Fits a Smooth CuSMOOTH
Language - FORTRAN IVHware - IBM[360-65
1
Fits smooth cu between supplied points that passes exactly through those soints. Author' Dave endieton.
Oceanographic rvices Branch t Copy on.file at NODCNational Oceanog hic Data;CenterNOAA/EDSWashington, DC 2023 TelephoneWW114-'7439
Curve Fitting: Velocity profile t Language.- FORTRAN V'. NEWFIT \ Hardware - UNIVg 1108/25K
Fits a yelo,c4x profile with a series of curve segments haying continuous first derivatives atpoints of-Intirspction. Output: Printed listings of, original data, fitted data, and coeffi-cients of curvefiegments; also, cards for input to program "Sonar in Refractive Water". NEWFITis the main routine of the program described in Report AP-PROG-C-8070, "A New Curve-FittingProgram," by Melvin 0. Brown, Associated Aero Science Laboratories, Inc., Pasadena, for NUSC,Feb, 1968.
4
Naval Ifndersea CenterPasadena Laboratory3202,`E. Foothill Blvd.
Paandena, CA 91107
Copy on file at NODC (above report)
Least-Squares Curve Fitting in Two, Three, Language - FORTRAN IIand Four Dimensions Hardware - CDC 3100 '
uar, BCF, TCF
Three subroutines, UC , BCF, and TCF (for Univariate, Bivariate, and Trivariate Curve Fit), foruse in two-, three-, nd four-space. Curve coefficients calculated by reduction technique dueto P.D. Crout (1941). Output: printout of coefficients, in nori8alized floating point;tanddifferences curve-to-ppints, in same format. Satellite subroutine SYMMET is called to solve m .
*simultaneous equation9 ip x. BIO Computer Note 68-1-C by F.K. Keyte, Jan. 1968.
Director Copy on file at NODC (Report with listing andBedford Institute of Oceanography documentation)P.O. Box 1006Dartmouth, N.S., Canada B2Y 4A2'
Subroutine for Fitting a Least-SquaresDistance Hyperplane to Measured Data
Language - FORTRAN VHardOare - UNIVAC'1108
A subroutine for modeling measured data in k-space by a least-squares distance hyperplane, andnumerically compared with ordinary least squares. Minimizes the sum of the squares of theperpendicular distances from the points Xm to the hyperplane model. Input: Points Xm (xml,
xm2,, xmk) in k-space, where each component xmi is in error. Output: Normal form of thehyperplane: AX'-p 0 ell 1); p is the distance from the origin of the coordinate axes to - .
the hyperplane. NUSC/NL Tech. Memo. R. PA4-121-74, "A Computer Subroutine for Fitting a LeastSquares Distance Hyperplane to Measured\Data," by M.J. Goldstein.
Marvin J. Goldstein Available from originator onlyNaval Underwater Systems CentegNew London, CT 06320 Telephone (203) 442:91.71, ext. 2415
138
148
4 t

Fits PolynomialP3TERM
Language - FORTRAN IVHardware - xpm 360-65
This routine fits a polynomial function Y(x) an + aix + a2x2 + ...amxm to the data (xl, Y1),
(x2, Y2) ... (xn, Yn) by using the least' squares criterion. The method is very accurate and
should perform well' for up to a 20-term polynomial and 100 data points.
Jerry SullivanCenter for Experiment Design and
Data AnalysisWashington, DC 20235
Least-Squares"Plot
Available from originator only
Telephone (202) 634-7288
Language - FORTRANHardware - IBM 7074
Fits an n-degree polynomial (max. n 10) or an exponential function to data points (max. 300),
plotting the actual curve and the computed curve for comparison or plotting the data points
only to help identify the type of curve they represent. OS No. 10112. Author - James S.
Warden.
Data Systems OfficeU.S. Naval Oceanographic OfficeWashington, DC 20373
Temperature, Saliltty CorrectionsCURVFIT N1S512
// Available from originator only
Telephone (301) 763-1449 .1
Language - FORTRANHardware - UNIVAC 1108/DEC PDP -9/6K words
Determines corrections foi electronically measured temperature and salinity data, using linear
and curvilinear regression techniques. Input: Temperatures or salinity data collected simul-
taneously with electronic sensors, reversing thermometers, and Niskin bottles. Output. AsCor-
rections for a range, of possible observed values, equations of best fit linear, Imabolioi'and'
'cubic equations, and standard error of estimate.
Harry Iredale Copy oh file at NODC (Deck, listing, documents-
U.S. Naval Oceanographic Office tion
Washington, DC 20373 Telephone (202) 433-3257
Bar ett's Curve Fitting
7
Bartlettts method for computing the best value
tial relationship. The 70% and 90% confidencetakes a maximum of 99 sets of data, each withAuthor,- Maureen Tyler.
Language- FORTRAN -
Hardware IBM 1800
for fitting a linear relationship or an exponen-limits on the slope are also found. The program
a maximum of 500 points. NIO Program No. 174.
National Institute of Oceanography Copy on filc,at NODC (listing, documentation)
Wortley, Godalming, Surrey, England
Curve FittingCRVFT
Language! FORTRAN IIHardware - GE 225
Finds either, best leait-squares fit to n points within apecified standard deviation "signa,A
fits a specified "M- curve" order curve -- the former executed by M-curvegregative, the latter
by M-curve non-negative. In either cgse "SD' ig the actual standard deviation as calculated.
BIO Computer Note 66-5-C, Appendix 5:..also, a 14-page WT to is in the "COPE" caealog.(1965)
of the Woods Hole Oceanographic'Institution. Author -' .K. Keyte.-
ye
139
14fk.
ti

Bedford Institute of OceanographyP. O. Box 1006'Dartmouth, N. 8. 82Y 4A2
v ,
a
Copy on file at.NODC (deck, documentation)
.
Telephone (902) 426-3410
140
I
r t
X pie
a
v t.
J
GI
'
t
150
O
APPLIED MATHEMATICS
Linear Interpolation
LININT
I
4
Language - PL/1Hardwalt,- IBM 360-65/144 (hex) bytes
Computes a linear interpolation on fullword fixed binary integers. Author - Robert Van Wie.
Oceanographic Services Branch Copy on file at NODC
National Oceanographic Data Center .
NOAA/EDS, ' , ''.'
Washington, DC 20235 . Telephone' (202) 634-7439
Lagrangian Three-Point Interpolation.LAG1PT
N
Language - PL/1Hardware - IBM 360-65
.0111.01114.0c..1.1.1.0.117.1.-
Computes a Lagrangian three-point interpolation; calls subroutine LININT. 'Author --Robert 'Van
Wie. ..
\,,
Oceanographic Services Branab Copy on file at NODC
National-Oceanographic Data tenter
NOAA/EDS .
Washington, DC 20235 Telephone (202) 634-7439
Calculates Spline Coefficient Language - FORTRAN IVHardware - IBM 360-65SPLCOF
Calculates spline coefficient for use by routine SPLINE. Authof - Dave Pendleton.
Oceanographic Services Branch - Copy on file at NODC
National Odeanographic Data CenterNOAA/EDSWashington, DG 20215 Telephone (202) 634-7439
Interpolating by Cubic Spline Language - FORTRAN IV
SPLINE Hardware - IBM 360-65/832 bytbs (object form) ,
Performs interpolation by cubic splines. This method fits a cubic spline between adjacent
points while insuring that the first two derivatives remain continuous. The endpoints (X(1)
and X(N)) use an extrapolation of the curvature at points X(2) and X(N-1). Author - Dave
Pendleton.
Ocevographic Se ices Branch Copy on file at liODC-
NationalOceanographic Data Center
NOAA/EDSWashington, DC 20235 Telephone (202) 634-7439 .
)
Program for Smoothing Data .B6guage - FORTRAN IV
Using the Cubic Spline , Hardware = UNIVAC 1108.y N a , -
Fits measured data with the smoothing cubic Spline, using an extension of Reinsch's technique
--which brings the second derivative of the spline,to zero at its end points? The extension al-
lows end cOnditions,on either first or second derivatives. Input: 'Set of sample data (xi, yi),
i 0), 1, ..., n12; x0<x1 <...<xn.And end conditions on either the first or second derivative/
-- and a smoothing paramerer S c (N-VB, 111411) whereM n+1. Output: Smoothed data values"
141
151

Ili and pointwise approximations to the first and second derivatives at the points xi. NUSCTech. Memo. No. PA4-48-74, "On a Computer Program for Smoothing Data Using the Cubic Spline,"by M.J. Goldstein. 4
.Marvin J. Goldstein '
Naval Underwater Systems Center' New London, CT 06320
Solve Algebraic Equatiqns`MATRIX
-Solves tt linear-algebraic equations in n
Alan T. Masgey
Naval Underwater. Systems CenterNewport, 'RI 02840
.
Checka:.Angles Language - FORIRAICIVTWOPI Hardware - IBM 360-65/CDC 6600
/.,
.
In the use of angles, this routine-aesUres that any angle remains' between 0° and 360°.
.Available from originator only
Telephone (203) 442-0771, ext. 2415
Language - USASI FORTRANHardware --CDC 3300/20K words
unknowns, using Cholesky's method._
Available from originator only
Telephone (401) 841 -477.2
0 4.
Robert DennisCenter for Experiment Design and
Data Analysis, NOAA/EDS'Washington, DC' 20235 0
Available from originator only
Telephone (202) 634-7344
Trigonometry Subroutines 'Language - FORTRANASSUB, SAS, ASA Hardwate - IBM 1800
ASSUB calculates trig other side. 'Input: 1 angle, 2 sides. Output: Two possible sidelengths; if either or both returned sides are zero, these values are undefined. SAS calcu-.lates°other side. Input: Side, angle, side. Output: Length of other side. ASA calculatesother two sides. Input: Angle, side; angle. Output: Length of other two sides.
Michael Moore Available from originator onlyScripps Institution of Oceanography -
P.O. Box 1529Jolla, CA 92037 Telephone (714) 452-4194
,
' .
. Inter-Active Calculations Language - ALGOLDSDP/CALC Hardware - Burroughs 6700/6K words
0Provides inter-active computing abilities for persons with the occasional need to do numericalcalculations involving small amounts of da a. The user may address either the "definitionlevel" or "evaluation level" of ten independent working spaces in which any number of expre-sions may be defined; The program can save the total working environment for later use. Inputt General arithmetic expressions defingd in terms of alpha- numeric identifiers, system in-trinsic functions and previously defined expressions. An expression is evaluated by assigningvalues to the independent vgtiables in either an identifier prompting mode or free-field inputmode.
W. Thomas BirtleyDeep Sea rojectBox 1529La Jolla, CA 92
Available from Originator only
'Telephone j714) 452-3526
1421 5 2,
1.,
O
4

DATA REDUCTION ,EDITING, CONVERSION, INVENTORY, RETRIEVAL
AND SPECIAL INPUT-OUTPUT
Thermometer Correction Language - FORTRAN IVTCPLO Hardware - XDS Sigma 7/12;500 words/2 tape
units/CalComR Plotter
. Plots thermometer correction curves and prints the calibration data for each thermometer. For-
mulas used are from "On Formulas for Correcting Reversing Thermometers," by F.K. Keyte..
i Mary Hunt Available from originator onlyWoods Hole Oceanographic InstitutionWoods Hole, MA 02543 Telephone (617) 548-1400
Thermometer Correction, Depth ComputationHYD1
Language - HP ASA Basic FORTRANHardware - HP 2100/HP 2116/12K words/Keyboard/
CalComp Plotter /Paper tapeoptional ,
Corrects thermometer readings and computes depth or pressure. Input: Station information, in-
cluding thermometer readings, and thermometer calibrations. Output: Depth and corrected tem-
perature for each station.
Chris Polloni Available from originator onlyWoods Hole 0 anographic InstitutionWoods,Hole, 02543 Telephone (617) 548-1400
,Areal Concentratiori Language - FORTRAN IVINTEGRATE Hardware - IBM 360/3676 bytes
Performs integration 2f samples taken at discrete, depths to produce areal concentrations. In-:
tegration is of form N[dnia-dn][(Angli-An)/23 where d depth and A = values of a variable for
each of N depths. Input: Data cards containing sample identification codes and depth valuesalong with substance to be integrated. An unlimited number of depths and variables may be in-
tegrated. Output: Printed output includes sample identification codes, list of depths andvariable values, a depth-weighted average for each depth interval, and the running sum; punchedoutput includes identification codlip and integration from sdiface to selected depths. "A Com-
puter Program Package for Aquatic Ecologists," by Paul J. Godfrey, Lois White, and ElizabethKeokosky.
I
Paul J. Godfrey . Copy on file at NODC (listing, documentation)Department of Natural ResourcesCornell University, Fernow HallIthaca, NY Telephone (607) 256 -3120
Unweighted Averages Language - FORTRAN IV
AVERAGE Hardware - IBM 360/5824 bytes
Calculates unweighted averages over depth; depths for which data are averaged may be con-
trolled. Input: Data cards with sample identification codes, depth and variables to be aver-aged; if average is to be controlled by a variable such as thermocline depth, this must also
be included. Output: Printed or punched averages of,deveral variables in a form similar toathe input data, i.e., one variable after another on, each card, thus suitable for,odkTh pack-
aged programs. "A Computer Program Package for Aquatic Ecologists," by Paul J. Godfrey, Lois
White, and Elizabeth Keokosky.
143
153
9

Paul 4. GodfreyDepartment of Natural Resources
, Cornell UniVersity, Fernow Hall '
Ithaca, NY. 14850 ,.Telephone (607) 256-310
Copy on file at NODC (listing, documentatiOn)
1
Bathymetric Data Reduction Language - FORTRANHardware - IBM 7074
Processes data gathered while navigating with anY circular and/or hyperbolic system. Eight op-tions are available pertaining to position conversion, form of input, data smoothing, specialcorrections, and interpolation of position-dependent values such as contour crossings. OS No.
53559.
Data Systems Office Available from originator onlyU.S. Naval ,Oceanographic Office
Washington, DC 20373
Julian Day ConversionJDAYWK
Computes the date from the Julian day.
Paul SabolCenter for Experiment Design and
Data Analysis,, K0AA/EDSWashington', DC 20235
A,
Telephone (301) 763-1449
Language - FORTRAN'IVHardware - IBM 360-65-
Available from originat r only
Telephone (202) 634-7344
Julian Date Conversion Routines Language - FORTRAN IVJULDAY, JULIAN, JULYAN, JULSEC, CESLUJ Hardware - IBM 360/CDC 6600/PDP-11
Given the month (1-12), day, add year, JULDAY returns the Julian Day. JULIAN calculates month(in 10-character words) and day, given the year and Julian.dite. JULYAN calculates month (digi-tal) and day from given year and Julian date. JULSEC yielcis Julian seconds from Julian day,
hour, minute, and second. CESLUJ computes the Julian date, hour, minute, and second, givenJulian seconds.
Robert DenCenter for Experiment sign
FData Analysis, NOAH/ S
Washington, DC 20235
Avaitable from originator onlyand
Teleph9ne (202) 634-7344
Day of the Week Language FORTRAN IVNDAYWK, Hardware BM 360-65
This subroutine returns the day of the week for any date in the nineteenth or twentieth century.Modifications include conversion of the function to a subroutine so Julian day can be extractedand addition of an array containing an alphanumeric description of the day.
es
Available from originator only
Telephone (202) 634-7344
Paul SabolCenter for Experiment Design andData Anal sis, NOAA/EDS
Washington, DC 20235
* Date CalculationDAYWK, NWDAT, NXTD I YSTDY
Language - FORTRANHardware - IBM 1800
154

Given year (4 digits) and Julian Day (i-366), DAYWK prOduces*the day of the week (1-7x Sun. -Sat.). Given packed' date (bits 0-3 month, 4-8.day, 9-15 year), NWDAT produces following &Age,packed and unpacked. Given day, month, year, NXTDY returns day, month, year of next day. Givenpacked date, YSTDY produce, preceding date (packed)'.
Available from originator onlyMichael MooreScripps Institution of Oceanography'P.O. Box 1529
La Jolla, CA 92037
Julian Day Subroutines
Telephone (714) 452-4194
Language - FORTRANCLEJL, CLJUL Hardware - IBM 1800
Both subroutines calculate Julian Day. Input formats vary. CLEJL format, 01 Nov. 70; CLJULfoikat, day (1-31), year (00-99), month (1-12).
Michael MooreScripps Institution of OceanographyP.O. Box 1529La Jolla, CA 92037
Time ConversioDTIME
Calculates hors, minutes, and seconds,
Available from originator only
Telephone (714) 452-4194
Language - FORTRANHardware -4BM 1800
given thousandths of hours.
Michael MooreScripps Institution of OceanographyP.O. Box 1529La Jolla, CA 92037 Telephone (714) 452-4194
Available from originator only
Current Meter Data Reduction Language FORTRAN IV
.
Hrdware - IBM 1800
Converts data in the form of angular positions of the rotor and compass arcs from Braincontype 316 current meters into values Of current speed and.directilon, tilt direction, N-S andD-W current components and displacements in kilometers frpm any arbitrary origin. Data areoutput to lineprinter with column headings and magnetic tape without headings. Author - W.J.Gould.
National Institute of Oceanography Copy on file at,NODC (listing, documentation)Wormley, 0401ming, SurreyUnited Kingdom
Reduction and Display of Data Acquiredat. Sea
Language - FORTRAN IIHardware - IBM,1130/Disk/CalComp 30" p/otter
A system ofprograms (navigation, gravity, "topography, magnetics) for the reduction, storage,and display of underway data acquired at sea. 4 large number of the programs utilize naviga-tion points together with raw digitized geophysical data presented as a time series, where thedifferent data may be read at unequal intervals. Technical Report No. 1, by Manik Talwani,August 1969.
Lamont-Doherty Geological Observa-tory
eColumbia UniversityPalisades, NY 10964
Available'from NTIS, Order No. AD.693 293/LK,$10.00 paper copy, $2.25 microfiche.
195
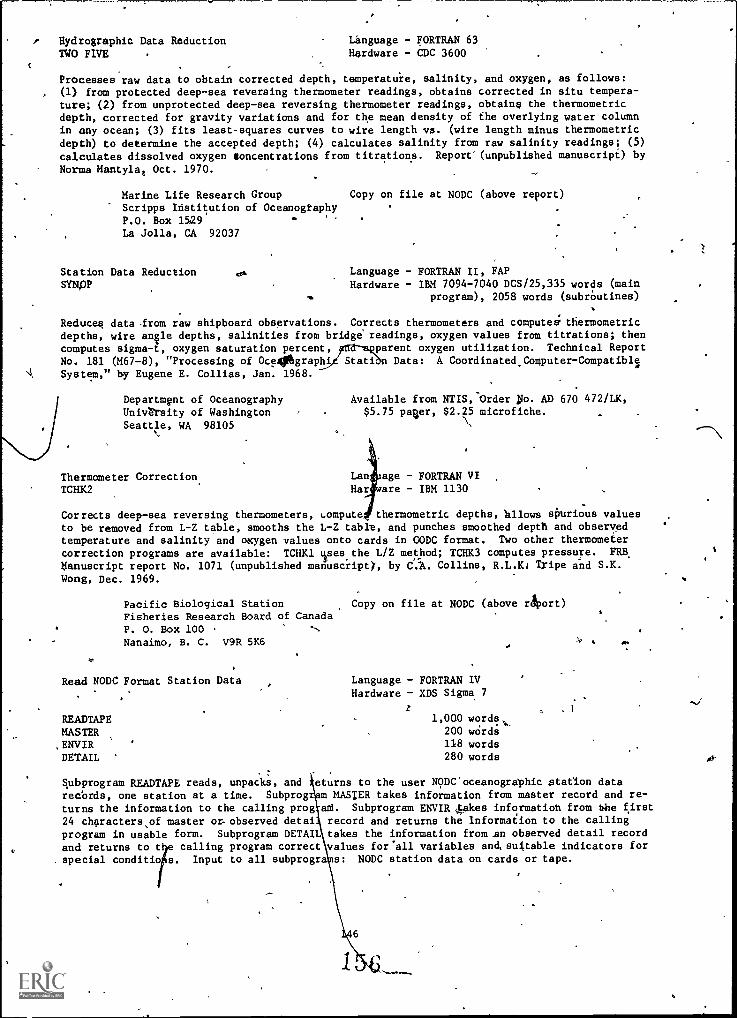
r Hydrographic Data Reduction Language - FORTRAN 63
TWO FIVE Hardware - CDC 3600
Processes raw data to obtain corrected depth, temperatuie, salinity, and oxygen, as follows:(1) from protected deep-sea reversing thermometer readings, obtains corrected in situ tempera-ture; (2) from unprotected deep-sea reversing thermometer readings, obtains the thermometricdepth, corrected for gravity variations and for the mean density of the overlying water columnin any ocean; (3) fits least-squares curves to wire length vs. (wire length minus thermometricdepth) to determine the accepted depth; (4) calculates salinity from raw salinity readings; (5)calculates dissolved oxygen oncentrations from titrations. Report'(unpublished manuscript) by
Norma Mantyla, Oct. 1970.
Marine Life Research Group Copy on file at NODC (above report)
Scripps Institution of OceanographyP.O. Box l529
, ,
La Jolla, CA 92037
Station Data Reduction 0* Language - FORTRAN II, FAPHardware IBM 7094-7040 DCS/25,335 words (main
program), 2058 words (subrOutines)
Reduces data -from raw shipboard observations. Corrects thermometers and compute& thermometricdepths, wire anile depths, salinities from bridge readings, oxygen values from titrations; thencomputes sigma-t, oxygen saturation percent, parent oxygen utilization. Technical Report
No. 181 (M67 -8), "Processing of OceOgraph Stati Data: A Coordinated Computer-Compatible,
System," by Eugene E. Collies, Jan. 1968.
Department of OceanographyUnivWreity of WashingtonSeattle, WA 98105
SYNPP
Available from NTIS,)Order No. AD 670 472/LK,$5.75 pager, $2.25 microfiche.
Thermometer Correction Lan age - FORTRAN VI ,
TCHK2 Har are - IBM 1130
Corrects deep-sea reversing thermometers, compute thermometric depths, hllows spurious valuesto be removed from L-2 table, smooths the L-Z table, and punches smoothed depth and observedtemperature and salinity and oxygen values onto cards in GODC format. Two other thermometer
correction programs are available: TCHK1 Ises.the L/Z method; TCHK3 computes pressure. FRB,
Manuscript report No. 1071 (unpublished manuscript)', by CA. Collins, R.L.K4 Tripe and S.K.Wong, Dec. 1969.
Pacific Biological Station Copy on file at NODC (above Aort)Fisheries Research Board of Canada
4 P. O. Box 100 .
Nanaimo, B. C. V9R 5K6
Read NODC Format Station Data Language - FORTRAN IVHardware - XDS Sigma 7
z
READTAPE 1,000 words,MASTER 200 wdrds
,ENVIR 118 words
DETAIL ' 280 words
Subprogram READTAPE reads, unpacks, and eturns to the user NODC'oceanographic station data
records, one station at a time. Subprogram MASTER takes information from master record and re-
turns the information to the calling prog aM. Subprogram ENVIR takes information from bhe first
24 characters of master or- observed detai record and returns the information to the calling
program in usable form. Subprogram DETAIL takes the information from an observed detail record
and returns to t calling program correct values forall variables and suitable indicators for
. special conditio s. Input to all subprogra s: NODC station data on cards or tape.
46

Mary Hunt Available from originator onlyWoods Hole Oceanog aphic InstitutionWoods Hole, MA 02543 Telephone (617) 548-1400
Reads NODC Station Data Tape' Language - FORTRAN IVEDIT Hardware - IBM 360-65,
.i . , ,.
This subroutine reads a NODC station data tape (120 characters per record), checks the indica-tors in characters 81-120, sets the decimal points, then prints the master records, observedstation data, and standard station dattl'for each station. See program CAPRICORN.
Ruth Mcliath
Department of OceanographyTexas ASM UniversityCollege(Searterry-IX 77843
Available from originator only
elephone (713) 845r7432
r Converts NODC Format Data to BNDO Format Language - FORTRAN IVA
TRANSNODC Hardware - XDS Sigma 7/2 tape or. disk units.
aThis sybtem prepares data in NODC format for introduction into the Poseidon system; header dataare listed, stations are selected and separated into cruises' with inventories at the cruiselevel, and output is provided in BNDO format. Report, "Transcodage des donnees NODC."
Mr. Stanislas, .BNDO Copy. on file at NODC..Centre National pour ltExploitation
des OceansBoite Postale 33729273Brest Cedex, FrancA Telephone 80.46.50, telex 94-627
Converts Data to BNDO FormatTRANSCOD
Language - FORTRAN IV.Hardware XDS Sigma 7/2.tape or disk units
This 9p:item prepares data to out-of-house formats for introduction into the Poseidon system;header data are listed, stations are selected and separated into cruises with inventories atthe..truise level, and output,is provided in BNDO format. Input formats are those of ORSTOM,SHOM, etc.
Mr. Stanislas, BNDO - Copy on file at NODCCentre National pour l'Exploitation t .
des OceansBoite Postale 337 .
29237 Brest Cedex, France Telephone 80.46.50,,telex 94-627
Reads BNDO Format Data Language - FORTRAN IVLSTA 1142 Hai-dware - XDS Sigma 7
This subroutine is used to read easily the physical, chemical, and biological data in the com-plex and very flexible BNDO foEmat. Data may be on disk, tape, or cards. After the call, thestation is stored in a common area.
Mr. Stanislas, BNDO Copy on file at NODCCentre National pour 1Exploitation
des OceansBoite Postale 33729273 Brest Cedex, France
4 0
Telephone 80.46.50, telex 94-627
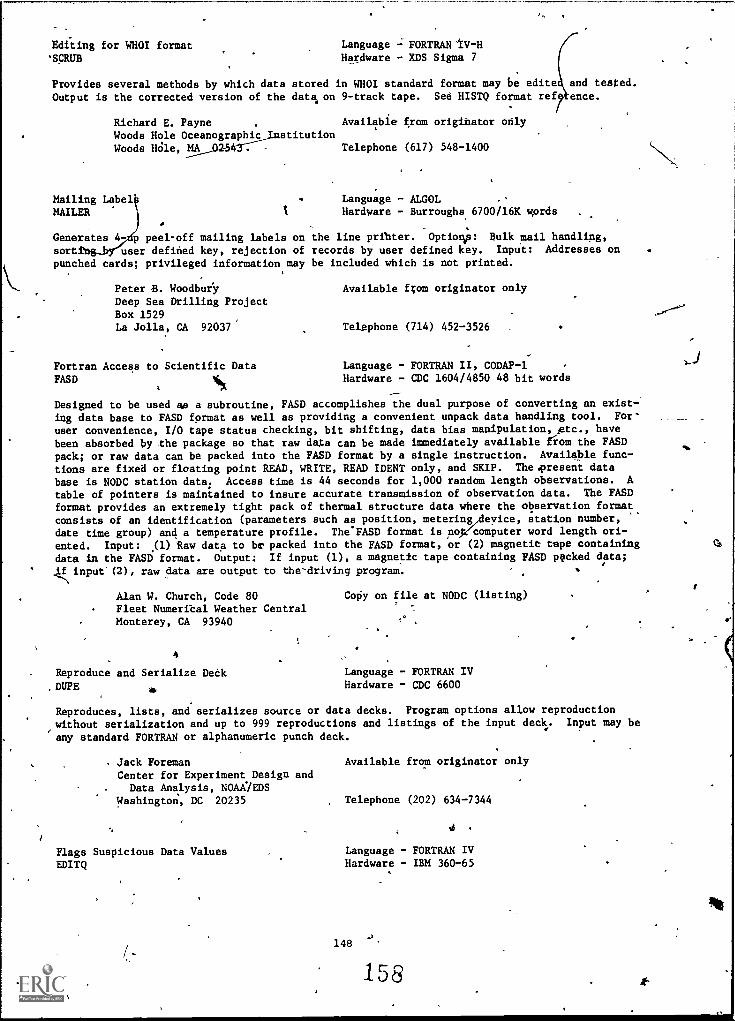
Editing for WHOI format
`SCRUB
Language FORTRAN 41V-H
Hardware - XDS Sigma 7
Provides several methods by which data stored in WHOI standard format may be editeOutput is the corrected version of the data. on 9-track tape. See HISTQ format ref?
Richard E. Payne Available from originator only
Woods Hole Oceanographic stitution
Woods Wile, MA Telephone (617) 548-1400
and tested.
ence.
Mailing Label Language - ALGOLMAILER l Hardware - Burroughs 6700/16K fiords .
Generates 4- p peel-off mailing labels on the line pribter. Optiona: Bulk mail handling,
sort user defined key, rejection of records by user defined key. Input: Addresses on
punched cards; privileged information may be included which is not printed.
Peter B. WoodburyDeep Sea Drilling ProjectBox 1529La Jolla, CA 92037
Available f;om originator only
Telephone (714) 452-3526
Fortran Access to Scientific Data Language - FORTRAN II, CODAP-1
FASD s Hardware - CDC 1604/4850 48 bit words--
.
Designed to be used 40 a subroutine, FASD accomplishes the dual purpose of converting an exist-ing data base to FASD format as well as providing a convenient unpack data handling tool. For
user convenience, I/O tape status checking, bit shifting, data bias manipulation,,atc., havebeen absorbed by the package so that raw data can be made immediately available fiom the FASDpack; or raw data can be packed into the FASD format by a single instruction. Available func-
tions are fixed or floating point READ, WRITE, READ IDENT only, and SKIP. The.present data
base is NODC station data: Access time is 44 seconds for 1,000 random length observations. Atable of pointers is maintained to insure accurate transmission of observation data. The FASDformat provides an extremely tight pack of thermal structure data where the observation formatconsists of an identification (parameters such as position, metering eyice, station number,
/4date time group) and a temperature profile. The'FASD format is no computer word length ori-
ented. Input: p.) Raw data to be packed into the FASD format, or (2) magnetic tape containingdata in the FASD format. Output: If input (1), a magnetic tape containing FASD packed data;
.1finputA2), raw data are output to the~driving program.
Alan W. Church, Code 80Fleet Numeribal Weather CentralMonterey, CA 93940
Copy on file at NODC (listing)
4-
Reproduce and Serialize Dealt Language - FORTRAN IV
,DUPE Hardware - CDC 6600
Reproduces, lists, and serializes source or data decks. Program options allow reproduction
without serialization and up to 999 reproductions and listings of the input deck. Input may be
any standard FORTRAN or alphanumeric punch deck.
. Jack Foreman
Center for Experiment Design and. Data Analysis, NOAA /EDS
Washington% DC 20235
Flags Suspicious Data ValuesEDITQ
Available from originator only
Telephone (202) 634-7344
Language - FORTRAN IVHardware - IBM 360-65
148
158 0-

EDITQ is designed as a computationally fast and efficient means of flagging suspiciously largeor small values in a series of data. The data series is fitted with a least-squares fitstraight line under the assumption that the programer limits the length of the data series toregions sufficiently small so that the straight line is locally a good approximation to thetrend. 4
*
FormatQREAD
Donald AchesonCenter for Experiment Design andData Analysis, NOAA/EDS
Washingto.n., DC, 20235
Free Input Subroutine
Available from originator only
Telephone (202) 634-7288
Language - FORTRANHardware - IBM 1800
A iotmat free input subroutine for cards or other sources. Input: jntiper arrayeight variables net to determine input.
Michael MooreScripps Institution of OceanographyP.O. Box 1529La Jolla, CA,.92037
Available from originator only
Telephone (714) 452 -4194
Meters vs. Fathoms t Language - FORTRANMATBL Hardware - IBM 1800/16K words
4Produces table of corrected depths in meters vs. raw fathoms.
Michael More AvailableScripps titution of pceanography.P.O. Box 1La Jolla, CA
from originator only
Telephone (714) 452-4194
with first
A File-lIndeiendent, Generalized Application Language - FORTRAN IV-G, Assembler, PL/l-F, System, GAS Hardware --IBM 360-65
-1 4
Development of GAS was based on the following premises: (1) most files of oceanographic data%consist of identification fields (location, date, etc.), an independent variable (perhaps waterdepth or time), and one or more dependent variables (e.g., water temperature or dissolved4Oxyrgen); (2) a system could be designed to treet.these, items uniformly, i.e., instead of tailoringprow= tb a discrete data file, the bas c units could be extracted and transmitted to a gen-eralized applications system from whiclany products could be derived. As a result, GAS hasflan number of applications programs, rather tha a theoretical maximum of nu" times the numberof files. Only one extra program was necessary - the conversion module,whidh provides a linkbetween the various data files and the GAS cyst . The system of applications programs istailored to an intermediate file created by this conversion module. Version 1 of the conver-sion module can access the files for Neilsen cast , mechanical bathythermographe (BT), and ex-pendable bathythermographs,(KBT); soon to be adds are the continuous salinity-temperature-depth (STD) file, ICES ocean surface reference fi e, and data from cooperative oceanographicresearch projects.
Application / Display File- AcceisProgram Subprogram
File- Create Subprogram
149
159
ConversionProgram

Following. are descriptions of adividual.programs and subroutines:
GASDIPBS reads the NODE GAS file and, on oneent printouts, depending on the control card
GASSAMPE,prints the'fi st three and the last
ebt and Wes a record ount. Author. - 'Gary
pass of the data, produces any one of three differ-
entry. Author - Gary Keull (44k, FORTRAN IVrG).
basic master records only, of'a GAS formatted data
Keull (38K, FORTRAN IV-G).
. ..
,
GASEINV prints out ,r/geog phic inventory of GAS data by ten-degree square, one-degree square,andimpnth, and gives counts of all one degrees and ten degrees and a total number of stations
processed. Author - Gary Keull (40K, FORTRAN IV-G).
GASCCI reads GAS records and prints out country code, reference identification number, and from
add to consec numbers. Also givesa.totai station count. Author -Gary Keull (40K, FORTRAN
. I1-G). . . ,
. , .
-70ASVAPRT-reads the output of, the progiam GASVASUM and prints vertical array summaries. Author -
Walter Morawski (48K, FORTRAN IV-G)....
GVAREFRM takes the GAS vertical array summary prpgrams summed records and produces a 110 char-
acter output record. Author - Gary Kehll (30K; FORTRAN IV-G)1
r. '
GASTHEMM computes the depth.of the thernuacline and mixed layer i desired. Also outputs a tem-.
- perature gradient analysis.,. Author - Walter Morawski (40E,KAssemblev).
GASMASK reads the basic and supplementary master information and produces a detailed printoutof master inedrmation'and headings for each station. Author -'Judy Yavner (100K, PL /l -F).
(--4,TA reads GAS records and transfers all the fields present into a common area in core of the
lling program. With each call to this subroutine, all master and independent-dependent pa-rameter pairs are transferred to the common area. Author - Walter Morawski (748 bytes (object
form), Assembler).
Subrautine'CANADA computes Canadian ten-degree, five-degree, two-degree, one-degree, and quar-ter-degree squares from latitude and longitude degrees and Minutes. Authors - Walter Morawski
and Gary Keull (5K, FORTRAN IV-G).
Subroutine CREATE creates GAS records when tilled from a user's progtam. Author - Walter
Morawski (630 bytes (object form), Assembler).
GAS accesses the major files of NODC and creates records compatible with the GAS system. Au,,
thor - Walter Morawski (96K, FORTRAN IV-G). '
MONT880 selects all stations with a month entry that corresponds to particular control cardy'' entry. Author - Gary Keull (44K, Assembler).
CHEM80 sele cts all stations with a non-zero chemistry percentage that corresponds to a cdntliO1
~card entry. Author - Gary Keull (44K, Assembler).'-
DEFTH80 selects all stations with a maximum depth gre
thor - Gary Keull (24K, Assembler).
r
than the control card entry. Au-
LATLON80 selects an area based on latitude and longitude degrees and minutes entered in a con-
. trol card. Author - Gary Keull (44K, Assembler)-.
GASbRDER selects certain GAS records (specified by truise and cohsec numbers) from an input
tape and inserts a sort-order number in an unused area. The output, when sorted On this order
number, will be in whatever order the user has specified on the control cards. Author - Walter
Morawski (38K, Assembler).
6ASVASUM reads GAS type 1, 2, or 3 records and produces three output GAS format records that
contain a,vertical array summary. (Depeh, Max, Avg, Min, Number, Standard Deviation). Summa-
ries are atsNODC standard levels, live meter intervals, or ten meter intervals, depending on
the input..'.: Author - Walter - Morawski (86K, FORTRAN IV-G).
A150 160

mi
ALTERGAS reads a- primary GAS file and finds matches to these records in an auAiliary GAS file.Before outputting, records may be altered and a single file of records may be altered in anyway. Autti&i- Walter Morawski (90K, FORTRAN IV-G).
.
GARB accesses several major files at NODC and creates records-compatible with GAS. Author -./
aralter Morawski (90K, FORTRAN IV400trith Assembler input-output routines). 0
*17`"
NO5bSQ takes the latitude and longitude fields from the GAS master fields and computes` the NODCten-degree, five-degree, two-degree, one-degree, quarter-degree, and six-minute squaw andreplaces them into the master field arrays. Author - Walter Morawski (2K, FORTRAN IW).
NAMES prints the names of the dependent and independent parameters of the GAS system.'At pres-ent, there are 29 names which may be printed all at once or singularly; t s subroutine is usedin program GASDIPBS for output type 2 listings. Author - Gary Keull (28K, ORTRAN IV-G).
. .
SD2GAS accesses the NODC SD2 (station data 2) fileselects upon various cri eria, and outputsGAS records of various types; user may at same time output regular SD2 records for use y non-GAS programs. The following options are available:
A. Standard and or observed depths only will be returned;B. If alrnlueAs missing at a particular level, it may be interpolated;C. Doubtful and questionable data may or may not be included;D. Chemistry values may be shifted to NODC prescribed nearest standard levels.
Output formats available:.
-11 Basic GAS master fieldil-2 Basic GAS master fields and all supplementary fields present;Q. Basic GAS master fields and one independent-dependent parameter paii;
Basic -GAS master fields and parameter pairs at five-meter intervals;2 Basic GAS master fields and parameter pairs at ten-meter intervals;,3 Basic GAS master fields and parameter pairs at Nansen levels;4 Basic GAS master fields and parameter pairs whenever they appeared in that particu-
lar rdcord;5 Basic GAS mister fields and parameter pairs at depth intervals specified by the user.
Author - Walter,Morawski (96K, FORTRAN IV-G).
LASSCUDS. summarizes SCUDS (surface current-ship drift) records by area, ten-degree, five-degree,two-degree, one-degree, quarter degree, one-tenth-degree squares, year, month, or day. Outputsproduced are optional. Variations include two print, formats or two tape formats. Parametersinclude all geographic information, month, year, day, north and east components, resultant
.
speed and directiGn, total, observations, number of-es.101, max and mean speeds, and standard
'Aeviation. Also available is a distribution of individual observations by speed and direction.Authors - Gary Keull and Walter,Morawski (80K, FORTRAN IV-G).
Oceanographic Services Branch Copy on file at NODC (tape, 13cumentatitn)National Oceanographic Data CenterNOAA/EDSWashington, DC 20235 '''''''Peinphone,(202) 634-7439
4N1Z S'
Other NODC Programs Hardware - IBM 360-65
STD Data:
STDRETV retrieves records from the STD geofile; sections are madd on the basis of optional se-1 t fields; with one exception, these select fields are located in the master records. Au.c
4ii- Robert Van. Wie (Assembler).
Station Alta:..
--,/ . , ,
SD2TOSD1 converts station data from SD2 variable length record tp SD1 80 or 83 byte records.Author - Walter Morawski (36K bytes, Assembler09
SDCHAR processes a series of 83 byte records to construct a one - record- per - station file of var-
iable length cHaracter records. Author - 'Robert Van Wie (92K tes, PL/1).,t4,
151
161

SDPRT2 produces an edited,listing of the R62 variable length record or data in 80 byte
format. Author - Sally Heimerdinger (36K bytes, Assembler).
SDSELEMlects SD1 records by Marsden square, one-degree square, or card type. Author
Michael Ilanagan (24K bytes, Assembler).
SD2MSTCT counts the number of SD2 records and prints the first 50 records and the last record.Author - Elmer Freeman (50K bytes, Assembler).
SD2SAMP selects five records from SD2 tape; used to give users a sample of SD2 data. Author -Walter Morawski (34K bytes, Assembler).
SDGEOIV reads SD2 master file and summarizes the number of stations by month, year, one-degreesquare, five-degree square, and modified Canadian (ten-degree) square; best results are ob-tained when running against a 4(46-graphically sorted file. Author - Michael Flanagan (14K bytes,PL/1).
80 or 83 barT7MAKE120 converts yte record from the NODC station data geofile to the 120 c ac-g.-
ter zone-edit format for the IBM 7074. Author - Walter Morawski (36K bytes, Assembler).
DEPTH selects full station data records with depths,grepter than a given hundred -meter inter-
val. Author - J. Gordon (17K bytes, Assembler).
CRUCON reads either the SD2 file or'SD2 master file and prints the NODC cruise Consec numberL inventory. Author - Walter Morawski (36K bytes, Assembler). h
CODCCONV converts station data in the format of the Marine Environmental Data Service (formerlyCODC - Canadian Oceanographic Data Center) to the NODC format. A table of control cards isrequired to convert the Canadian cruise reference numbers to the NODC system. Author - Walter
Morawski (24K bytes, Assembler).
SUPERSEL selects from the SD2 geof ile* master file by Canadian (ten-degree) square. Input
file is sorted in Canadian square order; output is identical in format, but contains only thedata from the desired Canadian squares. Author - Walter Morawski (36K bytes, Assembler):
f k. .
SDPASS retrieves SD2 records from either the cruise-sorted file, the geosorted file, or the
master file. Output is on one of four ormats: (1), the original variable length record; (2)
a series of80 byte fixed- lengt1 record?; (3) 105 byte fixed-length records;p undefined,records. Author - Robert Vad Wie (Assembler).
Expendable Bathytlermograph Data:
XORDER selects XBT data by cruise consec number, inserts a sort number in anyunused space; theoutput, when sorted on this number, will be in whatever order was specifiel'by the user on con-trol cards. Author - Walter Morawski (36K bytes, Assembler). .....,
XBEVALU compares production with standard sample.
XBT's; sorts input by reference number and7consec number before testing and evaluation; prints evaluation statistics. Author - MichaelFlanagan (PL/1). . , ,
-.
XBTAUT enables the user to choose the type of XBT output and the mode of output. Authc4 -
Philip Hadsell (60K bytes, FORTRAN IV-G).
XBCONV converts data from seven-track tapes in old NODC XBT format to new NODC format suitable.
for nine-track tape. Input: Contractor-- processed XBT's. Output on disk. Author - Pearl
Johnson (96K bytes, PL/1-4) - ----
4.
XBTCO gives a station count of XBT data from either, the cruise file or the geofile. Au-
thor --Elmer Freeman (Assembler).-
XBFNWC1 run after XBFNWSUM, reads,control cards providing cruise and other master informationand, for each cruise, converts (or deletes) Fleet kmerical Weather Central XBT data to theNODC XBT tape record format. Author - Judy Yavner (50K bytes, PL/1).
1.N\
152
162
tr
V

XBFNWSUM provides aisunmary of the cruises contained on a file of XBT data from Fleet Numer-
ican Weather Central. Author - Judy Yavner (22K bytes, PL/1).
AXBSELECT retrieves from theXBT data file by inputting the desired FORTRAN "if" statements.Author - Philip Hadsell (9K bytes, FORTRAN IV-G).
REIM retrieves records kom the XBT cr le or the XBT geofile. Author - Robert Van Wie
(Assembler).
XBTCONV converts the XBT binary-9haracter formatt d-records to an undefined all-character rec-
ordord with a maximum length of 2,50 10 bytes; primaril used to satisfy requests for XBT data on
seven-track tape. Autho'r -4 Sally Heimerdinger (650 bytes plus 2 times the sum of the buffer
lengths, Assembler).
XBMSINV, using the subroutine XBREAD, reads cruise-ordered XBT data and produces a summary ofeach cruise (one line per cruise), indicating the NODC cruise number, the number of observa-tions per cruise, the beginning and ending dates, the NODC ship code, and the originator's
cruise number. Author - Philip Hadsell (FORTRAN).
XBGEOSUM prints a summary of the number of observations within given seasons, one-degreesquires, ten-degree qe6res, and quadrants. Author - Philip Hadsell (80K bytes, FORTRAN IV-G).
Mechanical Bathythermograph Data: 4
RET4415trieves records from the BT cruise file or the BT geofile. Author - Robert Van Wie
(Assembler).
BTLISTC provides edited printout with headings of the NODC geographically-sorted bathythermo-
graph file. Author - Michael Flanagan (2600 bytes, Assembler).
BTGEOIV reads the batkprthermograph file, summarizes the number of stations by month, year, one-degree square, five-degree square, and Marsden square. Author - Charlotte Sparks (14K bytes, A,
PL/1)jOther NODC programs: o#6
0.
SCHNINE prints data from 81-9 surface rrent file; produces simultaneously any one of the fol-
lowing combinations: -l(1) edited listin: of the entire file; (2) edited listing and punchedcards, both for the entire file; or (3),e ited listihg, unedited listing, and magnetic tape,,
all for only the first 100 records. Autho - Rosa T. Washington (Less than 56K bytes, PL/1).
SCMULTI outputs surface current data in any o e of the following combinations: (1) edited
liiting of the entire file; (2) edited listing nd punched, cards for the entire file; br (3)
edited listing, unedited listing, and magnetic ape, all for only the first 100 records. Au-
thor - Rosa T. Washington (72K bytes, PL/1).
DRYLAND reeds a sequential tape file and identifies any one-degree squAre which is completely
on land. Author - Robert Van Wie (30K bytes, PL/1).
CANWMO computes a WMO square, given a Modified Canadian square. Requires subroutines GRIDSQ,
TENSQ, and WMO. Author - Robert Van'Wie (FORTRAN).
Oceanographic Services Branch Copy on file at NODC
National Oceanographic Data CenterEDS/NOAAWashington, DC 20235 -
Reformatted Stalion OutputIBM 1
Telephone (202) 634-7439
Language - FORTRANHardware - IBM 370
Outputs formatted hydrographic and nutrient chemical data by station; input is NOAA format taw
data. Author - Stephen A. Macko.
153
-163 .

B.J. MeAlice Available from originator only
Ira CV Darling Center (Marine Laboratory)4 t
University of Maine at OronoWalpole, ME 04573 Telephone (207) 5634-3146,
'a
1,
\54
Jr
45
.4
.9
a
-\
tl6
OM%
itV...6.
0
,4 ----,...
-0--
)o
CP
1 6
sy
-far...FISM6664.
tb.
CS
H

GENER6L INDEX
126 A TO D20 AACAL20 AANDERAA'CURRENT METER79 AANDERAA CURRENT METER5B ABRAMSON NORMAN J60 ABRAMSON NORMAN J'130 ABSOLUTE VALUES SQUARE OF -
'54 ABUNDANCE101 ACQUISITION LAMINAE
8 ACCELERATICN POTENTIAL30 ACCELERATICN126 ACFFT149 ACHESON DONALD126 ACORR99 ACOUSTIC PERFORANCE AND
EVALUATICN101 ACOUSTIC RAY TRACING109 ACOUSTIC TRANSPONDER NAVIGATION126 ACRPLT23 ACTIVITY COEFFICIENTS23 ACTIVITY PRODUCTS27 ADAMS -BA SHFORD PREDICTOR10 ADIABATIC TEMPERATURE GRADIENT,99 ADSORPTICN CQEFFICIENTS72 ADVECTION25 AERIAL PI- CTCGRAPHY51 AFFINITY58 AGE59 AGE
11 60 AGEA2 AGE64, AGE
120 AIR-SEA INTERACTION134 AIR-SEA INTERFACE TEMPERATURE,
FLUCTUATION90 AIRCRAFT CBSERVATIONS25 IRPHOTO ANALYSISB3 APOY,WAVES
113 'ALASKA PLANE COORDINATE SYSTEM6 ALATORRE MIGUEL ANGEL59 -ALBACORE26---ALBEMARLE SOUND87 ALBEDO
110 ALBERS EQUAL AREA CCNICPROJECTION
22 ALCT120 ALERS PERRY B103 ALERT126 ALIGN22 ALKALIOITV6 ALPHA
13 ALPHA105 ALAfX135- ALSOP136 ALSOP151 ALTERGAS
'4 AMBROSIONI NESTOR LOPEZ CAPITANDE FRAGATA
26 AMEIN,MIChAEL
0
27 AMEIN MICHAEL56 ANGLER-DAYS113 AMERICAN PCLYCONIC GRID
COORDINATES22 AMERICAN PUBLIC HEALTH ASSN28 AMMONIA95 AMOS126 AMPHCO20 AULITUDE80 AMPLITUDES TIDAL CONSTITUENTS90 AMSTUT5 ANALOG TRACES .
126' ANALOG TO DIGITAL TIME SERIES87 ANALYS33 ANCHOR35 ANCHOR36 ANCHOR37 ANCHOR17 ANDERSON AE JR83 ANDERSON AE JR88 ANCERSON AE JR
113 ANDOVER - LAMBERT METHOD113 ANGLE A
142 ANGLE CHECK36 ANGLES CABLE
113 ANLIS107 r'ANNOT108 ANNOT107 ANNOTATED TRACK39 ANOMALY MAGNETIC69 ANOVA.70 ANOVA§8 ANOVA TABLE13 ANOVA TABLES40 ANSCHUTZ GYRO-STABILIZED PLATFCRM108 MIRK113 APCTN113 APCWN99 APE-DIGI
113 APOLY23 ACUEOUS SPECIES28 ARAG'ORN
126 ARANO SYSTEM91 ARCTIC SEA ICE
143 AREAL CONCENTRATION129 ARITHMETIC PROGRESSION126 ARMAII,'
2 ARPANET 034 ARRAY DYNAMICS142 ASA 4,
40 ASKANIA GRAVITY METER&,103 ASCRT95 ,ASSOCIATED AERO SCIENCE
LABORATORIES, INC' 138 ASSOCIATED AERO SCIENCE
LABCRATCPIES, INC 0'
142 -ASSUB -
111 ASTRONOMIC LATITUDE 0
,103 ASTRONOMIC POSITION
, .
te
- 155
1 63

80 ASTRONOMICAL TIDE PREDICTIC482 ASTRONOMICAL TIDES10 ATG82 ATLANTIC W146 NAVEST§WELLS
' 1 ATMOSPHERIC PRESSURE .
86-^ATMOSPHERIC WATER CONTENT MODEL5' ATWOOD DONALD K,
27 AUGUR85 ALTCOV
135 AUTCOV126 AUTO135 AUTO-COVARIANCE20 AUTO-SPECTRA
125 AUTGSPECTRAL AUTOCORRELATIONPLOTS
130 'AUTO SPECTRAL FUNCTION126 AUTOCORRELATION130 AUTOCORRELATION132 AUTOCORRELATION134 AUTOCORRELATION126 AUTOCOVARIANCE130 ALTOCOVAAIANCE132 AUTOCOVARIANCE121 AUTOMATED CONTOUR126 AUTOPLT1'26 AUTOREGRESSIVE AVERAGE127 AUTOREGRESSIVE INTEGRATED
MOVING AVERAGE MODEL132 AUTOREGRESSIVE INTEGRATED
MOVING AVERAGE MODEL;143 AVERAGE143 AVERAGES UNWEIGHTE30 AXIAL STRAIN39 AXIS14 AXIS DEPTH
126 AXISL103 AZIMUTH METHOD111 AZIMUTH109'AZIMUTH112. AZIMUTH113 AZIMUTH114 AZIMUTH110 AZIMUTHAL EQUIDISTANT PROJECTION115 AZIMUTHAL EQTHSTANT PROJECTICN' 2 B5,28
5 BO EXTRACTION50 BACKUS'-56 BAIT BOATS112 BALDINI REFRACTION MODEL131 &DAN° WIDTh127 BANDWIDTH116 BAR GRAPH25 BAR MIGRATICN90 BARNETT13 BARNEY WC LCDR25 BAROMETRIC"PRESSURE82 BARRIENTES CELSO S.40 BARRINGER PROTON MAGNETOMETER3 BARRON JCN L , -
At
O
22 BARRON JOHN L66 BARTLETT'S THREE GROUP METHOD138 EARTLETTS CURVE. FITTING25 BASIN BOTTOM PROFILE27 BASS P B108 BATHYMETRIC CHART41 BATHYMETRIC PROFILES
!39 BATHYMETRY40 BATHYMETRY41 BATHYMETRY45 BATHYMETRY47 BATHYMETRY .\
144 BATHYMETRY*107 BATHYMETRY ANNOTATION108 BATHYMETRY DIGITIZATION
96 BATHYTHERMOGRAPH153 BATHYTHERMCGRAPH151 BATHYTHERMOGRAPH SEE AXSO
BT AND XBT5 BATHYTHERMOGRAPHS
75 BAUER RA28 BAY CHESAPEAKE MODEL64 BAYLIFF W F24 EAYS MODEL
138 BCF117 BEACH AND 5IEARSHORE MAPS25 BEACH SUMULPION MODEL89 BECKMAN LEY RADIOMETER135 BELL LABORATORIES;1-6 BELL TH3 BENNETT ANDREW'
r 102 BERGSTRGM48 BERNINGHAUSEN WILLLAM,58 BERUDE CATHERINE L2 BERUDE CATHERINE L
65 BERUDE CATHERINE L,26 BEST DENNIS63 BEVERTON-_MOLT YIELD EQUATION63 BEYERTON P J H64 BEVERTON R J H65 BEVERTON R J H134. BEYER'W.H22 BICARBONATE ALKALINITY22 BICARBONATE .40lit BILLS .d1 BINGHAM C_.15.__BlhOMIAL SMCOTH* -.67 BINOMIAL DISTRIBUTION
? 51 BIOASSAY47 BIODAL SHIPBOARD LOGGING'SYSTEM26 BIOLOGICAL OXYGEW-DEMAND.54 BION . . .. ,
54, BIOMASSAr2
.
64. BIOMASS ' ,-,
66 BIOMETRY142 BIRTLEY .W THOMAS
10 BISSET-BERMAN .
130 BIT-REVERSI4G /-134 6LACKY'
.;
000714t,
o
, 1.
r

r '
93 BLATSTEIN IRA M13 BLISS KENNETH A29 BLUMBERG ALAN FREDL--/147 BNDO FORMAT147 BNDO FORMAT26 BOD28 BoIcoma,wILLIAm
111 BCLICN R M109 BOLTON R A110 BOLTON RONALD.109 BOLTON RCNALD M134 BOMM34 BCCMERANG CORER124 BORKOWSKI MARILYNN112 BORQUIN LARRY51 BCRTHWICK PATRICK W82 BOTTOM STRESS94 BOTTOM REFLECTIVITY95 BOTTOM REFLECTION COEFFICIENTS100 BOTTOM TOPOGRAPHY15 8CUYANCEFREQUENCY's
132, BCXCAR WINOCW133 BOX GEP22 BRACKISH WATER75. BRAINCON CURRENT METER79 BRAINCCN CURRENT METER
145 BRAINCON 316 CURRENT ME5, BRANCH D
117, BRANCH D134 BRAY T73 BRILLOUIN
138 BROWN MELVIN 08 'BRUNTVAISALA FREQUENCY
16 BRUNTVAISALA FREQUENCY17 BRUNTVAISALA FREQUENCY14 BT'17 BT20 BT90 BT PREOECTED
153 BTGEOIV,153 BTLISTC-48. BULK WET 'DENSITY33 BUOY35 BUOY DRIFT31 BUOYS SUBSURFACE40 BYRD WILLIAM E JR-4 C 18 A 18X4 C 18 A 23 X4 C 18 A 32 X FQ
. .
22 1. CO2 AND D.O. SAT2: CO2 PREP.-6 C04 SAL6 (44 TVA6 C46'SIGMi
30 CAB130 CABANA //30 CABLE-32 CABLE /33 CABLE
O
34 CABLE36 CABLE37 CABLE74 CABLE37 CABLE CONFIGURATION37 CABLE LAW,HEAVY GENERAL EAMES37 CABLE LAYING31 CABLE MULTISTRAND30 CABLE STRESS30 CABLE TEKSCNS45 CAIN14 CALDWELL CSc8 CALGCM
'443, CALIBRATE REVERSING THERMOMETERS4 CALIBRATICN $
12 CALIBRATION23 CALIBRATICNS OXIOATION POTENTIAL
CAPFIELD FE112 CAMPBELL ANDREW114 CAMPBELL'S EQUATIONSI50--CANA6A---150 CANADIAN SQUARES.153 CANADIAN SQUAREMODIFIED153 CANWMO84 CAPGRAY84 CAPILLARYGRAVITY WAVE7 CAPRICORN
52 CARBON 14 A ,
22 CARBCN DIOXIDE '49 CARBON IN SEDIMENTS52 CARBON DIOXIDE DIURNAL MEASURES23 'CARBONATE49 CARBONATE22 CARBONATE ALKALINITY52 CAROTENOIDS54 CAROTENOID
. 78 CARP78 CASDEC16 CAST50 'CATCH56 CATCH-57 CATCH59 CATCH
62 CATCH CURVE23.
CATCH
23. CATIONS126 CCFFT1.26 CCCRR '
53' CELL NUMBERS53 CELL SURFACE AREAS144 CESLQ.0'.113 COPC-50 CHANAT82, CHAPMAN C
CHARGED SPECIES105 CHART116 CHEAP JAMES C150 CHEM 80150 CHEMISTRY
157
ob t.
4

.
28 CHEMISTRY ESTUARINE17' CHERMAK ANDREW28 CHESAPEAKE BAY51 CHI - SQUARE62 CHI-.SQUARE74 CHI- SQUARE
136 CHI - SQUARE127 CHIRP Z.. TRANSFCRM50 CHKSPIT55"ICHLOR22 CHLORINITY52 CHLOROPHYLL54 CHLOROPHYLL,.55 CHLOROPHYLL:
112. CHOLESKY'S METHOD142 CHOLESKYPS METHOD22 CHRIS
CHRSECS5 CHURCH'98 CHURCH
VI
-140CHURC11 -ALAN V109 CIRAZO29 CIRCULATICN ESTUARINE2°5 CIRCULATICN IN ESTUARY24 CIRCUCATICN MODEL-ESTUARINE16 CLAMCNS J 'DEAN
109 CLAMONS j,CEAN14' CLARITY,56 CLARK 42 0
136 CLASSIFICATION CHI-SQUARES48 CLAY .
37 CLAYSCN CATHERINE145 CLEaL87, CLIMATOLCGY
145 CLJNL77 GLGCK CURRENT METER,90 GLCUD COVER63. CLUPEID STOCKS
136 CLUSTER ANALYSIS136. CLUSTERING CYCLEE20 CMXSPC'74 CNONSOTA56 CCAN ATILIC L JR75 CCAVALICURRENTS28 CCASTAL UPWELLING93 CCATE M118 CCOC FORMAT MEOS FORMAT146 CCM FORMAT NEDS FORMAT152 CCDCGCNV.-99 CCHEN J S134 COHERENCE127, CCHERENCY130 COHERENCE ESTOOTE1 PLOT127' CCHPLT95 CCLE DONALD146 CCLLIAS EUGENE E115 COLLIGAN EQUAL AREA PROJECTION
OF THE SPHERE1 'CCLLINS C A
2 CCLLINS C A103 CGLLINS C A118 COLLINS C A146 CCLLINS C A 435 COMPACTICN OF SAMPLE .
128 COMPLEX OEMUULATES127 CCMPLOT52 CONCENTWATIONS91 CCNCENTRATION OF SEA ICE143 COKENTRATICN AREAL3 CCNOUCTIVITY7 CCNOLCTIVITY18 CCNOUCTIVITY22 CCNOUCTIVITY.22. CCNOLCTIVITY127 CCNFIO127 CCNFID.,1126 CCYFIDENCE INTERVALS127 CCNFIOENCE INTERVALS130 CCNFIOENCE INTERVALS129 CONFIDENCE LEVEL131 CONFIDENCE REGIONS99 CCNGRATS122 CCNIC PROJECTION127 CCNMOOE39 CCNNARO G
4 40 CCNNARO G°25 CCNSERVATIGN OF SALT4 CCNSISTENCY CHECK
4 CCNSOLIDATION'31 CCNSTRAINTSEND'
r70. CONTINGENCY TABLE71 CONTINGENCY TABLE99 CCNTINUOUS GRADIENT101 CCNTINUOU§ GRADIENT42- CONTOUR CROSSING-INTERVALS100 CCNTOUR PLOTS12r- CCNTOUR CHARTS123 CCNTOURS VERTICAL ANALYSIS
TEMPERATURE AND SALINITY134 CCNTOUR ,PLOTTING14 CCNTRAST LOSS38 CCNVEC38 CCNVECTION IN VARIABLE VISCOSITY
FLUID5 CCNVERGENCE ZONE
1'0 CCNVERGENCE INTERVAL1 CCNVERSICN128 CNVDLUTION135 COLEY' .
133 C LEY J.,130 CO.. -tUKEY2FAST FOURIER TRANSFORM
67 CCU. Y WILLIAM W106 COCR'INATE TRANSFORMATION
' 107 CURET'49 ,CCRE33 CCRER BOOMERANG35 CORER DYNAMICS33 CCRMORAN
°
158
1 63
,

-
101 CORNYN JOHN J JRt
98 CCRRECTICN RATIO135 COSINE FOURIER TRANSFORM132 COSINE WINDOW135 COSPECTRA126 CCSPECTRUM141 COSPECTRUM"127 CCSTR
2 CCUGHRAN106 COURSE PLAN127 COVARIANCE131 COVARANCE134 COVARIANCE127 CPEES 44
127 CPLT 1127 CPLT 275 CREATE-C
, 100 CRITICAL ACOUSTIC RATIO06 CRMIS
4 ,15 CROCKER K75 CROCKER K127 CROPLT127..CROSS20 CROSS COVARIANCE MATRIX126 CROSS CORRELATION127 CROSS CORRELATION131 CROSS CORRELATION126 CROSS COVARIANCE135 CROSS COVARIANCE86 CROSS R .11
135 CROSS RALPH H125 CROSS SPECTRA129 CROSS SPECTRA134 CROSS SPECTRA20 CROSS SPECTRA
130 CROSS SPECTRAL MATRIX138 GROUT P D85 CRSCOV135 CRSCOV152 CRMCON138 CRT/FT 4
26 CSTLUPNL7 CTD
15 CTO100 CTCUR
4113 CUBIC113 cunt CURVE18 ,CUBIC SPLINE
100 CUBIC SPLINE INTERPOLATION141 CUBIC SPLINE7.8 CURPLT675 CURRENT METER77 ICURRENT METER
4
78 -CURRENT NETER.79 CURRENT METER20 CURRENTMETER AANDERAA78 CURRENT METER CALIBRATION77 CURRENT METER CLOCK -
145 CURRENT METER DATA REDUCTION
4.
'1 69.
76 CURRENT METER TURBULENCE91 CURRENT MCNTHLY SURFACE20 CURRENT PROFILER24 CURRENT SPEED78 URRENT SURFACE
/g12 URRENT VELOCITY84 CURRENT-NAVE INTERACTION
,i13 CURRENTST2 CURRENTS5 CURRENTS76 CURRENTS:14 CURRENTS28 CURRENTS COASTAL UPWELLIPG MODEL25 CURRENTS DENSITY25 CURRENTS I.:CNGSHORE32 CUARENTS.RESPONSE TO35 CURRENTS RESPONSE Ta37 ,CURRENTSRESPONSE75 CURRPLOT-58.CURVE FITTING60 CURVE FITTING61 CURVE FITTING65 CURVE FITTING74 CURVE FITTING
138 CURVE FLTTING146 CURVE FITTING138 CURVFIT N1S512138 CURVILINEAR REGRESSION -
127 GUSFC.127 CUSID
20 CYCLESONDE163 CYLINDRICAL'STEREOGRAPHIC
PROJECTION115 CYLINDRLCAL STEREOGRAPHIC
PROJECTION/128 CZT128 CZT93 ,D/E kNGLE56 DAM72 DANISH, kDVECTION PROGRAM10 DATA A:
2 DATA LOGGER3 CATA LOGGER4 DATA MANAGEMENT SYSTEM,
39 DATA REDUCTION129 DATA WINDOW145 CATE CCNVERSIONS22 DATOS
128 DATPLT128 CATPLT29 DAVIS
£02 CAVIS H46 DAY145 DAY OF WEEK38' DE BREMAECKER J-CL23 DEBYE-HUECKEL ACTIVITY
COEFFICIENTS104 DECCA °
1C9 DECCA
4:1
159'
40.
-44

404040
1
120107107113
672'7
. 2565
10712812812811680
12314214413
161723251
15
1201
6
152150
45
9720
14612812885
1357274
87,1089423
12838/.
52
7242
1282526
DECCA DATA LOGGER 127DECCA HDFIX 126DECCA MAINCHAIN MK21 RECEIVER 130DEEP, 130DEEP 6 136DEGFR 16DEGREE - MINUTE CONVERSION ' 15
CEGREE - SECOND CONVERSION 25DELTA-ALPHA '17
DELTA-ALPHA 76DELTA-0 30-DELTA-0 76DELTA DEVELOPMENT 45DELTA-ST 4 73DELTA-I4DEMI
22g6
CEMOD 1 28DEMOD 2' 146DEMOD 3 109DENDROdRAPH 53DENNIS R E 50DENNIS ROBERT 52DENNIS RCBERT 50DENNIS ROBERT 52DENSITY 54DENSITY 73DENSITY. 55DENSITY 42DENSITY CURRENTS IN ESTUARY 46DENSITY POTENTIAL 107DENSITY PRCFILE 20DENTON DIANNA L 20DEPTH 20DEPTHDEPTH
.12530
DEPTH80 39DEPTH ANOMALY DYNAMIC 42DEPTH ANOMALY DYNAMIC )113DEPTH CORRECTION FOR SOUND VEL 33DERIVE . 75DEZAIL 76DETREND 74DETREND 91DETRNO ,91DETRNO, 53DEVANNEY J W III 54DEVANNEY J'W III 36DEVANNEY J W III 37OGBTH 153DI NAPOLI FREDERICK R 142DIELECTRIC CONSTANTDIFF12 98DIFFRACTION X-RAY 10DIFFUSION COEFFICIENT 10QDIFFUSION EQUATION FICKIAN. 112DIGICT 5
DIRECT TRANSFORM 148DISCHARGE 134DISCHARGE 7
160
DISCRETE COSINE` TRANSFORM,DISCRETE FOURIER TRANSFORMDISCRETE FCURIER TRANSFORMDISCRETE SINE TRANSFORM .
DISCRIMINANT FUNCTIONDISPER ,DISPERSION CURVESDISPERSION LONGITUDINALDISPERSION RELATIONS 6
DISPLADISPLACEMENTDISPLACEMENT WATERDISPLOTDISSIMILARITY COEFFICIENTSDISSOLVED OXYGE4DISSOLVED OXYGEN '
DISSOLVEDOXYGENDISSOLVED OXYGEN,DISTANCEDISTRIBUTIDNDISTRIBUTION SPECIESDIURNAL MEASURESDIVERSITYDIVERSITYDIVERSITYDIVERSITY COMMUNITYDIVERSITY SPECIESDLIST '
DLISTDMRCTOMSCHPCMSEDOMSORTDOBSON F WDOLLSDOPPLER SPEEC LOG '
DOUBLXDRACUP JOSEpiEDRAGDRIFTDRIFT0' FT BOTTLEDRIFT ICEDRIFT NINC,DRINKARDLREWDRINKARD CREWDROGUEDROGUEORYLANDOSOP/CALCOSOP/GRAW0,,SDP/SONHAMSIGMTOTSTOVOUBESTEM DOROTHY EDUNCAN C PETERDUPEDURBIN JOURBURY
1
."

124 OVR 1055 MISTY18 DYANOM25 OYE PATCH MOVEMENTS46 DYGYT6 DYNAMIC DEPTH4 DYNAMIC DEPTH ANCMALY
18 OYNANIC.DEPTH ANOMALY1 DYNAMIC HEIGHT7 DYNAMIC HEIGHT8 DYNAMIC HEIGHT9 DYNAMIC ;HELGHT12 DYNAMIC 'HEIGHT14 DYNAMIC HEIGHT5 DYNAMIC HEIGHT ANOMALY
30 DYNAMIC STRESS RESPONSE4 30 DYNAMIC TENSION20 DYNAMICAL FIELDS29 DYNAMICS ESTUARINE9 DYNHT
22 DYRSSEN37 EAMES M C100 EARTH CURVATURE CORRECTIONS39 EARTH DELS
109 EARTH SPHE L
106 EARTH SPH CAL SUBROUTINES39 EARTHQUAK MICRO '
82 EAST COAST STORM SURGE52 EATON A 0123 EBRPLT52 ECOPROD73 ECOSTAT29 EODY85 EDIST46 EDIT
146 EDIT148 EDITQ40 ECOWESTERN PRECISION DEPTH 1CDR52 EFFICIENCY57 EFFORT23 EH VALUES15 -EIGEN FUNCTIONS17 EIGEN FUNCTIONS
,20 EIGEN FUNCTIONS99 EIGEN RAYS20 EIGEN VALUES15 EIGWALUES20 EIGENVAWJE93 EIGENVAWES20 EIGENVECTORS ORTHOGONAL99 EINSTEIN L T79 EKMAN CURRENT METER,1 EKMAN TRANSPORT
11 EKMAN VW30 ELASTICITY CABLE31 ,ELECTRO MECHANICAL CABLE7 ELEUTERLUS
31 ELONGATION39 ,EM LOG
O
4
20 EMPEIGU31 ENO CONSTRAINTS31 END MOMENT31, END RESPCNSES31 END ROTATICN1 ENERGY ANOMALY POTENTIAL2 ENERGY POTENTIAL
25 ENERGY WAVE AND,CURRENT91 ENERGY FLUXES128 ENERGY SPECTRUM48 ENGINEERING INDEX OF CORE SAMPLES63 ENGRAULID STOCKS136 ENORMSEP146 ENVIR13 ENVIRONMENTAL DYNAMICS91 ENVIRONMENTAL CHANGES EFFECT ON
SEA ICE39 ECTVOS CORRECTION43 ECTVOS CORRECTION44 ECTVOS CORRECTION45 ECTVOS CORRECTION&9 EPPLEY RYRHELIOMETER115 EQUAL AREA SINUSOIDAL PROJECTION69 EQUALITY OF MEANS TEST58 EQUILIBRIUM APPROXIMATION54 EQUILIBRIUM YIELD'25 EROSION BEACH
106 ESTC2106 ESTCH12 ESTPAC
106 ESTPL22 ESTUARY24 ESTUARY25 ESTUARY27 EULER METHOD37 EULER METHOD63 EUMETRIC YIELD128 EUREKA128 EUREKA 4
111 EUROPEAN DATUM90 EVAPORATIVE HEAT113 EXCES31 EXCITATICN34 EXCITATICN BY CURRENTS36 EXCITATION STROUHAL151 fXPENOABLE'EATHYTHERMOGRAPH
SEE ALSO X8T1
128 EXSMO128 EXSMO136 EXTENDED NORMAL SEPARATOR
7 F3.109 FAA PLOT
51 FAGER E W16 FARRELL J
148 FASD104 FASHAM M136 -FASHAM M94 FAST FIELD125 FAST FOURIER TRANSFORM
EXGRANGE
ioi
17j "
la

126 FAST FOURIER TRANSFORM128 FAST FOURIETRANSFORM131 FAST-FOURIER TRANSFORM135 FAST FOURIER TRANSFORM47 FATHCR43 FATHOM'44 FATHOM'47 FATHCMETER '
50 FAUNAL BREAKS16 FECHER MICHAEL
135 FEE EVERETT J88 FEEDBACK CCEAN-ATMO,SPHERP
.-128 FFIN34 FFT-
78 FFT125 FFT128 FFTCNO128 FFTCNVk128 FFTPS128 FFT$128 FFTSPC72 FICKIAN DIFFUSION EQUATION129 FILTER130 FILTER
f/k128 FILTER 1_/ 134 FILTER ARBITRARY
129 FILTER DESIGN128 FILTERS NON- RECURSIVE DIGITAL111 F.INDLAY 0 J25 FINITE-DIFFERENCE EQUATION24 FINITE DIFFERENCE28 FINITE ELEMENT SCHEME93 FINITE DIFFERENCE .
32 FINN EDWARD J51 FINNEY DJ70 FISHER'S EXACT TEST
106 'FISHER'S DISTRIBUTION133 FISZ MAREK94 FITIT89' FITZGERA,LD JAMES W128 FIVE T'S METHOD128 FIVET35 FIXED THIN LINE ARRAY-34 FIXED THIN LINE ARRAY DYNAMICS
151 FLANAGAN MICHAEL153 FLANAGAN MICHAEL103 FLAT POLAR EQUAL AREA SINUSOIDAL
PROJECTICN115_ FLAT POLAR EQUAL AREA SINUSOIDAL
PROJECTION102 FLEMING H91 FLIP50 FLISHT84 FLOOD LEVELS26/ FLOW85 FLOW VELCUTIES
VERTICAL/HORIJZONTAL54 2FLCONESCENCE.67' FLU CONDUCTIVE
87 FLUX EVAPORATIVE,228 FLUX TABLES20 FLUXES METEOROLOGICAL91 FLUXES ENERGY
102 FNWC9 FCFONOFF
11 FCFONOFF16 FCFONOFF1 FOFONOFF NP
10 FCFONOFF NP129 FOLD38 FOLK GRAPHIC MEASURES86 FORCE ,-
132 FORECAST127 FORECASTING AUTGREGRESSIVE
INTEGRATED MOVING AVG MODELS91 FORECASTS ICE14 FCREL-ULE SCALE
149 FOREMAN113 FORWARD. OSITICN COMPUTATION12 FOURIER ERIES25 FOURIER ERIES129 FOURIER 'TRANSFORM85 FCURTR
129 FOURTR1 5 F MIR1 9 FC SPC129 FOUSPC 1 '
129 FOUSPC 2110 FCX KAY117 FOX WILLIAM T425 _FOX WILLIAM T29 FOX WILLIAM T57 FOX WILLIAM V JR58 FOX WILLIAM W JR
121 FRAME'45 FREE AIR ANCMALY128 FREE FORA INPUT151 FREEMAN'153 FREEMAN ELMER68 FREQUENCY BISTIMBUTION119 FREQUENCY DISTRIBUTION PLOT129 FREQUENCY DOMAIN TEST131 FREQUENCY DOMAIN TEST
-129 FREQUENCY RESPONSE OF FILTER28 FRESHWATER INFLDW
129 FRESPON1 FROSE CHARLOTTE
10 FRCESE CHARLOTTE-,18 FS50 FTAPE
Ipo FUEL CONSIMPT ON,24 FULLER ALAN J22 FULTUN PATRICI'A A85 ,C1 BE TISR
129 GAIN80 GAINER THOMAS H JR43 GAL45 GAL
162
172
,

28 OALERKIN WEIGHTED RESIDUAL55 GALES L E62 GALES LAWRENCE E63 GALES L E64 GALES LAWRENCE E66 GALES LAWRENCE E29 GAMA DE ALMEIDA EMMANUEL43 GAMMA45 GAMMA
129 GAPH92 GARCIA LT ROLAND A U $ N112 GARFINKEL REFRACTION MODEL22 GARRELS R M95 GARRETT 1 A,96 GARRETT T.A149 GAS150 GAS150 GAS VASUM151 GASB150 GASCCI150 GASDIPBS150 GASEINV150 GASMASK150 GASOMER160 GASSAMPC150 GASTHERM150 GASVAPRT114 GAUSS MID LATITUDE METHOD17 GAUSSIAN METHODS THERMOCLINE
ANALYSIS94 GBEAM115 GCIRC56 ,GEAR59 GEAR83 GELEI40 GEMDERLE M89 GEMMI&L W M90 GEMMILL k M39 GEMPERLE M129 GENES 1129 GENER 2129 GENER 347 GEODATA
111 GEODETIC DATUM CONVERSION111 GEODETIC DATUM REDUCTION104 GEODETIC DISTANCE
.113. GEODETIC DISTANCE AND AZIMUTH111 GEODETIC POSITION113 GEODETIC POSITION114 GEODETIC POSITION77 GEODYNE 850 CURRENT METER .
78 GEODYNE 850 CURRENT METER77 GECDYNE MKIII tURRENT METER
41140 77 GEODYNE OPTICAL CURRENT METER47 GEOFILE''
GECMASS145 GEOPHYSICAL DATA REDUCTICN14 GEOPOTENTIAL ANOMALIES2' GEOPOTENTIAL ANOMALY
1
13 GECSTROPHIC CURRENTI G,EOSTROPHIC TRANSPORT9 *STROPHIC VELOCITY10 GEOSTROPHIC VELOCITY.83' GECSTROPHIC WIND
',GEPOSGIESE 04GILLESPIE LEILONIE 0
73 GLEASON76\. GLEASON ROBERT R39 GLIB
113 GMLIC110 GNOMONIC PROJECTION133 GODFREY NZ2' GODFREY PAUL J54 GCDFREy.PAUC J143 GODFREY PAUL j127 GOERTZELVS METHOD128 GOERTZELIS METHOD54 GOLDMAN C R
138 GGLOSTEIN142 GOLDSTEIN MARVIN J87 GOOD A J.12 GCCD A J
151 GORDON J78 GORDON JEFFREY76 GOSSNER LCDR JOHN
GCULD W J25 GRAIN SIZE38 GRAIN SIZE48 GRAIN SIZE22 GRAM PLOT METHOD133 GRANGER C i1 J
2 GRANT AB120 GRAPH 2116 GRAPH BAR100 GRASS13 GRAV13 GRAVITY3EL GRAVITY39 GRAVITY .
40 GRAVITY41' GRAVITY45 GRAVITY46 GRAVITY145 GRAVITY146 GRAVITY VARIATIONS111 GRAY B4REARA106 GREATdCIRCLE115 GREAT CIRCLE52 "'GREEN LINDA S79 GREGORY DCNG
103 GRID. PLOT121 GRIDIT1'53 GRIOSQ !
33, GRIFFIN GARY T') 34 GRIFFIN GARY T
35 GRIFFIN GARY T75 GRIFFIN GARY T
r3
s
A

.
41 GRIM PAUL J 99 HERSTEIN PETER D45 GRIM PAUL J 121 HERSTEIN PETER D41 GROMAN ROBERT C 125 TERSTEIN PETER D _
97 GRCMAN RCBERT C 3 HE LETT-xPACKARD DATA LOGGER119 GROAN ROBERT C 40 HI IX120 GROMAN ROBERT C 113 H FIX .
17 GROSFILS ERIC F 134 HILOW136 GROUP MEMBERSHIP PROBABILITIES 49 HIRONAKA MELVIN C56 GROWTH 118 'HISTO57' GROWTH 125 HISTOGRAM60 GROWTH 118 HISTOGRAMS61 GROWTH 104 HNAV63 GROWTH 104 HNV13. Gal-CLINE STD 18 HCLBROOK JAMES R
80 GULF-OF MEXICO 125 HCLBROOK JAMES R150 GVAREFRM 112 KCLOAHL JEANNE H57 GXPOPS 64 HOLT S J39 ,GYgO EACLINGS 63 HOLT S J YIELD EQUATION19 HADSELL PHILIP 69, HCMOGENEITYOF VARIANCES
153 HADSELL PHILIP' 93' HORIZONTAL RANGE50 HAEDRICH R L 32 HOTEL LOAD30 HALLANGER L W 38 HCUSTON M H JR18 HAMILTCN DOUGLAS R 42 HRMiN
-98 HAMILTON FRAME 17 HUMIDITY98 HAMILTON EDWIN R 87 HUMIDITY89 HAMILTON G D 9 HUNT MARY
133 HAMMING 10 AUNT MARY75 HANSEN FINITE DIFRMANCE SCHEME 11 HUNT MARY102 HARDY W A Alk, 78 MAT MARY25 .HARLEMAN DRF 97 HUNT MARY
HARMCN1C 143 HUNT MARY14 HARMONIC SYNTHESIS MEAN SEA TEMP 147 HUNT. MARY,79 HARMONIC ANALYSIS` 88 HURRICANE80 'HARMONIC ANALYSIS 82 HURRICANE STORM SURGE84 HARRIS D LEE 1 HUYER A'85 HARRIS D LEE 2 HUYER A34 HARTREE'S METHOD 143 HYB4
136 HASSELBIIAD4.*
8 HYD 258 HASSELBLAC VICTOR 1 HYDRO .
38 HATHAWAY JOHN C 33 HYDRODYNAMIC MASSES85 HEALY M J R 24 HYDRODYNAMICAL.-NUMERICAL MODEL
135 HEALY M J R 75 HYDRODYNAMICAL-NUMERCIAL MODEL72 HEAT 117 HY OGRAPHIC CAST PLOT87 HEAT BUDGET 23 HYD YSIS90 HEAT BUDGET 2 HYDRO EARCH38 HEAT FLOW 23 HYDRO IDE v
88 HEAT POTENtAL MODEL OlIRRICANE 127 HYPER OLIC ARCTANGENT SCALE90 HEAT TRANSFER CONVECTIVE 114 HYPERB LIC COORDINATES12 HEAT TRANSPORt 70 HYPERG ME1RIC DISTRIBUTION34 HEAVE 17 PANSON11HEIMERDINGER-SALLY 153 IBM1
151 HEIMERDINGER SALLY 91 ICE153 HEIMERDINGER SALLY 91 ICE °BULLETIN62 ATINKE'S ESTIMATE 91 ICE-PLOT40 MEIRTZLER 91 ICE PREDICTION
134' HEITMAN RICHARD E 91 ICEBERG DRIFT'31 HELICAL IRE MODEL 91 ICEGRID MCDIFIED
133 HELMS HOWARD 0 '91 ICEMELT , ,
47 HERSTEIN PETER D 124 ICES FORMAT
N1
17 4
2
4

451432351504119326
. 381284143137100
142161715
,7666'4567
161820776
14715015111412817.
15232322
IGRFILLUMINAMETERIMAGINARY REACTIONSIMPACT VELOCITY .
INDAIA
2.1310239
^144
INCIVIDUAL POINT GENERATOR 144INGENITO 144-INLETS DISCHARGE AND WATER LEVEL 144INMAN GRAPHIC MEASURES 144INPUT FREE FORM 2
INTEGRATE 68INTEGRATICN SINGLE 117INTENSITIES RANDOM COHERENT 93
AND STATIST4tAL 95
INTERACTIVE CALCULATIONS 99
INTERNAL GRAVITY WAVES 39
INTERNAL WAVE OSCILLATIONS 40
INTERNAL WAVES 3
INTEROCEAN TYPE II CURRENT METER 22
INTERP1 54
INTERP2INTERPOLATICN 150
INTERPOLATICN 151
INTERPOLATICN' 5
INTERPCLATICN 138INTERP ATICN 143
INTER LATION 7
INTERP LATICN 29
INTERP LATION LAGRANGIAN 102
INTERP LATICN LINEAR 91
INTERPOLATICN POLYNCMIAL 10
INVENTORIES 13
INVENTORIES 53
INVENTORY 48
INVERSE POSITION 98
INVERSE :TRANSFORM 70
rNVERSIONS 38
INYRE.J 135
ICN COMPLEXES 12
ICN PAIRS 16
ICNIC CONDUCTANCE 146
IREDALE HARRY79 IRMINGER SEA PROJECT91 IRVINE KENNETH M18 ISENTROPIC INTERPOLATION16 ISENTROPIC LEVELS99 ISC-LOSS.CCNTOURS100 ISOMETRIC PLOTS20 IWEG.54 JASSBY A144 JDAYWK133 JENKINS G M51 JENSEN A L52 JOB153 JCHNSON PEARL19 1CHNSON RALPH
115 JCHNSON RALPH,39 JCHNSON S H47 JCHNSTONLARRY
75
-
JONES JAMES H!JCNES JAMES F"JONES MJOYNER WJULDAYJULIANJULIAN DATE CONVERSIONSJULSECJULYAN
KALMOGOROV-SMIRNCV STATISTICKAM DENNIS T 0KANABIS WILLIAM GKAPLAN HERBERT S -
KASIK RONALD PKEELING K .*-
KEELING KKENNEDY INCREMENTAL RECORDERKEOKOSKY ELIZABETHKEOKOSKY ELIZABETHKOCKCSKY ELIZABETHKEULL GARYKEULL GARYKEYTEKEYTE F KKEYTE F KKILMERKINEMATICS ESTUARINEKLERER MKNODLEKNUDSENKNUDSEN.
1
KCVALA PAAVOkEKRAVITZ JOSEPH'KRAVITZ JOSEPHKRUSKAL=WALLIS TESTKURTOSISL101
CURVEL-2 GRAPHL-Z TABLE SMOOTHING
13- LA FOND50 LACKEY ROBERT T56, LACKEY ROBERT I57 LACKEY RCPERT T136 LACKEY ROBERT T406 LACOSTE AND ROMBERG SHIPBGRNE
GRAVITY METER46 LACOSTE-RCMBERG GRAVIMETER24 LAEVASTU TAIVO72 LAEVASTU TAIVO75 LAEVASTU TAIVO76 LAEVASTU TAIVO88 LAEVASTU TAIVO-89 LAWSTU TAIVO93 LAEVASTU TAIVO97 ,LAEVASTU TAIVO
129 LAG WINDOW132 LAG WINDOW
1654e.

01.111.111.111111...P.111MWP.WIIMINII4,
141' LAG3PT16 LAGRANG-IAN POLYNOMIAL ,
141 tAGRANGIAN INTERPOLATION25 LAKE MICHIGAN54 LAKES
111 LAMB *
.110 LAMBERT AZIMUTHAL EQUAL AREAPOLAR PROJECTION
103 LAMBERT CCN4C6pONFORMALPROJECTICN
109 LAMBER,CONIC CCNFORALPRO ECTICN
110' LAMBE T CONFORMAL CCNICPRO ECIICN
122 LAMBE T CCNFORMAL PROJECTION103 LA B T EQUAL AREA CYLINDRICAL
JECTICN110 LAMBERT EQUAL AREA CYLINDRICAL
PROJECTICN115 °LAMBERT EQUAL AREA CYLINDRICAL
PROJECTICN115 LAMBER' EQUAL AREA POLAR
PROJECTION112 LAMBERT PROJECTICN132 LANCZOSDATA WINCOW132 LANCZOSSQUARED DATA WINDOW56 LANDINGS
4 38 LANDISMAN17 LAPLACIAN RELAXATION87 LAPLACIAN RELAXATION88 LAPLACIAN RELAXATION53 LARRANCE JkRRY D17 LARSON SE83 LARSON SIGURD84 LARSON SIGURD88 LARSON SIGURD
150 LATLON 8C42, LATTIMORE RK
`43 LATTIMORE RKATTIMORE RK
45 L IMGRE RK46 *LATTI ORE RK947462424616
LAUER RICHARD B.LAUNCH DRIFT BOTTLELALRENT ANDRE GLAVELLE J WLAVELLE J WLAVOIE R
125 LAWRENCE D J89 LAZANOFF SM
128 LEAST SQUARE FILTERING94 LEAST SQUARED ERROR20 LEAST SQUARES58 LEAST SQUARES
146 LEAST SQUARES CURVE FIT138, LEASTISQUARES CURVE FITTING149 LEAST SQUARES FIT138 LEAST SQUARES DISTANCE HYPERPLANE138 LEAST SQUARES PLOT
70 .LEEWAY tACTORS94 LEIBIGER GUSTAVE A56 LENARZ WILLIAM H56 LENFgE85 LENG159 LENGTHFREQUENCY56 LENGTH FREQUENCY ANALYSIS58 LENGTHFREQUENCY DISTRIBUTION58 ,LENGTH13 LEROY
100 LEROY61 I'LEVATIN JC ANNE63 LEVATINJ0 ANNE
133 LEVINSON N133 LEWIS P A W34 LEWIS' DIMENSIONLESS.RAO'S30 LIFTING 'LINES98 LIGHT AND SOUND INSTRUCTION B
'95 LIGHT AND SCUND INSTRUCTION D\136 LIKELIHOCD ESTIMATES42 LIMITS )
135 LUIDSEY1.1 K120 LINE PRINTER PLOTS1386566
1283031
14148
11844313130323065
12980845152
6711210410610911211410511011411010044106
166
176
LINEAR REGRESSIONLINEAR REGRESSION. ANALYSIS eA,LINEAR REGRESS ANALYSISLINEAR TRENDLINES LIFTINGLINES MOCRING t\LININTLIQUID LIMITLI SPLOLISTPLIU CLLIU FRANCIS CLOAD HANDLINGLOAD HOTELLOAD MOTICNLOGISTICS SCHAEFER MODELLCGPLTLCNG EELCNG STEVEN RLCKGLEY WILLIAMLCNGLEY WILLIAMLCKGLINERSLCNNES PAUL RLORAC.LGRANLORANLORANLCRANLCRANLORAN CONyESIONLCRAN CONVERSIONLORAN CONVERSIONLGRAN SKYWAVE CORRECTIONLCSSPLOTLOXNAVLRFIX
I
147 LSTA 1142,-/
31 LUMP MASS32 LUMP MASS33 LUMP MASS34 LUMP MASS3/ LUMP MASS80 LUNAR SEMIDURNAL CONSTITUENT M280 LUNAR TIDAL FORCE
138 M CURVE23 M010180 M2
121 MACHINE PLOTTING59 MACKETT D 4 'ts
28 -MACKO STEPHEN A55 MACKO STEPHEN A
153 MACKO STEPHEN A39 MAG2D107 MAGRI39, MAGNAVOX 706 SATELLITE NAVIGATIO139" MAGNETIC ANOMALY42 MAGNETIC ANCMALY PROFILES41 MAGNETIC FIELD107 MAGNETIC FIELD CCMPCNENTS120 MAGNETIC SIGNATURES39 MAGNETICS40 MAGNETICS41 MAGNETICS45 MAGNETICS47 MAGNETICS
145 MAGNETICS108 ....MAGNETICS CFART120 MAGNETOMETER77 MAGPACK
120 MAGP (,OT
148 MAILER148 MAILING 'LABELS
MAKE12078 MALTAIS JCHN A
118 MALTAIS JOHN A56 MANAGEMENT FISHERIES57 MANAGEMENT FISHERIES50 MANAGEMENT POLICY57 MANAGEMENT MATER RESOURCES38 MANTLE EARTHS -
146 MANTYLA NCRMA.3 MAP
1 2 MAP PLOTS2 MAP PROJECTICN DISTORTIONS104 MAP PROJECTIONS SEE ALSO NAME OF
I PROJECTICN115 MAR,SUBROLTINE'122 MAPPLT52 MARGALEF73 MARGALEF20 A MARK II CYCLESONDE59 MARKET MEASUREMENT72 MARKOVWIND MODEL87 MARKOV WIND MODEL40 MARQUART DOPPLER SONAR 2015A
a c167
134 PARSAGLILLI99 MARSH .7101 MAR 4p PHILIP26 PASCNESORC INLET72 MASS ADVECTION26 MASS BALANCE EQUATION91 MASS CHANGES ICE1 MASS TRANSPORT
15 MASSEY ALAN .T142 MASSEY ALAN47 MASSINGIiLL JAMES V
107 MASSINGItL JAMES V146 MASTER121 hArSTRACKJ49 MATBL20 vMATRIX
142 MATRIX32 MATRIX OF RACII32 MATRIX OF SPEED93,,---MATTHEWS TABLES'57 MATURATICN'63 MATURATION.15 MAXIMA REJECTION
102 MAY J91 MAYKUT G A22 MAYS MICHAEL E28 MCALICE B J55 MCALICE8 J154 MCALICE B J116 MCCAMMCN122837
7
8
1031471341061281368811811717314
48103106107108119121122124108105
MCHENDRIE 'CRAIGMCHONE JOHN4CLELLAN
t
MCMATH RLTHMCMATH 1WTHMCMATF RUTHMCMATH RUTHMCMILLAN JAHN GMEAN POLE COMPUTATIONMEAN TRENDMEANSMEDITERRANEANMEDS FORMATMEDS PLOTMEDSSTMERCATORMERCATORMERCATORMERCATORMERCATORMERCATORMERCATORMERCATORMERCATORMERCATORMERCATORMERCATORMERCATORMERCATOR GRID
DIGITIZATION
A
4
4.

' 110 MERCATOR 'PRO115 MERCATOR PROJECTION109 MERCATOR SEE ALSO'IRANSVERS
a MERCATOR AND OBLIQUE MERCATOR122 MERCATOR TRANSVERSE, PROJECTION
1,1MERIKONAL TRANSPORT68 MERISTIC VARIATES20 MET 5LX80 MEXICO GULF OF
141 MFIELD56 MGEAR17 NEWTONRAPHSON APPROXIMATION79 MICHELSENSCONTAINER DATA25 MICHIGAN LAKE40 MICRO TECHNICA GYROCOMPASS121 MICROFILM PLOTS123 MICROFILM PLOTS89 MIE SCATTERING THEORY124 MILLER FORREST
JECTION
E
103 MILLER PROJECTION110 MILLER PROJECTION115 MILLER PRCJECTION38 MINERALOGIC ANALYSIS15 MINIMA REJECTION102 MININGHAM R107 MINUTE DEGREE CONVERSION30 MISSION SCENARIO32 MISSION RADIUS150 MIXED LAYER12 MIXED LAYER DEPTH88 MIXED. LAYER DEPTH ANALYSIS .20 MK2CAL99 MK48 TORPEDCACOUSTIGS'51 MCBLEY CURTIS93 MOOE ENHANCEMENT93 MODE SHAPES24 MODEL 8AY28 MODEL CHESAPEAKE 8AY
a. 28 MODEL COASTAL UFWELLNG24....4400EL COASILINE5L.w MCOEL ECCSYMM
MODEL gSTUARY31 MODEL HELICAL WIRE127 MODEL IDEPTIPICATION132 MODEL IDENTIFICATION29 MODEL NUMERICAL28 MODELING AN OCEAN POND4 MOHR C MICHAEL
11!1 , MOLLWEIDE HOMOLOGRAPHIC PROJECTION 77 NAVIC1 5,11OLLWEIDE HCMCLOGRAPHIC PROJECTICN 144 NDAYWK86' OMENT X52 NEILSEN,
10610,7
142-145
0 34351820
150150151
MOORE MICHAELMCCRE MICHAELMOORE MICHAELMCCRE MICHAEL
ORINGMOMOORINGMCRAWSKI WALTERMORAWSKI WALTERM RAWSKI WALTERM AWSKI WALTERM RAWSKI WALTER
27 M ISHIMA D L51 MORTALITY56 a MCRTALTLy57 MORTALLW62 MORTALITY63 MORTALITY64 MORTALITY34 MOTI 'EQUATIONS OF36 MOTI N36 MCTIO37 MOTIO343 MOVE91 MCVEMENT OFD SEA ICE .
77 MPRINTO97 MTCOR16 MUDPAK*0 MUIRHEAD CHARLES R
135 MULDA67- MULTIPLEREGRE SSIONANALYSIS136 MULTIPLE DISCRIMINANT ANALYSIS82 MUNK SVERDRUP-.MUNK WAVE
FORECAST/NG SYSTEM63 MURPHY CATCH EQUATION,28 MYACHEM89 MYERS MARY E35 NAFI
151 "NAMES5 NANSEN BOTTLES
39 NAVIGATION40 NAVIGATICN43 NAVIGATICN44 NAVIGATICN
qi; 145 NAVIGATION76 NAVIGATICN ERROR FACTORS
108 NAVIGATICN PLOT109 NAVIGATICN REAL TIME120 NAVIGATICN WITH OTHER DATA PLOT-
EQUATIONS OFQUATIONS OFATIONSIO
94 *MONOCHROMATIC SOURCE 111 NELSON MERLE L56 MOATE CARLO SIMULATION 133 N
72 MCNTE'CARLO SPILL TRACKER, 532 MCNTGOMERY
150 MCNTH80 .
20 MCCERS CHRISTOPHER N K21 MCCERS CHRISTOPHER N K105 MCORE MICHAEL'
4
ti
4
168
2613893
28
LSON CHARLES RAMPLES 9.
EUS ESTUARYNEWFITEWMANGSDC FORMATNIGFET PC-NC
i7'6
t.p.
a
4o.
4
74 NISKIN CURRENT ARRAY6. NITRATE7 N1.TRATE8 NITRATE
28 NITRATE7 NITRITE8 NITRITE
28 NITRITE90 NI'X 0 B
14 NIX 0 B73 NOCHROMATIC SOURCE7 NODC FORMAI9 NODC FORMAT
102 NODC FORMAT146 NOOC FORMAT148 :NODC FORMAT151 NOOC 'FORMAT151 NODGSQ132 NOISE120: NOISE GECPAGNETIC BACKGRCUND '129 'NOISE 'WHITE129 NOIZT70 NCNADDITIVITY93 NOR'AL mcqEs93 NORM0113
136 NCRMSeP111 .NORTH AMERICAN DATUM113 NOS 4CIENTIFIC SUBROUTINE SYSTEMT NOWLIN
-# 76 NSAR ,
39 NUMBER42 NUMBER A
149 NUMISER,ING OF CECKI3 NUTRIENT
153" NUTRIENT CHEMISTRY- 0
144 'MOAT144 NXTDY.109 OBLIQUE MERCATOR PROJECTION
110 OBLIQUE MERCATOR PROJECTION1107 C "BRIEN ROBERt A. JR108 CI3RIEN ROBERT A JR124 O'-BRIEN ROBERT A 4R
8 OBVFRO9 OCCOMP24 ,ocEppoq'
108 OCEAN15 OCEAN DATA13. ,,,CGEAN L I E
4 OCEANS, V50 OEP
" \ 99 CFF ICER'74 quT2 OIL sPILW
"(102 CLMSTED CI99 OMEGA \,
114. OMEGA
Ns i 105 OMEGA -CONVERSION11 'OPLOT
'WC iORSTCM FORMAT
4
30° ORTHOGONAL CCLLOCATION"136 ORTHOGONAL POLYNOMIAL121 OSBORN-ROGENT121 OVERLAY PLOT .
23 OXIDATION POJENTIAL CALIBRATIONS723 OXIDE1 OXYGEN4* OXYGEN 0
7 OXYGEN,8 OXYGEN , °
11 OXYGEN0
2, extGEti ANOMALY,22 ,OXYGEN OtSSCLVED26 OXNGEN DISSOLVED cl
28 OXYGEN DISCLVEOsr OXYGEN DIURNAL CURVE ME0052 OXYGEN DIURNAL MEASURES11 OXYGEN PERCENT SATURATION22 OXYGEN PERCENT SATURATION ,
124 OXYGEN PHCSPHATE DENSITY PLOTS146. OXYGEN SATURATION
2 OXYGEN SATURATION6 OXYGEN SATURATION7-OXYGEN SWIRATION PERCENT6 OXYGEN' UTTWIZATION APPARENT52 Y/R
138 P3TERM12 .PACIFIC TROPICAL82 PACIFIC WIND WAVES /SMELLS84 PAGE EILEEN74 PAIRWISE CORRELATION DRIFT BOTTLE
'RECOVERY73 PAL0,6 VERGES SHELF26 PAMLICO SCUND57 'PANDAL/0 SHRIMP109 PAR4METRIC MAP
.127 PARAMETER ESTIMATION132 PARAMETER ESTIMATION109 PARRINELLC J111, PARRINELLC J25 PARTICLE TRAJEC1CRIES '
133 PARZ(EN E132 .PARZEN SPECTRAL WINDOW95 PATTERN FUNCTION33 PATTON KIRK T3'5 PATTON KIR* T63' PAULIK64, PAULIKG' J-30 PAYLOAD118 PAYNE 4iCrARci/E'119,,PAYNE RICWARO E '. '
.
3 PEAKS /'
66.: PEARSCN-ROCUC1MOMENTCOR ATICN CdEFFrCIENT'
72 PEDE Act Q .65. PEI-14.J
0 9 .P@IN1'9 PENDLETON DAVE
138 PENDLETCN DAVE
p.
1.
\.

1.41 RENbLETON DAVE -'.35 PENETRATICN OF CORER88, OEftDUE J K78 RERFECT DANIEL FREQUENCi.HINDOW125. PIRFECT,cANIEL FREQUENCY- NINDOW
/ .-78 PERIODOGRAM125 PERIODOGRAM128 PERIODOGRAMS% , ,
A29 PERIDDOGRAMS.20 PERKINS HENRY T
.)-
21 PERKINS OENRY T.49 PERMEAOIWY122 PFLOST$,22 PH ,rf,129 PHAPLT
a' 134 PHASE'125 PHASE ANGLE VS FREQUENCY PLOTS
12T PHASE'ESTIMATES129 kHASE ESTIWATES
.
130 RNASE ESTIMATES126 PHASE SPEETRA'80 PHASES 'TIDAL CONSTITUENTS22 PHENOLPHTHALEIN ALKALINITY,54 PHEOPIGMENTS44 ,PHONEY -
7 PHOSPHATEPHOSPHATE
28 PHOSPHATE'52 PHOTOSYNTHETIC QUOTIENT53 PHYTCELANKTCN NUMBERS, VOLUMES',
SURFACE AREAS" 55 PLITOPLANKTON POPULATION DENSITY,
-64....;PIECEWISE INTEGRATION55 PIENAAR L V
136 PIENAAR L V112 PIERCE C E37 PIERCE R24 PIETRAFESA I-
26. PIETRAFE1A L J54 PIGMENT RATIO52 PIGMENTS54 PIGMENTS
. 86 pILE-N3RCE DISTRIBUTION ON1,56 PISCES
34 PITCH4' 39 RLANE DIPPING LAYERS
52 PLANKTCN53 PLANKTCN t
56 PLANNING FISHERIES53 PLAIMA,VOLLME
4 48 PLASTIC LIMIT15 ',PLESSEY CTOSTD.42 PLOT124 PLOT39 PLGIOFER3 PLOA
100 PLOTS 3-0 ISOMETRIC AND CPNTOUR.40 PLOTS EOOHYSICAL50 PLOTSECG
A
I"` .-
42 PLTZ,20 HISAO8 LTEDT \
129 PLTFOR1290PLTORQ129 PLTSPC19 PODENS
110 POINT GENERATOR94 - POINT MONCCAROMATIC SOURCE67 PCISSON DISTRIBUTION
106 POLAR COORDINATES47 POLAR STERECGRAPHIC PROJECTION
110 PCLAR STEREOGRAPHIC PROJECTIDN115 POLAR STERECGRAPHIC PROJECTION112 POLARIS AND SOUTH STAR METHOD50 POLICY ECOSYSTEM MANAGEMENT81 PCLLAK HENRY L8 POLLONI CHRIS 4
105 POLLONI CHRIS143 POLIONI CHRIS24 POLLUTANT CIFFU$14 FIELDS72 PCLLUTICN72 POLLUTION THERM
130 POLRT109 PCLYCCNIC PROJECTION
-130 POLY00130 PCLYNOMIAL DIVISION'128 PCLYNQMIAL MULTIPLICATION136 PCLYNOMIAL REGRESSION ANALYSIS130 PCLYNOMIAL 'ROOTS - ,
130 PCLYNOMIAL SQUARE ROOT OF28 -POND MODEL. -53- JCPULATICN55 POPULATItN QENSITY PIHYTOPLANKTON
130 POPULATI.CN CISTRIBUTIONSRANDOM SAMPLE
57 POPULkTICN SIMULATOR81(' PORE N A82 PCRE N vA
83 PORE NA-30 PORE WATER 4RESSURE147 PCSEIDCN
,
13 PCSIT,22 POTASSIUM
, 18 PCTDEN10 PCTEMP ,
1 POTENTIAL DENSITY18 DENSITY19 y TENTIAL CENSITY2 P 1ENTIAL ENERGY1 POTENTIAL ENERGY:ANCMALYA POTENTIAL ENERGY ANONALS9. PCTENTIAL ENERGY,ANCMkLY-6 POTENTI'A'L SIGMA;7' PCTENTIAL, SIGMAL- POTENTIAL TEMPERATURE5 POTENTIAt TEMPERATURE6 'POTENTIAL TEMPERATURE7 POTENTIAL TEMPERATURE
170
u
1
.
ti
4

110
.
8 POTENTIAt TEMPERATURE10 POTENTIAL TEMPERATURE
75104
16' _POTENTIAL TEMRERATURE. 109
. -18 POTENTIAL TEMPERATURE' 1. POTENTIAL TEMPERATURE 93
22 :POTENTIOMETRIC ALKALINITY 94
POTOMAC ESTUARY \ 95
134 'POKIER 96
125 POWER SPECTRA 99
129 POWER'SOECTRA 130
134 POWER SPECTRA . 119
131 POWER SPECTRAL ESTIMATES 130
'130 POWER SPECTRUM 118
79 P'CWER SPECTRUM ANALYSIS 58101\4TYNTER A JB 59
/-S 44 PPLIST 60
72 PRAHA L P 61
30 \PREDICTORCORRECTOR METHOD 62
31 PREDICTORCORRECTOR METHOD 63
'50 PREPLOTG 64I 19 PRESSR 65
1 PRESSURE 66
6 'PRESSURE 67
8 PRESSURE / 68,9 PRESSURE 69
, 19 PRESSURE' / 70
22 PRESSURE EFFECT 71
1 PRESSURE ATMOSPHERIC ( 130
25 PRESSUREBARCMETRIC 145
.87 PRESSURE BAROMETRIC 99
106 PRFPLT . 56
118 PRI R PLOTS . .87
r2Q' PRI R PLCTS 89
123 PRI ARD JCHN A 42
' 136 PR ABILITIES OF GROUP MEMBERSHIP 1125 PROBABILITY 14
' 129 PRCBABILITY 4
136 PROBABXLITV 135
' 132 PROBABILITY LIMITS 126
51..-PROBIAANALYSIS 131-,
136. PRCBIT ANALYSIS 4,
57 'PROQFIT/4646
coo PRODUCTMOMENT CORRELATION 17
COEFFICIENT 24
57 PRCOUGT.ICN 72
52, PROOUTIVITY, r 83
PROOUCTI4ITY OXYGEN DIURNAL. ' 88
CURVE METHOD 89'
858$
PROF'PROFILE
v.
,
.,*
133'87
119 PROFILE . 31
122 PROFILE, , 133
121 PROFILE,' OTr. 80
.119. PROFILE PLOT'DATA ALONG TRACK ' 89'
119 PROFILE VS TIME OR DISTANCE 9d108 PROFL . 87
116,.
PROFL . 87
122 PROFL3 89
129 PROGRESSICN ARITHMETIC 88
4.
JPROGRESSIVE VECTOR PLOT CURRENTSPROJECTICNS OF :SPHEitEPROJECTION MAP IEE,NAME OF
PROJECTIONPROPAGATION LOSSPROPAGPICN LOSSPROPAGATION LOSSPREPAGATICN'LOSSPROPAGATION LOSSPRFPLTPROVECPRYERSPSAL1'PSAROPULCS CHRISTOPHER TPSAROPULCS CHRISTOPHER T'PSAROPULCS CHRISTOPHER-TPSARIPULOS.CHRISTOPHER TPSARCPULCS CHRISTOPHER TPSAROPULCS CHRISTOPHER T A\
PSAROPULCS CHRISTOPHER TPSAROPULCS CHRISTOPHER TPSAROPULCS CHRISTOPHER TPSAROPULCS CHRISTOPHER TPSARCPULCS CHRISTOPHER TPSAROPULCS CHRISTOPHER TPSAROPU4OS CHRISTOPHER TPSAROPULCS CHRISTOPHER 7PSQRTPTIMEPULSE SHAPEPURSE SEINERSPYRANOMETERPYRHE4.1,IONETEROCKDRA4'QFUNQREADGINOQUAD SPEgTRA
.
QUADRATURE-SPECTRUMQUADRATURE SPECTRUM
' QUE
QUETWO.R&D ASSOCIATESRABE KEVIN MRABE KEVIN M .
RABE KEVIN MRABE KEVIN M '
RABE KEVIN MRABINER.L RRAD,RADAC .
RADER C M .
RADI TIDAL FORCERAD ATIONRADL TION7RADI TION SOWRADIOMETER.RADIOMETERRADIOSONCE I s

c
32 RADIUS31 RAMSC'31 RAMSC
130 RANOM130, RANDOM10 RANDOM1132 RANDOM322 R NGE93 'R GE100 1141 LOT,
,102 RAY DENSITIES, 99 RAY WAGONS
"93 RAY EQUIVALENTS,101 RAY SORT'102 RAY TRACING112 'RAYD -IST
95 RAYLEIGH - MORSE95 RAYMOR .
102 RAYTRACE130 RCTFFT13 RDEDTP
146% READ TAPE74' RECOVERY ORIFT_BOTTLE
*57 RECREATTON54' RECRUITMENT5? RECRUITMENTJ,A RECRUITMENT110 RECTIFIEC, SKEW ORTHOMORPH1C
# OROjECTUN2 CTIV'ITY INBEX2
23. 6145
138
OF MISSION
NUMBERSSAMPLESHOCK .
FIELDEDOX REACTIOW
REDUCTION ;"
REDUCTION AND oisp.py OF DATAACQUIRED AT SEA'
',RECUCTION 'TECHNIQUE CURVE,.... . COEFFICIENTS.
87- REED R K -,,. [95 KEEYES J C ,
'.\REFLI *
REFLECTICN COEFFICIENTS. s# 39 REFLEFION.WIDEANGLE' .89 REFRACTOON .,'" , ..
94 ,REFRACTICN 4- 1
Ea REFRACTICN CCEFFICIENTS WAVE112' AEFRACTICN MODELS
. 19' REFRACTICN SEISMIC-7'45 REGIONAL FIELD ,'''
''. 51 AEGRESSICN ANALYSIS'1434 ,, REGRESSION -ANALYSIS .
' 65 REGRESSICN (LINEAR P -,. 8Z° REGRESSIQMISTATISTICAL SCREENING
126._REGREISIVE MOVING AVERAGE*-
Si' REGRCUPI-121, REGRIDLT .
31.4REINIGER R .
118 RE IN R F°. 141 REINSCH!S TECHNIQUE
. #,A, ,57 .REPRODUCTIVE SUCCESS,'
.
d %F.
'91 o ... '
1,
149 REPRODUCTION OF DECK76 RESCUE57 RESERVOIR45 RESIDUAL MAGNETIC A52 RESPIRATION ,/
130 RESPON135, RESPONSE SURFACE,153 RETBT151 RETRIEVAL151 RETRIEVAL153. RETXBT101 REVERBIRRATICN99- REVERBERATION94 REVERBERATION INDEX.95 REVERBERATION INDEX130 REVERS138 KEYT-E" F K
106 RHUMBLINE2, RICHARDS
52 RICHARDS58 RICKER W E54 RICKER W E
/-56 RICKER YIELD EQUATION91 RITE
66 'RITTER'0 WALTER,67 RITTER 0 ;,ALTER .
68 RITTER 0 WALT&69 RITTER 0 WALTER
. 70 RITTER 0 WALTER71 RITTER,0 WALTER
. 24 RIVERS .FLOWING INTO ESTUARY39 ROBB JAMES M
133 ROBINSON ENDERS Aa62.AROBSON 6 s 7
-120 RGC-101 G1Q3' 'RCEDDER SPENtER .
-RCHLE F.JAMES1,'67,-ROHLF F'4AMES- #
68 RCH3.F F JAMES ' .#4!
6'9 RC F F.JAMES70 ROHLF F JAMES ,
52) RCNA;M R130 RCCTS OF A PCLYNCMIAL102 ROSENBAUM S
. , /118. ROSS C
, 112 8C55 E B137 RCSS E 8106 RCTATION ABOUT A'POLE106 ROTATION FCR CLCSES1 APPROACH106 RCTATICN.CN M SPFERE105 RCTGUT110 RGWEN'LOUISI30 RPI.ACE20 ;Iss
x 33 RUNGEKUTTA ALGORITHM34 RUNGEKUTTA ALOCPITHM35" 'RUNGELKUTTA ALGGAITHM36 RUNGEKOTA ALGORITHM37 RUNG6KU9TTA ALGORITHM
.1
OMALY.
4.
./.19' II
p
4""
;
172 I ,
n.
S.
r
9
-a

fe4.- 37' RUPINSKI SL4 RUSSELL JCHN J15 RUSSELL JCHN J54 RYLD99 SO434B95 S158795 5J.797
06 S20.49123 SABOL PAUL
. 144 SABCL PAUL106 ..4ILB106 SAILG106 SAILM18- SALINE1 SALINITY2 SALINITY
.3 SALINITYe. 44 SALINITY
6: SALIN4Y,7 SALINITY
SKIN1TY0 11 :SALINITY-
14 SALINITY ' de.
19 SALINITYSALINITY
SALINITYSALINITY ANOMALY
6 SALINITY FLUXSA4INITY IN ESTUARY
25'. SALINITY IN.ESTUARY25 SALINITY' N ESTUARY25 SALINITY TRUSION91 ,SALPR 9
'28. SALT ADVECTION
T
25 SALT OF,28 SALT CO INUITY12 SALT TR NSPCRT11 SALTY40 SAND
130 SARIT142 SIAS
105 SATELLITE103 SATELLITE NAVIGATIch 7 . h103 SATELLITE RISE & SET123 SATELLITE VHRR DISPLAY68 SATTEWHNAIE'S APPROXIMAICN'84 SBNRq
'125 SCALAR:TIME SERIES'93 SCATTEWIAG OF tCUND BY ORGANISMS
14 SCRIPPS ILLUKINAMETER14P SCRUB122 SCIGM 4-122 StTGM 5151 SD2GAS
e 152 SD2MSTCT
1.51 2T0SO 1 °
104 56ANO151 SOCHAR152' SDGEOIV152 SDPASS152 SCPRT2152 SC5ELECT34 SEA STATE SHIP RESPCNSE TO83 SEA STATE46. SEAMOUNT MAGNETIZATION76 SEARCH ANC AESCUE'PLANNING52 SEASCN
,
14 SECCHI DISK,113 SECOND - CEGREE CONVERSION
8 SECPG6 SpHY0
48 SEDIMENT . 4 6 )35' SEDIMENT .FRICTIONAL FORCES DUE TO
.25 SEDIMENT LOAD97 SkDIMENT SCUND VEL ADJUSTMENT9;0/SEDIMENT SOLND VELOCITY )
38 SEDIMENTS7 SEDSTD '
39 SEISMIC4DAIA50 SELECT
t 15L SELECTION151 SELECTION90 SEN1SIBLE HEAT EXCHANGE'
,120 SEQUENTIAL PLCTTING;130' SERGEN149 SERIALZATICN OF DECK100 SERP&NT49 SETTLEMENT82 SVSRDRUP-MURK WAVE FORECASTING
SYSTEM57 SEX RATIO26 SHALLOWKATIER SYSTEMS:73 SHANNON-WEER
'
122 SCATTERGRAM30 SCENARIO MISSICN65 SCPAEFER M
433 SCHAEFE8 R ti
106 .SCHEDULE STATION TIME38' SCHLEE
153 §CHNINE99 SCI-ULKIN
153 SCMULTI
a
0
4
130 SHOE-38 SHEAR HEATING49 'ShEAR TEST25W ShEARIN °
38 SHEPPARD0StCRREOTION.38 SHIOELER GERALD L ,
33 'SHIP =;,/,
34 ShIP RESPCNSE83 SHOALING Z EFFICIENTg NAVE
147 SHCM PORMAT57 SHRIMP,.PANCIALID s
.
88 1-1UMAN LCCRSIGMA-0 -\ "
13 SIGMA -0
173
183
IP
1.5

6 IIGN1ASTP-1 S1GMA-T'
. 2 SIGMAT4 SIGMA-T5 SIGMA-T
SIGMA-TSIGMA -T
8 SIGMA -T10 SIGMA-712 SIGMA-T,13 SIGMA-*
. 26, SIGMA-T15 .SIGMA-T -INVERSION REMOVAL-10 SIGMAT
SIGMAT18 ,SIGMAT76 SILICATE8 SILICATE
&2-s11.8
SILICATE. '1',23 SILICATE
14,4/- 'ga I Sit I tATE22.
48 `SILT is0136 ,S-1MILARITY PATTI]73 SIMPSON
-, 25 SIKUDL69 'SrPATANEICUS TEST PRO
S UANECUSATESPRDC DURE135- ,S NE 'FOURIER TRANSFCRM114' S NGLETtiN J .
130 .SINTR' '
103 SINUSOIDAL EQUAL AREA pROOCTICN
. 64 SIZE. a413. SIZE DISTRIBUTION.93 SKAT38 SKENNE,SS32 SKOP0S OETHCCY260 S prr(, S
106. S ALL CIPCVE FIT,83 S TH BSL
126 SM TH S130 SPC 2 .
, 2 13 SMOOTH A STO CATA ,
8'' SMOOT '5 e'SMOOT E0 ,DENSI.TY PRCFIALE.6 6moc E.D SERIES
I
OURS
. 'TRIP EXPCNENTIALLY4'130' SMOCThED 'SERIES
-14* 15 SMOOTHING encm4AL -
t, 141 SMCOTHING CUPIC SPLINE.15 SRIMTHING,LCCAL
t31'...SMOOTHING SPE:rTRAL ESTFMATES121\ SMOTHERS 1: A
sniir;
31 SNAPLG7 . SNARK1
43 SNOCP91 SNCW4.- V104_SCDANO ES
.e
'1
0
112 SCDANO INVERSE110 SCDANO INVERSE METHOD114 $CDANO MET.HCD114 SCDIN '''
114 SC30 ASCWEST
(
66' SCKAL ROBERT R '
057 -SCKAL'ROBERT R68 SCKAL ROBERT R-69 SOKAL ROBERT,R ,
-70 SCKAL ROBERT'R12 SCLENOIDAL VALUES 4 .98 SOLID SASIPLE SOUND VELOCI,4 'SCMERS H .
.
95 SCNAR101 SCNAR PN REFRACTIVE WA!ER-7-14 SCNIC LAYER DEPTH
.97 SCNVELkp, SCUND ,
94 SCUND REFRACTION93 scuNa SCATTERING
1 SCUND VELCCI1\4 SCUND,VELCCIT\6 SCUND 46LCCITY\7 SCLND VELCCITY \ .
14 SOUND VELCCITY' 97 SCUND-VELCCITY100' )..SCUND VELCCITY \ t
97 1$0010.1/60CITY OEFTHXDBRECTION58 $4NOIVEIC0,1-1Y HARMONIC PEAK58 SCUM? VI:CCrTY'MRCUG14 SCUD SAPFL97 SCNiEL,33 SPAR-ARRAY CYNAMIO§. .,,.."
33 SPAR-BUOY(CYNAICS4.4, ,.
153, SPARKS CHARLOTTE . ,r .-'58 -SPAWNER-RECRUIT'CURVE...- --58 SPAWNING STOCK" . . ,.
130'SPEC50 SPECIES '
51 SPECIES .
.,.A52 SPECIES .
'54 SPECIES ABUNDANCE54 SPECIES IOMASS .
' 155 SPECIES DENSITY. 53- SPECIES DIRECTORY
73 §PECqES DI$R1BUTION2 SPECIFIc..1GRAVITY ANC(OALY
48 SPECIFIC GRAVITY OF SOLIDS12 SPECIFIC -HEAT11 'SPECIFIC VOLUME ,)1 'SPECIFIrVOkUME ANOMALY
_°,:.5, 2. sJitefW VOLUME ANOMALY'' 'k SPECIFIC VOLUME ANOMALY
7 ...SPECIFIC VOLUME ANOMALY. 8, SPECIFIC VCLURE ANCMALY-4- SPECIFIC oLumE ANOMALY
130 SPECT 1 .'
-.pp SPECT 234 'SPECTikA f,4//
A
E

90 'SPECTRA . i. ' 94' STATISTICS ACOUSTICS135 SPEC/RA - ' 0' .,c_i4, r - 136'. STATS _;
4131 SPECTRA-TIME VARYING ; . .' '1 61c .
,.... .
125 SPECTRAL ANACYSIS ' 2 'STD ,
126' SPECTRAL DENSITY -.3: STD131 SPECTRAL DENSITY l': 72, STD -
132 SPECTRAL DENSITY FUNCTION ' ''.12 STD,
128 SPECTRAL ESTIMATES- - . 13 STD, s-
129 SPECTRAL ESTIMATES ' A, STD .
129 SPECTRAL WINDOW ."- '97 STD131 SPECTRAL WINDOW ,
83 SPECTRO- ANGULAR WAVE 'MODEL '151. S 017 STD PLOT 7:
.
STD-S/V N'a
'15 STD SEE ALSO i r
,..
'A, 1PLESSEt BISSET-BERMAN MOLINE' 151 %STORETV .
40 3PERRY GYROCOMPASS MK227 32 §TEA24 STATE CONFIGURATION,105 SPHERICAL COORDINATE TRANSFORMATION 33 STEA Y STATE7CONFIGURATIONS113 SPHERICAL EXCESS ' 35_ STEADY STATEJONFIGURATIONS"-113 SPHERICAL TRIANGLE . 36 STEADY, STATOCONFIGURATICNS
1 102 SPINDEL R C ' 32. STEADY STATE,DSTORTION'20 SPKTRA I ,STEADY STATE MASS TRANSPORT82 SPLASH I 1.14 STEIN MILTCN 0 --
82 .SPLASH II 111 STEfHENSCN EDWIN141 SPLCU 108 STEREWAPHIC CHART DEPTH141 SPLINE COEFFICIENT ANNOTATICN -
6 SPLINE.FUNCTICN 107 STERECGRAPHIC PRCJECTLGN56 SFCRT FISHERIES 112 STERNECK METHCO
I
72 STEWART ROBERT. J74 STEwARTtRCBERT.
115 SQUARE PRC ECTICN 87 %STEWART ROBERT J130 SQUARERC OF ,PZLYKCMIAL 133 STOCKHAM R J JR130 SQUARE RC T OF PCWER-SERIES 85 STCKES WAVE THEORY126 SQUARED C HERENCE 1 STP02
.41v ...
'127 SQUARED C ERENCE * '25 STORM.
130 SQUARED CC ERENCE,. 82, STORM EXRATROPICAL
131 SQUARED CC ERENCY 82 STORM SURGE 4.
7 STABILITY y/ .
. 84 STORM SURGE ,
.
8
117 STPO182 STORM TRACK
34 STABIL!94 STAMP 1 : 38 STREAMLINES
, 5 STANDARD OBVIATION 30 STRESS ,
6 STANISLAS . 30 STRESS. ..
" . 7 STANISLA S ..: 35 'STRETCArCABLE v
. 147 STANISL AS 4 " 36 STRETCH CABLE' : 121 DOUR K. K , . 4
7,5 STRCURA _, .
5d STATAB 88 ST'ROUD A . .
, 112 ''STATE PLANE COORDINATE TRAVERSES 36 STROUHAL EXCITATION
, 1 STATION ZATA . % 69 STUDENT-NEWMAA-KEQLS TEST
i . 2 STATION DATA 25' 6LBAQUEOUS DEPOSIT'> 4 STATrONCATA , 46 SUBMARINE GRAVIMETER.
5 STA N DATA . " iY SUBMERSIBLE .-
° 124, -STD
75 SPECTRUM , 0
' 30 SPECTRUM ACCELERATION .
30 SPECTRUM DISPLACEMENT
\\\ 32 SPEED MATRIX100 PEED SQUND
11 malt: ,
103 SQUARE PRCJECTION
a
STA OWDATA.8 STATION CA A
10 STAT/ON'OA A.0.15 STATION 0 A
151 STATIC) 0 A.
3 STATICN P SIIONS
.( .1 A
.,:72 'SUBSTANCE ADVECTION/DIFFUSION
.35 -SUBSURFACE BUOY -54 SUCCESSION76 SUFCVR80 SOLAR TIDAL'FORCE23 SULFIDE
N
175 ,
1 gs.t
41.
I
Oa

17- SULLIVAN138 SULLIVAN JERRY69 $UM OF SQUARE STP15 SUMMARY91 SUPER A-PC CCR
1.02 SUPERSEL83 SURF PREDICTION78 'SURFACE CURRENT91 SURFACE CURRENT25 SURFACE ELEVATION31 SURFACE EXC1TATICN17 FACE TEMPERATURE MODEL84 SURFACE WAVE RAYS34 SURGE62 SURVIVAL28 SUMEHANNA9 SVANOM97 SVELFS123 HRR4KM79 SWEERS Ifi E
82 SWELL134 SWITZER PAUL89 SWOP II_.46 SXNOP39 SYMBOL42 SYMBOL
138 SYMMET87 SYNOP''
"99 4.1111191
63 TCPF365 TCPF765 TCPF8
-4' 143 TCPLO131 TCRCPLT65 TCSA166 TCSA266 .T 366.
.CSATCS81
67 TCSB267 TCSC167 ICSC269 :TCSD469 TCSE1°65 TCSE2
RIVER .70 1CSE3.70, TCSE470 ICSE571 TCSE668 TCSP1
' 68 'TC$P269. TC'SP3 . \''56. TEACHING GAME85 TEACHING AIDE-LATER- WAVE
9 TABATA V10 TABATA11 TABATA61 T-AG DATA-38 JALWAN41 FAKIK50 TALWANI145 TALWANIAA,
131' TAUTCPLT31 TAWAC53 TAXONOMIC bIRECTION448 TCF6 TCHK1
146' TCHK2-146 TCHK3131' TCOHPLT58 TCPA158 ICOA2'58 TCPA3
c0' 59 TCPB159 TCP8259 TCP8360 CPC1'60 TCPC2
- 60 TCPC364 TCPC4
. ,64 TCPC,5
61 -TCPD1
.9
me
4
0'9 4
62 ICFE163 1/CPEZ63 TCPF163 TOPF2'
'3 TECHAL DIGUIZER3 TeCHNICON AUTCANALYZER
20 TEMPDIFF1 TEMPERATURE 1!
2. TEMPERATURE4 TEMPERATURE7 TEMPERA(ZURE
.8 TEMPERATURE ' .
12 TEMFiATURE14 TEMPERATURE22 UMFERATURE1,87 AIR_TEMPERATURE90 TEMPERATURE CHANGE VERTICAL
--146 TEMPERATURE COWECTION.20 IEMPERATLRE,DIFFERENCE
134 TEMPERATURE FLUCSUATIONS-;, AIR-SEA 1NTERFAC-f
6 TEMPERATURE FLUX138 TEMPERATURE -SAtINITY COAREC
. 17 TEMPERATURE SURFACE125- TEMPLI7 ;
. 30 TENSION33 TENSION35 TeASION36 TENSION
153 TENSQ35' TERMINAL-VEKCl/Y134 'TERRAIN GCEWANA131 TFORM1131 T'FORM2 ; 0
'25 .THATCHER F LLEWEt10 TNERIIAL EXPANSION*h. TH'ERbAt PCLLUTICNCC, 111HERMAL STRICTURE VER
"....2.,.7 THERMAL TRANSIENTS,,t
a
t
a.
176
166
,
IC4L

87167
1591'5
12143165
16146
47
122
3
. ,91
3435119529055
,'13689
12137208024,258028
THERMIS ER 'AIRTHERMOTHERMO'LINE
ERM'CLINET ERMJOYNAMIC RESPONSE SEA ICETHERMOMETER CORRECTIONTAERM' TE'R CORRECTLONTHERMOMETER CORRECTION 's
THERMOMETER CORRECTIONSThERMOMETRIC DEPTH-THERMOMETRIC DEPTHTHERMOMETRIC DEPTHTHERMOMETRIC VALUESTHERHOSTERIC ANOMALYThERMOSTERIC ANOMALYTHERZTHETASTHETASTHICKNESS ICETHIN INE ARRAYThIN L E ARRAYThISTOTHOMIDSOTHOMPSON BThOMSON J'ATHOMSON J AThORNTHWAITE NET RADIOMETERThREE DIMENSIONALTICK'S MET-HODTICK'S METHODTIDAL ELLIPSE PARAMETERSTIDAL PREDICTION HARMONIC METHODTIDES '
TIDESTIDEITIDE, ESTUARINE
'20 TIDES474 TILT DATA
1 5 TIME CONVERSION0 ,JIME HISTORY'
29 44NE INVARIANT LINEAR SYSTEM20 TIME SERIES,78 TIME SERIES85 TIME SERIES87 TIME.SERIES-25 TIME SERIES ANALYSIS45 TIME SERIES
'1.3.1 TIME VARYING-SPECTRA:131 'TiliSPO.104 TISSOT'S INPICATRIX220 TITRATION
4.1:31'4TLOGPLTAD5 TVERC
, ,4 31 TNOIaT104 TCBLER W R128 tOEPLITZ, MATRIX111 TOKYO DATUM ,58 TCMLINSON PATRICK K60 ,TOMI.INSO,N'PATRICK K
6163646529
1171452577
1219931314536333336
. A\51L4
11413146
131131134347
119 TRACK103 TRACK PLOT42 TRACKLINE34 TRAJECTORIES74 TRAJECTORIES72 TRAJECTORIES25 TRAJECTORfES
102 TRAJECTORIES132132147955014
100101147
1
5
7
,8910
12192.5
109110112
'115115
'TOMLINSON.PATRICK K'TOMLINSON PATRICK KTOMLINSON PATRICK K.TtMLINSON PATRICKTOPOGRAPHIC MAPS BEACHTOPOGRAPHYTOPOGRAPHYTOPOGRAPHY NEARSHORETCFOLY PETER J -
TOPOLY. PETER JTORPEDO MK48 ACOUSTICSTORQUETORSIONTOTAL FIELDTOWED RRAY DYNAMICSTOW ODYTOWL E
TOWLINETOXICITYTPCCNVTPFIXTPHAPLTTRUST'TPLTFRCTPLTSPCTPMOD,TPNAVTRACK
177
1 8
TRANFRTRANFRMTRANSOM:).TRANSDUCER PATTERN FUNCTIONStRANSECTS FAUNALTRANSMISSOMETERTRANSMISSION LOSSTRANSMISSION LOSSTRANSNODCTRANSPORTTRANSPORTTRANSPORT '
TRANSPORTTRANSPORT,TRANSPORTTRANSPORTTRANSPORTTRANSPORT .
TRANSVERSE MERCATOR PROJECTIO NTRANSVERSE MERCATON PROJECTIONTRANSVERSE MERCATOR PROJECTION'TRANSVERSED SINUSOIDAL PROJECTIONTRANSVERSED MOLLWEIDE PROJECTION
COPENT/ASCENTDR FT BOTTLEOIL SPILLPARTICLERAY
4
a

..---
36 .TRAPEZOIDAL ARRAY.(
REFRACTICN MODELS37 TRAPEZOIDAL ARRAY .132 USES112 TRAVERSE 132 USFC114 TRAVERSE 132 USID84 TRAYERS CCLCNEL JAMES L 132 USPE85 TRAYERS CCLCNEL JAMES L 114 UTM134 TREND REMCVAL 85 UTMAX1
135 IRENDREMCVAL e 114 UTMCO
112 TRIANGULATICN STATIONS k 85 UTOFTI
30 TRIAX 123 V5DMD30, TRIAXIAL SOIL TEST , 94 VAAS A E
49 TRIAXIAL COMPRESSION a 77 VACM CURRENT M TER
130 TRIGONOMETRIC SERIES 78 VACM CURRENT A TER
142 TRIGCNCMETRY- 123 VACOTS
1 TRIPE R L'K 6 ,VAISALA FRECUENCY103 TRIPE R .1. K
484 VAN DER BIJL BALOW
118 TRIPE R L K 46 VAN VOORHIS G146 TRIPE R L K 18. VAN WIE RCBERT
131 TRISMO 97 VAN WIE ROBERT .
89 TRUWIND 141 ''VAN WIE RCBERT.
2 TS PLOT. 151 VAN WIE ROBERT
118 TS 'LOT 153 VAN WIE RCBERT 1125 TSAP '" 48 VANE SHEAR STRENGTHS
132 TSGEN 15 VARIANCE-.."
132 TSPECT 1 134 VARIANCE .404
132 TSPECT 2 136 VARIANCE , .
11 TSVO1 60 VARIANCECOVARIANCE s
132 TTYCUN 119 4VECTAV132 TTYNUM 7.8 VECTOR..
.
20 TUKEY ---LLS- VECTOR AVERAGES VELOCITY'
135 TUKEYtt, 81 VECTOR DATE
' 136 TUKEY COSINE WINCOW 76 VECTORIAL VALUES33 TUKEY J W 119 'VECTORS PROGRESSIVE132 TUKEY SEE ALSO CCOLEYTUKEY 110 VEGA GREGCRY l
132 TUKEY WINDCW 10 VEL
70 TUKEY'S TEST FOR NONADDITIVITY \ 97 ELOCIMETER VALUE'ADJUSTMENT FOR
56 TUNA? IWSEDIMENTS
65 TUNA m 138- VELOCITY PROFILE76- TURBULENCE CURRENT METER 97 VELOCITY SOUND
33 TURN FORCES DUE TO SHIP CN A' TURN 119 VELOCITY VECTOR AVERAGES ,
.36 TURN FORCES DUE TO SHIP GN A TURN 47 VELPRS
109 TURETT EARRY 111 VENING MEINESZ. 5 TWIRP 150 VERTICAL ARRAY SUMMARY
146 TWO FIVE \ 116 VERTICAL, BAR GRAPHS
142 TWOPI 101 VERTICAL) SECTION
138 ,TYLER MAUREEN - ,O. VERTICAL SECTION PLOTS
136 UCF - VERTICAL TEMPERATURE GRADIENT
. 32 UFSS 62 ,VESSEL FISHING PCWER
85 UMAX1 I00 'VFC ..
68 UNGROUPED CATA 123 VHRR SATELLITE DATA DISPLAY
44 UNIFCO 14 VINSON PHILIP114 UNIVERSAL TRANVERSE MERCATCR GPiC 76 VINSON PHILIP
132 UNLEAV . 38 VISCOUS 'FLUID'
91 UNTER STEINER N li _.....-- 34 ,VISCOUS .FORCES
85 UOFT1 37 VISCOUS FORCES
2.6 UPWELLING 14 VISIBILITY LCSS.
28 WWELLING 49 VCIb 1ATIC28 UREA 'I 40, 19 VOLTR i
. 112 US COAST i GEODETIC'SURVEY 11 VCLUME
. ../
178
186
eto
ti

aupwrirommompammimlammommummmilimp.m.
12195660616410
VOLUME FLOMVOLUME TRANSPORTVCN BERTALANFF.YVON BERTALANFFYVON BCALALANFFYVON BERTALANFFYVTR
131 WHITENESS DEPARTURES FROM95 WHITTAKER R
133 WICHERN DEAN h32 WILCOX J D
111 WILLEMS ROBERT M76 WILLIAMS GERALD77 WILLIAMS GERALD
95 VX METHOD 5 WILSCN %OW VELOCITY40 WALKER ELECTRIC COG 16 WILSON'SOUND VELOCITY5227
WALLIN MARSHAWALSH J J
99 WILSCN SOUND VELOCITY97 WILSCN'S FCRFULA ats,%
0,28 'WANG HSIN-PANG 98 WILSON'S FORMULA115 WARD JOHN 0 82 WIND/.138 RDEN JAMES S 89 WINO153 WhSHINGTCN ROSA I '87 WIND DIRECTICN73 WASTE WATER 91 WIND DRIFT88 WATER CONTENT ATMCSHERIC 76 WIND EFFECTS48 WATER CONTENT SOIL/SEDIMENT 91 WIND FIELD26 WATER QUALITY IN ESTUARY 83 WIND GEOSTRCPHIC133 WATTS D G 90 WIND MIXING.83 WAVE BOTTOM VELOCITY 90 WIND MIXING31 WAVE CCND.ITICNS 72 WIND MODEL MARKOV24 WAVE ELEVATION 87 'WIND MODEL MARKOV82 WAVE FORECASTS 87 WIND SPEED20 WAVE INTERNAL 89 WIND STRESS83 WAVE MODEL FFENCH SPECTRO-ANGULAR 87. WIND TRANSITION MATRIX83 WAVE PREDICTION 134 WIND VELCCLTY
' 83 WAVE RAY PATHS 131 WINDOW84 WAVE RAYS SURFACE ' 32 WINDOW ---
132 WINDCW 184 WAVE RECORDER SHIPBCRNE84
0085WAVE REFRACTIONWAVE TEACHING AIDS
132 WINDOW BOX132 WINDCW COSIN
84 WAVE-CURRENT INTERACTION 132 WINDOw LANCZC15 WAVES INTERNAL,,, 132 WINDOW PARZEN LAG34 WAVES SHIP RESPOOSE TO 78 WINDOW RERFECT DANIEL FREQUENCY9 wEBSTpR JACQUELINE, 132 WINDOW RECTANGULAR38, WEBSTER , 132 WINDOW TRIANGLE
'12 WEEKPLOT 132 WINDOW TUKEY136 WEiBUL 90 WINGER C M136 WEIBULL 100, WINGER'C M50 WEIGHT 31 WIRE HE/CAL63 WEIGHT 116 MIRTH DAVID58 WEIGHT-LENGTH 15 WITCOMB
132 WEIGHTING .KERNEL 97 WLSND99 WEINBERG H 85 WMAX1
'73 WEINSTEIN BRUCE 153 WMC25 wEISE G 85 wCFT1133 WELCH P,b 103 WCNG S K133 WELCH P C 118' WCNG S K116 WENNINGER 146 WCNG S K
5 WEST MARY 1* WCNG.S.K"2 WET 98 'WOO'DBURY PETER B 4
17 WET' BUL80 48 WCCDBURY PETER 8L7 WETBLB -116 WCODBURY PETER 8
134 WHALE SPECTRAL ANALYSIS OP' CALL 106 WCODING CHRISTINE22 WHITE LOIS 2 wCRTHINGTCN,LV54 WHITE LOIS 38 WCRZEL LAMAR
143 WHITE LOIS 85 WTMAX1129 WHITE NOISE 85 WTOFT1
-.1.7/ 4
183

38 X-RAY DIFFRACTION ANALYSIS152 XBCCNV152 XBEVALU152 X BFNWC
153 XBFNWSUM153 XBGEOSUM153 ,XBMSINV153 XBSELECT151 XBT DATA153 XBTCONV152 XBTCOUNT152 XBTOKOUT152 )(ORDER12 XPORT,77 X TAL91 YAR1T
150 YAVNER4JUDY153 YAVNER JUDY54 YIELD57 YIELD
-64 Y I ELD56 YIELD PER RECRUIT63 YIELD PER RECRUIT
136 YCNG MAR IAN Y Y144- YSTOY127 Z - TRANSFORM. 42 L LIST
43 ZED IT-793-"1-ERO -CR0-S -S LNG S44. 93 ZERO PRESSURE
17 ZMODE53 ZCOPLANKTCN DEEP OCEAN91 ZUBOV30 ZNIBEL H ;t'tz
.o4,41.t)F
4
180
1 0
C
4
4
r, 49 9
4 4 ,t
. .
s
te ° - ao
-"--,
COBOL
COBOL4 COBOL4 CCBCL4 COBOL
LANGUAGE INDEX
ALGOL
2 ALGOL142 ALGOL98 ALGOL148 ALGOL
. .
48 ALGOL134 ALGOL12 ALGOL
ASSELER
152 ASSEMBLER152 ASSEMBLER153 ASSEMBLER153 ASSEMBLER153 ASSEMBLER-153 ASSEMBLER18 ASSEMBLER20 ASSEMBLER78 ASSEMBLER°'
150' ASSEMBLER', 150 ASSEMBLER
150 ASSEMBLER150 ASSEMBLER150 ASSEMBLER150 ASSEMBLER150 ASSEMBLER150 ASSEMBLER151 ASSEMBLER01- ASSEMBLER152 ASSEMBLER-1,52 ASSEMBLER,152 ASSEMBLER152 ASSEMBLER152-,ASSEP4LER152 ,ASSEMBLER'
01t2 ASSEMBLER152 ASSEMBLER152 ASSEMBLER152 ASSEMBLER124 ASSEMBtY
B 13700
B 6700B 6700'B 6700B 6700
4B 6700B 67C0
BASIC
. 31 BASIC32 BASIC32 BASIC13 BASIC13 BASIC,
.
STATION DATA RETRI VAL.HYDiat RCHINTERACTIVE CALCULATIONS DSDP/C CSOUND VELOCITY THRu SOLID SAMPLES DP/SONMAILING LABELS '\SAND SILT ANC CLAY RACIIONS DSDP/GRAIINSPECTRAL ANALYSIS CF TIME SERIES -
CONSTANTS FCR HRMONIC SYNTHESIS MEAN
IBM 36065 XORDER t,.,,,
IBM 360/65 XBTCCUNT 11.,
IBM 360/65 RETUT ,
IBM 340/65 XBTCONVIBM 360/65 RETBTIBM 36065w BTLISTC .
IBM ;606 POTENTIAL TEMP AND/OR DENSITY POTDENIBM 36
21,5 TEMPERATURE CIFFERENCE CALCULATIONS .
'*Ifol 36 /65' SURFACE CURRENT SUMMARY SUFCURIBM 360/65 4. FIL INDEPENDENT1GEN APP SYS GAS GASTHERMIBM 360/65:AILE INDEPENDENT GEN APP SYS GAS 4NDATAIBM 360/E 'FILE INDEPOCENT GEN APP SYS GAS CREATEIBM 360/65 ,FILE INCEPENDENT GEN..APP SYS'GAS,MONTH80IBM 36000. FILE INCEPENDENT)CEN APP SYS GAS CHEM80 ,.I&M°60765 FILE INDEPENDENT'>GEN APP SYS.GAS DEPTH8CIBM 360/65 FILE INDEPENDENT GEN, APP SYS GAS LATLON80IBM 360/65 'FILE INDEPENCENT GEN APP SYSPAS GASCRDERIBM 360/65 SDRETV 1IBM 360/65 SWTOSDIIBM 360/65 SDPRt2IBM 360/65 SDSELECTIBM 360/65 SD2MSTCT .
IBM 360/65 SD2SyPPIBM 360/65 MAKE120IBM 360/65 DEPTHIBM 360/65 CRUCONIBM300/65 CODCCONVIBM 36065 SUPERSEL!IBM 360/65 OPASSHP 21005 PLOTTER COMMANDS PLOT DVRIO
,,
'''
)
TEMP
"'r
Os
HP 9830AHP 9830AHP 9830AIBM 360IBM 360.
4
45
UNMANNECFREE-SWIMMING SUBMERSIBLE PLOT ; I J:UNMANNED FREE-SWIMMING SUBMERSIBLE HOTEL LOADUNMAN*EC FREE-4WIMMING,SUBMERSIBLEENVIRONMENTAL VYNAMICS SUBROUTINES OCEANLIBGEOSTROPHIC CURRENT
IBM 360/50 CONSISTENCY CF PHYSICAL AND CHEMICAL DATAIBM 360/85 DATA MGT SYS FOR WHYS CHEM DATA OCEANSV
CALCULATION OF THERMMETRIC VALUESSTATION DATA SYSTEM FINAL VALUES "
0 -
.1( ,
19i
go.
1- '
"e
e.P.

FORTRAN
126 FORTRAN126 FORTRAN126 ,FORTRAN126 FORTRAN126 FORTRAN147 FORTRANa/ FORTRAN127 FORTRAN127 FORTRAN127 FORTRAN127 FORTRAN127 FORTRAN127 FORTRAN127 FORTRAN12/ FORTRAN127 FORTRAN1 FORT AN127 RTRAN127\F127 FORTRAN128 ORTRAN128 FORTRAN128 FORTRAN128 FORTRAN128 FORTRAN128 FORTRAN128 FORTRAN148-4CATRAN128 FORTRAN129 FORTRAN128 FORTRAN148 FORTRAN128 FORTRAN128 FORTRAN128 FORTRAN128 FORTRAN128 FORTRAN,129 `FORTRAN
ec,
CDC 6300/053-TIME 54RIES ARANO ARMAPCDC 3300/C53 TIME S, ERIES ARAND AUTO
COC 3300/053 TIME ERIES ARAND AUTOPCT,CDC 3300/OS3 TIME ERIES ARUD #XISLCDC 3300/0S3 SERIES ARAND'ICCFFTCOC 3300/0S3 TIME SERIES/ARAND CCORRCDC -3300/0S3 TIME SERIES -ARAND CONPLTCDC 330,0/0S3 TIME SERIES ARAND CPPPLOTCDC 3300/0S3 TIME SERIES ARM1040NFIDCDC 3300/0S3 TIME SERIES ARAND CONFID l'
CDC 3300/0S3 TIME SERIES ARAND CONMOOECDC 3300/0S3 TIME SERIES ARAND COPH ....---
CDC,3300/0S3 TIME SERIES ARAND CCSTRCDC 3300/C53 TIME SERIES'ARAND CPEES,COC 3300/0S3 TIME SERIES ARAND CPLT1
(/_
CDC 3300/053 TIME SERIES ARAND CPLT2CDC 3300/0S3 TIME' S RIES ARAND CROPITCDC 3300/CS3 TIME ERIES ARAND CROSSCDC 3300/0S3 TIME /SERIES ARAND CUSIDCDC 3300t0S3 TIME SERIES ARAND CUSF,0CDC 330070S3 TIME SERIES ARAND CZTCDC 3300/0S3 TIME SERIES ARAND UATPLTCDC 33130/0S3.TIME SERIES ARAND LEMOD1CDC 3300/0S3 TIME SERIES ARAND bEMOD2CDC 3300/053 TIME SERIES ARAND._DMOD3COC 3300/0S3 TIME SERIES.ARAND DETRNDCDC 3300/053 TIME SERIES ARAND DIFF12CDC 3300/053 TIME SERIES ARAND EUREKACDC 3300/053 TIME SERIES ARAND EXSMQCDC 3300/053 TIME SERIES ARAND FFINCDC 330D/OS3 TYME%SERIES ARAND FFINICDC 3300/0S3 TIME SERIES ARAND FFTCNVCDC 3300/CS IME SERIES ARAND'FFTPSCDC 3300/0S3 TI E SERIES ARAND FFTSCDC 3300/OS3 TI SERIES ARAND FFTSPCCDC 3,300 0S3 TI E SERIES ARAND FILTER1
129 FORTRAN129 FORTRAN129 FORTRAN129 FORTRAN129 FORTRAN129 FORTRAN129 FORTRAN129 FORTRAN129 FORTRAN129 FORTRAN
.," 4'129 FORTRAN129 FORTRAN129 FORTRAN129 FORTRAN149 FORTRAN
*th
1313
FORTRANFORTRAN
0 FORTRAN/1.30 FORTRAN130 FORTRAN130 FORTRAN130 FORTRAN
COC 00/ 3 E SERIES ARAND FIVET /CDC 3300 TIME S'tRIES ARAN FOLDCDC'3300/053 TIME SERIES ARANO OURTR =
CD 3300/0S3 TIME SERIES.ARAND F USPCC1 3340/0S3 TIME SERIES RAND F SPC1
DC 3300/053 TIME SERIES-ARANO F'CUSPC2
DC 3300/CS3 TIME SERNSARAN0 FRESPONCOC 3300/053 TIME SERIES ARANO 6API-4
CDC 3300/0S3 TIME SERIES ARAND GENERTCOC 3300/0S3 TIME;SERIES ARAND toENER2
OC 3300/453'TIMEiSERIES ARAND GENER3CDC 3300/0S3 TIME SERIES ARAND LCGPLOTCD'C'3300/CS3. TIME SERIES ARAND NO127'COC 3300/0$3 TIME SERIES,A,PAND PHAPL5COC 3300/0S,3'TIME SERIES ARAND PLTFOR
COC 3300/0S3 TIME ARAND PLTFRQ
.CDC 3300/05g TIM( SERIES ARAND PLTSPC ._
CDC 3300/0S3 TIME .SERIES ARAND PART \
CIA' 1300/0S3 TIME SERIES ARANO POLYOV"
CDC 3300./OS3 E SERIES ARAND.PR0PLTCOC 330 /OS 'ME SERIES ARAND Milt-COC TIME SE,rIE5 ARANO' RANDMCOC 3.3 0/06 TIME SERIES ARANO ACTFFTCOG, 3 0/CS3 TIME,,_gRyiES ',101 0,AESPON
', ' \. ., 1
'182
V 1192
0
.40
0
eff - 0
,
Jir
4.
O
°T.
° ' -/
0

AC
130 FORTRAN130 FCRTRAN,130 ..FORTRAN
130iFORTRAN.130 FORTRAN,130 FORTRAN,130 FORTRAN130 FORTRAN130 FORTRAN130 FORTRAN430 FORTRAN131 FORTRAN131 FORTRAN131 FORTRAN131 FORTRAN131 FORTRAN131 FORTRAN131 FORTRAN131 FORTRAN131 FORTRAN.131 FORTRAN131 FORTRAN131 FORTRAN132 FORTRAN132. FORTRAN.132 FORTRAN132 FORTRAN132FORTRAN132 FORTRAN132 FORTRAN132 FORTRAN132'FORIRAN132 FORTRAN132 FORTRAN132 FORTRAN132 FORTRAN133 FORTRAN25 FORTRAN116 FORTRAN116 FGRTRAN142 FCRTRAN149 FORTRAN149 FORTRAN144 FORTRAN144 FORTRAN144 FORTRAN144 FORTRAN145 FORTRAN145 FORTRAN145 FORTRAN105 FORTRAN105 FORTRAN106 FORTRAN106 FPRTRAN106 FORTRAN107 FORTRAN'107 FORTRAN107 FORTRAN51 FORTRAN
'116 FORTRAN153 FORTRAN55 FORTRAN
CDC 3300/0S3 TIME SEWS ARAND REVERSCQC 3300/DS3 TIME,SERLfS ARAND RPLACECDC 3300/053 TIME SERIES ARAND RRVERSCDCt300/050 TIME SERIES ARAND SARITCDC)3300/0S3 TIME SERIO ARAND SERGENcog 3300/0S3 TIME SERIES ARAND SHAPECDC 3300/0S3 TIME SERIES ARAND SINTRCDC 3300/0S3 TIME SERIES ARAND SMOCDC 3300/0S3 TIME'SERIES ARAND SPEC .
CDC 3300/0S3 TIME SERIES ARAND SpECT14 CDC 3300/DS3 TIME SERIES ARAND SPECT2
CDC 3300/0S3 TIME SERIES ARAND TAUTOPLTCDC 3300/Cd3 TIME SERIES ARAND TCOHPLT .
CDC 3300/0S3 TIME SERIES ARAND TCROPLT'CDC 3300/DS3 TIME SERIES ARANDItFORM1CDC 3300/0S3 TIME SERIES ARANDfTFORM2 .
CDC 3300/0S3 TIME. SERIES ARAND TIMSPcCDC 3300/DS3 TIME SERIES ARAND-TLOGPLT.CDC 3300/DS3 TIME SERIES ARAND TNOIZTCDC 3300/053 TIME SERIES ARAND TPHAPLTCDC 3300/0S3 TIME SERIES ARAND TPLTFRQCDC 3300/0S3 TIME SERIES ARAND TPLTSPCCDC 3300/0S3 TIME SERIES ARAND IRISH°CDC 3300/0S3 TIME SERIES ARAND l'SkENCDC 3300/053 TIME SERIES ARAND TSPECT1CDC 3300/DS3 TIME SERIES ARANO TSPECT2COCN3300/0S3 TIME SERIES ARAND TRANFRCDC 3300/0S3 TIME SERIES ARAND IRANFRMCDC 3300/DS3 TIME SERIES.ARAND TTYCCNCDC 3300/0S3 TIME SERIES ARAND TTYNUMCDC 3300/053TIME.SERIES ARAND UNLEAVCDC 3300/DS3 TIME SERIES ARAND USESCDC 3300/C53 TIME SERIES ARAND 6SFOCDC 3300/DS3 TIME SERIES ARAND SICCDC 3300/0S3 TIME SERIES ARAND -uSPECDC, 3300/C53 TIME SERIES ARAND iINCO -WCDC 3300/0S3 TIME SERIES ARAND hINDOW1IBM.370/155 ESTUARINE DENSITY CURRENTS AND SALINITYIBM 360 DENDRCGRAPHIBM 37C DENDRCGRAPHIBM 1800IBM 1800IBM 1800IBM 1800IBM 1800tBM 1800IBM 1800IBM 1800IBM 1800IBM 1800IBM 1800IBM 1800IBM 1800IBM 1800IBM 1800IBM 1800IBM 1800IBM npoCDC 3600CDC 3600IBM 370IBM 370
TRIGCNOMETRY SUBROUTINES ASSUB SAS.ASA -
FORMAT FREEtINeUT SUBRCUT/NE MEADMETERS VS FATHCMS MATBLDATE CALCULATICNS GAYWKDATE CALCULATICNS NWDATDATE CALCULATIONS NXTOVDATE CALCULATIONS YSTDY
-WLIAN DAY SUBROUTINES CLEJLJULIAN DAY gUBROUTINES CLEJLTIME CONVERSICN DTIMEPLOTS MERCATCR GRID CHARTNAVIGATIONAL SATELLITE PASSESRTXLORAN FIX LRFIXPLAN COURSE ANC SCFEDULE CRUIS . .
EARTH fPHERICAL SUbROUTINES ESTCH ESTC2 ESTPLDEGREE CONVERSIONS DEGFR DEMIMERCATOR DEGREES DMRCTMAGNETIC FIELD CCMFCNENTS MAGFISPECIES AFFIVITIES REGROUP _
X-Y PICTS MUCPAKREFORMATTED STATION OUTPUT IBM 1CHLORCPHYLL CHLOR
193.
183
55 FORTRAN55 FORTRAN20 FORTRAN20 FORTRAN20 FORTRAN20 FORTRAN20 FORTRAN20 FORTRAN20 FORTRAN20 FORTRAN20 FORTRAN20 FORTRAN
. 20 FORTRAN20 FORTRAA20 FORTRAN20 FORTRAN20 FORTRAN.20 FORTRAN28 FORTRAN143 FORTRAN50 FORTRAN72 FORTRAN83 FORTRAN83 FORTRAN22 FORTRAN87 FORTRANb8 FORTRAN88 FORTRAN89 FORTRAN75 FORTRAN75 FORTRAN75 FORTRAN75 FORTRAN
20 FOURAN121 FORTRAN99 FORTRAN76 FCRTRAN57-FORTRAN57 FORTRAN87 FORTRAN9/ FORTRAN97 FCRTRAN$97 FORTRAN123 FORTRAN123.FORTRAN139 FORTRAN136 FORTRAN103 FORTRAN13 FCRTRAN13 FORTRAN56 FCRTRAN
,V FORTRAN7 FORTRAN
57 FORTRAN.117 FORTRAN
4 FORTRAN85 FORTRAN85 FORTRAN85 FORTRAN65 FCRTRAN05 FORTRAN85
ti
IBM 370IBM 370 '
POP-11,PDP-11PDP1-11PDP-11PDP-11_UNIVAC 1106UNIVAC 1106UNIVAC 1106UNIVAC 1106UNIVAC 1106UNIVAC 1106UNIVAC 1106UNIVAC 1106UNIVAC 1106UNIVAC 1106UNIVAC 1106IBM 370/155HP 2100IBM 370CDC 3100CDC 3100COC 320IBM 3t0CDC 1604CDC 3100CDC 3100CDC 1604CDC 7600CDC 3100
PHYTCPLANKTCR-POPuLATICN DENSITYSPECIES DIVERSITY.GENERAL PURPCSE EDITOR DMSECTIME SERIES INTC PROFILES DMSCHPAANDERAA CURRENT METER DATA AACALCURRENT PROFILER DATA MK2CALAPPENDS NEW DATA TL FILE DERIVEAPPENDS NEW CAT TO FILE DERIVECONCATENATES SCRTS SEGMENTS OUTPUTS CMSORTINTERPOLATES TO UNIFORM GRID MATRIX 01TIME SERIES' STC OR PCM PROFILES PLSADINTERNAL WAVES IWEGDYNAMICAL FIELCS INTERNAL WAVE RAYS.CHRSECAUTO AND CRCSS SPEORA TUKEY METHCDAUTO AND CRCSS SPE..TRA POLARIZED- FORMCPXSPCAMPLITUDES PHASES LEAST SQUARES TIDES4METECROLOGICAL FLUXES METFLXacss CCVARIANCE,MATRIX EmPEIGI.MODELING AN CCEAN BONDTHERMOMETER CORRECTION DEPTH COMP HYD1CPTIMAL ECCSYSTEM PCLICIES CEPDANISH ADVECTICN PRWRAmSINGULAR HAVE PREDICTION MODELSINGULAR WAVEJRECICTICN MODELSPECIFIC CCWOCIIVITY WITH PRESSURE EFFECT'OCEAN CLINATCLCGY ANALYSIS MODEL ANALYSMIXED LAYER CEPTH ANALYSIS MODEL.mECRLDATMCSPHERIC WATER LCNTENT MCDELWIND COmPUTATICN FRCM SHIP OBSERVATIONS TRUWINDCPTIMIZEDVULTI-LAYER AN MOCEL.OPTIMIZED MULTI-LAYER HN MODEL
CDC 6500 MEAN CRIFT RCUTINE'CDC 1604 MEWORIFT RCUTINEIBM 360/65 . SEQUENTIAL,PLCTTINGUNIVAC 1108 OVERLAY. PLOTTING CVLPLTUNIVAC 11Q8' RAY PATH S04348'CDC 6500 SEARCh AND RESCUE PLANNING NSARCDC 6600 GENERALIZED STOCK PRODUCTIONmODEL'pRODFITp 6700 %, GENERALIZED STOCK PRODUCTION' MODEL PRCDFIT8 6706 4SUMMARIZES.W,EATHER REPORTSCDC 3100 SOUND SPEED CCMRUTATION MODEL. SCVELCDC 3200 SCUND SPEED CCNPuTATION MODEL StVELCDC 1604 SCUND SPEED CCPPUTATICN mapEL SOvEL'CDC 6600 DISPLAYS VHRR SATELLITE DATA V5DMD 4IBM 360/195 MICRCFILM PLCTS OF VHRR SATELLITE DATAIBM 1800 BARTLETT'S CURVE FITTINGIBM 1800 CLUSTER ANALYSISIBM 1800 SATELLITE NAVIGATILNCQC 36.00 CONVERTS STD DATA ADEDTPCOC 3600 CORRECTS STD DATA 1PMOOB 67CC GTH FREQUENCY ANALYSIS LENFREB 6700 YIELDSPER RECRUIT FOR MULTI -GEAR FISHERIESB 6700 A GENERALIZEC EXPLOITED POPULATION SIMULATORCDC 6600, A GENERALIZEC EXPLOITED POPULATION SIMULATOR /
CDC CYBER X-Y PLOTS IN A FLEXIBLE FORMAT MEDSPLGTCDC 64C0 DATA NGTSYS FCR PhYS CHEM DATA4OCEANSV' '
IBM 360/40 WATER WAVE 'TEACHING AIDSPRCF1IBM 360/40 uATER WAVE TEACHING AIDS UMAX1IBM 360/40 WATER WAVETEACHING AIDS UTFAX1TEM 360/46, WATER WAVE TEACHING AIDS WNJAX1 .
IBM 360/40 WATER WAVE TEACHING AIDS LENG1IBm 360/40 WATER WAVE TEACHING AIDS OETRND
1/4
184
194
.

I
c 85 FORTRAN85, FORTRAN85 FORTRAN85 FORTRAN, .
'85 FORTRANA5 FORTRAN85. FORTRAN85 FORTRAN86 FORTRAN86 FORTRAN'86 FCRTFAN85 FORTRAN63 FORTRAN63 FORTRAN64 FORTRAN64- FORTRAN65 FORTRAN65 FORTRAN '
65 FCRTRAN65 FORTRAN66 FORTRAN',66 FORTRAN.66 FORTRAN67 FORTRAN67 FORTRAN67 WRTRAN
'68 FORTRAN- 68 FORTRAN
isp FORTRAN69 FORTRAN69 FORTRAN6S FORTRATslA69 FORTRAN70 FORTRAN70 FORTRAN70 FORTRAN71 FORTRAN29 FORTRAN28 FORTRAN1 FORTRAN2 FORTRAN
58 FORTRAN58 FORTRAN58 FORTRAN59 FORTRAN5S FORTRAN.59 FORTRAN60 FORTRAN60 FORTRAN60 FORTRAN?IeFORTRAN4 FORTRAN
FORTRAN62 FORTRAN63 FORTRAN63 FORTRAN17 FORTRAN17 FORTRAN87 FORTRAN152 FORTRAN18 FORTRAN18 FORTRAN
t
,IBM P60/40' WATER WAVE'TEACHING AIDS WTMAX2IBM 36a/40 ?WATER WAVE TEACHING AIDS UOFT1 kc'
IBM 360/40 ,WATER WAVE TEACHING AIDS WOFT1IBM 360/40 WATER WAVE TEACHING AIDS UTCFT1IBM 360/40 WATER WAVE TEAMING AIDS WTCFT1
.IBM 360/40 WATER WAVE TEACHING AIDS AUTCOVIBM 3 60/40 WATER WAVE TEACHING AIDS CASCOV ,
IBM 360/40 WATtR WAVE TEACHING AIDS FOURTRIBM 360/40 WATER WAVE TEACHING AIDS PRCFILEIBM 360/40 WAfER WAVE TEAtHING AIDS REFL1IBM 360/40 WATER WAVE TEAaHING AIDS FORCE AND MOVENEhTIBM 360/40 *WATER WAVE TEACHING AIDS EDSIT L
B 6700B 6700B 67006.6700B 6700B 67008 6700B 6700.B 6700B 6700B 6700B 6700B 13700B 6700B 6700B 6700B 670aB 6700 (
.6 6700t 6700B 6700B 6790
.'866700B 6700B 67.00 .
YIELD CURVES WITHiLONSTANT RATES TCPF2.EUMETRIC YIELC TCRF3PIECEWISE INTEGRATION OF YIELDC6VES TCPF4PIECEWISE INTEGRATION OF. YIELD CURVESCONSTANTS IN SCHAFER'S MODEL TCPF6SCHAEFER LOGISTOS MODEL OF FISH PRODUCTIONFITS GENERALIZED STCCK PRODUCTION MODEL TCPF8BIOMETRY -LINEAR REGRESSION ANALYSIS TCSA1GENERALIZED hEIGHTO LINEAR RfGRESSICN.LINEAR RGRESSIQN. BOTH VARIABLESIOMETRY-PROCUCT=MLMENT CORRELATIONOOLEYLONNESIMULTIPLE EGRESSIONBIOMETRYGOOCKESS CF IT"
BIOMETRY-BASIC STATISTIC FOR UNGROUPED DATABIOMETRY -EASIC ilAJISTIC FOR GROUPEC, OATABIOMETRY - SINGLE CLASSIFICATflON ANOVA
___ELLOMETRY..-FACTORIAL ANOVA TqSD2BIOMETRY -SU CF SQUARES STO TCSD3,BIOMETRI-ST CENT-NtWMAN-KEULS TEST TCSD4BIOMETRY rTE-T CF H.LMOGENEITY
CF EQUALITY
HP 2115AHP 2115A'B 6.700B 67G0B 6700B 6700B 67CCB 6700B 67008 6700EP6700B 6700B 67C0B 67003 6700"B 6700B 6700CDC 6600CCC 7600CDC 6400IBM 360/65IBM 360/65IBM 360/65
BIOMETRY-TESBIOMOTRY-.AUK iS TESTBIOMETRi4RUS AL-WALLIS TEST TCSE4BICMETRY-FISHE °S tXACT TEST TCSE5 .
BIOMETRY-11 X C TEST OF INDEPENDENCE PAPNUMERICAL MCL ESTUARY UYNAMICS,6 KINEMATICSSALINITY pISTRIBUT1CN IN ONE - DIMENSIONAL ESTUARYCIGITIZES STC CATA CEEP'STD PROCESSING WETNORMAL DISTRIBUTICh SEPARATOR TCEA1SPAWNER- RECRUITWEIGHT-LENGTH CURVE FITTING T PA3AGE OpPOSITION ESTIMATION T FBIESTIMATE CATCH NUMBERS PERCENT WEIGHTLENGTH -? EQUENCY.DISTRIBUTION'VON BERTALANFFY GROWTH CURVE FITTING -TCPC1VON BERTALANFFY GRCWTH UNEQUAL AGE INTERVALVON BERTALANFFY GRLW.T..kEQUAL AGE INTERVALVON BERTALAFFY GROWTH-CURVEIFIPING TCPC4ESTIMATION CF LINEAR GROWTHFISHING POWER ESTIMATION TCPD1,SURVIVAL RATE ESTIMATION TCPE1FISHING MORTALITIES ESTIMIFION TCPE2RELATIVE YIELD PER RECRUIIFINTERNAL WAVE OSCILLATIONS ZMCIYINTERNAL WAVE OSCILLATIONS ZMODE,PYRANOMETE# AN RALICMETER TIME R1ES RACXBTQKCUTISENTROPIC INTERPOLATICSIGMAT'
185
19.5

48 FORTRAN19 FORTRAN'2297 FORTRAN97 FOR RAN'97''FORTRAN .
IBM 360/65IBM 360765)BM 360IBM 360/65IBM 360/65IBM 360/65
SALINITY FROM CONDuCTIVITY4 P SALINEVOLUME,TRA.KSPCRT FuNCTION FUNCO2 AND DC SAT
(SOUND VELCCITY WILSONS FORMULA WLSNDSOUND VELOCITY WILSCNS FORMULA SVELFSSOUNb VELCCITY WILSONS FORMULA VELPR'S
116 FCRTRAN 'CDC 3300 VERTICAL GRAPHS4 FORTRAN 1,BM 360/50 CONSISTENCY CF PHYSICAL ANC CHEMICAL DATA
FORTRAN CALCULATICN CF THERMOMETRIC VALUES',4 FORTRAN
102 FORTRANSTATICN DATA SYSTEM FINAL VALUESrRAY TRACING KLERER-MAY pSER LANGUAGE
.135 FORTRAN 1 IBM 7090 FOURIERANALYSIS'(301134'FORTRAN JBM,7090 ThCrDIMENSICNAL AUTCCCRA6LATICN134 FORTRAN 4 IBM 1401 TWO7DIMENSICNAL AUTCCORRELATION118 FORTRAN CDC 3100 SfCTICN PLCTTING116 FORTRAN PDP-8 SECTICN PLCTTING79 FCRTRAN CDC 3150 ,CURRENT METER CATA PRCCESSING SYSTEM TICE135 FORTRAN
FORTRANIBM7074 ,
UNIVAC 1108LEAST SCUARES PLOTTEMPERRE SALINITY CCRRECTIONS CURVEFIT NI3512139
139 FORTRAN POP-9 BARTLETT'S CURVE-FITTING121 FORTRkk PRODUCES CCfTCUR ChARTS GRICIT121 FORTRAN PRODUCES CCNTCUR.ChAPTS AUTCMATED CONTOUR100 FORTRAN IBM 7077 CRITICAL ACCLSTIC RATIO9.7 FORTRAN UNIVAC 1108 SOUND VELCCITY FOR MARINE SEDIMENTS98 FORTRAN IBM 7074 LIGHT AND SCUNC INSTRUCTION B45 FORTRAN IBM 7074 LIGHT AND StLND INSTRLCTLON d
144 FCRTRAN IBM 7074 BATHYMETRIC CATA RtCUCTION14 FORTRAN IBM 7074 MDNTHLY 5CNIC LAYER DEPTH14 FORTRAN IB 7074 VERTICAL TEMPERATURE GRADIENTS137 FORTRAN IB 7074 SINGLE INTEGRATICN111 FORTPAN IB7 7074 GECDETIC DATUM REDUCTION111 FCRTRAN 187 7074 . GECDETIC FCSITION &.CMPUTATION AND PLCT
.111 FORTRAN ASTRCNOMIC LATITUDE412-FORTRAN-112 FORTRAN.112 FORTRAN112 FCRTRITNr'89 FORTRAN85 FCRTRAN85 FCRTRAN90'FORTRAN90 FORTRAN46 FORT5AN,46 FORTRAN48 FORTRAN76 FORTRAN'76 FORTRAN.105 FORTRAN109 FORTRAN105 FORTRAN110 FORTRAK110 FORTRAN
1110 FCRTRAN
5 FGRTRAN_15 FORTRAN75 FORTRAN75 FCRTRAN75 FCRTRAN75 FORTRAN93 FORTRAN
-120 FORTRAN16 FORTRAN
CDC aloo, . SOUNDING PCTIBM 1074 SCUNCING PLCTIBM 1074 SINGLE INTEGRATIONCDC 3100 SOCANC INVERSE-IBM 7074 SOLAR RADIATICN CCAVERSIONIBM 7074 WIND STRESSIBM 7074 TWC-DIMENSICNAL POWER SPECTRUM FOR 'SWOP II
IBM 7074 PRtDICTION'CF VERTICAL TEMPERATURE ChANG.EIBM 7074 CLCUD CCVER AND DAILY SEA TEMPERATUREIBM 7074 SEAMCUNT MAGNETIZATIONIBM 7074 CaSERVATICK CRAPING GRAVITYUNIVAC 1108 SEDIMENT SIZEI8 7074 CURRENT METER TURBULENCEUNIVAC 1108 WATER') DISPLACEMENT DISPLAUNIVAC I108 FAA FLC1UNIVAC 1108 DISTANCE ANC AZIMUTH CIRAZDUNIVAC 1108 PARAMETRIC MAPUNIVAC 1108. LORAN TC GECGRAPHIL AND/OECGRAPHIC TC LCRANUNIVAC 110E LORAN CCORDINATE CUMPUTATIONUNIVAC 1108 LORAN SKYhAVE CCRRECTIONCDC 3200 INTERPOLATICN FOR uCEANOGRAPHIC DATAIBM 1620 INTtl/PCLAITCh FOR uCEANOORAOHIfOATA
CDC .p00 CURRENT METER DATA CURRENTCOC 3300 ZURRENT METES CATA CREATE-C
COC 3300 CURRENT METES DATA CURRPLOT'CDC 3300 CURRENT METER DATA SPECTRUMCDC 6400 40RIZCNTAL RANGEcpc 3800 LINE FRINTER PLCTSCDC '38'00 INTERNAL GRAVITY WAVES DISPER
' 4186
196
p.

107 FORTRAN CDC 3800 ANNCTATED TRACK ON STEREOGRAPHIC PROJECTION t
89 FORTRAN CDC 3800 . MIE SCATTERING COMPUTATIONS47 FORTRAN CDC 3600 PLOTS TRACK AND DATA PROFILE TRACK'-'47 FORTRAN CDC. 3800 PLCTS TRACK ANC DATA PROFILE TRACK ..47 FORTRAN CDC 3800 GECDATA
' 47 FORTRAN CDC 3600 GECDATA47'FORTRAN CDC 3600 MAGNETIC SIGNATURES MAGPLOT47 FORTRAN CDC 3800 MAGNETIC SIGNATURES MAGPLOT107 FORTRAN CDC 3600 ANNCTATED TRACK ON STEREOGRAPHIC PROJECTION125 FORTRAN UNIVAC 1108 SPECTR4 ANALYSIS SUBROUTINES . .
47 FORTRAN UNIVAC 1108 TRUE CC AN DEFTH FATHCR142 FORTRAN CDC-3300 SOLVE ALGEBRAIC MATIONS MATRIX121 FORTRAN CDC 3300 PHYSICAL CATA PLCT FRAME ,
99 FORTRAN CDC 3300 ACOUSTIC PERFORMANGE AND EVALUATION94 FORTRAN COO 3300 SOUND REFRACTICN CCRRECTIONS FITIT15 FORTRAN SIGMA -T INVREJ
6 15 FCRTRAN STD PROCESSING CCEANDATA, 1
15 FORTRAN INTERNAL.WAVES WITGC84 FORTRAN IBM 360/165 WAVE INTERACTICN WI H CURRENT CAPGRAY24 FORTRAN IBM,370/165 ESTUARINE MOCEL NO LNRA2E FORTRAN CDC 6400 WhELLING CSTLUPWL,126 FORTRAN CDC 330b/CS3 TIME SERIES ARANO ACFFT .126 FORTRAN CDC 3300/053 TIME, SERIES ARANO ACbRR126 FCRTRAN CCC 3300053 TIMES SERIES ARANO AcRPLT126 FORTRAN CDC 3300 /053'TIME SERIES ARANO ALIGN126 FORTRAN -CDC 3300/053 TIME SERIES ARANO APPACO
1 FORTRAN I % IBM 1620 TRANSPORT COMPUTATIONS FROM ATMOSPHERIC PRESSURE'446 FORTRAN II IBM 7094 STATICN DATA REbUCTION SYNOP
5 FORTRAN II POP 8E MASS TRANSPGRT AND. VELOCITIES GEOMASS79'FORTRAN II IBM 1620 PRCCESSES CURRENT INSTRUMENT OBSERVATIONS94 FORTRAN II UNIVAC 1108 BOTTCK REFLECTIVITY148 FORTRAN II CDC 1604 FORTRAN.tCCESS TO SCIENTIFIC DATA FASO48 FORTRAN II IBM 1620 SOIL ANC SECIMENt OGINEERLNG TEST DATA145 FORTRAN II IBM 1130 REDUCTICN ANC'DISPLAY CF DATA )CQUIRED AT SEAL101 FORTRAN II IBM 7090 ACOUSTIC RAY TRACING ,'138 FORTRAN II CDC 3100 LEAST SCUARES CURVE FITTINGt2 3 CA OLMENtICNS139 FORTRAN II `GE 225 'CURVE RITTING'CAVFT-2 FORTRAN II' CDC 3100 . SALINITY ANCOALY ISALBF3 FORTRAN II CDC 31b0s OkYGEN SATURATION GXYGEN ANGHALY ISAT8P
4 3 FORTRAN II PDP"8 :PLCI THETA-S CURVES. t
3 FCRTRAN II cgc 3100 PLCT THETA-S 'CURVES : .
3 FORTRANII COC 310b PLOTS STATION PCSIT1CKS3 VORTRAN II iPDP-8 PLCTS STATICN POSITIONS3 FORTRAN II CDC 3150 NUTRIENT CONCENTRATION PEAKS
91 FORTRAN II CDC 160A. ICE DRIFT ANALYSIS/FORECAST110 FGRTRAN II 187 7074 INDIVIIDLAL FCINT GtNERATOR FOWMAP PROJECTICNS111 FORTRAN II 187 7074 INDIVIDUALPUNT GENERATOR FOR DISTANCE39 FORTRAN IV GDC 3302 GEOPHYSICAL;DATA REDUCTION AND PLOTTING39 FORTRAN IV CDC 3300- PRCCESSING/CISPLAY MARINE GEOPHYSICAL DATA39 kiRTRAN IV. CDC 3300- MARINE SEISMIC CATA PECUCTICN AND ANALYSIS35 FORTRAN ;IV CDC 3300 'A LIBRARY CF GEOPHYSICAL SUBROUTINES GLIB7 FORTRAN IV IBM 360/65 REAC CALC INTERP STATICN DATA CAPRICORN7 FORTRAN IV IBM 360/65 STATICN DATA CALOULATICNS F38 FORTRAN IV 18M 360/65 PLCTS STATICN CATA PLTEDT8 FCRTRAN IV IBM 360/65 CALCULATES STATION DATA SECPG
103 FORTRAN IV IBM 360/65 PLOTS MAPS GPIDS TRACKS MAP ..
5'FCRTRAK IV 0 6700 CCEANCGRAQHY STATICN CCMPUTER PROGRAM25 FORTRAN IV 1BM'360 DYNAMIC DETERMINISTIC SIMULATION SIMUDELT83 FORTRAN IV: 18M 360/75 AVEh BCTTCM VELCCITY91 HATRAN IV IBM 3090-94 SEA ICE STUCIES YARIT ,
91 FORTRAN IV IBM 7090-94 °SEA ICE STUDIES FLIP.91 FCRTRAN IV I3' 7090-94 SEA ICE STUCIES 5ALPR ,
187
i 97
4.

\
91 \FORTRAN IV38 tORTRAN IV116 ,ORTRAN IV
2 FORTRAN IV25 FORTRAN IVZ8 FORTRAN IV28 FORTRAN IV
. 1,50 F RTRAN IV5 F R
24 IV
TRAN IV1'5 FORTRAN IV147 FORTRAN IV51 FORTRAN IV52 FORTRAN IV52 FORTRAN IV.27 FO RAN IV52 FOR RAN .IV118 'FCR RAN IV118 FORT AN IV119 FORT AN IV119 FORT AN IV119 FORT AN IV119 FORTRAN IV119 FORTR N IV120 FORTR N IV102 FCRTR N IV97 FORTRA .IV
97 FORTRA IV148 FORTRA IV143 FORTRA .IV
IBM, 709044CUC 6600CDC 3600CDC 660QIBM 360/65IBM 370IBM 370UNIVAC 1108'UNIVAC 1108'PDP 10PDP 10IBM 360/65CDC 6600CDC 6600DC 6600CDC 6.400IBM 7-094XDS SIGMA 7XDS SIGMA 7XDS SIGMA 17XDS SIGMA,XDS SIGMA,XDS SIGMAXDS SIGMA 7HP MINIXDS SIGMA 7XDS SIGMA 7XQS SIGMA 7XDS SIGMA.7XDS SIGMA 7
8 FORTRAN IV HP 2100.8 FORTRAN IV XDS SIGMA 79 FORTRAN IV XDS SIGMA 79 FORTRAN4V XDS SIGMA 79 FORTRAN IV XDS SIGMA 79 FORTRAN IV XDS,SIGMA 79 FCRTRAN IV .XDS SIGMA 7
10 FORTRAN I\V XDS SIGMA 710 FORTRAN IV XDS SIGMA 710 FORTRAN XDS SIGMA- 710 FORTRAN I XDS SIGMA 752 FORTRAN ir CDC 640053 FORTRAN IV IBM 7094
:q3*'FORTRAN IV ,UNIVAC 1108'136 FORTRAN IV IBM 37056 FORTRAN IV IBM 37056 FORTRAN IV IBm 370/25 FORTRAN IV2S FO TRAN IV113 F RTRAN IV93 F RTRAN. SV72 .ORTRAN IV72 FORTRAN, IV134 FORTRAN IV83.FORTRAN'IV-'83 FORTRAN'IV'83 FORTRAN IV24 CCRTRAN IV24 FORTRAN IVZ4 FORTRAN tV24 FORTRAN Ly88 FORTRAN IV
IBM 1130IBM 1130IBM 360/63CDC 1604CDC 6500CDC 1604.IBM 360CDC 6500CDC 7600CDC 3100CDC 6500CDC 7600CDC 6500_IBM 360CDC 6500
SEA ICE STUDIES RITE,.CONVECTION INVARIAbLE VISCOSITY FLUID CCNVECPLOTTING PRCGRAM PRCFLSTD DATA. PRCOESSING.MIT SALINITY INTRUSION PROGRAMESTUARINE CHtMISTRY MYACHEMESTUARINE TICES .
THREE DIMENS1CNAL ESTUARINE CIRCULATION MODELINVERSE PROBLEM IN ECOSYSTEM ANALYSISSTATICN DATA ThIRPTHERMCMETER CORRECTION THERMOMETRIC DEPTHREACS NCDC STATION DATA TAPEPRCOLCTIVITY'CXYGENSPECIES DIVERSITY JC8PRODL(TIVITY ECOPRODTHREE-DIMENSICNAL SIMULATION PACKAGE AUGURCONCENTRATIONS PER SQUARE METER OF SURFACEHCRIZCNTAL HISTCGRAMS HISTO f
PRINTER PLCTS LISPLCPLOD CF FREQUENCY uISTRIBUTION THISTOVELCCITY VECTCR AVERAGES VECTAVPROGRESSIVE VECTORS PROVECPLOTS DATA ALCNG TRACKPRCFILE VERSUS TIME bR DISTANCEPLOTS NAVIGATION WITH ANY OTHER DATA TYPE DEEP6RAYTRACESOUNC'VELCCITY SONVELDEPTH CORRECTION MICOR SOUND VELOCITYEDITING FCR 6HOI FORMAT SCRUBTHERMCMETER,CCRRECTICN TCPLSTATION DATA HYD2BRUNT-VAISALA FREQUENCY OBVFRQDYNAMIC HEIGHT DYNHTPOTENTIAL ENERGY ANOMALY PENVWCUS PARAMETERS FROM STATION DATA OCCOMPSPECIFICIVCUUME ANOMALY- SVANOMPRESSURE SUBRCUTINE PRESSREADS STATICN DATAGEOSTROPHIC VELCCITY DIFFERENCE VELVOLUME TRANSPORT VTRSIGMA-T SIGMAT AND DSIGMTCCM8INED CHLOROPHYLL AND PRODUCTIVITYPHYTGPLANKTCN NUMBERS VCLUME SURFACE AREASPECTRAL ANALYSIS uF TIME SERIESPROBABILITY CISTRIbUTION WEIBULRESOURCES ALLCCATIuN IN FISHERIES MGT PISCESWATER ESCURES TEACHING GAME DAMBEACH MULATICN MODELBEACH A D NEARSHORE,MAPS A-SNOS S I NTIFIC SUBROUTINE SYSTEM ANGLESCUND ATTERING BY CRGANISMS SKATTHERMA ,CLLLTICN MCDELTHERMA pfLLLTICN MCDELTIME S IES ANALYSIS BLACKYFRENCH 'SPECTRC-ANGULAR WAVE MODELFRENCH SPECTRC-ANGuLAR WAVE MODELSURF PREOICTICN MODELMULTI-LAYER HYDRODYNAMIC -NUMBERICAL MODELMULTI-LAYER HYDRODYNAMICAL-NUMERICAL MCCELSINGLE LARGE HYDRCuYNAMICAL-NUMERICAL MCDELSINGLE LARGE HYDRCLYNAMICAL-NUMERICAL MCDELHURRICANE HEAT POTENTIAL MODEL
3.88.
t

1
.9
4
,88.FORTRAN IV CDC 6500 OCEAWATMCS;HERE FEEDBACt( MODEL80 FORTRAN .60 IBM 36b/195 TIDES IN THE CPEN SEA15 FORTRAN EXT CDC 6500 VARIANCE AND STANDARD DEVIATION SUMMARY,
101 FORTRAN.IV UNIVAC 1108 SCNAR IN REFRACTLVE WATER101 FORTRAN UNIVAC '1108' SONAR 4N REFRACTUE'MATER101 FORTRAN IV UNIVAC 1108 SORTS SCUND RAY DATA RAY SORT45 FORTRAN IV UNIVAC 1108 PATTERN,FUNCTICN:CALCULATIONS,141' FORTRAN IV UNIVAC 1108. SMOOTHING DATA USING THE CUBIC SPLINE94 FORTRAN IV UNIVAC 1108 PROPAGATICN LOSS FAST FIELD PROGRAM14 FORTRAN.EXT'CDC 6509 CCEANCGRAPHIC CATA CCMPUTATION'TPCONV
136-FORTRAN IV IBM 860/65 EXTENDED NCRMAL SEPARATOR PROGRAM ENCRMSEP-124 FORTRAN IV IBM 360/65 CXYGEN PHCSPHATE CENSITY PLGTS -"
124 FORTRAN IV IBM, 360/65 GENERAL MERCATOR PLOT .
112 FORTRAN IV ISM 360/30 ADJUSTS A STATE PLANE COORDINATE TRAVERSE113 FORTRAN IV IBM 360/65 KS SCIENTIFIC SUBRCUTINE SYSTEM ANLIS113 FORTRAN IV IBM 36.0/65 NOS SCIENTIFIC SUBROUTINE 'SY/STEM PCTN
-113 FCRTRAN IV IBM 360/65 NOS SCIENTIFIC SUBROUTINE-SYSTEM APCWN113 -FORTRAN IV IBM 360/A5 NOS SCIENTIFIC SUBRCUTINE SYSTEM APOLY113 FORTRAN IV IBM 360/65. NOS SCIENTIFIC SUBROUTINE SYSTEM CGSPC113 FORTRAN IV IBM 360/65 NOS SCIOTIFIC SUBRCUTINE SYSTEM CUBIC113 FORTRAN IV IBM 360/65 NOS SCIENTIFIC SUBROUTINE USTEM.EXCEB113 FORTRANIV IBM' 360/65 NOS'SCIENTIFIC SUBROUTINE SYSTEWOMLIC .
113 FORTRAN IV IBM 360765 NOS SCIENTIFIC SUBRCUTINE SYSTEM. HIFIX114 FORTRAN IV IBM.360/65 /NOS SCIENTIFIC SUBROUTINE SYSTEM LORAN114 FORTRAN IV IBM '360/65/ .NOS SCIENTIFIC SUBROUTINE .SYSTEM OMEGA114_FORTRAN IV IBM 360/65/ NOS SCIENTIFIC SUBROUTINE SYSTEM SODIN114 FCRTRAN IV114 FORTRAN IV.114 FORTRAN IV.80 FORTRAN' IV82 FORTRAN IV82 FORTRAN IV82 FORTRANIV82 FORTRAN IV80. FORTRAN IV30 FORTRAN IV30 FORTRAN IV30 FORTRAN IV0 FORTRAN IV31'FORTRAN IV31 FORTRAN IV31 FORTRAN IV17 FORTRAN IV.17'- FORTRAN IV91 FORTRAN 66145 FORTRAN IV437 FORTRAN IV134 FORTRAN IV84 FORTRAN IV
'104 'FORTRAN IV104 FORTRAN IV104 FORTRAN IV12 FORTRAN IV4 FORTRAN IV
135 FORTRAN IV25 FORTRAN- IV40. ,FORTRAN I
1135 FORTRAN I135 FCRTFAN103 FORTRAN 'I54 FORTRAN
IBM 360/6IBM 360/IBMt360/CDC 660CDC 66tCDC 66IBM 36IBM 3IBM 3CDCCDCCDCCDCCDCCDCDIBCI
I
NOS SCIENTIFIC SUBROUTINE SYSTEM SODPN .
NOS 4CIENTIFIC SUBROUTINE SYSTEM TPFIX5 NOS SCIENTIF16r SUBROUTINE SYSTEM UTMCO .
HARMCNIC ANALYSIS OF DATA AT TIDAL FREQUENCIESHURRICANE STM SURGE FORECASTS.SPLASH I '
0 HURRICANE STCRR SURGE FORECASTS'SPLASK IIx./195 -EAST COAST STORM SURGE07195 WAVE FORECASTS.
, k.
0/195- ASTRCNOMICAL TIDE PREDICTION00 DEEP CCEAN LCAC HANC'LING SYSTEMS DOLLS600 LOAD MOTICN AND CABLE STRESSES CAB1600 , SOIL TEST CATA TRIAX N
00 DYNAMIC'STRESS RESPCNSE OF LIFTING LINES CABANA6600 DYNAMIC RESPCNSE OF CABLE SYSTEM SNAPL -G6600 CHANGES IN ELECTROMECHANICAL CABLE RAMSC6600 END USPONSES IN ELECTROMECHANiCAL CABLE. RADAC360 CBJECTIVE THERMCCLINE ANALYSIS
C 6500 CBJECTIVE THERMOLjNE ANALYSIS , .
M 1604 WINDDRIFT AND CONGENTRATION OF SEA ICE IGEGRIDM 1800 CURRENT METER CATA RECUCTIGN -I!"
BM,1800 CABLE CCNFIGURATION ,
BM 1806 GENERATES, ARBITRARY FILTER HILOW'BM 1800 SHIPBCRNE WAVE AECCROER ANALYSIS SBWROIBM 1800 LORAN/DECCA COORDINATES CALCULATION HNAVIBM 1800 LORAN/DECBA FILE, INITIALIZATION HNV1IBM apo WDETIC DISTANtE AND AZIMUTH SDANDB 6700 i, PLOT TEMP LIST MIXED LAYER DEPTH WEEkPUCTCDC CYBER 74'DAILY SEAWATER CBSERVATIONS .
IBM 360/40IBM 360/65IBM tI074IBM 1.130IBM 1130DIM 1,130IBM 1130
SPECTRA PRCGRAMS DtTRND AUTCOV CRSCCV FCURTRMIT SALINITY INTRUSION PROGRAM'OOMPUTATICKANO PLCTTING Of MAGNETIC ANCAALIES,_ANALYSIS CF.NCNLINEAR RESPCNSE SURFACEMULTIPLE DISCRIMINANT 'ANALYSIS MULGASATELLITE RISE AND SET TIMES ALERT ASORTYIELD PER RECRUIT RYLC BICM
189
199

103 FORTRAN IV, IBM 36076522 FORTRAN IV IBM 360/0523 FORTRAN IV IBM 360/6538 FORTRAN IV IBM 360/6538 FORTRAN IV XDS SIGMA 73S FORTRAN IV US SIGMA 7122 FORTRAN IV IBM 360/61122 FORTRAN IV IBM 360/61122 FORTRAN IV IBM 360/6138 FORTRAN IV IBM 113040 FORTRAN IV IBM 113011? FORTRAN IV IBM 1130117 FORTRAN IV IBM 1130118 FORTRAN IV IBM 1130
1 FORTRAN IV LBM 11301 FORTRAN IV IBM 1130
t' 1 FORTRAN IV IBM 1'13042 FORTRAN V .UN1VAC 110842.FORTRAfi IV UNIVAC 110842FORTRAN IV UNIVAC 1/08
ASTRCNOPIC PCSIIION AZIMUTH METHODPERCENTAGE SATURATIdN QF OXYGEN IN ESTUARYWATER'CkEMISTRY DItLECTRIC CONSTANTGRAVITATICNAL ATTRACTICN IMO-DIMENSIONAL BOCIESX-RAY DIFFRACTION ANALYSISMAGNETIC ANCMAtIES MAG2D'PROFILE PLCTS TIME AXIS PROFL3 ,
*PRCFILE PLCTS(DISTANCE AXIS PFLDSTMAP FLCTS MAFPLTSEDIMENT GRAIN SIZt ANALYSISREDUCTION DISPLAY STORAGE GEOPHYSICAL DATAPLCTS HYDRC CAST CATA FLOGPLOTS STD DATA STF01PICTS TEMPERATURE-SALINITY PSAL 1TRANSPORT CCMPUTATICNS FROM ATMOSPHERIC,FRESSURESTD CCMPUTATICNS STP02HYCRC CAST CCMPUTATIONSLISTS RAW DATA 2LISTPLCTS TRACKLINE QCKORAWPLCTS4tCNTCUR CROSSING INTERVALS DCUBLX
42 FORTRAN IV UNIVAC,1108 PLCTS GEOPHYSICAL DATA PLCT243 FORTRAN IV UNIVAC 1108 LISTS EVERY HUNCRELTH VALUE SNOOP,43 FORTRAN .IV UNIVAC 1108 NAVIGATION CCMPUTATIONS TPNAV43 FORTRAN IV UNIVAC 1108 EDITS GEOPHYSICAL BATA ZEOTT
' 43 FORTRAN IV UNIVAC 1108 GECPHYSICAL CATA CCNVERSION HANDY44 FORTRAN IV UNIVAC 1108 LISTS GEOPHYSICAL BATA LISTP44 FCRTRAN IV UNIVAC 1108 COURSE/ SPEEC, EOTVCS CORRECTIp OXNAV
1 44 FORTRAN .IV UNIVAC 1108 CONVERTS GECPHYSICAL DATA PHONEY.44 FORTRAN IV UNIVAC 1108 4SCLND VELCCITY VARIATION AND NAVIGATION FATH00,
.1 1 45 FORTRAN IV UNIVAC 1108 REGICKAL FIELC RESACUAL MAGNET. ANOMALY GAMMAi 45 FORTRAN IV UNIVAC 1108 GRAVITY GAL
45 FORTRAN IV UNIVAC 1108 PLCTS PROFILES CF 4EOPHYSICAL DATA DLSPLOT1r
46 FORTRAN IV UNIVAC 1108 CONVERTS DIGITIZER CATA.DYGYT46 FORTRANAV UNIVAC 1108 EDITS REDUCED GEOPHYSICAL DATA EDIT
IV CDC 6400 SCALAR TIME SERIES TEMPLT778 FORTRAN IV CDC 6400 VECTCR TIME SERIES CURPLT65 FORTRAN IV IBM 360 TCXICITY EICASSAY PRCBIT ANACYSIS
439 FORTRAN IV IBM 360/65 FITS POLYNCMIAL P3TERM142 FORTRAN IV IBM.360/65 CHECKS ANGLES ThOPI
1 142 FORTRAN IV COC 6600 CHECKS'ANGLES TWOPI122-FORTRAN IV IBM 360/65 PLCTS SCATTERGRAM SCTM4 SCTGMS123 FORTRAN IV CDC 6600- X-Y PLOTS EBTPLT148 FORTRAN IV ,,CDC. 6600 REPRCDUCE ANC SERIALIZE DECK DUPE148 FORTRAN IV IBM 360/65 FLAGS SUSPICICUS DATA VALUES EDIT() -
144 FORTRAN IV' IBM 360/65 JULIAN DAY CCNVERS1CN JDAYMK144 FORTRAN IV ,IBM 360/65 JULIAN DATE CCNVERSION ROUTINES JULDAY
;-
144 FORTRAN IV IBM 360/65144 ;FORTRAN IV IBM 360/65144 FORTRAN IV' IBM 360/65144 FORTRAN IV 'IBM 360/65144 FORTRAN 14 IBM 360/6517 FORTRAN IV CDC 650041 FORTRAN IV IBM 360/6541 FORTRAN IV IBM 360/65153 FORTRAN IV IBM 360/65
; 153 FORTRAN IV153 FORTRAN IV153 FORTRAN IV18 FORTAN IV19 FOR5RAN IV19 FORT AN IV
- 19 FORT N IV
It
IBM 380/65IBM 360/65,IBM 360/65IBM 360/65IBM 360/65IBM 360/65IBM 360/65
"JULIAN DATE CCNVERSION ROUTINES JULIANJULIAN DATE CCNVERSION ROUTINES JULYANJULIAN DATE CCKVERSION.ROUTINES JULSECJULIAN DATE CCNVERSION .ROUTINES CESLUJDAY CF NDAYWK
UBWeT B T PPERATUKE WETBLAMARINE GEC HYSICAL DATA REDUCTION r4r.
PLCTS PROFILES CF 6ATHYMETRY AND MAGNETIC,XBSELECTXBPSINVXBGEDSUMCANWMCDYNAMIC DEPTh ANOMALY DYANCMPOTENTIAL TEMP AND DENSITY PODENSVOLUME TRANSFCRT VCWTRNCCMPUTES PRESSURE PAESSR,
190
200

' 115 FORTRAN IV 'IBM 360/65 CORFUTEIGREAT CIRCLI PATH GCIRC,
115FORTRAN V IBM 360/40 MAP PROJECTICNS ANC,GRIDS MAP54 FORTRAN 4V IBM 360 PIGMENT RAT IC
54 FORTRAN IV IBM 360, SUCCESSION54-FORTRAN 1V IBM 360 SPECIES ABUKEAKCE138 FORTRAN IV IBM 360/65 FITS A SMCOTH CURVE141 FORTRAN IV IBM 360/65 CALCULATES SPLINE COEFFICIENT SPLCOF141 FORTRAN IV IBM 360/65 INTERPOLATING BY CUBIC SPLINE150 FORTRAN IV- IBM 360/65 FILE INCEPENCENT GEN APP SYS GAS GASDItSeSo.
150 FORTRAN IV IBM 360/65 FILE INCEPENCENT GEN APP SYS GAS GASSAMPC150 FORTRAN IV IBM 360/65 ,FILE INDEPENCENTiGEN APP SYS GAS GASEINV150, FORTRAN TV IBM 360/65 FILE INDEPENCENT GEN APP SYS GAS GASCCI *
'150 FORTRAN IV IBM 360/65 FILEINDEPENCENT GEN ARP SYS GAS GASVPRT150 FORTRAN IV IBM 360165 FILE INDEPENCET GEN APP SYS GAS GVAREFRM150 FORTRAN IV IBM 360/65 FILE INDEPENCENT GEN APP SYS GAS CANADA
050 FORTRAN Iv IBM 360/65. FILE IUCEPENDENT GEN APP SYS GAS,GAS150 FORTRAN IV IBM 360/65 FILE INDEPENCENT GEN APP SYS GAS GASVAZUrm
151 FORTRAN IV IB.M 360/65 rrcE INDEPENDENT EN APP SYS GAS GASB151 FORTRAN IV IBM 360/65 FILE INCEPENCENT G $. GAS ALTERGAS
151 FCRTRAN IV IBM 360/654 FILE.INCEPE 'App SYS GA.0 NODCSQ'151 FORTRAN IV IBM 360/65 FILE INCEPENCENT G APPSYS GAS NAMES151 FORTRAN IV IBM 360/65 FILE INCEPENCENT GEN APP SYS GAS 502,GAS1.1 FORTRAN IV CDC 3300 , CXYCEA CPLCI-11 FORTRAN IV CDC 3500 ' CHLORCPHYLL CHLO11 FORTRAN IV CDC 3300 SALINITY SALTY11FORTRAN IV, CDC 3300 TEMPERATURE SALINITY CLASS VOLUME TSVOL12 FORTRAN IV DC '5300 THERMCMETER CCRRECTION THERZ12 FORTRAA IV CDC 3300 TRANSPORT XPCRT91 FORTRAN IV ,CDC 3300 ICEBERG DWI ICE PLOT143 FORTRAN IV IBM 36b AREAL CCNCENTRATION INTEGRATE143 FORTRAN IV IBM 360 LNWEIGHTEC AVERAGES AVERAGE84 FORTRAN IV UNIVAC 1108 STORM- SURGE84 FORTRAN Iv UNIVAC 1108 WAVE REFRACTICN,28 FORTRAN IV IBM 360/40 MATHEMATICAL MCDEL qf COASTAL UPWELLING3 FGRIRAN IV HP 2100A STD- TABLES AND PLCTS" STD
22 FORTRAN IV CDC 3150 ALKALINITY ALCT47 FGRTRAN IV CDC 3150 GEGPHySICAL CATA STORAGE AND RETRIEVAL GEOFILE48 FORTRAN IV.,UNIVAC 1108 'BOTTCM SECIMENT DISTRIBUTION 'PLOT93 FORTRAN IV CDC 6500 NORMALKCE CALCULATICNS NORMOD 316 FORTRAN IV HP 2100S THERMCMERIC CEPTH CALCULATION CAST16 FORTRAN IV HP 21005 THERMCMETER CATA FILE HANDLER THERMO -
16 FORTRAN IV pc 3200 SEA, SURFACE - TEPPERATURES ANALYSIS107 FORTRAN IV HP 21055 ,ANNCTES CHART108 FORTRAN IV HP 2100S BATHYMETRIC CR MAGNETICS CHART PROFL108 FCRTRAN IV ,HP 2100S MERCATOR CHART CIGATIZATION NTRK108 FORTRAN IV HP 2100S BATHYMETRIC CHART LIGITIZAT N DGBTH108 FORTRAN IV HP 2100S PLCTS ON STERECGRAPHIC CHAR ANNOT108 FORTRAN IV HP 2100S PLCTS NAVIGATIGN DATA OCEAN109 FORTRAN IV HP 2100S LONG BASE LINE ACOUSTIC TRACKING10 FORTRAN IV XDS SIGMA 7 ADIABATIC TEMPERATURE GRADIENT ATG10 FCRTRAN IV XDS SIGMA 7 FCTENTIAL TEMPERATURE POTEMP10 FORTRAN IV 'XDS SIGMA 7 SPECIFIC VCLUME SPVCL136 FORTRAN IV XDS SIGMA 7 STATISTICS FRCP WHCI FORMAT STATS
-100 FORTRAN IV HP-2100S LORAN OR CgEGA'CONVERSION GEPOS105 FORTRAN IV HP 3100A CRUISE TRACK IPERC100 FORTRAN IV XDS SIGMA 7 TRANSFORMATICK CF SPHERICAL COORDINATES ROTGUT106 FORTRAN IV XDS SIGMA 7 SUM OF FINITE ROTATYONS ON A SPHERE-SUMROT41 FORTRAN IV XDS SIGMA 7 GEOMAGNETIC FIELD MPIELD50 FORTRAN IV XDS SIGMA 7 WHCI BIGLCGY SERIES FTAPE'50 FORTRAN IV. XDS SIGMA 7 wHCI BICLCCY SERIES FLISHT50 FORTRAN IV XDS SIGMA 7 WHCI BIGLCCY SERIES ChKSPIT50 FORTRAN IV XDS SIGMA 7 WHCI BLCLCGY SERIES SELECT
O
401
191

50. FORTRAN IV'50 FORTRAN IX50 FORTRAN IV50 FORRANeIV77 FOTTRAN IV
* 78 FCRTRAN IV78 FORTRAN It53 'FORTRAN IV53 FORTRAN LV53 FORTRAN IV26 FORTRAN IV.26 FORTRAN IV26 FORTRAN IV138 FORTRAN45,FORTRAN'V138 FORTRAN V
FORTOEN V93 FORTRAN V
XDS SIGMA 7 wHqi BIOLC'GY SERIES CHANATXDS SIGMA ,7 WHCI BIOLOGY SERIES PREPLCTGXDS SIGMA '7 WHOI BIOLCGY SERIES PLOTSPECGXDS SIGMA 7 .UHCII 8ICLCGY SERIESSTATA8)(DS SIGMA-4 CURRENT METER CLOCK SEQUENCE XTAL
SIGMA 7 CURRENT METER CALIbRATION CASDEC'<D,S SIGMA 7 CURRENT METER CATA REDUCTION AND ECITING4CARPUNIVAC 1108 GENERATES ZOOPLANKTON TAXONCMIC DIRECTORYUNIVAC 1108 DEEP CCEAh tCOPLANOON DISTRIBUTIONUNIVAC 1108' DEEP GCEAh ZCOPLANKTCN POPULATION STATISTICSIBM 360 ' MATHEMATICAL WATER QUALITY MODEL FOR 6STUARIESIBM 360 COMFIITATICN CF FLOW THROUGH MASONBORO INLET NCIBM 360 CIFIGULATIGN 'IN PAMLICQ SOUNDUNIVAC 4108 CURVE FITTING VELCCITY PRCF.ILE NEWFITUNIVAC 1108 RAYLEIGH-MORSE a3OTTCM REFLECTION COEFFICIENTSUNIVAC FITTING A LEAST SQUARES DISTANCE HYPERPLANEUNIVAC 1108 CONTIhUCUS GRACIENT RAY TRACING SYSTEM CONGRATSUNIVAC.1/08 NORMAL MODE FRCPAGATICN MODEL
94 FORTRAN V UNIVAC 1108 BEAM PATTERNS AND WIDTHS GBEAM94 FORTRAN V UNIVAC 1108 STATISTICS ACOUSTI4., MEASUREMENTS AND PREDICT1pS45 FORTRAN V.r UNIVAC 1108 PROPAGATICN LCSS ; 4
45 FORTRAN V UNIVAC 1108 AMOS FRCPAGATICN LOSS'121 FORTRAN V UNIVAC 1108 REFORMATS DATA, PLOTS TRACK CHART MASJRACK
14 FORTRAN V ' UNIVAC 1108' WATER CLARITY76 FGRTRAN V UNI,VAC 1108 IN-SITU CURRENT77 FORTRAN V UNIVAC 1108 CURRENT METER PRINT77 FORTRAN V UNIVAC 1/08 CURRENT METER PLOT77 FORTRAN V UNIVAC 1108 CONVERT CURRENT METER TAPE77 FORTRAN V UNIVAC ,1108 CURRENT METER DATA PPRINTO36 FORTRAN V UNIVAC/1108 TOWED SYSTEM DYNAMICS36 FORTRAN V UNIVAC 1108 TRAPEZOIDAL ARRAY UEPLCYMENT DYNAMICS37 FORTRAN V UNIVAC 1108 STEADY STATE CABLE LAYING37 FORTRAN,V UNIVAC 1108 TOWED ARRAY CCNFIGURATIONS'37 FORTRAN V UNIVAC 1108 TRAPEZCIDAL, ARRAY VYNAMIC616 'FORTRAN V UNIVAC 1108 STD-S7VDATA 52049
FORTRANV . UNIVAC 1108 STEADY-STATE TRAPELCI8AL ARRAY CONFIGURATIONS32 FORTRAN V UNIVAC 1108 ANCHOR LAST -BUOY SYSTEM DEVELOPMENT DYNAMICS.33 FCRTRAN V UNIVAC 1108 CABLE TCWED EICY CO./FIGURATIONS IN 4 TURN33 FORTRAN-V33 5ORTRAN V33 FORTRAN V34 FCRTRAN V34 FORTRAN V
, 34 FORTRAN V`34 FORTRAN V35 FORTRAN V35 FORTRAN V35 FORTRAN V36 FORTRAN V36FORTRAN V146 FORTRAN VI125 FORTRAN 22
UNIVAC 1108 FREE-FLCAT4AG SPAR-ARRAY CYNAMICS'UNIVAC 1108 FREE-PLGATING SPAR1-BUOY DYNAMICSUNIVAC 1108 SHIP SUSPENCEC ARRAY CYNAMICSUNIVAC 1108 BOCMERANG CCRER DESCENT/ASCENT TRAJECTCRIESUNIVAC 1108'.-.80CY--SHIP DYNAMICSUNIVAC 1108 BUCY-SYSTEM CYhAMICSUNIVAC 1108 FIXED THIN LINE ARRAY DYNAMICSUNIVAC 1108 FIXED THIN LINE ARRAY STEADY STATE CONFIGURATIONUNIVAC 1108 MARINE CORER DYNAMICS
STEADY-ST TE BUOY SYSTEM CONFIGURATIONSSTEAOY-ST E SUBSUkFACE BUOY SYSTM CONFIGURATIONTOWEL ARRAY CYNAMICSTHERMCMETER CORRECTION TCHK2TIME SERIES PLOTTING
UNIVAC 1108UNIVAC 1108UNIVAC 1108IBM' 1130CDC 3100
125 FORTRAN 32 PDP-8 .
L):1 FORTRAN 63 ACX 660012 F0RTRIAN 63 CDC 16043 FORTRAN 63 CDC 3600
./---12.FORTRAN 63 CDC 3600100 ORTRAN 63 CCC 3800
----
TIME'SERIES PLOTTINGHYDRGGRAPHIC CATA RECUCTION Th0 FIVEMACHINE PLCTTING CA MERCATGR PROJECTIONVERTICALLY ANALYZEU CCNTOURS VACOTSVERTICAL SECTICN. PLOTS EtTPACGRASS'UNDERWATER ACOUSTICS PREDICTICN DTSTOV
10 FORTRAN 63. CCC 3800 GRASS UNDERWATER AuGUSTICS PREDICTION VFC100 FORTRAN 63 CCC 3800 GRASS UNDERhAER ACCUSTICS PREOICTION CTOUR100 FORTRAN 63 CDC 38'00 GRASS UNDERWATER ACCUSTICSPREDFCTICN PRFPLT100 FORTRAN 63 COC13800 GRASS UNDERWATER ACCUSTICS PREDICTICN SERPENT
1
192
,?02
4

1
101 FORTRAN 63 CDC 3800101 FORTRAN 63 CDC 380073 ANS FORTRAN IBM 36073 ANS FORTRAN IBM 370
' 125 M FORTRAN CDC 6400125,MS FORTRAN CDC 3150126 MS FORTRAN CDC 3150
laGRASS UNDERWATER ACOUSTICS PREDICTION RAPLOTGRASS UNDERWATER ACCUSTICS PREDICTION LCSSPLOTECCLOGICAL STATISTICAL PROGRAMS/ECCSTATECOLOGICAL STATISTICAL PROGRAMS ECOSI"AT.TIME SERIES ANALYSIS PROGRAMS TSAPTIME SERIES ANALYSIS PROGRAMS TSAP,TIME SERIES ANALOG TO DIGITAL A TO D
a.
PL/1 .
74 PL/174 PL/1
IBM 360/168"IBM 360/168
DRIFT,BDRIFT TT
LE/STATISTICSPLOTS
74 PC/1 IBM 360/168 REFCRM4T SCRT DRIFT BOTTLE DATA
4 PL/1 I8M 360/8 DATA MG CR PhYS CHEM CATA OCEANSV
72 PL/187 PL/1
IBM 370/168IBM' 370/180
MONTE CAAARKCVIAN
ILL TRACKER,YSIS CF TDF-14'WIND DATA
51 PL /11 IBM 360/65 SD2CHAR to;
152 PL/1 IBM 360/65 SDGECIV152 PL/1152 PL/1 .
IBM 36p/65IBM 360/65
XBEVALU,XEICONV
152 PL/1 IBM 360/65 X8F"NWC
152 PL/1 IBM 360/65 XBINWSUM
153 PL/1 IBM 360/65 BTGEOIV
153 PL/1 IBM }360/65 SCHNINE
153 PL/1 IBM 360/65 SCMULTI (
153 PL/1 IBM 360/65 DRYLAND.r.
141 4/1' IBM 360/65 LINEAR INTERFOLMTION LININT
141 PL/1150 FL/1
IBM 360/6,IBM 360/65
LAGRANGIAN TFAEE PLINT INTEIIPOLATI,ON LAG3P,TFILE INDEPENCENT GEN APP SYSGAS 445 THERM
(
MISCELLANEOUS
104 MAD104 MAD80 ,MAD53 MAP
114 SPAS114 SPS
A
-IBM 7090 GENERAL MAP FRCJECTIONIBM 7090 FINITE MAP PRWECTIONOISTO NS
IBM 7090 THECRETICAL RACIAL TIDAL FORCEIBM 7094 PHYTOPLANKTCN NUMBtRS VOLUME SURFACE AREA
IBM 1620 COMPUTES GECGRAPHIC PCSITIONSIBM 1620 'LORAN C VERS2ON2
193
203 .
#3r
4
-,
k
Op

1
HARDWARE., INDEX-A .
'BURROUGHS
61 FCRTRAN .8 670061 'FORTRAN B 670071 FORTRAN B 670060 FORTRAN B 670060 FORTRAN B 670060. FCRTRAN B 670070 FORTRAN 8.670070 FORIRAN B 670070 FORTRAN', B 470064 FORTRAN B 670064 FORTRAN B 6700'64 FCRTRAN B 670D58 FORTRAN B 670058 FORTRAN B 670058 FORTRAN B 670068 FORTRAN, B 6700-68 FCRTRAN PB 670068 FORTRAN B 670057 FORTRAN. , B 6700
134 ALGOL. B 670063 FORTRAN B 670C63 FCRTRAN 0 670063 FORTRAN B 670063 FORTRAN B 6700 .
55 FCRTRAN' B 67005S FORTRAN 8.6700Sc FORTRAN B 47006S FORTRAN B 67006S FORTRAN B 6700,65 FORTRAN 867006S FdRTRAN B 670066 FORTRAN B 670056 FORTRAN B 6700,56 FORTRAN 8 67005 FCRTRAN IV B 6700
+.`
ft
VON BERTALANFFY GRONTH*CURVE FITTING TCPC4FISHING POWER ESTIPATItN TCPD1BIORETRY-R X C TEST OF INDEPENDENCE MAP''LDN BERTALANFFY GROWTH CURVE 'FITTING TCPC1.VON BERTALANFFY GRLWTH UNEQUAL AGE INTERVALVON BERTALANFFY GRCW,TH EQUAL AGE INTERVAL-WICNETRY-TUKEY'S TESTBIOMETRY-KRUSKAL-WALLIS TEST TCSE4BIOMETRY-FIShER'S EXACT TEST TCSE5ESTIMATION CF LINEAR GROWThPIECEWISE INTEGRATION OFAIELD CURVES TCPF4PIgCEhISE INTEGRATION CF YIELD,,-CURVESNORMAL DISTRIBUTION SEPARATOR TCRA1SPANNER- RECRUIT CURVE FITTING TCPA2hEIGHT-LENGTh CURVE FITTING TCPA3BIOMETRY-USIC STATISTIC FCR GROUPED DATA'481GMETRY-2441CLE.CLASSIFICATION ANOVA-BICMETRY-FACTCRIAL ANCVA TCSD2AaGENERALIZED EXP1LITED POPULATION SIMULATOR
ANALYSIS LF TIME SERIES
'66 FORTRAN B 640066 FORTRAN tB 670062 FCRTRAN 8 670012 FORTRAN IV B 670012 ALGOL' B 670065 FORTRAN B 6700
FISHING MCRTALITIE4 ESTIMATION T6711E2RELATIVE YIELD PER RECRUIT-
: '
YIELD CURVES, ilITH LCASTANT RATES TCP.F)EUMETRIC YIELD TCPF3 .
::AGE COMPOSITION ESTIMATION TCPB1ESTIMATE CATCh NUMBERS PERCENT WEIGHTLENGTh-FREQUENCY DWRIBOTICNAIEMETRY-SUP CF S'QuARn 5Tp TCSD3BIOMETRY=STUUNT-NEWMAN-KEVLS TEST TCSr)4.
BIOMETRY-7E9T CF HLMOGENEITY'' 1,
BIOMETRY-TEST CF EGUALITYBIOMETRY-PRCEUCT-MLNEKT OORRELATICVLENGTH FREQUENCY AN'ALYSIS' LENFRE ,- A. -..
YIELD PER RECRUIT FOR MULT-1-GEARtFISHERMSCCEANCGRAPHY STATILk CCMPUTER PROGRAP,,GEKERALIZEa hEIGHTEC LINEAR REGRESSICN -.LINEAR -REGRESSION, BOTH VARIABLESSURVIVAL RATE ESTFRATICN TCPE1PLCT TEMP LIST,MIXED LAYER DEPTH WEEKNICT . ,
CONSTANTS FCR HAA,KLNIC SYNTHESIS MEAN SEA TEMFCONSTANTS IN SCHAEFER'S MODEL TCPF6 '
65 FORTRAN B 6700 SCHAEFEP LOGISTICS MCDEL OF FISH PAU:3=110N65 FORTRAN B 6700 FITS GENERALIZED STCCk PRODUCTION MODEL',TCPF865 FORTRAN B 6'100 BIOMETRY-LINEAR REGRESSION ANALYSIS'YOSAi57 FORTRAN B 6700 - GENERALIZED- STOCK PRODUCT ON MODEL PRODFIT117,FCRTRAN- B 6700 SUMMARIZES WEATHER REPORTS . ..:.
98 ALGOL . 8 6700 SOUND VELCCITY THRu SCLID SAMPLES COR/SCN, ,t\.148 ALQ,OL B 6700
...MAILING LABELS
48 ALGOL B 6700 SAND SILT ANC CLAY FRACTIONS DSDP /GRAIN -4414
47 FORTRAN , B 670 _COOLEY-LURES MDCTALE12EGRESSION .-67 FORTRAN B 6700 BICNETRY-TOCCENESS%F FIT c
' .67 FORTRAN 8 6700 BICMETRY--8ASIt STATISTIC FOR UNGROUPEDJATA2 ALGOL B 6700 ., 'STATICN DATA RETRIEVAL HYDRCSgAREH
. *7- '
1421141GO' B 6700 INTERACTIVE CALCULATICNS DSCP/CALC
\.
3
At
194
2Q4

.
. CONTROL. DATA COPORATION
91 FORTRAN 1 CDC .160A/121 FORTRAN .63 CDC 1604
93 FORTRAN IV CDC41604,89 FORTRAN 'CDC 160472 FORTRAN HIV CPC 1604
"' c75 FORTRAN CDC 1.604
.97JORTRAN., CDC 1604.87 FORTRAN CDC 16b4148 FORTRAN II CDC 1604,138 FORTRAN II COC 3100118 FORTRAN CDC 310088 FORTRAN ,CDC 310088 FORTRAN CDC 31003 FORTRAN, II, CDC 31003 FORTRAN II CDC 3100
' 3 FORTRAN 11. CDC310083 FORTRAN IV_ CDC 31003 FORTRAN CDC 31'00
' 2 FORTRAN II CDC 31.0072 FORTRAN * CDC 3100112 FORTRAN CDC 310075 FORTRAN NA CDC 3100125 FORTRAN 32 CCC 310097 FORTRAN CDC 3100112FCRTRAN CDC 3100125 MS FORTRAN CDC 315047 FORTRAN IV CDC 31504126 AS FORTRAN CDC 315022 FORTRANIV CDC 315079 FORTRAN-' CDC 31503 FORTRAN II CDC 315083 FORTRAN CDC 3200'
.416 FORTRAN IV15 FORTRAN
2 97 FORTRAN11 FORTRAN IV11 FORTRAN IV11 'FORTRAN IV_IL FORTRAN IVAl FORTRAN IV12 FORTRAN IV12 FORTRAN IV
. 142 FORTRAN' 116 FORTRAN
t75 FORTRAN750FCRTRAN751 FORTRAN75 ,FORTRAN39 FCRTRAN IV39 FORTRAN IV39 FORTRAN IV39 FORTRAN IV94 FORTRAN99 FORTRAN121 FORTRAN ,
131 FORTRAN131 FORTRAN
CDC 3200CDC 3200CDC 3200etc 3300CDC 330QCDC 3300CDC 3300CDC 3300CDC 3300CDC 3300CDC 3300'cqc 3300CDC 3300COC 3300COC 3300CDC 3300CDC 3300CDC 3400CDC 3300CDC 3300CDC 3300
ICE DRIFT ANALYSIS/FORECASTMACHINE PLOTTING ON MERCATOR PROJECTIONSCUND SCATTERING BY ORGANISMS SKATWIND COMPUTATICN FRCA SHIP OBSERVATICNS TRUWINDTHERMAL PCLLLTICN MODELMEAN DRIFT ROUTINESOUND SPEEC CCMPUTATICN MODEL SOVELOCEAN CLIMATCLCGY ANALYSIS MODEL ANALYSFORTRAN ACCESS TO SCIENTIFIC DATA FASOi4EAST SQUARES CURVE FITTING 2 3 4 171MENSICAS
SfCTION PLOTTING "f'
RUED LAYER CEPTH ANALYSIS MODEL MGDALDATMOSPHERIC WATER CCNTENT MCDELOXYGEN SATURATION O'YGEN ANOMALY ISATIOPLOT THETA-S CURVESPLOTS STATION PCSITICN$SURF PREDICTION MODELSINGULAR NAVE OREpICTICN MODELSALINITY ANCMALY ISALBPDANISh ADVECTICK PRCGRAMSOUNDING PLCTOPTIMIZED MULTI-LAYER HN MODELTIME SERIES FLCTTINGSOUND SPEEC CCMPUTA4ICN MOOEL SOVEL_SODANC INVERSETIME SERIES',ANALYSIS PROGRAMS TSAPGEOPHYSICAL DATA STORAGE AND RETRIEVAL GEG.FILETIME SERIES - ANALOG TO DIGITAL A TO 0ALKALINITY ALCTCURRENT METER DATA PROCESSING SYSTEM TIDE
NUTRIENT CCICENTRATION PEAKSSINGULAR WAVE PREDICTION MODEL
_ SEA SURFACE TEMPERATURES ANALYSIS' INTERPOLATION Ff.!! CCEANCGRAPHIC DATA
SOUND SPEED COMPUTATICN MODEL SOVELCXYGEN CPLCTCHLCRCPHYLL CHICSALINITY SALTYTEMFEfATURE,SALINITY CLASS VOLUME TSVOLICEBERG DRIFT ICE-PLOTTHERMCMETER CCRRECTION1 THERZTRANSPORT XPCRTSOLVE ALGEBRAIC EQUATIONS MATRIXVERTICAL EAR GRAHSCURRENT METER DATA CREATE-CCURRENT METERtGATA CURRENTCURRENT METER DATA CURgPLOTCURRENT METER DATA SPECTRUMGEMYSICALNCATA REDUCTION AND PLOTTINGPRCCESSING/CISPLAY MARINE GEOPHYSICAL DATAMARINE SEISNI,CIDATA REDUCTICN AND ANALYSISA LIBRARY CF CEOFHYSICAL SUBROUTINES GLIBSOUND REFRACTION C6RRECTIONS FITIT
CDC 3300 - ACCLSTIC PERFORMANCE AND EVALUATIONCDC 3300 'PHYSICAL DATA PLOT FRAMECDC 3300/053 TIME SERIES ARAND TAUTOPJ.TCDC 3300/CS3 TIME SERIES AR'AND TCOHPLT
19S
25

r.
7
131131141
131131131131131131130
'44 130130130130130130130130130130130130130130130110
._130n29129129129129J29
'129129129129.
129129
. 12912912'9-FORTRAN129 FORTRAN127 FORTRAN127 FORTRAN'127 FORTRAN127 FORTRAN127 FORTRAN
'127 FORTRAN127 FGRTRAN127 FORTRAN127 FORTRAN127 FORTRAN127 FORTRAN127 FORTRAN127 FORTRAN12/ FOkTRAN
FOgTRAN CDC 3300/C53 TIMEFORTRAN CDC 3300/053 TIMEFORTRAN CDC 3300/053 TIMEFORTRAN CDC-3300 /0S3 TIMEFORTRAN CDC 3300/C53 TIMEFORTRAN. CDC 3300/O53 TIMEFORTRAN ' CDC 3300/053 TIMEFORTRAN , CDC 3300/C53 TIMEFORTRAN CDC 3300/053 TIMEFORTRAN CCC 3300/CS3'TIMEFORTRAN CDC 3300/053 TIME.FORTRAN COC,3300/053 TIMEFORTRAN CCC 3300/CS3 TIMEFORTRAN CDC 3300/CS3 TIMEFORTRAN CDC 3300/C53 TIMEFORTRAN CDC 3300/CS3 TIMEFORTRAN CDC 3300/053 TIMEFORTRAN CDC 3300/C53 TIMEFORTRAN CQC 3300/G53 TIMEFORTRAN CDC 3300/053 TIMEFORTRAN CDC 3300/C53 TIMEFORTRAN COC 3300/C53fTIMEFORTRAN CDC 3300/C53 TIME
CDC 3300/C53 TIMEFORTRANFORTRANFORTRANFORTRANFORTRANFORTRANFORTRANFORTRANFORTRANFORTRANFORTRANFORTRANFORTRANFORTRAN
CCCCDCCDCCOC'CDCCCCCDCCDCCDCCDCCDCCDCCDC
FORTRAN- CDCFGRTRAN CCCFORTRAN CCCFORTRAN, CDCFGRTRAN tocFORTRAN CDC
CDCCDCCDCCDCCOCCDCCDC'CDC
CDCCACCDCCDCCDC.
CCCCDCCDC
SERIES ARANOSERIES ARANOSERIES ARANOSERIES ARANOSERIES ARANOSERIES ARANOSERIES ARANOSERIES ARANOSERIES ARANOSERIES ARANOSERIES ARANOSERIES ARAND"SERIES ARANOSERIES' ARANOSERIEVARANDSERIESSERIESSERIESSERIESSERIESSERIESSERIESSERIESSERIES
ARANOARANOARANOARANOARANOtRANDARANOARAk0ARANO
TCROPLTTFCRM1 ,
TFORM2,TIMSPCTLOGPLTTNOIZTTPHAPLTTPLTFRQTPLTSPCTRISMOPCLRTRGLYDVPROPLTPSQRTRANDMRUFFTRESPONREVERSRPLACERRVERSSARIT ,
BERGENSHAPESINTR
3300/0S3 TIME SERIES ARANO 403300/C53 TIME SERIES ARANDSPEC3300/C53 'TIME SERIES. 'ARANO SPECT13300/0S3 TIME SERIES ARANO SPECT23300/C53 TIME SERIES ARANDFFIN3300/0S3 TIME SERIES ARANO FOLD ,
3300/C53 TIME SERIES ARAND.FCURTR3300/C53 TIME SERIES ARANO FCUSPC3300/C53 TIME SERIES ARANO FGUSPC-1-3300/C53 TIME SERIES ARAM FOUSPG23300/CS3 TIME SERIES ARANO FRESPON3300/53 TIME SERIES ARANO ,APH3300/G53 TIME SERIES ARANO GENERk3300/053 TIME SERIES ARAND.GENER23300/053TIME SERIES:ARANO (ENER33300/CS3 TIME SERIES ARANO LCGFLOT3300/053 TIME SERIES ARANO NO12T3300/C53 TIME SERIES ARANO PhAPLT3300/G53 TIME SERIES ARANO FLTFOR3300/C53'TIME SERIES ARANO PLTFRQ3300/C53 TIME SERLES ARANO PLTSPC3300/053 TIME SERIES ARANO CCORR'3300/C53 TIME SERIES ARANO CONPLT3300/0S3 TIME SERIES ARAK0g6AMUCT1300/053 TIME SERIE9 ARAKU1LCAVID3300/053 TIME SERIES ARANO CCNFID 13300/C53 TIME SERIESARAND-CONMODE3300 /CS3 TIME SERIES' ARAND,11LCPH3309 /C53TIME SERIES ARANO COSTR3300/053 TIME' SERIES ARANO (.FEES3300/C53 TIMESERIES ARANO CPLT13300/C53 TIME SERIES ARANO CPLT23300/C53 TIME SERIES ARANO CRCPLT3300/C53 TIME SERIES ARA ROSS3300/053 TIME SERIES AR ND CUSID
196
206
N
>.

4 4,
127 FORTRAN128 FORTRAN128 FORTRAN128 FORTRAN128' FORTRAN'128 FORTRAN128 FORTRAN128 FORTRAN128 FORTRAN128 FORTRAN128 FORTRAN128.FORTRAN,128 FORTRAN128 FORTRAN
' 128 FORTRAN128 FORTRAN132 FCRTRAN132 FORTRAN132 FORTRAN132 FORTRAN132 FORTRAN132 FCRTRAN132 FORTRAN132 FORTRAN132 FORTRAN132 FORTRAN132 FORTRAN132 FORTRAN132 FORTRAN126 FORTRAN126 FORTRAN126 FORTRAN126 FORTRAN126 FORTRAN126 FORTRAN126 FORTRAN126 FORTRAN126 FORTRAN126 FORTRAN133 FCRTRAN14 OUTRAN51 FORTRAN123 FCRTRAN 63 CDC 3600.13 FCRTRAN CDC 360013 FORTRAN CDC 3600
116 FCRTRANIV 'Cad 3660116 FORTRAN CDC 360012 FORTRAN 63 CDC 360047 FORTRAN CDC 360047 FORTRAN CDC 360047 FORTRAN CDC 3600107 FORTRAN CDC 3600104 FORTRAN 63 CDC 38C0101 FCRTRAN .63 CCC 3800120 FORTRAN CDC 3800100 FORTRAN 63 CDC 3800100 FORTRAN 63 CDC 3800100 FCRTRAK 63 CCC 3800100 FORTRAN 63 -CDC 3800
0CDC 3300/053 TIME SERIES ARANO CUSFCCDC 3300/053 TIME SERIES ARAM) CZTCDC 3300/C53 TIME SERIES ARAND DATPLTdDC 3300/C53 TIME SERIES ARAND LEMOD1 .
CDC 3300/C53 TIME SERIES ARAND OEMOD2CDC 3300/053 TIME SERIES ARAND DEMOD3CDC 3300/C53 'TIME SERIES ARM) CETRNDCDC 3300/053 TIME SERIES ARANO CIFF12CCC 3300/C53 TIME SERIES ARAND EUREKACDC 33.00/053 TIME SERIES. ARANO EXSMCCDC 33-00/043 Tr14E SERIES ARAND FFINICDC 3300/643 TIME SERIES ARAND FFTCNVCDC'9300/0S3 TIME SERIES ARAND FFTPSCCC 3300/C53 TIME SERIES ARAND FFTSCDC 3300/0S3 TIME SERIES ARAND FFTSPCCDC 3300/053 TIME SERIES ARAND FILTER1CDC 3300/C53 TIME SERIES ARAND TSGENCDC 3300/C53 TIME SERIES ARAND ISPECT1CDC 3300/053 TIME SERIES ARANO ISPECT2CDC 3300/053 TIME SERIES ARAND TRANFRCDC 3300/0S3 TIME SERIES ARAND TRANFRMCDC 3300/C53 TIME SERIES ARANO ITYCON-CDC 3300/C53 TIME SERIES ARAND ITYKUMCDC 3300/053 TIME SERIES ARAND WNLEAVCDC 3300/C53 TIME SERIES ARAND USESCDC 3300/C53 TIME SERIES ARANC 44SFOCDC 3500/CS3 TIME SERIES ARAN() LSIDCDC 3300/C53 TIM SERIES ARAND USPECCC 3300/053 TIME SERIES ARANO WINDOWCDC 3300/053 TIME SERIESARAND ACFFTCDC 3300/C53 TIMES SERIES ARANO ACCRRCDC 3300/043 TIME SERIES ARAND ACRPLTCDC 3300/053 TIME SERIES ARAND ALIGNCDC 3300/053 TIME SERIES ARANO AMPACOCDC 3300/C53 TIME SERIES ARM ARMAPCCC 3300/C53 TIME SERIES ARAND AUTOCDC 3300/053 TIME SERIES ARAND AUTOPLTcpc 3300/053 TIRE SERIES ARANO AXISLCDC 33.00/C53 TIME SERIES ARANO CCFFTCDC-3300/d53 TIME SERIES ARAND 0INDCM1CDC 3300/053 TIME SERIES ARANO FIVET.CDC 3600 SPECIES AFFINITIES REGROUP
VERTICALLY ANALYZED CCNTOURS YACOTSCONVERTS STC dATA RDEDTPCORRECTS STC DATA TPMCDPLCTTING PRCGRAM FRCFLX Y PLOTS MLCPAKVERTICAL SECTIN PLCTS ESTPACPLCTS TRACK ANS, DATA PROFILE TRACKGECDATAMAGNETIC SIGNATURES MAGPLOTANNCTATED TRACK ON STEREOGRAPHIC PRCJECTIONGRASS UNDERWATER ACOUSTICS PREDICTION RAPLCTGRASS UNDERWATER ACCUSTICS PREDIOS.I5N LCSSPLOTLINE PRINTER PLCTSGRASS UNDERWATER ACOUSTICS PREDICTICK CTSTCVGRASS UNDERPTER ACCUSTICS PREDICTION VFCGRASS UNDERWATER ACCUSTICS PREDIGfICh CTCURGRASS UNDERWATER ALCUSTICS PREDICTION PRFPLI
4-,
207
197
fr

a
100 FORTRAN 63 CDC 3800 GRASS UNDERWATER ACCUSTICS PREDICTION'SERPENT89 FORTRAN' CDC 3800 MIE SCATTERING,COMPUTATIONS16 FORTRAN CDC 380 INTERNAL GRAVITY WAVES DISPER107 FORTRAN CDC 3800 ANNCTATED TRACK ON STEREOGRAPHIC PROJECTION47 FORTRAN CDC 3800 PLOTS TRACK AND'DATA PROFILE TRACK47 FORTRAN CDC 3800 GECDATA
/47 .FORTRAN CDC 38004 FCRTRAN
'
CDC 640078 FCRTRAN IV CDC 6400
MAGNETIC SIGNATURES MAGPLCTDATA NGT SYS FOR PHYS CHEM CATA OCEANSV'VECTCR TINE SERIES CURPLT6 i.
93 FORTRAN CDC 6400 HORIZCNTARANGE26 FCRTRAN CDC 6400 UPWELLING CSTLUPWL125 MS FORTRAN CDC 6400 TIME SERIES ANALYSIS PROGRAMS. TSAP125 FORTRAN IV CDC 6400 SCALAR TINE SERIES TEMPLT727 FORTRAN IV CDC 640087 FORTRAN CDC 6400
THREEDJMENSICNAL SIMULATICN PACKAGE AUDIPYRAKOMETER AND RADIOMETER TIME SERIES PrAD
Is
52 FCRTRAN IV CDC 6400 COMBINED CHLCRCPHYLL AND PRCDUCTIVITY24 FORTRAN IV CDC 6500 MULTILAYER HYDROCYNAMICNUMBERICAL MODEL88 FORTRAN IV CDC 6500 'HURRICANE HEAT POTtNTIAC MODEL24 FORTRAN IV CDC 6500 SINGLE LARGE HYCRCLYNAMICALNUMERICAL MCDEL14 FCRTRAN EXT CDC 6500 CCEANCGRAPHIC CATA COMPUTATION TPCONV85 FORTRAN IV CDC 6500 * FRENCH SPECTRCANGLLAR WAVE MODEL93 FCRTRAN IV CDC 6500 NORMAL MODE CALCULATICNS NORMOD 3.76 FORTRAN CDC 6500 SEARCH AND RESCUE PLANNING NSAR72 FCRTRANAV CDC 6500 THERMAL PCLLUTIGN MODEL75 FORTRAN CDC, ¢500 MEAN CRIFT RCUTINE15 FORTRA11 EXT CDC 6500 VARIANCE AND STANDARD DEVIATION SUMMARY1'1 FORTRAN kV. CDC 6500 CBJECTIVE THERNCLIKE ANALYSIS88 FORTRAN IV CDC -6500 OCEANATMOSPHERE FtEDBACK MCDEL17 FORTRAN IV CCC 6500 NET BLLB TENFERATURE WETBLA31 FORTRAN IV CDC 6600 DYNAMIC RESPCASE CF CABLE SYSTEM SNAPLG31 FORTPAN IV CDC 6600 CHANGES IN ELECTROMECHANICAL CABLE RAMSC
FCRTRAN IV CDC 6600 END RESPONSES IN ELECTRCMECHANICAL CABLE RACAC -
51 FORTRAN'IV CDC 6600 PRCDLCTIVITY CXYGEN.80 FORTRAN IV CDC 6600 HARMCNIC ANALYSIS CF DATA AT TIDAL FREQLENCIES'30 FORTRAN, IV CDC 6600 DEEP CCEAN LCAC HANCLING SYSTEMS DCLLS30 FORTRAN'M CDC 6600 LOAC NOTICN ANC CABLE STRESSES CAB130 FCRTRAN IV CDC 6600 SOIL TEST DATA' TR4AX30 FORTRAN ,IV -CDC 6600 DYNAMN,STRESS AESPCKSE OF LIFTING LINES CABANA14'8 FCRTRAN IV CDC 660d REPRCCIKE ANDtEPNLIZE0DECK 'NAPE P
57 FORTRAN CDC 6600 A GEKERALIZEC EXPLLITp POPULATION SIMULATCR123 FORTRAN IV CDC 6600 i XY PLOTS E8TRLT123 FORTRAN CDC 6600 DISPLAYS VHRR SATELLITE DATA V5DMDI46'FORTRAN 63 CDC 6600 HYDROGRAPHIC CATA REDUCTION TWO FIVE142 FCRTRAN IV CDC .660C CHECKS ANGLES TWOIPI82 FORTRAN IV CDC 6600 HURRICANE STCRM SURGE FORECASTS SPLASH I82 FORTRAN IV CDC 6600 HURRICANE STCRM SURGE FORECASTS SPLASH II57 FORTRAN CDC 6600 GENERALIZEC STOCK PAODUCTIOK MODEL PRODFIT38 FORTRAN IV CDC 6600 CONVECTION INVARIAalt VISCOSITY FLUID CCNVEC
.17 FORTRAN CDC 6600 INTERNAL WAVE OSCILLATICNS ZMODE2 FCRTRAN IV \ CCC 6600 STD DATA PRCCESSIN6
52 FORTRAN IV\CDC 6600 SPECIES DIVERSITY JCB*52 FORTRAN IV CDC 660024. FORTRAN IV C0C'7600
, PRODUCTIVITY ECOPRLDMULTILAYER HYDRODYNAMICALNUMERI AL MCDEL
83'FORTRAN IV CDC 7600 FRENCH SPECTRCANGLLAR WAVE MODECuC CPTIMIZED MULTILAYER HN MODEL75 FORAMFN 7600
17 FORIFAN, CDC 76,00 INTERNAL WAVE OSCILLATIONS ZMODE117 FORTRAN .CDC CYBER X Y PLOTS IN A FLEXIBLE FORMAT MEDS LC'l4-FORTRAN IV- CDC CYBER 74 DAILY SEAWATER CBStRVATIONS
A
198
208

r ,
.DIGITAL EQUIPM6T CORPORATION
'125 FCRTRAN 32 PDP-83 FORTRAN II' PDP-83 FORTRAN II PDP-8
118-FORTRAN5 FCRTRAN II
139 FORTRAN5 FORTRAN IV5.FORTRAN IV20 FORTRAN''20 FORTRAN20 FORTRAN20'FORTRAN20 FORTRAN
' GENERAL ELECTRIC
PDP-8PDP 8EPDP-9PDP 10POP' 10
PDP-11PDP-11PDP-11PDP.-11
139 FORTRAN II GE 225
HEhLETT- PACKARC
143 FORTRAN8 FORTRAN. IV3 FORTRAN IV HP 2100A
16 FORTRAN IV HP 2100S105 FORTRAN ty. HP 2100S107 FCRTRAN IV HP 2100S108 FORTRAN IV HP 21004108 FORTRAN IV HP 2100S108 FORTRAN IV HP 2100S108 PORTRAN IV HP 2100S108 FORtAN IV ,HP 2100S16 FORTRAN IV HP 2100S124 ASSEMBLY HP 2100S109 FORTRAN IV HP 2100S
2 FORTRAN HP 2115A1 FORTRAN HP 2115A
105 FORTRAN IV HP 3100A32 BASIC HP 9830A
TIME SERIES PLCTTfNGPLOTS STATION PCSITIONSPLOT THETA-S CURVESSECTION PLOTTINGMASS TRANSPCRT AND VELOCITIES GEOMASSBARTLETT'S CURVE FITTINGSTATICN DATA ThIRPTHERMCMETER CORRECTION THERMOMETRIC DEPTHGENERAL PURPCSETDITOR OMSECTIME SERIES INTO] 0CFILES DMSCHPAANDERAA CURREN/METER DATA AACALCURRENT PROFILER DATA MK2CALAPPENCS NEW CATA TO FILE DERIVE
CURVE FITTING CRVFT
HP 2100 THEROCMETER CCRRECTION DEPTH COMP HND1'HP 2100 STATION DATA HYD2
STC TABLES Aq PICTS STD .
THERMCMETER CATA FILE RANDIER THEAMOLORAN OR CGA CONVERSION GEPOSANNCTES CHARTBATHYMETRIC CR MAGNETICS CHART PROFLMERCATOR CHART DIGITIZATION ANTRKBATHYMETRIC CHART 4IGITIZNTION DGBTH,PLCTS ON STERECGRAPHIC CHART ANNCTPLCTS NAVIGATICK COA CCEANTHERMCMETRIC CEPTH CALCULATION CAST
-'PLOTTER CCMMANDS PLCT DVRICLONG EASE LINE ACCLSTIC TRACKINGSTD PROCESSING NET
( DIGITIZES SIC DATA CEEPCRUISE TRACK TMERCUNMANNEC FREE-SWIMMING SUBMERSIBLE
HP, 9830A UNMANNEC FREE- SWIMMING SUBMERSIBLE HCTEe LOADHP 9830A UNMANNEC FREE-SWIMMING SUBMERSIBLE PLOTHP MINI PLCTS NAVIGATICN WITH ANY OTHER DATA TYPE CEEP6
32 BASIC31 BASIC12Q FORTRAN IV
S
i
IBM-
51 FORTRAN IV IBM 36054 FORTRAN IV IBM 36054 FORTRAN IV IBM 360
'134 FORTRAN IV IBM 36024 FORTRAN IV IBM 360143 FCRTRAN IV IBM 360143 FORTRAN` IV IBM 36073 ANS FORTRAN IBM 36024 FORTRAN IV IBM 360
TCXICITY EICASSAY PROBIT ANALYSISSUCCESSIONSPECIES AEUKCANCETIME SERIES ANALYSIS BLACKYSINGLE LARGE HYDRO6YNAMICAL-NUMERICAL MCDELAREAL.CCNCENTRATION INTEGRATE ALNhEIGHTED AVERAGEb AVERAGEECOLOGICAL STATISTICAL PROGRAMS ECCSTATMATHEMATICAL WATER QUALITY MODEL FCR ESTUARIES
r
199
209

-N\
26 FORTRAN IV26 FORTRAN IV
116. FORTRAN
18
01BM 36O -
COMPUTATION CF FLOh THROUGH MASONBORO INLET NCCIRCU1ATICW IN PAMLICC SOUNC-DENDRCGRAPH
25 FORTRAN IV IBM 36.0 DYNAMIC DETERMINISTIC SIMULATION SIMUDELT54 FORTRAN IV IBM ,3,60 PIGMENT RATIC13 BASIC IBM 36,0 1NVIRCNMENTAt DYNAMICS SUBRCUTINESTCEANLIB13 BASIC IBM 360 GECSTROPAIC CURRENT22 FORTRAN IBM 360 CO2 AND DC SAT
k
£2 FORTRAN IBM 360 SPECIFIC CONDUCTIVITY WITH PRESSURE EFFECTL7 FORTRAN IV IBM 360 CBJECTIVE THERMOCLINE ANALYSIS'
112 FORTRAN IV IBM 360/30 ADJUSTS A STATE PLANE COORDINATE TRAVERSE28 FORTRAN IV IBM 360/40 MATHEMATICAL MODEL CF COASTAL UPWELLING86 FORTRAN IJBM 360/40 WATER WAVE TEACH MU AICS PRCFILEe6 FORTRAN 360/40 WATER' WAVE TEACHING AIDS REFL186 FORTRAN
immBM 360/40, WATER WAVE TEACHING AIDS FCRCE AND MCVENENT
135 FORTRAN IV IBM 360/40 SPECTRA PROGRAMS DETRND AUTCOV CRSCCV FCURTR85 FORTRAN .1pM.360/40 WATER WAVE TEACHING AIDS PRCF185 FORTRAN IBM 360/40 WATER WAVE TEACHING AIDS UMAX185 FORTRAN IBM 360/40 WATER WAVE TEACHING AIDS UTMAX1'65 FORTRAN IBM 360/40 WATER WAVE. TEACHING AIDS WMAX185 FORTRAN IBM 360140 WATER WAVE EACFING AIDS LEING1'85 FORTRAN IBM 360/40 WATER WAVE TEACHING AFOS DETRND85 FCRTRAN IBM 360/40 WATER HAVE TEACHING AIDS WTMAX285 FORTRAN IBM 360/40 WATER WAVE TEACHING AIDS UCFT185 FORTRAN IBM 360/40 WATER WAVE TEACHUNG, AIDS WCFT185 FORTRAN IBM 360/40 WATER WAVE TEACHING AIDS UTCFT185 FORTRAN IBM 360/40 WATER WAVE TEACHING AIDS WTCFT185 FORTRAN IBM 360/40 WATER WAVE TEACHING AIDS OtTCOV85 FORTRAN IBM 360/40 hATER WAVE TEACHING AICS CRSCOV85 FORTRAN IBM 360/40 WATER WAVE TEACHINC, AIDS FCURTR
° 85 FORTRAN IBM 360/40 WATER WAVE TEACHING AIDS EDSIT115 FORTRAN IV IBM 360/40 MAP PROJECTIONS AN& GRIDS MAP4 COBOL IBM 360/50 CONSISTENCY CF PHYSICAL. AND CHEMICAL DATA4 FORTRAN IBM 360/50 CONSISTENCY CF PHYSICAL ANC CHEMICAL DATA
122 QRTRAN IV IBM 360/61 PROFILE PLCTS TIME AXIS PRCFL3122 FCRTRAN IV IBM 360/61 PRCFILE PLCTS DISTANCE AXIS PFLDST122 FORTRAN IV IBM 360/61 MAP PLCTS PAPPLT41 FCRTRAN IV IBM 360/65 PLCTS PROFILES CF DATHYMETRY AND MAGNETIC
°150 FORTRAN IV IBM 360/65 FILE INCEPENCENT GEN APP SYS GAS GASCIPES150 FCRTRAN IV IBM 360/65 FILE INDEPENDENT GtN APP SYS GAS GASSAMFC150 FORTRAN IV IBM 360/65 FILE INCEPENCENT GtN APP SYS GAS GASEINV150 FCRTRAN IV IBM 360/65. FILE INCEPENCENT' GEN APP SYS GAS GASCCI °
150 FORTRAN IV IBM 360/65 FILE INDEPENCEINt GtN APP SYS GAS GASVPRT150 FORTRAN IV IBM 360/65 FILE INCEPENCENT GEN APP SYS GAS GVAREFRM150 FORTRAN IV IBM 360/65 FILE INDEPEINCEINT GEN APP SYS GAS CANADA150 FCRTRAN IV IBM 360/65 FILE INCEPENCENT GEN ARP SYS GAS GAS15,0 FORTRAN IV IBM 360/65 FILE INCEPENCENT APP SYS GAS GASVASLM150 PL/1 IBM 360/65 FILE INDEPEINCEINT GtN APP SYS GAS GAS THEM150 ASSEMBLER IBM 360/65 FILE INCEPENCENT GEN APIS` SYS GAS GASTHERM150 ASSEMBLER IBM 360/65 FILE INCEPENCENT GtN PP SYS GAS INCATA150 ASSEMBLER IBM 360/65 `FILE INCEPENCENT GEN APP SYS GAS CREATE,154 ASSEMBLER IBM 360/65 FILE INCEPENCENT GtN APP SYS GAS MONTH6C150 ASSEMBLER IBM 360/65 FILE INDEPEINCEINT GtN APP SYS GAS CHEM8O1'50 ASSEMBLER, IBM-360/65' FILE INCEPENCENT GEN APP SYS GAS DEPTH8C150 ASSEMBLER IBM 360/65 FILE INCEPENCENT GEN APP SYS GAS LATLCN80150 ASSEMBLER IBM 360/65 FILE INDEPENDENT GEN APP SYS GAS GASCRDER20 ASSEMBLER IBM 360/65 - TEMPERATURE CIFFERENCE CALCULATIONS-
N.
120 FORTRAN IBM 360/65 SEQLENTIAL PLOTTING144 FORTRAN IV IBM 360/65 JULIAN DATE CCNVERsICN ROUTINES JULIAN
y.
'no
210

.
144 FORTRAN IV144 FORTRAN IV
4...,. 144 FORTRAN IV144 FORTRAN IV124 FORTRAN IV124 FORTRAN IV14 FORTRAN IV14 FORTRAN IV14 FORTRANIV
1 4 FORTRAN -IV14 FCRTRAN IV114 FORTRAN IV138 FORTRAN IV.18 FORTRAN18 ASSEMBLER_18 FCRTRAN18 FORTRAN IV18" FORTRAN78 ASSEMBLER148 FORTRAN IV.38 FORTRAN IV153 ASSEMBLER153 ASSEMBLER
IBM 360/65 -IBM 360/65IBM 360/65IBM 360/65IBM 360/65IBM 360/.65IBM 360/65IBM 360/65IBM 360/65IBM 360/65IBM 360/45IBM 360/65IBM 360/65IBM 360/65IBM 360/65IBM 360/65IBM 360/65IBM 560/65IBM 360/65IBM 360/65IBM 340/065IBM 360/65IBM 360/65
° 153 ASSEMBLER IBM 360/65153 ASSEMBLER JBM 360/65153 FORTRAN IV IBM 360/65153 FORTRAN IV IBM 360/65153 FORTRAN IV IBM 360/65153 FORTRAN IV 'IBM 360/65153 PL/1 IBM 360/65153 PL/1 IB 360/65153 PL/1 IBM 0/65153 PL/1 IBM 360/6'5103 FORTRAN IV IBM 36023 FORTRAN IV ,IBM 360/65113 FORTRAN IV ABM 360/65113 FORTRAN IV IBM 360/65113 FORTRAN IV 'IBM 360/65113 FgATRAN IV IBM 360/65'113 FCRTRAN IV IBM 360/65113 FORTRAN IV IBM 360/65113 FORTRAN IV IBM 360/65
IN
. ,
JULIAN DATE CC VERSION ROUTINES JULYANJULIAN DATE CONVERSION ROUTINES JULSEC,JULIAN CATE CC VERSION ROUTINES CESLUJ,DAY OF THE hEEK NDAYWK' .,
OXYGEN PHCSPI-ATE DENSITYPLCISGENERAL MERCATOR PLOT .
NOS SCIENTIFIC SUBROUTINE SYSTEM LCRAN' NOS SCIENTIFIC SUBRCUTINE',SYSTEM OMEGA
NCS SCIENTIFIC SUBRCUTINE SYSTEM SOCINNOS SCIENTIFIC SUBROUTINE SYSTEM SODPNNOS SCIENTI IC SUBROUTINE SYSTEM TPFIXNOS SCIENTIFIC SUBRCUTINE SYSTEM UTMCO ,
FITS A SMCC't CURVEISENTROPIC KTERPCLATINPOTENTIAL TEMP AND/OR DENSITY POTDENSIGMAT r
,L -
DYNAMIC DEPTH ANOMALY DYANCMSALINITY FRCP CONDUCTIVITY T P SALINESURFACE CURRENT SUMMARY SUFCURFLAGS SUSPICICUS DATAVALUES EDIT() r :GRAVITATICNAL ATTRACTICN MCDIMENSIONAL BCDIES .
RETXET,,,:'
.
XBTCCNV ...
RETETBTLISTCXBSELECTX,BPSINVkBGEosupCANwMCBTGECIV 6.SCHNINESCPULTtDRYLANDASTRCNOMIC PC5ITION AZIMUTH METHODWATER ChEPISTRY DILLECTRIC:CONSTANTNOS SCIENTIFIC SUBROUTINE SYSTEM ANGLENOS SCIENTIFIC SUBROUTINE SYSTEM ANLISNCS SCIENTIFIC SUBRCUTINE SYSTEM APCTNNOS SCIENTIFIC SUBROUTINE SYSTEM APC,NNNCS SCIENTIFIC SUBRCUTINE SYSTEM APOLYNps SCIENTIFIC SUBROUTINE SYSTEM CGSPCNCS SCIENTIFIC SUBRCUTINE SYSTEM CUBIC;
113 FORTRAN IV IBM 360/65 NOS SCIENTIFIC SUBROUTINE SYSTEM EXCEB113 FCRTRANAV IBP.360/65 NOS SCIENTIFIC. SUBROUTINE SYSTEM GMLIC113 FORTRAN IV IBM 360/65 f81. SCIENTIFIC SUBRCUTINE SYSTEM HIFIX19 FORTRAN c-. IBM 360/65 VO LME TRANSFCRT FUNCTION QFUN ,
15 FORTRAN IV IBM 360/65 PCTENIIAL TEMP AND CENSIJY POCANS \....,)19 FORTRAN IV IBM 360/65 , VGLUME TRANSPCRT VCLTRN19 ,FORTRAN IV IBM' 360/65 CONFUTES PRESSURE PRESSR139 FORTRAN IV IBM 360/65 FITS ROLYNCPIAL P3TERM .
136 FORTRAN IV IBM 360/65 EXTENCED NCRNAL SEPARATOR PROGRAM ENORMSEP'25 FORTRAN IV IBM 360/65 MIT SALINITY INTRUSICN PRCGRAM,103 FORTRAN IV IBM 360/65 PLOTS MAPS c7os TRACKS MAP152 ASSEMBLER IBM 360/65 SbPRT2 -'152 ASSEMBLER IBM 360/65 SOSEL4CT .'
152 ASSEMBtER IBM 36C/65 SD2MSTCT152 ASSEMBLER: IBM 360/65 SD2SAMP152 ASSEMBLER IBM 360/65 MAKE120152 ASSEMBLER IBM 360/65 DEPTH.
201
211

152 ASSEMBLER 'BM 360/65 CRUCON152 ASSEMBLER IBM 360/65 COOCCCNV152 ASSEMBLER IBM 360/65 SUPERSET152 ASSEMBLER BM 360/65. SDPASS
.. 152 ASSEMBLER BM 360/65 XDRDER152 ASSEMBLER IBM 360/65 XBICCLNT152 FORTRAN IBM 360/65 XBTQKCUT152 PL/1 N, IBM 360/65 SDGECIV152 PL/1
aIBM 360765 XBEVALU
152 PL /,1 IBM 360/65 XBCURV152 PL/1 IBM 360/65 XBFNWC152 PL /1 ;,IBM 360/65 XBTN M
142 FORTRAN IV "IBM 360/65 CHECK- NGLES TWDPI122 FORTRAN IV IBM 360/65-, PLCTS SCATTERGRAM sCIGP4 SCTGMS22 FORTRAN IV. IBM 360/65 PERCENTAGE SATURATACN CF OXYGEN IN ESTUARY25sFORTRAN LV IBM 360/65 MIT SALINITY INTRUSIGN PRCGRAM115 FORTRAN IV IBM 360/65 CCMPUTE GREAT CIRCLE PATH GCIRC144 FORTRAN IV' IBM 360/65 JULIAN CAY'CCNVERSICN JDAYWK144 FORTRAN IV IBM 360/65 JULIAN CATE CCNVERSICN ROUTINES JULDAY
7 FORTRAN IV IBM N)0/65 REAL CALC INTERP STATICN DATA CAPRJCORNee.17 FORTRAN IV IBM 360/.65 STATICN DATA CALCULATICNS F3
147 FORTRAN IV IBM 360/65 REACS NCDC STATION DATA 7APE,8 FCRTRAN IV IBM 36C/65' PLCTS STATICN CAT.A PLTEDT8 FORTRAN IV 'IBM 360/65 CALCULATES STATION DATA SECPG
97 FORTRAN IBM 360/65 SCUKC VELCCITY WILSONS FORMULA WLSNC97 FORTRAN IBM A0/65 SOUND Vp_CCITY WILSONS FORMULA SVELFS97 FCRTRAN IBM 360/65 SOUND VLCCITY WILSONS FORMULA VELPRS141 PL/1 IBM 360/65, 'LINEAR INTERPCLATICN LININT141 PL/1' IBM 360/65 LAGRANGIAN TFREE PCINT INTERPOLATION LAG3PT141 FORTRAN IV IBM 360/65 CALCULATES SPLINE LCEFFICIENT SPLCGF141 FORTRAN IV IBM 360/65 INTERPOLATING ,EY CLBIC.SPLINE151 FORTRAN LV IBM 360/65 FILE INEEPENCENT GEN APP SY GAS ALTERGAS151 FORTRAN IV IBM 360/65 FILE INCEPENCENT GtN APP S S GAS GASB .
151 FORTRAN IV IBM 360/65 FILE INDEPENCENT GEN .APP S GAS NDOCSQ . .
151 FORTRAN IV IBM 360/65 FILE INCEPENCENT GEN APPSYS GAS NAMES%151 FORTRAN /V IBM 360/65 'FILE INDEPENCENT GIN APP SYSGAS SC2 GAS,151 ASSEMBLER tam. 360165 SDRETV '
151 ASSEMBLER IBM 360/65 SO2TCSa1151 PL/1 IBM 360/65 SD2CHAR .
4 FORTRAN IV, IBM 360/65 MARINE GECPHYSICAL DATA REDUCTICNFORTRAN IV IBM 360/75 ' AVE, EGITCM VELCCITY
4 COBOL rBM 360/85 DATA MGT SYS FOR PHYS CHEN DATA CCEZNV4 PL/1 IBM 360/85 DATA MGT SYS FOR PhYS CHEM' DATA DCEANSV84 FORTRAN IBM 360/165 NAVE INTERACTICN WITH CURRENT CAPGRAY74 PL/1 IBM 360/168, DRIFT BOTTLE/STATISTICS74 PL/1 IBM 360/168 DRIFT BCTTLE FLCTS -- - ,,74 PL/1 , IBM 360/16880 FORTRAN IV IBM 360/19580 FORTRAN 6C IBM 360/155
123 FORTRAN IBM 360/19582 FGRIIRAN IV IBM 360/155.
482 FORTRAN IV IBM 360/19528 FORTRANV IBM 37028JORTRAN IV IBM 37073 ANS FORTRAN IBM 370
116 FORTRAN IBM 370136 FORTRAN IV IBM 37056 FORTRAN IV IBM 37056 FORTRAN IV IBM 370
REFORMAT ANC SORT ORIFT BCTTLE DATAASIR-GNOMICAL TIDE PRtOICTIQNTIDES IN THE CPEN SEAMICROFILM PaTS.OF VHRR SATELLITE DATAEAST COAST STCRM SURGEWAVE FORECASTSESTUARINE CHEMISTRY MYACHEMESTUARINE TICESeCOLGGICAL STATISTICAL PROGRAMS ECCSTATDENCRCGRAPHPRCBABILITY CISTRIBUTICN WEIBUL,RESOURCES ALLCCATILN IN FISHERIES MGT PISCESWATER RESCLVCES TEACHING GAME DAM
2Q2
212

54 FORTRAN IBM.37055 FORTRAN IBM370,
,...... 55 FOOJRAN. IBM 370* 153 FORTRAN IBM 370 v,
7 5.0 FORTRAN IBM 370 ., ..
28 FORTRAN.A IBM 370'155:25 FORTRAN' IBM 370/155' 24 FORTRAN IBM 370/16572PL/1 'IBM 370/168
0' ,83 PLO. IBM 370/180117-FORTRAN IV IBM 130'117 FORTRAN IV' 'IBN 130145 FORTRAN It, IBM 1130'
-135 FORTRAN 'IV ABM 1130\''' 135 FORTRAN IV IBM 1130
- - 146 FORTRAN VI ,IBM 1130' A6 FORTRAN IV IBM:1130
. 29 FORTRAN IN IBM 1130118 FORTRAN IV IBM 113038 FORTRAN IV 'IBM 113054 FORTRAN IV /IBM 113040 FORTRAN IV IBM1411130"1 FORTRAN IV/ IBM 1130
, .1 FORTRAN IV/ IBM 1130e 1 FORTRAN iy IBM 1130103 FORTRAN IV IBM 1130134 FORTRAA4 IBM 140191 FORTRAN 60 18M 16041- FORTRAN* I IBM 1420,
15 FORTRAN', A IBM 1620114_,SPS l'IBM 1620114 SPS IBM 1620-
. 79 FbRTRAN II IBM 162048 FORTRAN II IBM 1620'149 FCRTRAN , IBM 1800149"TORTRAN IBM ISOO134 FORTRAN IV IBM 1430084 FORTRAN IV IBM 1800104.FCRTRAN.IV IBM 1800
M104 FO 'IRAN' IVY IBM 1800 4'
104 FORTRAN1V IBM 180014:4, 37 FORTRAN IV IBM 1800
144 FORTRAN tBM 1800144 FORTRAN IBM 1800144 FORTRAN IBM 1800144 FORTRAN IBM 1800-103 FORTRAN
/ 135 FORTRAN,136-FORTRAN106 FORTRAN106 FPRTRAN106 FORTRAN105 FORTRAN IB
:105 FORTRANL45 FORTRAN. IBM145 FORTRAN IBM
IBM 1800IBM 1800IBM 1800IBM 1800BM 1800
18001800
00 '
0000'
145 FORTRAN IBM 1800145 FORTRAN IV IBM 1800
'142 FORTRAN IpM 1800/
'`a
CHLOROPHYLL CHLORPHYTOPLANKTCN POPULATION DENSITY)'SPECIES DIVERSITY ,
REFORMATTED S,TATIOJ' OUTPUT IBM 1OPTIMAL ECCSNSTEM YOLIbIES CEPMODELING AN COUR:FONDESTUARINE DENSITY CURRENTS AND SALINITY
'ESTUARINE NCACNRAMONTE CARLO SP LL TRACKERAARKVIAN'AKAL SIS OF TDF -14 WIND DATAPLCTS HYDRO CAST CATA PLOGPLOTS STD DATA STPG1REPUCTICN ANC CISPLAY CF DATrACQUIRED AT SEAANALYSIS CF NON- LINEAR RESPONSE URFACEMULTIPLE CISCRIMINANT ANALYSIS MULDATHERACAETEF CORRECTION TCHK2BEACH SIMULATION MODELBEACH MID NEARSAORE MAPS if-SPLOTS TEMPERATURE-SAUNIT? PSAL 1SEDIMENT GRAIN SIZE ANALYS,ISYIELC-PER fECRUIT RYLC MOMREDUOiTiON IIISPLAY STORAGE GEOPHYSICAL DATASTQ OCMPUTATICAS STP02HYDRO tAST_ACCAPMTATICAS
.TRANSPORT QCAPUTATIONS FROM ATMOSPHERIC PRESSURESATELLITE RISE AND SET TIMES -ALERT ASORTTWC-DIMENSICNAL AUTOCORRELATIONWIND CRIFT AND CONCENTRATION OF SEA ICE ICEGRIDTRANSPORT COMPUTATACNS FRCM ATMOSPHERIC PRESSUREINTERPOLATICK FOR OCEANOGRAPHIC DATACOMPUTES GECGRAPHIC,,CSITIOASLORAN t VERSICA2 -
ORCOESSES C&BRENT INSTRUMENT OBSERVATIONSSOIL ANC SECIMENt ENGINEERING TEST DATAFORMAT FREE INPUT SUBROUTINE QREADMETERS VS FATHOMS AATBLGENERATES ARBITRARY FILTER MILOWSHIPBCRNE WAVE RECCRDER ANALYSIS SBWROLCRAN/DECCA CCORPINATES CALCULATION HNAVLORAN/DECCA FILE INITIALIZATION HNV1GEODETIC DISTANCE AND AZIMUTH SDANOCABLE CONFIGURATIONDATE CALCULATIONS OAYWKGATE CALCULATIONS hADATDATE CALCULATICAS NXTDYDATE CALCULATIONS YSTOY'SATELLITE NAVIGATIO....5 0BARTLETT'S CURVE FITTINGCLUSTER ANALYSIS
,LORAN FIX LRFIXPLAN COURSE ANC SCHEDULE CRUISEARTH SPHERICAL SUOROUTINES ESTCH ESTC2 ESTPLPLOTS MERCATCR GRID CHART t'
_NAVIGATIONAL SATELLITE PASSES ALRTXJULIAN DAY SLBROUTIN-ES CLEJLJULIAN CAY SUBROUTINES CLJULTIME COAVERSICA DTIMECURRENT METER CATA RECUCTIONTRIGONOMETRY SUBROUTINES ASSUB SAS ASA
203
213

(
.107 FORTRAN IBM 1800 DEGREE CONVERSICNS DEGFR DEMI
.,,' -- 107 FORTRAN' IBM 18100 MERCATOR DEGREES DMRCT107 FORTRAN DBM 1800 MAGNETIC FIELC COMPCNENTS MAGFI98 FORTRAN '4BM 71074 LIGHT AND SOUNC INSTRUCTION B112 FORTRAN IBM 7074 ,.- SOUNDING NCI
. , 112 FORTRAN , IBM 074 'SINGLE INTEGRATION147 FORTRAN .IBM 7074 ,, SINGLE INTEGRATION45 FORTRAN IBM 7074. LIGHT AND SCUND INST4UCTION D
r',. , ---- 46 FORTRAN= IBM 7074 SEAKANT MAGNETIZATION4',
464bRTRAN -IBM 7074 .OBSERVATICN CRA,ING GRAVITY76 FORTRAN ;BM 7074 CURRENT METER TURBULENCE'139 FORTRAN ,ICBM 7074 daLEAST SCONES PLOT89 FIWRAN IBM 7074 SOLAR RADIATICN CONVERSION89 FORTRAN IBM 7074 WINC STRESS89 FORTRAN \ IBM 7074 TWC-DIMENSIONAL POWER SPECTRUM FOR SWOP II
.144 fORTRAh IBM 70. 74 BATHYMETRIC DATA RtDUCTIONA
14 FORTRAN IBM 7074 MCNThLY SCNIC LAYER DEPTH (
14'FORTR'AN IBM 7074 VERTICAL TEMFERATURE GRADIENTS40 FORTRAN ;V ,,IBM 7074 CONPUTATICN AND P,LCITING OF MAGNETIC ANCMALIES100 FORTRAN IBM,7074 CRITICAL ACOUSTIC RATIC
,1
. 110 FORTRAN II IB7,7074 INDIVIDUAL PCINT GENERATOR FUR MAP PROJECTICNS90 FORTRAN Ilim'7074 PRECICTION CF VERTICAL TEMPERATURE CHANGE90 FORTRAN IBM 7074 CLCUD CCVER ANC CAILY SEA TEMPERATURE111 FORTRAN II IB7 7074 INCIVIDUAL PCINT GENERATOR FOR DISTANCE111 FD8TRAN IB7 7074 GECDETIC CATLM REDUCTION111 FORTRAN IB7 7074 GE&DETIC PCSITICN COMPUTATION AND PLOT146 FORTRAN II IBM 794
9494 STATICN DATA REDUCTION SYNOP
52 FORTRAN IV IBM 7 CONCENTRATICNS PER SQUARE METER OF SURFACE135,FORTRAN IBM 7090 FOURIER ANALYSIS L101114.FCRTRAN IBM 7090 TWC-CIMENSfCNAL AUTCCCRRELATION104 MAD, IBM 7090 v GENERAL MAP PRCJECTICN104 MAD, IB% 7090 FINITE. MAP PRCJECTICN DISTCRTIONS,80 MO IBM' 7090, THEORETICAL RACIAL TIDAL FORCE91JORTRAN IV- IBM 7090-94 SEA ICE STUDIES WM91 FORTRAN IV. IEMP7090-94 SEA ICE STUCIES FLIP91 FORT AN IV- IBM 7090-94 SEA ICE STUCIES SALPR,
1N--1X191 FORT N IV BM 7090-94 SEA ICE STUDIES RITE146 FORTR pm 7094 STATICN DATA RECUCTION SYNOP' 53 FORTRAN IV IBM 7094 pHYTCPLANKTCN AMBERS VOLUME SURFACE AREA
0 53MAP . IBM 7094 PHYTOPLANKTCN NUMBERS VOLUME SURFACE AREA101 FORTRAN II IBM 7090 ACOUSTIC RAY TRACING
o
UNIVAC '
A
1*
138 FO 'RTRAN UNIVAC FITTING "LEAST SQUARES ISTANCE H*PERPLANE.
20 FORTIIAN--,-- ONIVAC 1106 APPENCS NEI CATA IC FILE ERIVE20. FORTRAN UNIVAC 14106 CONCATENATES SORTS SEGMEN tS OUTPUTS DMSCRT20 FORTRAN UNIVAC 1106 INTERPCLATES TC UNIFORM GRID MATRIX' 0120 FORTRAN UNIVAC 1106 TIME SERIES SIC OR PCM PROFILES PLSAC20 FORTRAN AJNIVAC 1106 INTERNAL WAVES IWEG20 FORTRAN, UNIVAC,1106 DYNAMICAL FIELDS INTERNAL WAVE RAYS CHRSEC20 FORTRAN UNIVAC 1106 AUTO ANC CRCSS SPECTRA TUKEY METHCD
x. ZO FORTRAN UNIVAC 1106 AUTO AND CRCSS SPECTRA POLARIZED %ORM CMXSPC20 FORTRAN UNIVAC 1106 AMPLITUDES PHASES LEAST SQUARES TIDES420 FORTRAN -UNIVAC 1106 METEOROLOGICAL FUO.AES METFLX /
20 FORTRA UNIVAC 1106 CRCSS CCVARIANCE MATRJX EMPEIGI101 FORTRAN IV 'UNIVAC 1108 SONAR IN REFRACTIVE WATER101 FORTRAN IV UNIVAC 1108 SCNAR IN REFRACTIVE WATER
204
211
0

4
10 FORTRAN .IV UNIVAC 1108 SORTS SOUND RAY DATA RAY SORT14 FORTRAN rV UNIVAC 1108 SMOOTHING DATA USING THE, CU8IC SPLthE1 1 FORTRAN.- UNIVAC 1108 OVERLAY PLCTTING CVLPLT
1 FORTRAN V UNIVAC 1108 REFORMATS DATA PLOTS TRACK CHART MASTRACK,110 FORTRAN - UNIVAC 1108 LORAN TO GECGRAPHIL AND/GECGRAPHIC TC LCRAN110 FORTRAN UNIVAC,1108 LORAN CCORCINATE CLMPUTATION -
110 FORTRAN UNIVAC 1'108 LORAN SKYWAVE CORRECTION50 FORTRAN IV UNIVAC 1108 INVERSE PROBLEM IN ECCSYSTEM ANALYSIS44 FORTRAN V UNIVAC 1108 LISTSGEOPHYSICAL DATA LISTP44 FORTRAN-1V UNIVAC 1108 .COURSE SPEED, EOTVCS CORRECTION LOXNAV44 FORTRAN IV UNIVAC 1108 CONVERTS GECPHYSkcAL DATA PhONEY44 FORTRAN IV UNIVAC I108 SPUND VELCCITY VARIATION AND NAVIGATION FATHOM99 FORTRAN V UNIVAC 1108 CONTIKUCUS GRADIENT RAY TRACING SYSTEM CONGRATS99 FORTRAN 'UNIVAC 1108 RAY PATH SC4310139 FORTRAN UNIVAC 1108 TEPOERATURE SALINITY CORRECTIONS CURVEFIT U15512109 FCRTRAN UNIVAC 1108 FAA PLC1109 FORTRAN UNIVAC 1108 DISTANCE ANC AZIMUTH CIRA,ZD1b9 FORTRAN UNIVAC 1108 PARAMETRIC NAP94 FORTRAN V UNIVAC 1108 8EAN PATTERNS AND wIDThS G8EAM94 FORTRAN V UNIVAC 1108 STATISTICS ACOUSTIC. MEASUREMENTS AND PREDICTIONS94 FORTRAN IV _UNIVAC-1108 1PROPAGATICN LCSS FAST FIELD PROGRAM94 FORTRAN II UNIVAC 11D8 8OTTOM. REFLECTIVITY34 FORTRAN V UNIYAC11108 800MERAKGeCCRER DESCENT /ASCENT TRAJECTCRIES34 FORTRAN V UNIVAC 1108 8UC*SHIP DYNAMICS34 FORTRAN V UNIVAC 1108 840Y-SYSTVO DYNAMICS34 FORTRAN V UNIVAC 1108 FIXED MIK LINE ARRAY DYNAMICS_14 FORTRAN V UNIVAC 1108 WATER CLARITY24 FORTRAN IV UNIVAC I108 THREE DIMENSIONAL ESTUARINE CIRCULATION MODEL134 FORTRAN IV UNIVAC.1108 SPECTRAL ANALYSIS OF TIME SERIES43 FORTRAN IV UNIVAC 1108 LISTS EVERY FUNCREDTH VALUE SNOOP44$TRAN IV IUNIVAC 1108 NAVIGATION CCMPUTATION.S TPNAV-43 RTRAN IV, UNIVAC 1108 EDITS GEOPHYSICAL CATA ZEDIT43 FORTRAN IV UNIVAC 1108 GEOPHYSICAL CATA CLNVERSION HANDY N93 FORTRAN V > UNIVAC 1108 NORMAL MODE FROPAGATICN MODEL 1.53 FORTRAN IV UNIPAC 1108 GENERATES ZOCPLANKTCN TAXONOMIC DIRECTCRY53 FORTRAN IV. UNIVAC 1108 DEEP,CCEAN ZCCPLANKTON DISTRI8UTION53 FORTRAN IV UNIVAC 1108 DEEP CCEAN ZCCPLANKTON POPULATION STATISTICS33 FORTRAN V UNIVAC 1108 CABLE TCWEC BUOY CCAFIGURATIONS IN A TURN33 FORTRANCV UNIVAC 1108 FREE-FLCATING'SPAR-ARRAY DYNAMICS3 V UNIVAC 1108 FREE-FLCATING SPAR -BUOY DYNAMICS
FtpRAN V UNIVAC 1108 SHIP SUSPENDED ARRAY DYNAMICS .
46 E RAN V UNIVAC 1108' TOWED SYSTEM DYNAMICS36 FORTRAN V UNIVAC 1108 TRAPEZCIDAL ARRAY DEPLOYMENT DYNAMICS16 FORTRAN V UNIVACk4108 STD -S /V DATA S204936 FORTRAN V UNIVAC 1108 EADY -STATE SU8SURFACE 8UOY SYSTM CCNFIGURATION36 FORTRAN V UNIVAC 1108 -TOWED ARRAY DYNAMICS
4. 76 FORTRAN V UNIVAC 1108 ,IN-SITU CUIplEKT76 FORTRAN UNIVAC 1108 WATER DISPLACEMENT DISPLA84 FORTRAN IV pNIVAC 1108 STbRP SURGE84 FORTRAN IV PNIVAC 1108 WAVE REFRACTICN46 FORTRAN IV UNIVAC 1108 CONVERTS DIGITIZER CATA DYGYT46 FORTRAN IV UNIVAC 1108 EDITS REDUCEC GEOPHYSICAL CATA EDIT42 FORTRAN-IV UNIVAC 1108 LISTS RAW DATA 2LIST42 FORTRAN IV UNIVAC 1108= PLOTS TRACKLINE QCKDRAW42 FORTRAN IV UNIVAC 1108 PLOTS CCNTOUR CROSSING INTERVALS DOU5LX42 FORTRAN IV UNIVAC 1108 PLUS GEOPHYSICAL CATA PLOT232JpRTRAN V UNIVAC 1108 STEADY. STATE TRAPEZOIDAL ARRAY CONFIGURATrOKS32 FORTRAN V UNIVAC 1108 ANCHOR LAST -EUO'f SYSTEM DEVELOPMENT DYNAMICS45 FORTRAN IV UNIVAC 1108 PATTERN FUNCTION CALCULATIONS
205
215

45 FORTRAN V45 ,FORTRAN45 FORTRAN V
UNIVACUNIVACUNIVAC
110811081108
RAYLEIGH1-PGRSE BOTTOM REFLECTION COEFFICIENTSPROPAGATICK.LCSSAMOS PRCPAGATICN LOSS
125 FORTRAN UNIVAC 1108 SPECTRAL ANALYSIS SUBROUTINES35 FORTRAN V UNIVAC 1108 FIXED THIN LIKE ARRAY STEADY STATE CONFIGURATION35 FORTRAN V. UNIVAC 1108 MARINE CORER DYNAMICS -35 FORTRAN V UNIVAC 1108 .STEADY-STATE BUOY SYSTEM CONFIGURATICN545 FORTRAN IV UNIVAC 1108 REGIONAL .FIELD RESIDUAL MAGNETIC ANOMALN GAMMA45 FORTRAN IV UNIVAC1108 GRAVITY' GAL45 FORTRAN IV *UNIVAC 1108 PLCTS PROFILES CF LEOPHYSICAL DATA DISPLOT37 FCRTRANV4 ONIVAC 1108 STEADY STATE CABLE LAYING37 FORTRAN V UNIVAC 1108 TOisEo ARRAY CONFIGURATIONS'37 FORTRAN V UNIVAC 1108 TRAPEZCIDAL ARRAY DYNAMICS,47 FORTRAN UNIVAC 1108 TRUE CC EAN CEPTH4,4TKR97 FORTRAN qUIVAC 1108 &cop VELCCITY FOR `MARINE SEDIMENTS77 FCRTRAN V UNNIC 1108 CUOWENT METER PRINT.77 FORTRAN V UNIVAC 1108 CURRENT ME;Ef PLOT77 FORTRAN V UNIVAC 1108 CONVERT CURRENT METER TAPE77 FCRTRAN V . UNIVAC 1108 CURRENT METER DATA //PRINT°138 FORTRAN V UNIVAC 1108 CURVE FITTING VELCCITY PROFILE NEWFIT48 FCRTRAN UNIVAC 1108 SEDIMENT SIZE46 tFORTRAN IV UNIVAC 1108 BCTTCP SEDIMENT DISTRIBUTION PLOT
XERCX CATA SYSTEMS,
.
41 FORTRAN IV XDS SIGMA 7 *MAGNETIC FIELD AFIELD10 FORTRAN IV XDS SIGMA 7 READS STATICK DATA10 FORTRAN IV XQS SIGMA 7 GECSTROPHIC VELOCITY, DIFFERENCE VEL10 FCRTRAN IV XDS SIGMA 7 VOLUME TRANSPORT VTR/0 FORTRAN IV XDS SIGMA 7 SIGMA-T SIGPAT ANC CSIGMT10 FORTRAN IV XDS SIGMA 7 ADIABATIC TEMPERATURE GRADIENT ATG10 FORTRAN IV XDS !SIGMA 7 'POTENTIAL TEMPERATURE POTEMP10 FORTRAN IV XDS SIGMA 7 SPECIFIC VCLUPE SPVOL50 FORTRAN IV XDS SIGMA 7 WHCI BICLCGY SERIES FTAPE50 XDS SIGMA 7 WHCI BICLCGY SERIES FLISHT50 FORTRA IV XDS:SIGMA7 WHCPOIELCGY SERIES CIKSPIT50 FORTRAN IV XDS SIGMA 7 'WHCI BICLCGY SERIES SELECT50 FORTRAN IV XDS SIGMA 7 WHOI BIOLOGY SERIES ChANAT.5C FORTRAN IV XD$ SIGMA 7 WHGI BICLCGY SERIES PREPLOTG50 FORTRAN IV 'XDS'StGMA 7 WHCI BICLCGY SERIES PLOTSPECG.50 FORTRAN IV XDS SIGMA 7 WHCI BICLCGY SERIES 'STATAB119 FORTRAN IV XD,S SIGMA? PLGT CF FREQUENCY DISTRIBUTION THISTO119 FORTRAN IV XQS SIGMA VELCCITY VECTCR AVERAGES VECTAV119 FORTRAN IV xps SIGMA 7 PROGRESSIVE VECTORS PROVEC119 FORTRAN IV xps SIGMA 7 PLCTS DATA ALCKG MACK119 FORTRAN IV XDS SIGMA 7 PROFILE VERSUS TIME OR DISTANCE
9 FORTRAN IV XDS SIGMA 7 DYNAMIC HEIGHT DYNHT9 FCRTRAN IV XDS SIGMA 7 POTENTIAL ENERGY ANOMALY PEN9 FORTRAN IV ,XDS SIGMA 7 VARIOUS PARAMETERS FRCM STATION DATA OCCCMP9 FORTRAN IV ,XDS SIGMA 7 SPECIFIC VCLUPE ANCMALY SVANOM9 FORTRAN IV, XDS SIGMA 7 PRESSURE SUBRCUTINE PRESS
38 FORTRAN IVI XDS SIGMA 7 X-RAY DIFFRACTION ANALYSIS39 FORTRAN IV XDS SIGMA, 7 MAGNETIC ANCPALIES MAG2D136 FORTRAN IV XDS SIGMA, 7 STATISTICS FRCP WHCI FCRMAT STATS106 FORTRAN 1g )(QS SIGMA 7 SUM OF FINITE ROTATIONS ON A SPHERE SUMROT105 FORTRAN I XDS SIGMA 7 JRANSFERMATICK CF SPHERICAL COORDINATES ROTGUT143 FGRTRAN'IV XDS SIGMA 7 THERMOMETER CORRECTION TCPL
6 FORTRAN IV XDS SIGMA 7 FLEXIBLE SYSTEM BIL PHYS CIJEM DATA SEDHYP
206
1
216
Wm-

o
6 FORTRAN IV XDS SIGMA 7 SUBROUTINES PhYS ChEM 810 PARAMETERS6 FORTRAN IV XDS SIGMA 7 INTERPOLATICh SUBROUTINES
97 FORTRAN IV XDS SIGMA 7 SOUND VELCCITY SONVEL97 FORTRAN IV XDS SIGMA 7 DEPTH CORRECTION MTCOR SOUND VELOCITY77 FORTRAN IV XDS SIGMA 7 CURRENT METER CLOCK SEQUENCE XTAL-118 FORTRAN IV XOS SIGMA 7 HORIZCNTAL HISTOGRAMS HISTO118 FORTRAN. IV XDS SIGMA 7 PRINTER PLCTS LISPLO-148 FORTRAN IV XDS SIGMA 7 EDITING FCR hHCI RAMAT SCRUB
8 *FORTRAN IV XDS SIGMA 7 BRUNTVAISALA FREQtjENCY OBVFRQ78 FORTRAN IV XDS SIGMA 7 CURRENT METER CALIBRATION CASDEC78FUTRAN LV XDS SIGMA 7 CURRENT MET 4R DATA REDUCTION AND EDITING CARP
11/
147 FORTRAN IV XDS SIGMA 7 CONVERTS hCPC4.FORMAT DATA TC.ND0 FORMAT147 FORTRAN IV XDS SIGMA 7 CONVEFTS DATA TO BNDO FORMAT TRANSCOD147 FORTRAN IV XDS SIGMA 7 READS BhDC FORMAT LATA LSTA 1142
I FORTRAN IV XDS SIGMA 7 PROCESSES STC AND CTD DATA SEDSTD102 FORTRAN IV XDS SIGMA 7 RAYTRACE
r:,
207
21 7r
bt.
,

INSTITUTION INDEX4 4
, .2)a
AR1PrOORPS OF ENGINEERS, COASTAL ENGINEERING RESEARCH CENTER, .
R4.BELVON, VA : A
'84 FORTRAN IV UNIVAC 1108 STORM SURGE.
. 84 FORTRAN IV UNIVAC Iro8 WAVE REFRACTION
?!
0
ARTHUR D LNTLE INC, CAMBRIDGE, MA
,101 FORTRAN II IBM 77
1090'
ACOUSTIC RAY TRACING134 FORTRAN. IBM 090 TWO-DIMENSIONAL AUTOCORRELOTION134 FORTRAN ,IBM .401. ' TWO-DIMENSIOpt AUTOCORRELATION
BN00, CENTRE NATIONAL POUR L'EXPLOITATItA CES OCEANS, FRANCE '
,
XDS SIGMA 7 CONVERTS NOCC FORMAT,DATA TG BNOO.FORMAT"XDS SIGMA 7. CONVERTS DATA TO BNDO FORMAT TRANSCODXDS SIGMAq READS BNDC FORMAT DATA LSfA 1142i ,
XDS SIGMA 7- FLEXIBLE SYSTEM BIG PHYS CHEM DATA sumyriXDS .SUMA.71/4,., SUBROUTINES FhYS CHEM BIO,PARAMEJEWSXDS SIGKA 7 INTERPOLATION SUBRCUTINES,XDS SIGMA 7 PROCESSES STC,AND GTO DATA SEOSTO
BCO,NAGIONAL DE CACOS OCEANOGRAF4CCS, BRAZIL
28 FORTRAN IV IBM 36/40 , MATHEMATICAL MODEL OF COASTAL UPWELLING.
147 FORTRAN IV147 FORTRAN IV14711.FORTRAN IV6 FORTRAN IV'6.FORTRAN IV6 FORTRAN IV7 FORTRAN IV
'1ACFORD INSTITUTEGFOtEANOGRAPHY, CANADA
138 FORTRAN 1 CDC 3X00139 FORTRAN II GE 225118 FORTRAN CDC 310014eFORTRAN. PDQ -8
2' FORTRAN II CDC 31003 FORTRAN. II CDC 31003 FORTRAN II3 FORTRAN II CDC 31003 FORTRAN II CDC 31003 FORTRAN II PDP -8
3 FORTRAN II CDC 3150r- 6 3.FORTRAN IV HP 2100A
125 - FORTRAN 32 CDC 3100125 FORTRAN 32 POP-8125 MS FaRTRAN CDC 6400125 MS FORTRAN CDC 3150.126 HS FORTRAN GOO 315022 FORTRAN, IV CDC 315047 FORTRAN IV CDC 3150TeFORTRAN .CDC 3150
LEAST SQUARES CURVE FITTING 2 3-8 CDIMENSIONg-CURVE FITTING CRVFT
1
SECTION PLOTTINGSECTION PLOTTINGSALINITY ANOMALY. ISACBPOXYGEN SATURATION OXYGEN, ANOMALY ISATBPPLOT THETA-S CURVES' ,
0
PLOT THETAS CURVES 0= PLOTS STATION l'OSITIONS
PLOTO4TION ROSITTONSNU4fIENT CONCENTRATION PEAKSSTD TABLES ANC PLOTS ST&TIME SERIES PLOTTING .
TIME SERIES FLUTINGTIME SERIES ANALYSIS PROGRAMS'TS
. TIME SERIES ANALYSIS PROGRAMS TS- TIME SERIES-ANALOG TO DIGITAL A
ALKALINITY ALCT 4 V%
GEOPHYSICAL-CA1A STORAGE ANCWETRIEVAL.GEOFILECURRENT METER DATA PROCESSING SY1/EM TICE
_CALIFORNIA DEPARTMENT OF WATER AESOURCES, SACRAMENTO, CA
4
116 FORTRAN CDC 3300 VERTICAL BAR GRAPHS
I
208
216
ti
S.

CENTRC ARGENTIODOE DATOS OCJANOGRAFICOS, _ARGENTINA -
iffiCBOL 'CALCULATICN CF THERMCMETRIC VALUES,.
4 COBOL IBM 360/50 CONSISTENCY OF PHYSICAL AND CHEMICAL DATA4 FCRTRAN IBM 360/50 CONSISTENCY CF PHYSICAL AND CHEMICAL DATA4 FORTRAN CALCULATICN OF THERMOMETRIC VALUES4 COBOL STATICN DATA SYSTEM FINAL VALUES4 FORTRAN ° STATICN DATA SYSTEM FINAL VALUES
COAST GUARD OCEANOGRAPHIC UNIT, WASHINGTOKI.CC
11 FCRTRAN IV11 FORTRAN IV11 FORTRAN IV,11 FCRTRAN.U.12 FORTRAN IV12 FORTRAN IV
CDC 3300'CDC 3300CDC 3300CDC 3300CDC 330aCDC 3300
CXYGEN CPLCT.CHLOROPHYLL CHLCSALINITY SALTYTEMPERATURE SALINITY CLASS VOLUME TSVOLMERMCMETER CCRRECTION THERZ,TRANSPORT XPCRT
COAST GUARD, ICE PATROL, NEW YORK, NY 41
91 FORTRAN IV CDC 3300 ICEBERG DRIFT ICE7PLOT
COLUMBIA UNIVERSITY, HUDSON LABORATCRIES, ccees FERRY, NY4
102 FCRTRAN RAY TRACING KLERERMAY USER LANGUAGE
. COLUMBIA UNIVERSITY, LAMGNTDOHERTY .GEOLOGICAL CBSERVATORY, PALISADES, NY
145 FORTRAN II IBM 1130 REDUCTICN ANC DISPLAY CF DATA'ACQUIRED AT'SEA135 FORTRAN IBM 7090. FOURIER ANALYSIS L101
.CORNELL UNIVERSITY, ITHACA, NY
143 FORTRAN IV IBM 360143 FORTRAN IV IBM 360.22 FORTRAN IBM 36054 FORTRAN IV IBM 36054 FORTRAN.IV IBM 360
154 FORTRAN IV IBM 360
AREAL CONCENTRATION INTEGRATEUNWEIGHTED AVERAGES AVERAGECO2 AND'OC SAT ""Issio.
P1GMENT'RATICSUCCESSIONSPECIES ABUNDANCE
ENVIRONMENTAL DATA SERVICE,. NATIONAL CCEANOGRAPHIC DATA CENTER, WASHINGTON, DC
138 FORTRAN IV IBM 360/65 FITS A SMCCTH CURVE./ 141 PL/1 LBM 360/65 LINEAR INTERPCLATION LININT141 PL/1 IBM 360/65 LAGRANGIAN THREE FEINT INTERPOLATION LAC3PT
_ 141 FORTRA)1 IV IBM 360/65 CALCULATES SPLINE COEFFICIENT'SPLCOF141 FORTRAN IV IBM 360/65 INTERFCLATING BY -6,BIC.SPLIKE97 FORTRAN IBM 360/65 SOUND VELCCITY WILSONS FORMULA WLSND97 FORTRAN IBM 360/65 SOUND VELCCITY WILSONS FORMULA SVELFS97 FORTRAN IBM `360/65 SOUND VELCCITY WItSCNS FORMULA %/ELPRS
150 FORTRAN DC IBM 360/65 FILE INDEPENCENT GEN APP SYS GAS GASDIPBS150 FORTRAN IV 1811360/65 FILE INDEPENDENT GEN APP SYS GAS GASSAMPC150 FORTRAN IV I10.1 360/65 FILE INCEPENCENT GEN APP SYS GAS GASEINV150 FORTRAN IV IBM 360/65 FILE IND_EPENCENT GEN APP SYS GAS GASCCI150 FORTRAN IV IBM 360/65 FILE INCEPENCENT GEN APP SYS GAS GASVPRT150 FORTRAN IV IBM 360/65 FILE INDEPENCENT GEN APP SYS GAS GVAREFRM
209
.2L
r--

.
-
'-- 150 FCRTRAN IV IBM 360/65 FILE INCEPENCENT GEN APP SYS.GAS CANADA150 FORTRAN IV IBM 360/65 FILE' NCEPENCENT GEN APP SYS;-GAS GAS150 FORTRAN IV IBM 360/65 FILE INCEPENCENT GEN APP SYS GAS GA9VASUM151 FORTRAN IV IBM 360/65 FILE INCEPENCENT GEN APP SYS GAS ALTERGAS151 FORTRAN IV IBM 360/65 fr FILE INDEPENCENT GEN APP SYS GAS GASB151 FCRTRAN IV IBM 360/65 FILE INCEPENCEN1 GEN APP SYS GAS-NOQCSQ151 FORTRAN IV IBM 360/65 FILE INCEPENCENT GEN APP SYS GAS NAMES151 FORTRAN IV IBM 360/65 FILE INDEPENCENT GEN APP SYS GAS SD2 GAS150 PL/1 IBM 360/65 FILE INCEPENCENT GEN APP SYS' GAS GAS THERM'150 ASSEMBLER IBM 360/65 FILE' NDEPENCENT GEN APP SYS GAS GASTFERM150 ASSEMBLER IBM 360/65 FILE INCEPENCENT GEN APP SYS GAS INDATA150 ASSEMBLER IBM 360/65 FILE INDEPENCENT GEN APP SYS'GAS CREATE150 ASSEMBLER IBM 360/65 FILE INCEPENCENT GEN APP SYS GAS MONTH8C150 ASSEMBLER IBM 360/65 FILE INCEPENCENT GEN APP SYS GAS CHEM80150 ASSEMBLER IBM 360/65 FILE INCEPENCENT GEN APP SYS GAS CEPTH8C150 ASSEMBLER IBM 360/0 FILE INCEPENCENT GEN APP SYS GAS LATLONe0150 ASSEMBLER IBM 360/65 FILE INCEPENCENT GEN APP SYS GAS GASCRDER151 ASSEMBLER IBM 360/65 SDRETV151 ASSEMBLER IBM 360/65 SD2TCSC1152 ASSEMBLER IBM 360/65 SDPRT2152 ASSEMBLER IBM 360/65 SUPERSEL152 ASSEMBLER IBM 360/65 SDPASS 4152 ASSEMBLER IBM 360445 XORCER152 ASSEMBLER IQM 360/65 XBTCCUNT153' ASSEMBLER IBM 36C/65 RETXET153 ASSEMBLER IBM 360/65 XBTCCNV
/153 ASSEMBLER IBM 360/65 RETET153 ASSEMBLER IBM 36C/65 BTLISTC
''.152 FCRTRAN IBM 360/65 XBTQKCUT153 FORTRAN IV IBM 360/65 XBSELECT153 FORTRAN IV IBM 360/65 XEMSINV153 FORTRAN IV IBM 360/65 XBGECSUP153 FORTRAN IV IBM 360/65 CANWMG151 PL/1 IBM 360/65 SD.2CHAR152 PL/1 IBM 360/65 SDGECIV152 PL/1 IBM 360/65 XBEVALU152 PL/1 'IBM 360/65 XBCCNV152 PL/1 IBM 360/65 XBFNhC152 PL/1 IBM 360/65 XBTNWSUM153 PL/1 IBM 360/65 BTGECIV153 PL/1 IBM 360/65 KHNINE153 PL/1 IBM 360/.65 SCPUL.TI/53 PL/1 ,
18 FORTRANIBM 360(65IBM 360/65
DRYLANDISENTROPIC INTERPOLATICN
18 ASSEMBLER IBM 360/05 POTENTIAL TEMP ANC/OR DENSITY POTDEN18 FORTRAN18 FORTRAN IV
IBM 360/65IBM 360/65
SIGMAT ,
DYNAMIC DEPTh ANOMALY CYANCPN-
18 FORTRAN IBM 360/65 SALINITY FRCP CONCUCTIVITY T P SALINE19 FORTRAN IBM 3/30/0 VOLUME TRANSPCRT FUNCTION QFUN15 FCRTRAN IV IBM 36C/65 POTENTIAL TEMP AND DENSITY PODENS19 FORTRAN IV IBM 360/65 VOLUME TRANSFCRJ VELTRNL9 FORTRAN IV IBM 360/65 COMPUTES PRESSURE PRESSR20 ASSEMBLER IBM 360/65 TEPFERATURESIFFERENCE CALCULATIONS115 FORTRAN IV IBM 360/65 COMPUTE GREAT CIRCLE PATH GCIRC115 FCRTRAN IV IBM 360/40 PAP PROJECTICNS AN, GRIDS NAP,78 ASSEMB4ER IBM 360/65 SURFACE CURRENT SUMMARY SUFCUR:
1*
210
., 2'0(

)4,
ENVIRCNMENTAL CATA SERVICE, NATIONAL GECPHYSICAL AND SOLAR- TERRESTRIAL DATACENTER, BOULDER, CO
41 FORTRAN IV IBM360/65 MARINE GECPHYSICAL CATA REDUCTION41 FORTRAN IV IBM 360/65 PLOTS PROFILES OF bATHYMETRY AND MAGNETIC
ENVIRONMENTAL CATA SERVICE, CENTER FOR EXPERIMENT CESIGN ANC CATA ANALYSIS,WASHINGTON, OC
a
139 FORTRAN IV IBM 360/65, FITS POLYNCMIAL P3TERM142 FORTRAN IV. IBM 360/65 CHECKS ANGLES ThOPI142 FORTRAN IV C006600 CHECKS ANGLES TWOPI122 FORTRAN IV IBM 360/65 PLCTS SCATTERQRAM SCTGM4 SCTGMS123 FORTRAN IV CDC 6600 X -Y PLOTS EBTPLT148 FdRTRAN IV CDC 6'600 REPRCCUCE ANC SERIALIZE DECK DUPE'148 FORTRAN IV IBM 360/65 FLAGS SUSPICIOUS DATA VALUES EDIT()144 FORTRAN IV IBM 360/65' JULIAN CAV CCNVERS1CN JDAYWK144 FORTRAN IV IBM360/65 JULIAN DATE CCNVERSION ROUTINES JULOAY144 FORTRAN IV IBM 360/65 JULIAN CATE CCNVERSION ROUTINES-JULIAN144 FORTRAN IV IBM 360/65 JULIAKtdTE CCNVERSION ROUTINES JULYAN144 FORTRAN IV IBM 360/65 JULIAN DATE CCNVERSION ROUTINES JULS1C144 FORTRAN IV IBM 360/65 JULIAN DATE CCKVERSICN ROUTINES CESLUJ144 FORTRANCIV IBM 360/65 DAY CF THE hEEK- NDAYWK17, FORTRAN IV CDC 6500 WET BULB TEMPERATURE WETBLA
.ENVIRCNMENTAL PROTECTION AGENCY, GULF BREEZE, FL
51 FORTRAN IV IBM 360 TOXICITY BIOASSAY PRCBIT.ANALYSIS
ENVIRONMENTAL RESEARCH LABORATORIES, PACIFIC MARINE ENVIRONMENTAL LABORATORY,SEATTLE, WA
125 FCRTRAN IV CDC 6400 SCALAR TIME SERIES TEMPLT787 FORTRAN' CDC 6400 PYRANCMETER AND RALICMETER TIME SERIES RAD.78 FORTRAN IV CDC 6400 VECTCR TIME SERIES CURPLT6,
ENVIRONMENTAL RESEARCH LABORATORIES, ATLANTICOCEANOGRAPHIC AND METECROLOGICALLABCRATCRIES, MIAMI, FL
17 FORTRAN CDC 6600 INTERNALliAVE OSCILLATICNS ZMODE17 FORTRAN CDC 3/600 INTERNAL NAVE CSCILLATIONS ZMODE42 FORTRAN IV UNIVAC 1108 LISTS RAW DATA 2LIST42 FCRTRAN IV UNIVAC 1108 PLCTS TRACKLIFE QCKDRAh42 FORTRAN IV UNIVAC 1108 PLCTS CCNTOLIR CROSSING INTERVALS DOUBLX42 FORTRAN IV UNIVAC 1108 PLOTS GEOPHYSICAL DATA PLOT243 FORTRAN IV UNIVAC 4108 LISTS EVERY HUNDREOTH VALUE SNOOP43 FORTRAN IV, UNIVAC 1108 NAVIGATICN CCMPUTATUNS TPNAV
\ 43 FORTRAN IV UNIVAC 1108 EDITS GEOPHYSICAL UATA ZEOIT43 FORTRAN IV UNIVAC 1108 GECFHYSICAL CATA CONVERSION HANDY44 FORTRAN IV UNIVAC 1108 LISTS GEOPHYSICAL DATA LISTP44 FORTRAN IV UNIVAC 1108 COURSE, SPEEC, ECTVCS CORRECTION LCXNAV44 FORTRAN IV UNIVAC 1108 CONVERTS GECPHYSICAL DATA PHONEY44 FORTRAN IV UNIVAC 1108, SOUND VELCCITY VARIATION AND NAVIGATION FATHOM45 FORTRAN IV UNIVAC'1108 REGICNAL FIELC RESICUAL MAGNETIC ANOMALY GAMMA45. FORTRAN IV UNIVAC 1108 GRAVITY GAL45 FORTRAN IV UNIVAC 1108 PLOTS PROFILES CF 6EOPHYSIDAL DATA DISPLOT46 FORTRAN IV UNIVAC,A108 CONVERTS DIGITIZER CATA DYGYT46 FORTRAN IV UNIVAC 1108. EDITS REDUCED GEOPHYSICAL DATA EDIT
S.
221
211

FISHIPES,RESEARCH BOARD OF CANADA, CANADA
117 FORTRAN IV IBM 1130117 FORTRAN IV IBM 1130118 FORTRAN IV IBM 1130146 FORTRAN'VI IBM 1130
1 FORTRAN I IBM 16201 FORTRAN IV' IBM. 11301 FORTRAN IV, IBM 11301 FORTRAN IV IBM 1130
FORTRAN HP 2115A2 FORTRAN HP 2115A
135 FORTRAN IV IBM 1130135 FORTRAN IV IBM 1130103 FORTRAN IV IBM 113054 RTRAN IV IBM 1130
PLOTS HYCRC CAST CATA FLOGPLOTS STD DATA STPO1PLOTS TEMPERATURE- SALINITY PSAL 1THERMOMETER CORRECTION TCHK2TRANSPORT COMPUTATIONS FRCM ATMOSPHERIC PRESSURETRANSPORT 'COMPUTATIONS FRCM ATMOSPHERIC PRESSURESTD COMPUTATICKS STP02HYDRO CAST CCMPUTATIONSDIGITIZES STC DATA CEEPSTD PROCESSING WETANALYSIS CP MCN-LINEAR RESPONSE SURFACEMULTIPLE DISCRIMINANT ANALYSIS MULDASATELLITE RISE AND SET TIMES ALERT ASORTYIELD PER RECRUIT RYLC BIOM
GEOLOGICAL SURVEY, NATIONAL CENTER, RESTON, VA
103 FORTRAN IV IBM 360/6522 FORTRAN IV IBM 360/6523 FORTRAN IV IBM 360/6538 FORTRAN IV IBM 360/65
/1(
GEOLOGICAL SURVEY, WOODS HOLE, MA
38 FORTRAN IV XDS SIGMA 7 X-RAY DIFFRACTION ANALYSIS39 FORTRAN IV XDS SIGMA 7 MAGNETIC AKCNALIES MAG20
ASTRONOMIC FCSITION AZIMUTH METHODPERCENTAGE SATURATION OF OXYGEN IN ESTUARYWATER CHEMISTRY DIELECTRIC CONSTANTGRAVITATICNAL ATTRACTION TWO-DIMENSIONAL BCDIES
GEOLOGICAL SURVEY, MENLO PARK, CA
122 FORTRAN IV IBM 360/61 ,PROFILE PLCTS TIME AXIS PROFL3122 FORTRAN IV IBM 360/61 PROFILE PLUS DISTANCE AXIS PFLDST122 FCRTRAN IV IBM 360/61 MAP PLOTS PAPPLT
GEOLOGICAL' SURVEY, CORPUS CHRISTI, TX
38 FORTRAN LV IBM 1130 SEDIMENT GRAIN SIZE ANALYSIS ."
INSTITUTE OF CCEANOGRAPHIC SCIENCES, MALES
40 FCRTRAN IV IBM 1130 RECUCTION'DISPLAY STORAGE GEOPHYSICAL DATA,
INTER-AMERICAN TROPICAL TUNA COMMISSION, LA JCLLA, CA
58"FORTRAN 'B 6700- NORMAL DISTRIBUTION SEPARATOR TCPA1SPAWNER - RECRLIT CURVE FITTING TCPA2HEIGHT-LENGTF CURVE FITTING TCPA3t,AGE COMPOUTION ESTIMATION TCPB1 -ESTIMATE CATO- NUMBERS PERCENT WEIGHT!LENGTH-.FREQUENCY DISTRIBUTIONVON BERTALANFFY GROWTH CURVE FITTING TCPC1;VON BERTALANFFY GRCWTH UNEQUAL AGE INTERVALVON BERTALANFFY GROWTH EQUAL AGE INTERVALVDN BERTALANFFY GROWTH CURVE FITTING TCPC4ESTIMATION CF LINEAR GROWTHFISHING POWER ESTIMATICN TOP01.'s
58 FORTRAN5E FORTRAN59 FORTRAN5S FORTRAN5S FORTRAN
B 6700B 6700B 6700B -6700B 670C
60 FORTRAN B 6.70060 FORTRAN B 670060 FORTRAN B 670061 FCRTRAN B 670064 FORTRAN B 67C0A61 FORTRAN B 6700
a I
212
222

.04
62 FCRTRAN Bp670063 FORTRAN. B 670063 FORTRAN B 670063 FORTRAN B 670063 FORTRAN B 670064 FORTRAN B 670064 FORTRAN B 6700
FORTRAN, B 6700',6565 FORTRAN B 67 00
65 FCRTRAN B 670065 FORTRAN B 670066 FORTRAN B 67 00_66 "FORTRAN B 670066 FORTRAN B 670067 FORTRAN B 670067 FORTRAN B 670067 FORTRAN B 670068 FORTRAN B 6700
'68 FORTRAN B 670068 FORTRAN B 670069 FORTRAN B 670065 FORTRAN B 670069 FORTRAN B 670065 FCRTRAN B 670070 FORTRAN B 67 00
70 FORTRAN B 670070 FCRTRAN B670071 FORTRAN B 6700
SURVIVAL RATE ESTIMATION TCPE1
i
FISHING MC TALITIES'ESTIMATION TCPE2 .
RELATIVE Y ELD PER RECRUITYIELC GOV S WITH CONSTANT RATES TCPF2EUMETRICtYIELD TCPF3PIECEWISE INTEGRATION OF YIELD tURVES JCPF4PIECEhISE INTEGRATIO CrYIELD CURVESCONSTANTS IN SCHAEFER'S MODEL TCPF6SCHAEFER LOGISTICS MODEL OF FISH PROCUCTIONFITS GENERALIZEC STOCK PRODUCTION MODEL TCPF8BIOMETRY - LINEAR REGRESSION ANALYSIS TCSA1 ,
GENERALIZED hEIGHTED LINEAR REGRESSICNLINEAR REGRESSION, BOTH, VARIABLESBICMETRYPRCCUCTMGMENT CORRELATIONCOOEEY- LONNES MULTIPLE- REGRESSIONBIOMETRYGCCCNESS CF FITBICMETRY-BASIC STATISTIC FOR UNGROUPED CATABIOMETRY-BASIC STATISTIC FOQ GROUPED DATABIOMETRYS#INGLE CLASSIFICATION ANOVABICMETRY-FACTCRIAI ANCVA 1CSD2BIOMETRY -SUM GF SQUARES SIP TCSD3BIGNETRY-STUCENT-NEWMAN-KEULS TEST TCSD4BIOMETRY-TEST OF HLMOeENEITY 4BICMETRY-TEST GF EQUALITYBIGMETRY-TUKEYIS TESTBIOMETRY-KRUSKALWALLIS TEST TCSE4BICMETRY-FISHER'S EXACT TEST TCSE5BIGMETRY-R X C TEST CF INDEPENDENCE MAP
JOHNS HCPKIN4 UNIVERSITY,BALITMCRE, MD
29 FCRTRAN28 FORTRAN
NUMERICAL M,CL ESTUARY OYNAMICS.8 KINEMATICSSALINITY DrSTRIBUTIONqN ONE- DIMENSIONAL ESTUARY
LOS ANGELES CITY SANITATION DEPARTMENT, LCS ANGELES, LA
73 ANS FORTRAN IBM 36073 ANS FORTRAN IBM 370
ECCLOGICAL StATISTICAL PROGRAMS ECCSTATECCLCGICAL STATISTICAA. PROGRAMS ECOSTAT
'MARINE ENVIRONMENTAL CATA SERVICE, CANACA
117 FORTRAN4 FORTRAN IV4 FORTRAN4 COBOL4 PL/1
CDC CYBER X -Y PLOTS IN A FLEXIBLE FCRMAT MEDSPLCTCCC CYBER 74 DAILYSEAWATER CBSERVATIONSCDC 6400 DATA MGT SYS FOR PhYS CHEM DATA OCEANSVIBM 360/85 DATA MGT SYS FGR PhYS CHEM BATA CCEANSVIBM 360/85' , DATA MGT SYS FCR PhYS CHEM CATA OCEAMM
MASSACHUSETTS IMSTITUTE OF TECHNCLCGY, CAKBRICGE, MA
IBM 370/168 MONTE CARLC SPILL TRACKERIBM 360/40 SPECTRA PROGRAMS DETRND AUTCOV CRSCGV FCURTRIBM 360/40 WATER WAVE TEACHING AIDS PRCF1IBM 360/40 WATER WAVE TEACHING Min UMAX1IBM 360/40 WATER WAVE TEACHING AIDS UTMAX1IBM 360/40 WATER WAVE TEACHING AIDS WMAilIBM 360/40 WATER WAVE TEACHING AIDS LENG1 I '
IBM 360/40 LhATER WAVE TEACHING AIDS DETRND -
IBM 360/40 WATER WAVE-TEACHING AIDS hTMAX2
72 PL/1_135 FORTRAN IV
85 FORTRAN85 FORTRAN85 FORTRAN85' FORTRAN85 FCRTRAN85 FORTRAN85 FORTRAN
' 213
223
A
t.
85 FORTRAN IBM 360/4085 FCRTRAN IBM 360/4085 FORTRAN rem 360/4085 FORTRAN IBM 360/4085 FORTRAN IBM 360/4085 FORTRAN IBM 360/4085 FORTRAN IBM 360/4086 FORTRAN IBM 360/4086 FORTRAN IBM 360/4086 FORTRAN IBM 360/4085 FORTRAN IBM 360/4025 FCRTRAN IV IBM 360/6587 PL/1 IBA 370/18040 FORTRAN IV IBM 707474 PL/1 IBM 360/16874 PL/1 IBM 360/16874 PL/1 IBM 360/168
WATER WAVE TEACHING AIDS UOFT1WATER WAVE TEACHING AIDS MCFT1WATER RAVE TEACHING AIDS UTCFT1WATER WAVE TEACHING AIDS WTCFT1WATER WAVE TEACHING AIDS AUTCOVWATER WAVETEACHING AICS CRSCOVWATER WAVE TEACHING AIDS FCURTRWATER HAVE TEACHING AIDS PRCFILEWATER WAVE TfACHING AICS REFL1WATER WAVE TEACHING AIDS FORCE AND MOVEMONTWATER WAVE TEACHING AIDS EDSIT -
MIT SALINITY IKTRUSICN PRCIRAMMARKCVIAN ANALYSIS OF TDF-14 WIND DATACONFUTATION ANC PLOTTING OF MAGNETIC AtCMALIESDRIFT BCTTLE[STATISTICSDRIFT BCTTLE PLCTSREFORMAT AKE SCRT &RIFT BOTTLE DATA
I
NATICNAL ENVIRCNMENTAL SATELLITE SERVICE, RCCKVILL6, MD
123 FCRTRANI:23 FORTRAN
CDC 6600 DISPLAYS VHRR SATELLITE DATA -14-50M0IBM 360/195 MICROFILM PLCTS OF VHRR.SATELLITE OATA
NATICNAL INSTITL;TE OF OCEANOGRAPHY, ENGLAND
135 FORTRAN - IBM 1800 BARTLETT'S CURVE FITTING145 FORTRAN IV IBM 1800 CURRENT METER CATA RECUCTION37 FCRTRAN IV IBM 1800 CABLE CCNFIGLRATION134 FORTRAN IV IBM 1800 GENERATES ARBITRARY FILTER HILOW136 FORTRAN IBM 1800 'CLUSTER ANALYSIS84 FCRTRAN IV IBM 1800 SHIPBCRNE WAVE RECORDER ANALYSIS SBWRO103 "FCRTRAN IBM 1800 SATELLITE NAVIGATION104 FCRTRAN IV IBM 1800 LCRAN/DECCA COORDINATES CALCULATICN HNAV'104 FORTRAN IV IBM 1800 LCRAN/DECCA FILE INITIALIZATION HNV1104 FCRTRAN IV um 1800 GECCETIC CISTANCE ANC AZIMUTH SDANO
NATICNAL MARINE FISHERIES SERVICE, SOUTHWEST FISHERIES CENTER, LA JCLLA, CA
123 FORTkAN 62 CDC 360012 FCRTRAN IV B 670012 ALGOL B 6700,712 FORTRAN 63 CDC 360013 FCRTRAN CDC 360013 FORTRAN CDC 360056 FCRTRAN B 670056 FORTRAN'57 FORTRAN57 FCRTRAN57 FORTRAN57 FORTRAN87 FORTRAN
B 6700B 6700CDC 6600CDC 6600B 6700B 6700
VERtICALLY ANALYZED CONTOURS VACCTSPLCT TEMP LIST MIXED LAYER DEPTH WEEKPLCTCONSTANTS FCR HARMCNIC SYNTHESIS MEAN SEA TEMPVERTICAL SECTICN PLOTS ESTPACCCNVEFTS STC CATA RDECTPCORRECTS STD CATA TPMCDLENGTH FREGUEKCY ANALYSIS LENFREYIELD PER RECRUIT klik MULTI-GEAR FISHERIESA GENERALIZV EXPLCITED POPULATION SIMULATORA GENERALIZEC EXPLOITED POPULATION SIMULATORGENERALIZEC STCCK PRCOUGTICN MODEL PRCDFITGENERALIZED STOCK PROGLLTION MODEL PRCCFITSUMMARIZES WEATHER REPORTS
ATIONAL MARINE FISHERIES SERVICE, SCUTHWEST FISHERIES CENTER, HONOLULU, HI
- 136 FORTRAN IV IBM 360/65 EXTENDED NCRMAL SEPARATOR PRCPRAM ENCRMSEP
214
224
.*

,NATIONAL MARINE FISHERIES SERVICE, SOUTHEAST FISHERIES CENTER, MIAMI, FL
124 FORTRAN IV IBM 360/65 OXYGEN, PHCSFHATE DENSITY PLCTS! " 124 FORTRAN1V, 1891360/65 GENERAL MERCATOR PLOT
NATIONAL OCEAN SURVEY, ROCKVILLE' MC
112 FCRTRAN IV IBM 360/30 ADJUSTS A STATE PLANE COORDINATE TRAVERSE113 FORTRAN IV IBM 360/65 NOS SCIENTIFIC SUBRCUTINE SYSTEM ANGLE113 FORTRAN IV IBM 360/65 NOSSCIENTIFIC SUBROUTINE SYSTEM ANUS113 FORTRAN IV IBM 360/65 NOS SCIENTIFIC SUBROUTINE SYSTEM APCTN113 FORTRAN IV IBM 360/65 NOS SCIENTIFIC SUBROUTINE SYSTEM AfCWN113. FCRTRAN IV IBM 360/65 NOS SCIENTIFIC SUBROUTINE SYSTEM APOLY113 FORTRAN IV IBM 260/65 NOS SCIENTIFIC SUBROUTINE SYSTEM CGSPC113 FORTRAN IV IBM 360/65 NOS SCIENTIFIC SUBROUTINE SYSTEM CUBIC113 FORTRAN IV'. IBM 360/65 NOS SCIENTIFIC SUBROUTINE SYSTEM EXCEB113 FORTRAN IV IBM 360/65 NOS SCIENTIFIC SUBROUTINE SYSTEM GMLIC113 FORTRAN kV IBM 360/65 NOS SCIENTIFIC SUBROUTINE SYSTEM HIFIX114 FORTRAN- IV IBM 360/65 -NOS SCIENTIFIC SUBRCUTINE SYSTEM LORAN114 FORTRAN IV IBM 360/65 NOS SCIENTIFIC SUBROUTINE SYSTEM OMEGA114 FCRTRAN IV IBM 360/65 NOS SCIENTIFIC SUBROUTINE,SYSTEM114 FORTRAN IV IBM 360/65 NOS SCIENTIFIC SUBROUTINE SYSTEM SCDPN114 FORTRAN IV IBM 360/65 NOS SCIENTIFIC SUBROUTINE SYSTEM TPFIX114 FORTRAN IV IBM 360165 Nos SCIENTIFIC SUBROUTINE SYSTEM UTMCO114 SPS IBM 1620 COMPUTES GECGRAPHIG POSITIONS114 SPS IBM 1620 LORAN C VERSICN280 FORTRAN IV CDC 6600 HARMONIC, ANALYSIS GF DATA AT TIDAL FREQLENCIES
A
NATIONAL WEATHER SERVICE, TECHNIQUES CEVELCPFENT LABORATORY, SILVER SPRING,' MC
82 FORTRAN IV82 FORTRAN IV82 FORTRAN IV82 FCRTRAN IV80 FORTRAN IV
CDC 6600CDC 6600IBM 360/195IBM 260/195IBM 360/195
HURRICANE STCRM SURGE FORECASTS SPLASH IHURRICANE STCRM SURGE FORECASTS SPLASH IIEAST CCAST STORM SURGEWAVE FORECASTSASTRCKCMIaL,TIDE PREDICTION`
'NAVY, CIVIL ENGINEERING LABORATORY, PCRT HUENEME, CA41eso
30'FORTRAN IV CDC 6600 DEEP CCEAk LCAD HANCLING SYSTEMS OCLLS30 FORTRAN IV CDC 6600 LOAD NOTICN ANC CABLE STRESSES CAB130 FORTRAN IV cop 66C0 SOIL, TEST DATA TRIAX30 FCRTRAN IV CDC 6600 DYNAMIC STRESS RESPONSE OF LIFTING LINES CABANA31 FORTRAN. V CDC 6600 DYNAMIC RESPCNSE CF CABLE SYSTEM SNAPLG31 FORTRAN IV CDC 6600 CHANGES IN ELECTROMECHANICAL CABLE RAMSC .
31 FORTRAN IV CDC 6600 END,RESPONSES IN ELECTROMECHANICAL CABLE RACAC48 FORTRAN II IBM 1620 SOIL ANC SEDIMENT tNGINEERING TEST DATA
NAVY, %AVAL.POSTGRADUATE SCHOCL,,
''17 FORTRAN IV IBM 360'17 FCRTRAN -IV CDC 6500 .
MCNTEREY, CA
0 4CBJEGTIVE IhERNOCLiKE ANALYSISCCJECTIVE ThERMCLINE ANALYSIS
91 FORTRAN 60 IBM 1604 WINC CRIF1 ANC CONCENTRATICN OF SEA ICE ICEGRIQ
97 FORTRAN CDC 3100 SOUND SPEED CCMPUTATICN MODEL SOVEL97 FCRTRAN CCC 3200 SOUND SPEED CCMPUTATICN MODEL SOV'EL
97 FORTRAN CCC 1604 SOUND SPEEC CCMFUTATICN MODEL SOVEL93 FCRTRAN IV CDC 160c SCUNC SCATTERING BY CRGANISMS SKAT72 FORTRAN IN CDC 6500 THERMAL PCLLLTICN MODEL72 FORTRAN IV CDC 1604 THERMAL PCLLLTICN MODEL
215
225
a

J2 FORTRAN ' CDC 3100134 FORTRAN IV IBM 36083 FORTRAN IV CDC 6500
- 83 FORTRAN IV 'CDC 160083 FCRTRAN IV CDC 310083 FORTRAN CDC 310083 FORTRAN CDC 320022 FORTRAN IBM 36024 FORTRAN'IV CDC 650024 FORTRAN IV CDC 760024 FORTRAN IV CDC 650024 FORTRAN IV IBM 36087 FORTRAN CDC 1o0488FORTRAN IV CDC 650088 FORTRAN C,DC 3100.88 FORTRAN CDC 310088 FORTRAN IV CDC 650089 FORTRAN CDC 160475FORtRAN ; CDC 760075 FORTRAN CDC 310075 FORTRAN CDC 650075 FORTRAN CDC 160480 FORTRAN 60 IBM 360/1S
tiDANISH ADVECTICN PROGRAMTIME SERIES ANALYSIS BLACKYFRENCH SPECTRC-ANGULAR WAVE MODELFRENCH SPECTRC-ANGULAR WAVE MODELSURF PREDICTICP MODELSINGULAR WAVE PRECICTICN MODELSINGULAR WAVE PREDICTICN MODELSPECIFIC UNCUCTIVITY WITH PRESSURE EFFECTMULTI-LAYER HYDRODYNAMIC-NUMBERICAL MODELMULTI-LAYER HYDRODYNAMICAL-NUMERICAL MOCELSINGLE LARGE HY'DRCLYNAMICAL- NURICAL MCDELSINGLE LARGE HYDRODYNAMICAL -NUMERICAL MCDELOCEAN CLIMAPOLCGY ANALYSIS MODEL ANALYSHURRICANE HEAT POTtNTIAL MODELMIXED LAYER DEPTH ANALYSIS PODEL.MEDNLDATMCSPHERIC WATER CCNTENT MODELOCEAN- ATMCSPFERE FtEDBACK MODELWIND COMPUTATICN FRCM SHIP OBSERVATIONS TRUWINDOPTIMIZED MULTI-LAYER HN MODELOPTIMIZED MULTI-LAYER HN MODELMEAN CRIFT RCUTINEMEAN CRIFT RCUTINE
5 TIDES IN THE CPEN SEA
NAVY, FLEET NUMERICAL WEATHER CENTRAL, MONTEREY, CA-!
148 FORTRAN II CDC 1604 FORTRAN ACCESS TO SCIENTIFIC CATA FASDX76 FORTRAN CDC 6500 SEARCH AND RESCUE PLANNING NSAR
NAVY, NAVAL UNCERSEA RESEARCH AND CEVELCPMENT CENTER, SAN DIEGO, CA
121 FORTRAN 63 CDC 160414 FCRTRAN EXT CDC e50.015 FORTRAN EXT -CDC 6500
MACHINE FLUTING ON MERCATGR PROJECTIONGCEANCGRAPHIC DATA COMPUTATICN TPCCNVVARIANCE ARC STANDARD CEVIATION SUMMARY
NAVY, NAVAL ELECTRCNICS LABORATORY, SAN DIEGC, CA
120 FORTRAN IBM 360/65 SECUENTIAL FLUTING
NAVY, NAVAL UNCERSEA CENTER, PASADENA, CA
138 FCRTRAN101 FORTRAN IV101 FORTRAN IV101 FORTRAN IV45 FORTRAN IV45 FORTRAN V
UNIVAC 1108UNIVAC 1108UNIVAC 1108UNIVAC 1108UNIVAC 1108UNIVAC 11.08
CURVE FITTING VELOCITY PROFILE NEWFITSONAR IN REFRACTIVt WATERSONAR IN REFRACTIVE WATERSORTS SCUND RAY DATA RAY SORT'PATTERN FUNCTION CALCULATICNSRAYLEIGH-MORSE BOTTOM REFLECTION COEFFICIENTS
NAVY, NAVAL UNDERWATER SYSTEMS CENTER, NEW LCNDCN, CT
, 138 FORTRAN V UNIVAC FITTING A LEAST SQUARES DISTANCE HYPERPLANE141 FCRTRAN IV UNIVAC 1108 SMOOTHING DATA USING THE CUBIC SPLINE
. 121 FORTRAN UNIVAC 1108 OVERLAY PLCTTING OVLRLT99 FORTRAN V UNIVAC 1108 CONTINUCUS GRADIENT RAY TRACING SYSTEM CONGRATS99 FORTRAN UNIVAC 1108 RAY FATh SC434E93 FORTRAN V UNIVAC 1108 NCRMAL MOCE FROPAGATICN MOCEL94 FORTRAN V UNIVAC 1108 BEAN PATTERNS AND RIDTHS GBEAMS4 FORTRAN V UNIVAC 1108 STATISTICS ACCUSTIt. MEASUREMENTS ANC PREDICTICNS
216
2'2 6

94-FORTRAN IV UNIVAC 1108 PROPAGATICN LCSS FAST FIELD PROGRAM94 FORTRAN. ID UN VAC 1108 BOTTOM REFLECTIVITY .. 1
45 FORTRAN V UNIVAC 1108 PRQPAGATICN LCSS45 FORT AN V UNIVAC-1108 AMOS PRUAGATICN LCSSAN36 FORT V UNIVAC 1108 TOhED STEM DYNAMICS36 FORTRA V UNIVAC 1108 TRAPEZOIDAL ARRAY DEPLCYMENT DYNAMICS37 FPRTRAN,V UNIVAC 1108 STEADY STATE CABLE LAYING .
37 FORTRAN V UNIVAC 1108 TOWED.ARRAY CCNFIGURATIONS ..
37 FCRTRAN (V UNIVAC 1108 TRAPEZCIOAL ARRAY DYNAMICS125 FORTRAN.-UNIVAC 1108 SPECTRAL ANALYSIS SUBROUTINES I
47 FORTRAN- UNIVAC 1108 TRUE CCEAN DEPTH FATHCR
I
53 FORTRAN IV UNIVAC 1108 GENERATES ZOCPLANKTON TAXONOMIC DIRECTORY53
it.
FORTRAtl IV UNIVAC 1108 DEEP CCEA ZCOP ANKTON DISTRIeJTION53 FORTRAN IV UNIVAC 1108 DEEP CCEAN ZC LAWTON POPULATION STATISTICS'74 CURRENT PRCFI ES FKCM TILT CATA16 FORTRAN V UNIVAC 1108 STD-S/V,DATA 5204932 FORTRAN V UNIVAC 1108 STEADY STATE TRAPELOIDAL RRAY CONFIGURATIONS32 FORTRAN V UNIVAC 1108 ANCHOR LAST -BUOY SYSTEM D VELOPMENT CYNAMICS33 FORTRAN V UNIVAC 1108 CABLE TCWEC EUCY CLNFIGURAT}ONS IN A TURN33 FORTRAN V UNIVAC 1106 FREE-FLCATING SPAR-ARRAY CYNAMICS,33' FORTRAN V UNIVAC 1108 FREE-FLCATING SPAR-BUOY DYNAMICS33 FCRTR4N.V UNIVAC 1108 SHIP SUSPENDEX ARRAY DYNAMICS34 FORTRAN-V UNIVAC 1108 BOCMERANG CCRER DESCENT/ASCENT TRAJECTCRIES34 FORTRAN V' UNIVAC 1108 BUOY-SHIP DYNAMICS34 FCRTRAN V UNIVAC 1108 BUCY-SYSTEM CYNAMICS34 FORTRAN V UNIVA0 :1108 FIXED TWIN LINE ARKAY'DYNAMICS.35 FORTRAN V UNIVAC 1108 FIXED TI-It LINE ARRAY STEADY STATE CONFIGURATION35 FORTRAN V . UNIVAC 1108 MARINE CORER DYNAMICS35 FORTRAN V UNIVAC 1108 STEADY-STATE BUCY SYSTEM CONFIGURATICNS36 FORTRAN V UNIVAC 1.108 STEADY -STATE SUBSURFACE BUOY SYSTM CONFIGURATION36.QFORTRAN V 'UNIVAC 1108 ED ARRAY-CYNAMICS c
NAVY, NAVAL UNDERhATER SYSTEMS CENTER, 'NEWFCFT, RI
142 FAIRTRAN CDC 3300 SOLVE ALGEBRAIC EQ(.ATICNS MAT(2IX
121 FORTRAN CDC 3300 PHYSICAL CATA PLOT FRAME99 FORTRAN CDC 3300 ACCLSTIC PERFCRMANCE AND EVALUATION94 FCRTRAN CDC 3300 SOUND REFRACTICN CGRRECTIONS FITIT
. 15 FORTRAN SIGMA-T INVREJ '
15 FORTRAN STD PROCESSING OCEANDATA15 FORTRAN INTERNAL WAVES hITCCMB 1:\
15 FCRTRAN CDC 3200 INTERPOLATICN FOR LCEANOGRAPHIC DATA15 FORTRAN, IBM 1620 4.-INTERP04:ATICK FOR CCEANOGRAPRIC DATA
75 FORTRAN CDC 3390 CURRENT METER CATA CREATE-C75 FORTRAN CDC 3300 CORRENT METEF DATA CURRENT75 FORTRAN CDC 3300 CURRENT METEF CATA CURRPLOT75 FORTRAN CDC'3300 CURRENT, TER DATA SPECTRUM
NAVY, NAVAL SURFACE WEAPONS CENTER, SILVER SPRING, MD
93 FORTRAN'IV CDC 6500 NORMAL MOCE CALCULATICKS NFMOD 393 FORTRAN t CDC 6400 HORIZCNTAL RANGE
. NAVY, NAVAL RESEARCH LABCRAJCRY; WASHINDTON,,DC- v
120 FORTRAN CDC 3800 LINE PRINTER FLCTS
6 , ,
217
.
227
114

124 ASSEMBLY ,HP 2100S100 FORTRAN `Q3 Spt 3000100 FORTRAN, 63-- CDC 3800100 FORTRAN 63 CDC'3800100 FORTRAN 63 CDC 3800100 FORTRAN 63 CDC 3800101 FORTRAN 63 CDC 3800101- FORTRAN 63 CDC 380016 FCRTRAN IV HP 2100S16 FORTRAN IV HP 2100S16 FCRTRAN CDC 800leFORTRAN IV CDC 20031 BASIC HP 9830A32 BASIC HP 9830A32 BASIC HP 9830A107 FORTRAN CDC 3800107 FCRTRAN IV HP 21-00S108 FORTRAN IV HP 2100S108 FORTRAN IV HP 2100S108. FORT AN IV HP 2100S
sz 108 FCRTRAN IV HP 210.0S'108 FORTRAN IV HP 2100S109 FORTRAN IV HP 2100S89 FCRTRAN CDC 3800447- FORTRAN4r FORTRAN
CDC 3600,CDC-1800
L47-FORTRAN CDC 380047 FORTRAN CDC 36cd47 FCRTRAN CDC 360047 FCRTRAN CDC 3800107 FORTRAN CAC 3600
PLCTTER CCMMANOS PttT CVRIO P
GRASS UNDERWATER ACCUSTICS PREDICTICN DTSTOVGRASS UNDERWATER AuOUSTICSPREDICTION VFCGRASS UNDERWATER ACCUSTICS PREDICTICN CTOURGPASS UNDERWATER ACCUSTICS PREDICTICN PRFPLTGRASS UNDERWATER ACCUSTICS PREDICTION SERPENTGRASS UNDERWATER ACCUSTICS PREDICTICN RAFLCTGRASS UNDERWATER ACCUSTICS PREDICTICN LCSSPLOTTHERMCMETRIC 'DEPTH CALT4ATICN CASTTHERMCMETER CATA FILE HANDLER THERMOINTERNAL GRAVITY WAVES DISPERSEA SURFACE TEMPERATURES ANALYSISUNMANNEP-FREE-SWIMMING SUBMERSIBLE PLCTUNMANNED FREE-SWIMMING SUBMERSIBLE HOTEL LCADUNMANNEC FREE - SWIMMING' SUBMERSIBLEANNCTATED TRACK ON STEREOGRAPHIC PRCJECTIONANNOTES CHARTBATHYPETRIC CR MAGNETICS CHART'PROFLMERCATOR CHART CIGITIZATION -ANTRKBATHYPETRIC CHART UIGITIZATICN DGBTHPLCTS Oh STERECGRAPHIC CHART ANN'OTPLCTS NAVIGATICA CATA OCEAN
',LONG BASE LINE AUUSTIC TRACKINGMIE SCATTERING COMPUTATIONSPLCTS TRACK AND DATA PRCFILE TRACKPLCTS TRACK AND DATA _PROFILE TRACKGECCATA Y'4E0DATAMAGNETIC SIGNATURES MAGPLCTMAGNETIC SIGNATURE. MAGPLCTANNCTATED TRACK ONSTEREOGRAPHIC PROJECTION
..NAVY, FLEET WEATHER FACILJTY,'SUITLANC, MO
91,,,FORTRAN II CDC 160A ICE DRIFT ANALYSIS/FORECAST
,NAVY, NAVAL OCEANCGRAPHIC
11.9' FORTRAN139.FORTRAN139 FORTRAN121 %FORTRAN V'21 MATRA*121 FO4TRAN
,100 FORTRAN97,FORTRANS8 FORTRAN
FJCE, WASHINGTON, CC
IBM 7C74UNIVAC 1 08PDP."9UNIVAC 1108
IBM 7074.UNIVAC I1'08IBM 7074
45' FCRTRAN ,IBM '7074'144, FORTRAN IBM 7074
14 FCRTRAN IBM 707014 FCRTRAN IBM 707414 FORTRAN V UNIVAC1108137:FORTRAN IBM 7074110 FORTRAN II 167 7074111 FORTRAN° ir 187 7014 k
111 FORTRAN 1877074111 FORTRAN 187 7074
A
LEAST SCUARES PLOT '
TEMPERATURE SALINITY CCRRECTIONS CU VEFIT N1S512BARTLETT'S CURVE FITTINGREFORMATS DATA' PLOTS TRACK CHART M STRACKPRCCUtES tChT R CHARTS GRICITPRODUCES CCNT UR CHARTS AUTCMATEE> CONTCURCRITICAL ACC STIC RATIOSOUNC.VELCCI FOR MARINE SEDIMENTSLIGHT AND SC ND,INSTRUCTIdW BLIGHT AND SCAN{! INSTRUCTION 0BATHYMeIRIC CATA RtCUCJIONMCNTHLY SChIC LAYEK DEPTH /
VERTICAL TEMPERATURE GRADIENTSWATER CLARITYSINGLE INTEGRATIONINDIVIDUAL FCINT GthERATCR,FCR MAP, OJECTICNSINDIVIDUAL POINT GthERATOR FOR DIST NCEGEOPETIC CATUM RECUCTICNGEODETIC PCSITICN WDMPUTATION,AND PLCT
, `,3
218
228
4

111 FORTRAN .
112.FORTRAN-- ---CUt 3100112 FORTRAN112 FCRTRAN112 FORTRAN'89 FORTRAN
4 89' FORTRAN89 FORTRAN =
90 FORTRAN90 FORTRAN46 FORTRAN0 FORTRAN''.48 FORTRAN48 FORTRAN IV76 FORTRAN76 FORTRAN V76 FORTRAN71 FORTRAN V77 FORTRAN V77 FORTRAN V77 FORTRAN V
IBM 7074IBM 7074CDC 3400IBM 7074IBM 7074IBM 7074IBM 7074IBM 7074IBM 7074IBM 7074UNIVAC 1108UNIVAC 1108IBM 7074 ,UNIVAC 1108UNIVAC 1108UNIVAC 1108UNIVAC 1108UNIVAC 1108UNIVAC 1108
ASTROKOVID LATITUDESOUNDING PLOTSOUNDING PLCTSINGLE INTEGRATIONSODANO INVERSESOLAR RADIATICN CCNVERSION.WINC STRESSTWC-DIMENSIONAL POWER SPECTRUM FOR SWOP IIPREDICTION OF VERTICAL TEMPERATURE4CHANGECLCUD COVER AND DAILY SEA TEMPERATURESEARCUNT MAGNETIZATIONCBSERVATICN DRAPING GRAVITY4tEDIgENT SIZEBQTTCM SEDIMENT DISTRIBUTION PLOTCURRENT METER TURBULENCEIN-SITUI.CURRENTWATER DISPLACEMENT DISPLACURRENT METER PRINTCURRENT METER PLOT
40
CONVERT CURRENT METER. TAPECURRENT METER DATA MPRINTO
NAVY, DEFENSE MAPPING AGENCY HYDRCGRAPHIC CENTER, WASHINGTON, DC
109 FORTRAN109'FORTRAN109-FORTRAN110 FORTRAN110 FORTRAN110 FORTRAN '
UNIVAC 1108UNIVAC 1108UNIVAC 1108UNIVAC 1108UNIVAC 1108UNIVAC,1108
FAA FLCTDISTANCE AND AZIMUTH CIRAZDPARAMETRIC MAPLORAN TO GECGRAPHIC AND/GEOGRAPHIC TO LCRANLORAN GOORCINATE,COMPUTATIONLORAN SKYhAVE CCRRECTICN
NAVY? NAVAL ACADEMY, ANNAPOLIWMD ,
13 BASIC 'IBM 360 ENVIRCNMENTAL DYNAMICS SUBROUTINES OCEAKLIB--).13 BASIC IBM 360 GEOSTROPHIC CURRENT .
NORTH CAROLINA STATE - UNIVERSITY, RALEIGH,' N&\
84 FORTRAN24 FORTRAN26 FCRTRAN26 FORTRAN IV26 FORTRAN IV26 FORTRAN IV.
IBM 360/165IBM` 370/165CDC 6400IBM 360IBM 360IBM 360,
WAVE INTERACTION,hITH CURRENT dWPGRAYESTUARINE MCCEL NONLNRAUPWELLING CSTLUPWLMATHEMATICAL WATER QUALITY MODEL FCR ESTUARIESCONFUTATION CF. FLOW THROUGH KASONBCRC INLET NCCIRCULATICN IN PAMLICC SOUND
CREGONSTATE UNIVERSITY, CORVALLIS, OR
1 126 FORTRAN.
....
CDC 33001bS3 TIME SERIES ARAND ACFFT126 FORTRAN CDC,3300/CS3 TIME SERIES,ARAND ACCRR126 FORTRAN CDC 3300/0S3 TIME SERIES ARAND ACRPIT126 FORFRAN CDC 3300/GS3 TIME SERIES ARAND ALIGN126 FORTRAN . CDC 3300/CS3 TIME SERIES ARAND AMPACO126 FORTRAN CDC 330010S3 TIME SERIES ARAND ARMAP126 FORTRAN CDC 3300/CS3 TIME SERIES ARAND AUTOla FORTRAN CDC 3300/CS3 TIME SERIES ARAM) AUTCPLT
g'
229
219

126 FORTRAN126-ACRTRAN-
CDC 3300/OS3 TIME SERIES ARAND AX1151.TIME-SERI-ES -ARANO-LCFFT-
127 FORTRAN CDC 3300/OS3 TIME SERIES ARAND' qpIRR127 FORTRAN CDC 3300/CS3 TIME SERIES ARAND CCNPLT
Irk127 FORTRAN CDC 3300/C53 TIME SERIES ARAND COMPLOT127 FORTRAN CDC 3300/0S3 TIME SERIES ARAND CGNFID127 FORTRAN CDC 3300/C53 TIME SERIES ARAND LCNFID 1.127 FORTRAN CDC 3300/C53 TIME SERIES ARAND CCNMODE127 FORTRAN CDC 3300/0S3 TIME SERIES ARAND CtPH127 FORTRAN CDC 3300/C53 TIME SERIES ARAND COSTR1127 FORTRAN > CDC 3300/0S3 TIME,SERIES ARAND CPEES127 FORTRAN CDC 3300/0S3 TIME SERIES ARAND tPLT1127 FORTRAN CDC 3300/C53 TIME SERIES ARAND CPLT2127 FORTRAN CDC 3300/0S3 TIME SERIES ARAND CROPLT Tj.-
127.FORTRAN CDC 3300/C53 TIME SERIES ARAND CROSS127 'FORTRAN CDC 3300/CS3 TIME SERIES ARAND CUSID127 FCRTRAN,'128 FORTRAN
CDC 3300/C53 TIME SERIES ARAND CUSFOCDC 3300/C53 TINE SERIES ARANO CZT
128 FORTRAN CDC 3300/053 TIME SERIES ARAND DATPLT128 FORTRAN CDC 3300/0S3 TIME SERIES ARAND DEMOD1128 FORTRAN CDC 3300/0S3 TIME SERIES ARAND CEMCD2128 FORTRANfr CDC 3300/GS3 TIME SERIES ARAND DEMOD3128 FORTRAN CDC 3300/GS3 TIME SERIES ARAND CETRND '3
128 FORTRAN CDC 3300/0S3 TIME SERIES ARAND DIFF12128 FCRTRAN CDC 3300/C53 TIME SERIES ARAND EUREKA128 FORTRAN CDC 3300/C53 TIME SERIES ARAND EXSMO129 FORTRAN CDC 3300/C53 TIME SERIES ARAND FFIN128 FORTRAN CDC 3300/C53 TIME SERIES ARAND FFINI
< f28 FORTRAN CDC 3300/0S3 TIME SERIES ARAND FFTCNV128 FORTRAN CDC 3300/0S3 TIME SERIES ARAND FFTPS128 FORTRAN . CDC 3300/C53 TIME SERIES ARAND FFTS128 FORTRAN CDC 3300/0S3 TIME SERIES ARAND FFTSPC128 FORTRAN CPC 3300/C53 TINE 'SEAIES ARAND FILTER1128 FORTRAN CDC 3O0 SICS3 TIME SERIES ARAM} FIVET
-- 129 FORTRAN CDC 3300/0S3 TIME SERIES ARAND FCLD129 FORTRAN CDC 3300/CS3 TIME SERIES ARAM) FCURTR129 FORTRAN CDC 3300/C53 TIME SERIES ARAM) FOUSPC129 FORTRAN CDC 3300/CS3 TIME SERIES ARAND FCUSPC1129 FORTRAN CDC 3300/053 TIME SERIES ARAND FCUSPC2 I
129 FORTRAN CDC 3300/0S3 TIME SERIES ARAND PRESPON129 FORTRAN CDc(3300/CS3 TIME SERIES ARAND GAPH129 FORTRAN CD 3300/CS3 TIME SERIES ARAND CENER1129 FORTRAN CDC 3300/CS3 TIME SERIES ARAND GENER2
' 129 FORTRAN CDC 3300/CS3 TIMEDSERIES ARAND GENER312 .FORTRAN CDC 3300/eS3 TIME'SERIES ARAND LOGPLOT129 FORTRAN CDC 3300/053 TIME SERIES ARAND NC12T129'FORTRAN CDC 3300/053 TIME SERIES ARAND PHAPLT129 FORTRAN CDC 3300/0S3 TIME SERIES ARANO FLTFOA129 FCRTRAN CDC 3300/C53 TIME SERIES ARAND PLTFRQ129 FORTRAN -CDC 3300/C53 TIME SERIES ARAWD\?LTSPC130 FORTRAN *CDC 3300/053 TIME SERIES ARAND FCLRT130 FORTRAN CDC 3300/t53 TIME SERIES ARAND PCLYDV130 FORTM --CDC 3300/0S3 TIME SERIES ARAND PROPLT130 FORTRAN CDC 3300/CS3. TIME SERIES ARAND PSQRT130 FORTRAN ,; CDC 3300/CS3 TIME SERIES ARAND RANCM130 FORTRAN ' CDC 3300/0S3 TIME SERIES ARAND RCTFFT130 FORTRAN CDC 3300/CS3.TIME SERIES ARAND RESPON130 FORTRAN CDC 3300/C53 TIME SERIES ARAND REVERS130 FORTRAN CDC 3300/C53 TIME SERIES ARAND RPLACE
220
/4.
230
A
sp.

t
130 FORTRAN'30 FORTRAN130 FCRTRAN130 FORTRAN130 FORTRAN130 FORTRAN130 FORTRAN130 FORTRAN130 FORTRAN,-131 FORTRAN131 FORTRAN131 FORTRAN131 FORTRAN131 FORTRAN131 FORTRAN,131 FORTRAN131, FORTRAN131 FORTRAN131 FORTRAN131 FORTRAN131 FORTRAN132 FORTRAN132 FORTRAN132 FORTRAN132 FORTRAN132 FORTRAN132 FORTRAN132 FORTRAN132 FORTRAN132 FORTRAN132 FORTRAN132 FORTRAN132 FORTRAN132 FORTRAN133 FORTRAN25 FORTRAN39 FORTRAN IV39 FORTRAN IV39 FORTRAN IV39 FORTRAN IV
CDC 3300/053 TIME SERIES ARAND RRVERSCDC 3300/053 TIME SERIES ARAND SARITCDC 3300/053 TIME SERIES ARAND SERGENCDC 3300/053 TIME SERIES ARAND SHAPECDC 3300/C53 TIME SERIES ARAND SINTRCDC 3300/C53 TIME SERIES ARAND SMOCDC 3300/053 TIME SERIES ARAND SPECCDC 3300/053 TIME SERIES ARAND SPECT1.CDC 3300/053 TIME SERIES ARAND SPECT2CDC 3300/053 TIME SERIES ARAND TAUTOPLTCDC 3300/C53 TIME SERIES ARANO TCOHPLTCDC 330 /C53 TIME SERIES ARAND TCROPLTCDC 3360/C53 TIME SERIES'ARAhD TFORM1COC 3300/C53 TIME SERIES ARAND TFORM2CDC 3300/Q53 TIME SERIES ARAND TIMSPCCDC 3300/053 TIME SERIES ARAND TLOGPLTCDC 3300/C53 TIME SERIES ARAND TNCIZTCDC 3300/053 TIME SERIES ARAND TPHAPLTCDC 3300/053 TIME SERIES ARAND TPLTFRQCDC 3300053 TIME SERIES ARAND TPLTSPCCDC 3300/GS3 TIME SERIES ARAND TRISMOCDC 3300/053 TIME SERIES ARAND TSGENCDC 3300/053 TIME SERIES ARAND TSPECTICDC 3300/C53 TIME SERIES ARAND TSPECTZCDC 3300/C53 TIME SERIES ARAND TRANFRCDC 3300/053 TIME SERIES ARAND TRANFRMCDC 3300053 TIME SERIES ARAND TTYCONCDC 3300/C53 TIME SERIES ARAND TTYNUMCDC 3300/C53 TIME SERIES ARAND LNEAVCDC 3300/C53 TIME SERIES ARAND LSESCDC 3300/053 TIME SERIES ARAND USFOCDC 3300/053 TIME. SERIES ARAND LSICCDC 3300/C53 TIME SERIES ARAND USPECDC 3300/C53 TIME SERIES ARAND NINZOW.CDC 3300/053 TIME SERIES ARAND AINDOW1IBM 370/155 ESTUARINE DENSITY CURRENTS AND SALINITCDC 3300 GEOPHYSICAL CATA REDUCTION AND PLOTTINGCDC 3300 PRCCESSING/CISPLAY MARINE GEOPHYSICAL DATACDC 3300 MARINE SEISMIC DATA RECUCTICN ANO ANALYSISCDC 3300 A LIBRARY CF GEOPHYSICAL SUBROUTINES GLIB
8
RAND CCRPCRATICN, SANTA MCNICk, `CA
91 FORTRAN IV91'FORTRANAV
'sk' 91 FORTRAN IV'91 FORTRAN'IV
IBM 7090-94.IBM 7090-94IBM 7090-94IBM 7090,94
RICE UNIVERSITY, HOUSTON, TX
38 FORTRAN IV CDC 6600
SEA ICE STUDIES YARITSEA ICE STUCIES FLIPSEA ICE STUCIES-SALPRSEA ICE STUCIES,RIIE
,CONVECTION INVARIABLE-VISCOSITY FLUIC CCNVEC
SCRIPPS INSTITLTICN OF OCEANCGRAPHY, LA JCLL'A, CA
C142 FORTRAN IBM 1800 TRIGONCMETRY SLEROLTIKES ASSUB SAS ASAI116 FORTRAN IV 'CDC 3600 PLOTTING PROGRAM PRCFL
231
221

149 FCRTRAN--149*Ge IRANI44 FORTRAN144 FORTRAN144 FORTRAN144 FORTRAN145 FORTRAN145 FORTRAN145 FORTRAN146 FCRTRAN 63
2 FORTRAN IV105 FORTRAN.105 FORTRAN106 FORTRAN106 FPRTRAN106 FORTRAN107 FORTRAN107 FCRTRAN107 URTRAN51 FORTRAN1f6 FORTRAN2 XLGOL
142 ALGOL98 ALGOL
X148 ALGOL.48 ALGOL
'SdLTHAMPTCN OC
.26 FORTRAN
4
XAS ACM UNIVE
7 FCRTRAN7 FORTRAN)3-FORTRAN8 FORTRAN
103 FCRTRA
UNIVERSIDAON
5 FORTRAN
IBR 18001814_1800_IBM 1800IBM 1000IBM 1800IBM 1800IBM 1800IBM 160IBM 1800CDC 6600CDC 6600IBM 1800IBM 1J300IBM 1800IBM 1800IBM 1800IBM 1800IBM 1800IBM 800CDCL3609DC 360-0
B 67C0B 6,700B 67 00B 6794.8 '6 CO
FORMAT FREE INPUT SUBROUTINE QREAD: MITERSVS 457HCMS_ RAUL, _},"
DATE CALCULATIONS CAYWKDATE CALCULATICNS NWDAT.DATE CALCULATIONS hXTCYDATEaCALCULATICNS YSTOYJULIAN CAY SUBROUTINES CLEJLJULIAN CAY SUBROUTINES CJULTIME COAERSION.DTIMEHYDRCGRAiTHIC DATA REDUCTION 'TWO FIVE-STD DATA PRCCESSIN4PLCTS MERCATCR GRIb CHARTNAVIGATIONAL SATELLITE PASSES ALRTXLORAN FIX LRFIXPLAN CCLRSE ANC SCHEDULE CRUISEARTH SPHERICAL SUbRCUTINES ESTCH ;OTC? ESTPLCEGREE CONVERSICNS CEGFR DEMIMERCATOR CEGR,EES DMRCTMAGAFIC FIELC COMPCNENTS MAGFISP ES AFFINITIES REGROUPXY FLCTS MUCPAK,§TATICN DATA RETRItVAL HYCROSEARCHINTERACTIVE CALCULATIONS DSOP/CALC,SCUNC VELCCITY THRL SCLID SAMPLES DSDP/SCNMAILING LABELSSAMC SILT ANC CLAY FRACTIONS DSDP/GRAIN
EGE,'SCUTHAPPTON, NY ,,N,,,
V IBM yeelt5' ,MIT SALINITY INTRUbION,PRCG
)SITY, COLLEGE STATICN, TX-
REAC CALL l' STATICN DATA CAPRICORNSTATICN BATA CALCULATICNS F3 0
PLCTS STATION DATA PLTEDT 'r"
CALCULATES STATION DATA SECPGPLCTSt MAPS GRIDS TRACKS MAF
._ r.
-
IV
IVIVIV
IBM 360/65144....14t3.160/65
60/65'IBM 360/66Ipm 360/65
CE MEXICC, MEXICO, OF0
6790 CCEANCRAPHY STATICN.i.CMpUTER PRCGRAM 9 .
UNIVERSITY C-F" BERGI0107WAi----\ ....
79 FORTRAN II TBi1620 . . PROCESSES CLRKENT INSTRUMENT :CtSERVATIONS-).
, -0 ..r. -N.
UNIVERSITY OF DELAWARE, LEVIES, DE .
(,,
25 FORTRAN kV IBM 360 CYNAMIC DETkRMINISTIC SIMULATION SIMUDE
`UNIVERSITY OF HAUAII, HONCLU U, HI
116 FORTRAN IBM 360 . DENDRCGRARH116 FCRTRAN IBM 370 CENCRCGRAPH
r0
22
4 6.
232
T

UNIVERSITY OF ILLINOIS, URbANA, IL
83 FORTRAN IV IBM 360/75 WAVE BCTTCM VELOCITY'
UNIVERSITY OF MAINE, WALPCLE, ME
153 FCRTRAN , IBM 37028 FORTRAN IV IBM 37028 FORTRAN IV IBM 37055 FORTRAN IBM 370'55 FORTRAN IBM 37055PFORTRAN IBM 370
REFCRMATTED STATION OUTPUT IBM 1ESTUARINE CHEMISTRY MYACHEMESTUARINE TICESCHLCRCPHYLL CHLORPHYTOPLANKTCN POPULATiCN DENSITYSPECIES DIVERSITY
UNIVERSITY OF MARYLAND, COLLEGE PARK, MD
24 FORTRAN IV UNIVAC '1108 THREE DIMENSICKAL ESTUARINE CIRCULATICN MODEL50 FORTRAN IV UNIVAC 1108 INVERSE PROBLEM,IN ECOSYSTEM ANALYSIS
UNIVERSITY OF MIAMI, MIAMI, FL
20 FORTRAN20 FORTRAN20 FCRTRAN20 FORTRAN20 FORTRAN20 FORTRAN20 FORTRAN20 FORTRAN20 FORTRAN20 FORTRAN20,FCRJRAK20 FOR RAN20 FORTRAN20 FORTRAN20 FORTRAN20 FORTRAN
POPrllPDP-11PDP-1I,PDP-11PDP-11UNI6C 1106UNIVAC 1106UNIVAC 1106UNIVAC 1106UNIVAC ,1106UNIVAC 1106UNIVAC 1106,UNIVAC 1106UNIVAC 1196-UNIVAC 1106UNIVAC 1106
4"
GENERAL PURPCSE EDITOR DMSECTIME SERIES INTO PROFILES CMSCHPAAKCERAA CURRENT METER DATA AACALCURREKTPACFILER DATA MK2CAL'APPEPCS NEW CATA TC FILE DERIVEAPPEPCS NEW CATA' TC FILE DERIVECONCATENATES SORTS SEGMENTS OUTPUTS DMSCRT.INTERPCLATES TO UNIFORM GRID MATRIX 01 \TIME SERIES SIC OR PGA PRCFLES PLSAD.IN- JERNAL WAVES IWEGCYKAMICAL FIELDS INTERNAL WAVE RAYS CHRSEOAUTC ANC CRCSS SPECTRA TUKEY METHGCAUTC ANC CRCSS SPECTRA POLARIZED FCRM CPXSPeAMPLITUDES PHASES LEAST SQUARES TI0ES4METEGROLUGICAC FLUXES PETFLXCROSS CCVARLANCP.,MATRIX EMPEIGI
UNIVERSITY OF MICHIGAN' ANN ARBOR, M.I144,4f
104 MAD IBM 7090 GENERAL MAP. FRCJECTICN104 MAD IBM 7090 FIKTTE PAP FRCJEOTIGN,DISTCRTIONS
UNIVERSITY OF PITTSBURGH, PITTSBURGh,.PA
80 MAD IBM 7090 THECRETICtL RACIAL TIDAL. FCRCE.
UNIVERSITY Of RHCDE ISALND, PINGSTCN, RI
28 FCRTRAN IBM 370/155 MODELING AN CCEAN POND
223
233'411
\

UNIVERSITY OF PUERTO RICO MAYAGUEZ, PR
5-FORTRAN II POP 8E . MASS TRANSPCRT AND VELOCITIES GEOMASS5 FORTRAN IV POP 10 .STATION DATA TWIRP5 FORTRANAV POP 10 THERMOMETER CORRECTION THERMOMETRIC DEPTH
UNIVERSITY OF TEXAS, PORT ARANSAS, TX
147 FORTRAN IV IBM 360/65 READS NCDC STATION DATA TAPE51 FORTRAN IV COC 6600 PRODUCTPITY OXYGEN52 FORTRAN IV COC 6600 SPECIES DIVERSITY JOB52 FORTRAN IV COC 6600 PRODUCTIVITY ECCPRCO
UNIVERSITY OF WASHINGTON, SEATTLE, WA
146 FORTRAN II27 FORTRAN IV52 FORTRAN IV2 FORTRAN IV53 FORTRAN IV53 MAP'
IBM 7094 STATION DATA REDCOC 6400 THREE-OIMENSI
. IBM 7094 CONCENTRATICCOC 6400 ,COMBINED CHLIBM 7094 PHYTOPLANKTONIBM 7094 PHYTDPLANKTCA NU
CT ION SYNOP '
L SIMULATION PACKAGE AUGURS PER SQUARE METER OF SURFACEROPHYLL AND PRODUCTIVITY
MBERS VOLUME SURFACE AREABERS VOLUME
UNIVERSITY OF WISCONSIN, MILWAUKEE, NI
134-FORTRAN IV UNIVAC 1108 SPECTRAL ANALYSIS CF TIME SERIES134 ALGOL B 67C0 SPECTRAL ANALYSIS CF TIME SERIES
POLYTECHNIC INSTITUTE AND STATE UNIVERSITY, BLACKSBURG, VA
136 FORTRAN IV IBM 370 - PROBAEILITY DISTRIBUTION WEIBUL56 FORTRAN IV IBM 370 RESOURCES ALLOCATILN IN FISHERIES MGT P'ISCES56 FORTRAN IV IBM 370 .WATER RESOURCES TEACHING GAME DAM50 FORTRAN IBM 370 OPTIMAL ECOSYSTEM POLICIES CEP
ti
WILLIAMS COLLEGE, WILLIAMSTOWN, MA
25 FORTRAN IV IBM 1130 BEACH SIMULATION mcogi. .
29 FORTRAN IV IBM 1130 BEACI. AND NEARSHORE MAPS A-S
WOODS HOLE OCEANCGRAPHICANSTITUTIONt WCOCS HOLE, MA
118 FORTRAN /V XDS SIGMA 7 HORIZONTAL HISTOGRAMS HISTO118 FORTRAN IV XDS SIGMA 7 PRINTER PLOTS LISPLO119 FORTRAN IV XOS SIGMA 7 PLOT CF FREQUENCY DISTRIBUTION THISTC119 FORTRAN IV XDS SIGMA 7 VELOCITY VECTOR AVERAGES VECTAV119 FORTRAN IV XDS SIGMA 7 PROGRESSIVE VECTORS PROVEC119- FORTRAN IV XDS SIGMA 7 PLOTS OATA ALONG TRACK
. 119 FORTRAN IV XDS SIGMA 7 PROFILE VERSUS TIME OR DISTANCE120 FORTRAN IV HP MINI PLOTS NAVIGATION WITH ANY-OTHER OATA TYPE OEEP6102 FORTRAN IV XOS SIGMA 7 RAYTRACE91 FORTRAN IV XOS SIGMA 7 SOUND VELOCITY lONVEL
224
234

Or 97148143143
8
899
999
1010
FORTRAN IVFORTRAN IVFORTRAN IVFORTRANFORTRAN IVFORTRAN IVFORTRAN IVFORTRAN IVFORTRAN IVFORTRAN IVFORTRAN IVFORTRAN IVFORTRAN ,IV,
XDS SIGMAXDS SIGMAXDS SIGMAHP 2100HP 2100XDS SIGMAXDS SIGMAXDS SIGMAXDS SIGMAXDS SIGMAXDS SIGMAXDS SIGMAXDS,SIGMA
7
7
7
7
77
7
7
7
77
t
DEPTH,CORRECTICN MXCOR SOUND VELOCITYEDITING FCR MECI FORMAT SCRUBTHERMCMETER CCRRECTIONTCPLCTHERMOMETER CORRECTION-DEPTH COMP HVD1STATICN DATA HYC2BRUNT-VAISALA FREQUENCY OBVFRQDYNAMIC HEIGhT DYNhTPOTENTIAL ENERGY ANOMALY PEN,VARIOUS PARAMETERS FROM STATION DATA OCCCMPSPECIFIC VCLUME ,ANLMALY SVANOMPRESSURE SLERCLCEINE PRESS ,
REACS STATICK DATAGECSTROPHIC VELOCITY DIFFERENCE VEL
10 FORTRAN IV XDS SIGMA 7 VOLUME TRAKSPCRT VTR0 FORTRAN IV XDS SIGMA 7 SIGMA-T SIGMATAND DSIGMT10 FORTRAN IV XDS SIGMA 7 ADIABATIC TEMPERATURE GRADIENT ATG10 FORTRAN IV XDS SIGMA 7 POTENTIAL TEMPERATURE POTEMF10 FORTRAN IV XDS SIGMA 7 SPECIFIC VCLUME SPVOL
136 FORTRAN IV XDS SIGMA 7 STATISTICS FRCP WHCI FCRMAT STATS105 FORTRAN IV HP 2100S LORAN OR CMEGA CONVERSION "UFOS105 FCRTRAN IV HP 3100A CRUISE TRACK TMERC105 FORTRAN IV XDS SIGMA 7 TRANSFORMATICN CF SPHERICAL COORDINATES ROTGUT106 FORTRAN IV XDS SIGMA 7 SUM CF FINITE RCTATICKS ON_A SPhERE SUMROT41 FORTRAN IV XDS SIGMA 7 GECMAGNETIC FIELD MFIELD
t.50 FORTRAN IV XDS SIGMA 7 WHOI BICLCGY SERIES FTAPE50 FORTRAN IV XDS SIGMA 7 WHCI BICLCGY SERIES FLISHT50 FORTRAN IV XDS SIGMA 7 WHCI BICLCGY SERIES CPKSPIT50 FORTRAN IV. XDS SIGMA 7 WHCI BICLCGY SERIES SELECT50 FORTRAN IV XDS SIGMA 7 WHCI BICLCGY SERIES CIANAT50 FORTRAN IV "XDS SIGMA 7 WHOI BICLCGY SERIES PREPLOTG,50 FORTRAN IV XDS SIGMA 7 WHCI BICLCGY SERIES PLOTSPECG50 FCRTRAN IV XDS SIGMA 7 WHOI BICLCGY SERIES STATAB77 FORTRAN IV XDS SIGMA 7 CURRENT METER CLOCK SEQUENCE XTAL78 FORTRAN IV XDS SIGMA 7 CURRENT METER CALIBRATION,OASDEC,78 FORTRAN IV XDS SIGMA 7 CURRENT METER DATA REDUCTION AND'EDITING CARP
6-
235
225
r .
FEDERAL INFORMATION PROCESSING STANDARD SOFTWARE SUMMARY
Ql. Summary date 02. Summary prepared by (Name and Phone)
A> '0
03.
or -..
Summary action
New Replacement DeletionYr. Mo. Day
1.1 05. Software title ./ 1.3 1.3
04. Software date Previous Intimal Software IDYr. Mo. Day
I I I. rn07. Internal Software ID06. Shorttitle .,
08. Software type
Automated DataSystem .Computer ProgramSubroutine/Module
09. Prossing
InteractiveBatch
mode
.
10.
Computbr SytemsSupport/UtilftyScientific/EngineeringBibliographic/Textual
GeneralApplication area
Management/-4"BusinessProcess ControlOther
.
Specific
;Comblnatjon
11. Submitting orp,anization and address 12. Technical contact(s) and phone
'
,..,
13. Narrative`'-
0
.
14. ,Keywords
- .
15. Computer rnanurr and model 16. Computer operating system 17. Programing language(s) 18. Number of source program state-ments
19. Computer memory requirements 20. Tape drives 21. Disk/Drum units 22. Terminals
23. Other operational requirements .
*24. Software availability '
-Available Limited In -house only
- 0
25. Documentation availability
Available Inadequate In-house only
26. FOR SUBMITTING ORGANIZATION USE
4C \
135-101
'2 3 6
Standard Form 11151974 July
U.S. Dept. of commerce-NEIS(FIPS. Pub. 30)

INSTRUCTIONS
01. Summary Date. Enter date summary prepared. Use Year, Month, Day format: YYMMDD.
02. Summary Prepared By. Enter name and phone number (including area code) of individual who prepared this summary.
03. Summary Action. Mark the appropriate box for new summary, replacement summary oi deletion of summary. If this software summary is a replace-ment, enter under "Previous Internal Software ID" the Internal software identification as reported in item 07 of the original summary, and enter thenew internal software identification in item 07 of this form, complete all other items as for a new summary. if a software summary is to be deleted,
41111; enter under "Previous Internal Software ID" the Internal software identification as ieported in item 07 of the original summary, complete only items01, 02. 03 and 11 on this form.
b
04. Software Data. Enter date software was completed or last updated. Use Year, Month, Day format: YYMMDD.
05. Software Title. Make title as descriptive as possible.
06. Short Title. (Optional) Enter commonly used abbreviation or acronym which identifies the software.
07. Internal Software ID. Enter a unique identification number or code.
08. Software Type. Mark the appropriate box for an Automa'ed Data System (set of computer programs), Computer Program, or Subroutine/Module,whichever best describes the software.
09. Precipitin Mode. Mark the appropriate box for an Iteractive. Batch, or Combination mode, whichever best describes the software.
10. Application Area.General: Mark the appropriate box which best es the general area of application from among:
Computer Systems Support /Utility Process ControlManagement/Business Bibliographic/TextualScientific/Engineering Other
Specific: Specify the sub-area of application, e g "COBOL optimizer' if the general area IS 'Computer Systems Support / Utility', -Payroll" if thegeneral area is "Management/Business"; etc. Elaborate here If the general area is
11. Submitting Organization and Address. Identify the organization responsible for the software as completely as possible, to the Branch or Division level,but including Agency, Department (Bureau; Administration), Service, Corporation, Commission, or Council. Fill in complete mailing address, includingmail code, street eddress, city, state, and ZIP code.
12. Technical Contacts) and Phone: Enter person(s) or office(s) to be contacted for technical information on subject matter and/or operational aspectsof software. Include telephone area code. Provide organization name and mailing address, if different from that in item 11.
13. Narrative. Describe concisely the problem addressed and methods of solution. Include significant factors such as special operating system modiflications, security concerns, relationships to other software, input al output media, virtual memory requirements, and unique hardware features.Cite references, If appropriate:
14. Keywords. List significant words or phrases which reflect the functions. applications and features of the software. Separate entries with semicolons..15. Computer Manufacturer and Model. identify mainframe computer(s) on which software is operational.
Computer Operating System. Enter name, number, and release uncle' which software is operating. identify enhancements in the Narrative (item 13).
17 Programing Language(s), identify the language(s) in which the software is, written, including version, e.g., ANSI COBOL, FORTRAN V. SIMSCRIPT 11.5,SLEUTH II.
18. NurAer of Source Program Statements. Include statements in this software, separate macros, called subroutines, etc.
19. Computer Memory Requirements. Enter minimum .nteinal memory necessary to execute software, exclusive of memory required for the operatill?system. Specify words, bytes, characters, etc., and number of bits per unit. Identify virtual memory requirements in the Narrative (item 13).
20. Tape Drives. Identify number needed to operate software. Specify, if critical, manufacturer, model, tracks, recording density, etc.
4E. Disk/Drum Units. Identify number and size (In same units as "Memory" Item 19) needed to operate software. Specify, if critical, manufacturer,model. etc.
22. Terminals. Identify number of terminals required. Specify, if critical, type, speed, character set, screen/line size, etc.
23 Other Operational Requirements. Identify peripheral devices, support software, oi 'elated equipment not indicatedabove, e.g., optical character devices,facsimile, computeoutput microfilm, graphic plotters.
24. Software Availability. Mark the appropriate box which best desciibes the suftwaie ava,labiiity from among. Availableto the Public, Limited Availability(e g. for government use only), and For Inouse Use Only. If the software is "Available ', include a mail or phone contact point, as well as the priceand form in which the software is available, if possible.
25. Documentation Availability. Mark the appropriate box which best desciibes the documentation availability from among; Available to the Public, Inadequate for Distribution, and For In house Use Only. If documentation is 'Available ', include a mail or phone contact point, as well as the price andform in which the documentation is available, if possible. If documentation is presently inadeq,ate , show the expected availability date.
26. For Submitting Organization Use. This area is provided for the use of the organization submitting this summary. It may contain any informationdeemed useful for internal operation.
237
U.S. GOVERNMENT PRINTING OFFICEi 197e-21-0-801/27e