I @f TU '-# E3 rTnf | Report No. SA -I la I II~nnUjaI~ UU - World ...
176
I TTR I CTED I @f TU '-# E3 rTnf | Report No. SA -I la I II~nnUjaI~ UU IPFP n rep(! [~~~~~~ ~ ~ ~ ~ ~ ~~ &PAWo' I" I This report was prepared tar Use w 11. li_1 n liated organizations. They do not accept responsibility for its accuracy or completeness. The report may not Ihe published nor may it be quoted as representing their views. INTERNATIONAL BANK FOR RECONSTRUCTION AND DEVELOPMENT INTERNATIONAL DEVELOPMENT ASSOCIATION TW~rTT'% mCrr T A T T'7 A flTt-kTT fVC'L T7) A TTq ' 1INDUSTR J. XIiIZAT ION OFX PAY_IS A N THE RECORD, THE PROBLEMS AND THE PROSPECTS (in three volumes) VOLUME II SECTOR REPORTS March 10, 1970 South Asia Department Public Disclosure Authorized Public Disclosure Authorized Public Disclosure Authorized Public Disclosure Authorized
-
Upload
khangminh22 -
Category
Documents
-
view
1 -
download
0
Transcript of I @f TU '-# E3 rTnf | Report No. SA -I la I II~nnUjaI~ UU - World ...
I TTR I CTED
I @f TU '-# E3 rTnf | Report No. SA -I laI II~nnUjaI~ UU
IPFP n rep(
PART ONE: AGRO-BASED INDUSTRIES

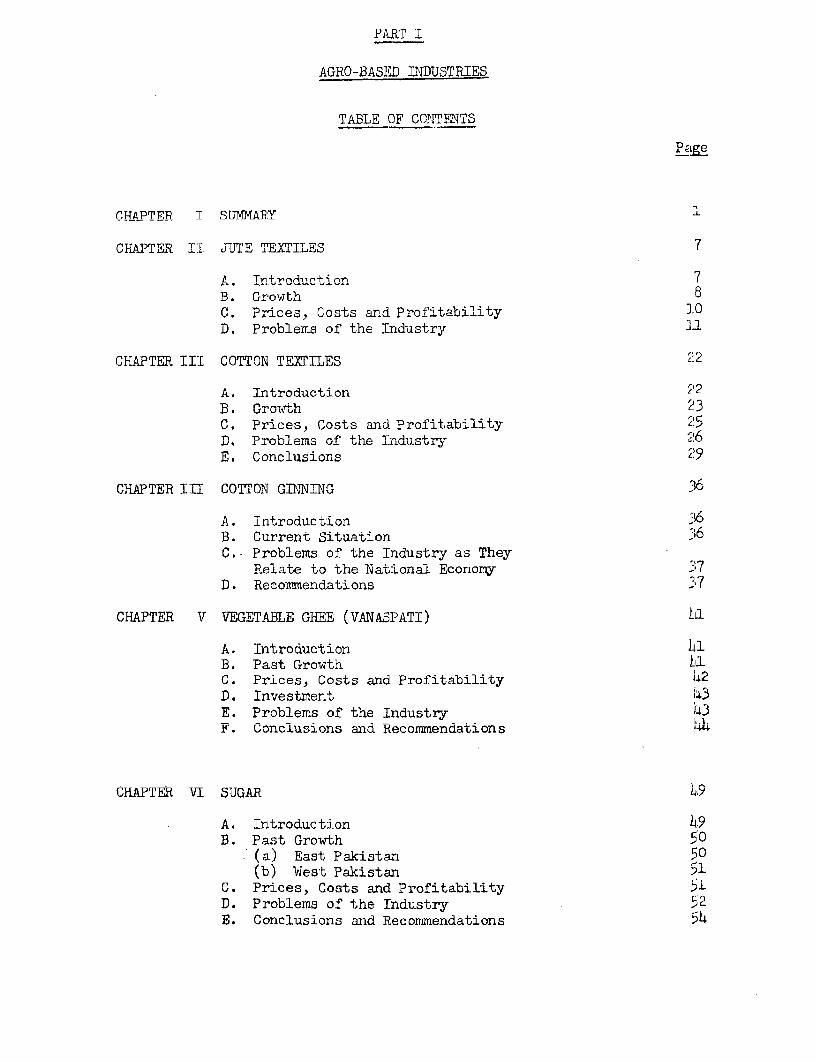
PkRT I
AGRO-BASED DDUSTRIES
TABLE OF CONTE\TTS
CIAPT7R T SUMMARYT
CWAPrV.- IT: TTTTr TF.YTTTF.S 7
A. Tr+.oduti+.o -n 7B. GrowthC. Pr ces, "osts and Profitaility 1.0D. Problems of the Industry l1
CHAPTER III COTTON TEXTILES r2
A. Introduction 22B1. GUrtVULh -
C. Prices, Costs and Profitability 25V. Problems oLf UiIndu.-
E. Conclusions 2
CHAPTER III COTTON GINNING 36
A. Introduction 6B.D Currernt SituationC. Problems of the Industry as They
Relate to the National Economy _'D. Recommendations ;37
CHAPTER V VEGETABLE GHEE (VANASPATI) La
A. Introduction IlB. Past Growth LC. Prices, Costs and Profitability 142D. Investment 43E. Problems of the Industry 43F. Conclusions and Recommendations 4
CHAPTEK VI SUGAR 4'
A. Introduction 9>B. Past Growth 50
(a) East Pakistan 5u(b) West Pakistan
C. Prices, Costs and ProfitabilityD. Problems of the Industry 52E. Conclusions and Recommendations 54

Page
CHAPTER VII SEAFOOD FREEZING 66
A. Introduction 66
B. Past Growth 66
C. Prices, Costs and Profitability 67
D. Problems of the Industry 67
E. Conclusions 69
CHAPTER VIII TOBACCO 70
A. Introduction 70
B. Past Growth 70
C. Prices, Costs and Profitability 74
D. Problems of the Industry 74
E. Conclusions 75
ANNEX I ESTIMATE OF APPARENT USE OF COTTONSEED OIL, 1967/68
CHAPTER I
SUMT.rARY
1. This section analyzes the problems and prospects of agriculturs-based indust.ries in Pakistan. It is essentially based on a sample surveyof some 40 plants of varying size and producing different products.
2. Th.e objective of the survey was to obtain within a limited timean understanding of the major problems in the agro-based industry sector. Theindustries considered important in this sectcr are:
Jute and jute manufacturesCotton and cotton textilesSugarVegetable aheeCotton ginningSeafood freezinzWool and wool manufacturesLeather tanning and manufacturesTobacco and manufactures
3. This is quite a formidable list and it has not been possiblewithin the time limit to deal with each in great detail. However, theindustries considered to be the most important in the agro-industry economyare di sc1sed in some detail in the chapters that follow.
4. Agro-bhasd industries dominate .the present industrial structureof Pakistan. They account for 64% of industrial employment and 63% of valueadded in industry (see Table I--1) -
The advantages of agro-based industries in Pakistan are avail-ability of domestic raw materials at prices comparable to those in otherprimarv producing coulntriA- labhor intensi veness when em.ployment atthe cultivation stageis included, low labor costs both in the production ofprimary inpu.ts and in processing anl, except fo- capiual plant, a small importdependence consisting largely of spare parts and secondary processingm.aterials. ValUe ad.(ed iS substantial since proces1ng 1s performed onlow-cost resource inputs of which some are by-products of other primaryproducts (motton seed bagasse, n qolasses, and lin+ers). Their produrtshave a large internal market. External markets are available, but under
constraints bo a certain poi- foxeign obs-cles Lo threatento become prohibitive.

- 2 -Table I-1
COMPARISON OF MAJOR AGRICULTURE-BASEDINWUSTRIES WITH ALL MAN-UFACTURING, 1966-67
(Million Rupees)
Employ- % of Total Gross Value % of Total Value % of Totalment Agro-Based of Agro-Based Added Agro-Based(to0o) Industry Production Industry Industry
igaF rfactori Rs
and refineries 23 6.1 773 11.0 437 14.9
Edible oils and fats 6 1.6 599 8.5 146 5.0
Tea factories 10 2.6 445 6.3 198 6.7
Cigarettes 9 2.4 613 8.7 384 13.0
Cotton textiles 167 44.3 1,797 25.6 888 30.2
Woolen textiles 6 1.6 90 1.3 33 1.1
Jute textiles 82 21.8 768 10.9 339 11.5
Carpets and rugs 3 .8 20 .3 8 .3
Dyeing, printing andfinishing textiles 6 1.6 74 1.1 29 1.0
Footvwea~r, excep'trubber 3 .8 33 ,5 10 .3
Footwear, rubber 5 1.3 93 1.3 33 1.1
Pulp and paper board 8 2.1 181 2.6 89 3.0
Leather tanning andfinishing 7 1.9 171 2.h 43
Cotton ginning 1 4 4z 1-3.4 85 2
Jute pressing F 7 21 v '2
Total above 35O 92.8 6,17 97.0 ,791 94.8
All Manufacturing 587 1l,352 4,664
Total AgricultureBased Industry: 377 7,028 2,944
as % of allmanufacturing 64.2 61.9 63.1
Soarce: GCensus of M--UP.factures International Econoindr Section,Planning Commission, y 17, 1969.

6. Investment in the industries is substantial, with foreign ex-change outlays accountin.b for abcut 50% of t-'Gotal- cos't. Tv-Lh recurringannual import requirements and annual external debt servicing constitutingsmall foreign exchange costs of production, the agro-based lndustries' out--put, appropriately priced, produces a benefit that ranks high in comparisonTr.rt;+h other rmanufacitaires notu based on iien-sprimu-n-y materlails.
7. The problems of particular interest tG the riassion were capaci1tyunder-utilization, costs and prices, impact of the bonus system and tariffs,raw materials supply, producti-v-.ty and labor efficiepcy. "Agro-basedindustries" is a conglomerate nomenclature covering widely disparate enter-prlses and in .ost of their problems there is, no inter-relation. Forexample, labor productivity in the cotton textile industry is a major
-mI:, Ls notL- so signtficant in the sugar, ghee and tanning indus-tries where -the mnajor problems are raw material quality, price and supply.
8. The country's agro-based industries fall into three categorieswith regard to output end -use: la) those that are largely export-oriented(jute goods., carpet wool and carpets, fine leathers); (b) nmixed domisticand export-oriented (cotton textiles); (c) totally domestic-oriented(sugar, ghee). Their finished product prices are only marginally highert-an unose of comparable imports if the prices of the latter are not dupn?,distress, or otherwise subsidized by country of origin and do not requirea high degree of protection. The major exception is sugar. Certaindomestically oriented agro-based industries sometimes compete with importsun-der special and peculiar conditions.
9. The principal objective of exchange policy (bonus exchange ratesystem) as it affects manufacturing was to raise the effective cost ofcompeting imports and to maintain the profitability of exports. Thepolicy, in general, has succeeded admirably and has contributed to thehandsome earnings of the export-oriented cotton and jute textile industries.Since the irnport content of production in these industries is low, theoperation oi the system has not affected them significantly on the importside even though the C.I.F. cost of imports is on the average about doublethat at the official rate of exchange.
10. The impact of the bonus system was perhaps more profound on thecotton textile industry than any other in the sector. Exports have beenextremely sensitive to fluctuations in the bonus rate. It can be arguedthat the boinus was the prime stimulant to the export orientation of theindustry ancl the basis for its high profits. The behavior of cottontextile exports in relation to fluctuations in the bonus rate raises somequestions: (a) does the industry depend solely on the export regime forits profit or nearly so; (b) is the industry excessively subsidized and canit actually meet competition in overseas markets at a reduced export sub-sidy rate; (c) is there a compelling need for continuing protectionand encouragement to an in(lustry now appi oaching middle age; (d) shoulclnot some of the benefits of the bonus system be extended to the producersof primawry inputs to the extent that their production needs encouragement?
11. A special problem has arisen in the industry as a result of the
recent increase in Mwni;mm wages for uinskilled labor. The largest
employers in the sector, jute and cotton textiles, report that the labor
cost componer.t in the sales price averaged about 10% and 17% respectively.
In the jute textile industry, about 40d of the labor force is classified asuns1killed, axd in the cotton textile industry- about 30%. In the other
industries in the sector, the ratio is roughly 33% unskilled. On an industry--.ide basis, replies to the Mlssion qiuestionnaire suggested that about one-
third of the labor force would benefit from the wage increase in varyingamo-unrts. Although the quantitatiye bhasis for evaluatina the absoluite in-
crease in labor cost and its effect on production costs is not available
to the Mission, it would appear that it will be moderate.
12 * The question of price ntsrovflen for agricult1ral inputs
should be considered from several points of view, industry by industry.The sugar irndustry in both East and Wlest is disadvanta-eA b- low sucrosecontent in cane while at the same time enjoying the benefits of a ratherhigh government fixce selling price for the finished produc+. The obvious
means of raising prices to cane growers is by means of compensation related
to sucrose content. However, the schem.e was tried to the dissatisfactionof farmers who could not understand why they received higher prices at the
height of the season (w-hLen the sucrose content is at a maimwr.n) than theydid at the beginning when it was low. The only lasting solution to theproblem is a general up-grading of the crop through disse4iation of better
varieties, the extended use of fertilizer and other improved agronomicfactors -- all a long-term eflort. In the interim, it appears that theprice of sugar should be lowered for the benefit of the consumer, especially
in West Pakistan where profits in the industr-y are very large.
13. Prices paid to cotton growers could be related to the textile
industryts bonus exchange rate, while at the same time considering the
effect price changes would have on cotton textile productionr anu on ra-w
cotton exports. Since Pakistan will soon begin experiencing the restric-
tive effects of the International Cotton Textile Agreement, and sirnce raw
cotton exports are not subject to these restrictions, it would be desirable
to expanTd in the future exports of both cotton textiles (to the limit
possible) and raw cotton, and to adjust the producer prices and the bonus
exchange rate accordingly in favor of raw cotton. In the case of raw jute,
the need for price adjustment to the grower is determined primarily by the
need to increase the supply of raw jute to the domestic industry. Tne
optimum strategy in jute marketing and processing calls for a long-term
master plan in order to assure maximum benefits to East Pakistan, which in
jute processing has a unique comparative advantage.
l. Within the time available to the Mission, a reconnaissance of
the entire vegetable oil industry from farm to finished product was not
practicable. Effort and emphasis were put on the popular consumer items,
ghee or vanaspati. The principal problems of the industry are two: (a) an
increasing dependence on imported oil on which there are high import duties,
and (b) a high capacity tax. Ghee consumption in the country is in excess
of oil available to the industry. In order to minimize imports, a restruct-
uring of the cotton-ginning industry to include expanded production of
cotton seed oil is discussed in detail in Chapter V. Implementation of

the proposed scheme by concentrating cot-o..n seed crushiing facilities inthe cotton growing areas wouldserve to reduce the prevailing excessivewaste of po"ential cotton seed oil resulting from spoilage ard would alsoreduce transport costs.
15. Pulp and paper industries are located in both wings and arebased on different resources in each. In the East, the primary rawmaterials are wood and bamboo. In the West., primary inputs laroelv arewaste or by-product materials: wheat straw, liriters ard cotton mill was-,eThe demand f'or paper has been continuous-1r _., -l at rt cjrImo,oa-d rateof about l0,' annually. Projected demand for 1974-75 is about 190,000 tonswhich poses a problem of raw mater:al sunply. Wood soiirces in rite East cansupply only the existing newsprint mill; baxrC.oo in the northern area of "-theChittagong Hill tracts is comiitted to excisting mills, lea.ing the untapprclbamboo growths in the south as the so-urce of supply for the proposed newmill. In the West, wheat straw ard ntb r4rmiaterials are i n -lentifUl supplyfor the existing strawboard mills i-.- probably enough would be availablefor considerable future expansion.
16. An .Lho ugh the potenttial supply of bagasse for paper 4aing islarge, the material by itself makes an inferior quality, low strengtthpaper of limi ted usefulness nlless blended with long filore woo pulp jhj-c_would have to be imnorted. For future pulp requirements above local re-sources, consideration may be given to a joint ventuWre to tap the world! .most extens:ive bamsboo groves in Burma's Arakan region which is adjacent toEast Pakistan7s souther.n hborder.
17. The contrTs woolen iMclustry has been expanding ara recently iasentered the high-grade, machine-made carpet field. The industry, whichincludes wool scouring for export, textile production and carpet making,is import dependent for apparel wool, the local variety being too harsh intext.ure for -arment- Expor4s mad4e entirely of local woo' have a cost art-vantage over those made from imports (which are purchased against bonusvou h.es, +e p m onUq nh-r .eIr n 150 bo nLU0%) whlch places theindustry at a disadvantage relative to other exporting countries. However,receipts through the bonus market (Up to 7%4 of exchnge surrenderedoperate to permit exports.
18. The incentive policy for stimulating industrial growth appears tohave worked well in general. Ho-wever, it has resulted in some uneconomic.locations; cotton seed crushing plants nearly a hundred miles from growingcenters is nMre cri-L±±cal examirnaion of the external andinternal dis-economies engendered by unadvantageous locations appears tobe in order before grnting tax holidays as an incentive.
19. A seos problem confronting manufacturing inwustries which dcnot have the:ir own electric power generating facilities (most of them) isthe frequent and sometimes lengthy power outages. An estimate of produc-tion loss value is not available but it is safe to say that over a period.Of years it probably would be more than the cost of rehabilitating aninadequate distribution system.

20. Growth in the sector has been most impressive. The resultsfrom large expenditures for capital eqquipr±Ent ha-ve been most gratif-yiLngin terms of the industry's contribution to GNP. Some of the nation'smanufacturing plants installed unier previous rmulti-year plans are nowwell into their useful physical life span, and a few are outdated tech-nologically. The focus of development naturallyy is on new plants. Itis suggested that in the forthcoming Fourth Plan the necessary resourcesalso be directed toward replacement, rehabilitation and modernization ofexisting productive facilities which would raise productivity at a re-latively low cost.
CHirTER II
JUTE TEXTILES
A. Introduction
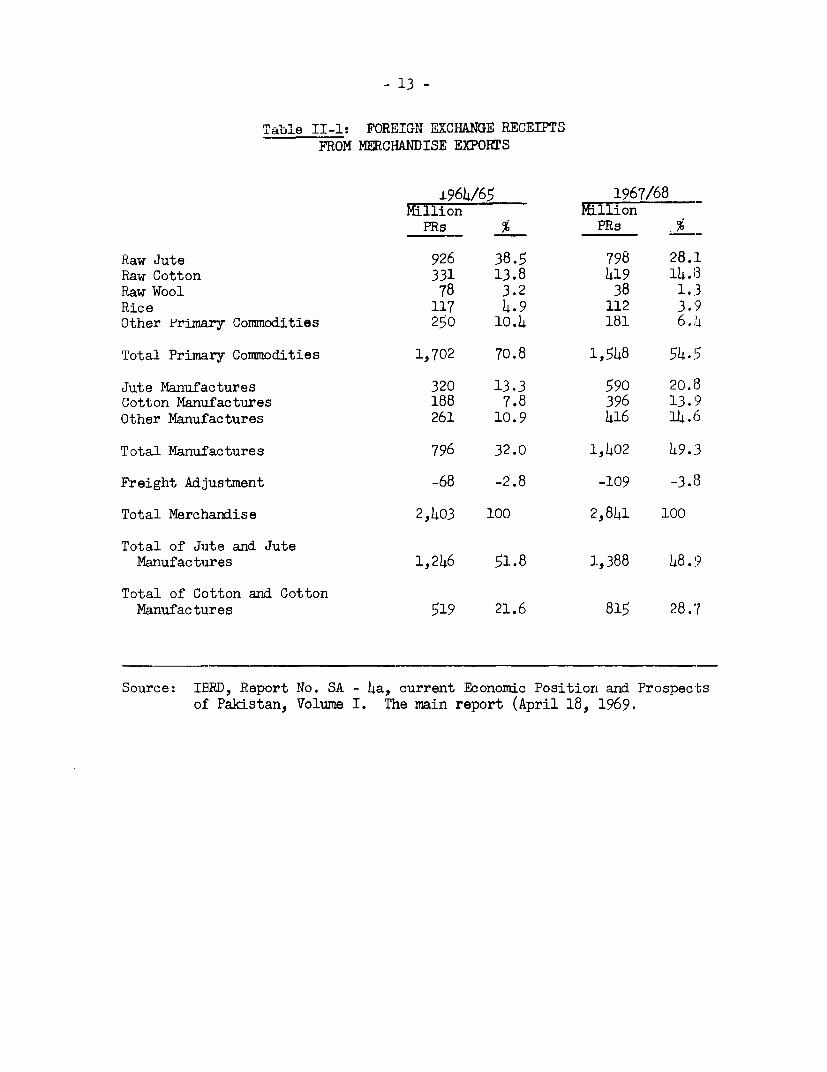
21. Jute and jute products are the country's leading foreignexchange earner accounting for receipts of Rs 1,388 million or 49% oftotal mercharndise exports in 1967-68 (Table II-I). In the same year,the crop was grown on 2.3 million acres ih the East (none in the V§st)pre-empting about 10% of the total cultivated area and yielded 6.7million bales or 1.2 million tons. For the period, the 56 mills (52in the East, 4 in the West) in the country nroduced 513,000 tons ofgoods (42% of raw f'ibre produced) valued at Rs 740 million. 1/ Theindustry consumed 535,000 tons of raw jute costing about Rs 470 million.,Value added. amounted to Rs 270 million. The industry employs 79,700 inthe East arnd possibly, 2,000 in th;e West_2/ or about 13% of aggregateindustrial employment.
22. T'he jute industry, and the associated production of its maininput, raw jute, is of critical importance for East Pakistan. Rawjute is its main cash crop, and jute manufacture the main industry, pro-viding 43% of industrial employment in the region.
23. East Pakistan commands outstanding comparative advantages injute manufacturing. The quality of raw jute is high. Labor costs, bothin production of raw jute and in jute manufacturing, are low and theproportion of labor costs in total cost is large. The dependence of theindustry on imported inputs is negligible -- 4-5% of the gross value ofproduction. Raw jute is a bulky, low value product and its cost oftransport to foreign manufacturing centers is high, thus putting themat a disadvantage compared to processing facilities located in Pakistan.,
24. East Pakistan accounts for about 45% of world production ofraw jute and about 33% of world production of raw jute and allied fiberscombined (raw jute, kenaf or mesta). At the present time, less than onehalf of itv domestic production of raw jute is processed into manufactureswhich are then exported: the share of Pakistan in world exDorts of jutemanufactures is now about 25%. In the exports of raw jute, East Pakistanhas a commanding position: it accounts for about 60 of world exnorts.Consequently, the trends in Pakistan's production of raw jute and manu-factures influence to a substantial extent the supplv nosition in theworld jute economy while the world demand trends directly affect theeconomy of East Pakistan.
25. The combination of a uniaue comraqrative advantage position inworld production of jute goods, scarcity of alternative employmentopportunities at the present time, and the very large share i-n u orld
11 The value given is estimated on the basis of the average ex-factoryprice of product mix Rs 1,442 per ton given in Section C.
2/ Director of Labor, Government of East Pakistan. No data are avail-able for the West. Figure given is an estimate.
production and trade in raw jute and jute goods, poses a special problemof policy planning for the government. The situation is conplicated furtherby four additional factors. World demand for jute goods is expandingrelatively slowly and is exposed to serious threat by synthetic substitutes.In the world supply of jute goods, Pakistan faces competition of the oldestablished European industry and of the large jute industry in East India.The supply of raw jute is highly variable partly because jute competes with ricefor land and labor; the introduction of IRRI rice, with rmuch larger yieldsper acre, may adversely affect the long-run attractiveness of jute growingunless larger yields are offset by lower rice prices or jute yields improvewithout a corresponding fall in the jute price. The world jute economyis characterized by extremely sharp fluctuations in price caused by out-put variations and by cyclical changes in demand for consumption and forinventories. These price fiuctuations, in turn, make production planningvncertain, discourage supply and stimulate the switch to syntheticsubstitutesi, thus ireducing demand.
26. In the past 10-15 years, the problem of planning in the juteindustry was simpler than it will be in the future although the problemslisted above have been present. East Pakistan was then only establishingits jute goods industry. By the mid-1960's, however, the first problemsemerged: there was excessive expansion in one key product line (sacking)which led to subsequent shut-down of capacity, while the most profitableline -- carpet backing -- was neglected. For the future, the problemswill increase in complexity. A master plan is needed for the developmentof the jute industry within the framework of an over-all strategy coveringalso production and marketing of raw jute. Such a plan could then hope-fully be integrated with a similar plan prepared by India and also byThailand. While the difficulties in preparing such master plans are greatin view of the complexity of the problem, and the difficulties of inte-grating the plans cannot be overestimated, there is little doubt that onlya systematic international approach to the jute problem can yield optimumresults. East Pakistan and West Bengal are probably the poorest among thedeveloping regions, with a severe imbalance between population and resources.A satisfactory solution of the jute problem will not solve their over-allproblem of growth and welfare, but its contribution to it may be significant.The alternative is a cut-throat competition between Pakistan and India dueto over-expansion, from wlhich both countries will suffer badly over theshort run: while over the long run, they may end up by having a mirch smallerjute sector than today, with a corresponding curtailment of employment andincome all around which neither country can afford.
B. Growth
27. Growth of the jute textile industry is a tribte to the deter-mination of a people to industrialize the country's most important non-foodcrop. yi Tnenienc-e left Pakihsta.n with a wrell established cash cr- ofsignificant volume and value and no means of conversion to textiles: thesole means of exchange realization was to export the crop to those withestablished mills or to those who were constructing facilities largelyfor their own internal needs.
-9-
28. The area cultivated and produc-.ion of raw fibre has remainedrelatively static. except 'or bad crop years; for the 20-year period1947-48 through 1967-68 (Table II-2). From the early rmills of the 1950 s,productive capacity has risen to 22;771 loomsn in 56 mnills FTr'om a totalof 130,209 tons of textiles in 1955-56, production in 1967-68 rose to512.549 tons, an annual compound growth of 12.2% Tn 1967-68, minlTIutilized 415% of prcduction of raw jute (Tables II-3 and II-4)¢ 1/
29. Jute textile exports amounted o Rs 600).1 million in foreignexchange earnings in 19671-68. The major b wers fere East Africa-) LUS.A,Australia, West Africa, Turkey ancd the U.K., in that order. These six,out of more, thcan 50 imPort-ing cou-intries, absorbed about 71< of totalexports in 1967-68.
30. Beginrnng in 1962, the industry entered the market for carpetbacking utili zd bvy the burgeonin- tufted carpet induSt~ry. The growth cfexports was phenomenal from 1'56 tons at the beginning to aoout 25,000 t.onsin 1968-69 (Table TT_I-. The prospect of capturing a sig-i.ficant share ofthe market promoted sanctions for the installation of 3,010 broad looms ofwhich 1,522 currently are eith- o-erating, installed but not operating, oron order (Table I-4). Assumning that the 685 now installed produced the2.8 thousand tons sho. n l T- uu.t per oom was 36 tonIs. Or.!that basis, t1he 1,522 looms that are intended to be operative in theirnmediate future would produce 54,500 tons, or 220p of 1968-69 exports.Total sanctioned looms would produce 108,000 tons or 436% of currentexports. Although the available raw jute supply level is sufficient toprovide for such production, there may be severe pressure on market pricesif this expansion. takes place over a very short period.
31. In addition to the 52 existing mills in the country, five newmills, each containing 250 looms, and two of 500 looms each are reported.to be ready for operation in 1970 bringing the total number of mills to59 having a loomage of 25,021.
32. Implausibly, four mills having a loomage of 1,421 have been con-st-Ucted in the sWest- wing. One of the mlills, at Jaranwala, was conceivedat the time when large areas of the surrounding countryside were waterloggedan'd it wvas believed that Jute -was the only crop that would thrive. Pilotplantings proved successful and the mill was constructed concurrently withthe success u lowering of gro-unrdwater through the tube well program.Local cultivators promptly put their lands to sugarcane with the resultentdei se of the m ll.
33. Transportation exrpenses for raw material from the fields andbaling houses of northern East Pakistan via Chittagong/Karachi to the Westwing mills andl the costs of finished product transport back to Karachi forexport wouldl seem to preclude the mills from Drofitable operation. It issuggest tuat consideration be given to relocating the mills to the East.
1/ Pakistan publishes two esti-mntes of rawT Jute production, an. rfoffici4crop estimate" by the Ministry of Agriculture (Table I-1) based onsample surveys and yields and a "trade estimnateA' anparently derivedfrom consumption, trade and stock statistics which differ markedly inmost years (Table I-3). Efforts to find a consistent or explainablebias in the two series have not been revealing. See Background Noteon Jute, No. 4, Economics Department, IBRD.

- 10 -
C. Prices, Costs and Profitability
34. The average price paid for raw jute as taken from the returnsto the Mission's questionnU-aire was Rs 875 per ton. The average ex-factoryselling price of the product mix was Rs 1,442 per ton. The wholesale(export) price was Rs 1,578 per ton iI.o.b. (L 138.75). Tne average con-version cost of Rs 567 in mid-1969 compares favorably with the conversioncost in India: the latter amounted to Rs 561 for sacking and Rs 871 forhessian in early 1968. 1/
35. Excise duty is Rs 200 per ton for hessian sacking, Rs 125 perton for other manufactures. in addition, for domestic sales, there is asales tax of 15% on duty paid value, a rehabilitation tax of 1% on dutypaid value and a defense surcharge of 25% of sales tax amount.
36. Except for capital costs, imported inputs are between 4% and 5%of gross value of production. Since jute textiles, unlike cotton, are not"finished"t , there is little consumption of dyes and chemicals. Again,unlike cotton, jute is very abrasive and the wear on machinery requiresreplacement of parts more frequently.
37. The composition of aggregate sales value as indicated bythe Mission sample is:
Rs (000) %
Raw jute 30,070 46.2Imported materials 945 1. 5/aServices 2,800 4.3Other domestic inputs 271 .4Labor 10,379 15.9Selling expense 4.,256 6.5Admin. expense 2,203 3.4Depreciation 954 1.5Profit after direct taxes 6,240 9.6Direct taxes 560 .9General expense 6,354 9.8
Aggregate sales price 65,032 100.0
/a The imported input in this particular sampleis below the industry average.
38. The after-tax profit of 9.6% on sales is comparable with that inthe rest of industry; and industry in Pakistan has generally been quite pro-fitable. The application of the bonus voucher rate of 30% to jute productsexports has helped profitability. The profit margin on sales of 9.6%compares to 5.7% in the Indian jute industry. 1/
1/ Bension Varon, Indian Exports of Jute Manufactures, Problems and Prospects,January 1969 (IBRD paper).
D. Problems of the Industry
39. Jutel crops since the 1960-61 season have remained relativelystatic at about 1.1 to 1.2 million tons per year (6.1 to 6.9 million bales)except for the, poor year of 1964-65. By and large, yields have not Changedsince the latei 19401s. Tnere has been a moderate expansion in the areaplanted, and the crop is now on the average about 20% above the level of20 years ago. The growing domestic jute goods demand and the increasingvolume of fabric exports have absorbed increasing quantities of the relativelystatic raw jute supply; as a result, tle avail.ability of raw jute for ex-ports has been. continuously declining. Exports of raw jute are currentlyrunning at abcut 650,000 tons, and the use of raw jute for the domesticindustry about 500,000 tons. of which 420000 t!ons go into exports and80,000 tons into domestic consumption.
Iho. The prospect for increased carry over into 1968-^9 of raw Jute -iS:
Mi.llion bales
lotal available supply (Table II-4) 8.2
Less mill consumption (Table [I-3) 2.7
Less raw jute export (Table II-4) 3.81 7
Less mill sector internal textileconsumption (Table II-7) 0.4
Apparent carry over to 1968-69 1.3 (230,000 tons)
The apparent carry over (home consumption, waste, etc. not included) ison the order of the carry overs for 1966=67 and 1967-68 which seea,s toindicate that the rate of increase in textile production about balancesthe rate of decrease in raw jute exports. iTn brief, if raw Jute exportscontinue to decline absolutely and crops remain at the present level, andif textile exrnrts do not in-crease, carry overs (stocks) co-aid becomaeexcessive. The industry's efforts to increase sales has stimulated outputof carpet backiing Lwhiich is still only a small fraction ().4p) Of total out-put. However, there is little doubt that domestic processing wfill continueto expand rapialy and the problem over the longer r-un is that of insufficientsupply of raw jute rather than the opposite.
41. It is in the interest of Pakistan to expand the domestic process-ing industry, particularly in products for which world demand is increasing.At the same time, there is a major question of whatVthe export policy forraw jute should be, since&`he export supply serves to provide inputs for theindustry abroad which competes with Pakistan's jute goods exports. It is
- 12 -
in Pakistan's interest to attract foreign manufacturers of jute goodsto invest in the development of Pakistan's lute goods industry, thusminimizing competition in jute products and benefitting to the maximumfrom foreipn experience in technioues of nrodur.tion; m, nmgm,ent n nrimarketing. At the same time, Pakistan cannot stop exporting raw jute aslong as other nroducing c-oiuntries are nrepared to supply jute or alliedfibers to European manufacturers. This is one reason why the jute prob-lem shouRld be apnroached in the internationnl context-ni if a. all psiAnother reason is that cut-throat competition between Pakistan and Indiasholllr he ' voidm d Tn 1967- the competition in sacking wTas so severethat its price was almost as low as that of raw jute. The third reason
+itha p;nrirc flucintuatinns shouild be rerifeld qndi t.he nri crp kpnt. t+ alevel which will discourage further large-scale inroads of syntheticsubstitutes into the Jute market. The new threat is the ne plastics --poly-propylene and polyethylene. Past attempts at price stabilization ona~, natior,.alr basis have notc been -cs .. J-
I, S TTv-,A oy. ,+- 1;- .,n+, nn nef' r. !Jflof +IT nnn.,vono-Fl -r; es 1 .
the East wing; it is unacceptably high in the West. Most mills operate12 s1ifts a wek +'ke-sf opraio is -deer.e 4..1ctcl y h.LL C Q1.L-LJ.UC ~L, i2. LILLI.U~ W iJ.LL _V - V4.'.-L Li. i..i)I _.. .L11JjJ± d.U UL'2±.; C LJL y UIle
larger mills. a principal reason being the difficulty of mustering thelarge labor Por.ce for the late hour shift. LTnder.=pm-ilo-..ent 4i the
industry is not viewed so much as a "problem" but as a way of life - acor.dition to be accepted. For example, ,any mills employ one weaver perone or two looms. MaLnagement states that attempts to change the patternIln Eastd Paita%.Ld.a couLIU adcase uphea-v aLs Uiithe LabUUr forUU W4LL(c WUrU
have unpleasant results.
43. A common complaint in the East was the price of power and thefrequent occurences o ooutages*. Those inter-v-ie-wed adva-nced no estimateof the cost of power failures in terms of lost production.
44. Another was the ever present one of inefficient and irresponsiblelabor. Tlere was no mention of imlpro-virg working conditions or wagescommensurate with improved productivity.
45. The processing industry in the country is not old consideringthe useful physical life of jute machinery and large scale replacementof machinery is not imminent. However, some equipment has proved to be notas eff'icient as it should be and replacement is desired. The cost of juteprocessing machinery has tripled since the earlier mills were constructedand replacements will be increasingly costly.
- 13 -
Table I-1: rOR$INE EsCIIV1n REEPTSFROM MERCHANDISE EXPORTS
1964/65 1967/68Million Mi.llion
PRs % PRs
Raw Jute 926 38.5 798 28.1Raw Cotton 331 13.8 419 14.8Raw Wool 78 3.2 38 1.3Rice 117 4.9 112 3.9Other Primary Commodities 250 10.4 181 6.4
Total Primary Commodities 1,702 70.8 1,548 54.5
Jute Manufactures 320 13.3 590 20.13Cotton Manufactures 188 7.8 396 13.9Other Manufactures 261 10.9 416 14.6
Total Manufactures 796 32.0 1,402 49.3
Freight Adjustment -68 -2.8 -109 -3.8
Total Merchandise 2,403 100 2,841 100
Total of Jute and JuteManufactures 1,246 51.8 1,388 48.9
Total of Cotton and CottonManufactures 519 21.6 815 28.7
Source: IBRD, Report No. SA - ha, current Economic Position and Prospectsof Pakistan, Volume I. The main report (April 18, 1969.

- 14 -
Table II-2: RAW JUTE - EAST PAKISTAN /
(Area, production and per acre yield)
Yield Pro- YieldArea Production Per Acre duction Per Acre
(000 acres) (000 baiesj'2 kbaies) _(00 ton32) (ton)
1,'7-1048 2X059 6,843 3.3 1 -
1948-1949 1,877 5,479 2.9 978 .5219L9-1950 1,561 3,333 2.1 595 .38
Three Years' Average 1,832 5,218 2.8 932 .51
1950-1951 1,711 6,007 3.5 1,073 .631951-1952 1,779 6,331 3.6 1,131 .641952-1953 1,907 6,823 3.6 1,218 .647953-L 754 95360 3.7 645 .671954-1955 1,243 4,662 3.8 833 .67
Five Years' Average 1,521 5,487 3.6 980 .64
1955-1956 1,634 6,500 4.0 1,161 .711956-1957 1,230 5,514 4.5 985 .801957-1958 1,563 6,200 4.0 1,107 .711958-1959 1,528 6,0oo 3.9 1,071 .70-959-1960 1,375 5,554 4.0 992 .72
Five vears' Average -,1,466 5',9 .11,63.7
1960-1961 1;518 5,62 3.7 1,00' .b61961-1962 2,061 6,969 3-4 1,244 .601962-1963 1,723 6,300 3.7 1,125 .651963-1964 1,700 5,875 3.5 1,049 .621964-1965 1,660 5,328 3.2 951 .57
Five Years' Average 1,732 6,019 3.5 1,075 .62
1965-1966 2,198 6,693 3.0 1,195 .541966-1967 2,165 6,40c 3. -1143 .531967-1968/3 2,400 6,850 2.9 1,223 .51
/1 No commercial jute is grown in the West Wing.
/2 1 bale = 400 lbs. 1 ton (2,240 lbs.) = 5.60 bales.
/3 Inclluding mesta.
Source: Yearbook of Agricultural Statistics, 1968; Ministry of Agriculture and Works,jarulJary 1°60, GoverSment of P.aki;stan.
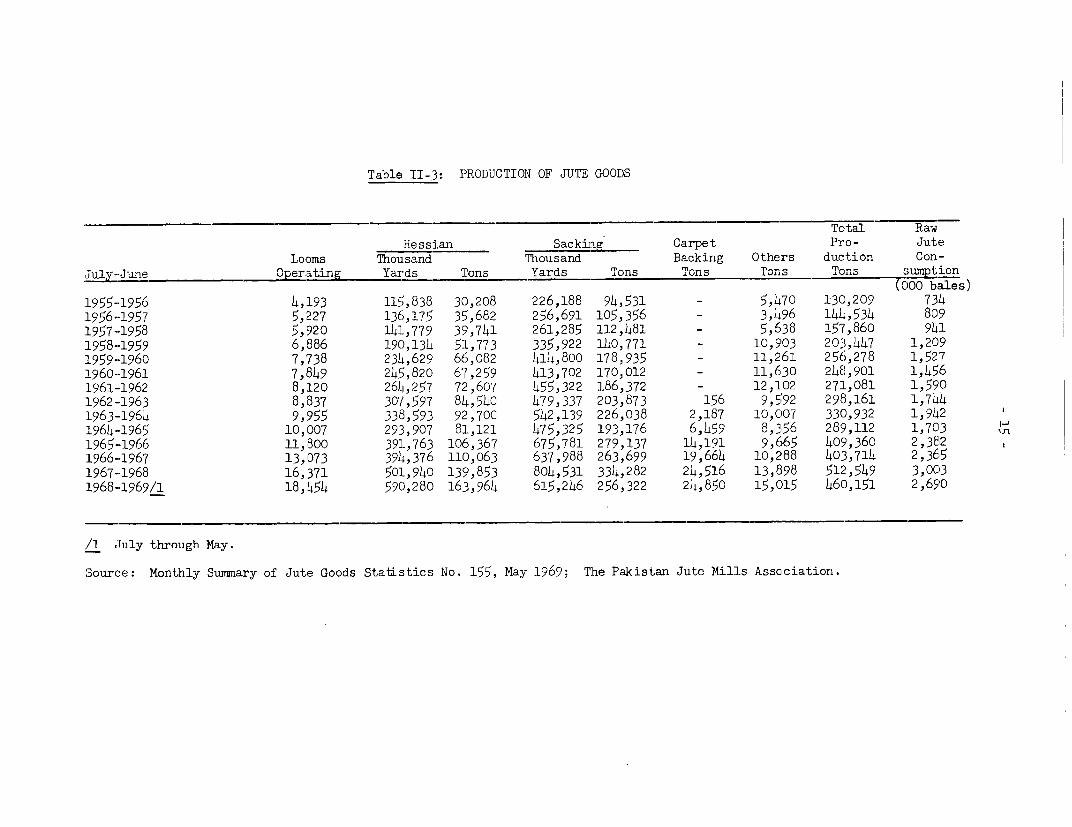
Table_ II-3: PRODUCTION OF JUTE GOODS
Total RawHessian Sacking Carpet Pro- Jute
Looms Thousand Thousand Backing Others duction Con-JLLv--June Operqting Yards Tons Yards Tons Tons Tons Tons s lmption
t000 bales):1955--1956 4,193 115,838 3(,208 226,188 94,531 - 5,470 130,209 734:1956--1957 5,:227 136,175 35,682 256,691 105,356 - 3,496 144,534 809:1957--1958 5,920 141,779 39,741 261,285 112,481 - 5,638 157',860 941:1958--1959 6,886 190,134 51,773 335,922 140,771 - 10,903 203,447 1,209:1959-1960 7,738 234,629 66,082 414,800 178,935 - 11,261 256,278 1,527:1960-1961 7,849 245,820 67,259 413,702 170,012 - 11,630 248,901 1,4561961-1962 8,120 26L4,257 72,607 455,322 186,372 - 12,102 271,081 1,590:1962-1963 8,837 307',597 814,540 479,337 203,873 156 9,592 298,161 1,7W41963-1964 9,955 338,593 92,700 542,139 226,038 2,187 10, 007 33(,932 1,94.21964-1965 10,007 293,907 8:L,121 475,325 193,176 6,459 8,356 289,112 1,7031965--1966 11,800 391,763 106,367 675,781 279,137 L4,191 9,665 409',360 2,3821966--1967 13,073 394,376 110,063 637,988 263,699 :L9,664 10,288 403,714 2,3651967-1968 16,371 501,940 139,853 804,531 334,282 24,516 13,898 512,549 3,OC03:1968-1969/1 18,454 59(,280 16:3,964 615,246 256,322 24,850 15,C015 460,151 2,6590
/1 July through Nay.
Source: Monthly Summary of Jute Goods Statistics No. 155, May 1969; The PEkistan Jute Nills Association.

0 -r4 r- C) 0 C) co IU\ r-l r- (n C C) O -1I P I 1 1 .I I . . . . . . . .,. . .
bQ c> Y\4) 9oD No\ o9c) - r-- o co c\ 0:: a) in' Hr C\r1 H r-i OJ r-i NIJ C\J CHNJ CD .
m -_OJ ONl > C\OJ IA r1 r-i CO (\I U r-l 1 V\t :Ws . ............... - D1t
IY) E) eH * *H* **r- CC o n O. H rH OJ OJC 'J c 1( odU1 E-4 4-' @ s r1 H r- OJ C'J OJ C\J (n z J r-
HO C\r J r-H O r'-'0 CO 9t) -I O-O C) O ') 0 r rI yH- O r- r . . . . . . . 0 9 0 . * MD r
.q ^ O C))0 r-H CM ---C r-i C\J r1 44 (\ X 00 C) 9) \rMl Ft PZ as ~~~~~~~~~o:\ r- \D r-- co cc 7 - c^- \.o r-- sD0 1E\ UN 9) 9D - -u chj
| Z~~~~~~~~~~~D CG r-i r- Ll C) OlJ 9D UX 0-\gD 04 V\ CO E- r) V% L- 4Cq vL\: -4 C)0 r-r- H H -r- ONAACo 1 0 C' rE\O) U'C\ C) C\ J r Lr\
Cti 0 cl $0 Oc) oca) Q c O I r- r- r O-s ID ) \0 I rdt | -I r--IHHH r-CO
3 .H *--I) .-- | l ) C0 V\ ' CO ICC) ACO 0a C) aC H 0 Cct; t.3 - rtI Id sD oJinna xOu2r-U JnJ )O -.=~~~~~~~~~~ 91 --- -7-F rn J 1tt CMt CM rif r-1 Ot r- ZX Jr 't_ ) I
~ri E- Eq K' i r-I rQrI ri rI r- l - 1.- r- I 1 -- ri r-1i ri r- 1, rI ri, '{i
H -4-' ,t4O Inx c' ON oX ' t- C\i 'L - D o ,C ->:. -.t G, rl -- °\ -J ON °> C) 't 4 tJFz Cli r II _1 _ (J I C\r C) _J rrIC C) C\ OJ \r C\ 4 CJ UN J C O *r4w 0 @4 tt 0 CJ irr J 0 0\ CIN rHI H4 H oi ONCM (NJ H ONJ N OJ CHti) , <
0 g4 ''-% Q. .. .. Ut ) eW A * tnE-i $-P -HH H; g r rI-i rH H r-l r4 r-i rH rHi ri CD
(DU) 4
P. to -4-- ON L-zt 'U-, r\ O C .7tr' .L \ -- -.4") -4 OC 0 C) :J 0o O a V\ C\o. c r- Cr\ CC) O04J t (tn -J rHl O'NC\ -i J r- :it *r4
43> CMt P C \ (NJ H CNI C\ I rH l rH C\ (J \Jd
oo EH
43'
H
;.. rc
Is~
Hr- C\Ol cLA :Nt) D X) O. rCi OJ In _JU\ V\ t-aD 'r4ii- f U IUUU\lJ\ V\in -r\V\lrN ) \D 'NO 1ID \0 \9D \0 I'D \0 r- >
O ONO\ ON N\ ON, ON. N. \ N\ ON OX C\ NO CN ION CP\ .-.~~a r4 r 4 r4 r~~~ r 4 r4 r1 ~ r1 r- r r-l r1i r4A r-4 r-i r4 r4 r-l 1_ 4 Fr aOI I I I I I II I i t I I I I I I I I -s C)
D) 0 rH (NJ Z A-C 1\'\\0 ('-CO ON O r-0 HJ ".)fN't -\ [-lj-\ UI b-\ Ill UE UL' U-r UE UE IJ' NO N) 'D \j) \,O N4D NO tD ,ON ON ON ON 0', ON , ON ON \ CO ON C' C ON CN Cr'. ONr ON C' O
H r4 -r1 r4H r1H rHl 'j rl- rj r- r r- r-A r- r- r1 -t r1 f--f J >s, C8

n rw- 17 -
Table II-5: BROAD LOOMS POSITICN AS OF JUNE 30, 1969
Installed bhut Sanctioned butName of' Mill (45) Operating not Operating On Order not, Ordered
Adamjee 128 95Amin loh 125Chittagong 100 20Ca,rpeting 50 25People 79Dl atn A r,, TVle1 AA h8 LR
Crescen.t 85 15Bawa30Latif EBawany 39 60
Nishat 23 2Tac_ 10 - -
Hafiz 60Qaumi 25Victory- - 65Gul Ahiried - 65Jessore - 50Anwara - 5Janata - 65Noapara - -( -
Easteni -- 65Pak - - -65Sonali - - - 65National - - -65Delta - - - 65Star Alkaid - - -50Monawar - - - 50Hossain - - - 50Banani - - - 25East Bengal - - -25Osmania - _ - 25Rubi General - _ - 25Karnaphuli - 200'R.R. - 65 - -
M.M. - - 65Bengal - - - 65Mashriqui _ _ 50Taj 50Allied - - 5Broad Burlap - _ - 65Purbachal - - 65 -Sultana - - - 65Chand - -- 65Mahsin - -- 65S.K.J. - - - 6$
Total (3,010) 685 247 590 1,4 8 8
Source: EPIDC

Table II46: JUITE LOOKAGE POSIT ON AS OF JUNE 30, 1969
Sanctioried Iris talled % of OperaLtirg % of
Flat Looms (Hessian ard Sackirg) Hess- - 7aE =a F ress- Sac k- 0tr Sanctiomid s-StaTot IxtaAl.diaj ing ian ing ian ing
EPIDC Mills (7) 1,825 1,151 2,976 1,P280 8146 2,126 71.14 ,091 ,789 1,880 88.84
EPL)C/Associate t4ills (22) 4,029 3,044 7,073 3,,279 3,0144 6,323 89.3 2,772 2,-59 5,531 137.5
Private! Mills (23) 7,226 6,260 13747 1 6160 901 95.7 4 5,860 12,2714 95.1
East Pakistan (52) 13,070 10,455 23,,525 11,300 10,050 21,350 90.8 10,277 9,408 19,6135 92.2
Weist Pakistan (W4)I li5 971 1,1 _ 1650 971 1A42L LOO.0 88 4131 519 36.5
Total (56) 13,5,20 11,416 21&,9146 11,750 11,021 22,77L 91.3 10,365 9,1339 20,2014 8138.7
Other E;quipn*nt -- E. Pakisan OperalSE
Broad looms (Sanctioned 3,t)10) 68,
Cot ton baggi rC looms 112
Carpet looms5
TaLpe locons 5:3
Tvistirg spindles (twine) 7,1400
Source: East Pakistan Industrmal 3evelowient t orooraticn.

Table II-7: SHIPMENTS FROM 1{ILLS(Tons)
= or Exor For Internal Cons-uxmtion =TotalCarpet Ship -
ulyr-June Hessi.an Sackinig B Lcking Others Total Hessian Sacking Cthers Total rrients_
1955-1956 24,221 60,7'15 Nil 7 84,943 5,496 29,694 5,130 40,320 125,2631956-1957 26,198 5'a1393 ll; 80,706 7, 647 45,738 3,605 57,:L90 137,89,61957-1958 32,510 70,7 67 " 384 103,661 8,288 42, 964 5,688 56,940 160,6011958-1959 44,299 91,33.12 "I 1L,666 137,277 5,296 42,293 7,684 55,273 192,5501959-1960 59,1 87 132,L16 " i,19c) 196,793 6,708 38,0o61 6,OhO 50, 309 247,6021960-1961 61,784 135,506 5,301 202,591 6, 091 35,894 6,061 48,o46 250,6371961-196:2 65, 396 146,437 " '3,891 215,774 8,4L58 40,730 7,663 56,,351 272,62,51962-1963 71,2'94 1&5,2:13 81 2,16L 218,752 9, 327 480,543 7,61L4 65,484 284,23F61963-196 | 78, j789 168,238 1,264 2,431 250,722 10, 031 50,287 8,491 68,309 31-9,531iQ64-1965 73,5,79 138,956 6,482 2,61i2 221,629 9,L44 51,6;26 7,660 68,730 290,3591S65-1966 91, 370 208,378 13,188 :3, 542. 316,478 16,568 4u,126 6,469 71,163 387,611966-196-7 90,373 232,5164 15,071 24,22C) 346,628 13,5993 49,103 4,8 05 67,901 414,52 9 11967-1968 1i30,0)35 260,3:11 25,,090! 6j,996 422,432 13,6L8 58,179 6,228 78,055 5(0,487 H1968-196'9/1 143,503 230,0OL5 24,336 7,808 405,692 12, 317 48,438 6,318 67,123 4'72,81.5 \
/1 July through May.
Source: Monthly Sumnary of Jute Goods Statistics No. 1.55, May 1969The Pakistan Jute Mi'L1s Association.
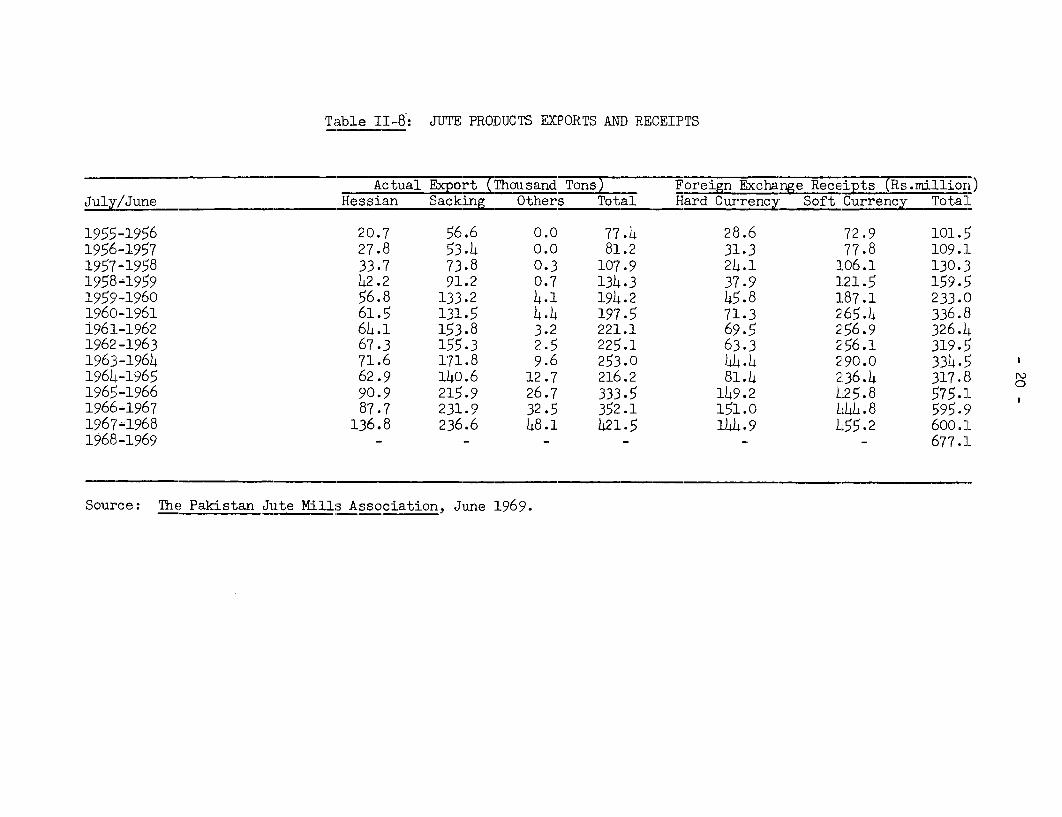
Table II-8: JUTE PRODUCTS EXPORTS AND RECEIPTS
Actia1 E7a= Thou sand Ton s7 _ Foreign Excchnge Receipt 7Rs .miJliorl)July/June Hessian Sacking Others Total Hard Currency Soft Currency 1'otaIL
1955-1956 20 .7 56.6 0.0 77.4 28.6 72.c9 ]01.',1956-1957 2'7.8 53.4 0.0 81.2 31.3 77.8 1-09.11957-1958 33.7 73.8 0.3 107.9 24.1 106.1 130.319584-959 4X2.2 91.2 0.7 134.3 37.9 121.5; 1-59.-51959-1960 56.8 133.2 4.1 194.2 45.8 187.1 2 33.0(1960-1961 6:1.5 131.5 4.4 197.5 71.3 265.4 336.81961-1962 64.1 153.8 3.2 221.1 69.5 2'56.c9 326.41962-1963 67.3 155.3 2.5 225.1 63.3 2'56.1 -319.51963-1964 71.6 171.8 9.6 253.0 44.4 2'90.C) 334.5 a1964-1965 62.9 140.6 12.7 216.2 81.4 2'36. 4 317.8 o1965-1966 90.9 215.9 26.7 333.5 149.2 425.8 5'75.11966-1967 87.7 231.9 32.5 352.1 151.0 444.8 8 595-91967T1968 136.8 236.6 48.1 421.5 144.9 455.2 600 . 119681-1969 - - - -- 67 7 77. 1
Source: The Pakistan Jute Mills Association, June 1969.

_ 21 -
Table II-9: EORTS SSIA, SACKIN.G OTHER JUTE MANUFACTURES BY DESTINATION
(Tons)
1965-66 1967-680Hess- Sacking Others Total Hess- Sacking Other&,Total
Destination ian _ianr
E. Arica 1J 4,136 32,166 321 46i623 32,059 67,9)49 11j3() 1()1;138U. S. A. 29,335 - 21,539 50,874 37,455 63 37,96'; 75,483Australia 1,616 37,740 107 39,463 2,018 39,084 14', 41,247W. Africa 660 53,873 494 55,027 6,240 34,533 473 41,246Tarkev 4,833 1,128 86 6,047 15,744 5,615 46 21,405United Kingdom 10,077 3,812 228 14117 13,484 4,399 366 18,249Chile - 8,363 - 8,363 - 10,203 75 10,278Netherlands 215 3,655 - 3,870 1,022 8,295 78:l 10,098New Zealirmi - 672 152 824 - 8,762 158 8,920Cambodia - 4,503 176 4,679 - 8,525 - 8,52'Japan _ _ - - 5,216 - 2,0993 7,315Italy - A427 _ 1,1427 442 6,7 1:1 7 917
Peru 16 4,13)4 _ 4,150 21 6,922 - 6,9)43R om~ri a - - )421 6,223 _ - ,Iran 965 365 423 1,753 1,259 4,689 3441 6,289Argenti rii 1)1;162 - - 1L4.162 5,646 104 1L 5,751Canada 5,524 - - 5,524 4,004 _ 589 4,593Belgium 136 1,393 - 1,529 1,123 2,433 56)4 4,120W. Indies 226 19,701 - 19,927 88 3,837 62 3,987Burma - 16,744 336 17,080 1,309 1,45o 716 3,475Uruguay 2,801 - - 2,801 3,)41)4 - '. 3,)41Iraq - 208 562 770 915 2,297 - 3,212Germany 230 584 - 814 1,1)45 1,371 43 2,559Brit. Guiana - 2,132 - 2,132 - 1,959 - 1,959Ei r e 34() - - 34 1 , 654 - 14
Hongkong 198 1,145 65 3 1,996 288 119 1,1810 1,587New Guin!-a - )481 - 1 -)]6(5 T 14 7)Nicaragua 275 6l44 - 91'9 32 1,400 - 1,432Denmark 5 75' 156 - 728 618 249 35:2 1,219Sudan - 3,073 - 3,073 - 1,178 23 1,201Greece 51 1,19)4 - 1,245 139 1,046 - 1,185Ceylon - - 44 6 1,1)40 1)4 1,160Albania - - - - 915 - 915Singapora - - 587 587 106 258 505 869Hungary - - - - 28 464 - 492
M o r,-),- 1~~~~ ~~~~~~~~~~.00 IPAMoro^c: tJt.,UtJ - - - 4uu -Kuwait - _ _ 6' 321 - 386Phii LpinT.s - = 22 359 381Cyprus 36 717 - 753 22 323 - 345Malaya -- 55 550 - - 2 327AfghanLst'an 123 - _ 123 76 184 h'7 307Yugoslavia 21 162 - 183 195 105 - 300France - - - - 284 - 28)4Lebanon - 209 - 209 - 283 - 283Norway 123 - - 123 228 8 - 236IJ. S. S. R. - 502 - 502 - - - -
Bulgaria - 155 - 155 _- -China 2,877 3,904 - 6,781 _ 104 - 1.04Indonesia, I0. ,,727 376 i,5(8 _ _ _
Other Coumtries 982 5,213 61 6f,2'5 172 566i 93 836TOTA t. 9°,93. 215,882 26,655 333 ,)j72 136,84() '36,623 o8 , (13, )421',l58
_ ~~~~~ ~ ~~~ ~ ~ ~ ~~~~~~~~~~~~~~~~.9 9 _1 1 ,8 6 .3 48 ,
Sour(:e: Monthly Sunmnary of Jute Goods Statistji(s, No. 15', May 1969,
The Pakistan Jute Mills Association.

CHAPTER III
COTTON TEXTILES
A. Introduction
46. Originally established for import substitution, the industry
has grown to a leading position in the industrial structure of thecoLintrv in terms of the value of fixed assets and inventories, employ-ment provided, value of products and by-products manufactured. Afterju_te nroduicts, cotton goodrs are the nation's second largest manufacturedexports, accounting for Rs. 396 million or 28.3% of total receipts fromexport f- manufactures and 13.9% of total merchandise exports. Exports
of cotton goods have now almost reached the value of exports of raw
cotton; toether5 thev account for 28.7% of total exports. (Table II-1).
h7. %he indllstry nrovides employment for about 1h3.000 in the West.24,OQo i t,e East, a total of 167,000 or about 28.4% of employment inmaiaf-p'+.ctng induistri RS.l/
48. Total value of' production was Rs 1,797 million, Rs 208 millionin the E,as, and Rs 1,595 in the West. Gross value added was Rs 888 million,Rs 89 m-llion in ti-he East and Rs 799 million in the West.
49. Actual investment in the industrv was not obtainable. However.a possible measure may be obtained from sanctioned investment :-/
Sanctioned Investment in Cotton Textiles(TS mi. 1 in
1960/61-1964/65
Tota East West
New mills 391.,6 176.6 215.0
Balancing, modernization,replacement 593.n .7
902.2 269.6 7 2.6
1965 through 1960
New mills 897.0 215.4 681.6
Balancing, modernization,replacement 159.,6 15.5 ;44.;l
1,056.6 230.9 82g;.7Grand Total 203db. ,500.5 j,38.3
1/ Censu,s of Manufactu,ri,ng Industries 1966/67. Bureaus o,f Statistics -
Governments of East and West Pakistan.
2/ CQtton Textile Industry, Growth Prospects over Fourth Five-YearPlan (1970-75).
- 23 -
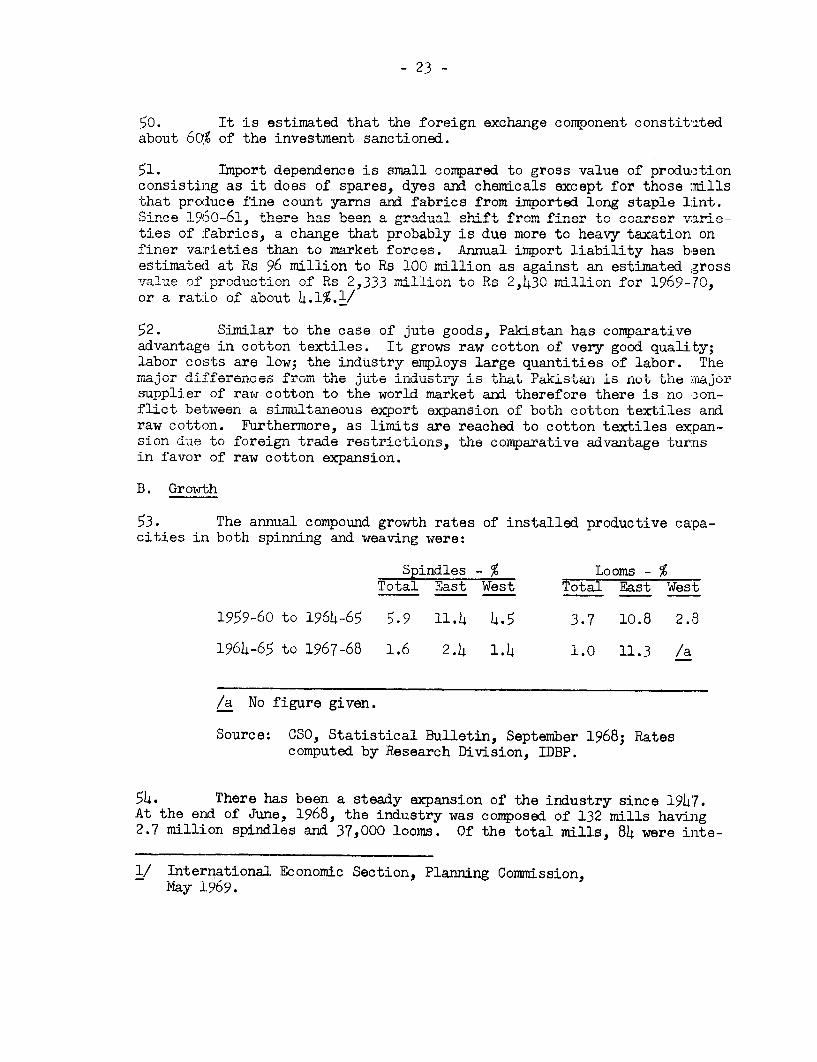
50. It is estimntAd that the fore-ign echange compnonnt constitutedabout 6Q9 of the investment sanctioned.
51. Import dependence is small compared to gross value of productionconsistinic1 -g- as it r1oes rof' spares, dyes:b mr n hrn m 2+ cmmcl ic t for thsc lthat produce fine count yarns and fabrics from imported long staple lint.Since 196 0-62, there has been a graual shift from. finer to coarser varie-ties of fabrics, a change that probably is due more to heavy taxation onfinn rr- +
40 +Hn- +- m..rn4"-+ fnmCe. A--n,.1 - ,flrv4l 14A n1,414
4.-. InS 'kaenvine. uarie_ies *han to ._ Ic forces. -L.ua -Jl ipr liablit. y .has bsen
estimated at Rs 96 million to Rs 100 million as against an estimated grossvalue of poutLnof Ps 2,3 rLllo 4to Rs 240 rlllon for14- 1969IA-70,
or a ratiLo of about 4.1%._/
52. Similar to the case of jute goods, Pakistan has comparativeadvaLtage In cotton textiles. It gro-ws raw cotton of ve,-y good quality;labor costs are low; the industry employs large quantities of labor. Themlajor du:.ferences fro, the jute iduusury is tU;zb rak±taii ls niot ithe -irlajorsupplier of raw cotton to the world market and therefore there is no ,-on-flict belween a simultaneous export expnLsion of both cotton textiles andraw cotton. Furthermore, as limits are reached to cotton textiles expan-sion d-ue to foreignL traue restrictionLs, the comparative advantage turnsin favor of raw cotton expansion.
B. Growth
53. The annual compound growth rates of installed productive ca:pa-cities in both spinning and weaving were:
Spindles - % Looms-%Total East West Total East West
1959-60 to 1964-65 5.9 11.4 4.5 3.7 10.8 2.3
1964-65 to 1967-68 1.6 2.4 1.4 1.0 11.3 /a
/a No figure given.
Source: CSO, Statistical Bulletin, September 1968; Ratescomputed by Research Division, IDBP.
54. There has been a steady expansion of the industry since 1947.At the erLd of June, 1968, the industry was composo:i of' 132 mnilTs hbaing2.7 million spindles and 37,000 looms. Of the total mills, 84 were inte-
l/ International Economic Section, Planning Commission,May 1.969.

- 24 -
grated spinning and weaving, 45 were spinning only, and 3 had onlyweaving facilities.l/ This remarkable growth was engendered by severalfactors: at Independence, virtually all of the larger mills were inIndia. and the effort toward self-sufficiency stimulated both millconstruction and cotton growing; existence of a large hand loom industrythat was dependent upon machine-spun yarns accounts, even today, for therelatively large number of mills producing yarn only; there was a size-able overseas market: and the bonus system made production for exportshighly profitable.
55. The industry is broad in structure. It is linked backward toainning (a few mills own their own ginning facilities), and is integratedforward through the finished product. Mills are located in both wings,the West having 751 of the spindles and 81% of the looms. Soinnablecotton is grown exclusively in the West.
56. Exports of cloth and yarn have been extremely responsive toinereasAs nr decreases in the bonus rate. In January 1959, a bonus of 20%was instituted on yarn which resulted in a sharp rise of its export fromPR 12 A million in 1958 to Rs 102.9 million in 1959. The large exp-ortcreated a domestic shortage, causing a consequent reduction in bonus to10% in Febhrary 1960. and its complete withdrawal in January 1961. Exportsdropped sharply until the 10% bonus was reinstated in February 1963 whicharrested the romwnward trend. To reverse the trend. the bonus rate wasraised to 15 in January 1964 and exports rose to Rs 86.7 million. Therate was magin rnisi to 2?Q in Novemher 1960)4. which resulted in a steadvrise in exports to Rs 104.5 million by 1966-67. Subsequent to devalua-tion of +he porin sterling in November 196?7v the bhons was raised to 30%in the same month, and exports during 1967-68 rose to Rs. 200 million. 2 !
57. Cloth exports behaved in much the same manner. A bonus of 20%was promulgated in Jon Jnuar 1959, sedring expnorts up from Ts 4.1 m-nllionin 1958 to Rs 58.2 million in 1960. In July, 1963, the rate on finishedcloth was raise to 30% increasing ex-pnorts to Rs 74.4 million. The ratewas raised to 40% in January 1964 and exports rose to Rs 155.8 million in' cn4 47 Q48- , .1,4-.A 7-, +k- m-PfPer,-.+i wrn f-"rnm Tnv%rmhir 1 QA7A7UU %j fv * Li U . IUv,> U-- .A. v; -*Y w - .. . i _ | . .. .' _ ... _ .w.. _ -, v
of 40% on finished and 30% on grey cloth, exports for 1967-68 totaledas 200O LL.u1' onl.3!~
1/ The number of finishing facilities is not available. All of thelarger mills visited by the Mission and some of the smaller oneshad their own plants.
?/ EPB: Commmodity Notes, Cotton Yarn and Piece Goods (1968-69).3/ Ibid.; The industry is not entitled to an Export Performance
Li cen.se since it is based on indiigeno raw material.
58. Of cloth exports, 40% are shipped to quota countries, 20% tothe Socialist Blc)n and 40% to other countries. Historically, exportvalues of cloth generally have exceeded that of yarn. The latest excep.-tion to the general trend was in 1907-68 when yarn value exceeded cloth.In conformity with the policy to export a maximum of finished instead ofsern -Y-rocessed goods, cloth e.xports are A,Pected to axceed yarn in 1968-
69.- " (Table III-1).
C. Prices, Costs and Profitability
59. Domestic mills are the major buyers of local cotton - theyabsorbed in 1965/66 thr4ough 1067/68, about 6J% of domestic spinnable nLnt(Table IV-2). Apparently it is not the custom of the industry to car:rya large inventory of raw material, a procedure at some issue with cottonexporters who suggest that mills should carry a stock equivalent to threem,on'ths requirem,ent- to prevent th--ie price st-r uCt-re fror. being dlisturbed by
scarcity buying. Apparently exporters can buy cotton at a lower prica (so-called "export parity") than mills, the rationle belng that textileproduct-e.xporters who receive a generous bonus exchange rate can afford ahi-Lgher price thUa cotton shippers -wo must- surrender hei4r procees at theofficial rate with no bonus. The differential must be small; it was mnen-tionued only b-y sormLe of the mill maragemrents intervievwed" by the Mission todiscuss industry problems. It was capacity taxes and an inefficient laborforce t'nat headued thie 11±sU 0.1. Ullelr co-I1plaints.
60 l*Iore time than was available to tlh1e r Ussion wouulU be rt
obtain cost data on even a few specific items, if, indeed they could beacquired,, since these data are among the most jealously guarded of corporatesecrets. Returns from the Mission's Industrial Study Questionnaire covereda variety of cotton textile operations. Those that produced orny yarns(the majority of returns), those that produced coarse to medium yarns andcloth and those that made a fairly wide range of coarse, medlum an-d ineyarns andl fabrics.
61. The segment that produces fine items has a larger import inputcontent cdue to the use of American and Egyptian long-staple cottor tharnthe sector which produces yarns only or fabrics of average and lowerquality. Import inputs for this latter segment consist entirely of spareparts, dyes and processing chemicals and probably accounts for less than5% of total sales value. Unfortunately, the firms, in answering thequestionnaire, misconstrued the question concerning imports believing itto refer to raw materials only and failed to give volumes and values ofspare parts, dyes, chemicals and other miscellaneous secondary materials.A limitecd number of replies that were complete enough to be usable gaveimport data. They are shown in Table III-2. The range of factor inputsand other cost items as a percent of the sales price are shown below.
1/ Export data for the full year 1968-69 is not available.
- 26 -
Average ofRange
Range % ValuesMaterial 24.0 - 47.5 35.7Tbhor 4.3 - 10.h 7.hServices 2.1 - 7.3 4.7Overhead 3.8 - 16.2 10.0Other 0.7 - 11.4 6.1Profit before taxes 5.9 - 39.2 2,2.6Direct taxes 8.0 - 24.7 16.4
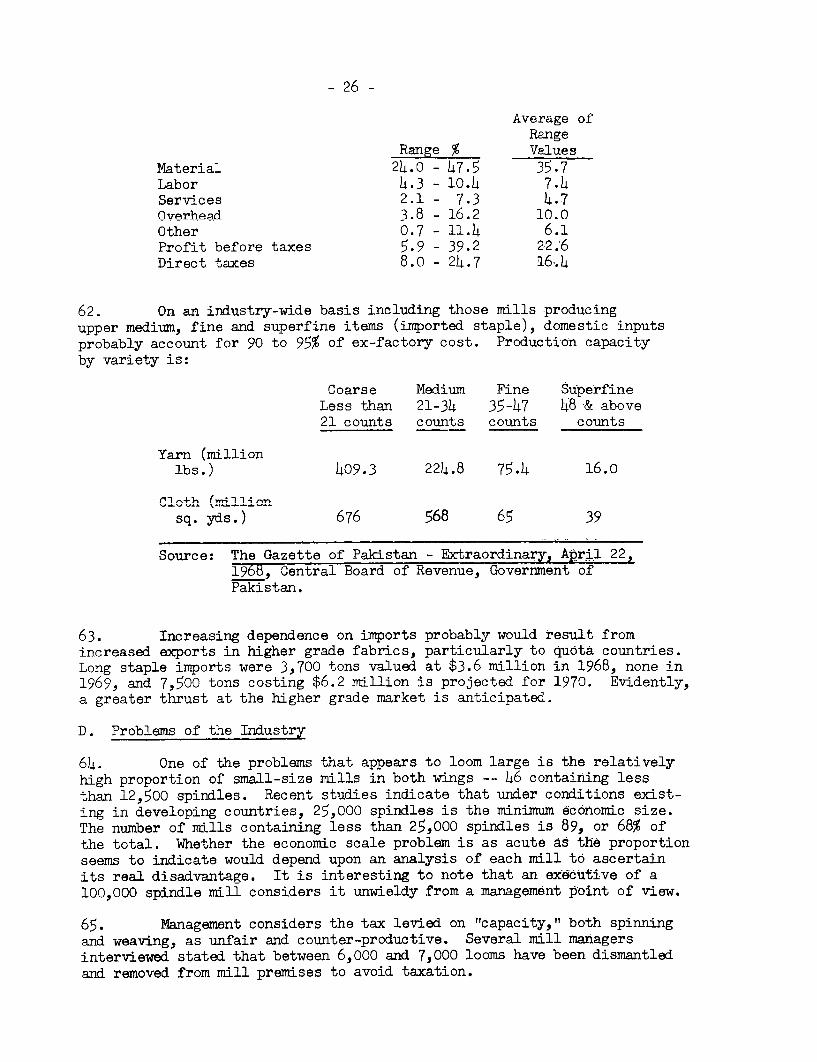
629 nn an industrv-wide basis including those mills producingupper medium, fine and superfine items (imported staple), domestic inputsprobablyt mr-rmini f 90 nt 95% of ex-faetory cost. Production eapacityby variety is:
Coarse Medium Fine SuperfineLess thnn 21 -34 35-4r7 hR &, above
21 counts counts counts counts
Yarn (millionlbs.) 409.3 224=8 75.4 16.0l
sq. yds.) 676 568 65 39
Source: The Gazette of Pakistan - Extraordinary, Api'jl 22,1968, Central Board of Revenue, Government ofPakistan.
63. Increasing dependence on imports probably would result fromincreased exports in higher grade fabrics, particularly to quota countries.Long staple imports were 3,700 tons valued at $3.6 million in 1968, none in1969, and 7,500 tons costing $6.2 million is projected for 1970. Evidently,a greater thrust at the higher grade market is anticipated.
D. Problems of the Industry
64. One of the problems that appears to loom large is the relativelyhigh proportion of small-size mills in both wings -- 46 containing lessthan 12,500 spindles. Recent studies indicate that under conditions exist-ing in developing countries, 25,000 spindles is the minimum economic size.The number of mills containing less than 25,000 spindles is 89, or 68% ofthe total. Whether the economic scale problem is as acute as the proportionseems to indicate would depend upon an analysis of each mill to ascertainits real disadvantage. It is interesting to note that an executive of a100,000 spindle mill considers it unwieldy from a management point of view.
65. Management considers the tax levied on "capacity," both spinningand weaving. as unfair and counter-productive. Several mill managersinterviewed stated that between 6,000 and 7,000 looms have been dismantledAind removed from mill premises to avoid taxation.
- 27 -
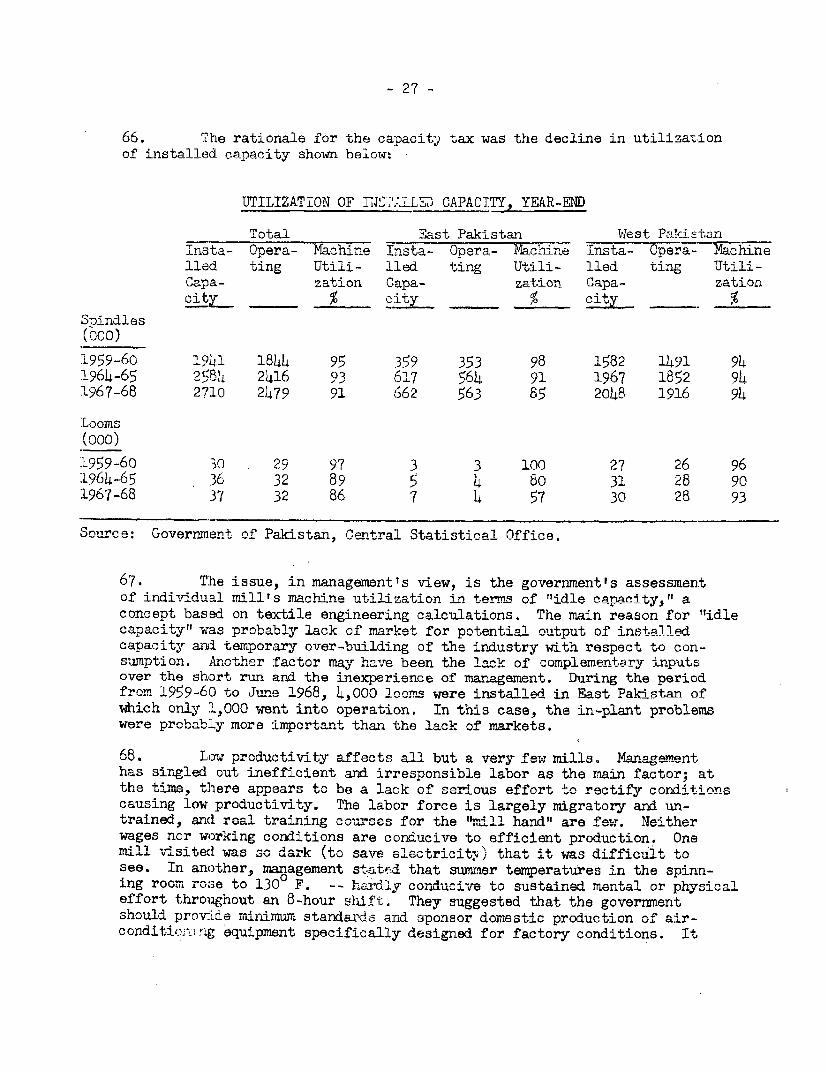
66. The rationale for the capacity/ tax was the decline in utilizationof installed capacity shown below:
UTILIZATION OF ITN-Y7LLSD CAPACITY, YEAR-END
Total East Pakistan W0est Palkistan±nsta- Opera- Machine Insta- O-pra- Machine Insta- nTeia- hinelled ting Utili- lied ting Utili- lled ting Utili-Capa- zation Gapa- zat.ion Cana- zationcity __ city % city %
Spindles(000)
1959-60 1941 1844 95 359 353 98 1582 1491 94194-65 258)4 2)16 93 617 56)Q 91 1967 1852 9):1967-68 2710 2479 91 6,62 563 85 2048 1916 94
Loomsf onrl )(ooo)1959-60 30 29 97 3 3 100 27 26 96.1964-65 36 32 89 5 4 80 31 28 901967-68 37 32 86 7 4 57 30 28 93
Sonlrce: Goverrn'nment of Pakistan, Central Statistica1 Office.
67. The issue, in managementts view, is the government's assessmentof individua.l m.ill's mwacjhine utilization in term.q of "idle cnapaity;" aconcept based on textile engineering calculations. The main reason for "idlecapacitY aS- nrobably lack of r.rke for potential outpniut of installedcapacity ani temporary over-building of the industry with respect to con-Sump ion. Another fa+nor may hava e been the rlock of nmplermrentary -nputs
over the short run and the inexperience of management. During the periodfrom 19910-60 to JTne 1968, )4,000 looms were inst lhd in ERst Pakistan of
which only :1,000 went into operation. In this case, the in-plant problemswere probablr y ro.ore i-Morvant thn - the lack of ,m, * rkets.
68. Tow productivity affects all but a very few mills. Managementhas singled out inefficient and irresponsible labor as the main factor; att-Lh e- tima, +lthere appna¶' 4-to bo a 1 ala_ of se rno effort to rec+ifyr wo.nditionscausing low productivity. The labor force is largely migratory and un-trained, and real trainiing cou ses for the "mill ha-d" are few. Neitherwages nor working conditions are conducive to efficient production. Onemill visitecd was so dark (to save e'l" that it was difficlt tosee. In another, management statP4d that suwwmer temperatures in the spinn-
nrLg room rose to 13)0° F. -- h2.d1.-y conaducive to sustained mental or p1hysicaleffort throughout an 8-hour sit. They suggested that the governmentshould pro-v-ide miLnimu-i;m standa&-, anld sponsor domestic production of air-conditic.r&ng equipment specifically designed for factory conditions. It
- 28
has been said that the most difficult segment of industrial personnel totrain is management. Attracted by the protection given, it is possible thatsome entrepreneurs entered the industry from the general business communityand have not developed industrial management skills to the required degree.
69. Utilization of quotas in 1967/68 was unsatisfactory in the E.C.MJcountries except for the Federal Republic of Germany where it was fulfilled.Of the fabric quota of 2,270 tons in E.C.M. anid Austria, 917 tons were sold,
leaving a deficit of 1,353 tons (Table III-3). Wider widths of fabric werein large demand in E.C.M. countries, but only a few mrLills -were equipped withbroad looms. The situation is changing now as broad looms are being in-
stalled. There was also a quota of 530 tons for made-up articles in the E.C.M.,
none of which was utilized. Thus, of the total quota for fabrics and made-up
articles in E.C.M. of 2,800 tons (about 25 million square yards), under-
utilization in 1967/68 was 1,883 tons (16.8 million square yards). Lack of
timely communication between exporters and buyers in the sophisticated overseas
markets contributed to quota shortfalls. Quota utilization was considerably
better in the U.S. and U.K. In the U.S., of the fabrics quota of 59.7 millionsquare yards, 41.4 million or 69.5% was used in 1967/68. Pakistan has met her
fairly small "cowutry quota" of the U.K. (22.53 million square yards) and has
been successful in getting a large share in the "global quota" available to
all exporters (43.37 million square yards), which has resulted in aggregateexports of 66 million square yards in 1967.
70. Altogether, the available export quotas for cotton fabrics and made-
up articles in 1967/68 were about 150 million square yards, of which 117 million
or 78% were utilized. The percentage of utilization is expected to increase
in 1968/69, as strenuous efforts were made, under the leadership of the Export
Promotion Bureau, to expand the export flow. Aggregate exports of Pakistanicotton fabrics and made-up articles are now running at Rs. 220 million p.a.
($46 million), of which exports to the quota countries may reach as much asone-half. The room for further expansion within the present quotas is quite
limited. Thus, the future trade policies of the quota countries will exer-
cise a substantial impact on the development of Pakistan's cotton textile
industry.
71. The little-known domestic market, while not an industry problem,
should be mentioned, Virtually all domestic yarn sales are to small machine-
weaving enterprises (some comprise as little as 4 power looms) and to thehand loom industry. This non-mill sector produced an estimated 820 million
yards of fabric in 1967-68 against 767 million for the recognized industry.Assuming the mill sector supply to domestic consumption was the differencebetween cloth production and export, the domestic availability was about
1,300 million square yards representing an apparent per capita consumptionof 10.8 yards.l/ Hand loom production is traditional, a facet of the over-
all economic pattern-and will remain so for a considerable period. The "mill
sector" accepts the competition and continues to supply it with yarn -- its
basic raw material.
l/ IDBP, Cotton Textile Industry, Growth Prospects over Fourth Five-YearPlan 1970-75.

29 -
Ex ort of Cotton_Fabrics and Made-up 2Articles to C=ta C(_utrjes
(in Millions of Square Yards)
Export Quota Expected Exports Actual Exports1968/69 1968/69 1967/68
United States /Cotton 'abrics 62.7 U0. a 4i.4Made-up Articles 8.9 8.9 rL.a.
Total 71 .o St' n.a.
united nidomCountry ZQota 23.1 2 3 . 1 /Z 22.8Global Quota 43.7 43.7/D
Total 66.8
ECM Countries andAustria
Cotton Fabrics 20. 4 14.4e 8.3Made-up Articles 4.7u 0.6 -
Total 24.7 15.0 8.3
GRAND TOTAL 163.1 150.7 (115.9)
/a Actual exports in the first nine months of the quota year were 42 millionsqulare yards.
A Actual exports in 1968.
/c Approximate. The quota is expressed in tons (2,270 tons) and has beenonverte-Ad into yardals using t h1-e converslion fLacuor of one squaare yard
0.245 lbs.
/d Approximate. The quota is expressed in tons (530 tons) and has beenconverted into yards using the conversion factor of one square yard =0.245 lbs.
/e rull utilization of the quotas in Germany (450 tons) and Italy (990 tons),one-fourth in France (113 tons) and 22% in Benelux countries (83 tons).
Source: Export Promotion Bureau.
E. Conclusions
72. The profitability of the industry appears quite satisfactory and isheav-ily dependent on the bonus exchange rate.
73. The lack of real training given lower level persomnel, low wagesand unsatisfactory working conditions are a contributing factor to the lowrate of productivity. -Whether, and to what degree, low-output machinery is
a substantial obstacle to increasing productivity should be determined by aGoverrerimet- industly survey. An extension of the investigation that was madeto determine "capacity tax" could provide a starting point.
74. A large number of spinning mills are under-sized, with a capacityof about one-half of the desirable level. it is suggested that over the nextseveral years priority be given to balancing of capacity rather than toestablishment of new mills.
75. Export sales are transacted by mill management which is also in-volved in day-to-day operations. It is probable that sales could be increasedif professional representatives could be commissioned to promote Pakistanicotton goods and handle transactions overseas. A more direct channel ofmarket intelligence would thus be established.
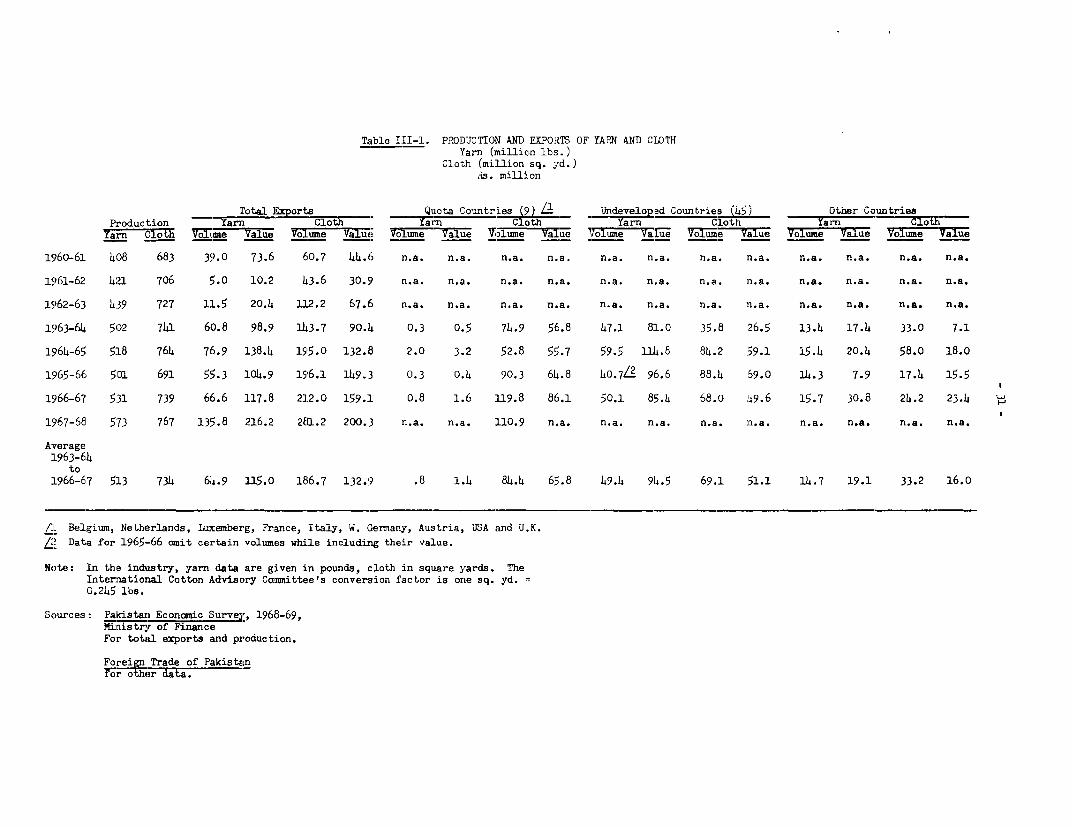
Tzible III-1. PRODUCTION AND EXPORTS OF YARN AND CLOTHYarn (milLion lbs. )
Cloth (million sq. ydi.)Rs. million
Total Exports Quota Countries (5) Undeved Countries (45) Other Countries
Production Yarn1 Co ta Yarn oI-Mth Yarn Cloth Ya_r_n -l
in Co Voi Value e V Valu V Value Ioume Va ulue V lume Value VolvuxIiel =aue roiiie Ta=ue
15'60-61 408 683 39 .0 73.6 60.7 44.6 n.a. n.a. n.a. n.a. n.a. n.a. n.a. n.a. n.a. n.a. n.a. n.a.
15161-62 4_L 706 ;.0 10.2 t3.6 30.9 n.a. n.a. n.a. n.a. n.a. n.a. n.a. n.a. n.a. n.a. n.a. n.a.
1962-63 4.39 727 LL.5 20.4 L12.2 67.6 n.a. n.a. n.a. n.a. n.a. n.a. n.a. n.a. n.a. n.a. n.a. n.a.
1963-64 502 741 60).8 98.9 )L3.7 90.l1 0.3 0.5 74.9 56.8 47.1 81.0 35.8 26.5 13.4 17.4 33.0 7.1
1'64-65 518 764 76.9 138.4 1955.0 132.13 2.0 3.2 52.8 55.7 59.5 11LA.8 84.2 59.1 15.4 20.4 58.0 18.0
1965-66 5D1 691 55-3 104.9 156.1 149.3 0.3 o.4 90.3 64.8 oL0.7L2 96.6 88.4 59.0 L4.3 7.9 17.4 15.5
1966-67 531 739 66.6 117.8 212.0 159.1 o.8 1.6 L119.8 86.1 50.1 85.41 68.o 49.6 15.7 30.8 24.2 23.4
1967-68 573 767 135.8 216.2 2cL.2 200.3 n.a. n.a.. :110.9 n.a. n.a. n.a. n.a. m.a. n.a. n.a. n.a. n.a.
Average:L963-64
to1L966-67 513 734 6i4 .9 LL5.0 186.7 132.9 .8 1.4 8 4.4 65.8 49.L 94.5 69.1 51.1 14.7 19.1 33.2 16.0
/:L Belgium, Netherlands, luxcemberg, France, Italy, W. (Germany, Austria, USA and U.K.
/2 Data for 1965--66 azit certain volumes while includinlg their value.
Note: In the industry, yarn data are given in pounds, cloth in sqlaare yards. TheInternational Cotton Advisory Camiittee 's conver3ion factor is one sq. yd. =O.245 lbs.
Sources: Palcistan Economic Survey, 1968-69,Ministry of FinancieFor totalI exports and production.
Forel Trade of Pakistan;r -'hr data .
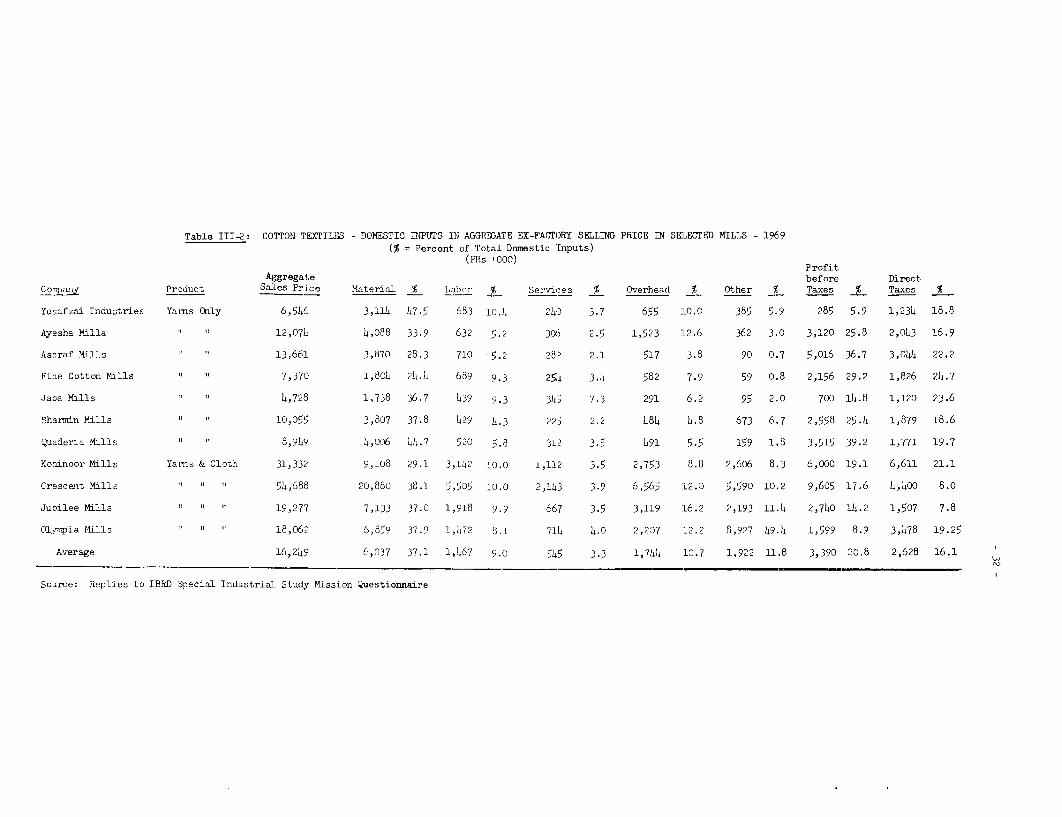
Table III4: COTTON IEXTILES - DOMESTIC INPTlTS IN ACGR3GATE EX-FACTORY SELLING PRICE IN SELECTED MILLS - 1969(% = Percent of Total Donmestic Inputs)
(ERs 000) Profit
Aggregate before DirectCO__an Product Sales Price Material % Lobkr .2 Services % Overhead % Other % T'axes % Taxes %
Yusafzai Industries Yarns Only 6,5146 3,114 47.5 683 10., 240 3.7 655 10.0 385 5.9 285 5.9 1,234 18.8
Ayesha Milla i 12,071 4 ,088 33.9 632 5.2 306 2.5 1,523 12.6 362 3.0 3,120 25.8 2,043 16.9
Ashraf Mills 13,661 3,870 28.3 710 '5.2 282 2.1 517 3.8 90 0.7 ;,016 36.7 3,044 22.2
Fine Cotton M lls 7,370 1,804 21.4 659 9.3 251 3.4 582 7.9 59 o.8 2,156 29.2 1,826 24.7
Jaba Mills 4,728 1,738 36.7 439 9.3 345 7.3 25'1 6.2 95 2.0 700 14.8 1,120 23.6
Sharmin Mills " 10,055 3,807 37.8 429 1l.3 225 2.2 4184 .8 673 6.7 2,558 25.4 1,879 18.6
Quaderia Mills 8,919 1,006 11.7 520 ,.8 312 3.5 491 5.5 159 1.8 3,515 39.2 1,771 19.7
Kohinoor Mills Yarns & Cloth 31,332 9,108 29.1 3,1.L2 10.0 1,112 3.5 2,753 8.8 2,606 8.3 6,oo0 19.1 6,611 21.1
Crescent Mills 54,688 2C,880 38.1 5,5D5 10.0 2,143 3.9 6,565 12.0 5,590 10.2 9,605 17.6 4,10oo 8.0
Jubilee Mills 19,277 7,133 37.0 1,918 9.9 667 3.5 3,119 16.2 2,193 11.4 2,740 14.2 1,507 7.8
OlysTia Mills 18,062 6,859 37.9 1,472 8.1 714 4.0 2,207 12.2 8,927 49.4 1,599 8.9 3,478 L9.25
Average 16,249 6,037 37.1 1,457 9.0 545 3.3 1,744 10.7 1,922 11.8 3,390 20.8 2,628 16.1
Saurce: Replies to IBRD Special Industrial Study Mission Questionnaire

Table III-3: EXPORTS OF COTTON TEXTILESTO QUCTA COUNTRIES, 1967-68
E.C.M. and ArUSTdA(metric tons) QUOTA
% of - --Fabrics Available Utilized Available Shortfall
Benelux /1 370 224 60.5 - 146France 450 27 6.0 - 423Italy 900 216 24.0 - 684W. Germarny 450 450 100.0 0Austria 100 1il 0.0 - 100
2,270 917 -1,353
Madeups /2
Benelux -30 nil 0.0 - 130France 10 0.0 - 150Italy 200 0.0 - 200W. Germanv 5n fn o. r-
530 - 530
Total for E.C.M. 2,700 917 34.0 -1,783
Total for Austria 100 nil 0.0 - 100
Total 2,800 917 32.8 -1,883
U.S.A. (million sq. yd.) /2
Fabrics 59.745 41.405 69.5 - 18.:340Madeiins n.a.f) n.a.,)
U.K. (million sRn-. )
QuotaFabrics Total
Country Global ExportsA
1966 22.32 35.00 57.321967 22.83 43.37 66.201968 23.06 43.73 66.79
/1 Belgium, Netherlands and Luxembourg/2 Apparel and other items, e.g., T shirts, shop towels, etc./3 The rnota for 1968/69 ji 8,930 million sq. yds., ail of which Is ex-
pected to be utilized.
/4 Exclusive of exports for re-export.
Source: Export Promotion Bureau, July, 1969.

- 3L -
Table III-4; COTTON SPOT PRICES -KARACHT - SEPT. 16; 1 969) /1
Rs/maund Rs/lb. $/lb.
Desi Sind 90.00 1.09 .23
Desi Punjab 88.oo 1.07 .22
Desi Bahawalpur 89.00 1.08 .23
4-F Roller 101.00 1.23 .26
4-F Sawgin 106.50 1.29 .27
LSS Roller 101.50 1.23 .26
LSS Sawgin 106.50 1.29 .27
NT Roller (new) 114.00 1.39 .29
NT Sawgin (new) 118.00 1.43 .30
289-F Roller 111.00 1.35 .28
289-F Sawgin 117.00 1.42 .30
AC-134 Roller 112.00 1.36 .29
AC-134 Sawgin 118.50 1.44 .30
/1 The Pakistan Times - September 17, 1969.so Rs L.75 = $1

Table III-5: PERCENT DISTRIBUTION OF EXPORTS OF COTTON CLOTH AND YARN
4-Year
1963-64 1964-65 1965-66 1966-67 Average
Quota Countries (9)Larn
Volume 0.5 2.6 0.5 1.2 1.2
Value 0.5 2.3 0.4 1.4 1.2
ClothVolume 52.1 27.1 46. 56.5 45 .2
Value 62.8 41.9 43.4 54.1 49.5
Undeveloped Countries (45)Yarn
Volume 77.5 77.4 73.6 75.2 76.1
Value 81.9 83.0 92.1 72.5 82.2
ClothVolume 24.9 43.2 45.1 32.1 37.0
Value 29.3 44.5 46.2 31.2 38.5
Other CountriesYarnVolume 22.0 20.0 25.9 23.6 22.7
Value 17.6 14.7 7.5 26.1 15.6
ClothVolume 23.0 29.7 8.9 11.4 17.8
Value 7.9 13.6 10.4 14.7 12.0
Total Exports as % ofTotal Production
Yarn 12,1 14.8 11.0 12.5 12.7
Cloth 19.4 25.5 28.4 28.7 25.4
Source: Table III-1.

CHAPTER IV
COnTTON G.TNN'TNG
A. Introduction
76. The total area under cotton during 1968-69 was 4.36 million acres,
of which orly 34,000 acres were in the East Wing and h.33 million acres in
the West. Of the total, 3.8 million acres are under medium-staple American
varieties and 0.4 mIllion are ulnder short-staple (non-spinnable) indigenous
varieties known as "Desi". The crop during the same year is estimated to
be 2.99 million bales of 392 lbs. each, of whirh 2.79 million are medium-
staple (nominally 1 1/16 in.) and 0.20 million are Desi. No medium-staple
varieties are grown in East Pakistan.
77. Raw cotton is purchased from the farmer by the ginner according to
established grades. The ginner processes the material and bales it for mar-
ket. It is in the gin that the lint is separated from the seed, The ginner
returns from 13 to 15% of the seed contained in the purchased raw cotton to
the farmer, who uses lt for sowei-ng, stock feeding and other pu-roses. The
baled cotton is disposed of through established channels, where it is ulti-
mately utilized either by the domestic textile industry or exported.
B. Current Situation
78. Over the past 12 years, cotton crops have about doubled from approX -
mately 1.5 million bales to the nearly 3 million bales estimated for the
1969-70 season. The increase was largely the result of better cultivation
practices such as row sowing (instead of broadcast), use of fertilizers and
additional irrigation pro-vided by the tubewell program wvhich augmented canal
water supply. For the same period, domestic mill consumption also about
doubled to approximately 2 million bales.
79. Estimated 1969-70 exports ar;e 50,000 bl 'es of spinnable cotton
and 150,000 bales of non-spinnable Desi cotton. The latter is used princi-
pally in Japan for matting and surgical cottorn, anLd in Europe and the U.S.
for stuffing and surgical cotton.l/
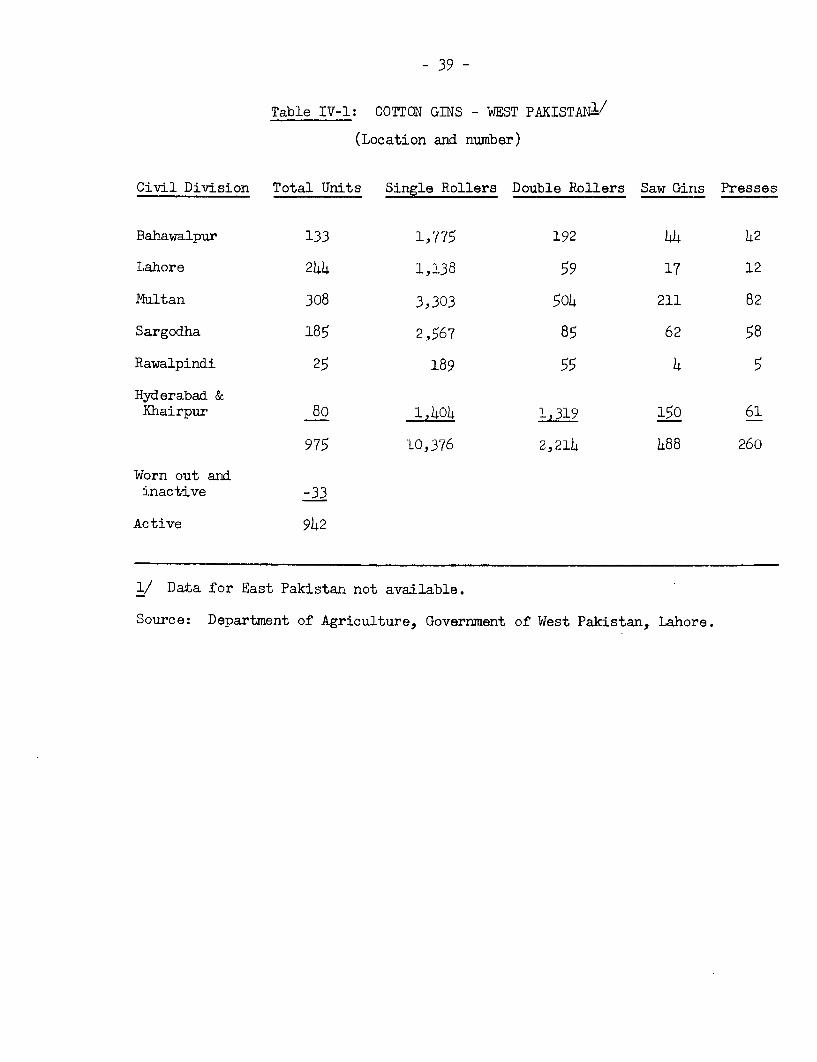
80. Currently, there are 942 active ginning facilities in West Pakistan
of which 450 are said to be "large'". There are 33 establisIhIMents containing
worn-out equipment which are closed down. Only 260 of the 942 units contain
baling presses; it is assumed that the smaller operators tranisport their
cotton to the presses. Distribution of ginning plants is shown in Table IV-1.
81. In the past, virtually all of the plants were owned by Indian na-
tionals. After their departure from Pakistan, the properties were takeni o-ver
by Pakistani authorities who, over a period of time, allocated them to Pakistan
citizens and eventually awarded them legal title. It is said that most of
the machinery in the plants was from 20 to 40 years old at the time of allo-
cation. The new owners, during the period in which they did not have legal
1/ Purists refer to Desi as "little more than a weed".
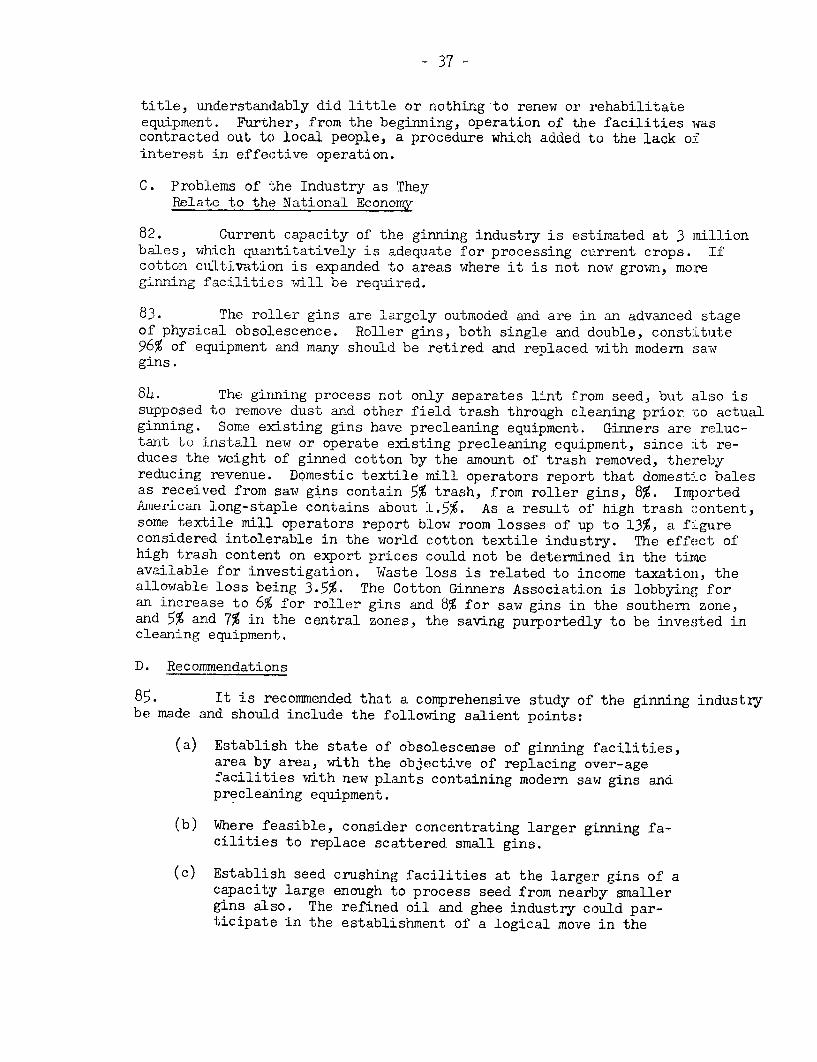
title, understandably did little or nothing to renew or rehabilitateepnp, m1r,-n . 1T-rr±hpr_ f-rom +.hp bhpai-nninci nnperatio)n orf +the fn+ilitips I.TnQ
contracted out to local people, a procedure which added to the lack o:-inte~rest -inr efetivr prain
C.ProiLems: of} t-he Industry as They
Relate to the National Econory
82. Current capacity of the ginning industry is estimated at 3 mi:Llionb-a7es, wh-X}ch quantitati4vel is adqut 4for--,-.- P_---- prcssn _urren crops XIfu~u V~ y L10~U:;JU~ 10.U Uu.1rueIG L;LU * .Lcotton cultivation is expanded to areas where it is not now grown, more
gitning 44 iailtes wilbe elrd
83. The roller ginsa rg o d are laglyU outmoded and are in an advalced stageof physical obsolescence. Roller gins, both single and double, const:itute96% of equippment a,nd many sho-uld be retired and repiaced with modern sawgins.
84. The girming process not only separates lint from seed, but also issupposed to remove dust and other field trash through cleaning prior go actualginning. Some existing gins have precleaning equipment. Ginners are reluc-tait to install new or operate existing precleaning equipment, since -Lt re-duces the weight of ginned cotton by the amount of trash removed, therebyreducing revenue. Domestic textile mill operators report that domestic balesas received from saw gins contain 5% trash, from roller gins, 8%. Im)ortedAnerican long-staple contains about 1.5%. As a result of high trash content,some text;ile mill operators report blow room losses of up to 13%, a f-gureconsidered intolerable in the world cotton textile industry. The effect ofhigh trash content on export prices could not be determined in the timeavailable for investigation. Waste loss is related to income taxation, theallowable loss being 3.5%. The Cotton Ginners Association is lobbyinge foran increase to 6% for roller girns and 5% for saw gins in the southern zone,and 5% and 7% in the central zones, the saving purportedly to be invested incleaning equipment.
D. Recommendations
85. It is recommended that a comprehensive study of the ginning industrybe made and should include the following salient points:
(a) Establish the state of obsolescense of ginning facilities,area by area, with the objective of replacing over-agefacilities with new plants containing modern saw gins andprecleaning equipment.
(b) Where feasible, consider concentrating larger ginning fa-cilities to replace scattered small gins.
(c) Establish seed crushing facilities at the larger gins of acapacity large enough to process seed from nearby smallergins also. The refined oil and ghee industry could par-ticipate in the establishment of a logical move in the

effort to disperse industries into rural areas. Thepresent trade in cottonseed, with its inherent waste,would be eliminated if seed were crushed promptly andstored as oil, a far less expensive form for storage,handling, and transport than bulk, low-density seed.
(d) Consider promulgation of a law or regulation that all seedmust be crushed within 210 days of harvest, the objec-tive being to eliminate the present waste caused by over-long and bad storage with consequent deterioration of oilcontent. Certain countries have such a law, the purposeof which is to minimize insect infestation.
- 39 -
Table IV-1: COTTON GINS - WEST PAKISTAN-/
(Location and number)
Civil , Dlsion Toal Uris ingle P.Lol'lers I---"le Rlers Saw Gir Pess'IL VJ4.J.L . '.-.'L ± LiLid,L ULJJ.. Ij. 1j i%.VJL .L.~ L%L LU.).L 1LU-L.A.O± I U±±LLO I. IJ V0 V
Bahawalpur 133 1,775 192 44 42
Lahore 244 1,138 59 17 12
Multan 308 3,303 504 211 82
Sargodha 185 2,567 85 62 58
Rawalpind.i 25 189 55 4 5
Hyderabad &Knairpuir ou 1,404 1,319 15U 6,1
975 10,376 2,214 h88 260
worn out andinactive -33
Active 942
1/ Data for East Pakistan not available.
Source: Department of Agriculture, Government of West Pakistan, Lahore.
- ho -
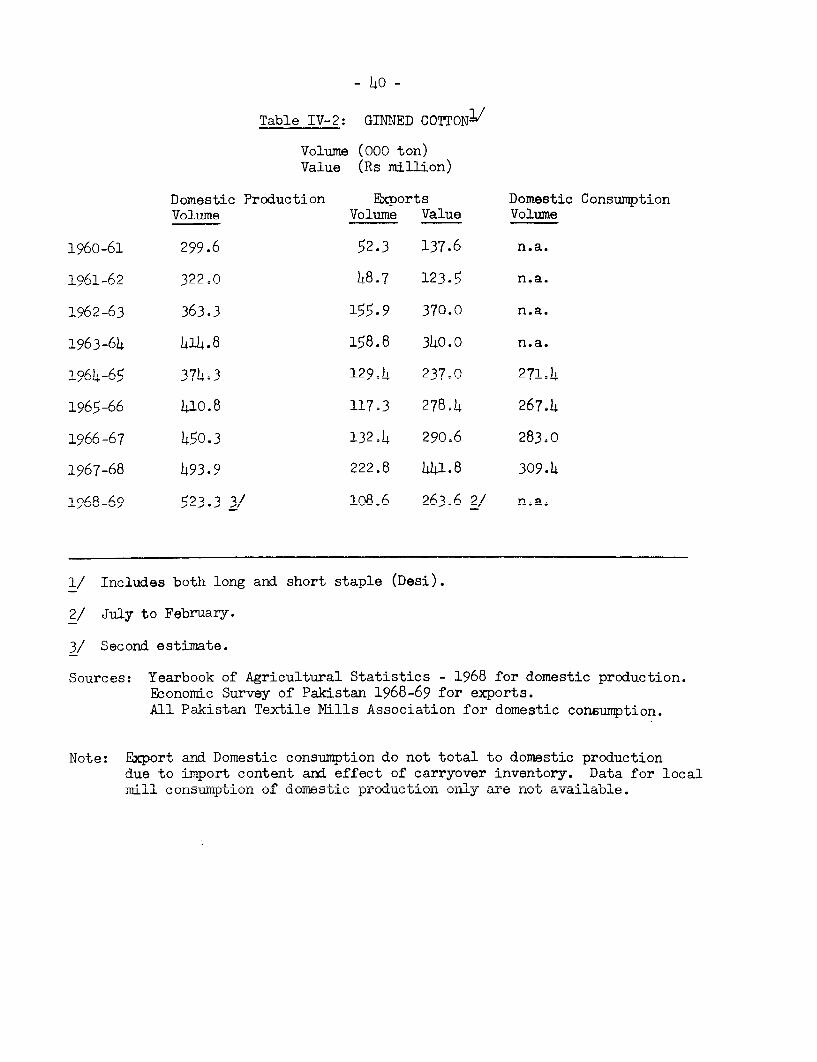
Table IV-2: GINNED COTTONI/
Volume (000 ton)Value (Rs million)
Domestic Production Exports Domestic ConsumptionVolume Volume Value Volume
1960-61 299.6 52.3 137.6 n.a.
1961-62 322' 0 h8.7 123.5 n.a.
196-63 - 1J$.9 370.0 n.a.
1963-6) )I8), 158. 3),0.0 n.a.
1964-65 37). 3 129Ah 237.0 271 A
1 A[)_AA i n R 117 - 27R-), 2(7-),
l966=67 450, *3 132.4 290Q.6 283,0
1967-68 493.9 222.8 )W11.8 309.4
1968-69 523.3 3/ lo8-6 263.6 2/ n..
1/ Includes both long and short staple (Desi).
2/ July to February.
3/ Second estimate.
Sources: Yearbook of Agricultural Statistics - 1968 for domestic production.z0.;ono-U_Ic SUl vey oL I PZLMt.L 1968-6 f.7o. Ur .
All Pakistan Textile Mills Association for domestic conEumption.
Not,e: Export aIILd DoUesticj consiUIlplipUil UU nlUI oudJ. t.U UUIIi,uic prUUuction
due to import content and effect of carryover inventory. Data for localrlil.L consw-uptiulon ou. domestic prUvuculou n uonl-y arUe nrva-Lailable.
CHAPTER V
rrfl. rr A hT Tl t rrffl TT A IKT A flrl A m-
vnjnj&ojn Grnn '.vai'irA±±I)
A. Introduction
86. The people of Pakistan in the past have utilized clarifiedbutter (ghee) as a main source of edible fat. Over the years, therehas been an increase in the commercial uses of milk which provides thefarmer with a quicker cash return than the milk-to-butter-to-ghee pro-cess. Consequently, there has been an increasing decline in gheeavailability. Consumers have turned to a fat known both as vegetableghee and as vanaspati which is vegetable oil appearing in finished formas a plastic solid similar to the shortening of the West. Better keepingqualities and a lower price than animal fats have enhanced its popularitywith consumers.
87. The industry is an important segment of the domestic processedfoods supply. Sales value in 1967-68 was of the order of Rs. 350 million.Currently, the industry provides direct employment for 5,300 persons inthe West. Fixed investment in the West Wing industry is about Rs. 77million. 1/
88. The industry is directly linked to oilseed production, largelycotton, since it is the dominant domestic oil source. Other oils, mainlymustard, rapeseed, sesame and groundnut, are utilized as liquids by con-sumers although some of each are converted to solid fat. Forward linkagesare through by-product expeller cake and soapstock. Large amounts of theformer are exported to the dairyindustriesof Europe and some is disposedof locally. Soapstock, a by-product of refining, is utilized for makingsoap. The larger plants have their own soap-making -- usually laundrygrade -- facilities.
89. The industry is becoming increasingly dependent on imports tosupplement the local supply of oils to meet rising demand. Oil input tothe process is a blend consisting of from 30% to 50% imported soy oil, theremainder being local cottonseed oil. For the five Years ending with. 1967-68, the average annual expenditure for PL 480 oil was Rs. 87.5 million,virtually all utilized by the ghee industrv.
B. Past Growth
90. The vegetable ghee industry has expanded rapidly from two unitshaving a capacity of 9,000 tons in 1947 to 23 plants with an installedcapacitv of 147.500 tons in 1968. Production increased from 1960-61 to1965-66 at an average annual compound rate of 17.5%, but declined absolutelyin the nast two years possibly diue to inav-ijInhjitjV nf oils (Table VF-l).
1/ Nizas r dumad, Joint Director of Industries, Directorate of Industriesand Commerce, Vegetable Ghee Industry in West Pakistan - Government ofvWest Pakistan. Similar data for the East Wing are not available.
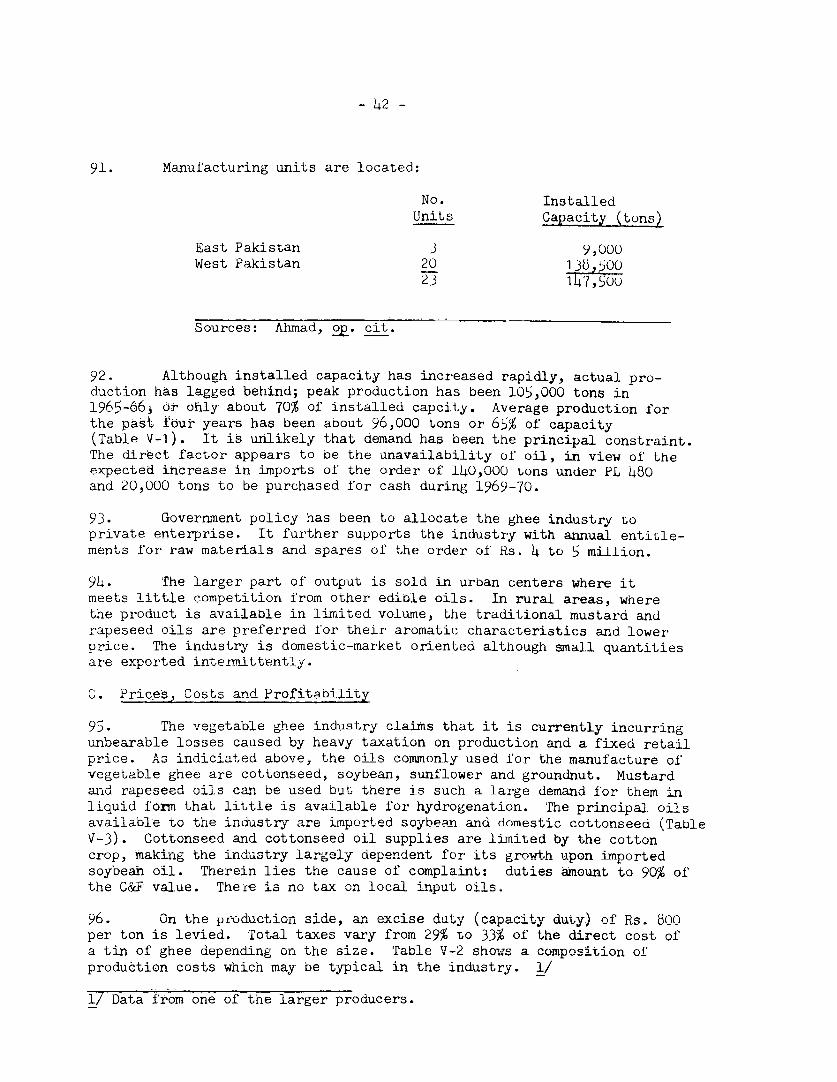
- 42 -
91. Manufacturing units are located:
No. InstalledUnits Capacity (tons)
East Pakistan 3 9,000
West Pakistan 20 135 $0023 14'15Tou
Sources: Ahmad, 2E- cit.
92. Although installed capacity has increased rapidly, actual pro-
duction has lagged behind; peak production has been 105,OOO tons in
1965-663 or ohlY about 70% of installed capcity. Average production for
the past four years has been about 96,000 tons or 65% of capacity
(Tahle V-1). It is unlikely that demand has been the principal constraint.
The direct factor appears to be the unavailability of oil, in view of the
expected increase in imports of the order of 140,000 tons under PL 480
and 20,000 tons to be purchased for cash during 1969-70.
93. Government policy has been to allocate the ghee industry to
private enterprise. It further supports the industry with annual entitle-
ments for raw materials and spares of the order of As. 4 to 5 million.
94. The larger part of output is sold in urban centers where it
meets little competition f'rom other edible oils. In rural areas, where
the product is available in limited volume, the traditional mustard and
rapeseed oils are preferred for their aromatic characteristics and lower
price. The industry is domestic-market oriented although small quantities
are exported intermnittently.
C. Prices, Costs and Profitability
95. The vegetable ghee industry claims that it is currently incurring
unbearable losses caused by heavy taxation on production and a fixed retail
price. As indiciated aEbove, the oils commonly used for the manufacture of
vegetable ghee are cottonseed, soybean, sunflower and groundnut. Mustard
arnd rapeseed oil s can be used but there is surh a large demand for them in
liquid form that little is available for hydrogenation. The principal oils
available to thae industry are mported soybenn and domestic cottonseed (Table
V-3). Cottonseed and cottonseed oil supplies are limited by the cotton
crop, makding the industry largely dependent for its gr owth ianon imported
soybeah oil. Therein lies the cause of complaint: duties amount to 90% of
the C&F value. There is no tax on local input oils.
96. On the production side, an excise duty (capacity duty) of Rs 800
per ton is levied. Total taxes vary from 29% to 33% of the direct cost of
a tin of ghee depending on the slze. Table Ve2 shows acom.position of
production costs which may be typical in the industry. v/
1/ Data from one of the larger producers.
97. The cost structure indicates a loss of the order of Rs. O.41 perlb. due to the imposition of a maximum retail selling price of Rs. 1. 5 perlb. The analysis, however, does not credit values of expeller cake orsoapstocic against ghee cost. Solvency is maintained, undoubtedly, tnroughrevenue from cake, soap sales, and other sources of income.
98. The industry appears to be reasonably efficient. The plantsvisited contained, for the most part, conventional processing equipment (anexception is noted in Section E). High ex-factory prices primarily are theresult of heavy taxation. A drastic change in the bonus voucher systemwould affect costs through the real price of imports.
D. Investment
99. The total investment in 18 of the 20 plants in the West is estimatedat Rs. 71.4 million. Most of the factories were established in the 1950'sand in the early part of the 1960's, which may explain the seemingly Lowinvestment cost (average Rs. 3.94 million per plant). According to Almad, a20-ton per day plant (a large one) would cost about Rs. 4.5 million at currentprices with a foreign exchange component of about Rs. 1.7 million.l/
E. Problems of the Industry
100. There is a general view that the industry is overtaxed. Squeezedbetween high taxes on both raw materials and finished product and a fixedselling price, the entrepreneurs consider immediate and f'uture prospects asindeed gloomy.
101. There is nothing fundamentally unsound in the business; it pro-cesses and adds value to a secondary product -- cottonseed -- the pri:acipaldomestic oil source. Oil is only imported to satisfy the deficiency 'betweenconsumer demand and available local supply. Since cotton is grown for high-value lint and not for its seed which occurs as a co-product, the industry'sdomestic raw material input is linked to the requirements of the domestictextile industry and to the prospects of the export market for cotton.
102. Although fundamentally sound, the industry does have problems otherthan seerningly inordinate taxation. One major problem is the structure ofseed production and marketing. This subject is discussedi in more detail inthe chapt;er on ginning, but will be treated herein from the ghee producers'viewpoint. In most cases, ghee manufacturers purchase seed which they crushthemselves. Seed is marketed by the ginner, possibly through a chain ofintermediaries. In order to obtain maximum prices, seed is held (much of itunder poor storage conditions) over the intervening period between harvests.Over that; neriod the seed deteriorates and the free fatty acid (ffa) contentrises with a consequent reduction in available oil.2/ Fresh seed containsabout 2.',% ffa: refiners rpnort nurchasing seed with -rfa content of un to11%; 7.5% to 8% ffa content is common.
1/ Ahmad, op. cit.
2/ For each 1% rise in ffa, there is an oil loss of about 3%.
103. Manufacturers estimate that the loss caused by bad storage con-ditions and overlong holding of seed before crushing is from 25 to 40% ofpotential oil. Annex V-A is a computation indicating a national refinedoil loss of some 25,000 tons based on the 1967-68 crop. This loss is about40% of the recent volume of vegetable oil imports.
104. The huge apparent loss is due either to a gross understatement ofghee production, excessive spoilage or diversion of seed to other purposes.That there must be a significant real loss is evidenced by the trade incottonseed in which transactions are made in the material up to 11 monthsafter the previous harvest. It would be to the country's interest to reducethe scope for this trade by reorganizing the seed-crushing industry. Suchreorganization would call for combining cotton ginning facilities with seedcrushing facilities. This would drastically reduce transport costs andwould eliminate spoilage in the seed since the latter would be converted tooil immediately after harvesting.
105. Frequent and sometimes lengthy power outages plague the industry-- a commion complaint in the industrial community. The seriousness of theproblem may be evaluated from the statement of one urban producer that poweroutages were equivalent to 25 days lost in a year.
106. The oil yield from cottonseed in the country averages about 12%.1/One of the causes of the low yield is the enforced use of locally-made ex-pellers; imports of the machines are banned. A locally-made e=eller costsabout Rs. 10,000, a high-grade imported one about Rs. 50,000. It is reportedthat the locally-made machine expels about 9% of available oil, the importedone yields about 16%. Industry holds that the difference in yields will payfor the imDort in the first year of its oDeration. Low vields from mechanicale-xpellers are partially offset in some plants by solvent extraction of resid-ual oil from the cake. It is suggested that the government investigate thereasons for the inferior quality of locally-produced expellers. If theirqomn1litv cannot be imnroved. the imnort ban should be rescinded.
F. ConcluGsions and Recommendations
107. The induistry appears to be too heavily taxed in relation to theselling prices it is allowed to charge. In 1967-68, the former excise duty onghee wJas cowmbined with sales tax- defense sureharge; rehabilitation t-jqw etc.,and levied at a new rate of Rs. 800 per ton. The duty is not levied on--ctu-1 -roductio;n blit+ on rrodQlict;on Pssronr +.-r_ ; +.)I'm sz r r; nmo+.-r +s aC~+V I ` Cr11(-+71 rh . I'71 (MI- C'_Th- t2i- .1 - - T fl('l +.T + ;---
rently, undercapacity operations are caused by a shortage of both domesticand imported oils. Taxes are also heavn y on imports and rlll operations a-pearto be unduly penalized.
108. The industry, which is efficient in the refining and hydrogenationst,ages, nLeeds res4'rLc'uu.ing in c4ade oiL4 Y.L Uk;LUX Uctlon and po.L4 ('(eLL.mILIIc±1 UUto
eliminate substantial oil losses. Management appears to be efficient,oIwOleUttdgeabLte, andU cpb of asLsti -I U1±the _ - ul-t1 restruc 4u- n opera-
tion.
_/ U.S. average is 17%.

109. Gr(rrpntlJv instsl Id cnanity is greater than annarent demand.New capacity now sanctioned should be deferred until available oil suppliesmore closely approach installed capac-it. Inst.ead; investment in new cottonginning and crude oil production facilities should be promoted. Currentcapaciy +wir l cointin +n e htb unricurtl+.ilized uin+til su iffi ce Pnt r"n T mn+Pr n i- S
available.
110. With the aid of industry, realistic projections of demand andzrapp,y Ifor edIi-bl1e oills over a 1five=year ter,,. sho'-~Ad be prepared. Aprnlthere are: currently none which would serve as guides for import procurement,domest up c t.a Uet UaLction ofC new cappacity.

- 46 -
Table V-1. HYDROGENATED VEGETABLE OIL PRODUCTION
(Ghee or Vanaspati)(000 Tons)
Pakistan E. Pakistan W. Pakistan
1960-61 40.4 3.4 34
1961-62 54.0 4.O 50
1962-63 71.1 4.1 67
1963-64 88.6 4.6 84
1964-65 94.9 4.9 90
1965-66 10o .3 100
1966-67 89.9 4.9 85
1967-68 93.5 5.3 68.2
Source: Pakistan Economic Survey 1968-69.
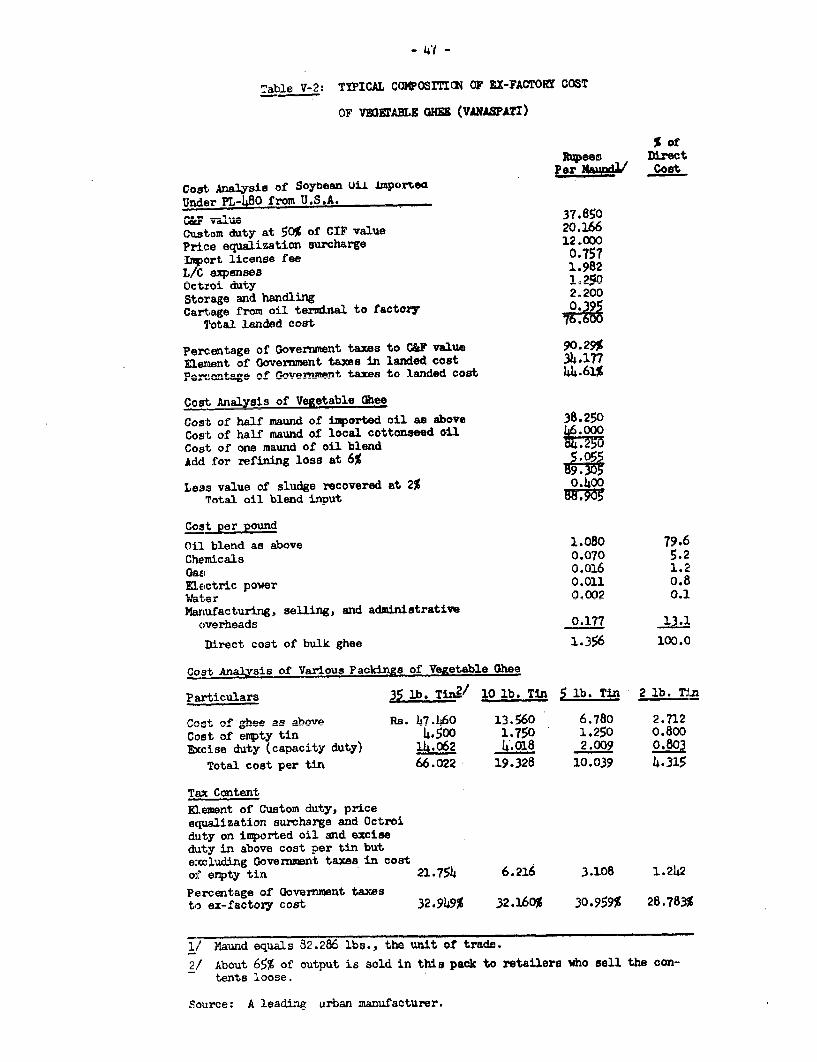
- 4/ -
Table V-2: TYPICAL COMPOSITICK OF EX-FACTORIY COS?
OF VEOErABL GHS (VANASPATI)
S%ofPer Maundl/ Coat
CotK AalysA - of _ovhnUiL l a1ortOd
Under PL-480 from U.S.A.
uor V"Uo W37.850Custom duty at 50% of CIF value 20.166Price ecualization surcharge 12.000Import license fee 0.757L/C expenses 1.982Octioi duty io2wStorage and handling 2.200Cart-Pe frnm oil terminal to factory 03O95
1'otal landed cost 76460
Percentage of Oovernment taxes to C&F value 90.o25Elemient of Government taxes in landed cost 34 .177Percentago oef .rlr nvamnt taxes to landed coat 44.61%
Cost A
Cost of half maund of imported oil as above 38.250Cos0t of half maund of local cottonseed oilCoat of one maund of oil blendAdd for refining loss at 6%
Less value of sludge recovered at 2% 0.400
Total oil blend input
Cost per pound
Oil blend as above 1.080 79.6
Chenicals 0.070 5.2GasU.OElcictric power 0.011 0.8
Water 0.U02 0.1
MarLufacturing, selling, and administrativeoverheads 0.177 13.1
Direct cost of bulk ghee 1.356 100.0
Cost Analysis of Various Packings of Vegetable Ohee
Particulars )) LU. -LZO ' lJv l. A.U 5 lb. T&n 2 b. T4
Cost of-hee Am bne Ra. 47.L60 13.560 6.780 2.712
Cost of empty tin 4.500 1.750 1.250 0.800
Excise duty (capacity duty) IL.062 4.018 2.0u9 0.803
Total cost per tin 66.022 19.328 10.039 4.315
TEax ContentElement of Custom duty, priceequalization surcharge and Octroiduty on imported oil and excise&.At- 4n above Gont nAr tin bute:cluding Government taxes in costof empty tin 21.754 6.216 3.108 1.242
Percentage of Government taxesto ex-factory cost 32.949% 32.160% 30.959% 28.783%
I Qn-"n' +U2 ks.. * -44. 4of t,-*...4-
2/ About 65% of output is sold in this pack to retailers who sell the con-SuentA loose.
Source: A leadin-- urban manufacturer.

- h8 -
Table V-3: VrA"rll E 0h D OR TS4/
Cottonseed Oil Soy Oil
Volume Value Unit Cost Volume Vlu,e Unit Cost
(Tons) (Rs million) (Rs./ton) (Tons) (Rs million) (Rs./ton)
1960-61
1961-62
1962-63
1963-64 6,400 10.6 1,656 63,150 93.2 1,1476
1964-65 14,050 22.7 1,616 63,550 105.1 1,654
1965-66 Nil Nil _ 27,700 50.2 1,812
1966-67 Nil Nil 74,1400 107.6 1,446
1967-68 Nil Nil _ 65,730 81.3 1,237
i/ PL 480 importsbegan nin 1955
Source: C-overnm.ent of Pawistan, Planning Division.
Industries and Commerce Section.
CHAPTER VI
SUGAR
A. Introduction
111. Sugar industry data obtainable while the Mission was inPakistan contain several conflicts concerning number of mills inoperation and capacity, white su g a r produced, import data, etc.The data used throughout this paper are believed to be a resonablerepresentation of conditions in the industry. Time did not permitreconciliation of contradictions and inconsistenceies Data for 1907-68 are used to present as complete a picture of the industry as ispossible.
112. During the 1967-68 season, SUgPrlnPA_ *.hp domirnn+ sourc- ofsugar, was grown on 1.245 million acres in the West and 0.412 millionin the East. a tota1 of 1=657 m.i llion. The crop coverci about 2.3%of the total cultivated land in the country and yielded 25.9 milliontons of .-ane (Table VT-1). For the period, the 30 mills in the countr y(11 in the East, 19 in the West) produced 510,335 tons of white sugar(L91.785 from cane- 18;550 from beet) valued -. Pat PA million (TablesVI-2 and VI-3). The net value added in milling is estimated at Rs 166million in the aggregate and Rs 325 per torn. I/
113. The mnlls employatotalof about 23, 000 pern, 5 -inEast, 18,000 in the West.2/ It is estimated that 4 million persons areenDgarA :in cuilt+.ivring tn +' rp
114. lCrrent1fl +tIher are 10 mlls operatingin -----. __jI - - - - _ ~ J LL_Lr U VV I CM-LO~ Ud±i.
having a total daily crushing capacity of 30,000 tons. In addition, 3beet mills in the northern zone have a seasorL leet capacity o2Ctons. At an average capital cost of Rs 28 million per mill, totalCAni±.tl jmnroQvfliS,+ -n at s4 D. milin -v /
115 Tn thA .as+. Trnnl t ee s 9MC c0ne M'lh 2 p-
owned ones having a seasonal sugar capacity of about 129,000 tons.4/ Atan averag- c-p-.±- al- 'P. Cl cost4.t±U .ofU Rs-- 22- ntR
million. 3/
116. Total seasonal crushing capacity (160 days) is about 6.5million tons representing an investment in the industry Of about Rs 774million, with an estimated 50% foreign exchange component. 3/
1/ Income, Employment and Investment in the Manufacturing Sector Duringthe Fourth elan, M. Akram Swati, Planning i aivision7
2/ Sources: Census of Manufactures,'International Economic Section'Planning Cormission, May 17, 1965;.
3/ The Economics of the Sugar Industrv in Pakistan, Plannning Division,Presidentis Secretariat, Government of Pakistan.
4/ Data from EPIDC.
- 50 -
117. The individual mills are well integrated since the primaryinput is cane and the output is finished sugar ready for consumptionwithout further processing. The industry's forward linkage to otheractivities is through its by-products: molasses and bagasse. The aver-age yield of molasses in the mills is 3.5% of the cane crushed. On thebasis of the 1968-69 crush of 4,305,000 tons in W. Pakistan, molassesproduced amounted to 150,675 tons.1/ About 71,000 tons reportedly areused for alcohol production in mill distilleries, 37,000 tons are usedfor acetate and 16,000 tons for polyethylene in factories having theirown distilleries. The remainder is used for various purposes locally.Small quantities of both alcohol and molasses are exported intermittently.
I1T. Until recently there was no industrial utilization of bagassein the country and all of it was utilized as fuel in the sugar mills. Thethree principal outlets for bagasse are for paper, newsprint and hardboard/particle board. There are facilities in the country now ror prodtucingpaper and board from bagasse. Increasingly more economic use of thematerial (when and where gas or other fuel is available as a substitute)may operate to slightly reduce the ex-factory cost of sugar.
B. Past Growth
119. Nationwide sugarcane production has increased from 8.7 milliontons in 1947-48 to 26 million in 1967-68. Production was erratic untilabout 1952 but has since increased fairly constantly at an average annualcompound rate of 4.1%. Development of the industry in both wings has notbeen narallel and each will be discussed separately.
(a) East Pakistan
120. At the time of indenendence there were only 5 mills in the wing;all privately owned. Annual rated capacity was 39,000 tons but actualoutput was far lower nnd inn;r3emiqte to meet increasing demand which wasmet by imports. During the First Five-Year Plan, three mills with asugar capa .cityr cf' qK-nnn +.ofA i.Orp, hons wr blt Diur ng the S.cRnc1 P lnn pe-p rd
three more were built and one expanded, raising capacity to 109,000 tons.by 196-66 Iy 1967-68, capacity hadi beejn fqurtJher ranised ton 12900 nnns+n
(Table VI-2). The capacity is expressed in terms of white sugar produced.2/
121. Actual sugar production has fallen short of "installed capacity";.+,-,,+ -. 1-.hA 1 00 ).lrt +_q ; -, 1o07_AR -. ; -a ;qqcoq,1A +n S- ko RUq! ,
V. U. UJJ. LA LWAV J. LiLv ±LL'.A A.s.1 , wA 4J> V L ~ L.L' .I'. -VWAJ~.L~ L&aL ..L_ SLV 1 UVJ VWL. V 2 J
capacity. It is understood that some mills produced nearly at capacityvsi~ le oth,er s fell far sh11ort .n_Detallddt onn idwiulnl efrm
(as in the West Wing) were not available to the Mission.
1/ PICIC, A Study of Sugar By-Products (for the Fourth Plan), July 1969.
2/ Capacity is computed on the product of the daily cane crushingcapacity multiplied by 160 days (assumed harvest period) times anassumed sugar yield. "Capacities" are thus calculated on somewhatideal norms which engenders the under-utilization syndrome. However,the adoption of rather ideal norms is not the only reason for under-uti li Atj nn

- 51 -
122. Developmenit policy has been to allocate new mills to the publi,sector. It is understood that there has not been any new private invest-ment in the industry in many years.
(b) West Pakistan
123. Government poliev has been to allocate the industry in the rnng>to the private sector; all but one mill (Bannu) are in private hands. A;sin East Pakvistan. the industry began its growth afi--ir 1947 through thesuccessive rnulti-year plans. The area under cane has grown sporadicallyfrom 1.2 to 1.7 million acres from 1960-61 te t9(7--, hut the yield neracre has increased but little - it annually lags behind East Pakistan byabout 3-5 tons per acre denending on the sAnAon.
124. The number of niants has aro.m from 3 atv TnAannan, to,- .19 a+present (Table VI-3). Rated crushing capacity has increased to 30,000tons daily which on the hasis of a U6
-Anir season, is 4.8 rillion tons.This capacity is a half million tons over the 1968-69 actual crushindicating a sufficienny of capaei.v -n n Certain. ments are considerinig expansion in those areas where cane supply exceedspresent installed canacity.
C. Priceq- Cose±t A nr Prf+ahlIj+.-xr
125-126. rc-ept for the usunl m-ntena,ce mterials and -4-ts, whichare purchased at the cash-cum-bonus rate at an entitlement rangingfrom 2.5 to 5 percent of the nnnual produc+ion va4ue, the rA-stry isinfluenced by local costs for cane and prices for the finished product,both of- which currently are gorerrmen controlled. Not only are can.ebuying prices controlled, but the area from whibh cane is drawn isidiuarcated by govefnment = a regulation frequer,tly overlooked -wheL canesupplies run short during the crushing season.
127. Cane is the largest single input and typically accounts forahbout (0 percent of direct- prouction cost before taxes. Prices to farmers(theoretically, at least) have increased from Rs. 1.75 per maund in 1957-58up to PRs 2 9n per Tnma in the souther. region of the West.T For the 196-68 season, in the West, price was related to sugar recovery but it isiinderstoodv that d 'evlal i unprov A satisfactory --
1/ 1 maund = 40 seers = 2.057 lbs. per seer. The seer is the retailselling unit.

and has been discontirnued. The cane price in the West currently is Rs. 2.75per mnaund (Table VI-4). The fixed prices to farmers are very often floutedby mill buyers who use various devices to exploit the cultivators such asforcing -them to wait for hours in the hot sun until near closing time whenthe buyer will announce that no more purchases Will be made that day butif the farmer -wdants to disDose of his cart load -the mill would take it offhis hands for Rs. 1.50 per maund. Such practices encourage gur productionwhich is done on the farm and which sometimes fetches a higher price thanwhite sugar.
128. The nine public sector mills in East Pakistan are marginal enter-prises; at least two are said to report substantial annual losses. Dis-advantageous location with respect to cane supply areas is the apparentreason for the large losses. EPIDC has given production costs for an"lavera.ge"l mill -wrhich show a loss of Rs. 256.68 per ton for 1967-68 or atotal loss of Rs. 28.1 million on a production of 109,405 tons for the sameyear (Table VI-'). Profitable operation seems far in the future since itdepends upon basic agronomic, transport and communication improvements.
129. The industry in the West appears to be profitable largely due tothe fixed selling price of Rs. 62.50 per maund and an amelioration of theproblems that plaguie the East. Inquiries were made by the Mission regardingthe rationale or basis for setting the fixed price. No answers were avail-able. Obviously, it is not high enough to permit the East Wng mills tobreak even. Equally obviously, it is high enough to provide an internalrate of return of up to 24 percent to certain West Wing mills and analleged inordinate profit to most.l/
130. A question arises as to the equity of the same fixed price beingapplied to both wings. Or, indeed to either wing. Price to the consumerdoes not reflect the low cost of imports, nor production cost in the West.The East is a special case and perhaps the existing price should be main-tained until such time as the East Wing industry can reduce its presenthigh production cost. Although Pakistan is a high-cost producer with thepresent level of sugar yield per acre, poor transport, and conmunicationbetween field and mill, it appears that an adjustment is in order so thatthe internal market price is not beyond the means of the urban workingclass.
D. Problems of the Industr
131. The industry's basic problem is the distressingly low yield ofsugar ner acre. All other problems are related to this one and are amenableto reasonable solution if the basic problem can be solved.2/ Low sugar
1/ The Economics of the Sugar Industry in Pakistan, Planning Division,Pre.qsid-enrt's $Secretariat. Government of Pakistan.
2/ These remarks do not apply to the problems of certain mills that areso badly located with resrpect, to cane sunnlv that prospects of success-ful operation appear to be very dim. The problems of these mills arediscussed in ublic Tndustrial TTndertrkings_ in Pak-stan n- Report of aReconnaissance Mission, May 13, 199, "Naylor Report".
yield, in fact, affects the national economy since the rising demand forw`hite s-ugar necessi-tates a large exoeriditure of foreign exchnaige forimports (of the order of $17 milliou Por 1968-69) (Tables VI-6, VI-79T7T- O'
132, Pakistan's cane and sugar yieid per acre are among the lowestIn the wTorld (Table VI-9). The problem of increasing them is a difficultone.!/f Adelquate soil type, water availability at the proper time, huamid-ity, length of growing season and high-yielding varieties that are diseaseresistant are some of the agronomic factors -which determine the areas ofthe country where soil and climatic conditions are conducive to the culti-vation of high-yielding varieties.
133. The gur problem is a serious one and in magnitude peculiar toPakistan. Both government and private industry estimate that not lessthan 60% of cane grown is used for the manufacture of gur which is anexceedingly wasteful use of a pereririal resource (Table VT-10). The pre-valence of the practice is relatec. to unavailability of white sugar inrural areas, low income and the price relationship between gur and whitesugar. Little or no effort is being made either by the authorities ormill owners to culrb the practice. A discussion of this rather complex,socio-economic problem is beyond the scope of this paper.
134. U:nder-utilization of capacity in the West is not believed to besignificant in most sections. Some mills are considering expansion inareas where farmers are complaining of the lack of market for their crops.The problem is different in the East where cane growing on a commercialscale is relatively new, transportation from field to mill has not beendeveloped and mill management is not good.
135. The problems of the public sector industry in the East includepoor location of mills, diversion of land by farmers to crops other thancane, unusually small land holdings (said to average less than threeacres as against eight in the West) which results in buying from a verylarge group of farmers (said to be over 100,000 per season), and the ever-present low sugar yield.
136. A Study G'roup is being formed in the Planning Division of thePresident's Secretariat for a comprehensive study of the entire industryincluding agronomic factors. The group may need assistance in the inveEti-gation of an industry influenced by many complex and interdependentfactors.
1/ A study by American Factors Association, a private Hawaii-based firnmwho mArA the investigation for their own purpose, concludes thatEast Pakistan's soil and climatic conditions are conducive to canepcti hih. er rn n yie +of o+h t caneA ad sg a- rc be X A Z A - Vachie
practiceas higher yields of both cane and sugar can be achieved.

E. Conclusions and Recommendations
137- The performance of the industry and the policies of governmenttow +r it , ,c; +h, hiil-h-an+ r1 ul-Lic+ cr;, , +-;c 4 , 4 t M,, r. _,
uvsw 1 v .- -' ' ~ -'-~f.J±- -. -. V± 4.- L &- S. J .OiLi. ' 11 LAt-
dustry, mechanically efficient enough in its milling and refining processes,is prot+eted from nori,1 lnternational --.- eti 1-ion bhihpces f4,U
by government, e.g., Rs 1,701 per ton as against Rs 380 ($80) at theofficial exchn.ge rate for recent imports. k
138. the disparity between the import A local pric unarrowed if other than the official exchange rate were used; but even_at an cxcha,,ge ~rato of 9:1 or o=ven 12:1, i.,vqortod s-ugar waould9ilbbelow Rs. 1,000 per ton, compared to the present ex-factory local priceof . ., 1,700 per t-on. Theu r,nn spreaL1dLeL1G Opltze ear dLJj - tJUec1Vesvel.y hLigh
despite the disparity between Pakistan's sugar yield per ton of caneof Q.5% ar the -u k iel ln other cotr11±uies of -U/0 ana above.
139-* Unless higher yielding, disease resistant varieties are developedand distributed to farmers, improved methods of cultivation includingfertilizer use9 are uli-versally intr-oduced, and better transport facili-ties are established, prospects are remote that the above disparity willbe eliminated. However, inX West Pakistn, where profits in the sugarindustry are very high, a reduction in the price is feasible and necessary.
1l0. Z.stimated annual white sugar demand in the country is aboutDr),uuu T,ori: LjuUnUUU 0n mrte iest, 12>,uuu in the ast." rouctionin West Pakistan for the 1968-69 season was about 401,000 tons; productionin East Pakistan for the same period was not available but assuning it wasabout the 1967-68 output of 109,000 tons, nationwide production was51u,000 tons or 97% of estimated demand. However, demand in East Pakistanis probably understated. Large-scale construction of new mills shouldbe deferred until full utilization is more nearly realized and until whitesugar is substituted in increased volume for gur. Since only 20% to 25%of cane growsn is processed by the mills, new construction on a large scalemay lead to further uneconornic land utilization. Expansion of existingmills in areas where and when conditions are favorable appear to be amore economic use of resources. In any case, realistic projections of de-mand for sugar are necessary before increase in nmli capacity is planned.At the present time such projections do not appear to have been made.
141. A recent study of the industry concludes that, in terms ofbenefits to the national economy, sugar manufacturing yields a negativerate of return, e.g., the resource cost to the nation far outweighs thebenefits.3/ The conclusion resulted, in part, from a study of the benefits
1/ The average CIF cost of imports in 1968 was L25 per ton ($60). Mostof the imports were from Eastern European countries. The price was probablybelow production cost; world market prices have been running around$80 per ton lately.
2/ Pakistan Economic Survey, 1968-69. The figure given presumably is forthe current year or the next. Longer range consumption projectionswere not available to the Mission.
3/ The Economics of the Sugar Industry in Pakistan. Planning Division.Government of Pakistan, (undated, believed to be written in early 1969).
- 55 -
to the farmer of growing crops other than cane. Certain double croppingwill return to the farmer up to 75% .rore than cane. If these conclusionsare valid, the sugar industry is in a precarious position with reeard tofuture availability of cane. Increasing emphasis on self-sufficiency in.food grains by using high-yielding varieties in both wings is makingsugarcane cultivation increasingly less attractive. The solution againhas to be sought in improvement in yields.
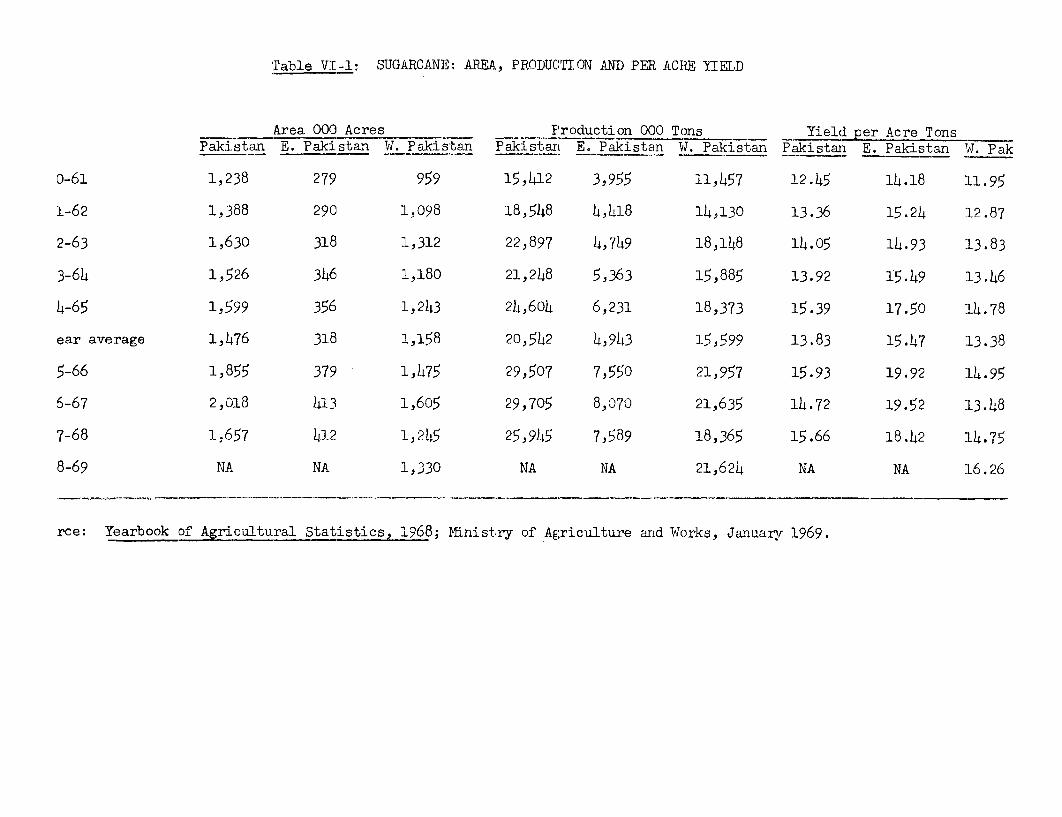
Table VI-1 SUGARCANE: AREA, PROIDUCION ANI) PER ACRE YIELD
.Area 000 Acres _Prodiuction 000 Tons Yiel( per Ac:re TonsPakistan E. Pakistan W.TaIstan Pakistan E., Pakistan W. Pakistan Pak:Lstani E. Pakistan lr. Pak
o-61 :1,238 279 959 15,412 3,955 11i,457 12.45 14.18 :Ll.95
1-62> 1,388 290 1,05'8 18, 518 4, I1-8 14,130 13.36 15.24 :12.87
2-63 :1,630 318 1,312 22,897 4,749 18,148 14.05 14.93 L3.83
3-614 1,526 346 1,180 21,248 5,36i3 15,885 13.92 15.49 :13.446
4-65 :1,599 356 1, 243 24,604 6,2:31 18,373 15.39 17.50 :L4.78
ear average '1,476 318 1,158 20,542 4,943 15,599 13.83 15.47 1L3.38
5-66 1,855 379 1,475 29,507 7,550 21:,957 15.93 19.92 -L4.9,5
6-67 2,018 413 1,605 29,705 8,o070 21,635 14.72 19.52 :13.48
7-68 :1, 657 113.2 1,24.5 25,945 7,589 18,365 15.66 18.42 L4.75
8-69 NA NA 1,330 NA NA 21,624 NA NA -L6.26)
rce: Yearbook of Agricultural Statistics, 1968C; Ministry of Agriculdture arid Works, January 1969.
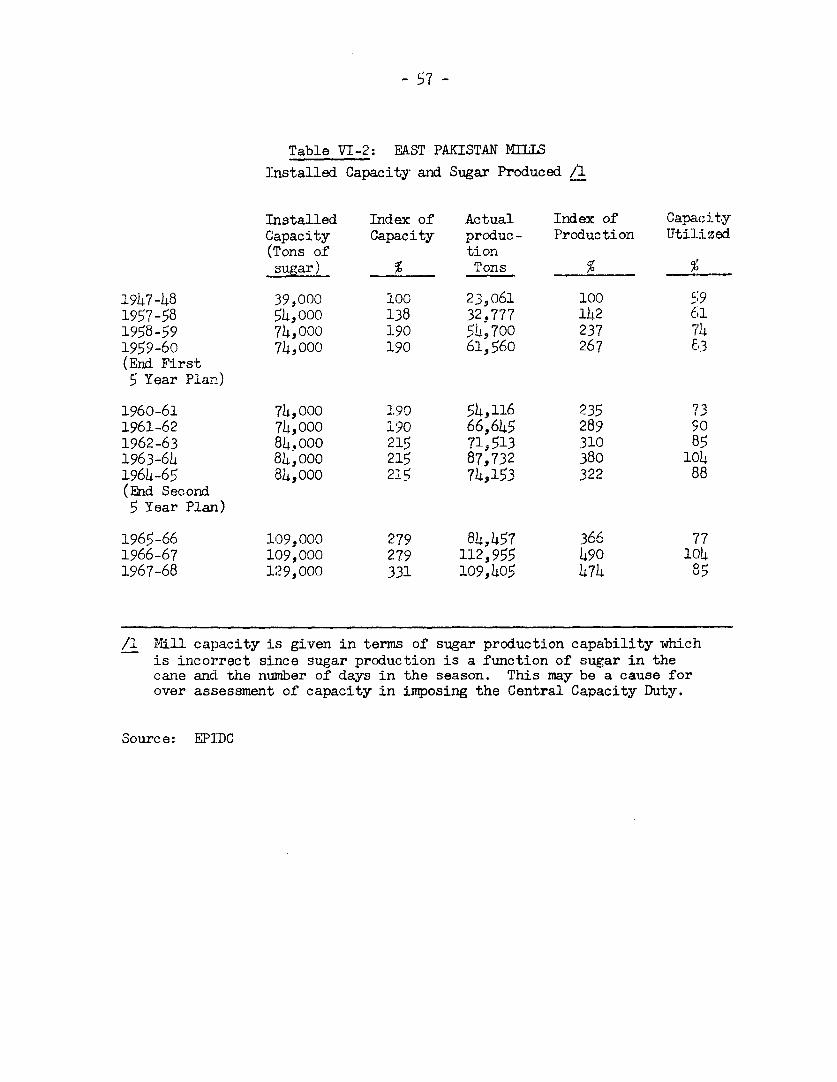
- 57 -
Table VI-2: EAST PAKISTAN MIIISInstalled Capacity and Sugar Produced /1
Installed Index of Actual Index of CaMacitVCapacity Capacity produc- Production Utilized(Tons of tionsugar) % Tons %__X,
1947-48 39,000 100 23,061 100 .;91957-58 54,000 138 32.777 l12 f1,1958-59 74,000 190 h,.700 237 7'h1959-60 74,000 190 61,560 267 E3(End First5 Year Plan)
1960-61 74,000 490 Sh,116 235 731961-62 7,000 Ig90 66,645 289 901962-63 8h,ooo 215 71, 513 310 81963-6h 84,o0o 215 87,732 380 1041964-65 84.000 21' 74h,53 322 88(End Second5 Year Plan)
1965-66 109,000 279 84,457 366 771966-67 109,000 279 112,955 490 1041967-68 1:29,000 331 109,405 474 8,
/1 Mill capacity is given in terms of sugar production capability whichis incorrect since sugar production is a function of sugar in thecane andi the number of days in the season. This may be a cause forover assessment of capacity in imposing the Central Capacity Duty.
Source: EMDC

- 58 -
Table VI-3: WEST PAKISTAN MILLS: INSTALLED CAPACITYAND SUGAR PRODUCED 1968-1969 SEASON
Daily raw Sugar produced frommaterial capacity Gur Recovery
based on Shakkar/ fromCane Beet Cane Khandsari Beet Total cane
Name (19) (Tons) (Tons) __%
North ZonePremier (D) 3,74,0 i0,000 36;345 Nil 8,743 45,o88 8.59Frontier (D) 1,000 5,000 12,965 I 3,707 16,672 8.22Charsadda 2,000 Joo00 20;032 38 6,100 26.170 8.46Bannu (P) 1,500 5,516 Nil 5,516 8.50
BTi.] Avg.
CLentrJf .1 Z-oe
Rahwali 550 5,414 Nil 5,414 8.36Leiah 1,200 22,761 22,761 8.87Kohinoor 1,500 18,442 18,442 8.87Noon 1,500 24,750 760 25,510 8.53
Crescent (D) 2,000 31,009 Nil 31,009 9.31Husain 1,500 20,318 U 20,318 8.79Shahtaj 1,500 14,364 14,364 8.61Adamji 1,500 22,246 22,246 9.33Hyesons (D) , 1,500 32,703 43 32,746 8.78Bahawalnagar ± 1,500 10,544 69 10,613 8.66
?77W Avg.
South Zone
Fauji 1,500 30,189 30,189 9.60Habib (D) 1,500 24,584 3,262 27,846 7.95Bawany 1,500 23,074 1,179 24,253 9.22Mirpur 1,500 17,759 186 17,945 8.80Mehran /1 1,500 3,828 Nil 3,828 8.75
30,000 20,000 376,843 5,537 18,550 400,930 8.72 Avg.
k/1 Air-s op±ery at- season4.. 2. i.14V J±I.. Ci.1
DL) ) > | LJ.L r.4 y~ V~4~-
(P) Publicly owned - all others are private enterprises.
Source: Management, Crescent Sugar Mill. Information from Planning Division, Industriesarid Coummerce Section indicate 22 mills in Test Paksta.n. The nirimber could notbe verified. Crescent Mills has detailed information (as above) on each milland their data appear to be more reliable. LhTe t}ee mills listed by the Plaj"ngDivision that are omitted from the list above are United, Al Noor and Shaharganj -
L ~. .. e i I ***L* 4* ..~* uh u4*-e mi r
the latter appears uo bue a Bengal narmie. t is - possi tt the 4e 4l 4
in the planning stage or are under construction.

- 59 -Table VI-4: 'WEST PAKISTAN
Prices of Cane1957-58 to 1968-69
(Rs per maund)
1957-58 1.751958-59 - 1.621959-60 - 1.501960-61 =~1.62 u,p to 9th FebI,--,,',, 1961
2.25 after 9th February 19611961-62 -- 2.501962-63 - 2.251963-64 - 2.001964-65 - 2.:251965-66 - 2.251966-67 - 2.00 /2
From From From From1967-z8 Frormr Co.urinerncement 11-15-67 12-15-768 2-15-6 to
of crushing season to to to close of- 1 -,1967I 1=4=6.' j ~IL94. 7 1-14 C)..-A 2-± J-1±48 - sa-o--n
For mills located 2.25 linked to 8%in Northern Region recovery. 2.00 2.12 2.37 2.50
Increase in rateFor mills located of 0.07 per maundin Central Region on every 0.25% 2.19 2.31 2.56 2.68
increase in re-For mills located covery. Decreasein Southern R,,gion in rate of 0.07 per 2.37 2e.4 2.69 2.75
maund on every 0.25%decrease in
1968-69
For mills locatedin Northern Region 2.50
For miwlis locatedin Central Region 2.75
For mills locatedin Southern Region 2.90
/1 For East Paldstan: 1968-69, Rs 3 per a 4nd at mil gate;Rs 2.75 at buying centers with mill paying for transportation.
/2 Exceptions are: 1.37 for Premier, Frontier and Charsadda in effect from 4-25-67.1.38 for Bannu in effect from 5-4-67.1.38 for Rahwali Cooperative in effect from 5-9-67.
Source: Crescent Sugar Mills Ltd.

T TVI-5 PRODUCTION COST IN AN AT.- AGE KPTDC STfLAR MTT.T.
(Rs per maund)
1967-68%i of ex-
1962- 1963- 1964- 1965- 1966- 1967- faetoryI963 196- 1965 1966 16Q7 6R c8 ost
Sugar Cane 32.10 33.7 36.76 34.10 37.76 29.82 41.4
Cane Incidental 2.57 2.14 2.86 3.29 4.41 0.96 1.3
Sulphur 0.18 0.24 0.22 0.21 0.22 0.18 0.3
Other Chemicals & Prod. Stores 0.49 o.64 0.74 0.49 0.74 0.43 0.6
Salary & Wages (Factory) 2.68 3.64 3.93 3.65 4.20 4.93 6.9
Packings 0.90 0.88 0.89 1.18 1.28 1.11 1.5
Spares 1.15 1.17 0.91 1.10 1.20 1.60 2.2
Depreciation 2.53 3.53 4.10 3.36 3.39 6.14 8.5
Insurance o.60 0.56 0.41 0.53 0.30 0.47 0.7
Central Excise Duty 10.30 10.30 10.30 10.30 10.5 13.00 18.1
Other Factory Oirerhead 0.08 0420 o.65 o.55 1.h9 1.59 2.2
Admin. Salaries 0.68 0.91 0.97 1.01 0.43 0.55 0.8
Admn. Other Expenses 0.42 0.50 0.76 0.95 o.40 0.32 o.4
Head Office Overhead 0.72 0.41 0.34 0.34 0.26 0.36 0.5
Interest on Government Loan 0.13 4.39 0.05 0.22 0.37 0.91 1.3
Interest on Overdraft 0.14 0.05 0.01 0.16 0.84 1.53 2.1
Selling Expenses 0.23 0.08 0.13 0.13 0.19 2.13 3.0
55.90 63.11 64.o03 61.54 68.03 66.03 91.8
Provincial Dues 5.90 5.90 5.90 5.90 5.90 5.90 8.2
Ex-Factory Cost 61.80 69.01 69.93 67.47 73.93 71.93 100.0
*rbappees per t-on 1 401 00 , 1 PR O 1 5 1,937.5 Rr 1,.1 rn07 R7 1 Q97 Q9
Fixed ex-factory selling price 1 701.25Loss: E 256al v)
Source: East Pakistan Industrial Development Corp.
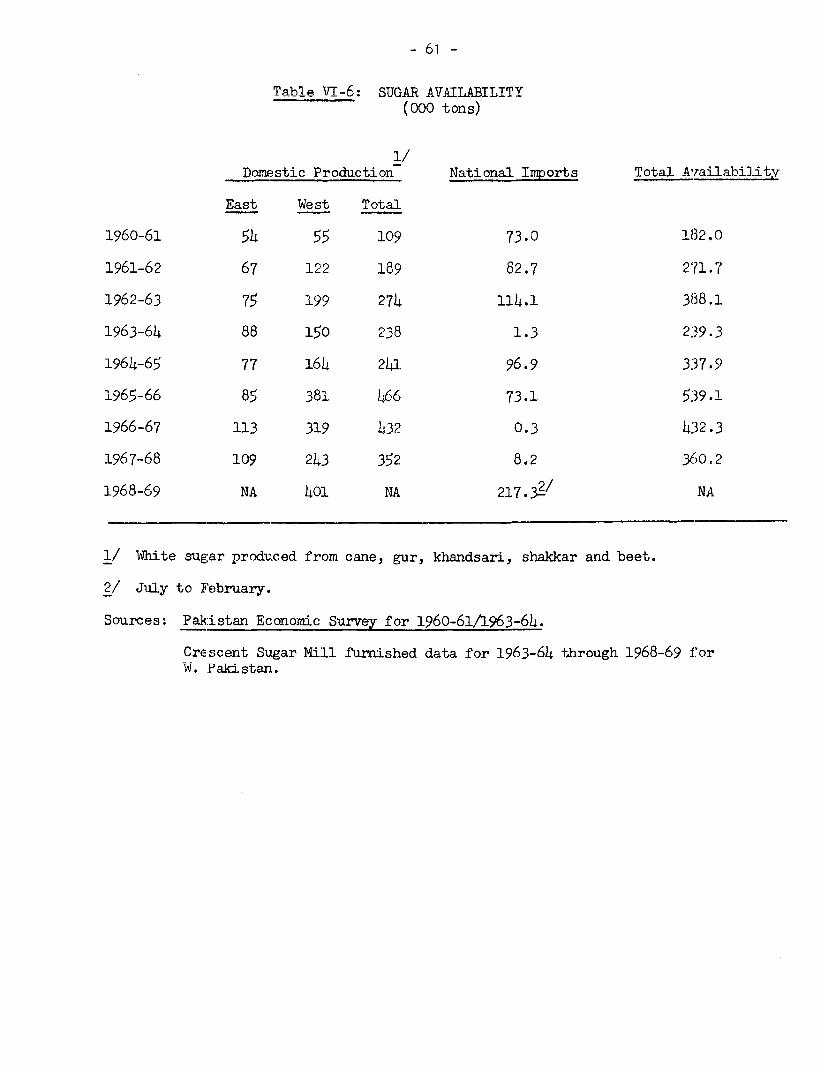
- 61 -
Table VT-6: qTTGAR AVAITTALITTY(000 tons)
1/
Domestic Production National Imports Total AvaiLabiliLy
East West Total
1960-61 54 55 109 73.0 182.0
1961-62 67 122 189 82.7 2'71.7
1962-63 75 199 274 114.1 388.1
1963-64 88 150 238 1.3 2:39.3
1964-65 77 164 241 96.9 337.9
1965-66 85 381 466 73.1 539.1
1966-67 113 319 032 0.3 432.3
1967-68 109 243 352 8.2 Y;0.2
1968-69 NA 401 NA 217.3-2/ NA
1/ White sugar produced from cane, gur, khandsari, shakkar and beet.
2/ July to February.
Sources: Pakistan Economic Survey for 1960-61/1963-64.
Crescent Sugar Mill furnished data for 1963-64 through 1968-69 i'orW. Pakistan.
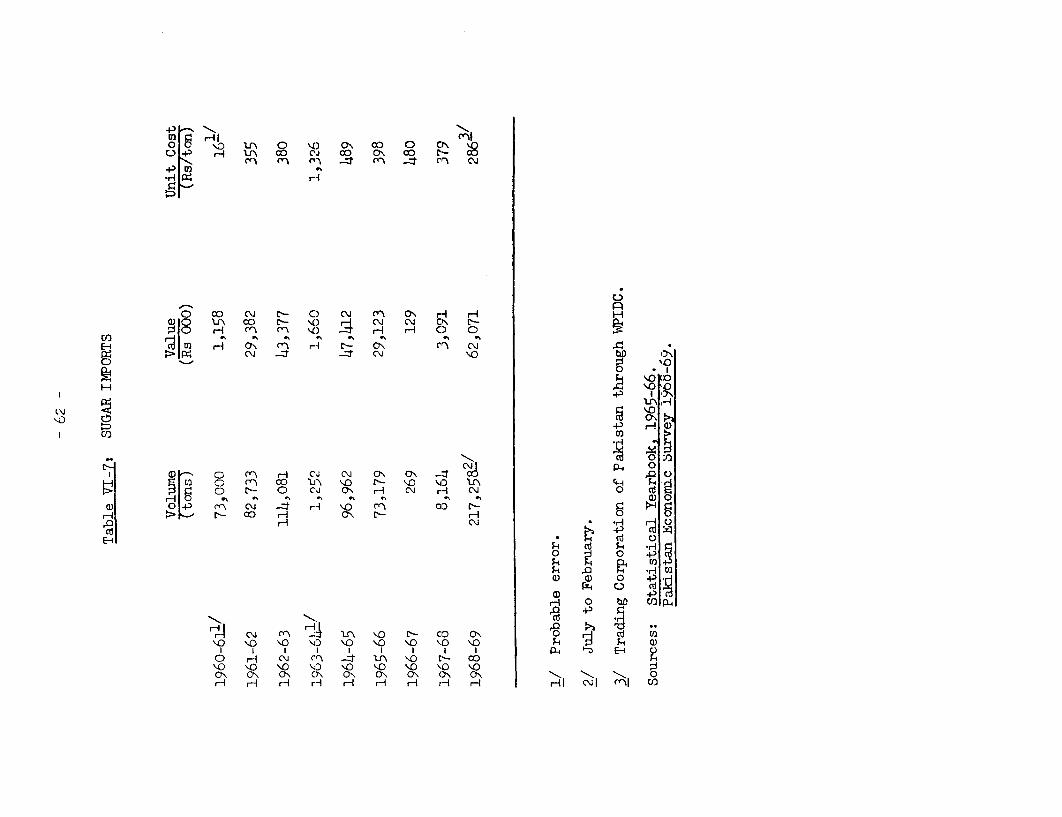
HI crEO '.0 L1\ U '.0 O) s a) C) Cr'i '.0 -P r- UN a) c0i a) CN a:) r- a
Cy. C1 v. 4z '\ .: cr ) co.
CO CC C\j C) _\J M CP\ H C0.) 0) tr\ CC) [-- \'.0C" CQJ CN E'-*d H ) C ' 4 H C) C)
v.) O'\ M r-A LI- CN or\ CQ O
C\)
o CO U) ao Cr- H rl 04 C 4 ON r-
C2 O0.4>) .4 -J rl rl 0 O 3:
Li - CO HS CN C'- Hd r s A C P. p: C.4 _. _iF C4 <D bp r:
_,~~~~~~~~~~~~~~~~~~~~~~~~~~~~~~0 IV).
o~ ~~C >
C\j 0) 0)
n C CY) CC) uE \o rI- 4D \4D lLr\ -2 h.C Nj) r-- C C4 CN r C04 rO C4 O i C
0 +:> r0 C"j r'4 ) '.0 r0 ' O 0C H C- a .D r CN r\- rO C O
r4l Cq 4A h 0
'.0 '.0 '.0 '.0 '0 '.0 NO '.0 '.0~~~~~~~~~~~~~~~0 0 4.Cr'. Cr' ON ON N ON ON N O '-. r,. O-. HO H H H H HH . I co
O - L\ co CN Ot) t) w) w\0 D \AD \D \0 0 \0 h
C) ri CQ cn -:f lX \,O t- Co \tD \() \40 %0 \D \10 \0 \0 110 CPN CN CNo 0\ C\ 01\ CN ()\ ON 0 rH rH rlI rI rH rl ri rl rlq 0i Cf\ C4| CO|
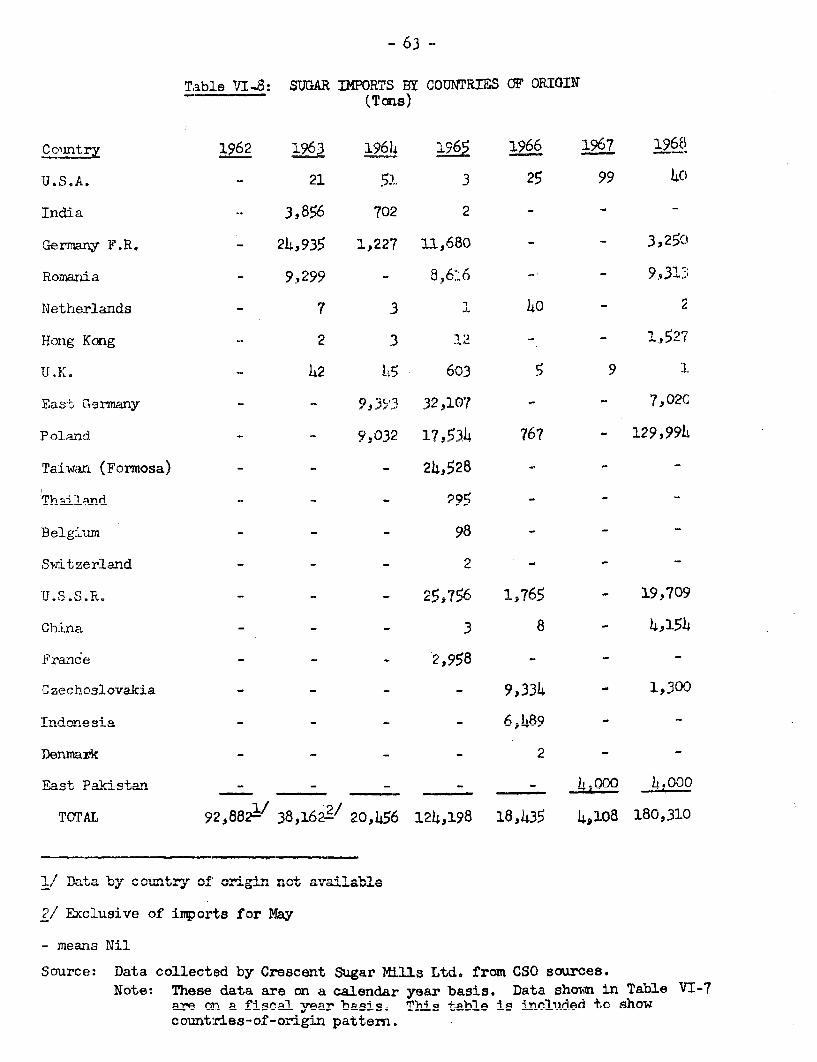
- 63 -
Tiable VI-8: SUGAR IMPORTS By COUNTRIES OF ORIGIN(T ons)
Colntry 92 1963 1964 ;26E 1966 1967 1968
U.S.A. - 21 51 3 25 99 4C0
India - 3,856 702 2 - -
GermnanY F.R. - 24,935 1,227 11,680 - - 3,25C\
Romaia - 9,299 - 8,6.6 - - 9,31;
Netherlands 7 3 1 40 - 2
Hlong Kong -- 2 3 - - 1,527
U.K. 142 L5 603 5 9 : 1.
East Germany - - 9,3t'3 32.107 - - 7,02C
Poland - 9.032 17.53L 767 - 129,9914
Tai wan (Form.osa) - - - 24,<28 - -
ThI1 anrd - - - 295 - - -
S%d tzerlnd- - - 2-U.S.S.R q,;.. _ _ 19_,709
C.hina 4.15- - - 3 8 4
Frano e ~- - _ 2 ,9 -R _ _-
C ze_ - - - - 9,33A4 - 1,300
In d c esia S 1 n- - - - 6 1Q --
Denmark - - - - 2 -
EoaSt. P+.:n _ _ _ _ _ L000 k.O0O
TCIAT. Ag2o88 )./ 8A 2. 120,18 18,I3A 14,108 180.310
n / n^ ss, num r^4t -A -4 -^4- -- 4 .<1,4/ V ) U LJ _~ i V a j w V A . -a. U a vow - aa. L
° / 1cl4us- of, t.forts Lfor May
mean,s NA.il
Source: Data collected by Crescent Sugar Mills Ltd. from CSO sources.Note: These data are on a calendar year basis. Data shon in Table VI-7
Are n afiGsca1 year basis. Thi s t.able 8 iencluled to showcountries-of-origin pattern.

- 64 -
Table VI-9: SUGAR CANE YIELD PER ACRE, 1960-61(Tons)
Cane Yield Sugar Sugar YieldPer Acre Recovery Per Acre
__ (%)Hawaii 74.3 10.9 8.1
Peru 61.8 11.0 6.8
U.A.R. 42.7 11.0 4.7
Taiwan 32.5 12.3 4.o
Barbados 30.6 11.6 3.5
Amqtral ia 26.9 15.4 4.1
Tndia 18.3 9.7 1.8
Pki 'stan l5.6 8.5 1.3
World Average 20.6 10.4 2.1
Sources: International Sugar Conuncil, The World Sugar E.Conomyr,Vol. II, 1963. Pakistani data is from local industrydata.
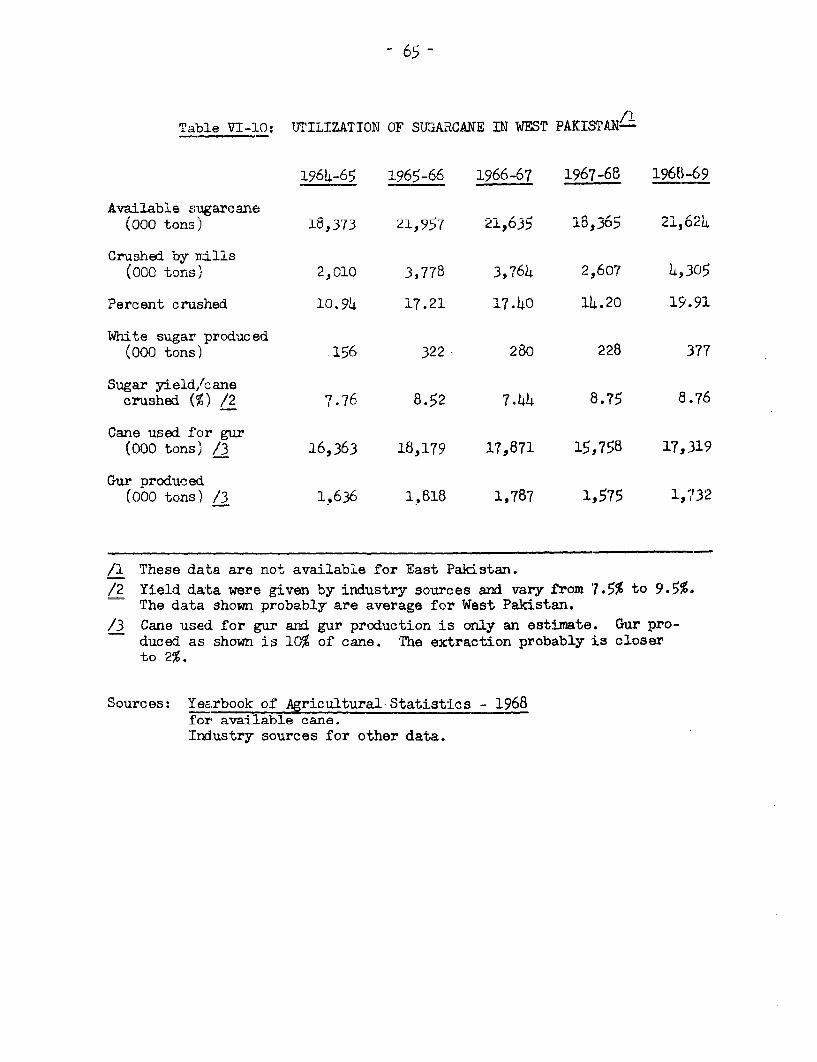
Ti3bae V-L-,L: ULLIMT UON OF SUGUARCUJUAIE L11J WfAw') r &n-Iolftil
1964-65 1965-66 1966-67 1967-68 1968-69
Available sugarcane(000 tons) IW,373 21,957 22,OJ5 1o)o 64
Crushed by mi]is(000 tons) 2,010 3,778 3,764 2,607 4,305
Percent crushed 10.94 17.21 17.40 14.20 19.91
White sugar produced(000 tons) 156 322 280 228 377
Sugar yield/canecrushed (%) /2 7.76 8.52 7.44 8.75 8.76
Cane used for gur(000 tons) /3 16,363 18,179 17,871 15,758 17,319
Gur produced.(000 tons) /3 1,636 1,818 1,787 1,575 1,732
ii. Tnese aata are not avaiiabie for Ezast Pakistan./2 Yield data were given by industry sources and vary from 7.5% to 9.5%.
The data shown probably are average for West Pakistan./3 Cane used for our and gur production is onlv an estimate. Gur pro-
duced as shown is 10% of cane. The extraction probably is closerto 2%.
Sources: Yearbook of Agricultural Statistics - 1968for available cane.Industry sources for other data.

CHAPTER VII
SEAFOOD FEEZIiNG
A. Introduction
142. Inadequate planning for industrial development and implementa-tion has accompanied the growth of the shrimp and lobster tail freezingindustry in West Pakistan. Apparently, without benefit of critical pre-investment analysis, sanctions were granted by the investment lendinginstitutions who seemingly acted independently of each other in an unco-
ordinated im lementation program resulting in serious over-building.
143. The industry was conceived as a foreign exchange earner, mainlycatering to the U.S. and Japanese markets for frozen shrimp and lobster
tails. Some frozen fish fillets and frog legs are also exported but the
volume is small in relation to the principal items. Shrimp constitutes
90% of industry export (Table VII-l). Presently, no effort is being madeto promote a domestic market for frozen fish or seafood since commercial
and household refrigeration is almost totally lacking. Local demand is
met by fresh or dried sea produce.
B. Past Growth
1LL. Conceived primarily as dollar earners, 25 plants were sanctionedand 16 have been constructed. Of the 16, currently only 3 are fully active,
4 are partially active and the remaining 9 are shut down. Those that are
fully and partially active operate at about 25% of capacity in the aggre-
gate. The foregoing information was obtained from industry sources and issubject to confirmation.
Table VII-1: EXPORTS OF FROZEN SEAFOOD(Volime 000 lbs)(Value 000 Rs)
Shrimp Prawns Lobster TotalVolme Value Volume Value VTl,imp Value Volirime Valuie
-i~ n. -41 7 [R ' .?Q ) A2 9 R 9 '
1963-6)4g 2,872 7,758 314 712 29.1 103 3,215 8,5731964-65 3,577 10,717 249 432 1.3 27 3,827 11,1761965-66 6,h76 19,4.12 512 1,448 53.4 150 7,041 20,980
1966-67 10,256 36,557 150 898 36.0 153 10,442 37,608
Source: Foreign Trade of Pakistan 1963-66 to 1966-67Export Promotion BureauGovernment of Pakistan
- 67 -
145. The volume of sales of the three major frozen items, shrimp,prawns and 1obster, increased three-fold in the period 1963-1967 whilethe value of sales more than quadrupled. The shipments are mainly tothe U.S. Total voltine e:)norted in 1966-67 was l0.4 million poundsvalued at Rs 37.6 million. The East Wing supplies about 16% of exportsannLnlly. The active plants employ about 125 workers each. Irdustryestimates that about 6,000 are engaged in shrimp and Lobster fishing asa sep1ate act 1rity.
C. Prces Costs and-I Prfitnbilitr
i46. A sales price composition twhich mny be t-nical for the survivingfirms is:
Salesthrough delivery of exchange Rs 4h,872;619through bonus market 3,536,070
8,5408,689Ccst of sales
MaterialDomestic 5,151,814Imported 338,578
Services 92,169Labor 173,631Selling Expenses 682,389Administrative Expenses 321,799Depreciation 325,757Profit before direct taxes (incl. bonus) 1,322,552Direct Taxes (holiday) nil
Total sales value 8,408,689
147. In a way it is surprising that a simple cleaning and freezingoperation requires high bonus payments in order to be profitable. The
profit margin of 16% on sales is substantially above the average in in-dustrv and it most likely results in a very high profit rate on equity.
D. Problems of the Industry
148. The reason for the marked under-utilization of capacity is simplythe lack of shrimp; lobster is almost a sideline although also in shortsupply. Capacity in this case relates to freezing capacity. The process,
consisting of washing, grading and packaging, is entirely manual, the laborforce being adjusted to the seafood available at a given time.
149. Some firms own and operate their own boats9 the maximum numberprobably being about 10 per company. The firms, however, purchase thebulk of their reauirements from some 600 independent fishermen who operate
- 68 -
out of Karachi. The boats vary in size; some are powered, others sail.The largest boats are in the 40 ft. range, powered with a 65 h.p. dieselengine largely of Japanese make. It is in this type of fishing fleet thatthe major cause of under-utilization often lies. The boats are too small
and under-powered to trawl at more than 20 fathoms (US commercial shrimp
boats trawl down to 50 fathoms). Shrimp are a bottom feeder and trawlingmust be done on the sea-bed.
150. Another cause of capacity under-utilization is the lack ofknowledge of shrimp movement and, therefore, their location at a giventirme. The fishermen do not know, for example. whether shrimp breed in
deep water and migrate toward shallower or vice versa. Having no modernelectronic fish locating devices, their daily hunt is on a haphazardbasis. The U.S.S.R. has had a survey ship in coastal waters for some
time but the industry does not know the results of their efforts.
lU1. A special problem facing the industry is indiscriminate fishing.There are no regulations limiting the size of shrimp and lobster which maybe takeng or in what season. Fishermen now take any and all includingfemales with roe. Improvement of the fleet could cause depletion if catchregulations are not promulgated and enforced.
o2. Boat builringf being a traditional occupation, industry spokesmen
state that if licenses and funds were available for teak, heavy dutyengines (185 hp), and deck winches with steel cable, local boat builders
could build a 60 ft. craft capable of deep trawling at an extended cruisingrange. Some years ago USAID imported high speed 185 h.n. Caternillarengines for fishing which did not survive for long due to uncertainty con-erning responsibility for .maintenance. A hea w -dtnty, rugged engine is
needed.
153. Most boats go out in the morning and return in the afternoon.Pishlermen then sel' their catch at auction in Fish Har.hnr More than 30%
of the catch is rejected by processors for reasons of quality. Independentfishleriren do not have insulated holds in their craft nor is there any
public icing facility in the harbor available to them. Shrimp must be de-headed ald iced immediately upon being brought on board since the headcontains enzymes that quickly spread into the body upon death causing theflesh to become "muishy,'" a conldition not acceptable to processors onsanitary grounds. The rejects are sold on the local market.
154. Until the catch is increased and better quality assured, itdoes not appear that the currently inactive facilitles will become thriv-ing enterprises. The capital tied up in the plants must be considerablebut cannot be quantified.
- 69 -
E. Conclusions
155- The over-built industry is struggling with the basic problemsof quantity and quality of raw material and these problems can be solvedonly by adequate planning.
156. Application of the results of the recent U.S.S.R. survey, whenobtained, would be helpful in determining availability of raw material.Some judgements could then be made concerning limitations on the numberof plants which could survive considering the volume of the seafoodresource.
157. In the meantime, continued use of the plants for poultry andproduce storage appears to be the most practicable use for some of theclosed-down plants.
CHAPTER VIII
TOBACC3
A. Introduction
158. At Independence, there was no large--scale cigarette manufactur-ing -hich is the dominant use of the leaf in the country. Emphasis inplanning iwas placed both on cultivation and processing of tobacco, withconsiderable success. The anticipated crop for 1969-70 is c.f `he order of400 million pounds (310 million in the Wes. and 90 million -n the East),compared to less than 200 million only ten years ago. Concurrernly, leafpreparation and product manufacturing facilities were established over thesuccessive Plan periods. A total of 41 cie.L-ette manufacturing facilitieshave been sanctloned, 20 in the East and 21 irn the West. They -il2. have atotal annual oanacity of 76,5964 million pieces, representing an in7vestmentof Rs. 147.8 million when all are constructed. Currently, 35 plants are inoperation, 20 in the East and 15 in the West, whikSch produced D0,141 m-il-lion cigarettes valued at Rs. 690.2 million in 1967-.68 (Table VITI-l). Thecigarette industry employs about 7,300 persons.
159. The industry is cirectly linked backward to intermediate processors(redrying) and to the farm. Investment in redryitg plants is about Rs. 23million and approximately 5,000 persons are employed, including seasonallabor.
160. Blending of tobaccos is essentiaL to suit the taste of consumers.Virginia tobacco is imported on bonus voucher largely by the makers ofbetter quality cigarettes, and is nurchased from the PL 480 Assistance Pro-gram wohen available. (Table VTTI-2). Entitlement of spare parts has beenassessed at 2% of the value of imported machinery, which workes out to beRs. 922,185, the sum on which licensing is based. Other processing materials'import (paper, foil, etc.) is classified by quAlity of cigarette: chean.medium, cork-tipped, good, and superior. The value of these imported itemsvaries per million pieces from Rs. 205 fonr chean t.o Rs 761 for sune rorquality. Total raw material entitlement is Rs. 8,233,633.1/
161. Industry sources state that current annual excise taxes paid togovernment are of the order of Rs, 430 million, making the industry one ofthe largest collectors of central excise duty.
B. Past Growth
162. Growth rates in all phases of the industry have been impressive:th cnron increased at a co.pou_nd rate of 10.1% bet-een 1960-61 n-d 1967-68(Table VIII-3). Equally impressive has been the growth in cigarette prodluc-tion (by far the dominant use of tobacco) from, 10,128 million paeces an1965-66 to 30,151 million pieces in 1967-65, a compound rate of 73%. The
West, with 15pla'nts, produced 2 mLljon oU the national prod- UioL ofn 3
million pieces, indicating that the plants in the West have a higher
1/ Cigarette Manufacturing Industry in West Pakistan, (Undated), K. S. Hasan,Directorate of Industries and Commerce, Goverrnent of West Pakistan.

productive capacity than the 20 in the East (Table VIII-1). It may be notediii tihe LabiLe LtatL installed capacit5y in .I East exceedA's sanctioned, lilEinstallation has lagged in the West.
163. Government policy has beer. to allocate the industry to the privatesector which is led by one Joint venture ente-prise (foreign equity 65 _ 93',Pakistani 34.07%). This firm has put both effort and money into the agronomicsidue W-LUi considerabule sucuess in increasing volum we[ and rasing tUhe qua.iYof the domestic leaf.
C. Prices, Costs and Profitability
164. Of a typical ex-factory aggregate sales price for a range of mediumto superior cigarettes and other tobacco products, 35% is raw material, ofwhich 27% is domestic and 8% imported in terms of value inclusive of bonusvoucher prem:ium and diuties. Direct taxes account for another 48% and profitfor 5.4% of sales.
165. Stnce exports of manufactured products are a small proportion ofdomestic sales, the bonus system and tariff impact are reflecmed largelyin the total price paid for imports of inputs. Of that price, bonus voucherpremiums are 38.2% and import duties 12.8%.
D. Problems of the Industry
166. According to leading industry spokesmen, the industry does nothave over-r-iding problems. Heavy taxation is expected, most of which, asin other countries, is passed on to the consumer. The industry believesthat the export of cigarettes is unlikely to expand since most countrieshave their own producing facilities, which are offered a substantial degreeof protection. Pakistan is a newcomer in the market for unmianufacturedtobacco and the quality of the indigenous product will have to be improvedbefore a larger and more permanent share of the market can be obtained. Atpresent, exports of unmanufactured tobacco amount to Rs. 12.4 million, andexports of finished products Rs. 8.7 million.
167s The cigarette industry is one which lends itself to large-scaleproduction. Authorities in Pakistan have determined that an economic rangeof annual, single-shift productive capacity is from 400 to 600 millioncigarettes. The import content of plant capital cost ranges from Rs. 5(0,000to Rs. 868,ooo and represents about 50% of total cost.l/ There has been aproliferation of small, uneconomic-sized units (some "tunrecognizedll) in thecountry producing a total of 89 brands of which no less than 62 brands retailat Rs. 0.25 or less for 10 cigarettes. Lacking financial resources andmanufacturing and marketing expertise, some of the smaller firms are facingserious difficulties.
168. An industry spokesman stated that the system of local (municipal)taxation and the multiplicity of local tax rates in West Pakistan on acommodity t,hat already bears a high rate of central excise duty places anunnecessary burden on the industry. A simplification of the taxation systemcould be beneficial to both government and the industry.
1/ Estimates of ,,s sze were -,ma-le by PITrTmatkCI I ' es-.vstent AArdvsory.sr Center
of Pakistan and the Standardization Committee.
-72 -
169. As indicated in Table VIII-1, production in the West has exceeded
installed capacity. In the East the situation is not bright: installed
capacity is 243% of production. The problem of overcapacity appears pe-culiar to the industry in the East. The reasons for this are not clear,
but may possibly be engendered by overestimation of the market and the
prospect of early profitability.
E. Conclusions
170. The industry appears to be financially healthy an,d does not seem
to have the vexing problems besetting largely import-dependent enterprises.
Although it cultivates, processes and distributes a product considered by
many to be a health hazard, it does contribute to the general economy through
employment, value added to a perennial resource, and as a source of Sig4--4f4
cant tax revenue. The industry is bothered, but not seriously, by small-
scale competitors making a cheap, inferior product -which is feared to have
made inroads in the market for medium-priced cigarettes. Improvement of
local crops appears to be approached in a scientific mannrer by- the upper
echelon of producers. The industry is a large consumer of locally-made paper-
board products which currently, it is claimed, are significantly higher
priced than imports.

- 73 -
Table ArITI-1: TOBACCO MANUFACTURES -- CIGARETTE CAPACITY,
CAPITAL INVESTMENT ANILu PRODUCTION
Total East West
Number of Plants Sanctlioned L1 20 21Number of Plants Installed 35 20 15
Capacity (million pieces)San.ctioned 3,9.16J 2127lInstalled 41 573 23 650 17 9`Total C-aacity 0,°), 7 236
Capital Investmen-t -s ilin
Internal 89.71 37.99 51.7<iExternal -.09 4h.08 *4V -Total Capital Investment 1h7.80 62.07 85.73
Production Volume Value Voiume Value Volume 'Value
Volume-million. piecesValue -million Rupees
1965-66 10.128 228.1 3,017 52.9 7,111 175.21966-67 12,2h2 250.7 3,611 62.5 8,631 188.21967-68 30,lLl 690.2 9,764 296.0 20,377 394.2
A Installecd and sanctioned.
Source: Paper on Tobacco and Tobacco Manufactures for the Fourth Five-YearPlan, (Undated), Department of Investment Promotion and Supplies,Government of Pakistan.
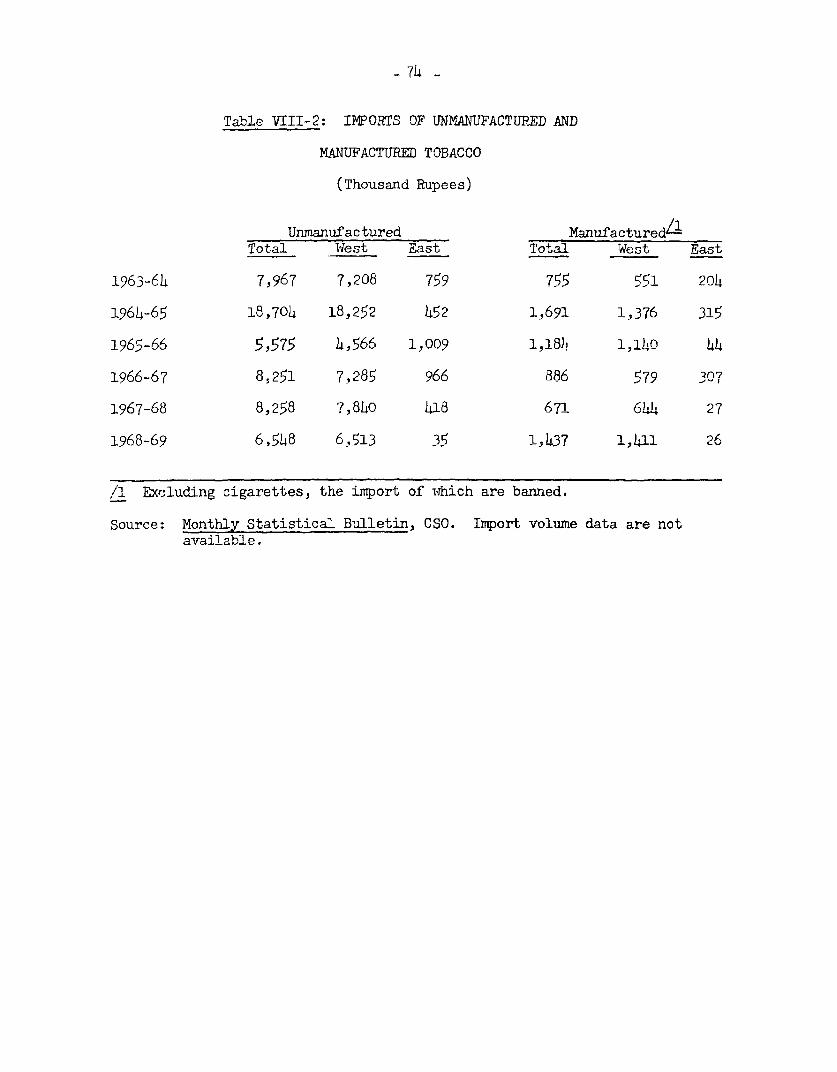
- 74 -
Table VIII-2: IMPORTS OF UNMANUFACTURED AND
MANUFACTURED TOBACCO
(Thousand Rupees)
Unmanufactured ManufacturedlTotal West East Total West East
1963-64 7,967 7,208 759 755 _5 2014
196 4- 6 5 18,704 18,252 452 1,691 1j76 315
1965-66 5,575 h,566 1,009 1,184 1,14o )111
1966-67 8,251 7,285 966 886 579 307
1967-68 8,258 7,8L0 h18 671 64-14 27
1968-69 6,548 6,513 35 1,1437 1,411 26
/1 Excluding cigarettes, the import of which are banned.
Source: Monthly Statistical Bulletin, CSO. Import volume data are notavailable.
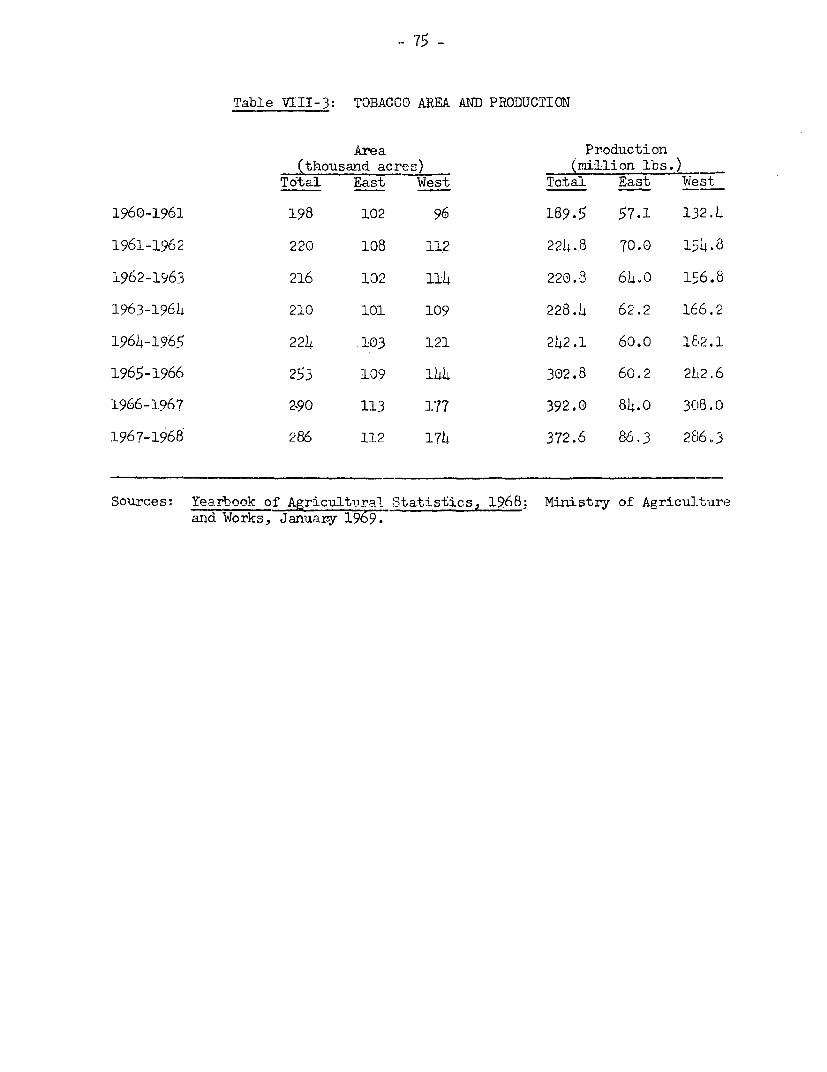
Table VIII-3: TOBACCO AREA AND PRODUCTION
Area Production(thousand acres) (L lion lbs.)
Total East West Total East West
1960-1961 198 102 96 189.5 57.1 132.h
1961-1962 220 108 11.2 224.,8 70.0 154h8
1962-1963 216 102 114 220.8 6Lo0 156.8
1963-196L 210 101 109 228.h 62.2 166.2
1964-1965 22L .103 121 242.1 60.0 182.1
196g-1966 253 109 lL 302.8 60.2 2L2.6
1966-i967 2.90 113 177 392.0 84.O 3C)8.0
1967-1968 286 112 17L 372.6 86.3 286.3
Sources: Yearbook of Agriciltural Statist;ics. 1968: Ministrv of Agricultureand Works, January 1969.


ANNEX IPFge I
ESTIMATE OF APPARENT USE OF COTTONSEED CIL, 1967/68
(000 Tons)
Ginned Cotton4J Cottonseed
Pakistan East West Pakistan East West
512.5 2.5 510 1,024 5 1,019
Note:1. Seed available 1,024.02. Less 15% return to farmer 153.5
3. Seed available for crushinz 870.514. Crude oil potential (12% of seed weight) 104.55. Pefinina 70ss (I%) 14;2
. Net. rpfinp( il note nti.an1 0 no
7. Less domestic cottonseed oil contentin ghee production 65.8
8. Less liquid oil sales (10% of ghee production) 9.4
9. Apparent refined oil loss 25.1
1/ Given in bales in the Yearbook; one bale = 392 lbs. net, 400 lbs.gross. All tons are 2,240 lbs.
Source: Yearbook of Agricultural Statistics, 1968
Mxnistry of Agriculture and Works, Food and AgricultureDivision, January, 1969.
Notes to Estimate of Apparent Loss of Cottonseed Oil
1. The ratio of seed weight to lint weight of raw cotton is about 2:1for all of the commercially produced varieties.
2. Estimates of seed returned to farmers vary from 13% to 25% inPakistan. (15% is used in the comnutation ) The seed is used for plnrlting,cattle feeding, and some is sold on the market by farmers. Only about 10%is reouired for planting. Feeding seed to cattle is wasteful, *qire sf!edcake is deemed to be better nutritionally. Inadequate storage on the farmverv nrnoqhl v res.qlts in seed loss tIrough Cpoilage.
- 2 - ANNEX IP.,qe 2
3. Seed available after ginning raw cotton.
4. Average yield of crude oil from cottonseed is 12% (maximum 14%)in West Pakistan. Source: Vegetable Ghee Industry in West Pakistan, MansurAhmad, Joint Director of Industries, West Pakistan.
5. Industry sources state 4% is average refining loss after creditinga 2% recovery from sludge.
6. With efficient expellers, the figure shown is refined oil potential.
7. Ghee production in 1967-68 was 94,000 tons.l/ Industry sourcesstate that imported soy oil is blended with domestic oil in proportions vary-ing from 30% soy and 70% cottonseed to 50%-50%. Assuming a 30-70 blend,1967-68 production represents 65,800 tons of cottonseed oil consumed. A 50-50blend would represent a consumption of 47,000 tons. The larger consumption isused in this estimate.
8. Industry sources estimate that liquid refined cottonseed oil salesare about 10% of ghee production.
9. Apparent loss based on 30-70 blend.
1/ There are several figures in government publications given for produc-tion. This is a round number (Taule V-1).
PART TWO.. ERMTNERING INDUSTRIES

PART II
ENGINEERING INDUSTRIES
TABLE OF CONT1NTS
Page
TNTRODUCT ION
CHAPTER 'E. SALIENT FEATURES 1
A. So lz eB. Product Range 1
C. Structure 3D. Growth 3E. Irr-port Dependence 4
F. Exports 7
CHAPTER II. INDUSTRIAL INPUTS 1A
A. Licensiulg Regime 116
B. Machinery 16
C. Raw Materials 16
D. Accessories, Spare Parts, etc. 18
E. Civil and Industrial T-hgineeringr1Works 1
F. ELectric Power 19
G. Personnel Education andTraining 19
H. Utilization of InstalledCapacity 20
I. Productivity of Labor 21
CHAPTER III. DESIGN AND QUALITY OF OUTPUT 23
A. Design 23
B. Quality Standards 24
C. Institute for IndustrialTechnology 24
CHAPTER IV. PRICES AND COSTS 26
CHAPTER V. PROBLEMS OF SMALL SCALE INDUSTRY 30
CHAPTER VI. SUMMARY 32
ANNEX I Diesel Engine industry
ANNEX II Founxiries
ANNEX III Shipyards
ANNEX rJ The Automotive Industry

INTRODUCTJlU'u-N
1. This report analyzes the prospects for growth of the capitalgoods industries in Pakistan. It is based mainly on the results obtainedfrom interviews with principal authorities in the public and privatesector and from plant visits. During the course of the MUssion a totalof 52 manuSacturing plants were visited in eight principal locations:Rawalpindi, Karachi, Dacca, Chittagong, Lahore, Lyalipur, Owandajalla aadWazirabad, in order to revnew the prevalenti situation of the industry,its cost s-tructure, productivity, capacity utilization, competitivenessand the possibility for future expansion. To the extent that limitingfactors became evident, recormendations are :iade for corrective actionswhich might be considered.
2. The report is divided into six chapters. The first concentralteson the salient features and growth cf the sector. Emphasis is placed oilthe trends which have occurred in recent years. The second chapteranalyzes the industrial inputs -- raw materials, equipment, labor andmanagement, The third chapter discusses the design and quality ofindustrial output. Emphasis is placed on the development of an instituteto assist in the -transfer of technology, management and product develop--ment and in the establishment of subsidiary industries. The fourth chapteranalyses prices and costs based on data obtained from questionnaires sentto the industry and from personal interviews. The fifth chapter focusseson the problems encountered by small industries which require correctiveaction before expansion can be expected. The last chapter summarizes thefindings of the study, outlining the basic requirements of the industryand presents recommendations to promote its rapid growth.
3. Four annexes deal in greater detail with the present situation,problems and prospects in the diesel engine industry. foundries, automotiveproduction and shipyards.

CHAPTER I
A. Size
1. In 1966-1967, the latest year for which imnufacturing censusdata are aviabe grs valu of pro-c -n of1 enierimiPdkA ULC4 7 CL V (1-. L CdLJ _L U ~, r, UV V d.L LVV U 'J I L-kL U' U U .(U0 I 0..L l%_LI;u1 ±Li 11J.± I LL4O UIJiZuo
amounted to Rs 1068 mirllion and value added, Rs 556 million. The shareof tlese irLust.-ie,s in os value ef prodution & lUn vUalue addelu of
manufacturing as a whole was 12.0%. Employn:iant in the engineering sector-was 0, ac ountteudL 4 0 or I r. 2oaf t h e .- - -.- --- U-e- -i l A- LI, v -I - 1
of 590,000 (Table I-1). Engineering industries were more labor intensiveper aLi L dvl-ue of p dL ard ovalue added u Lali Uoh1ar Ui .us -triUz-
2. Th~~~.1e abuove duata are r.o' corl,rehenl-ves sj.ince theI Ue-n6ulls ofL *eul-Ui-facturing Industries does not cover all production units. The degree of-Uderstate d,1,-Lt is noIb ±i.wi. -aormed observers estimate it at 20u; inthe engineering industries it may be higher, since small plants arepartlcularly numerous in this suD-sector.
3 . OI the total recorded employment in engineering industries,83 percent was in West Pakistan and 17 percent in East Pakistan. Asimilar proportion held in gross value of production. In value added,the share of East Pakistan was even lower (12.5%). The concentration ofengineering industries in west PaKistan is also reflected in tne factthatofthetotal industrial employment of 400,000 in this region, as manyas ,)OUU kl9s" are employed in engineering. in East PakIstan, the pro-portion is only 7.7%: in East Pakistan employment in engineering is lh,600and total employment in industry, 107,600.
B. Product Range
4. The structure of the industry is varied, despite its relativelysmall size. Most of the production consists of light engineering goods:simple macnine tools, telecommunication equipment, motors (includingelectric), fans, transformers, switch-gear, bicycles, household utensiLs,and surgical instruments. However, the industry also produces mediumand heavy capital goods and transport equipment: parts of textile, cemeentand sugar mill machinery, agricultural machinery, automotive parts, shiprepair and ship building. There is a fairly large rerolling sector.Table I-2 sets forth the details for the major product groups.
Domestic industry supplies about one-fourth of the aggregaterequiremerLts for capital goods in the economy, as shown in the followirng table:
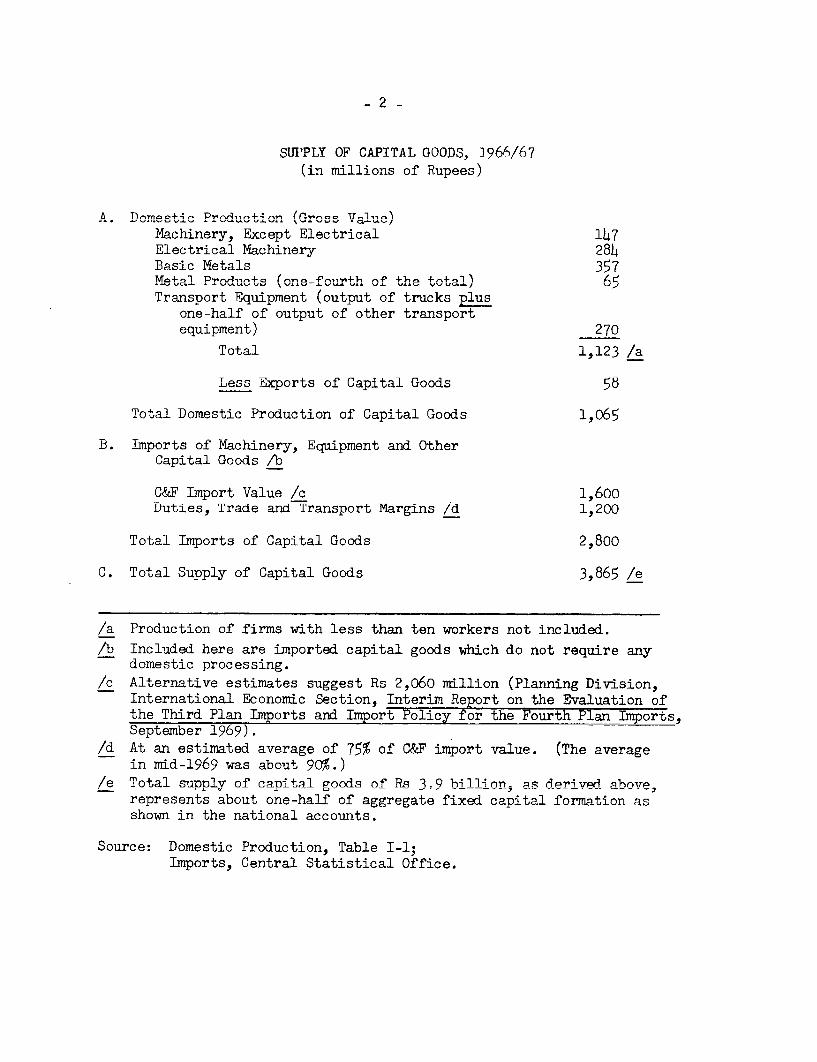
- 2 -
SFNT1PTY OF GAPTTAT. (OOnsOfl 196)6/67(in millions of Rupees)
A. Domestic Production (Gross VMachinery, Except Electrical 147El..' eJc tricsal M-S inhry In' J OA.Basic Metals 357Meta-l Products (one-fo.1- th of th. e 1+.1 V65V'.
Transport Equipment (output of trucks plusonehlf o opP op o-t-h 4-t4nnnpor'.,4-
equipment) 270
Total 1,123 /a
Less Exports of Capital Goods 58
Total Domestic Production of Capital Goods 1,065
B. Imports of Machinery, Equipment and OtherCapital Goods /b
C&F Import Value /c 1,600Duties, Trade and Transport Margins /d 1,200
Total Imports of Capital Goods 2,800
C. Total Supply of Capital Goods 3,865 /e
/a Production of firm- s wth less than ten 4--- no4- i.nluded
/b Included here are imported capital goods which do not require anydomestic processing.
/c Alternative estimates suggest Rs 2,060 million (Planning Division,International Economic Section, Interim Report on the Evaluation ofthe Third Plan Imports and Import Policy for the Fourth Plan Imports,September 1969).
/d At an estimated average of 75% of C&F import value. (The averagein mid-1969 was about 90%.)
/e Total supply of canital goods of Rs 3.9 billion, aS derived above,represents about one-half of aggregate fixed capital formation asshown in the national acxcounts
Source: Domestic Production; Tbhle T-1;Imports, Central Statistical Office.
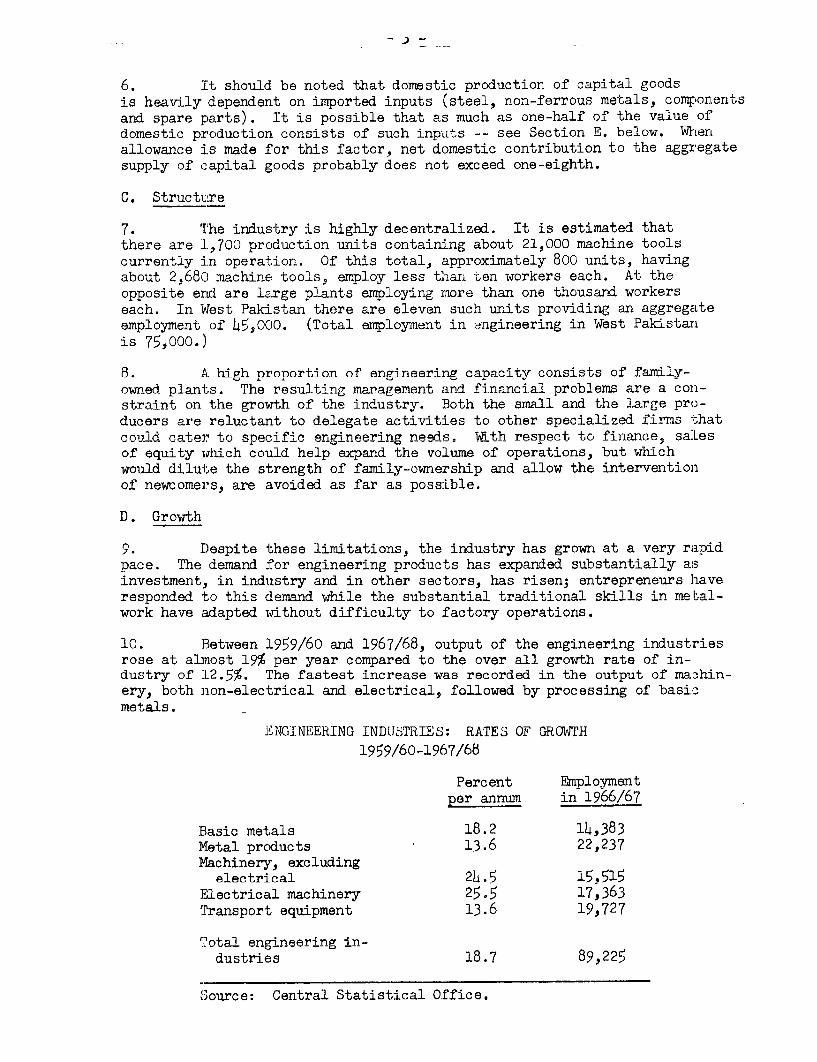
6. It should be noted that dormstic production of capital goodsis heavily dependent on imported inputs (steel, non-ferrous metals, compbonentsand spare parts). It is possible that as much as one-half of the value ofdomestic production consists of such inp-uts -- see Section E. below. W.Lernallowance is made for this factor net domestic contribution to the aggregatesupply of capital goods probably does not exceed one-eighth.
C. StructuLre
7. I'he industry is highly decentralized. It is estimated thatthere are 1,700 production units containing about 21,000 machine toolscurrently in operation. Of this total, approximately 800 units, havingabout 2.680 machine tools, employ less than ten workers each. At theopposite erd are large plants employing more than one thousand workerseach. In Wlest Pakistan there are eleven such urits providing an aggregateemployment of 45,000. (Total employment in engineering in West Pakistanis 75;000.)
8. A high proportion of engineering capacity consists of family-owned plants. The resulting management and financial problems are a colI-straint on the growth of the industry. Both the small and the large pro-ducers are reluctant to delegate activities to other specialized firms thatcounld catv to n Rni flo er,in ering nePds. c Mth resneet to finarnce, saLesof equity which could help expand the volume of operations, but whichwould dilute the st;rength of farmilv-ownership and allow the interventionof newcomers, are avoided as far as possible.
D. Growth
9. I)espite these limitations, the industry has grown at a very rapidpace. The demand for engineering pr s has expanded substntially asinvestment, in industry and in other sectors, has risen; entrepreneurs haverespor.ded i;o this deen-n-d whi--dlee the substar.ti-al tr-aditlonal 9A-11LZ in meta-1
work have adapted without difficulty to factory operations.
10. ]3etween L959/60 and 1967/68, output of the engineering industriesrose at alr.ost 104prya om>rdt h ve l rTv r teof in
dustry of 1L2.5%. The fastest increase was recorded in the output of ma-hin-ery, both non-nelectrical anr electr,ica1l fer-v_ hy- procsing of basic
metals.
ENGINEERING INDLJSTRIES: RATES OF GROWTH
1959/60-1967/68
Percent Employmentper annum in 1966/67
Basic metals 18.2 14,383MAtal nroducts 13.6 22,237Machinery, excluding
electri=cal 24.5 15.515Electrical machinery 25-5 17,363Transport Aniiinment 13.6 19,727
nt-.,1 engrinAAriDgn in-
dustries 18.7 89,225
Source: Central Statistical Office.

-4 -
11. There are inevitable statistical defects in the above computation,resulting both from weaknesses of basic data and from general methodo-logical problems in measuring changes in aggregate output when the com-position of outnut changes rapidly. There is no doubt, however, that theengineering industries have been the most rapidly growing sector of thegenerally ranidlv growing manufacturing sector. In recent years, outputgrowth has decelerated under the impact of a shortage of imported inputs.
12. Table I-3 sets forth the progress of planned investments in theprivate engineering industry compared to all manufacturing during theSecond Five-Year Plan, 1965-1970. Of the total engineering plants approved(585), about 60% were completed (348). Project completions in engineering
industries accounted for 1a% of all completions in manufacturing: this isa higher Drooortion than the share of engineering output in total indus-trial output (12%) and is consistent with a faster rate of growth fore-ngineering than for manufacturing in general. Surprisingly, there was asharp lag in financial expenditures on investment in engineering: theirshare in investment expenditure in industry was 11%. There is no excplana-tion for this lag. It should be mentioned, however, that there are alarge number of "unrecognized" firms in the engineering sector (see ChapterII) and their financial expenditure in investment is not recorded.
13. In planned industrial investment during the Third Plan (1965-1970). the share of engineering industry was scheduled to increase to 19%.(see Annex Table I-4. The volume of investments in East Pakistan wasscheduled to eaual that in the West. The investments scheduled for East
Pakistan included only 10% for machine modernization, balancing, and_ , - 1 E J * WU+ Po ler+.n +.he nrrnn^rti on was nearlv 25% ofrepl e dUyisivv ' …..- --- y . r-.--, _f . --
the total investment. Both proportions are possible amounts, dependingon the adequacy and co-dition f' +the pres^ntly installed equipment. In-
formation on the completed investment in the Third Plan is not yet avail-au-le.
14. As suggested in Sec-tion B abonren +.the eagi nepri ng i nidstrPes
are heavily dependent on imported inputs. The table be'low sets forth anapproximate estillia-e uo uthe riin -L-j.
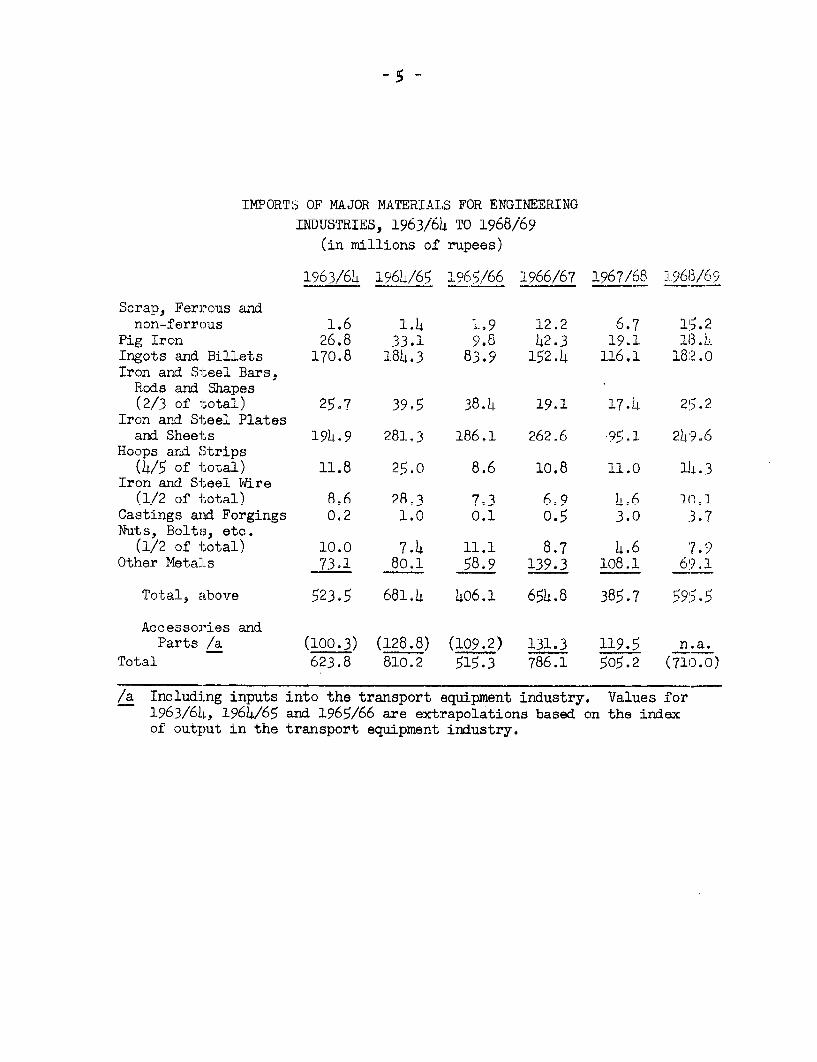
IMPORTS OF MAJOR MATERIALS FOR ENGINEERINGINDUSTRIES, 1963/64 TO 1968/69
(in millions of rupees)
1963/6L 196L/65 1965/66 1966/67 1967/68 .1.968/69
Scrap. Ferrous andnon-ferrous 1.6 1. 4 :L9 12.2 6.7 115.2
Pig Iron 26.8 33.1 9.8 L2.3 19.1 183.);Ingots and Billets 170.8 1.84.3 83.9 152.4 116.1 182.0Iron and Steel Bars,Rods and Shapes(2/3 of total) 25.7 39.5 38.LJ 19.1 17.i1 25.2
Iron and Steel Platesand Sheets 19L.9 281,3 186.1 262.6 99C.1 24L9.6
Hoops and Strips(IL/5 of total) 11.8 2E.O 8.6 10n8 -1 n0 -l 3
Iron and Steel Wire(1/2 of total) 8.6 28.3 7.3 6 9 416 1(01
Castings and Forgings 0.2 1.0 0.1 0.5 3.0 .3.7Nuts. Bolts. etc.
(1/2 of total) 10.0 7.4 11.1 8.7 4.6 '7.9Other Metals 71 0R, C58.9 139.3 -'-R 6 9-1
Tota,l above 523,5 681.4 406.1 654.8 385.7 595.5
Parts /a (100.3) (128.8) (109.2) 131.3 119.5 n.a.rn~~~ ~ -4- n . l " 0 . l. _ _ _-
Total 62. 810. 5153 786.14 ~)L) )o_ 50. (1Lo.o)
/a Including inputs into the transport equipment industry. Values for1963/64, 1964/65 and 1965/66 are extrapolations based on the indexof output in the transport equipment industry.
- 6 -
15. The yearly variations in imported inputs have been substantial:they have been mainly the result of vicissitudes in the availability offoreign exchange, the response of import policy to this availability andthe reaction of the users and of the importers, in their inventory scheduling,to changes in import policy. On the average, main imported inputs haveamounted to Rs 660 million per annum ($140 million). Other availableestimates suggest a range from $125 to $165 million.l/ Imported inputshave amounted to up to one-half of the gross value of production of theengineering industries.2/
16. The capacity in the engineering industries has been under-utilized during most of the recent period and import requirements for fullcapacity utilization would have been substantially higher than the actualimports. During the Mission's survey in September 1969, the averagecapacity utilization in the sample visited was 48%. The enterprises inter-viewed stated that they would not have difficulties in selling additionaloutput and that the only constraint was the shortage of imported materials.On this basis, the additional needs for imported inputs would be aboutequal to the 1968/69 actual import level, i.e., about Rs 700 million ($150million). A similar order of magnitude is obtained by extrapolating tothe present from the import level in 1964/65 of Rs 800 million which appearsto have been sufficient for a high capacity utilization in that year. Ifcapacity since then has risen at 10%-15% per annum, the present require-ments for imported inputs would be about Rs 650 million ($140 million)higher than the actual imports in 1968/69.
17. These qualifications should be added to the above. First, it isby no means certain that capacity would be used to the full even if therewas no shortage at all of imported inputs: some capacity is surplus fromthe viewpoint of domestic market demand and not sufficiently efficient tobe able to produce for export. This is particularly so in view of the factthat imported inputs would now have to be bought by the industry at an
1/ Estimates of the Harvard Advisory Group and of the Planning Commission.(Tnterlm Report on the Evaluation of the Third Plnn Tmports and TmportPolicy and Projections for the Fourth Plan Imports, Islamabad,September 10, 19096.
2/ Gross value of production in 1966/67 was recorded at Rs 1.4 billion.Allow.ing for a possible understatement of 2U0, the total would amountto Rs 1.7 billion. The average imports of main inputs were Rs 660million; allowing for at least 50% margin for duties and tradingprofits in 1966/67, the value of imported inputs would be Rs 1 billion,
'O of th gr s va u - I .. - .l .1 I I . .sor 0 te gross value oI proauction. On the other hand, in thesample of engineering firms visited by the Mission, the average pro-portion in the domestic price of imported inputs was 33% (net of duties,taxes, bonus payments, etc.) and 52% (gross of duties, taxes, bonuspayments etc.) -- See Chapter IV.
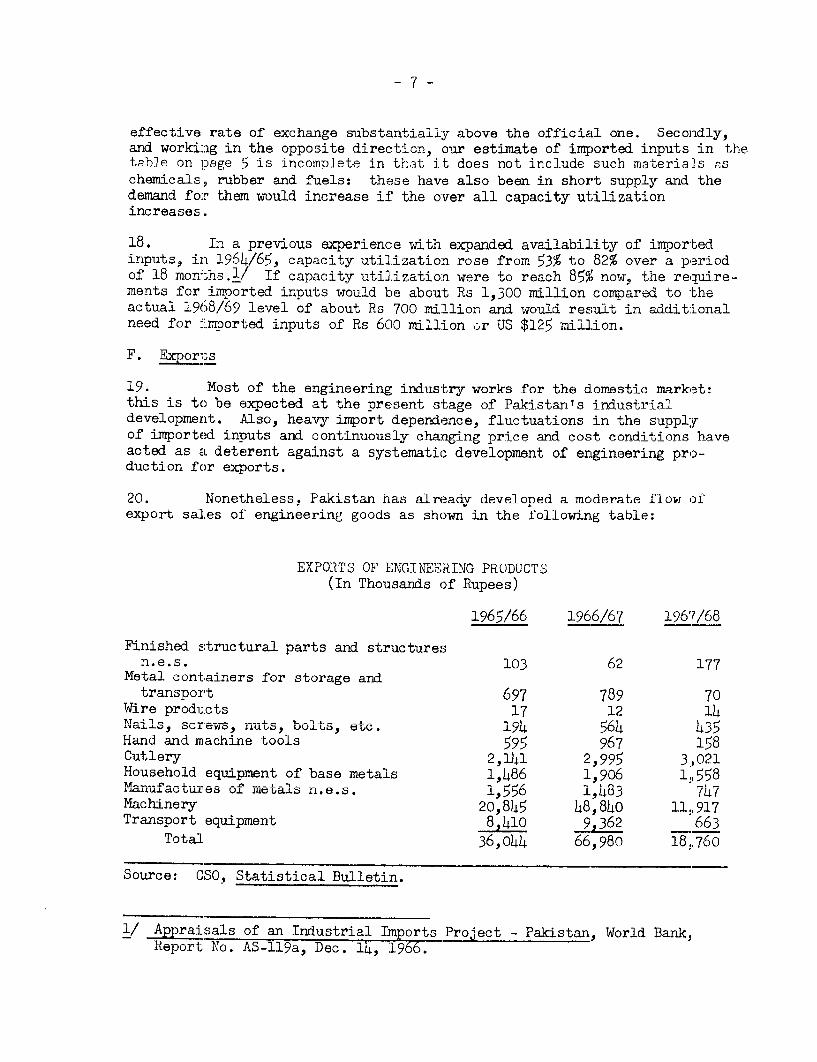
- 7 -
effective rate of exchange substantially above the official one. Seconldly,and working in the opposite direction, our estimate of imported inputs in thetpble on page 5 is incompiete in tint it does not include such materials nschemicals, rubber and ftels: these have also been in short supply and thedemand for them would increase if the over all capacity utilizationincreases.
18. In a previous experience with expanded availability of importedinputs, in 1964/65, capacity utilization rose from 53% to 82% over a periodof 18 months.l/ If capacity utilization were to reach 85% now. the re,:xire-ments for imported inputs would be about Rs 1,300 million compared to theactual 1968/69 level of about Rs 700 million and would result in additionalneed for -i.ported inputs of Rs 600 million or US $125 million.
F. Exports
19. Most of the engineering industry works for the domestic market:this is to be expected at the present stage of Pakistan's indnstrialdevelopment. Also, heavy import dependence, fluctuations in the supplyof imported inputs and continuously changing price and cost conditions haveacted as a deterent against a systematic development of engineering pro-duction for exports.
20. Nonetheless, Pakistan has already developed a moderate flow ofexport sal.es of engineering goods as shown in the following table:
(In Thousands of Rupees)
1965/66 1966/67 1967/68
Finished structural parts and structuresn.e.s. 103 62 177
Metal containers for storage andtransport 697 789 70
Wire products 17 12 14Nails, scre-ws, nuts, bolts, etc. 194 564 435Hand and machine tools 595 967 158Cutleruy 2,141 2,9 9'Y 302uz1Household equipment of base metals 1,486 1,906 1,558Manufactures of metals n.e.s. l,56 1,483 747Machinery 20,845 48,840 1L,917TLrransporu equipmllent 8,410 9,362 _ 663
Total 36,044 66,980 18 76O
Source: CSO, Statistical Bulletin.
1/ Appraisals of an Industrial Imports Project - Pakistan, World Bank,PLeport No. AS-119a, Dec. 14, 1966.
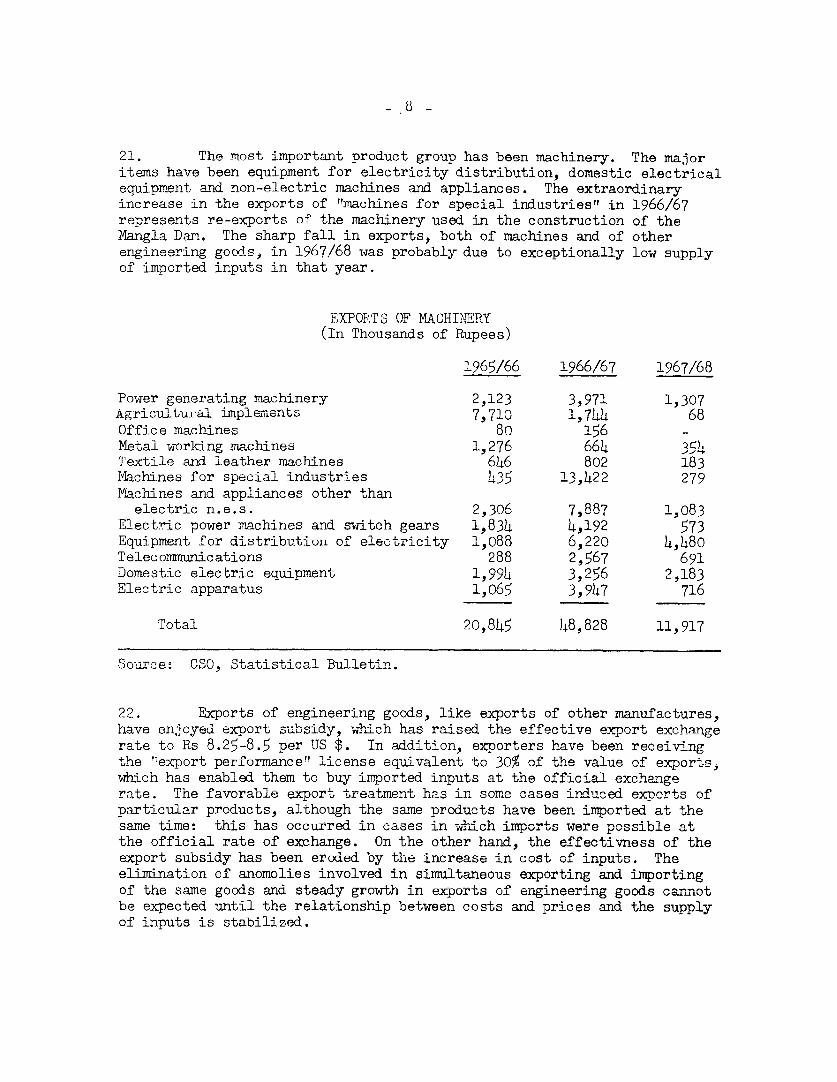
21. The most important product group has been machinery. The major
items have been equipment for electricity distribution, domestic electrical
equipment and non-electric machines and appliances. The extraordinary
increase in the exports of "machines for special industries" in 1966/67
represents re-exports of the machinery used in the construction of the
Mangla Dam. The sharp fall in exports, both of machines and of other
engineering goods i-n 1967/68 was probably due to exceptionally low supply
of imported inputs in that year.
EXPOR'TS OF MACHINTRRY
(In Thousands of Rupees)
1965/66 1966/67 1967/68
Power generating machinery 2,123 3,971 1,307Agricultuural implem ents 7 710 l,748 68
Office machines 80 156 -
Metal working machines 1,276 664 354Textile and leather machines 646 802 183
Iliachines for special industries h3$ 13,Jh22 279
Machines and appliances other thanelectric n.e.s. 2,306 7,887 1,083
Electric power machines and switch gears 1,834 4,192 573Equipment for distribution of electricity 1,088 6,220 iAh80
Telecormiunications 288 2,567 691
Domestic electric equipment l,99h 3X256 2,183Electric apparatus 1,065 3,947 716
Total 20,845 48,828 11,917
Source: CS0, Statistical Bulletin.
22. Exports of engineering goods, like exports of other manufactures,
have enjoyed export subsidy, which has raised the effective export exchange
rate to Rs 8.25-8.5 per US $. In addition, exporters have been receiving
the "export performarnce"! license equivalent to 30% of the value of exports,
which has enabled them to buy imported inputs at the official exchange
rate. The favorable export treatmrent has in some cases inluced exports of
particular products, although the same products have been imported at the
same time: this has occurred in cases in -wiich imports were possible at
the official rate of exchange. On the other hand, the effectivness of the
export subsidy has been eroded by the increase in cost of inputs. The
elimination of anomolies involved in simultaneous exporting and importing
of the same goods and steady growth in exports of engineering goods cannot
be expected until the relationship between costs and prices and the supply
of inputs is stabilized.
23. A special problem in the exports of engineering goods concernsavailability of credit for export finance. In selling these goodsPakistan competes with other suppliers, not only in price, quality and timeof delivery but also in credit terms. At the present time there is nocredit facility in Pakistan -which would enable the producers to extendmedium-term credit which is often needed to encourage sales of engineeringgoods. The volume of exports at the present time is too small to justifysetting up a separate credit institution for this purpose. However, con-sideration should be given to introducing a special credit line at theState Bank of Pakistan on which exporters of engineering goods who sellon medium-term credit could draw. As prices and costs stabilize and exportsof these goods expand, such a credit line mayr be converted into a specialcredit institution for export finance.
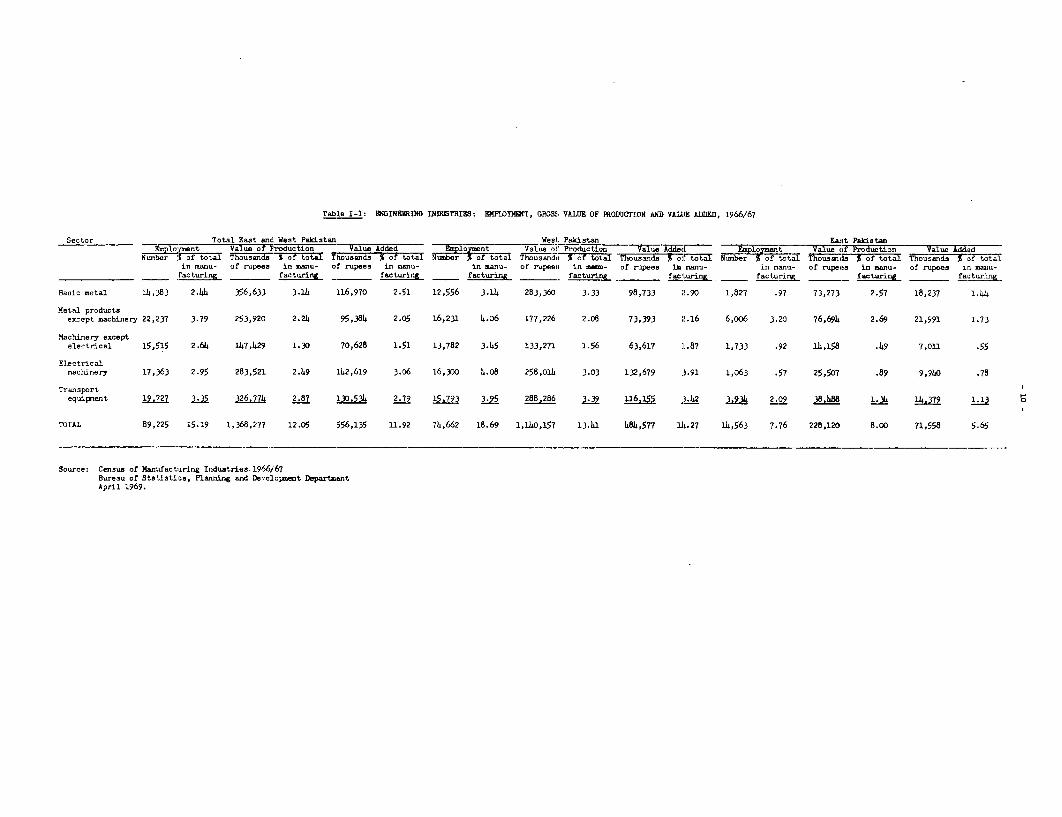
Table I-1: eNGINEflING INDUSTRIES: E1PI0YTMET, GROSS VALUE OF JROD3CTI0N IND VAlUE ADDEI, 1966/67
Sector ____Total Fast and. West Pakistan _______ West, Pakistan ____ __________ East PakistanSecor__Toal__*du o Val,as Added o nt VaLue or ProductIo
7iVlte AddeL & 1 tt tVaLw P ction __alwe XdMad
Number : Tfj ̀ouaaL 5, of total Tousand S or total mber fttal tousands , of' tota Number ototaL housnudas S of total Thousands lef totalin manm- of rupees in manu- of rupees in manu- in manu- of rupees in mann- of rapees tn manu- in manu- of rupees in manu- of rupees in manu-
ra_ aturiiy_ _ _ facturing _ factlring facturing ___ factxig ___ _ facturing facturing _ _ factuig _ _ facturing
Basic metal L4,383 2.44 356,633 3.14 116,970 2.51 12,556 3.14 283,360 3.33 98,73.3 2.'90 1,827 .97 73,273 2.57 18,237 l.44
Metal productsexcept machinery 22,237 3.79 253,920 2.24 95,384 2.05 16,231 4.o6 L77,226 2.08 73,393 2.16 6,006 3.20 76,694 2.69 21,991 1.73
Machirery exceptelectrical 15,515 2.64 Il.7,429 1.30 70,628 1.51 13,782 3.45 133,271 1.56 63,61'7 ]L.87 1,731 .92 J14,158 .49 7,011 .55
ElectricaLmactdnery 17,363 2.95 283,521 2.49 142,619 306 16,300 4.o8 258,014 3.03 132,679 3.91 1,0631 .57 25,507 .89 9,940 .78
Transportequipment 19.727 3.35 3,7 287 130.534 2.79 1 3 39 S 2 6.155 )Ju2 3-93 2.09 39.2 i42 1,4378 1 13
TOTAL 89,225 15.19 1,36Y8,277 12.05 556,135 UL 92 74,662 18.69 1,iL4o,157 13.4La 484,5r7 l14.27 14,56'1 7.76 228,120 8.00 71,558 5.65
Source: Census of Manufacturing Industries. 1966/67Bwreau of Statistics, Planning and Devclopment DepartamntApril 1969.

Table I-2: TEN LARGE S- ENGINEERING INDUSTRIES, 1966-1967
(Thousand Rupees)
% of Gross % of Value 5' ofEmployment Total Value of Total Added Total
(nu m .. bers) . ... Produtnr on
ILron anr.d steel basic forms 13,801 15.4 349,725 25.6 114,212 20.5
Manufacture and repairof mechanicallypropelled vehicles 6,729 7.5' 194,833 14.2 69,844 12.6
Communication equip-ment and accessories 7,159 8.t) 92,887 6.8 49,121 8.8
SiLUP building and re-pairing 8,469 9.5 71,654 5.2 30,971 5.6
Miscellaneous electricalproducts 1,623 1.8 64,125 4.7 27,687 5.0
Motors, generators andtransformers and controlapparatus and supplies 3,386 3.8 61,325 4.5 *34.35 6.2
Cycles and cycle-rickshaws 4,529 5.1 60,287 4.4 29,719 5.4
Tin cans and, other tinwares 2,473 2.8 55,255 4.0 14,523 2.6
Utensils 5,690 6.4 5O,i62 4.0 16,315 2.9
Electric fan.s 3,538 4.() 31,589 2.7 19,060 3.4
Total Above 57,397 64.3 1,0h1,842 76.1 405,887 73.0
Total All EngineeringIndustries 89,225 1,368,277 556,135
Source: Cen.sus of Manufacturing, International Economic Section,Planning Commission, May 17, 1969.

Table I-3: ENGINEERING INDUSTRIES
TOTAL SANCTIONED INVESTMENT APPROVED AND ACTUALLY MADEDURIrNG THE SECOND FIVE-'YEAR PLAN, 196o-1965
FINANCIAL PROGRES S
SECTIOR PHYSICAL PROGRE3S IiVESTNENTS fAPP]RO; M'ITT ACTIJLM C0DDL
NC). of' NTo. o:F Ral RuFlpee Fo- eig T (7Ta
projects projects Component Exchange Component Exchange
approved completed Component Component
Basic metalindustries 77 33 230.90 484.5o 715;.40 16. 72 20.17 36.89
Manufac tur, e ofmetal productsexcept machin-ery & trans-por't equlipment 238 143 99.58 94.65 194.23 31.91 37.52 69. 4 3
Machinery exceptelectricalmachinery 88 415 56.7t 58.87 lOX.62 20.134 39-35 60.19 F
Electric machin-ery apparatus& appliances 126 87 68.12 72.11 14(l.23 30.74 24.87 55.61
Transport equiLpmenlt 56 44 70.75 414.2 112.17 60.80 33.84 94.64
Total for engineer-ing industries 1585 348 516.:0 751.55 1,267.65 161.01 155.75 316.76
Total. f orindustries 3,682 2,482 2,712.3 3,727.0 6,439.3 1,251.0 1,654.8 2,90;.8
% of total forengineeringindustries 16 14 19 20 20 13 9 11
Source: Ministry of Industries and ]Natural Resources, Evaluation of Performance of Private Industriies Sector uDringr
Second Five-Year Plan 1960-1965, Karachi, 1966.
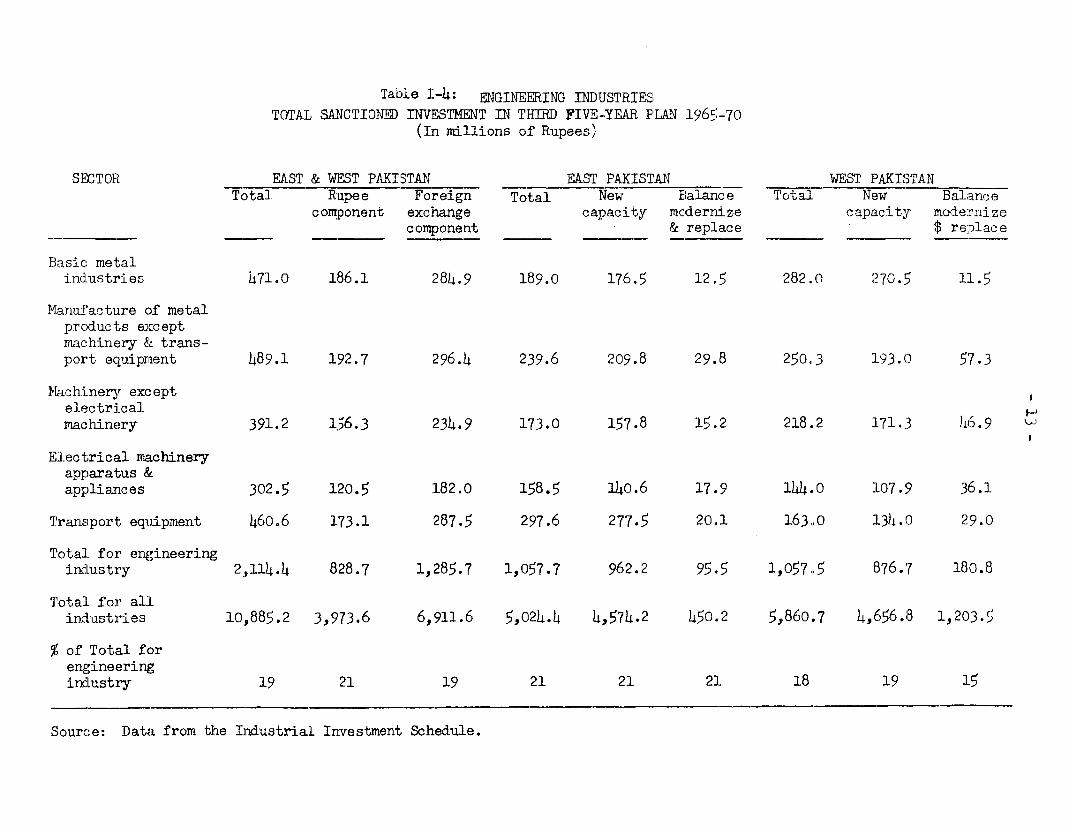
Table 1-4: ENGINEERING INDUSTRIESITOTAL SANCTIONS) INVESTMENT IN THIlD FIVE-YEAR PLAN 1965-70
(In millions of Rupees)
SECTOR EAST & WEST PAKISTAN _ EAST PAKISTAN WIE PAKISTANTotal Rupee Foreign Total New Balance Total New Balance
component exchange capacity mcLerrize capzacity mode:rnizecomponent & replace $ replace
Basic metalindustries 471.0 186.1 284.9 189.0 176.5 12.5 282.0 270.'i 11.5
Manufacture of metalpr oduc ts exceptmachinery &i trans-port ecquipent 489.1 192.7 296.4 239.6 209.8 29.8 250.,3 :L93.0 57.3
Machinery exceptelectricalmachinery 391.2 1156.3 234.9 173.0 157.8 15.2 218.2 171.3 46.9 F
Electrical machineryapparatus &appliances 302.5 120.5 182.0 158.5 14o.6 17.9 144.o0 1L07.9 36 .1
Transport equipment 460.6 173.1 287.5 297.6 277.5 20.1 163.0 :L34.0 29.0
Total for ernrineeringindLustry 2,114.4 828.7 1,285.7 1,057.7 962.2 95.5 1,057.5 876.7 180.8
T'otal- f or allindLustrieall 10,885.2 3,973.6 6,911.6 5,024.4 4,574.2 450.2 5,860.7 4,656.3 1,203.5
% of Total forengineeringtindustry 19 21 19 21 21 21 18 19 15
S'ource: Data from thie Iridustrial Investment Schedule.

CHAPTER II
T1nT,MTjr1PpTAT TuT 1STP
A. Licensing Regime
24. The industry requires machines, supply materials, servicesand the correspornding ci-vil and industrial engineering work. Themachinery, raw materials, spare parts, tools, etc., can be of nationalor imlparrtd. orlgin 'Lo pewrchase thle foreizi- - components an industrymust be authorized or "sanctioned", and only then can import permitse lessued.
25l. Mile sanctioninlg sy-ste has been developed in order to control
the foreign exchange outflow for supplies, raw materials, accessoriesndL spare parts arid, theoretically at least, to avoid the development
of over-capacity in certain sectors of the industry. In engineeringindustries teis syst,em has sho-w little success: a number of unrecognizedplants have been established and have survived in competition with thosebeing favored by goverrnmentri sanctions. * The non-recognized or non-sanctioned industries suffer from the disability of not being eligiblefor implwort licenses a-nd consequently, must purchase imports on thelocal market at a higher price; in addition, these industries receiveonly limieu electric power supply.
26. Tne industry sanctioning system is independent of corporatestructure and legal aspects of industry. It is only relevant for theimportation of machinery, materials and supplies, and for allocationand utilization of electric power from the public system.
27. For importation, merchandise is classified into several cate-gories based on their relative importance for the economy as determinedby the import control authorities. For certain products, there is anabsolute import prohibition. For some categories, the importers buy theexchange at the official rate; for others, they pay, in addition, importsurcharges (bonus).
28. The products and amounts authorized at a certain surchargerate are revised every six months and new allocations are made.
29. Products not specifically banned from importation are on oneor more of the following lists:

- 15 -
(a)~~~- tns wVrL ee -Lla 4t
T---4-,s o4-1,e 'tP--c 14 .4- It 1-. b - Ch r4 4-h fe,n,E
cbtained from loans and credits for specifically listedi'11-em,z.Mk ---e -@Cae - GL - ^+r - - p--4 E- of his Ousu
allocation in the amount authorized by the ChiefColu nroller f'or U'-,1por-t ankalt - withouu %btlJ3,L"Irns
a special license. These items are bought at theofficial exchange rate.
Jb) teSms on the 'I. cens 1 Llt'
Imports require a license by the importer-consW-mer forspecific items free of any surcharge other -than thelicense fee. The foreign excaLnge for the lic-enseditems comes from Pakistan's own resources contrary tothose Of the free list, wnicn are financed withn iudsthat come from b:ilateral loan agreements.
(c) Items on the "Cash-cum-Bonus List"
Merchandise authorized to be imported under the cash-cum-bonus rate require that, when the letter of credit.for payment is opened, a "bonus" is attached for thevalue of 50% (at the import price) of the authorizedamount of the corresponding import license.
The bonus vouchers are sold on the open market at,a price presently varying from 1.5 to 2 times theirnominal value. For example, for an item costing Rs. 100a bonus voucher will have to be deposited for a nominalvalue of Rs. ,0. The bonus actually costs between 90and 100 Rs; thus the product's final cost will be Rs. 190to Rs. 200 to the importer, i.e., the effective exchangerate will be almost double the official rate.
(d) Items on the "Bonus List"
All merchandise that is not specifically banned can beimported by depositing, when the letter of credit isopened, a bonus covering 100% of the purchase price.At the bomns cost of between 1.8 and 2 times the nominalvalue, the cost of the merchandise is practically.tripled.
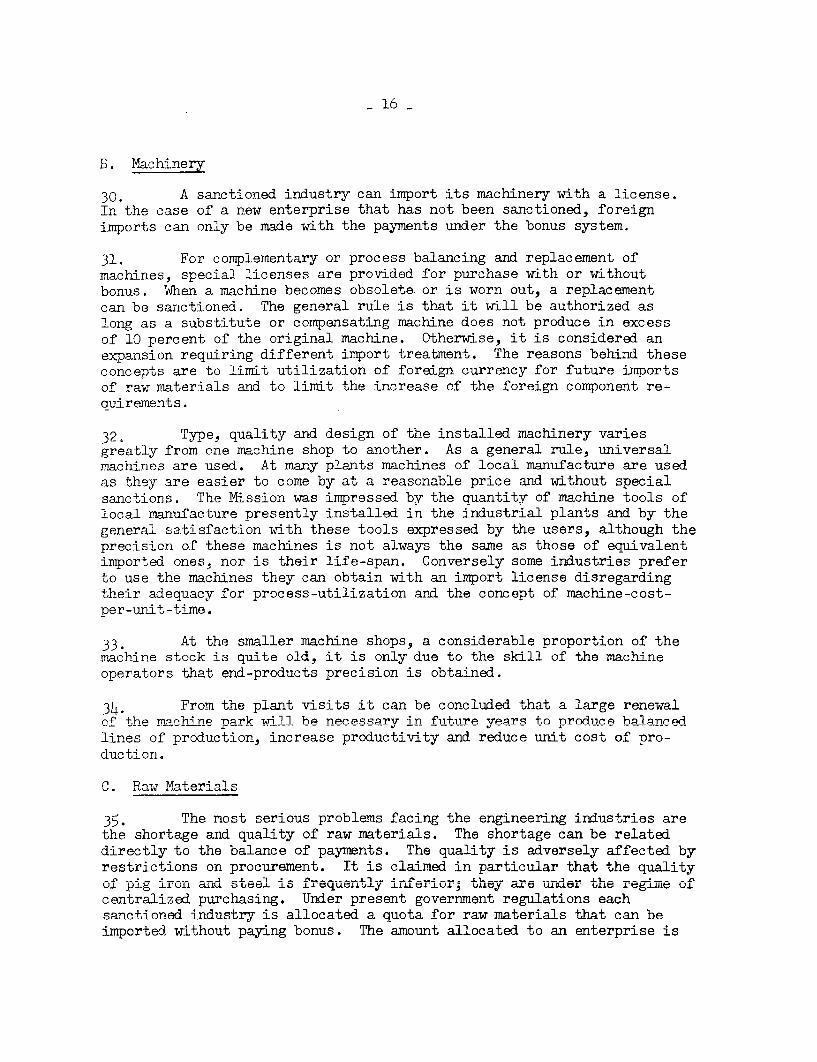
_ 16 -
B. Machinery
30. A sanctioned industry can import its machinery with a license.In the case of a new enterprise that has not been sanctioned, foreignimports can only be made with the payments under the bonus system.
31. For complementary or process balancing and replacement ofmachines, special licenses are provided for purchase with or withoutbonus. When a machine becomes obsolete or is worn out, a replacementcan be sanctioned. The general rule is that it will be authorized aslong as a substitute or compensating machine does not produce in excessof 10 percent of the original machine. Otherwise, it is considered anexpansion requiring different import treatment. The reasons behind theseconcepts are to limit utilization of foreign currency for future importsof raw materials and to limit the increase of the foreign component re-quirements.
_2. Type, quality and design of the installed machinery variesgreatly from one machine shop to another. As a general rule, universalmachines are used. At many plants machines of local manufacture are usedas they are easier to come by at a reasonable price and without specialsanctions. The Mission was impressed by the quantity of machine tools oflocal manufacture presently installed in the industrial plants and by thegeneral satisfaction with these tools expressed by the users, although theprecisicn of these machines is not always the same as those of equivalentimported ones, nor is their life-span. Conversely some industries preferto use the machines they can obtain with an import license disregardingtheir adeauacv for process-utilization and the conceDt of machine-cost-per-unit-time.
33. At the smaller machine shops, a considerable proportion of themachine stock is quite old, it is onlv due to the skill of the machineoperators that end-products precision is obtained.
34. From the plant visits it can be concluded that a large renewalof the mnchine park will be necessary in future years to nroduce balancedlines of production, increase productivity and reduce unit cost of pro-duc t ion .
the shortage and quality of raw materials. The shortage can be relateddirec4tly to 4 he balnce of1- pavvn The -uality is -dversely Ifce ..U..Li. eul V0 UiJ .l.L~Le 16 DU I,M ' L * .-LiS 'JUCLO.-.± J L tSUV~. J ~Q U~.. JY
restrictions on procurement. It is claimed in particular that the qualityof plg iron ald steel is frequently inferior; they are under the regime ofcentralized purchasing. Under present government regulations eachsanctioned industry is allocated a quota for ra-w materials hat, can beimported without paying bonus. The amount allocated to an enterprise is
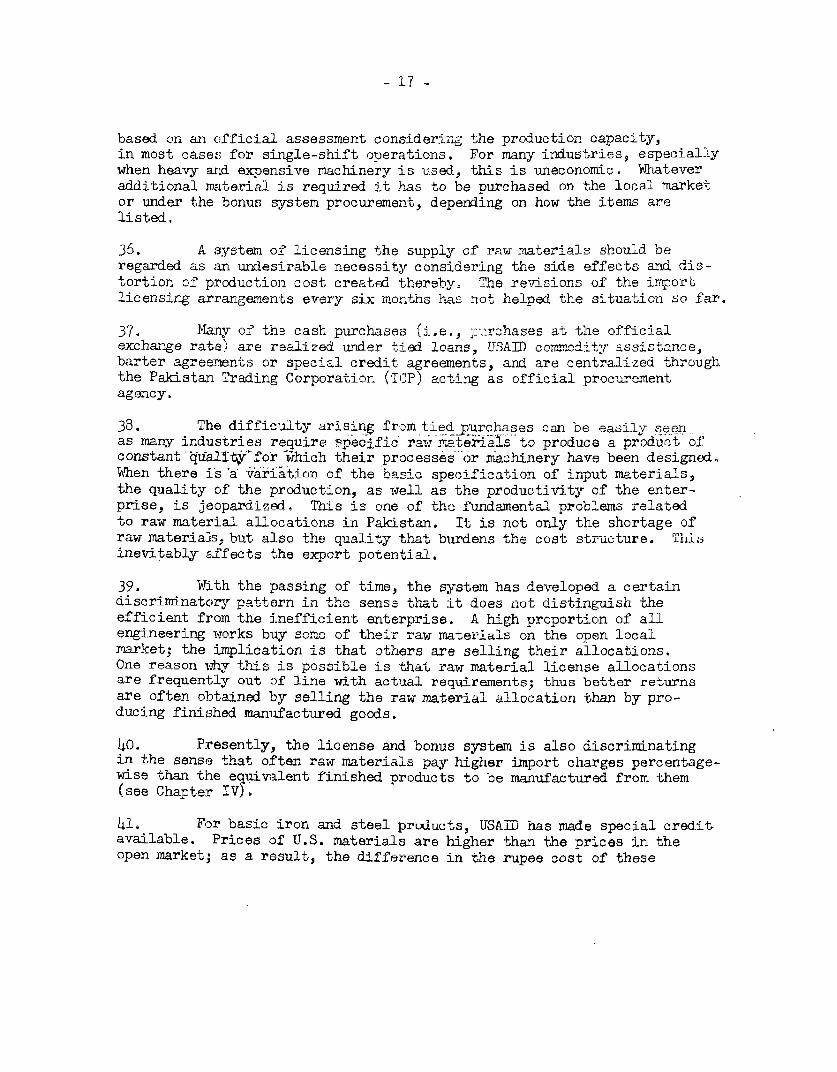
- 17 -
based on an official assessment considering the production capacity,in most cases for single-shift operations. For many industries, especiallywhen heavy and expensive machinery is used, this is uneconomic. Whateveradditional material is required it has to be purchased on the loral market-or under the bonus system procurement, depending on how the items arelisted.
36. A system of licensing the supply of raw materials shound beregarded as an undesirable necessity considering the side effects and dis-tortion of production cost created thereby. she revisions of the importlicensing arrangements every six monrths has not helped the situation so far.
37. Many of the cash purchases (i.e., -:-rchases at the officialexchange rate) are realized under tred loans, LTMLD commodity assistance,barter agreements or special credit agreements, and are centralized throughthe Pakistan Trading Corporation (TCP) acting as official procurementagency.
38. The difficulty arising from tied.urchases can be easily seenas many industries require spec7fic raw mate-als to oduceaprdct ofconstanti ialitffor which their processes or nmachinery have been designed.When there is a vriation of the basic specification of input materials,the quality of the production, as well as the productivity of the enter-prise, is ieopardized. Thi-s Ls one of the fundamental problermts relatedto raw material allocations in Pakistan. It is not only the shortage ofraw materials, huLt also the quality that burdens the cost structure. This.inevitably affects the export potential.
39. With the passing of time, the system has developed a certaindiscriminatory pattern in the sense that it does not dlstinguish theefficient from the inefficient enterprise. A high proportion of allengineeri ng works buy some of their raw materials on the open localmarket; the implication is that others are selling their allocations.One reason vh-y this is possible is that raw material license allocationsare frequently out of line with actual requirements; thus better returnsare often obtained by selli.ng the raw rmaterial allocation than by pro-ducing finished manufactured goods.
40. Presently, the license and bonus system is also discriminatingin the sense that often raw materials pay higher import charges percentage-wise than the equivalent finished products to be manufactured from them(see Chapter IV)
4l, FDor basic iron and steel products, USAI) has made special credit,available. Prices of U.S. materials are higher than the prices in theopen mnrket; as a result, the difference in the rupee cost of these
- 18 -
rmiaterials and of materials bought in the open market at the cash-cum-bonus ra-te has narrowed. Under barter agreements prices may be lower,but the choice of quality is determined by the availability in specifiedmarkets.
42. At most of the industries visited, the management complainedabout the restrictions imposed on the production capacity by the iimita-tion in quantity and quality of imported inputs. In many cases, thepurchase at the cash-cum-bonus or bonus rates could not be afforded bythe local industry while remaining competitive with the imports ofequivalent finished products.
43. Under these circumstances, it is surprising and encouragingthat many smaller non-sanctioned industries survive, especially those inthe zone of Lahore where the engineering industries are highly developedby small enterprise through the entrepreneurship of mechanics from largeindustries, and that they even sell their production several months inadvance while purchasing the required raw materials and machinery on thelocal market at high prices.
D. Accessories, Spare Parts, Tools, Jigs and Fixtures
44. When a new industry is established, a proportion of the valueof machinery is sanctioned for the import of parts and accessories. Also,small additional allocations are sanctioned for the purchase of tools andaccessories. However, the latter are often limited to procurement inspecific countries under barter or credit agreements and do not correspondnecessarily to the countries where the original machinery has been pur-chased, thus creating technical difficulties. Also, substantial delaysin procurement are encountered. Many industries therefore buy their spareparts, tools, jigs and fixtures on the free market at the bonus rate.Despite higher cost, the end result is favorable, considering machineefficiency and savings in production time.
E. Civil and Industrial Engineering Works
45. There is a great variety in the buildings and conditions of thehousing for industry. There are some notable buildings of superb con-struction, built to higher standards than those normally used in thedeveloped countries. On the other hand, there are many very primitiveinstallations, especially -when foundry operations are involved.
46. Plant layout is also greatly varied in nature. Those industrieswhere technical know-how is available are often well planned, layout andmachinery balanced, and space adequately distributed for production. Atsome of the older and more primitive machine shops the lavoi,t has takenits natural course and machines are crammed together. A whole range fromgood to bad conditions i encoointeri.P- Tn the future, the government manprescribe minimum standards concerning space available to machine operators.
- 1.9 -
47. In a survey prepared by O.W. Ro :3yill, considerable variationof covered-space-area per employee was observed.l/ Wghile the averagecompanies with 10 to 49 employees make available 36 square y-ards peroperator, the smaller machine shops only had 20 square yards, and some-times only 7 which is probably nearly the minimum area in which it ispossible to squeeze a machine-tool and operator. The average spaceavailable per employee at larger companies, varying between 27 and 36square yards per employee, was surprisingly somewhat lower than forthose with 50 employees.
F. Electric Power
48. Electric power is supplied to those industries that have beensanctioned and are officially recognized. Others have either to obtainit on a linrited basis or generate it themselves. At many locationselectric power is rationed or supply suffers from sporadic interruptions.These interruptions in the neighborhood of Lahore average nearly fivehours per week producing losses due to machine down-time and spoilageof the work in process.
49. The principal industries where controlled processes are in-volved have their own standby-power. Among the industries visited, onefoundry with induction furnaces generated its power exclusively internallywith the explanation that they could not work otherwise and it was tooexpensive for them to rely on the general power supply. The importance ofa better supply of power should be stressed in order to assure the growthof the engineering industries.
G. Personnel Education and Training
50. As in most developing countries, industry is faced with theproblem of mnagAnpreant and labor relations. The management of factorieshas generally evolved out of experience through the development of theenterpri sE nd has not h-,r form.al tr-i-n-ng. Corporate ax +nnl , budget-ing, cost control, quality control, purchasing and stock control, methodsand trainingg; payment, nnd o+ther organizational aspects, are all areaswhere improvement is needed. The eistablishment of management trainingcenters is ulrgently reqllired,
51. The work-force i. mechan-ically inclined anr has developed skillsto copy proclucts and perform trained operations sometimes even withoutbeing able to read instructions or drawings.
52 There are several engineering schools in Pa-kst n" ALso, ,ma-n-y
of the schoLars study abroad but, as in many developing countries, theirreturn to the roirit-tr of ori' ,- g i h- -4 -,- the 1 - rmted a--4- C+ r-
of local conditions.
1/ Government of PaLkistan: Survey of Engineering Capacity in West Pakistan,O.W. Ros3kill, Industrial ConsuLtants, February 7, 1969.

- 20 -
5). O '~Jn tLe skIde -4-lab-o nol a ms l r.enon-. p--o-sly, +here Ls a
natural inclination of the Pakistani worker toward mechanical operations.Irn ord er t1-o c omapl1ement thi s tw; h un-iver sal t rai-nedC caacit the~4-1 -~4 -, esals-1±1 .LL bO LI I .LI1L U LL.i-' YWL Vt., -LLV va. ~ (.ay...A .lJ'u l.. VIM UaLJ .1ad1-
ment of a formal schooling system will be necessary. The Swedish PakistanIntitute for Tecn o. l ogyn Karaci (D T M1 A r' A -P--AA 4- 1 . _'3--lrl.j b1 ns'Ui_ Lu'ue _L or I ec .UAH U ry _.L. AL \2a1 . l @ 1 *L L (J V .L1 L 7 -) U.LIL-
takes the training of foremen, instructors, small-scale entrepreneurs andsome skilled rchine o,, ,. nately, the~, D s-cae l oliUe
and the operations are not well known in the country. An extension of thesam,e institution fun-ctions at z>a wihtesm lrttos
>14. r±±aL %1~1-- -_. I11 U U± O1 - d.1 -A LV-It1) . 'UJ.) .LJ..2 , J.AJ ,1.JA _ IL154- P ITAC hasj eta;bCished01t:1 aL 12-week course for 15, UV 16V trainees-' ari
conducts three courses a year. It is understood that the level of trainingis quite adequate for the co-untry's needs b-ut the nu-mber of traines is nuotsufficient: there are more than 1,700 engineering firms employing about100,000 persons in Pakistan.
55. The subjects presently taught are the following: design anddrafting, machine and tools, pattern-making, foundry practice, precisionmachining, tool and dye-making, heat treatment, sneet metal welding, pro-tective and decorative coatings, and inspection.
56. Other courses are given through the West Pakistan Small IndustriesCorporation (WPSIC) which has numerous brancnes and cooperates with tneIndustrial Development Bank of Pakistan (IDBP) in promoting small industriesand training workers in specific operations.
H. Utilization of installed Capacity
57. Expressed in general terms, the industry is not utilizing itsinstallation to the full capacity under present conditions. Normalcapacity for most engineering industries can be defined as the fullutilization of machinery in a one-shift operation. Maximum capacityconsists of a two-shift operation with utilization of the machinery forbottleneck operations in a third shift. Exceptions to this definitionare process industries where, by the process itself, the machinery isdesigned to work on a three-shift balanced operation.
58. The under-utilization of the installed capacity in the engineeringindustries derives mainly from three causes: lirmited availability of rawmaterials at a competitive cost, type of machinery installed and the supplyof electric power. Only seldom at any of the industries consulted was theliritation in capacity utilization attributed to lack of demand. Practicallyevery industry mentioned that they could sell more if they could obtain theinputs under reasonable conditions.
59. There were several industries that produced at full capacitv andsold the production several months in advance. Of the industries visited,the ones in the above category were the fan manufacturing industrv in Karachi,the KSB pump manufacturing plants in Dacca, Husanabal and Karachi, andSiddiqui Brothers power loom manufacture in Lyallpur. All these indnstrieshad similar characteristics, namely, capable management producing withmodern production techniques.

- 2l -
60. While the fan industry did not have specific plans for expansion,the pump industry was fully aware of ever-increasing needs as wall as thedifficulties involved, and they were especially aware of the problem ofthe suppling industries: quali't of castings. KSB planned to establis.their owTn foundry and increase their production once a sanction for thiscould be obtained from the government. Simultaneously, their p-up ar-ebeing copied in at least five large and two dozen small plants. SiddiqudBrothers are constructing new facilities at present.
61. The utilization of installed capacity as estimated through thesample taken at the industries visited (see Table II-1) was approximatEly 46percent. The implication of higher capacity utilization for the increaseddemand for imported inputs was discussed in Chapter I.
I. Productivity of' Labor
62. It is difficult to obtain an exact indication of the productivityof labor as the statistics are of dubious value. Nevertheless 'it canbe estimated for companies employing more than 50 persons that the averageannual production per employee is Rs. 23,000. In some companies employ-ing between 10 and 49 mainly simple foundries and very simple machineshops, it comes down to as low as Rs. 4.,000 per employee. The highestthat could be observed was Rs. 60,000 per employee in the case of motorvehicle assembly where the value of work is small in relation to thehigh cost of the components assembled. The minimum wage is about Rs. 1D0per month and skilled workers earn up to Rs. 350 and Rs. 370 per month.
63. In 1964-65 the Census of' Manufacturing Industries showed an over-all average output per employee of Rs 6,395. For surgical, medical anddental ins-truments the average was Rs 4,500 per employee; for metal-workingmachinery and machine tools it was Rs 5,300; and for miscellaneous electrica'products i-t was up to Rs 33,000. The 1966-67 Census of ManufacturingIndustries showed an overall average output per employee of Rs 8,000. Forsurgical, medical and dental instruments the average was Rs 4,570 peremployee; for metal-working machinery and machine tools, it was Rs 7,570per employee; and for miscellaneous electric products, Rs 44,200 peremployee. While price increases have been responsible for a part ofthese changes, there is little doubt that a real increase in productivityhas taken place.

TABLE II-1
CAPACITY UTILIZATION FOR THE MANUFACTURE OFA SELECTED NUMBER OF ENGINEERING PRODUCTS
Product % Product %
Steel ProductsBars - Rods 52.0 Nuts, bolts, etc. 75.0Black steel 25.0 Nuts, bQlts, etc. 25.0Billets 49.0 Cutlery 40.0Plate 12.0 Shovels 50.0Nail wire 96.0 Shovels 20.0Steel wire 27.0Foundry prod. 25.0 SpecialPipes GI 47.0 Foiding mach. 100.0Pipes DB & GI O4.uRolled steel 64.4 Transport EquipmentIngots 65.0 Bicycles 40.5Galvanized sheet 26.1 Bicycles 79.0
Ship building 100.0Machines Auto & truck 22.0Tool Auto 6.o
Lathe 100.0 TruckShaper (181) 100.0 Jeep 30.0
Tractor 39.0TextileLoom 83.0 ElectricLoom 100.0 Fans 60.0
Fan (small) 33.0Fan 56.0
Centrifugal 75.0 Transformer 60.0Switch fuse (30) 25.0
Motors Switch fuse (1W) 67.0Diesel - slow speed 45.0 Lamps 33.0Diesel - slow speed 50.0 Lamps 8L.oDiesel - slow speed 100.0DiQsQ1 - hi oh snped 2n-n Electronics
TV (19") 25.0Motonr Parts Transistor 1L9.0Piston 25.0 Diode 22.0Piston pin 25.n Potentiometer 17.0Cylinder liner 25.0Radiator 10.0
Average: 48.6
Source: Plant visits. Data as provided by plant management.

CHAPTER III
DESIGN AND QUALITY OF OUTPUT
A. Design
64. The quality of a manufactured product depends on the design ofthe product., material, production methods (process, equipment and technology),and labor. The questions concerning supply of material and labor werediscussed in Chapter II. This chapter reviews the problems of design anctquality of' output.
65. The design of a product determines its quality at a given coststructure considering methods of production and inputs used for its manu-facture.
66. The difference between product design in industrial and developingcountries is; that in the foimer nearly any product can be engineered forproduction, while in the latter it may be necessary to adjust the designin accordance with the restricted supply of' input materials, availableproduction equipment, simple maintenance and the lower purchasing power ofthe consumer.
67. The products anrLufactured in Pakistan are mainly copies oftraditionally imported items. A limited number of enterprises have licenseagreements with foreign manufacturers for the purchase of draiings andtechnical know-how.
68. As a result of copying the traditionally imported products, thedesign is nct, in general, of the latest type but this by no means imnliesthat the product is not adequate for the existing market.
69. Under cert,ain circumstances the design of the product is of extremeimportance f'or the overall economy of the coinntry s-Lich as wihen scarce rawmaterials can be used more economically in a newer design of a traditionalproduct. Fcr example, there is a case for promoting the construction ofother types of diesel engines than those presently popular on the localmarket. The slow speed motors reonlire a (oroximatelv 67 kgs. of casting perhorsepower cutput, while similar fast speed engines require only from 20 to25 kgs. per hp. To produce the lighter engine at less than one-third of theraw materials cost, new process technology and methods must be establishedand fundamentally better castings and foundryv products waill be required(see Annexes I and II).
70. Modern design and technology can be purchased in industriallyadvanced countries. Companies in contact with f'orei gn enterprises havesolved this problem to a certain extent, but the majority of local entrepre-neurs in most cases are not aware of its importance. A meiLm. shol'd beestablished to make the local manufacturer conscious of quality, technology,design and product and to give hir.m the incentive to change his res-ntattitude. To obtain results in this field, up-to-date knowledge must becomeaccessible, As a first approach to promote the diffusion of inforation, a

- 2b -
government-subsidized institute could assist the entrepreneur to becomeacquai4nted with newer possibilities favoring his production. It will beimportant for the industry to maintain modern technology and remain compe-titive in domestic and f'oreign markets.
B. Quality Standards
71. The standardization of products manufactured in Pakistan becomesf1rnri,qntt1 in order to oialifv not only on the domestic hut also on theforeign market. Presently, a number of different designs, types and quali-ties of nroducts are manufactuared following some or none of the accepteduniversal s-tandards. Overall quality control is missing, both with respectto the input material and the final product. There is still li ttle incentivefor management to incur control expenditures, as production can be sold-rn.molilir n t.h, m-kf_+. Thi l- 1 o or' r,,ii i +.i ronn +t-nl ,AiIa r n+llcll-rr h_mr
production and sales.
72. This problem is presently coming to a head in the foundries. It-i ---l -'ccha- enters the - --wr L-il-un -w i± -r+ +.Ii xt rni - ofra cupola roirrn. f urr .F',-ace, , ,or thec
characteristics of castings.
73. This sector of the metal manufacturing industries in particularrequires reorganization. It wold pay - -ell to have a few good rIgefoundries with quality control of inputs and outputs to supply the marketwi+th a c.onri-'olled. pr-oduct, rat-~'~+herv+ than the~ present nm-e (oe 400 ofI.lf'
existing units. Foundry products are basic inputs for the large portionof the-i me-tall engineering, industuries and th 4 uai- ofP castirgs_ dictate-4
the quality of the products (see Annex III-B).
74. The concept of cost of alternative machines has to be promotedwNJ Uithin industrial iaLnage-ment arLUd an, intel±LL-gent ch oULice hIlas tUo bUe LIadue avail-able to the local manuf'acturer. These concepts, which are imperative forthe develop-ment of the industrial sector in the near f-ut-ure, co-uld be con-veyed through the development of a technological institute as outlined
C. Insti t-te f-or ITuus-riaLl lechnology
75. Irn sumumary, a part of the present difficulties of' the engineeringindustries limiting their f'uture growth can be attributed to lack of productquality, lack oi' production standardization, under-utilization of capitalinvestment and machinery, frequently outdated technology and productionmethods increasing costs and waste, limited information regardLing possibil-ities of improvement, and lack of training for key personnel and especiallymiddle management and skilled machine operators.
76. To assist in overcoming these handicaps, an institute for industrialtechnology could be established. This institute could be financed by publicand private funds and would render direct services to the industry with in-formation, instruction and physical facilities, i.e., laboratories for testingmaterials. it would serve to improve the quality both of inputs and ofoutputs, and it would alsoadapt the application of different technologies tothe Pakistani conditions. This may include examining the profitability of
using surplus machirnery from the developed countries as well as the de-
velopment of new production methods adapted to local condi-tions.
77. To improve product qulality control, laboratories for physical <and
chemical tests with responsible personnel to control specific standards and4
norms will be needed at the major industry locations: Karachi, Lahore,
Dacca and Chittagong. The action of the :Laboratories would be coordinated
through a central establishment in one of the main centers of the country
wvhere the following programs could also be pursued:
(a) provide standards an.d norms. The no-oas can be adapted
from any of the existing universal systvems to satisfyloca-L needs.
(ID) establish a central laboratory for physical and chemicalanalysis. The laboratory should be able to provide all
necessary control operations for the industries. The
laboratory would also engage in developing new products
based on domestic raw materials, e.g., juue; it would
associate its research with the research act:ivities under'
way abroad.
(c) es-tablish training courses for management, middle manage-
ment and technicians in production plarning, organization
and control techniques, equipment costs and utilization,
enterprise administration, industrial engineering aspects,
and marketing.
(d) establish a technical reference service with specialized
person-nel keeping abreast of information on modem
technologies, machinery and equipment.
78. Official stimuilus to follow quality standards can be exercised by
giving preferential treatment to manufacturers following the norms. Thie
individual acquisition of systematic methods of quality control should be
encouraged Aith financial assistance. To instigate the utilization of the
institute'z; services, control labels (similar to underwriters' labels)
coud be n p Iroide.
79. 'l'he rese-ch and edu+cationfl sectors of the institute could co-
ordinate their activities with the universities and with other establish-
ments providing related services. The technical information service would
provide assistance for selection of machinery, machine balancing and capacity
utilization. All services should be provided at a fee to cover at least part
of the operating expenses.
80. The establishment of an institute to perform the outlined activi-ties requir,-es further careful progra, ng, timinng and cost determination.
and an assessment of scope and personnel requirements.

CHAPTER iV
PRICES AND COSTS
31. During- the survey, the Mission visited 52 plants, obtainingprice aid cost clata for 60 products. The prices of products and inputmateriaLs in relation to C&F prces are presentedl in Table IV- I. T17hefindings are sunmarized below:
Percent
R] DomestiC price (including taxes, duties, etc.) aspercent of C&F price of equivalent import product 198.0
R2 Pric:e of imported inputs (including taxes, duties,etc..) as percent of C&F import price of such inputs 217.0
R3 Imported inputs (net of taxes, duties, etc.) aspercent of sales price (net of taxes, duties, etc.) 32.6
R4 Imported inputs (including taxes, duties, etc.) aspercent of sales price (including taxes, duties, etc.) 52.0
R5 Ex-f'actory price without taxes, duties, etc. aspercent of C&F price of equivalent import product 147,,5
R6 Profit as petreent of sales 9.98
82. From the computation of the costs of local mnniifactured productsin relation to imported goods, and the duties, taxes and bonuses paid, thefollowing conclusions can be drawn:
(a) The domestic prices are on the average 1.98 times theC&F price of the equivalent imported product. DomestcLeprices reflect domestin production costs a nd duties,taxes, bonus voucher costs, etc., paid on inputs. C&Fprice is net of anny duties, taxes, etc., and is based onthe official exchange rate.
(b) The landed cost of imported inputs is 2.17 times theirC&F nrice. Landed cost; includes duties, taxes, bonusvoucher costs, etc.


- 27 -
(c) The imported inputs, net of taxes, duties, etc., repre-sent 32.6 percent of the price of the finished produc',again net of taxes, duties, etc. This iindicates theimport dependence when the inputs are taken at world iarketprices and output is valued at prices net of all levies.
(d) The imported inputs including taxes, duties, bonus, etc.,.represent on the average 52 percent of' the price of thefinished product considered with taxes, duties, bonus, etc.,meaning that the value added. domesticall;-. cormuted at-domestic prices, represents 48% of the product's cost.T'he import deperdence commuted on the basis of dormesticprices is higher than the import dependence shown under(c) above. The diff'erenoe hetwTeer these two nroportionsis weighted in each particular case by the amount ofimported inpnts that en+rt.Ar into thA mqnmifno2.ctre of aparticular product and by the impact of taxes, duties,
tnc.. ThAv vnr-v fro^m one product+. +tor) no+.ther The dl iffPr-ence between the two proportions averages out over the
(e) T'Ihe ex-f'ctory domestically produced product, u'.thtaxes, bonus, and duties, costs on the average 1.47 timesthe &rF price of the imported equivralentv. This compareswith the coefficient of 1.98, where the price includesduties, taxes, bonus, etc. (see under (a) above). Fiscalcharges represent the difference of 0.51 (1.98 less 1.47).
(f) The average profit margin on sales is 9.98 percent whichlsVV4.. cor.pa1- wi.t t r ' the1- -- . -a-. sector.
83. Observing the relationship 4- 1 of domestically produced productsto their equivalent C&F import price (1.98) and the relationship R2 of
o rn-n . inputs 4o hel 4 - mor price (2.-. -11 17), ..s nol eaIlk- ~~- -P UQ . uV ±±. Ul - A- LllP I .'L U 1e- .± -L I , .Lu iLd 1LUU±-dUf±U
that the input materials carry proportionately a heavier share of duties,t^Y, bonus, etc.* than the finlshed products. This is u--val-ent to aneffectilre exchange rate of Rs 9.42 per US $ for finished. products (4.76 X1.98)and P-s 10.33+- per US$frimpoV-ted inp-uts 4(47U A C-21).
84. The effecti Vw Ve teLxIlchuang I-rteu on Value adUUeU wUos QUt at as 9per US $. If the C&F import price is $100, the domestic price is Rs 942at the exchange rate of P-s 9.42 per US $. -mported inputs of $32.6 --coefficient R3 -- cost Rs 336.75 at the exchange rate ofP Rs 10.33 per US $.The difference of P-s 605.25 is worth $67.4, giving an effectlve xchan-gerate for value added of Rs 8.98 per US $.
- 28 -
85. In other words, if imported inputs can be bought at an effectiveexchange rate of Rs 9 per US $, the same effective exchange rate wouldapply to finished engineering goods, on the average. Further differentialprotection on particular goods could be held to a moderate level.
86. Under present circumstances, with the finished engineering goodsenjoying proportionately lower protection than imported inputs, and withthe heavy dependence of the engineering industry on imported inputs, it isunlikely that the industry can continue to develop at a rapid pace. Sincethe past growth of this industry has shown that Pakistan can specialize inthis type of products and since there is a large domestic market for theseproducts, it is necessary that cost-price relations be reversed in itsfavor if the potential needed growth is to materialize.
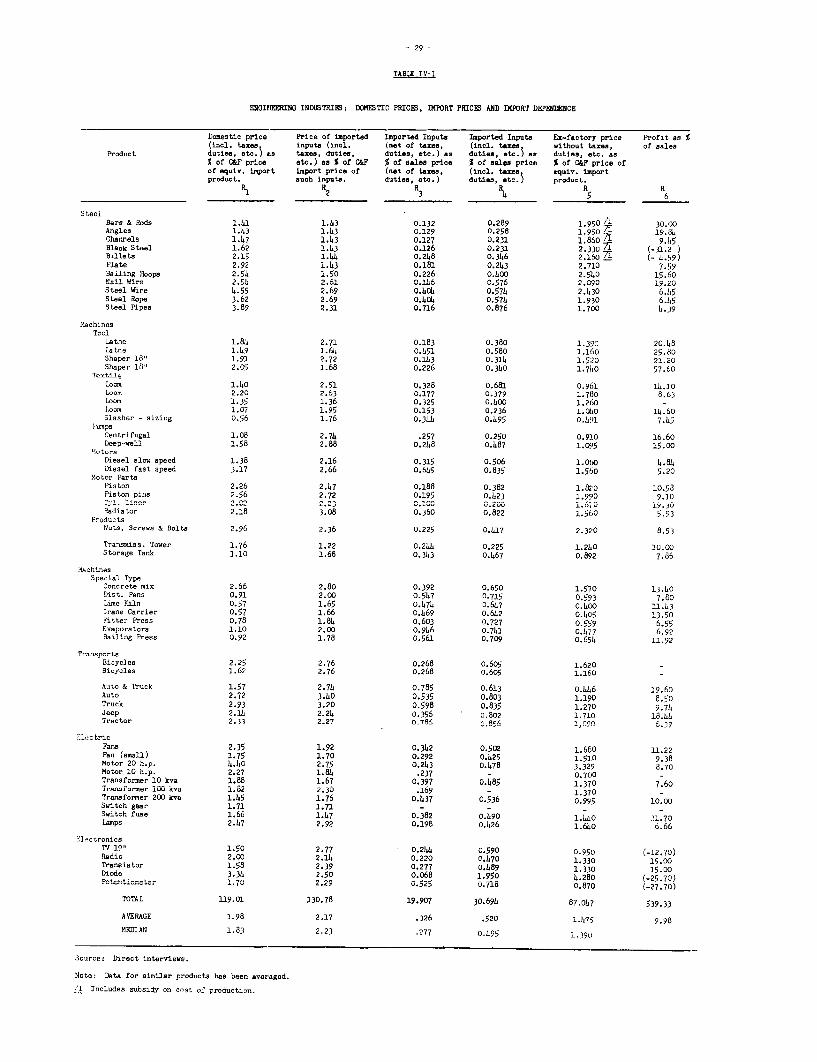
- 29 -
TABLE V- I
ENGI8IMNINO INDUSTRIES: DOMFSTIC PRICES, DMPRT PRICES AND IMPORT DEPENDENBCE
Domestic price Price of imported Imported Inputs Imported Inputs Er-factory price Profit as (incl, taxes inputs (inel. (net of taxes, (joel. taxes without taxes, of sales
Product duties, ate.5
as taxes, duties, duties, etc.) as duties .etc1
as duties. sic. % of Cdii price etc.) asS% of CdiP % of sales price % of sales price S of Cdi? price ofof eqaic. impor-t import price of (net of taxes, (incl.,taxes, equiv. importproduct. such inputs, duties, eta.) duti es, c. product.'
R2 3 s4` 6
SteelBars & Rods 1.41 1.43 0.132 0.289 1 950 /i 30.00Angles 1.43 1.43 0.129 0.258 1:950 7119.86Channels 1.47 1.43 0.127 0.231 1.860 T1 9.45Black Steel 1.62 1.63 0.126 0.211 2A1ln 71 (-11 9Billets 2.15 1."6 0.248 0.366 2iO 1 (-659)Plate 2.92 1.43 0.181 0.243 2.71.0 7.59Bailing Hoops 2.56 1.50 0.226 0.600 2.560 15.60
Steel Wire 4.55 2.69 0.406 O.574 2.430 6.45Steel Rope 3.62 2.69 0.404 0.574 1.930 6.45Steel Pipes 3.89 2.31 0.716 0.876 1. 700 6.39
MachiinesTool
Lathe 1.8 2.71 0.183 0.380 1.390 70A68Latne 1.69 i.66 0.651 0.580 1.i60 25.80Shaper 18' 1.91 2.72 0.163 0. 316 1.520 21.20Shaper 18" 2.05 i.68 0.226 0.360 1.760 57.60
Texti-leLoon 1.60 2.51 0.328 o.68i 0. 961 16.10Lco- 2.20 2.63 0.177 0.379 1.7130 8.63Loon 1.35 1.36 0.325 0.600 1.260 -
Loom i~~~~~.07 1.95 0.15.3 0.236 1.0610 16.60Slasher - sizing 0.56 1.76 0.346 0.695 0.691 7.45
PiUmpsCentrifugal 1.08 2.76 .257 0.250 0.910 16.60Deep-well 1.58 2.88 0.248 0.487 1.o95 15.00
No turnDiesel slow speed 1.38 2.1L6 0.315 0.506 1. 060 6.86Diesel fast speed 3.17 2.66 01. .3 15052
Motor PartsPiston 2.26 2.47 0.188 0.382 1.a20 io.58Piston pies 2.56 2.72 0.195 0.623 1.990 9.50
Radia tor 2.18 3.08 0.36o 0.822 1.560 5.93Products
Nuts, Screws & Bolts 2.96 2.36 0.225 0.617 2.320 8.53
Tranoniss. Tower 1.76 1.22 0.266 0.225 1.260 10.00Storage Tank 1.10 1.68 0.343 0.467 0.892 7.86
MAc hi-nesSpecial Type
Concrete nix 2.66 2.80 0.392 0.650 1.570 13.60Dist. Pans 0.91 2.00 0.567 De71 1 fl59 7.80 cLimes Kil-n 0.57 1.65 0.674 0.667 0.64(0 11.63-rese Corrier 0.57 1.66 0.669 0.642 0. 4C5 13.50'itter Press 0.78 1.86 0.603 0.727 0.559 6.55Kvpoatrsmcc 2c00.4 u. 741 0.477 6.92Bailing Press 0.92 1.78 0.561 0.709 0.654 11.92
TransportsBicyc.es 2.25 .7 0.268J 0.605 1.620 -Bioy.les 1.62 2.76 0.268 o.6o5 1.160 -
Auto & Truck 1.57 2.76 0.785 0.613 o.666 19.60Auto 2.72 3.60 0.535 0.803 1.190 8.50Trock 2.93 3.20 0.598 0.835 1.270 9.74Jeep 2.16 2.26 o.356 o.802 1.710 18.66Tractor 2.33 2.27 n-786 c rA1 O90Ci
Pans 2.35 1.92 0.342 0.502 1.660 U1.22Fan, (Mn1-l 1.7 SC7 1.920 9.38Motor.20 hn.p.. I,*.51U''9V.3
Motor 20 h.p. 6~~~~.60 2.75 0.243 0.478 3,329 8.70Meter 10 h.p. 2.27 1.84 .237 - 0.700 -Transfomyer 10 kva 1.88 1.67 0.397 0.685 1.370 7.60T-raf.crmer 100 kva 1.62 2.30 .1L69 - 1.370 -Transfomser 200 kva 1.65 1.76 0.637 0.536 0o995 10.00Switch gear 1.71 1.71 - -Switch fuse 1.66 1.67 0.382 0.690 I I.n 'i -n
lanpo ~~~~~~~~2.67 2.92 0.198 0.426 1.66 6.66
El,cutronicsTV 19", 1.00 2.77 - .2-0.9 0.950 (-12.70)Radio 2-.00 2-.16 0.220 0.470 1.330 15.00Transistor 1.58 2.39 0.277 0.489 1.330 15.00GDiode 3.34 2.50 0.068 1.950 4.280 (-25.70)Potentiometer 1.700 2.29 0.525 0. 718 0.870 (-27.70)
TOTAL. 319.01 130.78 19.907 30.694 87.067 539.33
AVERAGE; 1.98 2.17 .326 .520 1.4*75 9.98
MEDIAN 1.83 2.23 .277 0.1,95 1.390
Source: Direct interviews.
Noe:o Data for. eiril.ar- produ,,c.s h. beenav… agd
A1 3ncludes scubsidy on cust cC productiun.
C('A pER1 V
PROBLEMS OF SMALL SCAIE INDUSTRY
87. Most of the small-scale industry has grown from the personalefforts of mechanics, frequently on the basis of CODying certain typesof traditionally imported products. hle industry faces many problems --
mana7eria], financia]. and technical; at the same time, it has beensuccessful in meeting both domestic end foreigni competition.
88. The main problems are listed beloow:
(.) Lack of caoital. and access to l.oan capita.l. Due to thelack of capital the industry cannot afford bulk pur-chases of raw materials and thu3 cannot take edvantageof wholesale pricing and bulk shinments. Another incon-venience directly attributable to limited access of capitalis the inability to purchase modern specialized Droductionmachinery wath the consequent reduction of productioncosts. The scarcity of raw materials and of other inputsaffects small scale industry particularly severely. Someof the small enterDrises do not have government sanctionsfor import of materials and must procure all inputs on thelocal markets at high prices; the lack of working capitalthen lea.ds to insufficient capacity utilization. Theirability to borrow from commercial banks is limited due toinsufficient collateral. Banks are unwilling to lendagainst raw material inputs at their market value sincethis value may change with a possible change in theimport reg~ime.
(b) Iack of modern management technioues in planning, organiza-tion and cost control. There is a tendency to continue toproduce the same product. lAi]le this has advantages ofspecialization, they are lost if the technicue of productionbecomes outdated or market demand changes. The imorovementin Droduct design, product standardization and qualitycontrol require access to information concerning newprocesses of production and a reasonably stable market.

- 3]. -
(c) Lack of subcontracting. This is perhaps the major weak-ness of the engineering industry. There is a generaldistrust of subcontracting and, therefore, the industryproduces all its items "at home" requiring for theseoperations additional capital that otherwise could beused to improve the process of the main product. Thenon-delegation concept has gone so far that many engineer-ing industries employing 150 workmen have their ownfoundry facilities. Subcontracting and the developmentof the suppliers? industry will not take place untilstandardization of quality in the small-scale industry isachieved.
(d) Lack of marketing techniques. Presently because of theexistence of a sellerst market, very little has been doneby the existing enterprises to study the demand and productdesign adequate for local needs or exporting. Due to therationing of raw materials and other inputs, all themerchandise produced could be readily sold on the market.Only seldom did the enterprises mention limitations ofdemand for their products.
(e) Lack of power supply. In certain zones of the countryand especially for those industries established withoutgovernment sanction, the limitations of power supply amdthe sporadic interruptions seriously interfere withproduction schedules aid raise production costs.
89. With the exception of the physical limitations imposed by govern-ment regulations, i.e., power limitation. raw material rationing andavailability of capital, the management and technical difficulties can beovercome with access to education and information. The establishmenlt ofthe Institute for Industrial Technology (see Chapter III) to approach thesmall entrepreneur and acquaint him with modern manragement ard prndLiction-techniques should open the path to improvement of these aspects. The mnajorproblem will remain in the field of finance. This is discussed in VolumeIII of this Report.


CHAPTER VI
SUMMARY
90. The engIneering industry sector has developed a broad and well-established base for further expansion. The most favorable asset of theindustnx is the mechanically-inclined labor force. The main lIabilitiescan be attributed to cifficult conditions of supply of raw materials andcomponents and the competition from imports of equivalent finished prodiucts.
91. While rapid growuh of other industrial sectors may be imitied dleto market conditions, such limitation does nob eacLst for engineering pro-ducts. The demand for them has been increasing rapidly and the li.m';edsupply has kept prices high, yielding good profit margins to the industrydespite difficulties in supply of inputs and competition of finished p.?o-ducts imports. The outlook for growth and expansion in this sectJr is oneof the most favorable in the country, but higher efficiency and quality ofproduction will be required to satisfy the present and future needs of thegrowing producer and consumer rnarkets..
92. The engineering industry is now primarily domestic market oriented.It has substituted ior imports of a broad line of products: light engineeringgoods, simple machinery, tools and instruments, engines, electrical machineryand equipment. In recent years, the industry has started to export relativelysmall quantities of a wide variety of products.
93. Much of the industry consists of small establishments of simpleorganization. I'hese are private, family-owned establishments, sometLmesconsisting of machine shops that produce limited quantities of items, copy-ing those traditionally known to the market. In addition to these smraLlenterprises, there are several large ones with considerable experience andreceiving technical cooperation from experienced foreign producers.
9h. With a. properly organized and managed engineering industry sector,specializing in particular in the production of light engineering goods,there is an opportunity not only to expand further import substitution, butalso to develop exports on a considerable scale, benefiting from the low costof the available mechanically-inclined personnel and favorable access to theregional markets.
95. The present limitations to the growth of the industry can bue attribu-ted mainly to:
(a) Scarcity of capital and limited access to loan capitaL.The limitation is partly due to the owners, who do notwish to lose part of comnanv control and are reluctan-tto accept any type of partnership. Limited access toloan caDital affects in narticular small enterDrises.
(b) Limitations in management canacitv and knowledge. At nre-sent there is a void in the system with respect to infor-mation flow and contacts requpred to develop neW teh.-nologies, diversify production and utilize to the maXcLmumthe existiAng machine caacty

I

( c} Limitations resulting from insuffciient supply of importedinputs of raw materiais, conponents and parts. As a result,the industry operates at probably one-half of capacity.The quality of inputs is also unsatisfactor,y in many cases.The industry is exposed to competition of imrports of finis1hedproducts which on the average enter the country at a morefavorable effective exchange rate than the imports of inputs.
(d) Limitations in supply and high cost of electric power.
(e) Limited knowledge of marketing techniques., market researchand merchandising.
96. The manufacturing industry requires product standardization andimprovement of quality. The lack of both carn be attributed to managementfactors and the existing sellers1 market. Without improvement and standard-ization of quality, it will not be possible to meet competition from irmportsand to tap export markets.
97. The cost structure of production is being distorted and the costlevel increased by the discriminating import surcharge system. The e:xCistingsystem does not necessarily favor the better, more efficient and productivemanufacturer, but often promotes internal trade that raises costs of materialsand interferes with the development of a competitive productive industry.Imports of raw materials, spare parts, tools, jigs, fixtures, and other im-portant input materials are allocated to the industrv on the basis of recordedcapacity which tends to freeze the position of different firms in the industryand in effect discriminates against thle dynamic narts of the industrial system-
98. In order to improve cquality of nroduction and advancce managrementtechniques, it is suggested that an Institute for Industrial Technologzy beestablished. Th.e Institute would nrovide training for top and m.iddle mranage-ment in production planning, organization and control techniques; it wouldprovide access to information and assistance for the acquisition and utiliza-tion of modern technologies and know-how; it would establish and maintaincontacts with firms and research institutes abroad concerning alternatLvemachinery and product design and improvement; it would conduct research totransfer and adapt research and modern production tec.hniques for the manmfac-ture of new products based on domestic raw materials; it would supp:Ly ad-visory services for machine selection; it wold be responsble for the pre-paration and establishment of norms, and it would supervise quality and pro-duction. A detailed prograrm wvill havre to be prepared for the establ]siumentof the Institute, with its organization and cost estimate covering a periodof at least five years. The Institute shoul-d have laboratory facili ies inthe mairt centers of the country for physical and chemical testing, analysisand control of qualitv of products and production standards.
99. In futu.re planniing, there is need to give pirt to the ievelop-ment of certain selected lines in the engineering industry. Among suchlines are: the establishmvent of two Large foundries for the production ofgood quality castings; determination in detail of the needs for the manu-facture of machine tools to ascertailn the type, quality anu quantity ofproduct needed; determination in detail of the needs for motor and engine
- 31. -
mqn]faet.uring facilities to ascertain the production of the correct type ofmotors required; determination in detail of which are the required service-indiustries (tool. die. Jig and fixture) to be developed in order to servethe further development and expansion of basic engineering industries; de-termination of the need for replacement and expansion of capacity in thetextile, agricultural machinery and food processing industries, as well asin the indii.qtries producinp electrical goods and telecommunications eauip-ment; and preparation of the domestic programs for expansion and balancingof capacity to meet those needs in the industries where the auality of domes-tic equipment is satisfactory and domestic costs can be reasonably competitive.
100. The growth of the engineering industry is closely related to itscompetitiveness not only in qulnity rind nrice. hut also in its nhbilitv toprovide credit on terms comparable to foreign competitors. Availability ofadequate credit facilities for 1es finnancing would enable the domestiindustry to obtain stronger position in the loca-l market and to improve itsco--etj itivees in eovrncrtsC
101 The~ isu o~f f-Y,rH -i-.- is~r. p r-tic1 n--i r -irror-ta-nn focr then small *i ndust1-y-
which has difficulties in obtaining both long-term investment capital andwor'King cappital4. The fut,+1i"p "rrT.Tv.1ih of smnol I i nrlii c+_sr. i c creatn+.y dipendn n
the developmemt of subcontracting with larger firms, which is at presenta lmos -.t In ; n w,,i1 -ro nTh-moteS gtinn+.itV, rri mi1reater seilzin f
production, standardization of quality, greater certainty of markets, andb_etter availability44 off;ane
.ruusl r UU i itVUU U E UJl 1' VAsiUd• * ±~~~Ilt .VJLU i .LLin1LLL a,slULLU l _i1 LLJ" UD.L IU. .L-LJ Ui L.L u~1 U L t U. LU~±iJ
machine replacement, modernization and production line balancing. Theserieeus Ilave ueen neglecuteu iLn tlle past anUd shoI 'd now obi pU. ioiy.
103. AdLumiIstrative measures, -with their compUlex sanctioning system,import licenses, export regulations and slow processing procedures, have haddiscouraging effects on foreign private investment. RevisionL and simpllfi-cation of the administrative system is needed in the near future to assurea steady inflow of foreign investmenlt and foreignL technLical expertise. They-will be needed in increasing amounts at the present stage of growth of theengineering industry with the increasirng complexity of Ibs production pro-cesses.
104. Perhaps above all, a revision is necessary in the system of importallocation and pricing of both inputs and finished products. It is difficultto envisage a healthy rapid growth of the engineering industry unless muchgreater stability is assured in the import regime, foreign exchange regime,and the tariff system, and unless domestic production is placed in a posi-tion to compete with imported products at least on an equal basis.

JAMEX :1Page 1
Diesel Enzine Tndustrv
1-. The manuafacture of' diesel engines is one of the olderindustrie3 in Pakistan. having started over 25 years ago. There areseveral Large plants and more thian 100 small manufacturirng shops, mostof them in the neighborhood of lIahore, employing less than 10 personsper establishment. Officially, only 33 plants are sanct'oned for aproduction capacity of 11,400 engines oer yea r.
2. Diesel engine manuifacture is one of the character4st4cindustries of Pakistan as -it has grown out of the ingenuity of localskills. When the mechanics employed at one of the marnfacturing plantsreach a certain level of competence, they leave and open their ownmachine shons. The basic equipment at these establLisi,rents c onsissof a few lathes, drill presses, and sometimes a shaper.
3. The size of the manufacturing establishments of dieselengines varies; it ran'es from, those employing two to th:ree men tothose with over 200 employees. The industry has grown continouslysinco its beginning and fa_ ures 'ave been rare.
4. The capital t equired to set up shop and marufacture dieselengines is rather small. It varies between 15,000 and 50,000 rupeesfor plants employing less t'an seven persons, dependinlg on the in-tegration and sophistication of production facilities. The smallermachine shkops purcha+e ther castings and finish the engine, whichthey copy from those previously seen, in a family type operation.
5. When the typical shop reaches an employment level ofabout 20, a small foundry is usually added. A foundry of the type usedin Pakistan (very primitive) with a furnace or cupola capacity ofup to four tons per hour requires an investment of between Rs.100,000and Rs.200,000. The largest firm manufacturing diesel engines, BECO(Bat 1a Engirieering Company) has two fully balanced production lines!:one for slow speed and one for high speed air-cooled diesel engines.Yearly production capacity is over 2,000 engines of each type insizes ranging from 15 to 25 hp. The Batala Engineering Company is theonly conpany producing a rLore- sophisticated high speed diesel enginebut has had difficulty selling them because East Pakistan WAPDA (Waterand Power Development Authority) imported 12,000 engines under tiedloan arrangements. Most of the traditional consumers in West andvast lakis'tan prefer the slow speed diesel engines for their sturdiness,easy service and low maintenance. However, these engines are heavyand cos0t,y both to produce and to operate in terms of fuel consumptionper horlsepower output. The cost of a high speed engine (15 to 25bra'ke horsepo-wer output) is between one-half and one-third of thatfor a similar slow speed engine.
6. The lower cost of a high speed diesel engine derivespartly 'rorm reduction in the weight of casting required, over 20
ANNEX IPage 2
kilograms per horsepower output, while the slow speed diesel enginerequires approximately 67 kilograms per horsepower. The production ofhigh speed engines requires a high quality foundry.
7. Only the larger enterprises are sanctioned and receivei-rort licenses for r.aw material and spare parts. The smaller factories
purchase their inputs on the local market and still remain competitive.
8. The heaviest part of a diesel engine is the block castingand it is possible that high sneed diesel engines cannot be developed
in the country due to the quality of the castings since the stressesproduced by high cylinder pressures and moving narts may induce crackingof the motor block.
9. Data from the sample taken during the survey sponsoredby the U.S. Agency for International Develonment (Table I A-1) showsthat the investment reouirement per operator is moderate, averagingfrom us.2,500 to Rs.), 500. Many shops are satisfied with a producCtionof less than one engine per month.
10. The price of castf7gs in the Lahore area varies from25 to 30 US cents per kilogram..- In the United States similar tyne
castings cost an average of from 12 to 15 cents per kilo. Pricesfor diesel engines vary 1n P-akistan from Rs.235 ($149.25) to over Rs.300($62.90) per brake horsepower output, with a 20 percent price rangevariation based on seasonal demand. The larger firms charge higher
prices.
11. In the United States there is little demand for smallslow peederElns;-tose of 'IO rp.. are dou,ble t1he price of 1,800slow speed engines e -i ~ P flO _ %J~+1 ""o~
rpm. units of 15 to 25 horsepower output. The retail price forhigh speed engines is $75 per brake horsepower which is hig.her thanfor the equivalent manufactured in Pakistan, but the engines are ofhigher quality and life expectarcy.
12. In conclusion, to improve product quality and reduce
cost, the manufacturing industry requires:
(a) technical assistance to improve and modernize thedesign of the engines currently produced.
(b) availability of adequate, reliable and constantquality foundry products.
(c) standardization of products with interchangeabilityof parts.
(d) organized maintenance servicing.
(e) marketing with emphasis on conveying the advantagesof modern design engines to the traditional-minded consumer.
1/ At the official rate of exchange iHs. 4.'T = 1 U6;
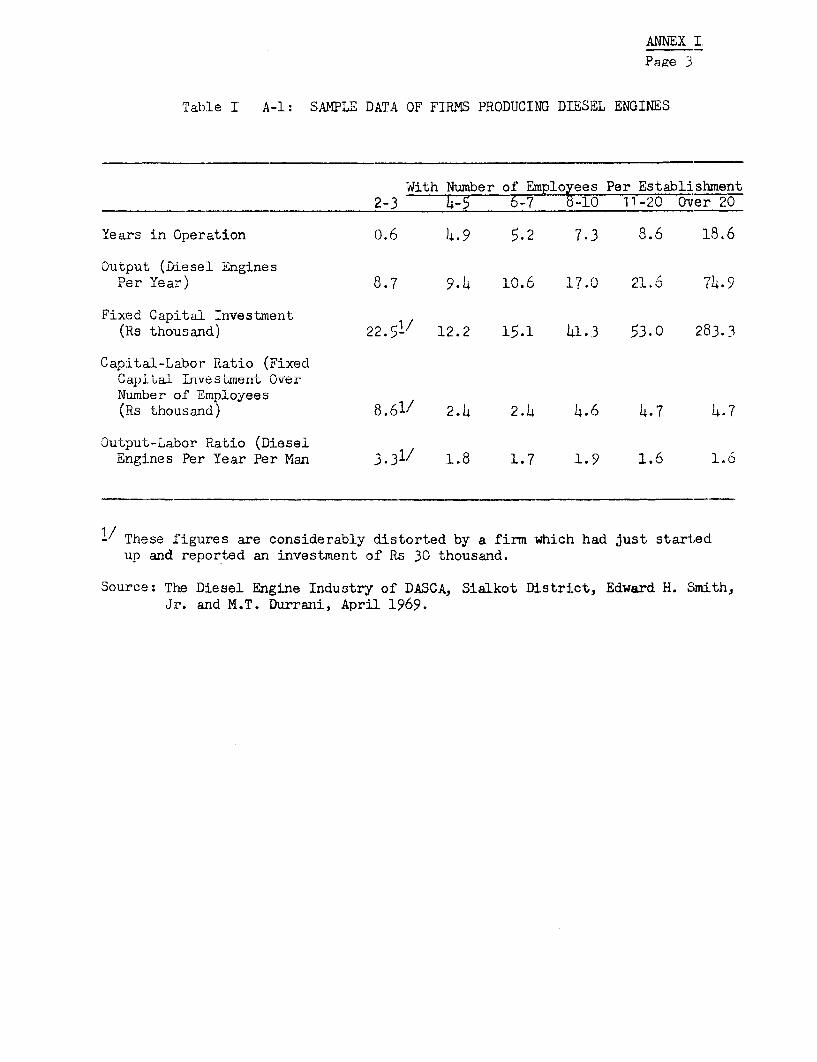
ANNEX Ia ge3
Table I A-1: SAMPLE DATA OF FIRMS PRODUCING DIESEL ENGINES
Wit;h M,Vberof' 1Zr,& ,'.,rsler PT I;Qt-l .h.¾1
2-3 64-5 6-78-10 11-20 Over 20
Years in Operation 0.6 4.9 5.2 7.3 8.6 18.6
Output (Diesel EnginesPer J-'~d± Year) .7 9.4 10.6 .17.0 .' 21.6. 7L4.9
F-lxed Capit- rinvestirent(Rs thousand) 22.51/3 12.2 15.1 41.3 53.0 283.3
Capital-Labor Ratio (FixedCapitLal Lnvestment O-verNumber of Employees(Rs thousand) .o 24 2.4 4.6 4f. 4.(
Output-Labor Ratio (DieselEngines Per Year Per Man 3.31/ 1.8 1.7 1.9 1.6 1.6
- These figures are considerably distorted by a firm whiCh had just startedup and reported an investment of Rs 30 thousand.
Source: The Diesel Engine Industry of DASCA, Sialkot District, Edward H. Smith,Jr. and M.T. Durrani, April 1969.


ANNEX IIPage 1
Foumdries
1. Among the principal inputs end basic materials for the manufac-ture of most capital goods indu-stries products are iron and steel castings.To develop the engineering industry, quality castings must be available ata reasonable cost.
2. In Pakzistan, there are over 400 iron and steel casting plants.There are several large installations with electric furnaces for steelcastings in Karachi, Dacca and Lahore.
3. By the end of 1966, 105 sanctioned foundries were in production,of which 59 were located in West Pakistan and L6 in East Pakistan. Theyearly value of production as given by the Central Investment Promot:ion andCoordination Committee was Rs. 65 million. The annual import liabiliity forraw materials for the fomndiies sanctioned has been estimated for the ThirdFive-Year Plan, 196q-1970 at Rs. 23 millionn
Lt. The industry survey made br engineering consultants in 1969estimated the exJstence of over 400 foundries in the country.l/ Accordingto our observations made in Aufust-September of 1969, practicallv evervmachine shop wit;h over 150 workers had a foundry. Most of the found:riesvisqitedi werp ra'ther py -it-.iver, consisting + aiiJy rnlyr of a cupolnnal Vqrv-ng in
capacity from two to eight tons per hour, and having little space fo:r manualsand mi}ing annd molding.
.Only a few plants have mechanized sand-mi ing, rmolding and de-molding operations, and only two of the installations visited had labora-to- es. roliy contL operations fUor 4rIpU- S, process or cast-gs areseldom performed. This explains frequent complaints of the users aboutpoor andL inconslstent qualty from one lot to another. A central foundryas well as a jig and press-tool factory would make a substantial contr:ibu-tiJ.on tuo 4WLpro-VIiriLg tLuhie qaa..LUy 01- raoP.aksta,-muade productUs.
6.* There is a prisma facie case for promoting the establislmen-2 of atleast twfo large scale foundries, one in Lahore and one in Karachi (thlelatter could be related to the Karachi shipyard), with both mechanical moldingand handling facilities, an efficient mechanical sand preparation plant,pattern shops, core shops, and above 1ll, laboratories for raw material con-trol and product, testing. It would be desirable if such enterprises wereestablished -with foreign, technical assistance. lhere may be i.itala diffi-culties in getting orders, although the new foundries ought to be ab:Le tosell castings since their prices sho-uld be beloow the cost of castings madeby small, engineering works. At least some of the larger engineering worksare probably open to the convi-ction that with fewer rejects they could savemachining costs and increase customer goodwill and confidence. Even so,such founodries might not have an immediate success and financing chargesshould be arranged accordingly. To maintain constant selling efforts, itwould be necessary to train salesmen with some technical knowledge.
I/ Survey of Engineering Capacity in West Pakistan, O.W. Roskill,Engineering Consultants, London, February 1969.
ANNEX IIPage 2
7. It is the full intention of the government to promote the manu-facture of heavy machinery and quality machine tools. To accomplish thisobjective, the quality of castings has to be improved and the volume ofproduction increased. The establishment of two large foundries would meetthese requirements, as well as avoid the waste of materials which is nowvery frequent.
8. For a semi-mechanized foundry with a production of approximately120 tons daily in a two-shift operation (foundries should operate on twoshifts), the investment cost in the U.S. would range from $750,000 to $1million, depending on the sophistication of equipment and accessory installa-tions.
9. A detailed survey of the requirements of castings and local con-ditions for construction of the equipment as well as location and cost ofoperation of basic plants should be conducted in the very near future.OtherLwise, future development of the engineering industry will be limitedat its beginning by the lack of quality of the basic inputs.
ANNEX IIIPage 1
Shipyards
1. The shipbuilding industry has been established in Pakistan forsome timte. At present 22 dockyards have been sanctioned, 7 in WestPakistan. and 15 in the eastern part of the country, with a total constructioncapacity of 54,000 dwt. of larger vessels, and in addition of approxim.atelv20 fishing trawlers and over 400 smaller craft. The total value of pro-duction in 1967/68 was Rs. 71.67 million: Rs. 47.9 million in West Pakistanand Rs. 23.7 million in the East. The value added by the industry was Rs.30.97 million of which Rs. 20.1 million was in WSst Pakistan. Total Pmploy-ment was 8,829, of which 5,847 were in West Pakistan. The authorized in-vestment during that period was Rs. 292 millionj of whiich about half, Rs.148.8 million, was accomplished.
2. There are two major dockyards in Pakistan: the Karachi Shipyardsand Engineering Works Ltd. in the West ani the Dockrard and Eninee r iWorks Ltd. Narayanganj, in the East. Together they produced in 1966/67 aaross value of nroduction of R.. 39.9, or about 55% of the total in thesector. In 1968/69 their production increased to Rs. 61.1 million: Rs.49.7 million for the Karachi sh:ipyard and Rs. 11.4 million in NarayangaJ.These establishments have diversified their operations to make the best useof the installed capacity.
I. Karachi Shinpyrds
3. The Karacihi shipyard was established in 1956 for the shipb-uildingand repairing and auxiliary operations in the port of Karachi. The estab-lishment ermlolys over 4,000 workers. The value of sales ncreasederratically:
1964/65 Rs. 27.4 million/37.8
1966/67 32.4196 7/68 31.61968/69 49.7
4. The present operations of the shipyard include 5 divisions:
(a) Shipbuilding.(b) Ship repir and dry dock -w-ork.(c) Foundry operations.(d) General engineering.(e) Sugar industry machinery.
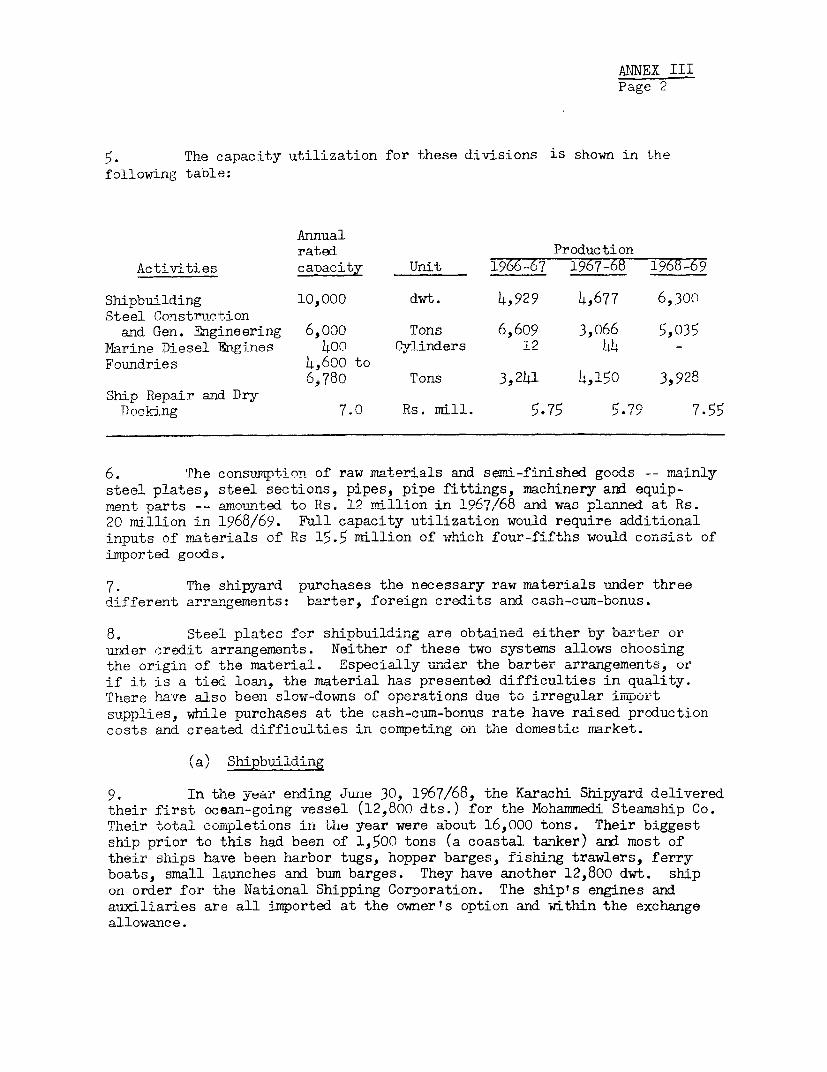
ANNEX IIIPage 2
The capacity utilization for these divisions is shown in thefollowing table:
Annualrated Prodi-icttion
Activities capacity Unit 1966-67 1967-68 1968-69
Shipbuilding 10,000 dwt. 4,929 4,677 6,300Steel Construction
and Gen. Engineering 6,000 Tons 6,609 3,066 5,035MIrine Diesel Engines 0l,o Ceylinders 12 44 =Foundries 4,600 to
6,780 Tons 3,2)4 ,150 3,928Ship Repair and Dry
Dockinng 7.0 Rs. mil�. 575 570 7- r55
6, The cons-litmption of raw m-±-terials and semi-finished goods -- mainlysteel plates, steel sections, pipes, pipe fittings, machinery and equip-ment pnrts -- nmonlnted to Rs. 12 mnillion 'n 1967/68 and was planned at Rs.20 million in 1968/69. Full capacity utilization would require additionalinputs of m--terials of Rs 1E5. 1 million of *ihich for-iths would consist ofimported goods.
7. The shipyard purchases the necessary raw materials under threedifferent arrangements: barter, foreign credits and cash-cm-bonus.
8. Steel plates for shipbuilding are obtained either by barter orunder credit arrangements. Neither of these two systems allows choosingthe origin of the material. Especially under the barter arrangements, orif it is a tied loan, the material has presented difficulties in quality.There havre also been slow-down.,s o'f operations d.ue t o irregular im.aportsupplies, while purchases at the cash-cum-bonus rate have raised productioncosts and created difficulties in com,peting on the domestiC market.
\a)/ Snipb-uijldng
9. In tshe year ending Junie 30, 1967/68, the Karachi Shipyard deliveredtheir first ocean-going vessel (12,800 dts.) for the Mohanmmedi Steamship Co.Their total comfpletlons in the year were about 16,000 tons. Their biggestship prior to this had been of 1,500 tons (a coastal tanker) and most oftlelr ships have been harbor tugs, hopper barges, fishing trawlers, ferryboats, small launches and bum barges. They have another 12,800 dwt. shipon order for the National Shipping Corporatlon. The ship's engines andauxiliaries are all imported at the owner's option and within the exchangeallowance.
ANNEX IIIPage 3
10. ManufEacturing costs at the shipyards are about 70% higherthan the price of ships imported from Yugoslavia. The principal reasonis the high cost; of imported componen-s, even those obtained under thebarter arrangements or on credit.
11. Orders have been irregular. As a result, there has been surploTscapacity, with a high carry-over cost of equipment and labor. The laborforce has to be kept on the payroll: otherwise it would take a long timeto train new qualified skilled craftsmen to meet the orders when they docome in.
12. In part, the difficulties have arisen from imnnort no'icy a-ridfrom the fact that foreign suppliers provide long-term credit finance.WPIDC iS now considering introducIng long-term sales finance for the pur-chase of domestically produced ships. The enterprise would be fullyemiloyed, if the Pakistani shipping Pinres placed the orders domestica:llyand on a regular basis.
(b) Ship Repair
13. This section of the enterprise has been fully occupied, mostlyto meet the demand for repairs by foreign ships. The closing of the SuezCanal helped to develop this industry since it channelled more foreignvessels into the Karachi harbor.
14 All foreign repairs are paid in foreig. currency. The cost; ofthe operations are high based on the official exchange rate, due to theh-igh cost of steel shapes, plates, and1 other inputs w"hch are necessaLry.
15- The prices charged for repair work on the dry docks are between400 and 600% of those of the cost of labor, but, the high cost to clientsdoes not represent a problem, and the dry docks remain 100% occupled.
I6. The workers are trained on the premises for the jobs to be per-formed and labor is efficient. The operation is profitable and is thelargest source of income of the Karachi Shipyard.
(c) Foundry
17. A well laid-out foundry has been installed by the shipyard.The foundry has two large cupolas with a production capacity of approxi-mately 5 tons per hour each and one sm,all cupola with a production capacityof about 1.2 tons per hour. There is also the regular outlay for sand-molding, s.-SxiLng, model preparation, shaking and cleaning.
18. The capacity rates up to pieces of 10 tons, however gray-castingrolls of up to only 8½C tons have been produced. In addition to the grayiron casting, there are facilitiLes which include electric steel furnaceof 3 tons-per-melt capacity.
AM1TLTEX TTT
Page 4
19. The foundry has technical difficulties due to the unrealia-bility of the raw material import starting with the pig iron, which is
obtained under barter arrangements and is sometimes bought in countries
that deliver a "second class" product. Also the sand is of poor quality.
It is a domestic product from the northern part of the country. As a
result, castings do not show uniformity and present bubbles and hard
spots.
20. During the last 18 months, the foundry has been occupied at
80-85% of its capacity, mainly with orders from the railway, but also
from the private sector. The foundry is a profitable operation since
its break-even point is about 60% of capacity.
(d) General Engiiieering
21. The general engineering section consists of a series of largemachine tools and an outlay of electrical welding equipment installed
for the repair of engines and heavy shipbuilding equipment. As ships
are not buillt regularly, only a portion of capacity is used mostly for
repair work and smaller machine jobs. The management estimates thatthis section is working at approximately 50% of capacity.
22. At present the main products being produced with the existingrolling, shearing and nibbling, welding and control equipment are steel
towers for electrical nower transmission and oil tanks, both of which can
be built at any size.
(e) Sugar Industry
23. The sugar industry has been idle due to the lack of orders.
II. Dockyard and Engineering WorksT t, NarayanZan,
2h. The government dockyard, Narayanganj waS established in 1925
by the Government of Bengal to undertake repairs of the governmentcraft. L-IDC took over the -!ant from the government at a cost of RS.
3 million on August 1, 1954, with a view to modernize it and to operateit as a commercial undertaking. The project was converted into a pulblic
limited company in 1956 with issued capital of Rs. 7.5 million of whichEPIDC holds 60% of the outstanding shares and the East Pakistan Govern-ment, 40%. Additionally, PIDC/EPIDC invested Rs. 15.9 million. Thedockyard is now capable of undertaklng construction of new vessels and
repair work, fabrication of sugar mill equipment and general engineering
work.

ANNEX IIIPage j
25. The production capacity of the yard was estimated originallyat Rs. 3.8 million per annum and actually has increased to Rs. 10.8million. Landing craft type vessels have been built for East PakistanShipping Corporation. The performance of the dockyard during 1968-69was satisfactory. Gross sales during 1968-69 were Rs. 114.0 millionand net profit was Rs. 446 thousand with an employment of 784 persons.
26. Gross sales during the past years were as follows:
Year Amount
1959-60 Rs. 3.60 million1960-61 Rs. 3.301961-62 Rs. 2.h01962-63 Rs. 5.60 "1963-6h Rs. 5.30 H
196h-65 Rs. 8.901965-66 Rs. 11.101966-67 Rs. 7.50 "1967-68 Rs 9 H20
1968-69 Rs. 114.0
27. Caoacitv ut,ilizatinn -is preent.vy IO(# mith a +o-shift or-tion for the production of smal:L craft and ships up to 1,000 tons dwt..and for shin rnepnir work= The machine shops are not fiillv occupied whereapproximately 20% of the installed machinery is over-dimensioned for theneeds of the shinyard wihere due tothe shallow " draft of -the river largevessels cannot be constructed. The machinery lies idle. It would beadvi sable to transfer machinery to a location where largLe parts ca Lemachined.


ANNEX IVPage 1
The Automotive Industryr
1. The automotive industry in Pakistan is still in its initialphases and looks more like the assembly of imported Darts and marketingof products than the production of transportation equipment. Its majorproblems are the duplication of plants. the absence of a comprehensiveprogram for development of the industry and irregular and changingconditions concerning comneting imnorts, duties and taxes and the foreignexchange regime.
2. The government has sanctioned 6 assembly plants for cars, jeeps,and commercial vehicles and 3 assembly plants for motor scooters andmotor cycles. The existing production or assembly capacity is: commercialvehicles; 4,500 units; truncks, cas,A 8ln0 j 6,00. 0; A motorscooters and motor cycles, 14,000.
3. Most plants have simple equipment, the most sophisticated equip-ment i n'-nl led being some spot welders, jigs and fixtures. The inve.tmentper unit assembled varies widely, but it is generally small, in relationto the value of production, compared to other industries. With the pro-fits obtained in assembly operations, some enterprises have built first-rate buildings. In addition, there are manufacturers of automobileparts. Parts such as piston rings, leaf springs, brake drums, batteries,radiators, exhwaust systems, etc., ar-e domesticalily pruUUUcU.
A. Passenger Cars
4~. The market for cars is limrted in Pakistan. In 1966 lO4,408cars were registered, and in 1967, 117,971 cars, representing an incre!aseof 12.9%. As automobiles are s-tlll considered a luxury in Pakistan andrepresent a large investment, their life is rather long, leading tocontinued maintenance rather than substitution. The substitution rateunder such conditions (as in many Latin American countries) would suggesta replacement of appro)idmately 6-8% per year, the remainder being newAconsumers. On this basis, a minimum normal need of 10,000 cars per yearcan be expected. There are only a limited number of models justified bymarket size. However, the plants in operation produce many models, on alimited scale, in small-batch production and thus at increasing costs.In addition there is a preference for imports of already assembled cars.For exami-ple, It is estimated that about 25% of the existing stock has comeinto the country in assembled form imported by the consumers (domesticcitizens returning from abroad, foreigners serving in the country, etc.)The combination of small market size, the preference for imported assembledcars and tne fact that both assembled and disassembled (CKD) cars areimported at full bonus payments, makes it unattractive for the assemblerto use tne existing installed capacity. It has been reported that in. thepast onl;y up to :20% of the capacity (of 8,400 cars) has been used.
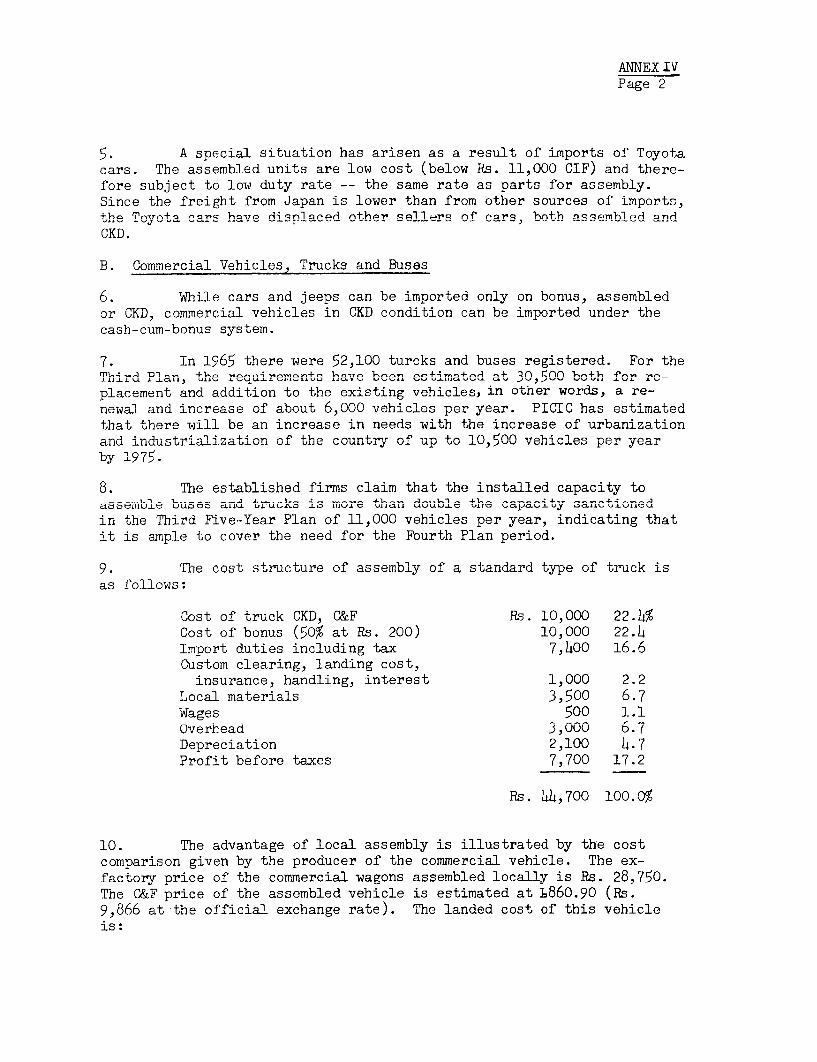
ANNEX IVPage 2
5. A special situation has arisen as a res lt. of imnort9. of Toyotacars. The assembled units are low cost (below Rs. 11,000 CIF) and there-fore subject to low idiitv rate -- the same rate as narts for assembly=Since the freight from Japan is lovwer than from other sources of imports,the Toyota cars have displaced other sellPrs of cars, bofh assembled andCKD.
B. Commercial Vehicles, Trucks and Buses
6. While cars and jeeps can be imported only on bonus, assembledor CKD, conmmeriael enhinc! in rCKn onndito+n cn be importe+.d undr +br
cash-cum-bonus system.
7. In 1965 there were 52,100 turcks and buses registered. For theThir Plan, t.e' 're- been -tij-ated at 30,500 bothi 4 fo -
placement and addition to the existing vehicles, in other words, a re-new_l a n A 6,00 v e p y e r- . PIOIC n A - TrArO has estimat e d4
tAt: W_L slU, _LLI_1 tIZ7 O C V| CL.IJ'VU U V,--VV V- - Q E7 J1%_| j,cfL.L b ;. I E JV xI V V oQ 1G W
that there -will be an increase in needs -with the increase of urbanizationandI industriallzatio -of t-h.e, c-o4- - 4-- 10 r e EleO - pe1anIU ±LnUUS LrU±d.LJ.LZ,d UL'ULI UIJ_ ULJU ,ULLL1U1I~.VVLy J. LA.FJ UV -LV 2'VJU V1U1JiA1.._LC JPJ_I. ~yztd.Lby 1975.
8. The established firms claim that the installed capacity toassemble buses and tr-cks is mLore than double the capacity sanctionedin the Third Five-Year Plan of 11,000 vehicles per year, indicating thatit is ample to cover the need for the Fourth Plan period.
M__ -J- --- -41 - 1 - 4_ -.C 4.-. -1,
9.i~ The cs str-u U oft VI e tbly ; UofLaUtadarU type Uruc is
as follows:
Cost of truck CKD, C&F Rs. 10,000 22.4%Cost of bonus (50% at Rs. 200) 10,000 22.hImport duties including tax 7,400 16.6Custom clearing, landing cost,
insurance, handling, interest 1,000 2.2Local materials 3,500 6.7Wages 500 1.1Overhead 3,000 6.7Depreciation 2,100 4.7Profit before taxes 7,700 17.2
Rs. 44,700 100.0%
10. The advantage of local assembly is illustrated by the costcomparison given by the producer of the commercial vehicle. The ex-factory orice of the commercial -wagons assembled locally is Rs. 28,750.The C&F price of the assembled vehicle is estimated at 1860.90 (Rs.9;866 at the official exchange rate). The landed cost of this vehicleis:

ANNEX I_Page 3
C&F cost 9,866Ronus voucher (109%at 180) 17,759
Insurance 198Handling and port
charges 297Custums duties and
other taxes ln060Municipal tax £0
32,240
When the commercial wagon is imported in CKD disassembled form, thecost-structure is as follows:
C&F price (L659.14) Rs. 7,530Bonus voucher (50% at
180) 6,777Insurance 150Handling and port
charges 287Import duties and taxes 2,721Domestic inputs 963Assembly charges 2,000Selling, Administrative
and overhead 2,882Rs. 23,310
Profit 1/ 5,LL0
Sales price 28.750
I/ Obtained hy difference.
11. Evidently the assemblers of commercial vehicles are in abetter position than the assemblers of cars, as the former can importtheir parts at the cash-cum-bonus rate when importing in CKD condition.The import, though, is subject to import license and allocation and theamount varies every six months, malcing plant process planning difficultand always :restrlctLng the willingness to invest in specialIzed equip,entsince calcuLations for amortizations are nearly guesswork. However,profit marg-ins are large enough to run the risk.
12. The profi-t -argins are much lo-wer in production of parts, whilethe risks of changes in the import regime and the possibilities of theassociated cost increases are aways present. This discourages domesticproduction of parts by the assembly enterprises; they also frequentlyprefer +o iJmport parts rater ahan pt--uichase "iei forri uomestic producers,among other reasons because delivery terms and quality are more reliable,.
ANNEX IVPage 4
C. Import Regime and Problems
13. Vehicles assembled or disassembled (completely knocked downCKD) can be imported under the following import regime:
(a) At the bonus rate - the import of motor cars (assembledand CKD), motor cycles and scooters; assembled motor vans,omnibuses, lorries and trucks, automotive conveyanceslike rickshaws, and parts and accessories of all auto-motive vehicles;
(b) At the cash-cum-bonus rate - the import of CKD motorcycle and motor scooter assembly, CKD commercial vehicles(trucks and buses), auto-rickshaws without bodies forEast Pakistan only.
(c) At the cash rate - the import of tractors and power tillersas 'well as parts and accessories thereof.
14. The duty strdciure differentiates between assembled (built-up)and completely knocked down (CKD) vehicles, in other words, when partsare imported for final assembly within the country.
15. Parts and CKD vehicles are charged 55% ad valorem. The samerate applies to passenger cars of CIF cost of less than Rs. 11,000.The rate of 62.5% applies to assembled vehicles. The difference of 7.5%is the margin for the local assembly plants.
16. At the present time there is not sufficient stimulus to developDthe domestic production of parts, while at the same time the establishmentof additional capacity in assembly lines is stimulated. The allocation ofimports is based on the assessment of installed capacity: the larger thecapacit.v the larger the allocation, which, as shown above, is urofitablein some lines (commercial vehicles). There have been loopholes in thelicenslng systemn which have allowed substantial amounts of capital gnndsand related sub-assemblies to enter the country in competition -with existingindustries. There has been limited understanding at the control agenciesresponsible for licensing of allocation materials and supplies of thenecessities of productiron line operations, and of the need to limit theassembly to a small number of products in large scale rather than duplicatethe efforts for many small scale operations. Finally, there has not beenan effective mechanism to pursue a systematic domestic production of partswhi--c', can bDe produced economicallyr for final asseqmbly.r
Li Conlusions
-1 A, n _ A ~ A+A4- por r 5_IAti n an - - -; - - - -A-4 _-_ 4.1_ -
l | * lWasse sm n1 u U L V4. P 4. VJ4. .GL4 UL'J1 A U1 vlJe
assembly and/or manufacturing industry of automotive vehicles in Pakistanis suggested along the following lines:
ANNEX IVPage 5
(a) determine import policy in such a way so as to promotelt,he production of parts domestically in a progressivemanner, thereby reducing the foreign exchange componerntover the next few years. This -would also limit thetendency of trading rather than producing vehicles andleave only serious minded firms interested in manufactu_;ring onthe market. The selection of parts to be produced domesticallyshould be determined with a vie-w to concentratirg dom .esticefforts on items which can be produced competitively;
(b) assist in the de-velopment of facilities for the manu-f'acture of parts that could be used in several tvnesof vehicles and insist on the assembly of products thatcan be standardized:
(c) review the financing policies for technical assistance!and manufacturing, acquisition of know-how, technologg,natents and iicenses to support the growth of the man.u.-facturing sector of supply materials for the transportationindustry


PART THREE: CHEMICALS, NONNETALLIC MINERALS
AND RUBBER INDUSTRIES

CHEMICALS, NONMETALLIC MINERALSAND RUBBER INDUSTRIES
TABLE OF CONTENTS
P age
CHAPTER I. SALIENT FEATURES 1
CHAPTER II. PROBLEMS OF l'HE INDUSTRY 5
CHAP'TER III.. IPIORT POLICY 6
CHAPTER IV. PRICES AND COSTS 9
CHAPTER V. CAPACITY UTILIZATION 13
CHAPTER VI. SUGGFSTTONS FOR THR 'TTTTIRTt 1
ANNEX I Natural Gas Pricing Policy
ANNEX II Development of the FertilizerTridimtr in Pakistin'

CHAPTER I
SALIENT FEATURES
1. The five groups of incdustries considered in this part are:
(a) Petrochemicals consisting primarily of local naturalgas based nitrogenous fertilizers; import based potashand phosphoric fertilizers; local cellulose based rayon;and primarily imported crude oil based reiineries. Theseindustries supply the respective inputs to agri clture,textiles and transportation activities.
(b) DIorganic chemicals consisting principally of causticsoda, soda ash, and chlorine, based upon locally avail-able limestone and salt; and sulphuric acid based upon.irnported sulphur. Thev supply the basic builk chei,icalsto the agro-processing industries, textiles, paper andleather.
(c) Nonmetallic mineral industries consisting of cement,glass, and ceramics, based principally upon locallyavailable raw materials. They supply the bulk require--ments to local construction, and partially satisfy thelocal demand for household tableware, electrlcal andceramic insulators and switch-gears.
(d) Pharmaceuticals based almost entirely on imported bulkproducts which are proce.ssed and packaged for sale tothe final consumers.
(e) Rubber products consisting principally of tires andtubes; in addition to s-undzy rubber products, based uponimported natural and synthetic rubbers. They supplypartial national requirements Lor transportation andindustrial hose and belting.
2. There are two annexes with supplementary data on fertilizers andthe pricirig of natural gas in East Pakistan.
3. The five groups of industries m,-entioned above account for approxi-mately sixteen percent of the total value added of the large scale manu-facturing sector as showin in Table I-l which also sets out employment, grossproduction value and imports for various categories of chemical products.Within thlese industries, the bulk. of production is concentrated in fertilizers,industrial chemicals, and cement.
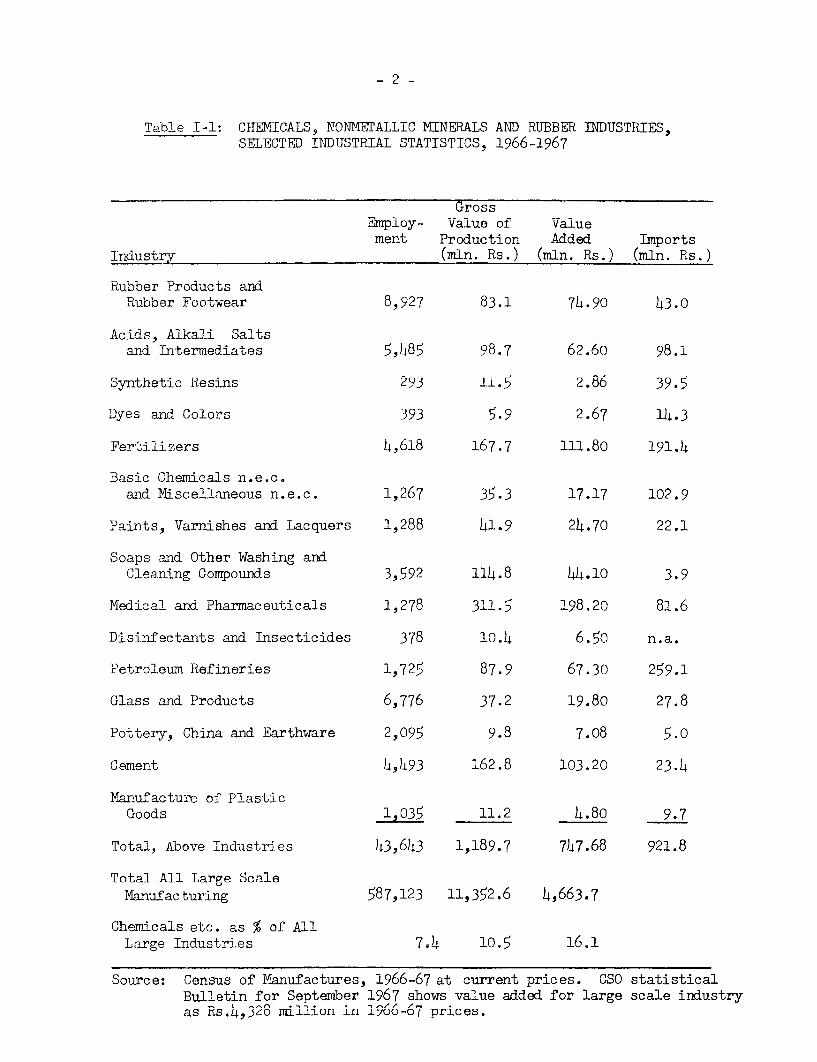
- 2 -
TaD'le I-1: CHElMICALSO, i1\UJvUThALLIU iCMINERALS A1iJ RuiBBER INDUSTRIES,SELECTED INDUSTRIAL STATISTICS, 1966-1967
GrossFmploy- Value of Valuement Production Added Imports
Industz7r (mln. Rs.) (mmn. Rs.) (mmn. Rs.)
Rubber Products andRubber Footwear 8,927 83.1 74.90 43.0
Acids, Alkali Saltsand Intermnediates 5,485 98.7 62.60 98.1
Synthetic Resins 293 11.5 2.86 39.5
Dyes and Colors 393 5.9 2.67 14.3
Fertilizers 4,618 167.7 111.80 191.4
Basic Chemicals n.e.c.anld Miscellaneous n.e.c. 1,267 35.3 17.17 102.9
Paints, Varnishes and Lacquers 1,288 41.9 24.70 22.1
Soaps and Other Washing andCleaning Compounds 3,592 114.8 44.10 3.9
Medical and Pharmaceuticals 1,278 311.5 198.20 81.6
Disinfectants and Insecticides 378 10.4 6.5n n.a.
Petroleum Refineries 1,725 87.9 67.30 259.1
Glass and Products 6,776 37.2 19.80 27.8
Pottery, China and Earthware 2,v095 9.8 7.08 5.0
Cement 4,493 162.8 103.20 23.4
Manufacture of PlasticGoods 1,035 11.2 4.80 9.7
Total. Above Industries 43.6h3 1,189.7 747.68 921.8
Total All Large ScaleManufacturing 587,123 11,352.6 4,663.7
Chemicals etc. as % of AllLarge Industries 7.4 1051.
Source: Census of Manufactures, 1966-67 at current prices. CSO statisticalBulletin for September 1967 shows value added for large scale industryas Rse4g328 million in 1966-67 prices.
- 3 -
4~. With the exception of' fertilizer and cement, chemical andnon-metallic industries have not been in the forefront of postwarindust-rializat,ion. Much of the growth within the manufacturing sectorhas occurred in the agro-based industries, such as sugar, jute andcotton textiles, and other industries directly linked to agriculturewith the incentives offered for the Pxnorts of iute and cotton mani-factures being a major factor. Engineering industries, working forthe rnpidly increasing domestic market, have also develnoed faster thanchemicals and related industries. `urthermore, since the agro-basednnd ecgineerng industries are not so -u by ecoromix ifo T1e aseare the chemical process industries, the former have grown more rapidlyat probably lower cost,
5 Tn te;l. of valueadded, the fCert-illizer indust-r- h1as been th.emajor contributor. Other major industries classified as chemicals are
thoe podunE olyt;uy-ene a^d acetate rayjon from, 4-14genous .mo-lasses:~.J. '~UU . VL i-.Ly ~_ A.i,y LLI~dIU dk d ~I 'J ± ± 'JJ I ~-- those producing viscose rayon, cellophane and paper products from bamboopulp in East Pakistan; three oil refineries using imported crude oil,and one small refinery using local petroleum, supplying transportationand l UbiLoation oils. ThIeSe indusltriles, apat frori, 'te re'LiLeries, pri.'-uc e
on a scale that is acknowledgedly small. The contribution of the remainderof the cerlcal secb-or is insignrificanit.
6. The future development of chemicals lies in thle -use of nauralgas f'or fertilizer and for synthetics. Fertilizer is the key to agricul-tural development and the properties of local natural gas are suitedc forfertilizer production. The development of a natural gas based syntheticsindustry shouid provide substitutes for fibres as well as expensiveimported metals and local high cost wood; there may also be some scopefor e!xport of manufactures. The economics of the natural gas baasedindustries, in both East and West Pakistan, as well as the alternativeof cracking naphthafrom local refineries are presently under studr.
7. Within the nonmetallic mineral industry, the major value addedearner is the cement industry located in West Pakistan and based uipon locallimestone and gypsum. Total cement production in 1968/69 was about 3million tons, of which 220,000 tons were exported under the present exportbonus scheme (1968/69). The remairder of this group, ceramincs and glass,,have the opportunity to improve their competitive position in relation toimports, through the development of local clays which can be par-tlysubstituted f'or presently imported china clay.
8. Pharmaceutical, rubber and soap products industries are largelybased upon imported raw materials and therefore licensing, bonus, dutiesand -taxes on imported inputs have had a significant effect upon productiontrendis. In -the case of rubber, low priced imported finished products havebeen allowed to enter the country which has restricted production.
9. The pharmaceutical industry, although import dependent, hasdeveloped as a matter of policy to meet medical needs.
10. Government policies in general, and those specifically4 _rected to parxricul arin sries, have -1 _xra IA a m rro le -- n the
uL C. u t %>9Wi >|9| ;Ls; U~ a - - *v t Jc §L v v SK Z,
establishmen-t and growth of the sector. Fertilizers and pharmaceuticalsUtev tJeuo . HIt.r*±.±~ L'J ±S ~ QL .J4 L V U.I nJJI dec.& ¼Al'. -O.tJL Unsdevelopeud preduor-"nat-ly on the boasls ofl specilfic gove.=Me deisonvt
promote these two industries; the same holds true for petroleum refineries.Other industries did not have such specific gover-nment suppor- and theirdevelopment has been in response to two general factors that have shaped. akist Uari.L industr-i allzation nameLLy, Wite .LUdU bro Vt-dLLIItIIIU plicy of resrtrict
ing imports, hence encouraging import substitution industries, and theavailability of tied foreign loans principally for capital equipment pur-chasing. Under these circumstances, those industries in which the economiesof scale co- d be satisfied -with reasonable ease have developed efficientproduction units, such as cement and paper; these industries are alsodomestic resource based. In contrast, most of the cheumical indusbries,with the notable exception of fertilizers, confronted with relativelynarrow market demaul-d and sizable requirements of scale ha-ve had a frag-mented, unbalanced development of small plants resulting in high costsof production. In addition, some Of these industries are heavily dependenton imported inputs while their technical efficiency is below internationalstandards.
PROBLEMS OF THE INDUSTRY
11.* Problemis in tis industry can be stated in genera term.s as being:
lack of entrepreneuirial experience, technical difficulties, and the smallsiz e ofC t,IUtJ WIt L,-LUiI±, JAU.1UL -
IC' * lJ.ItC .tUt;:IiL, suu Wu.z--.{ ±vXUs, UUJ. rcl r rwd4± L| 111 ji1 dr±y Itivtpec:i i e
history of the textile industry, with the growth of engineering industriesau a signnifican't aduition. 2itrepreneurs in the mrajority of cases startedas textile manufacturers in India before partition and subsequently movredto Pakistan soon after independence so that in this field there has been atradition and knowledge accumulated over a long period. To a lesser extent,the sane is true of simpler engineering goods, particularLy in the Lanoreregion. In contrast, the chemical industry is conpletely new and entre-preneurs, coinJig mostly from the textile industry, have had to find theirway from scratch in plant design, plant operations and markets.
13. In nmany cases technical problems arose from faulty initial designand project analysis, particularly in the unusual use of local raw materials.For instance, the use of molasses in production of polyethylene and rayon,and the use of ga:; ltired reduction of limestone instead of coke in the pro-duction of calcium oxide are two examples of the use of raw materials inproduction processes which have not yet been thoroughly developed inter-nationally. Problems have also arisen from the dearth of local desigr.ability which has forced reliance on foreign designs without proper adapta-tion to conditions in Pakistan; in some cases the sellers of machinery andforeign consultants have provided wrong advice. These difficulties havebeen exacerbated by the shortage of plant technicians and skilled labor.An exception to this situation is the oil refineries which have success-fully overcome local technical personnel deficiencies through extensivetraining programs including foreign experience for key staff. In otherindustries, efforts are being made to remedy the situation.
14. The sraall market size has resulted in production levels on un-economic scale. The polyethylene plant, in Karachi, where small initialdesign size of five thousand tons contributes to high costs, clearlyillustrates this problem. The scale problem is further compounded bygovernment import restrictions, which encourage vertical integration ex-tending to production of intermediary chemicals in what are locallyreferred to as mini-plants (e.g., both the viscose and acetate rayon plants).The result is high production costs and management problems in controllingall the diverse processes included in one plant. These factors inhibitthe industry from acquiring the advantages of specialization. In addition,the market demand for chemicals is not balanced to absorb all the productsproduced by the industry. This is a particular problem of the caustic sodaindustry, where chlorine is produced in excess of local demand, requiringcostly disposal operations. In the case of the caustic soda plant in.East Pakistan, chlorine storage facilities directlv limit nroduction ofcaustic soda, since the chlorine cannot be readily disposed of.
OWAP'P1TT TTT
IMPORT POLICY
1*. Gove;.=rnent policies -wth the notable e 4ception of fertilizers,pharmaceuticals and cement, have often been arbitrary in their effectson Uldustry and have created a n-wmber of anomalies.
16. For ifistance, the banr-ing of imports of chemicals to protectlocal production has been used to foster local production but has con-tributed to the growth of small, inefficient producers, resulting inlimited and perhaps questionable national gain. The justification forthis type of protection is foreign exchange saving DUt the resulting highcost of protected local production has then been passed on to consiuingindustries. Wnen chemical prices have risen too high, the consumingindustries have been able to pressure the government to relax importrestrictions, which has then back-fired on the aomestic producers.This complex of uncertainty is increased fur-ther by the six monthlysetting of import policy, which allows for fluctuations in restric-tive measures. These variations complicate planning of the industrialistsand potential investors by introducing uncertainty both in the cost ofimported inputs and in the competitive posi-tion vis-a-vis finished importedproducts.
17. A striking example of the fluctuations in restrictions is thecase of caustic soda in the production of which technical problems,compounded by small scale units, have resulted in high production costs.In 1968, production levels fell far below their capacity, prices rose andlocal demand was left unsatisfied. The government responded to this situa-tion with a relaxing of the import ban. In an earlier period, causticsoda imports into West Pakistan were banned while imports were allowed fromEast Pakistan. The East Pakistan producer of caustic soda (who receivedlimestone and salt from West Pakistan for his production, transported atsubsidized rates) sold his entire production in West Pakistan because ofthe high profit margin selling in the protected market. The policy hastended to react at times in response to consuming industries, and at othertimes in response to the caustic soda producers. This case is also anillustration of the adjustment difficulties encountered by entrepreneurscoming from the textile industry where the sales have been in a protectedmarket to a large number of unorganized consumers who absorb high prices --however grudgingly. In contrast, the chemical industry produces inter-mediaries for a relatively small number of industrial consumers. Theseconsumers are organized, and the government is responsive to their needs;hence the local high cost producer must remain alert to consumer pressureon the government. The effects of policy changes are further cost increasescaused by the instabilities. Of course, it is impossible to appreciatethe hidden costs resulting from these actions in terms of consumption ofvaluable government and entrepreneurial talent.
18. The cases of industrial difficulties due to changes in policiesand insufficient entrepreneurial experience can reach paradoxical levels,as exenmplified by the nlight of a sod-inm sulfate manufacturer. who succeededin obtaining an import ban on his product, only to realize that even with

- 7 -
this protection his operation was unprofitable, due primarily to smallscale of productuion. Ti'e industtrialist responded to this by building asoldium sulfide plant consuming his original sodium sulfate production.Buu hiis req-uiremerrnt for sodium sulfate far exceeded his own productio:ncapacity of sodium sulfate and he required imports. However, importswere not forthcotning because of the protection previously given to himin the form of import ban, and he was compelled to stop operations.
19. In those cases where there is no explicit protection of localproduction, present policies can have the effect of making imported raumaterials so expensive that the finished product can be imported morecheaply in finished form. If the effect were to preclude the establish-ment of uneconomic activities, then these policies could be justifiedbut in practice both the policy and its implementation often lacks con-sistency. At the same time, the importation of capital equipment at theofficial exchange rate encourages uneconomical plants by under-valuingytheir imp)ort cost, while simultaneously discouraging local manufactureof capital goods..
20. The excise tax, used primari:Ly for fiscal purposes, has had acascadingr effect in some industries, specifically in rayon, glass andplastics., where their inputs of alcohoL, soda ash, and methanol are taxedas well as their products. Excise taxes are a further burden on the pro-ducer who is taxed ex-factory and who normally sells on 30-90 day creditterms (e.g., rubber products) or when the products are subject to shippinglosses (e.g., glass). These taxes have caused additional anomalies byencouraging uneconomical verticalization. For example, the recent tax onsales of refitted metal drums has caused industrial drum users to purchaseused drums and refit them themselves, thus avoiding the tax but unnecessarilyexpanding their operation into areas in which they have no specialization.
21. Foreign loans and barter agreements have provided needed capitalequipment and corrunodities, but in a number of cases they have disrunptedlocal industry by permitting imports of finished products, in particuLar:triple-super-phosphate, DDT, and electrical insulators. The latter t'doproducts do not require foreign exchange for local production so theirpurchase abroad on loan is an avoidable consumDtion of foreipg exchangye.In the case of DDTf this indirectly contributes to the caustic soda diffi-culties because the caustic plant in East Pakistan was built in anticipa-tion that chlorine would be sold to this plant but now production islimited because of imports, hence caustic soda nroduLcrtion is restricted-
22. The fixing of import licenses for shipping npriods of only sixmonths contributes to instability, making industrial production planningdifficult, and also causing some u-nique problems. For examp-le, a smallproducer is required to have a six-month inventory, the carrying chargesof which can be very expensive for high value items, while the bulk lowvalue material consumer is required to fragment his shipping, thus increas-ing freight costs. This diffi9cult y waCs coM.ounded in the case of one

- 8 -
chemical plant's imrport of bauxite - a low value bulk product - whereafter some difficultv the plant obtained a license for a single shinment±.amounting to his total allotment for two shipping periods. This stillrespilted in high costs. causing the industry to nurchase one year qI n1 t.-ment on license at the official exchange rate in combination with thepurchase of a second year's allotment at the cnsh-bum-honiis rate.

CHAPTER IV
PRICES AND COSTS
23. Transportation costs on the bulk chemicals - particularly theacids - plus the cash-cum-bonus exchange rate applicable to competingimports, and the 5G percent general duty on chemical imports provideconsiderable protection to the local industry. Analysis of chemicalindustries costs reveals variable dependence on imported raw materials,substantial foreign exchange requirements for spares and high costcatalysts, and high overhead and indirect costs. The petrochemicals(with the exception of crude oil for the refineries) are imported witha high duty, obviously to discourage consumer goods production.
24. The pharmaceutical industry is not subject to local taxes exceptindirectl;y through taxes on packaging materials; receives the bulk of itsinputs from foreign sources tax free, and at the cash exchange rate: andis protected from foreign competition. Examination of the industry's costsshows high overhead charges and profits at Annroximately 20 n-.rc.nft ofsales.
25. The nonmetallic minerals industry prices compare favorably withC&F imports of finished goods at the csh-cnm-bonus rate, with the exczp-tion of "dumped" products from which it needs protection. Natural re-sources, and Derhans competition, have assisted this industry in achievingpresent efficiency levels.
26. Local production of rayon yarn has suffered from over-verticaliza-tion and relTtAvely small size plants. The sales - rice suggestek bygovernment; are competitive (before taxes) with imported non-dumped yarn -atthe cash-cum-honi; rate. Recent reduct:ion of excise taxes on the local yarnhas assist;ed this market, but "dumping", smuggling, and licensed importshave made nTrTnnfi t;; rn vrernr lrknn7- - -- -_ -. 1 -
27. A smmmnry statemrent of ratios based on industries interviewedby the Mission is set out in Table IV-l which requires some explanation.First. int+erpretatiion of +th results -- 4---- -3 -- - -b---- t b Ihe s sizeof the sample and the highly diverse grouping which make up these indus-tries. Secondly, imlicit in all of the ge±eializations is t use offactor prices at the official exchange rate, and also that the bonus,duties nnd. taxes reflect a mix4ure of protection pollcy and of exchangerate adjustments. At the present time it is difficult to decide which partof the system is the mechanism, for currenc.y adjustaeunt and which part ispurely for protection above the currency adjustment. Reconsideration ofthese ratios mwith all the imported inputs priced UG& at the efiective cash-cum-bonus exchange rate could help reduce the confusion in analysis result-lng from. the use of the bonu-,s, duty and tax system, to adjust the exchangeratios, as well as to provide protectiorL to local industry and discourageconsumption of goods with high foreign exchange costs.

- 10 -
28. The prices of locally produced goods in this sub-sector areon the average 2.7 times the C&F prices of equivalent imported goods(ratio R-1). This average is heavily influenced by the extremely highprices of several products (polyethylene, paints and rayon): when themedian ratio is computed, prices of locally produced goods are 2 timesthe C&F prices of equivalent import products. A similar order of magni-tude holds for prices of imported inputs: on the local market, afterduties, taxes, bonus, etc., they are on the average 2.4-2.5 times theC&F prices of these inputs (ratio R-2). In other words, the effectiveexchange rate mechanism is about neutral with respect to this sub-sector,on the average, but the incidence varies widely from product to product.The mechanism -- after bonus, duties and taxes -- provides an added pro-tection to local manufacturers by cheapening the imports of industrialinputs in relation to finished product irports in the case of Dolvethvleneand resins, acetate yarn, paints, rubber products, ceramic tableware,caustic soda and to a minor extent, cement. The opposite holds for suchvaried products as sulfuric acid, fertilizers, soda ash, DDT, andelectrical insulators.
29. The relative efficiencv of the industries is indicated by theratio of ex-factory prices without bonus, duties and taxes as a percentageof C&F irmort eauivalent. The arithmetic average of this llrelqfiveefficiency coefficient" is 2.17, i.e., prices of domestic products are2 2 times tn,he MrF m Tnnort nrices of the same products. at t.he officialexchange rate; the median average, which dampens the importance of extremeirues h is_ 1 5; Ji e.. domestir nripces net, of tyes- cdutqies bhnn,ii et+.r-
are 1.6 times the C&F import prices. The protected industries, such ascaus~tic soda, rayon, nolyvethyv1e ne- npaints and +ableware, show the highestratio values, i.e., they are the least "efficient" within the group. Thisi caused r yi ownr capacit ±.Iti tcnic p M r 7-rnoblems in p
particularly in caustic soda and polyethylene; and by extremely low "dumping"prri ces of ronnmmI- njr imrporte.dr fi nis,herl pn-'ciroduct refl ct'edn inv +he high ratio
for rayon, paints and tableware. In contrast, fertilizers and cement, the____stris nrllnc 4.6 pe-rcn+. o-P +the vtrlu addedA in large scale manu-facturing sector, show much lower coefficient, ranging from 1.1 to 1.5,- -AJ-icatg a 1ubst -tially >Clh- e n -P +of-these -. -A-d-us.-te-.- I A
-tLLAJ,dL'_ ,WaL -2L5
.-. C 4.- 4- - j LJJ ./ - 4.i C .iLA4 /J 4C . it
similar situation prevails in rubber.
Percentage of value Approximatea AA-.A -~4C 1 -. .--PC'-4 _ade oflage efici..ecy
scale manufacturing coefficient /a
Fertilizers 2.4 1.1
Basic Chemicals 1.8 1.8
/a R-5 of Table IV-1.
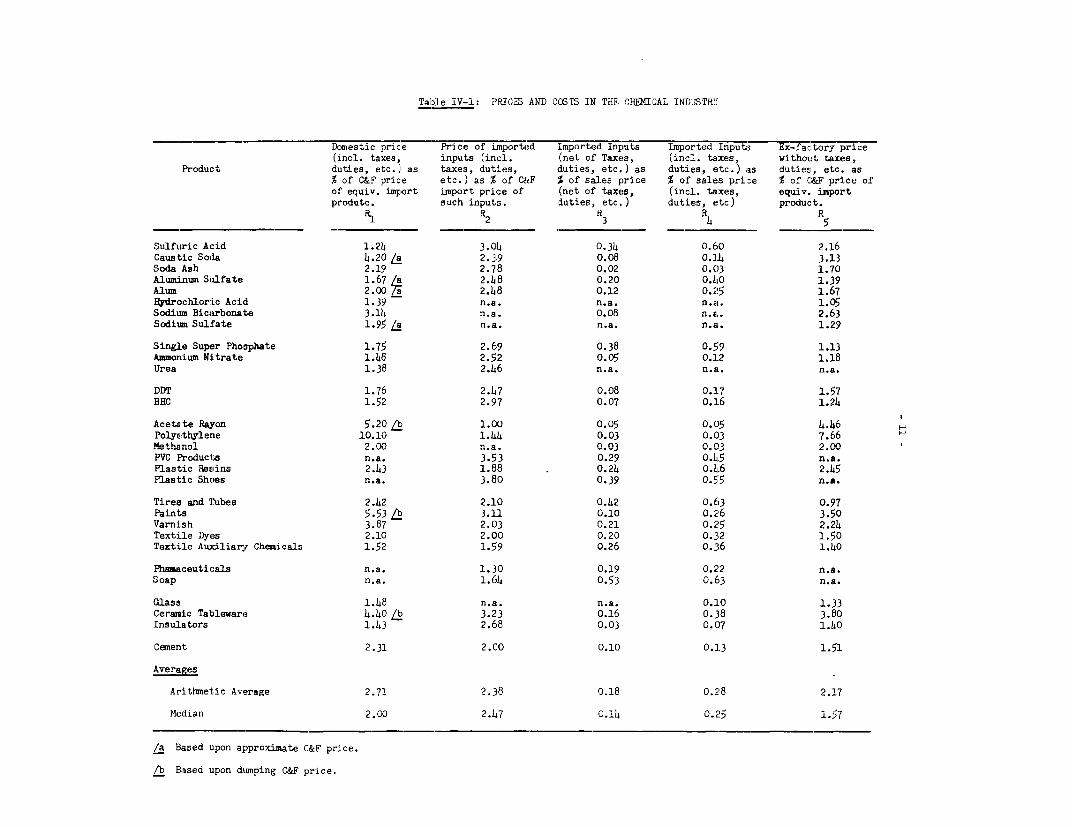
Table IV-1: PRICES AND COSIS IN THE CHEKIJAL INDUSTRY
Domestic price Price of imported Imported Inputs Imported Inputs Ex-factory price(incl. taxes, inputs (incl. (net of Taxes, (incl. taxes, without taxes,
Product duties, etc.) as taxes, duties, duties, etc.,) as duties, etc.) as duties, etc.. as% of C&F price etc.) as %: of 0CF % of sales price % of sales prize % of C&F price ofof equiv. import import price of (net of taxes, (incl. tEaxes, equiv. importprodutc. such inputs. duties, etc.) duties, etc) product.
R1 R2 R3 R4 R5_ _ _ _ ~ ~ ~ ~ ~ ~ H 2_ _ 3_ _ . _ _ _
Sulfuric Acid 1.24 3.Co4 0.34 0.60 2.16Caustic Soda 4.20 L 2.39 0.08 0.1-4 3.13Soda Ash 2.19 2.78 0.02 0.(3 1.70Aluminum Sulfate 1.67 L 2.4,8 0.20 0.140 1.39Alum 2.00 T 2.48 0.12 0.25 1.67Hydrochloric Acid 1.39 n.a. n.a. n.a. 1.05Sodium Bicarbonate 3.14 n.a. 0.08 n.a. 2.63Sodium Sulfate 1.95 L n.a,. n.a. n.a. 1.29
Single Super Phosphate 1.75 2.69 0.38 0.5;9 1.13Ammonium NiLtrate 1.48 2.52 0.05 0.1]2 1.18Urea 1.38 2.46 n.a. n.a I. n.a.
DDT 1.76 2.47 0.08 0.17 1.57BHC 1.52 2.97 0.07 0.1]6 1.24
Acetaite Rajron 5.20 /b' 1.CO 0.05 0.05 4.b6Polyethylene 10.10 1.44 0.03 0.03 7.66.Lthanol 2.00 n.a. 0.03 0.03 2.00PVC Products n.a. 3.53 0.29 0.45 n.a.Plastic Resins 2.43 1.88 0.24 0.4,6 2.45Plastic Shoes n.a. 3.80 0.39 0.55 n.a.
Tires and lubes 2.42 2.10 0.42 0.63 0.97Paints 5.53 /b 3.11 0.10 0.26 3.50Varnish 3.87 2.03 0.21 0.2-5 2.24Textile Dyes 2.10 2.00 0.20 0.32 1.50Textile Auxzlliaryr Chemicals 1.52 1.59 0.26 0.316 1.40
Phaceuticals n.a. 1.30 0.19 0.22 n.s.Soap n.a. 1.64 0.53 0.63 n.a.
Glass 1.48 n.a. n.a. 0.10 1.33Ceramic Tableware 4.40 /b 3.23 0.16 0.38 3.80Insulators 1.43 2.68 0.03 0.07 1.40
Cement 2.31 2.0O 0.10 0.1]3 1.51
Avera0
Arithmetic Average 2.71 2.38 0.18 O.'28 2.17
Median 2.00 2.47 0.14 0.25 1.57
/a Based upon approxiLmate C&F price.
/b Based upon dumping C&F price.
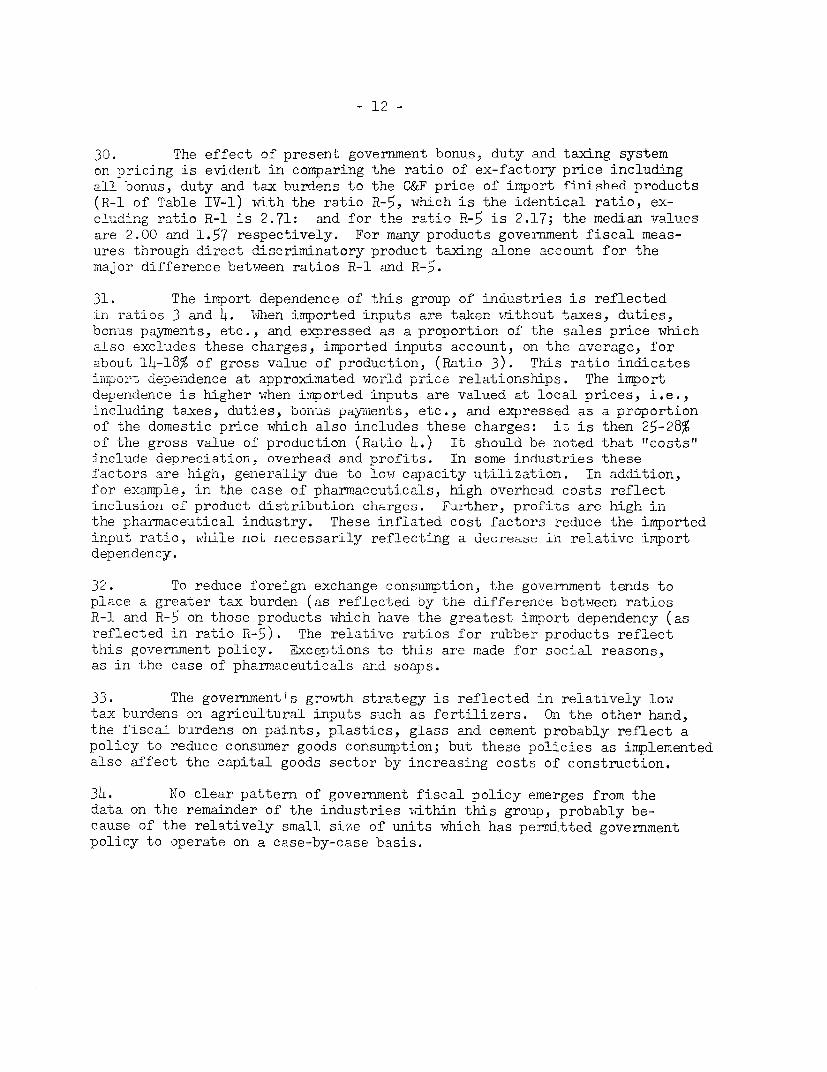
- 12 -
30. The effect of present government honus, duty and taxing systemon pricing is evident in comparing the ratio of ex-factory price includingall bonus, duty and tax burdens to the (ZF price of imnort finished products(R-1 of Table IV-1) with the ratio R-5, which is the identical ratio, ex-ludi r o R-1 i- 21 ad for the ratio R-5 is 2.17; the median values
are 2.00 and 1.57 respectively. For many products government fiscal meas-ures through direct discriminatory product taxing alone acco10+ for' themajor difference between ratios R-1 and R-5.
31. The import dependence of this group of industries is reflectedin ratios 39 and 4. T1en im.Lorte inputs are t-aken wVithout ta xe, duties
bonus payments, etc., and expressed as a proportion of the sales price whicha'so exc'ludes thi'ese cha I"rges, imported inputs accoJu-t, on the a for
about 14-18% of gross value of production, (Ratio 3). This ratio indicatesi'port dependence a' aproiae world prc reainhp.Teiprt
dependence is higher when imported inputs are valued at local prices, i.e.,inccludirng taxes, duties, bonus payimients, etc., and expresseu as a proportionof the domestic price which also includes these charges: it is then 25-28%of the gross value of production (Ratio 4.) It shIo-u ue notleduu thi Lcosts
include depreciation, overhead and profits. In some industries thesefactors are high, generall-y due to low capacity utilization. In addition,for example, in the case of pharmaceuticals, high overhead costs reflectinclusion of product distribution charges. F-urther, profits are high inthe pharmaceutical industry. These inflated cost factors reduce the importedinput ratio, while not necessarily reflectin-g a decrease in relative imrportdependency.
32. To reduce foreign exchange consumption, the government tends toplace a greater tax burden (as reflecteed by the differernce between ratiosR-1 and R-5 on those products which have the greatest import dependency (asreflected in ratio R-5). The relative ratios for rubber products reflectthis government policy. Exceptions to this are made for social reasons,as in the case of pharmaceuticals and soaps.
33. The governmentis growth strategy is reflected in relatively lowtax burdens on agricultural inputs such as fertilizers. On the other hand,the fiscal burdens on paints, plastics, glass and cement probably reflect apolicy to reduce consumer goods consumption; but these policies as implementedalso affect the capital goods sector by increasing costs of construction.
34. No clear pattern of government fiscal policy emerges from thedata on the remainder of the industries within this group, probably be-cause of the relatively small size of units which has permitted governmentpolicy to operate on a case-by-case basis.

CHAPTER V
rA'AorTrV T1TT777A TITOT
'J7LU XIJUL 4. 4L . -.U ± ±LL.1- L~±~ £i
35. An assessment of capacity utilization in 1967 is set ou-t inMTabl1e V1.' A'lthough- tF.1s asesmn is soewa daed -th :-- -. A- -- .le re s- 1 'sar-eILul.L Y1 * ftiLU lU4iJL1 U±LLO CtD-,O[ -U L-- ZVI1MWL1d.U LL.L UZ'I, ull~ -L _ UO J
broadly representative of the present situation. The lack of full capa-ciuy u.tl-liVzation i4n U±the ch'eieiAca.l and.U -LUbber induut -Les r-esults fUom 'lcwL ,cost finished product imports, either through loans and barter agree-
~~~~~~~~~~L - - - - A _ _ _ -- k ____u._n____mentus, from UI1 u11rpn1! b Uy fUortei gnl produce or from teh I proble -
in plant operations. In the case of rubber products, paints and soapE,present restrictionis Un raw material irports dUue to the foreignL excangeshortage are a substantial factor causing insufficient capacity utiliza-tion; in other iidustrLes, the foreign exchange shortage is reflected inmarginal shortages of imported parts, spares, special catalysts, andchleicals. Shortages oT spares ana special catalysts present specialburden in the case of chemical industries. Unlike a failure in an industrycorrmposed of parallel or separated activities, a smali failure in thechemical industry can interrupt a flow process which can shut down anentire plant.
36. The cement capacity utilization during 1967 was 80 percent.These figures are based upon Wes-t Pakistan production where ample naturalgas, gypsum, and limestone are avallable. Also, export promotion assistedin achieving capacity level. The short-fall of fertilizer production wasprimarily due to technical plant problems in the case of nitrates, anc tocompetition with imports through loan agreements in the case of phosphates.Technical difficulties, as well as the previously cited chlorine dispcsalproblems explain the capacity utilization of approximately 50 percent incaustic soda production.
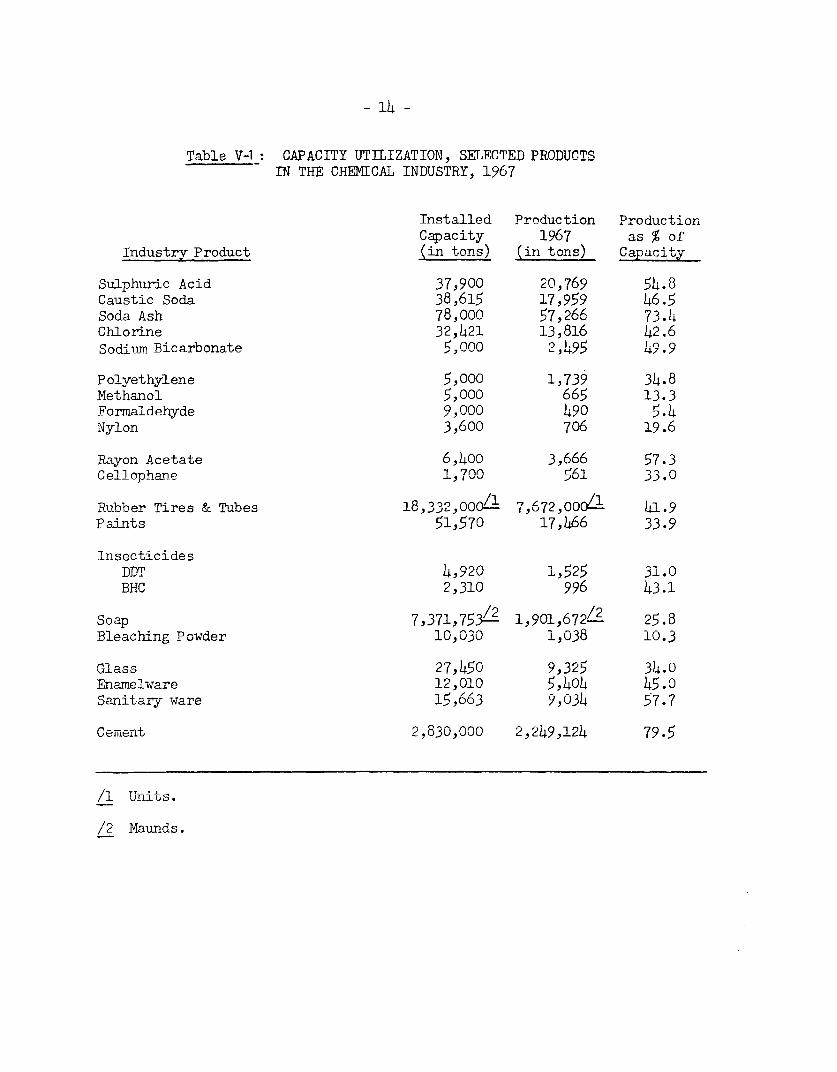
- 14 -
Table V-1 CAPACITY UTILIZATION. SELECTED P7RODUCTSIN THE CHEMICAL INDUSTRY, 1967
Installed Production. Prod--c-onCapacity 1967 as % of
Industrv Product (i-7 tons) (in tons) Capacity
SulDphuric Acid 37,900 20,769 514.8Caustic Soda 38,615 17,959 46.5Soda Ash 78jOo0 57,266 73.14Chlorine 32,421 13,816 142.6S_c7.i nm Bicarbonate 5,0n0 2,L95 4979
Polyethvlene 5,000 17'O 34.8Methanol 5,000 665 13.3Formaldehyde 9,000 1490 5.14Nylon 3,600 706 19.6
Rayon Acetate 6,400 3,666 57.3Cellophane 1,700 561 33,0
Rulbber Tires & Tubes 18,3, f /1 7 1.9Paints 51,570 17,466 33.9
InsecticidesDDT 4,920 1,525 31.0BHC 2,310 996 43.1
Soap 7,371,753/2 1,901,672L2 25.8Bleachning Powder 10,030 1,038 10.3
Glass 27,1450 9,325 34.0Enamelware 12,010 5,404 45.0Sanitar-y ware 15,663 9,034 57.7
Cement 2,830,000 2,249,124 79.5
/1 Uni's.
/2 r'aunds.
CHAPT'ER VI
SUGGESTIONS FOR THE FUTURE
37. Government poLicy and economies of scale are the dominant con-siderations in the appraisal of the petrochemical, inorganic chemical,nonmetallic minerals, pharmaceuticals, and rubber products industries.
38. Specific government decisions have directed the development ofthe fertilizer, pharmaceutical, and cement industries; and these industrieshave a sclid basis for future growth. The development of the remainderof the industries winthin thls sector has been on an ad hoc basis, primarilythrough short term response to critical situations in supply of rawmatYrials and finished products and to fiscal requlirements. Tn somecases, government policies have been issued from different agencies,often uncoordinated and sometime,s conflicting. This A hoc nnlicv, withnoted impcTortant exceptions, has inevitably led to less than optimum re-surlts. If the sector is to develop, a more systematic policy f'or -roro-tion of growth must be developed.
39. The chemical industry, in the same way as manufacturing ingeneral, has developed uander specilal circulmstances, prompted by the needto contrcl demand for foreign exchange. However, even when at some fuituredate the exchange rate system is simplified, it will still be necessa:y toformulate a general policy of protection for the chemical industries. Infor mating such a policy, lt rust be taken lnto account that most chemicalsserve as inputs into other industries and that consequently, the policy onprot.e ct uUion U w±v.LIl inf Luence tUh ue entire cos5L s'U.aLuLure - In tUii±s contet,_u itmust be recognized that the ecoinomies of large scale production are partic-u.larly significant in the flow process chemical ind-ustries. In addition, abalanced market demand is needed to absorb all of the products result:ingfrom the chemical process. Imbalances in demand, such as the previouslyillustrated case of caustic soda and chlorine, can adversely affect theindustries! efficiency. Thus, scale arld balarnced dermand are major factorsaffecting the economics of the chemical industry. Future growth of chemi-cals sho-ld be plannued in- order to min-mize difficulties arising from thesecharacteristics and protection, in whatever form, should only be extendedwhere it -will clearly complement the strategy for industrial developmentin general. The corollary of such a selective approach may be that certainexisting activities will have to be left to compete on their own merlts.
140. A special problem from which the chemical industry has sufferedfrequently in recent years concerns foreign dumping in competition withotl-leIlwise efficient local manufacturing. Protection against these prAc-tices is clearly justified, particularly for infant industries and thoseindustries having little or no import-based raw material requirement.A particularly efficient manufacturer of electrical insulators has, withforeign assistance, succeeded in workinig out the technical problems, whichshould allow local clay to substitute for imported clays. F'urtherdevelopment in this area could be advexsely affected by dumping. Total banning is

- 16 -
not necessarily required, but effective and flexible protection throughtariff duties would seem appropriate.
41. More specifically, pricing and protection policy should beestablished and clearly defined for the entire period of the Fourth Planwhenever feasible. The principle to be applied should be the developmentof a chemical sector which only requires limited protection or subsidiesof, say, 10 to 20% based on an exchange rate which adequately reflectsthe relationship of prices and costs in the Pakistani industry and in theindustry abroad. In addition, given the present state of the industry,an interim period should be set to allow for plant adjustments to the newmarket conditions before this new long-run strategy is invoked. Thispolicy might be developed according to the following steps:
(a) Establishing an effective exchange rate for importingall chemicals -- basic, intermediate, and finished pro-ducts -- and fixing this rate for the entire Fourth Planperiod. For example, applying the cash-cum-bonus rateto all chemicals without exception.
(b) Assigning to government technicians the task of analvsisand establishment of a clear understanding of the cost oflocally rai;S)factured basic inorganic chemicals (specif-ically, soda ash, caustic soda, hydrochloric acid, sulfuricacid, and sodium sulfate and sulfite).
(c) Examine the merits of establishing a chemical nrici ngboard composed of producers and consumers of basic chemi-cals. The function of the board would be to arrive Pt. asuggested market price for the locally produced basicchemincals on an arhitrated hasis acceptable to both pro-ducers and consumers of the chemicals. These suggestionswould be reviewed by the government in the light of findingsof the industry cost study, suggested under (b) above, andthe over.nmen-t would then decide ,on thne required deg5Arce ofP
protection.
(d) The protection so determined would be reduced progressivelyover t1he Fo-urth Pl Dan -;- order to acev th 1- percentover C&F cost.
(e) Minimizing the effects of dumping by direct governmentact iLon. 'or exaplLjle, Ira14din UUIjJl4-iU-_ U.I Tf PaLkist[1
(T.C.P.) might be granted the free import monopoly on theselected basic cheiucals duriLg the Fo-urth Plan period,subject to their pricing for final market sales in accordwit h the price set by- the chemi-cal price board, as approvedby the government. Alternatively, a system of counter-vailing duties could be established.
42. with respect to petrochemicals, the Iviission understands thatfollowing extensive preliminary investigations, a special study has nowbeen comuissioned to examine the inter-industry and inter-sectoral demandfor basic chemicals and the market projections for natural gas and naphthabased synthetics as a basis for planning in the chemical sector. Preliminary
- 17 -
estimates of local market conditions indicate the following -phaseddevelopment pattern with respect to the synthetics industry in Pakist<wn:
(a) Encouraging the imports of intermediary chemicals inorder to build up the local market for synthetic goods.This action would be particularly necessary to sub-stitute reinforced plastics for metals in construction.and plastic fitting and tubing in water distribution.IJ' the government shoni (1 wish to avoid the creation ofexcessive demand for the consumer based industry, excisetaxes could be levied9 on synth.tic. con s1mpr goods overan interim period.
(b) Encouraging local manufacture when domestic marketr3m.anni rec-hes: mniniimam. Iecvels &o I nTArnog fo-rv e'-nnomi -c
production of the intermediaries. At that time, follow-gt +bca mor't'-i4-A+r& rorltm +Ah ,sohl; oF- 1 l4--,-A;tP¾ws1
S_t.4 fl. 4 rua U V .LA.>V | I:JIUJJ1 U) UJ4.¼. H' 0 h-LUJZ-'- J. V 1 >tJJ..r
capacity in excess of demand should be analyzed. (Time-capacity e^ ansion models and techniques used in thepetrochemical field can facilitate analysis.) The trade-o 4'f- b etween econories of sc-'e and cap4`al os nefJ.LL u Lu~± VUP±LitiLL~ UI C" dLu _dLU -L. LIUD U LUUUt.L
increasing market conditions should be examined. Thepossiblity forU eVpuX±iiLg these lnte±-1Ieul±d.s u as wellaS) their final products should also be analyzed, takingirito dULAJWIt that comlpetition froml major petrochemticalproducing countries in the Near East could be serious,paErticualarly- if these countries resort to miiarginal cos-pricing.
(c) Locating the producing facilities in a manner which wouldavoid duplication between West and East Pakistan. Natuiralgas in East Pakistan is richer in methane and its heat:Lngvalue is higher than in west Pakistan; both have a low ethaneand propane content. Gas in both regions is suitable :forlarge-scale use in fertilizer production; in addition, gasin East Pakistan, since it is cheaper in real terms, canbe used to produce acetylene for making vinyl c'loride andrelated products. The analyses made so far suggest thatpetrochemicals in West Pakistan should be based on naphthaas a by-product of petroleum refineries; the compositionof output should not include products which could be pro-duced cheaper in East Pakistan. The liquefaction of gas forexports should also be considered.
43. The pricing of natural gas is currently under review and thisreview should consider the benefits of marginal cost pricing policies topetrochemical industry, which uses gas as a feedstock in its productionprocess (see Annex I.).

- 18 -
44. In its fertilizer policy, the government presently gives asubsidy to stimulate its use. The subsidy enables the farmers to obtainfertilizer at a price competitive with imports at the official rate ofexchange; since some of the key agricultural products are sold at pricesequivalent to world market prices at the official rate, the effectivesubsidy is limited (see Annex II).
45. The subsidy has to be applied mainly to the sales from the RPand WP PIDC plants, although some price equalizations of imported fertilizerfrom different sources also has to be made. In the case of the PTDfltq thesunk cost of the plants really make the subsidy of the fertilizer a book-keeping entry offsetting depreciation. New private sector nroiects will notbe eligible since their prices are expected to be reasonably competitive atthe official exchange rate.
6. DeTand nroiections for fertilizers during the Fniirth Plan periodvary substantially but a consensus is emerging that construction of a thirdprivate sector uirea plant couild be justifi er i-ri ng the Fr Pln. Thereis also agreement that production capacity for mixed and phosphatic fertil-izer is becoming urt-nt and prioritv is exnented t.o hb ivpn to suchinvestment.

ANNEX
Natural Gas Pricing Policy
1. Natural gas pricing policy is based upon BTU value at well-hlead,and return on investment after the gas is distributed. The well-headprice, approximately .50 Rs. in East Pakistan and .65 Rs. in West Pakistanper MCF, compares favorably with contracted well-head prices through theworld. The cost of distribution and the pricing policy for distributed gasare currently under review by the central government but hitherto in g7enzaeralbulk users have paid a minimum of 1.20 Rs. in East Pakistan and 1.60 'is. inWest Pakistan per MCF although contracts are subject to negotiation. Theseprices will be increased by the new excise tax of Rs.0.40 per MCF at thewell-head.
2. In the petrochemical complex based on natural gas, now under con-sideration in East Pakistan, the ap-proximate contribution of gas is e.3timatedat eight percent of annrual recurring costs and five percent of total costs,based upon a .50 Rs. per MCF gas price at well-head. The contribution ofgas to the total price of ferti'lizer to be produced at the new Da-ood-Herculesplant is estimated at under .60 Rs. per ton of finished product based upona 1.77/MCF cost of distributed gas. The cost of gas is between five andfifteen percent of the finished product prices. These examples indicatethat gas pricing policies at present gas price levels although not the singlekey factor in costs, are a significant one. This importance is best appre-ciated when the finished products are planned to compete internationally.Due to the keenness of international competition, a few percentage pointscan be critical. Local consumption of finished goods can absorb pricefluctuations under protected markets, but due to the price elasticity ofplastics and synthetics, the demand will be affected. This effect isimportant where azlarge price differential is needed between plastics andmetals to produce substitution of plastic for metal products on a significantscale.
3. Natural gas pricing policy for the development of the petro-chemical industry is presently under review and the Mission would emphasizethe need for the analysis of new petrochemical industries to consider theeconomic sensitivity of project profitability to alternate prices of gasbecause it is through pricing of gas that the national comparative advantageof having gas can be adeauately reflected in investment decisions and inthe attraction of additional capital. It is in this context that the effectand the possibility of marginal cost pricing of gas should be examined.

A 7,TV TT
Page 1
Development of the Fertilizer Industry in Pakistan
A. Production Growth
1. The development of the fertilizer industry in Pakistan begain in the1950's. This was prior to advances in production techniques which havereduced costs in large--scale plants. Therefore, some of the opera.tingferti.LJzer production 1i,iits in Pakistan are relatively small and high-costcompared to modern plants. The new large ammoniifm sulphate plant at Yl.riis a noted exception. Plants now being planned and erected incorporatemodern technologies an,d are of a scale whi.ch peraits production at costsocinpar'abIe to international levels. Prior to the Mari plant, fertilizerwa3 -rodaced or'y by the nublic sector. High initial capital cost, l1r'gperiods of time for capital recovery, market uncertain-ies, and lack OItechtaical know-how contributed to the private sector reluctance to enterthe Iertilizer field.
2. The 2initial develop.-nent of the fertilizer industry by the publicsector provided a base for training and understanding of complex chemicalmaniufacturing. The small-scale plant development has been the character:.sticof the irLitial development of the fertilizer and chemical industry ingeneral. It is anticipated that; this experience will not be repeated ilthe development of fTture chemi.cal complexes.
3. Recent development of fertilizers in Wbst Pakistan has been inthe private sector. The E3so plant at Mari began operation in 1968 witha 173,00(0-ton per annum capacitv of urea. The Dawood-Hercules plant, nowurnder construction near Lahore will have a 340, 000 ton per annum capacity ofurea. Construction on the Jaffers Brothers nlant near Karachi with ananticipated production of 150,000 tons of T.S.P. per annum is planned tobegin soon. Two additional nrivate sector plants with oombin d nrodi1tJoncapacity of 680,000 tons of urea per annum have been sanctioned but phasingof implermentation and financing are still under discussion.
4. In East; Pakistan, a 3L0.000 ton per annum urea plant for EP'EDC isunder construction and another urea p:Lant of equal capacity has been sanctionedwithin the private sector. In addition; EPTDG nlans two T.S.P. plants atChittagong; one plant with a capacity of 32,000 tons per annum has recentlybeen completed and the second of 120,000 tons annual capacity is underconstruction.
B. Marketing
5. The marketing of fertilizer was carried out by rural and agricul-tural ext,ension services prior to 1964-65 in both East anrd West Paddstan.After 1964-65 in West Pakistan, the sale of fertilizer was given to p:civatedealers, but overall fertilizer shortages caused the public sector agencieSto resume marketing functions. Recently, the private sector is resuMingthe marketing of 50 per.cent of locally produced fertilizers in West P.akistan.
ANNEX IIPIage c
C. Cost of Production
6. The cost of production at the early public sectors plants ishigher than that of comaparable imports at the official exchange rate. Forexample, the cost of one ton of bagged urea at the WPIDC Multan FertilizerFactory is Rs.735 (US$1541), w,hereas the C & F price of the same fertilizeris about US$90-l10 per ton, depending on the source and shipping vessel (aratio of 1.4 times CIF import price at the official exchange rate). However,the market price of urea produced in new plants such as that of Dawood-Hercules presen'tly under construction is expected to be at par with theimported product, even at the official exchange rate.
7. Table IIA-1 compares the cost of production of the Multan plantof WrCUC and the Dawood-Hercules plant, given the following assumptions:
(a) Actual cost of production and ex-factory sales pricecalculated with existing excise duty on natural gas aswell as duty on imported spare parts and chemicals, etc.The import of spares is on cash cum bonus (Col. 1);
(b) Cost of production if spares, etc., were imported on cashbasis, and no duties and excise taxes were levied on gas(Col. 2);
(c) Cost of production if spares, etc., are imported on cashcum bonus but without duty. The depreciation is chargedat cash cum bonus rate. The rupee cost thus obtained isconverted to dollars by dividing by the cash-cum-bonusvalue of the dollar, i.e., Rs.9. No duties or excisetaxes are charged on gas (Col. 3).
8. This table shows that if a cash-cum-bonus value is assigned tothe rupee, the cost of production of urea in the Multan Plant would beUS$91.14 per ton, which is lower than the C&F price of urea. The comparablecost of urea from the large Dawood-Hercules plant will be $64.44, which isvery competitive compared to international price.
D. N:P Ratio
9. The farmers' lack of familiarity with the value of phosphate as afertilizer is the main cause of the present imbalance in the use of nitro-genous and P203 fertilizers. The government is now promoting more balancedfertilizer use. The present ratio of N:P:K use is 18:1:0 in West Pakistan.However, to sustain crop yields, this ratio should lie between 2:1 or 3:1.
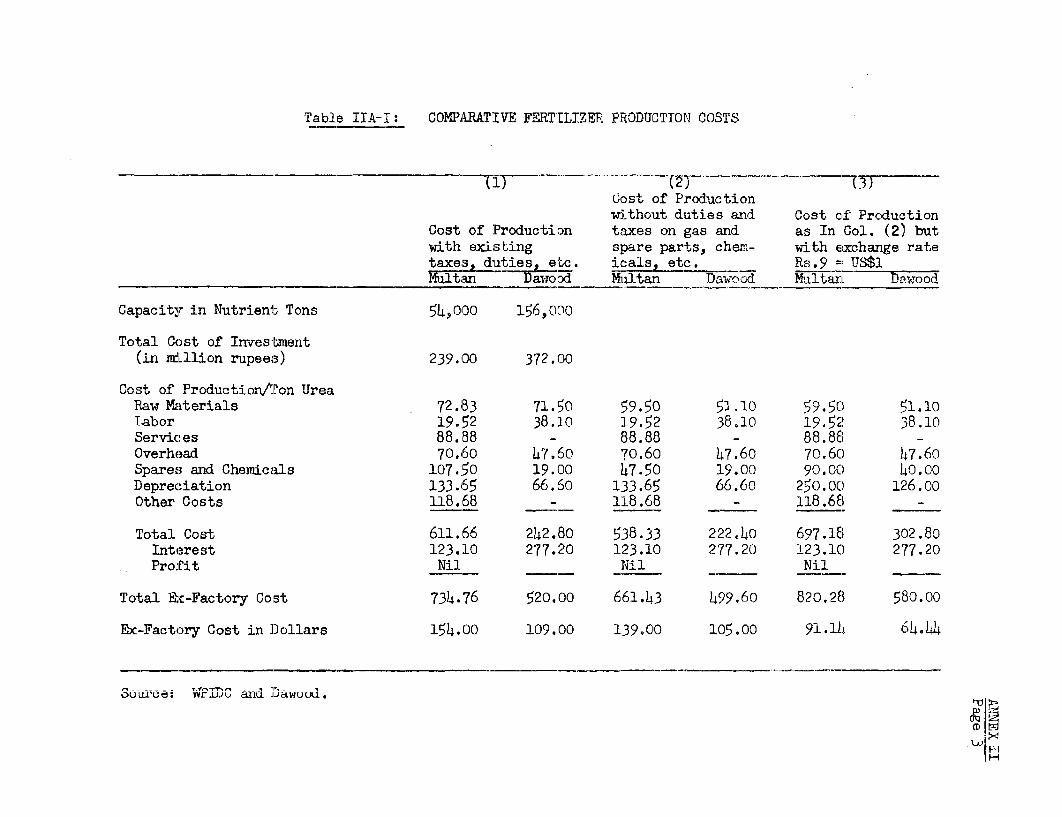
Table IIA-I:_ COMPARATIVE FERTILIZER PRODUCTION COSTS
Cost of Productionwithout duties and Cost of Production
Cost of Production taxes on gas and as In Col. (2) but;with existing spare parts, cher..- with E¢ehange ratetaxes. duties etc. icals. etc. Rs.9 = US$1
IMultan i7awod Multan Daw-ood Multan DaToodL
Capacity in Nutrient ToIns 54,000 156 ,0o0
Total Cost of Inives-tmen'b(in miLllion rupees) 239 .00 372.00
Cost of Product-ior/Ton UreaRaw Materials 72.133 71.50 59.5C) 51.10 59.50 ';l.loLabor 19.52 38.10 19.52 38,10 19.52 38.10Services 88. 98 - 88.88 - 8c8. 88rlOverhead 70.60 47.60 70.60 47.60 70.6C) 47.60)Spares and Chemicals 107.150 19.00 47.50 19.00 590.0C) 40. 00Depreciation 133.$55 66.60 133.65 66.60 25'0.oc) 126.0c)Other Costs :118.68 - 118.68 - 118.68 _
Total Cost 611.66 242.80 538.33 222.4O 697.18 302.80Interesit 123.10 277.20 123.10 277.20 123.10 277.2()Prof'it Nil Nil Nil
Total Ek-Factory Cost 734.76 520.00 661.43 4599.60 820.28 580.00
Ex-Factory Cost in Dollars 154.00 109.00 139C00 105.C00 C9l.l l 64-414
OoCP r%.FLU .i UlU Dj-avuu

ANNEX IIPage4
E. Subsidy on Fertilizers
.0O Indigenously produced fertilizers have a market price to the con-sunmer at Par with foreign fertiiizers, which are imported at the cash rate(Rs.4,76/U,tS$1) free of duties and taxes. All imports are handled bygovernment wnich makes available supplies to private distributors. As theprice of imported fertilizer can vary between different sources of supply-the government absorbs the cost of price equalization. In addition, thegovernment pays the fertilizer producer an amount equal to the differencebetween this market price, pegged at par with imports, and cost of localproduction. This payment to the local fertilizer industry can be considereda subsidy to local fertilizer manufacturing. Agriculture's basic cash crops,cotton and jute, are exported at the official exchange rate without anyexport incen1tives, and local market prices of cotton and jute reflect theinternational prices for these commodities in rupees at the official exchangerate. Since the prices for the basic inputs to agriculture, i.e., fertilizers,are zadljusted to be at par with international prices at the official exchangerate, the net effect is that agriculture buys its inputs and sells some ofits outruts essentially at world market prices.
11. It is possible that a subsidy which provides fertilizers to agri-calture at a cost lower than the C & F cost could provide sufficient incentiveto use more fertilizers, thereby resulting in increased output. If themarginal cost of the increased subsidy is less than the value of the increasedoutl., this policy should be considered: theoretically, marginal costanalyses suggest that the subsidy should be increased until the marginalincrease in production equals the marginal increase in subsidy. However,there may also arise the budgetary problem, resulting from higher subsidywhich may or may not be offset by increased tax proceeds from higher agri-cultural income. This is a subject which falls more strictly within thepurview of agricultural policy and the Mission understood that such policyis under review for the Fourth ?' i
12. The use of the phosphatic fertilizers is very much below thedesired level, but while it is easy to repair the damage done to soils dueto depletion of nitrogen, the phosphorous deficiency once having occurred,is not easily rectified. The government is fully aware of this problem andproposals to remedy this situation may require a review of subsidy policyfor both farmers and producers.
F. Demand Projections for the Fourth Plan
13. Various agencies haste prepared demand projections for the FourthPlan period (see Table IIA-2. There is a substantial variation in all theseestimates. The Provincial Planning Departments anticipate the followingproduction (in terms of nutrients) from present industry capacity:

ANNEX IPaee 'F
(In Thousand Tons)Producti-nn
East Pakistan West Paidistan.
197;V-197:1 1 1c 5 - 143 101971-1972 193 57- 145 101972-1973 20R 65 - 259 101973-1974 208 71 3525 41974 -l975 208 71 - 2o1 Xv"
Total 67 279 1,323 2.32
14. Coa arlson of the production project ons *"it 1"' Gil esti",teswill Jindicate the total deficits of fertiTlizer nutrients. New fertilizerplants c.a. be plan4ed to meet this deficit. A'tern.atively, these defic:itscould be n.et by :imports. Importing these nutrients would cost $540 million-1^r fore-Ig, -ch-e, an appro-dia,ted cost- 04 20 per ton. of :Tatr-en'- -5"~ '. ~ ~ .u5 H .AIA d.L U.UU u J1 YPc-uU Jv L IILU. U~
during the five-year period, based upon the PIDC fertilizer demand projet-tions.
15. Thbe pl,;..irg of uDauro Jinves' n'rls ir. rer,ilizer plai'ts l: bL =J.LL± U.L inLLU.t urVt-LeiLu, Ui f2 U.".±/-. pLdL1b W.".L. DU~
based upon denduxl estimates, but since they differ, the position will haveto be clarified before the investment program is LIrmed up. II in the con-text of the future overall investment program it is decided that small high-cost prodluction plants are to be phased out of operation, it may be con-sidered that they be used as a source of a buffer stock Lutil the market forfertilizer becormes more predictable.
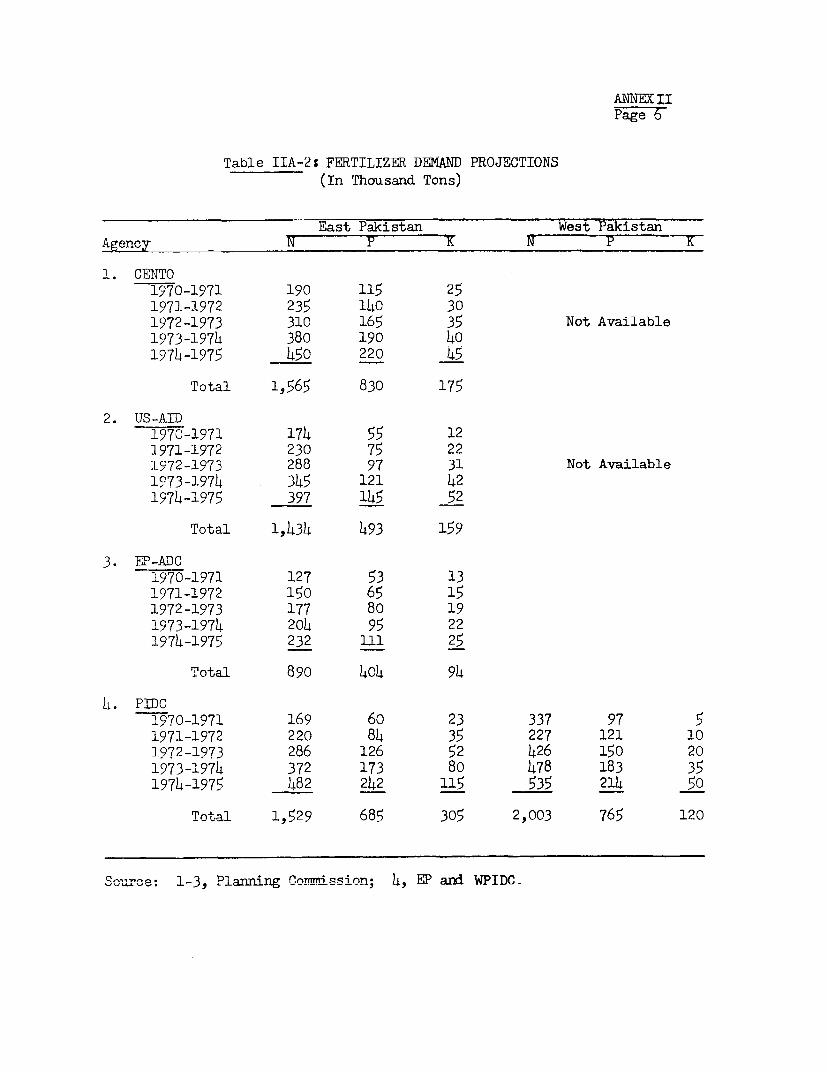
ANiM IIPage 6
Table IIA-2: FERTILIZER DEMAND PROJECTIONS(In Thousand Tons)
East Pakistan West Pakistan
1. CENTO1970-1971 190 115 251971-1972 235 140 301972-1973 310 165 35 Not Available1973-1974 380 190 401974-1975 450 220 45
Total 1,565 830 175
2. US-AID1970-1971 174 55 121971-1972 230 75 221972-1973 288 97 31 Not Available
1973-1974 345 121 421974-1975 397 145 52
Total 1,434 493 159
3. EP-ADC1970-1971 127 53 131971-1972 150 65 151972-1973 177 80 191973-197L 204 95 221974-1975 232 111 25
Total 890 404 94
4. PDC1970-1971 169 60 23 337 97 51971-1972 220 84 35 227 121 101972-1973 286 126 52 426 150 201973-1974 372 173 80 478 183 35197)t-1975 h82 2h2 115 535 214 50
Total 1;529 685 305 2.003 765 120
Souce: 1=3, Planning Cor.nission; Ifi. EP and WPIDC.