Humanized Foxp2 accelerates learning by enhancing transitions from declarative to procedural...
63
Humanized Foxp2 accelerates learning by enhancing transitions from declarative to procedural performance Christiane Schreiweis a,b,1 , Ulrich Bornschein b,1 , Eric Burguière a,c , Cemil Kerimoglu b,d , Sven Schreiter b,e , Michael Dannemann b , Shubhi Goyal a , Ellis Rea f , Catherine A. French g,h , Rathi Puliyadi h , Matthias Groszer i , Simon E. Fisher j,k , Roger Mundry l , Christine Winter f , Wulf Hevers b , Svante Pääbo b,2 , Wolfgang Enard b,d,2,3 , and Ann M. Graybiel a,2,3 a McGovern Institute for Brain Research and Department of Brain and Cognitive Sciences, Massachusetts Institute of Technology, Cambridge, MA 02139; b Department of Evolutionary Genetics, Max Planck Institute for Evolutionary Anthropology, 04103 Leipzig, Germany; c Institut National de la Santé et de la Recherche Médicale U 1127, Centre National de Recherche Scientifique Unité Mixte de Recherche 7225, Sorbonne Universités, Université Pierre et Marie Curie, Université Paris 06 Unité Mixte de Recherche S 1127, Institut du Cerveau et de la Moelle épinière, F-75013 Paris, France; d Laboratory of Anthropology and Human Genetics, Department of Biology II, Ludwig-Maximilians University Munich, 82152 Martinsried, Germany; e DFG Research Center for Regenerative Therapies, Technical University Dresden, 01307 Dresden, Germany; f Department of Psychiatry and Psychotherapy, Faculty of Medicine Carl Gustav Carus, Technical University Dresden, 01187 Dresden, Germany; g Champalimaud Neuroscience Programme, Champalimaud Centre for the Unknown, 1400-038 Lisbon, Portugal; h Wellcome Trust Centre for Human Genetics, University of Oxford, Oxford OX3 7BN, United Kingdom; i Institut du Fer à Moulin, Institut National de la Santé et de la Recherche Médicale, Unité Mixte de Recherche S839, Université Pierre et Marie Curie, 75005 Paris, France; j Department of Language and Genetics, Max Planck Institute for Psycholinguistics, 6525 XD, Nijmegen, The Netherlands; k Donders Institute for Brain, Cognition and Behaviour, Radboud University, 6525 EN, Nijmegen, The Netherlands; and l Departments of Developmental and Comparative Psychology and Primatology, Max Planck Institute for Evolutionary Anthropology, 04103 Leipzig, Germany Contributed by Svante Pääbo, August 6, 2014 (sent for review April 29, 2014) The acquisition of language and speech is uniquely human, but how genetic changes might have adapted the nervous system to this capacity is not well understood. Two human-specific amino acid substitutions in the transcription factor forkhead box P2 (FOXP2) are outstanding mechanistic candidates, as they could have been positively selected during human evolution and as FOXP2 is the sole gene to date firmly linked to speech and lan- guage development. When these two substitutions are introduced into the endogenous Foxp2 gene of mice (Foxp2 hum ), cortico-basal ganglia circuits are specifically affected. Here we demonstrate marked effects of this humanization of Foxp2 on learning and striatal neuro- plasticity. Foxp2 hum/hum mice learn stimulus–response associations faster than their WT littermates in situations in which declarative (i.e., place-based) and procedural (i.e., response-based) forms of learn- ing could compete during transitions toward proceduralization of action sequences. Striatal districts known to be differently related to these two modes of learning are affected differently in the Foxp2 hum/hum mice, as judged by measures of dopamine levels, gene expression patterns, and synaptic plasticity, including an NMDA receptor-dependent form of long-term depression. These findings raise the possibility that the humanized Foxp2 phenotype reflects a different tuning of corticostriatal systems involved in declarative and procedural learning, a capacity potentially contributing to adapting the human brain for speech and language acquisition. dorsomedial striatum | dorsolateral striatum | T-maze | cross maze | learning strategy T he gene encoding the transcription factor forkhead box P2 (FOXP2) is a promising candidate for investigating the evolutionary basis of human speech and language capabilities. Humans carrying only one functional copy of this transcription factor experience difficulties in learning and performing complex orofacial movements and have receptive and expressive deficits in oral and written language, whereas other cognitive skills are less affected. These speech and language deficits are associated with functional impairments in cortico-basal ganglia and cortico- cerebellar circuits (1). Since the time that the human and chim- panzee lineages separated, approximately 6 Mya, two amino acid substitutions have occurred in FOXP2, a higher rate of change than expected given its conservation in mammals (2, 3). Mice in which the endogenous Foxp2 gene has been “humanized” for these two amino acid changes (Foxp2 hum/hum mice) exhibit prominent neurochemical, neurophysiological, and neuroanat- omical alterations in the striatum and related cortico-basal ganglia circuits (4, 5). These circuits are known to be essential for ac- quiring habits and other motor and cognitive behaviors (6), in- cluding vocal learning in songbirds (7) and speech and language capabilities in humans (8). However, whether learning behavior depending on these circuits is affected in Foxp2 hum/hum mice has so far not been investigated. A key functional distinction has been made between sub- regions of the striatum that underlie modes of learning also considered to be crucial for speech and language development and performance: declarative learning and procedural learning (9–12). These learning modes were first distinguished in human cognitive studies to differentiate between a conscious form of Significance The human form of forkhead box P2 (FOXP2) is the leading genetic candidate for human speech and language proficiency. We demonstrate that the introduction of the amino acid changes that occurred during human evolution into murine Foxp2 (Foxp2 hum ) profoundly affects learning and striatal neuroplasticity. Foxp2 hum/hum mice learn stimulus–response associations more rapidly than WT mice when declarative (i.e., place-based) and procedural (i.e., response-based) forms of learning could interfere with one another. Dopamine levels, gene expression patterns, and synaptic physiology are oppo- sitely affected in the striatal districts underpinning these learning forms, paralleling the behavioral change. We hy- pothesize that the human FOXP2 evolution led to differential tuning of corticostriatal systems involved in declarative and procedural learning and thus contributed to adapting the hu- man brain for speech and language acquisition. Author contributions: C.S., E.B., M.G., C.W., W.H., W.E., and A.M.G. designed research; C.S., U.B., S.S., S.G., E.R., C.A.F., R.P., and W.H. performed research; C.S., U.B., E.B., C.K., M.D., R.M., C.W., W.H., W.E., and A.M.G. analyzed data; C.S., U.B., E.B., S.E.F., R.M., W.H., S.P., W.E., and A.M.G. wrote the paper; and E.B., M.G., S.E.F., R.M., W.H., S.P., and A.M.G. supervised research. The authors declare no conflict of interest. Database deposition: Sequences have been deposited in the Gene Expression Omnibus (GEO), (accession no. GSE60659). 1 C.S. and U.B. contributed equally to this work. 2 To whom correspondence may be addressed. Email: [email protected], enard@ bio.lmu.de, or [email protected]. 3 W.E. and A.M.G. contributed equally to this work. This article contains supporting information online at www.pnas.org/lookup/suppl/doi:10. 1073/pnas.1414542111/-/DCSupplemental. www.pnas.org/cgi/doi/10.1073/pnas.1414542111 PNAS Early Edition | 1 of 6 NEUROSCIENCE
-
Upload
sorbonne-fr -
Category
Documents
-
view
0 -
download
0
Transcript of Humanized Foxp2 accelerates learning by enhancing transitions from declarative to procedural...

Humanized Foxp2 accelerates learning by enhancingtransitions from declarative to procedural performanceChristiane Schreiweisa,b,1, Ulrich Bornscheinb,1, Eric Burguièrea,c, Cemil Kerimoglub,d, Sven Schreiterb,e,Michael Dannemannb, Shubhi Goyala, Ellis Reaf, Catherine A. Frenchg,h, Rathi Puliyadih, Matthias Groszeri,Simon E. Fisherj,k, Roger Mundryl, Christine Winterf, Wulf Heversb, Svante Pääbob,2, Wolfgang Enardb,d,2,3,and Ann M. Graybiela,2,3
aMcGovern Institute for Brain Research and Department of Brain and Cognitive Sciences, Massachusetts Institute of Technology, Cambridge, MA 02139;bDepartment of Evolutionary Genetics, Max Planck Institute for Evolutionary Anthropology, 04103 Leipzig, Germany; cInstitut National de la Santé et de laRecherche Médicale U 1127, Centre National de Recherche Scientifique Unité Mixte de Recherche 7225, Sorbonne Universités, Université Pierre et Marie Curie,Université Paris 06 Unité Mixte de Recherche S 1127, Institut du Cerveau et de la Moelle épinière, F-75013 Paris, France; dLaboratory of Anthropology andHuman Genetics, Department of Biology II, Ludwig-Maximilians University Munich, 82152 Martinsried, Germany; eDFG Research Center for RegenerativeTherapies, Technical University Dresden, 01307 Dresden, Germany; fDepartment of Psychiatry and Psychotherapy, Faculty of Medicine Carl Gustav Carus,Technical University Dresden, 01187 Dresden, Germany; gChampalimaud Neuroscience Programme, Champalimaud Centre for the Unknown, 1400-038 Lisbon,Portugal; hWellcome Trust Centre for Human Genetics, University of Oxford, Oxford OX3 7BN, United Kingdom; iInstitut du Fer à Moulin, Institut National dela Santé et de la Recherche Médicale, Unité Mixte de Recherche S839, Université Pierre et Marie Curie, 75005 Paris, France; jDepartment of Language andGenetics, Max Planck Institute for Psycholinguistics, 6525 XD, Nijmegen, The Netherlands; kDonders Institute for Brain, Cognition and Behaviour, RadboudUniversity, 6525 EN, Nijmegen, The Netherlands; and lDepartments of Developmental and Comparative Psychology and Primatology, Max Planck Institute forEvolutionary Anthropology, 04103 Leipzig, Germany
Contributed by Svante Pääbo, August 6, 2014 (sent for review April 29, 2014)
The acquisition of language and speech is uniquely human, buthow genetic changes might have adapted the nervous system tothis capacity is not well understood. Two human-specific aminoacid substitutions in the transcription factor forkhead box P2(FOXP2) are outstanding mechanistic candidates, as they couldhave been positively selected during human evolution and asFOXP2 is the sole gene to date firmly linked to speech and lan-guage development. When these two substitutions are introducedinto the endogenous Foxp2 gene of mice (Foxp2hum), cortico-basalganglia circuits are specifically affected. Herewe demonstratemarkedeffects of this humanization of Foxp2 on learning and striatal neuro-plasticity. Foxp2hum/hum mice learn stimulus–response associationsfaster than their WT littermates in situations in which declarative(i.e., place-based) and procedural (i.e., response-based) forms of learn-ing could compete during transitions toward proceduralization ofaction sequences. Striatal districts known to be differently relatedto these two modes of learning are affected differently in theFoxp2hum/hum mice, as judged bymeasures of dopamine levels, geneexpression patterns, and synaptic plasticity, including an NMDAreceptor-dependent form of long-term depression. These findingsraise the possibility that the humanized Foxp2 phenotype reflectsa different tuning of corticostriatal systems involved in declarativeand procedural learning, a capacity potentially contributing toadapting the human brain for speech and language acquisition.
dorsomedial striatum | dorsolateral striatum | T-maze | cross maze |learning strategy
The gene encoding the transcription factor forkhead box P2(FOXP2) is a promising candidate for investigating the
evolutionary basis of human speech and language capabilities.Humans carrying only one functional copy of this transcriptionfactor experience difficulties in learning and performing complexorofacial movements and have receptive and expressive deficitsin oral and written language, whereas other cognitive skills areless affected. These speech and language deficits are associatedwith functional impairments in cortico-basal ganglia and cortico-cerebellar circuits (1). Since the time that the human and chim-panzee lineages separated, approximately 6 Mya, two amino acidsubstitutions have occurred in FOXP2, a higher rate of changethan expected given its conservation in mammals (2, 3). Micein which the endogenous Foxp2 gene has been “humanized”for these two amino acid changes (Foxp2hum/hum mice) exhibitprominent neurochemical, neurophysiological, and neuroanat-omical alterations in the striatum and related cortico-basal ganglia
circuits (4, 5). These circuits are known to be essential for ac-quiring habits and other motor and cognitive behaviors (6), in-cluding vocal learning in songbirds (7) and speech and languagecapabilities in humans (8). However, whether learning behaviordepending on these circuits is affected in Foxp2hum/hum mice has sofar not been investigated.A key functional distinction has been made between sub-
regions of the striatum that underlie modes of learning alsoconsidered to be crucial for speech and language developmentand performance: declarative learning and procedural learning(9–12). These learning modes were first distinguished in humancognitive studies to differentiate between a conscious form of
Significance
The human form of forkhead box P2 (FOXP2) is the leadinggenetic candidate for human speech and language proficiency.We demonstrate that the introduction of the amino acidchanges that occurred during human evolution into murineFoxp2 (Foxp2hum) profoundly affects learning and striatalneuroplasticity. Foxp2hum/hum mice learn stimulus–responseassociations more rapidly than WT mice when declarative (i.e.,place-based) and procedural (i.e., response-based) forms oflearning could interfere with one another. Dopamine levels,gene expression patterns, and synaptic physiology are oppo-sitely affected in the striatal districts underpinning theselearning forms, paralleling the behavioral change. We hy-pothesize that the human FOXP2 evolution led to differentialtuning of corticostriatal systems involved in declarative andprocedural learning and thus contributed to adapting the hu-man brain for speech and language acquisition.
Author contributions: C.S., E.B., M.G., C.W., W.H., W.E., and A.M.G. designed research;C.S., U.B., S.S., S.G., E.R., C.A.F., R.P., and W.H. performed research; C.S., U.B., E.B., C.K., M.D.,R.M., C.W., W.H., W.E., and A.M.G. analyzed data; C.S., U.B., E.B., S.E.F., R.M., W.H., S.P., W.E.,and A.M.G. wrote the paper; and E.B., M.G., S.E.F., R.M., W.H., S.P., and A.M.G. supervisedresearch.
The authors declare no conflict of interest.
Database deposition: Sequences have been deposited in the Gene Expression Omnibus(GEO), (accession no. GSE60659).1C.S. and U.B. contributed equally to this work.2To whom correspondence may be addressed. Email: [email protected], [email protected], or [email protected].
3W.E. and A.M.G. contributed equally to this work.
This article contains supporting information online at www.pnas.org/lookup/suppl/doi:10.1073/pnas.1414542111/-/DCSupplemental.
www.pnas.org/cgi/doi/10.1073/pnas.1414542111 PNAS Early Edition | 1 of 6
NEU
ROSC
IENCE

learning that can be “declared” and nonconscious forms oflearning that require repetitive exposure (13). Equivalents forthese two forms of learning have been suggested for animals inmany pioneering studies, and terminology has been adapteddepending on whether the motivational drive (action–outcomevs. stimulus–response; goal-directed vs. habit) or the task objective(place-based vs. response-based) is more central to the learning. Inrodents, the two learning systems are often probed by tasks requiringmotor learning, a type of learning thought to be mainly procedural,or by navigational maze tasks in which place-based learning is sug-gested to correspond to declarative learning and response-basedlearning is representative of procedural learning (13–17).These systems are thought to interact dynamically to optimize
behavior (17–22). Evidence suggests that these interacting systemshave the capacity to compensate for each other if key componentsare pathologically affected (23, 24), but can also compete witheach other under normal circumstances (14, 15, 17, 19, 25). Insituations in which such competition occurs, learning is lessenedbut can be facilitated by attenuating one of the two competinglearning strategies (19, 25). In a novel context, a fact-oriented,declarative type of learning predominates as the new environmentis explored. With extended training, as beneficial behaviors areacquired, the procedural system becomes predominant.Early suggestions that declarative learning solely depends on
the temporal lobe and hippocampus, and procedural learningsolely on the striatum and cerebellum, have been replaced byevidence that these functions are distributed. Within the stria-tum, moreover, strong evidence indicates that the declarativesystem operates early during learning in circuits engaging thedorsomedial striatum, when action–outcome associations areformed, whereas the eventual automatization or proceduraliza-tion of the behavior engages circuits interconnected with thedorsolateral striatum (17, 20–22, 26, 27). In brain imaging studiesof humans lacking one functional copy of FOXP2, contrastingactivation patterns have been reported for regions that areconsidered to be homologous to the dorsomedial and dorsolat-eral striatum in rodents (28, 29).We took advantage of these findings by developing a panel of
behavioral learning protocols adapted for mice to determine howhumanized Foxp2 influences these two striatal learning systems.
ResultsMotor Skill Learning Is Normal in Humanized Foxp2 Mice. We firstevaluated motor skill learning, given that mice lacking onefunctional allele of murine Foxp2 are reported to exhibit learningdeficits on an accelerating rotarod and a tilted running wheel(30, 31). However, mice homozygous for humanized Foxp2(Foxp2hum/hum) performed at levels equivalent to those of theirWT (Foxp2wt/wt) controls when tested by these two tasks (n = 9–10per genotype; Figs. S1 and S2), extending earlier findings based ondifferent protocols (4). Hence, these types of motor skill learningare impaired in heterozygous murine Foxp2 KO mice (31), butthey are not detectably affected by humanizing the Foxp2 proteinin mice.
Learning Is Enhanced in Humanized Foxp2 Mice When Declarative andProcedural Systems Can Be Active. We next performed a series ofnavigational maze experiments to probe declarative and pro-cedural learning in the Foxp2hum/hum mice. We began by assessinglearning in a context allowing place-based/declarative and response-based/procedural forms of learning. We trained Foxp2hum/hum andFoxp2wt/wt mice on a conditional T-maze task, in which distinctivelearning-related activity patterns have been found in the dorsomedialand the dorsolateral striatum (22, 32). The mice were required toassociate each of two sensory stimuli—a rough or smooth tactileflooring surface—with a food reward that could be found at eithergoal-arm of a T-maze. In addition, we surrounded the T-maze withsalient spatial cues (Fig. 1A).
The Foxp2hum/hum mice clearly learned faster than their WTlittermates [n = 21–22 per genotype; repeated-measuresANOVA (RMA) days 1–12: F1,41 = 14.94, PGT < 0.001; F7.2,41 =3.99, Pday*GT < 0.001; generalized linear mixed model days 1–12,z = −3.9, Pday*GT < 10−4; Fig. 1A, SI Materials and Methods, andTable S1]. Moreover, this faster learning in the Foxp2hum/hum
mice was specific to the acquisition phase of training. Perfor-mance during overtraining, as correct performance was reachedand then maintained at greater than 72.5%, did not differ be-tween genotypes (n = 14–15 per genotype; RMA overtrainingdays 1–10: F1,27 = 0.11, PGT = 0.74; F9,27 = 1.14, Pday*GT = 0.34;Fig. S3).We designed experiments to determine whether this en-
hancement of learning speed in the Foxp2hum/hum mice reflectedenhanced place-based/declarative learning, enhanced response-based/procedural learning, or an altered interaction of theselearning systems. An altered interaction, for example, caused byan attenuated declarative system, could enhance performance byaccelerating the transition toward the procedural system, an in-teraction that has been proposed to occur during striatum-dependent learning tasks (17, 18, 21, 22, 27). In the original T-mazesurrounded by spatial cues, the mice were provided with at leastthree learning possibilities. They could associate a sensory stimulus(rough or smooth) with a reward at a constant place (place-based/declarative learning), associate the stimulus with a body turn(procedural/response-based strategy), or shift from a declarativeto a procedural strategy during the course of the training. Wetested these three alternatives individually.First, we changed the T-maze task to favor procedural learning
by removing extramaze spatial cues (Fig. 1B), and we testedacquisition in new, naïve cohorts of mutant and WT mice. In thiscontext, the Foxp2hum/hum and WT mice learned equally well (n =13–14 per genotype; RMA days 1–12: F1,25 = 0.07, PGT = 0.795;F11,25 = 1.439, Pday*GT = 0.156; Fig. 1B and Table S2). Analysesof the combined data for the two task paradigms showed thatthe presence of spatial cues had clearly a different effect onlearning in Foxp2hum/hum mice and their WT controls (RMAdays 1–12: F7.85,68 = 4.04, Pday*GT*setup < 0.001). This differenceappears to reflect less efficient learning by WT mice in thepresence of spatial cues (Fig. 1). This possibility is in accordwith reports of less efficient learning in an environment inwhich the two learning strategies of declarative/place-based andprocedural/response-based learning can interact competitively
050
60
70
80
90
1 2 3 4 5 6 7 8 9 10 11 120
50
60
70
80
90
1 2 3 4 5 6 7 8 9 10 11 12Days of training Days of training
% c
orre
ct re
spon
se
% c
orre
ct re
spon
se
Foxp2hum/hum
Foxp2wt/wt
***
A B
Start
Smooth Rough
Reward
Start
Smooth Rough
Reward
Fig. 1. Foxp2hum/hum mice learn more rapidly than WT littermates in a con-ditional T-maze paradigm when spatial cues are present. (Upper) T-mazetask with spatial cues (A), promoting place-based/declarative learning; orwithout spatial cues (B), promoting response-based/procedural learning.(Lower) Average percent correct responses for Foxp2hum/hum mice (black) andtheir WT littermates (white) in the two environments. Error bars indicate ±SEM (***P < 0.001).
2 of 6 | www.pnas.org/cgi/doi/10.1073/pnas.1414542111 Schreiweis et al.

(25) and that WT C57BL/6 mice are “essentially place learners”(33–35). By this view, the abundance of spatial cues in theoriginal maze task did not impair the performance of theFoxp2hum/hum mice, which might have dealt more effectivelywith competition between the two available learning strategies.Given this result, we turned to a cross-maze task often used to
discriminate place-based from response-based learning (15, 17,25). We chose a Tolman variation of the task (16, 36), tailoredfor our purposes, because the cross-maze variation by Packardand McGaugh (15) has been reported to be difficult for mice(33–35). In this cross-maze paradigm, we were able to testdeclarative/place-based learning and procedural/response-basedlearning separately as well as to challenge the interaction be-tween them by testing the ability to change between place-basedand response-based learning. The mice started from either oftwo opposing arms of the maze (north or south), with rewardavailable after a specific response (e.g., right turn; Fig. 2A, Left)or at a fixed place (e.g., east arm; Fig. 2A, Right).Remarkably, we did not observe enhanced learning by the
Foxp2hum/hum mice in the response-based task or the place-basedtask. The Foxp2hum/hum and WT mice learned both tasks equallyrapidly (response-based, n = 7–8 per genotype, RMA: F1,13 = 0.43,PGT = 0.53; F4.6,13 = 0.56, Pday*GT = 0.72; place-based, n = 19–20per genotype, RMA: F1,37 = 0.45, PGT = 0.51; F6.2,37 = 0.83,Pday*GT = 0.55; Fig. S4). Thus, Foxp2hum/hum mice did not learnfaster when the mice were required to use only place-basedlearning or only response-based learning to solve the task, despiteexhibiting accelerated learning when both strategies could be used.Prompted by this finding, we tested whether the enhanced
performance of the Foxp2hum/hum mice resulted from an alteredinteraction between the two learning systems, attenuating thedeclarative and favoring the procedural system. We required micethat previously had acquired both tasks without significant dif-ference in performance to shift from place-based learning toresponse-based learning. We expected to find a difference onlyduring the first days after the task switch, when the two learningsystems would likely be in direct competition with each other. Tocontrol for general effects on memory or behavioral flexibility, weadditionally tested the mice on the opposite direction of transition,
measuring learning speeds during the first days after a shift fromresponse-based to place-based learning.For the transition from place-based to response-based learning,
the Foxp2hum/hum mice switched significantly more rapidly (n = 7–8per genotype; RMA: F1,13 = 5.68, PGT = 0.03; Fig. 2B and Table S3).By contrast, their learning rates did not differ from those of theirWT littermates after the opposite, response-to-place transitionconditions (n = 7–8 per genotype, RMA: F1,13 = 0.19, PGT =0.67; Fig. 2C). These findings suggest that it is specifically thetransition from declarative/place-based learning to procedural/response-based learning that is enhanced by the introduction ofthe humanized form of Foxp2, and not either one of theselearning systems alone. The findings further suggest that thecompetitive interaction between these systems could be lessenedin mice with humanized Foxp2, therefore facilitating the transi-tion from declarative to procedural learning that is proposed tooccur during striatum-dependent habit learning (18, 20–22).By contrast, we did not detect differences between Foxp2hum/hum
mice and their WT siblings in either of these learning systemswhen they were tested individually. The two genotypes exhibitedequivalent procedural/response-based learning as assessed withthe accelerating rotarod protocol, the tilted running wheel test, theT-maze protocol in which extramaze cues had been removed, andthe procedural/response-based version of the cross-maze task. Wealso did not observe a difference in the place-based learning of theFoxp2hum/hum mice, which we tested in the declarative/place-basedversion of the cross-maze task. Only when both learning systemscould be engaged in parallel and could interact during the earlyacquisition phase of learning, as in the T-maze task with extra-maze cues, did the humanized Foxp2 mice exhibit more efficientlearning. By challenging this interaction between the learningsystems with the abrupt shift from declarative/place-based toprocedural/response-based learning in the cross-maze task, we foundthat the more rapid learning in the humanized Foxp2 mice couldreflect a faster transition from declarative to response learning.We next tested the possibility that such a change in learning
dynamics could reflect differential effects of the Foxp2 human-ization on the dorsomedial and dorsolateral striatum, nodes incircuits that differently support these learning forms.
Differential Effects of Humanized Foxp2 on mRNA Expression Profilesin the Dorsomedial and Dorsolateral Striatum. To test the possibilitythat humanized Foxp2 might influence the dorsomedial and thedorsolateral striatum differently, we isolated striatal samplesfrom each subregion by laser capture microdissection in adultFoxp2hum/hum mice and WT littermates (n = 11–12 per genotype)and obtained profiles of mRNA expression with >20 millionRNA-Sequencing (Seq) reads per sample. We found many dif-ferences between the mRNAs in the two regions [5,895 of25,259 detected genes with a false discovery rate (FDR) < 0.05;Ppermutations < 0.001], but no single gene differed between geno-types (no genes with an FDR < 0.1; Ppermutations = 0.17). Thisresult indicated that the introduction of humanized Foxp2 does notproduce massive changes in the expression profile of striatal cells atthe level of single genes.We did detect a significant effect of humanized Foxp2 at the
level of functional gene categories, in particular, a down-regulationof genes in the dorsomedial striatum (1,485 of 3,930 categories atan FDR < 0.05; Ppermutations = 0.013; Dataset S1). The most sig-nificant category affected was “signaling,” and the strongest en-richment was found for “neurotransmitter transporter activity” andmany categories involved in synaptic regulatory processes (Fig. S5and Dataset S1). Effects in the dorsolateral striatum were oftensmaller and nonsignificant (914 of 3,930 categories at an FDR <0.05; Ppermutations = 0.08). Thus, we detected differential effects ofhumanized Foxp2 on genes involved in synaptic regulatory pro-cesses in the two striatal regions. These subtle molecular effectscould reflect important physiological alterations, if present in a
A Place-based learningResponse-based learning
C
40
60
80
100
% c
orre
ct re
spon
se
B
40
60
80
100
13
% c
orre
ct re
spon
se
Days of training
Transition
Place-based
1 3Response-
based
North
South
North
South
*
Transition
13Place-based
1 3Response-
based
Days of training
Fig. 2. Foxp2hum/hum mice exhibit enhanced ability to make transitions froma declarative to a procedural mode of learning. (A) Response-based/procedural(Left) and place-based/declarative (Right) versions of the cross-maze task. (B andC) Average percent correct responses (±SEM) for Foxp2hum/hum (filled dots)and Foxp2wt/wt (open dots) mice successively trained on the two cross-mazetask versions and tested on the switch to response-based/procedural (B) orplace-based/declarative version (C) (*P < 0.05).
Schreiweis et al. PNAS Early Edition | 3 of 6
NEU
ROSC
IENCE

subset of cells or if produced by differential inputs to the twostriatal districts.
Humanized Foxp2 Influences Dopamine Levels Differently in theDorsomedial and Dorsolateral Striatum. To explore such potentialphysiological consequences of the Foxp2 humanization, we nextanalyzed striatal dopamine levels, which are known to be related tolearning and to be reduced in striatal samples spanning the dor-somedial and dorsolateral regions in Foxp2hum/hum mice (4). Do-pamine levels in the dorsomedial striatum of the Foxp2hum/hum
mice were reduced to 70% of those found in WT control mice (n =10–22 per genotype; t test, t30 = 3.7; PGT = 0.001), whereas do-pamine levels in the dorsolateral striatum were similar in the twogenotypes (n = 9–22 per genotype; t test, t29 = 0.7; PGT = 0.5).Thus, humanized Foxp2 influences dopamine levels differently inthe sensorimotor and associative regions of the dorsal striatum,reducing them dorsomedially (RMA, F1,29 = 5.73, PGT*region =0.02; Fig. 3A).
Humanized Foxp2 Influences Induction of LTD Differently in theDorsomedial and Dorsolateral Striatum. To explore potential elec-trophysiological effects of the Foxp2 humanization, we measuredin acute brain slices the induction of dopamine-dependent long-term depression (LTD) after high-frequency stimulation (HFS)in medium spiny neurons (MSNs) located in the dorsolateral anddorsomedial striatum (n = 9–19 cells per genotype and striatalregion). In the Foxp2hum/hum mice, LTD in the dorsolateralstriatum was stronger than that in WT controls (Fig. 3D), inaccordance with previous results (4, 5). However, in the dorso-medial striatum, LTD tended to be weaker in the Foxp2hum/hum
mice relative to that in WT controls (Fig. 3C), indicating againthe presence of a region-specific effect of humanized Foxp2 (n =9–19; ANOVA, F1,52 = 5.9, PGT*region = 0.02; Fig. 3B).To determine the mechanistic basis of the stronger LTD in the
dorsolateral striatum of the Foxp2hum/hum mice, we first compared
our protocol, involving a modest −70-mV depolarization duringinduction, vs. the commonly used HFS-LTD protocol in whichstronger depolarization to −15 mV (37) favors the activation ofvoltage-gated calcium channels (38, 39). When we used thestrong depolarization, the genotype difference disappeared. Wealso observed robust LTD in WT mice (n = 7–17 per LTDprotocol; ANOVA, F1,22 = 10.1, P = 0.004; Fig. 4 A and B),and the magnitude of this LTD was similar to that in theFoxp2hum/hum mice (n = 7–8 per genotype; ANOVA, F1,13 = 0.28,P = 0.6). This result indicates that LTD is more readily induciblein MSNs of the dorsolateral striatum of the Foxp2hum/hummice andrequires less depolarization than LTD in the corresponding regionof the WT.We next tested whether the readily inducible LTD in Foxp2hum/hum
mice is based on the dopamine D2 receptor (D2R)-dependentstriatal mechanism that has been consistently described for LTD inWT mice (38, 40). Applying the D2R antagonist sulpiride to theslice bath eliminated LTD induction in the Foxp2hum/hum mice(n = 6–19 per treatment; ANOVA, F1,22 = 5.5, P = 0.03; Fig. 4 Cand D), suggesting that the effect of humanized Foxp2 on striatalLTD depends on D2R-associated mechanisms.We tested the alternative possibility that the LTD difference
could be the result of a confounding effect of long-term poten-tiation (LTP) present only in WT mice. LTP in striatal MSNs isconsidered to be mediated by NMDA receptors and is consis-tently reported to be blocked by APV (38, 41). Therefore, weantagonized NMDA receptors by adding extracellular APV(50 μM) to the bath solution under the modest −70-mV de-polarization conditions. The responses in the dorsolateral striatumwere not lowered by APV application in the WT mice, excludingthe possibility of a confounding LTP effect (n = 5–17; ANOVA,F1,20 = 0.32, P = 0.58; Fig. 4 C and D). By contrast, in the dorso-lateral striatum of the Foxp2hum/hum mice, NMDA receptor in-hibition abolished the readily inducible, weak-depolarizationLTD, so that the response in humanized mice was no longer dis-tinguishable from WT (n = 10–17 per genotype and treatment;ANOVA, F1,25 = 0.42, P = 0.52; Fig. 4 C and D).To determine whether this extracellular NMDA receptor
blockade in the Foxp2hum/hum mice resulted from effects at thepresynaptic level or from the actions of postsynaptic receptors onthe MSNs themselves, we added the NMDA channel blockerMK801 (1 mM) to the intracellular solution. This treatmentblocked the readily inducible LTD in humanized MSNs (n = 5–19per treatment; F1,22 = 4.3, P = 0.04; Fig. 4D), suggesting that,under low-depolarization conditions, postsynaptic NMDA receptoractivation accounts for LTD induction in the Foxp2hum/hum mice.Our findings thus implicate the humanized form of Foxp2 inenhancing a mechanism of LTD induction in the dorsolateralstriatum by means of postsynaptic NMDA receptors. At present,we do not assume a specific increase in NMDA receptors to beresponsible for this increased modulation, as the ratio of NMDAto AMPA currents remains unaltered in the Foxp2hum/hum mice(Fig. S6B).
DiscussionOur findings suggest a striking selectivity in the effects of hu-manized Foxp2 on behavioral learning dynamics as well as onstriatal dopamine levels, gene expression levels, and synapticplasticity. Based on our experimental findings, we suggest as aworking hypothesis that humanized Foxp2 differentially influ-ences the functional contributions of the associative and senso-rimotor striatum to learning dynamics (Fig. S7). In this view, theFoxp2hum/hum mice exhibited an altered interaction betweenthe declarative and procedural learning strategies, favoring theprocedural system when both learning systems were engagedas indicated by their more rapid transition toward proceduralbehavior in the cue-enriched conditional T-maze task and inthe place-to-response switching cross-maze task. This condition
hum/humwt/wthum/humwt/wtDorsolateralDorsomedial
*
Dop
amin
e C
once
ntra
tion
[log2
(nm
ol/m
g pr
otei
n)]
*A
D
B
1.2
Time (min)−10
Time (min)
Pre Post
DorsolateralDorsomedialC
Pre Post
0 10 20 30 40 −10 0 10 20 30 40
Foxp2wt/wt Foxp2hum/hum Foxp2wt/wt Foxp2hum/hum
DorsolateralDorsomedial
Rat
io E
PS
Ppo
st /
EP
SP
pre
Rat
io E
PS
Ppo
st /
EP
SP
pre
0.60.0
1.1
1.0
0.9
0.8
0.70.6
0.0
1.11.00.90.80.7
1.2
9.8
9.6
9.4
9.2
9.0
8.8
8.6
8.4wt/wt wt/wthum/hum hum/hum
Rat
io E
PS
Ppo
st /
EP
SP
pre
1.2
0.6
0.0
1.11.00.90.80.7
Fig. 3. Foxp2hum/hum mice exhibit differential effects of dopamine levelsand synaptic plasticity in the dorsomedial and the dorsolateral striatum. (A)Average (±SEM) concentrations of dopamine in dorsomedial (red) and dor-solateral (blue) striatal biopsies of Foxp2hum/hum mice (hum/hum) relativeto WT (wt/wt) levels (*P < 0.05). (B) Averaged excitatory postsynapticresponses (±SEM) in dorsomedial and dorsolateral MSNs in mutant and WTmice 30–40 min after HFS to induce LTD, normalized to baseline levels (*P <0.05). (C and D) Recording location, representative traces, and time course ofLTD induction (post; mean amplitudes ± SEM), normalized to baseline levels(pre) and after stimulation in the dorsomedial (C) and dorsolateral (D) striatum.(Scale bars: 2 mV and 10 ms.)
4 of 6 | www.pnas.org/cgi/doi/10.1073/pnas.1414542111 Schreiweis et al.

would contrast with WT conditions, in which the declarativesystem is thought to dominate and render the naturally occurringtransition toward the procedural learning system less thanmaximally efficient (17, 19, 25).How this behavioral change in the Foxp2hum/hum mice is brought
about is not clear. However, the modest effects of humanized Foxp2on gene expression patterns suggest that generalized molecular orcellular reconfigurations of striatal MSNs are not involved. The re-gion-specific effects of humanized Foxp2 on dopamine content andsynaptic plasticity could reflect mechanisms directly related to thebehavioral effects, given the differential function of the dorsomedialand dorsolateral striatum in place-based/declarative and response-based/procedural forms of learning. Our electrophysiologicalrecordings indicate a region-specific enhancement of readily in-ducible LTD in the Foxp2hum/hum mice. This form of LTD followedthe D2R-dependent mechanism identified for classical strong-de-polarization induction protocols (40), but required the activation ofNMDA receptors. Such a mechanism has been described in otherbrain regions (42), but, in the striatum, has been linked mainly, butnot exclusively, to the induction of LTP, not LTD (38, 40, 41, 43,44). Given that the unaltered ratio between NMDA and AMPAcurrents indicated no increase in NMDA receptors of Foxp2hum/hum
mice, and that dopamine is critical for striatal synaptic plasticity, onealternative is that an altered dopamine-dependent modulation ofNMDA receptors could be responsible for the humanized effect weobserved in these mice (45–47).The contrasting effects in the dorsomedial and dorsolateral
striatum of Foxp2hum/hum mice are striking given that differentregional brain-imaging activation patterns have been reported forwhat are considered as homologous striatal districts in humanslacking one functional copy of FOXP2 (28, 29). How these findings
relate to the effect of humanized version of Foxp2 in shaping thedevelopment of a human brain to enable traits such as language andspeech acquisition is unknown. The relation between declarative andprocedural learning strategies and language learning is itself unclear(10–12). One possibility raised by our findings is that efficientproceduralization might accelerate probabilistic learning oflanguage features (10) by chunking single speech and language-related actions into sequences, a chunking function that has beensuggested to be a core property of the striatum in experimentalwork (48, 49). If so, such a process could free up declarativecapacities by implementing procedural components at earliertime points. Our findings prompt the intriguing speculation thatthe humanization of this gene imparted a facilitated ability to useprocedural forms of learning and therefore to shift more rapidlyfrom declarative to procedural forms of learning, a change thatcould have been important for the emergence of proficient lan-guage and speech.
Materials and MethodsAdditional description of study materials and methods is provided in SIMaterials and Methods.
Animals. A total of 303 Foxp2hum/hum mice [5H10 line (4); 1.8–15.2 mo;postnatal day (P)21–P53 for electrophysiological experiments] and WT lit-termates (160 for behavioral tests, 23 for gene expression assays, 32 fordopamine measurements, and 88 for electrophysiology experiments) wereused, and they were balanced for genotype and sex in each experiment.Behavioral procedures were approved by the Committee on Animal Care atthe Massachusetts Institute of Technology, and other procedures were inaccordance with the United Kingdom Animals (Scientific Procedures) Act of1986 and guidelines of the Max Planck Institute for Evolutionary Anthro-pology and federal regulations of Saxony, Germany.
Behavioral Experiments. Rotarod and tilted running wheel experiments wereconducted as previously described (31). For the maze experiments, mice werefood-restricted and were habituated to apparatus and reward (chocolatemilk). They were then trained on a T-maze (40 trials each day) to obtain re-ward on the correct goal arm as instructed by tactile conditional cues (rough orsmooth floor surface) or on a cross maze (10 trials each day) to go to a specificgoal (place-based version) or to make a particular turn (response-based ver-sion) to receive reward. Statistical analysis was performed by using RMA andgeneralized linear mixed models (SI Materials and Methods).
Laser Capture Microdissection and RNA Sequencing. The dorsomedial anddorsolateral striatum of adult mice was dissected from brain slices by usinga laser microscope (P.A.L.M. System; Zeiss). Twenty-five nanograms total RNAwere used to construct barcodedmRNA-Seq libraries that were sequenced ona Genome Analyzer IIx platform as described earlier (50). Gene expressionanalysis was performed by the multifactor model of the R package fordifferential expression analysis for sequence count data (51). Effects ofhumanized Foxp2 were summarized by the π-value that multiplies themagnitude and significance of genotype effect (52). This ranking was usedfor the Wilcoxon rank test implemented in FUNC (https://func.eva.mpg.de/)(53) to identify enriched Gene Ontology categories. Permutations of geno-type labels were used to assess global significance (Ppermutations).
Dopamine Content. Tissue samples from 1 mm cryocut slabs of the dorso-medial and the dorsolateral striatum were homogenized, and their proteincontent was measured. Dopamine was detected at an electrode potential of0.8 V. Statistical analyses were performed on log2-transformed dopamineamounts per milligram of protein normalized per region, sex, and batch.
In Situ Electrophysiology. Coronal striatal slices (250 μm) were prepared fromP21–P53 mice, and responses of MSNs to stimulation of cortical afferents(0.33–0.2 Hz) were measured during periods before (15 min) and after(40 min) a tetanic HFS (4 × 100 Hz, at −70 or at −15 mV) in the presence ofthe GABA(A) receptor blocker SR95531 (GABAzine) by using a whole-cellpatch-clamp setup. We applied one- and two-way ANOVAs to test region-and genotype-specific effects.
ACKNOWLEDGMENTS. We thank H. F. Hall for his expert help withexperimental equipment manufacture and setup; H. Jenny, D. Hu, andC. Ye for help with behavioral experiments; J. P. De Bono for assistance with
A
No drug (−70 mV)
APV (50 μM)Sulpiride (20 μM)
Foxp2hum/hum
Time (min)
DNo drug Sulpiride APV MK 801
Time (min)
Foxp2wt/wt Foxp2hum/hum
−15 mVHFS
−70 mVHFS
−15 mV HFS
B
ns
**
−70 mV HFSHigh DPLow DP
wt/wt hum/hum wt/wt hum/hum
−70 mV HFSLow DP
*ns ns
*
C
*
1.2
1.0
0.8
0.6
0.4
0.2
0.0
1.0
0.9
0.8
0.7
0.6
0.0
1.1
1.2
−10 0 10 20 30 40
1.0
0.9
0.8
0.7
0.6
0.0
1.1
1.2
1.0
0.9
0.8
0.7
0.6
0.0
1.1
1.2
−10 0 10 20 30 40 * *
Rat
io E
PS
Ppo
st /E
PS
Ppr
eR
atio
EP
SP
post
/EP
SP
pre
Rat
io E
PS
Ppo
st /E
PS
Ppr
eR
atio
EP
SP
post
/EP
SP
pre
Fig. 4. The enhanced LTD in dorsolateral MSNs of Foxp2hum/hum mice is specificfor LTD induction under low depolarization (DP) conditions and depends onD2Rs and NMDA channels. (A) HFS (gray arrow) with depolarization to −15 mVinstead of weaker depolarization of −70 mV (Fig. 3 B–D) induced comparableLTD in control andmutant mice during the 40min post-HFS period. (B) Changingfrom HFS with weak depolarization (−70 mV) to high depolarization conditions(−15 mV) enhanced mean LTD levels measured at 30–40 min after the HFS inWTbut not in mutant mice. Error bars indicate SEM (*P < 0.05 and **P < 0.005). ns,not significant. (C) Readily inducible LTD under low depolarization conditions indorsolateral MSNs of Foxp2hum/hum mice is abolished by the D2R antagonistsulpiride or by external application of the NMDA receptors antagonist APV.Shown are excitatory postsynaptic potential amplitudes (post), normalized to themean baseline levels (pre), after HFS in the low depolarization condition of−70 mV (gray arrow) in the presence of sulpiride (20 μM) or APV (50 μM). (D) Inmutant mice, the readily inducible LTD measured 30–40 min after HFS underlow depolarization conditions can be reversed to WT levels by blocking D2Rsby sulpiride or NMDA receptors with extracellular APV or intracellularMK801 (1 mM; electrode solution). Recordings in the presence of sulpiride,APV, or MK801 were not different from control recordings obtained withoutHFS stimulation (n = 5–17; ANOVA, P = 0.32–0.98; Fig. S6A). Error bars in-dicate SEM (*P < 0.05). ns, not significant.
Schreiweis et al. PNAS Early Edition | 5 of 6
NEU
ROSC
IENCE

the running wheel experiments; I. Bliesener and V. Wiebe for technicalsupport; A. McWhinnie for help with graphics; N. Cohen for reading themanuscript; and K. S. Smith and Y. Kubota for help with editing themanuscript. This work was funded by the Nancy Lurie Marks Family
Foundation, the Simons Foundation Autism Research Initiative Grant137593,National Institutes of Health Grant R01 MH060379, the Wellcome TrustGrants 075491/Z/04 and 080971, the Fondation pour la Recherche Médicale,and the Max Planck Society.
1. Vargha-Khadem F, Gadian DG, Copp A, Mishkin M (2005) FOXP2 and the neuro-anatomy of speech and language. Nat Rev Neurosci 6(2):131–138.
2. Enard W, et al. (2002) Molecular evolution of FOXP2, a gene involved in speech andlanguage. Nature 418(6900):869–872.
3. Enard W (2011) FOXP2 and the role of cortico-basal ganglia circuits in speech andlanguage evolution. Curr Opin Neurobiol 21(3):415–424.
4. Enard W, et al. (2009) A humanized version of Foxp2 affects cortico-basal gangliacircuits in mice. Cell 137(5):961–971.
5. Reimers-Kipping S, Hevers W, Pääbo S, Enard W (2011) Humanized Foxp2 specificallyaffects cortico-basal ganglia circuits. Neuroscience 175:75–84.
6. Graybiel AM (2008) Habits, rituals, and the evaluative brain. Annu Rev Neurosci 31:359–387.
7. Bolhuis JJ, Okanoya K, Scharff C (2010) Twitter evolution: Converging mechanisms inbirdsong and human speech. Nat Rev Neurosci 11(11):747–759.
8. Friederici AD (2006) What’s in control of language? Nat Neurosci 9(8):991–992.9. Nicolson RI, Fawcett AJ (2007) Procedural learning difficulties: Reuniting the de-
velopmental disorders? Trends Neurosci 30(4):135–141.10. Romberg AR, Saffran JR (2010) Statistical learning and language acquisition. Wiley
Interdiscip Rev Cogn Sci 1(6):906–914.11. Teichmann M, Dupoux E, Cesaro P, Bachoud-Lévi AC (2008) The role of the striatum in
sentence processing: Evidence from a priming study in early stages of Huntington’sdisease. Neuropsychologia 46(1):174–185.
12. Ullman MT (2004) Contributions of memory circuits to language: the declarative/procedural model. Cognition 92(1-2):231–270.
13. Eichenbaum H, Cohen NJ (2001) From Conditioning to Conscious Recollection.Memory Systems of the Brain (Oxford Univ Press, New York).
14. Moussa R, Poucet B, Amalric M, Sargolini F (2011) Contributions of dorsal striatalsubregions to spatial alternation behavior. Learn Mem 18(7):444–451.
15. Packard MG, McGaugh JL (1996) Inactivation of hippocampus or caudate nucleus withlidocaine differentially affects expression of place and response learning. NeurobiolLearn Mem 65(1):65–72.
16. Tolman EC, Ritchie BF, Kalish D (1947) Studies in spatial learning; response learning vs.place learning by the non-correction method. J Exp Psychol 37(4):285–292.
17. White NM (2009) Some highlights of research on the effects of caudate nucleus le-sions over the past 200 years. Behav Brain Res 199(1):3–23.
18. Miyachi S, Hikosaka O, Lu X (2002) Differential activation of monkey striatal neuronsin the early and late stages of procedural learning. Exp Brain Res 146(1):122–126.
19. White NM, McDonald RJ (2002) Multiple parallel memory systems in the brain of therat. Neurobiol Learn Mem 77(2):125–184.
20. Yin HH, Knowlton BJ (2006) The role of the basal ganglia in habit formation. Nat RevNeurosci 7(6):464–476.
21. Yin HH, et al. (2009) Dynamic reorganization of striatal circuits during the acquisitionand consolidation of a skill. Nat Neurosci 12(3):333–341.
22. Thorn CA, Atallah H, Howe M, Graybiel AM (2010) Differential dynamics of activitychanges in dorsolateral and dorsomedial striatal loops during learning. Neuron 66(5):781–795.
23. Dagher A, Owen AM, Boecker H, Brooks DJ (2001) The role of the striatum andhippocampus in planning: A PET activation study in Parkinson’s disease. Brain 124(Pt 5):1020–1032.
24. Moody TD, Bookheimer SY, Vanek Z, Knowlton BJ (2004) An implicit learning taskactivates medial temporal lobe in patients with Parkinson’s disease. Behav Neurosci118(2):438–442.
25. Chang Q, Gold PE (2004) Inactivation of dorsolateral striatum impairs acquisition ofresponse learning in cue-deficient, but not cue-available, conditions. Behav Neurosci118(2):383–388.
26. Voorn P, Vanderschuren LJ, Groenewegen HJ, Robbins TW, Pennartz CM (2004)Putting a spin on the dorsal-ventral divide of the striatum. Trends Neurosci 27(8):468–474.
27. Miyachi S, Hikosaka O, Miyashita K, Kárádi Z, Rand MK (1997) Differential roles ofmonkey striatum in learning of sequential hand movement. Exp Brain Res 115(1):1–5.
28. Liégeois F, et al. (2003) Language fMRI abnormalities associated with FOXP2 genemutation. Nat Neurosci 6(11):1230–1237.
29. Vargha-Khadem F, et al. (1998) Neural basis of an inherited speech and languagedisorder. Proc Natl Acad Sci USA 95(21):12695–12700.
30. French CA, et al. (2012) An aetiological Foxp2 mutation causes aberrant striatal ac-tivity and alters plasticity during skill learning. Mol Psychiatry 17(11):1077–1085.
31. Groszer M, et al. (2008) Impaired synaptic plasticity and motor learning in mice witha point mutation implicated in human speech deficits. Curr Biol 18(5):354–362.
32. Thorn CA, Graybiel AM (2014) Differential entrainment and learning-related dy-namics of spike and local field potential activity in the sensorimotor and associativestriatum. J Neurosci 34(8):2845–2859.
33. Middei S, Restivo L, Sgobio C, Passino E, Ammassari-Teule M (2004) Reversible in-activation of hippocampus and dorsolateral striatum in C57BL/6 and DBA/2 inbredmice failed to show interaction between memory systems in these genotypes. BehavBrain Res 154(2):527–534.
34. Passino E, Middei S, Restivo L, Bertaina-Anglade V, Ammassari-Teule M (2002) Geneticapproach to variability of memory systems: Analysis of place vs. response learning andfos-related expression in hippocampal and striatal areas of C57BL/6 and DBA/2 mice.Hippocampus 12(1):63–75.
35. Pittenger C, et al. (2006) Impaired bidirectional synaptic plasticity and proceduralmemory formation in striatum-specific cAMP response element-binding protein-deficient mice. J Neurosci 26(10):2808–2813.
36. Tolman EC, Ritchie BF, Kalish D (1946) Studies in spatial learning; place learning versusresponse learning. J Exp Psychol 36:221–229.
37. Gerdeman GL, Ronesi J, Lovinger DM (2002) Postsynaptic endocannabinoid release iscritical to long-term depression in the striatum. Nat Neurosci 5(5):446–451.
38. Calabresi P, Maj R, Pisani A, Mercuri NB, Bernardi G (1992) Long-term synapticdepression in the striatum: Physiological and pharmacological characterization.J Neurosci 12(11):4224–4233.
39. Choi S, Lovinger DM (1997) Decreased probability of neurotransmitter release un-derlies striatal long-term depression and postnatal development of corticostriatalsynapses. Proc Natl Acad Sci USA 94(6):2665–2670.
40. Kreitzer AC, Malenka RC (2005) Dopamine modulation of state-dependent endo-cannabinoid release and long-term depression in the striatum. J Neurosci 25(45):10537–10545.
41. Partridge JG, Tang KC, Lovinger DM (2000) Regional and postnatal heterogeneity ofactivity-dependent long-term changes in synaptic efficacy in the dorsal striatum.J Neurophysiol 84(3):1422–1429.
42. Jurado S, Biou V, Malenka RC (2010) A calcineurin/AKAP complex is required forNMDA receptor-dependent long-term depression. Nat Neurosci 13(9):1053–1055.
43. Pawlak V, Kerr JN (2008) Dopamine receptor activation is required for corticostriatalspike-timing-dependent plasticity. J Neurosci 28(10):2435–2446.
44. Spencer JP, Murphy KP (2000) Bi-directional changes in synaptic plasticity induced atcorticostriatal synapses in vitro. Exp Brain Res 135(4):497–503.
45. Cepeda C, Colwell CS, Itri JN, Chandler SH, Levine MS (1998) Dopaminergic modula-tion of NMDA-induced whole cell currents in neostriatal neurons in slices: contribu-tion of calcium conductances. J Neurophysiol 79(1):82–94.
46. Sarantis K, Antoniou K, Matsokis N, Angelatou F (2012) Exposure to novel environ-ment is characterized by an interaction of D1/NMDA receptors underlined by phos-phorylation of the NMDA and AMPA receptor subunits and activation of ERK1/2signaling, leading to epigenetic changes and gene expression in rat hippocampus.Neurochem Int 60(1):55–67.
47. Snyder GL, Fienberg AA, Huganir RL, Greengard P (1998) A dopamine/D1 receptor/protein kinase A/dopamine- and cAMP-regulated phosphoprotein (Mr 32 kDa)/pro-tein phosphatase-1 pathway regulates dephosphorylation of the NMDA receptor.J Neurosci 18(24):10297–10303.
48. Graybiel AM (1998) The basal ganglia and chunking of action repertoires. NeurobiolLearn Mem 70(1-2):119–136.
49. Jog MS, Kubota Y, Connolly CI, Hillegaart V, Graybiel AM (1999) Building neuralrepresentations of habits. Science 286(5445):1745–1749.
50. Wunderlich S, et al. (2014) Primate iPS cells as tools for evolutionary analyses. StemCell Res (Amst) 12(3):622–629.
51. Anders S, Huber W (2010) Differential expression analysis for sequence count data.Genome Biol 11(10):R106.
52. Xiao Y, et al. (2014) A novel significance score for gene selection and ranking. Bio-informatics 30(6):801–807.
53. Prüfer K, et al. (2007) FUNC: A package for detecting significant associations betweengene sets and ontological annotations. BMC Bioinformatics 8:41.
6 of 6 | www.pnas.org/cgi/doi/10.1073/pnas.1414542111 Schreiweis et al.

Supporting InformationSchreiweis et al. 10.1073/pnas.1414542111SI Materials and MethodsAnimals. A total of 303 forkhead box P2, Foxp2hum/hum, mice[5H10 line (1); P21–P53 for in situ electrophysiology; 1.8–15.2 mofor other experiments] and WT littermates were used. They werebalanced for genotype and sex for behavioral tests (n = 160), forgene expression assays (n = 23), for dopamine measurements(n = 32), and for in situ electrophysiology (n = 88). Behavioralprocedures were approved by the committee on animal care atthe Massachusetts Institute of Technology. Experiments based inthe United Kingdom were performed in accordance with theUnited Kingdom Animals (Scientific Procedures) Act of 1986.Electrophysiological procedures followed guidelines of the MaxPlanck Institute for Evolutionary Anthropology and federal reg-ulations of Saxony, Germany.
Behavioral Experiments. Rotarod and tilted running wheel. A stand-alone accelerating rotarod was custom modified to allow the useof faster acceleration speeds than the standard model. The rodwas set to accelerate from 8 rpm to 80 rpm over a 300-s timeperiod. Mice were placed on the rod, and trials were deemed tohave started when the rod began to turn. Trials ended when micefell from the rod or after 300 s elapsed. Mice were trained forthree consecutive days, with one daily session consisting of 10trials separated by 300-s intertrial intervals spent in their homecages. Tilted running wheel experiments were conducted aspreviously described (2). Time spent running, average speed ofrunning, as well as number and length of single running boutswere automatically monitored and recorded by a computer during24-h periods.T-maze task. The black acrylic T-shaped maze consisted of a longalleyway (55.2 cm × 3.2 cm) with two short alleys (39.4 cm × 3.2 cm),flanked by outward-sloping walls of a 60° angle. The floor wastaped with a flat black tape to take off any possibly irritatingshine and to provide a nonslippery walking ground for the ani-mals. A sliding door prevented the mouse from leaving the startcompartment until trial start, which was indicated by a warningclick. Circular wells (1 cm in diameter, ∼1 mm deep, located2 cm away from the end of right and left choice arms) could befilled from outside the maze, out of sight of the mouse, withchocolate milk delivered via a blunt-end metal syringe needle.The audio speaker, delivering the warning click, was locatedoutside the apparatus, above the choice point of the maze. Thetactile inserts were flat black to limit reflections and stress duringtraining. Light conditions were dimmed during habituation andtraining periods to signal the start of the session and to createa less stressful environment while permitting vision of spatialcues; lights were turned up fully again to mark the end of thesession. The cue-enriched environment contained numerouscues, among them the door, racks, and black posters on the wallsto left side of the T-maze (seen from the start compartment,facing the long alleyway), as well as a bright monitor that emitteda 75-kHz ultrasound tone and was located diagonally behind theexperimenter. To simulate a cue-deprived environment, we re-moved all cues we were able to remove, i.e., the black postersand the monitor.A subset of mice was trained on a T-maze task as previously
described (3). These mice were food-restricted (75–85% of free-feeding weight) and were first habituated to the apparatus andreward (chocolate milk). During the daily 40-trial training andtesting session in the T-maze, mice received reward if theyreached the correct goal location as instructed by tactile condi-
tional cues (rough or smooth floor surface). Performance accu-racy and running times of each trial were measured.Cross-maze task. The cross-maze apparatus resembled the mea-surements and the angled design of the T-maze apparatus.However, it contained an additional long arm, which was closedoff by an equally 60° angled Plexiglas wall so that the mouse wasexposed to the choice of only two short arms at a time. The mazewas constructed of white acrylic floor material, and equippedwith transparent Plexiglas walls and a transparent door to sep-arate off the start compartment to ensure good visibility of allprovided cues. The floor of the cross-maze was elevated 40 cmabove the ground and mounted on a revolvable construction.The apparatus was located in an test room adjacent to theT-maze room, which was equipped with a black squared cubicle(216 cm × 216 cm) of ripstop nylon panels, which were arrangedalong a squared framed metal construction (height, 220 cm fromfloor). A white ceiling of the same material was mounted to themetal frame to ensure an indirect light source providing equallight intensity inside the cubicle. There were again numerouscues in the room such as the door, light switches on the walls,and a table, as well as the nylon walls of the northwest, north,and southeast black nylon panels that were rolled down. Addi-tionally, white cues in different shapes (triangle, cross) werehanging from black nylon strings in front of the black panels ofthe cubicle. Light conditions were kept at a moderate level torelax the animals and to ensure good visibility of all presentedspatial cues. With a probe trial day in the egocentric learningtask, during which the cross-maze apparatus was turned 90°clockwise to its original position, we confirmed that mice hadacquired a procedural strategy and not learned to go to twodifferent locations depending on the start arm (data not shown).Mice were food-deprived and habituated as those in the T-maze
task. Each mouse was placed on either of two opposing arms of themaze (north or south), and the other departure arm was closed.They were rewarded in the place-based version for a specific place(east or west), and in the response-based version for a particularturn (right or left turn). Mice received 10 daily trials, and per-formance accuracy was measured.Statistical analysis. Behavioral data from the T-maze and cross-maze experiments were analyzed by using repeated-measuresANOVA (RMA) with training day, genotype, and sex as predictorvariables. We used the Greenhouse–Geisser correction to adjustthe degrees of freedom when the sphericity assumption was vi-olated. Additionally, we applied a generalized linear mixed model(GLMM) approach on data from all behavioral experiments.
Detailed Statistical Analysis of Behavioral Data Using a GLMM.Accelerating rotarod. To test whether latencies to fall were influ-enced by genotype, day, trial, or age of the mice, we used a simpleand a more differentiated GLMM approach (4, 5) into which weincluded these predictors as fixed effects and batch and subjectas random effects. The models were fitted in R (6) using thefunction “lmer” of the R package lme4 (7). Before analyzing thedata, we checked whether the assumptions of normally distrib-uted and homogeneous residuals were fulfilled by visually in-specting a histogram of the plotted residuals, a Q-Q plot, and theresiduals plotted against fitted values (all indicating that therewere no obvious deviations from these assumptions). The sig-nificance of the full model including all predictors (genotype,trial, training day) as main effects, as well as all their interactionsup to the third order and random effects (batch, subject), com-pared with the null model not comprising the factor genotype or
Schreiweis et al. www.pnas.org/cgi/content/short/1414542111 1 of 8

its interactions with other effects, was established by using a like-lihood ratio test (R function “anova” with argument test set to“Chisq”) (8). To achieve a more reliable P value, we fitted themodels by using maximum likelihood (9).Tilted running wheel. All parameters were analyzed by using thesame GLMM and R packages as described earlier for the analysisof the rotarod assay. Here, day and genotype served as fixedeffects; age and weight at beginning of testing were included asfurther fixed effects as well as in interactions with day and ge-notype. Furthermore, we corrected for individual variation in thechange of the response as well as potential genotype differences inthe batches (random slopes), which consistently remained in thebuilt models (10). Again, before running the models, we checkedthe assumptions as described earlier and found that assumptionswere not fulfilled for the bout length, bout number, and averagespeed of running. To amend this violation, length and numberwere transformed, applying the square root after subtracting theminimum value from all individual values, and the average runningspeed was squared. We compared the full model including allpredictors with a model lacking genotype as factor of interest(likelihood ratio test with R function “anova,” argument test set to“Chisq”) and fitted models by using maximum likelihood.T-maze task. We performed a GLMM (11) as described for therotarod test. In the analyses of spatial cue-enriched and spatialcue-deprived setups, we included training day, genotype, and sexas fixed effects as in the RMA, and additionally trial as predictorof interest as well as age, stimulus type (rough or smooth), andmaze-arm (arm 1 or 2) as control variables. Furthermore, wecontrolled for potential effects of batch and subject (randomintercepts). We tested a model with day, trial, and genotype in allinteractions up to the third order. Additionally, we included age,sex, stimulus type, and maze-arm and their interactions with allterms involving the test effect to control for their potential ef-fects [model: training day * trial number * genotype * (sex + age +stimulus type + maze arm)]. Furthermore, random slope termswere included to control for genotype effects potentially differingbetween batches (random slope term encoded in R using the fol-lowing construct: 1 + genotype j batch) or individual differences inperformance across days or trials (1 + maze arm + training day *trial j subject). We first tested whether the full model containingall the mentioned factors was significant against a null modelthat lacked the factor genotype (cue-enriched environment,GLMM, df = 5, P < 2.7 × 10⁻¹⁴; cue-deprived environment,GLMM not significant) before reducing the model stepwise toreach the final model containing only the factors that contributesignificantly to explain the observed data.Cross-maze task. The same GLMM procedure as used for theT-maze was applied to the switch experiment in the cross-mazeapparatus. We analyzed the responses to informative trials, i.e.,the 50% of trials in which place-based rule and the response-basedrule strategies led to opposite actions. For instance, a mouse thathad learned to go to the location arm 1 will still be rewarded in 50%of the cases in the procedural task because the required turn willoverlap with the specific location in half the trials.For the GLMM analysis, the same functions and packages as
those for the analyses of the T-maze task were applied. Thecontributions of fixed and random effects, as well as individualinteractions between these effects, were tested by comparinga model including the term to be tested (main or interactioneffect) with a model not containing the term (likelihood ratio testwith R function “anova,” argument test set to “Chisq,” andmodels fitted by using maximum likelihood). Before testing, allcontinuous variables [training day “switch 1–3,” informative trialnumber (n = 1–5), and age] were z-transformed, which, apartfrom the listed continuous variables, contained genotype as fixedeffect and batch and subject as random effects.
Laser-Capture Microdissection and RNA Sequencing.Mice were 8 wkof age, and six genotype pairs per sex matched for litter wereprocessed in random order. Brains were isolated, flash-frozenin −20 °C isopentane, and stored at −80 °C. Coronal cryosections(45 μm, −20 °C in a Microm HM 550 cryostat; Thermo Fisher)were put onto membrane slides (MembraneSlide NF 1,0 PEN;Zeiss) and incubated for 10 min at −20 °C in 70% (vol/vol)EtOH. Slides were stained for 1 min in 0.2% toluidine at roomtemperature and then washed three times in 100% EtOH. Slideswere dried and stored together with Silica Gel (Roth) in slideboxes at −80 °C. Before microdissection, boxes containing thesample slides were brought to room temperature, and the sam-ples were not processed further until humidity in the boxes wasreduced by the silica gel which absorbed moisture. Striatal re-gions were cut with a laser (P.A.L.M. System; Zeiss), transferredmanually into lysis buffer (Qiagen) and stored at −80 °C.RNA was isolated by using an RNeasy Micro Kit (Qiagen), and
RNA concentration and quality were measured on a PicoChip(2100 Bionalyzer; Agilent). We developed and applied an in-house protocol for library preparation of small amounts of RNA(15 ng total RNA per sample), which included mRNA isolation,RNA fragmentation, and cDNA synthesis similar to the TrueSeqprotocol, and made indexed libraries from these cDNAs as de-scribed (12) The 48 libraries were pooled, and single-end 36-bpreads were sequenced on three flow cells on an Illumina GAIIx.Reads were processed as described previously (12), and oneanimal (Foxp2hum/hum female) was excluded as a result of con-tamination with cortical tissue. Gene expression analysis wasperformed by using the multifactor analysis of the DESeqpackage (13). Factors included in the generalized linear modelwere “Region,” “Genotype,” “Sex,” and “Batch.” false discoveryrates were calculated by using the Benjamini–Hochberg correc-tion (14). As this correction did not account for the dependencyamong genes, we also ran the same analysis on permutations offactors. To test the genotype effect, we permuted genotypeswithin matched pairs of animals, and, to test the region effect, wepermuted region within each animal. Ppermutations values werecalculated as the fraction of the 555 permutations that have asmany or more significant genes (P < 0.05) as the data.To summarize effects on the level of gene categories, we an-
alyzed the dorsomedial and dorsolateral striatum separately andranked genes according to a statistic that combines fold changeand statistical significance (15). We then used theWilcoxon rank-sum test implemented in the FUNC package (16) to identifyGene Ontology categories (version 3.6.2013) enriched for genesranking low (high) in the list, corresponding to genes expressedhigh (low) in Foxp2hum/hum mice compared with Foxp2wt/wt mice.To estimate the overall significance of the enrichment, we usedpermutations of genotype as described earlier and compared theP value distribution of the permutations and the data as de-scribed in FUNC for the global P value. We used the averagerank of genes in a category to calculate the enrichment.
Dopamine Content. Animals (n = 9–22 per genotype, age-matched,age between 9 and 37 wk) were decapitated under deep iso-flurane anesthesia, and their brains were rapidly dissected andsliced into 1-mm slabs on ice. Biopsy specimens were taken fromthe dorsomedial and dorsolateral striatum by using disposablebiopsy punches with 1.5 mm diameter at anterior–posteriorbregma coordinates of +0.5 to −0.5, and were stored at −80 °C.Tissue samples from each region were homogenized by ultra-sonication in 750 μL 0.1 N perchloric acid at 4 °C immediatelyafter processing, and 100 μL of the homogenates were thenadded to equal volumes of 1 N sodium hydroxide for measuringprotein content. The remaining homogenates were centrifugedat 17,000 × g and 4 °C for 10 min. Perchloric acid extracts wereseparated on a column (Prontosil 120–3-C18-SH; length 150 mm,inner diameter 3 mm; Bischoff Analysentechnik und Geräte) at
Schreiweis et al. www.pnas.org/cgi/content/short/1414542111 2 of 8

a flow rate of 0.55 mL/min. The mobile phase consisted of 80 mMsodium dihydrogen phosphate, 0.85 mM octane-1-sulfonic acidsodium salt, 0.5 mM EDTA disodium salt, 0.92 mM phosphoricacid, and 4% 2-propanol (all chemicals from Merck). Dopaminewas detected by using an electrochemical detector (41000;Chromsystems Instruments and Chemicals) at an electrode po-tential of 0.8 V. Sample analysis was performed based on peakareas by using a computer-based chromatography data system(CSW 1.7; DataApex) in relation to the mean of two dopa-mine calibration solutions (0.1 M perchloric acid containing 1 mMDA injected into the HPLC system before and after sampleanalysis). Statistical analyses were done on log2-transformed do-pamine amounts per milligram of protein normalized per region,sex, and batch.
In Situ Electrophysiology. Recording procedures. Brains of mice agedpostnatal day (P)21–P53 were prepared into ice-cold sucrose-based cutting solution (85 mM sucrose, 60 mM NaCl, 3.5 mMKCl, 6 mM MgCl2, 0.5 mM CaCl2, 38 mM NaHCO3, 1.25 mMNaH2PO4, 10 mM Hepes, and 25 mM glucose). Coronal slices of250 μm thickness were cut (Vibroslice 7000smz; Campden In-struments), incubated for 30 min at 35 °C in artificial cerebro-spinal fluid (120 mM NaCl, 3.5 mM KCl, 1 mM MgCl2, 2 mMCaCl2, 30 mM NaHCO3, 1.25 mM NaH2PO4, and 15 mM glucose)supplemented with 5 mM Hepes, and allowed to recover for atleast 40 min.Medium spiny neurons (MSNs) were identified according to
the methods used by Pawlak and Kerr (17). Their activity wasrecorded in the current-clamp configuration with the bridgemode enabled (EPC-10 amplifier; Patch- and Fitmaster soft-ware; HEKA). The internal solution contained K-gluconate (150mM), NaCl (10 mM), MgATP (3 mM), GTP (0.5 mM), Hepes(10 mM), and EGTA (0.05 mM) adjusted to pH 7.3, and 310mOsm with the liquid junction potential (15 mV) correctedonline. Slices were perfused (2–3 mL/min, artificial cerebrospinalfluid, 21–24 °C) in presence of the GABA(A) receptor blockerSR-95531 (GABAzine). All solutions were continuously bubbledwith carbogen (95% O2 and 5% CO2). All drugs were obtainedfrom Sigma. Aliquots were diluted in water and used at thefollowing final concentrations: SR-95531 10 μM, sulpiride 20μM, APV 50 μM, and MK-801 1 mM.Cortical excitatory afferents where stimulated with a saline
solution-filled theta-glass electrode typically ∼100–150 μm fromthe MSN cell body. A bipolar voltage pulse (0.1 ms, 5–30 V) at0.33–0.2 Hz induced subthreshold excitatory postsynaptic po-tentials (4–8 mV). Such low-amplitude stimulation was chosen toavoid inducing confounding voltage-gated calcium conductancespresent in MSNs (18, 19). Following 15 min baseline recording,MSNs were slightly depolarized to −70 mV by equivalent in-jection of positive current. Synaptic plasticity was then inducedby a high-frequency protocol (four 100-Hz tetani, 3 s long, sep-arated by 30 s), after which the cells were recorded under controlconditions for at least another 30–40 min. For an enhanceddepolarization to −15 mV in a subset of experiments, voltage-
clamp was applied and stimulus duration doubled from 100 μs to200 μs during tetani. Recordings were excluded from analysiswhen initial series resistance was more than 30 MΩ or inputresistance changed by more than 25% during recordings. Inputresistance was calculated from a voltage step of 1 mV (voltageclamp) or 50 pA (current clamp), respectively.To determine NMDA to AMPA ratios synaptic currents were
stimulated as described earlier and measured by using Cs-basedelectrode solution [Cs-gluconate (140 mM), NaCl (10 mM), Mg-ATP (4 mM), GTP (0.5 mM), Hepes (10 mM), and EGTA (0.05mM)] supplemented with tetraethylammonium chloride (TEA)(5 mM) and QX-314 (5 mM, added fresh) to block confoundingpotassium and sodium currents. Cells were voltage-clamped at−60 and +60 mV and the ratio of the conductances was calcu-lated after remaining voltage errors had been corrected.Statistical analysis. Excitatory postsynaptic potential amplitudeswere normalized to a mean baseline level at t −10 to 0 min. LTDmagnitude of individual cells was calculated by averaging am-plitudes 30–40 min after induction. Control data included sevencells per genotype of the dorsolateral striatum from a previousstudy (20), which were not significantly different from the cells ofthe according genotype recorded for this study (all P > 0.3 inRMA). Data were analyzed using one- or two-way ANOVA (Origin9.0; Microcal) and RMA (SPSS version 16.00) with Greenhouse–Geisser correction implemented in SPSS to adjust the degrees offreedom when the sphericity assumption was violated.
Statistical Remarks About the Use of a RMA and a GLMM. All maze-learning data were analyzed by using a traditional RMA ap-proach. However, such analysis does not allow for including morethan one random effect (e.g., subject and batch), nor does it allowfor missing cells (e.g., certain combinations of batch, genotype,and sex are missing in our data), and it may suffer from heavilyunbalanced designs (e.g., different numbers of individuals percombination of genotype and sex). Most crucially, although, in anRMA with day included as a within-subjects factor (i.e., a cate-gorical predictor), the question of learning (i.e., the degree ofimprovement over the succession of trials) is not addressed ad-equately because the analysis does not take the order of days intoaccount and any rearrangement or relabeling of the days will leaveresults unaltered. Because of the various advantages of GLMMscompared with the traditionally applied RMA (4), we addition-ally used a GLMM approach. GLMMs allow for random effectswith more complex structures (e.g., subject nested in genotype)and can deal better with unbalanced designs and empty cells.Furthermore, they allow for day being treated as a covariate (i.e.,a numerical predictor) and, hence, can address hypotheses aboutlearning directly. Furthermore, GLMMs allow for modeling re-sponses with non-Gaussian error distribution (e.g., Poisson orbinomial). This provides the opportunity to analyze a binaryresponse (correct choice or not) (9) more appropriately thanwith the use of an ANOVA after having turned it into proportioncorrect responses (6).
1. Enard W, et al. (2009) A humanized version of Foxp2 affects cortico-basal gangliacircuits in mice. Cell 137(5):961–971.
2. Groszer M, et al. (2008) Impaired synaptic plasticity and motor learning in mice witha point mutation implicated in human speech deficits. Curr Biol 18(5):354–362.
3. Thorn CA, Atallah H, HoweM, Graybiel AM (2010) Differential dynamics of activity changesin dorsolateral and dorsomedial striatal loops during learning. Neuron 66(5):781–795.
4. Baayen RH (2009) Analyzing Linguistic Data: A Practical Introduction to StatisticsUsing R (Cambridge Univ Press, Cambridge, UK).
5. Baayen RH, Davidson DJ, Bates DM (2008) Mixed-effects modeling with crossedrandom effects for subjects and items. J Mem Lang 59:390–412.
6. Jaeger TF (2008) Categorical data analysis: Away from ANOVAs (transformation ornot) and towards logit mixed models. J Mem Lang 59(4):434–446.
7. Bates D, Maechler M (2010) lme4: Linear mixed-effects models using S4 classes. Rpackage version 0.999375-35 (R Foundation for Statistical Computing, Vienna).
8. Dobson AJ (2002) An Introduction to Generalized Linear Models (Chapman andHall/CRC, Boca Raton, FL).
9. Bolker BM, et al. (2009) Generalized linear mixed models: A practical guide forecology and evolution. Trends Ecol Evol 24(3):127–135.
10. Schielzeth H, Forstmeier W (2009) Conclusions beyond support: Overconfidentestimates in mixed models. Behav Ecol 20(2):416–420.
11. Baayen RH (2010) languageR: Data sets and functions with “Analyzing LinguisticData: A practical introduction to statistics.” R package version 1.0. (R Foundation forStatistical Computing, Vienna).
12. Meyer M, Kircher M (2010) Illumina sequencing library preparation for highlymultiplexed target capture and sequencing. Cold Spring Harb Protoc 2010(6):pdbprot5448.
13. Anders S, Huber W (2010) Differential expression analysis for sequence count data.Genome Biol 11(10):R106.
Schreiweis et al. www.pnas.org/cgi/content/short/1414542111 3 of 8

14. Benjamini Y, Hochberg Y (1995) Controlling the false discovery rate: A practical andpowerful approach to multiple testing. J R Stat Soc, B 57(1):289–300.
15. Xiao Y, et al. (2014) A novel significance score for gene selection and ranking.Bioinformatics 30(6):801–807.
16. Prüfer K, et al. (2007) FUNC: A package for detecting significant associations betweengene sets and ontological annotations. BMC Bioinformatics 8:41.
17. Pawlak V, Kerr JN (2008) Dopamine receptor activation is required for corticostriatalspike-timing-dependent plasticity. J Neurosci 28(10):2435–2446.
18. Carter AG, Sabatini BL (2004) State-dependent calcium signaling in dendritic spines ofstriatal medium spiny neurons. Neuron 44(3):483–493.
19. McRory JE, et al. (2001) Molecular and functional characterization of a family of ratbrain T-type calcium channels. J Biol Chem 276(6):3999–4011.
20. Reimers-Kipping S, Hevers W, Pääbo S, Enard W (2011) Humanized Foxp2 specificallyaffects cortico-basal ganglia circuits. Neuroscience 175:75–84.
0
50
100
150
200
250
300
Late
ncy
to fa
ll [s
]
1 Days32
101101101 Trials
Foxp2hum/hum Foxp2wt/wt
Fig. S1. Mice expressing humanized Foxp2 protein and their WT littermates acquire an accelerating rotarod task comparably. Across three consecutive days—the training periods that had previously been used to measure motor skill acquisition—with 10 daily trials (x axis), the Foxp2hum/hum (♦) and Foxp2wt/wt (♢) mice(n = 9 per genotype) improved their performance equally well (GLMM, likelihood ratio test for interaction of training day and genotype interaction: χ2 = 6.15,df = 4, P = 0.19), as indicated by increases in latencies to fall off the rod. Error bars indicate ±SEM.
A
0
2
4
6
5 10
Tim
e ru
nnin
g [h
r]
0
50
150
250
5 10Days
Bou
t len
gth
[s]
0
100
200
300
5 10Days
Bou
t num
ber /
d
0
1
2
3
5 10Days
Spe
ed [k
m/h
]
B
C DDays
Foxp2hum/hum Foxp2wt/wt
Fig. S2. Mutant and WT mice show comparable improvement on a voluntary motor skill learning task, the tilted running wheel. Across 14 d (x axis), Foxp2hum/hum
(♦) and Foxp2wt/wt (♢) mice did not differ in the time spent running (A; GLMM, χ2 = 7.26, df = 8, P = 0.51), length of individual running bouts (B; GLMM, χ2 = 5.95, df = 8,P = 0.65), total number of running bouts per day (C; GLMM, χ2 = 6.5, df = 8, P = 0.65), or running speed (D; GLMM, χ2 = 10.87, df = 8, P = 0.32).
Schreiweis et al. www.pnas.org/cgi/content/short/1414542111 4 of 8
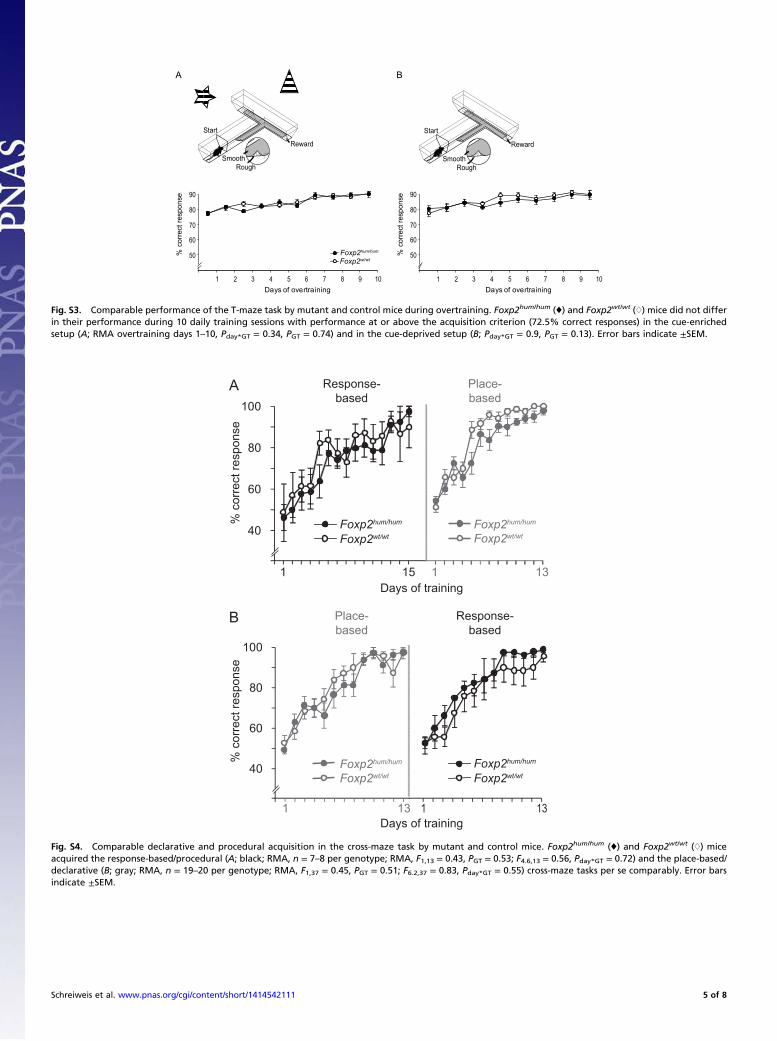
Smooth
Reward
Rough
Start
A B
Smooth
Reward
Rough
Start
50
60
70
80
90
1 2 3 4 5 6 7 8 9 10Days of overtraining
% c
orre
ct re
spon
se
50
60
70
80
90
1 2 3 4 5 6 7 8 9 10Days of overtraining
% c
orre
ct re
spon
se
Foxp2hum/hum Foxp2wt/wt
Fig. S3. Comparable performance of the T-maze task by mutant and control mice during overtraining. Foxp2hum/hum (♦) and Foxp2wt/wt (♢) mice did not differin their performance during 10 daily training sessions with performance at or above the acquisition criterion (72.5% correct responses) in the cue-enrichedsetup (A; RMA overtraining days 1–10, Pday*GT = 0.34, PGT = 0.74) and in the cue-deprived setup (B; Pday*GT = 0.9, PGT = 0.13). Error bars indicate ±SEM.
B
40
60
80
100
1 13 1 13
40
60
80
100
1 15 1 13Days of training
Foxp2hum/hum Foxp2wt/wt
Foxp2hum/hum Foxp2wt/wt
Foxp2hum/hum Foxp2wt/wt
Foxp2hum/hum Foxp2wt/wt
Days of training
A
% c
orre
ct re
spon
se%
cor
rect
resp
onse
Place-based
Response-based
Place-based
Response-based
Fig. S4. Comparable declarative and procedural acquisition in the cross-maze task by mutant and control mice. Foxp2hum/hum (♦) and Foxp2wt/wt (♢) miceacquired the response-based/procedural (A; black; RMA, n = 7–8 per genotype; RMA, F1,13 = 0.43, PGT = 0.53; F4.6,13 = 0.56, Pday*GT = 0.72) and the place-based/declarative (B; gray; RMA, n = 19–20 per genotype; RMA, F1,37 = 0.45, PGT = 0.51; F6.2,37 = 0.83, Pday*GT = 0.55) cross-maze tasks per se comparably. Error barsindicate ±SEM.
Schreiweis et al. www.pnas.org/cgi/content/short/1414542111 5 of 8

A B
Num
ber o
f enr
iche
d pa
thw
ays
Dorsolateral (DLS)
Dorsomedial (DMS)
2000
1500
1000
500
*
ns
0
D
DLSDMS
0.70.6
0.5
0.4
0.30.2
0.1
Neurotransmitter transporter activityCellular response to vascular endothelial growth factor stimulusInsulin receptor binding
Excitatory synapse
Regulation of gene silencing
0.16
0.14
0.12
0.10
0.08
DLSDMS
Signaling
Single organism signaling
Cell communication
Cell periphery
Protein binding
Single organismcellular process
log2 rank enrichm
ent value
log2 rank enrichm
ent value
Heterophilic cell-cell adhesion
Voltage-gated calcium channel activity
Laminin binding
Demethylase activity
Nucleus localization
DLSDMS
C
Fig. S5. Different gene expression patterns in the dorsomedial and dorsolateral striatum. (A) Functional categories showed significant enrichment (Benjamini–Hochberg-corrected false discovery rate < 0.05) only in the dorsomedial striatum (DMS) and not the dorsolateral striatum (DLS; *Pperm < 0.05). ns, not significant. Toidentify differentially enriched functional categories in dorsomedial striatum and dorsolateral striatum, we first ranked genes based on fold change as well asstatistical significance and then applied a Wilcoxon rank-sum test for each region, differentiating between genes expressed higher or lower in Foxp2hum/hum mice.The average rank of genes in a category was used to calculate the rank enrichment value. (B) Results of the five most down-regulated categories in dorsomedialstriatum according to rank enrichment value. Heat map represents logarithmically scaled rank enrichment values. (C) Corresponding heat map of rank enrichmentvalues on a logarithmic scale of the five most down-regulated categories in dorsolateral striatum. (D) Logarithmically scaled heat map of the most significantlydown-regulated categories according to significance resulting from permutation testing in dorsomedial striatum and dorsolateral striatum.
0 10 20 30 40 500,0
0,2
0,4
0,6
0,8
1,0
1,2
Foxp2hum/humFoxp2wt/wtA
0.0
1.0
2.0
3.0
1.0
1.5
2.5
ns
ratio
EP
SP p
ost/
EP
SP
pre
B
wt/wt hum/hum
gN
MD
A /
g AM
PA
Fig. S6. (A) Control recordings obtained without any high-frequency stimulation were stable over a time course of 50 min and showed no significant re-duction in amplitude. (B) NMDA/AMPA ratios recorded in presence of intracellular CsCl, TEA, and QX-314 were not altered in the Foxp2hum/hum mice. (Inset)Example traces at the given holding voltages. (Scale bars: 200 pA, 50 ms.). Symbols indicate time points at which AMPA (▼) and NMDA (▲) amplitudes weremeasured. Error bars indicate ±SEM. ns, not significant.
Schreiweis et al. www.pnas.org/cgi/content/short/1414542111 6 of 8

Declarative learning Procedural learning
Foxp2hum/hum
Foxp2wt/wt
Fig. S7. Working model describing how humanized Foxp2 might alter striatum-dependent learning. Schematic diagrams showing transverse sections throughthe striatum of a mouse brain, symbolizing with different densities of color the activity of the dorsomedial (red) and dorsolateral (blue) striatum during theprogression of learning with declarative and procedural strategies. The dorsomedial striatum is involved initially when declarative learning plays a pre-dominant role, but as the behavior is progressively automatized, the dorsolateral striatum becomes increasingly more involved. Alterations of striatum-dependent functions in Foxp2hum/hum mice are proposed to rely on a more rapid transition from declarative to procedural learning than observed in WTlittermates, which need longer times to reach the same state.
Table S1. Results of the GLMM analysis performed on theT-maze data in the environment enriched for spatial cues
Predictor term* Estimate SE z-value P value
Intercept* 0.74 0.07 † †
Training day* 0.57 0.05 † †
Trial* 0.05 0.02 † †
Genotype* −0.38 0.08 † †
Sex* −0.18 0.08 † †
Stimulus* 0.16 0.04 † †
Trial:stimulus* 0.08 0.03 2.63 0.009Training day:sex* −0.11 0.05 −2.17 0.03Training day:trial* 0.05 0.02 3.28 0.001Training day:genotype* −0.2 0.05 −3.9 < 10−4
Genotype:stimulus* 0.17 0.06 2.82 0.005
*Predictor variables and their interaction terms of the final statistical model.Interactions are marked by a colon between the names of the predictors.†Not indicated because it has no meaningful interpretation.
Table S2. Results of the GLMM analysis performed on theT-maze data in the environment deprived of spatial cues
Predictor term* Estimate SE z-Value P Value
Intercept 0.76 0.10 † †
Training day 0.54 0.06 † †
Trial 0.13 0.03 † †
Genotype 0.13 0.14 † †
Stimulus < −0.01 0.04 † †
Training day:trial 0.07 0.02 3.31 < 0.001Training day:genotype 0.17 0.07 2.24 0.025Training day:stimulus −0.28 0.04 −6.97 < 10−11
*Predictor variables and their interaction terms of the final statistical model.Interactions are marked by a colon between the names of the predictors.†Not indicated because it has no meaningful interpretation.
Schreiweis et al. www.pnas.org/cgi/content/short/1414542111 7 of 8

Table S3. Results of the GLMM analysis performed on the place-response-switch data in the cross maze
Predictor term* Estimate SE z-Value P Value
Intercept −0.73 0.55 † †
Training day 0.83 0.2 4.17 < 0.0001Informative trial 0.34 0.19 1.83 0.067Genotype −1.79 0.84 −2.14 0.033
*Predictor variables and their interaction terms of the final statistical model.†Not indicated because it has no meaningful interpretation. Shown areonly the significant predictors; interactions are not shown as a result ofnonsignificance.
Other Supporting Information Files
Dataset S1 (PDF)
Schreiweis et al. www.pnas.org/cgi/content/short/1414542111 8 of 8

Root Node Description GO_ID nGenes_root nGenes_nodes Rank Enrichment_DMS P-Value_DMS Permutation P-Value_DMS FDR_DMS Rank Enrichment_DLS P-Value_DLS Permutation P-Value_DLS FDR_DLS
biological_process signaling GO:0023052 12849 3688 1.124814161 1.80E-50 0.018018018 0 1.103631035 1.99E-35 0.081081081 0
biological_process single organism signaling GO:0044700 12849 3688 1.124814161 1.80E-50 0.018018018 0 1.103631035 1.99E-35 0.081081081 0
biological_process cell communication GO:0007154 12728 3809 1.121673243 5.02E-50 0.018018018 0 1.09834368 2.19E-33 0.086486486 0
molecular_function protein binding GO:0005515 7725 9136 1.059472893 3.07E-48 0.012612613 0 1.054305778 1.46E-40 0.037837838 0
cellular_component cell periphery GO:0071944 13652 3171 1.130333106 1.61E-45 0.03963964 0 1.08512878 1.52E-20 0.153153153 0
biological_process single-organism process GO:0044699 7439 9098 1.05655356 2.08E-44 0.018018018 0 1.047440309 7.61E-32 0.082882883 0
biological_process single-multicellular organism process GO:0044707 12313 4224 1.106766626 2.13E-44 0.009009009 0 1.084105815 2.60E-28 0.091891892 0
cellular_component plasma membrane GO:0005886 13748 3075 1.130781644 3.37E-44 0.036036036 0 1.085530739 5.07E-20 0.153153153 0
biological_process multicellular organismal process GO:0032501 12190 4347 1.101539945 7.23E-42 0.005405405 0 1.081910078 6.11E-28 0.088288288 0
biological_process single-organism cellular process GO:0044763 8262 8275 1.06008194 3.35E-41 0.01981982 0 1.05301004 1.61E-32 0.075675676 0
biological_process system development GO:0048731 13604 2933 1.129460962 3.51E-41 0.005405405 0 1.09895739 6.97E-25 0.09009009 0
biological_process single-organism developmental process GO:0044767 13323 3214 1.116163701 2.67E-37 0.005405405 0 1.096638917 2.01E-26 0.059459459 0
biological_process signal transduction GO:0007165 13212 3325 1.113622177 3.11E-37 0.018018018 0 1.103009081 5.89E-31 0.068468468 0
biological_process anatomical structure development GO:0048856 13107 3430 1.111034483 5.49E-37 0.005405405 0 1.093275165 1.10E-26 0.072072072 0
biological_process developmental process GO:0032502 12690 3847 1.103045783 6.58E-37 0.007207207 0 1.089782966 1.70E-28 0.07027027 0
biological_process multicellular organismal development GO:0007275 13146 3391 1.111522977 8.64E-37 0.007207207 0 1.092000926 1.15E-25 0.091891892 0
biological_process response to stimulus GO:0050896 11144 5393 1.081351402 9.91E-37 0.009009009 0 1.059205208 2.29E-20 0.093693694 0
biological_process regulation of cell communication GO:0010646 14778 1759 1.158312667 2.37E-34 0.014414414 0 1.132015192 1.75E-24 0.064864865 0
biological_process regulation of signaling GO:0023051 14783 1754 1.157477731 6.58E-34 0.014414414 0 1.133642562 5.72E-25 0.064864865 0
biological_process regulation of multicellular organismal process GO:0051239 14857 1680 1.160577761 1.28E-33 0.003603604 0 1.114075756 6.47E-18 0.084684685 0
biological_process nervous system development GO:0007399 15096 1441 1.173471104 3.75E-33 0.021621622 0 1.140380001 2.21E-22 0.113513514 0
biological_process anatomical structure morphogenesis GO:0009653 14762 1775 1.153846701 7.31E-33 0.009009009 0 1.136057478 3.96E-26 0.075675676 0
biological_process cellular developmental process GO:0048869 14039 2498 1.118358783 5.00E-29 0.001801802 0 1.106478397 7.30E-24 0.045045045 0
biological_process cell differentiation GO:0030154 14225 2312 1.123504135 7.00E-29 0.001801802 0 1.104903731 2.26E-21 0.055855856 0
cellular_component membrane GO:0016020 10364 6459 1.06161847 4.23E-28 0.082882883 0 1.040995674 1.79E-13 0.118918919 0
biological_process biological regulation GO:0065007 9127 7410 1.05401577 1.11E-27 0.073873874 0 1.05583386 1.92E-29 0.073873874 0
biological_process cell development GO:0048468 15136 1401 1.159084706 2.13E-27 0.001801802 0 1.129036792 1.12E-18 0.057657658 0
biological_process regulation of developmental process GO:0050793 15202 1335 1.163049985 2.60E-27 0.003603604 0 1.124106517 1.29E-16 0.048648649 0
biological_process cellular response to stimulus GO:0051716 12365 4172 1.082660838 5.40E-27 0.025225225 0 1.079933155 2.28E-25 0.063063063 0
biological_process regulation of signal transduction GO:0009966 15000 1537 1.149022572 1.14E-26 0.012612613 0 1.131791246 2.81E-21 0.059459459 0
biological_process transmission of nerve impulse GO:0019226 16037 500 1.267340031 3.71E-26 0.030630631 0 1.143796267 7.78E-09 0.183783784 0
biological_process multicellular organismal signaling GO:0035637 16014 523 1.260155487 5.81E-26 0.037837838 0 1.150484759 6.92E-10 0.167567568 0
biological_process biological adhesion GO:0022610 15781 756 1.21194752 2.50E-25 0.021621622 0 1.148081247 2.62E-13 0.108108108 0
cellular_component neuron part GO:0097458 16011 812 1.202572505 5.99E-25 0.09009009 0 1.177616939 1.28E-19 0.073873874 0
biological_process cell adhesion GO:0007155 15787 750 1.210060847 1.01E-24 0.023423423 0 1.15082737 1.22E-13 0.100900901 0
cellular_component neuron projection GO:0043005 16103 720 1.214530491 1.09E-24 0.09009009 0 1.181515468 3.27E-18 0.09009009 0
biological_process regulation of response to stimulus GO:0048583 14617 1920 1.126191652 1.13E-24 0.007207207 0 1.101249012 1.50E-16 0.073873874 0
molecular_function binding GO:0005488 4551 12310 1.027493776 1.33E-24 0.075675676 0 1.025489643 2.05E-21 0.093693694 0
biological_process regulation of biological process GO:0050789 9462 7075 1.052486536 2.53E-24 0.091891892 0 1.057722166 5.17E-29 0.072072072 0
biological_process neurogenesis GO:0022008 15568 969 1.181631341 2.96E-24 0.007207207 0 1.141364934 1.99E-15 0.108108108 0
cellular_component cell junction GO:0030054 16146 677 1.217079231 8.75E-24 0.054054054 0 1.191953333 5.22E-19 0.100900901 0
biological_process organ development GO:0048513 14341 2196 1.114316569 1.10E-23 0.007207207 0 1.094133366 1.16E-16 0.088288288 0
biological_process regulation of multicellular organismal development GO:2000026 15477 1060 1.170527109 1.39E-23 0.001801802 0 1.129637724 2.07E-14 0.054054054 0
cellular_component plasma membrane part GO:0044459 15528 1295 1.15301424 1.58E-23 0.012612613 0 1.078089061 2.03E-07 0.207207207 0
biological_process positive regulation of biological process GO:0048518 13602 2935 1.095299517 3.10E-23 0.007207207 0 1.080536091 3.96E-17 0.064864865 0
biological_process cell surface receptor signaling pathway GO:0007166 14722 1815 1.12568573 4.21E-23 0.014414414 0 1.099739888 3.08E-15 0.10990991 0
cellular_component synapse GO:0045202 16321 502 1.249335239 4.44E-23 0.081081081 0 1.213141431 2.27E-17 0.104504505 0
biological_process regulation of biological quality GO:0065008 14585 1952 1.119872457 7.76E-23 0.014414414 0 1.094087245 8.82E-15 0.043243243 0
cellular_component cell projection GO:0042995 15588 1235 1.154405066 8.03E-23 0.030630631 0 1.118193042 3.88E-14 0.113513514 0
biological_process regulation of cellular process GO:0050794 9823 6714 1.052970643 8.87E-23 0.100900901 0 1.06060422 3.22E-29 0.077477477 0
biological_process generation of neurons GO:0048699 15641 896 1.180688439 2.91E-22 0.010810811 0 1.146088625 3.40E-15 0.108108108 0
biological_process system process GO:0003008 15335 1202 1.154165197 3.50E-22 0.036036036 0 1.095529307 1.28E-09 0.171171171 0
biological_process cellular component morphogenesis GO:0032989 15721 816 1.186287035 1.64E-21 0.018018018 0 1.15572304 1.37E-15 0.102702703 0
biological_process neuron projection development GO:0031175 16010 527 1.233786191 1.73E-21 0.028828829 0 1.177993619 3.17E-13 0.136936937 0
biological_process locomotion GO:0040011 15634 903 1.175978098 2.25E-21 0.012612613 0 1.130165135 1.61E-12 0.106306306 0
biological_process cell morphogenesis GO:0000902 15775 762 1.192041122 2.70E-21 0.01981982 0 1.16270907 8.25E-16 0.113513514 0
biological_process regulation of cell differentiation GO:0045595 15593 944 1.171270209 3.11E-21 0.001801802 0 1.130494694 4.29E-13 0.05045045 0
biological_process cellular component movement GO:0006928 15575 962 1.167632933 8.52E-21 0.009009009 0 1.114926071 9.97E-11 0.111711712 0
biological_process neuron differentiation GO:0030182 15726 811 1.183341506 8.99E-21 0.023423423 0 1.147035953 5.14E-14 0.117117117 0
biological_process neuron projection morphogenesis GO:0048812 16161 376 1.270817012 1.77E-20 0.034234234 0 1.195709274 1.47E-11 0.153153153 0
biological_process synaptic transmission GO:0007268 16133 404 1.260701113 1.98E-20 0.043243243 0 1.151465375 4.68E-08 0.165765766 0
biological_process cell morphogenesis involved in differentiation GO:0000904 16047 490 1.235372977 2.57E-20 0.01981982 0 1.181739978 7.54E-13 0.131531532 0
biological_process localization GO:0051179 12788 3749 1.075938483 2.65E-20 0.05045045 0 1.061106406 8.58E-14 0.118918919 0
biological_process neuron development GO:0048666 15911 626 1.205914905 4.62E-20 0.027027027 0 1.15696561 2.03E-12 0.136936937 0
biological_process positive regulation of cellular process GO:0048522 13874 2663 1.092179868 1.18E-19 0.007207207 0 1.083524208 1.81E-16 0.064864865 0
cellular_component membrane part GO:0044425 11904 4919 1.061903831 1.95E-19 0.100900901 0 1.033896604 4.91E-07 0.209009009 0
biological_process cell migration GO:0016477 15836 701 1.190427106 2.25E-19 0.007207207 0 1.144967305 5.47E-12 0.095495495 0
molecular_function protein tyrosine kinase activity GO:0004713 16401 460 1.235242884 3.97E-19 0.005405405 0 1.206018419 4.25E-15 0.055855856 0
biological_process cell morphogenesis involved in neuron differentiation GO:0048667 16171 366 1.262841815 6.39E-19 0.034234234 0 1.198548538 1.43E-11 0.136936937 0
biological_process neurological system process GO:0050877 15662 875 1.167255046 6.52E-19 0.064864865 0 1.08022817 1.20E-05 0.248648649 0
biological_process intracellular signal transduction GO:0035556 14889 1648 1.118661589 7.28E-19 0.028828829 0 1.107712952 7.21E-16 0.09009009 0
biological_process protein phosphorylation GO:0006468 15448 1089 1.146274495 2.56E-18 0.012612613 0 1.114713939 5.85E-12 0.106306306 0
biological_process response to chemical stimulus GO:0042221 14344 2193 1.098580411 4.53E-18 0.016216216 0 1.068068425 1.53E-09 0.117117117 0
biological_process cardiovascular system development GO:0072358 15828 709 1.181375157 6.14E-18 0.016216216 0 1.125641466 1.58E-09 0.131531532 0
biological_process circulatory system development GO:0072359 15828 709 1.181375157 6.14E-18 0.016216216 0 1.125641466 1.58E-09 0.131531532 0
biological_process regulation of cell development GO:0060284 15905 632 1.192106985 7.34E-18 0.001801802 0 1.159328511 7.52E-13 0.052252252 0
biological_process cell motility GO:0048870 15778 759 1.173372172 1.23E-17 0.009009009 0 1.128806635 1.56E-10 0.099099099 0
biological_process localization of cell GO:0051674 15778 759 1.173372172 1.23E-17 0.009009009 0 1.128806635 1.56E-10 0.099099099 0
biological_process cell-cell signaling GO:0007267 15886 651 1.187042525 1.67E-17 0.043243243 0 1.124650979 9.53E-09 0.176576577 0
biological_process regulation of phosphate metabolic process GO:0019220 15485 1052 1.144873748 2.04E-17 0.025225225 0 1.118495879 3.01E-12 0.082882883 0

biological_process regulation of phosphorus metabolic process GO:0051174 15482 1055 1.144626058 2.07E-17 0.027027027 0 1.118437827 2.86E-12 0.082882883 0
biological_process positive regulation of metabolic process GO:0009893 14864 1673 1.112484446 2.13E-17 0.007207207 0 1.111024274 5.38E-17 0.043243243 0
biological_process axonogenesis GO:0007409 16225 312 1.268838062 5.05E-17 0.016216216 0 1.173525009 4.17E-08 0.171171171 0
biological_process regulation of nervous system development GO:0051960 16090 447 1.222545425 7.16E-17 0.003603604 0 1.183946644 4.27E-12 0.079279279 0
biological_process positive regulation of cellular metabolic process GO:0031325 14964 1573 1.114407269 7.17E-17 0.005405405 0 1.109902035 1.04E-15 0.045045045 0
biological_process enzyme linked receptor protein signaling pathway GO:0007167 16004 533 1.201947904 1.12E-16 0.005405405 0 1.17237693 1.22E-12 0.057657658 0
biological_process positive regulation of macromolecule metabolic process GO:0010604 14987 1550 1.114207928 1.41E-16 0.007207207 0 1.115791774 5.47E-17 0.041441441 0
biological_process regulation of system process GO:0044057 16112 425 1.225900926 1.52E-16 0.016216216 0 1.125520008 2.80E-06 0.165765766 0
biological_process regulation of anatomical structure morphogenesis GO:0022603 15992 545 1.197930123 2.00E-16 0.007207207 0 1.153058059 1.55E-10 0.082882883 0
biological_process central nervous system development GO:0007417 15880 657 1.178432882 3.13E-16 0.014414414 0 1.148030036 9.97E-12 0.097297297 0
cellular_component intrinsic to membrane GO:0031224 12607 4216 1.062155047 3.38E-16 0.118918919 0 1.038664263 2.54E-07 0.205405405 0
molecular_function protein kinase activity GO:0004672 16283 578 1.190388518 3.58E-16 0.007207207 0 1.163553526 2.10E-12 0.045045045 0
biological_process cell projection organization GO:0030030 15762 775 1.163202586 3.80E-16 0.034234234 0 1.146470001 2.34E-13 0.118918919 0
biological_process vasculature development GO:0001944 16054 483 1.206781187 6.81E-16 0.010810811 0 1.137247888 5.71E-08 0.126126126 0
cellular_component synapse part GO:0044456 16458 365 1.237886529 8.68E-16 0.099099099 0 1.188654811 1.38E-10 0.135135135 0
biological_process cellular component organization GO:0016043 13119 3418 1.069767092 1.08E-15 0.018018018 0 1.068358908 3.88E-15 0.05045045 0
biological_process phosphorylation GO:0016310 15318 1219 1.125985894 1.23E-15 0.007207207 0 1.097136337 5.19E-10 0.104504505 0
cellular_component dendrite GO:0030425 16439 384 1.230023619 1.42E-15 0.127927928 0 1.20098213 2.58E-12 0.084684685 0
biological_process anatomical structure formation involved in morphogenesis GO:0048646 15754 783 1.15902968 1.43E-15 0.014414414 0 1.117193927 2.95E-09 0.108108108 0
cellular_component integral to membrane GO:0016021 12715 4108 1.061404481 2.23E-15 0.126126126 0 1.041231707 7.01E-08 0.194594595 0
biological_process blood vessel development GO:0001568 16079 458 1.206572857 4.07E-15 0.018018018 0 1.141265852 5.47E-08 0.122522523 0
cellular_component intrinsic to plasma membrane GO:0031226 16264 559 1.186301067 4.26E-15 0.030630631 0 1.134683833 1.01E-08 0.14954955 0
biological_process regulation of transmission of nerve impulse GO:0051969 16331 206 1.308987355 5.39E-15 0.023423423 0 1.151262404 7.72E-05 0.189189189 0.00597424
biological_process regulation of synaptic transmission GO:0050804 16350 187 1.324156251 5.74E-15 0.030630631 0 1.170207905 2.51E-05 0.171171171 0.00331208
molecular_function signal transducer activity GO:0004871 15873 988 1.137254703 6.71E-15 0.030630631 0 1.097086981 2.55E-08 0.104504505 0
molecular_function molecular transducer activity GO:0060089 15873 988 1.137254703 6.71E-15 0.030630631 0 1.097086981 2.55E-08 0.104504505 0
biological_process tissue development GO:0009888 15311 1226 1.12174677 8.35E-15 0.007207207 0 1.123384212 3.73E-15 0.063063063 0
biological_process regulation of neurogenesis GO:0050767 16138 399 1.218829915 9.00E-15 0.003603604 0 1.199056144 1.57E-12 0.066666667 0
biological_process regulation of cell morphogenesis GO:0022604 16258 279 1.26171881 1.12E-14 0.018018018 0 1.222452101 4.27E-11 0.068468468 0
biological_process regulation of localization GO:0032879 15328 1209 1.122015524 1.15E-14 0.048648649 0 1.105700936 1.90E-11 0.093693694 0
molecular_function receptor activity GO:0004872 15968 893 1.143251331 1.28E-14 0.037837838 0 1.084804376 3.23E-06 0.185585586 0
biological_process regulation of neurological system process GO:0031644 16314 223 1.291960243 1.45E-14 0.025225225 0 1.140814425 0.00012268 0.201801802 0.00831865
molecular_function GTPase regulator activity GO:0030695 16468 393 1.218731002 1.48E-14 0.03963964 0 1.239290064 4.62E-17 0.025225225 0
biological_process tissue morphogenesis GO:0048729 16085 452 1.203477992 1.51E-14 0.003603604 0 1.202661955 1.91E-14 0.03963964 0
cellular_component cell projection part GO:0044463 16196 627 1.171538441 1.69E-14 0.032432432 0 1.164337515 1.88E-13 0.066666667 0
biological_process phosphate-containing compound metabolic process GO:0006796 14163 2374 1.083072547 1.79E-14 0.037837838 0 1.063205545 4.12E-09 0.104504505 0
molecular_function phosphotransferase activity, alcohol group as acceptor GO:0016773 16169 692 1.162473671 2.02E-14 0.016216216 0 1.142911597 1.47E-11 0.063063063 0
biological_process transmembrane receptor protein tyrosine kinase signaling pathway GO:0007169 16202 335 1.234465475 2.97E-14 0.001801802 0 1.150638352 7.01E-07 0.100900901 0
cellular_component integral to plasma membrane GO:0005887 16298 525 1.185780588 3.42E-14 0.034234234 0 1.138186423 1.26E-08 0.145945946 0
biological_process negative regulation of biological process GO:0048519 13836 2701 1.075551517 5.24E-14 0.016216216 0 1.079787118 2.05E-15 0.030630631 0
cellular_component anchoring junction GO:0070161 16622 201 1.298341376 8.50E-14 0.005405405 0 1.190393184 1.28E-06 0.118918919 0
biological_process positive regulation of cell communication GO:0010647 15800 737 1.152676673 1.03E-13 0.001801802 0 1.096556401 1.70E-06 0.140540541 0
biological_process response to organic substance GO:0010033 14925 1612 1.100109364 1.17E-13 0.018018018 0 1.077010368 8.64E-09 0.093693694 0
biological_process phosphorus metabolic process GO:0006793 14121 2416 1.079521227 1.18E-13 0.043243243 0 1.059073569 2.63E-08 0.120720721 0
molecular_function cytoskeletal protein binding GO:0008092 16266 595 1.170126206 1.26E-13 0.014414414 0 1.153008496 2.32E-11 0.066666667 0
biological_process cell projection morphogenesis GO:0048858 16052 485 1.188170396 1.60E-13 0.043243243 0 1.156488179 6.86E-10 0.147747748 0
biological_process negative regulation of developmental process GO:0051093 16049 488 1.187398488 1.69E-13 0.001801802 0 1.102278789 3.56E-05 0.075675676 0.0032691
biological_process intracellular protein kinase cascade GO:0007243 15787 750 1.149908272 1.70E-13 0.003603604 0 1.098553242 8.57E-07 0.106306306 0
biological_process negative regulation of cellular process GO:0048523 14079 2458 1.078123238 1.79E-13 0.012612613 0 1.080411046 3.61E-14 0.037837838 0
cellular_component adherens junction GO:0005912 16634 189 1.303461113 1.84E-13 0.003603604 0 1.219535862 7.31E-08 0.081081081 0
biological_process regulation of neuron differentiation GO:0045664 16208 329 1.228582924 2.02E-13 0.016216216 0 1.20999805 1.33E-11 0.079279279 0
biological_process regulation of cellular component organization GO:0051128 15401 1136 1.119363475 2.58E-13 0.030630631 0 1.126251178 1.11E-14 0.046846847 0
molecular_function kinase activity GO:0016301 16087 774 1.145844315 3.12E-13 0.010810811 0 1.134210118 1.78E-11 0.054054054 0
biological_process regulation of molecular function GO:0065009 15088 1449 1.104054883 3.42E-13 0.01981982 0 1.079651085 1.93E-08 0.117117117 0
biological_process regulation of small GTPase mediated signal transduction GO:0051056 16213 324 1.227928086 3.57E-13 0.028828829 0 1.233859078 8.95E-14 0.05045045 0
biological_process blood vessel morphogenesis GO:0048514 16138 399 1.203711648 4.85E-13 0.012612613 0 1.137158542 7.79E-07 0.122522523 0
biological_process positive regulation of signaling GO:0023056 15802 735 1.148341625 5.17E-13 0.001801802 0 1.095622624 2.18E-06 0.142342342 0
molecular_function nucleoside-triphosphatase regulator activity GO:0060589 16455 406 1.20093469 6.29E-13 0.046846847 0 1.228022169 3.95E-16 0.027027027 0
biological_process MAPK cascade GO:0000165 16085 452 1.189388645 7.67E-13 0.007207207 0 1.108710679 2.46E-05 0.147747748 0.00332307
biological_process tube morphogenesis GO:0035239 16257 280 1.241845414 7.77E-13 0.005405405 0 1.199976333 2.52E-09 0.07027027 0
biological_process negative regulation of cell differentiation GO:0045596 16141 396 1.202609309 7.83E-13 0.001801802 0 1.090610981 0.000785594 0.104504505 0.0328093
biological_process positive regulation of response to stimulus GO:0048584 15600 937 1.129259052 8.57E-13 0.001801802 0 1.060964249 0.000437592 0.172972973 0.0201478
biological_process regulation of cellular component movement GO:0051270 16107 430 1.193767718 8.83E-13 0.01981982 0 1.126500285 2.08E-06 0.136936937 0
biological_process regulation of transcription from RNA polymerase II promoter GO:0006357 15435 1102 1.117399507 1.41E-12 0.007207207 0 1.128384529 1.08E-14 0.036036036 0
biological_process embryo development GO:0009790 15685 852 1.134419192 1.50E-12 0.014414414 0 1.142292677 7.53E-14 0.064864865 0
biological_process tube development GO:0035295 16121 416 1.194691368 1.63E-12 0.007207207 0 1.155434328 1.34E-08 0.099099099 0
biological_process cell part morphogenesis GO:0032990 16038 499 1.177015075 1.77E-12 0.048648649 0 1.150099381 1.85E-09 0.140540541 0
biological_process regulation of MAPK cascade GO:0043408 16138 399 1.198446927 1.82E-12 0.009009009 0 1.096401659 0.000367448 0.205405405 0.0139241
molecular_function actin binding GO:0003779 16524 337 1.215607869 2.18E-12 0.005405405 0 1.145128207 1.57E-06 0.106306306 0
biological_process positive regulation of phosphorus metabolic process GO:0010562 16028 509 1.174335744 2.26E-12 0.005405405 0 1.12218919 6.17E-07 0.122522523 0
biological_process positive regulation of phosphate metabolic process GO:0045937 16028 509 1.174335744 2.26E-12 0.005405405 0 1.12218919 6.17E-07 0.122522523 0
molecular_function small GTPase regulator activity GO:0005083 16595 266 1.24246171 2.53E-12 0.054054054 0 1.254389592 2.18E-13 0.036036036 0
cellular_component dendritic spine GO:0043197 16659 164 1.309591822 2.58E-12 0.073873874 0 1.273116616 5.72E-10 0.073873874 0
cellular_component neuron spine GO:0044309 16659 164 1.309591822 2.58E-12 0.073873874 0 1.273116616 5.72E-10 0.073873874 0
biological_process brain development GO:0007420 16028 509 1.173613466 2.77E-12 0.014414414 0 1.121393259 7.23E-07 0.169369369 0
biological_process Ras protein signal transduction GO:0007265 16183 354 1.209029205 2.87E-12 0.01981982 0 1.216650781 4.76E-13 0.03963964 0
biological_process immune system process GO:0002376 15345 1192 1.110543489 3.39E-12 0.003603604 0 1.063722143 3.81E-05 0.023423423 0.00324795
biological_process epithelial tube morphogenesis GO:0060562 16271 266 1.240037315 4.07E-12 0.003603604 0 1.202565958 3.99E-09 0.084684685 0
cellular_component actin cytoskeleton GO:0015629 16489 334 1.212062974 5.99E-12 0.001801802 0 1.166999724 4.66E-08 0.05045045 0
biological_process single-organism transport GO:0044765 14188 2349 1.074747583 6.26E-12 0.100900901 0 1.055446536 2.52E-07 0.185585586 0
biological_process morphogenesis of an epithelium GO:0002009 16179 358 1.204249367 6.56E-12 0.010810811 0 1.209390751 1.99E-12 0.07027027 0

biological_process behavior GO:0007610 16055 482 1.174201475 8.90E-12 0.081081081 0 1.142648237 1.84E-08 0.145945946 0
molecular_function anion binding GO:0043168 14272 2589 1.070064405 9.61E-12 0.082882883 0 1.073999745 6.78E-13 0.106306306 0
biological_process synapse organization GO:0050808 16417 120 1.352082522 1.01E-11 0.01981982 0 1.266078286 2.02E-07 0.117117117 0
biological_process organ morphogenesis GO:0009887 15818 719 1.140264728 1.36E-11 0.009009009 0 1.139464108 1.76E-11 0.093693694 0
biological_process cell-cell adhesion GO:0016337 16214 323 1.211534116 1.46E-11 0.055855856 0 1.195674163 3.84E-10 0.091891892 0
biological_process regulation of catalytic activity GO:0050790 15431 1106 1.110985524 1.82E-11 0.023423423 0 1.074321525 4.67E-06 0.151351351 0
molecular_function nucleic acid binding transcription factor activity GO:0001071 16150 711 1.140230486 1.83E-11 0.003603604 0 1.116606917 1.87E-08 0.09009009 0
biological_process cellular component organization or biogenesis GO:0071840 12973 3564 1.05663884 1.90E-11 0.023423423 0 1.055763391 3.76E-11 0.048648649 0
molecular_function protein serine/threonine kinase activity GO:0004674 16449 412 1.185664969 1.94E-11 0.005405405 0 1.167795744 1.17E-09 0.052252252 0
cellular_component cytoskeleton GO:0005856 15262 1561 1.091871417 2.04E-11 0.037837838 0 1.095222234 3.92E-12 0.048648649 0
molecular_function sequence-specific DNA binding transcription factor activity GO:0003700 16152 709 1.139980645 2.11E-11 0.003603604 0 1.114819941 3.14E-08 0.093693694 0
biological_process regulation of locomotion GO:0040012 16123 414 1.184776456 2.13E-11 0.023423423 0 1.122974504 5.69E-06 0.136936937 0
molecular_function signaling receptor activity GO:0038023 16120 741 1.136571615 2.26E-11 0.045045045 0 1.099896964 7.28E-07 0.140540541 0
biological_process positive regulation of signal transduction GO:0009967 15847 690 1.141688896 2.27E-11 0.001801802 0 1.092184822 9.16E-06 0.140540541 0
biological_process actin filament-based process GO:0030029 16119 418 1.183530217 2.31E-11 0.030630631 0 1.165037151 1.61E-09 0.077477477 0
biological_process positive regulation of macromolecule biosynthetic process GO:0010557 15491 1046 1.113161703 2.88E-11 0.007207207 0 1.114468161 1.73E-11 0.043243243 0
biological_process transcription from RNA polymerase II promoter GO:0006366 15389 1148 1.107399454 3.21E-11 0.007207207 0 1.122094832 5.54E-14 0.021621622 0
biological_process angiogenesis GO:0001525 16214 323 1.207475525 3.46E-11 0.005405405 0 1.126528366 3.48E-05 0.106306306 0.0032798
biological_process regulation of synaptic plasticity GO:0048167 16442 95 1.384859881 3.61E-11 0.028828829 0 1.255976053 7.32E-06 0.082882883 0
biological_process positive regulation of biosynthetic process GO:0009891 15401 1136 1.107621379 3.75E-11 0.005405405 0 1.107482987 3.96E-11 0.055855856 0
biological_process axon guidance GO:0007411 16406 131 1.327015333 3.79E-11 0.003603604 0 1.212811164 1.14E-05 0.138738739 0
biological_process positive regulation of transcription, DNA-dependent GO:0045893 15623 914 1.120608391 4.08E-11 0.009009009 0 1.129307965 1.63E-12 0.054054054 0
biological_process establishment of localization GO:0051234 13469 3068 1.0610619 4.27E-11 0.099099099 0 1.046859644 3.16E-07 0.16036036 0
biological_process positive regulation of cellular biosynthetic process GO:0031328 15421 1116 1.108214976 4.45E-11 0.005405405 0 1.109569524 2.59E-11 0.052252252 0
biological_process positive regulation of transcription from RNA polymerase II promoter GO:0045944 15892 645 1.144474454 4.50E-11 0.005405405 0 1.142263893 8.64E-11 0.045045045 0
biological_process regulation of cell migration GO:0030334 16168 369 1.192373269 4.80E-11 0.01981982 0 1.117479395 3.86E-05 0.158558559 0.00323745
biological_process cellular response to organic substance GO:0071310 15543 994 1.114887457 4.86E-11 0.010810811 0 1.097953046 1.72E-08 0.086486486 0
molecular_function phospholipid binding GO:0005543 16406 455 1.172531221 5.16E-11 0.066666667 0 1.20416489 1.03E-14 0.052252252 0
biological_process positive regulation of phosphorylation GO:0042327 16093 444 1.174492565 5.39E-11 0.010810811 0 1.12122985 3.64E-06 0.131531532 0
molecular_function transmembrane signaling receptor activity GO:0004888 16206 655 1.142722838 5.47E-11 0.048648649 0 1.097515237 5.19E-06 0.16036036 0
cellular_component cell leading edge GO:0031252 16573 250 1.233704895 5.65E-11 0.010810811 0 1.219934084 6.45E-10 0.046846847 0
biological_process single-organism behavior GO:0044708 16204 333 1.201942406 5.66E-11 0.097297297 0 1.13419394 9.14E-06 0.201801802 0
biological_process positive regulation of protein modification process GO:0031401 16013 524 1.159953309 5.78E-11 0.007207207 0 1.129740578 8.59E-08 0.09009009 0
biological_process positive regulation of gene expression GO:0010628 15544 993 1.114090848 6.68E-11 0.010810811 0 1.122738909 2.43E-12 0.059459459 0
biological_process ion homeostasis GO:0050801 15939 598 1.148875099 6.69E-11 0.034234234 0 1.079400736 0.000306831 0.154954955 0.0142827
biological_process regulation of Ras protein signal transduction GO:0046578 16244 293 1.214627332 6.79E-11 0.027027027 0 1.220492425 2.11E-11 0.045045045 0
biological_process regulation of phosphorylation GO:0042325 15838 699 1.136994208 7.26E-11 0.009009009 0 1.087509881 2.11E-05 0.138738739 0
biological_process regulation of cell motility GO:2000145 16152 385 1.186340631 7.38E-11 0.018018018 0 1.107981676 0.000102288 0.163963964 0.00857888
biological_process positive regulation of protein phosphorylation GO:0001934 16110 427 1.176118631 8.48E-11 0.010810811 0 1.121548222 5.23E-06 0.12972973 0
biological_process positive regulation of protein metabolic process GO:0051247 15870 667 1.139464882 9.55E-11 0.005405405 0 1.114645308 8.25E-08 0.063063063 0
molecular_function transferase activity, transferring phosphorus-containing groups GO:0016772 15963 898 1.119310909 9.79E-11 0.005405405 0 1.108017866 4.15E-09 0.048648649 0
biological_process cytoskeleton organization GO:0007010 15811 726 1.132768531 1.17E-10 0.032432432 0 1.126695179 7.38E-10 0.048648649 0
biological_process chemical homeostasis GO:0048878 15790 747 1.130747546 1.19E-10 0.034234234 0 1.069396606 0.000387073 0.16036036 0.0161346
biological_process regulation of intracellular protein kinase cascade GO:0010627 15929 608 1.145477775 1.22E-10 0.005405405 0 1.084175371 0.000124679 0.136936937 0.0082729
biological_process positive regulation of RNA metabolic process GO:0051254 15599 938 1.115580125 1.37E-10 0.012612613 0 1.13058213 4.94E-13 0.041441441 0
biological_process regulation of protein phosphorylation GO:0001932 15897 640 1.141210774 1.39E-10 0.018018018 0 1.085539559 6.60E-05 0.162162162 0.0030506
biological_process regulation of membrane potential GO:0042391 16278 259 1.223754107 1.62E-10 0.057657658 0 1.161769591 2.75E-06 0.082882883 0
biological_process protein autophosphorylation GO:0046777 16367 170 1.276728778 1.67E-10 0.028828829 0 1.218004647 3.73E-07 0.066666667 0
biological_process positive regulation of developmental process GO:0051094 15902 635 1.140819062 1.83E-10 0.012612613 0 1.105845328 1.23E-06 0.131531532 0
biological_process regulation of cell adhesion GO:0030155 16294 243 1.230102907 1.94E-10 0.001801802 0 1.17044213 1.77E-06 0.077477477 0
biological_process transport GO:0006810 13523 3014 1.059484628 1.99E-10 0.111711712 0 1.044610628 1.36E-06 0.163963964 0
biological_process cellular protein modification process GO:0006464 14250 2287 1.069919615 2.20E-10 0.117117117 0 1.083419594 4.91E-14 0.059459459 0
biological_process protein modification process GO:0036211 14250 2287 1.069919615 2.20E-10 0.117117117 0 1.083419594 4.91E-14 0.059459459 0
biological_process regulation of neuron projection development GO:0010975 16317 220 1.241151222 2.23E-10 0.045045045 0 1.243146633 1.60E-10 0.07027027 0
molecular_function protein domain specific binding GO:0019904 16326 535 1.153115024 2.27E-10 0.054054054 0 1.141905828 3.79E-09 0.052252252 0
cellular_component postsynaptic density GO:0014069 16705 118 1.328409685 2.81E-10 0.079279279 0 1.296161548 1.12E-08 0.063063063 0
cellular_component dendritic spine head GO:0044327 16705 118 1.328409685 2.81E-10 0.079279279 0 1.296161548 1.12E-08 0.063063063 0
biological_process regulation of action potential GO:0001508 16391 146 1.294217531 3.11E-10 0.023423423 0 1.144872315 0.00116167 0.163963964 0.0416234
biological_process response to oxygen-containing compound GO:1901700 15613 924 1.113588878 3.76E-10 0.010810811 0 1.062458922 0.000356872 0.133333333 0.013988
biological_process regulation of cell morphogenesis involved in differentiation GO:0010769 16363 174 1.26755521 3.99E-10 0.034234234 0 1.22984326 6.49E-08 0.113513514 0
biological_process heart development GO:0007507 16168 369 1.181220466 5.37E-10 0.014414414 0 1.140122567 1.21E-06 0.131531532 0
biological_process embryo development ending in birth or egg hatching GO:0009792 16018 519 1.151634287 6.03E-10 0.014414414 0 1.115298161 1.89E-06 0.127927928 0
biological_process epithelium development GO:0060429 15843 694 1.130353096 6.13E-10 0.014414414 0 1.125670824 2.34E-09 0.066666667 0
biological_process neurotransmitter transport GO:0006836 16421 116 1.324560999 6.16E-10 0.009009009 0 1.219181607 2.04E-05 0.136936937 0
biological_process positive regulation of nucleobase-containing compound metabolic process GO:0045935 15495 1042 1.105194081 6.16E-10 0.010810811 0 1.12046403 1.73E-12 0.037837838 0
biological_process cell-substrate adhesion GO:0031589 16354 183 1.257832635 6.20E-10 0.007207207 0 1.141260182 0.000436885 0.165765766 0.0202383
biological_process positive regulation of molecular function GO:0044093 15714 823 1.119099506 6.36E-10 0.005405405 0 1.095166916 6.14E-07 0.100900901 0
cellular_component axon GO:0030424 16523 300 1.200499931 6.42E-10 0.131531532 0 1.222365532 8.40E-12 0.075675676 0
biological_process cellular ion homeostasis GO:0006873 16011 526 1.150031836 6.93E-10 0.045045045 0 1.079768258 0.00064023 0.162162162 0.031639
biological_process chordate embryonic development GO:0043009 16024 513 1.151492135 7.83E-10 0.014414414 0 1.11395073 2.80E-06 0.135135135 0
biological_process response to stress GO:0006950 14416 2121 1.070525401 8.44E-10 0.001801802 0 1.028064507 0.0082506 0.153153153 0.0774282
biological_process regulation of MAP kinase activity GO:0043405 16339 198 1.245638606 8.56E-10 0.001801802 0 1.088039606 0.0154413 0.245045045 0.105987
biological_process actin cytoskeleton organization GO:0030036 16160 377 1.176813003 8.98E-10 0.028828829 0 1.149979767 1.68E-07 0.091891892 0
biological_process cellular chemical homeostasis GO:0055082 15959 578 1.141558452 9.84E-10 0.041441441 0 1.071868661 0.00115827 0.174774775 0.0417807
biological_process morphogenesis of a branching structure GO:0001763 16357 180 1.256558092 1.02E-09 0.001801802 0 1.193175235 3.18E-06 0.102702703 0
biological_process regulation of cell proliferation GO:0042127 15588 949 1.109017102 1.04E-09 0.009009009 0 1.075206553 1.79E-05 0.073873874 0
biological_process taxis GO:0042330 16223 314 1.193071761 1.10E-09 0.001801802 0 1.168322654 9.15E-08 0.027027027 0
biological_process positive regulation of MAPK cascade GO:0043410 16270 267 1.209321963 1.17E-09 0.003603604 0 1.116701007 0.000434462 0.201801802 0.0180706
biological_process homeostatic process GO:0042592 15485 1052 1.102630763 1.28E-09 0.027027027 0 1.083003127 7.23E-07 0.059459459 0
biological_process circulatory system process GO:0003013 16256 281 1.203254647 1.32E-09 0.007207207 0 1.151872757 4.34E-06 0.064864865 0
biological_process response to external stimulus GO:0009605 15586 951 1.108042907 1.39E-09 0.01981982 0 1.060469172 0.000439205 0.158558559 0.0221879

biological_process regulation of protein modification process GO:0031399 15745 792 1.118975502 1.40E-09 0.028828829 0 1.097042471 6.24E-07 0.088288288 0
biological_process ameboidal cell migration GO:0001667 16346 191 1.246405404 1.49E-09 0.012612613 0 1.216843055 8.90E-08 0.064864865 0
biological_process chemotaxis GO:0006935 16224 313 1.1913043 1.62E-09 0.001801802 0 1.16669249 1.25E-07 0.027027027 0
biological_process positive regulation of nitrogen compound metabolic process GO:0051173 15470 1067 1.100960768 1.75E-09 0.012612613 0 1.114761073 9.53E-12 0.03963964 0
biological_process cellular response to chemical stimulus GO:0070887 15309 1228 1.093605841 1.77E-09 0.012612613 0 1.0822215 1.07E-07 0.086486486 0
biological_process muscle structure development GO:0061061 16128 409 1.165990118 1.96E-09 0.001801802 0 1.158955839 8.59E-09 0.025225225 0
biological_process blood circulation GO:0008015 16257 280 1.201077697 2.08E-09 0.007207207 0 1.148968096 6.67E-06 0.064864865 0
molecular_function ATP binding GO:0005524 15426 1435 1.085632491 2.12E-09 0.093693694 0 1.087872442 8.30E-10 0.12972973 0
biological_process macromolecule modification GO:0043412 14166 2371 1.064418192 2.18E-09 0.122522523 0 1.082928083 2.07E-14 0.043243243 0
cellular_component membrane raft GO:0045121 16624 199 1.238749091 2.20E-09 0.014414414 0 1.141090035 0.000262186 0.163963964 0
biological_process striated muscle tissue development GO:0014706 16241 296 1.194484809 2.48E-09 0.001801802 0 1.16048029 6.98E-07 0.03963964 0
biological_process muscle tissue development GO:0060537 16227 310 1.18974487 2.59E-09 0.001801802 0 1.160045819 4.17E-07 0.03963964 0
molecular_function adenyl ribonucleotide binding GO:0032559 15400 1461 1.084319176 2.59E-09 0.097297297 0 1.088321552 4.73E-10 0.131531532 0
molecular_function enzyme binding GO:0019899 15834 1027 1.101823082 2.73E-09 0.082882883 0 1.117747077 7.67E-12 0.045045045 0
molecular_function adenyl nucleotide binding GO:0030554 15396 1465 1.08398176 2.83E-09 0.093693694 0 1.087600781 6.09E-10 0.131531532 0
biological_process regulation of cell projection organization GO:0031344 16268 269 1.20335632 2.86E-09 0.05045045 0 1.217490763 2.34E-10 0.063063063 0
biological_process cell proliferation GO:0008283 15351 1186 1.093881752 3.08E-09 0.010810811 0 1.079004626 5.01E-07 0.043243243 0
biological_process negative regulation of cell communication GO:0010648 15942 595 1.135031722 3.12E-09 0.043243243 0 1.123674088 5.14E-08 0.084684685 0
biological_process morphogenesis of a branching epithelium GO:0061138 16367 170 1.255906788 3.14E-09 0.001801802 0 1.196506848 4.08E-06 0.095495495 0
cellular_component synaptic membrane GO:0097060 16619 204 1.232798346 3.43E-09 0.154954955 0 1.211120619 7.40E-08 0.142342342 0
cellular_component vesicle GO:0031982 15983 840 1.110875367 5.64E-09 0.077477477 0 1.067700062 0.000244438 0.162162162 0
molecular_function receptor binding GO:0005102 15884 977 1.102244739 5.88E-09 0.009009009 0 1.065904199 0.000118392 0.108108108 0
biological_process positive regulation of protein serine/threonine kinase activity GO:0071902 16354 183 1.241972438 5.95E-09 0.001801802 0 1.118262895 0.00266454 0.183783784 0.0525408
biological_process response to growth factor stimulus GO:0070848 16210 327 1.180082927 6.10E-09 0.012612613 0 1.177926825 9.07E-09 0.057657658 0
cellular_component membrane-bounded vesicle GO:0031988 16074 749 1.117104273 6.77E-09 0.057657658 0 1.070021341 0.000342283 0.144144144 0
biological_process branching morphogenesis of an epithelial tube GO:0048754 16391 146 1.269442626 7.39E-09 0.001801802 0 1.232715134 4.99E-07 0.057657658 0
biological_process positive regulation of catalytic activity GO:0043085 15889 648 1.125669797 7.89E-09 0.009009009 0 1.095962582 7.93E-06 0.120720721 0
biological_process negative regulation of signaling GO:0023057 15946 591 1.131422565 8.73E-09 0.041441441 0 1.122949 6.74E-08 0.082882883 0
biological_process negative regulation of response to stimulus GO:0048585 15845 692 1.120986603 8.93E-09 0.016216216 0 1.122667796 5.65E-09 0.032432432 0
biological_process positive regulation of cellular protein metabolic process GO:0032270 15945 592 1.131025096 9.37E-09 0.009009009 0 1.10982896 1.22E-06 0.079279279 0
biological_process muscle organ development GO:0007517 16250 287 1.189893724 9.49E-09 0.001801802 0 1.162858442 7.15E-07 0.018018018 0
biological_process response to nitrogen compound GO:1901698 15954 583 1.131886308 9.80E-09 0.010810811 0 1.061792294 0.0042576 0.189189189 0.0577993
biological_process regulation of protein metabolic process GO:0051246 15372 1165 1.091084268 1.17E-08 0.025225225 0 1.075046238 2.09E-06 0.064864865 0
biological_process response to endogenous stimulus GO:0009719 15548 989 1.099359832 1.19E-08 0.054054054 0 1.076568235 8.49E-06 0.124324324 0
biological_process regulation of immune system process GO:0002682 15933 604 1.128480479 1.26E-08 0.009009009 0 1.030297682 0.0944508 0.227027027 0.256104
biological_process cellular response to growth factor stimulus GO:0071363 16229 308 1.180810649 1.44E-08 0.009009009 0 1.172423797 6.09E-08 0.063063063 0
biological_process regulation of action potential in neuron GO:0019228 16434 103 1.313625116 1.60E-08 0.018018018 0 1.100920981 0.0375741 0.25045045 0.161696
biological_process regulation of cellular catabolic process GO:0031329 16113 424 1.153048723 1.60E-08 0.030630631 0 1.148610673 3.95E-08 0.034234234 0
molecular_function enzyme regulator activity GO:0030234 16058 803 1.109901269 1.62E-08 0.014414414 0 1.119508233 9.24E-10 0.014414414 0
biological_process regulation of catabolic process GO:0009894 16046 491 1.141806688 1.65E-08 0.043243243 0 1.151240034 1.90E-09 0.034234234 0
biological_process wound healing GO:0042060 16297 240 1.204265891 1.68E-08 0.001801802 0 1.114094472 0.00102127 0.09009009 0.038989
molecular_function ribonucleoside binding GO:0032549 15075 1786 1.071275136 1.72E-08 0.077477477 0 1.069734402 3.36E-08 0.118918919 0
molecular_function guanyl-nucleotide exchange factor activity GO:0005085 16687 174 1.239385549 1.92E-08 0.014414414 0 1.240564832 1.65E-08 0.028828829 0
molecular_function purine ribonucleoside binding GO:0032550 15079 1782 1.070771121 2.23E-08 0.077477477 0 1.069419953 3.99E-08 0.118918919 0
molecular_function purine nucleoside binding GO:0001883 15076 1785 1.070652644 2.28E-08 0.075675676 0 1.069217364 4.23E-08 0.118918919 0
biological_process hindbrain development GO:0030902 16422 115 1.293173638 2.32E-08 0.010810811 0 1.22477757 1.40E-05 0.081081081 0
biological_process positive regulation of intracellular protein kinase cascade GO:0010740 16126 411 1.1535692 2.37E-08 0.001801802 0 1.098725186 0.000223579 0.145945946 0.0149874
biological_process regulation of purine nucleotide metabolic process GO:1900542 16207 330 1.171678299 2.43E-08 0.01981982 0 1.15400361 4.92E-07 0.07027027 0
cellular_component extracellular region part GO:0044421 15976 847 1.105411091 2.48E-08 0.073873874 0 1.024122216 0.106057 0.252252252 0.173348
biological_process embryonic morphogenesis GO:0048598 16086 451 1.146183569 2.49E-08 0.009009009 0 1.164203004 4.56E-10 0.048648649 0
biological_process positive regulation of cell proliferation GO:0008284 15997 540 1.133030722 2.61E-08 0.010810811 0 1.0724607 0.00151245 0.081081081 0.0428184
molecular_function nucleoside binding GO:0001882 15065 1796 1.070098339 2.61E-08 0.079279279 0 1.069801153 2.97E-08 0.117117117 0
molecular_function purine ribonucleoside triphosphate binding GO:0035639 15087 1774 1.07049842 2.71E-08 0.075675676 0 1.069268193 4.59E-08 0.122522523 0
biological_process regulation of nucleotide metabolic process GO:0006140 16205 332 1.170327935 2.81E-08 0.021621622 0 1.153899852 4.63E-07 0.068468468 0
cellular_component cell surface GO:0009986 16354 469 1.14242128 3.01E-08 0.023423423 0 1.083152176 0.000779362 0.165765766 0
molecular_function purine ribonucleotide binding GO:0032555 15054 1807 1.069353864 3.25E-08 0.086486486 0 1.067909803 6.06E-08 0.120720721 0
biological_process negative regulation of cellular metabolic process GO:0031324 15385 1152 1.088532046 3.41E-08 0.007207207 0 1.092059287 1.01E-08 0.034234234 0
molecular_function purine nucleotide binding GO:0017076 15049 1812 1.069027976 3.58E-08 0.082882883 0 1.067011868 8.48E-08 0.122522523 0
biological_process positive regulation of kinase activity GO:0033674 16236 301 1.177523589 3.64E-08 0.005405405 0 1.114995483 0.000243796 0.145945946 0.01466
biological_process positive regulation of transferase activity GO:0051347 16226 311 1.174432538 3.75E-08 0.003603604 0 1.112176799 0.000270932 0.144144144 0.0144163
biological_process response to organic nitrogen GO:0010243 15994 543 1.130879967 3.91E-08 0.01981982 0 1.068335036 0.00252011 0.174774775 0.0530963
biological_process ensheathment of neurons GO:0007272 16450 87 1.331313843 4.01E-08 0.014414414 0 1.062854246 0.154319 0.317117117 0.345003
biological_process axon ensheathment GO:0008366 16450 87 1.331313843 4.01E-08 0.014414414 0 1.062854246 0.154319 0.317117117 0.345003
biological_process response to wounding GO:0009611 15908 629 1.121156309 4.03E-08 0.001801802 0 1.041422538 0.0332866 0.221621622 0.151773
biological_process regulation of transport GO:0051049 15683 854 1.102949308 4.38E-08 0.117117117 0 1.094575973 4.42E-07 0.082882883 0
biological_process negative regulation of transcription from RNA polymerase II promoter GO:0000122 16044 493 1.13698573 4.43E-08 0.001801802 0 1.129970085 1.94E-07 0.045045045 0
biological_process Rho protein signal transduction GO:0007266 16351 186 1.22452185 4.81E-08 0.018018018 0 1.253311946 8.84E-10 0.01981982 0
biological_process muscle cell differentiation GO:0042692 16257 280 1.182397711 4.86E-08 0.005405405 0 1.200904934 2.14E-09 0.009009009 0
biological_process negative regulation of signal transduction GO:0009968 15982 555 1.128425424 4.90E-08 0.03963964 0 1.13558341 9.13E-09 0.045045045 0
biological_process growth GO:0040007 15837 700 1.113795304 4.95E-08 0.012612613 0 1.099471534 1.60E-06 0.106306306 0
biological_process regulation of protein serine/threonine kinase activity GO:0071900 16253 284 1.180605479 5.26E-08 0.003603604 0 1.068830945 0.0213562 0.25045045 0.127342
biological_process positive regulation of protein kinase activity GO:0045860 16259 278 1.182434439 5.38E-08 0.005405405 0 1.123202876 0.000166475 0.127927928 0.0105959
molecular_function ribonucleotide binding GO:0032553 15040 1821 1.067431091 6.56E-08 0.097297297 0 1.067847952 5.48E-08 0.118918919 0
biological_process regulation of kinase activity GO:0043549 16068 469 1.138636232 6.62E-08 0.010810811 0 1.071145257 0.00339188 0.207207207 0.0574954
biological_process regulation of synapse structure and activity GO:0050803 16483 54 1.412786915 7.10E-08 0.007207207 0 1.23851429 0.00117981 0.178378378 0.0413927
biological_process small GTPase mediated signal transduction GO:0007264 15984 553 1.12675943 7.54E-08 0.052252252 0 1.145929547 7.43E-10 0.030630631 0
cellular_component focal adhesion GO:0005925 16703 120 1.275767447 7.55E-08 0.005405405 0 1.176771911 0.000381225 0.099099099 0
biological_process regulation of cellular component biogenesis GO:0044087 16208 329 1.165399499 7.65E-08 0.007207207 0 1.090096943 0.00212405 0.183783784 0.0502774
cellular_component cell-substrate junction GO:0030055 16691 132 1.261672315 8.57E-08 0.010810811 0 1.190048406 7.32E-05 0.079279279 0
molecular_function GTPase activator activity GO:0005096 16653 208 1.207860047 8.72E-08 0.052252252 0 1.245341937 3.48E-10 0.032432432 0
molecular_function ion binding GO:0043167 11326 5535 1.033196752 8.97E-08 0.236036036 0 1.043364852 4.61E-12 0.207207207 0

biological_process regulation of hydrolase activity GO:0051336 15945 592 1.121532185 9.14E-08 0.028828829 0 1.095100342 2.24E-05 0.073873874 0
cellular_component cell projection membrane GO:0031253 16655 168 1.231001442 9.33E-08 0.001801802 0 1.123763708 0.00261528 0.144144144 0
biological_process regulation of stress-activated protein kinase signaling cascade GO:0070302 16398 139 1.253842056 9.67E-08 0.007207207 0 1.129514935 0.00395406 0.171171171 0.0589714
biological_process positive regulation of cellular component organization GO:0051130 16063 474 1.135835676 1.01E-07 0.041441441 0 1.132603115 1.95E-07 0.079279279 0
biological_process positive regulation of cell adhesion GO:0045785 16420 117 1.276091519 1.05E-07 0.001801802 0 1.169669592 0.000711388 0.145945946 0.0311924
biological_process stem cell differentiation GO:0048863 16297 240 1.191764338 1.09E-07 0.003603604 0 1.145033422 4.42E-05 0.104504505 0.00320648
biological_process regulation of protein kinase activity GO:0045859 16100 437 1.141149351 1.11E-07 0.012612613 0 1.076370787 0.00253565 0.187387387 0.0530149
biological_process regulation of transferase activity GO:0051338 16049 488 1.133337517 1.12E-07 0.012612613 0 1.066955155 0.00465562 0.205405405 0.0590523
biological_process cellular localization GO:0051641 14873 1664 1.069372048 1.18E-07 0.10990991 0 1.057794652 8.33E-06 0.135135135 0
biological_process regulation of stress-activated MAPK cascade GO:0032872 16399 138 1.25226289 1.27E-07 0.007207207 0 1.129190629 0.00414888 0.172972973 0.0584317
biological_process response to peptide GO:1901652 16265 272 1.178617507 1.34E-07 0.027027027 0 1.093439062 0.00355831 0.167567568 0.0593976
biological_process negative regulation of macromolecule metabolic process GO:0010605 15347 1190 1.082938636 1.34E-07 0.001801802 0 1.087084945 3.31E-08 0.027027027 0
biological_process positive regulation of JUN kinase activity GO:0043507 16486 51 1.414721595 1.39E-07 0.001801802 0 1.285338805 0.000203933 0.075675676 0.0127748
biological_process cell-matrix adhesion GO:0007160 16426 111 1.280407877 1.42E-07 0.012612613 0 1.189990639 0.000251962 0.09009009 0.0146252
biological_process negative regulation of cellular macromolecule biosynthetic process GO:2000113 15707 830 1.100267805 1.42E-07 0.001801802 0 1.110252874 8.26E-09 0.045045045 0
cellular_component cytoplasmic vesicle GO:0031410 16069 754 1.105407988 1.45E-07 0.082882883 0 1.072836401 0.000196625 0.127927928 0
biological_process response to abiotic stimulus GO:0009628 15771 766 1.104476403 1.46E-07 0.03963964 0 1.068238827 0.000404614 0.142342342 0.0182733
biological_process striated muscle cell development GO:0055002 16394 143 1.246313751 1.50E-07 0.007207207 0 1.242271341 2.33E-07 0.016216216 0
biological_process negative regulation of metabolic process GO:0009892 15270 1267 1.079863378 1.50E-07 0.009009009 0 1.081858264 7.52E-08 0.037837838 0
biological_process stress-activated protein kinase signaling cascade GO:0031098 16375 162 1.231175388 1.51E-07 0.005405405 0 1.115019019 0.00541469 0.151351351 0.0626739
biological_process regulation of blood pressure GO:0008217 16420 117 1.272112066 1.56E-07 0.007207207 0 1.145141694 0.00317673 0.118918919 0.0567866
cellular_component main axon GO:0044304 16779 44 1.444471337 1.58E-07 0.07027027 0 1.331099686 6.97E-05 0.108108108 0
biological_process synapse assembly GO:0007416 16480 57 1.389364142 1.69E-07 0.052252252 0 1.299138886 4.45E-05 0.147747748 0.00319624
biological_process cell junction organization GO:0034330 16421 116 1.272204914 1.73E-07 0.037837838 0 1.258495585 6.52E-07 0.063063063 0
cellular_component cell-cell junction GO:0005911 16560 263 1.179638992 1.83E-07 0.086486486 0 1.152500488 7.89E-06 0.185585586 0
cellular_component clathrin-coated vesicle GO:0030136 16651 172 1.222527446 1.88E-07 0.055855856 0 1.130058442 0.00149033 0.138738739 0
biological_process renal system development GO:0072001 16307 230 1.192062292 1.88E-07 0.014414414 0 1.159241853 1.26E-05 0.068468468 0
biological_process response to organic cyclic compound GO:0014070 15887 650 1.112700785 1.91E-07 0.016216216 0 1.043457693 0.025128 0.268468468 0.136043
cellular_component postsynaptic membrane GO:0045211 16651 172 1.221863941 2.03E-07 0.14954955 0 1.199823157 2.53E-06 0.144144144 0
biological_process regulation of neurotransmitter levels GO:0001505 16429 108 1.280265637 2.08E-07 0.016216216 0 1.205969605 9.97E-05 0.099099099 0.00862804
biological_process negative regulation of gene expression GO:0010629 15701 836 1.098432312 2.11E-07 0.001801802 0 1.108552579 1.21E-08 0.025225225 0
cellular_component coated vesicle GO:0030135 16617 206 1.202166761 2.13E-07 0.068468468 0 1.130055221 0.000570646 0.136936937 0
biological_process hematopoietic or lymphoid organ development GO:0048534 16026 511 1.127088389 2.16E-07 0.005405405 0 1.124463813 3.70E-07 0.007207207 0
biological_process tissue migration GO:0090130 16409 128 1.256561032 2.24E-07 0.009009009 0 1.242294598 9.37E-07 0.048648649 0
biological_process endothelial cell migration GO:0043542 16444 93 1.300937839 2.32E-07 0.001801802 0 1.220351577 0.000111672 0.066666667 0.00843483
biological_process cognition GO:0050890 16370 167 1.22398251 2.34E-07 0.142342342 0 1.146722334 0.000481955 0.228828829 0.0220474
biological_process stress-activated MAPK cascade GO:0051403 16379 158 1.230227986 2.37E-07 0.005405405 0 1.115179944 0.0058739 0.16036036 0.064597
biological_process myelination GO:0042552 16453 84 1.316083059 2.45E-07 0.018018018 0 1.063934212 0.154464 0.317117117 0.344722
cellular_component extracellular matrix GO:0031012 16450 373 1.148669249 2.46E-07 0.084684685 0 1.111288059 8.33E-05 0.106306306 0
biological_process regulation of JNK cascade GO:0046328 16413 124 1.25976176 2.46E-07 0.005405405 0 1.121975013 0.00910233 0.207207207 0.0779109
biological_process epithelial cell migration GO:0010631 16412 125 1.258342541 2.56E-07 0.009009009 0 1.243598267 1.09E-06 0.05045045 0
biological_process epithelium migration GO:0090132 16412 125 1.258342541 2.56E-07 0.009009009 0 1.243598267 1.09E-06 0.05045045 0
biological_process striated muscle cell differentiation GO:0051146 16324 213 1.197212614 2.61E-07 0.010810811 0 1.2150518 2.23E-08 0.010810811 0
cellular_component axon part GO:0033267 16676 147 1.237817713 2.64E-07 0.126126126 0 1.260493462 1.96E-08 0.061261261 0
molecular_function neurotransmitter transporter activity GO:0005326 16841 20 1.647029877 2.65E-07 0.001801802 0 1.135334614 0.147107 0.297297297 0.287678
biological_process response to peptide hormone stimulus GO:0043434 16274 263 1.176922409 2.73E-07 0.027027027 0 1.096728907 0.00308191 0.158558559 0.0570245
biological_process learning or memory GO:0007611 16380 157 1.22964467 2.75E-07 0.136936937 0 1.135015734 0.00161909 0.237837838 0.0439994
biological_process vasoconstriction GO:0042310 16484 53 1.39525216 2.99E-07 0.012612613 0 1.10093301 0.101201 0.228828829 0.262205
biological_process dendrite development GO:0016358 16412 125 1.25680426 2.99E-07 0.138738739 0 1.292465281 6.53E-09 0.088288288 0
biological_process negative regulation of transcription, DNA-dependent GO:0045892 15795 742 1.103245751 3.11E-07 0.001801802 0 1.111945828 3.25E-08 0.034234234 0
cellular_component neuronal cell body GO:0043025 16489 334 1.155720565 3.19E-07 0.133333333 0 1.179699011 4.58E-09 0.025225225 0
biological_process cellular carbohydrate biosynthetic process GO:0034637 16434 103 1.28194745 3.32E-07 0.001801802 0 1.140181092 0.00672049 0.07027027 0.0697055
biological_process muscle cell development GO:0055001 16383 154 1.229710394 3.51E-07 0.012612613 0 1.241945146 8.71E-08 0.012612613 0
molecular_function calcium ion binding GO:0005509 16291 570 1.117907272 3.52E-07 0.061261261 0 1.076514474 0.000643245 0.145945946 0
biological_process developmental growth involved in morphogenesis GO:0060560 16421 116 1.264761218 3.59E-07 0.018018018 0 1.196516906 0.000117063 0.082882883 0.00838804
biological_process positive regulation of MAP kinase activity GO:0043406 16396 141 1.239710813 3.69E-07 0.001801802 0 1.114205328 0.00916408 0.205405405 0.0776565
biological_process regulation of JUN kinase activity GO:0043506 16474 63 1.359248341 3.74E-07 0.003603604 0 1.220807696 0.0011773 0.075675676 0.0414701
cellular_component cell-substrate adherens junction GO:0005924 16698 125 1.253723926 4.07E-07 0.010810811 0 1.17568299 0.000319033 0.093693694 0
cellular_component actomyosin GO:0042641 16764 59 1.37001895 4.08E-07 0.001801802 0 1.274549956 0.000126523 0.054054054 0
biological_process endocytosis GO:0006897 16224 313 1.159382358 4.09E-07 0.057657658 0 1.148223974 2.26E-06 0.043243243 0
biological_process regulation of cell shape GO:0008360 16443 94 1.292694489 4.13E-07 0.009009009 0 1.242650967 2.19E-05 0.027027027 0
cellular_component cytoskeletal part GO:0044430 15696 1127 1.081714666 4.35E-07 0.055855856 0 1.085364332 1.38E-07 0.063063063 0
biological_process negative regulation of macromolecule biosynthetic process GO:0010558 15679 858 1.094194837 4.60E-07 0.003603604 0 1.107934519 9.34E-09 0.041441441 0
biological_process regulation of GTP catabolic process GO:0033124 16306 231 1.184095761 5.29E-07 0.068468468 0 1.191215685 2.00E-07 0.064864865 0
biological_process positive regulation of cell differentiation GO:0045597 16079 458 1.129629255 5.50E-07 0.023423423 0 1.102849501 5.53E-05 0.126126126 0.00314628
cellular_component cytoplasmic membrane-bounded vesicle GO:0016023 16138 685 1.105241282 5.55E-07 0.086486486 0 1.074582943 0.000278096 0.100900901 0
biological_process developmental growth GO:0048589 16278 259 1.172840423 5.99E-07 0.010810811 0 1.163665314 2.13E-06 0.081081081 0
biological_process negative regulation of cellular biosynthetic process GO:0031327 15654 883 1.091523239 6.44E-07 0.003603604 0 1.105213571 1.30E-08 0.043243243 0
biological_process establishment of localization in cell GO:0051649 15091 1446 1.070081978 6.76E-07 0.106306306 0 1.051916787 0.000172231 0.151351351 0.0105405
biological_process cellular response to endogenous stimulus GO:0071495 15969 568 1.114928519 6.90E-07 0.061261261 0 1.121963131 1.50E-07 0.082882883 0
biological_process neuromuscular process controlling balance GO:0050885 16492 45 1.414790836 6.96E-07 0.010810811 0 1.248560323 0.00191417 0.185585586 0.0475937
biological_process regulation of nucleoside metabolic process GO:0009118 16283 254 1.173231281 7.21E-07 0.048648649 0 1.165199168 2.16E-06 0.073873874 0
biological_process immune system development GO:0002520 15998 539 1.117838583 7.26E-07 0.005405405 0 1.115545549 1.16E-06 0.010810811 0
biological_process regulation of synapse organization GO:0050807 16488 49 1.396165847 7.53E-07 0.005405405 0 1.236873546 0.00201231 0.156756757 0.0506738
biological_process cellular homeostasis GO:0019725 15879 658 1.106075671 7.56E-07 0.064864865 0 1.063998723 0.00185561 0.136936937 0.0479053
biological_process locomotory behavior GO:0007626 16390 147 1.227480182 7.99E-07 0.106306306 0 1.230450058 5.83E-07 0.075675676 0
biological_process negative regulation of biosynthetic process GO:0009890 15640 897 1.089952464 8.01E-07 0.003603604 0 1.101416253 3.16E-08 0.043243243 0
biological_process polysaccharide biosynthetic process GO:0000271 16436 101 1.274608524 8.14E-07 0.001801802 0 1.154750948 0.00344617 0.072072072 0.0570775
biological_process negative regulation of nucleobase-containing compound metabolic process GO:0045934 15704 833 1.09344378 8.19E-07 0.001801802 0 1.106470681 2.36E-08 0.034234234 0
cellular_component leading edge membrane GO:0031256 16734 89 1.292534902 8.22E-07 0.012612613 0 1.23277941 6.84E-05 0.07027027 0
molecular_function lipid binding GO:0008289 16223 638 1.107432269 8.27E-07 0.099099099 0 1.137419398 4.42E-10 0.055855856 0

biological_process hemopoiesis GO:0030097 16053 484 1.123831741 8.37E-07 0.005405405 0 1.121765369 1.24E-06 0.009009009 0
biological_process regulation of GTPase activity GO:0043087 16309 228 1.181594212 8.66E-07 0.079279279 0 1.191152242 2.40E-07 0.068468468 0
biological_process JNK cascade GO:0007254 16396 141 1.231348355 8.83E-07 0.007207207 0 1.115045862 0.0087457 0.178378378 0.077737
biological_process regulation of nucleotide catabolic process GO:0030811 16284 253 1.172084758 8.87E-07 0.046846847 0 1.165177658 2.26E-06 0.075675676 0
biological_process regulation of purine nucleotide catabolic process GO:0033121 16284 253 1.172084758 8.87E-07 0.046846847 0 1.165177658 2.26E-06 0.075675676 0
biological_process polysaccharide metabolic process GO:0005976 16406 131 1.239702825 9.17E-07 0.001801802 0 1.143260262 0.00217713 0.03963964 0.0500391
molecular_function amino acid transmembrane transporter activity GO:0015171 16798 63 1.343707852 1.10E-06 0.001801802 0 1.026702945 0.356518 0.4 -1
cellular_component cell-cell adherens junction GO:0005913 16774 49 1.389109599 1.15E-06 0.032432432 0 1.299230661 0.000139878 0.12972973 0
cellular_component caveola GO:0005901 16760 63 1.342536705 1.19E-06 0.018018018 0 1.155781478 0.0159483 0.203603604 0.00814041
biological_process regulation of dendrite development GO:0050773 16471 66 1.334567246 1.20E-06 0.046846847 0 1.296108399 1.49E-05 0.059459459 0
biological_process establishment of cell polarity GO:0030010 16464 73 1.317304331 1.26E-06 0.003603604 0 1.259067151 6.09E-05 0.025225225 0.00306919
biological_process response to decreased oxygen levels GO:0036293 16294 243 1.17289067 1.28E-06 0.003603604 0 1.089028161 0.00772704 0.113513514 0.0772018
biological_process regulation of Ras GTPase activity GO:0032318 16365 172 1.205606595 1.33E-06 0.055855856 0 1.201387967 2.13E-06 0.064864865 0
biological_process gliogenesis GO:0042063 16370 167 1.208644891 1.34E-06 0.012612613 0 1.113215648 0.00543412 0.05045045 0.0638421
molecular_function insulin receptor binding GO:0005158 16833 28 1.511065576 1.38E-06 0.007207207 0 1.2731128 0.00611827 0.108108108 0
biological_process regulation of cellular protein metabolic process GO:0032268 15535 1002 1.082855419 1.39E-06 0.068468468 0 1.084064759 9.91E-07 0.046846847 0
biological_process positive regulation of multicellular organismal process GO:0051240 16073 464 1.123456084 1.49E-06 0.01981982 0 1.066116684 0.00617414 0.23963964 0.0647118
biological_process regulation of gene silencing GO:0060968 16508 29 1.500048756 1.52E-06 0.007207207 0 1.057918192 0.29437 0.378378378 -1
biological_process negative regulation of nitrogen compound metabolic process GO:0051172 15692 845 1.090313825 1.52E-06 0.001801802 0 1.103192939 4.81E-08 0.036036036 0
molecular_function metal ion transmembrane transporter activity GO:0046873 16506 355 1.141315229 1.57E-06 0.111711712 0 1.117893937 5.04E-05 0.181981982 0
cellular_component extracellular matrix part GO:0044420 16654 169 1.205878697 1.59E-06 0.081081081 0 1.117107185 0.00402067 0.104504505 0
biological_process regulation of Rho protein signal transduction GO:0035023 16376 161 1.210692138 1.63E-06 0.025225225 0 1.249976912 1.69E-08 0.014414414 0
biological_process heart morphogenesis GO:0003007 16369 168 1.206143968 1.65E-06 0.005405405 0 1.164385743 0.000103866 0.082882883 0.00850602
molecular_function enzyme activator activity GO:0008047 16543 318 1.148644293 1.78E-06 0.037837838 0 1.160945415 2.60E-07 0.045045045 0
biological_process regulation of systemic arterial blood pressure GO:0003073 16475 62 1.338952079 1.82E-06 0.016216216 0 1.138172368 0.029516 0.176576577 0.14282
biological_process establishment or maintenance of cell polarity GO:0007163 16434 103 1.262644974 1.82E-06 0.010810811 0 1.224533149 3.76E-05 0.079279279 0.00325851
biological_process ion transport GO:0006811 15537 1000 1.081823635 1.89E-06 0.138738739 0 1.036030763 0.0208805 0.30990991 0.127076
biological_process regulation of axonogenesis GO:0050770 16441 96 1.271192787 1.96E-06 0.07027027 0 1.241420346 1.99E-05 0.117117117 0
biological_process blood vessel endothelial cell migration GO:0043534 16482 55 1.358686984 1.96E-06 0.003603604 0 1.167120919 0.0157663 0.088288288 0.109002
biological_process cell junction assembly GO:0034329 16451 86 1.286542383 1.97E-06 0.059459459 0 1.217538282 0.000229737 0.140540541 0.0149136
biological_process extracellular structure organization GO:0043062 16393 144 1.220854006 2.01E-06 0.025225225 0 1.119235847 0.00640234 0.163963964 0.0667541
biological_process urogenital system development GO:0001655 16272 265 1.162184945 2.01E-06 0.023423423 0 1.155841614 4.72E-06 0.07027027 0
cellular_component cell body GO:0044297 16456 367 1.137372809 2.02E-06 0.12972973 0 1.158842085 4.93E-08 0.030630631 0
biological_process regulation of neuronal synaptic plasticity GO:0048168 16487 50 1.375626761 2.04E-06 0.063063063 0 1.188989306 0.0102206 0.223423423 0.0801685
molecular_function organic acid transmembrane transporter activity GO:0005342 16767 94 1.273542986 2.05E-06 0.001801802 0 1.011918418 0.420471 0.463063063 -1
biological_process Wnt receptor signaling pathway GO:0016055 16258 279 1.157867273 2.05E-06 0.016216216 0 1.149397558 6.53E-06 0.115315315 0
biological_process cerebellum development GO:0021549 16464 73 1.310541966 2.05E-06 0.010810811 0 1.261784024 5.17E-05 0.05045045 0.00316609
molecular_function protein complex binding GO:0032403 16525 336 1.143611895 2.06E-06 0.027027027 0 1.096393832 0.000996166 0.131531532 0
biological_process regulation of cellular response to growth factor stimulus GO:0090287 16413 124 1.237720562 2.09E-06 0.010810811 0 1.231625098 3.66E-06 0.034234234 0
biological_process activation of protein kinase activity GO:0032147 16385 152 1.214400214 2.12E-06 0.001801802 0 1.149151543 0.00068765 0.043243243 0.0313836
biological_process embryonic organ morphogenesis GO:0048562 16349 188 1.19233856 2.17E-06 0.003603604 0 1.161841319 5.54E-05 0.097297297 0.00312661
biological_process neurotransmitter secretion GO:0007269 16465 72 1.311887081 2.18E-06 0.028828829 0 1.304053244 3.76E-06 0.045045045 0
biological_process regulation of metabolic process GO:0019222 12306 4231 1.035119079 2.26E-06 0.234234234 0 1.056530486 7.75E-14 0.115315315 0
biological_process reproductive behavior GO:0019098 16478 59 1.344099511 2.26E-06 0.075675676 0 1.197716068 0.00420489 0.209009009 0.058032
biological_process response to hypoxia GO:0001666 16297 240 1.169583026 2.28E-06 0.003603604 0 1.09353569 0.00573294 0.102702703 0.0648176
biological_process kidney development GO:0001822 16352 185 1.19333757 2.32E-06 0.016216216 0 1.151481329 0.000166069 0.115315315 0.010624
biological_process cellular polysaccharide biosynthetic process GO:0033692 16441 96 1.268837093 2.37E-06 0.001801802 0 1.141561608 0.00798979 0.068468468 0.0772702
biological_process stem cell development GO:0048864 16346 191 1.189585416 2.50E-06 0.007207207 0 1.140945884 0.000344979 0.108108108 0.0140523
biological_process skeletal muscle tissue development GO:0007519 16369 168 1.201580149 2.70E-06 0.005405405 0 1.187953477 1.11E-05 0.034234234 0
biological_process response to oxygen levels GO:0070482 16275 262 1.160869546 2.73E-06 0.005405405 0 1.092154104 0.00460363 0.081081081 0.0593658
biological_process defense response GO:0006952 15886 651 1.100748401 2.78E-06 0.003603604 0 0.985469126 0.743888 0.641441441 -1
biological_process positive regulation of blood pressure GO:0045777 16504 33 1.454949722 2.93E-06 0.009009009 0 1.089395533 0.186643 0.227027027 0.380955
biological_process cellular polysaccharide metabolic process GO:0044264 16414 123 1.234972191 2.94E-06 0.003603604 0 1.133495777 0.00502577 0.036036036 0.0608052
biological_process secretion GO:0046903 15924 613 1.103344283 3.15E-06 0.111711712 0 1.087831981 6.19E-05 0.165765766 0.00305983
molecular_function transferase activity GO:0016740 15142 1719 1.059451282 3.31E-06 0.023423423 0 1.058043694 5.45E-06 0.037837838 0
biological_process extracellular matrix organization GO:0030198 16394 143 1.215902653 3.54E-06 0.025225225 0 1.113852956 0.00893287 0.183783784 0.0771514
molecular_function transmembrane receptor protein kinase activity GO:0019199 16784 77 1.294633962 3.59E-06 0.073873874 0 1.22243284 0.000351368 0.135135135 0
biological_process ossification GO:0001503 16271 266 1.157602148 3.59E-06 0.010810811 0 1.082186609 0.00962701 0.203603604 0.0783954
biological_process regulation of stem cell differentiation GO:2000736 16481 56 1.34534333 3.67E-06 0.007207207 0 1.173835152 0.0120044 0.151351351 0.092639
biological_process cellular response to nitrogen compound GO:1901699 16264 273 1.155358329 3.68E-06 0.005405405 0 1.093230144 0.00356876 0.169369369 0.0591368
biological_process cellular response to organic nitrogen GO:0071417 16290 247 1.163458599 3.68E-06 0.025225225 0 1.113337084 0.000940201 0.126126126 0.0377578
biological_process plasma membrane organization GO:0007009 16449 88 1.274401203 3.90E-06 0.003603604 0 1.178837226 0.0017868 0.045045045 0.0433507
biological_process secretion by cell GO:0032940 16013 524 1.110769633 4.04E-06 0.100900901 0 1.08610048 0.000261123 0.172972973 0.0145552
cellular_component lamellipodium GO:0030027 16707 116 1.23835884 4.06E-06 0.027027027 0 1.244804889 2.29E-06 0.027027027 0
biological_process immune response GO:0006955 15906 631 1.100497557 4.13E-06 0.005405405 0 1.012953601 0.282807 0.376576577 -1
biological_process insulin receptor signaling pathway GO:0008286 16470 67 1.313610465 4.19E-06 0.001801802 0 1.20816684 0.00155178 0.068468468 0.0442956
molecular_function protein dimerization activity GO:0046983 15942 919 1.08247019 4.23E-06 0.012612613 0 1.026199504 0.0785659 0.142342342 0.135976
biological_process negative regulation of RNA metabolic process GO:0051253 15767 770 1.090392846 4.31E-06 0.001801802 0 1.101608297 2.85E-07 0.043243243 0
biological_process cellular component assembly GO:0022607 15197 1340 1.067125297 4.51E-06 0.012612613 0 1.024536672 0.0523539 0.201801802 0.188283
cellular_component stress fiber GO:0001725 16774 49 1.365324323 4.58E-06 0.001801802 0 1.269486936 0.000533573 0.046846847 0
cellular_component actin filament bundle GO:0032432 16771 52 1.354542316 4.60E-06 0.001801802 0 1.219940576 0.00296731 0.088288288 0
biological_process response to lipid GO:0033993 15926 611 1.101592036 4.66E-06 0.025225225 0 1.043159732 0.0298619 0.25045045 0.143664
molecular_function Ras guanyl-nucleotide exchange factor activity GO:0005088 16751 110 1.243118726 4.69E-06 0.030630631 0 1.275617858 2.54E-07 0.036036036 0
biological_process phosphatidylinositol-mediated signaling GO:0048015 16452 85 1.276725933 4.70E-06 0.034234234 0 1.143240397 0.0109164 0.230630631 0.0855017
biological_process inositol lipid-mediated signaling GO:0048017 16452 85 1.276725933 4.70E-06 0.034234234 0 1.143240397 0.0109164 0.230630631 0.0855017
biological_process in utero embryonic development GO:0001701 16211 326 1.140155441 4.78E-06 0.01981982 0 1.098885783 0.000893901 0.165765766 0.0361922
biological_process carbohydrate biosynthetic process GO:0016051 16359 178 1.190486605 4.81E-06 0.001801802 0 1.09664725 0.0123693 0.068468468 0.0949586
biological_process positive regulation of cell development GO:0010720 16378 159 1.201384296 4.94E-06 0.021621622 0 1.133395045 0.0017086 0.162162162 0.0437121
biological_process developmental cell growth GO:0048588 16465 72 1.299618997 5.09E-06 0.010810811 0 1.154291592 0.0115262 0.163963964 0.0885482
cellular_component basement membrane GO:0005604 16735 88 1.270777279 5.14E-06 0.030630631 0 1.079143471 0.0986428 0.227027027 0.147996
biological_process skeletal muscle organ development GO:0060538 16364 173 1.192374368 5.27E-06 0.007207207 0 1.176569062 2.63E-05 0.05045045 0.00330118

biological_process single-organism carbohydrate metabolic process GO:0044723 16026 511 1.11021206 5.84E-06 0.027027027 0 1.056494641 0.0123236 0.156756757 0.0951478
biological_process regulation of cellular localization GO:0060341 15952 585 1.102533646 6.12E-06 0.055855856 0 1.062377353 0.00390082 0.187387387 0.0594711
biological_process connective tissue development GO:0061448 16362 175 1.189714219 6.21E-06 0.01981982 0 1.158782755 0.000127268 0.099099099 0.00816056
biological_process reproductive structure development GO:0048608 16292 245 1.159446164 6.65E-06 0.005405405 0 1.063320904 0.0418591 0.201801802 0.170372
biological_process reproductive system development GO:0061458 16292 245 1.159446164 6.65E-06 0.005405405 0 1.063320904 0.0418591 0.201801802 0.170372
biological_process embryonic organ development GO:0048568 16235 302 1.143098678 6.89E-06 0.012612613 0 1.136599476 1.66E-05 0.10990991 0
molecular_function secondary active transmembrane transporter activity GO:0015291 16681 180 1.186053554 6.91E-06 0.030630631 0 1.010148382 0.406303 0.443243243 -1
biological_process dendrite morphogenesis GO:0048813 16465 72 1.294993272 6.96E-06 0.117117117 0 1.354207265 9.08E-08 0.064864865 0
biological_process central nervous system neuron differentiation GO:0021953 16409 128 1.220828812 6.99E-06 0.003603604 0 1.218854186 8.33E-06 0.028828829 0
biological_process gland morphogenesis GO:0022612 16431 106 1.242642568 7.10E-06 0.009009009 0 1.127144886 0.0114646 0.185585586 0.0886274
molecular_function carboxylic acid transmembrane transporter activity GO:0046943 16769 92 1.260337917 7.22E-06 0.001801802 0 1.007569761 0.449832 0.466666667 -1
biological_process lipid metabolic process GO:0006629 15611 926 1.079773526 7.54E-06 0.059459459 0 1.029879759 0.0525322 0.225225225 0.188796
biological_process cell-cell junction organization GO:0045216 16432 105 1.242637244 7.79E-06 0.048648649 0 1.25461547 2.90E-06 0.05045045 0
molecular_function sequence-specific DNA binding GO:0043565 16283 578 1.101888655 7.89E-06 0.010810811 0 1.090466802 6.32E-05 0.05045045 0
biological_process glial cell differentiation GO:0010001 16396 141 1.208705392 8.13E-06 0.012612613 0 1.124763467 0.00498324 0.014414414 0.0608771
molecular_function transcription factor binding GO:0008134 16491 370 1.127314015 8.97E-06 0.010810811 0 1.156774167 6.40E-08 0.003603604 0
biological_process regulation of ERK1 and ERK2 cascade GO:0070372 16433 104 1.242015519 8.99E-06 0.003603604 0 1.019792303 0.362931 0.412612613 -1
biological_process muscle fiber development GO:0048747 16434 103 1.24287285 9.23E-06 0.009009009 0 1.257713684 2.76E-06 0.025225225 0
biological_process positive regulation of cellular component movement GO:0051272 16305 232 1.161122858 9.31E-06 0.048648649 0 1.090517205 0.00808753 0.201801802 0.0767412
biological_process ERK1 and ERK2 cascade GO:0070371 16416 121 1.223832173 9.34E-06 0.005405405 0 1.01910389 0.357429 0.418018018 -1
biological_process digestive system development GO:0055123 16433 104 1.241062001 9.71E-06 0.021621622 0 1.165234053 0.00170659 0.099099099 0.0437882
biological_process tube formation GO:0035148 16417 120 1.224285509 9.73E-06 0.018018018 0 1.157630714 0.00134249 0.126126126 0.0440358
biological_process pattern specification process GO:0007389 16181 356 1.129204315 9.83E-06 0.036036036 0 1.125807293 1.62E-05 0.126126126 0
biological_process cell-substrate junction assembly GO:0007044 16494 43 1.374845302 1.01E-05 0.07027027 0 1.346451122 4.07E-05 0.122522523 0.00321669
biological_process regulation of endothelial cell migration GO:0010594 16475 62 1.311872614 1.02E-05 0.005405405 0 1.14618132 0.0228921 0.163963964 0.12883
biological_process regulation of anatomical structure size GO:0090066 16265 272 1.147859365 1.03E-05 0.021621622 0 1.119977852 0.000274362 0.061261261 0.0143821
biological_process metencephalon development GO:0022037 16455 82 1.27082765 1.03E-05 0.023423423 0 1.245807583 5.56E-05 0.063063063 0.00311687
biological_process chondrocyte differentiation GO:0002062 16470 67 1.299289713 1.06E-05 0.012612613 0 1.201627379 0.00208909 0.072072072 0.0505226
biological_process regulation of cell-cell adhesion GO:0022407 16466 71 1.290675866 1.06E-05 0.007207207 0 1.254593246 9.82E-05 0.010810811 0.00867783
biological_process morphogenesis of embryonic epithelium GO:0016331 16399 138 1.207841551 1.08E-05 0.016216216 0 1.189876716 5.23E-05 0.07027027 0.00315612
biological_process negative regulation of catalytic activity GO:0043086 16162 375 1.125099063 1.10E-05 0.027027027 0 1.030035258 0.154125 0.318918919 0.345277
biological_process myeloid cell differentiation GO:0030099 16300 237 1.15785383 1.12E-05 0.001801802 0 1.1309677 0.000217798 0.023423423 0.015138
biological_process neural tube closure GO:0001843 16463 74 1.283841967 1.12E-05 0.005405405 0 1.191454921 0.00212467 0.115315315 0.0501934
biological_process regulation of dendrite morphogenesis GO:0048814 16495 42 1.376453604 1.16E-05 0.055855856 0 1.413206025 1.71E-06 0.034234234 0
biological_process regulation of heart contraction GO:0008016 16436 101 1.242255684 1.17E-05 0.025225225 0 1.198527862 0.000263758 0.066666667 0.0145202
biological_process regulation of cellular metabolic process GO:0031323 12682 3855 1.034429664 1.18E-05 0.255855856 0 1.064793355 8.85E-16 0.100900901 0
biological_process amino acid transport GO:0006865 16432 105 1.237235525 1.20E-05 0.046846847 0 1.053073763 0.172348 0.358558559 0.365519
cellular_component Golgi apparatus GO:0005794 15843 980 1.075531646 1.22E-05 0.135135135 0 1.076470538 9.65E-06 0.081081081 0
molecular_function actin filament binding GO:0051015 16785 76 1.278523376 1.25E-05 0.014414414 0 1.201406608 0.0011514 0.088288288 0
biological_process negative regulation of cell proliferation GO:0008285 16116 421 1.116855726 1.29E-05 0.010810811 0 1.054938089 0.0239839 0.25045045 0.133482
biological_process negative regulation of neurogenesis GO:0050768 16451 86 1.260793283 1.33E-05 0.001801802 0 1.104554981 0.0461134 0.207207207 0.179149
biological_process positive regulation of endothelial cell migration GO:0010595 16500 37 1.398042892 1.34E-05 0.001801802 0 1.185045419 0.0254834 0.151351351 0.136448
biological_process actin filament organization GO:0007015 16342 195 1.172241248 1.39E-05 0.025225225 0 1.158498183 5.75E-05 0.009009009 0.00308805
biological_process tube closure GO:0060606 16462 75 1.278562707 1.41E-05 0.005405405 0 1.195942205 0.0016104 0.104504505 0.044075
molecular_function transmembrane receptor protein tyrosine kinase activity GO:0004714 16800 61 1.308960163 1.41E-05 0.059459459 0 1.19478543 0.00414723 0.158558559 0
biological_process regulation of vasoconstriction GO:0019229 16497 40 1.380343792 1.51E-05 0.016216216 0 1.15004009 0.0499241 0.095495495 0.183628
biological_process positive regulation of cell motility GO:2000147 16312 225 1.159289526 1.54E-05 0.048648649 0 1.084326565 0.013698 0.214414414 0.0994506
biological_process epithelial tube formation GO:0072175 16424 113 1.224986587 1.61E-05 0.021621622 0 1.170116794 0.000836322 0.108108108 0.0343771
cellular_component perinuclear region of cytoplasm GO:0048471 16377 446 1.112115684 1.62E-05 0.077477477 0 1.078699278 0.00176328 0.099099099 0
biological_process forebrain development GO:0030900 16257 280 1.142139644 1.63E-05 0.061261261 0 1.119524984 0.000238012 0.189189189 0.0147677
molecular_function active transmembrane transporter activity GO:0022804 16563 298 1.137481534 1.68E-05 0.046846847 0 1.01021463 0.378985 0.448648649 -1
biological_process carbohydrate derivative metabolic process GO:1901135 15296 1241 1.065252229 1.74E-05 0.037837838 0 1.051638626 0.000526798 0.066666667 0.0281121
biological_process morphogenesis of an epithelial sheet GO:0002011 16506 31 1.42867536 1.75E-05 0.009009009 0 1.33362123 0.000640099 0.03963964 0.0317059
biological_process embryonic epithelial tube formation GO:0001838 16425 112 1.224899537 1.76E-05 0.010810811 0 1.164270567 0.00125801 0.115315315 0.0427301
molecular_function beta-catenin binding GO:0008013 16800 61 1.305174366 1.77E-05 0.025225225 0 1.304163264 1.88E-05 0.066666667 0
biological_process positive regulation of cell migration GO:0030335 16317 220 1.15986158 1.78E-05 0.045045045 0 1.089247114 0.0104957 0.205405405 0.0848387
molecular_function protein kinase binding GO:0019901 16500 361 1.12413665 1.82E-05 0.045045045 0 1.14452705 7.62E-07 0.034234234 0
biological_process skeletal muscle fiber development GO:0048741 16450 87 1.254551329 1.87E-05 0.010810811 0 1.243561625 3.99E-05 0.037837838 0.00322704
molecular_function kinase binding GO:0019900 16461 400 1.117569806 1.88E-05 0.05045045 0 1.124721987 6.13E-06 0.064864865 0
biological_process carbohydrate metabolic process GO:0005975 15911 626 1.093285934 1.88E-05 0.021621622 0 1.049682076 0.0140855 0.169369369 0.100497
biological_process sex differentiation GO:0007548 16307 230 1.155456093 1.96E-05 0.003603604 0 1.085130338 0.0121639 0.111711712 0.0944347
biological_process positive regulation of locomotion GO:0040017 16305 232 1.154726908 1.97E-05 0.045045045 0 1.09392108 0.00629085 0.192792793 0.0645736
biological_process regulation of primary metabolic process GO:0080090 12745 3792 1.033810364 2.00E-05 0.248648649 0 1.061990029 2.52E-14 0.106306306 0
cellular_component proteinaceous extracellular matrix GO:0005578 16514 309 1.133544614 2.03E-05 0.118918919 0 1.08686678 0.00379766 0.142342342 0
molecular_function sequence-specific DNA binding RNA polymerase II transcription factor activity GO:0000981 16658 203 1.165117986 2.07E-05 0.003603604 0 1.184977852 2.19E-06 0.028828829 0
biological_process activation of JUN kinase activity GO:0007257 16512 25 1.472860122 2.08E-05 0.001801802 0 1.354233534 0.00106991 0.041441441 0.0407909
biological_process regulation of cellular response to stress GO:0080135 16271 266 1.143785665 2.11E-05 0.027027027 0 1.097930762 0.00264401 0.136936937 0.0526194
molecular_function sodium ion transmembrane transporter activity GO:0015081 16755 106 1.228732131 2.14E-05 0.043243243 0 1.135298807 0.00775018 0.16036036 0
biological_process vesicle-mediated transport GO:0016192 15789 748 1.084370628 2.15E-05 0.167567568 0 1.083733622 2.46E-05 0.163963964 0.00333415
biological_process positive regulation of cell projection organization GO:0031346 16391 146 1.194554656 2.16E-05 0.032432432 0 1.204287358 8.76E-06 0.054054054 0
biological_process defense response to Gram-positive bacterium GO:0050830 16502 35 1.398653632 2.16E-05 0.005405405 0 0.850152256 0.937878 0.87027027 -1
biological_process positive regulation of Ras GTPase activity GO:0032320 16442 95 1.241516165 2.17E-05 0.016216216 0 1.179167682 0.00120896 0.055855856 0.0412442
biological_process primary neural tube formation GO:0014020 16458 79 1.264623761 2.22E-05 0.009009009 0 1.182783585 0.00239613 0.131531532 0.0504163
biological_process neuromuscular process GO:0050905 16457 80 1.262945591 2.22E-05 0.041441441 0 1.192141753 0.00142304 0.18018018 0.0434175
biological_process positive regulation of neurological system process GO:0031646 16477 60 1.303132466 2.31E-05 0.037837838 0 1.098705619 0.0923104 0.27027027 0.253372
biological_process developmental maturation GO:0021700 16370 167 1.180931451 2.35E-05 0.010810811 0 1.186094682 1.42E-05 0.012612613 0
biological_process organelle localization GO:0051640 16342 195 1.167149616 2.38E-05 0.052252252 0 1.135632353 0.000483409 0.113513514 0.0219991
molecular_function protein heterodimerization activity GO:0046982 16475 386 1.117951186 2.45E-05 0.034234234 0 1.036472898 0.104635 0.151351351 0.189041
biological_process cell migration involved in sprouting angiogenesis GO:0002042 16514 23 1.488413707 2.45E-05 0.003603604 0 1.093459011 0.218626 0.304504505 0.418073
molecular_function cytokine receptor activity GO:0004896 16795 66 1.287459086 2.53E-05 0.003603604 0 1.095623637 0.0887966 0.136936937 0.155764
biological_process regulation of vasculature development GO:1901342 16389 148 1.191232664 2.59E-05 0.03963964 0 1.06172705 0.0956878 0.248648649 0.256178

biological_process activation of MAPK activity GO:0000187 16454 83 1.255762712 2.60E-05 0.003603604 0 1.152661371 0.00786706 0.086486486 0.0764909
biological_process cellular response to peptide hormone stimulus GO:0071375 16381 156 1.186099045 2.61E-05 0.03963964 0 1.16442395 0.000175786 0.063063063 0.0130727
biological_process cellular response to peptide GO:1901653 16381 156 1.186099045 2.61E-05 0.03963964 0 1.16442395 0.000175786 0.063063063 0.0130727
biological_process generation of a signal involved in cell-cell signaling GO:0003001 16263 274 1.139820681 2.65E-05 0.093693694 0 1.121521688 0.000221294 0.127927928 0.0150624
biological_process signal release GO:0023061 16263 274 1.139820681 2.65E-05 0.093693694 0 1.121521688 0.000221294 0.127927928 0.0150624
biological_process regulation of cartilage development GO:0061035 16493 44 1.351355085 2.65E-05 0.007207207 0 1.186552266 0.0159292 0.05045045 0.108409
biological_process patterning of blood vessels GO:0001569 16503 34 1.399327407 2.70E-05 0.009009009 0 1.297564997 0.00131321 0.108108108 0.0441097
molecular_function organic anion transmembrane transporter activity GO:0008514 16760 101 1.231018801 2.75E-05 0.005405405 0 0.98949485 0.572773 0.511711712 -1
biological_process muscle cell proliferation GO:0033002 16430 107 1.224372065 2.75E-05 0.007207207 0 1.11463519 0.0196744 0.162162162 0.122942
biological_process response to cytokine stimulus GO:0034097 16179 358 1.121588608 2.81E-05 0.005405405 0 1.05438916 0.0357779 0.189189189 0.157101
biological_process cellular response to vascular endothelial growth factor stimulus GO:0035924 16517 20 1.51862276 2.91E-05 0.010810811 0 1.323755746 0.00604789 0.086486486 0.0650168
biological_process positive regulation of transport GO:0051050 16097 440 1.108934621 3.02E-05 0.099099099 0 1.09693192 0.000178847 0.144144144 0.0130389
biological_process single-organism reproductive behavior GO:0044704 16491 46 1.340882105 3.03E-05 0.12972973 0 1.227033252 0.00378386 0.18018018 0.0584148
molecular_function Rho guanyl-nucleotide exchange factor activity GO:0005089 16786 75 1.266262622 3.13E-05 0.048648649 0 1.344874146 1.08E-07 0.027027027 0
cellular_component excitatory synapse GO:0060076 16802 21 1.503918114 3.14E-05 0.021621622 0 1.238792188 0.0289426 0.246846847 0.0148337
biological_process canonical Wnt receptor signaling pathway GO:0060070 16365 172 1.175267627 3.14E-05 0.003603604 0 1.133489146 0.00115127 0.127927928 0.0418586
biological_process positive regulation of immune system process GO:0002684 16160 377 1.117491183 3.21E-05 0.009009009 0 1.037241685 0.102606 0.216216216 0.264093
biological_process skeletal system development GO:0001501 16238 299 1.131837156 3.38E-05 0.01981982 0 1.139186222 1.29E-05 0.086486486 0
biological_process regulation of chondrocyte differentiation GO:0032330 16505 32 1.406269775 3.38E-05 0.003603604 0 1.151907764 0.0681361 0.10990991 0.218813
biological_process cardiac chamber morphogenesis GO:0003206 16442 95 1.235218685 3.41E-05 0.005405405 0 1.111818897 0.029169 0.190990991 0.143301
biological_process learning GO:0007612 16446 91 1.240107819 3.47E-05 0.147747748 0 1.193699725 0.000665276 0.14954955 0.031445
biological_process positive regulation of GTPase activity GO:0043547 16396 141 1.192452204 3.52E-05 0.043243243 0 1.177957277 0.000118556 0.05045045 0.00836475
cellular_component basolateral plasma membrane GO:0016323 16672 151 1.185692474 3.59E-05 0.036036036 0 1.05556452 0.117427 0.327927928 0.200364
biological_process positive regulation of epithelial cell proliferation GO:0050679 16428 109 1.21828254 3.74E-05 0.023423423 0 1.146054981 0.00402696 0.084684685 0.0588205
biological_process regulation of synapse assembly GO:0051963 16506 31 1.409041139 3.93E-05 0.027027027 0 1.321262555 0.000964066 0.126126126 0.0373181
biological_process exocrine system development GO:0035272 16492 45 1.339268892 3.95E-05 0.001801802 0 1.14945356 0.0410303 0.120720721 0.167161
cellular_component myosin complex GO:0016459 16765 58 1.298580723 3.98E-05 0.003603604 0 1.084742003 0.131406 0.236036036 0.230839
biological_process response to bacterium GO:0009617 16240 297 1.130936568 4.01E-05 0.007207207 0 1.026603501 0.211499 0.286486486 0.409422
molecular_function extracellular matrix structural constituent GO:0005201 16832 29 1.422133516 4.06E-05 0.032432432 0 1.231474128 0.0153498 0.07027027 0.0239228
biological_process cardiocyte differentiation GO:0035051 16450 87 1.24280127 4.20E-05 0.007207207 0 1.216311162 0.000229273 0.01981982 0.0149507
molecular_function transcription regulatory region DNA binding GO:0044212 16564 297 1.130548681 4.22E-05 0.009009009 0 1.187804948 7.74E-09 0.001801802 0
biological_process nucleus localization GO:0051647 16516 21 1.494646441 4.27E-05 0.012612613 0 1.455676896 0.000147775 0.025225225 0.0107078
biological_process development of primary sexual characteristics GO:0045137 16333 204 1.157468876 4.43E-05 0.007207207 0 1.066537173 0.048841 0.151351351 0.182095
cellular_component synaptic vesicle GO:0008021 16719 104 1.221127069 4.46E-05 0.097297297 0 1.107909626 0.0279369 0.201801802 0.0150132
biological_process digestive tract development GO:0048565 16440 97 1.22898126 4.47E-05 0.030630631 0 1.160815622 0.00296708 0.104504505 0.0573479
biological_process regulation of sequence-specific DNA binding transcription factor activity GO:0051090 16269 268 1.136815776 4.59E-05 0.003603604 0 1.094700959 0.00339258 0.063063063 0.0574087
biological_process negative regulation of cellular component organization GO:0051129 16258 279 1.133814842 4.72E-05 0.001801802 0 1.126784198 0.000108071 0.016216216 0.00848227
biological_process cardiac chamber development GO:0003205 16431 106 1.217873915 4.86E-05 0.007207207 0 1.104127494 0.0312438 0.212612613 0.146745
biological_process reproductive process GO:0022414 15578 959 1.070171393 5.27E-05 0.045045045 0 1.050519302 0.00262088 0.189189189 0.0526977
cellular_component clathrin-coated vesicle membrane GO:0030665 16744 79 1.251165373 5.31E-05 0.081081081 0 1.18288434 0.00238503 0.075675676 0
molecular_function regulatory region DNA binding GO:0000975 16557 304 1.127095122 5.37E-05 0.009009009 0 1.179252295 2.34E-08 0.001801802 0
molecular_function regulatory region nucleic acid binding GO:0001067 16557 304 1.127095122 5.37E-05 0.009009009 0 1.179252295 2.34E-08 0.001801802 0
biological_process response to hormone stimulus GO:0009725 15903 634 1.086887721 5.58E-05 0.066666667 0 1.050119205 0.0129126 0.201801802 0.0980354
cellular_component growth cone GO:0030426 16721 102 1.22016466 5.60E-05 0.099099099 0 1.223626104 4.36E-05 0.068468468 0
biological_process regulation of cell-substrate adhesion GO:0010810 16441 96 1.226754578 5.68E-05 0.025225225 0 1.154933634 0.00418239 0.169369369 0.0581912
molecular_function symporter activity GO:0015293 16743 118 1.204011795 5.86E-05 0.037837838 0 1.043043996 0.208201 0.342342342 0.378976
biological_process multi-organism process GO:0051704 15798 739 1.079909599 5.92E-05 0.005405405 0 1.027685418 0.0911685 0.261261261 0.251348
cellular_component cation channel complex GO:0034703 16723 100 1.221541312 5.93E-05 0.122522523 0 1.299501411 9.80E-08 0.05045045 0
biological_process neural tube development GO:0021915 16402 135 1.190223549 6.05E-05 0.030630631 0 1.175783133 0.000191139 0.077477477 0.0129055
biological_process organic acid transport GO:0015849 16356 181 1.163505424 6.38E-05 0.045045045 0 1.00279014 0.473977 0.466666667 -1
biological_process carboxylic acid transport GO:0046942 16356 181 1.163505424 6.38E-05 0.045045045 0 1.00279014 0.473977 0.466666667 -1
biological_process platelet activation GO:0030168 16495 42 1.339735735 6.72E-05 0.001801802 0 1.06608511 0.228827 0.272072072 0.427272
molecular_function growth factor binding GO:0019838 16770 91 1.230398548 6.75E-05 0.03963964 0 1.146150279 0.0077304 0.133333333 0
cellular_component myelin sheath GO:0043209 16785 38 1.356699805 6.87E-05 0.048648649 0 1.09084199 0.165767 0.257657658 0.293172
cellular_component Golgi apparatus part GO:0044431 16330 493 1.097560918 7.00E-05 0.154954955 0 1.112957168 5.19E-06 0.030630631 0
biological_process regulation of epithelial cell migration GO:0010632 16451 86 1.236022904 7.20E-05 0.016216216 0 1.170039341 0.00308729 0.158558559 0.0569382
biological_process cellular response to oxygen-containing compound GO:1901701 16071 466 1.100130962 7.30E-05 0.041441441 0 1.08206612 0.000927451 0.108108108 0.0360545
biological_process olfactory lobe development GO:0021988 16507 30 1.399484622 7.43E-05 0.041441441 0 1.344225842 0.000540373 0.063063063 0.0279934
biological_process defense response to bacterium GO:0042742 16454 83 1.239655177 7.49E-05 0.009009009 0 0.900296866 0.942645 0.89009009 -1
biological_process response to insulin stimulus GO:0032868 16367 170 1.166643262 7.75E-05 0.100900901 0 1.142598736 0.000603895 0.088288288 0.0297742
biological_process regulation of secretion GO:0051046 16156 381 1.110390034 7.97E-05 0.075675676 0 1.068859836 0.00925373 0.144144144 0.0775906
cellular_component neuron projection terminus GO:0044306 16738 85 1.235650016 8.08E-05 0.054054054 0 1.252050965 2.73E-05 0.021621622 0
biological_process regulation of angiogenesis GO:0045765 16399 138 1.184583662 8.11E-05 0.03963964 0 1.061967094 0.102739 0.21981982 0.263999
cellular_component coated vesicle membrane GO:0030662 16717 106 1.210714904 8.18E-05 0.084684685 0 1.170217928 0.00116271 0.081081081 0
biological_process cell activation GO:0001775 16027 510 1.094874856 8.18E-05 0.030630631 0 1.089207557 0.00019675 0.034234234 0.0128398
biological_process nerve development GO:0021675 16488 49 1.309752328 8.46E-05 0.003603604 0 1.29073854 0.000207551 0.036036036 0.0127426
biological_process positive regulation of transmission of nerve impulse GO:0051971 16482 55 1.292116111 8.54E-05 0.048648649 0 1.090567493 0.121954 0.284684685 0.297336
molecular_function SH3 domain binding GO:0017124 16744 117 1.199714482 8.68E-05 0.072072072 0 1.234658804 5.13E-06 0.034234234 0
biological_process adult behavior GO:0030534 16423 114 1.202126473 8.81E-05 0.099099099 0 1.148321448 0.00295809 0.136936937 0.0575238
biological_process muscle system process GO:0003012 16339 198 1.152507205 9.23E-05 0.007207207 0 1.091704273 0.0122717 0.093693694 0.0952339
biological_process BMP signaling pathway GO:0030509 16450 87 1.230668948 9.33E-05 0.009009009 0 1.21535064 0.000243039 0.046846847 0.0146959
biological_process synaptic transmission, glutamatergic GO:0035249 16480 57 1.285150852 9.37E-05 0.095495495 0 1.174301043 0.0112086 0.190990991 0.0882321
molecular_function GTPase binding GO:0051020 16720 141 1.180833734 9.39E-05 0.118918919 0 1.221119063 2.47E-06 0.046846847 0
cellular_component cytoplasmic vesicle membrane GO:0030659 16570 253 1.134165241 9.79E-05 0.124324324 0 1.10717104 0.00146482 0.063063063 0
biological_process membrane depolarization GO:0051899 16467 70 1.255882398 0.000101201 0.081081081 0 1.260761221 7.63E-05 0.057657658 0.00599209
biological_process innate immune response GO:0045087 16263 274 1.128517323 0.000101368 0.012612613 0 0.994858762 0.559133 0.558558559 -1
biological_process negative regulation of cell development GO:0010721 16435 102 1.211746905 0.0001014 0.005405405 0 1.047673839 0.20144 0.354954955 0.397484
molecular_function integrin binding GO:0005178 16801 60 1.276144414 0.000102992 0.043243243 0 1.144307458 0.0262156 0.171171171 0.0497297
biological_process cation homeostasis GO:0055080 16191 346 1.113823186 0.000105239 0.030630631 0 1.041654243 0.0875127 0.23963964 0.24769
biological_process negative regulation of molecular function GO:0044092 16017 520 1.09230852 0.000105857 0.046846847 0 1.033283422 0.0908261 0.243243243 0.250739
cellular_component vesicle membrane GO:0012506 16555 268 1.129459411 0.000107588 0.126126126 0 1.095703422 0.00311374 0.081081081 0

biological_process peptidyl-amino acid modification GO:0018193 15999 538 1.090289766 0.000113092 0.075675676 0 1.115371209 1.22E-06 0.016216216 0
molecular_function Ras GTPase activator activity GO:0005099 16771 90 1.223803153 0.000113278 0.086486486 0 1.222935982 0.000119807 0.106306306 0
biological_process associative learning GO:0008306 16481 56 1.283751208 0.000114747 0.117117117 0 1.217947991 0.00232927 0.113513514 0.0507299
biological_process regulation of response to stress GO:0080134 15989 548 1.089317491 0.000115248 0.014414414 0 1.044040064 0.0346927 0.2 0.154837
biological_process positive regulation of synaptic transmission GO:0050806 16483 54 1.288773568 0.000115912 0.059459459 0 1.110109248 0.0801986 0.246846847 0.23735
biological_process embryonic skeletal system development GO:0048706 16448 89 1.224383456 0.000118276 0.001801802 0 1.084344592 0.0835016 0.214414414 0.243945
biological_process nephron development GO:0072006 16459 78 1.239585986 0.000119545 0.037837838 0 1.147090075 0.0120551 0.212612613 0.0925543
molecular_function voltage-gated cation channel activity GO:0022843 16738 123 1.190487284 0.000120043 0.176576577 0 1.239580239 1.93E-06 0.113513514 0
biological_process hindbrain morphogenesis GO:0021575 16503 34 1.363022307 0.000121196 0.007207207 0 1.362652391 0.000122981 0.009009009 0.00829567
cellular_component extracellular organelle GO:0043230 16760 63 1.266194477 0.000122933 0.043243243 0 1.069851657 0.167997 0.344144144 0.295102
cellular_component extracellular membrane-bounded organelle GO:0065010 16760 63 1.266194477 0.000122933 0.043243243 0 1.069851657 0.167997 0.344144144 0.295102
cellular_component cytoplasmic vesicle part GO:0044433 16561 262 1.129543826 0.000125855 0.131531532 0 1.104393445 0.00158936 0.066666667 0
biological_process developmental process involved in reproduction GO:0003006 16140 397 1.104758056 0.000126373 0.016216216 0 1.054057159 0.0294954 0.209009009 0.142933
biological_process regulation of cell death GO:0010941 15527 1010 1.064382113 0.000127454 0.012612613 0 1.03792271 0.0156127 0.135135135 0.108176
biological_process heart process GO:0003015 16413 124 1.188830063 0.000128201 0.023423423 0 1.146015523 0.00235002 0.100900901 0.0504871
biological_process heart contraction GO:0060047 16413 124 1.188830063 0.000128201 0.023423423 0 1.146015523 0.00235002 0.100900901 0.0504871
biological_process somatic stem cell maintenance GO:0035019 16499 38 1.341953768 0.000128433 0.021621622 0 1.302382888 0.000613956 0.066666667 0.0297129
biological_process positive regulation of catabolic process GO:0009896 16415 122 1.190327669 0.000128782 0.012612613 0 1.159281331 0.00111229 0.028828829 0.0422512
biological_process cerebellar cortex development GO:0021695 16501 36 1.351078097 0.000129832 0.001801802 0 1.356802307 0.000102778 0.009009009 0.00855445
biological_process transmembrane receptor protein serine/threonine kinase signaling pathway GO:0007178 16333 204 1.14669745 0.000130234 0.055855856 0 1.197543087 4.39E-07 0.045045045 0
biological_process axis elongation GO:0003401 16510 27 1.405284527 0.000130819 0.005405405 0 1.274308517 0.00674035 0.093693694 0.0707988
molecular_function non-membrane spanning protein tyrosine kinase activity GO:0004715 16819 42 1.324638947 0.000131789 0.001801802 0 1.07893275 0.187505 0.246846847 0.346149
biological_process cardiac muscle tissue development GO:0048738 16403 134 1.181227436 0.000131932 0.003603604 0 1.139712777 0.0024573 0.073873874 0.0501862
cellular_component extracellular space GO:0005615 16226 597 1.084651926 0.000132211 0.133333333 0 1.004505948 0.423034 0.472072072 -1
biological_process positive regulation of cell-substrate adhesion GO:0010811 16481 56 1.28095029 0.000132271 0.003603604 0 1.111705305 0.0734866 0.254054054 0.228028
biological_process Schwann cell differentiation GO:0014037 16513 24 1.429006629 0.000134774 0.009009009 0 1.135081561 0.125687 0.12972973 0.301061
biological_process salivary gland morphogenesis GO:0007435 16504 33 1.365385262 0.000136734 0.001801802 0 1.217842108 0.0150158 0.099099099 0.105805
molecular_function RNA polymerase II distal enhancer sequence-specific DNA binding transcription factor activity GO:0003705 16787 74 1.243593458 0.00013763 0.010810811 0 1.303730314 2.87E-06 0.003603604 0
biological_process cerebellum morphogenesis GO:0021587 16506 31 1.375671155 0.000143762 0.007207207 0 1.35371188 0.000319711 0.014414414 0.0142501
cellular_component extracellular region GO:0005576 15451 1372 1.054165864 0.000143971 0.163963964 0 1.006891987 0.322376 0.405405405 -1
cellular_component endomembrane system GO:0012505 15360 1463 1.052276242 0.000144828 0.225225225 0 1.063058943 6.15E-06 0.081081081 0
biological_process regulation of behavior GO:0050795 16414 123 1.187601455 0.00014885 0.01981982 0 1.145205728 0.00255753 0.176576577 0.0528506
biological_process mesenchyme development GO:0060485 16399 138 1.176880692 0.000150673 0.001801802 0 1.0923671 0.0295616 0.216216216 0.142716
biological_process olfactory bulb development GO:0021772 16508 29 1.386766951 0.000152665 0.048648649 0 1.332317457 0.000959774 0.057657658 0.0373906
biological_process regulation of protein kinase B signaling cascade GO:0051896 16456 81 1.230997719 0.000153233 0.007207207 0 1.083550796 0.0958441 0.194594595 0.255943
biological_process glomerulus development GO:0032835 16492 45 1.309822804 0.000156217 0.028828829 0 1.133487583 0.0602011 0.268468468 0.205178
molecular_function cation channel activity GO:0005261 16616 245 1.131969964 0.000156544 0.151351351 0 1.193274373 6.51E-08 0.063063063 0
molecular_function protein binding transcription factor activity GO:0000988 16519 342 1.111278293 0.000158368 0.012612613 0 1.138156282 3.89E-06 0.005405405 0
biological_process negative regulation of MAPK cascade GO:0043409 16444 93 1.214938155 0.000158899 0.014414414 0 1.042396534 0.238817 0.302702703 0.441337
biological_process muscle contraction GO:0006936 16368 169 1.159020084 0.00015965 0.009009009 0 1.093071692 0.0175822 0.113513514 0.114559
biological_process sensory organ development GO:0007423 16125 412 1.101027826 0.000161005 0.028828829 0 1.084188059 0.00136176 0.192792793 0.0437993
cellular_component presynaptic membrane GO:0042734 16772 51 1.290283948 0.000161479 0.156756757 0 1.292710455 0.000143804 0.138738739 0
biological_process establishment of organelle localization GO:0051656 16402 135 1.177959945 0.000161521 0.018018018 0 1.124668359 0.00588143 0.124324324 0.0644291
biological_process neural tube formation GO:0001841 16443 94 1.213369499 0.000163233 0.03963964 0 1.174822427 0.00161916 0.113513514 0.0439221
cellular_component endosome GO:0005768 16354 469 1.094449375 0.00016326 0.12972973 0 1.050114778 0.0282844 0.198198198 0.0149162
biological_process protein kinase B signaling cascade GO:0043491 16434 103 1.203551686 0.000165728 0.007207207 0 1.07847422 0.0832197 0.189189189 0.243162
biological_process regulation of Wnt receptor signaling pathway GO:0030111 16374 163 1.161166798 0.000170675 0.018018018 0 1.187482928 1.55E-05 0.072072072 0
molecular_function receptor signaling protein activity GO:0005057 16786 75 1.238088801 0.000172203 0.009009009 0 1.140017335 0.0176462 0.12972973 0.0290886
biological_process response to other organism GO:0051707 16089 448 1.096007639 0.000179623 0.009009009 0 0.998045694 0.528998 0.526126126 -1
biological_process cell chemotaxis GO:0060326 16413 124 1.184256027 0.000180334 0.007207207 0 1.210529915 2.29E-05 0.005405405 0.00337916
biological_process negative regulation of phosphorus metabolic process GO:0010563 16313 224 1.136671699 0.000180403 0.048648649 0 1.07506554 0.025045 0.144144144 0.135493
biological_process negative regulation of phosphate metabolic process GO:0045936 16313 224 1.136671699 0.000180403 0.048648649 0 1.07506554 0.025045 0.144144144 0.135493
biological_process negative regulation of cell projection organization GO:0031345 16468 69 1.247134587 0.000183234 0.048648649 0 1.279772748 2.75E-05 0.037837838 0.00329036
biological_process cochlea development GO:0090102 16507 30 1.375088201 0.000184247 0.003603604 0 1.231797526 0.0138669 0.055855856 0.0998146
cellular_component external side of plasma membrane GO:0009897 16626 197 1.145596344 0.000185099 0.027027027 0 1.029759829 0.233392 0.345945946 0.39086
molecular_function solute:cation symporter activity GO:0015294 16790 71 1.243349872 0.000186023 0.021621622 0 1.029673179 0.332155 0.38018018 -1
cellular_component cell cortex GO:0005938 16649 174 1.154864225 0.000187742 0.113513514 0 1.157207622 0.000152776 0.111711712 0
molecular_function transcription cofactor activity GO:0003712 16555 306 1.115972505 0.000195434 0.010810811 0 1.151563248 1.79E-06 0.007207207 0
cellular_component apical part of cell GO:0045177 16553 270 1.123303293 0.000201731 0.046846847 0 1.023441489 0.250621 0.401801802 0.4158
biological_process osteoblast differentiation GO:0001649 16397 140 1.171859176 0.000202297 0.003603604 0 1.037026396 0.223041 0.347747748 0.421975
cellular_component site of polarized growth GO:0030427 16718 105 1.198424664 0.000205503 0.120720721 0 1.217501729 5.39E-05 0.068468468 0
biological_process positive regulation of ERK1 and ERK2 cascade GO:0070374 16460 77 1.231334364 0.000212362 0.007207207 0 1.051532194 0.21622 0.327927928 0.415952
biological_process cellular response to insulin stimulus GO:0032869 16412 125 1.181244692 0.00021324 0.077477477 0 1.180702908 0.00022192 0.095495495 0.0150248
biological_process gonad development GO:0008406 16358 179 1.15109583 0.000215369 0.007207207 0 1.051261091 0.116165 0.163963964 0.285815
biological_process response to biotic stimulus GO:0009607 16059 478 1.091614113 0.000215386 0.014414414 0 1.001948377 0.47022 0.47027027 -1
biological_process platelet-derived growth factor receptor signaling pathway GO:0048008 16502 35 1.343065452 0.000216485 0.03963964 0 1.154909411 0.0560276 0.203603604 0.196292
biological_process gland development GO:0048732 16279 258 1.12547844 0.000216991 0.034234234 0 1.080967225 0.0115929 0.234234234 0.0903591
biological_process regulation of smooth muscle cell proliferation GO:0048660 16470 67 1.247605767 0.000217746 0.028828829 0 1.13083947 0.0315328 0.145945946 0.148354
biological_process cellular response to cytokine stimulus GO:0071345 16289 248 1.127948567 0.000218713 0.003603604 0 1.060635138 0.0478166 0.18018018 0.181099
cellular_component synaptic vesicle membrane GO:0030672 16771 52 1.281048367 0.000219205 0.102702703 0 1.200739516 0.00601655 0.118918919 0
biological_process regulation of cell size GO:0008361 16461 76 1.232279353 0.000219496 0.036036036 0 1.195674538 0.00153097 0.081081081 0.0427463
biological_process negative regulation of cell adhesion GO:0007162 16458 79 1.227775628 0.000219878 0.003603604 0 1.173491567 0.00371112 0.03963964 0.0586532
molecular_function identical protein binding GO:0042802 16062 799 1.07003708 0.000221304 0.001801802 0 1.036415088 0.0338726 0.136936937 0.050867
biological_process renal system process GO:0003014 16476 61 1.258996377 0.000223924 0.023423423 0 1.07173304 0.165488 0.293693694 0.35527
biological_process actin filament bundle assembly GO:0051017 16465 72 1.238312174 0.000223933 0.016216216 0 1.148506915 0.0143581 0.176576577 0.101088
biological_process regulation of cytoskeleton organization GO:0051493 16291 246 1.128181563 0.000225437 0.025225225 0 1.103783373 0.00225195 0.023423423 0.0496434
biological_process peripheral nervous system development GO:0007422 16485 52 1.280235317 0.000227711 0.007207207 0 1.161247882 0.0218395 0.086486486 0.127393
biological_process multicellular organism growth GO:0035264 16402 135 1.17347195 0.000227998 0.025225225 0 1.168500218 0.000330932 0.075675676 0.0141504
biological_process response to drug GO:0042493 16154 383 1.102160343 0.000229435 0.041441441 0 1.051608033 0.0383676 0.145945946 0.162286
biological_process glutamate receptor signaling pathway GO:0007215 16492 45 1.300913999 0.000231661 0.12972973 0 1.196478077 0.0111275 0.183783784 0.0872986
biological_process cell growth GO:0016049 16243 294 1.116821451 0.000231994 0.03963964 0 1.107167298 0.000660452 0.057657658 0.0315101

cellular_component neuron projection membrane GO:0032589 16793 30 1.368268289 0.000235352 0.09009009 0 1.250662425 0.00865253 0.16036036 0
biological_process respiratory system development GO:0060541 16360 177 1.150909141 0.000235978 0.014414414 0 1.101503841 0.00934537 0.171171171 0.0774356
biological_process peptidyl-tyrosine phosphorylation GO:0018108 16354 183 1.148119717 0.000241533 0.012612613 0 1.111958466 0.00417096 0.154954955 0.058354
biological_process formation of primary germ layer GO:0001704 16467 70 1.240160977 0.00024361 0.012612613 0 1.122626942 0.0374731 0.223423423 0.161131
biological_process regulation of developmental growth GO:0048638 16433 104 1.196793177 0.000244136 0.034234234 0 1.128203827 0.011553 0.189189189 0.0894536
biological_process regulation of programmed cell death GO:0043067 15566 971 1.062605157 0.000248245 0.012612613 0 1.033260912 0.032146 0.163963964 0.149816
biological_process Notch signaling pathway GO:0007219 16447 90 1.211125873 0.000251965 0.005405405 0 1.14114405 0.0100208 0.104504505 0.0808446
biological_process phosphatidylinositol 3-kinase cascade GO:0014065 16474 63 1.252546155 0.000252018 0.027027027 0 1.085277145 0.120082 0.30990991 0.294668
biological_process regulation of polysaccharide biosynthetic process GO:0032885 16509 28 1.37893707 0.000254473 0.003603604 0 1.203401357 0.0310358 0.138738739 0.146791
biological_process glycoprotein metabolic process GO:0009100 16285 252 1.125430115 0.000255109 0.064864865 0 1.132383821 0.000122249 0.037837838 0.00834175
molecular_function solute:sodium symporter activity GO:0015370 16814 47 1.291702929 0.000261495 0.028828829 0 1.013668546 0.435451 0.457657658 -1
molecular_function core promoter binding GO:0001047 16809 52 1.277064402 0.000264171 0.003603604 0 1.256499258 0.000666689 0.003603604 0
biological_process vascular endothelial growth factor receptor signaling pathway GO:0048010 16494 43 1.304650141 0.000265404 0.005405405 0 1.228695147 0.00464928 0.073873874 0.0592134
biological_process ear development GO:0043583 16358 179 1.148629857 0.00026707 0.003603604 0 1.13634053 0.000744779 0.102702703 0.0329362
molecular_function organic acid:sodium symporter activity GO:0005343 16838 23 1.416435081 0.000268482 0.016216216 0 0.993482249 0.521614 0.497297297 -1
biological_process positive regulation of neurogenesis GO:0050769 16413 124 1.178794491 0.000268677 0.03963964 0 1.134907149 0.00450357 0.172972973 0.0571333
biological_process cardiac ventricle morphogenesis GO:0003208 16478 59 1.259652728 0.000269417 0.009009009 0 1.053693913 0.237122 0.306306306 0.437167
biological_process visual behavior GO:0007632 16499 38 1.323250369 0.000274756 0.120720721 0 1.223428893 0.00846268 0.145945946 0.0771186
biological_process smooth muscle cell proliferation GO:0048659 16467 70 1.237828678 0.000276358 0.028828829 0 1.125216657 0.0345013 0.16036036 0.153229
biological_process multicellular organismal macromolecule metabolic process GO:0044259 16489 48 1.287357633 0.00027684 0.012612613 0 1.041677676 0.30825 0.306306306 -1
biological_process organ growth GO:0035265 16455 82 1.21962832 0.000276848 0.007207207 0 1.087966581 0.0833157 0.27027027 0.243526
biological_process regulation of insulin receptor signaling pathway GO:0046626 16508 29 1.369740277 0.000278453 0.001801802 0 1.2775135 0.00478813 0.037837838 0.0601278
biological_process positive regulation of smooth muscle cell proliferation GO:0048661 16496 41 1.310797814 0.000279014 0.01981982 0 1.203921647 0.0117742 0.100900901 0.0901176
biological_process regulation of apoptotic process GO:0042981 15577 960 1.06240904 0.000279508 0.012612613 0 1.030740706 0.0445967 0.176576577 0.177234
biological_process peptidyl-tyrosine modification GO:0018212 16352 185 1.145650349 0.000279548 0.012612613 0 1.108899484 0.00494108 0.151351351 0.0610318
biological_process adherens junction organization GO:0034332 16492 45 1.296383005 0.000281966 0.063063063 0 1.331529115 5.73E-05 0.09009009 0.00309761
biological_process regulation of growth GO:0040008 16086 451 1.092422905 0.000283532 0.030630631 0 1.071260794 0.00393426 0.142342342 0.0590513
molecular_function motor activity GO:0003774 16734 127 1.175396765 0.000294494 0.052252252 0 0.99708022 0.522805 0.508108108 -1
molecular_function cytokine binding GO:0019955 16814 47 1.288762916 0.000297662 0.005405405 0 1.210924494 0.00606847 0.068468468 0
biological_process regulation of protein transport GO:0051223 16273 264 1.121017027 0.000298263 0.01981982 0 1.040540942 0.125063 0.225225225 0.300866
biological_process cardiac ventricle development GO:0003231 16450 87 1.211900546 0.000299103 0.014414414 0 1.095714935 0.0605249 0.248648649 0.205173
biological_process branching involved in salivary gland morphogenesis GO:0060445 16515 22 1.421942067 0.000301569 0.003603604 0 1.228645546 0.0315304 0.106306306 0.148475
biological_process protein localization to membrane GO:0072657 16439 98 1.19939511 0.000302777 0.01981982 0 1.132649409 0.0112675 0.140540541 0.0881519
biological_process neural precursor cell proliferation GO:0061351 16443 94 1.203319111 0.000308443 0.041441441 0 1.152448349 0.00512392 0.198198198 0.060502
biological_process vascular process in circulatory system GO:0003018 16416 121 1.178966655 0.000310385 0.034234234 0 1.105266872 0.0220633 0.174774775 0.127568
biological_process visual learning GO:0008542 16501 36 1.328869911 0.000311403 0.122522523 0 1.24102815 0.00607798 0.131531532 0.0648557
biological_process organelle organization GO:0006996 14538 1999 1.041423906 0.000311591 0.14954955 0 1.055592363 2.20E-06 0.007207207 0
biological_process stem cell maintenance GO:0019827 16445 92 1.205236211 0.000314039 0.021621622 0 1.195904575 0.000549791 0.059459459 0.0299551
biological_process glial cell development GO:0021782 16475 62 1.250188468 0.000314763 0.005405405 0 1.116131169 0.0562813 0.057657658 0.197104
biological_process regulation of macromolecule metabolic process GO:0060255 12867 3670 1.028683785 0.000322879 0.266666667 0 1.054211735 5.65E-11 0.124324324 0
biological_process cerebellar cortex morphogenesis GO:0021696 16514 23 1.410069502 0.000326358 0.009009009 0 1.437258622 0.000139141 0.014414414 0.0107647
biological_process organic substance transport GO:0071702 14865 1672 1.045413743 0.000346466 0.147747748 0 1.027186848 0.0211541 0.194594595 0.126588
biological_process pathway-restricted SMAD protein phosphorylation GO:0060389 16504 33 1.340066079 0.000353261 0.023423423 0 1.087464253 0.19185 0.34954955 0.387772
biological_process anoikis GO:0043276 16516 21 1.426278415 0.000355021 0.012612613 0 1.29881397 0.00881534 0.027027027 0.0773912
molecular_function transcription factor binding transcription factor activity GO:0000989 16533 328 1.106873284 0.000355082 0.009009009 0 1.138022865 6.14E-06 0.005405405 0
biological_process negative regulation of Wnt receptor signaling pathway GO:0030178 16434 103 1.191916191 0.000356852 0.025225225 0 1.201238676 0.000193696 0.086486486 0.0128725
biological_process cell death GO:0008219 15211 1326 1.051450975 0.000357967 0.018018018 0 1.045632279 0.00134776 0.093693694 0.0439564
biological_process multi-organism behavior GO:0051705 16483 54 1.265171281 0.000361589 0.075675676 0 1.219606034 0.00255733 0.138738739 0.0529353
biological_process regulation of establishment of protein localization GO:0070201 16246 291 1.113386634 0.000362322 0.025225225 0 1.048402266 0.0745375 0.194594595 0.227898
biological_process regulation of stem cell proliferation GO:0072091 16466 71 1.230667049 0.000370752 0.003603604 0 1.19360844 0.0023149 0.086486486 0.0508929
molecular_function voltage-gated ion channel activity GO:0005244 16695 166 1.150273753 0.0003755 0.171171171 0 1.242296511 2.76E-08 0.025225225 0
molecular_function voltage-gated channel activity GO:0022832 16695 166 1.150273753 0.0003755 0.171171171 0 1.242296511 2.76E-08 0.025225225 0
biological_process regulation of cell activation GO:0050865 16258 279 1.115314973 0.000383203 0.01981982 0 1.073646922 0.0158233 0.106306306 0.10859
biological_process regulation of intracellular protein transport GO:0033157 16384 153 1.156310913 0.000383538 0.007207207 0 1.069451841 0.0674882 0.232432432 0.218449
biological_process regulation of cellular response to insulin stimulus GO:1900076 16502 35 1.327945245 0.000384053 0.005405405 0 1.209623412 0.0157664 0.104504505 0.108894
biological_process cytokine-mediated signaling pathway GO:0019221 16389 148 1.158866475 0.000386085 0.005405405 0 1.100793637 0.0164449 0.104504505 0.111961
biological_process heart valve development GO:0003170 16511 26 1.380033782 0.000391055 0.007207207 0 1.101950682 0.183771 0.268468468 0.378845
biological_process adherens junction assembly GO:0034333 16498 39 1.310155631 0.000391342 0.073873874 0 1.310738595 0.000382496 0.10990991 0.0161714
biological_process telencephalon development GO:0021537 16371 166 1.149754584 0.000391451 0.077477477 0 1.114239325 0.00519933 0.201801802 0.062956
biological_process regulation of systemic arterial blood pressure by hormone GO:0001990 16508 29 1.35928157 0.000398064 0.010810811 0 0.983118423 0.562635 0.58018018 -1
biological_process positive regulation of axonogenesis GO:0050772 16494 43 1.294668867 0.000402324 0.03963964 0 1.162682053 0.0321484 0.205405405 0.149695
biological_process regulation of dephosphorylation GO:0035303 16429 108 1.185444417 0.000405499 0.16036036 0 1.226517189 2.15E-05 0.064864865 0
cellular_component ruffle GO:0001726 16711 112 1.182070467 0.000406003 0.005405405 0 1.207480609 6.78E-05 0.014414414 0
molecular_function DNA binding GO:0003677 15171 1690 1.044602901 0.00040654 0.142342342 0 1.069742599 8.23E-08 0.068468468 0
biological_process mesenchymal cell development GO:0014031 16429 108 1.185377231 0.000407308 0.003603604 0 1.101300101 0.0336725 0.162162162 0.153231
biological_process regulation of striated muscle tissue development GO:0016202 16431 106 1.186841792 0.00041484 0.018018018 0 1.150013964 0.00363941 0.05045045 0.058721
biological_process regulation of muscle tissue development GO:1901861 16431 106 1.186841792 0.00041484 0.018018018 0 1.150013964 0.00363941 0.05045045 0.058721
biological_process negative regulation of myeloid cell differentiation GO:0045638 16474 63 1.242623807 0.000415992 0.037837838 0 0.926813283 0.843311 0.735135135 -1
biological_process regulation of myeloid cell differentiation GO:0045637 16410 127 1.17052693 0.000416637 0.012612613 0 1.077169685 0.0652501 0.135135135 0.217429
biological_process mammary gland duct morphogenesis GO:0060603 16502 35 1.325702783 0.000417332 0.003603604 0 1.294387786 0.00126469 0.063063063 0.0443424
biological_process negative regulation of programmed cell death GO:0043069 16021 516 1.083582774 0.00041737 0.010810811 0 1.066534829 0.00391198 0.084684685 0.0593019
biological_process regulation of muscle organ development GO:0048634 16430 107 1.18586532 0.00041751 0.018018018 0 1.150749249 0.00336825 0.052252252 0.0576637
biological_process regulation of excitatory postsynaptic membrane potential GO:0060079 16499 38 1.311958952 0.000426987 0.091891892 0 1.279157193 0.00142234 0.111711712 0.0434961
biological_process neural crest cell development GO:0014032 16491 46 1.283015182 0.000435253 0.014414414 0 1.174534747 0.0200277 0.052252252 0.124942
biological_process memory GO:0007613 16465 72 1.225797184 0.00044082 0.14954955 0 1.157580325 0.0101432 0.205405405 0.0803291
biological_process lung development GO:0030324 16380 157 1.1525088 0.000441073 0.016216216 0 1.096609558 0.0175708 0.190990991 0.114666
biological_process positive regulation of amine transport GO:0051954 16516 21 1.41867109 0.000441695 0.025225225 0 1.133053757 0.145317 0.221621622 0.336274
biological_process protein complex subunit organization GO:0071822 15653 884 1.062778734 0.000445401 0.009009009 0 1.024186557 0.100256 0.257657658 0.262235
biological_process negative regulation of fat cell differentiation GO:0045599 16509 28 1.362109966 0.000447442 0.016216216 0 1.324555638 0.00145469 0.045045045 0.0431905
biological_process axon extension GO:0048675 16485 52 1.265353457 0.000450862 0.034234234 0 1.133409803 0.0475683 0.254054054 0.180801
cellular_component cell cortex part GO:0044448 16734 89 1.202306608 0.000458916 0.059459459 0 1.14037258 0.0107285 0.178378378 0

biological_process positive regulation of stem cell proliferation GO:2000648 16484 53 1.262384475 0.000460039 0.003603604 0 1.223995913 0.00233441 0.048648649 0.0506483
biological_process vasculogenesis GO:0001570 16464 73 1.223394932 0.000461023 0.016216216 0 1.11613475 0.042496 0.181981982 0.172603
biological_process respiratory tube development GO:0030323 16378 159 1.150926673 0.000462648 0.014414414 0 1.088740733 0.0257364 0.198198198 0.136934
biological_process response to transforming growth factor beta stimulus GO:0071559 16395 142 1.159782687 0.000462984 0.084684685 0 1.214628814 4.31E-06 0.077477477 0
biological_process positive regulation of epithelial cell migration GO:0010634 16481 56 1.255003466 0.00046504 0.012612613 0 1.190007916 0.00681301 0.151351351 0.0705504
cellular_component apical plasma membrane GO:0016324 16624 199 1.134656294 0.000466615 0.032432432 0 1.01848455 0.324774 0.414414414 -1
biological_process anatomical structure maturation GO:0071695 16496 41 1.297683848 0.00047385 0.009009009 0 1.21010108 0.00982309 0.077477477 0.0808826
molecular_function small GTPase binding GO:0031267 16738 123 1.171442188 0.000474247 0.154954955 0 1.223659503 8.08E-06 0.052252252 0
biological_process death GO:0016265 15206 1331 1.050154219 0.000474692 0.018018018 0 1.04586565 0.00125484 0.095495495 0.0428089
biological_process negative regulation of locomotion GO:0040013 16402 135 1.163555361 0.000474972 0.043243243 0 1.116803169 0.00913263 0.171171171 0.0777382
biological_process embryonic heart tube development GO:0035050 16483 54 1.258961096 0.000480909 0.014414414 0 1.291131782 0.000102972 0.016216216 0.00853014
biological_process regulation of tube size GO:0035150 16432 105 1.185406665 0.000481538 0.046846847 0 1.08273254 0.070374 0.214414414 0.220552
biological_process regulation of blood vessel size GO:0050880 16432 105 1.185406665 0.000481538 0.046846847 0 1.08273254 0.070374 0.214414414 0.220552
biological_process cation transport GO:0006812 15874 663 1.072515016 0.000482028 0.190990991 0 1.051077046 0.0100381 0.25045045 0.0806656
biological_process mesoderm morphogenesis GO:0048332 16482 55 1.256532928 0.000482133 0.003603604 0 1.110358893 0.077814 0.232432432 0.233894
cellular_component cortical cytoskeleton GO:0030863 16766 57 1.250970464 0.000505381 0.027027027 0 1.232064714 0.00118343 0.052252252 0
biological_process sprouting angiogenesis GO:0002040 16492 45 1.281986483 0.000517404 0.030630631 0 1.143369236 0.0476517 0.192792793 0.180702
molecular_function RNA polymerase II regulatory region sequence-specific DNA binding GO:0000977 16781 80 1.211255372 0.000517897 0.007207207 0 1.317430567 4.12E-07 0.001801802 0
biological_process negative regulation of protein serine/threonine kinase activity GO:0071901 16460 77 1.215063243 0.000525808 0.014414414 0 1.038675496 0.277883 0.362162162 0.496237
biological_process dicarboxylic acid transport GO:0006835 16484 53 1.259183146 0.000531203 0.037837838 0 0.883073818 0.930142 0.792792793 -1
biological_process skeletal system morphogenesis GO:0048705 16375 162 1.147604016 0.000537588 0.025225225 0 1.06050167 0.0900814 0.279279279 0.251015
biological_process positive regulation of hydrolase activity GO:0051345 16224 313 1.105557065 0.0005462 0.037837838 0 1.090009511 0.00267931 0.086486486 0.0523776
biological_process inner ear development GO:0048839 16381 156 1.150229708 0.000546396 0.003603604 0 1.153121271 0.000436945 0.066666667 0.0201929
biological_process integrin-mediated signaling pathway GO:0007229 16472 65 1.232693368 0.000565329 0.014414414 0 1.150873139 0.0173871 0.007207207 0.114827
biological_process positive regulation of stress-activated protein kinase signaling cascade GO:0070304 16483 54 1.255348752 0.000566145 0.021621622 0 1.035141361 0.32709 0.409009009 -1
biological_process regulation of transmembrane receptor protein serine/threonine kinase signaling pathway GO:0090092 16404 133 1.162166725 0.000572184 0.045045045 0 1.182270867 0.000128267 0.052252252 0.00813849
biological_process smooth muscle contraction GO:0006939 16471 66 1.230673939 0.000572185 0.072072072 0 1.034572116 0.312987 0.387387387 -1
biological_process negative regulation of cellular component movement GO:0051271 16415 122 1.169352557 0.000573068 0.032432432 0 1.118064643 0.0116948 0.153153153 0.0901924
biological_process hormone biosynthetic process GO:0042446 16497 40 1.296270469 0.000578148 0.010810811 0 0.986050552 0.560821 0.547747748 -1
biological_process social behavior GO:0035176 16505 32 1.331279353 0.00057897 0.05045045 0 1.20873919 0.020319 0.174774775 0.126437
biological_process intraspecies interaction between organisms GO:0051703 16505 32 1.331279353 0.00057897 0.05045045 0 1.20873919 0.020319 0.174774775 0.126437
biological_process negative regulation of protein metabolic process GO:0051248 16159 378 1.095313388 0.000583261 0.046846847 0 1.074591442 0.00552613 0.095495495 0.0636958
biological_process embryonic skeletal system morphogenesis GO:0048704 16473 64 1.233740406 0.000587014 0.005405405 0 1.031536855 0.33077 0.376576577 -1
molecular_function hormone receptor binding GO:0051427 16756 105 1.182123422 0.000592149 0.05045045 0 1.252306634 3.53E-06 0.012612613 0
biological_process digestive tract morphogenesis GO:0048546 16489 48 1.269822202 0.000592205 0.016216216 0 1.214754397 0.00492836 0.05045045 0.0611116
biological_process regulation of polysaccharide metabolic process GO:0032881 16507 30 1.341424204 0.000593443 0.003603604 0 1.172979256 0.0502422 0.151351351 0.18368
biological_process regulation of extent of cell growth GO:0061387 16489 48 1.269756696 0.000593843 0.048648649 0 1.141402882 0.044632 0.237837838 0.177116
biological_process nitrogen compound transport GO:0071705 16095 442 1.087787722 0.000597033 0.131531532 0 1.046618174 0.0426574 0.291891892 0.172898
biological_process dendritic spine development GO:0060996 16507 30 1.340984811 0.00060219 0.046846847 0 1.331850262 0.000813279 0.09009009 0.0345821
biological_process divalent inorganic cation homeostasis GO:0072507 16302 235 1.120883286 0.000613067 0.066666667 0 1.077455112 0.0191654 0.196396396 0.119918
biological_process regulation of postsynaptic membrane potential GO:0060078 16493 44 1.280410798 0.000627662 0.095495495 0 1.276219336 0.000742035 0.104504505 0.0330036
biological_process negative regulation of gliogenesis GO:0014014 16507 30 1.339727097 0.000627891 0.014414414 0 1.024327173 0.408676 0.418018018 -1
biological_process regionalization GO:0003002 16275 262 1.114139168 0.000628519 0.034234234 0 1.102871996 0.00182385 0.126126126 0.0481446
biological_process cartilage development GO:0051216 16398 139 1.157286256 0.00062881 0.030630631 0 1.178375754 0.000127114 0.084684685 0.00818281
biological_process protein import into nucleus GO:0006606 16346 191 1.133886124 0.000632943 0.023423423 0 1.100391836 0.00782109 0.140540541 0.0766644
biological_process protein targeting to nucleus GO:0044744 16346 191 1.133886124 0.000632943 0.023423423 0 1.100391836 0.00782109 0.140540541 0.0766644
biological_process cellular macromolecule localization GO:0070727 15664 873 1.061275574 0.000636573 0.133333333 0 1.052364137 0.00294945 0.120720721 0.0576111
biological_process collagen metabolic process GO:0032963 16491 46 1.273774246 0.000639537 0.016216216 0 1.022026447 0.397792 0.4 -1
molecular_function PDZ domain binding GO:0030165 16775 86 1.199694313 0.000650296 0.099099099 0 1.154497019 0.00642331 0.156756757 0
cellular_component neuromuscular junction GO:0031594 16778 45 1.276299095 0.00065295 0.046846847 0 1.34748844 2.64E-05 0.007207207 0
biological_process mesenchymal cell differentiation GO:0048762 16417 120 1.168796955 0.000653556 0.007207207 0 1.087529301 0.0477865 0.214414414 0.181219
biological_process endothelium development GO:0003158 16490 47 1.270043807 0.000660931 0.046846847 0 1.151796077 0.0355343 0.192792793 0.157383
biological_process collagen fibril organization GO:0030199 16503 34 1.31760803 0.00066132 0.021621622 0 1.089597628 0.182522 0.275675676 0.3771
biological_process regulation of immune effector process GO:0002697 16369 168 1.142272095 0.000662711 0.046846847 0 0.975203203 0.712113 0.740540541 -1
biological_process salivary gland development GO:0007431 16500 37 1.304315767 0.000664154 0.003603604 0 1.16031278 0.0454293 0.097297297 0.178068
biological_process positive regulation of protein transport GO:0051222 16381 156 1.147617224 0.000666662 0.028828829 0 1.018613196 0.342926 0.405405405 -1
cellular_component voltage-gated potassium channel complex GO:0008076 16773 50 1.261251272 0.000676488 0.106306306 0 1.288020188 0.000205554 0.09009009 0
cellular_component potassium channel complex GO:0034705 16773 50 1.261251272 0.000676488 0.106306306 0 1.288020188 0.000205554 0.09009009 0
biological_process regulation of chemotaxis GO:0050920 16450 87 1.197213319 0.000700306 0.009009009 0 1.224199673 0.000140799 0.03963964 0.0107359
biological_process cellular response to transforming growth factor beta stimulus GO:0071560 16397 140 1.154764291 0.000722937 0.084684685 0 1.215058532 4.79E-06 0.075675676 0
cellular_component ion channel complex GO:0034702 16661 162 1.143773766 0.000723942 0.171171171 0 1.156153207 0.000270853 0.154954955 0
biological_process cellular protein localization GO:0034613 15667 870 1.06057457 0.000738212 0.133333333 0 1.051553171 0.00340732 0.126126126 0.0573259
biological_process regulation of epithelial cell proliferation GO:0050678 16343 194 1.130988558 0.000739469 0.036036036 0 1.13789551 0.000409448 0.081081081 0.0182322
biological_process negative regulation of kinase activity GO:0033673 16395 142 1.153318679 0.000741059 0.036036036 0 1.02849264 0.277395 0.354954955 0.495705
biological_process negative regulation of neuron differentiation GO:0045665 16481 56 1.244488686 0.00075088 0.032432432 0 1.128845541 0.0471782 0.127927928 0.180912
biological_process G-protein coupled receptor signaling pathway GO:0007186 15891 646 1.070666589 0.000753075 0.162162162 0 1.041857712 0.0300757 0.245045045 0.144217
biological_process epithelial cell differentiation GO:0030855 16115 422 1.08804499 0.000753104 0.016216216 0 1.090042407 0.000586283 0.059459459 0.029898
biological_process positive regulation of stress-activated MAPK cascade GO:0032874 16484 53 1.251267673 0.000753108 0.018018018 0 1.032518589 0.340662 0.423423423 -1
biological_process cellular process GO:0009987 4973 11564 1.009338824 0.000759464 0.181981982 0 1.010014398 0.000336543 0.14954955 0.0141176
biological_process negative regulation of protein phosphorylation GO:0001933 16352 185 1.133818427 0.000761194 0.05045045 0 1.048040262 0.127543 0.252252252 0.305574
biological_process regulation of immune response GO:0050776 16216 321 1.101143701 0.000763294 0.032432432 0 0.971574779 0.813504 0.765765766 -1
biological_process negative regulation of cell migration GO:0030336 16421 116 1.169139948 0.000771424 0.034234234 0 1.115167935 0.0155426 0.174774775 0.105807
molecular_function small molecule binding GO:0036094 14361 2500 1.033728571 0.000775018 0.216216216 0 1.043900561 1.90E-05 0.145945946 0
molecular_function calcium ion transmembrane transporter activity GO:0015085 16762 99 1.183007434 0.000780055 0.178378378 0 1.296910144 1.43E-07 0.036036036 0
molecular_function nucleotide binding GO:0000166 14488 2373 1.034735767 0.000783901 0.214414414 0 1.043927664 3.19E-05 0.151351351 0
molecular_function nucleoside phosphate binding GO:1901265 14488 2373 1.034735767 0.000783901 0.214414414 0 1.043927664 3.19E-05 0.151351351 0
biological_process response to nicotine GO:0035094 16502 35 1.307949671 0.000791766 0.043243243 0 1.184420765 0.029262 0.088288288 0.143213
biological_process negative regulation of apoptotic process GO:0043066 16029 508 1.079638357 0.000794793 0.012612613 0 1.062645701 0.00649595 0.100900901 0.0689039
biological_process insulin-like growth factor receptor signaling pathway GO:0048009 16510 27 1.35055517 0.00079534 0.03963964 0 1.250851799 0.0119255 0.154954955 0.0907549
biological_process regulation of glycogen biosynthetic process GO:0005979 16513 24 1.371734298 0.000798109 0.001801802 0 1.189184413 0.0540883 0.126126126 0.192077
biological_process regulation of glucan biosynthetic process GO:0010962 16513 24 1.371734298 0.000798109 0.001801802 0 1.189184413 0.0540883 0.126126126 0.192077

biological_process cellular carbohydrate metabolic process GO:0044262 16297 240 1.116669358 0.0008066 0.036036036 0 1.105004265 0.00226884 0.05045045 0.0495655
biological_process cardiac septum morphogenesis GO:0060411 16498 39 1.291175194 0.000807196 0.028828829 0 1.27110635 0.00166262 0.048648649 0.043855
biological_process muscle tissue morphogenesis GO:0060415 16481 56 1.242722186 0.000812429 0.016216216 0 1.186001977 0.00786844 0.009009009 0.0763986
biological_process peptidyl-serine modification GO:0018209 16403 134 1.156490114 0.000814988 0.077477477 0 1.157058685 0.000783916 0.052252252 0.0328764
biological_process regulation of ossification GO:0030278 16387 150 1.147397682 0.000841538 0.077477477 0 1.100870338 0.0157971 0.232432432 0.108796
biological_process nuclear import GO:0051170 16344 193 1.129749212 0.000843468 0.023423423 0 1.089847255 0.0148291 0.171171171 0.105163
biological_process cardiac septum development GO:0003279 16486 51 1.253265209 0.00085172 0.036036036 0.00143995 1.246976641 0.00110787 0.084684685 0.0423314
biological_process positive regulation of intracellular protein transport GO:0090316 16449 88 1.192489026 0.00085649 0.010810811 0.00143791 1.056627914 0.178131 0.313513514 0.372983
biological_process cellular lipid metabolic process GO:0044255 15851 686 1.067625168 0.000863825 0.099099099 0.00143589 1.016764132 0.218678 0.315315315 0.417906
biological_process ventricular cardiac muscle tissue development GO:0003229 16495 42 1.278730287 0.00086588 0.014414414 0.00143384 1.077835864 0.190845 0.214414414 0.386275
molecular_function RNA polymerase II core promoter proximal region sequence-specific DNA binding transcription factor activityGO:0000982 16773 88 1.192286268 0.000866514 0.009009009 0 1.183490261 0.00139836 0.041441441 0
biological_process ARF protein signal transduction GO:0032011 16498 39 1.289119316 0.000870974 0.072072072 0.00142977 1.375577829 2.38E-05 0.023423423 0.00334527
biological_process regulation of ARF protein signal transduction GO:0032012 16498 39 1.289119316 0.000870974 0.072072072 0.00142977 1.375577829 2.38E-05 0.023423423 0.00334527
biological_process glycoprotein biosynthetic process GO:0009101 16313 224 1.119865111 0.000878474 0.072072072 0.00142778 1.138539698 0.000149591 0.034234234 0.0106793
biological_process regulation of organelle organization GO:0033043 16074 463 1.082704152 0.000884817 0.043243243 0.00142578 1.094815836 0.000169077 0.016216216 0.0105681
molecular_function L-amino acid transmembrane transporter activity GO:0015179 16833 28 1.340822147 0.000884957 0.041441441 0 1.116530698 0.142554 0.30990991 0.288111
biological_process appendage development GO:0048736 16409 128 1.158869028 0.00088822 0.023423423 0.00142174 1.123401351 0.00760102 0.151351351 0.0763155
biological_process limb development GO:0060173 16409 128 1.158869028 0.00088822 0.023423423 0.00142174 1.123401351 0.00760102 0.151351351 0.0763155
biological_process neuromuscular junction development GO:0007528 16504 33 1.313574202 0.000894558 0.036036036 0.00141976 1.334067019 0.000438484 0.041441441 0.0201029
biological_process lipid biosynthetic process GO:0008610 16073 464 1.082489689 0.000898895 0.088288288 0.00141778 1.015009034 0.285058 0.326126126 -1
cellular_component extracellular vesicular exosome GO:0070062 16769 54 1.244481657 0.000914066 0.068468468 0 1.072758189 0.176819 0.353153153 0.294197
biological_process reproduction GO:0000003 15512 1025 1.054345157 0.000930945 0.082882883 0.00141596 1.048031812 0.00298039 0.198198198 0.0572627
biological_process regulation of actin filament-based process GO:0032970 16348 189 1.129901154 0.000932175 0.052252252 0.00141397 1.09437599 0.0119063 0.061261261 0.0908475
biological_process negative regulation of insulin receptor signaling pathway GO:0046627 16515 22 1.382539568 0.000935849 0.01981982 0.00141199 1.224847119 0.0337836 0.095495495 0.153706
biological_process positive regulation of cellular component biogenesis GO:0044089 16517 20 1.400887456 0.000944423 0.05045045 0.00141005 1.218561299 0.0451336 0.230630631 0.177479
molecular_function transcription corepressor activity GO:0003714 16746 115 1.166627017 0.00094941 0.021621622 0 1.205211356 6.54E-05 0.025225225 0
biological_process regulation of skeletal muscle tissue development GO:0048641 16472 65 1.221703257 0.000960947 0.01981982 0.00140816 1.177242334 0.00657022 0.054054054 0.0688354
biological_process organic anion transport GO:0015711 16302 235 1.11597388 0.000963144 0.10990991 0.0014062 0.998544385 0.515548 0.49009009 -1
biological_process heart valve morphogenesis GO:0003179 16512 25 1.35757615 0.000970621 0.01981982 0.00140427 1.091888972 0.212913 0.291891892 0.411819
cellular_component apical junction complex GO:0043296 16720 103 1.175678927 0.000975139 0.068468468 0 1.161517458 0.0021998 0.144144144 0
biological_process negative regulation of multicellular organismal process GO:0051241 16243 294 1.103337721 0.000978764 0.063063063 0.00140234 1.064844508 0.0260043 0.147747748 0.136671
biological_process negative regulation of cellular response to insulin stimulus GO:1900077 16514 23 1.372259222 0.000986044 0.018018018 0.00140042 1.189596289 0.0575135 0.153153153 0.198461
biological_process appendage morphogenesis GO:0035107 16417 120 1.162417686 0.000990951 0.018018018 0.00139654 1.142927155 0.00324653 0.093693694 0.056372
biological_process limb morphogenesis GO:0035108 16417 120 1.162417686 0.000990951 0.018018018 0.00139654 1.142927155 0.00324653 0.093693694 0.056372
molecular_function RNA polymerase II regulatory region DNA binding GO:0001012 16777 84 1.194303536 0.000993216 0.012612613 0 1.321453422 1.56E-07 0.001801802 0
biological_process regulation of blood vessel endothelial cell migration GO:0043535 16501 36 1.297158326 0.000995545 0.007207207 0.00278535 1.07832152 0.207594 0.241441441 0.404738
cellular_component actin filament GO:0005884 16769 54 1.242414503 0.000999213 0.007207207 0 1.237593345 0.00122681 0.07027027 0
biological_process negative regulation of organelle organization GO:0010639 16393 144 1.147982868 0.00100319 0.009009009 0.00278157 1.113373906 0.00897221 0.032432432 0.076982
cellular_component histone deacetylase complex GO:0000118 16774 49 1.254105597 0.00101628 0.01981982 0 1.112915093 0.0851813 0.257657658 0.132434
cellular_component cell-cell contact zone GO:0044291 16782 41 1.277522345 0.00102912 0.064864865 0 1.163831621 0.0344382 0.228828829 0.0347931
biological_process regulation of glutamate receptor signaling pathway GO:1900449 16514 23 1.370645016 0.00103158 0.117117117 0.00277803 1.280948788 0.00976195 0.12972973 0.0809581
biological_process G-protein coupled receptor signaling pathway, coupled to cyclic nucleotide second messenger GO:0007187 16443 94 1.182715301 0.00104518 0.075675676 0.00277433 1.091820529 0.0610155 0.264864865 0.206182
biological_process negative regulation of phosphorylation GO:0042326 16342 195 1.126435167 0.00104802 0.052252252 0.00277052 1.062073468 0.0654968 0.190990991 0.218439
biological_process anion transport GO:0006820 16221 316 1.098915085 0.00105216 0.099099099 0.00276673 0.96827574 0.838031 0.655855856 -1
cellular_component intercalated disc GO:0014704 16785 38 1.287290778 0.00106685 0.068468468 0 1.146361078 0.0588501 0.257657658 0.0587146
biological_process negative regulation of protein modification process GO:0031400 16297 240 1.113615774 0.00106697 0.052252252 0.00276308 1.068588012 0.0318792 0.118918919 0.150211
biological_process collagen biosynthetic process GO:0032964 16511 26 1.347362994 0.00106931 0.012612613 0.00275929 1.059874949 0.29834 0.308108108 -1
biological_process positive regulation of cellular catabolic process GO:0031331 16450 87 1.18880215 0.00111311 0.014414414 0.00275599 1.134530581 0.0146606 0.032432432 0.104416
biological_process regulation of ion homeostasis GO:2000021 16416 121 1.159817105 0.00112112 0.084684685 0.00275228 1.131012823 0.00611859 0.10990991 0.0647818
molecular_function DNA binding, bending GO:0008301 16822 39 1.282198084 0.0011214 0.005405405 0 1.14876187 0.0535906 0.228828829 0.0966439
molecular_function core promoter sequence-specific DNA binding GO:0001046 16826 35 1.297776048 0.00112706 0.001801802 0 1.329716018 0.000359578 0.005405405 0
biological_process adult locomotory behavior GO:0008344 16463 74 1.204440619 0.001133 0.117117117 0.00411729 1.203607155 0.00118089 0.100900901 0.0413152
biological_process regulation of carbohydrate biosynthetic process GO:0043255 16484 53 1.241225587 0.00115703 0.012612613 0.00411205 1.164797576 0.0187007 0.104504505 0.115811
biological_process regulation of muscle contraction GO:0006937 16447 90 1.184445143 0.00118667 0.054054054 0.00546841 1.137736398 0.0116214 0.117117117 0.0902691
biological_process response to steroid hormone stimulus GO:0048545 16176 361 1.091327249 0.00118758 0.088288288 0.00546096 1.013272889 0.329419 0.414414414 -1
biological_process ceramide biosynthetic process GO:0046513 16509 28 1.331111989 0.00119356 0.009009009 0.00545365 0.952458971 0.668637 0.727927928 -1
biological_process positive regulation of Rho GTPase activity GO:0032321 16477 60 1.225861682 0.00119954 0.027027027 0.00544635 1.232970586 0.000870052 0.009009009 0.0343147
biological_process neuron-neuron synaptic transmission GO:0007270 16435 102 1.172975699 0.00120177 0.2 0.005439 1.069240404 0.112197 0.347747748 0.277768
biological_process negative regulation of protein kinase activity GO:0006469 16405 132 1.15191475 0.00120199 0.05045045 0.00543162 1.043733783 0.191147 0.313513514 0.386556
molecular_function transcription regulatory region sequence-specific DNA binding GO:0000976 16731 130 1.153025747 0.00120762 0.009009009 0 1.245377292 5.73E-07 0.005405405 0
biological_process negative regulation of cell death GO:0060548 15994 543 1.073922945 0.00120776 0.01981982 0.00542438 1.063029975 0.00484439 0.077477477 0.0612572
biological_process segmentation GO:0035282 16462 75 1.201751875 0.00120994 0.009009009 0.00541708 1.095296086 0.075976 0.194594595 0.229985
biological_process cardiac muscle cell differentiation GO:0055007 16472 65 1.216337508 0.00123511 0.028828829 0.0054103 1.203369662 0.00221696 0.032432432 0.0498825
molecular_functionRNA polymerase II core promoter proximal region sequence-specific DNA binding transcription factor activity involved in positive regulation of transcriptionGO:0001077 16804 57 1.231015402 0.00123864 0.007207207 0 1.140653334 0.0327062 0.041441441 0.0520131
biological_process sodium ion transport GO:0006814 16408 129 1.153185452 0.00124191 0.086486486 0.00540314 1.111458532 0.013861 0.216216216 0.0999156
biological_process anterior/posterior pattern specification GO:0009952 16368 169 1.13355954 0.00125238 0.055855856 0.00539608 1.133466513 0.00126125 0.118918919 0.0444236
biological_process glycogen metabolic process GO:0005977 16479 58 1.228414293 0.00127093 0.005405405 0.00538921 1.119513219 0.05714 0.055855856 0.198166
biological_process amine transport GO:0015837 16465 72 1.204865522 0.00127438 0.111711712 0.00538203 1.037775035 0.288988 0.362162162 -1
biological_process GTP catabolic process GO:0006184 16106 431 1.082710109 0.00129096 0.113513514 0.00537516 1.07958715 0.00186722 0.077477477 0.0478263
biological_process negative regulation of cell motility GO:2000146 16418 119 1.15876121 0.00130398 0.036036036 0.00536822 1.10225759 0.026247 0.194594595 0.137031
molecular_function glutamate receptor binding GO:0035254 16829 32 1.306926172 0.0013055 0.106306306 0 1.150757616 0.0696318 0.25045045 0.112561
biological_process negative regulation of axonogenesis GO:0050771 16503 34 1.297646805 0.00130964 0.061261261 0.00536115 1.27263125 0.00292298 0.088288288 0.0563984
biological_process lipopolysaccharide biosynthetic process GO:0009103 16492 45 1.258221607 0.00133061 0.021621622 0.00535442 1.226313841 0.00423009 0.041441441 0.0579561
molecular_function RNA polymerase II core promoter sequence-specific DNA binding GO:0000979 16835 26 1.339375692 0.00135141 0.003603604 0 1.367030062 0.000589128 0.003603604 0
cellular_component sarcolemma GO:0042383 16727 96 1.176140372 0.00135953 0.055855856 0 1.17056302 0.0018485 0.115315315 0
biological_process metal ion transport GO:0030001 16045 492 1.076838686 0.00136365 0.221621622 0.00534796 1.085633439 0.000419004 0.207207207 0.0181507
biological_process development of primary male sexual characteristics GO:0046546 16437 100 1.172481814 0.00136523 0.007207207 0.00534085 1.050845179 0.188538 0.18018018 0.383017
cellular_component receptor complex GO:0043235 16675 148 1.141203335 0.00140123 0.144144144 0 1.125717084 0.00389783 0.171171171 0
biological_process regulation of hormone metabolic process GO:0032350 16514 23 1.359529603 0.00140135 0.009009009 0.0053345 1.170551812 0.0781414 0.205405405 0.234379
biological_process negative regulation of cellular protein metabolic process GO:0032269 16213 324 1.094900677 0.00140355 0.093693694 0.00532744 1.084341346 0.00395828 0.077477477 0.0588877
cellular_component brush border membrane GO:0031526 16783 40 1.27215356 0.00141832 0.016216216 0 0.953424192 0.695274 0.666666667 -1

biological_process negative regulation of MAP kinase activity GO:0043407 16484 53 1.236326619 0.00141893 0.034234234 0.00532067 1.008571373 0.456918 0.461261261 -1
biological_process glutamate secretion GO:0014047 16516 21 1.375687688 0.00142321 0.073873874 0.0053137 0.985145706 0.546978 0.515315315 -1
biological_process cardiac muscle tissue morphogenesis GO:0055008 16485 52 1.238340986 0.00143376 0.014414414 0.00530687 1.137989016 0.0421567 0.048648649 0.171353
biological_process vesicle localization GO:0051648 16436 101 1.170489133 0.00145636 0.091891892 0.00530031 1.109902392 0.0274978 0.192792793 0.140978
biological_process artery development GO:0060840 16490 47 1.250226068 0.00146243 0.036036036 0.00529342 1.227351529 0.00343054 0.106306306 0.0572455
biological_process regulation of extrinsic apoptotic signaling pathway GO:2001236 16512 25 1.343189841 0.00146786 0.012612613 0.00528654 1.147813695 0.100087 0.135135135 0.262622
biological_process positive regulation of heart contraction GO:0045823 16516 21 1.374115546 0.00148238 0.075675676 0.00527986 1.018126138 0.442783 0.427027027 -1
biological_process regulation of BMP signaling pathway GO:0030510 16479 58 1.224682019 0.00149389 0.043243243 0.00527314 1.227036062 0.00134945 0.028828829 0.0438764
biological_process neural crest cell migration GO:0001755 16507 30 1.312670128 0.00149399 0.043243243 0.0052662 1.20275724 0.0270976 0.030630631 0.139476
biological_process protein localization to plasma membrane GO:0072659 16473 64 1.213589777 0.00151169 0.023423423 0.00525964 1.155736082 0.0153041 0.05045045 0.106262
biological_process cellular response to hormone stimulus GO:0032870 16228 309 1.096433116 0.00151915 0.09009009 0.00525288 1.093192555 0.00208969 0.117117117 0.0504378
molecular_function SMAD binding GO:0046332 16803 58 1.22421438 0.0015245 0.118918919 0.0086113 1.306063438 2.62E-05 0.055855856 0
biological_process regulation of phosphatidylinositol 3-kinase cascade GO:0014066 16490 47 1.248967839 0.00153538 0.032432432 0.00524633 1.088321162 0.146808 0.315315315 0.337043
molecular_function G-protein coupled receptor activity GO:0004930 16468 393 1.085172557 0.00154173 0.113513514 0.0085385 1.060213156 0.018214 0.216216216 0.0289749
biological_process epithelial cell proliferation GO:0050673 16305 232 1.111341833 0.00154682 0.01981982 0.00523969 1.127970259 0.000336976 0.072072072 0.0140845
molecular_function anion transmembrane transporter activity GO:0008509 16655 206 1.118140774 0.00156275 0.037837838 0.00846707 0.949777955 0.895483 0.708108108 -1
biological_process cranial nerve development GO:0021545 16507 30 1.311194733 0.00156353 0.003603604 0.00523317 1.392663944 9.63E-05 0.009009009 0.00872819
molecular_function histone deacetylase binding GO:0042826 16802 59 1.221475605 0.00157977 0.009009009 0.00839667 1.134584757 0.0364301 0.145945946 0.0549655
molecular_function protein homodimerization activity GO:0042803 16349 512 1.074103608 0.00159191 0.005405405 0.00832724 1.032421007 0.0984546 0.154954955 0.178279
biological_process regulation of hormone levels GO:0010817 16255 282 1.100533781 0.00159224 0.043243243 0.00522692 1.068327597 0.0225098 0.118918919 0.128725
biological_process male sex differentiation GO:0046661 16430 107 1.164006781 0.00159926 0.003603604 0.00522024 1.075253652 0.0880869 0.099099099 0.247645
biological_process negative regulation of intracellular protein kinase cascade GO:0010741 16404 133 1.146981778 0.00160001 0.014414414 0.00521345 1.049925417 0.158354 0.223423423 0.348538
biological_process establishment of protein localization to plasma membrane GO:0090002 16495 42 1.262234312 0.00160258 0.023423423 0.00520671 1.18324137 0.0197233 0.117117117 0.122843
biological_process negative regulation of cytoskeleton organization GO:0051494 16466 71 1.201137008 0.00163135 0.010810811 0.00520052 1.164643893 0.00801839 0.043243243 0.0771849
biological_process positive regulation of immune response GO:0050778 16306 231 1.110964715 0.0016321 0.005405405 0.00519379 0.952431225 0.896378 0.888288288 -1
cellular_component axon terminus GO:0043679 16745 78 1.191848062 0.00163259 0.100900901 0 1.241900212 0.000104016 0.01981982 0
biological_process regulation of adaptive immune response GO:0002819 16449 88 1.180454718 0.00164165 0.016216216 0.00518724 0.954930658 0.768627 0.769369369 -1
biological_process negative regulation of transferase activity GO:0051348 16386 151 1.137452421 0.00164677 0.046846847 0.00518063 1.023494143 0.307718 0.36036036 -1
biological_process dendritic spine organization GO:0097061 16513 24 1.346055977 0.00164878 0.10990991 0.00517397 1.438368936 9.87E-05 0.063063063 0.00865284
biological_process regulation of intracellular transport GO:0032386 16300 237 1.109347557 0.00165796 0.028828829 0.00516746 1.068969885 0.0319893 0.187387387 0.150005
biological_process cellular glucan metabolic process GO:0006073 16478 59 1.220328678 0.00165944 0.003603604 0.00515418 1.102938651 0.0850413 0.079279279 0.243745
biological_process glucan metabolic process GO:0044042 16478 59 1.220328678 0.00165944 0.003603604 0.00515418 1.102938651 0.0850413 0.079279279 0.243745
molecular_function nuclear hormone receptor binding GO:0035257 16770 91 1.177031883 0.00167833 0.095495495 0.00826185 1.282579113 1.42E-06 0.009009009 0
biological_process regulation of protein localization GO:0032880 16192 345 1.090144718 0.00169024 0.041441441 0.00514815 1.046433209 0.0655754 0.246846847 0.218181
biological_process myoblast differentiation GO:0045445 16487 50 1.238787512 0.00170031 0.027027027 0.00514173 1.201631747 0.00669495 0.028828829 0.0697873
cellular_component vacuole GO:0005773 16508 315 1.094336721 0.00170786 0.095495495 0 1.050291532 0.0593032 0.198198198 0.0584002
molecular_function phosphatase binding GO:0019902 16750 111 1.159749033 0.00172353 0.133333333 0.00819589 1.097430715 0.0372172 0.21981982 0.0586297
biological_process forebrain cell migration GO:0021885 16495 42 1.259930807 0.00174201 0.093693694 0.00513595 1.197635396 0.013166 0.18018018 0.0985445
biological_process regulation of neurotransmitter secretion GO:0046928 16504 33 1.293275612 0.00174456 0.032432432 0.00512941 1.238320267 0.00880688 0.088288288 0.0774798
biological_process positive regulation of epithelial to mesenchymal transition GO:0010718 16514 23 1.351264026 0.00175084 0.010810811 0.00512296 1.169232054 0.0797561 0.252252252 0.236785
molecular_function calmodulin binding GO:0005516 16730 131 1.146505681 0.00177383 0.124324324 0.0240032 1.197734322 4.15E-05 0.041441441 0
biological_process regulation of heart rate GO:0002027 16484 53 1.230850362 0.00177497 0.010810811 0.00511688 1.18012425 0.011455 0.028828829 0.088819
biological_process regulation of long-term neuronal synaptic plasticity GO:0048169 16507 30 1.306841109 0.00178631 0.135135135 0.00511056 1.074534942 0.239562 0.390990991 0.442352
biological_process positive regulation of blood vessel endothelial cell migration GO:0043536 16516 21 1.366778883 0.00178932 0.005405405 0.0051041 1.173071396 0.084632 0.079279279 0.243863
molecular_function cell adhesion molecule binding GO:0050839 16813 48 1.242345515 0.00179357 0.115315315 0.0238148 1.309357676 0.000100533 0.077477477 0
biological_process regulation of muscle cell differentiation GO:0051147 16452 85 1.18185676 0.00179834 0.009009009 0.00509777 1.133131737 0.0165272 0.108108108 0.11177
biological_process endothelial cell differentiation GO:0045446 16494 43 1.255919361 0.00180428 0.072072072 0.00509139 1.188092257 0.0162136 0.136936937 0.110586
biological_process regulation of glycogen metabolic process GO:0070873 16511 26 1.329004282 0.00181873 0.003603604 0.0050852 1.155175599 0.0851034 0.151351351 0.243471
biological_process female sex differentiation GO:0046660 16418 119 1.153181986 0.00183708 0.036036036 0.00634082 1.114320503 0.0150861 0.082882883 0.105721
biological_process protein localization to nucleus GO:0034504 16314 223 1.111486572 0.00184634 0.025225225 0.00633301 1.079235696 0.0195394 0.178378378 0.121361
biological_process hormone metabolic process GO:0042445 16426 111 1.158493323 0.00185344 0.025225225 0.00632516 1.040113092 0.231351 0.2 0.430567
biological_process cyclic nucleotide metabolic process GO:0009187 16419 118 1.153372232 0.00188918 0.054054054 0.00631802 1.129349408 0.00729306 0.120720721 0.0749689
molecular_function protein C-terminus binding GO:0008022 16709 152 1.134995951 0.00189055 0.084684685 0.0236375 1.068004729 0.0723132 0.225225225 0.11682
biological_process spinal cord development GO:0021510 16462 75 1.192414157 0.00190915 0.009009009 0.00631052 1.240512031 0.000149639 0.007207207 0.0106509
biological_process rhythmic process GO:0048511 16329 208 1.115011554 0.00191882 0.095495495 0.00630279 1.04039876 0.154947 0.320720721 0.344621
cellular_component extrinsic to membrane GO:0019898 16696 127 1.147555104 0.00191934 0.063063063 0 1.074562227 0.0720053 0.227027027 0.11029
biological_process negative regulation of cell-cell adhesion GO:0022408 16507 30 1.30421281 0.00193441 0.001801802 0.00629522 1.207219704 0.0245544 0.005405405 0.135558
molecular_function voltage-gated calcium channel activity GO:0005245 16832 29 1.309261817 0.00194378 0.081081081 0.0234584 1.469471163 5.86E-06 0.025225225 0
biological_process regulation of protein complex assembly GO:0043254 16359 178 1.124251456 0.00194583 0.003603604 0.00628758 1.036119099 0.200703 0.25045045 0.396382
biological_process negative regulation of hydrolase activity GO:0051346 16341 196 1.118287879 0.00195406 0.030630631 0.00627987 1.016950116 0.339663 0.34954955 -1
biological_process ureteric bud development GO:0001657 16446 91 1.174146955 0.00195495 0.023423423 0.00627202 1.210922854 0.00023732 0.027027027 0.014804
biological_process negative regulation of canonical Wnt receptor signaling pathway GO:0090090 16462 75 1.191906234 0.00195608 0.066666667 0.00626418 1.196234059 0.00158771 0.082882883 0.0441475
biological_process regulation of pathway-restricted SMAD protein phosphorylation GO:0060393 16508 29 1.308847919 0.00196767 0.027027027 0.00625662 1.041658823 0.348687 0.405405405 -1
biological_process regulation of muscle system process GO:0090257 16431 106 1.161149019 0.00196991 0.063063063 0.00624885 1.122915619 0.0139408 0.131531532 0.100659
biological_process cellular divalent inorganic cation homeostasis GO:0072503 16312 225 1.110174194 0.00197494 0.084684685 0.00624117 1.066890569 0.0400787 0.210810811 0.165785
biological_process regulation of phosphatase activity GO:0010921 16448 89 1.175867178 0.00197913 0.18018018 0.00623348 1.216280878 0.000197324 0.081081081 0.0128069
molecular_functionRNA polymerase II transcription regulatory region sequence-specific DNA binding transcription factor activity involved in positive regulation of transcriptionGO:0001228 16800 61 1.212514703 0.00198761 0.012612613 0.0232809 1.135721554 0.0329305 0.03963964 0.0515117
molecular_function SH2 domain binding GO:0042169 16830 31 1.298021576 0.00200916 0.045045045 0.0231038 1.196380486 0.0290066 0.055855856 0.0533677
biological_process hindlimb morphogenesis GO:0035137 16503 34 1.284123537 0.00203627 0.005405405 0.00622704 1.225178879 0.0114067 0.100900901 0.0890002
biological_process glycerolipid metabolic process GO:0046486 16305 232 1.108026573 0.00205201 0.054054054 0.00621965 1.058235123 0.0609042 0.165765766 0.206277
biological_process mesoderm formation GO:0001707 16486 51 1.231553998 0.00206138 0.007207207 0.00621214 1.073780171 0.180361 0.282882883 0.375346
biological_process multicellular organismal metabolic process GO:0044236 16477 60 1.213399432 0.00206354 0.01981982 0.00620448 0.999340191 0.503561 0.527927928 -1
biological_process positive regulation of axon extension GO:0045773 16515 22 1.35259191 0.00207581 0.028828829 0.00619707 1.05716662 0.321074 0.374774775 -1
cellular_component terminal bouton GO:0043195 16779 44 1.248936174 0.00209251 0.028828829 0 1.240220266 0.00285841 0.03963964 0
biological_process regulation of axon extension GO:0030516 16498 39 1.264371256 0.00209816 0.045045045 0.00618991 1.078052261 0.198991 0.335135135 0.394227
biological_process homeostasis of number of cells GO:0048872 16372 165 1.127940499 0.00211266 0.005405405 0.00740994 1.154047586 0.000285956 0.034234234 0.0143489
biological_process heart growth GO:0060419 16492 45 1.24565522 0.00213046 0.001801802 0.00740128 1.073128076 0.197441 0.335135135 0.393597
biological_process peptidyl-tyrosine dephosphorylation GO:0035335 16500 37 1.270957592 0.00213201 0.036036036 0.00739221 1.227421349 0.00822602 0.118918919 0.0775138
biological_process mating GO:0007618 16503 34 1.282398449 0.00215153 0.046846847 0.00738364 1.252097366 0.00540631 0.068468468 0.0627555
biological_process regulation of nucleocytoplasmic transport GO:0046822 16395 142 1.137716489 0.00215399 0.021621622 0.00737463 1.06427037 0.0913888 0.252252252 0.251751
biological_process macromolecular complex subunit organization GO:0043933 15442 1095 1.048122347 0.00215767 0.055855856 0.00736567 1.005464118 0.373006 0.4 -1

biological_process regulation of receptor activity GO:0010469 16476 61 1.210390819 0.00217638 0.178378378 0.00735714 1.308446492 1.46E-05 0.025225225 0
cellular_component contractile fiber GO:0043292 16669 154 1.132010538 0.0021823 0.016216216 0 1.133801425 0.00193052 0.054054054 0
biological_process positive regulation of protein kinase B signaling cascade GO:0051897 16479 58 1.215632819 0.00218991 0.016216216 0.00734849 1.095733005 0.102935 0.176576577 0.264057
biological_process purine-containing compound metabolic process GO:0072521 15765 772 1.057771546 0.00220379 0.064864865 0.00733988 1.048900441 0.00797295 0.100900901 0.0774526
biological_process metal ion homeostasis GO:0055065 16273 264 1.10015133 0.00224691 0.077477477 0.00733206 1.057636613 0.0510189 0.218018018 0.185209
biological_process cell differentiation involved in kidney development GO:0061005 16504 33 1.285136386 0.00225616 0.007207207 0.00732335 1.209233805 0.018583 0.162162162 0.116103
biological_process homophilic cell adhesion GO:0007156 16435 102 1.1616328 0.00228278 0.273873874 0.00731513 1.209992176 0.000114443 0.203603604 0.00841137
biological_process programmed cell death GO:0012501 15276 1261 1.044309755 0.00228897 0.034234234 0.00730639 1.039303605 0.00595068 0.122522523 0.0654176
biological_process oligodendrocyte differentiation GO:0048709 16471 66 1.200975479 0.00230097 0.023423423 0.00729782 1.103894787 0.071483 0.057657658 0.223292
biological_process cell-substrate adherens junction assembly GO:0007045 16504 33 1.28448774 0.00230228 0.108108108 0.00728014 1.33307023 0.000454368 0.104504505 0.0220921
biological_process focal adhesion assembly GO:0048041 16504 33 1.28448774 0.00230228 0.108108108 0.00728014 1.33307023 0.000454368 0.104504505 0.0220921
molecular_function carbohydrate derivative binding GO:0097367 16714 147 1.134282454 0.00230988 0.073873874 0.0229575 1.033649562 0.238941 0.369369369 0.428937
biological_process regulation of dendritic spine development GO:0060998 16513 24 1.333549385 0.00231041 0.066666667 0.00727153 1.318336894 0.00343415 0.097297297 0.0571603
biological_process negative regulation of protein kinase B signaling cascade GO:0051898 16517 20 1.365230064 0.00232159 0.003603604 0.00726302 1.138351818 0.141793 0.153153153 0.331618
biological_processregulation of adaptive immune response based on somatic recombination of immune receptors built from immunoglobulin superfamily domainsGO:0002822 16456 81 1.180745906 0.00236781 0.014414414 0.00725544 0.963672348 0.714902 0.758558559 -1
biological_process myofibril assembly GO:0030239 16504 33 1.283575238 0.00236859 0.012612613 0.0072467 1.200332329 0.0230064 0.117117117 0.130086
biological_process regulation of autophagy GO:0010506 16491 46 1.239602502 0.00241141 0.120720721 0.00723907 1.128968916 0.0646157 0.223423423 0.214811
biological_process ventricular cardiac muscle tissue morphogenesis GO:0055010 16498 39 1.260200583 0.00241734 0.009009009 0.0072305 1.082824503 0.184882 0.237837838 0.37933
biological_process regulation of systemic arterial blood pressure mediated by a chemical signal GO:0003044 16500 37 1.267084435 0.00242308 0.023423423 0.00722195 1.022281318 0.407118 0.461261261 -1
biological_process membrane protein ectodomain proteolysis GO:0006509 16506 31 1.291840481 0.00242317 0.01981982 0.00721327 1.02243072 0.41431 0.445045045 -1
biological_process positive regulation of chemotaxis GO:0050921 16472 65 1.201324947 0.00242452 0.009009009 0.00720464 1.228306254 0.000700495 0.010810811 0.0312553
biological_process actin filament-based movement GO:0030048 16482 55 1.218506879 0.00246579 0.097297297 0.00719706 1.273749533 0.000213929 0.064864865 0.0126786
biological_process catenin import into nucleus GO:0035411 16515 22 1.345808612 0.0024674 0.018018018 0.00718848 1.043127281 0.362959 0.390990991 -1
biological_process regulation of actin cytoskeleton organization GO:0032956 16376 161 1.12723265 0.00247773 0.028828829 0.00718014 1.060388442 0.0911536 0.115315315 0.251495
biological_process regeneration GO:0031099 16401 136 1.138478087 0.00248653 0.023423423 0.00717178 1.112895209 0.0110167 0.095495495 0.0854351
biological_process peptidyl-threonine modification GO:0018210 16481 56 1.216172852 0.00250263 0.10990991 0.00716363 1.289288258 8.63E-05 0.045045045 0.00590417
biological_process dephosphorylation GO:0016311 16262 275 1.096862658 0.00251131 0.218018018 0.0071553 1.134233465 5.05E-05 0.097297297 0.00317612
biological_process guanosine-containing compound catabolic process GO:1901069 16102 435 1.076632382 0.00251262 0.127927928 0.00714681 1.075436943 0.00287541 0.079279279 0.0535048
molecular_function neuropeptide receptor binding GO:0071855 16841 20 1.361820348 0.00252079 0.018018018 0.022804 1.067341449 0.300863 0.266666667 -1
biological_process response to alcohol GO:0097305 16267 270 1.097691117 0.0025296 0.079279279 0.00949572 1.030613054 0.189853 0.353153153 0.385682
biological_process negative regulation of protein complex disassembly GO:0043242 16499 38 1.261971834 0.00255247 0.018018018 0.00948523 1.259947781 0.00272885 0.03963964 0.0523068
biological_process cardiac muscle tissue growth GO:0055017 16495 42 1.248709859 0.0025923 0.003603604 0.00947532 1.065365265 0.231285 0.353153153 0.430727
biological_process immune response-activating signal transduction GO:0002757 16407 130 1.140696077 0.00263893 0.001801802 0.0106363 1.06471231 0.0997466 0.147747748 0.26262
biological_process negative regulation of microtubule polymerization or depolymerization GO:0031111 16512 25 1.321600702 0.00265765 0.043243243 0.0106244 1.311219726 0.00349517 0.032432432 0.056749
cellular_component trans-Golgi network GO:0005802 16718 105 1.156443797 0.00267284 0.095495495 0 1.175690689 0.000879975 0.010810811 0
biological_process regulation of Rho GTPase activity GO:0032319 16455 82 1.177128865 0.0026757 0.034234234 0.0117779 1.214923692 0.000363271 0.027027027 0.0139561
cellular_component brush border GO:0005903 16763 60 1.207036232 0.00269535 0.027027027 0 0.923359982 0.848524 0.790990991 -1
biological_process central nervous system neuron development GO:0021954 16480 57 1.212424959 0.00269598 0.023423423 0.0117648 1.112143085 0.0709195 0.21981982 0.221451
biological_process regulation of leukocyte activation GO:0002694 16277 260 1.098541273 0.0027689 0.043243243 0.011754 1.06414485 0.035482 0.142342342 0.157613
biological_process regulation of osteoblast differentiation GO:0045667 16442 95 1.163815428 0.00277277 0.037837838 0.0117404 1.032990291 0.288257 0.390990991 -1
biological_process peptidyl-serine phosphorylation GO:0018105 16414 123 1.143848908 0.00277278 0.088288288 0.0117266 1.141213923 0.00323606 0.088288288 0.0565416
biological_process oligodendrocyte development GO:0014003 16504 33 1.278353088 0.00278249 0.014414414 0.0117133 1.114861303 0.126317 0.133333333 0.30236
biological_process dendritic spine morphogenesis GO:0060997 16515 22 1.340844821 0.00279503 0.106306306 0.012855 1.426086805 0.000266208 0.082882883 0.0144854
biological_process positive regulation of mesenchymal cell proliferation GO:0002053 16505 32 1.282301079 0.00281421 0.001801802 0.0128409 1.272475191 0.00376657 0.05045045 0.0584958
biological_process receptor-mediated endocytosis GO:0006898 16439 98 1.160983754 0.00281559 0.144144144 0.012826 1.175456346 0.00127469 0.021621622 0.0442631
biological_process apoptotic process GO:0006915 15291 1246 1.043468315 0.00286003 0.037837838 0.012813 1.039353065 0.00618027 0.118918919 0.0646297
biological_process membrane protein proteolysis GO:0033619 16501 36 1.26550385 0.00287042 0.03963964 0.0127986 1.037768316 0.347202 0.363963964 -1
biological_process long-term memory GO:0007616 16512 25 1.318248411 0.00290583 0.156756757 0.0127852 1.125034565 0.139264 0.281081081 0.32688
biological_process protein deacetylation GO:0006476 16482 55 1.214300574 0.00291362 0.007207207 0.0139156 1.127747005 0.0501229 0.063063063 0.183765
biological_process lipopolysaccharide metabolic process GO:0008653 16491 46 1.233395432 0.00301987 0.027027027 0.0150458 1.235632711 0.0027862 0.034234234 0.0537361
cellular_component integrin complex GO:0008305 16793 30 1.288838067 0.00304718 0.104504505 0 1.237459057 0.0120733 0.030630631 0
molecular_function transmembrane transporter activity GO:0022857 15993 868 1.052323214 0.00305764 0.194594595 0.0226847 1.014612623 0.221945 0.392792793 0.397454
biological_process lipid phosphorylation GO:0046834 16509 28 1.298792375 0.00306428 0.084684685 0.0173031 1.338769703 0.000943254 0.007207207 0.0374607
biological_process neuron migration GO:0001764 16441 96 1.160761142 0.00310797 0.100900901 0.0172858 1.125852784 0.0160964 0.201801802 0.109018
biological_process protein targeting GO:0006605 16207 330 1.086042363 0.00312204 0.043243243 0.0172667 1.050443788 0.0544519 0.172972973 0.192952
biological_process regulation of synaptic transmission, glutamatergic GO:0051966 16504 33 1.274376924 0.00314024 0.154954955 0.0172479 1.243040358 0.00774636 0.185585586 0.0770185
biological_process ERBB signaling pathway GO:0038127 16487 50 1.222647659 0.00315697 0.028828829 0.0172291 1.162969145 0.0228053 0.190990991 0.129033
biological_process regulation of protein autophosphorylation GO:0031952 16513 24 1.32156684 0.00316104 0.005405405 0.0172096 1.194510548 0.0493009 0.088288288 0.183192
biological_process calcium ion homeostasis GO:0055074 16319 218 1.106052452 0.00316476 0.122522523 0.0171901 1.092522267 0.00861449 0.171171171 0.0778847
biological_process telencephalon cell migration GO:0022029 16498 39 1.251772413 0.00319979 0.111711712 0.0171724 1.217250405 0.00931861 0.165765766 0.0775181
biological_process ventricular septum morphogenesis GO:0060412 16511 26 1.308473408 0.0032002 0.041441441 0.0171528 1.337092906 0.00144361 0.046846847 0.0432658
molecular_function syntaxin binding GO:0019905 16822 39 1.251529804 0.00322562 0.061261261 0.0225307 1.059357326 0.260181 0.347747748 0.449958
biological_process macromolecule localization GO:0033036 14877 1660 1.036608434 0.00322771 0.190990991 0.0171348 1.042320016 0.000820319 0.073873874 0.0345134
biological_process mammary gland morphogenesis GO:0060443 16483 54 1.213626519 0.00322982 0.046846847 0.0171154 1.188788018 0.00804604 0.115315315 0.0770068
biological_process glycogen biosynthetic process GO:0005978 16504 33 1.273398458 0.0032344 0.003603604 0.0170767 1.118111863 0.119727 0.142342342 0.293085
biological_process glucan biosynthetic process GO:0009250 16504 33 1.273398458 0.0032344 0.003603604 0.0170767 1.118111863 0.119727 0.142342342 0.293085
biological_process erythrocyte differentiation GO:0030218 16456 81 1.174221442 0.00323922 0.007207207 0.0170575 1.23923019 9.26E-05 0.003603604 0.00875338
molecular_function Ras GTPase binding GO:0017016 16746 115 1.14582386 0.00328412 0.209009009 0.0223683 1.215267418 3.01E-05 0.057657658 0
cellular_component Golgi membrane GO:0000139 16390 433 1.074422469 0.00328863 0.214414414 0 1.088245794 0.000635738 0.086486486 0
biological_process hematopoietic progenitor cell differentiation GO:0002244 16505 32 1.277048009 0.00329227 0.018018018 0.0170412 1.186657396 0.0335778 0.028828829 0.153007
biological_process monovalent inorganic cation homeostasis GO:0055067 16475 62 1.198850031 0.00329318 0.003603604 0.0170219 0.96169649 0.699668 0.771171171 -1
biological_process adenylate cyclase-modulating G-protein coupled receptor signaling pathway GO:0007188 16452 85 1.169641003 0.00330432 0.084684685 0.0170033 1.075248453 0.114162 0.306306306 0.282575
molecular_function cation transmembrane transporter activity GO:0008324 16329 532 1.066840924 0.003329 0.16036036 0.022207 1.028609275 0.122745 0.315315315 0.235372
cellular_component dendritic shaft GO:0043198 16783 40 1.247159491 0.00335628 0.201801802 0 1.299391449 0.000512363 0.014414414 0
biological_process regulation of neurotransmitter transport GO:0051588 16496 41 1.243823971 0.00338943 0.072072072 0.0169889 1.213791042 0.00879797 0.124324324 0.0775685
biological_process lung morphogenesis GO:0060425 16499 38 1.253264585 0.00339207 0.009009009 0.0169698 1.165625619 0.0383279 0.113513514 0.162397
biological_process protein deacylation GO:0035601 16481 56 1.208426597 0.00340373 0.010810811 0.0169513 1.123712324 0.0541146 0.063063063 0.191953
biological_process positive regulation of cell-matrix adhesion GO:0001954 16517 20 1.34900072 0.00341514 0.018018018 0.0169328 1.302495547 0.00952496 0.106306306 0.0784584
cellular_component ruffle membrane GO:0032587 16775 48 1.22508833 0.00341543 0.010810811 0 1.200834771 0.00789981 0.036036036 0
biological_process regulation of branching involved in ureteric bud morphogenesis GO:0090189 16516 21 1.340495892 0.00342197 0.007207207 0.0169141 1.167041972 0.0923067 0.154954955 0.253524
molecular_function gated channel activity GO:0022836 16589 272 1.093771413 0.00346128 0.223423423 0.0218951 1.168508775 6.08E-07 0.091891892 0

molecular_function ion gated channel activity GO:0022839 16589 272 1.093771413 0.00346128 0.223423423 0.0218951 1.168508775 6.08E-07 0.091891892 0
biological_process regulation of epithelial to mesenchymal transition GO:0010717 16503 34 1.266975806 0.00347615 0.025225225 0.0191082 1.129295995 0.0955803 0.225225225 0.25599
biological_process positive regulation of glucose transport GO:0010828 16514 23 1.324690092 0.00347763 0.005405405 0.0190868 1.16359022 0.0869441 0.117117117 0.246344
biological_process epidermal growth factor receptor signaling pathway GO:0007173 16489 48 1.224252756 0.0035198 0.037837838 0.0190681 1.141438155 0.0445921 0.21981982 0.177363
biological_process pericardium development GO:0060039 16517 20 1.347301597 0.00355297 0.009009009 0.0201468 1.280437184 0.0148683 0.077477477 0.105865
biological_process regulation of amine transport GO:0051952 16480 57 1.205442611 0.00356012 0.147747748 0.0201247 0.997618579 0.512466 0.486486486 -1
biological_process T cell mediated cytotoxicity GO:0001913 16515 22 1.330999693 0.00356332 0.014414414 0.0201024 1.071563264 0.280372 0.389189189 0.498271
biological_process establishment of protein localization to membrane GO:0090150 16492 45 1.23111089 0.00358391 0.03963964 0.0200814 1.150826833 0.039644 0.165765766 0.164976
molecular_function monocarboxylic acid transmembrane transporter activity GO:0008028 16830 31 1.278515976 0.00358937 0.036036036 0.0287887 0.955047462 0.667835 0.616216216 -1
biological_process regulation of alpha-beta T cell activation GO:0046634 16481 56 1.206839338 0.00362096 0.010810811 0.0200615 1.152602595 0.0237783 0.147747748 0.132219
biological_process neural crest cell differentiation GO:0014033 16484 53 1.212507183 0.00363807 0.036036036 0.0200403 1.165206013 0.018466 0.07027027 0.115443
biological_process negative regulation of osteoblast differentiation GO:0045668 16503 34 1.265407221 0.00364539 0.016216216 0.0200185 0.991907848 0.53263 0.517117117 -1
biological_process regulation of alpha-beta T cell differentiation GO:0046637 16498 39 1.247694767 0.00365466 0.001801802 0.0199968 1.207110554 0.0124517 0.07027027 0.0956423
biological_process regulation of organ morphogenesis GO:2000027 16412 125 1.137930968 0.00366741 0.016216216 0.0199755 1.149395512 0.00184162 0.095495495 0.0479839
molecular_function microtubule motor activity GO:0003777 16796 65 1.191491872 0.00368921 0.124324324 0.0285947 0.947443651 0.768943 0.654054054 -1
biological_process phosphatidylinositol phosphorylation GO:0046854 16511 26 1.302919746 0.00370933 0.081081081 0.0210415 1.360856439 0.000712492 0.003603604 0.0311279
biological_process glycosphingolipid metabolic process GO:0006687 16508 29 1.286792058 0.00370993 0.003603604 0.0210182 1.037392772 0.363529 0.21981982 -1
biological_process outflow tract morphogenesis GO:0003151 16489 48 1.22269825 0.00372219 0.068468468 0.0209958 1.254740723 0.00110166 0.059459459 0.0405619
biological_process purine ribonucleotide metabolic process GO:0009150 15829 708 1.056797544 0.00373181 0.133333333 0.0209733 1.053379621 0.00596116 0.088288288 0.0653348
biological_process leukocyte cell-cell adhesion GO:0007159 16505 32 1.272652813 0.00374706 0.023423423 0.0209512 1.262033296 0.00508643 0.025225225 0.060656
biological_process regulation of amino acid transport GO:0051955 16516 21 1.336585692 0.0037556 0.066666667 0.0209287 0.959121859 0.627305 0.632432432 -1
biological_process pancreas development GO:0031016 16466 71 1.182736302 0.00376214 0.016216216 0.0209062 1.185436026 0.00334201 0.009009009 0.0563105
biological_process stress fiber assembly GO:0043149 16492 45 1.229651619 0.00377041 0.041441441 0.0208838 1.120456272 0.0805372 0.145945946 0.238498
cellular_component contractile fiber part GO:0044449 16686 137 1.13119657 0.00378383 0.030630631 0 1.162000687 0.000487132 0.023423423 0
molecular_function chromatin binding GO:0003682 16537 324 1.084816285 0.00379072 0.176576577 0.0284035 1.162421616 1.58E-07 0.027027027 0
molecular_function ARF GTPase activator activity GO:0008060 16838 23 1.321206747 0.00379238 0.048648649 0.0282034 1.399592465 0.000447514 0.007207207 0
cellular_component filopodium GO:0030175 16760 63 1.193828053 0.00379532 0.095495495 0 1.24648717 0.000343043 0.057657658 0
biological_process morphogenesis of a polarized epithelium GO:0001738 16496 41 1.240266741 0.00381504 0.059459459 0.0208639 1.261834289 0.00182157 0.046846847 0.044937
biological_process regulation of ARF GTPase activity GO:0032312 16514 23 1.32077814 0.00383273 0.05045045 0.0208422 1.400904808 0.00043031 0.007207207 0.018111
biological_process inflammatory response GO:0006954 16182 355 1.08078212 0.00385007 0.009009009 0.0208205 1.003374135 0.455717 0.479279279 -1
biological_process lymph vessel development GO:0001945 16515 22 1.327437637 0.00388494 0.061261261 0.0208001 1.279998523 0.0114157 0.144144144 0.0889051
biological_process regulation of canonical Wnt receptor signaling pathway GO:0060828 16419 118 1.140930377 0.00389474 0.059459459 0.020778 1.188135635 0.000190815 0.057657658 0.0129389
biological_process cardiac cell development GO:0055006 16501 36 1.255735069 0.00390015 0.018018018 0.0207557 1.151678074 0.0572835 0.07027027 0.198642
biological_process development of primary female sexual characteristics GO:0046545 16423 114 1.143293139 0.00391683 0.059459459 0.0207341 1.119700399 0.0131644 0.075675676 0.0986474
biological_process activation of immune response GO:0002253 16367 170 1.117067433 0.00393629 0.009009009 0.0207128 0.970082816 0.751523 0.735135135 -1
biological_process gastrulation GO:0007369 16409 128 1.135079041 0.00393804 0.023423423 0.0206904 1.109767931 0.0154111 0.172972973 0.106083
biological_process regulation of leukocyte differentiation GO:1902105 16382 155 1.122579683 0.00395712 0.064864865 0.0206692 1.077568825 0.0464308 0.077477477 0.179612
biological_process regulation of proteolysis GO:0030162 16391 146 1.126127543 0.00400842 0.028828829 0.0206501 1.01619356 0.366779 0.38018018 -1
biological_process cardiac muscle cell development GO:0055013 16506 31 1.274652247 0.00401083 0.005405405 0.0206279 1.136963027 0.0930761 0.088288288 0.254011
biological_process inner ear morphogenesis GO:0042472 16454 83 1.167577051 0.00401281 0.057657658 0.0206056 1.173617923 0.00301123 0.10990991 0.0571823
biological_process GTP metabolic process GO:0046039 16093 444 1.071652355 0.00401414 0.100900901 0.0205834 1.066692426 0.00680552 0.09009009 0.0706374
biological_process cellular cation homeostasis GO:0030003 16247 290 1.089048274 0.00402637 0.081081081 0.0205619 1.034231807 0.154213 0.268468468 0.345144
biological_process regulation of morphogenesis of a branching structure GO:0060688 16489 48 1.220405542 0.00403975 0.003603604 0.0205406 1.089466765 0.141157 0.136936937 0.330754
biological_process neuropeptide signaling pathway GO:0007218 16466 71 1.181021083 0.00405308 0.052252252 0.0205193 1.124429077 0.0343885 0.140540541 0.153434
biological_process peptidyl-threonine phosphorylation GO:0018107 16483 54 1.207508154 0.00407869 0.120720721 0.0204988 1.286979714 0.000126761 0.05045045 0.00820516
biological_process positive regulation of behavior GO:0048520 16461 76 1.174791144 0.00407978 0.016216216 0.0204768 1.172038304 0.00461108 0.086486486 0.0592858
biological_process transforming growth factor beta receptor signaling pathway GO:0007179 16425 112 1.143765774 0.00409277 0.140540541 0.0204556 1.230384758 1.13E-05 0.068468468 0
molecular_function collagen binding GO:0005518 16826 35 1.257584213 0.00411787 0.068468468 0.0280425 1.257343604 0.00414798 0.063063063 0
biological_process immune response-regulating signaling pathway GO:0002764 16399 138 1.129313315 0.00411895 0.007207207 0.0204353 1.053194997 0.138539 0.198198198 0.326122
biological_process monosaccharide transport GO:0015749 16471 66 1.187167014 0.00415809 0.01981982 0.0204159 1.106886988 0.0659022 0.084684685 0.218261
biological_process response to alkaloid GO:0043279 16429 108 1.146073678 0.00416988 0.140540541 0.0203948 1.114678986 0.0191803 0.136936937 0.11981
biological_process cellular response to organic cyclic compound GO:0071407 16314 223 1.101231585 0.0041922 0.007207207 0.0203744 1.028644065 0.22787 0.376576577 0.425891
biological_process regulation of systemic arterial blood pressure by renin-angiotensin GO:0003081 16515 22 1.324177915 0.0042018 0.018018018 0.0203531 1.050328351 0.341232 0.295495495 -1
biological_process positive regulation of developmental growth GO:0048639 16497 40 1.240154066 0.00421975 0.081081081 0.0203325 1.1262433 0.0830895 0.227027027 0.243256
biological_process hexose transport GO:0008645 16473 64 1.189546585 0.0042499 0.023423423 0.020291 1.117989554 0.0507036 0.068468468 0.184634
biological_process glucose transport GO:0015758 16473 64 1.189546585 0.0042499 0.023423423 0.020291 1.117989554 0.0507036 0.068468468 0.184634
biological_process gene silencing GO:0016458 16451 86 1.163243131 0.00428278 0.088288288 0.0202715 1.174972323 0.00241755 0.052252252 0.0503396
biological_process male gonad development GO:0008584 16449 88 1.161256444 0.00430565 0.009009009 0.0202514 1.035983929 0.278877 0.255855856 0.496445
cellular_component calcium channel complex GO:0034704 16792 31 1.272050596 0.0043193 0.030630631 0 1.302851466 0.00173143 0.052252252 0
biological_process central nervous system neuron axonogenesis GO:0021955 16508 29 1.281254114 0.00432371 0.034234234 0.020231 1.083026594 0.219149 0.363963964 0.418062
biological_process muscle hypertrophy GO:0014896 16511 26 1.296947467 0.00433685 0.005405405 0.0202103 1.042958142 0.352101 0.354954955 -1
biological_process bone development GO:0060348 16443 94 1.155799765 0.00434767 0.064864865 0.0201895 1.149386403 0.00593837 0.127927928 0.0655861
molecular_function Rho GTPase activator activity GO:0005100 16834 27 1.291117824 0.00436806 0.068468468 0.0278751 1.374658778 0.000369475 0.009009009 0
biological_process transmembrane transport GO:0055085 15857 680 1.056785386 0.00440739 0.192792793 0.0201719 1.052872816 0.00737116 0.194594595 0.0748036
biological_process energy reserve metabolic process GO:0006112 16472 65 1.187170086 0.00441132 0.012612613 0.0201507 1.095706766 0.0902718 0.028828829 0.250948
molecular_function potassium ion transmembrane transporter activity GO:0015079 16742 119 1.138007823 0.00443631 0.118918919 0.0276897 1.142383435 0.00346768 0.158558559 0
biological_process toll-like receptor signaling pathway GO:0002224 16492 45 1.224851883 0.00444675 0.007207207 0.0201316 1.035485351 0.339869 0.394594595 -1
biological_process positive regulation of pathway-restricted SMAD protein phosphorylation GO:0010862 16515 22 1.321528361 0.00447617 0.084684685 0.0201122 1.047568857 0.3495 0.401801802 -1
biological_process epithelial tube branching involved in lung morphogenesis GO:0060441 16515 22 1.321324972 0.00449788 0.007207207 0.0200923 1.265063173 0.0155877 0.052252252 0.107389
cellular_component Z disc GO:0030018 16747 76 1.172309299 0.00455676 0.059459459 0 1.220985089 0.000412259 0.003603604 0
biological_process regulation of leukocyte proliferation GO:0070663 16405 132 1.130503934 0.0045614 0.025225225 0.0200751 1.016377045 0.371788 0.423423423 -1
biological_process regulation of cellular component size GO:0032535 16367 170 1.114805255 0.00457898 0.07027027 0.020055 1.127538895 0.00189519 0.014414414 0.0476702
biological_process positive regulation of angiogenesis GO:0045766 16456 81 1.16667725 0.00459861 0.055855856 0.0200351 1.039907056 0.266454 0.347747748 0.480683
molecular_function voltage-gated potassium channel activity GO:0005249 16788 73 1.175389037 0.00464476 0.171171171 0.0407225 1.155850889 0.0104044 0.230630631 0.012497
biological_process regulation of cyclic nucleotide metabolic process GO:0030799 16457 80 1.167465169 0.00465217 0.018018018 0.0200173 1.124270564 0.0268125 0.088288288 0.138992
biological_process cell fate commitment involved in formation of primary germ layer GO:0060795 16510 27 1.288668311 0.00465904 0.007207207 0.0199967 1.018524132 0.433761 0.463063063 -1
biological_process head development GO:0060322 16488 49 1.214120676 0.00466194 0.023423423 0.0199758 1.172827882 0.0179288 0.073873874 0.115193
cellular_component myofibril GO:0030016 16679 144 1.124402913 0.00470496 0.01981982 0 1.126838258 0.00405221 0.03963964 0
biological_process positive regulation of JNK cascade GO:0046330 16490 47 1.21835867 0.00470794 0.023423423 0.0199577 0.990843205 0.543376 0.518918919 -1
molecular_function cation binding GO:0043169 13270 3591 1.022126601 0.00481602 0.322522523 0.0404748 1.035262548 1.85E-05 0.252252252 0
biological_process purine nucleotide metabolic process GO:0006163 15800 737 1.053814352 0.00481782 0.113513514 0.0209713 1.05054897 0.00751692 0.082882883 0.0766694

biological_process epidermis development GO:0008544 16326 211 1.102224646 0.00481942 0.037837838 0.0209494 1.134515745 0.000329502 0.113513514 0.0141837
biological_process leukocyte chemotaxis GO:0030595 16439 98 1.150487175 0.00482661 0.032432432 0.0209279 1.191424571 0.000497303 0.005405405 0.0219047
biological_process regulation of gliogenesis GO:0014013 16472 65 1.184825827 0.00485415 0.034234234 0.0209079 1.091040574 0.101368 0.097297297 0.262997
biological_process heart looping GO:0001947 16503 34 1.255640021 0.00487582 0.063063063 0.0208874 1.330924998 0.000410437 0.007207207 0.0181909
biological_process response to organophosphorus GO:0046683 16446 91 1.155952367 0.00488481 0.034234234 0.0208662 1.063419246 0.146695 0.261261261 0.336812
biological_process response to osmotic stress GO:0006970 16484 53 1.204345278 0.0049279 0.01981982 0.0208472 1.040155685 0.306037 0.302702703 -1
biological_process regulation of production of molecular mediator of immune response GO:0002700 16485 52 1.206112073 0.00496282 0.046846847 0.0208278 0.973342015 0.63064 0.668468468 -1
biological_process epithelial cell differentiation involved in kidney development GO:0035850 16512 25 1.297225243 0.00499733 0.032432432 0.0208083 1.1528252 0.0926698 0.246846847 0.253681
biological_process coronary vasculature development GO:0060976 16509 28 1.280583169 0.00502962 0.010810811 0.0207888 1.222128852 0.0207962 0.012612613 0.126018
molecular_function hyaluronic acid binding GO:0005540 16841 20 1.332013663 0.00503611 0.03963964 0.0402376 0.991371765 0.526671 0.533333333 -1
biological_process response to carbohydrate stimulus GO:0009743 16382 155 1.118725399 0.00505224 0.059459459 0.0207687 1.127705724 0.00282972 0.016216216 0.0535777
biological_process positive regulation of protein complex assembly GO:0031334 16449 88 1.15788266 0.00505351 0.018018018 0.0207472 1.020957878 0.366413 0.354954955 -1
biological_process regulation of nucleobase-containing compound metabolic process GO:0019219 13489 3048 1.024292797 0.00505893 0.335135135 0.020726 1.065556369 1.95E-12 0.12972973 0
biological_process muscle organ morphogenesis GO:0048644 16476 61 1.189730929 0.00506456 0.01981982 0.0207049 1.150504695 0.0206875 0.028828829 0.126331
biological_process regulation of embryonic development GO:0045995 16460 77 1.168357587 0.00516179 0.012612613 0.0206897 1.039647679 0.272937 0.324324324 0.489284
biological_process positive regulation of cell morphogenesis involved in differentiation GO:0010770 16505 32 1.261481534 0.00516644 0.009009009 0.0206473 1.113919369 0.131946 0.266666667 0.311993
biological_process embryonic digestive tract development GO:0048566 16505 32 1.261481534 0.00516644 0.023423423 0.0206473 1.105238575 0.151013 0.252252252 0.341619
biological_process endochondral ossification GO:0001958 16515 22 1.315305757 0.0051844 0.064864865 0.0206059 0.963805565 0.615735 0.551351351 -1
biological_process replacement ossification GO:0036075 16515 22 1.315305757 0.0051844 0.064864865 0.0206059 0.963805565 0.615735 0.551351351 -1
biological_process negative regulation of protein depolymerization GO:1901880 16500 37 1.24281919 0.00521643 0.025225225 0.0205867 1.247153203 0.00456888 0.037837838 0.058218
biological_process smooth muscle cell differentiation GO:0051145 16488 49 1.210697503 0.00525808 0.05045045 0.0205681 1.153157596 0.0314648 0.154954955 0.148574
biological_process hexose metabolic process GO:0019318 16338 199 1.103951258 0.00530522 0.043243243 0.0215553 1.007118973 0.430591 0.45045045 -1
biological_process cellular response to lipid GO:0071396 16286 251 1.092376177 0.00531931 0.066666667 0.0215341 1.041733254 0.124269 0.277477477 0.300586
biological_process neuron recognition GO:0008038 16516 21 1.321549564 0.00532677 0.054054054 0.0215126 1.351581509 0.002616 0.086486486 0.0527808
biological_process bone remodeling GO:0046849 16479 58 1.192888885 0.00540372 0.021621622 0.0214956 1.171270889 0.0118119 0.034234234 0.0900308
molecular_function ephrin receptor binding GO:0046875 16832 29 1.272648147 0.00545871 0.068468468 0.0463969 1.213105943 0.023325 0.158558559 0.0501017
biological_process regulation of protein import into nucleus GO:0042306 16419 118 1.13478119 0.00546321 0.010810811 0.0214775 1.028769209 0.293505 0.369369369 -1
biological_process filopodium assembly GO:0046847 16489 48 1.211698294 0.00547817 0.05045045 0.0214565 1.312151624 8.80E-05 0.009009009 0.00588688
biological_process negative regulation of glial cell differentiation GO:0045686 16513 24 1.299481267 0.00549451 0.014414414 0.0214357 1.044547339 0.352629 0.354954955 -1
biological_process ovulation cycle process GO:0022602 16440 97 1.148637442 0.00549471 0.072072072 0.0214138 1.003731072 0.474577 0.479279279 -1
biological_process sphingolipid biosynthetic process GO:0030148 16497 40 1.231758222 0.00551297 0.032432432 0.0213932 1.00376436 0.483554 0.468468468 -1
biological_process cytokine production GO:0001816 16193 344 1.078263787 0.00553168 0.030630631 0.0213726 1.005190116 0.433132 0.452252252 -1
biological_process positive regulation of nucleocytoplasmic transport GO:0046824 16468 69 1.176183131 0.0055403 0.032432432 0.0213514 1.006142905 0.464736 0.466666667 -1
biological_process positive regulation of intracellular transport GO:0032388 16416 121 1.132791852 0.00555239 0.018018018 0.0213305 1.05478442 0.147403 0.273873874 0.337521
biological_process substrate adhesion-dependent cell spreading GO:0034446 16506 31 1.26299967 0.00556366 0.016216216 0.0213096 1.082780691 0.212137 0.302702703 0.41016
biological_process cellular response to nutrient levels GO:0031669 16414 123 1.131539202 0.00560296 0.066666667 0.0212905 1.087953799 0.044952 0.124324324 0.177194
biological_process protein localization GO:0008104 15085 1452 1.03665931 0.0056539 0.172972973 0.0212722 1.035276731 0.00738809 0.12972973 0.0757717
biological_process establishment of vesicle localization GO:0051650 16457 80 1.162995145 0.00568292 0.084684685 0.0222421 1.102567445 0.055602 0.196396396 0.195268
biological_process regulation of protein localization to nucleus GO:1900180 16416 121 1.132362087 0.00568513 0.009009009 0.0222198 1.025880192 0.310337 0.392792793 -1
biological_process regulation of nitrogen compound metabolic process GO:0051171 13454 3083 1.023737955 0.00568882 0.342342342 0.0221976 1.063677951 5.64E-12 0.133333333 0
biological_process ear morphogenesis GO:0042471 16438 99 1.146395762 0.0056946 0.068468468 0.0221756 1.15607659 0.00348926 0.113513514 0.0568323
cellular_component I band GO:0031674 16737 86 1.157063068 0.00571397 0.075675676 0 1.23887868 5.98E-05 0.001801802 0
biological_process protein targeting to membrane GO:0006612 16479 58 1.191170789 0.00576584 0.027027027 0.022158 1.108112061 0.0765619 0.153153153 0.231972
biological_process positive regulation of muscle contraction GO:0045933 16511 26 1.285635486 0.00579038 0.072072072 0.0221373 0.926554508 0.741905 0.603603604 -1
biological_process regulation of glucose transport GO:0010827 16494 43 1.221936905 0.00580112 0.059459459 0.0221158 1.087402039 0.160121 0.203603604 0.351106
biological_process cell fate commitment GO:0045165 16361 176 1.109253447 0.00580194 0.054054054 0.0220936 1.102478394 0.00895829 0.117117117 0.0770681
biological_process kidney epithelium development GO:0072073 16481 56 1.194318349 0.00581891 0.061261261 0.0230527 1.111020732 0.0747334 0.25045045 0.228835
biological_process somite development GO:0061053 16470 67 1.177583171 0.00582123 0.055855856 0.0230298 1.12708871 0.0355027 0.151351351 0.157496
biological_process response to mechanical stimulus GO:0009612 16399 138 1.123371775 0.00585483 0.084684685 0.0230091 1.115660041 0.00906109 0.147747748 0.0779905
biological_process endocrine system development GO:0035270 16428 109 1.138765656 0.00590842 0.007207207 0.0229897 1.076136264 0.0835919 0.115315315 0.243834
biological_process carbohydrate derivative biosynthetic process GO:1901137 15991 546 1.061038662 0.00600016 0.073873874 0.0239479 1.052650804 0.0151221 0.052252252 0.105626
biological_process regulation of phosphatidylinositol 3-kinase activity GO:0043551 16513 24 1.295757507 0.00601221 0.016216216 0.0239249 1.21711513 0.0326192 0.16036036 0.151209
biological_process negative regulation of synaptic transmission GO:0050805 16502 35 1.24463899 0.00604551 0.097297297 0.0239035 0.983818887 0.565937 0.522522523 -1
molecular_function carbohydrate binding GO:0030246 16627 234 1.094024891 0.00605801 0.084684685 0.0461959 0.993170936 0.572328 0.511711712 -1
molecular_function calcium channel activity GO:0005262 16779 82 1.159286595 0.0061319 0.18018018 0.0459057 1.295118152 1.74E-06 0.032432432 0
molecular_function structural constituent of cytoskeleton GO:0005200 16832 29 1.267400678 0.00627407 0.007207207 0.0456309 1.139175123 0.0969257 0.181981982 0.179134
cellular_component sarcomere GO:0030017 16699 124 1.128879474 0.00629716 0.023423423 0 1.153652085 0.0014668 0.007207207 0
biological_process regulation of microtubule polymerization or depolymerization GO:0031110 16495 42 1.221658073 0.0063641 0.055855856 0.0248733 1.241019032 0.0033754 0.036036036 0.0575782
biological_process cellular response to starvation GO:0009267 16442 95 1.147050156 0.00639338 0.064864865 0.0248508 1.073289322 0.107339 0.205405405 0.271976
cellular_component coated pit GO:0005905 16777 46 1.211502336 0.00642238 0.093693694 0 1.212975387 0.00611611 0.037837838 0
biological_process metanephros development GO:0001656 16466 71 1.169913891 0.00647469 0.028828829 0.024832 1.126364022 0.032288 0.140540541 0.149623
biological_process production of molecular mediator of immune response GO:0002440 16451 86 1.154288389 0.00648285 0.025225225 0.024808 0.991199036 0.556382 0.6 -1
biological_process intracellular protein transport GO:0006886 15900 637 1.05566656 0.00653934 0.154954955 0.0247875 1.034883756 0.0599676 0.176576577 0.204677
biological_process erythrocyte homeostasis GO:0034101 16451 86 1.153918556 0.00659211 0.010810811 0.025732 1.208215113 0.000399435 0.007207207 0.0183145
biological_process negative regulation of muscle cell differentiation GO:0051148 16505 32 1.252634456 0.00661132 0.005405405 0.0266704 1.145022084 0.0774718 0.064864865 0.234041
biological_process adult walking behavior GO:0007628 16503 34 1.244997829 0.00662609 0.104504505 0.0266452 1.266648573 0.00351086 0.081081081 0.0580729
biological_process positive regulation of phosphatidylinositol 3-kinase cascade GO:0014068 16500 37 1.234713343 0.00664981 0.055855856 0.0266208 1.173654743 0.0335045 0.2 0.153104
biological_process regulation of lymphocyte activation GO:0051249 16315 222 1.095204525 0.00668713 0.046846847 0.0265975 1.074106443 0.0270912 0.104504505 0.139714
biological_process embryonic heart tube morphogenesis GO:0003143 16497 40 1.225502911 0.0066942 0.059459459 0.0265719 1.33890273 0.000100786 0.012612613 0.00860337
biological_process ribonucleotide metabolic process GO:0009259 15817 720 1.052021733 0.00671705 0.154954955 0.0275037 1.051314605 0.00737507 0.086486486 0.0747116
biological_process neutral amino acid transport GO:0015804 16516 21 1.311011029 0.00675264 0.086486486 0.0284331 1.225931075 0.0363738 0.183783784 0.158027
biological_process regulation of homeostatic process GO:0032844 16301 236 1.092131455 0.00677219 0.122522523 0.0284069 1.098541982 0.00413374 0.127927928 0.0585114
biological_process positive regulation of neuron projection development GO:0010976 16471 66 1.175117589 0.00677339 0.063063063 0.0283792 1.273779584 5.67E-05 0.018018018 0.00310721
molecular_function protein binding, bridging GO:0030674 16793 68 1.172267665 0.00684109 0.010810811 0.0515863 1.143555331 0.0199605 0.106306306 0.0506863
biological_process megakaryocyte differentiation GO:0030219 16504 33 1.247397647 0.00686884 0.311711712 0.0283593 0.854365785 0.926552 0.720720721 -1
biological_process regulation of catenin import into nucleus GO:0035412 16517 20 1.317473224 0.00693442 0.021621622 0.028337 1.04371491 0.367388 0.401801802 -1
biological_process response to lipopolysaccharide GO:0032496 16323 214 1.096458921 0.00694588 0.027027027 0.0283103 1.050374022 0.0994455 0.185585586 0.262792
molecular_function transcription coactivator activity GO:0003713 16687 174 1.107094535 0.00695559 0.025225225 0.0512773 1.141273292 0.000588039 0.007207207 0
biological_process regulation of response to external stimulus GO:0032101 16222 315 1.079184375 0.00699307 0.014414414 0.0282865 1.064948714 0.0219074 0.036036036 0.127981
biological_process organophosphate catabolic process GO:0046434 15924 613 1.056203694 0.00702334 0.153153153 0.0282614 1.043025241 0.0300455 0.135135135 0.144327
biological_process non-canonical Wnt receptor signaling pathway GO:0035567 16500 37 1.232811084 0.00703288 0.05045045 0.0282347 1.167323684 0.0387957 0.187387387 0.162967

cellular_component internal side of plasma membrane GO:0009898 16730 93 1.146533475 0.00705527 0.007207207 0 1.002057252 0.486263 0.491891892 -1
biological_process regulation of skeletal muscle fiber development GO:0048742 16491 46 1.208567155 0.00707297 0.046846847 0.0282105 1.219514311 0.00490695 0.054054054 0.0611894
biological_process positive regulation of endothelial cell proliferation GO:0001938 16492 45 1.210826225 0.00708488 0.037837838 0.028184 1.248901626 0.00189011 0.055855856 0.0477502
biological_process chromatin organization GO:0006325 16035 502 1.062239037 0.0070871 0.21981982 0.0281569 1.098685463 5.03E-05 0.021621622 0.00318623
molecular_function ion channel binding GO:0044325 16819 42 1.218014233 0.00713676 0.209009009 0.0569943 1.338281917 7.18E-05 0.016216216 0
biological_process regulation of mononuclear cell proliferation GO:0032944 16409 128 1.12452566 0.00714795 0.027027027 0.0290764 1.015477197 0.380417 0.427027027 -1
biological_process endocardial cushion development GO:0003197 16512 25 1.282297149 0.00720991 0.032432432 0.0290535 1.115567851 0.158273 0.245045045 0.348674
biological_process positive regulation of lipid kinase activity GO:0090218 16516 21 1.307907056 0.00723244 0.018018018 0.0299658 1.214885769 0.0439404 0.171171171 0.175053
biological_process response to molecule of bacterial origin GO:0002237 16308 229 1.092604437 0.0072591 0.023423423 0.0299392 1.048244364 0.101455 0.198198198 0.262882
cellular_component ionotropic glutamate receptor complex GO:0008328 16794 29 1.261777778 0.00726563 0.156756757 0 1.2686399 0.00607225 0.127927928 0
biological_process anatomical structure homeostasis GO:0060249 16386 151 1.114122569 0.00734201 0.021621622 0.0308527 1.079836577 0.0439187 0.18018018 0.175175
molecular_function metal ion binding GO:0046872 13368 3493 1.021224014 0.00734232 0.336936937 0.0566776 1.037489166 8.17E-06 0.234234234 0
biological_process ribose phosphate metabolic process GO:0019693 15812 725 1.051160066 0.00734557 0.151351351 0.0308233 1.051203436 0.00730369 0.084684685 0.0748783
biological_process guanosine-containing compound metabolic process GO:1901068 16084 453 1.065263094 0.00735357 0.122522523 0.0307943 1.059704935 0.0128172 0.104504505 0.0963044
molecular_function extracellular matrix binding GO:0050840 16826 35 1.23723752 0.0074761 0.082882883 0.05635 1.370731345 7.15E-05 0.018018018 0
biological_process cAMP metabolic process GO:0046058 16455 82 1.154761973 0.00747911 0.097297297 0.031707 1.208251675 0.000529334 0.025225225 0.0280519
biological_process regulation of nucleotide biosynthetic process GO:0030808 16463 74 1.162836052 0.00751505 0.027027027 0.0316494 1.136364578 0.0208581 0.063063063 0.12569
biological_process regulation of purine nucleotide biosynthetic process GO:1900371 16463 74 1.162836052 0.00751505 0.027027027 0.0316494 1.136364578 0.0208581 0.063063063 0.12569
biological_process positive regulation of protein catabolic process GO:0045732 16460 77 1.159579663 0.00752715 0.014414414 0.0316202 1.171980896 0.00439651 0.023423423 0.0575085
molecular_function substrate-specific transmembrane transporter activity GO:0022891 16078 783 1.048877187 0.00763429 0.190990991 0.0560309 1.006719902 0.369378 0.437837838 -1
biological_process regulation of cytokine production GO:0001817 16231 306 1.079288597 0.00765714 0.037837838 0.0325281 1.004688913 0.443038 0.446846847 -1
biological_process synaptic vesicle localization GO:0097479 16470 67 1.170576219 0.00769107 0.09009009 0.0325001 1.094046651 0.0907703 0.23963964 0.250867
biological_process regulation of chemokine production GO:0032642 16494 43 1.213063723 0.00769429 0.025225225 0.0324694 0.977270532 0.60201 0.632432432 -1
biological_process protein depolymerization GO:0051261 16483 54 1.190024232 0.00770535 0.030630631 0.0324394 1.211696054 0.00347869 0.021621622 0.0569148
biological_process cardiac muscle hypertrophy GO:0003300 16512 25 1.279278636 0.00775024 0.027027027 0.0323818 1.023271016 0.420099 0.428828829 -1
biological_process striated muscle hypertrophy GO:0014897 16512 25 1.279278636 0.00775024 0.027027027 0.0323818 1.023271016 0.420099 0.428828829 -1
biological_process stem cell proliferation GO:0072089 16430 107 1.134643552 0.00775781 0.072072072 0.0323516 1.170709012 0.00107597 0.120720721 0.0407132
biological_process cortical cytoskeleton organization GO:0030865 16515 22 1.297654889 0.00776483 0.097297297 0.0323215 1.367285392 0.00141392 0.030630631 0.043573
biological_process response to cAMP GO:0051591 16467 70 1.166576088 0.00778062 0.05045045 0.0322923 1.070267699 0.153768 0.273873874 0.345446
molecular_function glycosaminoglycan binding GO:0005539 16733 128 1.122976938 0.00778117 0.10990991 0.0557133 1.02410441 0.317696 0.401801802 -1
biological_process histone deacetylation GO:0016575 16491 46 1.205630561 0.00778184 0.018018018 0.0322617 1.097136982 0.126588 0.165765766 0.302712
biological_process glial cell proliferation GO:0014009 16517 20 1.311867933 0.00782028 0.091891892 0.0322346 1.114957134 0.186473 0.273873874 0.381049
biological_process respiratory gaseous exchange GO:0007585 16498 39 1.223194777 0.00782268 0.093693694 0.0322043 1.231926832 0.0060084 0.133333333 0.0651764
biological_process regulation of mesenchymal cell proliferation GO:0010464 16500 37 1.229009834 0.00785714 0.003603604 0.032177 1.254961618 0.00358099 0.066666667 0.0590527
biological_process ventricular septum development GO:0003281 16499 38 1.225943047 0.00786327 0.07027027 0.0321471 1.263149349 0.00245467 0.088288288 0.050267
biological_process glycosylation GO:0070085 16339 198 1.098453368 0.00788981 0.046846847 0.0321191 1.109728326 0.00356762 0.072072072 0.0592241
molecular_function sulfotransferase activity GO:0008146 16811 50 1.196674945 0.00792409 0.061261261 0.0611772 0.923025143 0.827465 0.736936937 -1
biological_process phospholipase C-activating G-protein coupled receptor signaling pathway GO:0007200 16492 45 1.207219704 0.00795511 0.054054054 0.0320947 1.015369994 0.429056 0.378378378 -1
biological_process ovulation cycle GO:0042698 16431 106 1.134663331 0.00799552 0.084684685 0.0320681 1.013197669 0.4067 0.43963964 -1
biological_process cellular calcium ion homeostasis GO:0006874 16328 209 1.09549431 0.00805459 0.158558559 0.0320431 1.082642902 0.0186468 0.181981982 0.115903
biological_process organic hydroxy compound transport GO:0015850 16421 116 1.128366422 0.0081301 0.104504505 0.0320197 1.113635409 0.0166975 0.100900901 0.11236
biological_process activation of innate immune response GO:0002218 16473 64 1.173048541 0.00814194 0.012612613 0.0319907 0.973129509 0.64547 0.571171171 -1
biological_process regulation of actin filament bundle assembly GO:0032231 16493 44 1.208614477 0.00819746 0.041441441 0.0319655 1.040551936 0.320434 0.396396396 -1
molecular_function protein self-association GO:0043621 16826 35 1.233852053 0.00822429 0.016216216 0.0665507 1.303618436 0.000921398 0.003603604 0
molecular_function SNARE binding GO:0000149 16816 45 1.206102592 0.00824368 0.057657658 0.0661549 1.020035182 0.407848 0.437837838 -1
biological_process artery morphogenesis GO:0048844 16498 39 1.221405574 0.008249 0.052252252 0.0319401 1.175918882 0.0283835 0.183783784 0.14241
biological_process branching involved in mammary gland duct morphogenesis GO:0060444 16512 25 1.276492317 0.0082803 0.014414414 0.0319129 1.287086136 0.0064207 0.061261261 0.0678683
biological_process organic hydroxy compound metabolic process GO:1901615 16220 317 1.076900175 0.00832182 0.068468468 0.0327938 1.011607255 0.358929 0.374774775 -1
biological_process female gonad development GO:0008585 16441 96 1.140674759 0.00832636 0.05045045 0.0327635 1.087711962 0.0677403 0.104504505 0.218413
molecular_function binding, bridging GO:0060090 16785 76 1.157961026 0.00841042 0.005405405 0.065797 1.159953985 0.00774399 0.066666667 0
biological_process positive regulation of branching involved in ureteric bud morphogenesis GO:0090190 16517 20 1.308100838 0.00847021 0.016216216 0.0327459 1.141955651 0.135616 0.18018018 0.318388
biological_process organophosphate metabolic process GO:0019637 15396 1141 1.039358376 0.00850832 0.183783784 0.0327188 1.022695769 0.0844085 0.216216216 0.243914
biological_process mesoderm development GO:0007498 16453 84 1.149859265 0.00853939 0.032432432 0.032691 1.127731221 0.0210348 0.09009009 0.126896
biological_process excretion GO:0007588 16505 32 1.243065552 0.0085659 0.036036036 0.0326629 1.079918017 0.21659 0.212612613 0.416328
biological_process response to estrogen stimulus GO:0043627 16371 166 1.106283907 0.00856919 0.091891892 0.0326328 1.042560427 0.169922 0.281081081 0.362641
biological_process ribonucleoside triphosphate catabolic process GO:0009203 16037 500 1.060569483 0.00860707 0.16036036 0.0326058 1.067012847 0.00420132 0.095495495 0.0581133
biological_process glucose import GO:0046323 16498 39 1.219883046 0.00862771 0.09009009 0.0325773 1.068300019 0.229766 0.255855856 0.428365
biological_process regulation of fibroblast growth factor receptor signaling pathway GO:0040036 16513 24 1.280187254 0.00867491 0.030630631 0.0334502 1.242249248 0.0198406 0.037837838 0.123474
biological_process negative regulation of immune effector process GO:0002698 16481 56 1.183095241 0.00872182 0.014414414 0.0334235 0.999228039 0.504021 0.502702703 -1
cellular_component voltage-gated calcium channel complex GO:0005891 16799 24 1.279943032 0.00872384 0.021621622 0.0236906 1.35217619 0.00139256 0.027027027 0
biological_process negative regulation of cellular response to growth factor stimulus GO:0090288 16476 61 1.175371502 0.00873237 0.052252252 0.0333934 1.242103284 0.000516808 0.041441441 0.0239931
biological_process regulation of organ growth GO:0046620 16482 55 1.184625567 0.00876214 0.027027027 0.0333652 1.083808382 0.140449 0.227027027 0.328604
biological_process regulation of response to cytokine stimulus GO:0060759 16489 48 1.19766491 0.00876407 0.012612613 0.0333345 1.099809142 0.115181 0.181981982 0.283724
biological_process regulation of ion transport GO:0043269 16278 259 1.08447455 0.00881587 0.27027027 0.0333084 1.098006085 0.00294754 0.145945946 0.0577004
biological_process regulation of glucose import GO:0046324 16502 35 1.231308607 0.00882853 0.059459459 0.0332788 1.053580534 0.291303 0.282882883 -1
biological_process autonomic nervous system development GO:0048483 16507 30 1.249776382 0.00885198 0.003603604 0.0332502 1.268412313 0.00540605 0.028828829 0.0628394
biological_process regulation of innate immune response GO:0045088 16429 108 1.131102496 0.0089509 0.014414414 0.03412 0.992579308 0.553332 0.551351351 -1
biological_process nucleoside phosphate catabolic process GO:1901292 15967 570 1.056120936 0.009095 0.156756757 0.0341021 1.057478791 0.00778558 0.095495495 0.0768415
biological_process actomyosin structure organization GO:0031032 16492 45 1.202809644 0.00914592 0.113513514 0.0340754 1.171737666 0.0228512 0.2 0.128932
biological_process positive regulation of growth GO:0045927 16407 130 1.118965166 0.00916891 0.147747748 0.0340462 1.089968912 0.0372343 0.192792793 0.161671
biological_process cardiac muscle cell proliferation GO:0060038 16500 37 1.223580877 0.00918136 0.012612613 0.034016 1.068625191 0.234598 0.344144144 0.433655
biological_process negative regulation of developmental growth GO:0048640 16514 23 1.28362511 0.00919622 0.079279279 0.0339862 1.256131026 0.0166241 0.115315315 0.111584
biological_process adenylate cyclase-activating G-protein coupled receptor signaling pathway GO:0007189 16498 39 1.217681426 0.00920228 0.052252252 0.0339555 1.106784941 0.123759 0.252252252 0.299505
biological_process hemostasis GO:0007599 16432 105 1.132373071 0.00921441 0.077477477 0.0339255 1.041141607 0.231941 0.154954955 0.430981
biological_process response to exogenous dsRNA GO:0043330 16514 23 1.283488402 0.00922441 0.032432432 0.0338954 0.922148102 0.74125 0.754954955 -1
biological_process regulation of cytokine production involved in immune response GO:0002718 16504 33 1.236407311 0.00927168 0.055855856 0.0338687 0.997976752 0.508059 0.547747748 -1
biological_process alcohol metabolic process GO:0006066 16292 245 1.086184836 0.00928691 0.073873874 0.0338391 1.017514064 0.316237 0.340540541 -1
biological_process regulation of cyclic nucleotide biosynthetic process GO:0030802 16464 73 1.15871346 0.0092876 0.023423423 0.0338083 1.135903318 0.0219192 0.064864865 0.127868
biological_process innate immune response-activating signal transduction GO:0002758 16481 56 1.18128555 0.0092932 0.012612613 0.0337779 1.03021306 0.347446 0.414414414 -1
biological_process ceramide metabolic process GO:0006672 16484 53 1.186289602 0.00931625 0.01981982 0.0337492 0.977760582 0.610623 0.668468468 -1
molecular_function ion transmembrane transporter activity GO:0015075 16131 730 1.049152286 0.00934377 0.212612613 0.071155 1.006035125 0.386394 0.45045045 -1

molecular_function protein kinase A binding GO:0051018 16834 27 1.260604312 0.00945345 0.072072072 0.0707617 1.373872438 0.000379098 0.023423423 0
biological_process leukocyte migration GO:0050900 16392 145 1.112050756 0.00945473 0.057657658 0.0337311 1.1320841 0.00282939 0.003603604 0.0536621
biological_process organ regeneration GO:0031100 16473 64 1.168812071 0.00954781 0.032432432 0.0337089 1.05487334 0.223094 0.245045045 0.421809
biological_process cellular component biogenesis GO:0044085 15040 1497 1.033343534 0.00957428 0.046846847 0.0345594 0.998412429 0.544438 0.563963964 -1
biological_process cell fate specification GO:0001708 16483 54 1.183670718 0.00960117 0.03963964 0.0345305 1.058855624 0.226537 0.156756757 0.424222
biological_process positive regulation of cytoskeleton organization GO:0051495 16442 95 1.138288169 0.00960826 0.034234234 0.0344999 1.03732864 0.26371 0.306306306 0.477416
molecular_function transporter activity GO:0005215 15793 1068 1.03998064 0.00968443 0.21981982 0.0704015 1.009484107 0.289559 0.407207207 -1
biological_process cardiac muscle contraction GO:0060048 16479 58 1.176954787 0.00968575 0.018018018 0.0344758 1.176977723 0.0096779 0.037837838 0.0782286
biological_process alcohol biosynthetic process GO:0046165 16431 106 1.130549293 0.00975819 0.046846847 0.0344512 0.99044154 0.567918 0.574774775 -1
biological_process lens development in camera-type eye GO:0002088 16489 48 1.194210732 0.00979979 0.126126126 0.0344239 1.222725964 0.00371849 0.111711712 0.0585692
biological_process regulation of cell-matrix adhesion GO:0001952 16489 48 1.193928553 0.00988894 0.124324324 0.0352743 1.259893016 0.000894233 0.075675676 0.0361197
biological_process positive regulation of phosphatidylinositol 3-kinase activity GO:0043552 16517 20 1.300669444 0.00989254 0.023423423 0.0352428 1.23259569 0.0357123 0.167567568 0.157325
biological_process regulation of cardiac muscle contraction GO:0055117 16501 36 1.223983174 0.00989647 0.064864865 0.0352113 1.247733269 0.00497814 0.036036036 0.0609583
biological_process regulation of cell growth GO:0001558 16297 240 1.086118404 0.00996353 0.09009009 0.0351859 1.089056093 0.00803902 0.084684685 0.0770977
biological_process positive regulation of T cell mediated immunity GO:0002711 16509 28 1.25368399 0.00998169 0.007207207 0.0351559 1.010943521 0.460039 0.49009009 -1
biological_process chromatin modification GO:0016568 16133 404 1.065982393 0.0100185 0.27027027 0.0351277 1.145873674 1.36E-07 0.030630631 0
molecular_function divalent inorganic cation transmembrane transporter activity GO:0072509 16718 143 1.111798415 0.0100195 0.205405405 0.0700694 1.143640629 0.00140455 0.140540541 0
biological_process negative regulation of multi-organism process GO:0043901 16497 40 1.211734574 0.0101096 0.091891892 0.0359724 1.048035277 0.299167 0.254054054 -1
biological_process monosaccharide metabolic process GO:0005996 16325 212 1.091395196 0.0101754 0.072072072 0.0359464 0.996268049 0.537782 0.535135135 -1
biological_process negative regulation of viral reproduction GO:0048525 16515 22 1.284918339 0.0102725 0.052252252 0.0359234 1.0999003 0.208365 0.178378378 0.405558
biological_process regulation of lymphocyte proliferation GO:0050670 16410 127 1.118087278 0.0103387 0.028828829 0.0358975 1.017654917 0.364746 0.418018018 -1
biological_process positive regulation of leukocyte proliferation GO:0070665 16448 89 1.141193088 0.0103519 0.03963964 0.0358666 1.074615519 0.110761 0.187387387 0.276229
biological_process interleukin-8 production GO:0032637 16504 33 1.232218596 0.010365 0.054054054 0.0358357 0.943146006 0.714412 0.700900901 -1
biological_process purine ribonucleoside triphosphate catabolic process GO:0009207 16038 499 1.058792994 0.0104496 0.165765766 0.0358117 1.065859999 0.00483428 0.095495495 0.0613382
biological_process second-messenger-mediated signaling GO:0019932 16420 117 1.122815416 0.0104663 0.136936937 0.0357812 1.104789013 0.0244108 0.241441441 0.135341
biological_process phospholipid metabolic process GO:0006644 16308 229 1.087439657 0.0105043 0.156756757 0.0357529 1.035955568 0.171342 0.295495495 0.364426
biological_process regulation of striated muscle cell differentiation GO:0051153 16469 68 1.161242136 0.0105065 0.072072072 0.0357211 1.191694386 0.00303844 0.052252252 0.0571012
biological_process cardiac atrium development GO:0003230 16513 24 1.271510239 0.0105685 0.032432432 0.0374131 1.220889279 0.0303503 0.091891892 0.146098
biological_process regulation of cAMP biosynthetic process GO:0030817 16476 61 1.169965157 0.0106253 0.036036036 0.0373854 1.178493979 0.0077796 0.03963964 0.0769337
biological_process synaptic vesicle exocytosis GO:0016079 16509 28 1.25094138 0.0106711 0.054054054 0.0373567 1.199337111 0.0337371 0.124324324 0.153131
biological_process cellular response to extracellular stimulus GO:0031668 16385 152 1.107182669 0.010742 0.072072072 0.0407409 1.043883263 0.173279 0.227027027 0.366615
biological_process protein glycosylation GO:0006486 16359 178 1.098930049 0.0107658 0.09009009 0.0406714 1.117294354 0.00321282 0.064864865 0.0566221
biological_process macromolecule glycosylation GO:0043413 16359 178 1.098930049 0.0107658 0.09009009 0.0406714 1.117294354 0.00321282 0.064864865 0.0566221
cellular_component lytic vacuole GO:0000323 16570 253 1.082681262 0.0108595 0.108108108 0.0234727 1.042901817 0.11685 0.259459459 0.201234
cellular_component lysosome GO:0005764 16570 253 1.082681262 0.0108595 0.108108108 0.0234727 1.042901817 0.11685 0.259459459 0.201234
cellular_component membrane coat GO:0030117 16751 72 1.155643023 0.0109403 0.10990991 0.0231166 1.179857782 0.00403543 0.03963964 0
cellular_component coated membrane GO:0048475 16751 72 1.155643023 0.0109403 0.10990991 0.0231166 1.179857782 0.00403543 0.03963964 0
biological_process cellular response to amino acid stimulus GO:0071230 16501 36 1.220247656 0.0109705 0.021621622 0.0406574 1.018492779 0.423736 0.41981982 -1
biological_process adipose tissue development GO:0060612 16512 25 1.264234446 0.0110083 0.068468468 0.0406255 1.106744506 0.177455 0.25045045 0.371598
biological_process nucleoside triphosphate catabolic process GO:0009143 16029 508 1.057722639 0.0110456 0.169369369 0.0405936 1.066233251 0.00431735 0.086486486 0.0576512
biological_process regulation of multicellular organism growth GO:0040014 16458 79 1.148253099 0.0110747 0.09009009 0.0405609 1.139169271 0.0158722 0.063063063 0.108498
biological_process interferon-beta production GO:0032608 16512 25 1.263861969 0.0111022 0.014414414 0.0405281 1.119824728 0.149524 0.201801802 0.340523
biological_process blood coagulation GO:0007596 16433 104 1.129035248 0.0111154 0.095495495 0.0404938 1.04192904 0.228769 0.14954955 0.427437
biological_process regulation of glycoprotein biosynthetic process GO:0010559 16511 26 1.258546268 0.0111497 0.005405405 0.0404618 1.181618285 0.0542177 0.097297297 0.192993
biological_process cellular response to external stimulus GO:0071496 16335 202 1.092243632 0.0111659 0.093693694 0.040428 1.045013514 0.132456 0.234234234 0.312826
biological_process tissue remodeling GO:0048771 16421 116 1.121913133 0.0112379 0.097297297 0.0412421 1.112092458 0.0179299 0.16036036 0.115083
cellular_component transcriptional repressor complex GO:0017053 16766 57 1.174225422 0.0112385 0.131531532 0.0303808 1.269673914 0.000205813 0.088288288 0
biological_process membrane organization GO:0061024 16229 308 1.074282708 0.0113245 0.091891892 0.0412152 1.075044435 0.0106495 0.111711712 0.0847873
biological_process protein oligomerization GO:0051259 16206 331 1.071592227 0.0113375 0.043243243 0.0411805 1.009316693 0.383419 0.432432432 -1
biological_process embryonic limb morphogenesis GO:0030326 16438 99 1.131831154 0.0113406 0.046846847 0.0411088 1.134369547 0.0100992 0.102702703 0.0804081
biological_process embryonic appendage morphogenesis GO:0035113 16438 99 1.131831154 0.0113406 0.046846847 0.0411088 1.134369547 0.0100992 0.102702703 0.0804081
biological_process cytokine metabolic process GO:0042107 16452 85 1.142278616 0.0113673 0.05045045 0.0410757 0.984850993 0.595844 0.583783784 -1
biological_process ephrin receptor signaling pathway GO:0048013 16505 32 1.232052999 0.0114272 0.043243243 0.0410463 1.302395021 0.00150971 0.063063063 0.0428943
cellular_component cortical actin cytoskeleton GO:0030864 16789 34 1.224931429 0.0114818 0.102702703 0.0301732 1.364245789 0.000115475 0.034234234 0
biological_process regulation of lipid metabolic process GO:0019216 16369 168 1.100744221 0.0115053 0.131531532 0.0410187 1.063816158 0.0749419 0.259459459 0.228631
biological_process sensory perception of sound GO:0007605 16430 107 1.126446034 0.0115184 0.100900901 0.0409844 1.0981147 0.0389029 0.207207207 0.164046
biological_process regulation of lipid kinase activity GO:0043550 16508 29 1.243301686 0.0115623 0.034234234 0.0417882 1.157000676 0.0713678 0.227027027 0.223388
biological_process response to extracellular stimulus GO:0009991 16203 334 1.071019093 0.0115702 0.106306306 0.0417528 1.020060254 0.260628 0.322522523 0.473307
biological_process regulation of protein complex disassembly GO:0043244 16486 51 1.183187509 0.0116216 0.023423423 0.0425542 1.158995965 0.0244359 0.066666667 0.134992
biological_process myeloid cell development GO:0061515 16513 24 1.267070953 0.0116698 0.001801802 0.0433528 1.194565976 0.0492529 0.025225225 0.182715
biological_process negative regulation of T cell proliferation GO:0042130 16503 34 1.2241047 0.0117353 0.01981982 0.0433225 0.983300192 0.567058 0.563963964 -1
biological_process cellular metal ion homeostasis GO:0006875 16290 247 1.082442606 0.011875 0.120720721 0.0433006 1.049276332 0.0882854 0.225225225 0.248045
biological_process cAMP-mediated signaling GO:0019933 16509 28 1.246406354 0.011902 0.064864865 0.0432661 1.113974977 0.147905 0.207207207 0.337431
cellular_component recycling endosome GO:0055037 16753 70 1.155550515 0.0119451 0.081081081 0.0299874 1.025537199 0.355381 0.394594595 -1
biological_process immune effector process GO:0002252 16201 336 1.070391944 0.0119777 0.073873874 0.0432371 0.963610095 0.878477 0.897297297 -1
biological_process response to epidermal growth factor stimulus GO:0070849 16517 20 1.291188217 0.0120068 0.014414414 0.043203 1.001762903 0.494569 0.466666667 -1
biological_process leukocyte activation GO:0045321 16086 451 1.06051617 0.012007 0.115315315 0.0431657 1.099145334 0.000108816 0.005405405 0.00845841
biological_process cAMP biosynthetic process GO:0006171 16474 63 1.163723005 0.0120629 0.03963964 0.0431346 1.18970846 0.00448686 0.028828829 0.057289
biological_process sensory perception of pain GO:0019233 16459 78 1.147014104 0.0120917 0.115315315 0.0431006 1.09444192 0.0737975 0.230630631 0.227869
molecular_function UDP-glycosyltransferase activity GO:0008194 16758 103 1.127762001 0.0121363 0.007207207 0.0809034 1.10441311 0.032805 0.046846847 0.0517591
biological_process regulation of body fluid levels GO:0050878 16339 198 1.091863075 0.0121484 0.12972973 0.0438934 1.104762703 0.00510326 0.010810811 0.0605785
molecular_function phosphatidylinositol 3-kinase binding GO:0043548 16837 24 1.265004961 0.0122155 0.055855856 0.0804595 1.171041156 0.0731977 0.147747748 0.116042
biological_process striated muscle cell proliferation GO:0014855 16498 39 1.207597391 0.0122827 0.012612613 0.0438707 1.110760259 0.115176 0.225225225 0.283883
biological_process camera-type eye development GO:0043010 16320 217 1.087503247 0.0123087 0.081081081 0.0438359 1.05824502 0.0673343 0.261261261 0.218674
cellular_component vacuolar part GO:0044437 16678 145 1.107220166 0.0123542 0.061261261 0.0297993 1.042099696 0.188918 0.252252252 0.313312
biological_process microtubule polymerization or depolymerization GO:0031109 16487 50 1.183087726 0.0123597 0.048648649 0.0446245 1.179082392 0.0140235 0.046846847 0.100581
biological_process response to nutrient levels GO:0031667 16232 305 1.073541102 0.0123728 0.095495495 0.0445877 1.033771656 0.151252 0.252252252 0.34191
biological_process negative regulation of cell activation GO:0050866 16439 98 1.130561447 0.0123739 0.052252252 0.0445496 0.984544738 0.604829 0.563963964 -1
biological_process purine ribonucleotide catabolic process GO:0009154 16014 523 1.055765452 0.0123961 0.2 0.044476 1.065033205 0.00442628 0.095495495 0.0573547
biological_process ribonucleotide catabolic process GO:0009261 16014 523 1.055765452 0.0123961 0.2 0.044476 1.065033205 0.00442628 0.095495495 0.0573547
biological_process nucleotide catabolic process GO:0009166 15979 558 1.053883531 0.0124577 0.169369369 0.0444449 1.056141833 0.00972702 0.106306306 0.0800823

biological_process intracellular transport GO:0046907 15539 998 1.03966894 0.0125756 0.221621622 0.0444202 1.030607372 0.0420319 0.209009009 0.170181
biological_process negative regulation of angiogenesis GO:0016525 16486 51 1.18016653 0.012808 0.122522523 0.0444085 1.110425547 0.085659 0.151351351 0.243735
biological_process carbohydrate derivative catabolic process GO:1901136 15953 584 1.052370223 0.0128178 0.16036036 0.0451864 1.053712094 0.011041 0.113513514 0.0853472
biological_process post-embryonic development GO:0009791 16442 95 1.131607519 0.0129338 0.118918919 0.0451612 1.206792829 0.000231616 0.063063063 0.0148768
biological_process cyclic-nucleotide-mediated signaling GO:0019935 16504 33 1.223529671 0.0129963 0.079279279 0.0451299 1.125745364 0.105215 0.201801802 0.267264
biological_process positive regulation of sequence-specific DNA binding transcription factor activity GO:0051091 16389 148 1.105181581 0.0130001 0.030630631 0.0450919 1.086281556 0.0339029 0.140540541 0.153627
biological_process positive regulation of autophagy GO:0010508 16517 20 1.287191348 0.0130094 0.073873874 0.0458657 1.189337596 0.0711227 0.169369369 0.221903
biological_process negative regulation of transmembrane receptor protein serine/threonine kinase signaling pathway GO:0090101 16466 71 1.152030987 0.0130878 0.066666667 0.0458359 1.243193087 0.000187582 0.028828829 0.0129721
biological_process cyclic purine nucleotide metabolic process GO:0052652 16452 85 1.138694701 0.0131929 0.057657658 0.0458091 1.141191633 0.0118963 0.063063063 0.0899577
biological_process homotypic cell-cell adhesion GO:0034109 16501 36 1.213132706 0.0132992 0.054054054 0.0457826 1.185059219 0.0270966 0.091891892 0.139595
biological_process synaptic vesicle transport GO:0048489 16473 64 1.159649431 0.01333 0.09009009 0.0457086 1.091142205 0.102877 0.237837838 0.264185
biological_process establishment of synaptic vesicle localization GO:0097480 16473 64 1.159649431 0.01333 0.09009009 0.0457086 1.091142205 0.102877 0.237837838 0.264185
biological_process negative regulation of BMP signaling pathway GO:0030514 16505 32 1.225654834 0.0134451 0.066666667 0.0456832 1.236251677 0.0102508 0.052252252 0.0830952
biological_process positive regulation of innate immune response GO:0045089 16454 83 1.139836538 0.0134786 0.003603604 0.0456484 0.967645452 0.695643 0.601801802 -1
biological_process embryonic hindlimb morphogenesis GO:0035116 16511 26 1.250271591 0.0134803 0.01981982 0.04561 1.218712466 0.0266096 0.127927928 0.138415
biological_process negative regulation of transmission of nerve impulse GO:0051970 16501 36 1.212501161 0.0135251 0.113513514 0.0455767 0.965372516 0.640694 0.553153153 -1
biological_process branching involved in ureteric bud morphogenesis GO:0001658 16486 51 1.178324065 0.0135818 0.043243243 0.046349 1.308062543 6.77E-05 0.009009009 0.00301387
biological_process mammary gland development GO:0030879 16406 131 1.110986575 0.0135908 0.122522523 0.046311 1.132911634 0.00408058 0.136936937 0.0586656
biological_process cardiac atrium morphogenesis GO:0003209 16516 21 1.278076667 0.013602 0.046846847 0.0462734 1.258917265 0.0198718 0.061261261 0.125005
molecular_function transferase activity, transferring hexosyl groups GO:0016758 16700 161 1.100007998 0.0136071 0.016216216 0.0803659 1.084699208 0.0307148 0.108108108 0.0530784
biological_process cyclic nucleotide biosynthetic process GO:0009190 16448 89 1.134558023 0.01374 0.055855856 0.0470518 1.123970183 0.0211198 0.084684685 0.126692
biological_process negative regulation of intracellular transport GO:0032387 16472 65 1.157466833 0.013789 0.009009009 0.0478175 1.082872877 0.123124 0.178378378 0.299358
biological_process myeloid cell homeostasis GO:0002262 16435 102 1.125511472 0.0138204 0.027027027 0.0477811 1.168750122 0.00153282 0.016216216 0.0443698
biological_process negative regulation of endopeptidase activity GO:0010951 16444 93 1.131445576 0.0138409 0.077477477 0.0477435 0.930376533 0.878258 0.917117117 -1
biological_process cytosolic calcium ion homeostasis GO:0051480 16385 152 1.102576038 0.0138861 0.127927928 0.0477089 1.038910647 0.201943 0.304504505 0.398451
biological_process coagulation GO:0050817 16430 107 1.122385138 0.0139099 0.102702703 0.0476719 1.056647898 0.154294 0.068468468 0.345348
biological_process positive regulation of organelle organization GO:0010638 16341 196 1.090164552 0.0139252 0.064864865 0.0476338 1.078348806 0.0279926 0.122522523 0.141166
biological_process palate development GO:0060021 16473 64 1.15834939 0.0139599 0.072072072 0.0475982 1.128622299 0.0370747 0.214414414 0.160426
biological_process cell adhesion mediated by integrin GO:0033627 16498 39 1.202989495 0.013965 0.023423423 0.0475591 1.268200833 0.00183917 0.030630631 0.0480657
biological_process sphingolipid metabolic process GO:0006665 16457 80 1.141532382 0.0139771 0.025225225 0.0483142 1.050045805 0.218536 0.10990991 0.418218
biological_process regulation of T cell differentiation GO:0045580 16462 75 1.145814253 0.014183 0.054054054 0.0490905 1.124600815 0.0305167 0.072072072 0.146504
biological_process hair follicle development GO:0001942 16465 72 1.148513634 0.0143545 0.167567568 0.051352 1.149749848 0.0137036 0.131531532 0.0991442
biological_process molting cycle process GO:0022404 16465 72 1.148513634 0.0143545 0.167567568 0.051352 1.149749848 0.0137036 0.131531532 0.0991442
biological_process hair cycle process GO:0022405 16465 72 1.148513634 0.0143545 0.167567568 0.051352 1.149749848 0.0137036 0.131531532 0.0991442
biological_process response to purine-containing compound GO:0014074 16429 108 1.121047057 0.0144113 0.03963964 0.0513167 1.086492404 0.0591506 0.167567568 0.202712
biological_process negative regulation of Ras protein signal transduction GO:0046580 16505 32 1.222771314 0.0144508 0.034234234 0.0512792 1.181774685 0.037314 0.057657658 0.161449
biological_process feeding behavior GO:0007631 16467 70 1.150446946 0.0144514 0.115315315 0.0512369 1.106046889 0.0617791 0.122522523 0.208637
biological_process response to fatty acid GO:0070542 16500 37 1.207068482 0.0144792 0.082882883 0.0511981 1.08806615 0.176484 0.201801802 0.370618
biological_process nucleocytoplasmic transport GO:0006913 16182 355 1.066184875 0.0145025 0.079279279 0.0511588 1.045738511 0.0656621 0.136936937 0.218072
biological_process positive regulation of leukocyte chemotaxis GO:0002690 16496 41 1.19596065 0.0147765 0.061261261 0.0534936 1.16102547 0.0368835 0.091891892 0.16048
cellular_component basal part of cell GO:0045178 16791 32 1.221819189 0.0147969 0.045045045 0.0369581 1.135361552 0.0921642 0.218018018 0.147558
biological_process regulation of T cell activation GO:0050863 16374 163 1.097858215 0.0148272 0.041441441 0.0534562 1.095172442 0.0172126 0.082882883 0.11488
biological_process protein complex assembly GO:0006461 15825 712 1.046004435 0.0148763 0.001801802 0.0534187 0.999680935 0.506076 0.511711712 -1
biological_process negative regulation of small GTPase mediated signal transduction GO:0051058 16504 33 1.218193916 0.0148834 0.030630631 0.0533758 1.196572381 0.0251252 0.052252252 0.136162
biological_process fat cell differentiation GO:0045444 16402 135 1.107513646 0.0149082 0.034234234 0.0533352 1.08516325 0.0426423 0.169369369 0.173022
biological_process amino acid transmembrane transport GO:0003333 16517 20 1.280152989 0.0149513 0.059459459 0.053297 1.15836035 0.10984 0.304504505 0.276331
biological_process regulation of steroid biosynthetic process GO:0050810 16495 42 1.193163717 0.0149648 0.027027027 0.0532551 1.026338133 0.383624 0.423423423 -1
biological_process determination of heart left/right asymmetry GO:0061371 16501 36 1.208637992 0.0149807 0.082882883 0.0532136 1.309124075 0.000649844 0.012612613 0.0315743
biological_process purine nucleotide catabolic process GO:0006195 15994 543 1.0528831 0.0149927 0.187387387 0.0531716 1.058237158 0.00842403 0.108108108 0.0771997
biological_process positive regulation of immune effector process GO:0002699 16440 97 1.126840646 0.0149995 0.106306306 0.053129 1.002289838 0.484401 0.502702703 -1
biological_process positive regulation of protein import into nucleus GO:0042307 16482 55 1.168600712 0.0150289 0.045045045 0.0530894 0.996509419 0.517934 0.499099099 -1
biological_process positive regulation of T cell differentiation GO:0045582 16486 51 1.174968739 0.0150949 0.014414414 0.0538269 1.19556546 0.00770156 0.037837838 0.0773843
biological_process regulation of kidney development GO:0090183 16498 39 1.20002196 0.0151506 0.025225225 0.0545608 1.15816639 0.0433705 0.147747748 0.174608
biological_process regulation of the force of heart contraction GO:0002026 16515 22 1.266310993 0.015195 0.145945946 0.0545223 1.128649612 0.14782 0.25045045 0.337563
biological_process regulation of synaptic transmission, GABAergic GO:0032228 16512 25 1.249214442 0.0153901 0.218018018 0.0552722 1.076056292 0.254905 0.315315315 0.465593
biological_process negative regulation of cellular catabolic process GO:0031330 16487 50 1.175976807 0.0154431 0.084684685 0.0560011 1.107445923 0.0937665 0.122522523 0.254613
biological_process cell proliferation in forebrain GO:0021846 16513 24 1.254156209 0.0154576 0.052252252 0.0559576 1.148616092 0.103483 0.263063063 0.264982
biological_process protein complex biogenesis GO:0070271 15824 713 1.045631392 0.0154883 0.001801802 0.0559164 0.999700214 0.505733 0.506306306 -1
biological_process regulation of protein catabolic process GO:0042176 16383 154 1.099855539 0.0155273 0.027027027 0.0558764 1.138672215 0.00137407 0.014414414 0.0436429
biological_process purine-containing compound catabolic process GO:0072523 15987 550 1.052194033 0.015533 0.183783784 0.0558319 1.052965812 0.0143312 0.122522523 0.101183
biological_process regulation of cytokine-mediated signaling pathway GO:0001959 16495 42 1.191813288 0.015548 0.027027027 0.0557888 1.13219858 0.068666 0.183783784 0.221047
biological_process ureteric bud morphogenesis GO:0060675 16480 57 1.164486294 0.0155944 0.030630631 0.05575 1.295109874 5.54E-05 0.010810811 0.00313641
biological_process calcium ion transport GO:0006816 16329 208 1.085626916 0.015681 0.266666667 0.0564784 1.137768079 0.000266857 0.145945946 0.0144506
biological_process organonitrogen compound metabolic process GO:1901564 15062 1475 1.03087428 0.0157091 0.117117117 0.0564367 1.011860995 0.204331 0.322522523 0.401452
biological_process negative regulation of catabolic process GO:0009895 16460 77 1.141192982 0.0157398 0.10990991 0.0563954 1.085341888 0.0967855 0.18018018 0.258284
biological_process molting cycle GO:0042303 16458 79 1.139360622 0.0157552 0.142342342 0.0563067 1.145439469 0.0124041 0.12972973 0.0957297
biological_process hair cycle GO:0042633 16458 79 1.139360622 0.0157552 0.142342342 0.0563067 1.145439469 0.0124041 0.12972973 0.0957297
biological_process eye development GO:0001654 16280 257 1.076830288 0.0157775 0.140540541 0.0562644 1.051867062 0.07332 0.304504505 0.22775
molecular_function RNA polymerase II transcription factor binding GO:0001085 16799 62 1.157283197 0.0158151 0.088288288 0.0804885 1.259829166 0.000192461 0.010810811 0
biological_process response to progesterone stimulus GO:0032570 16506 31 1.222385349 0.0159115 0.016216216 0.0562372 1.011464736 0.45596 0.427027027 -1
biological_process positive regulation of mitosis GO:0045840 16510 27 1.238265704 0.0159304 0.023423423 0.0561496 1.12052077 0.138838 0.210810811 0.325928
biological_process positive regulation of nuclear division GO:0051785 16510 27 1.238265704 0.0159304 0.023423423 0.0561496 1.12052077 0.138838 0.210810811 0.325928
biological_process maintenance of location GO:0051235 16371 166 1.095683969 0.0159371 0.063063063 0.0561054 1.081222884 0.0342568 0.122522523 0.153509
biological_process positive regulation of cytokine biosynthetic process GO:0042108 16487 50 1.174934355 0.0159465 0.046846847 0.0560618 0.996745351 0.515945 0.554954955 -1
biological_process epithelial to mesenchymal transition GO:0001837 16469 68 1.149922357 0.0159471 0.032432432 0.056017 1.034437493 0.311065 0.374774775 -1
molecular_function substrate-specific transporter activity GO:0022892 15976 885 1.040519011 0.0159802 0.214414414 0.0800717 1.011212298 0.276417 0.383783784 0.480224
biological_process glycerophospholipid metabolic process GO:0006650 16363 174 1.093312935 0.0160505 0.142342342 0.0559859 1.053710523 0.108664 0.252252252 0.274169
biological_process cytosolic calcium ion transport GO:0060401 16472 65 1.153103906 0.016089 0.154954955 0.0559463 1.138922999 0.0259615 0.192792793 0.136775
biological_process positive regulation of peptidyl-tyrosine phosphorylation GO:0050731 16432 105 1.120142612 0.0162134 0.028828829 0.0566717 1.113171054 0.0219534 0.136936937 0.127763
biological_process sensory perception of mechanical stimulus GO:0050954 16419 118 1.113248788 0.0162448 0.118918919 0.0566307 1.078649363 0.0687749 0.248648649 0.220948
biological_process positive regulation of mononuclear cell proliferation GO:0032946 16451 86 1.132732605 0.0162763 0.045045045 0.0565898 1.072011077 0.123095 0.169369369 0.299122

biological_process head morphogenesis GO:0060323 16503 34 1.211271468 0.0163421 0.064864865 0.0565535 1.136769005 0.0833773 0.174774775 0.243722
biological_process negative regulation of neurological system process GO:0031645 16495 42 1.189933052 0.0163924 0.142342342 0.0572656 1.034049115 0.350992 0.403603604 -1
molecular_function enhancer binding GO:0035326 16839 22 1.262506065 0.0164199 0.032432432 0.0797306 1.378069913 0.00105774 0.003603604 0
biological_process aminoglycan metabolic process GO:0006022 16453 84 1.133989556 0.0164856 0.030630631 0.0572327 1.08837152 0.0798003 0.162162162 0.236504
biological_process pattern recognition receptor signaling pathway GO:0002221 16484 53 1.168694845 0.0165619 0.016216216 0.057946 1.035439259 0.327241 0.407207207 -1
cellular_component cytoplasmic mRNA processing body GO:0000932 16780 43 1.187293984 0.0165852 0.095495495 0.0368737 1.236990457 0.00351734 0.036036036 0
biological_process somitogenesis GO:0001756 16481 56 1.163760917 0.0167438 0.059459459 0.0579248 1.098622837 0.100194 0.234234234 0.262361
molecular_function hydrolase activity, hydrolyzing O-glycosyl compounds GO:0004553 16776 85 1.132803337 0.0167472 0.032432432 0.0793634 0.983098022 0.606661 0.581981982 -1
cellular_component vacuolar membrane GO:0005774 16683 140 1.103169535 0.0168653 0.073873874 0.0436395 1.039153809 0.210206 0.268468468 0.341696
biological_process microtubule polymerization GO:0046785 16513 24 1.249908402 0.016915 0.127927928 0.0579023 1.164115801 0.081724 0.158558559 0.240349
biological_process glycosaminoglycan metabolic process GO:0030203 16463 74 1.142012523 0.0169742 0.09009009 0.0578644 1.120643157 0.035806 0.113513514 0.156987
biological_process regulation of collagen biosynthetic process GO:0032965 16517 20 1.273537899 0.0169986 0.061261261 0.0578219 0.984844235 0.546776 0.605405405 -1
molecular_function phosphoric ester hydrolase activity GO:0042578 16532 329 1.06680473 0.0170198 0.207207207 0.0789855 1.07720203 0.00715218 0.09009009 0
biological_process bone resorption GO:0045453 16495 42 1.188467447 0.0170775 0.016216216 0.0577869 1.189889861 0.0164122 0.045045045 0.11206
biological_process prostate gland epithelium morphogenesis GO:0060740 16510 27 1.235103503 0.0171016 0.111711712 0.0577444 1.154010533 0.0826881 0.227027027 0.243515
biological_process protein homooligomerization GO:0051260 16321 216 1.082639312 0.017109 0.010810811 0.0576998 0.995544431 0.545468 0.553153153 -1
biological_process cerebral cortex development GO:0021987 16467 70 1.1457668 0.0171366 0.158558559 0.057658 1.096498285 0.0805563 0.254054054 0.238356
biological_process regulation of sodium ion transport GO:0002028 16496 41 1.190497972 0.0172 0.165765766 0.0583643 1.24012516 0.00383293 0.064864865 0.0596266
biological_process purine nucleoside triphosphate catabolic process GO:0009146 16035 502 1.053672476 0.01721 0.189189189 0.0583197 1.064491493 0.00551815 0.102702703 0.0637784
cellular_component tight junction GO:0005923 16737 86 1.131299748 0.0172389 0.156756757 0.0430583 1.154483695 0.00642689 0.156756757 0
cellular_component occluding junction GO:0070160 16737 86 1.131299748 0.0172389 0.156756757 0.0430583 1.154483695 0.00642689 0.156756757 0
cellular_component endocytic vesicle GO:0030139 16729 94 1.125483704 0.0172925 0.048648649 0.0427579 1.04107916 0.24454 0.268468468 0.407122
biological_process regulation of G-protein coupled receptor protein signaling pathway GO:0008277 16435 102 1.120353992 0.0173498 0.165765766 0.0582928 1.04756239 0.20199 0.302702703 0.398286
biological_process regulation of multi-organism process GO:0043900 16417 120 1.110849409 0.0173882 0.05045045 0.0582521 1.010181925 0.423119 0.425225225 -1
biological_process regulation of type I interferon production GO:0032479 16511 26 1.238689834 0.0174413 0.027027027 0.0582135 1.127979401 0.128995 0.181981982 0.307691
cellular_component external encapsulating structure GO:0030312 16800 23 1.253680716 0.0174849 0.151351351 0.0424776 1.202232447 0.0463774 0.209009009 0.040789
biological_process negative regulation of peptidase activity GO:0010466 16438 99 1.121848601 0.0175933 0.086486486 0.0589284 0.949542071 0.808473 0.872072072 -1
biological_process regulation of protein deacetylation GO:0090311 16515 22 1.258868054 0.0176691 0.018018018 0.059631 1.328328151 0.00380218 0.034234234 0.0583342
biological_process regulation of protein depolymerization GO:1901879 16493 44 1.182833545 0.0177154 0.046846847 0.0595907 1.193074457 0.0131681 0.037837838 0.0984419
cellular_component microtubule GO:0005874 16516 307 1.06857641 0.0178421 0.198198198 0.0422199 1.05977093 0.0335706 0.2 0.0352009
biological_process face development GO:0060324 16499 38 1.196431967 0.017876 0.061261261 0.0595662 1.175825448 0.0300908 0.093693694 0.144102
molecular_functionRNA polymerase II core promoter proximal region sequence-specific DNA binding transcription factor activity involved in negative regulation of transcriptionGO:0001078 16832 29 1.224803339 0.0179231 0.001801802 0.0787711 1.238901566 0.0128643 0.115315315 0.012374
molecular_function enhancer sequence-specific DNA binding GO:0001158 16841 20 1.270716031 0.0179422 0.052252252 0.0783352 1.334712039 0.00473981 0.005405405 0
molecular_function phosphoric diester hydrolase activity GO:0008081 16778 83 1.132638023 0.0179436 0.088288288 0.0778997 1.026463524 0.337751 0.387387387 -1
biological_process regulation of transforming growth factor beta receptor signaling pathway GO:0017015 16472 65 1.149888922 0.0179876 0.135135135 0.0595351 1.211273164 0.00155776 0.059459459 0.0442187
biological_process negative regulation of leukocyte proliferation GO:0070664 16491 46 1.17823638 0.018009 0.027027027 0.0594914 0.951598162 0.715476 0.69009009 -1
biological_process tissue homeostasis GO:0001894 16436 101 1.119942309 0.0181204 0.064864865 0.0594603 1.04755672 0.203182 0.257657658 0.399356
biological_process odontogenesis GO:0042476 16448 89 1.127772131 0.0181547 0.095495495 0.0594185 1.223481207 0.000125316 0.059459459 0.0082502
biological_process leukocyte differentiation GO:0002521 16228 309 1.06806646 0.0182189 0.084684685 0.059381 1.116033036 0.000181006 0.014414414 0.0130052
biological_process regulation of Notch signaling pathway GO:0008593 16501 36 1.201009071 0.0182538 0.012612613 0.0593394 1.181290109 0.0296424 0.068468468 0.143347
biological_process nuclear transport GO:0051169 16179 358 1.063016687 0.018405 0.091891892 0.0593139 1.042694369 0.0786132 0.158558559 0.235416
molecular_function receptor signaling protein serine/threonine kinase activity GO:0004702 16814 47 1.175550964 0.0184214 0.055855856 0.0775862 1.15741878 0.0306111 0.064864865 0.0533448
biological_process regulation of CD4-positive, alpha-beta T cell activation GO:2000514 16511 26 1.236061845 0.0184672 0.054054054 0.0600093 1.056800435 0.307832 0.376576577 -1
biological_process B cell receptor signaling pathway GO:0050853 16511 26 1.236052543 0.0184709 0.027027027 0.0599631 0.967583696 0.612781 0.609009009 -1
biological_process astrocyte differentiation GO:0048708 16493 44 1.181310876 0.0184946 0.036036036 0.0599197 1.110229164 0.10238 0.084684685 0.264144
biological_process cellular membrane organization GO:0016044 16234 303 1.068521808 0.0185336 0.108108108 0.0598785 1.076787627 0.00972926 0.104504505 0.0799914
biological_process organic hydroxy compound biosynthetic process GO:1901617 16402 135 1.103177938 0.0185406 0.068468468 0.059833 0.982342469 0.639442 0.616216216 -1
biological_process regulation of stress fiber assembly GO:0051492 16499 38 1.194602044 0.0187547 0.046846847 0.0598161 1.079240548 0.198497 0.25045045 0.393845
biological_process regulation of T cell proliferation GO:0042129 16445 92 1.124774347 0.0188231 0.046846847 0.059779 1.025803006 0.333665 0.412612613 -1
biological_process single organism reproductive process GO:0044702 15913 624 1.047096643 0.0188922 0.102702703 0.0597422 1.057564025 0.00556052 0.167567568 0.06362
biological_process regulation of peptidyl-tyrosine phosphorylation GO:0050730 16397 140 1.100896828 0.0189237 0.066666667 0.0597002 1.086142879 0.0381172 0.14954955 0.16257
biological_process regulation of neuron death GO:1901214 16382 155 1.095747937 0.0190188 0.09009009 0.059667 1.056432681 0.110734 0.216216216 0.276374
biological_process regulation of cAMP metabolic process GO:0030814 16474 63 1.150585349 0.0190323 0.068468468 0.0596227 1.191032975 0.00425297 0.03963964 0.0578798
biological_process trabecula morphogenesis GO:0061383 16505 32 1.211373284 0.0190844 0.041441441 0.0595837 1.074094289 0.233722 0.306306306 0.433226
biological_process positive regulation of cell-cell adhesion GO:0022409 16507 30 1.218260979 0.0191098 0.113513514 0.0595411 1.322719744 0.0010906 0.05045045 0.0406378
biological_process positive regulation of leukocyte differentiation GO:1902107 16449 88 1.127078844 0.0192124 0.054054054 0.0602354 1.185209623 0.00127495 0.014414414 0.0441816
biological_process positive regulation of lipid metabolic process GO:0045834 16458 79 1.134050241 0.019291 0.174774775 0.0601998 1.063533468 0.163446 0.299099099 0.355029
biological_process proteoglycan metabolic process GO:0006029 16487 50 1.168628856 0.0193011 0.136936937 0.060879 1.174673138 0.0160749 0.064864865 0.109119
biological_process regulation of lymphocyte differentiation GO:0045619 16441 96 1.121468927 0.0193485 0.09009009 0.0608387 1.085837485 0.0720174 0.095495495 0.22475
biological_process positive regulation of cell cycle GO:0045787 16439 98 1.120001933 0.0195223 0.093693694 0.0615385 1.087680469 0.0657959 0.203603604 0.218361
cellular_component protein-DNA complex GO:0032993 16709 114 1.111153419 0.0195731 0.383783784 0.0421216 0.91446479 0.943775 0.682882883 -1
molecular_function ligand-dependent nuclear receptor transcription coactivator activity GO:0030374 16823 38 1.192950966 0.0195794 0.064864865 0.0774418 1.276130888 0.00158035 0.001801802 0
biological_process regulation of myoblast differentiation GO:0045661 16512 25 1.237933718 0.0195976 0.043243243 0.0615018 1.165179818 0.0761334 0.140540541 0.230402
biological_process negative regulation of blood pressure GO:0045776 16506 31 1.213525958 0.0196464 0.091891892 0.0614614 1.15539181 0.0668149 0.147747748 0.219033
biological_process camera-type eye morphogenesis GO:0048593 16460 77 1.135268786 0.0196657 0.163963964 0.0614169 1.112536334 0.0432291 0.261261261 0.174458
biological_process sarcomere organization GO:0045214 16514 23 1.247597291 0.0197886 0.036036036 0.061387 1.227280378 0.0294293 0.118918919 0.143152
biological_process ribonucleoside triphosphate metabolic process GO:0009199 15967 570 1.048900963 0.0198027 0.165765766 0.0613419 1.046299821 0.0256855 0.122522523 0.137155
molecular_function Rab GTPase activator activity GO:0005097 16818 43 1.180844983 0.0198592 0.140540541 0.0770837 1.164162353 0.030955 0.156756757 0.0528366
biological_process positive regulation of nucleotide metabolic process GO:0045981 16478 59 1.154226969 0.0199142 0.041441441 0.0612635 1.146618375 0.0253438 0.09009009 0.135762
biological_process positive regulation of purine nucleotide metabolic process GO:1900544 16478 59 1.154226969 0.0199142 0.041441441 0.0612635 1.146618375 0.0253438 0.09009009 0.135762
biological_process positive regulation of vasoconstriction GO:0045907 16514 23 1.247197683 0.0199485 0.066666667 0.0612214 1.028980153 0.404835 0.338738739 -1
biological_process macromolecular complex disassembly GO:0032984 16449 88 1.126123741 0.0199524 0.054054054 0.0611751 1.134321142 0.0143245 0.027027027 0.101285
biological_process positive regulation of transmembrane receptor protein serine/threonine kinase signaling pathway GO:0090100 16473 64 1.147871592 0.0200391 0.115315315 0.0618574 1.116077285 0.0535332 0.156756757 0.190112
biological_process regulation of Rab GTPase activity GO:0032313 16494 43 1.180481852 0.020058 0.135135135 0.0617186 1.159821823 0.0345637 0.153153153 0.152884
biological_process Rab protein signal transduction GO:0032482 16494 43 1.180481852 0.020058 0.135135135 0.0617186 1.159821823 0.0345637 0.153153153 0.152884
biological_process regulation of Rab protein signal transduction GO:0032483 16494 43 1.180481852 0.020058 0.135135135 0.0617186 1.159821823 0.0345637 0.153153153 0.152884
biological_process cell-cell junction assembly GO:0007043 16498 39 1.189432482 0.0201116 0.09009009 0.0616791 1.095603197 0.150264 0.225225225 0.341413
biological_process purine ribonucleoside triphosphate metabolic process GO:0009205 15973 564 1.049012463 0.0201194 0.167567568 0.0616333 1.044871974 0.0301928 0.12972973 0.144734
biological_process positive regulation of response to external stimulus GO:0032103 16413 124 1.105912246 0.0201591 0.041441441 0.0615919 1.090639451 0.0396546 0.037837838 0.164854
molecular_function potassium channel activity GO:0005267 16756 105 1.115056828 0.0202564 0.16036036 0.0767573 1.145455998 0.00480245 0.156756757 0
biological_process myotube differentiation GO:0014902 16498 39 1.188992159 0.0203448 0.030630631 0.0615709 1.337942545 0.00012622 0.001801802 0.00822763

biological_process ribonucleoside catabolic process GO:0042454 16025 512 1.051367671 0.0204269 0.196396396 0.0615356 1.060253486 0.00822539 0.108108108 0.0776062
biological_process macroautophagy GO:0016236 16487 50 1.166669725 0.0204584 0.113513514 0.0614932 1.032556329 0.344839 0.293693694 -1
biological_process regulation of astrocyte differentiation GO:0048710 16513 24 1.240112747 0.0207295 0.025225225 0.0636165 1.056076381 0.31699 0.333333333 -1
biological_process positive regulation of cell cycle process GO:0090068 16446 91 1.123018449 0.0207648 0.010810811 0.0635734 1.083228502 0.083958 0.126126126 0.244166
biological_process forelimb morphogenesis GO:0035136 16507 30 1.214330624 0.0209169 0.045045045 0.063547 1.075853123 0.235692 0.282882883 0.434952
biological_process regulation of striated muscle contraction GO:0006942 16493 44 1.176866551 0.0209379 0.079279279 0.063502 1.211426192 0.00750057 0.030630631 0.0767597
molecular_function laminin binding GO:0043236 16841 20 1.262472638 0.0209585 0.048648649 0.0765066 1.457930005 0.000193135 0.007207207 0
biological_process regulation of neural precursor cell proliferation GO:2000177 16488 49 1.167450021 0.0210143 0.095495495 0.0634649 1.089106996 0.139639 0.234234234 0.326736
molecular_function thyroid hormone receptor binding GO:0046966 16839 22 1.250105932 0.0210147 0.014414414 0.0761041 1.109876601 0.185869 0.072072072 0.341376
biological_process positive regulation of protein polymerization GO:0032273 16489 48 1.169169834 0.0210267 0.10990991 0.0634187 1.115323967 0.0828914 0.097297297 0.243318
biological_process ventral spinal cord development GO:0021517 16507 30 1.214044414 0.021054 0.037837838 0.0633748 1.289801507 0.00296326 0.003603604 0.0574359
molecular_function sialyltransferase activity GO:0008373 16841 20 1.262176113 0.0210746 0.048648649 0.0757067 1.090043397 0.242626 0.295495495 0.433027
biological_process regulation of megakaryocyte differentiation GO:0045652 16514 23 1.244410943 0.0210946 0.427027027 0.0633328 0.663007554 0.997455 0.803603604 -1
biological_process antigen processing and presentation of exogenous antigen GO:0019884 16512 25 1.234315372 0.0211391 0.041441441 0.0632913 1.058419276 0.306333 0.432432432 -1
biological_process hippo signaling cascade GO:0035329 16516 21 1.255663565 0.0211497 0.138738739 0.0632452 1.071469553 0.285154 0.371171171 -1
biological_process positive regulation of cell growth GO:0030307 16455 82 1.129122488 0.0211662 0.131531532 0.0631999 1.034376592 0.294437 0.345945946 -1
biological_process cytokine production involved in immune response GO:0002367 16498 39 1.187444824 0.0211822 0.048648649 0.0631547 1.008015966 0.465432 0.517117117 -1
biological_process nucleoside catabolic process GO:0009164 16023 514 1.050841241 0.0212741 0.201801802 0.0631202 1.058167865 0.010158 0.115315315 0.0802423
biological_process type I interferon production GO:0032606 16506 31 1.209909641 0.0213722 0.016216216 0.0630866 1.048439334 0.32006 0.345945946 -1
molecular_function ion channel activity GO:0005216 16505 356 1.06134265 0.0213728 0.263063063 0.0753688 1.093437308 0.00101295 0.187387387 0
biological_process regulation of bone resorption GO:0045124 16513 24 1.238394476 0.0214687 0.014414414 0.0637556 1.186795966 0.0563514 0.084684685 0.196996
biological_process erythrocyte development GO:0048821 16517 20 1.261033322 0.0215271 0.001801802 0.0637161 1.216499374 0.0466728 0.027027027 0.179575
molecular_function p53 binding GO:0002039 16818 43 1.177579071 0.0217164 0.052252252 0.0750443 1.255458927 0.00183495 0.003603604 0
biological_process rhythmic behavior GO:0007622 16511 26 1.228191832 0.0218516 0.115315315 0.0637144 1.135588941 0.115378 0.124324324 0.283497
biological_process regulation of osteoclast differentiation GO:0045670 16502 35 1.196293029 0.022029 0.064864865 0.0636918 0.97861527 0.586838 0.567567568 -1
biological_process regulation of leukocyte chemotaxis GO:0002688 16488 49 1.165759413 0.0220734 0.037837838 0.0636504 1.14820177 0.03597 0.054054054 0.157464
biological_process body morphogenesis GO:0010171 16494 43 1.176839769 0.0221558 0.115315315 0.0636144 1.19465363 0.0134238 0.07027027 0.0996763
biological_process cell maturation GO:0048469 16431 106 1.112296244 0.0222706 0.034234234 0.0635831 1.182666146 0.000541836 0.005405405 0.0279335
biological_process regulation of immunoglobulin production GO:0002637 16510 27 1.223010103 0.0222826 0.041441441 0.0635372 0.984031066 0.557207 0.565765766 -1
biological_processadaptive immune response based on somatic recombination of immune receptors built from immunoglobulin superfamily domainsGO:0002460 16388 149 1.094542053 0.0223259 0.059459459 0.0634959 0.957797344 0.814961 0.821621622 -1
biological_process eye morphogenesis GO:0048592 16423 114 1.108116194 0.0224085 0.205405405 0.0634601 1.095789412 0.0377436 0.282882883 0.161257
molecular_function ATPase activity, coupled to transmembrane movement of substances GO:0042626 16758 103 1.11372572 0.0224662 0.165765766 0.0748156 1.046004034 0.208637 0.306306306 0.381018
biological_process neuron death GO:0070997 16361 176 1.08657832 0.0227469 0.099099099 0.064159 1.054633877 0.103452 0.228828829 0.265123
molecular_function RNA polymerase II activating transcription factor binding GO:0001102 16834 27 1.221818852 0.0228582 0.052252252 0.0745068 1.300514369 0.00339624 0.041441441 0
biological_process microtubule-based process GO:0007017 16134 403 1.056753171 0.0228707 0.203603604 0.0641288 1.016199767 0.28428 0.331531532 -1
biological_process embryonic digit morphogenesis GO:0042733 16495 42 1.177738873 0.0228772 0.07027027 0.0640819 1.067864568 0.222817 0.311711712 0.421497
biological_process catecholamine secretion GO:0050432 16501 36 1.19180465 0.022996 0.176576577 0.0640511 1.131871771 0.0850425 0.196396396 0.243594
biological_process L-amino acid transport GO:0015807 16505 32 1.203421873 0.0230185 0.147747748 0.0640066 1.016174457 0.436999 0.436036036 -1
biological_process regulation of peptidyl-threonine phosphorylation GO:0010799 16517 20 1.257187621 0.0231101 0.016216216 0.0646677 1.166154546 0.0989092 0.082882883 0.261982
biological_process cytokine biosynthetic process GO:0042089 16455 82 1.1267687 0.0231183 0.064864865 0.0646208 0.970117865 0.680796 0.614414414 -1
biological_process positive regulation of alpha-beta T cell differentiation GO:0046638 16506 31 1.206453269 0.0231398 0.037837838 0.0645759 1.270688733 0.00448891 0.03963964 0.0572096
biological_process cell differentiation in spinal cord GO:0021515 16500 37 1.188738809 0.023256 0.03963964 0.0645445 1.211742418 0.0127629 0.018018018 0.09639
biological_process positive regulation of protein binding GO:0032092 16497 40 1.181449675 0.0232905 0.025225225 0.0645016 1.097279606 0.143006 0.174774775 0.334014
biological_process steroid metabolic process GO:0008202 16334 203 1.080143242 0.0232971 0.084684685 0.0644547 1.019849 0.311088 0.389189189 -1
molecular_function neurotransmitter binding GO:0042165 16841 20 1.256684472 0.0233242 0.154954955 0.0742173 1.109489502 0.198051 0.297297297 0.373407
molecular_function phosphatidylinositol binding GO:0035091 16723 138 1.097348482 0.023349 0.230630631 0.0738315 1.138225946 0.00236999 0.104504505 0
cellular_component collagen GO:0005581 16747 76 1.131402802 0.0233686 0.196396396 0.048958 1.10911164 0.0493374 0.142342342 0.0533491
cellular_component cell division site GO:0032153 16785 38 1.185928634 0.0234359 0.016216216 0.0482913 1.178949253 0.0278836 0.054054054 0.0151244
cellular_component cell division site part GO:0032155 16785 38 1.185928634 0.0234359 0.016216216 0.0482913 1.178949253 0.0278836 0.054054054 0.0151244
biological_process glucose metabolic process GO:0006006 16368 169 1.087797825 0.0234568 0.068468468 0.0644297 1.016575565 0.353808 0.392792793 -1
biological_process negative regulation of mononuclear cell proliferation GO:0032945 16493 44 1.172534915 0.0235768 0.034234234 0.0650429 0.951511524 0.711544 0.681081081 -1
biological_process negative regulation of lymphocyte proliferation GO:0050672 16493 44 1.172534915 0.0235768 0.034234234 0.0650429 0.951511524 0.711544 0.681081081 -1
molecular_function ATPase activity, coupled to movement of substances GO:0043492 16757 104 1.112007226 0.023594 0.167567568 0.0734983 1.051837758 0.179184 0.288288288 0.335388
biological_process cellular response to lipopolysaccharide GO:0071222 16446 91 1.119781139 0.0235965 0.113513514 0.0649977 1.0092541 0.439095 0.43963964 -1
biological_process regulation of protein binding GO:0043393 16443 94 1.117811048 0.0236269 0.003603604 0.064954 1.132176464 0.0130088 0.007207207 0.0989108
biological_process glycosyl compound catabolic process GO:1901658 16020 517 1.049576198 0.0236477 0.2 0.0649091 1.056907091 0.011394 0.113513514 0.0890944
biological_process regulation of interferon-beta production GO:0032648 16514 23 1.238474661 0.0237227 0.03963964 0.0648719 1.1667976 0.0828006 0.133333333 0.243734
biological_process regulation of neuron apoptotic process GO:0043523 16388 149 1.093284015 0.0237854 0.106306306 0.064833 1.043433231 0.178162 0.264864865 0.372814
biological_process regulation of CD4-positive, alpha-beta T cell differentiation GO:0043370 16512 25 1.228462166 0.0238494 0.054054054 0.0647943 1.068384238 0.276711 0.347747748 0.494391
biological_process cellular response to molecule of bacterial origin GO:0071219 16439 98 1.115093 0.0238915 0.082882883 0.0654403 1.008182401 0.444072 0.443243243 -1
molecular_function peptide hormone binding GO:0017046 16829 32 1.201796968 0.0239018 0.140540541 0.0731818 1.075336503 0.230001 0.29009009 0.406719
biological_process cellular response to biotic stimulus GO:0071216 16427 110 1.10856907 0.0239187 0.064864865 0.0653961 1.002403303 0.482558 0.477477477 -1
biological_process protein secretion GO:0009306 16392 145 1.09436103 0.0240379 0.093693694 0.0653651 0.994711407 0.54412 0.594594595 -1
biological_process myeloid leukocyte differentiation GO:0002573 16418 119 1.104239281 0.0240385 0.045045045 0.0653172 1.125041963 0.00886813 0.061261261 0.0773148
biological_process negative regulation of immune response GO:0050777 16486 51 1.159498671 0.024081 0.108108108 0.0652753 0.957787859 0.699517 0.646846847 -1
biological_process antigen processing and presentation GO:0019882 16470 67 1.138985368 0.024165 0.144144144 0.0652394 0.979940902 0.61219 0.565765766 -1
biological_process positive regulation of secretion GO:0051047 16334 203 1.079481977 0.0242131 0.144144144 0.0651985 1.047622121 0.118519 0.252252252 0.290867
biological_process calcium ion transport into cytosol GO:0060402 16473 64 1.142140454 0.0242266 0.165765766 0.0651526 1.135710166 0.029776 0.201801802 0.143154
biological_process positive regulation of lymphocyte proliferation GO:0050671 16452 85 1.123202344 0.0242792 0.05045045 0.0657959 1.075925683 0.112082 0.145945946 0.277872
biological_process positive regulation of ossification GO:0045778 16499 38 1.1844595 0.0243187 0.106306306 0.0657535 1.131579514 0.0797898 0.266666667 0.23665
biological_process microtubule depolymerization GO:0007019 16513 24 1.231496199 0.0246643 0.072072072 0.0664368 1.262687095 0.0128537 0.018018018 0.0981208
biological_process epidermis morphogenesis GO:0048730 16503 34 1.194422515 0.0246727 0.100900901 0.0663896 1.259940292 0.00429455 0.025225225 0.0577269
biological_process regulation of cardiac muscle cell membrane potential GO:0086036 16512 25 1.226411125 0.0248658 0.111711712 0.0684072 1.358674231 0.000939897 0.023423423 0.037833
biological_process response to cocaine GO:0042220 16503 34 1.193867641 0.0249988 0.181981982 0.0683771 1.146489965 0.0693049 0.216216216 0.220886
biological_process regulation of T cell mediated immunity GO:0002709 16502 35 1.190885551 0.025111 0.016216216 0.068344 1.009747139 0.460198 0.508108108 -1
biological_process regulation of protein polymerization GO:0032271 16438 99 1.113250071 0.0251403 0.043243243 0.0682987 1.095956508 0.0485948 0.068468468 0.181934
biological_process positive regulation of glucose import GO:0046326 16517 20 1.252368401 0.0252312 0.068468468 0.0682624 1.122376436 0.171444 0.189189189 0.364298
molecular_function Rab GTPase binding GO:0017137 16812 49 1.160932581 0.0253459 0.165765766 0.0826973 1.216454149 0.00429136 0.108108108 0
biological_process embryonic pattern specification GO:0009880 16488 49 1.160855416 0.0254002 0.061261261 0.0689137 1.073696548 0.185442 0.331531532 0.379198
biological_process response to starvation GO:0042594 16417 120 1.102535196 0.0254379 0.147747748 0.0688693 1.03686803 0.241345 0.297297297 0.44557
biological_process protein export from nucleus GO:0006611 16499 38 1.182585023 0.0254858 0.045045045 0.0688265 1.134074573 0.0759063 0.115315315 0.230103

biological_process regulation of vascular endothelial growth factor receptor signaling pathway GO:0030947 16513 24 1.229369776 0.0257264 0.045045045 0.0701594 1.228503082 0.0261702 0.068468468 0.137242
molecular_function hydrolase activity, acting on acid anhydrides, catalyzing transmembrane movement of substances GO:0016820 16757 104 1.109859702 0.025794 0.18018018 0.0870812 1.044292339 0.21629 0.317117117 0.393638
biological_process cellular response to acid GO:0071229 16495 42 1.17319233 0.0257943 0.043243243 0.0701189 1.001016855 0.495462 0.482882883 -1
biological_process membrane budding GO:0006900 16516 21 1.244577947 0.0260374 0.100900901 0.0707764 1.264537817 0.0178185 0.142342342 0.114416
biological_process long-term synaptic potentiation GO:0060291 16516 21 1.244013588 0.0263097 0.156756757 0.0714371 1.275231839 0.0144084 0.124324324 0.100898
biological_process positive regulation of leukocyte mediated cytotoxicity GO:0001912 16510 27 1.215135955 0.0263233 0.016216216 0.0713877 1.002054712 0.492637 0.517117117 -1
cellular_component melanosome GO:0042470 16738 85 1.120944072 0.0264182 0.158558559 0.0480101 0.984623337 0.597234 0.511711712 -1
cellular_component pigment granule GO:0048770 16738 85 1.120944072 0.0264182 0.158558559 0.0480101 0.984623337 0.597234 0.511711712 -1
biological_process mononuclear cell proliferation GO:0032943 16371 166 1.086315226 0.0264431 0.036036036 0.0713546 1.057240067 0.0996044 0.048648649 0.26271
biological_process oogenesis GO:0048477 16482 55 1.150436424 0.0264579 0.138738739 0.0713054 1.185311593 0.00855475 0.037837838 0.0770522
biological_process monoamine transport GO:0015844 16479 58 1.146475247 0.0264625 0.145945946 0.0712548 1.093839763 0.107491 0.167567568 0.271889
biological_process regulation of sensory perception of pain GO:0051930 16514 23 1.23282231 0.0264757 0.041441441 0.0711544 1.079088896 0.255466 0.324324324 0.466515
biological_process regulation of sensory perception GO:0051931 16514 23 1.23282231 0.0264757 0.041441441 0.0711544 1.079088896 0.255466 0.324324324 0.466515
biological_process triglyceride metabolic process GO:0006641 16476 61 1.142705442 0.0265536 0.061261261 0.0711151 1.040202967 0.292939 0.261261261 -1
biological_process positive regulation of adaptive immune response GO:0002821 16486 51 1.156081692 0.0265809 0.054054054 0.0710682 0.951961685 0.724142 0.736936937 -1
cellular_component extrinsic to plasma membrane GO:0019897 16741 82 1.122828909 0.0267264 0.030630631 0.0477218 0.962523568 0.72216 0.778378378 -1
biological_process positive regulation of cell activation GO:0050867 16364 173 1.084183868 0.0269286 0.077477477 0.0717363 1.145280008 0.000438803 0.003603604 0.0200581
molecular_function glutamate receptor activity GO:0008066 16835 26 1.218124371 0.0269313 0.21981982 0.0869261 1.233470676 0.0195286 0.185585586 0.0345204
biological_process morphogenesis of an epithelial fold GO:0060571 16512 25 1.222362255 0.026979 0.009009009 0.0723576 1.029298367 0.399794 0.412612613 -1
biological_process prostate gland morphogenesis GO:0060512 16509 28 1.210013856 0.0270246 0.142342342 0.0723128 1.160322936 0.0706971 0.221621622 0.22099
biological_process regulation of smooth muscle contraction GO:0006940 16496 41 1.173331242 0.027132 0.117117117 0.0722776 1.018385282 0.419134 0.418018018 -1
biological_process regulation of endocytosis GO:0030100 16421 116 1.102803475 0.0271486 0.135135135 0.0722284 1.152073658 0.00220706 0.027027027 0.0499631
biological_process purine nucleoside catabolic process GO:0006152 16029 508 1.048507372 0.0272192 0.212612613 0.0721361 1.060131797 0.00855709 0.108108108 0.0768706
biological_process purine ribonucleoside catabolic process GO:0046130 16029 508 1.048507372 0.0272192 0.212612613 0.0721361 1.060131797 0.00855709 0.108108108 0.0768706
biological_process establishment of spindle localization GO:0051293 16517 20 1.247924076 0.0273295 0.036036036 0.0721015 1.244562111 0.0290119 0.077477477 0.142759
biological_process immunoglobulin production GO:0002377 16479 58 1.145257567 0.0274642 0.052252252 0.0720706 1.010105473 0.446907 0.407207207 -1
biological_process chemokine production GO:0032602 16492 45 1.16486324 0.0275462 0.061261261 0.0720317 0.962508395 0.668681 0.726126126 -1
biological_process cell-type specific apoptotic process GO:0097285 16275 262 1.06787037 0.0275523 0.126126126 0.0719813 1.06064664 0.0432772 0.151351351 0.174085
biological_process nucleobase-containing compound catabolic process GO:0034655 15855 682 1.041498927 0.0276216 0.171171171 0.0719406 1.057562581 0.00391789 0.054054054 0.0592178
biological_process regulation of ERBB signaling pathway GO:1901184 16503 34 1.1895567 0.0276571 0.102702703 0.0718948 1.195023628 0.0243236 0.136936937 0.133897
biological_process regulation of epidermal growth factor receptor signaling pathway GO:0042058 16504 33 1.19235435 0.0276944 0.104504505 0.0718493 1.172422226 0.0429632 0.176576577 0.174128
biological_process neural tube patterning GO:0021532 16508 29 1.205003137 0.0278215 0.043243243 0.0718175 1.172592823 0.0535632 0.03963964 0.18999
biological_process positive regulation of alpha-beta T cell activation GO:0046635 16493 44 1.166290322 0.0278692 0.068468468 0.0717737 1.182204138 0.018034 0.091891892 0.115006
biological_process covalent chromatin modification GO:0016569 16253 284 1.064930397 0.0279555 0.306306306 0.0717358 1.168946419 3.27E-07 0.016216216 0
molecular_function ATPase activity, coupled to transmembrane movement of ions, phosphorylative mechanism GO:0015662 16808 53 1.151071695 0.0281972 0.127927928 0.0868042 1.027791179 0.362804 0.423423423 -1
biological_process smoothened signaling pathway GO:0007224 16453 84 1.119749576 0.0283381 0.135135135 0.0730596 1.125239116 0.0231216 0.063063063 0.130009
molecular_function lipid transporter activity GO:0005319 16802 59 1.142724618 0.028573 0.018018018 0.0864578 1.029614936 0.346539 0.378378378 -1
biological_process embryonic cranial skeleton morphogenesis GO:0048701 16504 33 1.19087016 0.0286489 0.084684685 0.0737126 1.126302393 0.104208 0.201801802 0.266138
biological_process neurotrophin signaling pathway GO:0038179 16517 20 1.245070033 0.0287523 0.100900901 0.0736243 1.172582189 0.0905115 0.126126126 0.250444
biological_process neurotrophin TRK receptor signaling pathway GO:0048011 16517 20 1.245070033 0.0287523 0.100900901 0.0736243 1.172582189 0.0905115 0.126126126 0.250444
biological_process adaptive immune response GO:0002250 16376 161 1.085979881 0.0287907 0.068468468 0.0735782 0.960125887 0.810771 0.809009009 -1
biological_process positive regulation of lymphocyte differentiation GO:0045621 16477 60 1.141008335 0.029029 0.041441441 0.073563 1.183738351 0.00676319 0.018018018 0.0707154
biological_process positive regulation of cytokine production GO:0001819 16376 161 1.085716981 0.029179 0.066666667 0.0735341 1.006306153 0.444655 0.441441441 -1
biological_process sequestering of metal ion GO:0051238 16479 58 1.143201689 0.0292272 0.108108108 0.0734896 1.057248885 0.224688 0.333333333 0.423655
biological_process macrophage activation GO:0042116 16504 33 1.189734113 0.0293979 0.025225225 0.073464 1.078328239 0.217665 0.216216216 0.416722
biological_process Wnt receptor signaling pathway, planar cell polarity pathway GO:0060071 16510 27 1.209747673 0.0294276 0.135135135 0.073365 1.206262982 0.0315927 0.136936937 0.148832
biological_process regulation of establishment of planar polarity GO:0090175 16510 27 1.209747673 0.0294276 0.135135135 0.073365 1.206262982 0.0315927 0.136936937 0.148832
biological_process osteoblast proliferation GO:0033687 16516 21 1.237845954 0.0294429 0.095495495 0.0733156 1.025929261 0.418437 0.412612613 -1
biological_process long-chain fatty acid metabolic process GO:0001676 16502 35 1.183871379 0.0296396 0.120720721 0.0732941 1.026577697 0.392586 0.401801802 -1
biological_process response to retinoic acid GO:0032526 16452 85 1.117731858 0.0297241 0.097297297 0.0739078 1.031412009 0.307534 0.335135135 -1
cellular_component transcription factor complex GO:0005667 16528 295 1.062792224 0.0297365 0.108108108 0.0542293 1.097492469 0.00171577 0.041441441 0
biological_process leukocyte proliferation GO:0070661 16365 172 1.082471869 0.0298419 0.057657658 0.0745251 1.048054894 0.136252 0.084684685 0.318737
biological_process negative regulation of phosphatase activity GO:0010923 16477 60 1.13996024 0.0299743 0.230630631 0.0751433 1.225117938 0.00123992 0.054054054 0.0410972
biological_process response to virus GO:0009615 16380 157 1.086264693 0.0299826 0.084684685 0.0750918 0.905002332 0.980851 0.96036036 -1
biological_process regulation of endothelial cell proliferation GO:0001936 16470 67 1.132352047 0.0300392 0.088288288 0.075048 1.187153203 0.00392147 0.032432432 0.0591333
biological_process catecholamine transport GO:0051937 16492 45 1.161444839 0.0301651 0.209009009 0.0750151 1.11318142 0.0939489 0.223423423 0.254838
biological_process cellular pigmentation GO:0033059 16517 20 1.242215991 0.0302362 0.059459459 0.0749736 1.106473613 0.204625 0.218018018 0.402001
molecular_function signaling adaptor activity GO:0035591 16833 28 1.204624015 0.0302592 0.059459459 0.0910648 1.025374701 0.407983 0.412612613 -1
biological_process regulation of cytokine biosynthetic process GO:0042035 16464 73 1.126490345 0.0303262 0.093693694 0.0749352 0.962174161 0.712631 0.634234234 -1
biological_process lung alveolus development GO:0048286 16498 39 1.173162207 0.0303794 0.052252252 0.074891 1.132088057 0.0762976 0.198198198 0.231166
biological_process regulation of vesicle-mediated transport GO:0060627 16328 209 1.074327965 0.030533 0.223423423 0.0748625 1.122898303 0.00097737 0.023423423 0.0372479
biological_process osteoclast differentiation GO:0030316 16484 53 1.148209081 0.0306143 0.064864865 0.0748228 1.038448918 0.31364 0.340540541 -1
biological_process neuron apoptotic process GO:0051402 16373 164 1.083907917 0.0307061 0.106306306 0.0747848 1.030379871 0.249152 0.315315315 0.457644
biological_process negative regulation of transport GO:0051051 16276 261 1.066146802 0.0310426 0.174774775 0.0767207 1.047890863 0.0883862 0.171171171 0.247786
biological_process multicellular organismal homeostasis GO:0048871 16388 149 1.087797344 0.0311187 0.108108108 0.0766793 1.01810202 0.350359 0.372972973 -1
biological_process cerebral cortex cell migration GO:0021795 16508 29 1.199385961 0.0313452 0.135135135 0.0766618 1.155474405 0.07333 0.203603604 0.227606
biological_process carbohydrate transport GO:0008643 16444 93 1.11108445 0.0313933 0.055855856 0.0766161 1.082179922 0.08433 0.102702703 0.244182
biological_process establishment of planar polarity GO:0001736 16504 33 1.186413925 0.0316807 0.145945946 0.0798125 1.216453199 0.015548 0.127927928 0.105703
biological_process prostate gland development GO:0030850 16492 45 1.159574393 0.0316833 0.140540541 0.0797576 1.101805561 0.118115 0.300900901 0.2902
biological_process regulation of response to extracellular stimulus GO:0032104 16501 36 1.177833412 0.0321487 0.088288288 0.0809977 1.07511341 0.217277 0.190990991 0.416139
biological_process regulation of response to nutrient levels GO:0032107 16501 36 1.177833412 0.0321487 0.088288288 0.0809977 1.07511341 0.217277 0.190990991 0.416139
biological_process regulation of collagen metabolic process GO:0010712 16516 21 1.23260548 0.032343 0.091891892 0.0816096 0.94669445 0.664009 0.778378378 -1
biological_process negative regulation of leukocyte activation GO:0002695 16445 92 1.110849847 0.0323951 0.09009009 0.0815619 0.986772869 0.587232 0.551351351 -1
biological_process phosphatidylinositol metabolic process GO:0046488 16422 115 1.099027233 0.0324652 0.259459459 0.0815173 1.109070014 0.0210248 0.145945946 0.127009
biological_process regulation of bone remodeling GO:0046850 16508 29 1.197672034 0.0324911 0.041441441 0.0814653 1.133351822 0.106585 0.205405405 0.269982
biological_process response to cadmium ion GO:0046686 16508 29 1.197442676 0.0326471 0.063063063 0.0814352 1.017843164 0.43387 0.412612613 -1
molecular_function protein phosphatase binding GO:0019903 16789 72 1.125129214 0.0326654 0.2 0.10036 1.043906097 0.258925 0.367567568 0.450394
molecular_function substrate-specific channel activity GO:0022838 16500 361 1.055273871 0.0329714 0.279279279 0.0999463 1.092693509 0.00102207 0.189189189 0
biological_process regulation of interleukin-8 production GO:0032677 16506 31 1.190450969 0.0330043 0.082882883 0.0820721 0.912095992 0.801944 0.778378378 -1
biological_process regulation of leukocyte mediated immunity GO:0002703 16441 96 1.107994863 0.0330269 0.117117117 0.0820193 0.976804139 0.653531 0.641441441 -1
biological_process embryonic eye morphogenesis GO:0048048 16507 30 1.193400978 0.0331472 0.102702703 0.081983 1.153670126 0.0722611 0.21981982 0.225068

biological_process T cell differentiation GO:0030217 16385 152 1.085573671 0.0331901 0.118918919 0.0819338 1.153742262 0.000486615 0.034234234 0.0219513
biological_process biomineral tissue development GO:0031214 16441 96 1.107824799 0.0332407 0.147747748 0.0825172 1.146119309 0.00644188 0.118918919 0.067787
molecular_function channel activity GO:0015267 16492 369 1.054474759 0.0334246 0.281081081 0.0990846 1.081986486 0.00290563 0.223423423 0
molecular_function passive transmembrane transporter activity GO:0022803 16492 369 1.054474759 0.0334246 0.281081081 0.0990846 1.081986486 0.00290563 0.223423423 0
molecular_function cadherin binding GO:0045296 16840 21 1.230725268 0.0334391 0.156756757 0.0986002 1.192216565 0.0634253 0.209009009 0.104709
biological_process response to calcium ion GO:0051592 16449 88 1.112419719 0.0335154 0.135135135 0.0843954 1.165711763 0.00347013 0.063063063 0.056998
biological_process endocrine process GO:0050886 16483 54 1.143625884 0.033547 0.064864865 0.0843429 0.969474194 0.651448 0.67027027 -1
biological_process positive regulation of cyclic nucleotide metabolic process GO:0030801 16480 57 1.139758471 0.0335705 0.059459459 0.0842892 1.145109271 0.0286626 0.095495495 0.142998
biological_process regulation of reproductive process GO:2000241 16392 145 1.087388559 0.0335753 0.104504505 0.0842323 1.029965756 0.265123 0.308108108 0.47883
biological_process protein import GO:0017038 16313 224 1.070125602 0.033611 0.048648649 0.0841807 1.036722981 0.168934 0.2 0.360995
cellular_component lysosomal membrane GO:0005765 16722 101 1.10479078 0.0336537 0.068468468 0.0608068 1.035321385 0.26872 0.345945946 0.434444
biological_process positive regulation of cytokine secretion GO:0050715 16485 52 1.146233459 0.0336753 0.151351351 0.0841342 0.861212933 0.958743 0.963963964 -1
biological_process elevation of cytosolic calcium ion concentration GO:0007204 16397 140 1.088881171 0.0336795 0.16036036 0.0840774 1.032733238 0.250282 0.311711712 0.459398
biological_process sensory perception GO:0007600 16186 351 1.055736663 0.0337686 0.178378378 0.0840351 1.018098968 0.276404 0.34954955 0.49419
cellular_component Golgi stack GO:0005795 16720 103 1.103589317 0.0338824 0.111711712 0.0604346 1.13701477 0.00784694 0.034234234 0
cellular_component cell envelope GO:0030313 16801 22 1.224312247 0.0341108 0.183783784 0.0596685 1.2392044 0.0259111 0.178378378 0.0152674
cellular_component external encapsulating structure part GO:0044462 16801 22 1.224312247 0.0341108 0.183783784 0.0596685 1.2392044 0.0259111 0.178378378 0.0152674
biological_process positive regulation of protein secretion GO:0050714 16463 74 1.122104171 0.0341227 0.099099099 0.0871566 0.949716011 0.773667 0.825225225 -1
biological_process acylglycerol metabolic process GO:0006639 16470 67 1.128290831 0.034188 0.057657658 0.0871088 1.030738601 0.331189 0.340540541 -1
biological_process endosome organization GO:0007032 16515 22 1.224132509 0.0342219 0.025225225 0.0870555 1.161670094 0.0943769 0.057657658 0.256224
biological_process extrinsic apoptotic signaling pathway GO:0097191 16500 37 1.172690539 0.0342697 0.05045045 0.0870047 1.044020023 0.321231 0.243243243 -1
biological_process response to monosaccharide stimulus GO:0034284 16402 135 1.090090191 0.0343522 0.084684685 0.08758 1.109977116 0.0131296 0.01981982 0.0987403
biological_process regulation of cardiac muscle cell action potential GO:0086001 16513 24 1.214363881 0.0343598 0.120720721 0.0881406 1.376450724 0.000695174 0.021621622 0.0313195
biological_process negative regulation of response to cytokine stimulus GO:0060761 16513 24 1.214293336 0.0344054 0.036036036 0.0887064 1.279154276 0.00888352 0.037837838 0.0772285
biological_process positive regulation of cell cycle phase transition GO:1901989 16515 22 1.223786198 0.034436 0.052252252 0.089823 1.110295128 0.184963 0.18018018 0.378999
biological_process positive regulation of mitotic cell cycle phase transition GO:1901992 16515 22 1.223786198 0.034436 0.052252252 0.089823 1.110295128 0.184963 0.18018018 0.378999
biological_process positive regulation of BMP signaling pathway GO:0030513 16512 25 1.209809305 0.0345033 0.030630631 0.0897744 1.219227645 0.0287162 0.048648649 0.142896
biological_process positive regulation of lymphocyte mediated immunity GO:0002708 16490 47 1.152879337 0.0345381 0.064864865 0.0897201 0.993856263 0.529142 0.565765766 -1
biological_process neutral lipid metabolic process GO:0006638 16468 69 1.12586582 0.0347872 0.081081081 0.0897044 1.03197546 0.322413 0.317117117 -1
biological_process lymphocyte proliferation GO:0046651 16372 165 1.081120715 0.0348483 0.045045045 0.0896549 1.05916936 0.0929195 0.046846847 0.253642
biological_process cytoplasmic transport GO:0016482 16025 512 1.045502844 0.0350282 0.21981982 0.0914636 1.034170004 0.0868643 0.261261261 0.245994
biological_process dorsal/ventral pattern formation GO:0009953 16459 78 1.118095372 0.035088 0.046846847 0.091413 1.122182321 0.0305037 0.084684685 0.146621
biological_process negative regulation of ERK1 and ERK2 cascade GO:0070373 16517 20 1.233605489 0.0351018 0.028828829 0.0913541 0.889977552 0.80312 0.801801802 -1
biological_process regulation of peptidase activity GO:0052547 16330 207 1.072176378 0.035153 0.181981982 0.0913021 0.976206187 0.724686 0.722522523 -1
cellular_component integral to Golgi membrane GO:0030173 16787 36 1.173948562 0.0351716 0.03963964 0.0590459 1.056233066 0.27927 0.243243243 0.446504
cellular_component intrinsic to Golgi membrane GO:0031228 16787 36 1.173948562 0.0351716 0.03963964 0.0590459 1.056233066 0.27927 0.243243243 0.446504
biological_process endothelial cell proliferation GO:0001935 16461 76 1.119552945 0.0351976 0.115315315 0.091249 1.189642159 0.00205137 0.028828829 0.0505983
biological_process histone modification GO:0016570 16258 279 1.061965304 0.035304 0.317117117 0.0912071 1.165985889 6.39E-07 0.014414414 0
biological_process striated muscle contraction GO:0006941 16453 84 1.113593459 0.0353171 0.036036036 0.0911484 1.152188684 0.00771596 0.014414414 0.0772934
biological_process regulation of adenylate cyclase activity GO:0045761 16508 29 1.19363534 0.0353271 0.108108108 0.0910891 1.171325101 0.0548648 0.230630631 0.192983
biological_process cellular response to fibroblast growth factor stimulus GO:0044344 16474 63 1.131070823 0.0355094 0.066666667 0.0910002 1.11945348 0.0499502 0.151351351 0.183374
biological_process response to fibroblast growth factor stimulus GO:0071774 16474 63 1.131070823 0.0355094 0.066666667 0.0910002 1.11945348 0.0499502 0.151351351 0.183374
biological_process bone morphogenesis GO:0060349 16470 67 1.127029146 0.0355699 0.126126126 0.0915578 1.093577355 0.0918647 0.192792793 0.252116
molecular_functionRNA polymerase II transcription regulatory region sequence-specific DNA binding transcription factor activity involved in negative regulation of transcriptionGO:0001227 16831 30 1.189966365 0.0356304 0.001801802 0.0987246 1.201969694 0.0275688 0.142342342 0.0545842
biological_process neuron maturation GO:0042551 16512 25 1.207913059 0.0357773 0.124324324 0.0915344 1.132687269 0.125081 0.203603604 0.300709
biological_process purine nucleoside triphosphate metabolic process GO:0009144 15967 570 1.042807587 0.0358178 0.187387387 0.0914806 1.043851438 0.0324963 0.140540541 0.149332
biological_process catabolic process GO:0009056 14879 1658 1.024233732 0.0358225 0.248648649 0.0914204 1.031279706 0.0100269 0.158558559 0.0807543
biological_process ethanolamine-containing compound metabolic process GO:0042439 16491 46 1.153100509 0.0358495 0.120720721 0.0913643 1.027991649 0.370987 0.367567568 -1
biological_process cGMP metabolic process GO:0046068 16501 36 1.173080034 0.0358784 0.057657658 0.0913087 1.030115881 0.377037 0.394594595 -1
biological_process negative regulation of homeostatic process GO:0032845 16517 20 1.232251029 0.0359227 0.005405405 0.0912558 1.060814979 0.318706 0.335135135 -1
biological_process regulation of cell junction assembly GO:1901888 16511 26 1.203456176 0.0360656 0.181981982 0.0912209 1.241573645 0.016372 0.194594595 0.111398
biological_process central nervous system projection neuron axonogenesis GO:0021952 16515 22 1.220735362 0.0363702 0.084684685 0.0912151 1.024041695 0.422539 0.445045045 -1
molecular_function sugar transmembrane transporter activity GO:0051119 16836 25 1.206870658 0.0364938 0.034234234 0.098479 1.221084876 0.0276761 0.009009009 0.0540127
biological_process positive regulation of binding GO:0051099 16463 74 1.120049927 0.03651 0.036036036 0.0911796 1.062305572 0.176087 0.189189189 0.370139
biological_processpositive regulation of adaptive immune response based on somatic recombination of immune receptors built from immunoglobulin superfamily domainsGO:0002824 16489 48 1.149079672 0.0366024 0.052252252 0.0929458 0.962395356 0.674358 0.708108108 -1
biological_process regulation of protein secretion GO:0050708 16424 113 1.09695707 0.0366197 0.095495495 0.0928873 0.978059676 0.657421 0.72972973 -1
biological_process renal tubule development GO:0061326 16504 33 1.179216519 0.0371339 0.093693694 0.0941223 1.052983402 0.298865 0.34954955 -1
biological_process epithelial cell morphogenesis GO:0003382 16506 31 1.184868499 0.037173 0.081081081 0.0940672 1.134583358 0.0969587 0.106306306 0.258055
biological_process aromatic compound catabolic process GO:0019439 15818 719 1.037551556 0.0372849 0.14954955 0.0940256 1.049232873 0.0096975 0.061261261 0.0792021
biological_process receptor clustering GO:0043113 16509 28 1.194063524 0.0375276 0.127927928 0.0940083 1.177849729 0.0514035 0.153153153 0.185677
biological_process demethylation GO:0070988 16502 35 1.173339754 0.0376951 0.081081081 0.093977 1.276005816 0.00231839 0.018018018 0.0508103
biological_process embryonic hemopoiesis GO:0035162 16513 24 1.209350159 0.0377279 0.064864865 0.0945198 1.272119948 0.0104246 0.048648649 0.0850085
biological_process lipid modification GO:0030258 16403 134 1.0881624 0.0379676 0.117117117 0.0945018 0.998120713 0.51512 0.535135135 -1
biological_process protein complex disassembly GO:0043241 16465 72 1.120480459 0.0379863 0.059459459 0.0944429 1.11503003 0.0451074 0.059459459 0.17773
biological_process regulation of steroid metabolic process GO:0019218 16480 57 1.135468497 0.0379876 0.05045045 0.0943808 0.956327041 0.716392 0.637837838 -1
molecular_function Wnt-protein binding GO:0017147 16834 27 1.196844864 0.0381102 0.118918919 0.0984432 1.059481343 0.296065 0.326126126 -1
biological_process negative regulation of DNA metabolic process GO:0051053 16480 57 1.135315738 0.0381532 0.113513514 0.0949463 1.146276178 0.0276756 0.059459459 0.140679
biological_process positive regulation of T cell activation GO:0050870 16427 110 1.097018773 0.0385052 0.082882883 0.0955455 1.14311222 0.00454763 0.046846847 0.0582937
biological_process negative regulation of sequence-specific DNA binding transcription factor activity GO:0043433 16438 99 1.1022011 0.0386495 0.075675676 0.0955096 1.080856859 0.0811134 0.113513514 0.239417
biological_process negative regulation of neuron apoptotic process GO:0043524 16442 95 1.104310804 0.0386954 0.212612613 0.0954553 1.118759236 0.0221808 0.151351351 0.12817
biological_process regulation of glial cell differentiation GO:0045685 16489 48 1.146776887 0.0388763 0.045045045 0.0954262 1.07069176 0.197801 0.12972973 0.393817
biological_process organic cyclic compound catabolic process GO:1901361 15797 740 1.036571142 0.0389561 0.147747748 0.0953783 1.044936834 0.0151488 0.086486486 0.105528
biological_process positive regulation of lymphocyte activation GO:0051251 16387 150 1.082689925 0.0390265 0.082882883 0.0953287 1.133401586 0.00223575 0.016216216 0.0498043
biological_process macromolecular complex assembly GO:0065003 15645 892 1.033116725 0.0391083 0.145945946 0.0952813 0.977302698 0.886347 0.852252252 -1
biological_process microtubule-based movement GO:0007018 16378 159 1.080199293 0.039203 0.169369369 0.0952364 0.939482307 0.907951 0.888288288 -1
biological_process tumor necrosis factor superfamily cytokine production GO:0071706 16471 66 1.124730251 0.0393218 0.077477477 0.0957895 0.959558216 0.715756 0.702702703 -1
biological_process monocyte differentiation GO:0030224 16515 22 1.216106888 0.0394736 0.041441441 0.095755 1.324419783 0.00417752 0.009009009 0.0582727
biological_process regulation of microtubule-based process GO:0032886 16443 94 1.104307608 0.0394928 0.117117117 0.0956958 1.105798699 0.0373979 0.115315315 0.161354
biological_process regulation of smoothened signaling pathway GO:0008589 16493 44 1.152638522 0.039543 0.135135135 0.0956425 1.168612805 0.0262023 0.072072072 0.137135
biological_process CD4-positive, alpha-beta T cell activation GO:0035710 16498 39 1.161977362 0.0397052 0.055855856 0.0956101 1.048863753 0.298358 0.381981982 -1
biological_process embryonic axis specification GO:0000578 16510 27 1.194469677 0.0399166 0.061261261 0.0955868 1.180181548 0.0522997 0.131531532 0.188395

biological_process T cell differentiation in thymus GO:0033077 16471 66 1.124171389 0.0399961 0.079279279 0.095539 1.218994646 0.0010085 0.043243243 0.0390622
biological_process positive regulation of carbohydrate metabolic process GO:0045913 16497 40 1.159445732 0.040167 0.100900901 0.0960996 1.136540831 0.0671278 0.21981982 0.218876
biological_process regulation of microtubule cytoskeleton organization GO:0070507 16459 78 1.114047183 0.0401715 0.126126126 0.0960376 1.146499359 0.012342 0.075675676 0.0950518
biological_process calcium-mediated signaling GO:0019722 16465 72 1.118627817 0.0402962 0.16036036 0.0959981 1.0647366 0.170175 0.356756757 0.362229
biological_process organelle transport along microtubule GO:0072384 16514 23 1.210165587 0.0403205 0.131531532 0.09594 1.154993389 0.0988115 0.196396396 0.262092
biological_process membrane lipid biosynthetic process GO:0046467 16465 72 1.118552233 0.0403928 0.052252252 0.0958908 0.964682184 0.698563 0.668468468 -1
biological_process response to dsRNA GO:0043331 16496 41 1.156739686 0.0408874 0.117117117 0.0959202 1.047763397 0.297938 0.344144144 -1
biological_process organ formation GO:0048645 16490 47 1.146294867 0.0409628 0.077477477 0.0958717 1.193222408 0.0107905 0.106306306 0.0857517
molecular_function serine-type endopeptidase inhibitor activity GO:0004867 16791 70 1.119764514 0.0410002 0.171171171 0.103191 0.953414034 0.750652 0.74954955 -1
cellular_component clathrin coat GO:0030118 16780 43 1.152623118 0.0413072 0.18018018 0.083841 1.186754887 0.0168399 0.091891892 0.00809718
molecular_function protein tyrosine phosphatase activity GO:0004725 16765 96 1.101886603 0.041455 0.176576577 0.102817 1.159196221 0.00336994 0.068468468 0
molecular_function double-stranded DNA binding GO:0003690 16740 121 1.090633359 0.0415479 0.059459459 0.102343 1.148869873 0.00220848 0.084684685 0
biological_process regulation of histone modification GO:0031056 16471 66 1.1228686 0.0416046 0.145945946 0.0976949 1.250071021 0.000211032 0.010810811 0.0127106
biological_process protein polymerization GO:0051258 16396 141 1.083663058 0.0419835 0.028828829 0.0977029 1.050290418 0.14947 0.158558559 0.340673
biological_process pallium development GO:0021543 16433 104 1.097181928 0.042537 0.190990991 0.0989182 1.055428299 0.163023 0.304504505 0.354505
biological_process response to estradiol stimulus GO:0032355 16435 102 1.098124662 0.042555 0.144144144 0.0988573 0.9999796 0.50017 0.466666667 -1
molecular_function cargo receptor activity GO:0038024 16807 54 1.134882139 0.0427569 0.108108108 0.106537 0.954291873 0.719962 0.715315315 -1
biological_process antigen processing and presentation of peptide antigen GO:0048002 16501 36 1.165249557 0.0427899 0.106306306 0.0994235 1.002505975 0.489621 0.502702703 -1
biological_process nucleoside triphosphate metabolic process GO:0009141 15951 586 1.040242969 0.0429043 0.192792793 0.0999655 1.044388983 0.0290482 0.118918919 0.142651
biological_process mechanoreceptor differentiation GO:0042490 16486 51 1.13861977 0.0429647 0.075675676 0.0999123 1.05382606 0.252455 0.369369369 0.462244
biological_process metanephric nephron development GO:0072210 16502 35 1.167372525 0.0430014 0.127927928 0.100438 1.184109791 0.0294752 0.108108108 0.143047
molecular_function cytokine receptor binding GO:0005126 16701 160 1.077971868 0.0430396 0.113513514 0.110397 1.099936951 0.0139021 0.041441441 0.0242374
biological_process negative regulation of leukocyte differentiation GO:1902106 16482 55 1.133294578 0.0431686 0.145945946 0.101569 0.973980513 0.631131 0.697297297 -1
biological_process regulation of generation of precursor metabolites and energy GO:0043467 16492 45 1.147362745 0.043216 0.142342342 0.101513 1.134651237 0.058601 0.142342342 0.202083
biological_process organonitrogen compound catabolic process GO:1901565 15836 701 1.036582141 0.0432482 0.133333333 0.101453 1.04261159 0.0229233 0.127927928 0.128725
biological_process negative regulation of reproductive process GO:2000242 16474 63 1.124306197 0.0434318 0.034234234 0.101424 1.010925765 0.44021 0.421621622 -1
biological_process negative regulation of immune system process GO:0002683 16377 160 1.077680738 0.0436214 0.095495495 0.101395 0.982747541 0.64799 0.621621622 -1
cellular_component cleavage furrow GO:0032154 16788 35 1.166711448 0.0436245 0.014414414 0.083784 1.212771523 0.0145337 0.007207207 0.00823791
biological_process immune response-activating cell surface receptor signaling pathway GO:0002429 16457 80 1.109879417 0.0439706 0.014414414 0.102557 1.046686863 0.234232 0.223423423 0.433051
biological_process negative regulation of lymphocyte activation GO:0051250 16457 80 1.109865812 0.0439902 0.140540541 0.102494 1.010155723 0.437364 0.434234234 -1
biological_process multicellular organismal response to stress GO:0033555 16480 57 1.130064656 0.0442145 0.145945946 0.10305 1.1243065 0.0517292 0.156756757 0.18728
biological_process negative regulation of neuron death GO:1901215 16439 98 1.099047031 0.0442526 0.221621622 0.102992 1.121345782 0.0184518 0.135135135 0.115548
biological_process positive regulation of T cell proliferation GO:0042102 16476 61 1.125275085 0.0447717 0.108108108 0.104181 1.07494473 0.154891 0.214414414 0.344771
biological_process response to ammonium ion GO:0060359 16477 60 1.126288651 0.0448096 0.275675676 0.104122 1.120552348 0.0525832 0.207207207 0.189258
biological_process chromosome organization GO:0051276 15900 637 1.038048544 0.0449295 0.299099099 0.104079 1.084140159 8.80E-05 0.045045045 0.00586961
biological_process lamellipodium assembly GO:0030032 16499 38 1.158620994 0.0449855 0.154954955 0.104023 1.180837845 0.0266155 0.214414414 0.138298
biological_process inner ear receptor cell differentiation GO:0060113 16492 45 1.145570235 0.0451639 0.032432432 0.103992 1.084264755 0.163451 0.315315315 0.354851
biological_process regulation of sterol transport GO:0032371 16512 25 1.195108567 0.0454218 0.10990991 0.105057 1.202224324 0.0398322 0.043243243 0.165819
biological_process regulation of cholesterol transport GO:0032374 16512 25 1.195108567 0.0454218 0.10990991 0.105057 1.202224324 0.0398322 0.043243243 0.165819
molecular_function oxidoreductase activity, acting on single donors with incorporation of molecular oxygen GO:0016701 16784 77 1.110948712 0.0454981 0.068468468 0.119088 1.200702569 0.00111606 0.003603604 0
biological_process lymphocyte activation GO:0046649 16153 384 1.049187552 0.0455968 0.156756757 0.105025 1.109733289 8.21E-05 0.001801802 0.00593902
biological_process T cell mediated immunity GO:0002456 16491 46 1.143567754 0.0456211 0.01981982 0.104963 0.998336527 0.507828 0.52972973 -1
molecular_function cholesterol binding GO:0015485 16833 28 1.183748661 0.0459453 0.126126126 0.118667 1.133949419 0.109593 0.108108108 0.196485
biological_process single-organism metabolic process GO:0044710 13841 2696 1.017092688 0.046463 0.277477477 0.106209 0.983844807 0.943918 0.758558559 -1
biological_process cellular protein complex disassembly GO:0043624 16470 67 1.118253308 0.0464863 0.091891892 0.106146 1.128794421 0.0336492 0.032432432 0.153594
biological_process response to hexose stimulus GO:0009746 16412 125 1.086113164 0.0470786 0.102702703 0.107909 1.115253422 0.0125319 0.007207207 0.095565
biological_process drug transport GO:0015893 16508 29 1.179010666 0.047345 0.100900901 0.109033 0.953310275 0.668559 0.627027027 -1
cellular_component microvillus GO:0005902 16761 62 1.122279835 0.0473821 0.153153153 0.0957179 1.009936425 0.44601 0.434234234 -1
biological_process regulation of chromosome organization GO:0033044 16435 102 1.095170078 0.0474665 0.169369369 0.108988 1.174220608 0.00111755 0.054054054 0.0421715
biological_process autophagy GO:0006914 16433 104 1.094201602 0.0475423 0.165765766 0.108934 1.029164688 0.302675 0.273873874 -1
biological_process regulation of biosynthetic process GO:0009889 13546 2991 1.015950793 0.0475627 0.376576577 0.108869 1.052602975 1.84E-08 0.165765766 0
biological_process embryonic camera-type eye development GO:0031076 16503 34 1.165074677 0.0475703 0.185585586 0.108802 1.132041908 0.090952 0.221621622 0.2511
molecular_function cyclic-nucleotide phosphodiesterase activity GO:0004112 16837 24 1.196502763 0.0475992 0.09009009 0.118638 0.999877088 0.500427 0.473873874 -1
biological_process establishment of tissue polarity GO:0007164 16503 34 1.164982198 0.0476631 0.163963964 0.108751 1.231385639 0.00966001 0.095495495 0.0783139
biological_process negative regulation of cytokine production GO:0001818 16445 92 1.100118268 0.0476664 0.135135135 0.108683 0.986640105 0.588093 0.6 -1
biological_process response to ketone GO:1901654 16439 98 1.096957835 0.0477179 0.075675676 0.108625 0.992290685 0.552766 0.569369369 -1
biological_process heterocycle catabolic process GO:0046700 15820 717 1.035156316 0.0477654 0.185585586 0.108565 1.050510043 0.00830954 0.073873874 0.0772602
biological_process skeletal muscle cell differentiation GO:0035914 16486 51 1.134263774 0.0481255 0.07027027 0.10857 1.244695494 0.00121703 0.009009009 0.0411689
biological_process positive regulation of cellular carbohydrate metabolic process GO:0010676 16504 33 1.166870256 0.0482573 0.104504505 0.108528 1.115597901 0.124802 0.263063063 0.300517
biological_process positive regulation of Rac GTPase activity GO:0032855 16509 28 1.180778059 0.0486328 0.122522523 0.109666 1.27467036 0.0058753 0.005405405 0.0645124
biological_process CD4-positive, alpha-beta T cell differentiation GO:0043367 16499 38 1.155027981 0.0487453 0.05045045 0.10962 1.056275816 0.273748 0.369369369 0.489594
molecular_function Rho GTPase binding GO:0017048 16815 46 1.140837085 0.0487852 0.237837838 0.122615 1.278597406 0.000523979 0.023423423 0
biological_process regulation of cyclase activity GO:0031279 16504 33 1.16611167 0.0490196 0.086486486 0.109607 1.076272361 0.223739 0.333333333 0.422951
biological_process regulation of cellular biosynthetic process GO:0031326 13572 2965 1.015890534 0.0490684 0.376576577 0.109548 1.05349632 1.28E-08 0.158558559 0
biological_process embryonic camera-type eye morphogenesis GO:0048596 16512 25 1.190803316 0.0490993 0.205405405 0.109485 1.14115265 0.110603 0.252252252 0.276472
biological_process leukocyte mediated immunity GO:0002443 16369 168 1.07320294 0.0492918 0.131531532 0.109455 0.943537209 0.898702 0.866666667 -1
biological_process nephron tubule development GO:0072080 16505 32 1.168362348 0.049349 0.126126126 0.109398 1.06961973 0.247379 0.322522523 0.455902
molecular_function deacetylase activity GO:0019213 16831 30 1.173756336 0.0494828 0.030630631 0.126377 0.977263109 0.585477 0.601801802 -1
biological_process regulation of endopeptidase activity GO:0052548 16346 191 1.068493117 0.0495633 0.196396396 0.109373 0.952238179 0.87494 0.855855856 -1
molecular_function lipase activity GO:0016298 16781 80 1.106184731 0.049579 0.133333333 0.125821 0.985247043 0.590614 0.551351351 -1
molecular_function phosphatase inhibitor activity GO:0019212 16831 30 1.173633772 0.049602 0.059459459 0.129284 1.212098985 0.0220061 0.016216216 0.0504511
cellular_component anchored to membrane GO:0031225 16723 100 1.094859123 0.0496823 0.102702703 0.0956495 0.950503364 0.805081 0.740540541 -1
biological_process response to corticosteroid stimulus GO:0031960 16383 154 1.076257702 0.049798 0.232432432 0.109914 0.98229826 0.648928 0.663063063 -1
biological_process nephron epithelium development GO:0072009 16496 41 1.148268407 0.0498397 0.12972973 0.109854 1.088229096 0.163618 0.291891892 0.35476
biological_process gene silencing by miRNA GO:0035195 16514 23 1.198066928 0.0498399 0.048648649 0.109784 1.168695738 0.0804194 0.10990991 0.238596
molecular_function protease binding GO:0002020 16811 50 1.134226797 0.0498403 0.102702703 0.12877 1.05314265 0.257257 0.23963964 0.45203
biological_process coronary vasculature morphogenesis GO:0060977 16517 20 1.212067143 0.0501238 0.041441441 0.110895 1.184536516 0.07632 0.021621622 0.231028
biological_process lymphocyte differentiation GO:0030098 16327 210 1.065008221 0.050284 0.117117117 0.110859 1.138311507 0.000238094 0.001801802 0.0147314
biological_process sensory perception of taste GO:0050909 16511 26 1.185743995 0.0503228 0.064864865 0.110797 1.132537683 0.12071 0.136936937 0.294483
biological_process zinc ion transport GO:0006829 16512 25 1.188897396 0.0508015 0.01981982 0.112503 1.022429315 0.422952 0.455855856 -1
biological_process cellular hormone metabolic process GO:0034754 16473 64 1.117853504 0.0508996 0.079279279 0.112453 1.02351364 0.372067 0.362162162 -1

biological_process endochondral bone morphogenesis GO:0060350 16494 43 1.143771349 0.051018 0.178378378 0.112407 1.063763659 0.234188 0.248648649 0.433226
biological_process positive regulation of nucleotide biosynthetic process GO:0030810 16481 56 1.125880498 0.0510922 0.077477477 0.112838 1.144044355 0.0307287 0.081081081 0.147046
biological_process positive regulation of purine nucleotide biosynthetic process GO:1900373 16481 56 1.125880498 0.0510922 0.077477477 0.112838 1.144044355 0.0307287 0.081081081 0.147046
biological_process epithelial cell development GO:0002064 16355 182 1.069488539 0.051268 0.061261261 0.11336 1.065348874 0.062349 0.088288288 0.210204
biological_process organic substance catabolic process GO:1901575 14995 1542 1.022825646 0.0515273 0.257657658 0.113899 1.035797426 0.00528457 0.145945946 0.0628931
biological_process trabecula formation GO:0060343 16516 21 1.205245601 0.0515384 0.054054054 0.11383 0.896967538 0.793432 0.789189189 -1
biological_process negative regulation of carbohydrate metabolic process GO:0045912 16516 21 1.205228324 0.0515529 0.102702703 0.113762 1.123045028 0.164226 0.081081081 0.354003
biological_process regulation of TOR signaling cascade GO:0032006 16503 34 1.160891783 0.0519118 0.054054054 0.113766 1.073630782 0.228327 0.257657658 0.42657
biological_process skin development GO:0043588 16486 51 1.131285478 0.0519313 0.133333333 0.113699 1.23981308 0.00148448 0.025225225 0.0430424
molecular_functionoxidoreductase activity, acting on single donors with incorporation of molecular oxygen, incorporation of two atoms of oxygenGO:0016702 16786 75 1.108060647 0.052129 0.082882883 0.132948 1.188543045 0.00229475 0.003603604 0
molecular_function core promoter proximal region sequence-specific DNA binding GO:0000987 16822 39 1.149899309 0.0522615 0.048648649 0.132387 1.253594834 0.00301375 0.041441441 0
biological_process antigen receptor-mediated signaling pathway GO:0050851 16470 67 1.114123502 0.0524819 0.048648649 0.114298 1.06497195 0.178011 0.176576577 0.372476
biological_process response to radiation GO:0009314 16239 298 1.053720738 0.052521 0.181981982 0.114235 1.037134923 0.13127 0.304504505 0.311209
molecular_function activating transcription factor binding GO:0033613 16819 42 1.144156936 0.0525946 0.154954955 0.1319 1.272072138 0.00111455 0.018018018 0
biological_process dopamine receptor signaling pathway GO:0007212 16510 27 1.17984562 0.052624 0.140540541 0.114186 1.085037837 0.221857 0.135135135 0.420037
biological_process positive regulation of leukocyte mediated immunity GO:0002705 16489 48 1.134776706 0.0526525 0.084684685 0.11412 0.975297503 0.616738 0.652252252 -1
biological_process regulation of leukocyte migration GO:0002685 16464 73 1.109047686 0.0529066 0.093693694 0.114655 1.137472147 0.0207306 0.023423423 0.126229
molecular_function inorganic cation transmembrane transporter activity GO:0022890 16423 438 1.044019561 0.0529534 0.237837838 0.131425 1.016977572 0.26645 0.385585586 0.459969
biological_process regulation of transmembrane transporter activity GO:0022898 16462 75 1.107318539 0.0533264 0.300900901 0.115775 1.20314826 0.00112839 0.041441441 0.0419329
biological_process circadian rhythm GO:0007623 16449 88 1.098781661 0.053779 0.118918919 0.117448 1.060970544 0.160291 0.252252252 0.350837
biological_process pituitary gland development GO:0021983 16498 39 1.148538183 0.0538547 0.063063063 0.117391 1.160578869 0.0410198 0.095495495 0.167284
cellular_component MHC class I protein complex GO:0042612 16797 26 1.18170077 0.0541368 0.163963964 0.107525 0.841636942 0.919209 0.753153153 -1
biological_process sterol metabolic process GO:0016125 16437 100 1.092326753 0.0543594 0.144144144 0.118523 1.035846943 0.266734 0.322522523 0.480894
biological_process regulation of carbohydrate metabolic process GO:0006109 16442 95 1.094628446 0.0545671 0.18018018 0.119042 1.153597141 0.00465438 0.064864865 0.0591332
biological_process gastrulation with mouth forming second GO:0001702 16505 32 1.163237769 0.0546952 0.10990991 0.119542 1.16188482 0.0561806 0.127927928 0.197338
biological_process cell recognition GO:0008037 16483 54 1.125496981 0.0548085 0.138738739 0.119493 1.09721186 0.107616 0.227027027 0.271791
molecular_function tubulin binding GO:0015631 16711 150 1.075041213 0.0549084 0.190990991 0.135417 1.078583698 0.0470142 0.198198198 0.0805455
biological_process glycolipid metabolic process GO:0006664 16468 69 1.110871755 0.0549672 0.032432432 0.119453 1.000956763 0.494521 0.475675676 -1
biological_process endocrine pancreas development GO:0031018 16496 41 1.143790899 0.0551676 0.084684685 0.119424 1.138021462 0.0626846 0.07027027 0.210061
biological_process cellular nitrogen compound catabolic process GO:0044270 15820 717 1.033672049 0.0551847 0.207207207 0.119353 1.049015657 0.0100596 0.082882883 0.0805799
biological_process T cell selection GO:0045058 16508 29 1.170899747 0.0553071 0.041441441 0.119306 1.228706203 0.016376 0.05045045 0.11129
biological_process spindle localization GO:0051653 16514 23 1.191825682 0.0554091 0.095495495 0.119255 1.233027372 0.0263714 0.082882883 0.136957
biological_process positive regulation of multicellular organism growth GO:0040018 16511 26 1.179850788 0.0559577 0.086486486 0.119846 1.15688728 0.0827714 0.153153153 0.243874
biological_process cellular response to dsRNA GO:0071359 16512 25 1.183339269 0.0560348 0.113513514 0.119789 0.977388653 0.577704 0.56036036 -1
biological_process transcription, DNA-dependent GO:0006351 13845 2692 1.016164625 0.056209 0.381981982 0.119753 1.051901253 1.72E-07 0.163963964 0
biological_process tumor necrosis factor production GO:0032640 16472 65 1.113195684 0.0566207 0.081081081 0.12078 0.946814675 0.771633 0.724324324 -1
biological_process regulation of tumor necrosis factor production GO:0032680 16472 65 1.113195684 0.0566207 0.081081081 0.12078 0.946814675 0.771633 0.724324324 -1
molecular_function protein phosphatase inhibitor activity GO:0004864 16834 27 1.175705932 0.0567516 0.054054054 0.139338 1.198553727 0.0368523 0.028828829 0.0594402
biological_process hormone transport GO:0009914 16356 181 1.067499857 0.0568717 0.201801802 0.120761 1.084063139 0.0244372 0.171171171 0.134873
biological_process regulation of ion transmembrane transporter activity GO:0032412 16466 71 1.108075734 0.0569742 0.308108108 0.12071 1.235296607 0.000289283 0.014414414 0.014315
biological_process regulation of macromolecule biosynthetic process GO:0010556 13664 2873 1.015466828 0.0571397 0.389189189 0.120672 1.055165005 8.81E-09 0.156756757 0
biological_process positive regulation of cAMP metabolic process GO:0030816 16490 47 1.132696223 0.0572929 0.088288288 0.120557 1.153849382 0.0336656 0.081081081 0.153352
biological_process positive regulation of cAMP biosynthetic process GO:0030819 16490 47 1.132696223 0.0572929 0.088288288 0.120557 1.153849382 0.0336656 0.081081081 0.153352
biological_process positive regulation of leukocyte activation GO:0002696 16372 165 1.070485851 0.0575067 0.102702703 0.12053 1.130395826 0.00177463 0.003603604 0.0434233
biological_process response to isoquinoline alkaloid GO:0014072 16508 29 1.168677063 0.0576642 0.245045045 0.120491 1.120174186 0.130958 0.185585586 0.31064
molecular_function Rab guanyl-nucleotide exchange factor activity GO:0017112 16839 22 1.193173147 0.0581623 0.10990991 0.139218 1.188056744 0.0631576 0.113513514 0.105114
biological_process positive regulation of multicellular organismal metabolic process GO:0044253 16512 25 1.181162457 0.0581968 0.099099099 0.122154 0.959514607 0.637183 0.704504505 -1
biological_process immune response-regulating cell surface receptor signaling pathway GO:0002768 16451 86 1.097393157 0.0583908 0.043243243 0.122122 1.030771174 0.310125 0.275675676 -1
biological_process regulation of coagulation GO:0050818 16486 51 1.126422034 0.0586542 0.095495495 0.122644 1.095066928 0.119457 0.108108108 0.292258
biological_process T cell proliferation GO:0042098 16420 117 1.083248289 0.0587666 0.081081081 0.122594 1.040435583 0.223584 0.246846847 0.422787
biological_process negative regulation of histone modification GO:0031057 16516 21 1.196682321 0.0591319 0.081081081 0.123675 1.239199263 0.0287301 0.075675676 0.142779
biological_process receptor metabolic process GO:0043112 16439 98 1.090605097 0.0595986 0.210810811 0.12424 1.152472714 0.00436889 0.037837838 0.0575827
biological_process purine nucleoside metabolic process GO:0042278 15917 620 1.035442829 0.059622 0.223423423 0.124169 1.037842003 0.0481133 0.144144144 0.182273
biological_process positive regulation of myeloid cell differentiation GO:0045639 16484 53 1.123337747 0.0596506 0.100900901 0.1241 1.24607892 0.000941953 0.010810811 0.0375345
biological_process anterior/posterior axis specification GO:0009948 16502 35 1.151854964 0.0596534 0.066666667 0.124025 1.109151438 0.131435 0.266666667 0.310953
cellular_component recycling endosome membrane GO:0055038 16794 29 1.166839461 0.0596713 0.158558559 0.108303 1.122616898 0.126169 0.194594595 0.226661
molecular_function peptide binding GO:0042277 16721 140 1.075622967 0.0598237 0.068468468 0.146849 0.924674838 0.939464 0.913513514 -1
biological_process response to metal ion GO:0010038 16301 236 1.058070084 0.0598293 0.165765766 0.124523 1.046048424 0.108583 0.169369369 0.274288
biological_process columnar/cuboidal epithelial cell differentiation GO:0002065 16473 64 1.112033554 0.059928 0.10990991 0.125004 1.095066891 0.0934478 0.171171171 0.254027
biological_process positive regulation of neural precursor cell proliferation GO:2000179 16506 31 1.161060104 0.060014 0.156756757 0.12548 1.142955112 0.0838103 0.135135135 0.243781
biological_process fibroblast migration GO:0010761 16517 20 1.200433291 0.060154 0.147747748 0.126499 1.114552005 0.187317 0.254054054 0.381683
biological_process regulation of transporter activity GO:0032409 16455 82 1.098794599 0.0601677 0.30990991 0.126425 1.188620546 0.0015096 0.021621622 0.0429711
biological_process positive regulation of cell death GO:0010942 16129 408 1.043823513 0.0602861 0.081081081 0.126906 1.013175042 0.320374 0.36036036 -1
biological_process regulation of catecholamine secretion GO:0050433 16505 32 1.158260579 0.0603163 0.203603604 0.126836 1.079876446 0.216709 0.277477477 0.416201
biological_process positive regulation of defense response GO:0031349 16405 132 1.077659437 0.0603776 0.100900901 0.126773 0.953042439 0.825963 0.763963964 -1
biological_process startle response GO:0001964 16516 21 1.195138973 0.0605894 0.156756757 0.126744 1.172409138 0.0854508 0.171171171 0.243793
molecular_function acetylglucosaminyltransferase activity GO:0008375 16827 34 1.153248207 0.060653 0.088288288 0.150279 1.132058885 0.0909233 0.091891892 0.163159
molecular_function 3',5'-cyclic-nucleotide phosphodiesterase activity GO:0004114 16838 23 1.186362685 0.0606765 0.122522523 0.149627 1.009731814 0.467773 0.448648649 -1
molecular_function transferase activity, transferring sulfur-containing groups GO:0016782 16801 60 1.11522034 0.0607361 0.162162162 0.148993 0.878423446 0.948881 0.969369369 -1
biological_process response to vitamin D GO:0033280 16512 25 1.178680891 0.0607408 0.144144144 0.126702 0.853334548 0.898172 0.706306306 -1
cellular_component AP-type membrane coat adaptor complex GO:0030119 16788 35 1.150758039 0.0609989 0.163963964 0.113597 1.168980317 0.0415154 0.102702703 0.0349711
biological_process granulocyte differentiation GO:0030851 16513 24 1.181671387 0.0614585 0.048648649 0.12943 1.219039996 0.0314451 0.059459459 0.148689
biological_process regulation of cell adhesion mediated by integrin GO:0033628 16507 30 1.162333032 0.0616078 0.054054054 0.129912 1.264679483 0.00598125 0.03963964 0.0652546
biological_process positive regulation of cyclic nucleotide biosynthetic process GO:0030804 16482 55 1.119736776 0.0617076 0.088288288 0.129857 1.14357177 0.0323533 0.091891892 0.149403
biological_process regulation of organic acid transport GO:0032890 16498 39 1.142252715 0.0617187 0.201801802 0.129781 1.078551501 0.197485 0.237837838 0.393725
biological_process membrane lipid metabolic process GO:0006643 16416 121 1.080480398 0.0619039 0.061261261 0.129746 1.019793514 0.352565 0.286486486 -1
biological_process positive regulation of ion transport GO:0043270 16437 100 1.088581427 0.0619133 0.297297297 0.12967 1.130937354 0.0114595 0.158558559 0.088723
biological_process negative regulation of chromosome organization GO:2001251 16503 34 1.152198762 0.0619382 0.115315315 0.129598 1.174333242 0.0389934 0.084684685 0.16447
biological_process regulation of transcription, DNA-dependent GO:0006355 13936 2601 1.015971205 0.0621869 0.394594595 0.130101 1.059179192 6.19E-09 0.158558559 0
biological_process cholesterol efflux GO:0033344 16505 32 1.156537269 0.0623646 0.093693694 0.130064 1.0963726 0.172293 0.126126126 0.365672
biological_process divalent inorganic cation transport GO:0072511 16292 245 1.056173457 0.062484 0.320720721 0.130014 1.088090163 0.00806222 0.214414414 0.0769187

biological_process positive regulation of JAK-STAT cascade GO:0046427 16497 40 1.139784886 0.0626243 0.052252252 0.129968 1.148238173 0.0519933 0.133333333 0.18783
biological_process regulation of fat cell differentiation GO:0045598 16475 62 1.112202765 0.0626255 0.10990991 0.12989 1.173769878 0.00878957 0.061261261 0.0776575
biological_process odontogenesis of dentin-containing tooth GO:0042475 16474 63 1.111295233 0.0626426 0.104504505 0.129816 1.273442783 8.28E-05 0.023423423 0.00592147
molecular_function ligand-dependent nuclear receptor binding GO:0016922 16839 22 1.188558141 0.0626538 0.077477477 0.149058 1.224793486 0.0338161 0.030630631 0.0511186
biological_process response to glucose stimulus GO:0009749 16418 119 1.080814669 0.0626973 0.127927928 0.130274 1.140285746 0.00390394 0.003603604 0.0593857
biological_process circadian behavior GO:0048512 16513 24 1.18040158 0.0627783 0.14954955 0.130214 1.079920536 0.248693 0.266666667 0.45753
biological_process response to amino acid stimulus GO:0043200 16452 85 1.095627967 0.0628881 0.082882883 0.130162 0.993001945 0.54463 0.547747748 -1
biological_process face morphogenesis GO:0060325 16507 30 1.161155941 0.0629788 0.158558559 0.130105 1.097943735 0.176187 0.236036036 0.370009
molecular_function protein kinase C binding GO:0005080 16817 44 1.132886935 0.0631605 0.012612613 0.148596 1.042411791 0.312809 0.29009009 -1
biological_process regulation of cardiac muscle cell contraction GO:0086004 16515 22 1.187747863 0.0634703 0.14954955 0.132222 1.330158652 0.00363702 0.034234234 0.0588933
biological_process B cell activation GO:0042113 16387 150 1.071209257 0.0645783 0.138738739 0.132404 1.056568179 0.114016 0.144144144 0.282666
biological_process female gamete generation GO:0007292 16454 83 1.095864641 0.0646957 0.169369369 0.132352 1.053629532 0.198121 0.257657658 0.393808
biological_process forebrain generation of neurons GO:0021872 16493 44 1.131387119 0.0653277 0.198198198 0.132422 1.215111931 0.00666638 0.025225225 0.0686853
biological_process purine ribonucleoside metabolic process GO:0046128 15921 616 1.034490315 0.0653984 0.228828829 0.132359 1.035263822 0.0611878 0.162162162 0.206655
cellular_component early endosome GO:0005769 16652 171 1.066355237 0.0654328 0.272072072 0.11411 1.086230781 0.024814 0.12972973 0.0156959
biological_process actin cytoskeleton reorganization GO:0031532 16489 48 1.125658786 0.065511 0.153153153 0.132306 1.139606508 0.0467024 0.135135135 0.180655
biological_process T cell activation GO:0042110 16268 269 1.052624892 0.065876 0.165765766 0.133351 1.13017551 9.63E-05 0.016216216 0.00870287
molecular_function channel regulator activity GO:0016247 16807 54 1.118076863 0.0661226 0.230630631 0.156446 1.114175913 0.0727551 0.201801802 0.116429
biological_process positive regulation of chromosome organization GO:2001252 16495 42 1.133707376 0.0664507 0.189189189 0.134443 1.270633467 0.00117605 0.01981982 0.0415482
biological_process response to inorganic substance GO:0010035 16191 346 1.046100141 0.0666893 0.14954955 0.135452 1.022741702 0.229526 0.288288288 0.428622
biological_process glycerolipid biosynthetic process GO:0045017 16416 121 1.078481488 0.0667014 0.072072072 0.135374 0.963695126 0.756265 0.823423423 -1
molecular_function glycoprotein binding GO:0001948 16803 58 1.11340404 0.0670013 0.142342342 0.156109 1.18690541 0.00676032 0.046846847 0
biological_process spinal cord motor neuron differentiation GO:0021522 16515 22 1.184009903 0.0673412 0.077477477 0.138531 1.242294598 0.0244349 0.027027027 0.13523
biological_process negative regulation of growth GO:0045926 16371 166 1.066630666 0.0675311 0.14954955 0.138495 1.112163049 0.00594014 0.045045045 0.0655006
biological_process granulocyte chemotaxis GO:0071621 16484 53 1.117882026 0.0682691 0.084684685 0.139106 1.222531015 0.00247295 0.009009009 0.0501089
molecular_function O-acyltransferase activity GO:0008374 16824 37 1.14111124 0.068329 0.084684685 0.155947 0.975406703 0.602345 0.547747748 -1
biological_process regulation of RNA biosynthetic process GO:2001141 13932 2605 1.015418569 0.0688179 0.398198198 0.140181 1.05910801 6.25E-09 0.158558559 0
biological_process cytokine secretion GO:0050663 16457 80 1.09547013 0.0690925 0.133333333 0.140676 0.907494843 0.924593 0.951351351 -1
biological_process RNA biosynthetic process GO:0032774 13833 2704 1.015058523 0.069111 0.390990991 0.140597 1.051370033 2.11E-07 0.162162162 0
biological_process response to acid GO:0001101 16435 102 1.084479274 0.0691258 0.099099099 0.140517 0.994516229 0.538357 0.556756757 -1
biological_process response to pain GO:0048265 16509 28 1.160823948 0.0700774 0.178378378 0.143719 1.241568994 0.0133491 0.048648649 0.097984
biological_process regulation of protein export from nucleus GO:0046825 16517 20 1.189936219 0.0704942 0.075675676 0.144751 1.084608745 0.255995 0.218018018 0.467382
biological_process cholesterol metabolic process GO:0008203 16444 93 1.087871622 0.0705289 0.151351351 0.145179 1.050582336 0.198432 0.236036036 0.393896
biological_process hormone secretion GO:0046879 16362 175 1.063749356 0.070992 0.210810811 0.145716 1.085849182 0.0239887 0.18018018 0.133365
biological_process regulation of gene expression GO:0010468 13508 3029 1.013921264 0.0710514 0.396396396 0.145645 1.055583409 2.28E-09 0.124324324 0
molecular_function protein complex scaffold GO:0032947 16821 40 1.133780823 0.0711532 0.023423423 0.170773 1.007840759 0.465744 0.455855856 -1
biological_process mesenchyme morphogenesis GO:0072132 16515 22 1.180392877 0.0712581 0.064864865 0.146115 0.998991865 0.503289 0.463063063 -1
biological_process regulation of myeloid leukocyte differentiation GO:0002761 16470 67 1.103221391 0.0712739 0.073873874 0.146033 1.089391595 0.102061 0.097297297 0.263719
biological_process divalent metal ion transport GO:0070838 16294 243 1.053877672 0.071394 0.331531532 0.145978 1.089545739 0.00743249 0.214414414 0.0756901
biological_process positive regulation of fibroblast proliferation GO:0048146 16500 37 1.138515242 0.0720117 0.03963964 0.148056 0.996852492 0.513263 0.554954955 -1
biological_process acidic amino acid transport GO:0015800 16517 20 1.188448731 0.0720638 0.113513514 0.147983 0.972720601 0.583747 0.547747748 -1
biological_process proximal/distal pattern formation GO:0009954 16514 23 1.175667846 0.0721158 0.203603604 0.14791 0.976847079 0.576329 0.538738739 -1
molecular_function amide binding GO:0033218 16712 149 1.068667851 0.0723864 0.077477477 0.181035 0.941699463 0.89218 0.893693694 -1
biological_process heterophilic cell-cell adhesion GO:0007157 16511 26 1.164799155 0.0726132 0.232432432 0.147951 1.496456021 5.72E-06 0.012612613 0
biological_process response to fluid shear stress GO:0034405 16517 20 1.187886388 0.0726642 0.142342342 0.147877 1.283000985 0.0141374 0.052252252 0.10041
biological_process negative regulation of cell cycle GO:0045786 16356 181 1.062148026 0.0726791 0.102702703 0.147794 1.059001069 0.0834169 0.189189189 0.243588
molecular_functionoxidoreductase activity, acting on paired donors, with incorporation or reduction of molecular oxygen, NAD(P)H as one donor, and incorporation of one atom of oxygenGO:0016709 16836 25 1.167938122 0.0727679 0.099099099 0.180442 1.012430965 0.457112 0.45045045 -1
biological_process response to morphine GO:0043278 16509 28 1.158521883 0.0729596 0.245045045 0.14828 1.112886571 0.150223 0.189189189 0.34157
biological_process regulation of binding GO:0051098 16373 164 1.065104154 0.0733595 0.05045045 0.148795 1.074388051 0.048639 0.100900901 0.181819
biological_process lipopolysaccharide-mediated signaling pathway GO:0031663 16500 37 1.137413762 0.0736195 0.138738739 0.149273 0.971649191 0.617564 0.594594595 -1
biological_process oocyte development GO:0048599 16507 30 1.152311634 0.0740527 0.205405405 0.149298 1.055878856 0.297862 0.259459459 -1
biological_process lymphocyte migration GO:0072676 16511 26 1.163427019 0.0743029 0.16036036 0.149276 1.204474813 0.0353599 0.104504505 0.157693
biological_process regulation of cardiac muscle tissue development GO:0055024 16500 37 1.136930026 0.0743342 0.052252252 0.149197 1.07847641 0.203921 0.29009009 0.401315
molecular_function core promoter proximal region DNA binding GO:0001159 16821 40 1.131298909 0.0749287 0.064864865 0.18405 1.238205039 0.00449336 0.046846847 0
biological_process regulation of phosphoprotein phosphatase activity GO:0043666 16509 28 1.156828807 0.0751367 0.210810811 0.149318 1.309810327 0.00224234 0.025225225 0.0497234
biological_process activation of MAPKK activity GO:0000186 16507 30 1.151493314 0.0751482 0.2 0.149233 1.190788804 0.0350222 0.073873874 0.156604
biological_process regulation of erythrocyte differentiation GO:0045646 16508 29 1.154010687 0.0752503 0.117117117 0.149172 1.318355834 0.00147903 0.005405405 0.0431185
biological_process establishment of protein localization GO:0045184 15389 1148 1.023593661 0.0756173 0.327927928 0.150175 1.02148469 0.095632 0.212612613 0.256306
biological_process regulation of multicellular organismal metabolic process GO:0044246 16508 29 1.153572822 0.0758321 0.133333333 0.150143 0.954995011 0.662834 0.772972973 -1
biological_process intracellular receptor signaling pathway GO:0030522 16415 122 1.074667176 0.0758381 0.196396396 0.150057 1.135659549 0.00459396 0.075675676 0.0594455
biological_process interleukin-6 production GO:0032635 16471 66 1.101675832 0.0758506 0.072072072 0.149885 0.914112682 0.887062 0.753153153 -1
biological_process regulation of interleukin-6 production GO:0032675 16471 66 1.101675832 0.0758506 0.072072072 0.149885 0.914112682 0.887062 0.753153153 -1
biological_process histone demethylation GO:0016577 16517 20 1.184615123 0.0762327 0.12972973 0.150392 1.422709998 0.00052585 0.007207207 0.0281728
biological_process regulation of pH GO:0006885 16496 41 1.128848175 0.0762502 0.075675676 0.150309 0.905665938 0.852588 0.895495495 -1
biological_process myeloid leukocyte mediated immunity GO:0002444 16496 41 1.128691845 0.0764993 0.104504505 0.150287 1.004200608 0.481419 0.457657658 -1
biological_process nucleobase-containing small molecule metabolic process GO:0055086 15616 921 1.026249144 0.0778426 0.241441441 0.151044 1.020350821 0.135525 0.232432432 0.318513
biological_process neuron fate commitment GO:0048663 16492 45 1.122023039 0.077848 0.079279279 0.150958 1.08011 0.175659 0.063063063 0.369773
biological_process defense response to virus GO:0051607 16435 102 1.080877338 0.0779307 0.111711712 0.150891 0.914063101 0.934229 0.962162162 -1
biological_process nephron epithelium morphogenesis GO:0072088 16511 26 1.16054786 0.0779459 0.106306306 0.150807 1.132156276 0.121389 0.187387387 0.296053
biological_process endoderm formation GO:0001706 16513 24 1.166730999 0.0784206 0.140540541 0.152324 1.079482151 0.249874 0.315315315 0.458864
cellular_component PML body GO:0016605 16752 71 1.096747021 0.0785362 0.203603604 0.134027 1.175203058 0.0051965 0.100900901 0
biological_process neutrophil chemotaxis GO:0030593 16493 44 1.122674373 0.0790804 0.095495495 0.152902 1.13303347 0.0629511 0.03963964 0.210566
biological_process chromatin assembly or disassembly GO:0006333 16406 131 1.070847562 0.0792641 0.41981982 0.152862 0.978189956 0.667913 0.562162162 -1
biological_process negative regulation of proteolysis GO:0045861 16505 32 1.143756056 0.0792894 0.086486486 0.153272 1.073980913 0.234063 0.174774775 0.433089
biological_process positive regulation of striated muscle cell differentiation GO:0051155 16516 21 1.17724074 0.0796118 0.201801802 0.15425 1.148256889 0.119501 0.223423423 0.292116
biological_process lipid localization GO:0010876 16329 208 1.055945757 0.0798044 0.21981982 0.154702 1.123692058 0.000937361 0.007207207 0.0359845
biological_process synaptic transmission, GABAergic GO:0051932 16508 29 1.150411858 0.0801345 0.340540541 0.155678 1.070240951 0.256007 0.340540541 0.46718
biological_process amide transport GO:0042886 16375 162 1.063338394 0.0802909 0.196396396 0.15563 1.05864287 0.0969369 0.27027027 0.258199
molecular_function antigen binding GO:0003823 16841 20 1.181029104 0.0802949 0.154954955 0.192476 1.208961751 0.0526601 0.127927928 0.0977536
molecular_function sterol binding GO:0032934 16828 33 1.140769107 0.080454 0.151351351 0.191747 1.103008006 0.152463 0.151351351 0.298121
biological_process anion homeostasis GO:0055081 16504 33 1.140565277 0.080758 0.095495495 0.155665 1.054698466 0.292969 0.371171171 -1

biological_process carbohydrate derivative transport GO:1901264 16504 33 1.140469995 0.0809002 0.018018018 0.155613 1.072560053 0.234947 0.156756757 0.433662
biological_process gluconeogenesis GO:0006094 16501 36 1.134441618 0.0809564 0.106306306 0.156026 1.12428988 0.097997 0.106306306 0.260867
biological_process positive regulation of muscle cell differentiation GO:0051149 16499 38 1.130723428 0.0811563 0.16036036 0.15599 1.101043677 0.140056 0.214414414 0.327146
biological_process regulation of lymphocyte mediated immunity GO:0002706 16465 72 1.094830692 0.0812457 0.145945946 0.155923 0.947128277 0.781961 0.781981982 -1
biological_process phagocytosis GO:0006909 16450 87 1.086016583 0.0817671 0.201801802 0.15646 1.0750519 0.112055 0.165765766 0.277605
biological_process antigen processing and presentation of exogenous peptide antigen GO:0002478 16516 21 1.175415212 0.0817814 0.154954955 0.156374 1.005220751 0.483482 0.499099099 -1
biological_process positive regulation of histone modification GO:0031058 16503 34 1.137615543 0.0820724 0.201801802 0.157334 1.242785448 0.00705301 0.027027027 0.0740234
molecular_function ADP binding GO:0043531 16840 21 1.17510849 0.0821491 0.18018018 0.195079 1.110844479 0.189336 0.291891892 0.353356
biological_process protein demethylation GO:0006482 16516 21 1.174994822 0.0822873 0.135135135 0.157211 1.391374557 0.000940364 0.007207207 0.0376084
biological_process protein dealkylation GO:0008214 16516 21 1.174994822 0.0822873 0.135135135 0.157211 1.391374557 0.000940364 0.007207207 0.0376084
molecular_function hormone binding GO:0042562 16809 52 1.111026413 0.0824345 0.140540541 0.194404 1.003878274 0.480667 0.468468468 -1
biological_process negative regulation of T cell activation GO:0050868 16478 59 1.104111096 0.0826348 0.183783784 0.157213 1.045404809 0.272553 0.308108108 0.48903
biological_process regulation of cellular macromolecule biosynthetic process GO:2000112 13721 2816 1.013754231 0.0826554 0.403603604 0.157129 1.056398929 6.32E-09 0.144144144 0
biological_process negative regulation of cell-substrate adhesion GO:0010812 16509 28 1.151248566 0.0826632 0.212612613 0.15704 1.143681552 0.0937577 0.192792793 0.254762
molecular_function magnesium ion binding GO:0000287 16692 169 1.061285498 0.082729 0.192792793 0.193738 0.997923913 0.518771 0.495495495 -1
biological_process positive regulation of neuron differentiation GO:0045666 16472 65 1.099094778 0.0827988 0.167567568 0.156986 1.075015887 0.146957 0.27027027 0.336945
biological_process positive regulation of endocytosis GO:0045807 16466 71 1.094629916 0.0831748 0.183783784 0.157481 1.177522514 0.00470971 0.063063063 0.0589035
biological_process regulation of DNA metabolic process GO:0051052 16356 181 1.058994387 0.0834553 0.18018018 0.15795 1.082847117 0.0261237 0.021621622 0.137345
biological_process positive regulation of cell killing GO:0031343 16505 32 1.14076294 0.0837145 0.072072072 0.157929 1.042126139 0.339763 0.390990991 -1
molecular_function phosphatase regulator activity GO:0019208 16808 53 1.109282941 0.0837634 0.214414414 0.199997 1.187536427 0.0089298 0.003603604 0
biological_process aminoglycan biosynthetic process GO:0006023 16493 44 1.119956106 0.0837916 0.117117117 0.158343 1.114151274 0.0945531 0.2 0.255997
biological_process monocyte chemotaxis GO:0002548 16517 20 1.177733978 0.0841723 0.176576577 0.159319 1.386683757 0.00136288 0.055855856 0.0437198
biological_process protein transport GO:0015031 15427 1110 1.023043965 0.0843133 0.336936937 0.159266 1.018149951 0.139137 0.254054054 0.326629
biological_process tissue regeneration GO:0042246 16498 39 1.126708044 0.0850068 0.091891892 0.161766 1.207938487 0.0121655 0.018018018 0.0943339
biological_process maintenance of location in cell GO:0051651 16454 83 1.086634317 0.0852681 0.153153153 0.161745 1.120629886 0.0281769 0.068468468 0.142578
biological_process multicellular organism reproduction GO:0032504 15961 576 1.032388012 0.0852888 0.158558559 0.161658 1.059306327 0.00604786 0.145945946 0.0651015
molecular_function estrogen receptor binding GO:0030331 16838 23 1.164765357 0.0854073 0.245045045 0.203201 1.316421093 0.00426629 0.027027027 0
biological_process regulation of proteasomal ubiquitin-dependent protein catabolic process GO:0032434 16480 57 1.104532729 0.0854552 0.064864865 0.161612 1.112533468 0.0702285 0.016216216 0.220925
biological_process forebrain neuron differentiation GO:0021879 16500 37 1.129605348 0.0858139 0.181981982 0.162096 1.201956569 0.0165803 0.027027027 0.111679
molecular_function G-protein coupled peptide receptor activity GO:0008528 16772 89 1.083382115 0.0859533 0.225225225 0.202635 0.984694623 0.599013 0.535135135 -1
biological_process alpha-beta T cell differentiation GO:0046632 16475 62 1.099894803 0.0861387 0.064864865 0.162571 1.128314295 0.0397794 0.124324324 0.166053
biological_process regulation of fibroblast proliferation GO:0048145 16476 61 1.100693761 0.0861803 0.05045045 0.16249 1.0358315 0.313636 0.320720721 -1
biological_process positive regulation of DNA replication GO:0045740 16497 40 1.124362777 0.08629 0.05045045 0.162427 1.143697101 0.0575106 0.063063063 0.198597
biological_process protein sumoylation GO:0016925 16507 30 1.142786065 0.0875808 0.133333333 0.163645 1.205006612 0.0257894 0.01981982 0.136834
biological_process regulation of lipid biosynthetic process GO:0046890 16453 84 1.085152372 0.0876816 0.2 0.16358 1.034388882 0.292104 0.367567568 -1
biological_process nucleus organization GO:0006997 16486 51 1.109377452 0.0877094 0.192792793 0.163494 1.10642524 0.0936812 0.136936937 0.254881
molecular_function transferase activity, transferring glycosyl groups GO:0016757 16626 235 1.050631955 0.0878806 0.10990991 0.20594 1.094734674 0.0056518 0.037837838 0
biological_process cellular response to heat GO:0034605 16513 24 1.159394335 0.0879519 0.120720721 0.163468 1.124983571 0.144284 0.153153153 0.335734
molecular_function insulin-like growth factor binding GO:0005520 16838 23 1.162821184 0.0879591 0.14954955 0.205149 0.996499068 0.511619 0.488288288 -1
biological_process ribonucleoside metabolic process GO:0009119 15904 633 1.030453273 0.0880162 0.27027027 0.163393 1.033257872 0.069741 0.158558559 0.221151
biological_process sequestering of calcium ion GO:0051208 16486 51 1.109183009 0.0880938 0.185585586 0.163797 1.098132961 0.112051 0.243243243 0.277763
biological_process multi-organism reproductive process GO:0044703 16267 270 1.046979456 0.0888283 0.136936937 0.164858 1.069746403 0.0226787 0.037837838 0.128551
biological_process regulation of JAK-STAT cascade GO:0046425 16480 57 1.102795098 0.0890671 0.036036036 0.165305 1.151013821 0.0239548 0.082882883 0.133591
biological_process aging GO:0007568 16307 230 1.050874466 0.0892093 0.154954955 0.165251 1.056279691 0.0682839 0.189189189 0.219769
biological_process negative regulation of cytokine-mediated signaling pathway GO:0001960 16517 20 1.173483147 0.089378 0.118918919 0.165678 1.341442344 0.00406739 0.061261261 0.0587463
biological_process response to interleukin-1 GO:0070555 16471 66 1.095321299 0.0894822 0.158558559 0.165613 1.056182657 0.21415 0.295495495 0.413742
biological_process negative regulation of cysteine-type endopeptidase activity GO:2000117 16480 57 1.102585055 0.0895113 0.117117117 0.165527 1.024510483 0.374097 0.338738739 -1
biological_process lymphocyte homeostasis GO:0002260 16491 46 1.114041453 0.0898738 0.144144144 0.166007 1.102082132 0.114906 0.183783784 0.283915
biological_process specification of symmetry GO:0009799 16460 77 1.088047982 0.0899093 0.223423423 0.165923 1.200639114 0.00111933 0.03963964 0.0420912
biological_process sleep GO:0030431 16511 26 1.151752236 0.0899147 0.169369369 0.165831 1.070907852 0.265428 0.313513514 0.47881
biological_process regulation of defense response to virus GO:0050688 16507 30 1.140887401 0.090485 0.082882883 0.16731 0.924858951 0.762253 0.735135135 -1
biological_process mesenchymal cell proliferation GO:0010463 16494 43 1.11749492 0.0907409 0.084684685 0.167758 1.194678942 0.0134139 0.122522523 0.0997768
biological_process positive regulation of Wnt receptor signaling pathway GO:0030177 16468 69 1.092626494 0.0908682 0.144144144 0.167699 1.166806363 0.00808728 0.127927928 0.0768333
molecular_function MAP kinase kinase kinase activity GO:0004709 16841 20 1.171991024 0.0912596 0.131531532 0.218507 1.112490334 0.191642 0.257657658 0.35845
biological_process nucleoside metabolic process GO:0009116 15872 665 1.029179324 0.0917232 0.257657658 0.169722 1.034122161 0.059902 0.18018018 0.20479
biological_process monocarboxylic acid transport GO:0015718 16457 80 1.085601915 0.0918694 0.144144144 0.169668 0.980773294 0.617398 0.605405405 -1
biological_process regulation of toll-like receptor signaling pathway GO:0034121 16511 26 1.15023591 0.0921092 0.115315315 0.171042 0.976607234 0.581924 0.571171171 -1
biological_process positive regulation of glucose metabolic process GO:0010907 16512 25 1.153013857 0.0923987 0.100900901 0.171028 1.104993381 0.181429 0.245045045 0.376932
biological_process regulation of exocytosis GO:0017157 16452 85 1.082750629 0.0926184 0.268468468 0.172391 1.151731388 0.00756592 0.081081081 0.0764939
biological_process negative regulation of protein catabolic process GO:0042177 16497 40 1.12076499 0.0926686 0.072072072 0.172309 1.162218144 0.0376069 0.028828829 0.161582
biological_process JAK-STAT cascade GO:0007259 16461 76 1.087211054 0.0934396 0.133333333 0.172899 1.163634982 0.00663321 0.073873874 0.0687642
biological_process fibroblast proliferation GO:0048144 16474 63 1.0958176 0.0934564 0.043243243 0.172806 1.044167261 0.271489 0.291891892 0.488102
biological_process regulation of B cell activation GO:0050864 16462 75 1.087711105 0.0936458 0.118918919 0.172764 0.959130843 0.730561 0.711711712 -1
biological_process sterol transport GO:0015918 16486 51 1.106392042 0.09375 0.140540541 0.1726 1.17903307 0.0132793 0.005405405 0.0980651
biological_process cholesterol transport GO:0030301 16486 51 1.106392042 0.09375 0.140540541 0.1726 1.17903307 0.0132793 0.005405405 0.0980651
biological_process multicellular organismal reproductive process GO:0048609 15966 571 1.031257871 0.0939912 0.176576577 0.172573 1.059938927 0.00579077 0.14954955 0.0646612
cellular_component extrinsic to internal side of plasma membrane GO:0031234 16773 50 1.107306824 0.0940519 0.03963964 0.155143 0.91971281 0.837646 0.899099099 -1
biological_process regulation of cellular carbohydrate metabolic process GO:0010675 16447 90 1.079732417 0.0944758 0.214414414 0.173079 1.14028945 0.010403 0.075675676 0.0850976
biological_process negative regulation of cell growth GO:0030308 16416 121 1.068626866 0.0947241 0.138738739 0.173054 1.149252869 0.00215772 0.016216216 0.0501178
biological_process nucleoside phosphate metabolic process GO:0006753 15655 882 1.024800543 0.0949274 0.272072072 0.173015 1.023155183 0.110466 0.198198198 0.276566
biological_process regulation of cytokine secretion GO:0050707 16467 70 1.090263273 0.0949642 0.205405405 0.172929 0.859709498 0.979197 0.981981982 -1
biological_process actin filament depolymerization GO:0030042 16509 28 1.14285661 0.0950307 0.120720721 0.172851 1.137842168 0.103043 0.126126126 0.264383
molecular_function scavenger receptor activity GO:0005044 16823 38 1.122474796 0.0952395 0.106306306 0.219624 0.903370972 0.849179 0.789189189 -1
biological_process regulation of vasodilation GO:0042312 16512 25 1.150793509 0.0956261 0.236036036 0.17385 1.145278918 0.103999 0.234234234 0.265339
biological_process small molecule metabolic process GO:0044281 14723 1814 1.016712339 0.0957258 0.246846847 0.173782 0.991052196 0.757928 0.677477477 -1
biological_process regulation of heart growth GO:0060420 16507 30 1.137469 0.0958929 0.104504505 0.173733 1.123686554 0.120109 0.147747748 0.294518
molecular_function dioxygenase activity GO:0051213 16782 79 1.084422411 0.0963321 0.120720721 0.219297 1.158544633 0.00721152 0.007207207 0
molecular_function nucleoside-triphosphatase activity GO:0017111 16067 794 1.025988174 0.0969143 0.236036036 0.218716 1.033046513 0.0492402 0.218018018 0.0888742
biological_process peptide transport GO:0015833 16382 155 1.059889053 0.0972431 0.189189189 0.174949 1.066887621 0.0736424 0.236036036 0.227949
biological_process endoderm development GO:0007492 16484 53 1.102660313 0.0973921 0.176576577 0.174895 1.087575507 0.134356 0.254054054 0.317327
molecular_function phosphorus-oxygen lyase activity GO:0016849 16837 24 1.152587422 0.0975427 0.221621622 0.221249 1.354471472 0.00130626 0.025225225 0

biological_process response to glucocorticoid stimulus GO:0051384 16391 146 1.061634928 0.0975666 0.252252252 0.174848 0.977461545 0.682227 0.718918919 -1
biological_process positive regulation of adenylate cyclase activity GO:0045762 16517 20 1.166535489 0.0983961 0.158558559 0.176372 1.168137864 0.0962593 0.257657658 0.257311
biological_process cardiac muscle cell contraction GO:0086003 16514 23 1.155235257 0.0984622 0.194594595 0.176293 1.283998428 0.00911964 0.057657658 0.077825
biological_process very long-chain fatty acid metabolic process GO:0000038 16516 21 1.161617218 0.0996414 0.172972973 0.178376 1.005957873 0.481149 0.504504505 -1
biological_process regulation of B cell differentiation GO:0045577 16516 21 1.1616057 0.0996574 0.100900901 0.178281 0.999519577 0.501542 0.52972973 -1
biological_process thymic T cell selection GO:0045061 16517 20 1.165574063 0.0996947 0.093693694 0.178193 1.224499159 0.0409283 0.095495495 0.167377
biological_process ruffle organization GO:0031529 16517 20 1.165428942 0.0998918 0.063063063 0.178152 0.989590895 0.532171 0.520720721 -1
molecular_function sulfur compound binding GO:1901681 16731 130 1.064670444 0.0999153 0.218018018 0.230695 1.027481657 0.292943 0.403603604 -1
biological_process negative regulation of cysteine-type endopeptidase activity involved in apoptotic process GO:0043154 16482 55 1.099564983 0.100089 0.144144144 0.178111 1.029089041 0.354116 0.333333333 -1
molecular_function hydrolase activity, acting on glycosyl bonds GO:0016798 16752 109 1.070582276 0.100183 0.091891892 0.229934 0.97273667 0.689571 0.747747748 -1
biological_process humoral immune response GO:0006959 16475 62 1.093635493 0.100379 0.196396396 0.179011 0.845966546 0.982346 0.886486486 -1
biological_process positive regulation of chemokine production GO:0032722 16511 26 1.144626432 0.100573 0.158558559 0.179425 0.812950961 0.950872 0.938738739 -1
molecular_function growth factor receptor binding GO:0070851 16775 86 1.079356225 0.100637 0.025225225 0.229273 1.068598577 0.13465 0.252252252 0.265785
cellular_component MHC protein complex GO:0042611 16788 35 1.124533584 0.100725 0.257657658 0.162211 0.818171759 0.968924 0.787387387 -1
molecular_function phosphatidylinositol phosphate binding GO:1901981 16804 57 1.097333645 0.101159 0.257657658 0.231628 1.103262062 0.0880866 0.218018018 0.156164
biological_process cellular response to stress GO:0033554 15524 1013 1.022403323 0.101236 0.183783784 0.179977 1.0336706 0.0277076 0.127927928 0.14057
biological_process regulation of tyrosine phosphorylation of Stat3 protein GO:0042516 16517 20 1.16437077 0.101338 0.093693694 0.179907 1.271929477 0.0175311 0.003603604 0.114763
biological_process response to testosterone stimulus GO:0033574 16507 30 1.134139283 0.101385 0.185585586 0.179822 0.974445926 0.595883 0.616216216 -1
molecular_function phospholipase activity GO:0004620 16795 66 1.090275406 0.101545 0.207207207 0.236809 0.93589375 0.816969 0.810810811 -1
cellular_component plasma lipoprotein particle GO:0034358 16797 26 1.143893039 0.101718 0.167567568 0.161565 1.122394436 0.13967 0.223423423 0.237985
molecular_function steroid hormone receptor binding GO:0035258 16813 48 1.105694477 0.102014 0.311711712 0.239048 1.390274385 1.37E-06 0.009009009 0
biological_process positive regulation of programmed cell death GO:0043068 16146 391 1.036645699 0.102026 0.081081081 0.181729 1.010139191 0.362668 0.390990991 -1
biological_process regulation of lyase activity GO:0051339 16502 35 1.123708437 0.102228 0.133333333 0.182142 1.032479277 0.369521 0.390990991 -1
molecular_function peptide receptor activity GO:0001653 16770 91 1.076562723 0.102316 0.248648649 0.2383 0.997554147 0.516166 0.497297297 -1
biological_process positive regulation of apoptotic process GO:0043065 16150 387 1.036688816 0.102943 0.082882883 0.183161 1.008064642 0.390508 0.418018018 -1
biological_process carbohydrate catabolic process GO:0016052 16430 107 1.070217372 0.103456 0.196396396 0.183666 0.953304702 0.799385 0.785585586 -1
biological_process negative regulation of transforming growth factor beta receptor signaling pathway GO:0030512 16500 37 1.119613584 0.103546 0.194594595 0.183591 1.22849995 0.00797393 0.034234234 0.0773592
biological_process regulation of DNA replication GO:0006275 16455 82 1.080215006 0.103614 0.154954955 0.18351 1.097611805 0.0624203 0.061261261 0.210091
molecular_function galactosyltransferase activity GO:0008378 16830 31 1.130490736 0.103911 0.118918919 0.238222 1.086777223 0.201122 0.185585586 0.377551
biological_process negative regulation of myeloid leukocyte differentiation GO:0002762 16509 28 1.13718135 0.104135 0.086486486 0.184017 0.930483534 0.738177 0.789189189 -1
biological_process ion transmembrane transport GO:0034220 16247 290 1.042242643 0.104392 0.282882883 0.185792 1.047321871 0.0795555 0.279279279 0.236846
biological_process actin filament polymerization GO:0030041 16450 87 1.077526182 0.104603 0.135135135 0.185754 1.087025757 0.0793245 0.07027027 0.236893
molecular_function receptor regulator activity GO:0030545 16836 25 1.144619402 0.105034 0.120720721 0.240768 1.128853765 0.132057 0.099099099 0.259504
biological_process smooth muscle cell migration GO:0014909 16506 31 1.129769405 0.105174 0.136936937 0.186723 1.033771209 0.372234 0.367567568 -1
molecular_function phosphatase activity GO:0016791 16617 244 1.045916309 0.105389 0.286486486 0.240049 1.098148444 0.00373705 0.036036036 0
biological_process protein stabilization GO:0050821 16478 59 1.093864501 0.105468 0.203603604 0.187157 1.212838968 0.00227897 0.014414414 0.0510516
biological_process mitochondrion localization GO:0051646 16517 20 1.161244626 0.105698 0.214414414 0.188465 1.19906069 0.0614344 0.082882883 0.207557
molecular_function protein deacetylase activity GO:0033558 16840 21 1.157108015 0.106054 0.081081081 0.239493 0.877679875 0.834362 0.809009009 -1
biological_process microtubule bundle formation GO:0001578 16504 33 1.125228646 0.106155 0.126126126 0.188947 1.084440903 0.200178 0.209009009 0.395105
biological_process cytoskeleton-dependent intracellular transport GO:0030705 16478 59 1.093579589 0.106162 0.124324324 0.188846 1.048444557 0.259261 0.210810811 0.470986
biological_process negative regulation of epithelial cell proliferation GO:0050680 16456 81 1.079752573 0.106337 0.25045045 0.190129 1.113779819 0.0377022 0.165765766 0.161367
biological_process receptor recycling GO:0001881 16513 24 1.146489669 0.106769 0.097297297 0.190159 1.26187079 0.0130853 0.009009009 0.0988305
cellular_component basal plasma membrane GO:0009925 16798 25 1.143486111 0.10683 0.140540541 0.167998 1.225711547 0.0252205 0.106306306 0.0154721
biological_process oocyte differentiation GO:0009994 16505 32 1.126749712 0.10692 0.257657658 0.190102 1.102370171 0.157697 0.165765766 0.34857
molecular_function carboxypeptidase activity GO:0004180 16827 34 1.122664278 0.107467 0.142342342 0.239323 0.990075777 0.53997 0.567567568 -1
biological_process protein heterooligomerization GO:0051291 16464 73 1.083613441 0.107473 0.142342342 0.190612 1.026244336 0.348568 0.396396396 -1
molecular_function primary active transmembrane transporter activity GO:0015399 16749 112 1.06737322 0.107638 0.225225225 0.237633 1.002798565 0.479484 0.497297297 -1
molecular_function P-P-bond-hydrolysis-driven transmembrane transporter activity GO:0015405 16749 112 1.06737322 0.107638 0.225225225 0.237633 1.002798565 0.479484 0.497297297 -1
biological_process brain morphogenesis GO:0048854 16510 27 1.137281328 0.108132 0.084684685 0.191155 1.004513703 0.483804 0.457657658 -1
biological_process glycosyl compound metabolic process GO:1901657 15865 672 1.02695648 0.108312 0.272072072 0.191549 1.030604296 0.0803359 0.190990991 0.237261
biological_process determination of bilateral symmetry GO:0009855 16461 76 1.081608308 0.108402 0.243243243 0.191473 1.201226364 0.00116156 0.030630631 0.0417023
biological_process monovalent inorganic cation transport GO:0015672 16253 284 1.041910353 0.108614 0.255855856 0.191876 1.03241022 0.169988 0.30990991 0.362494
biological_process response to nutrient GO:0007584 16376 161 1.055851539 0.108693 0.192792793 0.191796 0.996503738 0.530833 0.493693694 -1
biological_process response to vitamin GO:0033273 16455 82 1.078403945 0.108833 0.187387387 0.192176 0.928987029 0.86793 0.81981982 -1
cellular_component cytoplasmic microtubule GO:0005881 16794 29 1.131918066 0.109064 0.232432432 0.167849 1.248750404 0.0101101 0.028828829 0
biological_process regulation of RNA metabolic process GO:0051252 13873 2664 1.012595339 0.109557 0.414414414 0.194497 1.058544815 5.51E-09 0.151351351 0
biological_process cellular response to ionizing radiation GO:0071479 16503 34 1.121403272 0.109844 0.036036036 0.19492 0.977548713 0.589803 0.574774775 -1
cellular_component clathrin adaptor complex GO:0030131 16794 29 1.131434356 0.10991 0.214414414 0.167122 1.166732881 0.0597894 0.135135135 0.0641349
molecular_function repressing transcription factor binding GO:0070491 16821 40 1.111814257 0.110037 0.156756757 0.240786 1.203221029 0.0129116 0.037837838 0.0123
biological_process triglyceride biosynthetic process GO:0019432 16514 23 1.147300935 0.110399 0.05045045 0.195427 0.931738694 0.714806 0.848648649 -1
biological_process hair follicle morphogenesis GO:0031069 16514 23 1.146822457 0.111151 0.306306306 0.196434 1.256551666 0.01648 0.059459459 0.111864
biological_process positive regulation of NF-kappaB transcription factor activity GO:0051092 16459 78 1.079340673 0.111893 0.16036036 0.198744 1.099759915 0.063055 0.113513514 0.211001
molecular_function myosin binding GO:0017022 16832 29 1.130258925 0.111987 0.077477477 0.246476 1.180815401 0.0457047 0.079279279 0.0810252
biological_process ovarian follicle development GO:0001541 16482 55 1.094400002 0.112262 0.118918919 0.200057 1.043152567 0.289383 0.198198198 -1
cellular_component nucleosome GO:0000786 16746 77 1.079610105 0.11261 0.452252252 0.172488 0.801178092 0.998773 0.762162162 -1
biological_process cellular response to interleukin-1 GO:0071347 16495 42 1.107602907 0.113263 0.205405405 0.202868 1.17914689 0.0220322 0.063063063 0.127674
biological_process regulation of response to biotic stimulus GO:0002831 16487 50 1.098588716 0.11328 0.126126126 0.202764 0.954440216 0.711887 0.679279279 -1
biological_process nucleotide metabolic process GO:0009117 15664 873 1.022996428 0.113321 0.284684685 0.203098 1.022892533 0.114374 0.209009009 0.283009
biological_process actin polymerization or depolymerization GO:0008154 16431 106 1.067511871 0.113572 0.181981982 0.2035 1.104014546 0.0313863 0.016216216 0.146675
biological_process phospholipid biosynthetic process GO:0008654 16407 130 1.060758698 0.114195 0.14954955 0.204024 0.99878467 0.509657 0.473873874 -1
biological_process glandular epithelial cell differentiation GO:0002067 16512 25 1.138956488 0.114238 0.14954955 0.204357 1.241368243 0.0182238 0.084684685 0.115695
cellular_component heterotrimeric G-protein complex GO:0005834 16788 35 1.11715976 0.114722 0.061261261 0.172285 0.930504542 0.762047 0.81981982 -1
molecular_function heparin binding GO:0008201 16768 93 1.071675496 0.114964 0.201801802 0.249884 0.986391103 0.590161 0.540540541 -1
biological_process cellular response to decreased oxygen levels GO:0036294 16477 60 1.089300984 0.115021 0.102702703 0.20525 0.976852512 0.622171 0.605405405 -1
biological_process cellular response to hypoxia GO:0071456 16477 60 1.089300984 0.115021 0.102702703 0.20525 0.976852512 0.622171 0.605405405 -1
biological_process fibroblast growth factor receptor signaling pathway GO:0008543 16490 47 1.100926602 0.115046 0.122522523 0.205148 1.133789776 0.0558125 0.142342342 0.195217
biological_process neuron projection regeneration GO:0031102 16499 38 1.112261897 0.115072 0.151351351 0.205473 1.121169641 0.097624 0.185585586 0.25953
biological_process protein localization to organelle GO:0033365 16168 369 1.035578558 0.115625 0.243243243 0.206398 1.034336445 0.123987 0.234234234 0.300227
molecular_function solute:cation antiporter activity GO:0015298 16839 22 1.147249524 0.115644 0.218018018 0.249325 1.118610608 0.167466 0.236036036 0.320845
molecular_function ATPase activity, coupled to transmembrane movement of ions GO:0042625 16796 65 1.085533025 0.115707 0.216216216 0.248447 0.975059701 0.636447 0.618018018 -1
biological_process Rac protein signal transduction GO:0016601 16501 36 1.114769686 0.116239 0.174774775 0.207342 1.160916088 0.0470549 0.187387387 0.180996

biological_process release of sequestered calcium ion into cytosol GO:0051209 16487 50 1.097074622 0.116887 0.212612613 0.207648 1.119916638 0.0706615 0.198198198 0.220608
biological_process regulation of sequestering of calcium ion GO:0051282 16487 50 1.097074622 0.116887 0.212612613 0.207648 1.119916638 0.0706615 0.198198198 0.220608
biological_process negative regulation of sequestering of calcium ion GO:0051283 16487 50 1.097074622 0.116887 0.212612613 0.207648 1.119916638 0.0706615 0.198198198 0.220608
biological_process apical junction assembly GO:0043297 16511 26 1.134691239 0.116929 0.12972973 0.207551 1.101620439 0.184548 0.203603604 0.3794
molecular_function histone-lysine N-methyltransferase activity GO:0018024 16822 39 1.10980914 0.117189 0.264864865 0.248311 1.267155907 0.00190705 0.010810811 0
biological_process hepaticobiliary system development GO:0061008 16439 98 1.068733318 0.118602 0.18018018 0.209269 1.100483431 0.0419906 0.138738739 0.170294
biological_process regulation of glucose metabolic process GO:0010906 16468 69 1.081942238 0.118725 0.176576577 0.209622 1.144915555 0.018339 0.032432432 0.115622
biological_process regulation of defense response GO:0031347 16282 255 1.042384754 0.118726 0.136936937 0.209509 0.956293968 0.888456 0.814414414 -1
biological_process viral reproduction GO:0016032 16384 153 1.05478958 0.11915 0.196396396 0.211538 0.995192036 0.541272 0.526126126 -1
biological_process multi-organism cellular process GO:0044764 16384 153 1.05478958 0.11915 0.196396396 0.211538 0.995192036 0.541272 0.526126126 -1
biological_process glycosaminoglycan biosynthetic process GO:0006024 16495 42 1.10479551 0.119438 0.162162162 0.211521 1.131524805 0.0696735 0.14954955 0.221414
biological_process positive regulation of apoptotic signaling pathway GO:2001235 16506 31 1.122017925 0.119441 0.108108108 0.21141 1.075860145 0.232016 0.126126126 0.43109
biological_process axon cargo transport GO:0008088 16504 33 1.117998258 0.119953 0.14954955 0.211468 1.059088737 0.278106 0.273873874 0.496165
biological_process glycerophospholipid biosynthetic process GO:0046474 16437 100 1.067595749 0.120135 0.086486486 0.211417 0.970040703 0.698666 0.679279279 -1
biological_process positive regulation of protein tyrosine kinase activity GO:0061098 16511 26 1.132802808 0.12024 0.135135135 0.211339 1.202604987 0.0366655 0.16036036 0.159992
biological_process regulation of cardiac muscle tissue growth GO:0055021 16510 27 1.13019997 0.12045 0.156756757 0.211717 1.117228678 0.145507 0.153153153 0.336546
biological_process regulation of blood coagulation GO:0030193 16492 45 1.100789715 0.120472 0.131531532 0.211499 1.085261788 0.160605 0.158558559 0.350797
biological_process regulation of hemostasis GO:1900046 16492 45 1.100789715 0.120472 0.131531532 0.211499 1.085261788 0.160605 0.158558559 0.350797
biological_process smooth muscle tissue development GO:0048745 16517 20 1.151182916 0.120649 0.187387387 0.212703 1.228647195 0.0381837 0.135135135 0.162469
biological_process leukocyte mediated cytotoxicity GO:0001909 16491 46 1.099555662 0.120775 0.171171171 0.212633 0.998935939 0.505015 0.531531532 -1
biological_process positive regulation of actin filament polymerization GO:0030838 16501 36 1.112223354 0.121502 0.216216216 0.214018 1.081418774 0.198491 0.118918919 0.393739
biological_process exocytosis GO:0006887 16358 179 1.050092287 0.121579 0.356756757 0.214764 1.086365734 0.0220935 0.268468468 0.127463
biological_process regulation of wound healing GO:0061041 16473 64 1.08399954 0.121777 0.093693694 0.214717 1.090705708 0.103967 0.144144144 0.265479
biological_process maintenance of protein location in cell GO:0032507 16464 73 1.078537526 0.122051 0.196396396 0.214696 1.146689638 0.0147921 0.054054054 0.105258
molecular_function demethylase activity GO:0032451 16841 20 1.150101555 0.122338 0.135135135 0.266283 1.444260206 0.000287289 0.003603604 0
biological_process activated T cell proliferation GO:0050798 16507 30 1.122396591 0.122579 0.190990991 0.216008 1.021888337 0.417695 0.421621622 -1
biological_process RNA catabolic process GO:0006401 16456 81 1.07428964 0.122846 0.144144144 0.216399 1.118075216 0.03251 0.030630631 0.149909
molecular_function protein tyrosine/serine/threonine phosphatase activity GO:0008138 16815 46 1.098624829 0.122989 0.232432432 0.26831 0.99624122 0.517643 0.499099099 -1
biological_process axis specification GO:0009798 16462 75 1.077154373 0.123041 0.201801802 0.216765 1.118462205 0.0374593 0.228828829 0.161252
molecular_function hydrolase activity, acting on carbon-nitrogen (but not peptide) bonds GO:0016810 16760 101 1.06630831 0.123492 0.122522523 0.267629 0.91762543 0.92482 0.940540541 -1
biological_process regulation of calcium-mediated signaling GO:0050848 16505 32 1.118000892 0.123581 0.140540541 0.217249 0.983114123 0.565789 0.540540541 -1
molecular_function epidermal growth factor receptor binding GO:0005154 16840 21 1.145704514 0.123591 0.158558559 0.266731 1.069839319 0.289561 0.372972973 -1
biological_process positive regulation of proteasomal ubiquitin-dependent protein catabolic process GO:0032436 16502 35 1.112758727 0.12371 0.104504505 0.217063 1.135145339 0.0828305 0.043243243 0.243443
biological_process positive regulation of proteasomal protein catabolic process GO:1901800 16502 35 1.112758727 0.12371 0.104504505 0.217063 1.135145339 0.0828305 0.043243243 0.243443
biological_process negative regulation of DNA replication GO:0008156 16506 31 1.119817706 0.123729 0.187387387 0.216955 1.090126456 0.192168 0.14954955 0.388469
biological_process regulation of receptor-mediated endocytosis GO:0048259 16496 41 1.103971164 0.124146 0.254054054 0.217396 1.158889952 0.0388359 0.034234234 0.162857
biological_process regulation of cellular ketone metabolic process GO:0010565 16459 78 1.075261476 0.124256 0.223423423 0.217318 1.134762559 0.0193981 0.102702703 0.11977
biological_process response to light stimulus GO:0009416 16359 178 1.049612073 0.124532 0.29009009 0.218534 1.016362015 0.351915 0.401801802 -1
biological_process positive regulation of leukocyte migration GO:0002687 16483 54 1.090264873 0.124917 0.201801802 0.218551 1.14029572 0.0368395 0.046846847 0.160589
molecular_function purinergic receptor activity GO:0035586 16829 32 1.117268833 0.125052 0.198198198 0.266577 1.202860751 0.0233206 0.028828829 0.0503814
molecular_function pyrophosphatase activity GO:0016462 16031 830 1.02245365 0.125263 0.248648649 0.265746 1.024194216 0.107835 0.257657658 0.193106
biological_process respiratory system process GO:0003016 16517 20 1.148177706 0.12539 0.25045045 0.21942 1.11727302 0.181697 0.318918919 0.377016
cellular_component Golgi cisterna GO:0031985 16749 74 1.076827762 0.12564 0.172972973 0.206893 1.161733862 0.0078644 0.048648649 0
biological_process telomere maintenance GO:0000723 16500 37 1.108654348 0.125896 0.093693694 0.219478 1.082339761 0.192575 0.252252252 0.388618
biological_process myeloid leukocyte activation GO:0002274 16440 97 1.066955871 0.125999 0.16036036 0.219398 1.104990239 0.0362269 0.118918919 0.158097
biological_process positive regulation of osteoblast differentiation GO:0045669 16484 53 1.090685565 0.12604 0.214414414 0.220117 1.077067939 0.165197 0.245045045 0.354967
cellular_component nuclear inner membrane GO:0005637 16798 25 1.132073837 0.126177 0.102702703 0.210793 1.216695851 0.030186 0.03963964 0.0220025
biological_process positive regulation of cyclase activity GO:0031281 16516 21 1.143903265 0.126539 0.169369369 0.220991 1.157787641 0.10507 0.261261261 0.267352
biological_process cardiac conduction GO:0061337 16512 25 1.131777845 0.126712 0.214414414 0.221752 1.318025892 0.00292302 0.032432432 0.0563102
molecular_function antiporter activity GO:0015297 16809 52 1.091213986 0.126928 0.25045045 0.265703 0.92285398 0.832751 0.733333333 -1
biological_process multi-multicellular organism process GO:0044706 16382 155 1.052570595 0.127371 0.145945946 0.222271 1.068221797 0.0697024 0.082882883 0.221281
biological_process protein-DNA complex subunit organization GO:0071824 16401 136 1.056056226 0.127782 0.437837838 0.222704 0.945988494 0.863365 0.681081081 -1
biological_process blastocyst formation GO:0001825 16515 22 1.139781038 0.127911 0.190990991 0.223039 1.093639217 0.223267 0.2 0.421712
molecular_functionoxidoreductase activity, acting on paired donors, with incorporation or reduction of molecular oxygen, 2-oxoglutarate as one donor, and incorporation of one atom each of oxygen into both donorsGO:0016706 16815 46 1.096595567 0.127915 0.140540541 0.265295 1.130471605 0.0624151 0.014414414 0.10539
biological_process protein dephosphorylation GO:0006470 16385 152 1.05296127 0.127952 0.306306306 0.222937 1.083131122 0.0372582 0.097297297 0.161554
biological_process positive regulation of phospholipase activity GO:0010518 16515 22 1.139720571 0.128013 0.255855856 0.222842 1.107645574 0.190767 0.286486486 0.38642
biological_process negative regulation of intracellular protein transport GO:0090317 16484 53 1.08984359 0.128255 0.057657658 0.223215 1.084454041 0.143074 0.158558559 0.333874
molecular_function microtubule binding GO:0008017 16759 102 1.064583768 0.128565 0.275675676 0.264707 1.099170202 0.0409233 0.236036036 0.0719249
biological_process protein import into nucleus, translocation GO:0000060 16501 36 1.108679315 0.129104 0.135135135 0.226226 1.037046071 0.349981 0.351351351 -1
biological_process endothelial cell development GO:0001885 16516 21 1.142238983 0.129304 0.185585586 0.226179 1.124611411 0.161166 0.102702703 0.351403
molecular_function beta-tubulin binding GO:0048487 16834 27 1.125257159 0.129612 0.122522523 0.266918 1.089081119 0.211169 0.14954955 0.390244
biological_process midbrain development GO:0030901 16509 28 1.12266063 0.130266 0.183783784 0.226398 1.197929093 0.0347169 0.117117117 0.155396
biological_process regulation of leukocyte mediated cytotoxicity GO:0001910 16504 33 1.112783437 0.130659 0.118918919 0.226821 1.024831431 0.402349 0.454054054 -1
cellular_component vesicle coat GO:0030120 16791 32 1.114253303 0.131245 0.133333333 0.21205 1.126441998 0.107475 0.095495495 0.172896
biological_process auditory receptor cell differentiation GO:0042491 16509 28 1.122107789 0.131343 0.126126126 0.227346 1.004914097 0.482043 0.47027027 -1
biological_process negative regulation of protein import into nucleus GO:0042308 16495 42 1.099442741 0.131861 0.052252252 0.227813 1.071794923 0.209865 0.27027027 0.407736
biological_process dopamine transport GO:0015872 16511 26 1.125779332 0.133132 0.291891892 0.230153 1.117179064 0.150173 0.187387387 0.341034
biological_process receptor internalization GO:0031623 16489 48 1.092349025 0.133548 0.29009009 0.230181 1.119858993 0.0748794 0.142342342 0.228751
molecular_function receptor tyrosine kinase binding GO:0030971 16829 32 1.112887677 0.134119 0.095495495 0.276079 1.040943318 0.344015 0.378378378 -1
biological_process negative regulation of nucleocytoplasmic transport GO:0046823 16488 49 1.09104194 0.134485 0.057657658 0.232395 1.101341075 0.109255 0.153153153 0.274706
biological_process diencephalon development GO:0021536 16473 64 1.079507975 0.134839 0.153153153 0.232801 1.077822457 0.139982 0.205405405 0.327282
molecular_function purinergic nucleotide receptor activity GO:0001614 16835 26 1.124495487 0.135586 0.21981982 0.274965 1.182605248 0.0532646 0.057657658 0.0970069
molecular_function nucleotide receptor activity GO:0016502 16835 26 1.124495487 0.135586 0.21981982 0.274965 1.182605248 0.0532646 0.057657658 0.0970069
biological_process regulation of calcium ion transport into cytosol GO:0010522 16501 36 1.10558878 0.135996 0.263063063 0.233893 1.133978038 0.0816823 0.138738739 0.240481
biological_process protein complex localization GO:0031503 16500 37 1.104009828 0.136317 0.227027027 0.233887 1.186748301 0.0244352 0.075675676 0.135111
biological_process regulation of protein stability GO:0031647 16439 98 1.063771322 0.136394 0.115315315 0.233794 1.123365873 0.016937 0.043243243 0.114045
molecular_function carbohydrate transmembrane transporter activity GO:0015144 16831 30 1.115115568 0.137183 0.111711712 0.273931 1.191662487 0.0343858 0.014414414 0.0504294
molecular_function carbohydrate transporter activity GO:1901476 16831 30 1.115115568 0.137183 0.111711712 0.273931 1.191662487 0.0343858 0.014414414 0.0504294
biological_process cell projection assembly GO:0030031 16333 204 1.0439154 0.137186 0.221621622 0.234754 1.097061154 0.00784294 0.102702703 0.0765773
biological_process regulation of mitotic cell cycle GO:0007346 16338 199 1.044328969 0.137938 0.29009009 0.235302 1.095078713 0.00971264 0.014414414 0.0801701
biological_process production of molecular mediator involved in inflammatory response GO:0002532 16513 24 1.128284062 0.138011 0.254054054 0.235206 0.835064442 0.919337 0.790990991 -1

biological_process DNA methylation or demethylation GO:0044728 16491 46 1.092562522 0.138109 0.241441441 0.23512 1.327361157 5.88E-05 0.003603604 0.00307858
biological_process cellular component disassembly GO:0022411 16407 130 1.054851537 0.138407 0.082882883 0.235899 1.080052323 0.0562526 0.100900901 0.19723
biological_process pigmentation GO:0043473 16474 63 1.078869562 0.138669 0.117117117 0.236663 1.078163154 0.140832 0.174774775 0.32934
biological_process blood vessel remodeling GO:0001974 16500 37 1.102967181 0.138735 0.174774775 0.236565 1.072642161 0.221791 0.347747748 0.419922
biological_process mammary gland epithelium development GO:0061180 16469 68 1.075860948 0.138803 0.169369369 0.236467 1.145748355 0.0184897 0.120720721 0.115341
molecular_function phosphatidylinositol-4,5-bisphosphate binding GO:0005546 16835 26 1.122771081 0.138933 0.214414414 0.283866 0.949176269 0.673374 0.594594595 -1
biological_process TOR signaling cascade GO:0031929 16494 43 1.095217751 0.139437 0.097297297 0.237365 1.043123318 0.311931 0.311711712 -1
molecular_function lysine N-methyltransferase activity GO:0016278 16817 44 1.094058345 0.139611 0.227027027 0.284743 1.184722187 0.0167887 0.025225225 0.0236155
molecular_function protein-lysine N-methyltransferase activity GO:0016279 16817 44 1.094058345 0.139611 0.227027027 0.284743 1.184722187 0.0167887 0.025225225 0.0236155
cellular_component protein-lipid complex GO:0032994 16796 27 1.119935087 0.140007 0.190990991 0.215248 1.094926708 0.196268 0.273873874 0.328045
molecular_function G-protein coupled amine receptor activity GO:0008227 16827 34 1.106529834 0.140742 0.254054054 0.284404 1.063994206 0.25883 0.358558559 0.451875
molecular_function hormone activity GO:0005179 16795 66 1.076284821 0.141067 0.261261261 0.283622 0.980523446 0.608203 0.589189189 -1
biological_process posttranscriptional gene silencing GO:0016441 16510 27 1.119356221 0.141173 0.120720721 0.238542 1.187271864 0.045819 0.048648649 0.178562
biological_process posttranscriptional gene silencing by RNA GO:0035194 16510 27 1.119356221 0.141173 0.120720721 0.238542 1.187271864 0.045819 0.048648649 0.178562
biological_process response to endoplasmic reticulum stress GO:0034976 16478 59 1.080522815 0.141597 0.185585586 0.239754 1.098388253 0.09488 0.151351351 0.255992
biological_process regulation of cell fate commitment GO:0010453 16515 22 1.13200828 0.141605 0.054054054 0.239634 1.048118557 0.347847 0.317117117 -1
biological_process aminoglycan catabolic process GO:0006026 16516 21 1.134954148 0.141899 0.221621622 0.239618 0.983780879 0.551261 0.536936937 -1
biological_process microtubule-based transport GO:0010970 16479 58 1.081039524 0.142122 0.145945946 0.239968 1.037544982 0.309919 0.259459459 -1
biological_process protein processing GO:0016485 16426 111 1.05839047 0.142517 0.079279279 0.240382 1.004021372 0.470679 0.464864865 -1
molecular_function cyclin-dependent protein serine/threonine kinase activity GO:0004693 16830 31 1.110636957 0.142775 0.118918919 0.282648 1.10036763 0.166321 0.209009009 0.319912
molecular_function cyclin-dependent protein kinase activity GO:0097472 16830 31 1.110636957 0.142775 0.118918919 0.282648 1.10036763 0.166321 0.209009009 0.319912
biological_process T-helper 1 type immune response GO:0042088 16508 29 1.113852256 0.143924 0.158558559 0.243513 1.071325187 0.25276 0.264864865 0.46271
biological_process regulation of cell projection assembly GO:0060491 16482 55 1.082181269 0.145172 0.163963964 0.245409 1.12161675 0.0588166 0.162162162 0.202583
biological_process tyrosine phosphorylation of STAT protein GO:0007260 16494 43 1.092917192 0.145327 0.102702703 0.245341 1.202975577 0.0104893 0.03963964 0.0849317
biological_process negative regulation of ossification GO:0030279 16512 25 1.121899956 0.145379 0.243243243 0.245234 1.27690833 0.00819872 0.095495495 0.0776916
biological_process lipid transport GO:0006869 16357 180 1.04519232 0.145494 0.261261261 0.245151 1.115166081 0.00356275 0.014414414 0.0593107
biological_process early endosome to late endosome transport GO:0045022 16517 20 1.136144772 0.145669 0.21981982 0.245479 1.257586703 0.0229414 0.021621622 0.128615
molecular_function cysteine-type peptidase activity GO:0008234 16729 132 1.052699408 0.146215 0.272072072 0.290757 1.018715855 0.354211 0.403603604 -1
biological_process regulation of interferon-gamma production GO:0032649 16481 56 1.080964312 0.14659 0.254054054 0.246085 0.939147592 0.785281 0.769369369 -1
biological_process termination of signal transduction GO:0023021 16495 42 1.09344499 0.146807 0.228828829 0.24604 1.151170823 0.0446559 0.066666667 0.176863
biological_process regulation of epithelial cell differentiation GO:0030856 16465 72 1.071272075 0.14692 0.264864865 0.245956 1.084393415 0.106933 0.259459459 0.270834
biological_process liver development GO:0001889 16441 96 1.06152597 0.147519 0.21981982 0.246055 1.093150213 0.0564382 0.156756757 0.196894
biological_process positive regulation of B cell proliferation GO:0030890 16507 30 1.110210474 0.147671 0.165765766 0.246372 1.099717434 0.171861 0.187387387 0.364982
biological_process regulation of anion transport GO:0044070 16485 52 1.083510571 0.148089 0.243243243 0.24679 1.049949058 0.266044 0.259459459 0.480602
cellular_component transport vesicle membrane GO:0030658 16784 39 1.096300746 0.148504 0.216216216 0.23798 1.190753776 0.019426 0.01981982 0.00796803
biological_process regulation of T cell differentiation in thymus GO:0033081 16517 20 1.134203782 0.149136 0.172972973 0.249755 1.156159351 0.113078 0.127927928 0.280084
biological_process heparan sulfate proteoglycan metabolic process GO:0030201 16516 21 1.130393209 0.150194 0.210810811 0.252328 1.146506225 0.122297 0.140540541 0.297339
biological_process muscle cell apoptotic process GO:0010657 16512 25 1.119389366 0.150404 0.097297297 0.252661 1.11516635 0.159115 0.227027027 0.349926
biological_process DNA-dependent transcription, initiation GO:0006352 16457 80 1.066619811 0.150442 0.363963964 0.252546 0.964001259 0.711961 0.673873874 -1
biological_process developmental induction GO:0031128 16505 32 1.105238575 0.151013 0.248648649 0.253398 1.262422552 0.00503066 0.115315315 0.0607243
molecular_function E-box binding GO:0070888 16839 22 1.126746174 0.151419 0.171171171 0.302088 0.993752051 0.520266 0.518918919 -1
molecular_function hydrolase activity, acting on acid anhydrides, in phosphorus-containing anhydrides GO:0016818 16028 833 1.020071355 0.151716 0.272072072 0.303563 1.022548922 0.123808 0.27027027 0.23804
cellular_component organelle subcompartment GO:0031984 16748 75 1.068375911 0.151988 0.189189189 0.247935 1.164842914 0.00660187 0.037837838 0
biological_process lung epithelium development GO:0060428 16508 29 1.110032409 0.152165 0.135135135 0.254853 1.112730489 0.146312 0.255855856 0.336788
biological_process muscle cell migration GO:0014812 16503 34 1.101523856 0.152358 0.181981982 0.254797 1.04509747 0.324234 0.322522523 -1
biological_process positive regulation of calcium-mediated signaling GO:0050850 16515 22 1.125912106 0.153018 0.172972973 0.255681 0.907329384 0.774404 0.691891892 -1
molecular_function excitatory extracellular ligand-gated ion channel activity GO:0005231 16816 45 1.08761387 0.154019 0.277477477 0.306176 1.040973795 0.316788 0.381981982 -1
biological_process positive regulation of positive chemotaxis GO:0050927 16517 20 1.131373926 0.154294 0.135135135 0.256803 1.188920373 0.0715632 0.068468468 0.223181
biological_process regulation of actin filament polymerization GO:0030833 16459 78 1.066357322 0.154472 0.136936937 0.256742 1.072887759 0.131874 0.140540541 0.312127
biological_process activation of Ras GTPase activity GO:0032856 16513 24 1.119697747 0.154723 0.147747748 0.256708 1.134098972 0.127415 0.057657658 0.305297
biological_process actin-mediated cell contraction GO:0070252 16499 38 1.094669181 0.155786 0.230630631 0.258126 1.145661961 0.0597324 0.165765766 0.203769
molecular_function alcohol binding GO:0043178 16802 59 1.075906999 0.155851 0.275675676 0.308503 1.171780039 0.0110269 0.045045045 0.012447
biological_process negative regulation of epithelial cell differentiation GO:0030857 16517 20 1.130491107 0.15592 0.14954955 0.258046 1.135225674 0.147304 0.147747748 0.337298
cellular_component autophagic vacuole GO:0005776 16788 35 1.098163079 0.156985 0.218018018 0.276436 1.038839631 0.345171 0.297297297 -1
biological_process regulation of cardiac muscle cell proliferation GO:0060043 16512 25 1.115920978 0.157535 0.203603604 0.262308 1.09050065 0.216425 0.266666667 0.416152
biological_process behavioral fear response GO:0001662 16514 23 1.120811129 0.157639 0.254054054 0.262216 1.01281706 0.457595 0.479279279 -1
cellular_component phagocytic vesicle GO:0045335 16774 49 1.082695856 0.157664 0.115315315 0.275216 0.960215272 0.685489 0.666666667 -1
biological_process regulation of filopodium assembly GO:0051489 16510 27 1.111325307 0.157997 0.218018018 0.262225 1.242475999 0.0144783 0.061261261 0.101731
biological_process lysosome organization GO:0007040 16507 30 1.105413425 0.158432 0.097297297 0.263385 1.022642159 0.414902 0.378378378 -1
biological_process embryonic forelimb morphogenesis GO:0035115 16514 23 1.120337909 0.158589 0.145945946 0.263313 1.029395535 0.403497 0.4 -1
biological_process lymphocyte mediated immunity GO:0002449 16406 131 1.050039528 0.159654 0.257657658 0.264348 0.924886677 0.932548 0.895495495 -1
cellular_component midbody GO:0030496 16743 80 1.064090562 0.159804 0.227027027 0.274929 1.1009531 0.0584737 0.05045045 0.0590438
biological_process inner ear receptor cell development GO:0060119 16511 26 1.112564966 0.159891 0.131531532 0.264681 1.013180468 0.453647 0.423423423 -1
molecular_function kinesin binding GO:0019894 16841 20 1.128312904 0.15999 0.181981982 0.312166 1.139806209 0.139275 0.117117117 0.278859
biological_process telomere organization GO:0032200 16499 38 1.092845624 0.160493 0.115315315 0.266643 1.092237771 0.162082 0.198198198 0.352859
biological_process regulation of tyrosine phosphorylation of STAT protein GO:0042509 16500 37 1.093880788 0.161043 0.122522523 0.266729 1.202950189 0.0161526 0.041441441 0.109803
cellular_component endoplasmic reticulum GO:0005783 15759 1064 1.016959849 0.161084 0.326126126 0.2741 1.021522792 0.104488 0.252252252 0.168931
biological_process carbohydrate homeostasis GO:0033500 16429 108 1.054807694 0.161152 0.072072072 0.266503 1.074235518 0.0900267 0.072072072 0.251144
biological_process glucose homeostasis GO:0042593 16429 108 1.054807694 0.161152 0.072072072 0.266503 1.074235518 0.0900267 0.072072072 0.251144
biological_process positive regulation of B cell activation GO:0050871 16489 48 1.082205685 0.161607 0.171171171 0.26655 1.084095279 0.156108 0.232432432 0.34554
biological_process regulation of organ formation GO:0003156 16509 28 1.10768209 0.161641 0.2 0.266429 1.238351285 0.0143937 0.106306306 0.100996
biological_process DNA alkylation GO:0006305 16501 36 1.094805497 0.161994 0.27027027 0.267041 1.409045799 1.04E-05 0.001801802 0
biological_process DNA methylation GO:0006306 16501 36 1.094805497 0.161994 0.27027027 0.267041 1.409045799 1.04E-05 0.001801802 0
biological_process fear response GO:0042596 16511 26 1.111453304 0.162292 0.27027027 0.267025 0.961132332 0.634426 0.571171171 -1
biological_process regulation of bone mineralization GO:0030500 16482 55 1.076497371 0.1625 0.333333333 0.267712 1.084179979 0.139382 0.284684685 0.326777
biological_process regulation of smooth muscle cell migration GO:0014910 16510 27 1.108987249 0.163133 0.194594595 0.26783 1.02760762 0.401824 0.396396396 -1
biological_process iron ion homeostasis GO:0055072 16484 53 1.077697709 0.163229 0.27027027 0.268102 0.936649865 0.788196 0.738738739 -1
biological_process genitalia development GO:0048806 16498 39 1.090604591 0.163254 0.255855856 0.267978 1.230363993 0.00630273 0.025225225 0.0644933
biological_process protein N-linked glycosylation GO:0006487 16510 27 1.1083781 0.164489 0.261261261 0.270541 1.233289493 0.0178061 0.043243243 0.114522
biological_process protein maturation GO:0051604 16418 119 1.051455144 0.164591 0.14954955 0.270446 1.004275637 0.467718 0.484684685 -1
biological_process alpha-beta T cell activation GO:0046631 16455 82 1.061970193 0.164942 0.192792793 0.270453 1.111920363 0.0392247 0.196396396 0.16443

biological_process cellular catabolic process GO:0044248 15115 1422 1.014246822 0.165202 0.372972973 0.270421 1.03226786 0.0137453 0.111711712 0.0999832
biological_process glycolipid biosynthetic process GO:0009247 16494 43 1.085534593 0.165345 0.153153153 0.270344 0.925012978 0.803136 0.763963964 -1
biological_process female meiosis GO:0007143 16517 20 1.125321179 0.1657 0.21981982 0.270717 1.104018653 0.210068 0.162162162 0.407659
biological_process cellular carbohydrate catabolic process GO:0044275 16497 40 1.088487703 0.165903 0.181981982 0.271028 1.103111648 0.129053 0.275675676 0.307552
biological_process nucleosome organization GO:0034728 16424 113 1.0525272 0.165922 0.455855856 0.2709 0.930687792 0.899844 0.668468468 -1
biological_process behavioral defense response GO:0002209 16513 24 1.114114627 0.166279 0.257657658 0.270908 0.988494426 0.538935 0.517117117 -1
biological_process regulation of cysteine-type endopeptidase activity involved in apoptotic process GO:0043281 16391 146 1.046021188 0.166681 0.27027027 0.270935 0.999287648 0.506019 0.545945946 -1
biological_process glycolysis GO:0006096 16483 54 1.07585805 0.166756 0.275675676 0.270829 0.929290511 0.816349 0.790990991 -1
biological_process fatty acid metabolic process GO:0006631 16284 253 1.034793589 0.167049 0.279279279 0.271176 0.986267026 0.648534 0.688288288 -1
molecular_function protein phosphatase regulator activity GO:0019888 16816 45 1.082903736 0.167386 0.342342342 0.328896 1.153381779 0.0371674 0.012612613 0.0589093
biological_process neuroblast proliferation GO:0007405 16491 46 1.081920329 0.167609 0.263063063 0.271631 1.136732354 0.0538663 0.187387387 0.191689
biological_process regulation of cysteine-type endopeptidase activity GO:2000116 16388 149 1.045373045 0.167625 0.275675676 0.271502 0.997202351 0.523743 0.56036036 -1
biological_process negative regulation of coagulation GO:0050819 16509 28 1.104926522 0.16791 0.218018018 0.271481 1.10363512 0.170901 0.18018018 0.363085
biological_process homeostasis of number of cells within a tissue GO:0048873 16517 20 1.124142072 0.167985 0.059459459 0.271376 1.021940742 0.432501 0.437837838 -1
biological_process peptide cross-linking GO:0018149 16511 26 1.108820663 0.168072 0.237837838 0.271639 1.110699792 0.163933 0.284684685 0.354387
biological_process negative regulation of lymphocyte differentiation GO:0045620 16510 27 1.10675221 0.168143 0.241441441 0.271532 1.013171683 0.452798 0.410810811 -1
cellular_component microtubule associated complex GO:0005875 16710 113 1.052010126 0.168314 0.336936937 0.277057 0.908239455 0.954987 0.967567568 -1
biological_process leukocyte homeostasis GO:0001776 16480 57 1.073308416 0.168463 0.216216216 0.271525 1.125273972 0.0504 0.153153153 0.18361
cellular_component ribonucleoprotein granule GO:0035770 16749 74 1.064303819 0.16847 0.362162162 0.275498 1.174391141 0.004605 0.034234234 0
biological_process regulation of mitosis GO:0007088 16466 71 1.065631303 0.168557 0.169369369 0.271292 1.029017255 0.335653 0.313513514 -1
biological_process regulation of nuclear division GO:0051783 16466 71 1.065631303 0.168557 0.169369369 0.271292 1.029017255 0.335653 0.313513514 -1
molecular_function ubiquitin protein ligase binding GO:0031625 16719 142 1.046215093 0.16907 0.320720721 0.332126 1.151744553 0.000829396 0.007207207 0
molecular_function small conjugating protein ligase binding GO:0044389 16719 142 1.046215093 0.16907 0.320720721 0.332126 1.151744553 0.000829396 0.007207207 0
biological_process positive regulation of type I interferon production GO:0032481 16516 21 1.120505414 0.169267 0.142342342 0.272531 1.071383171 0.285387 0.264864865 -1
biological_process positive regulation of lipase activity GO:0060193 16510 27 1.106232641 0.169321 0.261261261 0.272418 1.095357539 0.1952 0.27027027 0.392012
biological_process regulation of histone acetylation GO:0035065 16512 25 1.110391875 0.169354 0.218018018 0.272295 0.95983871 0.636128 0.673873874 -1
biological_process protein ubiquitination involved in ubiquitin-dependent protein catabolic process GO:0042787 16478 59 1.071612643 0.169936 0.389189189 0.272394 1.283784186 7.77E-05 0.043243243 0.00595647
biological_process cellular response to oxygen levels GO:0071453 16470 67 1.067150567 0.170061 0.156756757 0.272309 1.003902081 0.47792 0.49009009 -1
molecular_function steroid hormone receptor activity GO:0003707 16809 52 1.076232635 0.170137 0.104504505 0.331711 1.102671253 0.0995079 0.16036036 0.180686
molecular_function hydrolase activity, acting on acid anhydrides GO:0016817 16022 839 1.018523163 0.170212 0.281081081 0.330691 1.025034695 0.0987897 0.243243243 0.181134
biological_process negative regulation of NF-kappaB transcription factor activity GO:0032088 16487 50 1.077480894 0.170967 0.21981982 0.273985 0.957652223 0.698297 0.78018018 -1
biological_process bone mineralization GO:0030282 16460 77 1.062213651 0.171631 0.255855856 0.27556 1.111747907 0.0443417 0.145945946 0.176786
biological_process cell-cell signaling involved in cell fate commitment GO:0045168 16504 33 1.09509409 0.171795 0.245045045 0.27549 1.267146537 0.00389833 0.113513514 0.0595568
biological_process B cell proliferation GO:0042100 16481 56 1.072894127 0.171975 0.254054054 0.275426 1.038754024 0.30744 0.324324324 -1
biological_process glycerol metabolic process GO:0006071 16516 21 1.118956307 0.17239 0.120720721 0.275817 1.061034676 0.313938 0.34954955 -1
cellular_component microtubule cytoskeleton GO:0015630 15991 832 1.018433178 0.172443 0.32972973 0.280702 1.032182716 0.0495565 0.218018018 0.0530254
biological_process acute inflammatory response GO:0002526 16445 92 1.056671412 0.172563 0.214414414 0.275751 0.923357442 0.899188 0.827027027 -1
biological_process regulation of myeloid leukocyte mediated immunity GO:0002886 16511 26 1.106797345 0.172604 0.295495495 0.27563 1.020566745 0.427894 0.479279279 -1
biological_process eating behavior GO:0042755 16515 22 1.115847098 0.173161 0.190990991 0.27572 1.101714311 0.20416 0.136936937 0.401546
biological_process regulation of calcium ion-dependent exocytosis GO:0017158 16513 24 1.110788942 0.173421 0.264864865 0.276048 1.186579293 0.0565603 0.117117117 0.197785
molecular_function RNA polymerase II core promoter proximal region sequence-specific DNA binding GO:0000978 16833 28 1.102394931 0.173802 0.194594595 0.340318 1.268525136 0.00688581 0.018018018 0
biological_process hexose biosynthetic process GO:0019319 16496 41 1.084539134 0.173937 0.201801802 0.276838 1.097302096 0.139971 0.138738739 0.327451
biological_process tyrosine phosphorylation of Stat3 protein GO:0042503 16513 24 1.110521879 0.174002 0.147747748 0.276727 1.260369193 0.0135207 0.014414414 0.0996026
biological_process positive regulation of proteolysis GO:0045862 16479 58 1.070553711 0.175598 0.09009009 0.278315 1.07397948 0.164151 0.163963964 0.354143
cellular_component nucleoplasm part GO:0044451 16027 796 1.018608506 0.175751 0.414414414 0.281168 1.074602068 9.38E-05 0.073873874 0
biological_process cellular monovalent inorganic cation homeostasis GO:0030004 16506 31 1.096500849 0.175806 0.154954955 0.278619 0.896577428 0.840954 0.933333333 -1
biological_process transcription initiation from RNA polymerase II promoter GO:0006367 16496 41 1.083415333 0.17716 0.187387387 0.27975 1.132877342 0.0700394 0.135135135 0.220989
biological_process regulation of apoptotic signaling pathway GO:2001233 16463 74 1.061960747 0.177423 0.136936937 0.27972 0.982121422 0.605285 0.621621622 -1
biological_process determination of left/right symmetry GO:0007368 16470 67 1.065123569 0.17745 0.275675676 0.279593 1.205997248 0.00171417 0.021621622 0.0435611
cellular_component lipid particle GO:0005811 16782 41 1.083275926 0.177559 0.167567568 0.28493 1.10043493 0.132372 0.158558559 0.230064
biological_process positive regulation of lyase activity GO:0051349 16515 22 1.11318655 0.178755 0.218018018 0.279991 1.109404614 0.186901 0.315315315 0.380724
biological_process regulation of protein acetylation GO:1901983 16510 27 1.102022346 0.179067 0.225225225 0.280199 1.000115289 0.499606 0.50990991 -1
biological_process regulation of peptidyl-lysine acetylation GO:2000756 16510 27 1.102022346 0.179067 0.225225225 0.280199 1.000115289 0.499606 0.50990991 -1
biological_process protein O-linked glycosylation GO:0006493 16516 21 1.115437703 0.179619 0.154954955 0.281356 1.052373497 0.338731 0.297297297 -1
biological_process microtubule cytoskeleton organization GO:0000226 16272 265 1.032228803 0.179814 0.336936937 0.281652 1.064671062 0.0330156 0.169369369 0.151108
biological_process positive regulation of DNA binding GO:0043388 16508 29 1.098080793 0.179935 0.201801802 0.281918 1.044319372 0.339544 0.324324324 -1
biological_process positive regulation of neuron apoptotic process GO:0043525 16491 46 1.077327466 0.181509 0.077477477 0.282785 0.916253883 0.837748 0.917117117 -1
biological_process inflammatory response to antigenic stimulus GO:0002437 16498 39 1.08398733 0.181541 0.324324324 0.282659 0.821138814 0.973632 0.936936937 -1
cellular_component anchored to plasma membrane GO:0046658 16801 22 1.111864601 0.181573 0.167567568 0.294268 1.051344964 0.338198 0.284684685 -1
molecular_function anion:cation symporter activity GO:0015296 16838 23 1.109013515 0.182428 0.264864865 0.355027 0.812947564 0.940016 0.841441441 -1
biological_process hair cell differentiation GO:0035315 16505 32 1.092355324 0.182536 0.187387387 0.285054 0.973337364 0.603166 0.545945946 -1
biological_process cellular response to retinoic acid GO:0071300 16503 34 1.08957273 0.182588 0.23963964 0.284935 1.118443946 0.115568 0.122522523 0.283833
biological_process regulation of tissue remodeling GO:0034103 16499 38 1.084523455 0.183137 0.18018018 0.285728 1.017163212 0.427236 0.423423423 -1
biological_process negative regulation of response to external stimulus GO:0032102 16421 116 1.048195515 0.183471 0.178378378 0.285727 1.043702191 0.20667 0.187387387 0.404116
molecular_function acetylgalactosaminyltransferase activity GO:0008376 16832 29 1.096639134 0.183484 0.223423423 0.35662 1.060892544 0.284865 0.185585586 0.493623
cellular_component T-tubule GO:0030315 16794 29 1.096443273 0.183969 0.331531532 0.298267 1.321044538 0.00136258 0.102702703 0
biological_process protein-DNA complex assembly GO:0065004 16418 119 1.047379973 0.184479 0.464864865 0.287414 0.90662295 0.961704 0.747747748 -1
biological_process negative regulation of ion transport GO:0043271 16485 52 1.071772995 0.184639 0.288288288 0.28734 1.001812672 0.490976 0.497297297 -1
molecular_function histone methyltransferase activity GO:0042054 16813 48 1.074433337 0.185533 0.304504505 0.358841 1.215860898 0.00474224 0.021621622 0
biological_process regulation of symbiosis, encompassing mutualism through parasitism GO:0043903 16516 21 1.112460423 0.185883 0.304504505 0.290169 0.926803685 0.719519 0.65045045 -1
biological_process negative regulation of lipid metabolic process GO:0045833 16494 43 1.078317926 0.186559 0.23963964 0.291009 0.936566394 0.764693 0.794594595 -1
biological_process positive regulation of homeostatic process GO:0032846 16483 54 1.0698539 0.186594 0.295495495 0.291229 1.042408599 0.294387 0.293693694 -1
biological_process peptide secretion GO:0002790 16395 142 1.04288549 0.187043 0.291891892 0.291277 1.071790421 0.0683572 0.232432432 0.219655
biological_process nuclear export GO:0051168 16458 79 1.057596986 0.18706 0.156756757 0.291142 1.063403349 0.163942 0.203603604 0.354211
biological_process vesicle docking involved in exocytosis GO:0006904 16514 23 1.10692475 0.187062 0.201801802 0.291 1.010256413 0.466048 0.468468468 -1
biological_process kidney morphogenesis GO:0060993 16495 42 1.078935788 0.187499 0.214414414 0.292083 1.166253021 0.0308423 0.189189189 0.146843
biological_process gene silencing by RNA GO:0031047 16497 40 1.080877931 0.187535 0.243243243 0.291955 1.219205272 0.00810407 0.009009009 0.0766538
cellular_component nucleoplasm GO:0005654 15793 1030 1.015439655 0.187861 0.427027027 0.303232 1.051645464 0.00152315 0.072072072 0
biological_process negative regulation of T cell differentiation GO:0045581 16516 21 1.111412328 0.18812 0.181981982 0.292061 1.1251297 0.160161 0.122522523 0.350947
molecular_function phosphoprotein phosphatase activity GO:0004721 16703 158 1.040412107 0.188342 0.335135135 0.361544 1.099642022 0.0146397 0.063063063 0.024008
biological_process vacuole organization GO:0007033 16472 65 1.063138307 0.188515 0.264864865 0.292778 0.990791862 0.551282 0.565765766 -1

biological_process cellular response to alcohol GO:0097306 16478 59 1.066174712 0.188905 0.23963964 0.2928 0.990779532 0.548927 0.535135135 -1
biological_process monosaccharide biosynthetic process GO:0046364 16491 46 1.074837803 0.189338 0.248648649 0.293532 1.051308251 0.273076 0.286486486 0.489158
biological_process regulation of B cell proliferation GO:0030888 16491 46 1.074785223 0.189505 0.264864865 0.293805 0.988270085 0.554898 0.513513514 -1
biological_process single-organism carbohydrate catabolic process GO:0044724 16436 101 1.050205295 0.190364 0.293693694 0.294716 0.939422559 0.854926 0.825225225 -1
molecular_function metallocarboxypeptidase activity GO:0004181 16841 20 1.112306488 0.192031 0.205405405 0.364819 0.935429374 0.691639 0.731531532 -1
cellular_component phagocytic vesicle membrane GO:0030670 16803 20 1.111484192 0.193776 0.25045045 0.309575 0.736953558 0.979267 0.922522523 -1
biological_process negative regulation of protein transport GO:0051224 16444 93 1.051581017 0.193804 0.174774775 0.298798 1.007226844 0.45185 0.482882883 -1
biological_process regulation of proteasomal protein catabolic process GO:0061136 16472 65 1.061664773 0.194134 0.29009009 0.299479 1.084599442 0.118272 0.072072072 0.290513
biological_process polyol biosynthetic process GO:0046173 16508 29 1.092376044 0.194246 0.243243243 0.299723 1.038989935 0.357947 0.38018018 -1
biological_process negative regulation of lipid biosynthetic process GO:0051055 16509 28 1.093990632 0.194305 0.216216216 0.299602 1.047253957 0.332355 0.306306306 -1
biological_process regulation of ubiquitin-protein ligase activity GO:0051438 16509 28 1.093912889 0.194501 0.136936937 0.299542 1.213257479 0.025221 0.003603604 0.135957
biological_process positive regulation of neuron death GO:1901216 16490 47 1.072190623 0.195334 0.073873874 0.30112 0.924926451 0.814017 0.899099099 -1
biological_process regulation of hormone secretion GO:0046883 16404 133 1.042678469 0.196027 0.228828829 0.302293 1.066328797 0.0917126 0.185585586 0.2522
biological_process regulation of metal ion transport GO:0010959 16381 156 1.039117712 0.197586 0.394594595 0.304521 1.099514947 0.0152664 0.18018018 0.106357
biological_process acid secretion GO:0046717 16502 35 1.082704898 0.198124 0.205405405 0.304947 0.941516171 0.725742 0.652252252 -1
molecular_function bHLH transcription factor binding GO:0043425 16840 21 1.106698778 0.19838 0.192792793 0.371855 1.102411875 0.208002 0.122522523 0.380181
biological_process nephron morphogenesis GO:0072028 16507 30 1.088869653 0.199382 0.218018018 0.305691 1.094541458 0.184676 0.286486486 0.379591
biological_process transcription elongation from RNA polymerase II promoter GO:0006368 16512 25 1.097214906 0.19975 0.190990991 0.305704 1.159582992 0.0833228 0.048648649 0.243378
biological_process B cell differentiation GO:0030183 16467 70 1.058017084 0.199756 0.297297297 0.305558 1.089009015 0.0980789 0.10990991 0.26075
biological_process regulation of B cell mediated immunity GO:0002712 16507 30 1.088273045 0.200969 0.304504505 0.307144 0.90138566 0.825483 0.809009009 -1
biological_process regulation of immunoglobulin mediated immune response GO:0002889 16507 30 1.088273045 0.200969 0.304504505 0.307144 0.90138566 0.825483 0.809009009 -1
biological_process post-Golgi vesicle-mediated transport GO:0006892 16500 37 1.079286995 0.201508 0.344144144 0.30757 1.085902412 0.182461 0.315315315 0.377254
biological_process viral infectious cycle GO:0019058 16475 62 1.061034025 0.202163 0.216216216 0.308717 1.032462391 0.328697 0.291891892 -1
biological_process cytokinesis GO:0000910 16464 73 1.056217747 0.202211 0.246846847 0.308924 1.044177358 0.256179 0.263063063 0.467078
biological_process positive regulation of transforming growth factor beta receptor signaling pathway GO:0030511 16516 21 1.104864615 0.202468 0.254054054 0.308889 1.181755609 0.0744332 0.135135135 0.228
biological_process regulation of positive chemotaxis GO:0050926 16516 21 1.104760958 0.202694 0.2 0.30884 1.193716559 0.0619575 0.066666667 0.209108
biological_process phosphatidylinositol biosynthetic process GO:0006661 16479 58 1.062765978 0.20345 0.225225225 0.309361 1.015555843 0.418589 0.372972973 -1
biological_process steroid biosynthetic process GO:0006694 16420 117 1.044104948 0.20347 0.297297297 0.30922 0.976120397 0.673306 0.641441441 -1
biological_process intracellular steroid hormone receptor signaling pathway GO:0030518 16469 68 1.057816882 0.203989 0.335135135 0.310303 1.181605289 0.00467204 0.081081081 0.0589753
biological_process inorganic anion transport GO:0015698 16459 78 1.053877863 0.204379 0.218018018 0.310659 0.859381868 0.984469 0.98018018 -1
biological_process positive regulation of peptidyl-serine phosphorylation GO:0033138 16491 46 1.070218649 0.204402 0.216216216 0.31052 1.069808525 0.205773 0.185585586 0.403325
biological_process regulation of muscle cell apoptotic process GO:0010660 16517 20 1.106401053 0.204785 0.183783784 0.310873 1.032208039 0.401452 0.448648649 -1
molecular_function ligand-gated ion channel activity GO:0015276 16746 115 1.04422153 0.204898 0.338738739 0.383663 1.065292849 0.111819 0.324324324 0.195892
molecular_function ligand-gated channel activity GO:0022834 16746 115 1.04422153 0.204898 0.338738739 0.383663 1.065292849 0.111819 0.324324324 0.195892
biological_process regulation of biomineral tissue development GO:0070167 16478 59 1.061792392 0.205104 0.367567568 0.311198 1.114035883 0.0642732 0.225225225 0.213894
biological_process positive regulation of myeloid leukocyte differentiation GO:0002763 16506 31 1.085004316 0.205968 0.245045045 0.312761 1.21314365 0.0198231 0.048648649 0.123583
biological_process neutral lipid biosynthetic process GO:0046460 16512 25 1.09464143 0.206048 0.163963964 0.312495 0.910105809 0.782059 0.85045045 -1
biological_process acylglycerol biosynthetic process GO:0046463 16512 25 1.09464143 0.206048 0.163963964 0.312495 0.910105809 0.782059 0.85045045 -1
biological_process nitric oxide metabolic process GO:0046209 16491 46 1.069495674 0.206823 0.21981982 0.313022 0.918885512 0.830031 0.718918919 -1
biological_process lipid storage GO:0019915 16489 48 1.06794807 0.207099 0.268468468 0.312995 1.202278039 0.00753115 0.01981982 0.0765787
biological_process sexual reproduction GO:0019953 16080 457 1.021736239 0.207231 0.263063063 0.312904 1.034274211 0.0990673 0.216216216 0.262336
molecular_function ligase activity, forming carbon-sulfur bonds GO:0016877 16835 26 1.092110404 0.207787 0.212612613 0.38445 1.024593961 0.413965 0.358558559 -1
biological_process superoxide anion generation GO:0042554 16517 20 1.104859144 0.208195 0.234234234 0.313515 1.085836225 0.252943 0.286486486 0.462857
biological_process positive regulation of tumor necrosis factor production GO:0032760 16507 30 1.085189228 0.209292 0.297297297 0.314848 0.895097092 0.840418 0.85045045 -1
biological_process oligosaccharide metabolic process GO:0009311 16512 25 1.093311156 0.209349 0.189189189 0.314722 0.938007703 0.704483 0.751351351 -1
biological_process negative regulation of apoptotic signaling pathway GO:2001234 16516 21 1.101599397 0.209861 0.210810811 0.31513 1.002617791 0.491725 0.482882883 -1
molecular_function ligand-activated sequence-specific DNA binding RNA polymerase II transcription factor activity GO:0004879 16820 41 1.072442401 0.210582 0.120720721 0.389 1.143003761 0.0561496 0.099099099 0.100998
cellular_component lateral plasma membrane GO:0016328 16794 29 1.085900037 0.211302 0.340540541 0.336407 1.200190849 0.0308185 0.147747748 0.0354348
molecular_function cysteine-type endopeptidase activity GO:0004197 16809 52 1.064104766 0.211303 0.120720721 0.392068 0.966949516 0.66037 0.616216216 -1
biological_process regulation of lipid catabolic process GO:0050994 16506 31 1.082983548 0.21157 0.279279279 0.318379 1.009334737 0.464121 0.457657658 -1
biological_process positive regulation of tyrosine phosphorylation of STAT protein GO:0042531 16505 32 1.081614872 0.211738 0.118918919 0.318302 1.184525934 0.0351691 0.099099099 0.15641
biological_process positive regulation of I-kappaB kinase/NF-kappaB cascade GO:0043123 16425 112 1.043489886 0.2119 0.185585586 0.31855 1.008356397 0.438951 0.472072072 -1
molecular_function cyclase activity GO:0009975 16837 24 1.09366792 0.213202 0.30990991 0.395905 1.368793625 0.000869248 0.016216216 0
biological_process intrinsic apoptotic signaling pathway in response to DNA damage GO:0008630 16497 40 1.072415573 0.213539 0.237837838 0.320775 1.165253588 0.0349582 0.048648649 0.156705
biological_process apoptotic signaling pathway GO:0097190 16370 167 1.035267525 0.213768 0.232432432 0.321376 1.032899535 0.229622 0.207207207 0.42848
biological_process regulation of epidermis development GO:0045682 16502 35 1.076630556 0.215925 0.237837838 0.323834 1.175710061 0.0357414 0.077477477 0.157211
biological_process response to ethanol GO:0045471 16426 111 1.042831384 0.216465 0.30990991 0.325544 1.118737629 0.0148498 0.043243243 0.105063
molecular_function phosphoprotein binding GO:0051219 16809 52 1.062521779 0.217077 0.30990991 0.397394 1.103394318 0.0979354 0.158558559 0.178812
cellular_component endocytic vesicle membrane GO:0030666 16795 28 1.085231715 0.217163 0.227027027 0.338932 0.861066287 0.898752 0.848648649 -1
biological_process stem cell division GO:0017145 16510 27 1.086793619 0.21718 0.338738739 0.326685 1.169808097 0.0630686 0.138738739 0.210865
biological_process regulation of antigen receptor-mediated signaling pathway GO:0050854 16510 27 1.086627895 0.217619 0.230630631 0.327054 1.083949431 0.224785 0.185585586 0.423513
biological_process proteasomal ubiquitin-dependent protein catabolic process GO:0043161 16377 160 1.035361393 0.218163 0.392792793 0.327472 1.008582069 0.425093 0.436036036 -1
molecular_function drug binding GO:0008144 16779 82 1.049180383 0.219688 0.261261261 0.399854 1.118159312 0.0315979 0.093693694 0.0526608
biological_process negative regulation of neuron projection development GO:0010977 16506 31 1.080010912 0.219971 0.273873874 0.32976 1.261833242 0.00574527 0.027027027 0.0647351
biological_process regulation of activated T cell proliferation GO:0046006 16513 24 1.090361172 0.221461 0.277477477 0.331897 0.938357202 0.699687 0.742342342 -1
cellular_component sarcoplasm GO:0016528 16771 52 1.061192914 0.221992 0.263063063 0.340682 1.158249826 0.0238721 0.082882883 0.0157747
biological_process cell aging GO:0007569 16466 71 1.05227065 0.222294 0.221621622 0.333403 1.06215658 0.181659 0.201801802 0.377182
cellular_component dynein complex GO:0030286 16785 38 1.071436744 0.222553 0.374774775 0.339095 0.870145248 0.917447 0.830630631 -1
biological_process immunoglobulin mediated immune response GO:0016064 16461 76 1.050348459 0.223043 0.281081081 0.334232 0.892352951 0.948374 0.895495495 -1
molecular_function actinin binding GO:0042805 16839 22 1.093707906 0.223096 0.261261261 0.406521 1.233457405 0.0288543 0.005405405 0.0539181
biological_process regulation of cell division GO:0051302 16475 62 1.055703176 0.223305 0.205405405 0.334196 1.075766518 0.150281 0.086486486 0.341244
biological_process positive regulation of organic acid transport GO:0032892 16515 22 1.093111505 0.22455 0.345945946 0.33526 1.202545788 0.0498222 0.126126126 0.18372
biological_process protein localization to endoplasmic reticulum GO:0070972 16510 27 1.083900161 0.224918 0.153153153 0.335275 0.99820274 0.506478 0.491891892 -1
biological_process peptide hormone secretion GO:0030072 16399 138 1.036965303 0.225027 0.320720721 0.335167 1.073271795 0.067195 0.21981982 0.218759
biological_process regulation of I-kappaB kinase/NF-kappaB cascade GO:0043122 16381 156 1.034652457 0.225696 0.181981982 0.335957 1.001721196 0.485117 0.531531532 -1
cellular_component secretory granule GO:0030141 16649 174 1.032693314 0.226367 0.306306306 0.351654 1.094885563 0.0146587 0.014414414 0.00817383
biological_process positive regulation of stress fiber assembly GO:0051496 16511 26 1.084847822 0.226653 0.209009009 0.337829 0.984919121 0.553041 0.590990991 -1
biological_process synaptic transmission, dopaminergic GO:0001963 16512 25 1.085585892 0.229126 0.282882883 0.339795 0.872427609 0.865577 0.863063063 -1
biological_process regulation of granulocyte chemotaxis GO:0071622 16515 22 1.091121591 0.229426 0.264864865 0.339777 1.285050267 0.0102433 0.009009009 0.0821547
biological_process regulation of actin filament length GO:0030832 16448 89 1.045115774 0.22991 0.218018018 0.339848 1.060682291 0.160063 0.209009009 0.351256
biological_process cellular response to abiotic stimulus GO:0071214 16389 148 1.034876432 0.230198 0.254054054 0.340139 1.052068672 0.135213 0.223423423 0.318698

biological_process regulation of transmembrane transport GO:0034762 16438 99 1.042685688 0.230319 0.407207207 0.340036 1.152961623 0.00409636 0.072072072 0.0585857
biological_process negative regulation of protein polymerization GO:0032272 16498 39 1.068104664 0.230409 0.163963964 0.339917 1.071652061 0.218898 0.241441441 0.418113
biological_process Golgi to plasma membrane transport GO:0006893 16510 27 1.081853241 0.230485 0.299099099 0.340105 1.059234102 0.296841 0.351351351 -1
biological_process regulation of DNA-dependent transcription in response to stress GO:0043620 16517 20 1.095033256 0.230701 0.300900901 0.340048 1.183829052 0.0771097 0.194594595 0.233048
biological_process regulation of ion transmembrane transport GO:0034765 16445 92 1.044036437 0.231601 0.412612613 0.340945 1.190793799 0.000739997 0.05045045 0.0330714
biological_process protein localization to cell surface GO:0034394 16510 27 1.08134711 0.231873 0.234234234 0.341226 0.989885167 0.536317 0.513513514 -1
molecular_function sodium channel activity GO:0005272 16831 30 1.077156424 0.231896 0.297297297 0.417019 1.293603801 0.00265248 0.03963964 0
biological_process nitric oxide biosynthetic process GO:0006809 16494 43 1.064269895 0.232425 0.277477477 0.343201 0.929195045 0.78968 0.681081081 -1
molecular_function catalytic activity GO:0003824 11736 5125 1.004902993 0.233063 0.313513514 0.416597 1.00538669 0.211754 0.326126126 0.389342
biological_process positive regulation of production of molecular mediator of immune response GO:0002702 16515 22 1.089532958 0.233361 0.317117117 0.345042 1.085470674 0.243591 0.30990991 0.449255
biological_process regulation of peptidyl-serine phosphorylation GO:0033135 16478 59 1.054374423 0.23433 0.209009009 0.346585 1.076468451 0.154069 0.133333333 0.345427
biological_process regulation of protein oligomerization GO:0032459 16517 20 1.093074125 0.235345 0.115315315 0.348148 0.901091388 0.778363 0.823423423 -1
biological_process positive regulation of interleukin-6 production GO:0032755 16505 32 1.073455606 0.235645 0.201801802 0.349664 0.91166102 0.80688 0.754954955 -1
biological_process regulation of actin polymerization or depolymerization GO:0008064 16449 88 1.044214312 0.235679 0.243243243 0.349516 1.053550968 0.1915 0.214414414 0.386865
biological_process positive regulation of actin filament bundle assembly GO:0032233 16507 30 1.0757725 0.235928 0.223423423 0.350084 0.965831393 0.627222 0.628828829 -1
biological_process axon regeneration GO:0031103 16505 32 1.073194842 0.236433 0.279279279 0.350472 1.127086059 0.106314 0.207207207 0.269745
biological_process positive regulation of bone mineralization GO:0030501 16508 29 1.07687147 0.2365 0.322522523 0.35034 1.040678841 0.352077 0.425225225 -1
biological_process positive regulation of transporter activity GO:0032411 16509 28 1.078165554 0.236695 0.344144144 0.350576 1.343637297 0.000810248 0.001801802 0.034652
biological_process regulation of protein tyrosine kinase activity GO:0061097 16494 43 1.063040868 0.236716 0.281081081 0.350422 1.176707585 0.0222353 0.142342342 0.128073
biological_process hexose catabolic process GO:0019320 16466 71 1.049008839 0.236761 0.331531532 0.35028 0.910239619 0.905396 0.873873874 -1
biological_process metanephros morphogenesis GO:0003338 16510 27 1.079568932 0.236787 0.255855856 0.350128 1.145352553 0.0952287 0.190990991 0.255691
biological_process regulation of lipid transport GO:0032368 16481 56 1.05491815 0.237926 0.306306306 0.350824 1.165201327 0.0159808 0.021621622 0.108319
molecular_function beta-amyloid binding GO:0001540 16839 22 1.087443143 0.238589 0.299099099 0.421165 0.809750251 0.939029 0.852252252 -1
biological_process metaphase/anaphase transition of mitotic cell cycle GO:0007091 16508 29 1.075578728 0.240237 0.313513514 0.353451 1.140449398 0.0949019 0.077477477 0.255695
biological_process metaphase/anaphase transition of cell cycle GO:0044784 16508 29 1.075578728 0.240237 0.313513514 0.353451 1.140449398 0.0949019 0.077477477 0.255695
biological_process adrenal gland development GO:0030325 16514 23 1.084436282 0.24139 0.25045045 0.355063 0.871261174 0.857737 0.809009009 -1
molecular_function small conjugating protein binding GO:0032182 16791 70 1.04832573 0.241413 0.369369369 0.425506 1.081060387 0.119571 0.142342342 0.222235
molecular_function phospholipase A2 activity GO:0004623 16840 21 1.088359418 0.241414 0.255855856 0.424208 0.765322346 0.968835 0.879279279 -1
molecular_function exopeptidase activity GO:0008238 16774 87 1.043297368 0.241558 0.198198198 0.424773 1.002770933 0.482109 0.49009009 -1
biological_process negative regulation of behavior GO:0048521 16513 24 1.082581085 0.241588 0.288288288 0.355599 1.177655371 0.0657052 0.151351351 0.218468
molecular_function double-stranded RNA binding GO:0003725 16818 43 1.061647481 0.241629 0.317117117 0.423541 1.192228781 0.0144031 0.037837838 0.0241332
biological_process nucleosome assembly GO:0006334 16441 96 1.04114733 0.241876 0.475675676 0.355876 0.879178901 0.980133 0.72972973 -1
biological_process adenylate cyclase-inhibiting G-protein coupled receptor signaling pathway GO:0007193 16507 30 1.073571501 0.242413 0.351351351 0.357178 1.009327325 0.464732 0.473873874 -1
biological_process calcium ion transmembrane transport GO:0070588 16475 62 1.051095981 0.242549 0.418018018 0.357078 1.146327611 0.0227831 0.23963964 0.129142
biological_process chromatin assembly GO:0031497 16425 112 1.037916124 0.242799 0.468468468 0.357035 0.910926778 0.949332 0.697297297 -1
molecular_function cation-transporting ATPase activity GO:0019829 16816 45 1.05935834 0.244908 0.32972973 0.42467 0.910455386 0.851261 0.781981982 -1
biological_process Golgi organization GO:0007030 16495 42 1.061417633 0.245017 0.315315315 0.359468 1.086750429 0.164784 0.273873874 0.35445
molecular_function kinase activator activity GO:0019209 16817 44 1.059852847 0.245552 0.282882883 0.423859 1.156705973 0.03571 0.03963964 0.0551273
molecular_function monovalent inorganic cation transmembrane transporter activity GO:0015077 16567 294 1.022978699 0.245583 0.363963964 0.422602 0.980311385 0.722389 0.625225225 -1
biological_process aromatic compound biosynthetic process GO:0019438 13501 3036 1.006492801 0.246516 0.452252252 0.360647 1.038765769 2.12E-05 0.174774775 0
biological_process nucleobase-containing compound biosynthetic process GO:0034654 13568 2969 1.006570938 0.246946 0.457657658 0.360693 1.041344047 8.25E-06 0.178378378 0
biological_process heterocycle biosynthetic process GO:0018130 13499 3038 1.006459151 0.247504 0.452252252 0.361699 1.038527761 2.34E-05 0.169369369 0.00336779
biological_process melanocyte differentiation GO:0030318 16513 24 1.080243027 0.247826 0.190990991 0.361691 0.928606898 0.727841 0.679279279 -1
biological_process regulation of leukocyte degranulation GO:0043300 16515 22 1.083772101 0.247939 0.371171171 0.361877 1.005401367 0.482507 0.497297297 -1
biological_process organic cyclic compound biosynthetic process GO:1901362 13407 3130 1.006329359 0.248013 0.436036036 0.362043 1.035515797 6.62E-05 0.169369369 0.00304133
biological_process cellular response to cAMP GO:0071320 16513 24 1.08013721 0.24811 0.221621622 0.36222 0.86587742 0.872643 0.884684685 -1
biological_process regulation of cell killing GO:0031341 16499 38 1.063620966 0.248242 0.187387387 0.362117 1.055578854 0.276234 0.354954955 0.494077
biological_process steroid hormone mediated signaling pathway GO:0043401 16485 52 1.054288728 0.248538 0.205405405 0.362394 1.080938398 0.155653 0.221621622 0.345835
biological_process fertilization GO:0009566 16464 73 1.045668326 0.249113 0.205405405 0.362514 1.011604694 0.431696 0.425225225 -1
biological_process cellular ketone metabolic process GO:0042180 16425 112 1.036755374 0.249527 0.302702703 0.362553 1.051066618 0.173812 0.230630631 0.367041
biological_process negative regulation of stress-activated MAPK cascade GO:0032873 16514 23 1.081244676 0.24974 0.230630631 0.362322 1.206232603 0.0432381 0.018018018 0.1742
biological_process negative regulation of stress-activated protein kinase signaling cascade GO:0070303 16514 23 1.081244676 0.24974 0.230630631 0.362322 1.206232603 0.0432381 0.018018018 0.1742
biological_process chromatin remodeling GO:0006338 16470 67 1.047272265 0.250945 0.237837838 0.364237 1.167610628 0.00862996 0.055855856 0.0777971
molecular_function phospholipid transporter activity GO:0005548 16838 23 1.080670889 0.251253 0.302702703 0.435779 1.097647586 0.20849 0.300900901 0.380059
biological_process negative regulation of protein complex assembly GO:0031333 16475 62 1.049071311 0.251282 0.212612613 0.364238 1.015644761 0.415385 0.477477477 -1
biological_process lipid homeostasis GO:0055088 16473 64 1.048291884 0.251298 0.272072072 0.364077 1.132633907 0.0327825 0.059459459 0.151145
biological_process sensory perception of chemical stimulus GO:0007606 16457 80 1.043105705 0.251631 0.331531532 0.364959 1.025044211 0.348685 0.394594595 -1
molecular_function cytokine activity GO:0005125 16730 131 1.033464043 0.252686 0.394594595 0.435547 0.997192934 0.522274 0.574774775 -1
biological_process termination of G-protein coupled receptor signaling pathway GO:0038032 16498 39 1.061372671 0.253154 0.34954955 0.36644 1.140268157 0.0643797 0.133333333 0.214854
biological_process meiotic cell cycle GO:0051321 16504 33 1.066626957 0.253486 0.282882883 0.367318 1.029855689 0.383113 0.425225225 -1
cellular_component endoplasmic reticulum-Golgi intermediate compartment GO:0005793 16769 54 1.051987585 0.253743 0.268468468 0.409225 1.026162471 0.369371 0.344144144 -1
molecular_function sulfur compound transmembrane transporter activity GO:1901682 16839 22 1.081512645 0.253782 0.236036036 0.436742 0.931266164 0.711852 0.785585586 -1
biological_process lactation GO:0007595 16492 45 1.056933669 0.253865 0.335135135 0.36734 1.208103866 0.00773349 0.048648649 0.0771091
biological_process lipid catabolic process GO:0016042 16355 182 1.028111831 0.254456 0.311711712 0.368053 0.951863604 0.871007 0.798198198 -1
molecular_function hydrolase activity GO:0016787 14641 2220 1.007516879 0.255171 0.336936937 0.436478 1.003034277 0.395316 0.394594595 -1
biological_process glycerolipid catabolic process GO:0046503 16516 21 1.082756727 0.255511 0.23963964 0.369878 1.002606273 0.491762 0.482882883 -1
biological_process vesicle organization GO:0016050 16458 79 1.042497074 0.25599 0.291891892 0.370823 1.034983857 0.294663 0.336936937 -1
biological_process negative regulation of tumor necrosis factor production GO:0032720 16509 28 1.071427802 0.256179 0.30990991 0.370748 0.941242342 0.705072 0.686486486 -1
biological_process gamete generation GO:0007276 16132 405 1.018559964 0.25627 0.308108108 0.370623 1.04584626 0.0528395 0.167567568 0.189531
biological_process regulation of actin filament depolymerization GO:0030834 16513 24 1.076282438 0.258584 0.246846847 0.372792 1.053657701 0.324341 0.30990991 -1
biological_process Golgi to plasma membrane protein transport GO:0043001 16514 23 1.077826976 0.258849 0.302702703 0.373334 0.970821411 0.595842 0.571171171 -1
biological_process acute-phase response GO:0006953 16502 35 1.063020297 0.259005 0.336936937 0.373531 1.052364283 0.295597 0.29009009 -1
cellular_component transport vesicle GO:0030133 16726 97 1.037627217 0.259875 0.284684685 0.415963 1.166663617 0.00217661 0.001801802 0
biological_process positive regulation of canonical Wnt receptor signaling pathway GO:0090263 16490 47 1.054071107 0.260133 0.266666667 0.375378 1.123898917 0.0703353 0.176576577 0.220826
molecular_function NADP binding GO:0050661 16820 41 1.057856268 0.260296 0.306306306 0.440672 1.019331172 0.415025 0.464864865 -1
molecular_function manganese ion binding GO:0030145 16825 36 1.061667939 0.260582 0.345945946 0.439578 1.019775558 0.418507 0.445045045 -1
molecular_function G-protein coupled receptor binding GO:0001664 16691 170 1.028048409 0.262186 0.241441441 0.439473 1.084667226 0.0273129 0.018018018 0.0548397
biological_process thymus development GO:0048538 16506 31 1.065943556 0.262225 0.225225225 0.378005 1.20592272 0.0234217 0.088288288 0.130659
biological_process retina development in camera-type eye GO:0060041 16434 103 1.035961807 0.263015 0.353153153 0.378812 1.089850236 0.0565583 0.192792793 0.197921
biological_process regulation of cell cycle GO:0051726 15995 542 1.015363717 0.264407 0.398198198 0.380502 1.040563508 0.0481533 0.136936937 0.182156
biological_process response to zinc ion GO:0010043 16505 32 1.064189038 0.264512 0.198198198 0.380666 0.756461116 0.991544 0.996396396 -1

biological_process CD4-positive, alpha-beta T cell differentiation involved in immune response GO:0002294 16509 28 1.068559938 0.26472 0.291891892 0.380424 1.151879151 0.0817853 0.140540541 0.240073
biological_process T-helper cell differentiation GO:0042093 16509 28 1.068559938 0.26472 0.291891892 0.380424 1.151879151 0.0817853 0.140540541 0.240073
biological_process mammary gland alveolus development GO:0060749 16516 21 1.078996255 0.265205 0.29009009 0.380611 0.936322919 0.693503 0.655855856 -1
biological_process mammary gland lobule development GO:0061377 16516 21 1.078996255 0.265205 0.29009009 0.380611 0.936322919 0.693503 0.655855856 -1
biological_process I-kappaB kinase/NF-kappaB cascade GO:0007249 16366 171 1.027543027 0.265297 0.243243243 0.380484 0.994919134 0.546093 0.578378378 -1
biological_process regulation of viral reproduction GO:0050792 16481 56 1.048230068 0.265607 0.282882883 0.380755 1.04291545 0.288712 0.232432432 -1
molecular_function calcium-dependent phospholipid binding GO:0005544 16838 23 1.075235459 0.265864 0.221621622 0.445875 0.953407551 0.650743 0.666666667 -1
biological_process regulation of humoral immune response GO:0002920 16514 23 1.07521375 0.265928 0.300900901 0.381314 0.891325704 0.816848 0.720720721 -1
biological_process chondroitin sulfate proteoglycan metabolic process GO:0050654 16516 21 1.078120923 0.267488 0.311711712 0.382518 1.215933864 0.0431719 0.027027027 0.174566
biological_process mast cell activation GO:0045576 16500 37 1.058662844 0.268054 0.225225225 0.38292 1.062183004 0.255964 0.147747748 0.467334
molecular_function protein phosphorylated amino acid binding GO:0045309 16839 22 1.075981107 0.268397 0.286486486 0.449724 1.120422106 0.163801 0.097297297 0.318011
biological_process regulation of gastrulation GO:0010470 16510 27 1.068546021 0.26849 0.308108108 0.383538 0.788319529 0.971726 0.89009009 -1
biological_process response to lithium ion GO:0010226 16509 28 1.067298769 0.268521 0.311711712 0.383378 1.135285277 0.107313 0.045045045 0.272121
biological_process proteoglycan biosynthetic process GO:0030166 16506 31 1.063801854 0.269005 0.331531532 0.383737 1.184252126 0.0376586 0.081081081 0.161476
molecular_function ubiquitin-specific protease activity GO:0004843 16821 40 1.055883727 0.269972 0.430630631 0.451208 1.142804076 0.0586484 0.227027027 0.101199
biological_process cellular response to steroid hormone stimulus GO:0071383 16430 107 1.034060364 0.270212 0.212612613 0.384474 1.005310846 0.462001 0.464864865 -1
biological_process viral reproductive process GO:0022415 16425 112 1.03300642 0.271918 0.277477477 0.386881 1.031959045 0.278347 0.25045045 0.496322
biological_process somatic recombination of immunoglobulin gene segments GO:0016447 16500 37 1.057476383 0.272193 0.291891892 0.386849 0.926439482 0.781111 0.747747748 -1
molecular_function metalloendopeptidase activity GO:0004222 16764 97 1.03540755 0.272341 0.358558559 0.451681 1.098323412 0.0462704 0.165765766 0.0807651
cellular_component intermediate filament GO:0005882 16766 57 1.046216911 0.272461 0.304504505 0.442297 1.166900878 0.0143982 0.023423423 0.00830273
cellular_component sarcoplasmic reticulum GO:0016529 16776 47 1.050743677 0.273125 0.30990991 0.446803 1.164600842 0.0251562 0.054054054 0.0155897
biological_process intrinsic apoptotic signaling pathway in response to DNA damage by p53 class mediator GO:0042771 16514 23 1.072358656 0.273773 0.299099099 0.388346 1.167549494 0.0818511 0.077477477 0.239952
molecular_function chemokine activity GO:0008009 16827 34 1.058963748 0.275554 0.405405405 0.454402 1.187676495 0.0288898 0.153153153 0.0536348
biological_process response to pH GO:0009268 16514 23 1.071643568 0.275756 0.277477477 0.390616 0.956666874 0.640674 0.67027027 -1
molecular_function tumor necrosis factor receptor binding GO:0005164 16838 23 1.071305859 0.276689 0.279279279 0.458693 1.005157595 0.482912 0.524324324 -1
biological_process positive regulation of DNA metabolic process GO:0051054 16450 87 1.036314096 0.278208 0.320720721 0.393415 1.026250163 0.335363 0.318918919 -1
biological_process cellular response to mechanical stimulus GO:0071260 16487 50 1.047866574 0.278571 0.369369369 0.393429 1.042402776 0.301507 0.354954955 -1
biological_process B cell mediated immunity GO:0019724 16459 78 1.038263422 0.278717 0.333333333 0.393605 0.892959661 0.949641 0.897297297 -1
biological_process regulation of skeletal muscle cell differentiation GO:2001014 16515 22 1.072057994 0.279019 0.281081081 0.394141 1.196075819 0.0554701 0.043243243 0.194223
biological_process regulation of gene expression, epigenetic GO:0040029 16424 113 1.03162167 0.279556 0.378378378 0.394525 1.158365861 0.00171761 0.01981982 0.0434861
cellular_component endoplasmic reticulum part GO:0044432 16126 697 1.012484588 0.279924 0.392792793 0.463409 1.036062314 0.0460597 0.158558559 0.0410338
biological_process negative regulation of smooth muscle cell proliferation GO:0048662 16513 24 1.068421728 0.280632 0.322522523 0.396303 0.882117849 0.841603 0.908108108 -1
biological_process peptidyl-lysine modification GO:0018205 16394 143 1.027837586 0.281315 0.394594595 0.39704 1.107501806 0.0126689 0.005405405 0.0955048
biological_process intermediate filament-based process GO:0045103 16509 28 1.063035845 0.281569 0.223423423 0.397545 1.182885766 0.0467134 0.045045045 0.180527
biological_process mast cell mediated immunity GO:0002448 16514 23 1.069450981 0.281878 0.331531532 0.397899 0.896352352 0.805556 0.836036036 -1
biological_process mast cell degranulation GO:0043303 16514 23 1.069450981 0.281878 0.331531532 0.397899 0.896352352 0.805556 0.836036036 -1
biological_process regulation of mast cell activation GO:0033003 16512 25 1.066352547 0.282635 0.356756757 0.398946 1.025002791 0.41424 0.409009009 -1
biological_process ketone biosynthetic process GO:0042181 16514 23 1.068767441 0.2838 0.302702703 0.399667 0.841758534 0.905821 0.818018018 -1
biological_process leukocyte degranulation GO:0043299 16503 34 1.055771675 0.286442 0.281081081 0.402281 0.915050729 0.804803 0.823423423 -1
biological_process alternative mRNA splicing, via spliceosome GO:0000380 16513 24 1.066300344 0.286734 0.398198198 0.402257 1.141858904 0.114185 0.228828829 0.282425
biological_process regulation of potassium ion transport GO:0043266 16505 32 1.056880088 0.288486 0.327927928 0.403574 1.086637413 0.197756 0.324324324 0.393688
biological_process regulation of release of sequestered calcium ion into cytosol GO:0051279 16512 25 1.064078988 0.289336 0.338738739 0.405753 1.172600329 0.0673419 0.057657658 0.218532
biological_process cellular nitrogen compound biosynthetic process GO:0044271 13441 3096 1.005193632 0.289468 0.463063063 0.405641 1.035755249 6.63E-05 0.176576577 0.00303211
biological_process intermediate filament cytoskeleton organization GO:0045104 16510 27 1.061048113 0.291212 0.223423423 0.407493 1.211033157 0.0286607 0.021621622 0.143119
biological_process positive regulation of hormone secretion GO:0046887 16466 71 1.03758313 0.291282 0.302702703 0.407347 1.084067778 0.109434 0.16036036 0.274632
biological_process protein acylation GO:0043543 16394 143 1.026357624 0.291751 0.428828829 0.40742 1.110360246 0.0108451 0.007207207 0.0856718
biological_process lipoprotein metabolic process GO:0042157 16451 86 1.033814211 0.293047 0.284684685 0.409025 1.062001679 0.159029 0.153153153 0.35006
biological_process detection of light stimulus GO:0009583 16507 30 1.056947106 0.294356 0.264864865 0.411437 0.848057794 0.925468 0.900900901 -1
molecular_function ubiquitin thiolesterase activity GO:0004221 16795 66 1.038302674 0.294592 0.457657658 0.482176 1.139879532 0.0242946 0.190990991 0.049978
biological_process mast cell activation involved in immune response GO:0002279 16513 24 1.063468472 0.294977 0.32972973 0.412661 0.890049105 0.824775 0.868468468 -1
cellular_component inclusion body GO:0016234 16789 34 1.053131947 0.295585 0.358558559 0.491791 1.146940562 0.0686992 0.189189189 0.0883381
biological_process vesicle docking GO:0048278 16512 25 1.061810266 0.296096 0.306306306 0.415217 0.957782832 0.642798 0.654054054 -1
biological_process response to reactive oxygen species GO:0000302 16404 133 1.026711543 0.296109 0.356756757 0.415037 0.965899013 0.753023 0.661261261 -1
biological_process alditol metabolic process GO:0019400 16514 23 1.064398043 0.296232 0.207207207 0.414918 1.006607361 0.478119 0.484684685 -1
biological_process negative regulation of protein binding GO:0032091 16503 34 1.052851474 0.296572 0.252252252 0.415184 1.100083318 0.155815 0.066666667 0.345742
biological_process digestion GO:0007586 16490 47 1.044916145 0.296647 0.317117117 0.415038 1.057006973 0.248934 0.282882883 0.457717
biological_process metanephric nephron morphogenesis GO:0072273 16515 22 1.065351653 0.297627 0.313513514 0.416451 1.137736154 0.131421 0.201801802 0.311115
biological_process positive regulation of cell division GO:0051781 16500 37 1.049991548 0.299011 0.313513514 0.417824 1.139508862 0.0705845 0.057657658 0.22101
biological_process T cell homeostasis GO:0043029 16513 24 1.061699813 0.300179 0.327927928 0.419076 1.137953744 0.120717 0.189189189 0.294322
biological_process somatic recombination of immunoglobulin genes involved in immune response GO:0002204 16506 31 1.054185649 0.300487 0.286486486 0.418682 0.922125713 0.773905 0.803603604 -1
biological_process somatic diversification of immunoglobulins involved in immune response GO:0002208 16506 31 1.054185649 0.300487 0.286486486 0.418682 0.922125713 0.773905 0.803603604 -1
biological_process isotype switching GO:0045190 16506 31 1.054185649 0.300487 0.286486486 0.418682 0.922125713 0.773905 0.803603604 -1
biological_process cellular aldehyde metabolic process GO:0006081 16509 28 1.057019378 0.300488 0.338738739 0.418495 0.717328707 0.995243 0.954954955 -1
biological_process maintenance of protein location GO:0045185 16450 87 1.03221485 0.300915 0.318918919 0.418807 1.093232313 0.0655003 0.120720721 0.218294
biological_process muscle adaptation GO:0043500 16500 37 1.049468591 0.300929 0.372972973 0.418627 1.056525253 0.275534 0.232432432 0.492746
biological_process positive regulation of receptor-mediated endocytosis GO:0048260 16510 27 1.057912786 0.300973 0.34954955 0.418463 1.135104516 0.111818 0.113513514 0.277811
biological_process cell cycle arrest GO:0007050 16428 109 1.028721256 0.301171 0.331531532 0.418647 1.048889499 0.187551 0.205405405 0.38193
biological_process cellular response to nutrient GO:0031670 16510 27 1.057594775 0.301971 0.291891892 0.418906 1.112265905 0.155961 0.151351351 0.345641
biological_process unsaturated fatty acid biosynthetic process GO:0006636 16501 36 1.049730705 0.302459 0.345945946 0.419251 1.053657701 0.288355 0.286486486 -1
biological_process cellular component assembly involved in morphogenesis GO:0010927 16403 134 1.025646737 0.302815 0.344144144 0.419523 1.061457644 0.107992 0.181981982 0.27307
biological_process transcription factor import into nucleus GO:0042991 16479 58 1.038299777 0.30641 0.335135135 0.423954 0.941277341 0.781139 0.708108108 -1
biological_process cartilage development involved in endochondral bone morphogenesis GO:0060351 16516 21 1.063562772 0.306842 0.347747748 0.424267 1.232686103 0.0322966 0.036036036 0.149504
biological_process monosaccharide catabolic process GO:0046365 16463 74 1.033771683 0.307036 0.389189189 0.424445 0.904494863 0.923108 0.875675676 -1
biological_process cellular response to tumor necrosis factor GO:0071356 16473 64 1.036291074 0.307203 0.324324324 0.424607 1.047161907 0.256324 0.293693694 0.467197
biological_process positive regulation of ion transmembrane transporter activity GO:0032414 16513 24 1.059094692 0.307917 0.38018018 0.42482 1.344705547 0.00171082 0.012612613 0.0436363
biological_process cellular process involved in reproduction in multicellular organism GO:0022412 16377 160 1.022761581 0.308182 0.299099099 0.42478 1.061233713 0.0888175 0.214414414 0.2486
molecular_function hydrolase activity, acting on carbon-nitrogen (but not peptide) bonds, in cyclic amidines GO:0016814 16836 25 1.057516986 0.309076 0.318918919 -1 0.887278471 0.835709 0.834234234 -1
molecular_function chemokine receptor binding GO:0042379 16821 40 1.045431223 0.309152 0.405405405 -1 1.174790219 0.0276176 0.120720721 0.0542961
biological_process protein kinase C-activating G-protein coupled receptor signaling pathway GO:0007205 16510 27 1.054961101 0.310294 0.407207207 0.426818 1.150619901 0.0874425 0.183783784 0.247346
cellular_component endoplasmic reticulum membrane GO:0005789 16208 615 1.011312297 0.310298 0.418018018 -1 1.040714753 0.0373953 0.174774775 0.0348273
biological_process regulation of ligase activity GO:0051340 16506 31 1.051267629 0.310359 0.21981982 0.426663 1.20756118 0.0225602 0.003603604 0.128626

biological_process somatic diversification of immunoglobulins GO:0016445 16498 39 1.045691561 0.31038 0.291891892 0.426484 0.896893117 0.867933 0.836036036 -1
biological_process female pregnancy GO:0007565 16408 129 1.024929781 0.311244 0.338738739 0.427298 1.046501033 0.17923 0.225225225 0.374282
cellular_component intermediate filament cytoskeleton GO:0045111 16727 96 1.028771455 0.312187 0.306306306 -1 1.110295661 0.0302468 0.057657658 0.021846
biological_process fatty acid biosynthetic process GO:0006633 16419 118 1.025930334 0.312254 0.335135135 0.428195 1.020034289 0.352629 0.38018018 -1
biological_process induction of programmed cell death GO:0012502 16382 155 1.022383906 0.313906 0.288288288 0.429203 0.941670209 0.896855 0.927927928 -1
biological_process polyol metabolic process GO:0019751 16457 80 1.030979047 0.315244 0.320720721 0.43182 1.036191303 0.287063 0.308108108 -1
molecular_function palmitoyltransferase activity GO:0016409 16840 21 1.060480428 0.315495 0.203603604 -1 0.998537784 0.504644 0.472072072 -1
biological_process regulation of transcription factor import into nucleus GO:0042990 16481 56 1.036903302 0.315938 0.362162162 0.432534 0.928075652 0.824825 0.744144144 -1
biological_process specification of organ identity GO:0010092 16509 28 1.052225209 0.315962 0.347747748 0.432355 1.185909117 0.0440669 0.153153153 0.175585
biological_process somatic diversification of immune receptors via germline recombination within a single locus GO:0002562 16494 43 1.041610236 0.318044 0.344144144 0.435444 0.954475877 0.6977 0.652252252 -1
biological_process somatic cell DNA recombination GO:0016444 16494 43 1.041610236 0.318044 0.344144144 0.435444 0.954475877 0.6977 0.652252252 -1
biological_process positive chemotaxis GO:0050918 16501 36 1.045447626 0.318191 0.335135135 0.435335 1.19668904 0.0203642 0.023423423 0.126336
biological_process induction of apoptosis GO:0006917 16384 153 1.021931889 0.318471 0.297297297 0.435302 0.946533882 0.875103 0.911711712 -1
cellular_component spindle GO:0005819 16605 218 1.018265193 0.319123 0.459459459 -1 1.025043412 0.259569 0.209009009 0.421183
biological_process insulin secretion GO:0030073 16421 116 1.025115885 0.319133 0.383783784 0.435743 1.070787239 0.0925496 0.203603604 0.25378
biological_process regulation of DNA binding GO:0051101 16476 61 1.034586474 0.319643 0.30990991 0.436095 1.02165843 0.384577 0.389189189 -1
biological_process cholesterol biosynthetic process GO:0006695 16502 35 1.045564336 0.320124 0.320720721 0.43643 0.959970701 0.659345 0.641441441 -1
cellular_component nuclear outer membrane-endoplasmic reticulum membrane network GO:0042175 16194 629 1.010554396 0.320139 0.421621622 -1 1.042226179 0.0307718 0.167567568 0.0356832
molecular_function inorganic anion transmembrane transporter activity GO:0015103 16768 93 1.027833171 0.320541 0.363963964 -1 0.903258269 0.947432 0.854054054 -1
biological_process multicellular organismal movement GO:0050879 16505 32 1.047469911 0.320779 0.261261261 0.436922 1.161087412 0.0570708 0.01981982 0.198275
biological_process musculoskeletal movement GO:0050881 16505 32 1.047469911 0.320779 0.261261261 0.436922 1.161087412 0.0570708 0.01981982 0.198275
biological_process interferon-gamma production GO:0032609 16473 64 1.03346802 0.321109 0.4 0.436918 0.933585978 0.82177 0.814414414 -1
biological_process negative regulation of G-protein coupled receptor protein signaling pathway GO:0045744 16476 61 1.034071018 0.322144 0.427027027 0.438825 1.085134907 0.124294 0.241441441 0.300432
molecular_function ubiquitin binding GO:0043130 16803 58 1.034923096 0.322237 0.378378378 -1 1.031847417 0.336947 0.288288288 -1
biological_process regulation of muscle adaptation GO:0043502 16514 23 1.055496248 0.322302 0.376576577 0.438971 1.043113658 0.360045 0.322522523 -1
biological_process chromatin silencing GO:0006342 16510 27 1.051073296 0.322759 0.336936937 0.43929 1.085521573 0.220563 0.297297297 0.419519
biological_process regulation of meiotic cell cycle GO:0051445 16511 26 1.051772371 0.323633 0.317117117 0.439851 1.019199261 0.432642 0.445045045 -1
biological_process regulation of interleukin-10 production GO:0032653 16513 24 1.053884452 0.323649 0.333333333 0.439914 1.072397433 0.269368 0.275675676 0.485111
biological_process T cell apoptotic process GO:0070231 16516 21 1.057504554 0.32395 0.358558559 0.440639 1.112736843 0.185296 0.243243243 0.378997
biological_process regulation of establishment of protein localization to plasma membrane GO:0090003 16516 21 1.057354826 0.324378 0.331531532 0.44094 1.056600429 0.326535 0.300900901 -1
cellular_component histone methyltransferase complex GO:0035097 16763 60 1.033480504 0.326361 0.430630631 -1 1.105348113 0.0783964 0.099099099 0.131943
biological_process potassium ion transport GO:0006813 16430 107 1.024886333 0.327341 0.418018018 0.44445 1.139537423 0.00606871 0.172972973 0.0649376
biological_process response to interferon-gamma GO:0034341 16483 54 1.034756163 0.328864 0.347747748 0.445885 1.065220336 0.202861 0.25045045 0.39975
biological_process male meiosis GO:0007140 16507 30 1.046643529 0.328933 0.34954955 0.445727 1.214427371 0.0208707 0.072072072 0.125578
biological_process regulated secretory pathway GO:0045055 16496 41 1.039746357 0.329493 0.327927928 0.44635 0.913240536 0.832347 0.866666667 -1
molecular_function small conjugating protein-specific protease activity GO:0019783 16813 48 1.03657946 0.330124 0.448648649 -1 1.099571237 0.115737 0.275675676 0.198607
biological_process lysosomal transport GO:0007041 16504 33 1.04403795 0.330486 0.427027027 0.447472 1.175240355 0.0404613 0.066666667 0.166312
biological_process DNA modification GO:0006304 16484 53 1.034683992 0.330691 0.381981982 0.447394 1.270115124 0.000322998 0.003603604 0.0142166
biological_process myeloid cell activation involved in immune response GO:0002275 16490 47 1.036826432 0.33074 0.32972973 0.447225 0.940596411 0.760048 0.735135135 -1
biological_process regulation of meiosis GO:0040020 16513 24 1.0515212 0.330892 0.335135135 0.447116 0.997070663 0.509942 0.502702703 -1
biological_process organophosphate ester transport GO:0015748 16488 49 1.035318511 0.334032 0.306306306 0.45048 1.018370474 0.411763 0.428828829 -1
biological_process regulation of phagocytosis GO:0050764 16496 41 1.038563564 0.33426 0.367567568 0.450416 1.096420163 0.142162 0.140540541 0.331988
biological_process negative regulation of epithelial cell migration GO:0010633 16511 26 1.048386219 0.334459 0.295495495 0.450334 1.022534249 0.421073 0.425225225 -1
biological_process hormone-mediated signaling pathway GO:0009755 16464 73 1.028624914 0.335601 0.320720721 0.451299 1.050615023 0.226431 0.282882883 0.424359
biological_process inositol phosphate metabolic process GO:0043647 16505 32 1.043154079 0.336078 0.405405405 0.45211 1.053452365 0.300072 0.354954955 -1
biological_process cGMP biosynthetic process GO:0006182 16514 23 1.050685178 0.336776 0.34954955 0.453051 1.000019087 0.499956 0.506306306 -1
molecular_function aspartic-type endopeptidase activity GO:0004190 16841 20 1.054211326 0.337187 0.315315315 -1 0.912881619 0.750246 0.636036036 -1
molecular_function aspartic-type peptidase activity GO:0070001 16841 20 1.054211326 0.337187 0.315315315 -1 0.912881619 0.750246 0.636036036 -1
biological_process dopamine metabolic process GO:0042417 16507 30 1.044216786 0.337309 0.398198198 0.453168 1.226343402 0.0158077 0.028828829 0.108692
molecular_function metalloexopeptidase activity GO:0008235 16829 32 1.042770653 0.337443 0.344144144 -1 0.910980153 0.808693 0.879279279 -1
biological_process cell fate determination GO:0001709 16509 28 1.045591115 0.337913 0.322522523 0.455015 1.049620809 0.324508 0.338738739 -1
cellular_component SWI/SNF superfamily-type complex GO:0070603 16768 55 1.03234396 0.338655 0.356756757 -1 1.127575931 0.0503515 0.093693694 0.0527829
biological_process histone phosphorylation GO:0016572 16516 21 1.052361979 0.338765 0.428828829 0.456281 1.112218555 0.186398 0.255855856 0.381195
biological_process positive regulation of transcription factor import into nucleus GO:0042993 16511 26 1.046809425 0.339548 0.387387387 0.457266 0.823518733 0.940615 0.872072072 -1
biological_process negative regulation of secretion GO:0051048 16415 122 1.021535514 0.339654 0.396396396 0.457128 0.978314492 0.661478 0.610810811 -1
cellular_component nuclear chromosome, telomeric region GO:0000784 16803 20 1.053239986 0.339941 0.304504505 -1 1.088796353 0.245658 0.140540541 0.406067
biological_process B cell homeostasis GO:0001782 16514 23 1.049354904 0.340822 0.362162162 0.458579 0.933363416 0.710202 0.818018018 -1
biological_process symbiosis, encompassing mutualism through parasitism GO:0044403 16428 109 1.022582469 0.341029 0.356756757 0.4583 0.993809051 0.544745 0.578378378 -1
biological_process interspecies interaction between organisms GO:0044419 16428 109 1.022582469 0.341029 0.356756757 0.4583 0.993809051 0.544745 0.578378378 -1
biological_process regulation of peptide secretion GO:0002791 16429 108 1.022651565 0.341267 0.358558559 0.45804 1.045994068 0.20311 0.282882883 0.399507
biological_process regulation of peptide transport GO:0090087 16429 108 1.022651565 0.341267 0.358558559 0.45804 1.045994068 0.20311 0.282882883 0.399507
biological_process positive regulation of protein ubiquitination GO:0031398 16475 62 1.029819397 0.341857 0.356756757 0.458667 1.075663139 0.150611 0.144144144 0.341241
biological_process positive regulation of peptidase activity GO:0010952 16431 106 1.022770851 0.34189 0.383783784 0.458485 0.99091729 0.564569 0.569369369 -1
biological_process purine ribonucleotide biosynthetic process GO:0009152 16359 178 1.017455857 0.34254 0.374774775 0.459148 0.984063123 0.644435 0.63963964 -1
biological_process interleukin-10 production GO:0032613 16510 27 1.044968369 0.342736 0.331531532 0.459063 1.078310323 0.2403 0.268468468 0.443105
biological_process B cell activation involved in immune response GO:0002312 16498 39 1.037266492 0.343278 0.365765766 0.459423 0.948882337 0.710088 0.726126126 -1
biological_process positive regulation of biomineral tissue development GO:0070169 16507 30 1.042362465 0.343764 0.385585586 0.459513 1.070060384 0.252954 0.363963964 0.462655
molecular_function retinoic acid receptor binding GO:0042974 16841 20 1.05187471 0.343827 0.345945946 -1 1.100593754 0.217798 0.151351351 0.393451
biological_process response to mineralocorticoid stimulus GO:0051385 16507 30 1.042181064 0.344398 0.403603604 0.460401 0.966835145 0.623609 0.688288288 -1
biological_process vasodilation GO:0042311 16489 48 1.032955311 0.346054 0.394594595 0.462137 1.10461123 0.104352 0.169369369 0.266049
molecular_function metallopeptidase activity GO:0008237 16698 163 1.017811782 0.346114 0.427027027 -1 1.048060963 0.142767 0.18018018 0.287142
biological_process positive regulation of phagocytosis GO:0050766 16507 30 1.041447397 0.346967 0.389189189 0.462955 1.170580731 0.0526447 0.135135135 0.189148
biological_process negative regulation of gene expression, epigenetic GO:0045814 16506 31 1.040516205 0.34788 0.365765766 0.464476 1.046644829 0.32628 0.358558559 -1
biological_process hippocampus development GO:0021766 16480 57 1.029789147 0.348205 0.333333333 0.464469 1.016068441 0.416665 0.405405405 -1
biological_process response to growth hormone stimulus GO:0060416 16517 20 1.050094179 0.348916 0.302702703 0.46633 1.191441848 0.0689322 0.057657658 0.22087
biological_process cell killing GO:0001906 16483 54 1.030395821 0.349207 0.345945946 0.466302 0.988154019 0.560045 0.609009009 -1
biological_process mRNA catabolic process GO:0006402 16473 64 1.027780343 0.349884 0.38018018 0.466973 1.09158059 0.10179 0.041441441 0.263316
molecular_function extracellular ligand-gated ion channel activity GO:0005230 16796 65 1.027428739 0.350581 0.427027027 -1 0.999095555 0.505057 0.461261261 -1
biological_process cellular response to carbohydrate stimulus GO:0071322 16482 55 1.029816844 0.350639 0.322522523 0.468386 1.141597247 0.034237 0.01981982 0.153626
cellular_component transcription elongation factor complex GO:0008023 16793 30 1.040030674 0.351939 0.279279279 -1 1.036198845 0.365534 0.394594595 -1
biological_process positive regulation of inflammatory response GO:0050729 16484 53 1.030086218 0.351996 0.372972973 0.471309 0.977575759 0.611518 0.663063063 -1

biological_process intrinsic apoptotic signaling pathway by p53 class mediator GO:0072332 16507 30 1.03992766 0.35231 0.372972973 0.471296 1.149562401 0.077782 0.084684685 0.234029
biological_process alcohol catabolic process GO:0046164 16493 44 1.032825902 0.352864 0.342342342 0.471886 0.928009099 0.796243 0.747747748 -1
biological_process phototransduction GO:0007602 16514 23 1.045285212 0.353314 0.356756757 0.472413 0.847531819 0.897505 0.886486486 -1
biological_process membrane docking GO:0022406 16505 32 1.038380964 0.353318 0.383783784 0.47221 0.943772778 0.709359 0.672072072 -1
biological_process response to hydrogen peroxide GO:0042542 16450 87 1.023225422 0.353401 0.385585586 0.472057 0.918951116 0.905399 0.83963964 -1
biological_process regulation of ATPase activity GO:0043462 16515 22 1.045952739 0.354377 0.381981982 0.474041 0.891789364 0.810507 0.781981982 -1
biological_process somatic diversification of immune receptors GO:0002200 16492 45 1.032101886 0.354405 0.365765766 0.47408 0.927622965 0.800153 0.745945946 -1
biological_process negative regulation of amine transport GO:0051953 16513 24 1.043816696 0.354936 0.392792793 0.474426 0.993009296 0.523688 0.497297297 -1
biological_process positive regulation of epithelial cell differentiation GO:0030858 16508 29 1.039323546 0.356784 0.401801802 0.475574 1.043005778 0.344047 0.412612613 -1
biological_process regulation of Rac protein signal transduction GO:0035020 16512 25 1.042344728 0.356827 0.425225225 0.475394 1.135908951 0.119422 0.275675676 0.292405
molecular_function protein kinase activator activity GO:0030295 16823 38 1.034288285 0.356996 0.403603604 -1 1.163566907 0.0401961 0.063063063 0.0676434
biological_process positive regulation of mitotic cell cycle GO:0045931 16508 29 1.03915257 0.35738 0.409009009 0.47598 1.083318504 0.218345 0.214414414 0.418028
cellular_component spindle pole GO:0000922 16726 97 1.021155893 0.358703 0.457657658 -1 1.065048785 0.132881 0.082882883 0.229079
biological_process sulfur compound transport GO:0072348 16513 24 1.042153853 0.360206 0.36036036 0.478184 0.887796709 0.829665 0.864864865 -1
biological_process response to food GO:0032094 16515 22 1.044017795 0.360246 0.362162162 0.478001 1.089104192 0.234429 0.286486486 0.432968
cellular_component endosome membrane GO:0010008 16589 234 1.013398173 0.360344 0.421621622 -1 0.993585197 0.567976 0.527927928 -1
biological_process cellular response to corticosteroid stimulus GO:0071384 16501 36 1.034328415 0.360509 0.410810811 0.477975 0.945945811 0.713087 0.659459459 -1
biological_process cellular response to glucocorticoid stimulus GO:0071385 16501 36 1.034328415 0.360509 0.410810811 0.477975 0.945945811 0.713087 0.659459459 -1
biological_process histone lysine methylation GO:0034968 16482 55 1.027347591 0.362485 0.390990991 0.480334 1.296847929 6.69E-05 0.009009009 0.00302296
molecular_function RNA polymerase II transcription factor binding transcription factor activity GO:0001076 16781 80 1.022603252 0.362798 0.390990991 -1 1.125374342 0.0257704 0.028828829 0.0499352
molecular_function DNA-directed DNA polymerase activity GO:0003887 16834 27 1.038957425 0.362838 0.34954955 -1 1.001397602 0.494988 0.461261261 -1
biological_process positive regulation of fatty acid metabolic process GO:0045923 16516 21 1.044069362 0.36318 0.409009009 0.481227 1.019848008 0.437388 0.407207207 -1
biological_process phosphatidylcholine metabolic process GO:0046470 16511 26 1.039567339 0.363288 0.347747748 0.481086 0.965230134 0.620723 0.616216216 -1
biological_process protein localization to chromosome GO:0034502 16514 23 1.041967414 0.363616 0.427027027 0.481528 1.172612948 0.0756695 0.122522523 0.22965
biological_process regulation of calcium ion transport GO:0051924 16436 101 1.01988199 0.364263 0.454054054 0.48172 1.072306284 0.103393 0.234234234 0.26525
biological_process regulation of histone methylation GO:0031060 16513 24 1.040763112 0.364635 0.392792793 0.481742 1.41225223 0.000232052 0.005405405 0.0148401
molecular_function GTPase activity GO:0003924 16584 277 1.011798692 0.365819 0.430630631 -1 0.961091861 0.870958 0.816216216 -1
biological_process regulation of inflammatory response to antigenic stimulus GO:0002861 16515 22 1.041857474 0.366839 0.423423423 0.484679 0.762554885 0.973221 0.884684685 -1
biological_process T cell differentiation involved in immune response GO:0002292 16508 29 1.036362748 0.367145 0.425225225 0.484452 1.143339303 0.0904255 0.145945946 0.250711
biological_process alpha-beta T cell differentiation involved in immune response GO:0002293 16508 29 1.036362748 0.367145 0.425225225 0.484452 1.143339303 0.0904255 0.145945946 0.250711
biological_process negative regulation of endocytosis GO:0045806 16515 22 1.041692564 0.367344 0.331531532 0.484588 1.198741864 0.0530844 0.036036036 0.190068
biological_process regulation of cell cycle process GO:0010564 16246 291 1.011270123 0.368476 0.441441441 0.485525 1.042970626 0.100111 0.127927928 0.262478
biological_process phenol-containing compound metabolic process GO:0018958 16471 66 1.023785169 0.368697 0.363963964 0.485675 1.021839231 0.379091 0.383783784 -1
biological_process retina morphogenesis in camera-type eye GO:0060042 16505 32 1.03412182 0.368961 0.374774775 0.485851 1.067204829 0.254924 0.342342342 0.465395
cellular_component endosomal part GO:0044440 16588 235 1.0124903 0.369181 0.425225225 -1 0.993338318 0.570721 0.536936937 -1
molecular_function tumor necrosis factor receptor superfamily binding GO:0032813 16832 29 1.035734961 0.369346 0.363963964 -1 0.997747051 0.5084 0.551351351 -1
biological_process pigment cell differentiation GO:0050931 16509 28 1.036270558 0.369693 0.273873874 0.4872 0.931442368 0.735306 0.735135135 -1
cellular_component nuclear membrane GO:0031965 16646 177 1.014316924 0.370059 0.421621622 -1 1.073151389 0.0450775 0.095495495 0.0414938
biological_process multicellular organismal aging GO:0010259 16511 26 1.037441691 0.370362 0.389189189 0.487846 1.051083977 0.325822 0.252252252 -1
biological_process tumor necrosis factor-mediated signaling pathway GO:0033209 16514 23 1.039548733 0.371189 0.331531532 0.48881 0.899086512 0.799239 0.794594595 -1
molecular_function transferase activity, transferring acyl groups other than amino-acyl groups GO:0016747 16673 188 1.013749302 0.371346 0.367567568 -1 0.994380547 0.55342 0.508108108 -1
biological_process polyol catabolic process GO:0046174 16517 20 1.042076254 0.372183 0.297297297 0.489657 1.0670068 0.301772 0.275675676 -1
cellular_component methyltransferase complex GO:0034708 16762 61 1.024048943 0.372247 0.45045045 -1 1.116274775 0.0575335 0.063063063 0.0592916
biological_process negative regulation of fibroblast proliferation GO:0048147 16513 24 1.038268848 0.372622 0.405405405 0.490158 1.040118131 0.366695 0.371171171 -1
biological_process regulation of protein ubiquitination GO:0031396 16426 111 1.017630262 0.373444 0.387387387 0.490898 1.113791319 0.0186007 0.028828829 0.115999
biological_process long-chain fatty acid transport GO:0015909 16502 35 1.030876037 0.375744 0.38018018 0.493433 1.032617487 0.368986 0.299099099 -1
biological_process cellular response to alkaloid GO:0071312 16516 21 1.039692702 0.376301 0.414414414 0.493571 1.059358876 0.318674 0.300900901 -1
molecular_function endopeptidase inhibitor activity GO:0004866 16742 119 1.016497393 0.377244 0.427027027 -1 0.913809069 0.94891 0.922522523 -1
molecular_function lipoprotein particle binding GO:0071813 16841 20 1.039960338 0.378396 0.392792793 -1 1.195090316 0.0652573 0.052252252 0.104258
molecular_function protein-lipid complex binding GO:0071814 16841 20 1.039960338 0.378396 0.392792793 -1 1.195090316 0.0652573 0.052252252 0.104258
biological_process cellular protein complex assembly GO:0043623 16258 279 1.010587856 0.378722 0.354954955 0.496614 1.007310934 0.415577 0.427027027 -1
biological_process placenta blood vessel development GO:0060674 16511 26 1.034934636 0.378761 0.365765766 0.496427 1.168217867 0.0685313 0.115315315 0.219584
biological_process protein deubiquitination GO:0016579 16477 60 1.022936432 0.378952 0.463063063 0.496334 1.1264116 0.0446537 0.142342342 0.176993
biological_process embryonic placenta development GO:0001892 16460 77 1.020155316 0.379423 0.45045045 0.497065 1.071555411 0.137844 0.277477477 0.323401
biological_process neural retina development GO:0003407 16506 31 1.031742638 0.379665 0.372972973 0.49722 1.027548959 0.395166 0.423423423 -1
biological_process glucose catabolic process GO:0006007 16469 68 1.021309039 0.38021 0.434234234 0.497781 0.910193806 0.900679 0.863063063 -1
biological_process macromolecule catabolic process GO:0009057 15932 605 1.007010489 0.380502 0.49009009 0.497967 1.078085704 0.00035046 0.028828829 0.01402
biological_process proteasomal protein catabolic process GO:0010498 16366 171 1.013278472 0.381252 0.497297297 0.498228 1.009035174 0.418546 0.423423423 -1
molecular_function transferase activity, transferring acyl groups GO:0016746 16626 235 1.011283729 0.381446 0.385585586 -1 0.993472045 0.569316 0.572972973 -1
biological_process interleukin-2 production GO:0032623 16496 41 1.027060085 0.381921 0.372972973 0.498653 1.000047557 0.499811 0.526126126 -1
cellular_component nuclear replication fork GO:0043596 16800 23 1.035617377 0.383598 0.347747748 -1 1.147155819 0.110624 0.054054054 0.177855
biological_process histone methylation GO:0016571 16469 68 1.020668801 0.383704 0.432432432 -1 1.254334646 0.000136237 0.009009009 0.0107934
molecular_function guanyl nucleotide binding GO:0019001 16478 383 1.008621386 0.383761 0.436036036 -1 0.991796113 0.610773 0.654054054 -1
molecular_function guanyl ribonucleotide binding GO:0032561 16478 383 1.008621386 0.383761 0.436036036 -1 0.991796113 0.610773 0.654054054 -1
molecular_function neurotransmitter receptor activity GO:0030594 16804 57 1.022311799 0.385049 0.45045045 -1 1.037712367 0.310665 0.371171171 -1
biological_process hyaluronan metabolic process GO:0030212 16517 20 1.037541229 0.385553 0.434234234 -1 1.115761345 0.184806 0.156756757 0.379475
molecular_function serine hydrolase activity GO:0017171 16725 136 1.014176276 0.386887 0.365765766 -1 0.972523246 0.711345 0.702702703 -1
biological_process lymphocyte apoptotic process GO:0070227 16499 38 1.026669262 0.38781 0.452252252 -1 1.033629332 0.359635 0.405405405 -1
biological_process protein acetylation GO:0006473 16412 125 1.014607304 0.388259 0.454054054 -1 1.085377885 0.0485022 0.052252252 0.182161
biological_process digestive system process GO:0022600 16497 40 1.02586505 0.388345 0.381981982 -1 1.103994466 0.127026 0.154954955 0.304128
biological_process negative regulation of blood coagulation GO:0030195 16513 24 1.032796585 0.390334 0.421621622 -1 1.138885943 0.119134 0.140540541 0.292429
biological_process negative regulation of hemostasis GO:1900047 16513 24 1.032796585 0.390334 0.421621622 -1 1.138885943 0.119134 0.140540541 0.292429
cellular_component perikaryon GO:0043204 16773 50 1.02269432 0.390372 0.428828829 -1 1.076303479 0.174657 0.142342342 0.295977
biological_process response to electrical stimulus GO:0051602 16507 30 1.029253218 0.39061 0.36036036 -1 0.947247867 0.691804 0.762162162 -1
biological_process phospholipid transport GO:0015914 16505 32 1.02821117 0.39103 0.383783784 -1 1.063550355 0.266566 0.245045045 0.480771
biological_process response to toxic substance GO:0009636 16391 146 1.013112228 0.391447 0.385585586 -1 1.025802016 0.293777 0.261261261 -1
biological_process porphyrin-containing compound biosynthetic process GO:0006779 16506 31 1.028493024 0.391661 0.436036036 -1 1.056928121 0.29134 0.311711712 -1
biological_process response to gonadotropin stimulus GO:0034698 16514 23 1.033013039 0.391898 0.416216216 -1 1.053398306 0.328582 0.347747748 -1
molecular_function zinc ion binding GO:0008270 15116 1745 1.003460721 0.395708 0.491891892 -1 1.062038411 1.06E-06 0.209009009 0
biological_process syncytium formation GO:0006949 16517 20 1.034100656 0.39579 0.367567568 -1 1.309249712 0.00826714 0.010810811 0.0773406
biological_process superoxide metabolic process GO:0006801 16499 38 1.024626113 0.396201 0.427027027 -1 1.048771543 0.301079 0.336936937 -1

biological_process positive regulation of lipid biosynthetic process GO:0046889 16501 36 1.025248287 0.396418 0.4 -1 1.053687935 0.288247 0.311711712 -1
biological_process regulation of inflammatory response GO:0050727 16388 149 1.01234751 0.396576 0.403603604 -1 0.979313858 0.669843 0.612612613 -1
molecular_function steroid binding GO:0005496 16801 60 1.01946849 0.396796 0.436036036 -1 1.078874292 0.144548 0.234234234 0.287165
biological_process cellular response to calcium ion GO:0071277 16510 27 1.02886175 0.397461 0.410810811 -1 1.020548657 0.426597 0.430630631 -1
biological_process internal peptidyl-lysine acetylation GO:0018393 16429 108 1.0143911 0.397499 0.473873874 -1 1.096573597 0.040579 0.088288288 0.16623
molecular_function hydrolase activity, acting on ester bonds GO:0016788 16202 659 1.005715337 0.397741 0.445045045 -1 1.018267475 0.203664 0.259459459 0.378166
biological_process purine nucleotide biosynthetic process GO:0006164 16351 186 1.010702722 0.39968 0.403603604 -1 0.988668025 0.606137 0.623423423 -1
biological_process blastocyst development GO:0001824 16479 58 1.019025398 0.400771 0.356756757 -1 0.996821497 0.516774 0.515315315 -1
biological_process endosomal transport GO:0016197 16433 104 1.014095613 0.401409 0.466666667 -1 1.102137897 0.0351638 0.095495495 0.156532
biological_process lipoprotein biosynthetic process GO:0042158 16478 59 1.018731686 0.401447 0.363963964 -1 1.014933538 0.421139 0.436036036 -1
biological_process regulation of lipase activity GO:0060191 16482 55 1.019302182 0.401949 0.414414414 -1 1.099400073 0.100462 0.162162162 0.262175
biological_process proteolysis GO:0006508 15728 809 1.004915266 0.402007 0.463063063 -1 1.004738873 0.405466 0.428828829 -1
biological_process regulation of lipid storage GO:0010883 16509 28 1.02695432 0.402374 0.396396396 -1 1.271681562 0.00634897 0.003603604 0.0656255
cellular_component endoplasmic reticulum lumen GO:0005788 16740 83 1.015625098 0.402393 0.327927928 -1 1.003635621 0.477076 0.488288288 -1
biological_process regulation of cellular pH GO:0030641 16513 24 1.028931735 0.402985 0.432432432 -1 0.824175343 0.932294 0.956756757 -1
molecular_function aminopeptidase activity GO:0004177 16831 30 1.02586552 0.403003 0.459459459 -1 1.098719717 0.174283 0.091891892 0.325762
biological_process response to antibiotic GO:0046677 16498 39 1.022512543 0.403711 0.390990991 -1 1.0323175 0.363193 0.387387387 -1
biological_process regulation of epidermal cell differentiation GO:0045604 16514 23 1.029311407 0.403768 0.365765766 -1 1.198293022 0.0496469 0.091891892 0.183195
molecular_function endopeptidase regulator activity GO:0061135 16737 124 1.012565644 0.403939 0.446846847 -1 0.900371137 0.973119 0.945945946 -1
biological_process positive regulation of Ras protein signal transduction GO:0046579 16511 26 1.027236721 0.404896 0.461261261 -1 1.032785732 0.386007 0.416216216 -1
biological_process sulfur compound metabolic process GO:0006790 16388 149 1.011308613 0.405112 0.403603604 -1 0.977974656 0.680031 0.682882883 -1
cellular_component intrinsic to organelle membrane GO:0031300 16626 197 1.009822141 0.405125 0.412612613 -1 0.99941882 0.505654 0.526126126 -1
cellular_component secretory granule membrane GO:0030667 16780 43 1.02109721 0.4052 0.405405405 -1 1.196455873 0.0127346 0.028828829 0
biological_process DNA biosynthetic process GO:0071897 16508 29 1.025537069 0.405801 0.443243243 -1 0.955178497 0.662208 0.659459459 -1
biological_process protein lipidation GO:0006497 16483 54 1.018658503 0.406009 0.358558559 -1 1.0576642 0.231136 0.241441441 0.430574
biological_process negative regulation of mitosis GO:0045839 16513 24 1.027908835 0.40635 0.403603604 -1 1.004170497 0.485894 0.506306306 -1
biological_process negative regulation of nuclear division GO:0051784 16513 24 1.027908835 0.40635 0.403603604 -1 1.004170497 0.485894 0.506306306 -1
molecular_functionRNA polymerase II transcription factor binding transcription factor activity involved in positive regulation of transcriptionGO:0001190 16835 26 1.026779121 0.406456 0.396396396 -1 1.258127864 0.0112587 0.028828829 0.0123802
biological_process phenol-containing compound biosynthetic process GO:0046189 16512 25 1.026603957 0.408841 0.38018018 -1 0.968018686 0.609199 0.607207207 -1
biological_process response to amphetamine GO:0001975 16508 29 1.024294368 0.410306 0.47027027 -1 0.995040848 0.518484 0.486486486 -1
biological_process regulation of peptide hormone secretion GO:0090276 16431 106 1.012418444 0.412117 0.41981982 -1 1.044035841 0.215421 0.282882883 0.41568
biological_process negative regulation of actin filament polymerization GO:0030837 16507 30 1.023343576 0.412308 0.363963964 -1 1.052815194 0.308021 0.326126126 -1
biological_process sterol biosynthetic process GO:0016126 16496 41 1.019922029 0.412479 0.425225225 -1 0.980406104 0.586144 0.589189189 -1
biological_process positive regulation of cysteine-type endopeptidase activity involved in apoptotic process GO:0043280 16448 89 1.013494928 0.412529 0.423423423 -1 0.987218278 0.582967 0.637837838 -1
molecular_function GTP binding GO:0005525 16491 370 1.006546628 0.412748 0.441441441 -1 0.994121433 0.578501 0.609009009 -1
biological_process plasma lipoprotein particle organization GO:0071827 16514 23 1.026430023 0.41307 0.4 -1 0.907488797 0.779071 0.805405405 -1
biological_process icosanoid biosynthetic process GO:0046456 16504 33 1.021800752 0.414071 0.423423423 -1 1.052184505 0.301633 0.324324324 -1
biological_process fatty acid derivative biosynthetic process GO:1901570 16504 33 1.021800752 0.414071 0.423423423 -1 1.052184505 0.301633 0.324324324 -1
biological_process internal protein amino acid acetylation GO:0006475 16425 112 1.011512559 0.416178 0.479279279 -1 1.084713266 0.0596005 0.104504505 0.203854
biological_process T cell receptor signaling pathway GO:0050852 16491 46 1.017977787 0.416273 0.354954955 -1 1.073988636 0.192055 0.115315315 0.388595
biological_process positive regulation of nitric oxide biosynthetic process GO:0045429 16511 26 1.023790102 0.416744 0.441441441 -1 0.859984988 0.892074 0.807207207 -1
biological_process humoral immune response mediated by circulating immunoglobulin GO:0002455 16505 32 1.021344386 0.417111 0.414414414 -1 0.725929059 0.996407 0.931531532 -1
molecular_functionRNA polymerase II transcription factor binding transcription factor activity involved in negative regulation of transcriptionGO:0001191 16841 20 1.026088903 0.419887 0.410810811 -1 1.271884339 0.0175462 0.009009009 0.029249
cellular_component multivesicular body GO:0005771 16798 25 1.023300597 0.41999 0.410810811 -1 0.868963852 0.871961 0.810810811 -1
biological_process cellular response to unfolded protein GO:0034620 16506 31 1.020870281 0.420189 0.374774775 -1 1.13526605 0.0958329 0.104504505 0.256091
biological_process response to tumor necrosis factor GO:0034612 16455 82 1.012640917 0.421249 0.405405405 -1 1.053913334 0.198313 0.176576577 0.39402
biological_process regulation of phospholipase activity GO:0010517 16508 29 1.021271018 0.421314 0.446846847 -1 1.014932408 0.444584 0.452252252 -1
biological_process positive regulation of reactive oxygen species metabolic process GO:2000379 16510 27 1.021981949 0.42154 0.409009009 -1 0.913759449 0.781382 0.76036036 -1
cellular_component integral to organelle membrane GO:0031301 16649 174 1.008555644 0.422143 0.434234234 -1 0.979956637 0.677376 0.583783784 -1
molecular_function serine-type endopeptidase activity GO:0004252 16753 108 1.010828193 0.422493 0.432432432 -1 0.96839987 0.715885 0.699099099 -1
biological_process regulation of reactive oxygen species metabolic process GO:2000377 16491 46 1.016537095 0.422897 0.461261261 -1 0.97726509 0.605461 0.578378378 -1
biological_process apoptotic cell clearance GO:0043277 16516 21 1.024460776 0.422998 0.387387387 -1 1.14206622 0.129594 0.212612613 0.308619
biological_process ovulation GO:0030728 16514 23 1.023364608 0.423021 0.423423423 -1 0.813654522 0.939318 0.789189189 -1
biological_process viral genome replication GO:0019079 16501 36 1.018445749 0.423927 0.414414414 -1 0.970028475 0.622432 0.634234234 -1
cellular_component cell GO:0005623 4340 12483 1.000495781 0.424467 0.511711712 -1 0.998781608 0.679085 0.558558559 -1
cellular_component cell part GO:0044464 4340 12483 1.000495781 0.424467 0.511711712 -1 0.998781608 0.679085 0.558558559 -1
biological_process protein-lipid complex subunit organization GO:0071825 16513 24 1.022275326 0.425005 0.416216216 -1 0.943753882 0.683559 0.704504505 -1
cellular_component integral to endoplasmic reticulum membrane GO:0030176 16744 79 1.012019239 0.426436 0.430630631 -1 1.004910644 0.469805 0.508108108 -1
biological_process detection of abiotic stimulus GO:0009582 16471 66 1.012924928 0.427721 0.432432432 -1 0.961855963 0.704671 0.627027027 -1
biological_process organic hydroxy compound catabolic process GO:1901616 16491 46 1.01520945 0.42902 0.401801802 -1 0.911348169 0.851512 0.8 -1
biological_process mRNA export from nucleus GO:0006406 16510 27 1.019599101 0.429954 0.414414414 -1 1.050459668 0.324745 0.381981982 -1
cellular_component late endosome GO:0005770 16678 145 1.008420369 0.429976 0.410810811 -1 0.956728997 0.817637 0.767567568 -1
biological_process transition metal ion transport GO:0000041 16456 81 1.011048619 0.431485 0.423423423 -1 0.86185935 0.984568 0.998198198 -1
biological_process regulation of oligodendrocyte differentiation GO:0048713 16512 25 1.019880026 0.43162 0.4 -1 1.072655627 0.264459 0.21981982 0.478604
biological_process histone H4 acetylation GO:0043967 16492 45 1.014211715 0.434354 0.502702703 -1 1.142503886 0.0486594 0.172972973 0.181695
biological_process gamma-aminobutyric acid signaling pathway GO:0007214 16517 20 1.021039783 0.435248 0.463063063 -1 1.069812469 0.294234 0.38018018 -1
biological_process fatty acid transport GO:0015908 16487 50 1.013274611 0.435348 0.423423423 -1 1.035103199 0.333404 0.27027027 -1
biological_process endoplasmic reticulum unfolded protein response GO:0030968 16507 30 1.017139662 0.435376 0.392792793 -1 1.111387565 0.145107 0.145945946 0.33634
biological_process regulation of viral genome replication GO:0045069 16504 33 1.016267105 0.435665 0.425225225 -1 0.983274108 0.566174 0.569369369 -1
molecular_function serine-type peptidase activity GO:0008236 16727 134 1.007972292 0.436271 0.436036036 -1 0.961873731 0.778614 0.745945946 -1
biological_process positive regulation of cysteine-type endopeptidase activity GO:2001056 16447 90 1.009682065 0.436651 0.45045045 -1 0.986136213 0.590371 0.636036036 -1
biological_process histone acetylation GO:0016573 16431 106 1.008904512 0.436741 0.488288288 -1 1.094844097 0.0448733 0.099099099 0.177294
biological_process embryo implantation GO:0007566 16501 36 1.015009208 0.437976 0.423423423 -1 0.927583998 0.774414 0.704504505 -1
biological_process regulation of carbohydrate catabolic process GO:0043470 16513 24 1.018259309 0.43841 0.428828829 -1 1.115344123 0.163687 0.30990991 0.354436
biological_process regulation of cellular carbohydrate catabolic process GO:0043471 16513 24 1.018259309 0.43841 0.428828829 -1 1.115344123 0.163687 0.30990991 0.354436
biological_process ER-associated protein catabolic process GO:0030433 16502 35 1.015106243 0.438446 0.461261261 -1 1.01412495 0.442417 0.445045045 -1
biological_process response to iron ion GO:0010039 16514 23 1.018453636 0.439062 0.41981982 -1 1.066574855 0.290008 0.25045045 -1
biological_process cellular glucose homeostasis GO:0001678 16481 56 1.01174255 0.439433 0.461261261 -1 1.040831498 0.298024 0.187387387 -1
biological_process epidermal cell differentiation GO:0009913 16433 104 1.008587302 0.439555 0.445045045 -1 1.074331215 0.0939083 0.205405405 0.254524
biological_process peptidyl-lysine acetylation GO:0018394 16426 111 1.008147292 0.440734 0.486486486 -1 1.095880012 0.039578 0.075675676 0.165078
biological_process cholesterol homeostasis GO:0042632 16493 44 1.012902024 0.441021 0.410810811 -1 1.079330525 0.18072 0.27027027 0.376292

biological_process autophagic vacuole assembly GO:0000045 16505 32 1.014991571 0.441573 0.448648649 -1 0.92087468 0.781152 0.859459459 -1
biological_process cell activation involved in immune response GO:0002263 16416 121 1.007610162 0.442205 0.488288288 -1 1.01017876 0.422869 0.452252252 -1
biological_process leukocyte activation involved in immune response GO:0002366 16416 121 1.007610162 0.442205 0.488288288 -1 1.01017876 0.422869 0.452252252 -1
biological_process response to gamma radiation GO:0010332 16493 44 1.012404546 0.44328 0.437837838 -1 1.029214373 0.368417 0.376576577 -1
biological_process regulation of RNA stability GO:0043487 16501 36 1.013557999 0.443933 0.446846847 -1 1.072936597 0.223994 0.21981982 0.422903
biological_process androgen receptor signaling pathway GO:0030521 16499 38 1.013140565 0.444166 0.434234234 -1 1.078896841 0.199523 0.252252252 0.394631
biological_process response to ionizing radiation GO:0010212 16418 119 1.007305085 0.44494 0.455855856 -1 1.021302942 0.343157 0.369369369 -1
biological_process cellular response to metal ion GO:0071248 16464 73 1.009336768 0.444954 0.463063063 -1 1.118906292 0.0389051 0.068468468 0.16392
biological_process regulation of G1/S transition of mitotic cell cycle GO:2000045 16489 48 1.011431577 0.445386 0.423423423 -1 1.050395002 0.272397 0.198198198 0.489145
biological_process regulation of mitotic metaphase/anaphase transition GO:0030071 16510 27 1.015173812 0.445662 0.457657658 -1 1.080643901 0.23381 0.198198198 0.433139
biological_process regulation of metaphase/anaphase transition of cell cycle GO:1902099 16510 27 1.015173812 0.445662 0.457657658 -1 1.080643901 0.23381 0.198198198 0.433139
biological_process male gamete generation GO:0048232 16223 314 1.004333829 0.446621 0.477477477 -1 1.053088721 0.0499807 0.104504505 0.183255
biological_process regulation of interleukin-1 beta production GO:0032651 16509 28 1.01439446 0.447495 0.468468468 -1 1.02765401 0.399893 0.401801802 -1
biological_process leukocyte apoptotic process GO:0071887 16482 55 1.010236529 0.447628 0.482882883 -1 1.04765571 0.269896 0.273873874 0.485923
biological_process regulation of insulin secretion GO:0050796 16446 91 1.007866681 0.448174 0.437837838 -1 1.049449375 0.206322 0.264864865 0.403824
biological_process ribose phosphate biosynthetic process GO:0046390 16344 193 1.005293706 0.449033 0.434234234 -1 0.976770825 0.713085 0.726126126 -1
biological_process intrinsic apoptotic signaling pathway GO:0097193 16434 103 1.007188906 0.449589 0.473873874 -1 1.056284591 0.16049 0.142342342 0.351096
biological_process spermatogenesis GO:0007283 16224 313 1.003918406 0.451779 0.482882883 -1 1.054764782 0.0451138 0.095495495 0.177602
biological_process regulation of mitotic cell cycle phase transition GO:1901990 16434 103 1.006692255 0.453057 0.481081081 -1 1.083801187 0.069748 0.073873874 0.221009
cellular_component Golgi-associated vesicle GO:0005798 16771 52 1.009311874 0.453641 0.457657658 -1 1.068805669 0.194697 0.214414414 0.325368
cellular_component intrinsic to endoplasmic reticulum membrane GO:0031227 16724 99 1.006674508 0.454084 0.455855856 -1 1.048586758 0.200508 0.322522523 0.332349
biological_process DNA-dependent transcription, elongation GO:0006354 16502 35 1.011167249 0.45442 0.475675676 -1 1.137083739 0.0798349 0.084684685 0.236369
cellular_component signalosome GO:0008180 16792 31 1.011708089 0.455018 0.497297297 -1 1.006665367 0.474359 0.486486486 -1
biological_process detection of external stimulus GO:0009581 16458 79 1.007188936 0.455857 0.446846847 -1 0.946954615 0.793511 0.722522523 -1
molecular_function modified amino acid binding GO:0072341 16813 48 1.00913855 0.456284 0.410810811 -1 0.902404405 0.879577 0.8 -1
biological_process xenobiotic metabolic process GO:0006805 16511 26 1.012306022 0.456711 0.428828829 -1 1.020836521 0.426958 0.367567568 -1
biological_process cellular response to xenobiotic stimulus GO:0071466 16511 26 1.012306022 0.456711 0.428828829 -1 1.020836521 0.426958 0.367567568 -1
biological_process catecholamine metabolic process GO:0006584 16496 41 1.009592495 0.457606 0.472072072 -1 1.199756798 0.0132717 0.018018018 0.0982678
biological_process catechol-containing compound metabolic process GO:0009712 16496 41 1.009592495 0.457606 0.472072072 -1 1.199756798 0.0132717 0.018018018 0.0982678
biological_process phospholipid catabolic process GO:0009395 16511 26 1.011794379 0.458505 0.434234234 -1 0.708915155 0.994958 0.972972973 -1
molecular_function hydrolase activity, acting on carbon-nitrogen (but not peptide) bonds, in linear amides GO:0016811 16811 50 1.008464647 0.458662 0.443243243 -1 0.87793675 0.932836 0.918918919 -1
molecular_function endoribonuclease activity GO:0004521 16828 33 1.010420346 0.458679 0.484684685 -1 0.74152436 0.99498 0.92972973 -1
cellular_component photoreceptor outer segment GO:0001750 16783 40 1.009397832 0.458961 0.484684685 -1 1.153804709 0.0458132 0.099099099 0.0412893
biological_process developmental pigmentation GO:0048066 16501 36 1.009839279 0.459253 0.47027027 -1 0.979790537 0.583287 0.58018018 -1
molecular_function oxidoreductase activity, acting on paired donors, with incorporation or reduction of molecular oxygen GO:0016705 16695 166 1.004540687 0.459459 0.466666667 -1 0.979825513 0.67455 0.704504505 -1
molecular_function enzyme inhibitor activity GO:0004857 16628 233 1.003796668 0.459736 0.452252252 -1 1.003150167 0.466606 0.488288288 -1
molecular_function kinase regulator activity GO:0019207 16738 123 1.005214657 0.459988 0.457657658 -1 1.030248111 0.279907 0.286486486 0.483629
biological_process ER-nucleus signaling pathway GO:0006984 16494 43 1.008693687 0.460641 0.394594595 -1 1.089477604 0.154442 0.142342342 0.34489
biological_process complement activation GO:0006956 16504 33 1.009733003 0.461407 0.437837838 -1 0.690166719 0.998986 0.974774775 -1
biological_process sensory perception of smell GO:0007608 16487 50 1.007897885 0.461434 0.473873874 -1 1.004064277 0.480142 0.493693694 -1
biological_process activation of cysteine-type endopeptidase activity involved in apoptotic process GO:0006919 16472 65 1.006905854 0.461535 0.499099099 -1 0.954591662 0.737422 0.789189189 -1
biological_process activation of cysteine-type endopeptidase activity GO:0097202 16472 65 1.006905854 0.461535 0.499099099 -1 0.954591662 0.737422 0.789189189 -1
biological_process cell-cell recognition GO:0009988 16517 20 1.012459516 0.461553 0.49009009 -1 0.963463102 0.611504 0.592792793 -1
biological_process immunoglobulin production involved in immunoglobulin mediated immune response GO:0002381 16503 34 1.009535758 0.461619 0.472072072 -1 0.964633672 0.639683 0.632432432 -1
biological_process monocarboxylic acid metabolic process GO:0032787 16210 327 1.00299042 0.462344 0.455855856 -1 0.975885669 0.777274 0.783783784 -1
molecular_function histone acetyltransferase activity GO:0004402 16814 47 1.00793489 0.462422 0.520720721 -1 1.154188551 0.033366 0.140540541 0.0513133
biological_process positive regulation of gliogenesis GO:0014015 16502 35 1.009128647 0.462717 0.468468468 -1 1.035585553 0.35756 0.322522523 -1
biological_process regulation of activin receptor signaling pathway GO:0032925 16515 22 1.011431577 0.462997 0.472072072 -1 1.139016955 0.129214 0.127927928 0.308598
molecular_function peptidase inhibitor activity GO:0030414 16734 127 1.004719823 0.463138 0.463063063 -1 0.923299216 0.933564 0.915315315 -1
biological_process vacuolar transport GO:0007034 16498 39 1.008394272 0.463804 0.49009009 -1 1.087013781 0.173024 0.210810811 0.366342
biological_process regulation of T cell receptor signaling pathway GO:0050856 16516 21 1.011376868 0.46402 0.486486486 -1 1.053934122 0.334208 0.347747748 -1
biological_process organelle assembly GO:0070925 16296 241 1.003310682 0.464283 0.466666667 -1 0.982084506 0.686273 0.632432432 -1
molecular_function polyubiquitin binding GO:0031593 16832 29 1.009563058 0.464441 0.477477477 -1 0.971366558 0.605395 0.672072072 -1
biological_process response to axon injury GO:0048678 16475 62 1.00642842 0.465026 0.457657658 -1 1.001403807 0.492371 0.468468468 -1
cellular_component sarcoplasmic reticulum membrane GO:0033017 16801 22 1.01067793 0.465423 0.45045045 -1 1.284772445 0.0103049 0.01981982 0
biological_process unsaturated fatty acid metabolic process GO:0033559 16491 46 1.007180483 0.466362 0.445045045 -1 1.07736953 0.181379 0.209009009 0.377091
biological_process regulation of cell cycle phase transition GO:1901987 16372 165 1.003700962 0.467042 0.477477477 -1 1.065311342 0.0720929 0.079279279 0.224637
biological_process response to activity GO:0014823 16497 40 1.007467964 0.467381 0.446846847 -1 0.923071144 0.800612 0.8 -1
biological_process response to increased oxygen levels GO:0036296 16509 28 1.008922196 0.467405 0.463063063 -1 1.114907897 0.145937 0.10990991 0.336767
biological_process response to hyperoxia GO:0055093 16509 28 1.008922196 0.467405 0.463063063 -1 1.114907897 0.145937 0.10990991 0.336767
biological_process negative regulation of endothelial cell migration GO:0010596 16515 22 1.010024344 0.467544 0.423423423 -1 0.983336408 0.553908 0.558558559 -1
biological_process regulation of nitric oxide biosynthetic process GO:0045428 16500 37 1.007246279 0.469559 0.491891892 -1 0.893404887 0.869576 0.771171171 -1
biological_process endosome to lysosome transport GO:0008333 16512 25 1.008333247 0.471231 0.486486486 -1 1.100349515 0.192237 0.061261261 0.388318
cellular_component gap junction GO:0005921 16800 23 1.008673452 0.471272 0.452252252 -1 0.805578385 0.946971 0.886486486 -1
biological_process positive regulation of endopeptidase activity GO:0010950 16441 96 1.00410877 0.47215 0.491891892 -1 0.961667232 0.742964 0.771171171 -1
biological_process protein metabolic process GO:0019538 12935 3602 1.000572797 0.473269 0.452252252 -1 1.005803646 0.247716 0.304504505 0.456149
cellular_component protein complex GO:0043234 13821 3002 1.00061338 0.474373 0.513513514 -1 1.015898807 0.0479824 0.113513514 0.0471448
biological_process type 2 immune response GO:0042092 16515 22 1.007737592 0.474941 0.508108108 -1 0.947952216 0.663918 0.666666667 -1
biological_process cellular response to ketone GO:1901655 16515 22 1.00731982 0.476293 0.479279279 -1 1.031055868 0.400356 0.441441441 -1
molecular_function chloride transmembrane transporter activity GO:0015108 16786 75 1.003903699 0.476609 0.473873874 -1 0.93055055 0.851785 0.722522523 -1
biological_process negative regulation of peptidyl-tyrosine phosphorylation GO:0050732 16509 28 1.006369624 0.476723 0.463063063 -1 1.051503924 0.318319 0.288288288 -1
biological_process positive regulation of small GTPase mediated signal transduction GO:0051057 16508 29 1.005974951 0.477778 0.508108108 -1 1.031975762 0.382672 0.437837838 -1
biological_process histone H3-K4 methylation GO:0051568 16507 30 1.005703336 0.478425 0.491891892 -1 1.298597441 0.00228883 0.009009009 0.0509701
cellular_component chloride channel complex GO:0034707 16776 47 1.004515366 0.478598 0.473873874 -1 0.920984702 0.826293 0.765765766 -1
biological_process sterol homeostasis GO:0055092 16492 45 1.004534307 0.478984 0.427027027 -1 1.073942365 0.194819 0.281081081 0.392177
molecular_function carbon-carbon lyase activity GO:0016830 16815 46 1.004425308 0.47925 0.464864865 -1 0.917569291 0.833906 0.796396396 -1
biological_process tetrapyrrole biosynthetic process GO:0033014 16503 34 1.005082541 0.47953 0.49009009 -1 1.049308819 0.309077 0.327927928 -1
biological_process organic cation transport GO:0015695 16516 21 1.006320675 0.48 0.517117117 -1 0.890419825 0.807957 0.767567568 -1
biological_process icosanoid secretion GO:0032309 16513 24 1.005233709 0.482295 0.454054054 -1 0.90798261 0.782726 0.771171171 -1
biological_process ribonucleotide biosynthetic process GO:0009260 16347 190 1.001842783 0.482374 0.457657658 -1 0.980615682 0.679246 0.684684685 -1
cellular_component polysome GO:0005844 16802 21 1.005485901 0.482634 0.486486486 -1 1.261882796 0.0187645 0.01981982 0.00801559

biological_process keratinocyte proliferation GO:0043616 16516 21 1.004241762 0.486582 0.52972973 -1 1.308529002 0.00713396 0.104504505 0.0738603
biological_process endoplasmic reticulum organization GO:0007029 16516 21 1.004212968 0.486673 0.488288288 -1 1.208591442 0.048791 0.05045045 0.181615
molecular_function histone binding GO:0042393 16771 90 1.002003831 0.48684 0.517117117 -1 1.152554145 0.00597718 0.102702703 0
biological_process negative regulation of I-kappaB kinase/NF-kappaB cascade GO:0043124 16514 23 1.003820621 0.487352 0.484684685 -1 1.008421371 0.472115 0.461261261 -1
biological_process cellular macromolecular complex assembly GO:0034622 16079 458 1.000776445 0.488405 0.511711712 -1 0.968031846 0.885301 0.742342342 -1
biological_process detection of mechanical stimulus GO:0050982 16509 28 1.002888453 0.489451 0.520720721 -1 1.068106436 0.266083 0.326126126 0.480415
biological_process negative regulation of binding GO:0051100 16472 65 1.001863836 0.489621 0.508108108 -1 1.046001028 0.25992 0.243243243 0.472368
molecular_function N-methyltransferase activity GO:0008170 16798 63 1.001823092 0.489992 0.506306306 -1 1.121011048 0.0477801 0.034234234 0.0803319
biological_process viral genome expression GO:0019080 16513 24 1.002941001 0.490058 0.488288288 -1 1.127583652 0.139327 0.113513514 0.326564
biological_process viral transcription GO:0019083 16513 24 1.002941001 0.490058 0.488288288 -1 1.127583652 0.139327 0.113513514 0.326564
biological_process lymphocyte activation involved in immune response GO:0002285 16461 76 1.001483163 0.49107 0.524324324 -1 1.063772133 0.167242 0.232432432 0.358315
biological_process organophosphate biosynthetic process GO:0090407 16130 407 1.000608577 0.491463 0.475675676 -1 0.983538162 0.71991 0.754954955 -1
biological_process alpha-beta T cell activation involved in immune response GO:0002287 16507 30 1.002035004 0.492312 0.545945946 -1 1.142592571 0.0878735 0.171171171 0.2477
biological_process nuclear-transcribed mRNA catabolic process GO:0000956 16482 55 1.001049942 0.494633 0.520720721 -1 1.066774277 0.195135 0.075675676 0.392166
biological_process ubiquitin-dependent protein catabolic process GO:0006511 16221 316 1.000430409 0.494696 0.50990991 -1 1.092634936 0.00198973 0.086486486 0.0507538
cellular_component mediator complex GO:0016592 16788 35 1.001274228 0.494795 0.533333333 -1 0.950812276 0.693076 0.664864865 -1
biological_process icosanoid transport GO:0071715 16512 25 1.001502894 0.494823 0.464864865 -1 0.910468611 0.781132 0.767567568 -1
biological_process fatty acid derivative transport GO:1901571 16512 25 1.001502894 0.494823 0.464864865 -1 0.910468611 0.781132 0.767567568 -1
biological_process positive regulation of lipid transport GO:0032370 16507 30 1.001349711 0.494907 0.520720721 -1 1.183504545 0.0407145 0.036036036 0.166789
biological_process cellular response to topologically incorrect protein GO:0035967 16501 36 1.001172342 0.495155 0.479279279 -1 1.093626391 0.165021 0.183783784 0.355053
biological_process glutamine metabolic process GO:0006541 16517 20 1.000317741 0.499037 0.511711712 -1 1.080587689 0.266125 0.351351351 0.480458
biological_process cellular response to interferon-gamma GO:0071346 16500 37 1.000189617 0.499223 0.506306306 -1 1.070272508 0.229297 0.254054054 0.427886
molecular_function chromatin DNA binding GO:0031490 16829 32 1.000182262 0.499297 0.520720721 -1 0.982513083 0.568096 0.558558559 -1
biological_process regulation of interleukin-2 production GO:0032663 16500 37 1.000120978 0.499512 0.479279279 -1 1.004824331 0.479729 0.511711712 -1
biological_process chloride transport GO:0006821 16491 46 1.000074296 0.499673 0.493693694 -1 0.876022293 0.927653 0.895495495 -1
biological_process negative regulation of protein secretion GO:0050709 16499 38 0.999630963 0.501595 0.475675676 -1 0.908379889 0.836319 0.807207207 -1
biological_process interleukin-12 production GO:0032615 16503 34 0.999462667 0.502188 0.493693694 -1 1.109000423 0.135239 0.187387387 0.318539
biological_process body fluid secretion GO:0007589 16466 71 0.999606445 0.502321 0.481081081 -1 1.237294573 0.00025956 0.001801802 0.0145904
biological_process iron ion transport GO:0006826 16499 38 0.99940819 0.502545 0.500900901 -1 0.78969589 0.987716 0.989189189 -1
cellular_component chromatin GO:0000785 16521 302 0.999652563 0.504238 0.50990991 -1 1.02194413 0.25255 0.331531532 0.417948
biological_process labyrinthine layer development GO:0060711 16500 37 0.998820121 0.504986 0.488288288 -1 1.098502428 0.14942 0.201801802 0.340479
cellular_component filamentous actin GO:0031941 16803 20 0.998377854 0.505027 0.482882883 -1 1.255516604 0.0238275 0.032432432 0.0158979
molecular_function pyridoxal phosphate binding GO:0030170 16809 52 0.998960522 0.505196 0.506306306 -1 0.892831972 0.909984 0.90990991 -1
molecular_function monooxygenase activity GO:0004497 16764 97 0.999079884 0.506288 0.511711712 -1 0.983521191 0.611009 0.607207207 -1
biological_process limbic system development GO:0021761 16464 73 0.998658129 0.507964 0.493693694 -1 0.984881592 0.588736 0.609009009 -1
molecular_function carbohydrate derivative transporter activity GO:1901505 16836 25 0.997652163 0.508128 0.547747748 -1 1.11516143 0.159123 0.156756757 0.30555
biological_process amide biosynthetic process GO:0043604 16495 42 0.998114439 0.508475 0.515315315 -1 0.965470895 0.651046 0.632432432 -1
biological_process cellular senescence GO:0090398 16509 28 0.997610547 0.508764 0.522522523 -1 0.996500546 0.512824 0.527927928 -1
biological_process mitotic cell cycle GO:0000278 16207 330 0.999164104 0.510665 0.499099099 -1 1.098920002 0.000833497 0.012612613 0.0344462
biological_process regulation of cellular amine metabolic process GO:0033238 16513 24 0.996148541 0.513065 0.518918919 -1 1.073979653 0.264949 0.266666667 0.478933
biological_process negative regulation of B cell activation GO:0050869 16512 25 0.995915743 0.514139 0.500900901 -1 0.797201819 0.960602 0.978378378 -1
cellular_component SAGA-type complex GO:0070461 16798 25 0.995892118 0.514211 0.49009009 -1 1.050694811 0.330206 0.205405405 -1
biological_process modification of morphology or physiology of other organism involved in symbiotic interaction GO:0051817 16497 40 0.9964539 0.515534 0.515315315 -1 1.021311885 0.40761 0.432432432 -1
biological_process regulation of intracellular pH GO:0051453 16515 22 0.995078 0.515979 0.499099099 -1 0.768398196 0.970143 0.987387387 -1
biological_process DNA damage checkpoint GO:0000077 16463 74 0.997279029 0.516231 0.535135135 -1 1.092168101 0.0843594 0.169369369 0.244044
molecular_function transition metal ion binding GO:0046914 14872 1989 0.999448499 0.51816 0.524324324 -1 1.048693401 3.10E-05 0.221621622 0
biological_process RNA polyadenylation GO:0043631 16514 23 0.994350962 0.518746 0.52972973 -1 1.162549136 0.0883219 0.144144144 0.247909
biological_process negative regulation of protein ubiquitination GO:0031397 16501 36 0.995330557 0.519394 0.578378378 -1 1.143249645 0.068072 0.043243243 0.218411
biological_process intracellular estrogen receptor signaling pathway GO:0030520 16512 25 0.994063034 0.520539 0.531531532 -1 1.364198497 0.000798447 0.014414414 0.0327448
biological_process natural killer cell mediated immunity GO:0002228 16513 24 0.99354846 0.521865 0.52972973 -1 0.928556509 0.727983 0.742342342 -1
biological_process natural killer cell mediated cytotoxicity GO:0042267 16513 24 0.99354846 0.521865 0.52972973 -1 0.928556509 0.727983 0.742342342 -1
biological_process regulation of viral transcription GO:0046782 16514 23 0.993336168 0.522107 0.536936937 -1 1.110847218 0.178425 0.171171171 0.372773
biological_process cellular biogenic amine metabolic process GO:0006576 16461 76 0.99633392 0.522149 0.499099099 -1 0.978039469 0.630219 0.598198198 -1
biological_process photoreceptor cell differentiation GO:0046530 16493 44 0.995105485 0.522474 0.545945946 -1 1.112342761 0.0981056 0.156756757 0.260607
biological_process eye photoreceptor cell differentiation GO:0001754 16502 35 0.994253764 0.523523 0.54954955 -1 1.100426913 0.151473 0.246846847 0.342192
biological_process regulation of circadian rhythm GO:0042752 16506 31 0.993523591 0.524944 0.49009009 -1 0.928894116 0.75378 0.641441441 -1
molecular_function ribonuclease activity GO:0004540 16815 46 0.994639985 0.525147 0.544144144 -1 0.779520181 0.995252 0.958558559 -1
molecular_function ATPase activity GO:0016887 16505 356 0.998049573 0.525682 0.511711712 -1 1.082122717 0.00333787 0.124324324 0
biological_process G2 DNA damage checkpoint GO:0031572 16508 29 0.992909908 0.526408 0.556756757 -1 1.128093278 0.115886 0.185585586 0.285037
biological_process response to unfolded protein GO:0006986 16481 56 0.99489817 0.52643 0.49009009 -1 1.145266652 0.0296424 0.036036036 0.143226
biological_process response to salt stress GO:0009651 16516 21 0.99154945 0.526776 0.493693694 -1 0.81762907 0.926266 0.926126126 -1
molecular_function phospholipase C activity GO:0004629 16837 24 0.992029062 0.526993 0.542342342 -1 1.114073777 0.166363 0.308108108 0.318741
biological_process mRNA 3'-end processing GO:0031124 16506 31 0.992712162 0.528062 0.544144144 -1 1.162039279 0.0588961 0.126126126 0.203025
biological_process microtubule anchoring GO:0034453 16505 32 0.992728376 0.528448 0.513513514 -1 1.152784536 0.0670125 0.043243243 0.218972
molecular_function neuropeptide receptor activity GO:0008188 16828 33 0.992190353 0.531009 0.511711712 -1 0.977870896 0.587238 0.545945946 -1
biological_process organonitrogen compound biosynthetic process GO:1901566 16034 503 0.997998886 0.531501 0.486486486 -1 0.975095956 0.837107 0.688288288 -1
molecular_function amino acid binding GO:0016597 16766 95 0.995196312 0.532418 0.50990991 -1 0.924885572 0.898264 0.864864865 -1
biological_process neuroepithelial cell differentiation GO:0060563 16503 34 0.991929189 0.532537 0.540540541 -1 0.97315952 0.606963 0.58018018 -1
molecular_function structure-specific DNA binding GO:0043566 16663 198 0.996467501 0.5345 0.527927928 -1 1.0557006 0.0860415 0.147747748 0.156048
biological_process response to xenobiotic stimulus GO:0009410 16507 30 0.990336654 0.536576 0.520720721 -1 1.004699583 0.482223 0.464864865 -1
biological_process chaperone-mediated protein folding GO:0061077 16512 25 0.988916083 0.538285 0.535135135 -1 0.922861928 0.748127 0.765765766 -1
biological_process modification-dependent protein catabolic process GO:0019941 16215 322 0.996913111 0.538657 0.522522523 -1 1.091155256 0.00211109 0.086486486 0.0503586
cellular_component microtubule organizing center part GO:0044450 16735 88 0.993999907 0.538942 0.536936937 -1 1.027093881 0.329472 0.338738739 -1
biological_process cellular component maintenance GO:0043954 16503 34 0.989997802 0.540294 0.545945946 -1 1.129363576 0.0954643 0.054054054 0.256091
cellular_component photoreceptor inner segment GO:0001917 16799 24 0.987874996 0.541013 0.538738739 -1 0.947897363 0.670922 0.70990991 -1
molecular_function peptidase regulator activity GO:0061134 16705 156 0.995130028 0.542144 0.520720721 -1 0.920223272 0.958541 0.922522523 -1
biological_process positive regulation of peptide secretion GO:0002793 16486 51 0.991452567 0.542188 0.545945946 -1 1.03553657 0.329897 0.342342342 -1
biological_process negative regulation of transcription factor import into nucleus GO:0042992 16510 27 0.988062199 0.542836 0.578378378 -1 1.041586695 0.353999 0.369369369 -1
biological_process protein tetramerization GO:0051262 16455 82 0.993138096 0.542986 0.544144144 -1 1.009759148 0.439046 0.488288288 -1
biological_process anterograde axon cargo transport GO:0008089 16517 20 0.985563792 0.544565 0.535135135 -1 0.892323672 0.798038 0.807207207 -1
molecular_function steroid dehydrogenase activity, acting on the CH-OH group of donors, NAD or NADP as acceptor GO:0033764 16835 26 0.987282002 0.544762 0.531531532 -1 0.854557448 0.900703 0.794594595 -1

molecular_function heat shock protein binding GO:0031072 16769 92 0.993018123 0.546306 0.54954955 -1 0.996711792 0.521851 0.511711712 -1
biological_process response to amine stimulus GO:0014075 16496 41 0.988797745 0.54952 0.538738739 -1 0.956546709 0.685305 0.72972973 -1
cellular_component rough endoplasmic reticulum GO:0005791 16780 43 0.988983601 0.54986 0.551351351 -1 0.948554071 0.72076 0.630630631 -1
molecular_function cyclic nucleotide binding GO:0030551 16832 29 0.986200984 0.551261 0.554954955 -1 0.99950984 0.501836 0.477477477 -1
biological_process protein homotetramerization GO:0051289 16481 56 0.990067288 0.55133 0.54954955 -1 0.95446518 0.722831 0.679279279 -1
biological_process positive regulation of calcium ion transport GO:0051928 16494 43 0.98839646 0.552516 0.569369369 -1 1.078405111 0.186293 0.246846847 0.380712
cellular_component MLL1/2 complex GO:0044665 16795 28 0.985561123 0.552695 0.58018018 -1 1.046766237 0.333974 0.297297297 -1
cellular_component MLL1 complex GO:0071339 16795 28 0.985561123 0.552695 0.58018018 -1 1.046766237 0.333974 0.297297297 -1
cellular_component Golgi-associated vesicle membrane GO:0030660 16791 32 0.986351873 0.553251 0.544144144 -1 0.961911329 0.645642 0.594594595 -1
biological_process positive regulation of reproductive process GO:2000243 16474 63 0.989787268 0.555959 0.513513514 -1 1.121376906 0.0472789 0.156756757 0.180819
biological_process response to interferon-beta GO:0035456 16514 23 0.982625622 0.557438 0.504504505 -1 0.717075572 0.990661 0.951351351 -1
biological_process nucleotide-excision repair GO:0006289 16491 46 0.987720624 0.557451 0.578378378 -1 0.951332633 0.716535 0.76036036 -1
biological_process negative regulation of DNA binding GO:0043392 16508 29 0.984377805 0.557998 0.558558559 -1 1.020945747 0.422503 0.437837838 -1
biological_process interaction with host GO:0051701 16470 67 0.989581328 0.558858 0.56036036 -1 1.005434513 0.469254 0.47027027 -1
biological_process monocarboxylic acid biosynthetic process GO:0072330 16388 149 0.993014301 0.559025 0.527927928 -1 1.019351942 0.340542 0.284684685 -1
biological_process protein activation cascade GO:0072376 16502 35 0.985498142 0.559149 0.515315315 -1 0.739311054 0.996255 0.958558559 -1
biological_process icosanoid metabolic process GO:0006690 16493 44 0.986983667 0.55954 0.520720721 -1 1.074075393 0.197061 0.212612613 0.393572
biological_process fatty acid derivative metabolic process GO:1901568 16493 44 0.986983667 0.55954 0.520720721 -1 1.074075393 0.197061 0.212612613 0.393572
cellular_component protein serine/threonine phosphatase complex GO:0008287 16787 36 0.985395071 0.560394 0.54954955 -1 1.08509727 0.187995 0.288288288 0.314318
molecular_function endoribonuclease activity, producing 5'-phosphomonoesters GO:0016891 16840 21 0.980542957 0.561417 0.596396396 -1 0.86655313 0.85541 0.834234234 -1
biological_process cellular response to interferon-beta GO:0035458 16517 20 0.979825474 0.562149 0.497297297 -1 0.630465264 0.99791 0.983783784 -1
biological_process cellular amide metabolic process GO:0043603 16418 119 0.991754394 0.562155 0.556756757 -1 0.95376079 0.809735 0.72972973 -1
biological_process regulation of fatty acid metabolic process GO:0019217 16491 46 0.986243126 0.564304 0.518918919 -1 1.148510275 0.0403165 0.061261261 0.165748
biological_process regulation of lipoprotein lipase activity GO:0051004 16512 25 0.981277891 0.564471 0.52972973 -1 1.207850174 0.0358202 0.091891892 0.156869
biological_process sperm motility GO:0030317 16508 29 0.982459541 0.565058 0.544144144 -1 1.121737987 0.127879 0.122522523 0.305574
cellular_component outer membrane GO:0019867 16690 133 0.991798859 0.565308 0.540540541 -1 1.004714536 0.462358 0.482882883 -1
biological_process Golgi vesicle transport GO:0048193 16418 119 0.991295048 0.565586 0.547747748 -1 0.993224911 0.551143 0.497297297 -1
cellular_component Golgi cisterna membrane GO:0032580 16765 58 0.987311351 0.566586 0.572972973 -1 1.103364834 0.0859928 0.209009009 0.131889
biological_process RNA 3'-end processing GO:0031123 16489 48 0.986000162 0.566827 0.583783784 -1 1.114081874 0.0851944 0.163963964 0.243361
biological_process cellular response to inorganic substance GO:0071241 16460 77 0.988797285 0.567782 0.554954955 -1 1.121617378 0.0319605 0.052252252 0.150117
biological_process NADP metabolic process GO:0006739 16509 28 0.980727296 0.570184 0.553153153 -1 0.896056214 0.829843 0.733333333 -1
biological_process secretion by tissue GO:0032941 16470 67 0.98748935 0.570558 0.533333333 -1 1.236059277 0.000398912 0.007207207 0.0183564
molecular_function intramolecular oxidoreductase activity GO:0016860 16825 36 0.982765953 0.571158 0.590990991 -1 0.91434118 0.813587 0.754954955 -1
biological_process protein catabolic process GO:0030163 16078 459 0.994796827 0.577664 0.54954955 -1 1.071409443 0.00360055 0.086486486 0.0589707
molecular_function carboxylic ester hydrolase activity GO:0052689 16772 89 0.987883766 0.578686 0.515315315 -1 0.949359515 0.796649 0.794594595 -1
biological_process virus-host interaction GO:0019048 16482 55 0.984561139 0.578755 0.625225225 -1 1.03568764 0.323068 0.340540541 -1
biological_process regulation of plasma lipoprotein particle levels GO:0097006 16499 38 0.981369928 0.578947 0.554954955 -1 1.064403855 0.2456 0.248648649 0.45303
biological_process regulation of interleukin-12 production GO:0032655 16505 32 0.979523894 0.579602 0.583783784 -1 1.076006558 0.228015 0.261261261 0.426316
biological_process GPI anchor metabolic process GO:0006505 16498 39 0.981385677 0.579901 0.630630631 -1 0.989956487 0.543328 0.535135135 -1
molecular_function DNA polymerase activity GO:0034061 16830 31 0.979056415 0.580116 0.562162162 -1 0.975371854 0.593965 0.567567568 -1
biological_process response to topologically incorrect protein GO:0035966 16474 63 0.985255123 0.580495 0.535135135 -1 1.123208193 0.0448419 0.045045045 0.177413
biological_process negative regulation of endothelial cell proliferation GO:0001937 16514 23 0.974969973 0.58243 0.547747748 -1 1.030031753 0.401451 0.367567568 -1
biological_process response to heat GO:0009408 16466 71 0.985746726 0.582594 0.571171171 -1 1.10370678 0.0646598 0.091891892 0.214685
biological_process mammary gland epithelial cell proliferation GO:0033598 16511 26 0.976090938 0.583705 0.533333333 -1 1.054111979 0.316239 0.318918919 -1
biological_process modification-dependent macromolecule catabolic process GO:0043632 16212 325 0.993180774 0.585173 0.542342342 -1 1.086634855 0.00314645 0.09009009 0.056866
biological_process cellular response to monosaccharide stimulus GO:0071326 16486 51 0.982330349 0.58666 0.661261261 -1 1.098922589 0.110198 0.034234234 0.276598
molecular_function peptidase activator activity GO:0016504 16831 30 0.976907279 0.586793 0.587387387 -1 0.932942518 0.737864 0.700900901 -1
biological_process regulation of DNA damage response, signal transduction by p53 class mediator GO:0043516 16513 24 0.973967229 0.587497 0.621621622 -1 0.901225423 0.799212 0.81981982 -1
biological_process regulation of signal transduction by p53 class mediator GO:1901796 16513 24 0.973967229 0.587497 0.621621622 -1 0.901225423 0.799212 0.81981982 -1
biological_process GPI anchor biosynthetic process GO:0006506 16505 32 0.977044747 0.589084 0.587387387 -1 0.915829464 0.795476 0.706306306 -1
cellular_component nuclear pore GO:0005643 16763 60 0.983236778 0.589139 0.547747748 -1 1.12665895 0.0443425 0.163963964 0.0417003
molecular_function calcium-dependent protein binding GO:0048306 16824 37 0.978541853 0.589537 0.592792793 -1 1.090028812 0.171168 0.21981982 0.324723
biological_process detection of stimulus GO:0051606 16392 145 0.989023339 0.590973 0.536936937 -1 0.925795703 0.939971 0.89009009 -1
biological_process interaction with symbiont GO:0051702 16505 32 0.976338039 0.591778 0.672072072 -1 1.04640418 0.32453 0.362162162 -1
biological_process cellular amine metabolic process GO:0044106 16443 94 0.986054733 0.592865 0.56036036 -1 0.990462391 0.563832 0.551351351 -1
biological_process posttranscriptional regulation of gene expression GO:0010608 16223 314 0.992406038 0.593059 0.614414414 -1 1.064307853 0.0231495 0.043243243 0.129902
biological_process cellular response to drug GO:0035690 16500 37 0.977601105 0.593404 0.618018018 -1 0.993391164 0.527808 0.522522523 -1
molecular_function G-protein beta/gamma-subunit complex binding GO:0031683 16821 40 0.978321703 0.593977 0.601801802 -1 0.927405409 0.787049 0.818018018 -1
molecular_function vitamin binding GO:0019842 16792 69 0.983491508 0.594072 0.574774775 -1 0.922369557 0.868484 0.873873874 -1
cellular_component spindle microtubule GO:0005876 16784 39 0.97770027 0.595423 0.589189189 -1 1.005926141 0.474423 0.464864865 -1
biological_process lipid oxidation GO:0034440 16472 65 0.982196245 0.598386 0.576576577 -1 0.888092842 0.941312 0.913513514 -1
molecular_function G-protein coupled nucleotide receptor activity GO:0001608 16841 20 0.967685354 0.598897 0.536936937 -1 1.239225085 0.0318585 0.023423423 0.0521526
molecular_function G-protein coupled purinergic nucleotide receptor activity GO:0045028 16841 20 0.967685354 0.598897 0.536936937 -1 1.239225085 0.0318585 0.023423423 0.0521526
biological_process cellular potassium ion transport GO:0071804 16499 38 0.976188861 0.600478 0.576576577 -1 1.184879586 0.0240634 0.01981982 0.133155
biological_process potassium ion transmembrane transport GO:0071805 16499 38 0.976188861 0.600478 0.576576577 -1 1.184879586 0.0240634 0.01981982 0.133155
molecular_function chloride channel activity GO:0005254 16799 62 0.98103835 0.602224 0.572972973 -1 0.867191911 0.965213 0.879279279 -1
biological_process regulation of acute inflammatory response GO:0002673 16494 43 0.97673336 0.604366 0.578378378 -1 0.917855372 0.82492 0.742342342 -1
molecular_function protein serine/threonine/tyrosine kinase activity GO:0004712 16835 26 0.969969509 0.604673 0.58018018 -1 1.311616398 0.00294089 0.005405405 0
cellular_component organelle outer membrane GO:0031968 16694 129 0.986538772 0.604799 0.58018018 -1 0.995901555 0.532299 0.536936937 -1
biological_process regulation of interleukin-1 production GO:0032652 16506 31 0.972005139 0.606529 0.603603604 -1 0.975180632 0.594692 0.554954955 -1
biological_process cellular lipid catabolic process GO:0044242 16426 111 0.985210142 0.606758 0.565765766 -1 0.897428395 0.969822 0.891891892 -1
biological_process detection of mechanical stimulus involved in sensory perception GO:0050974 16514 23 0.967272261 0.607229 0.585585586 -1 0.957576508 0.637843 0.567567568 -1
molecular_function RNA polymerase II transcription cofactor activity GO:0001104 16802 59 0.978982552 0.610315 0.682882883 -1 1.132299003 0.03893 0.012612613 0.0677333
molecular_function peptidase activity, acting on L-amino acid peptides GO:0070011 16375 486 0.992743467 0.610715 0.637837838 -1 0.986168668 0.703999 0.706306306 -1
biological_process purine-containing compound biosynthetic process GO:0072522 16343 194 0.988230325 0.612446 0.562162162 -1 0.982102586 0.667993 0.67027027 -1
biological_process DNA packaging GO:0006323 16397 140 0.986069987 0.61286 0.547747748 -1 0.930777231 0.922888 0.684684685 -1
biological_process interleukin-1 secretion GO:0050701 16517 20 0.962810059 0.613443 0.627027027 -1 0.886676054 0.810139 0.792792793 -1
molecular_function oxidoreductase activity, acting on the aldehyde or oxo group of donors GO:0016903 16814 47 0.975516514 0.614536 0.578378378 -1 0.748045308 0.998633 0.967567568 -1
biological_process regulation of protein processing GO:0070613 16507 30 0.969261888 0.61483 0.594594595 -1 0.942849901 0.706343 0.681081081 -1
cellular_component pore complex GO:0046930 16749 74 0.980404968 0.615098 0.581981982 -1 1.050502743 0.225384 0.259459459 0.374404
cellular_component condensed chromosome kinetochore GO:0000777 16745 78 0.980425317 0.617973 0.540540541 -1 0.958739252 0.736527 0.684684685 -1

biological_process peptide metabolic process GO:0006518 16457 80 0.980646313 0.61815 0.590990991 -1 0.98219578 0.608942 0.562162162 -1
biological_process positive regulation of peptide hormone secretion GO:0090277 16487 50 0.975465803 0.618293 0.616216216 -1 1.024178021 0.383416 0.378378378 -1
biological_process positive regulation of cell cycle arrest GO:0071158 16514 23 0.963638982 0.61879 0.684684685 -1 1.114748654 0.170089 0.203603604 0.362365
molecular_function ATPase activity, coupled GO:0042623 16585 276 0.98951655 0.619505 0.556756757 -1 1.105548041 0.00109808 0.120720721 0
biological_process protein trimerization GO:0070206 16509 28 0.966409573 0.621028 0.554954955 -1 0.817289303 0.953139 0.958558559 -1
biological_process M phase GO:0000279 16500 37 0.970364675 0.622722 0.581981982 -1 0.934417859 0.755467 0.724324324 -1
biological_process detection of chemical stimulus GO:0009593 16473 64 0.977318738 0.623603 0.563963964 -1 0.852184163 0.979929 0.963963964 -1
cellular_component nuclear envelope GO:0005635 16541 282 0.989211318 0.624201 0.581981982 -1 1.050214207 0.0703752 0.163963964 0.0994807
biological_process signal transduction by p53 class mediator GO:0072331 16467 70 0.978076249 0.624928 0.65045045 -1 1.040182773 0.27978 0.268468468 0.497892
biological_process regulation of NF-kappaB import into nucleus GO:0042345 16508 29 0.965449548 0.626504 0.627027027 -1 0.760766654 0.987242 0.944144144 -1
biological_process NF-kappaB import into nucleus GO:0042348 16508 29 0.965449548 0.626504 0.627027027 -1 0.760766654 0.987242 0.944144144 -1
biological_process cellular iron ion homeostasis GO:0006879 16508 29 0.965311933 0.62699 0.571171171 -1 0.828402125 0.945429 0.881081081 -1
biological_process modification of morphology or physiology of other organism GO:0035821 16494 43 0.971381327 0.627611 0.610810811 -1 1.020446785 0.40808 0.448648649 -1
molecular_function S-adenosylmethionine-dependent methyltransferase activity GO:0008757 16764 97 0.980943564 0.627806 0.664864865 -1 1.104448333 0.0369742 0.057657658 0.0591676
biological_process regulation of intrinsic apoptotic signaling pathway GO:2001242 16515 22 0.958841774 0.631056 0.742342342 -1 0.94796321 0.663886 0.693693694 -1
molecular_function methylated histone residue binding GO:0035064 16825 36 0.967745318 0.631411 0.636036036 -1 1.116132978 0.113487 0.189189189 0.19837
biological_process skeletal muscle contraction GO:0003009 16514 23 0.959348454 0.632307 0.625225225 -1 1.144193456 0.115346 0.030630631 0.283643
biological_process glutamine family amino acid metabolic process GO:0009064 16482 55 0.973461596 0.633646 0.605405405 -1 1.00678881 0.465219 0.482882883 -1
biological_process amine metabolic process GO:0009308 16440 97 0.979688893 0.635922 0.603603604 -1 0.991808475 0.555757 0.565765766 -1
biological_process keratinocyte differentiation GO:0030216 16473 64 0.974631736 0.63768 0.618018018 -1 1.137852965 0.0278199 0.091891892 0.140489
cellular_component centriole GO:0005814 16763 60 0.973708718 0.638104 0.605405405 -1 1.055560085 0.227607 0.264864865 0.385789
cellular_component condensed nuclear chromosome GO:0000794 16751 72 0.975600857 0.640349 0.585585586 -1 1.105509589 0.0600896 0.131531532 0.0637733
biological_process vitamin metabolic process GO:0006766 16499 38 0.966370929 0.640403 0.655855856 -1 0.802123451 0.982796 0.953153153 -1
molecular_function frizzled binding GO:0005109 16835 26 0.959034582 0.641366 0.652252252 -1 1.080139921 0.239374 0.291891892 0.427824
biological_process mitotic sister chromatid segregation GO:0000070 16496 41 0.967153507 0.64237 0.58018018 -1 0.967368828 0.641477 0.672072072 -1
biological_process cellular response to hexose stimulus GO:0071331 16487 50 0.970226941 0.642542 0.720720721 -1 1.081723259 0.158078 0.05045045 0.34875
biological_process cellular response to glucose stimulus GO:0071333 16487 50 0.970226941 0.642542 0.720720721 -1 1.081723259 0.158078 0.05045045 0.34875
molecular_function protein N-terminus binding GO:0047485 16774 87 0.977447023 0.642568 0.609009009 -1 1.074756277 0.112973 0.12972973 0.19895
biological_process cell cycle GO:0007049 15439 1098 0.993848455 0.642659 0.547747748 -1 1.041270446 0.00711699 0.10990991 0.0739482
molecular_function carboxy-lyase activity GO:0016831 16831 30 0.961250764 0.643552 0.735135135 -1 0.985372077 0.555245 0.526126126 -1
cellular_component chromosome, telomeric region GO:0000781 16777 46 0.968704649 0.643628 0.731531532 -1 1.028807743 0.367355 0.342342342 -1
biological_process positive regulation of acute inflammatory response GO:0002675 16517 20 0.952216239 0.644463 0.664864865 -1 0.843889602 0.886868 0.814414414 -1
molecular_function ATPase binding GO:0051117 16836 25 0.956456549 0.647067 0.664864865 -1 0.998249957 0.506061 0.484684685 -1
biological_process regulation of interleukin-4 production GO:0032673 16517 20 0.951242721 0.64727 0.630630631 -1 0.925743785 0.717557 0.713513514 -1
cellular_component condensed chromosome, centromeric region GO:0000779 16742 81 0.975679008 0.648055 0.551351351 -1 0.956792105 0.750229 0.691891892 -1
molecular_function 3'-5' exonuclease activity GO:0008408 16838 23 0.953711811 0.649807 0.636036036 -1 0.892168708 0.814975 0.85045045 -1
biological_process synapsis GO:0007129 16517 20 0.950099894 0.650555 0.648648649 -1 0.967157636 0.600486 0.576576577 -1
molecular_function transferase activity, transferring nitrogenous groups GO:0016769 16839 22 0.952249345 0.651073 0.637837838 -1 0.817583901 0.930962 0.951351351 -1
biological_process germ cell development GO:0007281 16407 130 0.980346885 0.651635 0.672072072 -1 1.030115881 0.27523 0.345945946 0.492546
molecular_function transition metal ion transmembrane transporter activity GO:0046915 16817 44 0.965652272 0.653643 0.655855856 -1 0.772754724 0.99553 0.987387387 -1
biological_process signal transduction in response to DNA damage GO:0042770 16476 61 0.970780898 0.653973 0.657657658 -1 1.044921375 0.271339 0.237837838 0.488221
molecular_function kinase inhibitor activity GO:0019210 16824 37 0.962221763 0.654866 0.63963964 -1 1.044325506 0.320071 0.279279279 -1
biological_process regulation of mitochondrial membrane potential GO:0051881 16511 26 0.95451352 0.656196 0.745945946 -1 0.921884595 0.755063 0.713513514 -1
molecular_function protein kinase regulator activity GO:0019887 16758 103 0.97714116 0.656558 0.673873874 -1 1.002233502 0.484301 0.45045045 -1
biological_process centrosome duplication GO:0051298 16510 27 0.955154712 0.656893 0.663063063 -1 1.109005165 0.163093 0.133333333 0.354362
cellular_component axoneme GO:0005930 16770 53 0.967943889 0.657218 0.56036036 -1 0.876208314 0.941031 0.83963964 -1
biological_process acetyl-CoA metabolic process GO:0006084 16512 25 0.953274412 0.657269 0.654054054 -1 1.040317874 0.363399 0.381981982 -1
biological_process fatty acid oxidation GO:0019395 16475 62 0.970275003 0.657712 0.666666667 -1 0.878103783 0.952111 0.940540541 -1
biological_process regulation of DNA-dependent transcription, elongation GO:0032784 16508 29 0.956425368 0.657943 0.70990991 -1 1.151158312 0.0791051 0.037837838 0.235973
molecular_function single-stranded RNA binding GO:0003727 16822 39 0.961966377 0.659797 0.634234234 -1 1.143378802 0.0602477 0.045045045 0.105274
biological_process heat generation GO:0031649 16516 21 0.94794986 0.660364 0.623423423 -1 0.956783802 0.634311 0.673873874 -1
cellular_component kinetochore GO:0000776 16724 99 0.976061659 0.660489 0.571171171 -1 1.011302339 0.422562 0.396396396 -1
biological_process regulation of mRNA stability GO:0043488 16504 33 0.958376361 0.660792 0.72972973 -1 1.06241259 0.267108 0.264864865 0.482061
biological_process interleukin-4 production GO:0032633 16511 26 0.952843701 0.66161 0.618018018 -1 1.039269655 0.364276 0.392792793 -1
molecular_function N-acyltransferase activity GO:0016410 16766 95 0.975323524 0.661953 0.625225225 -1 1.056022001 0.171452 0.234234234 0.323711
cellular_component stereocilium bundle GO:0032421 16796 27 0.953519295 0.662282 0.747747748 -1 1.100557996 0.182534 0.216216216 0.30684
biological_process cell cycle phase GO:0022403 16367 170 0.98155732 0.662299 0.569369369 -1 1.059488617 0.088446 0.127927928 0.248123
biological_process G2/M transition of mitotic cell cycle GO:0000086 16499 38 0.960830242 0.662306 0.61981982 -1 1.10736407 0.12556 0.151351351 0.301165
molecular_function organic cyclic compound binding GO:0097159 11895 4966 0.997095198 0.663607 0.590990991 -1 1.014623964 0.0167857 0.317117117 0.0238975
biological_process fatty acid catabolic process GO:0009062 16482 55 0.966957545 0.66466 0.648648649 -1 0.881635304 0.936127 0.924324324 -1
biological_process fatty acid beta-oxidation GO:0006635 16491 46 0.963431291 0.666493 0.67027027 -1 0.833027625 0.975254 0.944144144 -1
biological_process cell cycle checkpoint GO:0000075 16417 120 0.977150816 0.668291 0.601801802 -1 1.075123487 0.076282 0.063063063 0.231308
molecular_function oxidoreductase activity, acting on the aldehyde or oxo group of donors, NAD or NADP as acceptor GO:0016620 16826 35 0.957545049 0.668408 0.609009009 -1 0.713835454 0.998335 0.971171171 -1
cellular_component nuclear body GO:0016604 16560 263 0.984530143 0.669328 0.581981982 -1 1.057407242 0.0520438 0.2 0.0526624
biological_process retrograde transport, endosome to Golgi GO:0042147 16510 27 0.950532345 0.672069 0.708108108 -1 1.04556856 0.340751 0.333333333 -1
biological_process protein ubiquitination GO:0016567 16084 453 0.987854651 0.675131 0.574774775 -1 1.045921662 0.0430411 0.214414414 0.174027
biological_process meiotic chromosome segregation GO:0045132 16516 21 0.942409931 0.676329 0.627027027 -1 0.976225383 0.574906 0.538738739 -1
biological_process response to X-ray GO:0010165 16511 26 0.948080762 0.676869 0.735135135 -1 1.015436353 0.445756 0.461261261 -1
molecular_function oxidoreductase activity, acting on the CH-NH group of donors GO:0016645 16834 27 0.948708418 0.677971 0.610810811 -1 0.741892171 0.989962 0.899099099 -1
biological_process negative regulation of defense response GO:0031348 16458 79 0.969728479 0.679828 0.576576577 -1 0.943805738 0.8071 0.684684685 -1
biological_process porphyrin-containing compound metabolic process GO:0006778 16496 41 0.957708856 0.680708 0.627027027 -1 1.046961103 0.301033 0.407207207 -1
biological_process DNA integrity checkpoint GO:0031570 16459 78 0.969044207 0.68251 0.679279279 -1 1.08004147 0.109861 0.185585586 0.276182
biological_process cell cycle phase transition GO:0044770 16305 232 0.981994571 0.683855 0.583783784 -1 1.076703622 0.0207827 0.054054054 0.12613
biological_process response to corticosterone stimulus GO:0051412 16514 23 0.942286243 0.684316 0.695495495 -1 0.936965147 0.699873 0.774774775 -1
molecular_function carboxylic acid binding GO:0031406 16708 153 0.977656228 0.684684 0.637837838 -1 0.952011667 0.849155 0.846846847 -1
molecular_function phosphotransferase activity, phosphate group as acceptor GO:0016776 16830 31 0.949254704 0.687883 0.587387387 -1 0.76103599 0.989464 0.899099099 -1
cellular_component histone acetyltransferase complex GO:0000123 16748 75 0.967001629 0.690094 0.609009009 -1 1.096129928 0.0742014 0.201801802 0.115601
cellular_component proton-transporting V-type ATPase complex GO:0033176 16800 23 0.939129905 0.693576 0.664864865 -1 0.902768787 0.790531 0.708108108 -1
biological_process protein modification by small protein removal GO:0070646 16464 73 0.965765735 0.694209 0.625225225 -1 1.054673768 0.208726 0.254054054 0.406423
biological_process energy coupled proton transmembrane transport, against electrochemical gradient GO:0015988 16507 30 0.946143337 0.695485 0.627027027 -1 0.856769074 0.913105 0.740540541 -1
biological_process ATP hydrolysis coupled proton transport GO:0015991 16507 30 0.946143337 0.695485 0.627027027 -1 0.856769074 0.913105 0.740540541 -1

molecular_function protein methyltransferase activity GO:0008276 16786 75 0.965920043 0.695806 0.745945946 -1 1.021159077 0.375211 0.333333333 -1
biological_process RNA export from nucleus GO:0006405 16500 37 0.951201538 0.696642 0.731531532 -1 0.988880653 0.546703 0.524324324 -1
biological_process regulation of nitric-oxide synthase activity GO:0050999 16515 22 0.936084192 0.698351 0.643243243 -1 0.944604543 0.673787 0.610810811 -1
molecular_function endopeptidase activity GO:0004175 16554 307 0.982990734 0.698826 0.699099099 -1 0.958944205 0.89571 0.864864865 -1
biological_process sister chromatid segregation GO:0000819 16493 44 0.954262773 0.700642 0.616216216 -1 0.988258971 0.553746 0.571171171 -1
cellular_component cis-Golgi network GO:0005801 16795 28 0.942378741 0.701454 0.736936937 -1 0.944293524 0.695333 0.715315315 -1
molecular_function thiolester hydrolase activity GO:0016790 16760 101 0.96967994 0.701737 0.598198198 -1 0.985207276 0.601912 0.524324324 -1
biological_process positive regulation of insulin secretion GO:0032024 16499 38 0.950420369 0.701958 0.72972973 -1 1.03811662 0.341857 0.313513514 -1
biological_process nuclear-transcribed mRNA catabolic process, nonsense-mediated decay GO:0000184 16505 32 0.945851331 0.702334 0.76036036 -1 0.990332371 0.53779 0.567567568 -1
biological_process nucleobase metabolic process GO:0009112 16512 25 0.938655909 0.702541 0.699099099 -1 0.945099273 0.682919 0.666666667 -1
biological_process release of cytochrome c from mitochondria GO:0001836 16491 46 0.954624141 0.70328 0.713513514 -1 0.90503331 0.868055 0.87027027 -1
biological_process ATP metabolic process GO:0046034 16412 125 0.971525773 0.710069 0.747747748 -1 0.975463384 0.683341 0.666666667 -1
biological_process protein modification by small protein conjugation GO:0032446 16052 485 0.985639594 0.710933 0.594594595 -1 1.043423609 0.0463718 0.214414414 0.17972
molecular_function androgen receptor binding GO:0050681 16838 23 0.933022107 0.711162 0.636036036 -1 1.331623797 0.00292022 0.021621622 0
biological_process negative regulation of cell cycle phase transition GO:1901988 16405 132 0.971741402 0.713875 0.625225225 -1 1.107929586 0.0155249 0.023423423 0.105907
cellular_component cilium membrane GO:0060170 16803 20 0.926456751 0.715677 0.758558559 -1 0.938023566 0.684526 0.691891892 -1
biological_process modification by host of symbiont morphology or physiology GO:0051851 16515 22 0.929702175 0.716186 0.745945946 -1 1.12669268 0.151524 0.221621622 0.342041
biological_process placenta development GO:0001890 16416 121 0.970058653 0.716558 0.706306306 -1 1.081759699 0.0589846 0.189189189 0.202783
cellular_component cytoplasmic stress granule GO:0010494 16797 26 0.934887477 0.717539 0.607207207 -1 1.10072666 0.186657 0.210810811 0.3148
biological_process peptidyl-proline modification GO:0018208 16508 29 0.938014208 0.718617 0.589189189 -1 0.873568892 0.881077 0.724324324 -1
molecular_function transaminase activity GO:0008483 16841 20 0.924956113 0.719608 0.69009009 -1 0.847835912 0.880884 0.911711712 -1
biological_process negative regulation of leukocyte apoptotic process GO:2000107 16511 26 0.934103581 0.719887 0.78018018 -1 0.94551324 0.684975 0.706306306 -1
molecular_function heterocyclic compound binding GO:1901363 11950 4911 0.995946962 0.720553 0.603603604 -1 1.014029487 0.0215533 0.324324324 0.0506614
biological_process cell division GO:0051301 16129 408 0.983501749 0.720601 0.610810811 -1 1.027915356 0.161371 0.190990991 0.351332
biological_process energy derivation by oxidation of organic compounds GO:0015980 16388 149 0.972414938 0.721029 0.673873874 -1 0.890236627 0.990134 0.922522523 -1
biological_process mitotic DNA damage checkpoint GO:0044773 16513 24 0.930451141 0.722618 0.74954955 -1 1.073052493 0.267534 0.189189189 0.482574
biological_process regulation of release of cytochrome c from mitochondria GO:0090199 16509 28 0.935074708 0.724286 0.735135135 -1 0.840880073 0.927812 0.895495495 -1
molecular_function nucleobase-containing compound transmembrane transporter activity GO:0015932 16839 22 0.926667332 0.724476 0.828828829 -1 1.115542923 0.173791 0.162162162 0.326631
cellular_component early endosome membrane GO:0031901 16760 63 0.956691258 0.724597 0.6 -1 1.083898113 0.123925 0.254054054 0.226825
molecular_function protein serine/threonine phosphatase activity GO:0004722 16820 41 0.946195109 0.724911 0.673873874 -1 0.996355553 0.51615 0.511711712 -1
biological_process water-soluble vitamin metabolic process GO:0006767 16517 20 0.922442287 0.726143 0.810810811 -1 0.778839199 0.956757 0.962162162 -1
molecular_function intramolecular transferase activity GO:0016866 16834 27 0.932893756 0.727239 0.747747748 -1 0.888059188 0.843352 0.837837838 -1
molecular_function oxidoreductase activity, acting on CH-OH group of donors GO:0016614 16733 128 0.969182435 0.727842 0.677477477 -1 0.988280493 0.591157 0.56036036 -1
biological_process calcium ion-dependent exocytosis GO:0017156 16491 46 0.948380265 0.728178 0.681081081 -1 1.131240373 0.061311 0.201801802 0.207106
biological_process interleukin-1 beta production GO:0032611 16505 32 0.938028413 0.728357 0.74954955 -1 0.973779529 0.601493 0.540540541 -1
biological_process plasma lipoprotein particle clearance GO:0034381 16514 23 0.926811948 0.72855 0.715315315 -1 1.098627625 0.206163 0.25045045 0.403927
molecular_function protein kinase inhibitor activity GO:0004860 16828 33 0.938679287 0.729325 0.745945946 -1 1.034534112 0.365449 0.313513514 -1
cellular_component SNARE complex GO:0031201 16797 26 0.930822768 0.729557 0.740540541 -1 0.854759229 0.900392 0.87027027 -1
biological_process regulation of DNA recombination GO:0000018 16500 37 0.94201709 0.729612 0.664864865 -1 0.985755979 0.559734 0.590990991 -1
biological_process regulation of cell cycle arrest GO:0071156 16504 33 0.937832239 0.732123 0.745945946 -1 1.144087022 0.0756339 0.144144144 0.229285
molecular_function steroid dehydrogenase activity GO:0016229 16831 30 0.934733528 0.732294 0.675675676 -1 0.96093447 0.644672 0.609009009 -1
biological_process tetrapyrrole metabolic process GO:0033013 16489 48 0.948210804 0.733176 0.672072072 -1 1.018738006 0.410937 0.464864865 -1
molecular_function flavin adenine dinucleotide binding GO:0050660 16786 75 0.958553573 0.733398 0.726126126 -1 1.00907193 0.445766 0.473873874 -1
biological_process activin receptor signaling pathway GO:0032924 16507 30 0.934380489 0.733408 0.704504505 -1 1.093324056 0.187775 0.234234234 0.381867
biological_process G1/S transition of mitotic cell cycle GO:0000082 16440 97 0.963381503 0.734536 0.659459459 -1 1.073268127 0.10501 0.127927928 0.26748
biological_process genetic imprinting GO:0071514 16517 20 0.918735659 0.735626 0.733333333 -1 1.214062554 0.0485458 0.097297297 0.182046
cellular_component mitochondrial outer membrane GO:0005741 16712 111 0.965370667 0.736979 0.722522523 -1 0.955830452 0.790666 0.718918919 -1
cellular_component chromosome, centromeric region GO:0000775 16683 140 0.969007381 0.738217 0.598198198 -1 1.040571852 0.201865 0.2 0.331578
biological_process cellular response to radiation GO:0071478 16463 74 0.957102791 0.739131 0.895495495 -1 0.992868206 0.542433 0.531531532 -1
biological_process protein polyubiquitination GO:0000209 16426 111 0.964912839 0.739735 0.654054054 -1 1.061264559 0.130994 0.192792793 0.310489
molecular_function monosaccharide binding GO:0048029 16804 57 0.950240637 0.742745 0.736936937 -1 0.94030237 0.782897 0.882882883 -1
biological_process regulation of intracellular steroid hormone receptor signaling pathway GO:0033143 16500 37 0.93815047 0.742937 0.735135135 -1 1.117227588 0.108149 0.178378378 0.273824
biological_process protein K48-linked ubiquitination GO:0070936 16500 37 0.938094906 0.743125 0.693693694 -1 0.989096373 0.545802 0.533333333 -1
biological_process membrane invagination GO:0010324 16517 20 0.915282993 0.744306 0.69009009 -1 1.030261002 0.407298 0.434234234 -1
biological_process spindle checkpoint GO:0031577 16511 26 0.925540523 0.744793 0.69009009 -1 1.055665516 0.311369 0.257657658 -1
biological_process regulation of fatty acid transport GO:2000191 16517 20 0.914781117 0.745556 0.668468468 -1 1.155645381 0.113844 0.142342342 0.282745
biological_process secondary metabolic process GO:0019748 16513 24 0.921980722 0.746195 0.754954955 -1 0.795559333 0.958726 0.953153153 -1
biological_process regulation of monooxygenase activity GO:0032768 16507 30 0.930212297 0.74625 0.731531532 -1 0.867221803 0.896323 0.816216216 -1
molecular_function oxidoreductase activity, acting on the CH-OH group of donors, NAD or NADP as acceptor GO:0016616 16741 120 0.965040352 0.747207 0.693693694 -1 0.970761306 0.711164 0.598198198 -1
biological_process positive regulation of oxidoreductase activity GO:0051353 16509 28 0.927343569 0.747467 0.704504505 -1 0.928660886 0.743597 0.657657658 -1
biological_process organic acid metabolic process GO:0006082 15819 718 0.98583618 0.749304 0.598198198 -1 0.950632257 0.990431 0.92972973 -1
biological_process ventricular system development GO:0021591 16517 20 0.912549885 0.751071 0.762162162 -1 1.034977428 0.393174 0.416216216 -1
molecular_function peptidase activity GO:0008233 16352 509 0.982910785 0.751149 0.762162162 -1 0.989200142 0.665901 0.67027027 -1
biological_process histone ubiquitination GO:0016574 16506 31 0.929748456 0.751173 0.652252252 -1 1.211013651 0.0208322 0.073873874 0.125913
biological_process reactive oxygen species metabolic process GO:0072593 16439 98 0.960518359 0.751453 0.627027027 -1 0.952877304 0.791168 0.679279279 -1
biological_process cellular modified amino acid metabolic process GO:0006575 16394 143 0.967150701 0.752853 0.655855856 -1 0.88570207 0.991291 0.96036036 -1
biological_process spindle organization GO:0007051 16472 65 0.951105042 0.753077 0.636036036 -1 0.944918802 0.779576 0.807207207 -1
biological_process small molecule biosynthetic process GO:0044283 16173 364 0.97951563 0.753213 0.618018018 -1 0.945056082 0.966832 0.843243243 -1
biological_process single fertilization GO:0007338 16493 44 0.940446062 0.753393 0.771171171 -1 0.975849493 0.609455 0.601801802 -1
biological_process calcium ion import GO:0070509 16512 25 0.920888285 0.753553 0.679279279 -1 1.131057079 0.128014 0.216216216 0.305854
biological_process regulation of translational initiation GO:0006446 16502 35 0.93310953 0.753713 0.827027027 -1 0.907616641 0.828366 0.897297297 -1
cellular_component cilium axoneme GO:0035085 16783 40 0.937316243 0.754124 0.625225225 -1 0.912898731 0.830295 0.762162162 -1
cellular_component microtubule-based flagellar cytoplasm GO:0097014 16783 40 0.937316243 0.754124 0.625225225 -1 0.912898731 0.830295 0.762162162 -1
biological_process microtubule organizing center organization GO:0031023 16476 61 0.94925861 0.754199 0.713513514 -1 0.998805868 0.50648 0.499099099 -1
biological_process negative regulation of translation GO:0017148 16482 55 0.945978793 0.756518 0.702702703 -1 1.121563979 0.0588963 0.066666667 0.202886
biological_process DNA conformation change GO:0071103 16370 167 0.969014516 0.75715 0.572972973 -1 0.960889489 0.810572 0.632432432 -1
biological_process brown fat cell differentiation GO:0050873 16508 29 0.924828231 0.758611 0.713513514 -1 0.970512095 0.608474 0.589189189 -1
biological_process negative regulation of inflammatory response GO:0050728 16475 62 0.948623914 0.758683 0.673873874 -1 0.930255599 0.82972 0.778378378 -1
biological_process endocrine hormone secretion GO:0060986 16511 26 0.92037292 0.759243 0.727927928 -1 0.993789165 0.52191 0.50990991 -1
biological_process NAD metabolic process GO:0019674 16508 29 0.92448628 0.759605 0.895495495 -1 0.79112943 0.974414 0.947747748 -1
biological_process cellular process involved in reproduction GO:0048610 16163 374 0.979125705 0.760335 0.717117117 -1 1.055301196 0.030488 0.151351351 0.146738

biological_process interphase of mitotic cell cycle GO:0051329 16416 121 0.96293554 0.760795 0.663063063 -1 1.099719899 0.0282701 0.041441441 0.14249
biological_process regulation of odontogenesis GO:0042481 16516 21 0.910592769 0.7612 0.742342342 -1 1.350804076 0.00266636 0.027027027 0.0524577
biological_process prostanoid metabolic process GO:0006692 16514 23 0.914255843 0.762018 0.765765766 -1 0.911011657 0.770282 0.794594595 -1
biological_process prostaglandin metabolic process GO:0006693 16514 23 0.914255843 0.762018 0.765765766 -1 0.911011657 0.770282 0.794594595 -1
biological_process response to temperature stimulus GO:0009266 16418 119 0.962227187 0.763118 0.688288288 -1 1.065682674 0.106494 0.131531532 0.270097
biological_process negative regulation of G1/S transition of mitotic cell cycle GO:2000134 16510 27 0.920298843 0.763611 0.753153153 -1 1.22567513 0.0210393 0.01981982 0.126781
cellular_component replication fork GO:0005657 16782 41 0.935148317 0.764287 0.736936937 -1 1.119664148 0.0919609 0.032432432 0.148365
biological_process positive regulation of glial cell differentiation GO:0045687 16513 24 0.91482546 0.76526 0.796396396 -1 1.008463654 0.471372 0.479279279 -1
molecular_function deaminase activity GO:0019239 16841 20 0.905883631 0.767153 0.783783784 -1 0.925288221 0.71874 0.675675676 -1
biological_process serine family amino acid metabolic process GO:0009069 16508 29 0.921537992 0.768086 0.720720721 -1 0.924152669 0.760573 0.8 -1
molecular_function hydrolase activity, hydrolyzing N-glycosyl compounds GO:0016799 16841 20 0.905083013 0.769046 0.726126126 -1 1.014820956 0.454284 0.452252252 -1
molecular_function voltage-gated anion channel activity GO:0008308 16841 20 0.905077083 0.76906 0.776576577 -1 1.000510663 0.498432 0.544144144 -1
biological_process positive regulation of translation GO:0045727 16493 44 0.935902791 0.769584 0.774774775 -1 0.954933407 0.697957 0.767567568 -1
biological_process nuclear division GO:0000280 16231 306 0.97581493 0.770292 0.609009009 -1 0.987955756 0.643741 0.663063063 -1
biological_process mitosis GO:0007067 16231 306 0.97581493 0.770292 0.609009009 -1 0.987955756 0.643741 0.663063063 -1
biological_process pyridine-containing compound metabolic process GO:0072524 16479 58 0.943539641 0.772212 0.731531532 -1 0.8268696 0.988928 0.911711712 -1
cellular_component nuclear chromosome part GO:0044454 16585 238 0.9722011 0.772803 0.634234234 -1 1.077313101 0.0187293 0.05045045 0.00807947
biological_process DNA damage response, signal transduction by p53 class mediator GO:0030330 16487 50 0.938849404 0.773418 0.74954955 -1 1.016825233 0.418267 0.414414414 -1
biological_process T cell activation involved in immune response GO:0002286 16498 39 0.930528276 0.774098 0.781981982 -1 1.154901172 0.0467239 0.118918919 0.1804
biological_process mitotic cell cycle checkpoint GO:0007093 16483 54 0.940774763 0.774913 0.724324324 -1 1.094461731 0.114247 0.079279279 0.282295
molecular_function anion channel activity GO:0005253 16792 69 0.947571596 0.775147 0.762162162 -1 0.857885271 0.979767 0.96036036 -1
biological_process peptide biosynthetic process GO:0043043 16514 23 0.909039907 0.775225 0.742342342 -1 0.992347664 0.52538 0.547747748 -1
biological_process interphase GO:0051325 16405 132 0.961397879 0.779762 0.688288288 -1 1.091017148 0.034498 0.048648649 0.153351
biological_process temperature homeostasis GO:0001659 16502 35 0.923918545 0.782452 0.742342342 -1 0.944373669 0.715889 0.785585586 -1
biological_process positive regulation of exocytosis GO:0045921 16502 35 0.923704319 0.783098 0.699099099 -1 1.167773335 0.0426271 0.021621622 0.173146
biological_process chromosome organization involved in meiosis GO:0070192 16511 26 0.911219146 0.783709 0.700900901 -1 0.97645374 0.582453 0.554954955 -1
molecular_function ubiquitin-protein ligase activity GO:0004842 16629 232 0.970413588 0.784075 0.63963964 -1 1.056773915 0.0657512 0.183783784 0.10392
molecular_function acetyltransferase activity GO:0016407 16768 93 0.95291886 0.784836 0.733333333 -1 1.102293448 0.0433197 0.091891892 0.0720538
biological_process regulation of mitochondrion organization GO:0010821 16493 44 0.931109407 0.786001 0.76036036 -1 0.91600365 0.833081 0.731531532 -1
molecular_function glutathione transferase activity GO:0004364 16837 24 0.90647668 0.786457 0.634234234 -1 0.634113599 0.999055 0.857657658 -1
biological_process retinoic acid receptor signaling pathway GO:0048384 16516 21 0.89961081 0.787388 0.821621622 -1 1.037746241 0.382184 0.389189189 -1
cellular_component cytoplasm GO:0005737 8891 7932 0.996233014 0.787959 0.603603604 -1 0.988965758 0.990399 0.711711712 -1
cellular_component nuclear chromatin GO:0000790 16683 140 0.961161443 0.787976 0.769369369 -1 1.06818548 0.0802751 0.181981982 0.131726
biological_process detection of stimulus involved in sensory perception GO:0050906 16459 78 0.947840444 0.788104 0.664864865 -1 0.882639959 0.96404 0.920720721 -1
biological_process regulation of calcium ion transmembrane transporter activity GO:1901019 16516 21 0.899276802 0.788157 0.744144144 -1 1.203742564 0.0528121 0.061261261 0.189655
biological_process cellular response to hydrogen peroxide GO:0070301 16494 43 0.92910786 0.789966 0.700900901 -1 0.862464784 0.941118 0.879279279 -1
molecular_function ribosome binding GO:0043022 16834 27 0.910076713 0.791032 0.778378378 -1 0.903452126 0.807762 0.753153153 -1
molecular_function iron ion binding GO:0005506 16689 172 0.96429904 0.792494 0.654054054 -1 0.957437591 0.83445 0.859459459 -1
biological_process detection of chemical stimulus involved in sensory perception of smell GO:0050911 16506 31 0.91525198 0.793356 0.67027027 -1 0.811826095 0.965352 0.875675676 -1
cellular_component late endosome membrane GO:0031902 16753 70 0.943496193 0.794055 0.747747748 -1 0.881146455 0.957828 0.846846847 -1
biological_process negative regulation of cell cycle process GO:0010948 16376 161 0.962709819 0.794928 0.684684685 -1 1.073743763 0.0516958 0.077477477 0.1874
biological_process protein modification by small protein conjugation or removal GO:0070647 15988 549 0.979979593 0.795749 0.609009009 -1 1.045292768 0.0307917 0.214414414 0.146947
biological_process positive regulation of fat cell differentiation GO:0045600 16511 26 0.906479463 0.795789 0.846846847 -1 0.941499161 0.697469 0.713513514 -1
biological_process single-organism biosynthetic process GO:0044711 16164 373 0.975567835 0.795827 0.636036036 -1 0.934356248 0.986833 0.873873874 -1
biological_process cell cycle process GO:0022402 15757 780 0.983295814 0.79616 0.6 -1 1.039317718 0.0256874 0.108108108 0.137036
biological_process ER to Golgi vesicle-mediated transport GO:0006888 16491 46 0.929338417 0.797103 0.895495495 -1 0.937367384 0.769398 0.807207207 -1
cellular_component chromosome GO:0005694 16215 608 0.980705175 0.799378 0.612612613 -1 1.030278023 0.0938891 0.2 0.147268
biological_process positive regulation of viral reproduction GO:0048524 16504 33 0.915719638 0.799403 0.818018018 -1 1.060037886 0.274943 0.25045045 0.492578
molecular_function mRNA binding GO:0003729 16777 84 0.947140131 0.799901 0.72972973 -1 1.02625298 0.338052 0.423423423 -1
molecular_function damaged DNA binding GO:0003684 16819 42 0.924067668 0.803295 0.895495495 -1 0.932748788 0.775139 0.76036036 -1
cellular_component heterochromatin GO:0000792 16760 63 0.937567018 0.805097 0.738738739 -1 1.068851573 0.171479 0.268468468 0.295629
biological_process positive regulation of DNA repair GO:0045739 16513 24 0.898484252 0.80568 0.866666667 -1 0.981112413 0.563731 0.58018018 -1
cellular_component nuclear chromosome GO:0000228 16556 267 0.96948232 0.808029 0.673873874 -1 1.063943467 0.0340579 0.088288288 0.0350009
biological_process meiosis I GO:0007127 16474 63 0.936712596 0.808342 0.781981982 -1 1.046273048 0.261957 0.315315315 0.474657
biological_process response to UV GO:0009411 16443 94 0.948062156 0.809149 0.877477477 -1 0.982539927 0.615665 0.594594595 -1
cellular_component nuclear speck GO:0016607 16682 141 0.95726184 0.811318 0.668468468 -1 0.995918221 0.533615 0.527927928 -1
cellular_component nuclear heterochromatin GO:0005720 16797 26 0.899562464 0.81267 0.801801802 -1 1.035636461 0.376396 0.409009009 -1
biological_process response to cold GO:0009409 16501 36 0.914382035 0.813486 0.774774775 -1 0.929307307 0.768992 0.837837838 -1
biological_process protein K63-linked ubiquitination GO:0070534 16510 27 0.900703055 0.814467 0.89009009 -1 1.006887593 0.475285 0.497297297 -1
biological_process negative regulation of mitotic cell cycle phase transition GO:1901991 16471 66 0.936564264 0.81447 0.72972973 -1 1.15656338 0.0136413 0.012612613 0.0995363
cellular_component nucleus GO:0005634 11729 5094 0.993946308 0.814951 0.609009009 -1 1.034090338 2.24E-07 0.012612613 0
biological_process macromolecule methylation GO:0043414 16390 147 0.957237921 0.816528 0.740540541 -1 1.144817263 0.00112589 0.01981982 0.0420124
biological_process regulation of chromosome segregation GO:0051983 16514 23 0.891394058 0.816697 0.641441441 -1 0.996575097 0.511376 0.50990991 -1
biological_process negative regulation of cytokine secretion GO:0050710 16513 24 0.893631775 0.816815 0.762162162 -1 0.794405421 0.959585 0.89009009 -1
biological_process mitotic cell cycle phase transition GO:0044772 16361 176 0.960861922 0.817054 0.668468468 -1 1.085671315 0.0238976 0.052252252 0.132917
molecular_function cyclin-dependent protein serine/threonine kinase regulator activity GO:0016538 16840 21 0.885361282 0.81873 0.763963964 -1 0.969354084 0.596164 0.58018018 -1
biological_process monocarboxylic acid catabolic process GO:0072329 16472 65 0.934862674 0.818976 0.776576577 -1 0.882448015 0.950001 0.918918919 -1
biological_process glutamate metabolic process GO:0006536 16515 22 0.887661116 0.819465 0.821621622 -1 1.107821478 0.190378 0.246846847 0.38609
biological_process cellular response to UV GO:0034644 16501 36 0.91184578 0.820481 0.863063063 -1 1.037183802 0.34945 0.308108108 -1
biological_process positive regulation of interferon-gamma production GO:0032729 16507 30 0.902421662 0.82294 0.751351351 -1 0.741281127 0.99299 0.953153153 -1
biological_process regulation of leukocyte apoptotic process GO:2000106 16492 45 0.919942312 0.824211 0.841441441 -1 0.983236484 0.577342 0.574774775 -1
biological_process pyridine nucleotide metabolic process GO:0019362 16483 54 0.926706106 0.824974 0.792792793 -1 0.814945167 0.990846 0.918918919 -1
biological_process nicotinamide nucleotide metabolic process GO:0046496 16483 54 0.926706106 0.824974 0.792792793 -1 0.814945167 0.990846 0.918918919 -1
biological_process glucosamine-containing compound metabolic process GO:1901071 16512 25 0.892149527 0.825053 0.758558559 -1 0.858481499 0.890013 0.884684685 -1
biological_process cellular response to reactive oxygen species GO:0034614 16471 66 0.933531752 0.825685 0.744144144 -1 0.955428137 0.735166 0.711711712 -1
biological_process RNA stabilization GO:0043489 16513 24 0.888104083 0.829003 0.841441441 -1 1.090623196 0.2208 0.268468468 0.419537
biological_process mRNA stabilization GO:0048255 16513 24 0.888104083 0.829003 0.841441441 -1 1.090623196 0.2208 0.268468468 0.419537
biological_process DNA duplex unwinding GO:0032508 16517 20 0.877055753 0.829698 0.727927928 -1 1.119268432 0.177643 0.212612613 0.371831
biological_process cellular protein metabolic process GO:0044267 13529 3008 0.99091509 0.830096 0.673873874 -1 1.008472231 0.186899 0.297297297 0.38091
molecular_function chaperone binding GO:0051087 16819 42 0.9148641 0.830689 0.904504505 -1 0.831664855 0.970754 0.972972973 -1
biological_process aromatic amino acid family metabolic process GO:0009072 16517 20 0.876191075 0.831391 0.827027027 -1 0.888453784 0.806379 0.785585586 -1

biological_process centrosome cycle GO:0007098 16502 35 0.90632092 0.831729 0.846846847 -1 1.022262081 0.409701 0.416216216 -1
biological_process protein methylation GO:0006479 16435 102 0.945170411 0.832023 0.828828829 -1 1.109352554 0.0275049 0.037837838 0.140738
biological_process protein alkylation GO:0008213 16435 102 0.945170411 0.832023 0.828828829 -1 1.109352554 0.0275049 0.037837838 0.140738
biological_process developmental programmed cell death GO:0010623 16515 22 0.881389039 0.832556 0.809009009 -1 0.992516398 0.524276 0.495495495 -1
molecular_function hydro-lyase activity GO:0016836 16821 40 0.912021696 0.832715 0.675675676 -1 0.852123663 0.947588 0.864864865 -1
biological_process organelle fission GO:0048285 16207 330 0.969436326 0.834369 0.645045045 -1 0.985209052 0.680919 0.672072072 -1
biological_process DNA replication GO:0006260 16319 218 0.962157625 0.835065 0.657657658 -1 1.01387633 0.360508 0.369369369 -1
biological_process regulation of oxidoreductase activity GO:0051341 16491 46 0.917163517 0.835107 0.789189189 -1 0.876976621 0.926096 0.812612613 -1
molecular_function four-way junction helicase activity GO:0009378 16835 26 0.889497207 0.835651 0.798198198 -1 1.015794014 0.444498 0.457657658 -1
cellular_component endoplasmic reticulum-Golgi intermediate compartment membrane GO:0033116 16800 23 0.881257063 0.838199 0.85045045 -1 0.860872095 0.876269 0.861261261 -1
biological_process spindle assembly GO:0051225 16501 36 0.904814811 0.838999 0.751351351 -1 0.933926314 0.754109 0.702702703 -1
biological_process S phase GO:0051320 16517 20 0.871740704 0.83993 0.830630631 -1 1.082456119 0.261393 0.187387387 0.474514
biological_process protein ADP-ribosylation GO:0006471 16517 20 0.87112394 0.841091 0.881081081 -1 1.141901231 0.135708 0.01981982 0.318263
molecular_function GABA receptor activity GO:0016917 16840 21 0.873991669 0.841548 0.691891892 -1 0.959492512 0.626181 0.556756757 -1
molecular_function acyl-CoA dehydrogenase activity GO:0003995 16841 20 0.870686123 0.841904 0.963963964 -1 0.847136113 0.88196 0.801801802 -1
molecular_function NF-kappaB binding GO:0051059 16839 22 0.87655462 0.842211 0.763963964 -1 0.974456366 0.582263 0.609009009 -1
biological_process regulation of mRNA processing GO:0050684 16494 43 0.911426183 0.843128 0.781981982 -1 1.053838633 0.270187 0.288288288 0.486345
molecular_function olfactory receptor activity GO:0004984 16829 32 0.897243636 0.843228 0.695495495 -1 0.791058062 0.97978 0.90990991 -1
biological_process insulin secretion involved in cellular response to glucose stimulus GO:0035773 16515 22 0.875578709 0.844124 0.902702703 -1 0.931395251 0.711504 0.747747748 -1
biological_process regulation of insulin secretion involved in cellular response to glucose stimulus GO:0061178 16515 22 0.875578709 0.844124 0.902702703 -1 0.931395251 0.711504 0.747747748 -1
molecular_function cysteine-type endopeptidase regulator activity involved in apoptotic process GO:0043028 16828 33 0.898359086 0.844317 0.882882883 -1 0.939750371 0.725782 0.781981982 -1
biological_process positive regulation of release of cytochrome c from mitochondria GO:0090200 16517 20 0.8687234 0.845556 0.818018018 -1 0.877642283 0.828544 0.769369369 -1
biological_process interleukin-1 production GO:0032612 16501 36 0.901895599 0.846307 0.81981982 -1 0.920183508 0.796859 0.700900901 -1
molecular_functionendonuclease activity, active with either ribo- or deoxyribonucleic acids and producing 5'-phosphomonoestersGO:0016893 16827 34 0.898875177 0.846703 0.864864865 -1 0.871109979 0.90373 0.868468468 -1
cellular_component cilium part GO:0044441 16724 99 0.940691293 0.84736 0.702702703 -1 0.981143387 0.627772 0.648648649 -1
biological_process regulation of response to DNA damage stimulus GO:2001020 16458 79 0.933319688 0.848279 0.848648649 -1 1.021896961 0.367737 0.32972973 -1
molecular_function iron ion transmembrane transporter activity GO:0005381 16838 23 0.876192461 0.848303 0.854054054 -1 0.703651057 0.993119 0.996396396 -1
biological_process centrosome organization GO:0051297 16482 55 0.919755903 0.849094 0.78018018 -1 0.956999179 0.709987 0.661261261 -1
biological_process regulation of lymphocyte apoptotic process GO:0070228 16509 28 0.887422389 0.849138 0.798198198 -1 0.925089014 0.754028 0.717117117 -1
biological_process heme metabolic process GO:0042168 16509 28 0.886424684 0.85127 0.711711712 -1 0.980165816 0.572206 0.569369369 -1
biological_process alpha-beta T cell proliferation GO:0046633 16516 21 0.868755361 0.851401 0.884684685 -1 1.108458083 0.194514 0.228828829 0.392195
biological_process ciliary or flagellar motility GO:0001539 16516 21 0.868548046 0.851782 0.774774775 -1 0.779684585 0.959933 0.940540541 -1
cellular_component nuclear lumen GO:0031981 15156 1667 0.985923174 0.85287 0.628828829 -1 1.03389506 0.00577516 0.108108108 0
biological_process cellular macromolecule catabolic process GO:0044265 16062 475 0.972589483 0.853167 0.673873874 -1 1.068180815 0.00450708 0.034234234 0.0570546
molecular_function N-acetyltransferase activity GO:0008080 16781 80 0.932246179 0.853643 0.781981982 -1 1.088624526 0.0843717 0.147747748 0.156077
biological_process sensory perception of light stimulus GO:0050953 16430 107 0.941421523 0.853836 0.818018018 -1 0.883042043 0.982241 0.953153153 -1
biological_process chromosome segregation GO:0007059 16403 134 0.947644302 0.854092 0.655855856 -1 1.005403828 0.456693 0.441441441 -1
biological_process ribonucleoside monophosphate biosynthetic process GO:0009156 16506 31 0.89025375 0.855297 0.891891892 -1 0.994381832 0.521645 0.544144144 -1
biological_process apoptotic mitochondrial changes GO:0008637 16476 61 0.921683674 0.855766 0.85045045 -1 0.876840947 0.952466 0.92972973 -1
biological_process response to oxidative stress GO:0006979 16291 246 0.961159899 0.856148 0.751351351 -1 0.930056262 0.972226 0.855855856 -1
cellular_component cytosol GO:0005829 15695 1128 0.982164011 0.858643 0.718918919 -1 0.956856095 0.995319 0.828828829 -1
cellular_component chromosomal part GO:0044427 16293 530 0.973475074 0.858757 0.630630631 -1 1.023049384 0.175161 0.297297297 0.294744
biological_process regulation of DNA repair GO:0006282 16493 44 0.906117295 0.859963 0.899099099 -1 1.018995449 0.413526 0.403603604 -1
cellular_component PcG protein complex GO:0031519 16786 37 0.897514972 0.860149 0.731531532 -1 1.068952907 0.233532 0.194594595 0.389148
biological_process visual perception GO:0007601 16431 106 0.939451883 0.860663 0.821621622 -1 0.87350634 0.988185 0.962162162 -1
molecular_function protein transporter activity GO:0008565 16784 77 0.928839281 0.860835 0.904504505 -1 1.024813229 0.352722 0.306306306 -1
molecular_function nucleotidyltransferase activity GO:0016779 16752 109 0.940091725 0.86146 0.76036036 -1 0.889347333 0.977653 0.864864865 -1
biological_process sulfur amino acid metabolic process GO:0000096 16507 30 0.884729016 0.863161 0.834234234 -1 1.024831065 0.406818 0.43963964 -1
biological_process negative regulation of insulin secretion GO:0046676 16506 31 0.88573628 0.864994 0.836036036 -1 1.077951133 0.225903 0.275675676 0.424245
molecular_function aminoacyl-tRNA ligase activity GO:0004812 16817 44 0.904074829 0.865115 0.895495495 -1 0.942075845 0.747426 0.747747748 -1
molecular_function ligase activity, forming carbon-oxygen bonds GO:0016875 16817 44 0.904074829 0.865115 0.895495495 -1 0.942075845 0.747426 0.747747748 -1
molecular_function ligase activity, forming aminoacyl-tRNA and related compounds GO:0016876 16817 44 0.904074829 0.865115 0.895495495 -1 0.942075845 0.747426 0.747747748 -1
biological_process membrane fusion GO:0061025 16469 68 0.922744266 0.865593 0.884684685 -1 0.993860577 0.535035 0.583783784 -1
biological_process methylation GO:0032259 16385 152 0.948361309 0.866061 0.763963964 -1 1.138911933 0.00144073 0.023423423 0.0433432
cellular_component acrosomal vesicle GO:0001669 16765 58 0.916062522 0.866323 0.836036036 -1 1.086199281 0.127346 0.158558559 0.225996
biological_process response to copper ion GO:0046688 16515 22 0.863567764 0.866328 0.805405405 -1 0.777732103 0.96462 0.926126126 -1
biological_process purine nucleoside monophosphate metabolic process GO:0009126 16510 27 0.876547607 0.866944 0.918918919 -1 0.892264549 0.834098 0.899099099 -1
biological_process reciprocal meiotic recombination GO:0007131 16514 23 0.864951574 0.869208 0.74954955 -1 1.058409181 0.313666 0.36036036 -1
biological_process reciprocal DNA recombination GO:0035825 16514 23 0.864951574 0.869208 0.74954955 -1 1.058409181 0.313666 0.36036036 -1
molecular_function exonuclease activity GO:0004527 16809 52 0.910212894 0.86933 0.857657658 -1 0.924760863 0.826709 0.85045045 -1
cellular_component peroxisome GO:0005777 16697 126 0.94239478 0.869545 0.792792793 -1 0.868426336 0.994883 0.976576577 -1
cellular_component microbody GO:0042579 16697 126 0.94239478 0.869545 0.792792793 -1 0.868426336 0.994883 0.976576577 -1
biological_process oxoacid metabolic process GO:0043436 15830 707 0.97611705 0.869569 0.702702703 -1 0.946340258 0.994232 0.936936937 -1
biological_process nucleotide biosynthetic process GO:0009165 16285 252 0.959390602 0.869768 0.803603604 -1 0.968177513 0.811083 0.747747748 -1
biological_process proteolysis involved in cellular protein catabolic process GO:0051603 16184 353 0.965731711 0.870218 0.672072072 -1 1.065726664 0.015308 0.100900901 0.106157
biological_process cellular protein catabolic process GO:0044257 16172 365 0.966150074 0.871368 0.686486486 -1 1.059762936 0.0227634 0.102702703 0.129252
molecular_function 2 iron, 2 sulfur cluster binding GO:0051537 16840 21 0.857143406 0.87174 0.855855856 -1 0.7393863 0.980771 0.873873874 -1
biological_process ATP biosynthetic process GO:0006754 16485 52 0.909063264 0.872372 0.742342342 -1 0.802911113 0.993162 0.855855856 -1
biological_process negative regulation of peptide secretion GO:0002792 16501 36 0.890652095 0.872377 0.861261261 -1 1.007726293 0.467987 0.481081081 -1
biological_process one-carbon metabolic process GO:0006730 16508 29 0.87803511 0.872584 0.807207207 -1 0.876187739 0.876147 0.96036036 -1
biological_process regulation of cation channel activity GO:2001257 16510 27 0.873143538 0.873423 0.789189189 -1 1.232496704 0.0181217 0.01981982 0.114925
cellular_component peroxisomal membrane GO:0005778 16770 53 0.908803277 0.875302 0.812612613 -1 0.949075954 0.739947 0.738738739 -1
cellular_component microbody membrane GO:0031903 16770 53 0.908803277 0.875302 0.812612613 -1 0.949075954 0.739947 0.738738739 -1
biological_process positive regulation of multi-organism process GO:0043902 16500 37 0.889280057 0.878576 0.845045045 -1 1.031243509 0.37089 0.358558559 -1
biological_process purine ribonucleoside monophosphate metabolic process GO:0009167 16511 26 0.867524758 0.879199 0.926126126 -1 0.909767938 0.787451 0.908108108 -1
biological_process eye photoreceptor cell development GO:0042462 16510 27 0.868646585 0.881641 0.861261261 -1 1.037551083 0.367608 0.371171171 -1
biological_process sister chromatid cohesion GO:0007062 16507 30 0.873893329 0.884448 0.713513514 -1 1.120272184 0.126723 0.25045045 0.303379
cellular_component Cajal body GO:0015030 16781 42 0.893327473 0.884726 0.854054054 -1 1.001803518 0.491923 0.504504505 -1
biological_process positive regulation of mitochondrion organization GO:0010822 16510 27 0.864879714 0.888228 0.855855856 -1 0.914184957 0.78025 0.708108108 -1
biological_process nucleoside phosphate biosynthetic process GO:1901293 16284 253 0.956153024 0.888273 0.828828829 -1 0.967620245 0.815704 0.745945946 -1
biological_process cellular membrane fusion GO:0006944 16473 64 0.911976582 0.889174 0.918918919 -1 0.993100626 0.538179 0.592792793 -1

biological_process mRNA transport GO:0051028 16465 72 0.916956922 0.88938 0.801801802 -1 1.008339361 0.451143 0.455855856 -1
biological_process amino acid activation GO:0043038 16492 45 0.89482835 0.889474 0.918918919 -1 0.936577457 0.769737 0.778378378 -1
biological_process tRNA aminoacylation GO:0043039 16492 45 0.89482835 0.889474 0.918918919 -1 0.936577457 0.769737 0.778378378 -1
biological_process detection of chemical stimulus involved in sensory perception GO:0050907 16493 44 0.893551152 0.88966 0.738738739 -1 0.795918929 0.990562 0.953153153 -1
biological_process pyrimidine ribonucleoside metabolic process GO:0046131 16508 29 0.868043459 0.89102 0.76036036 -1 0.823969269 0.949854 0.836036036 -1
biological_process mitotic spindle organization GO:0007052 16509 28 0.865382166 0.89157 0.713513514 -1 1.055641595 0.3049 0.324324324 -1
biological_process tRNA aminoacylation for protein translation GO:0006418 16494 43 0.890552411 0.893396 0.926126126 -1 0.940889082 0.749309 0.736936937 -1
biological_process aerobic respiration GO:0009060 16500 37 0.88182137 0.893722 0.834234234 -1 0.765106979 0.993387 0.90990991 -1
molecular_function lyase activity GO:0016829 16702 159 0.94311336 0.894066 0.827027027 -1 0.959054838 0.815545 0.762162162 -1
molecular_functionoxidoreductase activity, acting on paired donors, with incorporation or reduction of molecular oxygen, reduced flavin or flavoprotein as one donor, and incorporation of one atom of oxygenGO:0016712 16825 36 0.879921226 0.89422 0.772972973 -1 1.023742402 0.40246 0.432432432 -1
biological_process diterpenoid metabolic process GO:0016101 16503 34 0.876252254 0.894559 0.805405405 -1 0.857379435 0.925342 0.848648649 -1
biological_process negative regulation of peptide hormone secretion GO:0090278 16502 35 0.877835778 0.894938 0.886486486 -1 1.016630011 0.432293 0.463063063 -1
biological_process negative regulation of hormone secretion GO:0046888 16491 46 0.891748973 0.898584 0.911711712 -1 0.979549691 0.595074 0.56036036 -1
biological_process nucleoside monophosphate biosynthetic process GO:0009124 16505 32 0.870139084 0.898613 0.936936937 -1 0.999663186 0.501338 0.545945946 -1
biological_process ATP catabolic process GO:0006200 16467 70 0.912193129 0.898888 0.895495495 -1 1.006260784 0.463801 0.477477477 -1
biological_process spermatid differentiation GO:0048515 16458 79 0.91728292 0.899122 0.859459459 -1 1.026141897 0.343341 0.428828829 -1
molecular_function tRNA binding GO:0000049 16834 27 0.857910291 0.899709 0.899099099 -1 0.935656929 0.718906 0.751351351 -1
cellular_component nuclear periphery GO:0034399 16733 90 0.921625686 0.901707 0.821621622 -1 1.042457103 0.242115 0.252252252 0.401767
biological_process photoreceptor cell development GO:0042461 16504 33 0.870068883 0.902198 0.848648649 -1 1.018964299 0.425111 0.43963964 -1
molecular_function calcium activated cation channel activity GO:0005227 16839 22 0.840389363 0.902787 0.920720721 -1 1.125533117 0.153745 0.16036036 0.30314
molecular_function carboxylesterase activity GO:0004091 16831 30 0.863065432 0.90325 0.767567568 -1 0.986546316 0.550837 0.506306306 -1
cellular_component motile cilium GO:0031514 16717 106 0.927298877 0.903304 0.753153153 -1 0.949578382 0.816482 0.814414414 -1
cellular_component cell projection cytoplasm GO:0032838 16767 56 0.899792872 0.903381 0.828828829 -1 0.953309136 0.727819 0.758558559 -1
cellular_component synaptonemal complex GO:0000795 16794 29 0.858474398 0.906793 0.872072072 -1 1.038984276 0.357958 0.389189189 -1
biological_process mitotic DNA integrity checkpoint GO:0044774 16510 27 0.852965475 0.907328 0.884684685 -1 1.056672093 0.304875 0.25045045 -1
cellular_component organelle membrane GO:0031090 14786 2037 0.984095065 0.907628 0.681081081 -1 0.988186051 0.837769 0.627027027 -1
molecular_function tetrapyrrole binding GO:0046906 16720 141 0.935571874 0.908349 0.846846847 -1 0.944286762 0.875078 0.805405405 -1
cellular_component centrosome GO:0005813 16458 365 0.960194368 0.908528 0.754954955 -1 1.016011593 0.296078 0.333333333 0.47196
cellular_component condensed chromosome GO:0000793 16658 165 0.940417514 0.908606 0.664864865 -1 1.034294998 0.22158 0.322522523 0.361498
biological_process retinoid metabolic process GO:0001523 16508 29 0.856971742 0.909114 0.801801802 -1 0.806629834 0.964486 0.89009009 -1
cellular_component non-membrane-bounded organelle GO:0043228 13901 2922 0.987011687 0.909506 0.666666667 -1 1.008618816 0.187379 0.338738739 0.312073
cellular_component intracellular non-membrane-bounded organelle GO:0043232 13901 2922 0.987011687 0.909506 0.666666667 -1 1.008618816 0.187379 0.338738739 0.312073
biological_process sulfur compound biosynthetic process GO:0044272 16469 68 0.906515989 0.909563 0.864864865 -1 1.010312937 0.441351 0.50990991 -1
biological_process histone H3 acetylation GO:0043966 16492 45 0.88450596 0.9105 0.832432432 -1 1.159109469 0.0320703 0.023423423 0.149912
cellular_component SCF ubiquitin ligase complex GO:0019005 16797 26 0.847923752 0.910559 0.891891892 -1 0.826402287 0.937538 0.87027027 -1
molecular_function RNA methyltransferase activity GO:0008173 16831 30 0.857320756 0.912266 0.879279279 -1 0.937564353 0.723371 0.736936937 -1
molecular_function GDP binding GO:0019003 16819 42 0.879312174 0.912525 0.85045045 -1 0.897922642 0.874372 0.845045045 -1
cellular_component primary cilium GO:0072372 16727 96 0.920185201 0.912838 0.90990991 -1 1.069791746 0.117453 0.117117117 0.199266
biological_process positive regulation of response to DNA damage stimulus GO:2001022 16495 42 0.877839809 0.915136 0.902702703 -1 0.978589355 0.595106 0.601801802 -1
biological_process ferrous iron transport GO:0015684 16517 20 0.821976359 0.916189 0.926126126 -1 0.700957698 0.989772 0.987387387 -1
biological_process alpha-amino acid biosynthetic process GO:1901607 16468 69 0.903867787 0.917141 0.83963964 -1 0.909781285 0.903342 0.812612613 -1
molecular_function ferrous iron transmembrane transporter activity GO:0015093 16841 20 0.820739465 0.91765 0.927927928 -1 0.701358532 0.989686 0.987387387 -1
biological_process nucleobase-containing compound transport GO:0015931 16428 109 0.923236845 0.918164 0.832432432 -1 1.000864274 0.493772 0.479279279 -1
biological_process organic acid biosynthetic process GO:0016053 16286 251 0.949384962 0.919211 0.787387387 -1 0.959690853 0.867527 0.789189189 -1
biological_process carboxylic acid biosynthetic process GO:0046394 16286 251 0.949384962 0.919211 0.787387387 -1 0.959690853 0.867527 0.789189189 -1
biological_process organelle fusion GO:0048284 16487 50 0.88567472 0.919603 0.978378378 -1 0.90616336 0.875152 0.936936937 -1
biological_process tRNA modification GO:0006400 16513 24 0.834661329 0.919848 0.881081081 -1 0.808665556 0.947897 0.956756757 -1
biological_process DNA geometric change GO:0032392 16515 22 0.827100663 0.920088 0.816216216 -1 1.053274743 0.332487 0.320720721 -1
molecular_function CoA hydrolase activity GO:0016289 16841 20 0.818189351 0.920613 0.846846847 -1 0.511268267 0.999924 0.989189189 -1
biological_process cellular modified amino acid biosynthetic process GO:0042398 16488 49 0.883299527 0.921775 0.827027027 -1 0.898939503 0.890126 0.715315315 -1
biological_process benzene-containing compound metabolic process GO:0042537 16517 20 0.816758057 0.922245 0.956756757 -1 0.762996844 0.966897 0.944144144 -1
biological_process spermatid development GO:0007286 16463 74 0.904681167 0.922705 0.891891892 -1 1.015996018 0.405624 0.457657658 -1
biological_process pyrimidine-containing compound metabolic process GO:0072527 16487 50 0.882842446 0.924662 0.778378378 -1 0.926400457 0.816698 0.736936937 -1
molecular_function DNA-directed RNA polymerase activity GO:0003899 16825 36 0.861642112 0.92499 0.758558559 -1 0.712298984 0.99862 0.933333333 -1
molecular_function RNA polymerase activity GO:0034062 16825 36 0.861642112 0.92499 0.758558559 -1 0.712298984 0.99862 0.933333333 -1
biological_process dicarboxylic acid metabolic process GO:0043648 16463 74 0.903261009 0.925731 0.897297297 -1 0.969420083 0.676066 0.675675676 -1
biological_process cellular response to oxidative stress GO:0034599 16444 93 0.913460076 0.926427 0.906306306 -1 0.960327856 0.74685 0.738738739 -1
biological_process pigment biosynthetic process GO:0046148 16494 43 0.872128255 0.927072 0.855855856 -1 0.868306178 0.932907 0.864864865 -1
biological_process photoreceptor cell maintenance GO:0045494 16515 22 0.820900047 0.927314 0.877477477 -1 1.031666035 0.398441 0.4 -1
biological_process glutathione metabolic process GO:0006749 16494 43 0.871464524 0.928113 0.74954955 -1 0.839979496 0.965617 0.774774775 -1
biological_process small molecule catabolic process GO:0044282 16344 193 0.938767469 0.930851 0.8 -1 0.903527425 0.990232 0.958558559 -1
biological_process single-organism catabolic process GO:0044712 16344 193 0.938767469 0.930851 0.8 -1 0.903527425 0.990232 0.958558559 -1
biological_process regulation of fatty acid biosynthetic process GO:0042304 16515 22 0.817162087 0.931421 0.89009009 -1 1.07452065 0.272331 0.21981982 0.489317
molecular_function mRNA 3'-UTR binding GO:0003730 16841 20 0.807532245 0.932125 0.969369369 -1 1.00880743 0.472799 0.500900901 -1
biological_process cilium movement GO:0003341 16513 24 0.8234447 0.933102 0.767567568 -1 0.804442944 0.951609 0.971171171 -1
molecular_function NAD binding GO:0051287 16805 56 0.884514774 0.933117 0.807207207 -1 0.781048757 0.997764 0.877477477 -1
biological_process regulation of endocrine process GO:0044060 16514 23 0.817114287 0.935784 0.954954955 -1 0.911174655 0.769871 0.864864865 -1
biological_process regulation of mRNA splicing, via spliceosome GO:0048024 16504 33 0.846541721 0.936807 0.879279279 -1 1.015831009 0.437375 0.423423423 -1
cellular_component nonmotile primary cilium GO:0031513 16743 80 0.901520634 0.93691 0.944144144 -1 1.06998096 0.138576 0.176576577 0.238715
cellular_component anaphase-promoting complex GO:0005680 16801 22 0.810341723 0.938448 0.837837838 -1 0.813340687 0.935429 0.78018018 -1
biological_process acyl-CoA metabolic process GO:0006637 16479 58 0.883001745 0.938963 0.855855856 -1 0.872211512 0.954363 0.915315315 -1
biological_process thioester metabolic process GO:0035383 16479 58 0.883001745 0.938963 0.855855856 -1 0.872211512 0.954363 0.915315315 -1
biological_process ribonucleoside monophosphate metabolic process GO:0009161 16499 38 0.855181656 0.939202 0.935135135 -1 0.936111967 0.752695 0.781981982 -1
biological_process pyrimidine nucleoside metabolic process GO:0006213 16504 33 0.843529365 0.940444 0.798198198 -1 0.857924177 0.921486 0.792792793 -1
biological_process protein autoubiquitination GO:0051865 16506 31 0.838451082 0.940558 0.913513514 -1 0.957005421 0.660957 0.663063063 -1
molecular_function ligase activity GO:0016874 16406 455 0.958201705 0.941283 0.774774775 -1 1.01501197 0.286974 0.374774775 -1
molecular_function copper ion binding GO:0005507 16816 45 0.86523863 0.941553 0.864864865 -1 0.853282746 0.956094 0.846846847 -1
biological_process RNA localization GO:0006403 16444 93 0.905679988 0.942948 0.857657658 -1 1.004315325 0.471214 0.466666667 -1
cellular_component photoreceptor connecting cilium GO:0032391 16801 22 0.805121904 0.943438 0.908108108 -1 1.006927874 0.477554 0.479279279 -1
cellular_component microbody part GO:0044438 16760 63 0.88474185 0.943809 0.951351351 -1 0.918057841 0.870485 0.846846847 -1
cellular_component peroxisomal part GO:0044439 16760 63 0.88474185 0.943809 0.951351351 -1 0.918057841 0.870485 0.846846847 -1

molecular_function small conjugating protein ligase activity GO:0019787 16614 247 0.941960029 0.944279 0.744144144 -1 1.03076384 0.199444 0.293693694 0.375377
biological_process regulation of translation GO:0006417 16367 170 0.929740654 0.944652 0.927927928 -1 1.027049848 0.269629 0.185585586 0.485741
biological_process hydrogen peroxide metabolic process GO:0042743 16517 20 0.793738269 0.945063 0.830630631 -1 0.847946938 0.88072 0.738738739 -1
biological_process ribonucleoprotein complex assembly GO:0022618 16470 67 0.887440826 0.945106 0.913513514 -1 0.904265093 0.913106 0.893693694 -1
biological_process maternal process involved in female pregnancy GO:0060135 16493 44 0.860802772 0.945365 0.927927928 -1 0.98853657 0.552483 0.562162162 -1
biological_process nucleoside diphosphate metabolic process GO:0009132 16506 31 0.833843887 0.945637 0.763963964 -1 0.748858488 0.992331 0.855855856 -1
biological_process maternal placenta development GO:0001893 16513 24 0.809083786 0.947518 0.942342342 -1 0.850433139 0.89798 0.841441441 -1
cellular_component nucleoid GO:0009295 16789 34 0.839375573 0.947806 0.994594595 -1 0.938404325 0.733278 0.753153153 -1
biological_process vesicle fusion GO:0006906 16506 31 0.830824438 0.948776 0.983783784 -1 0.813292908 0.964253 0.98018018 -1
biological_process RNA metabolic process GO:0016070 13276 3261 0.985176418 0.949174 0.628828829 -1 1.029352005 0.000598242 0.203603604 0.0298366
biological_process isoprenoid biosynthetic process GO:0008299 16513 24 0.806201526 0.95009 0.873873874 -1 0.951065351 0.661144 0.598198198 -1
biological_process natural killer cell activation GO:0030101 16504 33 0.83401589 0.950862 0.873873874 -1 0.990489837 0.537753 0.531531532 -1
biological_process folic acid-containing compound metabolic process GO:0006760 16516 21 0.791726157 0.950963 0.846846847 -1 0.748898242 0.976947 0.971171171 -1
biological_process terpenoid metabolic process GO:0006721 16495 42 0.851974328 0.951925 0.89009009 -1 0.865904774 0.934121 0.825225225 -1
biological_process ribonucleoprotein complex subunit organization GO:0071826 16465 72 0.886525222 0.952687 0.89009009 -1 0.914440822 0.896219 0.859459459 -1
biological_process cellular response to light stimulus GO:0071482 16493 44 0.854538941 0.95289 0.992792793 -1 0.958454235 0.683685 0.744144144 -1
cellular_component microtubule organizing center GO:0005815 16352 471 0.955924363 0.953578 0.789189189 -1 1.016509163 0.264535 0.30990991 0.430707
biological_process base-excision repair GO:0006284 16508 29 0.819965936 0.953601 0.962162162 -1 1.070086656 0.25647 0.324324324 0.467079
biological_process nucleotide-sugar metabolic process GO:0009225 16509 28 0.816520508 0.953826 0.924324324 -1 0.722809609 0.994501 0.996396396 -1
cellular_component nuclear matrix GO:0016363 16750 73 0.886382618 0.954017 0.904504505 -1 1.020426359 0.380972 0.342342342 -1
molecular_function oxidoreductase activity, acting on the CH-CH group of donors GO:0016627 16807 54 0.867394696 0.954541 0.918918919 -1 1.005564326 0.471732 0.531531532 -1
biological_process oxidoreduction coenzyme metabolic process GO:0006733 16473 64 0.878232215 0.954547 0.904504505 -1 0.77817444 0.998964 0.936936937 -1
biological_process regulation of cyclin-dependent protein serine/threonine kinase activity GO:0000079 16476 61 0.87506857 0.954798 0.855855856 -1 0.957365154 0.718332 0.715315315 -1
molecular_function translation elongation factor activity GO:0003746 16838 23 0.795790374 0.955201 0.859459459 -1 0.855105672 0.885791 0.76036036 -1
biological_process nucleic acid transport GO:0050657 16449 88 0.895795303 0.955223 0.891891892 -1 1.002529184 0.483592 0.491891892 -1
biological_process RNA transport GO:0050658 16449 88 0.895795303 0.955223 0.891891892 -1 1.002529184 0.483592 0.491891892 -1
biological_process establishment of RNA localization GO:0051236 16449 88 0.895795303 0.955223 0.891891892 -1 1.002529184 0.483592 0.491891892 -1
molecular_function growth factor activity GO:0008083 16745 116 0.909157675 0.955488 0.940540541 -1 0.852799535 0.997071 0.996396396 -1
biological_process RNA splicing, via transesterification reactions with bulged adenosine as nucleophile GO:0000377 16457 80 0.889901968 0.956356 0.812612613 -1 1.014536557 0.410722 0.427027027 -1
biological_process mRNA splicing, via spliceosome GO:0000398 16457 80 0.889901968 0.956356 0.812612613 -1 1.014536557 0.410722 0.427027027 -1
biological_process purine ribonucleoside triphosphate biosynthetic process GO:0009206 16473 64 0.876758331 0.956469 0.747747748 -1 0.770056744 0.999295 0.866666667 -1
molecular_function DNA helicase activity GO:0003678 16803 58 0.869529675 0.957652 0.841441441 -1 1.012828922 0.432702 0.416216216 -1
molecular_function translation regulator activity GO:0045182 16839 22 0.787564796 0.957919 0.954954955 -1 0.831574486 0.91454 0.90990991 -1
biological_process amino sugar metabolic process GO:0006040 16497 40 0.840406702 0.959982 0.893693694 -1 0.831941322 0.967359 0.933333333 -1
biological_process carboxylic acid metabolic process GO:0019752 15877 660 0.961456514 0.959988 0.821621622 -1 0.928067734 0.999456 0.971171171 -1
molecular_function ribonucleoprotein complex binding GO:0043021 16805 56 0.864931421 0.960257 0.917117117 -1 0.891404742 0.920724 0.841441441 -1
molecular_function heme binding GO:0020037 16727 134 0.912774516 0.960444 0.877477477 -1 0.935319261 0.903572 0.828828829 -1
molecular_function single-stranded DNA binding GO:0003697 16805 56 0.864245178 0.961015 0.893693694 -1 0.946270325 0.757292 0.789189189 -1
molecular_function disulfide oxidoreductase activity GO:0015036 16830 31 0.817245636 0.961144 0.913513514 -1 0.868385663 0.898042 0.832432432 -1
biological_process purine nucleoside triphosphate biosynthetic process GO:0009145 16472 65 0.873530527 0.961606 0.758558559 -1 0.763925245 0.999522 0.875675676 -1
cellular_component mitochondrial nucleoid GO:0042645 16790 33 0.822242117 0.961676 0.996396396 -1 0.943638023 0.712732 0.72972973 -1
biological_process cellular amino acid catabolic process GO:0009063 16461 76 0.881287489 0.963813 0.935135135 -1 0.972404899 0.661921 0.691891892 -1
biological_process ribonucleoside triphosphate biosynthetic process GO:0009201 16468 69 0.875290555 0.963921 0.771171171 -1 0.793111515 0.998573 0.855855856 -1
molecular_function acid-amino acid ligase activity GO:0016881 16574 287 0.939188442 0.964054 0.798198198 -1 1.02145086 0.262764 0.326126126 0.454489
molecular_function coenzyme binding GO:0050662 16652 209 0.928074761 0.965038 0.902702703 -1 0.917286362 0.981426 0.776576577 -1
cellular_component nucleolar part GO:0044452 16798 25 0.790076506 0.965576 0.967567568 -1 0.671160608 0.997814 0.972972973 -1
molecular_function cofactor binding GO:0048037 16573 288 0.938332517 0.966255 0.884684685 -1 0.918741281 0.992009 0.828828829 -1
cellular_component nuclear ubiquitin ligase complex GO:0000152 16797 26 0.792453515 0.96671 0.884684685 -1 0.857237375 0.896504 0.745945946 -1
cellular_component transcription factor TFIID complex GO:0005669 16802 21 0.768590635 0.966968 0.98018018 -1 0.940822007 0.680838 0.634234234 -1
biological_process protein K11-linked ubiquitination GO:0070979 16512 25 0.787415839 0.967301 0.947747748 -1 0.818882868 0.941769 0.888288288 -1
biological_process RNA methylation GO:0001510 16515 22 0.772669366 0.967711 0.927927928 -1 0.991411501 0.527852 0.536936937 -1
cellular_component catalytic step 2 spliceosome GO:0071013 16749 74 0.876166758 0.967787 0.922522523 -1 1.001329077 0.492091 0.526126126 -1
molecular_function transferase activity, transferring alkyl or aryl (other than methyl) groups GO:0016765 16809 52 0.851640099 0.96827 0.809009009 -1 0.810678603 0.991067 0.772972973 -1
biological_process RNA splicing, via transesterification reactions GO:0000375 16455 82 0.881766723 0.968497 0.836036036 -1 1.001507614 0.490569 0.506306306 -1
biological_process cellular amino acid biosynthetic process GO:0008652 16438 99 0.892016573 0.969026 0.866666667 -1 0.900947366 0.956578 0.823423423 -1
biological_process pteridine-containing compound metabolic process GO:0042558 16510 27 0.792565657 0.969156 0.868468468 -1 0.797734466 0.965771 0.845045045 -1
biological_process cilium assembly GO:0042384 16458 79 0.878351355 0.969766 0.787387387 -1 0.995173606 0.529711 0.484684685 -1
biological_process cilium organization GO:0044782 16458 79 0.878351355 0.969766 0.787387387 -1 0.995173606 0.529711 0.484684685 -1
biological_process pyrimidine-containing compound biosynthetic process GO:0072528 16508 29 0.798777464 0.969852 0.845045045 -1 0.885428765 0.857615 0.718918919 -1
biological_process pyrimidine ribonucleotide biosynthetic process GO:0009220 16513 24 0.778623533 0.96994 0.816216216 -1 0.791140203 0.961937 0.834234234 -1
biological_process pyrimidine ribonucleoside biosynthetic process GO:0046132 16513 24 0.778623533 0.96994 0.816216216 -1 0.791140203 0.961937 0.834234234 -1
biological_process pyrimidine nucleoside biosynthetic process GO:0046134 16513 24 0.778623533 0.96994 0.816216216 -1 0.791140203 0.961937 0.834234234 -1
biological_process tricarboxylic acid cycle GO:0006099 16511 26 0.786550137 0.970401 0.989189189 -1 0.806699603 0.95624 0.859459459 -1
biological_process protein monoubiquitination GO:0006513 16500 37 0.821083082 0.970435 0.951351351 -1 0.983167338 0.570481 0.592792793 -1
biological_process cofactor biosynthetic process GO:0051188 16424 113 0.897700633 0.970629 0.906306306 -1 0.888295606 0.980486 0.790990991 -1
biological_process pyrimidine ribonucleotide metabolic process GO:0009218 16512 25 0.780590323 0.971394 0.828828829 -1 0.783691071 0.96959 0.852252252 -1
biological_process DNA-dependent DNA replication GO:0006261 16470 67 0.866015652 0.971514 0.787387387 -1 0.989204086 0.560972 0.578378378 -1
cellular_component cilium GO:0005929 16592 231 0.928070685 0.971719 0.756756757 -1 0.993016077 0.573456 0.590990991 -1
biological_process nitrogen compound metabolic process GO:0006807 11451 5086 0.987150591 0.971795 0.677477477 -1 1.011002125 0.0512724 0.246846847 0.185758
molecular_function endodeoxyribonuclease activity GO:0004520 16833 28 0.789747528 0.973115 0.974774775 -1 0.878544033 0.867392 0.828828829 -1
molecular_function helicase activity GO:0004386 16692 169 0.913535377 0.974815 0.769369369 -1 1.178035606 2.80E-05 0.052252252 0
molecular_function protein disulfide oxidoreductase activity GO:0015035 16836 25 0.77410084 0.974878 0.944144144 -1 0.831413176 0.928014 0.857657658 -1
biological_process RNA modification GO:0009451 16472 65 0.859658466 0.97522 0.945945946 -1 0.963468219 0.695401 0.704504505 -1
biological_process cilium morphogenesis GO:0060271 16429 108 0.890635299 0.975874 0.807207207 -1 1.010665661 0.423657 0.405405405 -1
molecular_function cysteine-type endopeptidase inhibitor activity GO:0004869 16826 35 0.805727679 0.976861 0.983783784 -1 0.890828637 0.86862 0.864864865 -1
cellular_component small nuclear ribonucleoprotein complex GO:0030532 16801 22 0.753226316 0.977582 0.90990991 -1 0.855293763 0.880288 0.778378378 -1
biological_process peroxisome organization GO:0007031 16506 31 0.791735445 0.977807 0.976576577 -1 0.883122545 0.870396 0.834234234 -1
cellular_component cullin-RING ubiquitin ligase complex GO:0031461 16739 84 0.873476286 0.977975 0.983783784 -1 0.946072446 0.804627 0.852252252 -1
cellular_component organelle envelope lumen GO:0031970 16769 54 0.841756497 0.978175 0.900900901 -1 0.769736329 0.998335 0.864864865 -1
molecular_function ligase activity, forming carbon-nitrogen bonds GO:0016879 16549 312 0.934388039 0.97863 0.83963964 -1 1.008177125 0.400341 0.409009009 -1
biological_process nucleic acid phosphodiester bond hydrolysis GO:0090305 16491 46 0.827346355 0.97888 0.94954955 -1 0.891675361 0.898737 0.891891892 -1

biological_process aspartate family amino acid biosynthetic process GO:0009067 16517 20 0.737600702 0.979018 0.998198198 -1 0.925090741 0.719265 0.762162162 -1
biological_process meiosis GO:0007126 16401 136 0.899082105 0.979674 0.864864865 -1 1.026765297 0.2936 0.34954955 -1
biological_process proton transport GO:0015992 16470 67 0.855550348 0.979925 0.769369369 -1 0.766151236 0.999554 0.805405405 -1
molecular_function carbon-oxygen lyase activity GO:0016835 16804 57 0.842255625 0.980602 0.834234234 -1 0.832612843 0.985834 0.945945946 -1
biological_process nucleoside triphosphate biosynthetic process GO:0009142 16464 73 0.860490196 0.980738 0.812612613 -1 0.805170343 0.998072 0.854054054 -1
biological_process pyrimidine nucleoside triphosphate metabolic process GO:0009147 16516 21 0.737968111 0.981294 0.846846847 -1 0.7860365 0.955383 0.830630631 -1
biological_process mitochondrial membrane organization GO:0007006 16491 46 0.822711428 0.981496 0.972972973 -1 0.824078508 0.980755 0.848648649 -1
molecular_function endonuclease activity GO:0004519 16780 81 0.866453138 0.981551 0.891891892 -1 0.774735417 0.999784 0.983783784 -1
biological_process hydrogen transport GO:0006818 16469 68 0.853851007 0.981774 0.778378378 -1 0.770641296 0.999486 0.807207207 -1
molecular_function monocarboxylic acid binding GO:0033293 16829 32 0.785335131 0.98237 0.936936937 -1 0.923504624 0.77345 0.8 -1
biological_process alpha-amino acid catabolic process GO:1901606 16472 65 0.849010692 0.982688 0.953153153 -1 0.972039649 0.652207 0.661261261 -1
biological_process recombinational repair GO:0000725 16492 45 0.817863259 0.982965 0.926126126 -1 0.980299132 0.590673 0.625225225 -1
biological_process pyrimidine nucleotide biosynthetic process GO:0006221 16509 28 0.767231262 0.983631 0.868468468 -1 0.847522805 0.919056 0.763963964 -1
biological_process cellular amino acid metabolic process GO:0006520 16214 323 0.932045514 0.98368 0.915315315 -1 0.919495335 0.994313 0.953153153 -1
biological_process pigment metabolic process GO:0042440 16483 54 0.831575832 0.984116 0.924324324 -1 0.905182092 0.886649 0.74954955 -1
cellular_component integral to mitochondrial membrane GO:0032592 16792 31 0.777476527 0.984143 0.958558559 -1 0.824168682 0.955179 0.812612613 -1
biological_process double-strand break repair GO:0006302 16438 99 0.87527271 0.984462 0.956756757 -1 1.057340691 0.160813 0.29009009 0.351062
biological_process protein peptidyl-prolyl isomerization GO:0000413 16517 20 0.72169788 0.984502 0.891891892 -1 0.826559758 0.910584 0.724324324 -1
biological_process alpha-amino acid metabolic process GO:1901605 16352 185 0.908828876 0.98462 0.92972973 -1 0.957588161 0.84251 0.854054054 -1
molecular_function DNA-dependent ATPase activity GO:0008094 16804 57 0.834695801 0.984821 0.866666667 -1 0.997380816 0.513694 0.495495495 -1
biological_process nucleoside monophosphate metabolic process GO:0009123 16494 43 0.809377567 0.98492 0.972972973 -1 0.948603547 0.720585 0.70990991 -1
molecular_function ATP-dependent DNA helicase activity GO:0004003 16837 24 0.741984423 0.985774 0.917117117 -1 0.877550674 0.850787 0.902702703 -1
molecular_function oxidoreductase activity, acting on a sulfur group of donors GO:0016667 16811 50 0.819362403 0.986645 0.974774775 -1 0.890765604 0.90986 0.832432432 -1
biological_process organic acid catabolic process GO:0016054 16391 146 0.894605183 0.986645 0.926126126 -1 0.921227231 0.951141 0.897297297 -1
biological_process carboxylic acid catabolic process GO:0046395 16391 146 0.894605183 0.986645 0.926126126 -1 0.921227231 0.951141 0.897297297 -1
molecular_function nuclease activity GO:0004518 16730 131 0.886854879 0.987835 0.942342342 -1 0.855259357 0.998016 0.944144144 -1
biological_process double-strand break repair via homologous recombination GO:0000724 16493 44 0.803892328 0.987972 0.953153153 -1 0.999390397 0.502819 0.542342342 -1
molecular_function ATP-dependent helicase activity GO:0008026 16749 112 0.875966384 0.988733 0.879279279 -1 1.132227456 0.00751096 0.126126126 0
molecular_function purine NTP-dependent helicase activity GO:0070035 16749 112 0.875966384 0.988733 0.879279279 -1 1.132227456 0.00751096 0.126126126 0
biological_process coenzyme biosynthetic process GO:0009108 16456 81 0.853885171 0.988797 0.985585586 -1 0.822663295 0.997209 0.888288288 -1
molecular_function peroxidase activity GO:0004601 16827 34 0.773427693 0.989009 0.796396396 -1 0.672319672 0.999538 0.908108108 -1
molecular_function oxidoreductase activity, acting on peroxide as acceptor GO:0016684 16827 34 0.773427693 0.989009 0.796396396 -1 0.672319672 0.999538 0.908108108 -1
biological_process organic cyclic compound metabolic process GO:1901360 11697 4840 0.983980556 0.989151 0.697297297 -1 1.011950293 0.0434675 0.245045045 0.174515
biological_process isoprenoid metabolic process GO:0006720 16477 60 0.828498734 0.989423 0.920720721 -1 0.867250021 0.962817 0.807207207 -1
biological_process macromolecule biosynthetic process GO:0009059 12827 3710 0.980657457 0.989766 0.818018018 -1 1.005091994 0.271013 0.376576577 0.487779
biological_process regulation of RNA splicing GO:0043484 16475 62 0.828152186 0.990568 0.936936937 -1 1.03167632 0.33259 0.403603604 -1
molecular_function unfolded protein binding GO:0051082 16770 91 0.857224217 0.990998 0.863063063 -1 0.909456919 0.93321 0.821621622 -1
molecular_function transferase activity, transferring one-carbon groups GO:0016741 16675 186 0.899484431 0.991522 0.992792793 -1 0.986790296 0.623161 0.634234234 -1
biological_process response to DNA damage stimulus GO:0006974 16023 514 0.940064277 0.991604 0.884684685 -1 1.009356641 0.35454 0.371171171 -1
biological_process DNA metabolic process GO:0006259 15773 764 0.951187129 0.991646 0.753153153 -1 0.990781936 0.674374 0.601801802 -1
cellular_component intracellular organelle lumen GO:0070013 14840 1983 0.970721934 0.991897 0.809009009 -1 1.007284518 0.274822 0.363963964 0.447063
biological_process establishment of protein localization to organelle GO:0072594 16445 92 0.855372812 0.992014 0.992792793 -1 0.848196956 0.994283 0.926126126 -1
cellular_component organelle lumen GO:0043233 14835 1988 0.970678369 0.992056 0.814414414 -1 1.00624605 0.303697 0.38018018 0.480657
biological_process translational elongation GO:0006414 16499 38 0.773723054 0.992216 0.8 -1 0.727841328 0.998189 0.875675676 -1
molecular_function deoxyribonuclease activity GO:0004536 16824 37 0.770538437 0.992246 0.956756757 -1 0.842499425 0.95167 0.805405405 -1
molecular_function antioxidant activity GO:0016209 16803 58 0.815801405 0.992534 0.83963964 -1 0.74152498 0.999682 0.920720721 -1
cellular_component DNA-directed RNA polymerase complex GO:0000428 16730 93 0.854054319 0.99275 0.992792793 -1 0.931275075 0.875169 0.8 -1
cellular_component RNA polymerase complex GO:0030880 16730 93 0.854054319 0.99275 0.992792793 -1 0.931275075 0.875169 0.8 -1
cellular_component nuclear DNA-directed RNA polymerase complex GO:0055029 16730 93 0.854054319 0.99275 0.992792793 -1 0.931275075 0.875169 0.8 -1
biological_process apoptotic nuclear changes GO:0030262 16513 24 0.709670993 0.993158 0.913513514 -1 0.812978869 0.943876 0.927927928 -1
biological_process chromosome condensation GO:0030261 16514 23 0.702558233 0.993293 0.866666667 -1 0.967871673 0.605312 0.578378378 -1
cellular_component mitochondrial intermembrane space GO:0005758 16780 43 0.782420883 0.993329 0.918918919 -1 0.726385178 0.99907 0.845045045 -1
biological_process aspartate family amino acid metabolic process GO:0009066 16505 32 0.747349495 0.993393 0.992792793 -1 0.895576797 0.847131 0.875675676 -1
biological_process pyrimidine nucleotide metabolic process GO:0006220 16504 33 0.750857268 0.993459 0.881081081 -1 0.819302252 0.964055 0.796396396 -1
biological_process organic substance metabolic process GO:0071704 8428 8109 0.988610536 0.993596 0.884684685 -1 0.998686133 0.613209 0.628828829 -1
molecular_function methyltransferase activity GO:0008168 16682 179 0.893086675 0.993629 0.994594595 -1 0.990452869 0.588001 0.601801802 -1
cellular_component proteasome accessory complex GO:0022624 16801 22 0.692063658 0.99385 0.972972973 -1 0.766443372 0.971201 0.83963964 -1
molecular_function isoprenoid binding GO:0019840 16841 20 0.669654088 0.994773 0.954954955 -1 0.689515327 0.991948 0.94954955 -1
molecular_function rRNA binding GO:0019843 16827 34 0.746667191 0.994785 0.772972973 -1 0.668820678 0.999593 0.843243243 -1
biological_process cellular aromatic compound metabolic process GO:0006725 11842 4695 0.981734293 0.994799 0.695495495 -1 1.013434715 0.0297912 0.245045045 0.143039
cellular_component microtubule basal body GO:0005932 16758 65 0.814949777 0.99519 0.935135135 -1 1.054925765 0.2211 0.21981982 0.362923
biological_process DNA catabolic process GO:0006308 16507 30 0.723919035 0.995625 0.951351351 -1 0.990780079 0.534903 0.558558559 -1
cellular_component DNA-directed RNA polymerase II, holoenzyme GO:0016591 16736 87 0.838004178 0.995655 0.992792793 -1 0.931671731 0.865809 0.778378378 -1
biological_process cellular macromolecule biosynthetic process GO:0034645 12911 3626 0.977667742 0.995814 0.841441441 -1 1.004692791 0.289987 0.392792793 -1
biological_process cellular nitrogen compound metabolic process GO:0034641 11731 4806 0.981377211 0.996041 0.740540541 -1 1.010216675 0.0726791 0.282882883 0.22611
biological_process heterocycle metabolic process GO:0046483 11865 4672 0.98097619 0.996085 0.713513514 -1 1.014349524 0.022474 0.236036036 0.12883
biological_process oxidation-reduction process GO:0055114 15842 695 0.942406534 0.996397 0.771171171 -1 0.874460762 1 1 -1
biological_process execution phase of apoptosis GO:0097194 16510 27 0.701256001 0.996438 0.94954955 -1 0.859697468 0.896856 0.861261261 -1
molecular_function isomerase activity GO:0016853 16729 132 0.865159078 0.99647 0.933333333 -1 0.898578335 0.978631 0.792792793 -1
biological_process mitochondrial transport GO:0006839 16461 76 0.821746585 0.996511 0.976576577 -1 0.814412574 0.997515 0.85045045 -1
biological_process cellular component disassembly involved in execution phase of apoptosis GO:0006921 16512 25 0.68761142 0.996611 0.947747748 -1 0.859937545 0.887622 0.877477477 -1
cellular_component intracellular part GO:0044424 6242 10581 0.990730828 0.996651 0.832432432 -1 0.998062809 0.714605 0.565765766 -1
cellular_component nuclear part GO:0044428 14745 2078 0.967756148 0.99673 0.767567568 -1 1.022040652 0.0315222 0.144144144 0.0352529
biological_process nucleobase-containing compound metabolic process GO:0006139 11980 4557 0.980197072 0.996746 0.693693694 -1 1.015134447 0.0188305 0.243243243 0.116582
biological_process primary metabolic process GO:0044238 8677 7860 0.987050757 0.996983 0.893693694 -1 0.998294851 0.641363 0.63963964 -1
cellular_component organelle GO:0043226 7521 9302 0.989009588 0.996985 0.877477477 -1 1.000675005 0.433084 0.495495495 -1
cellular_component membrane-enclosed lumen GO:0031974 14787 2036 0.966997802 0.997031 0.83963964 -1 1.000529999 0.482342 0.517117117 -1
molecular_function peptidyl-prolyl cis-trans isomerase activity GO:0003755 16825 36 0.733615831 0.997209 0.918918919 -1 0.824032868 0.96643 0.78018018 -1
biological_process purine nucleoside biosynthetic process GO:0042451 16442 95 0.835900956 0.997269 0.924324324 -1 0.821677843 0.998733 0.843243243 -1
biological_process purine ribonucleoside biosynthetic process GO:0046129 16442 95 0.835900956 0.997269 0.924324324 -1 0.821677843 0.998733 0.843243243 -1
biological_process deoxyribonucleotide metabolic process GO:0009262 16515 22 0.65627588 0.9974 0.971171171 -1 0.859324079 0.873625 0.772972973 -1

cellular_component ubiquitin ligase complex GO:0000151 16687 136 0.862035791 0.99743 0.978378378 -1 0.981144411 0.648914 0.69009009 -1
molecular_function transferase activity, transferring pentosyl groups GO:0016763 16818 43 0.753355349 0.997484 0.992792793 -1 1.124502489 0.0784022 0.052252252 0.136518
biological_process protein targeting to mitochondrion GO:0006626 16502 35 0.724726413 0.997627 0.969369369 -1 0.666260003 0.999691 0.920720721 -1
molecular_function fatty-acyl-CoA binding GO:0000062 16839 22 0.649082267 0.997833 0.98018018 -1 0.757227601 0.97579 0.906306306 -1
biological_process organic substance biosynthetic process GO:1901576 12120 4417 0.978604455 0.997996 0.933333333 -1 0.995661708 0.720375 0.645045045 -1
molecular_function cis-trans isomerase activity GO:0016859 16823 38 0.727772036 0.998193 0.931531532 -1 0.7932978 0.986432 0.816216216 -1
biological_process macromolecule metabolic process GO:0043170 9987 6550 0.983824927 0.998241 0.809009009 -1 1.006506978 0.12033 0.23963964 0.294462
biological_process cellular biosynthetic process GO:0044249 12186 4351 0.977722688 0.998489 0.926126126 -1 0.995441702 0.728115 0.645045045 -1
cellular_component intracellular organelle GO:0043229 7559 9264 0.988041301 0.998532 0.879279279 -1 1.000482157 0.452365 0.511711712 -1
molecular_function nucleobase-containing compound kinase activity GO:0019205 16822 39 0.724822473 0.998559 0.904504505 -1 0.783461417 0.990487 0.843243243 -1
cellular_component membrane-bounded organelle GO:0043227 8410 8413 0.986501111 0.998791 0.89009009 -1 1.001682659 0.352737 0.473873874 -1
biological_process cellular respiration GO:0045333 16452 85 0.809549323 0.998853 0.963963964 -1 0.726434936 0.999994 0.985585586 -1
biological_process biosynthetic process GO:0009058 12048 4489 0.977192045 0.999038 0.947747748 -1 0.994013429 0.79227 0.684684685 -1
biological_process protein folding GO:0006457 16380 157 0.857221844 0.999076 0.902702703 -1 0.881762975 0.995037 0.879279279 -1
biological_process respiratory electron transport chain GO:0022904 16500 37 0.696504711 0.999316 1 -1 0.577329149 0.999996 0.998198198 -1
biological_process nucleic acid metabolic process GO:0090304 12785 3752 0.973418846 0.999331 0.713513514 -1 1.016715929 0.0218752 0.277477477 0.127288
biological_process nucleoside biosynthetic process GO:0009163 16429 108 0.822061237 0.999345 0.953153153 -1 0.834128884 0.998631 0.857657658 -1
biological_process ribonucleoside biosynthetic process GO:0042455 16429 108 0.822061237 0.999345 0.953153153 -1 0.834128884 0.998631 0.857657658 -1
biological_process glycosyl compound biosynthetic process GO:1901659 16429 108 0.822061237 0.999345 0.953153153 -1 0.834128884 0.998631 0.857657658 -1
molecular_function electron carrier activity GO:0009055 16732 129 0.836475192 0.99938 0.947747748 -1 0.814878064 0.999872 0.947747748 -1
cellular_component intracellular organelle part GO:0044446 11625 5198 0.97841874 0.999407 0.927927928 -1 0.996776427 0.685914 0.581981982 -1
biological_process metabolic process GO:0008152 7858 8679 0.98611031 0.999428 0.951351351 -1 0.993046702 0.948277 0.809009009 -1
cellular_component organelle part GO:0044422 11536 5287 0.978584895 0.999438 0.936936937 -1 0.998587494 0.585149 0.551351351 -1
biological_process mitochondrion organization GO:0007005 16321 216 0.872107761 0.999476 0.926126126 -1 0.860910168 0.999818 0.848648649 -1
biological_process cofactor metabolic process GO:0051186 16315 222 0.873846263 0.999477 0.969369369 -1 0.870539644 0.999616 0.852252252 -1
cellular_component intracellular membrane-bounded organelle GO:0043231 8445 8378 0.985257356 0.999515 0.900900901 -1 1.001640308 0.356883 0.475675676 -1
molecular_function 4 iron, 4 sulfur cluster binding GO:0051539 16825 36 0.681882117 0.999533 0.985585586 -1 0.764612569 0.992836 0.886486486 -1
biological_process coenzyme metabolic process GO:0006732 16358 179 0.856023607 0.999603 0.983783784 -1 0.829249223 0.999965 0.936936937 -1
biological_process generation of precursor metabolites and energy GO:0006091 16248 289 0.8866304 0.999621 0.879279279 -1 0.835725133 0.999999 0.895495495 -1
cellular_component proton-transporting two-sector ATPase complex, proton-transporting domain GO:0033177 16793 30 0.642614072 0.999655 0.841441441 -1 0.620209558 0.999845 0.78018018 -1
biological_process protein localization to mitochondrion GO:0070585 16496 41 0.693895741 0.999662 0.990990991 -1 0.722972996 0.998952 0.882882883 -1
biological_process establishment of protein localization to mitochondrion GO:0072655 16497 40 0.68880383 0.999679 0.990990991 -1 0.701432364 0.999471 0.904504505 -1
biological_process intracellular protein transmembrane transport GO:0065002 16504 33 0.656950179 0.999683 0.996396396 -1 0.699665536 0.998612 0.854054054 -1
biological_process protein transmembrane transport GO:0071806 16504 33 0.656950179 0.999683 0.996396396 -1 0.699665536 0.998612 0.854054054 -1
biological_process DNA recombination GO:0006310 16352 185 0.85564406 0.999687 0.926126126 -1 0.978277682 0.696646 0.666666667 -1
cellular_component U12-type spliceosomal complex GO:0005689 16800 23 0.585979971 0.999711 0.962162162 -1 0.633794713 0.998833 0.877477477 -1
biological_process cellular macromolecule metabolic process GO:0044260 10608 5929 0.979224835 0.99973 0.828828829 -1 1.007678696 0.100623 0.261261261 0.262094
biological_process translational initiation GO:0006413 16469 68 0.757648004 0.999739 0.987387387 -1 0.87957616 0.957614 0.875675676 -1
biological_process ATP synthesis coupled electron transport GO:0042773 16514 23 0.579163481 0.999766 1 -1 0.449832446 0.999998 1 -1
cellular_component nucleolus GO:0005730 16225 598 0.918355304 0.999785 0.983783784 -1 0.966524691 0.92561 0.790990991 -1
molecular_function oxidoreductase activity, acting on NAD(P)H GO:0016651 16801 60 0.73734282 0.999792 0.882882883 -1 0.608919854 1 1 -1
biological_process intracellular protein transmembrane import GO:0044743 16505 32 0.639223154 0.999799 0.996396396 -1 0.678534265 0.999192 0.87027027 -1
molecular_function iron-sulfur cluster binding GO:0051536 16797 64 0.736621646 0.999872 0.987387387 -1 0.759346575 0.999583 0.915315315 -1
molecular_function metal cluster binding GO:0051540 16797 64 0.736621646 0.999872 0.987387387 -1 0.759346575 0.999583 0.915315315 -1
biological_process cell redox homeostasis GO:0045454 16477 60 0.727986448 0.999872 0.989189189 -1 0.920533545 0.85728 0.715315315 -1
molecular_function oxidoreductase activity GO:0016491 16160 701 0.921452246 0.999883 0.810810811 -1 0.886414083 1 1 -1
biological_process tRNA processing GO:0008033 16454 83 0.766243703 0.999891 0.992792793 -1 0.797970667 0.999304 0.917117117 -1
biological_process cellular metabolic process GO:0044237 8795 7742 0.982316238 0.999891 0.954954955 -1 0.994918867 0.855998 0.711711712 -1
cellular_component cytoplasmic part GO:0044444 11421 5402 0.975654475 0.999916 0.774774775 -1 0.965555799 1 1 -1
molecular_function translation initiation factor activity GO:0003743 16798 63 0.722560629 0.999934 0.965765766 -1 0.882441218 0.947305 0.812612613 -1
cellular_component organellar ribosome GO:0000313 16778 45 0.669673314 0.999939 0.832432432 -1 0.530150335 1 1 -1
cellular_component mitochondrial ribosome GO:0005761 16778 45 0.669673314 0.999939 0.832432432 -1 0.530150335 1 1 -1
biological_process mRNA metabolic process GO:0016071 16178 359 0.882824996 0.999949 0.940540541 -1 0.991065986 0.616609 0.598198198 -1
biological_process tRNA metabolic process GO:0006399 16410 127 0.799916568 0.999956 0.992792793 -1 0.846457116 0.998688 0.915315315 -1
cellular_component intracellular GO:0005622 5618 11205 0.987453274 0.999966 0.90990991 -1 0.994449084 0.960922 0.735135135 -1
biological_process oxidative phosphorylation GO:0006119 16505 32 0.591461779 0.999969 1 -1 0.60318482 0.99995 0.98018018 -1
biological_process DNA repair GO:0006281 16175 362 0.876323902 0.999981 0.965765766 -1 0.97089296 0.833994 0.711711712 -1
biological_process mitochondrial respiratory chain complex assembly GO:0033108 16516 21 0.476479992 0.999984 0.971171171 -1 0.560891929 0.999756 0.882882883 -1
molecular_function oxidoreductase activity, acting on a heme group of donors GO:0016675 16831 30 0.549978607 0.99999 0.90990991 -1 0.506899467 0.999999 0.879279279 -1
molecular_function heme-copper terminal oxidase activity GO:0015002 16830 31 0.55563796 0.999991 0.92972973 -1 0.521466811 0.999998 0.863063063 -1
cellular_component proton-transporting two-sector ATPase complex GO:0016469 16771 52 0.656889321 0.999991 0.900900901 -1 0.664973015 0.999986 0.8 -1
molecular_function translation factor activity, nucleic acid binding GO:0008135 16767 94 0.744050424 0.999992 0.992792793 -1 0.863036411 0.98946 0.845045045 -1
biological_process ribosomal small subunit biogenesis GO:0042274 16517 20 0.438536947 0.999993 0.89009009 -1 0.352280766 1 1 -1
molecular_function nucleic acid binding GO:0003676 13956 2905 0.957204898 0.999994 0.81981982 -1 1.005228665 0.295822 0.441441441 -1
molecular_function cytochrome-c oxidase activity GO:0004129 16832 29 0.529180417 0.999994 0.92972973 -1 0.504628154 0.999998 0.863063063 -1
molecular_function oxidoreductase activity, acting on a heme group of donors, oxygen as acceptor GO:0016676 16832 29 0.529180417 0.999994 0.92972973 -1 0.504628154 0.999998 0.863063063 -1
cellular_component proteasome complex GO:0000502 16755 68 0.689440875 0.999996 0.990990991 -1 0.737572422 0.999914 0.828828829 -1
molecular_function threonine-type endopeptidase activity GO:0004298 16838 23 0.459206227 0.999997 0.969369369 -1 0.470010048 0.999995 0.875675676 -1
molecular_function threonine-type peptidase activity GO:0070003 16838 23 0.459206227 0.999997 0.969369369 -1 0.470010048 0.999995 0.875675676 -1
cellular_component proton-transporting ATP synthase complex, coupling factor F(o) GO:0045263 16803 20 0.417290999 0.999997 0.920720721 -1 0.477110337 0.999975 0.809009009 -1
molecular_function oxidoreductase activity, acting on NAD(P)H, quinone or similar compound as acceptor GO:0016655 16830 31 0.519733575 0.999998 0.924324324 -1 0.360030993 1 1 -1
biological_process mRNA processing GO:0006397 16224 313 0.852039974 0.999998 0.981981982 -1 0.970199841 0.821751 0.688288288 -1
biological_process energy coupled proton transport, down electrochemical gradient GO:0015985 16514 23 0.450174216 0.999998 0.904504505 -1 0.486549062 0.99999 0.837837838 -1
biological_process ATP synthesis coupled proton transport GO:0015986 16514 23 0.450174216 0.999998 0.904504505 -1 0.486549062 0.99999 0.837837838 -1
cellular_component proteasome core complex GO:0005839 16802 21 0.424042978 0.999998 0.971171171 -1 0.436083607 0.999996 0.864864865 -1
molecular_function molecular_function GO:0003674 0 16861 1 1 1 -1 1 1 1 -1
molecular_function RNA binding GO:0003723 16075 786 0.860824669 1 1 -1 0.936609799 0.999191 0.805405405 -1
molecular_function structural constituent of ribosome GO:0003735 16634 227 0.465512251 1 1 -1 0.397087362 1 1 -1
molecular_function NADH dehydrogenase activity GO:0003954 16835 26 0.428063374 1 1 -1 0.328513116 1 1 -1
molecular_function structural molecule activity GO:0005198 16387 474 0.805506817 1 1 -1 0.755545496 1 1 -1
molecular_function NADH dehydrogenase (ubiquinone) activity GO:0008137 16835 26 0.428063374 1 1 -1 0.328513116 1 1 -1

molecular_function hydrogen ion transmembrane transporter activity GO:0015078 16764 97 0.698769228 1 1 -1 0.654056938 1 1 -1
molecular_function NADH dehydrogenase (quinone) activity GO:0050136 16835 26 0.428063374 1 1 -1 0.328513116 1 1 -1
biological_process rRNA processing GO:0006364 16433 104 0.681144521 1 1 -1 0.741452218 0.999998 0.924324324 -1
biological_process RNA processing GO:0006396 15995 542 0.812687691 1 1 -1 0.902178857 0.99997 0.830630631 -1
biological_process translation GO:0006412 16054 483 0.689474075 1 1 -1 0.710768976 1 1 -1
biological_process biological_process GO:0008150 0 16537 1 1 1 -1 1 1 1 -1
biological_process RNA splicing GO:0008380 16286 251 0.795765045 1 1 -1 0.895750007 0.99803 0.848648649 -1
biological_process gene expression GO:0010467 12690 3847 0.959191842 1 1 -1 0.992080108 0.834446 0.70990991 -1
biological_process rRNA metabolic process GO:0016072 16430 107 0.698685495 1 1 -1 0.759183015 0.999993 0.913513514 -1
biological_process ribonucleoprotein complex biogenesis GO:0022613 16326 211 0.764228422 1 1 -1 0.802451593 1 1 -1
biological_process electron transport chain GO:0022900 16419 118 0.660512856 1 1 -1 0.614662469 1 1 -1
biological_process ncRNA processing GO:0034470 16334 203 0.759632376 1 1 -1 0.816584549 0.999997 0.899099099 -1
biological_process ncRNA metabolic process GO:0034660 16276 261 0.788480466 1 1 -1 0.860192942 0.99996 0.87027027 -1
biological_process ribosome biogenesis GO:0042254 16373 164 0.709595778 1 1 -1 0.747630261 1 1 -1
cellular_component cellular_component GO:0005575 0 16823 1 1 1 -1 1 1 1 -1
cellular_component spliceosomal complex GO:0005681 16674 149 0.765857432 1 1 -1 0.902490376 0.980811 0.816216216 -1
cellular_component mitochondrion GO:0005739 15299 1524 0.85360386 1 1 -1 0.82965668 1 1 -1
cellular_component mitochondrial envelope GO:0005740 16310 513 0.796157222 1 1 -1 0.786190484 1 1 -1
cellular_component mitochondrial inner membrane GO:0005743 16482 341 0.728334303 1 1 -1 0.712043505 1 1 -1
cellular_component mitochondrial respiratory chain GO:0005746 16769 54 0.429087425 1 1 -1 0.377754205 1 1 -1
cellular_component mitochondrial respiratory chain complex I GO:0005747 16788 35 0.39387291 1 1 -1 0.317512568 1 1 -1
cellular_component mitochondrial proton-transporting ATP synthase complex GO:0005753 16801 22 0.396808885 1 1 -1 0.406556869 0.999999 0.868468468 -1
cellular_component mitochondrial matrix GO:0005759 16616 207 0.800306411 1 1 -1 0.769576198 1 1 -1
cellular_component ribosome GO:0005840 16548 275 0.509986009 1 1 -1 0.442312086 1 1 -1
cellular_component large ribosomal subunit GO:0015934 16760 63 0.509333124 1 1 -1 0.368617593 1 1 -1
cellular_component small ribosomal subunit GO:0015935 16754 69 0.473018441 1 1 -1 0.343427793 1 1 -1
cellular_component organelle inner membrane GO:0019866 16457 366 0.757761893 1 1 -1 0.745010131 1 1 -1
cellular_component cytosolic large ribosomal subunit GO:0022625 16791 32 0.397445827 1 1 -1 0.29076781 1 1 -1
cellular_component cytosolic ribosome GO:0022626 16751 72 0.408758211 1 1 -1 0.303117072 1 1 -1
cellular_component cytosolic small ribosomal subunit GO:0022627 16787 36 0.370103094 1 1 -1 0.263822987 1 1 -1
cellular_component ribonucleoprotein complex GO:0030529 16189 634 0.710462077 1 1 -1 0.745907929 1 1 -1
cellular_component NADH dehydrogenase complex GO:0030964 16788 35 0.39387291 1 1 -1 0.317512568 1 1 -1
cellular_component mitochondrial membrane GO:0031966 16337 486 0.800309708 1 1 -1 0.788160195 1 1 -1
cellular_component organelle envelope GO:0031967 16036 787 0.866565202 1 1 -1 0.877193215 1 1 -1
cellular_component envelope GO:0031975 16014 809 0.876294387 1 1 -1 0.887038947 1 1 -1
cellular_component macromolecular complex GO:0032991 13154 3669 0.956064396 1 1 -1 0.967449972 0.999944 0.776576577 -1
cellular_component ribosomal subunit GO:0044391 16693 130 0.489143977 1 1 -1 0.354213951 1 1 -1
cellular_component mitochondrial part GO:0044429 16158 665 0.800278586 1 1 -1 0.786771201 1 1 -1
cellular_component cytosolic part GO:0044445 16665 158 0.662574767 1 1 -1 0.632491898 1 1 -1
cellular_component mitochondrial membrane part GO:0044455 16686 137 0.591056369 1 1 -1 0.588840208 1 1 -1
cellular_component proton-transporting ATP synthase complex GO:0045259 16795 28 0.43723276 1 1 -1 0.473868368 0.999999 0.836036036 -1
cellular_component respiratory chain complex I GO:0045271 16788 35 0.39387291 1 1 -1 0.317512568 1 1 -1
cellular_component respiratory chain GO:0070469 16754 69 0.413601909 1 1 -1 0.376915169 1 1 -1