![Contested Monarchy: Integrating the Roman Empire in the Fourth Century AD, ed. Johannes Wienand, Oxford/New York: Oxford University Press 2015 [Oxford Studies in Late Antiquity]; ISBN](https://static.fdokumen.com/doc/165x107/631f7db1d10f1687490fd2fe/contested-monarchy-integrating-the-roman-empire-in-the-fourth-century-ad-ed-johannes.jpg)
humanities and social sciences - Oxford University Press
48
10 Leo Conti | Mark Easton | Joanne Wilson Geraldine Carrodus | Tim Delany | Annie Wilson oxford big ideas humanities and social sciences WESTERN AUSTRALIAN CURRICULUM SAMPLE
-
Upload
khangminh22 -
Category
Documents
-
view
3 -
download
0
Transcript of humanities and social sciences - Oxford University Press

109 780190 307721
ISBN 978-0-19-030772-1
Leo Conti | Mark Easton | Joanne WilsonGeraldine Carrodus | Tim Delany | Annie Wilson
hu
man
ities and
social sciences
oxford big ideasWA oxford
big ideashumanities and social sciencesWESTERN AUSTRALIAN CURRICULUM
10
visit us at: oup.com.au or contact customer service: [email protected]
SAMPLE

1Oxford University Press is a department of the University of Oxford. It furthers the University’s objective of excellence in research, scholarship, and education by publishing worldwide. Oxford is a registeredtrademark of Oxford University Press in the UK and in certain other countries.
Published in Australia by Oxford University Press253 Normanby Road, South Melbourne, Victoria 3205, Australia
© Leo Conti, Mark Easton, Joanne Wilson, Geraldine Carrodus, Tim Delany, Annie Wilson 2016
The moral rights of the author have been asserted
First published 2016
All rights reserved. No part of this publication may be reproduced, stored in a retrieval system, or transmitted, in any form or by any means, without the prior permission in writing of Oxford University Press, or as expressly permitted by law, by licence, or under terms agreed with the appropriate reprographics rights organisation. Enquiries concerning reproduction outside the scope of the above should be sent to the Rights Department, Oxford University Press, at the address above.
You must not circulate this work in any other form and you must impose this same condition on any acquirer.
National Library of Australia Cataloguing-in-Publication dataConti, Leo, authorHumanities and Social Sciences 10 Western Australian curriculum / Leo Conti, Mark Easton, Joanne Wilson, Geraldine Carrodus, Tim Delany, Annie Wilson.ISBN: 9780190307721 (paperback)Series: Oxford big ideas.Includes index.For secondary school age.Humanities--Textbooks.Humanities--Study and teaching (Secondary)—Western Australia.Education--Curricula—Western Australia.Easton, Mark, author.Wilson, Joanne, 1964–, author.Carrodus, Geraldine, author.Delany, Tim, author.Wilson, Annie, 1964–, author.
001.30712
Reproduction and communication for educational purposesThe Australian Copyright Act 1968 (the Act) allows a maximum of one chapter or 10% of the pages of this work, whichever is the greater, to be reproduced and/or communicated by any educational institution for its educational purposes provided that the educational institution (or the body that administers it) has given a remuneration notice to Copyright Agency Limited (CAL) under the Act.
For details of the CAL licence for educational institutions contact:
Copyright Agency Limited Level 15, 233 Castlereagh Street Sydney NSW 2000 Telephone: (02) 9394 7600 Facsimile: (02) 9394 7601 Email: [email protected]
Edited by Katharine Day and Ingrid de BaetsTypeset by Watershed DesignProofread by Jocelyn HargraveIndexed by Max McMasterPrinted by Sheck Wah Tong Printing Press Ltd
Disclaimer
Indigenous Australians and Torres Strait Islanders are advised that this publication may include images or names of people now deceased.
Links to third party websites are provided by Oxford in good faith and for information only. Oxford disclaims any responsibility for the materials contained in any third party website referenced in this work.
SAMPLE

contents
Contents by skill ...................................................................viii
Using Oxford Big Ideas Humanities and Social Sciences ........x
PART 1
GEOGRAPHY
Concepts and skills
Chapter 1 The geography toolkit.............................................................................. 4
1A What are the geographical concepts?
1.1 Geographical concepts .......................................................................6
1B What are the geographical skills?
1.2 Geographical skills ...........................................................................12
1.3 Questioning and researching ..........................................................13
1.4 Analysing ............................................................................................18
1.5 Evaluating ............................................................................................26
1.6 Communicating and reflecting .......................................................28
1C What is fieldwork?
1.7 Fieldwork in geography ....................................................................32
1D What are the career opportunities for geographers?
1.8 Careers in geography .......................................................................38
Environmental change and management
Chapter 2 Changing and managing the environment...............................40
2A What is environmental change?
2.1 Understanding environmental change .........................................42
2.2 Degrading the land ............................................................................44
2.3 Degrading the atmosphere .............................................................46
2.4 Degrading water ................................................................................48
2.5 Damming the rivers ..........................................................................50
2.6 Pollutants in our water ....................................................................52
2.7 The real cost of your mobile phone ..............................................54
2A Rich task: Return to Eden ...............................................................56
2B Why does environmental change pose a challenge for sustainability?
2.8 Our environment: the key to sustaining life .................................58
2.9 Challenges to sustainability ............................................................60
2.10 Loss of biodiversity ...........................................................................62
2.11 Pollution ...............................................................................................64
2.12 Climate change ..................................................................................66
2.13 Ecosystem decline: invasive species ............................................68
2B Rich task: Invasion of the cane toad ............................................70
2C How are we responding to environmental changes?
2.14 One world, many views ....................................................................72
2.15 Our ecological footprint ....................................................................74
2.16 Living water .........................................................................................76
2.17 Responding to salinity ......................................................................78
2.18 Responding to deforestation ..........................................................82
2C Rich task: Deforestation on Easter Island ...................................86
Chapter 3 Coastal change and management ...............................................88
3A How is the coastal environment changing?
3.1 Change in coastal environments ...................................................90
3.2 A dynamic balance ............................................................................92
3.3 Climate change and coasts ............................................................94
3.4 The impact of climate change on the Great Barrier Reef ........96
3.5 The impact of population growth on coasts ...............................98
3.6 Loss of coastal biodiversity ...........................................................100
3.7 Coastal and marine pollution ........................................................102
3A Rich task: Gulf of Mexico oil spill .................................................104
3B How can coastal changes be managed?
3.8 New ways of managing coasts ....................................................108
3.9 Change at Rainbow Beach ...........................................................110
3.10 Integrated Coastal Zone Management (ICZM) .........................112
3.11 ICZM in the Netherlands ................................................................114
3.12 Protecting the coast .......................................................................116
3.13 Reducing the impacts of coastal tourism ..................................118
3.14 Indigenous management of the coast........................................120
3B Rich task: Ningaloo Coast .............................................................122
SAMPLE

Geographies of human wellbeing
Chapter 4 An unequal world ..................................................................................124
4A How does wellbeing vary around the world?
4.1 Defining wellbeing............................................................................126
4.2 Different views of wellbeing ...........................................................128
4.3 Mapping wellbeing ..........................................................................130
4.4 Exploring links between wellbeing...............................................132
4.5 Contrasts in wealth .........................................................................134
4.6 Living in poverty ...............................................................................136
4.7 Contrasts in health ..........................................................................138
4.8 The Sub-Saharan HIV epidemic ..................................................140
4.9 Contrasts in education ...................................................................142
4A Rich task: Global obesity epidemic ...........................................144
4B How does wellbeing vary within countries?
4.10 Wellbeing in Bolivia ..........................................................................146
4.11 Wellbeing in Australia ......................................................................150
4.12 Wellbeing in Indigenous Australian communities .....................152
4B Rich task: Investigating wellbeing at the local scale ...............154
Chapter 5 Inequalities in human wellbeing ..................................................156
5A How does the natural environment cause inequality?
5.1 Why wellbeing varies ......................................................................158
5.2 Environmental factors and wellbeing ..........................................160
5.3 The influence of climate .................................................................162
5.4 The influence of climate change ..................................................164
5.5 The influence of natural resources on inequality ......................166
5.6 The influence of location on inequality .......................................168
5A Rich task: Prisoners of geography ..............................................170
5B How do human activities cause inequality?
5.7 Human factors and wellbeing .......................................................172
5.8 Changes in population structure..................................................174
5.9 Population growth and inequalities in wellbeing ......................176
5.10 Gender and inequalities in wellbeing ..........................................178
5.11 Technology and inequalities in wellbeing ...................................180
5.12 Politics and inequalities in wellbeing ...........................................182
5.13 Conflict and wellbeing ....................................................................184
5.14 The lasting impacts of conflict ......................................................186
5.15 War in Darfur .....................................................................................188
5.16 Conflict and refugees......................................................................190
5B Rich task: Demographic change in Japan ................................192
Chapter 6 Improving wellbeing .............................................................................194
6A How can we improve wellbeing?
6.1 Improving wellbeing ........................................................................196
6.2 Improving wellbeing for women and children ..........................198
6.3 Improving access to education ....................................................200
6.4 Improving wellbeing in Australia ...................................................202
6.5 Improving the wellbeing of Indigenous Australians .................204
6A Rich task: The wellbeing of refugees in Australia ....................206
6B Who is working to improve wellbeing?
6.6 Organisations working to improve wellbeing ............................208
6.7 IFAD: Helping to improve wellbeing in India ..............................210
6.8 The government and foreign aid ................................................212
6.9 The role of NGOs ...........................................................................214
6B Rich task: Charity ............................................................................216
SAMPLE

PART 2
HISTORY
Concepts and skills
Chapter 7 The history toolkit .................................................................................220
7A What are the historical concepts?
7.1 Historical concepts .........................................................................222
7B What are the historical skills?
7.2 Historical skills .................................................................................230
7.3 Questioning and researching ........................................................231
7.4 Analysing ...........................................................................................236
7.5 Evaluating ..........................................................................................239
7.6 Communicating and reflecting .....................................................240
7C What are the career opportunities for historians?
7.7 Careers in history .............................................................................244
Overview
Chapter 8 The modern world and Australia .................................................246
8A What factors shaped the modern world from 1918 to the present day?
8.1 Key features of the modern world from 1918 to the present day .....................................................................................................248
8.2 The aftermath of World War I ......................................................250
8.3 The Roaring Twenties ....................................................................252
8.4 The Great Depression ...................................................................254
8B What were the key events of World War II?
8.5 World War II .....................................................................................256
8.6 The significance of World War II .................................................260
Depth Study 1: Investigating World War II (1939–1945)
Chapter 9 World War II ...............................................................................................262
9A What were the causes of World War II and what course did it take?
9.1 World War II: a timeline .................................................................264
9.2 Causes of World War II .................................................................266
9.3 Significant individual: Adolf Hitler ................................................270
9.4 The course of the war in Europe .................................................272
9.5 The end of the war in Europe ......................................................276
9.6 The course of the war in Asia and the Pacific .........................278
9.7 Significant individuals: wartime leaders ....................................284
9A Rich task: The Kokoda campaign ...............................................286
9B What were some of the most significant events of World War II?
9.8 The Holocaust .................................................................................288
9.9 The atomic bombings ...................................................................294
9B Rich task: Antisemitism in Nazi Germany ..................................298
9C How did World War II affect the lives of Australians and Australia’s international relationships?
9.10 Australia’s commitment to the war ............................................300
9.11 Australian experiences of the war abroad ................................302
9.12 Life on the home front ...................................................................304
9.13 Indigenous Australians at war .....................................................310
9.14 Australia’s international relationships .........................................312
9C Rich task: Australian wartime propaganda posters ................316
Depth Study 2: Investigating rights and freedoms (1945–the present)
Chapter 10 Rights and freedoms ...........................................................................318
10A How have Indigenous peoples in Australia struggled for rights and freedoms?
10.1 Rights and freedoms: a timeline ..................................................320
10.2 Background to the struggle for Indigenous rights ...................322
10.3 Indigenous protests during the 19th and 20th centuries ......326
10.4 Significant individual: Jack Patten ...............................................328
10.5 Indigenous achievements and contributions during the 19th and 20th centuries .................................................................330
10.6 The Universal Declaration of Human Rights ............................332
10A Rich task: The Stolen Generations ..............................................334
10B How have African Americans and Indigenous peoples in Australia achieved change?
10.7 The US civil rights movement ......................................................336
10.8 Significant individual: Dr Martin Luther King Jnr .....................340
10.9 Australia’s civil rights movement .................................................342
10.10 Land rights: a continuing struggle ...............................................346
10.11 Towards reconciliation ...................................................................350
10B Rich task: Charles Perkins: a significant individual ..................352
10C How do activists continue the struggle for civil rights and freedoms?
10.12 Two speeches, two perspectives ...............................................354
10.13 The reconciliation movement ......................................................356
10C Rich task: The Yirrkala Bark petitions .......................................360
00_OBI_HUMS10_WA_07721_TXT_SI.indd 5 5/05/2017 3:27 PMLicensed to Teacher obook3, from Sample School until 2026-12-31.
SAMPLE

Part 3
Economics and business
Concepts and skills
Chapter 11 The economics and business toolkit ........................................364
11A What are economics and business concepts?
11.1 Economics and business concepts ...........................................366
11B What are economics and business skills?
11.2 Economics and business skills ...................................................370
11.3 Questioning and research .............................................................371
11.4 Analysing ...........................................................................................373
11.5 Evaluating ..........................................................................................374
11.6 Communicating and reflecting ....................................................375
11C What career opportunities are there in economics and business?
11.7 Careers in economics and business ...........................................376
Economic performance and living standards
Chapter 12 Measuring Australia’s economic performance ..................378
12A How is the performance of the Australian economy measured?
12.1 Measuring growth in the Australian economy – GDP .............380
12.2 Measuring price changes in the Australian economy – inflation ......................................................................................... 382
12.3 Measuring participation in the Australian economy – the unemployment rate 384
12A Rich task: Youth unemployment ..................................................386
12B How well does the Australia economy perform compared with other economies around the world?
12.4 Australia’s economic scorecard ..................................................388
12.5 Productivity .......................................................................................390
12B Rich task: The story behind our economic growth .................394
Chapter 13 Living standards .....................................................................................396
13A Why do living standards vary around the world?
13.1 Defining and measuring living standards ..................................398
13.2 Factors that affect a country’s living standard .........................400
13.3 Factors that influence major consumer and financial decisions ............................................................................................402
13A Rich task: Poverty in Australia ......................................................404
13B What is the connection between economic performance and living standards?
13.4 Policies to improve living standards ............................................406
13.5 Governments manage living standards .....................................412
13B Rich task: Climate change and living standards ......................416
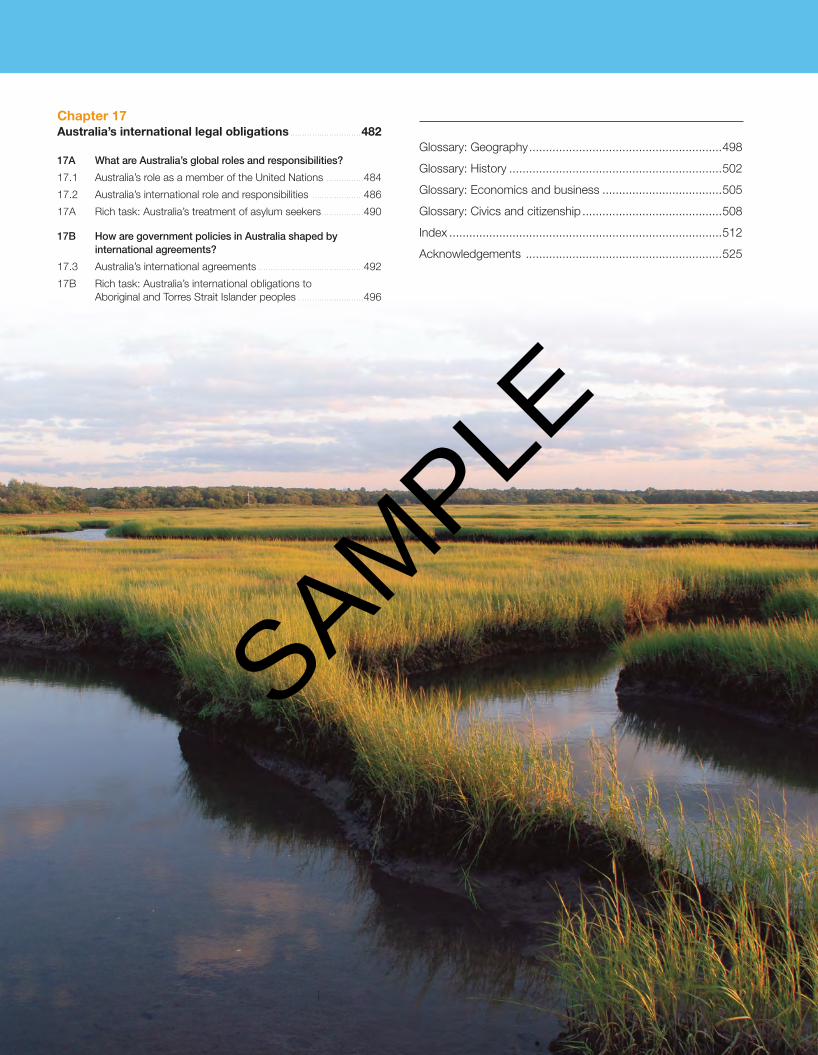
Chapter 17Australia’s international legal obligations .............................482
17A What are Australia’s global roles and responsibilities?
17.1 Australia’s role as a member of the United Nations ...............484
17.2 Australia’s international role and responsibilities .....................486
17A Rich task: Australia’s treatment of asylum seekers.................490
17B How are government policies in Australia shaped byinternational agreements?
17.3 Australia’s international agreements ...........................................492
17B Rich task: Australia’s international obligations to Aboriginal and Torres Strait Islander peoples ...........................496
Part 4
Civics and citizenship
Concepts and skills
Chapter 14 The civics and citizenship toolkit ................................................420
14A What are civics and citizenship concepts?
14.1 Civics and citizenship concepts .................................................422
14B What are civics and citizenship skills?
14.2 Civics and citizenship skills ..........................................................426
14.3 Questioning and research ............................................................427
14.4 Analysing ..........................................................................................429
14.5 Evaluating .........................................................................................431
14.6 Communicating and reflecting .....................................................432
14C What career opportunities are there within the field of civics and citizenship?
14.7 Careers in civics and citizenship ..................................................434
Justice at home and overseas
Chapter 15 Australia’s democracy and the global context ..................436
15A What are the key features of Australia’s democracy?
15.1 Key features of Australia’s system of government .................438
15.2 Principles of Australia’s system of government ......................440
15.3 Australia’s Commonwealth Parliament .......................................444
15.4 Comparing systems of government in Australia and Indonesia ..................................................................................450
15A Rich task: Should our government limit free speech?............454
15B What are the features of a resilient democracy and a cohesive society?
15.5 Safeguards to Australia’s democratic society ..........................456
15.6 Threats to Australia’s democratic society .................................458
15B Rich task: Maintaining Australia’s democratic and cohesive society ..............................................................................462
Chapter 16 The Australian Constitution and the High Court ...............466
16A How does the Australian Constitution work?
16.1 The Australian Constitution – an introduction .........................468
16.2 How the Australian Constitution works .....................................470
16A Rich task: Constitutional recognition of Indigenous Australians .........................................................................................474
16B What role does the High Court of Australia play in interpreting the Constitution?
16.3 The Australian Constitution and the High Court ......................476
16B Rich task: Freedom of ‘hate speech’ .........................................480
00_OBI_HUMS10_WA_07721_TXT_SI.indd 6 5/05/2017 3:30 PMLicensed to Teacher obook3, from Sample School until 2026-12-31.
SAMPLE
Chapter 17Australia’s international legal obligations .............................482
17A What are Australia’s global roles and responsibilities?
17.1 Australia’s role as a member of the United Nations ...............484
17.2 Australia’s international role and responsibilities .....................486
17A Rich task: Australia’s treatment of asylum seekers .................490
17B How are government policies in Australia shaped by international agreements?
17.3 Australia’s international agreements ...........................................492
17B Rich task: Australia’s international obligations to Aboriginal and Torres Strait Islander peoples ...........................496
Glossary: Geography ..........................................................498
Glossary: History ................................................................502
Glossary: Economics and business ....................................505
Glossary: Civics and citizenship ..........................................508
Index ..................................................................................512
Acknowledgements ...........................................................525
00_OBI_HUMS10_WA_07721_TXT_SI.indd 7 5/05/2017 4:44 PMLicensed to Teacher obook3, from Sample School until 2026-12-31.
SAMPLE

Geography skills
contents by skill
History skills
Skill Chapter Page
Generating questions to inform a historical inquiry
Chapter 7 231
Analysing propaganda posters Chapter 7 237
Creating a timeline Chapter 7 240
Writing a historical discussion Chapter 9 286
Evaluating the reliability and usefulness of sources
Chapter 9 298
Analysing propaganda posters Chapter 9 316
Identify and analyse the perspectives of people from the past
Chapter 10 335
Create and deliver an audiovisual presentation
Chapter 10 352
Generate different kinds of questions about the past to inform historical inquiry
Chapter 10 361
Skill Chapter Page
Developing geographical questions Chapter 1 14
Evaluating the reliability of websites Chapter 1 18
Planning, creating and delivering a PowerPoint presentation
Chapter 1 28
Constructing overlay maps from satellite images
Chapter 2 56
Using a topographic map to explore environmental change
Chapter 2 70
Using satellite images to analyse environmental change
Chapter 2 83
Interpreting topographic maps Chapter 2 86
Analysing environmental accidents using complex maps
Chapter 3 104
Analysing complex maps Chapter 3 122
Constructing scatter plots using Microsoft Excel
Chapter 4 133
Developing geographical questions from media reports
Chapter 4 144
Creating multiple-line graphs Chapter 4 149
Collecting and mapping census data Chapter 4 154
Calculating a wellbeing index Chapter 5 170
Constructing a population pyramid Chapter 5 175
Constructing multiple-line graphs Chapter 5 193
Constructing an infographic Chapter 6 206
Creating proportional circles maps Chapter 6 216
viii oxford big ideas humanities and social sciences 10 western australian curriculum
SAMPLE

Economics and business skills
Skill Chapter Page
Developing a hypothesis Chapter 11 371
Formulating questions about an economic issue
Chapter 12 387
Preparing an infographic Chapter 12 395
Identifying causes and effects in economics
Chapter 13 405
Presenting an oral report to an audience Chapter 13 417
Civics and citizenship skills
Skill Chapter Page
Developing civics and citizenship questions
Chapter 14 427
Identify and describe points of view, attitudes and values in sources
Chapter 14 429
Evaluating and comparing information Chapter 15 455
Creating an online survey Chapter 15 464
Gathering and assessing the reliability of information
Chapter 16 474
Creating a timeline Chapter 16 481
Recognising and considering multiple perspectives
Chapter 17 491
Creating and delivering an audiovisual presentation
Chapter 17 497
ixcontents by skill
SAMPLE

x oxford big ideas humanities and social sciences 10 western australian curriculum
The Great War (as World War I is also known) left many countries across Europe devastated. Many historians regard it as the first ‘total war’, meaning that nations dedicated all available resources (both military and civilian) to the war effort and suffered casualties at a level never experienced before. Over 8 million soldiers and sailors lost their lives during the war and a similar number of civilians died as a result of fighting, starvation and disease. A further 21 million people were wounded. Almost immediately after the end of the war was declared in 1918, the world was hit by a deadly flu pandemic (called the Spanish influenza). The pandemic lasted for about a year and resulted in the deaths of over 30 million people, most of them between 20 and 40 years of age.
The Treaty of VersaillesIn January 1919, the victorious nations of World War I met at the Paris Peace Conference in France to come up with a plan for rebuilding Europe and ensuring ongoing peace in the future. The leaders of 32 countries attended the conference, but negotiations were dominated by the leaders of four major powers:
• Prime Minister David Lloyd George of Britain• Prime Minister Georges Clemenceau of France• President Woodrow Wilson of the USA• Prime Minister Vittorio Orlando of Italy.The French had suffered greatly during World War I, and wanted revenge and compensation for the damage done to their country. Clemenceau wanted to weaken Germany so it would never be able to take up arms again. President Wilson, on the other hand, wanted to achieve lasting peace with a treaty that punished Germany, but not so harshly that they would one day want their own revenge.
Remember and understand1 The Treaty of Versailles was signed on 28 June 1919.a Summarise the restrictions placed on Germany by the Treaty of Versailles in terms of territory, the military and finance.
b Why did the German people oppose many of the terms outlined in the treaty?c If so many Germans opposed the treaty, why did German representatives at the Paris Peace Conference sign it?2 Summarise the different positions taken by the French Prime Minister and the US President at the Paris Peace Conference with regards to how Germany should be treated.3 What was the League of Nations and why was it created?Apply and analyse
4 Examine Source 3 and complete the following tasks.a Name the three men shown in the cartoon. Why has the cartoonist chosen to show one man more prominently than the others?b Who is the child supposed to represent?c Why do you think the child is shown naked?d What comment is the cartoonist making in this source?
Check your learning 8.2
Source 1 French Prime Minister Georges Clemenceau (left), American President Woodrow Wilson (centre) and British Prime Minister David Lloyd George (right) greet the crowd after signing the Treaty of Versailles on 28 June 1919
Source 3 This cartoon, by Australian political cartoonist Will Dyson, was published in 1920. It is highly critical of the harsh terms of the Treaty of Versailles. It shows the French Prime Minister Georges Clemenceau (together with Woodrow Wilson and David Lloyd George) leaving the Paris Peace Conference. Clemenceau, known as ‘The Tiger’, says ‘Curious! I seem to hear a child weeping’. The child shown represents the ‘1940 class’ – the German children of the 1920s who will become ‘cannon fodder’ (soldiers likely to die) by 1940 when the next war starts.
The terms of the Treaty of VersaillesAs part of the Treaty of Versailles, Germany was required to surrender large sections of its territory (see Source 2) and all of its overseas colonies (including the former German New Guinea which was given to Australia).Under the terms of the Treaty of Versailles, Germany was required to limit its army to 100 000 men who were mostly volunteers. It was also prohibited from possessing an air force, tanks, submarines or heavy artillery. Germany was required to accept full responsibility for starting the war and forced to pay reparations (compensation) to the Allies. It was agreed that Germany should pay an amount close to £7 billion British pounds (the current equivalent of around $526 billion Australian dollars).Germany’s allies in the war were also punished by the treaty. For example, Austria–Hungary was also required to pay reparations to the Allies, and the empire was broken up. The borders of Austria and Hungary were redrawn and the territory lost was used to create the new nations of Czechoslovakia and Yugoslavia.
GERMANY: TERRITORIAL LOSSES AFTER THE SIGNING OF THE TREATY OF VERSAILLES, 1919
Prague
Dresden
Warsaw
Koenigsberg
Bialystok
Kovno
Vienna
Berlin
Leipzig
Hannover
Given toBelgium
Given to Poland
Given toDenmark
Given toCzechoslovakia
Given toLithuaniaGERMANY 1933
BOUNDARY
Bremen
Munich
Krakow
Lublin
Lodz
Lvov
North
Sea
Balt ic Sea
AUSTRIA
GERMANY
SAAR
HUNGARY
POLAND
CZECHOSLOVAKIA
NETHERLANDS
DENMARK SWEDEN
BELGIUM
LITHUANIA
SWITZERLAND
FRANCE
ITALY
EASTPRUSSIA
DANZIG
200 km0
N
German territory lost
German territory
City
L E G E N D
Source 2 Source: Oxford University Press
Establishment of the League of NationsThe League of Nations was an international organisation formed at the Paris Peace Conference in 1919 to maintain world peace and prevent the outbreak of future wars by encouraging nations to negotiate with each other rather than engage in military conflicts. To help ensure its success, the League of Nations had the power to order countries in conflict to discuss their differences at an assembly of member countries. At these hearings, aggressors could be warned, punished with economic sanctions or threatened with military action. Forty-two countries (including Australia) joined the League of Nations. At its peak in 1935, there were 58 member countries. Although the idea for the League of Nations had been suggested by US President Wilson, the USA did not join the League. This was largely due to the reluctance of the American people to get involved in European affairs. Although the League of Nations had some early successes, it ultimately failed in its principal mission of preventing the outbreak of future wars.
8.2 The aftermath of World War I
After months of negotiations, the Treaty of Versailles was signed on 28 June 1919. While large sections of the German public were opposed to the terms of the treaty, German representatives at the negotiations knew that if they did not sign, Allied troops would invade Germany. With Germany’s army in ruins, Germany would be powerless to stop them.
251
250
8A What events defined the years between World War I and World War II?
chapter 8 Introduction to Australia at war
oxford big ideas humanities and social sciences 10 western australian curriculum
chapter 4 an unequal worldoxford big ideas humanities and social sciences 10 western australian curriculum
4B How does wellbeing vary within countries?1 What variations in living standards can you identify
between those living in the favela and those living in the apartment block?
2 Why do you think these variations exist in such a small area?
Source 1 An apartment building with a pool and tennis court shares a fence with one of São Paulo’s largest favelas (a shanty town or slum), Paraisópolis (meaning ‘Paradise City’), home to about 100 000 people. This scene starkly illustrates the inequalities in wellbeing worldwide.
4A How does wellbeing vary around the world?1 Compare the standards of housing that you
can see in the Paraisópolis favela with housing standards in the region where you live. What are the similarities and differences?
4chapterGeographies of human wellbeing
An unequal worldThe city of São Paulo in Brazil is home to more than 11 million people. Like many cities around the world today, there are huge differences between the way people in some parts of the city live compared with others. The access they have to food and fresh water, the types of houses in which they live, their levels of education, access to health care and levels of employment vary enormously. Geographers are interested in measuring these variations and exploring the reasons why they exist. Studying the links between all of these factors gives geographers an idea of the level of wellbeing in different populations. Wellbeing is an overall measure of the ability of human beings to access the things they need in order to live happy and healthy lives.
In this chapter we will explore some of the reasons why these enormous variations in wellbeing exist in different populations around the world and look at some of the many ways in which geographers measure them.
124 125
oxford big ideas humanities and social sciences 10 western australian curriculum
44.7
90.6%
76
15.7%
58%
ACT
39.0
91.1%
36
17.3%
70%
Vic
47.9
89.7%
47
19%
74%
NSW
67.5
90.3%
29
21.6%
66%
QLD
39.5
87.0%
38
20.2%
71%
SA
49.2
86.0%
29
17.3%
59%
WA
48.8
89.6%
36
19.1%
68%
National
34.6
88.1%
33
21.1%
52%
NT
49.4
90.0%
38
24.3%
59%
TAS
Incidence rate of melanoma per 100 000 population
Adult daily smoking rate
Proportion of childrenimmunised
Median elective surgery waiting time
Proportion of emergency department patients seen on time
LEGEND Comparison tonational result
Higher
Lower
Significantly higher
Significantly lower
Equal
Source 2 A RHEF film-making team
Remember and understand1 In what ways do people in rural areas have lower
levels of wellbeing than people in urban areas?
2 What did the Rural Health Education Foundation do to help reduce these inequalities?
Apply and analyse3 Examine Source 1.
a List the seven statistics that are significantly lower or higher than the national average.
b Describe the results of this survey for your home state or territory.
Evaluate and create4 Rank the states and territories of Australia from
those that performed best in the health survey in Source 1 to those that performed worst.
5 One of the difficulties for governments in reducing inequalities in wellbeing is being able to evaluate the effectiveness of individual programs. How could the effectiveness of the RHEF TV channel be evaluated?
6 Access RHEF online via YouTube and list the programs available on the Rural Health Channel. Watch one of the programs available online and write a brief review, outlining how useful you think it would be for the target audience.
Check your learning 6.4
6.4 Improving wellbeing in Australia
Australia has one of the highest levels of wellbeing in the world. In the 2013 United Nations Human Development Report, Australia was ranked as having the second highest HDI in the world behind Norway. Australians can expect to go to school for longer and to live longer, healthier lives than virtually any other nationality. While data such as this is welcome news regarding our position in the world, it can hide the inequalities that exist within our nation.
There are significant variations in wellbeing, for example, between rural and urban Australia and between Indigenous and non-Indigenous Australians. A number of government and non-government groups are working to reduce these variations.
Inequalities in healthStudies show that there are significant differences in the health of different groups of Australians. People from poorer households are less likely to be physically active, to visit a dentist or medical specialist, or to have a medical test such as a skin cancer check or mammogram to detect breast cancer. They are more likely to smoke and to be obese or overweight. As well as inequalities due to income, studies have also found health inequalities relating to location, ethnicity and age. Source 1 shows some of the health inequalities that exist between Australia’s states and territories.
Inequalities in educationThere are similar trends in education to those exhibited in health areas. Children from poorer households are less likely to attend early childhood education and less likely to go to university than children from wealthier
households. They also have less access to information technology such as broadband Internet, particularly in rural and remote regions. Students in rural areas generally have a more restricted choice of subjects to study and are less likely to finish high school.
The rural–urban divideIn many areas of wellbeing in Australia there is a rural–urban divide. There are fewer education and employment opportunities in rural areas and less access to health services and medical care. People in rural areas are more likely to suffer from chronic health conditions such as diabetes and heart disease and die earlier than those living in towns and cities. They are also at a higher risk of injury from work and car accidents.
Reducing inequalityGovernments have tried to reduce these inequalities in wellbeing in Australia in two main ways:
• targeted programs that focus on a particular problemor issue, such as campaigns to reduce smoking or toencourage people to have health checks.
• general programs to maintain and lift the wellbeing of the entire community, such as the National DisabilityInsurance Scheme and Medicare which ensure peoplecan access care regardless of their financial situation.
Case study: Rural Health Education FoundationMany people work in a range of fields to improve wellbeing in Australia. One of these groups was the non-profit organisation the Rural Health Education Foundation (RHEF). In a similar way to the RoyalFlying Doctor Service, the RHEF aimed to use modern technology to reduce the gap between rural and urban health.
The mission of the RHEF was to ‘improve the health outcomes of people in remote and rural Australia by providing quality accessible health education to health professionals and their communities’. The foundation,which was funded by government and private donations, produced and broadcast health education programs on its own free-to-air digital TV network called the Rural Health Channel, which could be accessed by 250 000 households across Australia.
Programs covered a wide range of topics of importance to people living in remote and rural regions such as Indigenous eye disease, tropical diseases and farming health hazards. Doctors and other health
professionals could access the programs easily and therefore stay up to date with current advances in medicine.
The RHEF ceased operating in 2014 due to the withdrawal of government funding. All RHEF-produced programs are available as podcasts, on DVD and online.
Source 1 Health inequalities between states in Australia.
203chapter 6 improving wellbeing202
6A How can we improve wellbeing?
Source materials – such asphotographs, technical illustrations, infographics, cartoons, and graphs – simplify difficult concepts and engage reluctant learners.
The learning sequence in each chapter is clearly set out under key inquiry questions. Students are encouraged to use their prior knowledge and make predictions at the start of each new topic.
Oxford Big Ideas Humanities and Social Sciences is a brand-new series developed and written to provide complete coverage of the Western Australian Curriculum: Humanities and Social Sciences – Geography, History, Economics and Business, and Civics and Citizenship – across Years 7–10.
Oxford Big Ideas Humanities and Social Sciences
Stunning full-colour photography generates discussion and interest
Focus on inquiryEach chapter of Oxford Big Ideas Humanities and Social Sciences is structured around key inquiry questions from the Western Australian Curriculum. Each unit of the text supports teachers and students as they adopt an inquiry-based approach to the key learning areas in the humanities and social sciences.
Focus on engagementEach unit of the Student book combines a range of engaging source materials – such as photographs, videos, data tables, graphs and illustrations – withsupporting questions and activities.
Using
Check your learning activities accompany every unit, allowing students to consolidate and extend their understanding. These are graded according to Bloom’s Taxonomy – catering for a range of abilities and learning styles.
SAMPLE

xiusing oxford big ideas humanities and social sciences western australian curriculum
Focus on concepts and skillsComplete coverage of all concepts and skills provided in stand-alone reference ‘Toolkits’. All of these concepts and skills are also integrated throughout the text so students can see them at work in context.
Integrated digital support
Student obook assess provides a fully interactive electronic version of the print Student book in an easy-to-read format. A host of additional resources for students – such as videos, worksheets, interactives objects, online quizzes and multimedia links – are linked to each unit in the book making easier to access than ever before.
obook assess is compatible with laptops, iPads, tablets and IWBs and access to content is provided online and offline.
Teacher support is offered in digital format via Teacher obook assess. Teacher notes, answers, tests, additional worksheets, lesson ideas, planning tips, assessment advice and is provided for every unit. Teacher obook assess allows teachers to manage their classes by assigning work, tracking progress and planning assessment
Rich task activities encourage students to apply the knowledge and skills they have learned in each chapter to a new and interesting case study, event or issue.
Extend your understanding activities challenge students to conduct further research, or complete group work, to deepen their understanding of an issue or skill being investigated.
Skill drill activities guide and support students step by step as they learn and apply key skills.
Complete coverage of all concepts and skills is provided for all four Humanities subjects. These can be used as introductory units of work or stand-alone reference and revision sections throughout the year.
© 2015 Oxford University Press Australia & New Zealand Terms of Use Privacy policy
Chapter 8Ancient Egypt
Resources
Pages 236–237
8.4 Key groups inEgyptian society
Go to page...
Begin Topic
11 Ancient Greece
12 Ancient Rome
Depth study 2: Investigating
one ancient society
Chapter 8 Ancient Egypt
Part 2: History
8.4 Compare female rulers
Worksheet
8.4 Compare female
rulers Answers
Worksheet
ws ws
8.4 Teacher notes
Teacher notes
tn
8.4 Answers
Answers
a
8A How did geography
influence the development of
ancient Egypt?
8B What shaped the roles of
key groups in ancient Egypt?
8.4 Key groups inEgyptian society
8.5 Pharaohs
8.6 Significant individual:
Tutankhamun
8.7 Other key groups in ancient
Egyptian society
8B Rich task: Farming in
ancient Egypt
8C How did beliefs, values and
practices influence ancient
Egyptian lifestyles?
8B What shaped the roles of key groups in ancient Egypt?
8.4 Key groups in
Egyptian society
Remember and understand
1 Place these social roles in order (from most
to least important) according to the values of
ancient Egyptian society: potter, merchant,
pharaoh, farmer, priestess, vizier, scribe.
2 How might a farmer’s social role and standing
potentially change if he learnt to read and write?
3 Explain why almost all scribes in ancient Egypt
were men.
Apply and analyse
4 Compare and contrast the roles of a chief priest
and the vizier in ancient Egypt.
Evaluate and create
5 a In groups, use Source 2 as a guide to help
you draw up what you think the social
hierarchy in Australia today might look like.
b Discuss your � ndings as a class. Decide to
what extent your modern social hierarchies
are an example of continuity and change
when compared with the social hierarchy of
ancient Egypt.
Check your learning 8.4
Source 1 A stone head of pharaoh
Amenhotep III, made in the early
14th century BCE. Pharaohs were at the top
of the social hierarchy in ancient Egypt.
The society of ancient Egypt was well organised.
Ancient Egyptians had a central government
and, from the 15th century BCE, they also had a
professional army. People knew what their social
responsibilities were. Some of these roles were shaped
by the society’s laws and traditions. Some were
determined by religious beliefs. Other roles were
determined by a person’s wealth and abilities (such as
whether they could read and write).
The society of ancient Egypt was a hierarchy. At
the top was the royal family: the pharaoh and his
family. At the bottom were the slaves and the poorest
of the poor farmers.
Men usually did the jobs their fathers did. They
learnt the skills a bit like apprentices learn trades
today. Education was the key to improving a person’s
position in society. A merchant, or even a farmer,
could do this by learning to read and write.
236 oxford big ideas humanities and social sciences 7 western australian curriculum
Depth Study 1: Investigating
the ancient past
Big Ideas Humanities and Social Sciences 7 Western Australian Curriculum
BOOK RESOURCES ASSESSMENTS
Library Classes Help
ASSIGNED WORK SEARCH...
Teacher
NOTES
oxforddigital.com.au
OXFORDDIGITAL.COM.AU DASHBOARD
Large Desktop 1440 x 900
Fold
Fold
Overview Concepts and skills
Part 1: GeographySAMPLE

3B How can coastal changes be managed?1 In Source 1, what evidence can you see of
management strategies to control or limit human activities that may have a negative impact on the natural environment?
2 Brainstorm further strategies that could be put in place to protect this coast. Why do you think these have not been used in this environment?
3A How is the coastal environment changing?1 As a class, discuss the ways in which human
activities have impacted on the coastal landscape shown in Source 1.
2 How would a 2-metre rise in sea level affect this coast?
Environmental change and management
Coastal change and managementCoasts are areas where the land meets the sea. Home to more than one billion people around the world, coastal areas are some of the most visited and heavily populated areas on the planet. Human activities in coastal areas have affected many of the natural environmental processes there. This has led to a wide range of issues including a loss of biodiversity, high levels of pollution, erosion, and rising sea levels due to climate change. In fact, coasts are one of the Earth’s most threatened environments.
Coasts are critically important – not only to the people who live along them, but also to the health of the planet. Around the world, geographers are playing a vital role in developing strategies to manage these problems and protect coasts for future generations.
88 oxford big ideas humanities and social sciences 10 western australian curriculum
SAMPLE

Source 1 Welcome to Hong Kong, China – one of the most densely populated coastal cities on Earth. Changes brought about by human activities in coastal areas like Hong Kong need to be carefully managed in order to protect the environment for future generations.
3chapter
89chapter 3 coastal change and management
SAMPLE

Sea levels are rising as a result of climate change. This increases coastal erosion particularly during storms and
reduces habitat for coastal plants and animals.
Warmer waters means that �sh that thrive in cooler waters move away from their usual habitats. This can cause the
starvation of other animals and birds and the death of coral.
Pollution from inland sources such as farms, cities and industries
is carried to coastal estuaries and river mouths by rivers.
Desalination plants change the salinity of water in the local area.
Declining fresh water �ows in rivers due to water extraction for farming
and urban users impacts on coastal lagoons and estuaries.
Increasing populations, particularly in coastal areas, bring widespread and
signi�cant change to the coastal environment. Examples include
building marinas, harbours, ports and breakwaters.
Land is often reclaimed from the sea in areas where
�at land is in short supply.
Over�shing of certain species bycommercial trawlers destroys
natural ecosystems.
Harbours are dredged to allow larger ships to reach ports.
Coastal visitors may impact on the coast, with activities such as snorkelling and scuba diving.
Flat, fertile land near the coast is often intensively farmed.
Invasive species from both the land and the sea impact on coastal
ecosystems. Ballast water carried in ships can transport invasive
species around the world.
3.1 Change in coastal environments
Source 1 Some common examples of coastal degradation
Coasts are very dynamic places – they are constantly changing. Crashing waves, strong currents, tidal waters and hazards (such as storms and tsunamis) all transform coastal environments. People, too, bring about many changes to these environments. From simple activities, such as walking across a sand dune, to complex study activities, such as the construction of shipping ports and sea walls, humans have serious effects on coastal areas. In many cases, these activities are responsible for coastal degradation.
Coastal degradation can be observed on many scales. It may be local, like when litter is dropped on a popular holiday beach, or regional, like when an oil spill washes ashore along hundreds of kilometres of coastline. The effects of coastal degradation are varied, and can include the loss of plant and animal species, or the arrival of an invasive species that permanently affects biodiversity in the area. Examples of coastal degradation can include sand dunes being washed into the sea, changing the
90 oxford big ideas humanities and social sciences 10 western australian curriculum
SAMPLE

Sea levels are rising as a result of climate change. This increases coastal erosion particularly during storms and
reduces habitat for coastal plants and animals.
Warmer waters means that �sh that thrive in cooler waters move away from their usual habitats. This can cause the
starvation of other animals and birds and the death of coral.
Pollution from inland sources such as farms, cities and industries
is carried to coastal estuaries and river mouths by rivers.
Desalination plants change the salinity of water in the local area.
Declining fresh water �ows in rivers due to water extraction for farming
and urban users impacts on coastal lagoons and estuaries.
Increasing populations, particularly in coastal areas, bring widespread and
signi�cant change to the coastal environment. Examples include
building marinas, harbours, ports and breakwaters.
Land is often reclaimed from the sea in areas where
�at land is in short supply.
Over�shing of certain species bycommercial trawlers destroys
natural ecosystems.
Harbours are dredged to allow larger ships to reach ports.
Coastal visitors may impact on the coast, with activities such as snorkelling and scuba diving.
Flat, fertile land near the coast is often intensively farmed.
Invasive species from both the land and the sea impact on coastal
ecosystems. Ballast water carried in ships can transport invasive
species around the world.
Remember and understand1 What are some of the changes
currently impacting on coastal environments?
2 Are coastal environments close to cities more at risk from degradation than those in remote areas? Give some reasons for your answer.
Apply and analyse3 The three main drivers of environmental
degradation are climate change, population growth and economic growth. Examine Source 1.a Classify each of the causes
of coastal degradation shown according to one of these three drivers.
b Are there any changes that could not be classified in this way?
c Which of the three drivers appears to be responsible for most of the changes shown?
d Classify each of the changes shown according to whether they are taking place on the local, regional, national, international or global scale.
4 Use the geographical concept of interconnection to describe the links between changes on the land and changes at the coast.
Evaluate and create5 Select one of the causes of coastal
degradation shown in Source 1. Suggest a solution for the problems this creates.
Check your learning 3.1coastline, or blooms of toxic algae damaging the marine environment. Source 1 provides an overview of some common forms of coastal degradation.
Over the course of this chapter we will be exploring some of the changes that are having the greatest impact on coastal environments. These include climate change, population growth in coastal areas, the loss of coastal biodiversity and marine pollution.
91chapter 3 coastal change and management
3A How is the coastal environment changing?
SAMPLE
wind erodes sand from dune
forming blow-outs
rivers bring silt, mudand sand, especiallyduring �oods
management bodies replenish the beach
mining removes sandfrom the beach
longshore drift transportssand away from the beach
sand is lost through rips,especially during storms
cliff erosion
loose rock
sand is deposited intobays and estuaries
constructivewavesdestructive
wavesrip current
longshoredrift current
longshore drift transportssand onto beach from
another part of the coast
waves erodedunes during
storms
sand
3.2 A dynamic balance
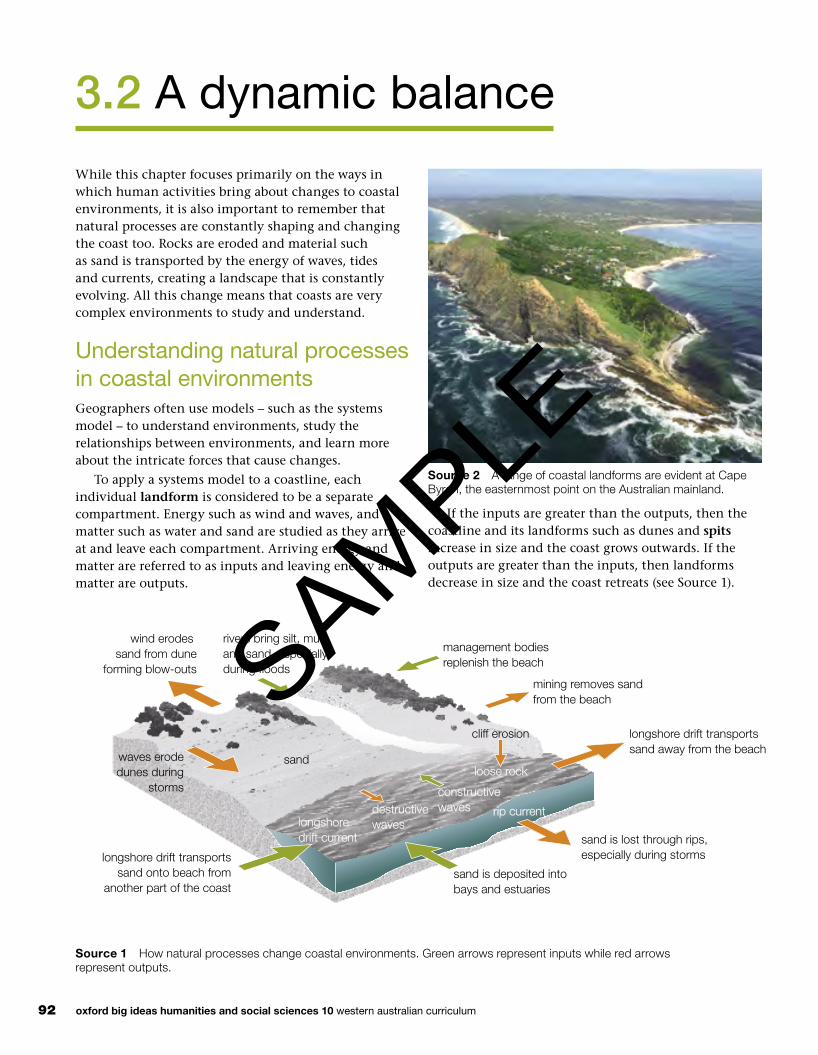
Source 2 A range of coastal landforms are evident at Cape Byron, the easternmost point on the Australian mainland.
Source 1 How natural processes change coastal environments. Green arrows represent inputs while red arrows represent outputs.
While this chapter focuses primarily on the ways in which human activities bring about changes to coastal environments, it is also important to remember that natural processes are constantly shaping and changing the coast too. Rocks are eroded and material such as sand is transported by the energy of waves, tides and currents, creating a landscape that is constantly evolving. All this change means that coasts are very complex environments to study and understand.
Understanding natural processes in coastal environmentsGeographers often use models – such as the systems model – to understand environments, study the relationships between environments, and learn more about the intricate forces that cause changes.
To apply a systems model to a coastline, each individual landform is considered to be a separate compartment. Energy such as wind and waves, and matter such as water and sand are studied as they arrive at and leave each compartment. Arriving energy and matter are referred to as inputs and leaving energy and matter are outputs.
If the inputs are greater than the outputs, then the coastline and its landforms such as dunes and spits increase in size and the coast grows outwards. If the outputs are greater than the inputs, then landforms decrease in size and the coast retreats (see Source 1).
92 oxford big ideas humanities and social sciences 10 western australian curriculum
SAMPLE

Dynamic equilibriumEnergy inputs on the coast – the waves and wind – often erode and transport matter, particularly sand. When matter is transported, the shape of the beach changes. When coastal landforms are in balance with energy inputs this is known as dynamic equilibrium. In this state, energy inputs are absorbed with no movement of matter, and the shapes of the landforms remain unchanged.
When dynamic equilibrium does not exist, inputs and outputs do not remain in balance, and the landscape changes.
In the case of a storm, energy inputs will not be constant, so erosion and deposits will not be in balance. Matter is eroded and transported offshore and the shape of the beach changes. Once the storm ends and the energy inputs return to ‘normal’ again, dynamic equilibrium returns and the beach will remain unchanged for as long as the energy inputs remain constant.
For more information on the key concept of change, refer to page 10 of ‘The geography toolkit’.
keyconcept: Change
Source 3 In June 2016, a massive storm hit the east coast of Australia, claiming up to 15 metres of the coastline in some places. The owner of this property in the Sydney suburb of Collaroy returned to his home to find his backyard and in-ground swimming pool claimed by the waves. This storm is an example of how the dynamic equilibrium in this environment was disrupted.
Remember and understand1 What are the main energy and matter inputs in
coastal environments?
Apply and analyse2 Use the systems model to describe the changes that
are taking place in Source 2.
3 Examine Source 3.a What evidence is there for the movement of sand?b How has this movement changed the shape and
location of the coastline?c Explain whether this is an example of dynamic
equilibrium.
4 Select a coast that you know well (or one that you have visited on a field trip). Describe the energy and matter inputs and outputs in this environment and
explain how these have shaped the coastline. For example, a series of sand dunes may have been formed by low energy waves bringing sand from a river mouth.
Evaluate and create5 While many coastlines were heavily eroded by a
2012 storm on the north-east coast of the United States, others hardly changed.a Brainstorm some reasons why variations exist in
the way coasts are changed.b Rank your reasons from the one most likely to
explain these variations to the one least likely. Justify your rankings.
6 Complete a field sketch of Source 2. On your sketch, label the individual compartments that geographers would study.
Check your learning 3.2
93chapter 3 coastal change and management
3A How is the coastal environment changing?
SAMPLE

The influence of climate change
Higher temperatures
Sea levels rising by about 1.8 mm every year
Saltwater intrusion changes ecosystems, e.g. wetlands turn into salt marshes
Reef-building animals are dying and coral reefs are bleaching
More carbon dioxide absorbed in the oceans
Sea surface temperatures are rising, leading to warmer temperatures in coastal regions
Tropical cyclones and other storms have increased in intensity
Reef-building animals are dying and coral reefs are bleaching
Increased coastal erosion and changed ecosystems
The northern ice cap and permafrost melts, exposing polar coastlines
Change to sediment supply at the coast, particularly at river mouths and estuaries
Increased coastal erosion
Increased coastal erosion
Increased coastal erosion
Changing rainfall patterns
Oceans becoming slightly more acidic
Increased algal blooms
3.3 Climate change and coasts
The world’s climate is changing. Human activities such as land clearing and fossil fuel burning have led to increased amounts of carbon dioxide in the atmosphere. This is leading to global warming. As a result, the Earth’s natural ecosystems are changing or adapting to the higher temperatures. Plants and animals that are unable to adapt to the warmer conditions are either
Source 1 The influence of climate change on the coast
moving towards the poles, where conditions are cooler, or facing extinction.
Global warming is also affecting coasts. In fact, coastal systems are undergoing greater change than virtually any other environment. As the interface between the land and the sea, coastal systems face pressures from changes in both of these places. Source 1 summarises the effects of climate change on coastal areas. One of the greatest concerns for Australian coastal areas is the rising of sea levels.
Australia’s rising seasIt can be difficult to convince people that sea levels are rising. This is because ocean and coastal waters are constantly changing as waves, tides and currents keep them in movement. Also, sea levels are rising very slowly. This doesn’t mean that they are not rising, however. In fact, sea levels have been rising for at least a century. Scientists use a combination of tide gauges and new technologies such as satellite altimeters (instruments used to measure altitude) to monitor and measure sea-level changes. These measures show that sea levels have risen by about 1.8 millimetres per year over the last century and by about 3 millimetres per year since the mid-1990s.
The physical impact of rising seasAn Australian government report in 2011 stated that ‘Sea levels are rising around Australia. A sea-level rise of a metre or more during this century is plausible. It could be less or much more. Between 16 000 and 250 000 individual homes are potentially at risk of inundation from a 1.1 metre rise in sea level.’
As well as the risk to homes situated on the coastline, rising sea levels are expected to cause:
• an increase in the erosion of beaches, with somebeaches expected to disappear completely
• an increase in the incidence of flooding in low-lyingcoastal areas
• saltwater to enter coastal aquifers, destroyingfreshwater sources
• an increase in the severity of extreme weather eventssuch as cyclones, bringing with them increasedincidences of serious storm damage.
94 oxford big ideas humanities and social sciences 10 western australian curriculum
SAMPLE
Tropic of Capricorn
0.16 to 0.200.12 to 0.160.08 to 0.120.04 to 0.080.0 to 0.04
0.20 to 0.24
L E G E N DSea level rise(mm per year)early 1990s to 2010
Trend in sea surfacetemperatures (°C/10 yrs)1970 to 2012
0mm
8mm
4mm
AdelaideCanberra
Melbourne
Hobart
Sydney
Darwin
Perth
Brisbane
0 400 800 km
AUSTRALIA: TREND IN SEA SURFACE TEMPERATURES AND SEA LEVEL RISE
Source 2 Source: Oxford University Press
Source 3 This sea wall in Manche, France, is squeezing the salt marsh (centre) into a narrower strip as sea levels rise.
Remember and understand1 What is coastal squeeze? What
causes this problem?
2 Why is coastal erosion expected to increase as sea levels continue to rise?
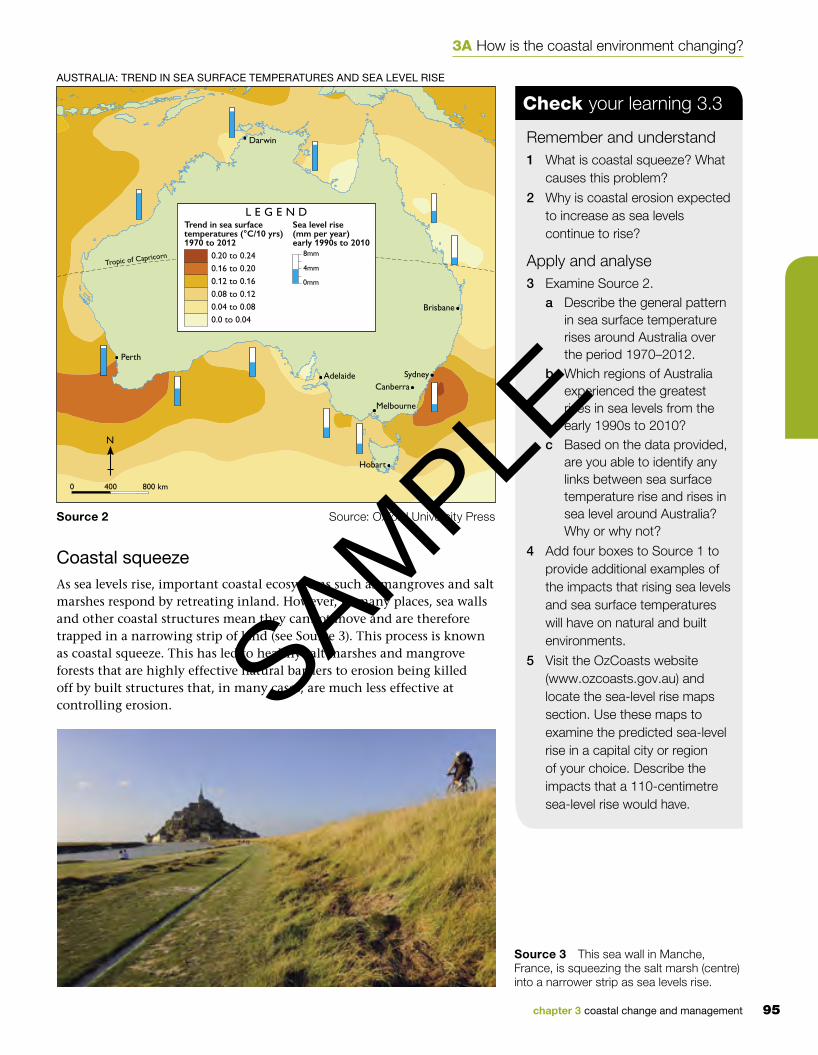
Apply and analyse3 Examine Source 2.
a Describe the general pattern in sea surface temperature rises around Australia over the period 1970–2012.
b Which regions of Australia experienced the greatest rises in sea levels from the early 1990s to 2010?
c Based on the data provided, are you able to identify any links between sea surface temperature rise and rises in sea level around Australia? Why or why not?
4 Add four boxes to Source 1 to provide additional examples of the impacts that rising sea levels and sea surface temperatures will have on natural and built environments.
5 Visit the OzCoasts website (www.ozcoasts.gov.au) and locate the sea-level rise maps section. Use these maps to examine the predicted sea-level rise in a capital city or region of your choice. Describe the impacts that a 110-centimetre sea-level rise would have.
Check your learning 3.3
Coastal squeezeAs sea levels rise, important coastal ecosystems such as mangroves and salt marshes respond by retreating inland. However, in many places, sea walls and other coastal structures mean they cannot move and are therefore trapped in a narrowing strip of land (see Source 3). This process is known as coastal squeeze. This has led to healthy salt marshes and mangrove forests that are highly effective natural barriers to erosion being killed off by built structures that, in many cases, are much less effective at controlling erosion.
95chapter 3 coastal change and management
3A How is the coastal environment changing?
SAMPLE

3.4 The impact of climate change on the Great Barrier Reef
Queensland’s Great Barrier Reef is not only one of the world’s most beautiful natural treasures, it is also one of its most important. Extending over 2300 kilometres and 14 degrees of latitude, the reef contains more than 2900 separate coral reefs and some of the world’s most extensive mangrove and seagrass ecosystems. But the combined effects of a changing climate – rising sea temperatures, rising sea levels, ocean acidification and extreme weather events – are causing problems for this remarkable natural environment.
Rising sea temperaturesStudies show that the current temperatures of the Coral Sea are warmer now than at any time over the last 300 years. On average, temperatures are 0.4° Celsius warmer than they were in the late 1800s. As average temperatures rise, warm weather events heat the sea surface to a temperature that coral polyps (the tiny organisms that construct the coral reef) cannot tolerate. The coral polyps feed on algae, but the warmer water temperature causes a build-up of poisons in the algae. In order to survive, the polyps expel the algae on which they feed, as well as some of their own tissue.
Source 1 An example of mass coral bleaching on the Great Barrier Reef
This process turns the coral white and is known as coral bleaching. Over the short term, bleaching does not kill the coral polyps. However, if sea temperatures remain high over an extended period, the coral polyps eventually starve and the reef will die out.
Rising sea levelsAs the climate warms, land ice is melting. For example, the Greenland ice sheet, which covers 80 per cent of Greenland, is melting an average of 195 cubic kilometres per year. The water from this melting ice ends up in our oceans. Rising sea temperatures are also causing the ocean to expand as a result of the warmer water.
In the Coral Sea, sea levels are rising by about 3 millimetres per year. This is expected to have little impact on the coral reefs as they can grow upwards by about 6 millimetres per year. Surrounding ecosystems, however, are likely to be severely affected. As saltwater intrudes further inland, environments such as mangroves and freshwater lakes are expected to change significantly. Low-lying islands are also expected to disappear beneath the rising seas, changing the distribution of nesting birds and turtles.
Source 2 The Great Barrier Reef islands such as Heron Island are important nesting sites for the endangered loggerhead turtle.
96 oxford big ideas humanities and social sciences 10 western australian curriculum
SAMPLE

5
5
5
5
5
50km
50km
100km
150km
100km
150km
200km
250km
300km
350km
CORAL SE A
Cairns
Gordonvale
Innisfail
Mission BeachTully HeadsCardwell
Ingham
Townsville
Ayr
Bowen
Area of map
Gale force winds
Cyclone pathDistance from cyclone path
Great Barrier Reefmarine park boundary
Destructive windsVery destructive winds
L E G E N D5 No damage
Moderate coral damageMinor coral damage
High coral and minor reef damageSevere coral and moderate reef damageExtreme coral and high reef damage
0 50 100 km
Ocean acidificationOcean acidification is a term used to describe the change in water chemistry caused when the carbon dioxide we pump into the atmosphere is absorbed into the ocean. The extra carbon dioxide in the water makes it more acidic. Ocean acidification can have dire consequences for a coral reef.
As carbon dioxide is absorbed into the ocean, it reduces the amount of carbonate (a kind of salt) in the water. Marine animals need this carbonate to make their shells and skeletons. Reef-building animals such as coral polyps then use these shells and skeletons to create a reef. With fewer shells and skeletons available, construction of the reef is seriously limited. Over the long term, ocean acidification is expected to be the greatest challenge facing the Great Barrier Reef.
Extreme weather eventsIncreases in the severity and frequency of flooding and tropical cyclones also pose serious threats to the reef. Flooding brings increased sediment to the reef and this sediment smothers plants. Pesticides and other chemicals are also carried by floodwaters, adding to the levels of pollution in the water around the reef.
Cyclones generate large and powerful waves which damage corals and the reef structure. One of the worst cyclones to hit the reef in recent times was Cyclone Yasi in 2011 (see Source 3). Reefs are able to recover from these natural events but need time to do so. As extreme weather events become more frequent, reefs have less recovery time.
GREAT BARRIER REEF: DAMAGE FROM CYCLONE YASI, FEBRUARY 2011
Source 3 Source: Oxford University Press
Remember and understand1 Why are sea levels around the world rising?
2 How do rising sea levels impact on nesting birds and turtles?
Apply and analyse3 Examine Source 3.
a Describe the track of Cyclone Yasi and the areas in which the winds were most destructive.
b In which areas was reef damage the greatest? Which areas suffered the least damage?
c Describe the relationship between wind speed and reef damage.
Evaluate and create4 Construct a flow chart or mind map showing the
impact of ocean acidification on coral reefs.
5 Rank the four impacts of climate change described here from the one likely to have the greatest impact on the reef to the one likely to have the least impact. Write a paragraph justifying your ranking.
6 Imagine that the Great Barrier Reef disappeared due to the combined effects of climate change. How would this affect the Queensland coast and the Queensland economy?
Check your learning 3.4
97chapter 3 coastal change and management
3A How is the coastal environment changing?
SAMPLE

3.5 The impact of population growth on coasts
Source 1 The contrast between the natural and built-up environments of Tokyo Bay, Japan: a beach in Tokyo Bay (left), and reclaimed land near the CBD (right).
About one-quarter of the world’s population live within 100 kilometres of the coast. Most of the world’s megacities in both the developed and developing world are located on the coast and many of them are growing rapidly. In China, for example, 1000 people a day move to coastal cities from the country’s interior. The impact of billions of people in millions of coastal cities, towns, villages and farms has caused one United Nations expert to state that ‘humankind is in the process of annihilating coastal and ocean ecosystems’.
The impact of human settlements on coastal areasThe coast has always been an attractive place for human settlement. Coastal regions provide access to food and water, and people have long used boats and ships for transportation. But the growing number of people along the coast, together with increasing levels of trade and movement between settlements, have had many detrimental effects on coastal ecosystems:
• Engineering structures such as sea walls, groynes,breakwaters, training walls and marinas have hardened
the coast and changed natural cycles of erosion and deposition.
• Changing the natural flow of water by dredgingchannels, diverting rivers and building dams hasaltered the amount of fresh water and sedimentarriving at the coast, impacting on naturalecosystems and landforms.
• Discharging sewage into the ocean, the run-off offertilisers from farms and other contaminants enteringcoastal waters have caused pollution in the oceans.
• Increased numbers of people in coastal areas hasled to overfishing of the fish and shellfish. In someplaces, coastal fish stocks have fallen by 90 per centin the last 30 years.
• Ports are often an entry point for invasive speciesthat bring dramatic changes to coastal ecosystems.
• The presence of large numbers of people on beacheshave an impact: people leave litter on beaches, theywalk over native plants and impose walkways, theycan destroy breeding areas of seabirds and bringpredators such as dogs into the environment.
98 oxford big ideas humanities and social sciences 10 western australian curriculum
SAMPLE

Continued growth and competition for landMany coasts have been converted from natural ecosystems to human landscapes. Cities need space to grow and harbours for trade and transport. Mangroves, marshes and estuaries have been drained and filled in, sand dunes flattened and built over and communities of coastal plants cleared. In some places, land for expansion has been so scarce that new land has been built in bays and estuaries from rocks, rubbish and silt from the sea bed (known as land reclamation).
Case study: Tokyo BayThe largest example of reclaimed land is Japan’s Tokyo Bay. Twenty per cent of the bay has been filled in to create 250 square kilometres of new land. This new land was created around the edge of the bay using urban waste and silt from the bottom of Tokyo Bay. The reclaimed land is now home to some of the world’s most expensive real estate including an international airport and Tokyo Disneyland.
In September 2013, Tokyo was selected as the host city for the 2020 Summer Olympic Games. Many of the sporting venues will be built on reclaimed land and this is expected to further increase the property values in the areas surrounding Tokyo Bay.
TOKYO BAY: EXTENT OF RECLAIMED LAND
Source 2 Source: National Geographic
Remember and understand1 What is land reclamation and why is it used?
2 Describe the changes to coastal ecosystems as a result of coastal city growth.
Apply and analyse3 Use an atlas to research the location of the world’s
megacities (cities with over 10 million people). How many megacities are coastal? How many of these coastal megacities are on river mouths or estuaries?
4 Why would the impacts described on these pages be particularly serious for small island communities?
5 Would the population impact on coasts be greatest in developing or developed countries? Discuss this with a partner and then with the class.
Evaluate and create6 Construct an overlay map of Tokyo Bay using
Source 2. On the base map show the natural outline of the bay. On the overlay show the total area of reclaimed land. Describe the spatial change over time shown on your map.
7 Use Google Earth to explore the coastline of Tokyo Bay. Estimate the percentage of the coastline that is:a heavily modified (for example, reclaimed land)b lightly modified (for example, sea walls or groynes
constructed)c not modified.
Check your learning 3.5
LEGEND
99chapter 3 coastal change and management
3A How is the coastal environment changing?
SAMPLE

3.6 Loss of coastal biodiversity
The number of plant and animal species on a global scale is in decline. The drivers of this wave of extinction are all caused by human activities such as the destruction of habitats, over exploitation of ecosystem services, pollution, climate change and the introduction of invasive species. Recent studies of the four key coastal ecosystems – mangroves, seagrass beds, salt marshes and coral reefs – reveal that all are declining in size and biodiversity.
MangrovesMangroves provide a wide range of crucial ecosystem services in many tropical areas, including providing wood, protecting communities from the effects of offshore storms and as a breeding ground for fish and crustaceans. Despite their importance, about one-fifth of the world’s mangroves have been lost since 1980, an estimated area of 36 000 square kilometres (see Source 1). Countries such as Kenya, Liberia and Puerto Rico have already lost over 70 per cent of their mangrove forests. Currently, the United Nations estimates that mangrove forests are being cleared at four times the rate of land forests. Mangroves have been cleared to make way for agricultural land, harbours, housing and fish farms.
Source 1 Many mangrove forests, such as here in Malaysia, have been cleared to make way for shrimp farms.
Source 3 The amazing leafy seadragon, threatened by a loss of seagrass near Australia’s southern cities
Source 2 Salt marshes protect shorelines from erosion and reduce flooding.
Seagrass bedsSeagrass beds are an important ecosystem for dugongs and manatees (both large sea mammals) and the leafy seadragon (see Source 3), as well as providing food for hundreds of other species. Seagrass beds are also important for stabilising sediments in the water, absorbing carbon dioxide and protecting against erosion. Over the last 200 years, about 30 per cent of the world’s seagrass beds have disappeared, many of them within the last few decades. The main threats to seagrass beds and the biodiversity they support are the dredging of the sea bed, the development of tourist marinas and water pollution from rivers and streams.
Salt marshesSalt marshes are intertidal habitats, meaning they are above water at low tide and under water at high tide. Salt marshes are essential for healthy fisheries and coasts. They provide food, refuge and a habitat for the offspring of more than 75 per cent of marine species, including shrimp, crab and many fish. Birds also feed on the marshes. Salt marshes protect shorelines from erosion and reduce flooding by slowing and absorbing rainwater (see Source 2). They also help to maintain water quality by filtering run-off and absorbing excess nutrients. Twenty-five per cent of the world’s salt marshes have already been lost; many turned into agricultural land for farming.
100 oxford big ideas humanities and social sciences 10 western australian curriculum
SAMPLE
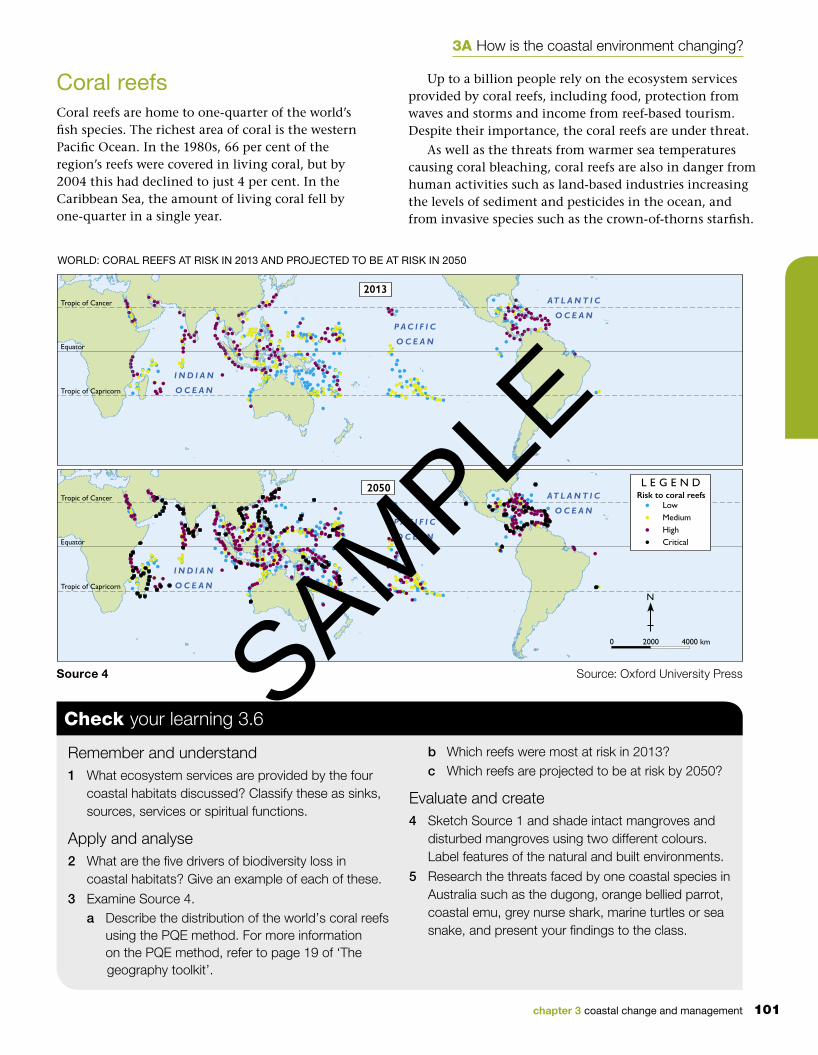
I N D I A N
O C E A N
P A C I F I C
O C E A N
AT L A N T I C
O C E A N
I N D I A N
O C E A N
P A C I F I C
O C E A N
AT L A N T I C
O C E A N
2013
2050 L E G E N DRisk to coral reefs
LowMediumHighCriticalEquator
Tropic of Cancer
Tropic of Capricorn
Equator
Tropic of Cancer
Tropic of Capricorn
0 2000 4000 km
Coral reefsCoral reefs are home to one-quarter of the world’s fish species. The richest area of coral is the western Pacific Ocean. In the 1980s, 66 per cent of the region’s reefs were covered in living coral, but by 2004 this had declined to just 4 per cent. In the Caribbean Sea, the amount of living coral fell by one-quarter in a single year.
Up to a billion people rely on the ecosystem services provided by coral reefs, including food, protection from waves and storms and income from reef-based tourism. Despite their importance, the coral reefs are under threat.
As well as the threats from warmer sea temperatures causing coral bleaching, coral reefs are also in danger from human activities such as land-based industries increasing the levels of sediment and pesticides in the ocean, and from invasive species such as the crown-of-thorns starfish.
WORLD: CORAL REEFS AT RISK IN 2013 AND PROJECTED TO BE AT RISK IN 2050
Source 4 Source: Oxford University Press
Remember and understand1 What ecosystem services are provided by the four
coastal habitats discussed? Classify these as sinks, sources, services or spiritual functions.
Apply and analyse2 What are the five drivers of biodiversity loss in
coastal habitats? Give an example of each of these.
3 Examine Source 4.a Describe the distribution of the world’s coral reefs
using the PQE method. For more information on the PQE method, refer to page 19 of ‘The geography toolkit’.
b Which reefs were most at risk in 2013?c Which reefs are projected to be at risk by 2050?
Evaluate and create4 Sketch Source 1 and shade intact mangroves and
disturbed mangroves using two different colours. Label features of the natural and built environments.
5 Research the threats faced by one coastal species in Australia such as the dugong, orange bellied parrot, coastal emu, grey nurse shark, marine turtles or sea snake, and present your findings to the class.
Check your learning 3.6
chapter 3 coastal change and management
3A How is the coastal environment changing?
101
SAMPLE

A pollutant is any substance released into the environment that has a harmful or negative effect on the natural environment. Coasts are particularly vulnerable to the damaging effects of pollution as pollutants released on land and in the sea usually find their way to the coast, carried by rivers, tides, waves and ocean currents.
Sources of coastal pollutionWhile it might be tempting to think that most coastal pollution comes from people using the coast such as beach-goers and people fishing, this is generally not the case. Rivers carry urban pollutants such as sewage, industrial waste, chemicals and water washed from streets and yards as stormwater to the coast. Rivers also bring pollutants from rural areas such as animal manure, pesticides and fertilisers washed from the land in heavy rain. Deforestation in river catchments also increases the amount of sediment and fresh water carried to the coast. One of the most serious consequences of coastal and marine pollution is the formation of dead zones in the ocean (see Source 1).
3.7 Coastal and marine pollution
Source 2 This bloom of algae, triggered by fertilisers washed from farms, covered beaches in southern China in 2011.
PACIFIC OCEAN
ARCTIC OCEAN
ATLANTIC
OCEAN
ATLANTIC
OCEANINDIAN
OCEAN
ASIA
AUSTRALIA
EUROPE
AFRICA
NORTH
AMERICA
SOUTH
AMERICADead zone size (km2)
Unknown size
0.1110100
1000
10 000
L E G E N D
0 1500 3000 km
WORLD: LOCATION OF MARINE DEAD ZONES
Source 1 Source: Oxford University Press
102 oxford big ideas humanities and social sciences 10 western australian curriculum
SAMPLE

Marine dead zonesMarine dead zones are areas of fresh water or salt water where oxygen concentration has become too low to support life. Some rivers carry a cocktail of pollutants, all of which arrive at the coast. Waves, tides and currents then carry these pollutants along the coast and out to sea where they can cause great environmental damage. Arguably the most serious damage is the creation of marine dead zones in the ocean, devoid of oxygen and marine life. Dead zones form in summer with the warmer weather conditions
encouraging algae blooms which then go on to deplete oxygen levels in deeper seas (see Source 3).
Although the number and size of marine dead zones fluctuate, they are on the increase. In the 1960s, only 39 dead zones were identified, compared with 405 in 2000. Some dead zones are only a few square kilometres in size and last only a few months. The largest dead zones, however, are massive. Dead zones in the Baltic Sea and Gulf of Mexico can be more than 18 000 square kilometres in size.
For more information on the key concept of environment, refer to page 8 of ‘The geography toolkit’.
keyconcept: Environment
lighter, fresher, warmer surface water
heavier, saltier, cooler, deeper water
Fresh water containingnitrogen and phosphorusfrom �elds and streetswashes into the ocean.
1
The nitrogen and phosphorus cause algae and phytoplanktonblooms to form on the surfaceof the ocean.
2
As the blooms die, they drop tothe sea �oor and decompose,using up oxygen in thedeep water.
3
In summer, as sea temperatures rise, the sea water forms into two layers. Oxygen levels in the deeper layer fall below the level needed to support marine life, and everything dies.
4
Source 3 How a marine dead zone forms
Remember and understand1 What is meant by the term ‘marine dead zone’?
2 What are the causes of marine dead zones and what are the effects of these zones?
Apply and analyse3 Examine Source 1.
a Describe the distribution of the world’s largest marine dead zones using the PQE method. For more information on the PQE method, refer to page 19 of ‘The geography toolkit’.
b Describe and account for the relationship between marine dead zones and areas of high population density.
4 Why do dead zones grow and decline throughout the year?
Evaluate and create5 Marine dead zones can be explored through the
geographical concept of environment, but they could also be used as an example of the geographical concept of interconnection. Describe how dead zones relate to interconnection.
6 In small groups, discuss possible solutions to the problem of marine dead zones and present your ideas to the class. You may wish to research the ways in which communities and nations have responded to a large dead zone in the Black Sea as a starting point.
Check your learning 3.7
chapter 3 coastal change and management
3A How is the coastal environment changing?
103
SAMPLE

3A rich task
Gulf of Mexico oil spillThe Gulf of Mexico lies between the United States, Mexico and Cuba and contains one of the world’s busiest oilfields. There are almost 4000 active oil wells in the Gulf along with a further 27 000 abandoned wells.
In April 2010, the Deepwater Horizon, an active oil well operated by British Petroleum (BP), exploded and sank to the sea floor, 1500 metres below the surface. Oil gushed from the well for three months while BP and American authorities tried desperately to plug the hole. The results were catastrophic. An oil slick covering 1500 square kilometres started moving towards the American coastline. Thousands of seabirds, fish, dolphins and turtles were covered in oil and died. Other animals along the shoreline such as crabs and molluscs were also badly affected. Local industries such as fishing and tourism collapsed, and many people lost their livelihoods.
Analysing environmental accidents using complex mapsIn the case of an environmental accident, the impacts of the accident usually have multiple causes. Geographers try to go beyond the obvious cause (the oil well blew up) to explore other factors that have influenced the course and extent of the impacts. These are generally a combination of natural processes and human activities. Complex maps contain more than one set of information. Geographers use complex maps to analyse different features, reveal patterns and explain links between features in a given area. You can analyse a complex map by following these steps.
skilldrill
Step 1 Look carefully at the map and read its title to make sure you understand what is being shown.
Step 2 Examine the map’s legend. Complex maps can have more than one part to a legend, and these parts will be represented on the map in different ways. For example, in Source 1 natural environments are shown using a range of colours and towns and cities with a range of symbols.
Step 3 Train your eyes to look for one set of information at a time. For example, look at solid blocks of colour on the map and work out what they tell you.
Step 4 Move to a different set of information by selecting another symbol or block of colour from the legend. Examine the map to identify the symbol or areas of colour.
Step 5 Look for concentrations of the same symbol in areas to see if patterns exist.
Step 6 Note any patterns you can find on the map between different features and locations.
Step 7 Describe the degree to which patterns are connected.
Step 8 Try to suggest reasons for the connection between the two patterns.
Apply the skill
1 Using Source 1, analyse the causes and effects of the Gulf of Mexico oil spill. Once you have completed your analysis, fill in the table below as a way of organising your results. An example has been done for you.
Geographic factor
Possible contributing feature
Description of feature
Physical environment
Shape of the coastline The Gulf of Mexico is an extensive broad bay which opens to the Atlantic Ocean and Caribbean Sea in the east.
Features of the sea bed
Location of coastal marshes
Natural processes
Ocean currents in the Gulf
Demographics Distribution of towns and cities
Location of oil refineries and oil rigs
104 oxford big ideas humanities and social sciences 10 western australian curriculum
SAMPLE

Source 1 Source: Oxford University Press
GULF OF MEXICO: EXTENT OF OIL SPILL FROM DEEPWATER HORIZON, 2010
chapter 3 coastal change and management
3A How is the coastal environment changing?
105
SAMPLE

Source 3 Marine animal populations in the Gulf of Mexico were devastated by the oil spill in 2010. In total, around 750 million litres of crude oil was released into the gulf affecting fish, dolphins, whales, sea turtles and birds, as well as molluscs across the sea bed.
In addition to complex maps, geographers use information from a range of additional sources to explain how the impacts of the accident progressed and to look at the longer-term impacts on the environment. Research the Gulf of Mexico oil spill on the Internet before answering the following questions.
1 Can you identify any contributing factors to the accident that are not shown on Source 1 (for example,
Extend your understanding
any economic or technological factors). What was their role in the accident? Add these factors to the table provided below.
2 Since 2000 more oil wells have been drilled in much deeper water than in the past. Some experts believe that this was an important factor in this disaster. Why do you think wells are now being drilled in much deeper water?
Contributing factors Possible contributing feature Description of feature
Economic factors Level of development of USA
Importance of oil in USA economy
Tourism and fishing industries
Technological factors Operation of oil refineries and oil rigs
Technical failure of oil rig
Source 2 The fire on the Deepwater Horizon oil platform
106 oxford big ideas humanities and social sciences 10 western australian curriculum
SAMPLE

Source 4 These signs were erected on the front lawn of a home in Grand Isle, Louisiana, shortly after the Gulf of Mexcio oil spill. Each cross represents something that was affected by the oil spill, including many species of fish and other sea creatures.
Source 5 Activists hold signs during a protest in front of the Hale Boggs Federal Building on the first day of the trial over the Deepwater Horizon oil rig spill on 25 February 2013 in New Orleans, Louisiana.
3 Sources 4 and 5 show some of the community responses and protests to the Gulf of Mexico oil spill. Shortly after the incident in 2010, civil and criminal charges were brought against BP in the American courts.
Conduct research to answer the following questions:
a What kinds of charges were brought against BP in the aftermath of the Gulf of Mexico oil spill in 2010? Who brought these charges against BP?
b How did BP plead in the case?
c How was the case resolved? How was BP penalised and how much did they have to pay?
d Do you consider this amount to be appropriate? Give reasons for your answer.
chapter 3 coastal change and management
3A How is the coastal environment changing?
107
SAMPLE
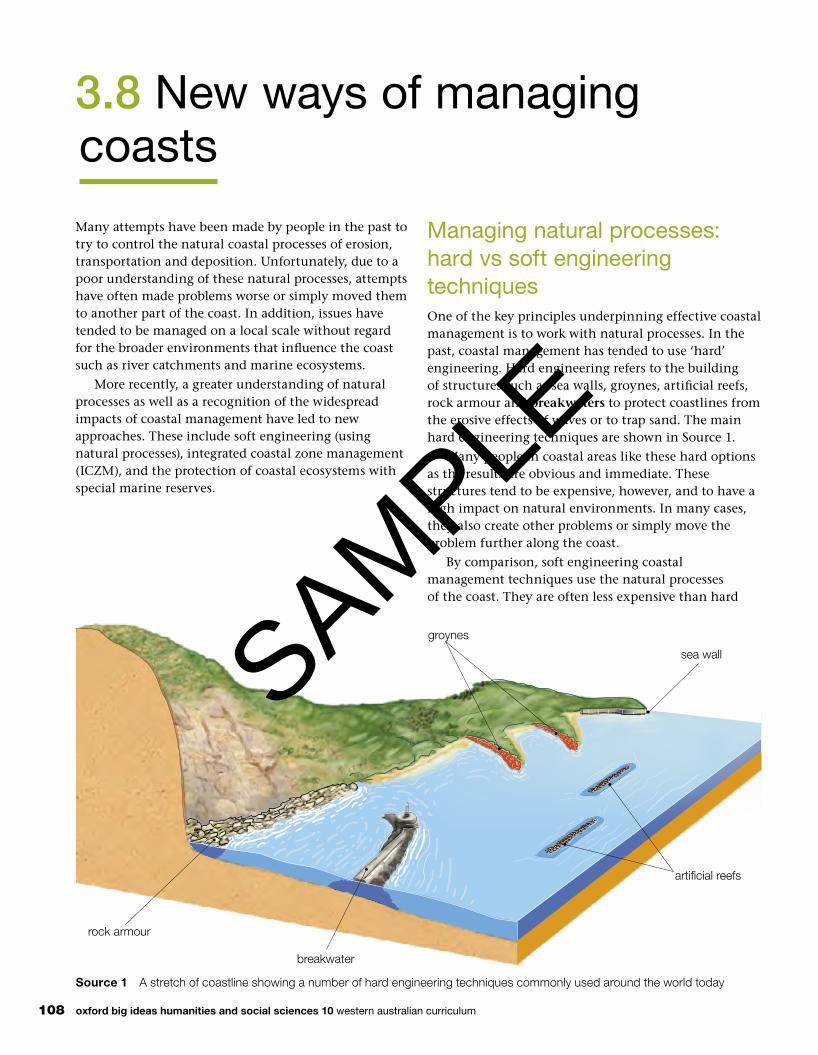
sea wall
arti�cial reefs
rock armour
breakwater
groynes
Source 1 A stretch of coastline showing a number of hard engineering techniques commonly used around the world today
3.8 New ways of managing coasts
Many attempts have been made by people in the past to try to control the natural coastal processes of erosion, transportation and deposition. Unfortunately, due to a poor understanding of these natural processes, attempts have often made problems worse or simply moved them to another part of the coast. In addition, issues have tended to be managed on a local scale without regard for the broader environments that influence the coast such as river catchments and marine ecosystems.
More recently, a greater understanding of natural processes as well as a recognition of the widespread impacts of coastal management have led to new approaches. These include soft engineering (using natural processes), integrated coastal zone management (ICZM), and the protection of coastal ecosystems with special marine reserves.
Managing natural processes: hard vs soft engineering techniquesOne of the key principles underpinning effective coastal management is to work with natural processes. In the past, coastal management has tended to use ‘hard’ engineering. Hard engineering refers to the building of structures such as sea walls, groynes, artificial reefs, rock armour and breakwaters to protect coastlines from the erosive effects of waves or to trap sand. The main hard engineering techniques are shown in Source 1.
Many people in coastal areas like these hard options as the results are obvious and immediate. These structures tend to be expensive, however, and to have a high impact on natural environments. In many cases, they also create other problems or simply move the problem further along the coast.
By comparison, soft engineering coastal management techniques use the natural processes of the coast. They are often less expensive than hard
108 oxford big ideas humanities and social sciences 10 western australian curriculum
SAMPLE

Source 2 In the Netherlands a vast sand peninsula 2 kilometres long and 1 kilometre wide has been constructed. Dubbed the ‘sand engine’, waves and currents are redistributing the peninsula along the shore where it is expected to nourish the beaches and form sand dunes.
engineering options, and are considered to be more sustainable as they have less impact on the natural environment. There are two main types of soft engineering – beach nourishment and managed retreat.
• Beach nourishment replaces beach material such assand that has been removed by erosion or longshoredrift (see Source 2). Beaches are a natural defenceagainst erosion and coastal flooding and are adesirable feature of the landscape for residents andtourists alike. The natural process that eroded thebeach in the first place will continue, however, so thebeach needs to be nourished again and again.
• Managed retreat involves the relocation of humansettlements and hard engineering defences such assea walls and groynes so that the natural processesof erosion and deposition can take place. In manycases, low-lying areas flood allowing salt marshes,wetlands and mudflats to re-establish themselves inthese areas (see Source 3). Over time, these habitatsprovide a natural defence against further erosion.Unlike many hard engineering techniques, managedretreat can be relatively inexpensive. However,people living in these regions can be unwilling torelocate and need to be compensated for the loss oftheir properties.
Source 3 Managed retreat at Abbotts Hall Farm in Essex, England, has allowed salt marshes to be re-established.
Remember and understand1 What are the main differences between hard and
soft engineering techniques?
2 Describe the process that is occurring at Abbotts Hall Farm (see Source 3).
Apply and analyse3 What is beach nourishment? Outline some of
the possible positive and negative environmental impacts of this soft engineering technique.
Evaluate and create4 Match the hard engineering technique with its
function and possible disadvantage.
Technique Function Possible disadvantage
Sea wall Absorbs the energy of waves and allows the build-up of sand to form a beach
Can be difficult and expensive to find and place suitable rocks to form the wall
Groyne Protects cliffs, land and buildings from erosion and can also lessen the risk of coastal flooding from storm surges
May weaken longshore drift and allow sand to build up – sometimes creating a tombolo
Rock armour
Absorbs the energy of waves and provides a safe harbour for boats
Can ruin the appearance of the beach and be costly to maintain
Breakwater Traps material carried by longshore drift and allows a beach to be built up
Can be very expensive to build and maintain. The breakwater reflects rather than absorbs wave energy so waves may continue to cause erosion elsewhere.
Check your learning 3.8
chapter 3 coastal change and management
3B How can coastal changes be managed?
109
SAMPLE

Rainbow Beach is a small community located on a massive dune system that runs along the Queensland coast near the southern tip of Fraser Island. Formed over two million years, the dunes are part of one of the world’s greatest sand dune complexes that includes Fraser Island – the world’s largest sand island. In places, the dune system is 200 metres high and is held in place by large areas of scrub, forest and grasses.
While Aboriginal occupation of the region dates back 5500 years, European settlement began with a sand-mining operation north of the town in the mid- 1960s. A road built to reach the sand mine was soon used by tourists to access Fraser Island and the new town of Rainbow Beach (see Source 1). The sand-mining operation finished in 1976 but the population of the small town continued to grow slowly. Now home to about 1000 full-time residents, visitor numbers swell in summer holiday periods as people arrive to use the camping ground as well as several motels and resorts.
The key management issue faced by the region is the erosion of the sand dunes, particularly during storms. This is an example of a potential conflict between natural processes and human activities. Sand dunes naturally change in response to long-term and short-term changes in wind patterns, sand supply and sea levels. The erosion of the foredune at Rainbow Beach (a dune ridge running parallel to the ocean) is a natural event. However, as the erosion is now putting buildings at risk and making the beach unsuitable for recreation activities, some local
residents and the Gympie Regional Council are proposing to try to control the erosion.
A study of the region found that the risk of severe dune erosion at Rainbow Beach is very low but some people are still concerned that during a severe storm important buildings could be lost. The council plans to install large sandbags at the base of the dunes in front of the Surf Life Saving tower, along 260 metres, to slow erosion and protect a new amenity block that has been built on top of the dunes.
3.9 Change at Rainbow Beach
Source 1 An oblique aerial photograph of Rainbow Beach, looking south. The foredune and two blowout dunes (known locally as the Carlo Sand Blow and the Little Sand Blow) can be seen to the south of the town.
Source 2 A 2009 storm severely eroded the Rainbow Beach foredune, placing the Surf Life Saving tower in danger of collapse.
oxford big ideas humanities and social sciences 10 western australian curriculum110
SAMPLE

Coastcare at Rainbow BeachThere are 2000 Coastcare groups in Australia. Each group is made up of volunteers who work with local governments to identify problems and then work together to solve them. At Rainbow Beach, the local group has identified the loss of native vegetation, the trampling of dune vegetation by visitors accessing the beach, sand skiing on the sand blows, coastal erosion, environmental weeds, beach parking and rising sea
levels due to climate change as the key issues in the area.
Some of the projects the Coastcare group at Rainbow Beach have undertaken include restoring native plants and removing weeds, protecting the dunes, monitoring bird populations and improving wetland areas.
For more information on the key concept of place, refer to page 6 of ‘The geography toolkit’.
keyconcept: Place
Source 3 Rainbow Beach has a very active Coastcare group.
Source 4 A range of management strategies are in place at the main beach in Rainbow Beach. The fencing and walkway direct people to enter the beach on this path, protecting surrounding dunes.
Remember and understand1 Describe the natural environment of Rainbow Beach.
2 Describe the human activities bringing about change to this place.
3 What is Coastcare?
Apply and analyse4 Is the plan to place sandbags at the base of the
dunes an example of hard or soft engineering? Give some reasons for your answer.
5 What management strategies can you identify in Sources 3 and 4? What is each strategy designed to achieve and how effective do you think each will be in achieving its aims?
6 What are the similarities and differences between changes at Rainbow Beach and changes at Abbotts Hall Farm in Essex? (See Source 3 on page 109.)
Evaluate and create7 The Little Sand Blow is increasing in size as it moves
westward. Construct a flow diagram or field sketch that shows the:
• natural processes responsible for this movement
• human activities that may be contributing to themovement
• impacts of this movement on the environment
• possible responses by the local government andCoastcare group.
Check your learning 3.9
chapter 3 coastal change and management
3B How can coastal changes be managed?
111
SAMPLE

In response to the serious issues facing coastal and marine ecosystems, a major United Nations conference held in 1992, called the Earth Summit, proposed a new system for managing coastal environments. Known as Integrated Coastal Zone Management (ICZM) it is now a widespread practice in many coastal nations, such as New Zealand, India, Canada, Bangladesh and the Netherlands.
The United Nations recognises that one of the common issues associated with coastal management is that government departments and interest groups often propose very different solutions to issues depending on their own needs and interests. In most cases, these solutions ignore the needs of other coastal users. The many coastal interest groups include residents, the tourism industry, fisheries, farmers, forestry, manufacturing, mining, waste disposal, marine transportation and real estate developers.
The key to ICZM is that it seeks to pull together the many groups and individuals with an interest
3.10 Integrated Coastal Zone Management (ICZM)
Source 1 The challenges facing many coastal environments require an integrated approach.
Involve all relevant governments
Take a long-term view
Use a holistic approach
Consider local conditions
Work with natural processes
Get people involved
Use a range of approaches
Be prepared to change strategy
Eight principles of ICZM
Source 2 The eight key principles of ICZM
in the coast in an integrated way when devising a management plan. The eight key principles of ICZM are outlined in Source 2. The success of ICZM is then dependent on funding, consistent government priorities and the expertise available to organise and manage large projects.
oxford big ideas humanities and social sciences 10 western australian curriculum112
SAMPLE

Chittagong
Dhaka
Ganges
Brahmaputra
River
River
B A N G L A D E S H
I N D I A
I N D I A
Bay of
Benga l
Area ofmap
Heavily populated areasLand submerged after1-metre rise in sea level
L E G E N D
0 50 100 km
Case study: ICZM in BangladeshEach ICZM plan is designed to best address the issues of the country it has been developed for. In Bangladesh, for example, the key issues are rising sea levels that bring saltwater floods to low-lying communities and the impacts of cyclones and storm surges. It is estimated that a 1-metre rise in sea level would leave 17 000 square kilometres of land in Bangladesh submerged and 15 million people without a home (see Source 4). It will affect 1 million hectares of farmland and threaten the freshwater supplies of three major cities.
In response to these threats the Bangladeshi government, with the assistance of the World Bank and expertise from the Netherlands, has developed an ICZM strategy that focuses on disaster mitigation. To date 150 000 hectares of mangroves have been replanted and more than 2500 cyclone shelters constructed.
BANGLADESH: PREDICTED IMPACT OF 1-METRE SEA-LEVEL RISE
Source 4 Source: Oxford University Press
Source 3 A nursery for mangrove trees. These will be used to replace some mangrove areas lost to farming and forestry and help to reduce flooding.
Remember and understand1 What is ICZM?
2 How and why has ICZM been implemented in Bangladesh?
Apply and analyse3 Source 3 on page 103 illustrates a significant problem
in many coastal areas – marine dead zones. Work with a partner to use the eight key principles of ICZM to suggest how people could manage this issue. For example, using a holistic approach might mean getting farmers to be more careful in their use of fertilisers. Perhaps nutrient levels in streams could be monitored so that farmers could better manage their application of fertiliser, particularly in times of heavy rainfall.
Evaluate and create4 What do you see as some of the barriers to ICZM
principles being adopted in Bangladesh?
5 What do you see as some of the advantages in managing coastal changes using this approach?
Check your learning 3.10
chapter 3 coastal change and management
3B How can coastal changes be managed?
113
SAMPLE

North Sea
Zeeland
Oosterscheldekering
The province of Zeeland in the Netherlands is a large agricultural area that is home to more than 380 000 people (Source 3). Much of the region lies below sea level. The land has been drained and reclaimed, creating new islands that are linked by bridges and tunnels. The area has an intricate series of levees (known as dykes) and dams that hold back the waters of the North Sea and regulate the flow of the rivers to the sea. The province also supports a large fishing industry and is home to the largest national park in the Netherlands.
In Zeeland, ICZM is used to reduce flooding from storm surges. The largest of the flood protection dams, the 9-kilometre-long Oosterscheldekering, links two of the largest islands in Zeeland. The 62 steel doors that make up the barrier can be lowered or raised in response to tides, storms and other sea level changes (see Source 1). For most of the year, seawater can flow freely beneath the dam so that marine ecosystems in the bays and estuaries of the delta can be maintained.
The dam, which was opened in 1986, has been declared one of the Seven Wonders of the Modern World and bears a plaque with the words, ‘Here the tide is ruled by the wind, the moon and us (the Dutch).’ Any long-term changes in sea level due to climate change will place greater pressure on this region and on these amazing engineering works.
The series of dams, storm surge barriers and bridges have provided many benefits for the people of the Zeeland region. As well as protecting them from storm surges and flooding, large areas of former saltwater estuaries have been converted into freshwater lakes creating a reliable supply of water. The dams and bridges also link together island communities that had been isolated for hundreds of years and the calmer waters of the river mouths and estuaries are safe for shipping and recreational boating.
3.11 ICZM in the Netherlands
Source 1 The Oosterscheldekering storm surge barrier in Zeeland
Source 2 An aerial photograph of Zeeland showing a number of dams and storm surge barriers (including Oosterscheldekering)
114 oxford big ideas humanities and social sciences 10 western australian curriculum
SAMPLE

5
510
10
15
20
26
25
24
23
22
21
20
19
18
17
16
48 49 50 51 52 53 54 55 56 57 58 59 60 61
51°45’N
3°45’E4°00’E
+++ +++++++++
++++
Schelphoek
Stampersplaat
Dwars in de Weg
Hompelvoet
Ossehoek
Veermansplaat
Grevelingenmeer(Lake Grevelingen)
Schouwen-Duiveland
Sirjansland
Dijkwater
Colijnsplaat
WestenschouwenBurghsluis
Serooskerke Schouwen
Moriaanshoofd
Zierikzee
Ouwerkerk
Viane
OosterlandNieuwerkerk
Bruinisse
Capelle Duiveland
Schuddebeurs
Noordgouwe
Zonnemaire
Brouwershaven
Brijdorpe
Nieuwerkerke
Kerkwerve
LooperskapelleElkerzee
Scharendijke
Ellemeet
Noordwelle
Renesse
Haamstede
Burgh
Nieuw-Haamstede
Grevelingenmeer(Lake Grevelingen)
Den Osse
Dreischor
Beldert
Grevelingenhout Golf Course
Sport Fields
Zeeland Village
Kop vanSchouwen
Zeeland Bridge
Watersnoodmuseum
Noord-BevelandTholen
Oosterschelde (Eastern Scheldt)
Delta ParkNeeltje Jans(Water Park)
Oosterscheldekering (Eastern ScheldtStorm Surge Barrier)
De Punt
Oosterschelde (Eastern Scheldt)
Keeten-Mastgat
N o r t h S e aBrouwers
Dam
Seawater access
PortZelande
Roompotsluis (Cream Pot Locks)
Herkingen
Inundated areas from 1953 �ood
Stavenisse
Rijk
sweg
57
Rijksweg
57
Kraaij
enstei
nwe g
Stoofweg
Delingsdyk
Delingsd
yk
Zui
dweg
Kloosterweg
Lang
e Blo
kweg
Heuveisw
eg
Provincialeweg
NieuweKoolweg
Weg
naa
r de
Val
Weg
naa
r de V
alRijksweg Rijksweg
Rijksweg
Stran
dweg
N652
N652 N
651
N57
N57
N57
N57
Prov inciale straatweg
Serooskerkseweg
Contour with value(interval 5 metres)
Forest
Park or recreation area
Lake/dam
Watercourse
Open area
Principal road
Secondary road
Minor road
Wind turbine
Building/s
10
L E G E N DGlass house cultivation
Built-up area
Cultivated land+0 1 2 3 4 5kilometres kilometres
Scale 1:150 000
ZEELAND: TOPOGRAPHIC MAP
Source 3 Source: Oxford University Press
Remember and understand1 Why was the Oosterscheldekering constructed?
2 Locate the province of Zeeland in an atlas and describe its location.
Apply and analyse3 Use the eight key principles of ICZM (see Source 2 on
page 112) to comment on the flood protection provided by Oosterscheldekering. For example, how does this barrier take local conditions into account?
4 Examine Sources 2 and 3.a What factors do you think may be responsible for
the large sandbanks forming in the Oosterschelde?
b Identify the different land uses on the island of Schouwen-Duiveland.
c Describe the relief of the island using the contour lines on the map.
d Describe the southern shore of the island.
Evaluate and create5 Draw a sketch map of the vertical aerial photograph in
Source 2. On your map, label the key natural and built features of the landscape.
6 The Oosterscheldekering is only one part of a much larger flood protection scheme. Use Google Earth to examine the region and find other examples of flood protection.
Check your learning 3.11
chapter 3 coastal change and management
3B How can coastal changes be managed?
115
SAMPLE

Source 2 The IUCN management categories for the conservation of marine reserves
IUCN number
Name of reserve type
Purpose of the reserve
Ia Strict nature reserve
Managed primarily for scientific research or environmental monitoring
II National park Protected and managed to preserve its natural condition
IV Habitat/species management area
Managed primarily to ensure the maintenance of habitats or to meet the requirements of specific species
VI Managed resource protected area
Managed to ensure long-term protection and maintenance of biological diversity with a sustainable flow of natural products and services to meet community needs
An effective way to manage and protect natural environments such as coasts is to give them legal protection. This helps ensure that harmful activities are banned or limited. In Australia, this is achieved mainly through a system of national parks (on land) and marine reserves (in the surrounding seas and oceans).
National parksEach state and territory of Australia has a large number of special places, both coastal and inland, that the government has decided to protect. These might be as small as a single historic house or beach, or as large as a wilderness or national park. Despite the name, virtually all of Australia’s more than 550 national parks are the responsibility of the individual state and territory governments.
Although management strategies differ between states, the common ideals are that the land, plants and animals within the parks have protection from activities that threaten their existence and that people should be able to visit these special places. This can lead to problems, as visitors who come to see these areas in their natural beauty may threaten the very environment they are visiting. The managers of the national parks have the task of controlling what visitors do in each park by limiting or restricting certain activities in sensitive areas.
Marine reservesWhile national parks protect special places on land, Australia’s diverse marine environments also need to be protected. In 2012, the Australian government announced the creation of one of the world’s largest marine reserve networks. Around 3.1 million square kilometres of our oceans are now managed mainly for the purposes of biodiversity conservation. This is an area roughly equivalent to the land area of Queensland and the Northern Territory combined.
Managing a marine reserve is particularly challenging because, unlike national parks on land, fences and signs aren’t easily erected to limit access to particularly sensitive areas. Instead, marine reserves are divided into zones, and certain activities are allowed, banned or limited in each zone. It is the responsibility of anyone who enters a marine reserve to be aware of the activities permitted within each zone.
Every marine reserve in Australia, except for the Great Barrier Reef which is recognised as a special case, has been assigned a particular management category (see Source 2). These are the same as those adopted in other countries and have been developed by the International Union for the Conservation of Nature (IUCN).
3.12 Protecting the coast
Source 1 Royal National Park is Australia’s oldest. Established in 1879, it protects large areas of coastal rainforest and ancient sand dunes.
Source 3 Freycinet Marine Reserve on Tasmania’s east coast includes large areas designated as strict nature reserves due to the biodiversity of the coast’s offshore seamounts (undersea mountains) and bird populations.
116 oxford big ideas humanities and social sciences 10 western australian curriculum
SAMPLE

Marine park
Australian ExclusiveEconomic Zone (EEZ)
L E G E N D
Recreational use zone (IUCN II and IV)
Special purpose zone (IUCN VI)
Multiple use zone (IUCN VI)
National park
General use zone (IUCN VI)
Special purpose zone(oil and gas exclusion) (IUCN VI)
Habitat protection zone(Coral Sea IUCN IV)
Habitat protection and conservationpark zone (IUCN IV)
Santuary and marine national park zone (IUCN Ia and ll) 1550km to Hobart
4100km to Perth
Jardine RiverGreat Barrier Reef
Iron Range
Cape MelvilleLake�eld
MungkanKandju
Mitchell andAlice Rivers
Staaten River
KakaduLitch�eld
KeepRiver
Drysdale River
Ashmore Reef
Ningaloo Cape Range
Kennedy RangeBernierand Dore Island
Shark Bay
Kalbarri
Alexander MorrisonLesueur
Nambung
Yalgorup
Moore River
Cape Le Grande
D’Entrecasteaux
Leeuwin NaturalisteShannon
Mount FranklandStirling Range
Fitzgerald River
NullarborLake
Gairdner
Cof�n Bay
WyperfeldInnesFlinders Chase
CanundaLower Glenelg
Walls of JerusalemFranklin-Lower Gordon
Wild RiversSouthwest
Mount William Douglas-Apsley
Maria Island
OtwayWilsons Promontory
AlpineKosciuszko
Mt Buffalo
Mitchell R.Snowy River
CroajingolongCoopracambra
Wadbilliga
Francois Peron
LumholtzBowling Green Bay
RepulseEungella
GoodedullaBlackdown Tableland
Kroombit TopsCarnarvon Palmgrove Burrum CoastGreat Sandy
Moreton Island
Maaroom
FlindersRanges
Mt RemarkableMurray River
Border Ranges
Cathedral Rock
Myall LakesBlue MtnsNattai
Morton
Dharug
Ku-ring-gai ChaseBudawang
Hat Head
Gibraltar RangeNymboida
MacquarieIsland
Lord HoweIsland
NorfolkIsland
Heard Islandand McDonald Islands
Kings Plains
Lamington
Simpson DesertUluru
Undara VolcanicWooroonooran
DaintreeGreat Barrier Reef
Coringa-HeraldLihou ReefHinchinbrook
Island Great Barrier Reef
Millstream-Chichester
Manton Dam
Cobourg Marine ParkGurig
P A C I F I C
O C E A N
I N D I A N
O C E A N
0 400 800 km
AUSTRALIA: NATIONAL PARKS AND MARINE RESERVES, 2012
Source 4 Source: Oxford University Press
Remember and understand1 In what ways are natural environments protected in
Australia?
2 What are the ideals behind the management strategies implemented in national parks?
Apply and analyse3 Examine Source 4.
a Where are Australia’s largest marine reserves located?
b Describe the location of marine reserves in the state in which you live.
4 Examine Source 1, showing a person in a protected coastal area. Describe what they are doing and how this may impact on the natural environment. How could park managers in this area limit these impacts?
Evaluate and create5 There were many objections to the Australian
government announcement in 2012 that millions of square kilometres of ocean were to become marine reserves. In small groups consider which Australian groups would be likely to support this announcement and which would be likely to oppose it. Brainstorm the arguments that each of these groups would use to support their points of view.
6 Source 4 shows the extent of Australia’s Exclusive Economic Zone (EEZ). Research this area and find out the benefits for Australia in having such a large EEZ. You may also like to find out about the Timor Gap and how this was created.
Check your learning 3.12
117chapter 3 coastal change and management
3B How can coastal changes be managed?
SAMPLE

3.13 Reducing the impacts of coastal tourism
Tourism is the world’s largest industry. It generates more than $US8 trillion a year in income and employs about 220 million people worldwide. Tourism in coastal areas has experienced a surge in recent years, and for many coastal communities it has become the largest contributor to their economy. While tourism has the potential to alleviate poverty and bring better infrastructure such as new roads and public services, it also has the potential to bring about major environmental degradation.
Tourism not only attracts visitors to coastal areas but also locals, who move to the coast for work, providing the goods and services tourists require. Tourism also brings developments such as hotels, jetties, roads, airports and shopping strips, often with minimal or hurried planning. The result is that many coastal tourism hubs are under significant environmental pressure.
The potential negative environmental impacts of tourism are many. Greater numbers of people bring increased pollution and landfill (see Source 1). As ecosystems such as mangroves, wetlands and reefs are removed to make way for hotel developments, there is a subsequent decline in biodiversity and an increased risk of beach loss from erosion and natural disasters.
Source 1 Cruise ships that carry up to 4000 passengers each contribute to the 70 000 tonnes of waste generated annually from tourism in the Caribbean region.
In addition, an increased demand for fresh water, food (especially seafood), energy and sanitation make tourism a huge consumer of natural resources.
Ecotourism: a way forward?Ecotourism is one option that coastal tourism operators are using to make their industry more sustainable. It is also a strong marketing tool, appealing to tourists who want more environmentally friendly travel. The International Ecotourism Society (TIES) defines ecotourism as ‘responsible travel to natural areas that conserves the environment and improves the wellbeing of local people’. TIES believes that those who implement and participate in ecotourism activities should:
• minimise environmental impacts
• build environmental and cultural awareness andrespect
• provide positive experiences for visitors and hosts
• provide direct financial support for conservation
• provide financial benefits and empowerment for localpeople
• ensure sensitivity to the host country’s political,environmental and social climate.
oxford big ideas humanities and social sciences 10 western australian curriculum118
SAMPLE

The Penguin ParadeOne of Victoria’s most popular tourist attractions is the nightly arrival of hundreds of Little Penguins at Summerlands Beach on Phillip Island. This natural event attracts around 1 million visitors per year, more than half of whom are from overseas. As well as a tourist attraction, the Penguin Parade is also an example of minimal impact ecotourism and conservation.
As a non-profit organisation, the Phillip Island Nature Park uses the income generated from the parade to protect, conserve and restore the natural environment of the region. The organisation has become a world expert on the Little Penguins as well as carrying out vital research on seals and seabirds. In order to protect
the penguins, rangers undertake large- and small-scale revegetation and habitat restoration programs. As a result, the penguin population climbed from 19 000 in the 1980s to 32 000 in 2013.
Much of the restoration and revegetation work is on the site of a former housing estate located adjacent to the Penguin Parade. Between 1985 and 2010, the Victorian government purchased and removed hundreds of holiday homes, as well as the roads, gardens, power cables and septic tanks that made up the Summerlands Estate. The area is now prime habitat for the penguins. Future plans include moving the visitor centre and car parks so that the land on which they now sit can also be restored to natural habitat.
For more information on the key concept of sustainability, refer to page 9 of ‘The geography toolkit’.
keyconcept: Sustainability
Source 2 Raised boardwalks and viewing platforms minimise the environmental impact of visitors to the Penguin Parade and allow penguins to move freely from the ocean to their burrows every evening.
Remember and understand1 What is ecotourism?
2 In what ways can the Penguin Parade on Phillip Island be considered to be an example of ecotourism?
Apply and analyse3 Source 1 shows a cruise ship docking at a
Caribbean port. Describe the changes that have been made to the coast as a result of tourism that can be seen in this photo.
4 Compare these changes with those that have occurred at the Penguin Parade.
Evaluate and create5 Imagine that an international tourism operator
has proposed to build a port for cruise ships at Rainbow Beach (see Source 1 on page 110) and that that you have been appointed the company’s environmental consultant. Brainstorm the impacts of this development on the natural environment. Use the ecotourism principles provided to make recommendations that minimise these impacts. Prepare a report for the tourism operator with your recommendations. You may like to include a map and sketches in your report.
Check your learning 3.13
119chapter 3 coastal change and management
3B How can coastal changes be managed?
SAMPLE

Prior to European colonisation in 1788, the coastal areas of Australia supported large numbers of Aboriginal and Torres Strait Islander peoples. The coasts provided a reliable source of food both from the sea and the surrounding land.
Today, nearly half of all Indigenous Australians live near the coast. Many maintain a close association with the coast through cultural and historic connections, through continued use of coastal resources and by law. In the Northern Territory, for example, Aboriginal communities own and manage approximately 85 per cent of the coastal land.
Coastal places with special significance to Indigenous Australians are under the same environmental threats as other coastal places: from population and economic growth, land use changes, climate change and the arrival of invasive species. Indigenous communities are now working with government to restore lands that are important to them. This joint approach means that factors of Indigenous heritage are taken into account when decisions are made about the use and restoration of degraded areas.
Case study: Indigenous management of the Coorong
The land and waters is a living body. We the Ngarrindjeri people are a part of its existence. The land and waters must be healthy for the Ngarrindjeri people to be healthy. We are hurting for our Country. The Land is dying, the River is dying, the Kurangk (Coorong) is dying and the Murray Mouth is closing. What does the future hold for us?
Tom Trevorrow, Ngarrindjeri Elder, Camp Coorong, 2002
The region known as the Coorong, where the Murray River reaches the sea, covers an area of 14 000 square kilometres. The Coorong was recognised as a Wetland of International Importance and as a breeding ground for many bird and fish species by the Ramsar Convention on Wetlands in 1985. Due to a combination of factors, including water extraction in the Murray–Darling Basin, drought and barrages (dams) built across the Murray
3.14 Indigenous management of the coast
Source 1 An oblique aerial photograph of the Coorong, Lower Lakes (including Lake Alexandrina and Lake Albert) and Murray Mouth region of South Australia
to hold back sea water, the region has become severely degraded. In particular, the waters of the Coorong Lagoon and lakes have become saltier than the sea, wetlands have dried out and acidic soils have become exposed. Another cause of this degradation has been the building of dams that collect water during wet seasons and then release this water during dry seasons. This has disrupted the natural cycle of the Murray River of floods and droughts and had a dramatic effect on the natural ecosystems of the river, particularly at its mouth. In some years, so little water flows through the mouth that it closes, cutting off the lakes of the region from the sea.
The traditional owners of the region, the Ngarrindjeri people, maintain a strong connection with the lands and water of the Coorong. They believe that the health of their nation is closely linked to the environmental health of the region, and that a
120 oxford big ideas humanities and social sciences 10 western australian curriculum
SAMPLE

Lake Alexandrina
The Coorong
LakeAlbert
Mur
ray M
outh
Goolwa
Milang
Strathalbyn
Meningie
Tailem Bend
Younghusband Peninsula
Sir RichardPeninsula
Wellington
Langhorne Creek
Currency Creek
ClaytonNarrung
Murray Riv
er
Urban area
Indigenous landNational parkor reserve
Road
RailwayBarrage ordam
L E G E N D
Area ofmap
0 5 10 km
COORONG: INDIGENOUS LANDS AND NATIONAL PARKS
Source 2 Source: Oxford University Press
freshwater flow that allows plants and animals to thrive must be maintained.
The Ngarrindjeri community through the Ngarrindjeri Regional Authority (NRA) has formed a close relationship with the South Australian Department of Environment, Water and Natural Resources (DEWNR) to deal with short-term crises in the region and to plan for a sustainable future. This has resulted in the adoption of a long-term plan which aims to secure a future for the region as a ‘healthy, productive and resilient wetland system that maintains its international importance’. The plan includes a number of specific goals:
• to protect and restore natural habitats
• to restore viable populations of native bird, fish and other animalspecies. Restoring the natural flow of fresh water to the Coorongand Lower Lakes are seen as a key component of this goal.
• to improve water quality and increase flows through thewetlands. It is proposed, for example, that very salty water bepumped out of the lagoon to the sea.
• to recognise the Ngarrindjeri community’s association withthe area.
Large areas of dunes, wetlands and farmland have already beenreplanted using native plant species as the first step in this plan to restore the Coorong area.
Source 3 South Australian Environment Minister Paul Caica and NRA chairman Tom Trevorrow meet at the Coorong in 2012 to sign a new management agreement for the region.
Remember and understand1 Why did many Aboriginal and Torres
Strait Islander peoples live near the coast in the past?
2 Why are the Ngarrindjeri people particularly concerned about the health of the Coorong ecosystems?
Apply and analyse3 Use Source 1 to describe the natural
environment of the Coorong and Lower Lakes. Include the water and land features that you can identify.
4 Examine Source 2.a Describe and account for the
location of Indigenous lands.b Describe the locations of the
barrages. Why have the barrages been built in these places? How would they change the natural environment of Lake Alexandrina and the Coorong?
Evaluate and create5 Use the eight key ICZM principles
shown in Source 2 on page 112 to devise a strategy to improve the health of the Coorong ecosystem.
6 Research which other wetlands in Australia are listed in the Ramsar Convention.
Check your learning 3.14
chapter 3 coastal change and management
3B How can coastal changes be managed?
SAMPLE

3B rich task
Ningaloo CoastOn the north-west tip of Western Australia is one of the world’s most spectacular coastal environments. Long white beaches run along the shore, and visitors can swim out from the beach to Australia’s longest fringing reef (a reef that lies extremely close to shore). The region has about 300 000 visitors a year, many of them arriving between April and July for a chance to snorkel with whale sharks. The region is also home to dugongs and visited by humpback whales and greenback turtles.
Much of the region is under some form of legal protection as part of the Ningaloo Marine Reserve and Cape Range National Park. It is also Australia’s newest World Heritage site, having been added to the World Heritage List in 2011.
Though a remote and relatively pristine area, the Ningaloo Coast faces a number of potential environmental threats. These include:
• oil and gas exploration off the coast
• damage to coral reefs from boat owners anchoring inthe fragile reef areas
• illegal fishing
• plastic bags killing turtles and whales by intestinalblockage
• damage to vegetation from off-road driving
• waste disposal and pollution
• increasing level of water consumption
• potential for bushfires
• invasive species (foxes, goats, cats) destroying orattacking native plants and animals.
Other potential issues in the area include a RAAFbombing range south of Cape Range National Park, which may threaten important limestone caves and sinkholes, and livestock from local farms that could damage vegetation if they are not appropriately managed. In addition, the development of oil and gas reserves in offshore basins and shelves could present a future threat to the coast and reef.
Source 1 The small town of Coral Bay is used as a launching point for whale watching and fishing boats.
Analysing complex mapsComplex maps contain more than one set of information. Geographers use complex maps to analyse different features, reveal patterns and explain links between features in a given area. You can analyse a complex map by following these steps:
Step 1 Look carefully at the map and read its title to make sure you understand what is being shown.
Step 2 Examine the map’s legend. Complex maps can have more than one part to a legend, and these parts will be represented on the map in different ways. For example, in Source 2 areas of colour are used to show the location of recreational use zones and state marine reserves. Different symbols are also used to show roads and coastal water boundaries.
Step 3 Train your eyes to look for one set of information at a time. For example, look at solid blocks of colour on the map and work out what they tell you.
skilldrill
122 oxford big ideas humanities and social sciences 10 western australian curriculum
SAMPLE

LakeMacLeod
Giralia
Learmonth
North West Cape
Coral BayMaud’s Landing
Lefroy Bay
TurquoiseBay
Winderabandi Point
Cape Farquhar
Red Blu�
Point Cloates
Ningaloo
Ning
aloo
Reef
Reef
Exmouth
MuironIslands
E xmouth
Gul fCape
Ran
ge
Gi r
al i
a R
an
ge
Nor
th W
est C
oasta
l Hwy
Tropic of Capricorn
I N D I A N
O C E A N
Defence Reserve
Coral reef
Urban area
World Heritage area boundary
Coastal waters boundary
State marine reserve
Recreational use marine zone (IUCN II)
Multiple use marine zone (IUCN VI)
Cape Range National Park
Main road
Minor road
4WD track
Camping area
L E G E N D
Area ofmap
0 15 30 km
Do some further reading on the Internet to complete the following tasks.
1 Research Ningaloo’s World Heritage listing.
a What does World Heritage mean?
b Why are sites placed on this list?
c Why was the Ningaloo Coast added to the list?
2 In the early 2000s, a large resort and marina called Coral Coast Resort was planned for the coastal area to the north of Coral Bay known as Maud’s Landing. Find out about these plans and why the resort was not built.
Extend your understanding
Source 2 Source: Oxford University Press
NINGALOO: MARINE RESERVE AREASStep 4 Move to a different set of information by selecting another symbol or block of colour from the legend. Examine the map to identify this symbol or area of colour.
Step 5 Look for concentrations of the same symbol in areas to see if patterns exist.
Step 6 Note any patterns you can find on the map between different features and locations.
Step 7 Describe the degree to which patterns are connected.
Step 8 Try to suggest reasons for the connection between the two patterns.
Apply the skillLook at the map of Ningaloo Marine Reserve (Source 2).
1 Find the symbol for multiple use marine zones in the legend and then locate these areas on the map. Describe the concentration of these areas.
2 What relationship is there between the multiple use marine zones and the location of recreational use areas?
3 Describe the location of the Ningaloo World Heritage area.
chapter 3 coastal change and management
3B How can coastal changes be managed?
123
SAMPLE

1090 307721
ISBN 978-0-19-030772-1
Leo Conti | Mark Easton | Joanne WilsonGeraldine Carrodus | Tim Delany | Annie Wilson
hu
man
ities and
social sciences
oxford big ideas
WA oxfordbig ideashumanities and social sciencesWESTERN AUSTRALIAN CURRICULUM
10
visit us at: oup.com.au or contact customer service: [email protected]
-12-31.
SAMPLE