
Human resource management practices and retention of ...
242
HUMAN RESOURCE MANAGEMENT PRACTICES AND RETENTION OF PROFESSIONAL HEALTH WORKERS IN PUBLIC DISTRICT HOSPITALS IN KIGALI, RWANDA BY CELESTIN NDIKUMANA A THESIS SUBMITTED TO THE SCHOOL OF BUSINESS AND ECONOMICS, DEPARTMENT OF HUMAN RESOURCE DEVELOPMENT STUDIES IN PARTIAL FULFILMENT OF THE REQUIREMENTS FOR THE AWARD OF THE DEGREE OF DOCTOR OF PHILOSOPHY IN HUMAN RESOURCE MANAGEMENT MOI UNIVERSITY 2019
-
Upload
khangminh22 -
Category
Documents
-
view
4 -
download
0
Transcript of Human resource management practices and retention of ...

HUMAN RESOURCE MANAGEMENT PRACTICES AND RETENTION OF
PROFESSIONAL HEALTH WORKERS IN PUBLIC DISTRICT HOSPITALS
IN KIGALI, RWANDA
BY
CELESTIN NDIKUMANA
A THESIS SUBMITTED TO THE SCHOOL OF BUSINESS AND
ECONOMICS, DEPARTMENT OF HUMAN RESOURCE DEVELOPMENT
STUDIES IN PARTIAL FULFILMENT OF THE REQUIREMENTS FOR THE
AWARD OF THE DEGREE OF DOCTOR OF PHILOSOPHY IN
HUMAN RESOURCE MANAGEMENT
MOI UNIVERSITY
2019

ii
DECLARATION
Declaration by Candidate
This thesis is my original work and has not been presented in any other
university/institution for consideration of any certification. This research has been
complemented by referenced sources duly acknowledged. Where text, data (including
spoken words), graphics, pictures or tables have been borrowed from other sources,
including the internet, these are specifically accredited and references are cited using
current APA system and in accordance with anti-plagiarism regulations.
Signature_________________________ Date: ____________________
Ndikumana Celestin
Reg. No: SHRD/PhD.H/03/15
Declaration by the Supervisors
This thesis has been submitted with our approval as University Supervisors.
Signature: _________________________ _________________
Prof. Joshua Kwonyike
Department of Development Studies
School of Business Economics
Moi University
Signature: __________________________ _________________
Prof. Ruth Tubey
Department of Quantitative Skills and Entrepreneurship Studies
School of Business and Economics
Moi University

iii
DEDICATION
To
My loved wife, Emerence Umwali
My daughters:
Michelle Ndikumana Atete & Sheila Amelia Ndikumana Kundwa

iv
ACKNOWLEDGEMENT
This work has been completed with assistance from many people to whom I owe a word
of thanks, I am very grateful to my supervisors, Professor Joshua Kwonyike and
Professor Ruth Tubey, for their immense support since my introduction to Moi
University and all the way up to the completion of this work. Their advice, corrections
and remarks have been unwaveringly and wholeheartedly supportive.
I am also thankful to my lecturers in the Department of Development Studies at Moi
University School of Business and Economics for their different supportive comments
and suggestions. Not only have they been resourceful to this research, but also
contributed a lot to the knowledge acquired during my PhD training.
My thanks go to Professor Rama Bokka Rao, my mentor from the College of Business
and Economics, University of Rwanda, for his guidance and encouragements which
contributed a lot to the acquisition of sponsorship for my PhD training. May your
kindness find in this work an expression of special recognition.
I wish to express my gratitude to the Consortium of Advanced Research Training in
Africa (CARTA) for having offered me a fellowship through which my PhD training
was funded. To the CARTA community including the Secretariat, facilitators of
CARTA Joint Advanced Seminars and cohort five fellows, you all deserve a word of
recognition for your supportive inputs that helped me to sharpen this work and my
research skills. To my colleague, Mr. Sheick Mbaye Faye from the African Population
and Health Research Centre (APHRC), I would like to express a special gratitude to
you for your contribution to this work.
I would like to express my sincere gratitude to the University of Rwanda for having
contributed to my PhD training by providing me with a study leave.
My heartfelt appreciation goes finally to my classmates at Moi University for having
been collaborative and supportive during this journey.
May God bless you all.

v
ABSTRACT
Retaining the health workforce has been considered as an important pillar to the health
system. However, the challenge of human resources for health in terms of turnover of
health workers in Rwanda has been more pronounced in the recent years. The purpose
of this study therefore, was to investigate the influence human resource management
practices on the retention of professional health workers in public district hospitals in
Kigali. The study objectives were: to establish the effect of performance management
function on the retention of professional health workers, to determine the effect of
financial incentives on the retention of professional health workers, to establish the
effect of non-financial incentives on the retention of professional health workers, and
to determine the effect of participation and involvement in the decision-making on the
retention of professional health workers. The study was devised in the social exchange
theory and the equity theory as its underpinning theoretical framework . Grounded in
the philosophical paradigm of pragmatism, the study used a cross-sectional research
design with a mixed-methods approach. With a population of 402 individuals, the study
considered a sample of 252 respondents including doctors, nurses, midwives,
pharmacists and dentists from 3 district hospitals. The study instruments entailed a
questionnaire as quantitative data collection tool, and interviews and focus group
discussions as qualitative data gathering tools. To analyse quantitative data, descriptive
statistics were used to assess the perceived status of human resource management
practices and the magnitude of intentions to stay, and inferential statistics used to show
the effect of predictors on the outcome variable by plotting a multiple linear regression.
Qualitative data were analyzed in themes and reported in narrative and verbatim quotes,
and were used to complement descriptive findings for better understanding of the
magnitude of the study variables. The findings of this study showed a significant and
positive effect of performance management function (β=0.183; P=0.004), financial
incentives (β=0.189; P=0.003), non-financial incentives (β=0.108; P=0.007) and
participation and involvement in decision-making (β=0.425; P=0.000) on retention of
health workers. This study is expected to be a major contributor for the improvement
of the health system in the country and other similar settings as it has provided the
insights for strategic orientation in the area of human resources for health, especially
for enhanced retention strategies in relation with integrated human resource
management approach.

vi
TABLE OF CONTENT
DECLARATION ........................................................................................................... ii
DEDICATION .............................................................................................................. iii
ACKNOWLEDGEMENT ............................................................................................ iv
ABSTRACT ................................................................................................................... v
TABLE OF CONTENT ................................................................................................ vi
LIST OF TABLES ........................................................................................................ xi
LIST OF FIGURES .................................................................................................... xiii
ABBREVIATIONS AND ACRONYMS ................................................................... xiv
OPERATIONAL DEFINITION OF TERMS ............................................................. xv
CHAPTER ONE .......................................................................................................... 1
INTRODUCTION........................................................................................................ 1
1.0 Overview .................................................................................................................. 1
1.1 Background to the Study .......................................................................................... 1
1.2 Statement of the Problem ......................................................................................... 5
1.3 Research Objectives ................................................................................................. 8
1.3.1 General Objective .............................................................................................. 8
1.3.2 Specific Objectives ............................................................................................ 8
1.4 Hypothesis................................................................................................................ 8
1.5 Significance of the Study ......................................................................................... 9
1.6 Scope of the Study ................................................................................................. 10
CHAPTER TWO ....................................................................................................... 12
LITERATURE REVIEW ......................................................................................... 12
2.0 Overview ................................................................................................................ 12
2.1 Theoretical Framework .......................................................................................... 12
2.1.1 Social Exchange Theory.................................................................................. 12
2.1.2 Equity Theory .................................................................................................. 17
2.2 The Concept of Employee Retention ..................................................................... 18
2.3 Human Resource Management Models ................................................................. 20
2.3.1 The Harvard Model of HRM ........................................................................... 20
2.3.2 The Guest Model of HRM .............................................................................. 22
2.3.3 The Michigan Model of Human Resource Management ................................ 25
2.4 Indicators of Human Resource Management Practices ......................................... 27

vii
2.4.1 Performance Management Function ............................................................... 28
2.4.2 Financial Incentives......................................................................................... 31
2.4.3 Non-financial Incentives ................................................................................. 33
2.4.4 Employee Participation and Involvement in Decision-making....................... 35
2.5 Human Resource Management Practices and Employee Retention ...................... 39
2.5.1 Performance Management Function and Retention of Employees ................. 40
2.5.2 Financial Incentives and Employee Retention ................................................ 41
2.5.3 Non-financial Incentives for Retention of Employees .................................... 44
2.5.4 Involvement and Participation in Decision-Making and Employee Retention
.......................................................................................................................... 47
2.5.5 Human Resource Management Practices and Employee Retention in the
Health Care Setting .......................................................................................... 49
2.6 Study Gaps ............................................................................................................. 53
2.7 Conceptual Framework .......................................................................................... 54
2.8 Operationalization of the Study Variables ............................................................. 56
CHAPTER THREE ................................................................................................... 57
RESEARCH METHODOLOGY ............................................................................. 57
3.0 Overview ................................................................................................................ 57
3.1 Area of the Study ................................................................................................... 57
3.2 Research Philosophy .............................................................................................. 59
3.3 Research Design..................................................................................................... 62
3.4 Target Population ................................................................................................... 64
3.5 Sample Design and Procedure ............................................................................... 65
3.5.1 Sampling Techniques ...................................................................................... 65
3.5.2 Sample Size ..................................................................................................... 66
3.6 Data Collection Methods and Procedures .............................................................. 69
3.6.1 Sources of Data ............................................................................................... 69
3.6.2 Data Collection Instruments ............................................................................ 69
3.6.2.1 Questionnaire ............................................................................................ 69
3.6.2.2 Interview Guide ........................................................................................ 71
3.6.2.3 Focus Group Discussion Guide ................................................................ 71
3.6.3 Data Collection Procedures ............................................................................. 72
3.7 Measurement of the Study Variables ..................................................................... 74
3.7.1 Dependent Variable-Retention ........................................................................ 74

viii
3.7.2 Independent Variable-HRMPs ........................................................................ 74
3.7.3 Control Variables ............................................................................................ 76
3.8 Reliability and Validity .......................................................................................... 77
3.8.1 Reliability of Instruments ................................................................................ 77
3.8.2 Validity of Instruments.................................................................................... 78
3.9 Data Processing and Analysis ................................................................................ 79
3.9.1 Data Processing ............................................................................................... 79
3.9.2 Data Screening ................................................................................................ 80
3.9.3 Data Analysis .................................................................................................. 80
3.9.3.1 Descriptive Statistics ................................................................................ 80
3.9.3.2 Correlation Analysis ................................................................................. 82
3.9.3.3 Regression Model and Regression Analysis ............................................ 82
3.9.3.4 Underlying Assumptions of Multiple Linear Regression ......................... 84
3.9.3.5 Qualitative Data Analysis ......................................................................... 85
3.9.3.6 Triangulation of Data ............................................................................... 86
3.10 Limitations of the Study....................................................................................... 86
3.11 Logistical Considerations..................................................................................... 87
3.12 Ethical Considerations ......................................................................................... 88
CHAPTER FOUR ...................................................................................................... 90
DATA ANALYSIS, PRESENTATION AND INTERPRETATION OF
FINDINGS .................................................................................................................. 90
4.0 Overview ................................................................................................................ 90
4.1 Data Preparation and Screening ............................................................................. 90
4.1.1 Reliability of Instruments ................................................................................ 90
4.1.2 Response Rate ................................................................................................. 91
4.1.3 Missing Data ................................................................................................... 91
4.1.4 Analysis of Outliers ......................................................................................... 92
4.2 Demographic Characteristics of Respondents ....................................................... 92
4.3 Performance Management Function .................................................................... 101
4.4 Financial Incentives ............................................................................................. 111
4.5 Non-financial Incentives ...................................................................................... 119
4.6 Participation and Involvement in Decision-Making ............................................ 133
4.7 Intentions to Stay ................................................................................................. 139
4.8 Factor Analysis .................................................................................................... 140
ix
4.8.1 Factor Analysis for Performance Management Function ............................. 142
4.8.2 Factor Analysis for Financial Incentives ....................................................... 146
4.8.3 Factor Analysis for Non-financial Incentives ............................................... 149
4.8.4 Factor Analysis for Participation and Involvement in Decision-making ...... 153
4.8.5 Factor Analysis for Retention ....................................................................... 157
4.9 Testing Assumptions of Linear Regression Analysis .......................................... 157
4.9.1 Linearity ........................................................................................................ 157
4.9.2 Normality ...................................................................................................... 157
4.9.3 Homoscedasticity .......................................................................................... 158
4.9.4 Multicollinearity ............................................................................................ 159
4.10 Correlation Analysis .......................................................................................... 159
4.11 Hypotheses Testing ............................................................................................ 161
CHAPTER FIVE ..................................................................................................... 166
SUMMARY OF FINDINGS, CONCLUSIONS AND
RECOMMENDATIONS ......................................................................................... 166
5.0 Overview .............................................................................................................. 166
5.1 Summary and Discussion of Findings ................................................................. 166
5.1.1 Effect of Performance Management Function on the Retention of Health
Workers in the Public District Hospitals ....................................................... 166
5.1.2 Effect of Financial Incentives on the Retention of Health Workers in the
Public District Hospitals ................................................................................ 168
5.1.3 Effect of Non-Financial Incentives on the Retention of Health Workers in the
Public District Hospitals ................................................................................ 171
5.1.4 Effect of Participation and Involvement in Decision Making on the Retention
of Health Workers in the Public District Hospitals ....................................... 175
5.2 Conclusions .......................................................................................................... 177
5.3 Implication of the Study to Theory and Practice ................................................. 179
5.3.1 Contribution to Theory .................................................................................. 179
5.3.2 Contribution to Practice ................................................................................ 181
5.4 Recommendations ................................................................................................ 182
5.5 Further Research .................................................................................................. 183
REFERENCES .......................................................................................................... 184
APPENDICES ........................................................................................................... 206

x
Appendix 1: Human Resource Management Practices and Intentions to Stay
Survey Questionnaire ......................................................................... 206
Appendix 2: Human Resource Management Practices and Intentions to Leave
Interview Guide for Professional Health Workers ............................. 213
Appendix 3: Focus Group Discussion Guide ........................................................ 215
Appendix 4: Consent Form I ................................................................................. 217
Appendix 5: Consent Form II ................................................................................ 219
Appendix 6: Map of Kigali City ............................................................................ 220
Appendix 7: Data Collection Authorization provided by the School ................... 221
Appendix 8: Research Clearance .......................................................................... 222
Appendix 9: Data Collection Authorization-Hospital 1 ........................................ 223
Appendix 10: Data Collection Authorization-Hospital 2 ...................................... 224
Appendix 11: Data Collection Authorization-Hospital 3 ...................................... 225
Appendix 12: Normal P-P Plot of Regression Standardized Residual .................. 226
Appendix 13: Regression Standardized residual ................................................... 227

xi
LIST OF TABLES
Table 2.1: Stereotypes of personnel management and human resource management . 23
Table 2.2: The Guest Model of HRM .......................................................................... 24
Table 2.3: Operationalization of the Research Variables ............................................ 56
Table 3.1: Distribution of the target population........................................................... 64
Table 3.2: The total sample size and the sample size for each stratum ....................... 69
Table 3.3: The progression of interviews and definition of changes by rounds of
activities ..................................................................................................... 73
Table 3.4. Interpretation of the mean range in a four-point Likert scale ..................... 81
Table 4.1: Reliability tests results. ............................................................................... 90
Table 4.2: Social and demographic characteristics of respondents ............................. 94
Table 4.3: Perceived status of implementation of performance management function
.................................................................................................................. 104
Table 4.4: Perceived level of availability and provision of financial incentives ....... 114
Table 4.5: Perceived status of non-financial incentives............................................. 123
Table 4.6: Perceived level of participation and involvement in decision-making ..... 135
Table 4.7: Perceived intention to stay in the hospital ................................................ 140
Table 4.8: KMO and Bartlett’s test for performance management function ............. 142
Table 4.9: Performance Management Function Total Variance Explained ............... 143
Table 4.10: Rotated Factor Loadings for Performance Management Function ......... 144
Table 4.11: KMO and Bartlett’s test for financial incentives .................................... 146
Table 4.12: Financial Incentives Total Variance Explained ...................................... 146
Table 4.13: Rotated Factor Loadings for Financial Incentives .................................. 147
Table 4.14: KMO and Bartlett’s test for non-financial incentives ............................. 149
Table. 4.15: Non-Financial Incentives Total Variance Explained ............................. 149
Table 4.16: Rotated Factor Loadings of Non-Financial Incentives ........................... 150
Table 4.17: KMO and Bartlett’s test for participation and involvement in decision-
making...................................................................................................... 154
Table 4.18: Participation and Involvement in Decision-Making Total Variance
Explained ................................................................................................. 154
Table 4.19: Rotated Factor Loadings of Participation and Involvement in Decision-
Making ..................................................................................................... 155
Table 4.20: Testing of normality ............................................................................... 158

xii
Table 4.21: Results of multicollinearity test .............................................................. 159
Table 4.22: Correlation matrix of the study variables ............................................... 160
Table 4.23: Model summary ...................................................................................... 161
Table 4.24: Results of Regression Analysis .............................................................. 163
Table 4.25: Summary of hypotheses testing .............................................................. 165

xiii
LIST OF FIGURES
Figure 1: Harvard Model of HRM ............................................................................... 21
Figure 2: Typical Performance Management Process ................................................. 30
Figure 3: Conceptual framework of effect of human resource management practices
on retention ................................................................................................... 55

xiv
ABBREVIATIONS AND ACRONYMS
CVI : Content Validity Index
DV : Dependent Variable
HR : Human Resource
HRH : Human Resources for Health
HRM : Human Resource Management
HRMPs : Human Resource Management Practices
ILO : International Labor Organization
IR : Irrelevant
ISCO : International Classification of Occupation
IV : Independent Variable
MINALOC : Ministère de l’Administration Locale
MINISANTE : Ministère de la Santé
MOH : Ministry of Health
RDB : Rwanda Development Board
ROI : Return on Investment
SPSS : Statistical Package for Social Sciences
WHO : World Health Organization
ROI : Return on the Investment
PMF : Performance Management Function
FI : Financial Incentives
NFI : Non-financial Incentives
PIDM : Participation and Involvement in Decision-Making
IS : Intention to Stay
RSSB : Rwanda Social Security Board

xv
OPERATIONAL DEFINITION OF TERMS
Human Resource Management (HRM): it is the function of the organization having
systems and policies aiming at people within that organization.
Employee incentive: it refers to a scheme devised by employers and prescribed to
employees for them to do the job, in terms of compensation,
recognition, reward or appreciation.
Involvement and participation: it is the process of empowering employees by
allowing them to participate in the organization decision-
making processes, in order to improve activities that happen at
different levels of the organization.
Performance management function: it is a process throughout which employers
evaluate employees’ performance, and whereby management
measures performance against planned targets, provides
feedback to employees and documents recommendations for
future management action.
Intention to stay: it refers to the employee considering to remain in the present
employment relationship with their current employer on long-
term basis.
Professional health worker: a professional health worker in this study will be any of
the professional health staff in the public district hospital
including doctors (specialists or practitioners), midwifes,
nurses, pharmacists and dentists.
District Hospital: it is a hospital at District level that receives referrals from and
provides general support to health centres, and which works
under a referral hospital.
Public Hospital: it is a hospital owned by the government and which receives the
government funding.

1
CHAPTER ONE
INTRODUCTION
1.0 Overview
This chapter relates to the background to the study, statement of the problem, the
purpose and specific objectives of the study, the study hypotheses, the scope and
significance of the study.
1.1 Background to the Study
The concept of human resource management practices is traced back long time ago, as
old as human resource management (HRM) itself (Aslam, Aslam, Ali, Habib, & Jabeen,
2013). In fact, the first human resource management practices are traced back in the
ancient China where they [HRMPs] were applied in the army and where the
organization of tasks and jobs required good leaders to initiate organizational activities
(Aslam et al., 2013). During this period of time, so many organized activities were
performed in different areas and they can be associated with practices similar to human
resource management in its modern application.
Modern human resources management goes back to the 18th century with the industrial
revolution era. During this time, the idea that people are important assets to the
organization and that their wellbeing needs to be taken with much consideration started
to evolve from the views of Robert Owen and Charles Babbage (Aslam et al., 2013).
By advancing the argument that people were crucial to the success of organizations, the
two men advocated for the wellbeing of employees. They stressed that employee
wellbeing could lead to perfect work and that there was no survival for organizations
which did not take care of their employees’ wellbeing.

2
With the influence of Frederick Winslow Taylor (1856-1915), human resource emerged
as a specific field and stood as a matter of focus in the 20th century (Rotich, 2015).
During this period of time, much attention was shifted to the improvement economic
efficiency and the key eye was on the inputs that could effectively contribute to the
manufacturing process and thereafter improve productivity. In the 1970s, there was an
introduction of the HR Management (Aslam et al., 2013). In fact, the introduction of
new technologies was followed by existence of multinational organizations, where a
sense of globalization was starting to spread around the world. With regard to this, the
Personnel Departments became Human Resource Departments that needed to deal with
a growing workforce in the global context (Aslam et al., 2013).
Due to a large pool of workers in the 1980s, changes in the practices relating to work
processes were observed as the managers’ targets started to shift to increased
productivity while at the same time they wanted to reduce the number of employees.
As for that, for example, HRM tasks moved from attracting candidates to selection of
employees (Aslam et al., 2013). During this time, the HRM function also was concerned
with attracting attention of personnel practitioners, and the managers’ concern was the
workforce that would contribute to excellence of organizations, moving away from
traditional practices that brought to adversarial industrial relations (Taylor, 2011).
The changes that occurred in the economic background in the 1990s onwards came with
another way of thinking in the area of Human Resource Management. In fact, the
increase in the pace of globalization, progress in the high tech especially with the spread
of internet and web services became hectic rivalry (Becker, Huselid, & Ulrich, 2001).
This made organizations consider human resource management function with much
more attention and give it a strategic level of importance in the organization, and from

3
that time onwards, the overall function of human resource management took the move
towards attracting, preserving and holding talented intellectual capital.
In view of the above consideration of human resource management, there have been so
many attempts to describe HRM practices as organizational activities that
organizational management implements towards employees as a way of ensuring there
is a fulfillment of organizational goals (Schuler & Jackson, 1987b). Human resource
management practices being a very old concept therefore, many researchers have
identified them under different names. De kok, Uhlaner & Thurik (2003) referred to
them as best practices; they have been described as high-performance practices by
Huselid (1995), or formal (de Kok & Uhlaner, 2001), or sophisticated (Golhar &
Deshpande, 1997) or as professional (Gnan & Songini, 2003). In the words of Pfeffer
(1998), the most appropriate term given to them is “best HRM practices”. From these
different points of view, there is no single way of grouping these activities in a set of
practices. However, it arises from these different considerations that these practices
commonly refer to organizational practices towards employee recruitment and
selection, employee rewards, communication, participation and involvement, and
performance management.
The concept of employee retention relates to undertaking taking measures to encourage
and make employees to remain in the organization for the maximum period of time
(Griffeth & Hom, 2001) It determines the organizational present and long term capacity
to retain employees (Kyndt, Dochy, Michielsen, & Moeyaert, 2009a). Employee
retention has therefore been a matter of focus in today’s work environment because the
organization survival relies a lot on its capacity to retain key employees (Aquino,
Griffeth, Allen, & Hom, 1997)Therefore, recruitment of skilled employees who have
the capacity to serve the organization does not stand just stand alone, but it calls for

4
organizations to devise strategies aiming at retaining the workforce (Kyndt et al.,
2009a) While employee retention constitutes one of the most critical issues that
organizations are facing today(Allen, 2008) (Allen, 2008), it becomes imperative for
all organizations to invest in and retain the human capital. As a matter of fact, in
addition to organizational capacity to handle customer satisfaction and organizational
performance and many other variables, being able to retain key employees is a major
determinant of the organizational ability to maintain its long-term health and success
(Bidisha & Mukulesh, 2013).
The need for continuous focus on employee retention is associated with the nature of
challenges that organizations are facing today (Arachchillage & Senevirathna, 2017).
These challenges concern the growing pressure of globalization, innovation in
technology and global competition on the continuing move (Burke & Ng, 2006) in
today’s organizational environment. In order to overcome challenges that are associated
with these factors, organizations need to retain skilled employees because their
knowledge and skills play an important role for the survival of organizations (Kyndt,
Dochy, Michielsen, & Moeyaert, 2009b).
As organizations continue to put much more focus on employee retention, this practice
has spread in different sectors of business environment (Albano & Leaver, 2005;
Lethbridge, 2017; Nettle, Semmelroth, Ford, Zheng, & Ullah, 2011; Salman, Ahmad,
& Matin, 2014). In the health sector, employee retention has been given much more
consideration because human resources for health are among the core foundations of
the health system (World Health Organisation, 2010) as it was also stressed through the
United Nations Millennium Development Goals (L. Chen et al., 2004; Danon-Hersch
& Paccaud, 2005) that were formulated to facilitate the achievement of health targets

5
by 2015. It is argued that countries can make health systems viable if only they can
embark on the investment into the retention of health workforces (Lehmann, Dieleman,
& Martineau, 2008)
Bonenberger, Aikins, Akwengo & Wyss (2014) state that when the health workforce is
well motivated and consider to remain, institutions take a lot of advantage in the
optimization of team relations, strong relationships between the staff and local
communities and building up of necessary competencies to perform duties, which leads
to optimum care service delivery(Willis-Shattuck et al., 2009) (Willis-Shattuck et al.,
2009).
1.2 Statement of the Problem
The management scenario in the era of globalization, increase in work knowledge and
accelerating rate of technological advancement among other trends, require
organizations not only strive to acquire competent employees but also and most
importantly make critical efforts to retain the key human capital (Josan, 2013). In order
to prevent loss of competent employees caused by unnecessary turnover, organizations
hinge on employee retention as strategic issue to maintain the overall targeted
productivity and quality of services offered (Schuler & Jackson, 1987a).
In the health care setting, the 2000 WHO report argues that human resources are the
most important inputs of the health system (World Health Organisation, 2000) for their
skills and experience are of great intellectual capital on which hinge any success of the
health care system. The retention of health workers as a major input to boost the health
system being important in this context, though, the health sector is suffering the
shortage of health personnel especially in developing countries (Lowell, 2003; Mensab,
2008; Pang, Lansang, & Haines, 2002; Sapkota, Teijlingen, & Simkhada, 2014), and in

6
many cases this situation is explained by lack of capacity to retain health employees for
many organizations.
In fact, turnover is noticed as a big challenge in many health care institutions and while
health worker migration is not confined to external movement, in-country migration,
from rural to urban and from public to private sector, is also creating problems like
leaving some of institutions both understaffed and/or with staff who are often under
qualified (El-Jardali, Tchaghchagian, & Jamal, 2009). As it is argued by the WHO
(2006), poor retention strategies make health care institutions carry the burden of
turnover and its associated challenges including disruptions, increased staff workload,
loss of institutional knowledge, reduction of morale among team members and all in all
inefficiencies in work processes.
Turnover of health workers being an issue of concern in developing countries, the
situation becomes very complex in sub-saharan Africa with both internal and external
migration of the health personnel. Connell, Zurn, Stilwell, Awases, & Braichet (2007)
state that in this area Africa is faced with challenges of turnover in the health sector
caused by external migration of the health personnel.
The problem of turnover among health workers is also stressed in the countries in the
region. For example, a study conducted in Uganda (Hagopian, Zuyderduin,
Kyobutungi, & Yumkella, 2009) shows that health institutions in this country are faced
with important cases of turnover. In the same view point, the issue of intentions to leave
and turnover in health care institutions has also been documented by Kenyan
researchers (Mwaniki & Dulo, 2008) where doctors and nurses migrate to other
countries or leave public health facilities for private health care institutions.

7
As for other developing countries especially in sub-saharan Africa and the region,
Rwanda is also suffering from high turnover rates among professional health workers.
In fact, there is growing evidence that the issue of retention of professional health
workers in public district hospitals in Rwanda has been more pronounced in recent
years (Friederike, 2009; Habarugira, 2012; Lievens, Serneels, Butera, & Soucat, 2010;
MINISANTE, 2014). In fact, the challenge of the gap in Human Resources for Health
in the country (Condo et al., 2014) expressed by insufficient number of qualified staff
(MINISANTE, 2014) does not stand alone, but it is aggravated by high rates of turnover
among professional health workers (Habarugira, 2012; Kamanzi & Nkosi, 2011;
MINISANTE, 2014; Nkomeje, 2008). For instance, available figures show 11.3% of
the rate of turnover among doctors in public district hospitals in Rwanda between 2010
and 2013. For the year 2014 only, the rate of turnover was 12.8% and 10.9 among
doctors and nurses (and midwives) respectively (MINISANTE, 2014).
As a result of this obstruction in the health sector, health care institutions-especially
district hospitals as major units of health care service provision in Rwanda-will
continue to have difficulties to deliver quality of services, persisting workflow
inefficiencies, repetitive costs related to hiring the health workforce and dissatisfaction
of patients, all of which have significant negative effects on quality of care and patient
safety. This being a matter of concern for human resources for health in the country,
the study intends to find out whether a management approach can respond to the
persisting turnover challenges by investigating into the magnitude of existing human
resource management practices in public district hospitals in Rwanda and their effect
on professional health workers’ intentions to stay in the health care institutions and
health care service delivery.

8
1.3 Research Objectives
1.3.1 General Objective
The general objective of this study was to establish the influence of human resource
management practices (HRMPs) on the retention of professional health workers in
public district hospitals in Rwanda.
1.3.2 Specific Objectives
The specific objectives of this research were:
1. To establish the effect of performance management function on the retention of
professional health workers in the public district hospitals in Kigali, Rwanda
2. To determine the effect of financial incentives on the retention of professional
health workers in the public district hospitals in Kigali, Rwanda
3. To establish the effect of non-financial incentives on the retention of
professional health workers in the public district hospitals in Kigali, Rwanda
4. To determine the effect of participation and involvement in the decision-making
on the retention of professional health workers in the public district hospitals in
Kigali, Rwanda.
1.4 Hypothesis
The study tested the following four null hypotheses
H01: Performance management function has no statistically significant effect on the
retention of professional health workers in the public district hospitals in Rwanda.
H03: Financial incentives have no statistically significant effect on the retention of
professional health workers in the public district hospitals in Rwanda.
H03: Non-financial incentives have no statistically significant effect on the retention of
professional health workers in the public district hospitals in Rwanda.

9
H04: Employee participation and involvement in decision-making has no statistically
significant effect on the retention of professional health workers in the public
district hospitals in Rwanda.
1.5 Significance of the Study
This study being conducted in the area human resource management, its contribution
lies in the efforts to devise relevant intervention measure aiming at retaining
professional health workers in Rwanda. In fact, the results of this study are important
to human resource managers in Rwanda, hospital management in general especially
human resources for health planners, and HR professionals in the health care service
delivery, the health workforce (including doctors, nurses, dentists, pharmacists, etc) and
the world of academics in the health system.
In the first instance, the study findings will inform hospital management authority and
health planners. As for that, the problem of health care turnover continuing to grow in
the public health care institutions, these players will be informed of the levels of human
resource management practices in public district hospitals, the extent of intentions to
stay and the effect of the former on the latter to take subsequent and appropriate action.
Results of the study may also be used to assist health care planners in formulating
strategies to increase retention rates, job satisfaction and organizational commitment
among health employees.
Second, the findings of the study will also benefit the health workforce including
doctors, nurses, midwives, pharmacists and dentists as beneficiaries of best
management practices. By considering both financial and non-financial incentives,
health workers’ involvement and participation in decision-making processes, and
effective performance management function in hospitals leads to job satisfaction, the

10
human resource management bodies and health care planners’ action in relation with
the will to reduce turnover intentions and turnover will benefit employees by devising
a different intervention measures in their favor. Health care service delivery being at
the centre of any intervention in the health care setting, it is anticipated that by creating
rooms for reduced turnover in the hospitals, patients will also benefit from stable health
workers upon whom best management practices instill the increased levels of
satisfaction and commitment to their organization and duties.
The third and final significance lies in the study’s theoretical consideration as it
advances knowledge and understanding of how key HRM interventions affect
employee retention in health care institutions. In this regard, the findings of the study
add to the current dearth of literature of Human Resources for Health. The
interdisciplinary nature of this study also justifies its significance due to the approach
of bringing into play the application of social sciences on health studies, which
therefore explores the retention of health workers through different HRM practices. The
area of study being currently under researched, this research provides new data to test
western theories and assumptions found in HRM studies about employee retention,
especially in the health care setting.
1.6 Scope of the Study
This study was conducted in the area of human resource management. More
specifically, it focused on human resource management practices and their influence on
the institutions’ capacity to retain employees. In fact, the study covered human resource
management practices that are believed to affect employee retention. These are
implementation of performance management function, financial and non-financial
incentives, and involvement and participation decision-making processes. The study

11
participants being health workers who were employed in the hospitals where the study
was conducted, the concept of retention concerned professional health workers’
intentions to stay as the latter are major predictors of retention. In this view, the study
investigated on health workers’ perceived levels of existence, availability and provision
of human resource management practices in the health institutions, and whether they
are intending to stay in the hospital or health care service delivery for the next three
years.
Using cross-sectional research design, the study was implemented in 3 public District
hospitals in Kigali city, and data collection was performed between May and June 2017,
then covering a period of four months.
The study participants were professional health workers including doctors (both
generalist and specialist practitioners, and public health doctors), nursing professionals
(including public health nurses), midwifery professionals (including public health
midwives), pharmacists and dentists. The definition of a professional health worker was
the basis for the inclusion and exclusion criteria of the study participant as
recommended in the International Standards Classification of Occupations as
professional health workers in the literature of Human Resources for Health
(International Labour Organization, 2012).

12
CHAPTER TWO
LITERATURE REVIEW
2.0 Overview
This chapter opens with a theoretical framework and focuses on previous research
knowledge about human resources management practices and employee retention.
Literature describing the nature of human resource best practices that relate to employee
retention, in relation with performance management function, financial and non-
financial incentives, and employee participation and involvement in organizational
decision making processes. The concept of retention was also reviewed. Finally,
empirical literature of human resource management practices and employee retention
was reviewed. The selection of documents to use and their importance priority
depended on their relevance to the developed topic and whether they provide current
knowledge in the field of study.
2.1 Theoretical Framework
2.1.1 Social Exchange Theory
The development of the Social Exchange Theory is traced back to almost five centuries
ago taking its early footsteps with the works of Thibaut & Kelley (1959) but Homans
(1961) is recognized as the founder of the theory which later kept being enriched by
inputs from other different theorists. For example, Blau (1964) and Emerson (1976)
contributed to the SET by developing more on the exchange perspective as it applies
within the field of sociology. The theory is founded on both psychological and
sociological frameworks that theorize that cost-benefits analyses and the comparison of
alternatives are the foundations of human relationships within the context of social
exchange (Homans, 1961).

13
The social exchange theory is fundamentally grounded on the two main concepts:
reciprocity and equity (Homans, 1961), which both generally communicate that the
individual comfort derives from their perceiving that the benefits received from a
relationship are equal or almost equal to the efforts produced as inputs to that
relationship, which determines the type of response after such a perception. In fact, the
main characteristic of social exchanges is the feeling of equity, which in turn implies
reciprocity to be present (Cropanzano & Mitchell, 2005). Therefore, the individual level
of relative perception of satisfaction will lead to a more likelihood of reciprocity, and
such satisfaction in the exchange of relationships will more likely push them to maintain
the relationship. In that context, social exchange theory proposes motivation as the
outcome of rewards individuals gain from social exchanges, and in the absence of
which [rewards] they are motivated to avoid costs: either punishments or counterfeit
rewards from that relationship in the social exchanges (Blau, 1968; Homans, 1958).
In the words of Homans cited by Emerson (1976), the system of social exchange was
summarized in three main propositions: (1) success proposition suggesting that
individuals feeling that there are rewarded for their actions will respond with a tendency
to repeat the action; (2) the stimulus proposition basing on the assumption that the more
often a particular stimulus resulted in the past will create the likelihood of responding
to it in the future and (3) the deprivation-sanitation proposition suggesting that the more
often the individual has received the reward in the past, the less value s/he will attach
to any further unit of that reward
As it is captured in the work of Aryee, Bdhwar & Chen (2002), the social exchange
theory in the work environment views the employment relationships as both social
and/or economic exchanges. Described as short-term relationships economic exchange
relationships involve weaker interpersonal relationships, characterized by the fact that

14
there are bargained or binding arrangements enforceable through legal sanctions (Blau,
1964), working as bilateral transactions between two parties (Molm, 2003). As it is
learnt from Blau [ibid] long-term relationships are created by social exchanges, which,
initiated by organizations through a particular treatment of their employees, are founded
on the assumption that the latter will reciprocate in response to such a treatment from
organizations.
The starting point of social exchange relationships as non-negotiated exchanges in the
work environment is when the organization is perceived by its employees as valuing
their inputs and contributions and caring for their overall wellbeing (Eisenberger,
Fasolo, & Davis-Lamastro, 1990). It is on this basis, therefore, that employees in turn
will reciprocate with positive attitudes and behaviors at work, as they build on such
perceptions that the organization is equitably dealing with them (Aryee et al., 2002;
Haas & Deseran, 1981). This argument of social exchange attached to the norm of
reciprocity is also stressed by Gouldner (1960), and Settoon, Bennett & Liden (1996)
Selton. The latter emphasize that high quality exchanges are established by the direction
of positive beneficial actions towards employees initiated by organizations and/or their
representatives, and this in turn pushes employees to reciprocate in a positive ways
benefiting the organizations. In this view point, the availability and provision of training
and development programs to employees will be reciprocated by desirable work-related
behaviors (Haas & Deseran, 1981; Moorman, Blakely, & Niehoff, 1998), and the
people representing the organizations, like managers, will be the ones to engage in
social exchange with employees as institutions themselves as parties in the relationships
cannot have perceptions towards their members (Aryee et al., 2002).
In the area of Human Resource Management, the social exchange theory serves as an
approach to understand the relationships that exist between human resource

15
management practices that are devised by organizations towards employees and the
response of the latter being considered as the reciprocal reaction. In fact, in contrast
with hard human resource management practices (Storey, 1989) which fully had a focus
on reduction of labor costs and increasing efficiency through procedures and rules
aiming at controlling employees, soft human resource management practices (Legge,
1995) are based on the mutual interests between organizations and employees, through
their empowerment, development and trust for enhanced worker and organizational
performance.
Pfeffer (1998) and Marchington & Grugulis (2000) consider soft human resource
management practices as high commitment practices that signal management positive
treatment of employees through greater worker empowerment and involvement in
decision-making processes; extensive communication, training opportunities aiming at
task-related skills and personal development, team-working activities that encourage
ideas for creative solutions, provision of adequate reward packages in relation with
worker effort, reduction of status between management and staff, blue collar and white
collar workers, with all workers valued regardless of their role within the organisation.
In response to such practices, basing on the assumption that employees’ voluntary
actions including intentions to stay (or leave) derive from their perceptions on the
expected returns from their contributions to the organization (Osman, Noordina, Dauda,
& Othmanb, 2016), the theory explains the reciprocal processes of the relationships
between employers and workers (Wittmer, Martin, & Tekleab, 2010). Therefore, the
reciprocity relationships as established between two parties will affect individual
behaviors including motivation and lower or no decisions to withdraw from the
institution, and failure in this exchange relationships will lead to opposite behaviors
including consideration to leave the organization (Avanzi, Fraccaroli, Sarchielli,

16
Ullrich, & van Dick, 2014; Schulz, Luthans, & Messersmith, 2014; Wittmer et al.,
2010)
In this view point, some scholars have demonstrated the outcome behavior resulting
from social exchange relationships in the light of social exchange theory. In the studies
conducted by Chen & Yu (2014) and Sanjeevkumar (2012), it was found out that
increased retention rates resulted from employee reciprocal behavior from job security,
conducive work environment and social support programs tailored for employees. In
addition, a study examining supervisory relationships (Brimhall, Lizano, & Mor Barak,
2014) the level of job satisfaction in terms of communication, decision making and
employees empowerment through teams for problem solving affected employee
intentions to remain (or leave). In addition, the interface of social exchange was used
by Nouri & Parker (2013) and realized that commitment of employees as a result of
training and career growth opportunities lead to reduced turnover intentions in the
accounting firms.
All in all, the social exchange theory having served as a tool to explain the relationships
between organizations and their employees by describing workplace behavior in terms
of interactions between employers and employees (Biron & Boon, 2013; Cropanzano
& Mitchell, 2005; B. D. Smith, 2005), it was used in this study to predict the effect
human resource management practices on the retention of professional health workers
in Rwanda. By choosing this theory, it was anticipated that best human resource
management practices in the hospitals attract positive work behavior which makes them
remain in the institutions.

17
2.1.2 Equity Theory
The equity theory was developed by John Stacey Adams with the primary focus that
calls for a balanced fairness between employee inputs including hard work, skill level,
acceptance or enthusiasm, and employees perceived level of outputs in terms of salary,
benefits, and other intangible outputs such as recognition (Adams, 1965). In its
reviewed version by (Waster, Berscheid, & Waster, 1973) the authors show that social
relationships are the basis for perception of fairness. Houseman, Hatfield & Miley
(1987) state that the feeling of inequity between two groups will create distress or
dissatisfaction because the individual will always believe that the output does not
correspond to the input, especially by comparing themselves with people from other
institutions. Hence they will de-motivated because of feeling that the level of benefits
from input-output scenario is relatively small compared to that of other people.
In the organizational setting, the theory serves as an important basis for employee
motivation throughout fair balance between their perceived inputs compared to the level
of perceived outputs. In fact, employees are expected to have the minimum of inputs
related to effort, loyalty, hard work, commitment, skill, ability, adaptability, flexibility,
tolerance, determination, heart and soul, enthusiasm, trust in their boss and superiors,
support of colleagues and personal sacrifice. In return to this, they feel that what they
gain should be fairly balanced in terms of financial rewards-pay, salary, expenses,
perks, benefits, pension arrangements, bonus and commission, interest, responsibility,
stimulus, travel, training, development, sense of achievement and advancement,
promotion, and intangibles like recognition, reputation, praise and thanks.
In the study investigating into the effect of human resource management practices on
the retention of employees, the Equity Theory is believed to be a framework to analyze

18
the phenomenon under studies. It is anticipated that the input-output ratio as it is
perceived by health workers will result in adoption of good behavior resulting in
commitment and intending to remain for a long period of time, which in turn will
increase retention rates in the hospitals.
2.2 The Concept of Employee Retention
Employee retention refers to various policies and practices which let the employees
stick to it for a longer period of time (Vos & Meganck, 2009). In fact, organizations
invest time and money to groom new employees, make them a corporate ready material
and bring them at par with the existing employees. The organization is completely at
loss when the employees leave their job once they are fully trained. Employee retention
takes into account the various measures taken so that an individual stays in an
organization for the maximum period of time. With regard to this, companies today are
interested in retaining valuable employees and good employees are increasingly
becoming more difficult to find (Panoch, 2001) while employee recruitment and
retention has become a priority (Czurak, 2011).
Beside the rate of turnover for a given period of time which serves as the basis to
determine the extent to which the organization has been able to retain its people for that
given period of time, it has been argued in the literature and studies of human resource
management that employee intention to stay is a measure predictor of retention (Nedd,
2006), as the likelihood that an individual employee will or wants to remain in the
organization. In fact, employee perceived intentions to remain (or quit) the organization
are indicators of how they would stay in (or leave) the institution once given an
opportunity, and this shows the prediction of future retention capacity within the
organization. Intentions to stay are mostly used to measure the retention and turnover

19
in studies involving current employees as the study participants in the organization
(Cavanagh & Coffin, 1992b; Price & Mueller, 1981; Van Breukelen, Van Der Vlist, &
Steensma, 2004).
Fox (2012) explains why employee retention matters. In fact, high turnover creates high
replacement costs and is clearly associated with low levels of customer satisfaction,
customer loyalty, and lost revenues. To this end, Padron (2004) argues that retention is
particularly challenging today due to an aging work force and a growing imbalance in
the supply and demand of qualified personnel. In addition, many of the companies that
already spend big bucks to recruit and train talented employees are bracing for even
stiffer competition as baby boomers start to retire amid a shortage of skilled labor
(Rawe, 2006).
In the continually changing global economy, business needs to understand and utilize
key strategies concerning employee retention. Without adapting to potential problems,
organizations face debilitating outcomes, one of which is the cost of turnover (Panoch,
2001). Therefore, organizations that will survive in the global changing environment
are those which will adapt to realities of the current work environment, and this will
mostly depend on their capacity to rely on longevity and success influenced by
innovation, creativity and flexibility bringing to retention of employees. As a result,
organizations that enhance employee retention strategies get different benefits
including reduction in cost of labor turnover, keeping of company knowledge, saving
interruption of service or production, improvement of organizational goodwill, and
enhancement of efficiency of business and operation (Oginni, Ogunlosi, & Faseyiku,
2013).

20
2.3 Human Resource Management Models
Human resource management models are a framework that legitimizes and serves as
the basis to understand key human resource management practices (Heneman &
Tansky, 2002). In fact, when these activities are discharged effectively, they result in a
competent and willing workforce who help realize organizational goals. Human
resource management not working in the vacuum therefore, it is assumed that
economic, technological, political factors as internal and external forces adding to
organizational and professional functions all have major connections with human
resource management.
There are different HRM models that have been developed to help practitioners manage
human resources, and three of these will be mentioned in this study. The Harvard Model
(Beer, Spector, & Lawrence, 1984) serves as a guideline to managers and their
relationship with employees, and emphasizes on the soft aspect of HRM. This model
also focuses on employee commitment and draws conclusions that employees need to
be congruent, competent and cost effective. Another HRM model is the Michigan
Model (Devanna et al., 1984) which has a focus on hard HRM suggesting that there is
a strong necessity to manage people like any other resources: obtained cheaply, used
sparingly, developed and exploited fully. In addition to the two previously mentioned
models, the Guest Model of HRM (Guest, 1997) which bases its principles on the belief
that integrated HRM practices will lead to the individual change in the behavior, then
bringing to both individual and organizational performance.
2.3.1 The Harvard Model of HRM
This model which has been developed at Harvard University contains six major
components: situational factors, stakeholder interests, human resource management

21
policy choices, HR outcomes, long-term consequences and a feedback loop through
which the outputs flow directly into the organization and to the stakeholders (Beer et
al., 1984). Figure 1 illustrates components of the Harvard model of HRM
Figure 1: Harvard Model of HRM
Source: Beer et. al., (1984)
As it is displayed in the model, the management choice of HR strategy is influenced by
situational factors including workforce characteristics, management philosophy, labour
market regulations, societal values and patterns of unionization. Beer et al.(1984) state
that while there is the role of trade-offs between interests of owns and those of
employees in the organizations contained in the stakeholders interests, human resource
management policy choices emphasize that management's decisions and actions in HR
management can be appreciated fully only if it is recognized that they result from an
interaction between constraints and choices. The model depicts management as areal
actor, capable of making at least some degree of unique contribution within
Stakeholders
Interests
Shareholders
Management
Employee groups
Government
Community
Situational Factors
Workforce
Characteristics
Business strategy and
conditions
Management
Philosophy
Labour markets
Unions
Tasks technology
Law and Societal
values
HRM policies
Employee influence
Human resource
flow
Reward systems
Work systems
HRM Outcomes
Commitment
Competence
Congruence
Cost-
effectiveness
Long-term
consequences
Individual well-
being
Organizational
effectiveness
Societal
effectiveness

22
environmental and organizational parameters and of influencing those parameters
itself over time.
As far as human resource outcomes are concerned, they relate to employee commitment
to the organizational main focus. In addition to this, they concern individual
commitment which in turn brings to cost-effective products or services. In fact,
utilization of employee effort and experience comes as an important focus in the
management of human resources.
While this model is recognized for its strength in classifying HRM inputs and outcomes
and cresting the foundations for comparative human resource management (Boxall,
1992), it has been criticized for not being able to describe a coherent theoretical
framework for researchers to be able to measure HRM inputs, outcomes and
performance (1997).
2.3.2 The Guest Model of HRM
The HRM model that was developed by Guest (1986, 1997) provides a descriptive and
comprehensive theoretical framework which shows with clear details how integrated
human resource management practices touch both the individual and the organization
in terms of performance. In fact, this model recognizes the superiority of human
resource management over orthodox personal management because the former seeks
employee behavioral commitment to the organization. With regard to this, human
resource management through different practices has the primary focus on the
individual for his/her full and positive utilization.
Prior to discussing the main components of the model, it is important to highlight a
clear distinction between the orthodox personal management and human resource
management as it sounds today, with its key practices. As put by Guest cited in Bratton

23
and Gold (2000), there is a clear distinction between assumptions (or stereotypes ) of
HRM and personnel management, and these stereotypes serve as criteria to conform
that HRM is better. Guest (1997) states, however, that in some circumstances HRM
might have some limitations hindering its effectiveness, as for example in cases where
it can be simply viewed and limited to a single and simple idea of being an approach to
manage the workforce. Distinction between HRM and personnel management is
displayed in table 2.1.
Table 2.1: Stereotypes of personnel management and human resource
management
PM compliance HRM commitment
Psychological
contract
Fair day's work for a fair day's
pay
Reciprocal commitment
Locus of control External Internal
Employee relations Pluralist
Collective
Low trust
Unitarist
Individual
High trust
Organizing principles Mechanistic
Formal/defined roles
Top-down
Centralized
Organic
Flexible roles
Bottom-up Decentralized
Policy goals Administrative efficiency
Standard performance
Cost minimization
Adaptive workforce
Improving performance
Maximum utilization
Source: Guest (1997)
While devising the model, it is hypothesized that superior organizational performance
results from employee high commitment and quality. For these characteristics to be
implanted in the employee, the scholar points out that integrated HRM practices must
be applied coherently in the organization. In his model, it is hypothesized that human
resource management practices should be set with the core functional purpose that they

24
will lead to high employee commitment as one of the HRM outcomes, along with high
quality and flexible employees. The model is displayed in table 2.2
Table 2.2: The Guest Model of HRM
HRM Strategy HRM
Practices
HRM
Outcomes
Behaviour
Outcomes
Performanc
e Outcomes
Financial
Outcomes
Differentiation
(Innovation)
Selection Effort/
Motivation
High:
Productivity
ROI
Training Commitment Quality
Innovation
Focus (Quality) Appraisal Cooperation
Rewards Quality Low:
Cost (Cost-
reduction)
Job design Involvement Absence
Labour
Turnover
Conflict
Involvement Flexibility Organizational
citizenship
Customer
complaints
Labour
turnover
Status and
Security
Source: Guest (1986)
With this unique value of employee commitment as the vital HRM outcome, employees
become attached and bound to the organization with increased effort, cooperation,
involvement and organizational citizenship as obtained behavior outcome. In addition
to this, HRM practices contribute to the organization for it to acquire capable, qualified
and skillful workforce, entitled and able to produce high-quality services and products,
and employees who have the functional flexibility so that they can cope with innovation
and change. It is also clear in the model that achieving three HRM outcomes
(commitment, quality and flexibility) brings to change of behavior and then
performance.
Though the model developed by Guest has been criticized of its weakness in defining
HRM as a particular managerial style, it has the strength of clearly mapping out the
field of HRM and classifying the inputs and outcomes. More on that point, the model

25
also examines the goals of associated with normative models of HRM, and these are
strategic integration, commitment, flexibility and quality (Bratton & Gold, 2000).
Practices that are incorporated in the HRM field in each workforce group therefore
include recruitment and selection, appraisal, rewards and development.
2.3.3 The Michigan Model of Human Resource Management
The Michigan model of HRM was developed by the University of Michigan in the
1980s and constitutes early concepts that contributed to the development of human
resource management and its practices (Ihuah, 2014). According to the author (ibid),
this model links different business strategies and organizational structure and observes
how they can bring to contrasting styles of HRM in activities such as selection,
appraisal, rewards, and development. For example, a single-product company with a
traditional functional structure (that is, structured according to the various functions of
the business-finance, accounting, marketing, sales, production and operations,
personnel, etc.) will select its people on the basis of their expertise in the specific
functions. Appraisal of employee performance will be largely informal and
administered via personal contact; the reward system will vary unsystematically across
the functions and employee development will be limited primarily to the functional area
in which the employee works. On the other hand, a company with a multi-divisional
structure and a strategy for product diversification may have a very different system of
HRM. Selection would be systematic and according to both functional experience and
general management ability. The appraisal system would be formal and impersonal
based on quantitative criteria such as productivity and return on investment and on
qualitative, subjective, judgments about individual performance.
The reward system would systematically reward contribution to the diversification
strategy, and it is likely that bonuses would be paid according to achievement of

26
profitability targets. Employee development would be more complex and systematic
than it would be in a company with a single-product strategy. In the multi-divisional
company, employees are accustomed to being periodically transferred to different
functions and areas of business. Individual development would be cross-divisional,
cross-subsidiary and corporate.
Finally, the Michigan model argues that within HRM there is a human resource cycle
affecting individual and organizational performance. It describes the four functions of
this cycle as follows: performance is a function of all the human resource components:
selecting people who are best able to perform the jobs defined by the structure,
appraising their performance to facilitate the equitable distribution of rewards,
motivating employees by linking rewards to high levels of performance, and developing
employees to enhance their current performance at work as well as to prepare them to
perform in positions they may hold in the future.
The Michigan model is considered hard HRM because it is based on strategic control,
organizational structure, and systems for managing people. It acknowledges the central
importance of motivating and rewarding people, but concentrates most on managing
human assets to achieve strategic goals. Subsequent empirical research has not
produced evidence of organizations systematically and consistently practicing hard
HRM (Truss, Gratton, Hope-Hailey, McGovern, & Stiles, 1997); it found that
employees were strongly managed towards organizational goals. A company practicing
hard HRM would have a style of management that treats employees in a calculated way,
primarily as means to achieving business goals. Its top management would aim to
manage the organization rationally and achieve a ‘fit’ between the organization’s
strategy, structure, and HRM systems.

27
This model would be described as ‘hard’ HRM because it emphasizes treating
employees as a means to achieving the organization’s strategy, as a resource that is used
in a calculative and purely rational manner. Hard HRM focuses more than soft HRM
does on using people as resources and as a means towards the competitive success of
the organization.
The strength of their approach is that it focuses on the organization and how it can best
rationally respond to its external environment. Focusing on the level of the organization
has the advantage of drawing attention to aspects partly under the control of
management, such as formal strategy, structure, and preferred culture. On the other
hand, with regard to its limitation, attending to the organizational level may lead
managers to assume that, through organizational strategy, structure, and HR systems,
they have more power than they really have to change individuals and influence the
external environment.
2.4 Indicators of Human Resource Management Practices
Human resource management is very complex and challenging function in today’s
environment of management of organizations. There is a growing body of research
stating that organizations have difficulties to manage people more than they do for
managing technology and/or capital (Swathi, 2014). While organizations face these
challenges of managing people, human resources are considered the most important
inputs in the organization. As a result, a comprehensive and effective human resource
management through different practices is necessary for any organization which wants
to survive in the organizational competitive environment.
Though human resource management practices may differ from one organization to
another (Swathi, 2014), it is evident that integration of different HRM practices will

28
benefit the organization. In fact, the typology of human resource management practices
has been turning around the qualification of best practices”, (high performance)
(Huselid, 1995), formal (de Kok & Uhlaner, 2001), sophisticated(T. H. Wagner, 1998)
(T. H. Wagner, 1998) or professional (Gnan & Songini, 2003), it has been to the
conclusion by Pfeffer (1998) that they would be better qualified as best practices.
A summary of human resource management practices was suggested by Redman &
Matthews (1998) and as from their view point, these practices relate to availability of
extensive remuneration systems, including bonuses, team working and flexible job
design, training, development and learning opportunities, employee involvement and
participation, and performance appraisals. This typology is not far from the one from a
recent one provided by Saxena &Tiwari (2009), who argued that HRMPs relate to
training and development, employer-employee relations, recognition through rewards,
culture building, career development, and compensation and benefits. All in all, in
addition to selective hiring of human resources, it is advantageous for an organization
to have a comprehensive and effective policy for both financial and non-financial
incentives for employees, the organizational strategy for employee involvement and
participation in the decision-making processes, and, an understandable and fair process,
the ability to implement performance management function.
2.4.1 Performance Management Function
Performance management function is one of the major activities in the typology of
Human Resource Management practices. In the view of Armstrong (2008),
performance management is a process owned and driven by line management that aims
at getting better results from the organization, teams, and individuals by understanding
and managing performance within an agreed framework of planned goals, standards
and competence requirements. According to Pulakos (2004), performance management

29
(PM) is a goal-oriented process that seeks to make efforts ensuring that individuals and
teams become productive through organizational processes, which ultimately enhances
organizational productivity. It is a process by which the organizational strategy can be
accomplished and throughout which the value of workforce is measured and improved.
The simplified meaning of performance management defines it as the process through
which supervisors and those they lead gain a shared understanding of work expectations
and goals, exchange performance feedback, identify learning and development
opportunities, and evaluate performance results (Giannetto, 2009). The scholar [ibid.]
states that throughout this process, the organizations can create and sustain a workplace
environment that values continuous improvement, adapts well to change, strives to
attain ambitious goals, encourages creativity, promotes learning and professional
development, and this is done through engaging and rewarding for employees. As a
result, performance management is considered to be the single largest contributor to
organizational effectiveness.
Performance management systems work in process throughout which managers and
employees have clear and defined roles and timelines. As suggested by Pulakos (2004),
performance management process has four main sections as described in the following
figure 2.

30
Figure 2: Typical Performance Management Process
Source: Pulakos (2004)
What is worth noticing about performance management function is its perceived value
which has been described as a poor record (Bratton & Gold, 2000). In fact, performance
management is the most continuous and the least popular of all human resource
management practices: while employees do not see any point in doing it, managers
seem not to like doing it. Despite this record, performance management is an accepted
management practice that puts forward the principle that employee performance in the
organization should be measured, monitored and controlled (Barlow, 1989) which
calls for human resource managers to stand by and put it in practice as people who act
as guardians of organizational policies and procedures of an organization. For those
who are interested in the affairs of an organization, realizing failure in the
implementation of performance management function would mean that the
management control of the organization is highly ineffective. As noted by Strebler,
Robinson & Heron (1997), appraisal in organizations has become a driver to the
competitive advantage because of continuous performance improvement, with its
Determination of Organization
Strategy and Goals
Performance
Evaluation
Performance
Review
Performance
Planning
Employee
Input
Ongoing
Feedback

31
associated role of information-processing system providing managers with rational,
objective and efficient decision-making in relation with performance improvement,
identification of training needs, management of careers and setting levels of reward.
All in all, performance management serves as an integral part of the organization for its
initiative to goals of employees with mission and vision of that organization. Therefore,
in order to enhance sustenance and competitiveness of the organization, it has become
a requirement for managers of organizations to consider performance management as
an important component of the management function in the modern days of global
knowledge and competitive environment (Krishnan, Warier, & Kanaujia, 2013). As
result of this, comprehensive and effective performance management systems when in
combination with other HRM practices like employee reward and recognitions,
improved work conditions and opportunities for training and development, leads to
employee productivity, engagement and higher levels of retention, and ultimately the
organization performance (Chew, 2016; Krishnan, Warier, & Kanaujia, 2013).
2.4.2 Financial Incentives
One of the major human resource management practices in organizations concerns
policies and procedures for financial incentives. Also known by some authors as
“rewards’ (Kshirsagar & Waghale, 2014), incentives are packages that serve as
stimulus, or any form of encouragement, that is designed for the sake of boosting great
action, be it in a fixed manner or in addition to an established, fixed form of
remuneration. In the words of Criffeth and Hom (2001), incentives refer to a form of
compensation in terms of benefits that is provided to employees by their employers as
a way of attracting and retain them for doing a certain job.

32
As it reads from Henderson (1994) and Kshirsagar and Waghale (2014), the first
category of incentives is external to workers and is referred to as intrinsic extrinsic
rewards. This category of incentives also being called financial incentives, it involves
direct compensation in terms of monetary value and encompasses wages and salaries,
bonus, commission, individual and group incentives, profit sharing and stock options.
Another variant of financial incentives, also called indirect incentives (Henderson,
1994), are paid in a form of benefits or perquisites, and consist of paid time off, health
insurance plans, childcare benefits and employee discounts
The most referred to in the typology of financial incentives is pay (Yousaf, Latif,
Aslam, & Saddiqui, 2014). This financial reward is offered to employees because of
the service they render to the organization. Due to the fact that employees expect a
financial reward which is worth their efforts, it is important for organizations to set up
reward systems which offer employees the pay which is reasonable, equitable and
which satisfies their needs. In fact, an equitable pay makes employees feel that they are
recognized for their efforts towards the achievement of organizational goals. As the pay
is expressed in terms of money, there is a tendency to believe that money becomes the
most important motivator for employees in order to fulfill basic necessities, and that
money can serve as an instrument to satisfy non-monetary needs (Sara, Gerhart, &
Minette, 2004). The reward pay in monetary value therefore becomes very important
for employees, and some scholars (Bohlander & snell, 2004) view it as a means for
employees to gain personal triumph and accomplishment.
In addition to financial reward in a form of pay, another type of financial incentives
relates to bonuses which are given to employees when they have reached certain
standards and quotas to complete a certain project (Yousaf et al., 2014). It is currently

33
asserted that employee benefits packages have become an important part of the total
compensation or organizational expenses (DeCenzo & Robbins, 2010). Benefits have
grown in size, importance and variety (DeCenzo & Robbins, 2010; Edgar & Geare,
2005; G. T. Milkovich & Newman, 2008), and are one of the greatest challenges in
business today in attracting and retaining quality employees (U.S. Chamber of
Commerce, 2008).
In addition to this are fringe benefits as benefits employees receive in addition to their
normal pay in order to improve working conditions (Wiley, 1997). Fringe benefits
include company car and house allowance. In this framework, employers also provide
their employees with other financial incentives in terms of vacations with pay, health
insurance, and pension and, in some circumstances, daily meals and drinks, with the
purpose of improving their working conditions and motivate them to perform the
assigned tasks at their jobs.
2.4.3 Non-financial Incentives
Employee incentives are also devised in a form of non-financial value. There are many
packages of non-financial incentives to employees, and most of them are in relation
with improvement of conditions of work, opportunities for career development, and
training and development (Kshirsagar & Waghale, 2014). In addition to this, non-
financial incentives include appreciation, meeting the new challenges, caring attitudes
from employer and recognition (Yousaf et al., 2014). In this way, employees have
expectations in addition to their monetary benefits in monetary value, and these are
health working conditions that can enhance a professional relationship with employers,
fulfillment of training and development needs job security.

34
In relation with the above, the concept of job enrichment relates to the process by which
employees are given extra amount of work in order to make it more interesting and
meaningful (Choudhary, 2016). This practice is often done to employees through
development and intensification, and it has the purpose of making the job more
challenging, then increasing employee responsibility. As employees feel the need for
more skills in their job, they are motivated by the opportunities for skill varieties, task
identity, task significance, autonomy and job feedback, depending on how the
management has initiated this practice. Job enrichment has the strength of motivating
employees because routine, monotonous, repetitive and unrewarding tasks with an
over-controlled structure authority make employees dissatisfied and bored.
Along with other non-financial incentives is training and development, considered as
major function in this category and which has been widely discussed in the literature of
human resource management (Beardwell, Holden, & Claydon, 2004; Gordon, 1992).
In fact, training and development activities act as devices to modify employees’
behavior through learning events, activities and programs (Gordon, 1992). Throughout
this process therefore, employees get the opportunity to achieve high levels of
knowledge, skills, competencies and abilities, which in turn helps them carry out their
jobs in an effective manner.
Training and development programs have been recently influenced by both
intensification of competition which requires employees to have high levels of skills in
the changing business environment, and the arguments on the perceived relative success
of organizations which have heavily invested in the human capital (Beardwell et al.,
2004). Besides this consideration, organizations have realized that technological
changes are very rapid in such a way that employees need to be upgraded for current
knowledge and skills. Considering these aspects therefore, a need for organizations to

35
invest in continuous employee training band development is very necessary, as the main
purpose of training and development is to acquire and improve knowledge towards
related tasks.
Training and development have been associated with benefits for organizations (Cole,
2002). These include increased confidence and motivations and lower cost of
production, reduction of turnover, facilitating management to manage change,
providing recognition, enhanced responsibility and the possibility of increased pay and
promotion, and improving the availability and quality of staff.
Moreover, human resource management practices encompass the concept of work
conditions and job security as another package of non-financial incentives. In fact, work
conditions come under different forms including flexibility in working hours and
workload, facilities (Aisha, Hardjomidjojo, & Yassierli, 2013), improved physical
working conditions (like well-designed workstations, appropriate lightning,
mechanisms for noise reduction, suitable equipment and furniture, sufficient safety
measure for fire emergencies, existence of personal equipment for protection) ,
existence of programs addressing lifestyle changes and work/life balance (Swalhah,
Irtima, & Zouby, 2013). In addition to these work conditions that employees expect to
have from their employers for them to the job with high levels of satisfaction, they
expect their organizations to be less or not frustrating and most importantly to feel high
level of job security.
2.4.4 Employee Participation and Involvement in Decision-making
The concept of employee participation and that of employee involvement have been
considered with slight differences in their conceptual definitions in the literature of
human resource management. In essence, employee participation involves workers

36
exerting a countervailing and upward pressure on management control, which need not
imply unity of purpose (Bratton & Gold, 2000). Considered as the softer form of
participation, employee involvement is considered as a process of implying
commonality of interest between employees and management. Employee involvement
being considered in an expanded view of serving to maximize the interests of workers
(D. E. Guest, 1986), it should not be restricted to trade unions, but directed to the
workforce as a whole (Bratton & Gold, 2000). The link between these two concepts lies
in the fact that they both refer to management styles aiming at building a strong
motivated workforce, enjoying their jobs and hence longer employment periods
expressed in reduction of employee turnaround.
The application of participation and involvement in organizations is perceived by many
people as a reflexion of their own attitudes and work experiences, and their own hopes
for the future. Participation, in the point of view of managers, refers to consultation,
which in turn is considered as a way of improving top-down or upward problem-solving
communications. Therefore, there is a tendency for employees and union
representatives to believe that opportunities for consultation are worth participation
(Bratton & Gold, 2000).
As far as involvement is concerned, its application should mean a lot to employees:
influence and take part in decision-making on matters in relation with their working
environment. Then, forms of participation where employees are involved in the
decision-making processes affecting their working lives are considered as direct
participation, and serve as devices to improve job satisfaction and productivity. Indirect
participation in a form of joint consultation, for example, involves delegates or
representatives of a certain body of an organization to be part of the decision-making

37
process, and they are associated with industrial democracy in a broad sense. Current
methods of employee involvement include involvement through the communication of
information, upward problem-solving, quality circles, extended consultation, cross-
functional teams, self-directed teams, collective bargaining, worker directors and
worker councils (Sofijanova & Zabijakin-Chatleska, 2013).
There are three main reasons which HRM theorists have associated with introduction
of employee involvement schemes by management. Verma (1995) evoked a political,
moral and ethical justification of such an involvement referring to a society with
democratic foundations. In such kind of societies, there is a feeling that involving
employees in decision-making processes in matters regarding their working conditions
and lives is necessary. This practice therefore impacts on their working lives outcome,
hence employee involvement and communications become encouraged.
The Japanese management and the model of excellence school in North America serve
as the basis for the second reason to involve employees in decision-making processes:
the principle of that employee involvement leads to quality and productivity. The level
of success of implemented decision is then associated with the degree of employee
involvement in the decision making process. Therefore by creating satisfaction among
employees and by improving productivity, employee involvement results in better
outcomes for all parties of the organization (Verma, 1995).
Guest (1986) cited in Bratton and Gold (2000) states that perennial managerial
problems associated with conflict in the organization becomes the third reason why
employee involvement is necessary in the organizations. In fact, introducing employee
involvement becomes a solution to those problems which in some circumstances lead
to strikes and/or absenteeism. All in all, there is hope for employers who introduce such

38
participative mechanisms that they are creating confidence between employers and
employees, increase of trust, reduction of potential for conflict and increase of the
potential for influence on matters related to pay, working conditions and employment
security.
Throughout the practice of employee involvement therefore, direct participation of staff
in the organizational systems allows the organization to benefit from employees
because they have opportunities to provide their own inputs by using their own ideas,
efforts and expertise for both solving problems and decision making purposes. In
addition to this, the practice of employee involvement increases autonomy in work
processes. This happens in forms of participation as individuals or as teams,
empowerment and self-managed teams (Sofijanova & Zabijakin-Chatleska, 2013).
Mullins (2005) stresses the importance of empowering employees and states that in
modern way of management, leaders choose to be facilitators instead of acting like
controllers, and therefore they embark on abandoning command-control systems and
mechanistic structures. Throughout self-managed teams, the supervisory position is
reduced or even eliminated, which allows employees participate in tasks like production
planning, resource allocation, determination of budgets, work schedules, making
operational decisions, coordination of activities with customers and any other task that
might be in their position (Noe, Hollenbeck, & Gerhart, 2008; Torrington, Hall, &
Taylor, 2002) .
In the words of Kuye & Sulaimon (2011), the modern style of management does not
consider employees as the outsiders to the decision-making processes in their
organizations. Instead, they try to consider the inadequacy of the “command and
control” model and, with openness and collaborative spirit aiming at benefiting from

39
employees’ talents, managers trust and involve employees at all levels (Hewitt, 2002).
According to Singh (2009), Kingir and Mesci (2010), the need to involve employees is
to enhance their ability to understand that they are required to be creative and committed
to changing their behavior at work. With regard to this, the situation of employee
involvement in the organizational decision making processes creates a sense of
belonging and a congenial environment where both managers and employees contribute
to industrial relations.
2.5 Human Resource Management Practices and Employee Retention
There is a growing body of argument in the literature asserting that human resource
management practices affect the retention of employees (Bowen & Ostroff, 2010;
Hussain & Rehman, 2013; Laka-Mathebula, 2004; Nishii, Lepak, & Schneider, 2008;
Ozolina-Ozola, 2014). Most of these researchers argue that the level of human resource
management practices determines the level of retention capacity in institutions, or in
other words, that human resource management practices are positively correlated with
employee retention. This means that the higher the organizational HRM policies and
practices, the lower the rate of turnover of employees in institutions.
In order to show the role of human resource management practices in helping
organizations to fulfill their goals, many studies have been done and concluded that
human resource management practices are key factors for the survival of organizations
in different areas. In fact, human resource management practices have been proved to
be very fundamental in the banking industry(S. Islam, Khatun, Faruk, & Mortoza, 2013)
(S. Islam et al., 2013) and financial institutions in general (Huselid, 1995), the aviation
and airline sector (Patton, 2015), mining industry (Nyamubarwa, Mupani, & Chiduuro,
2013), hospitality and tourism sector (Nickson, 2007), the textile industry(Rajendra,
2014) (Rajendra, 2014), (Hashmi, 2014) and the manufacturing sector (Sarbapriya,

40
2011) by the fact that they affected employees’ intentions to stay and subsequently
influence retention in these industries.
2.5.1 Performance Management Function and Retention of Employees
Performance management is considered by as an important human resource
management function and so many organizations rely on it for different organizational
outcomes (Selvarajan & Cloninger, 2008). This practice involves performance
appraisals which serve as a staff evaluation tool and management system as an integral
part of human resource management effectiveness in organizations (Guest, 1997). As
put in Rue & Byars (2005)’s argument, performance appraisal functions as a means to
determine and communicate how employees do their job and come up with effective
plans to improve the process of carrying out responsibilities. Therefore, updates on the
performance of employees, identification of training needs and adoption of clear
intervention practices including plans for training and development are all provided an
effective performance management approach. Hence good performance appraisal
system results in motivation of employees and extends to their commitment and
engagement, then reducing intentions to leave the organization (Selvarajan &
Cloninger, 2008).
Researchers conducted a study with the aim of examining the extent to which
performance management function contributes to employee retention (Krishnan,
Warier, & Muslim, 2013). Using a questionnaire to collect data on sampled respondents
to identify the causal factors of employee retention though intentions to stay, the
research reinforces the importance of a robust performance management system in
aligning employees with the organization’s goals, resulting in superior employee
commitment, reduction of turnover and organization performance. A similar recent
study was done to assess the effect of performance appraisal on employee retention

41
(Imna & Hassan, 2015). The results of the study showed that performance appraisal, as
a process of evaluating employee’s performance on the assigned tasks to facilitate
further career development and mainly communication between employee and
management, was very crucial for determination of levels of employee satisfaction. It
was realized, for example, that systematic and effective employee performance
evaluation activity, performance evaluation feedback, communication, goal setting, and
periodic review are associated with employee job satisfaction and lead to reduction of
turnover intentions among employees.
2.5.2 Financial Incentives and Employee Retention
Effective policies governing incentives are good strategies for employee retention
Caligiuri, Lepak & Bonache, 2010). In fact, there is a common argument that increase
in pay results in reduction of turnover among employees (Trevor, Gerhart, & Boudreau,
1997). Therefore, it is argued that good pay affects job satisfaction and leads to
employee commitment and engagement towards organizational goals, which
determines high levels of retention capacity (Caligiuri, Lepak, & Bonache, 2010;
Cranny, Smith, & Stone, 1992; R. Islam & Ismail, 2004; Steinhaus & Perry, 1996;
Weiss, 2002). As employees expect a certain level of monetary rewards for their
organizational contribution, pay constitutes a quantitative measure of an employee’s
worth.
In order to compete for the most talented workers, companies need to provide attractive
and equitable pay. The role of pay in attracting and retaining people at work has been
stressed for many decades and is increasingly being recognized important in today’s
competitive, economic environment where strategic compensation planning is needed
(Jackson & Schuler, 1995). In the view point of Milkovich & Newman (2004), the idea

42
that monetary pay is the most important and significant of all determinants of retention
was advanced. In the same viewpoint, Moncraz, Zhao, & Kay (2009) concluded in their
study that although compensation was not the sole factor to reduce non-management
turnover, it was the most important contributor to reduction of management turnover,
and acted as a considerable factor to increase employee commitment.
Creating a compensation structure that supports employee retention is a challenge for
companies (Feldman, 2000). It is noticeable, for example, that a good number of
organization claim they have based pay rise on employee performance while it is not
the case; others claim of team related pay rise, but still will continue to reward people
for individual achievement (Feldman, 2000). From the same source, it is argued that
there will be frustration and cynicism by employees, caused by these inconsistencies in
organization, especially when employees see no pay rises while leaders are being richly
rewarded.
A study conducted in Nigeria aimed to establish the relationship between financial
incentives and employee retention in manufacturing companies (Oni-Ojo, Salau,
Dirisu, & Waribo, 2015). Using quantitative data collected from a sample of
respondents in selected institutions, a very positive correlation was found between
employee wages and salaries, bonuses and fringe benefits with their intentions to stay
in the areas of work in the industry. In the same country, a study was conducted in Ogun
State in order to examine the influence of compensation packages on employee job
performance and retention of employees in higher learning the institutions (Osibanjo,
Adeniji, Falola, & Heirsmac, 2014). The authors developed the model which helped
them to interpret quantitative data collected from academic and non-academic staff. It
was recommended that management could resort to reviewing compensation packages

43
because a strong relationship was found between compensation packages (salaries,
incentives, bonuses, allowances and fringe benefits) and retention of employees.
In an attempt to study the reasons behind high turnover rates among health workers in
the health care institutions in Tanzania, a study was conducted for this (Mbilinyi, 2008).
While failure to retain hey health workers was associated with many factors, the study
found that health professionals were not satisfied with implementation of financial
incentive policies, which constituted the pushing factor in the health care institutions of
the country.
In the study conducted in Malaysia, researchers wanted to establish the effect of
extrinsic and intrinsic factors of motivation on retention (Ali, Amin, & Hamid, 2016).
While intrinsic factors affecting motivation were deemed important, researchers
realized that organizations which always review rewarding systems and update
employees’ annual salaries and benefits are likely to have low rates of turnover. Basing
on the findings, they argued that wages contribute to employee commitment while
dissatisfaction leads to undesirable behavior of leaving the work. Another research
investigated into the links between financial incentives employee commitment and
retention in organizations (Saleem, 2011) and found out very significant and positive
effect reward packages (in terms of promotion and bonuses) on employee commitment
and increased turnover rates.
Reviewed studies show that financial incentives create intrinsic behavior in employees,
which leads them to enjoying the work, have self-esteem, which in turn makes them
feel need for promotion and recognition. By undertaking comprehensive and clear
policies and procedures governing reward packages in terms of salaries, allowances,
bonuses, performance pay, fellowships, discounts and other compensation schemes,

44
organizations benefit with retention of employees who support the organization in
achieving the goals.
2.5.3 Non-financial Incentives for Retention of Employees
It has come to the attention of researchers that trends redefining modern retention
strategies go beyond the traditional salary and benefits packages (Chandranshu, 2012)
and compensation (Feldman, 2000) embracing employee motivation through non-
financial schemes (Kenneth, 2000) as one of the key factors leading to the diversity and
long stay of employees in the organization. In fact, individual job satisfaction, loyalty
and commitment are strengthened by the organization ability to devise retention
strategies that consider employee needs and desires (Boomer Authority, 2009).
To this end, some scholars rank among top priorities employee recognition, flexibility,
improvement of work conditions (Cunningham, 2002), and establishment of a
supportive learning and working environment (Walker, 2001). In addition, modern
employee retention strategies should be based on effective management systems
allowing communication (Gopinath & Becker, 2000) and career development (Boomer
Authority, 2009) for a long stay of employee in institutions.
In this view point, Boomer Authority (2009) emphasized the importance of job
flexibility on retention of employees of any age in employment flexibility should
consider individual work times, responsibilities, location around family responsibilities
and workload (Cunningham, 2002; Pleffer, 2007). Moreover, different job flexibility
options (Eyster, Johnson, & Toder, 2008) allowing a balance between work and
personal obligations is a good contributor to employee commitment, concentration,
satisfaction, productivity, loyalty and intents to stay (Prenda & Stahl, 2001).

45
Employee retention is also predicted by training and development as the latter enhances
both behavioral (personal) and technical (professional) development (Ayobami, Wallis,
& Mahomed, 2016). In fact, apart from the fact that availability of such opportunities
is crucial and that having access to training and development programs for all
employees is critical for organizational benefits and cost savings (Prenda & Stahl,
2001), it is argued there training programs available to all employees result in 70%
increase in employee retention rates (Eisen, Jasinowski, & Kleineli, 2005). McIntosh
(2001) asserts enhanced training foundations (competencies, efficiencies, and
intelligence) and advanced development of best practices, cross training, mentoring,
and technology changes for all employees enhances retention rates in the organizations
(Agrela et al., 2008; Yazinski, 2009). Research indicates that effective employee
retention strategies are in line with training methods that engage workers with career
challenges, advancement opportunities and supportive work environment (Eisen et al.,
2005). It is important for organizations to assist employees in their career development
with the purpose of helping them manage many aspects of their lives and make them
feel a clear promotion track (Moses, 1999).
A recent study conducted in Pakistan (Haider, Aamir, Hamid, & Hashim, 2014)
reviewed the literature on the prevalent non-financial incentives for employee job
satisfaction and retention. The reviewed literature came up with crucial findings that
non-financial incentives associated with job recognition and appreciation increase
employee satisfaction, commitment and attachment to the organization. Another study
recently conducted in Nigeria (Oni-Ojo et al., 2015) and it assessed non-financial
incentives in relation with retention in the manufacturing industry. The study found a
very positive significance between non-financial incentives and employee retention as

46
the latter employee satisfied and felt valued by the organization, which makes them
committed and stable in their working places.
A comparative study between two companies looked at the effect of non-monetary
reward programs towards employee motivation in Pretoria (Neelkamal, 2012). In the
study findings, it was realized that organizational commitment towards employee
career development, coaching and mentoring, and work-life balances made them retain
employees more than they did with increasing financial rewards. The study concluded
that better working conditions and other non-monetary rewards are crucial retention
strategies. In another study conducted in Karachi, Pakistan (Farooq-E-Azam, Shujaat,
& Alam, 2013), researchers wanted to measure the influence of non-monetary rewards
on employees in the commercial banks and found that training and development and
other non-financial packages were significantly related to employee commitment and
reduction of turnover.
In the region, while turnover intentions among health workers in Tanzania predicted
by lack of working equipment, bad working conditions and lack of supportive
supervision in health care institutions (M. A. Munga & Mbilinyi, 2008), a study
conducted in Kenya (Gikuya, 2014) realized that companies were introducing non-
financial incentives to motivate their employees. In another study conducted in Kenya
(2013), the researcher investigated into non-financial incentives and retention of
primary and secondary school teachers. The findings of the study show that key non-
financial incentives in terms of teacher recognition, personal development, work-life
balance and good conditions at the work environment affect their retention.
Evidence in the literature of human resource management shows that employee non-
financial incentives are very important factors that positively affect employee retention.

47
Conducive work environment, training and development programs that are well
designed and shared with fairness to all employees, career development programs,
recognition, job security and work-life balance are important non-financial packages
that can support organizations to retain key employees.
2.5.4 Involvement and Participation in Decision-Making and Employee Retention
The argument that employee participation and involvement in the organizations’
decision-making processes is crucial for employee retention has support in the literature
of HRM (Arthur, 1994; Bidisha & Mukulesh, 2013; Huselid, 1995; Kacmar, Andrews,
Rooy, Steilberg, & Cerrone, 2006; Leghari, Suleman, Leghari, & Aslam, 2014;
Nwokocha & Iheriohanma, 2012; Paré & Tremblay, 2007). In fact, employees who are
engaged are more productive, content, more likely to be loyal to an organization and
attached to it in such a way that their intentions to leave the organization are reduced.
In this view point, programs engaging employee participation and involvement are
expected to have a positive effect on employee commitment and retention.
In the modern scenario of the management function, keeping employees informed about
all important affairs of the business and involving them in decision-making processes
at all levels in order to exploit and make use of their talents has become the ideal for
many organizations (Hewitt, 2002). This view is supported by Noah (2008)’s argument
that employee involvement in decision-making helps in creating a sense of
belongingness among the employees, which to create a good congenial working
environment and contributes towards building a good employer-employee relationship.
At the same time, low involvement causes employees’ feelings of alienation and
organizations would not expect staff to remain as long as they are not involved in its
decision-making processes (Iftikhar, Jan, & Muhammad Najmi, 2015). Consequently,
48
lack of employee involvement in decision-making may lead to dissatisfaction and
turnover. This adversely effects the organization because of loss of skills and talents of
its human capital.
Rondeau & Wagner (2016) did a study on human resource management practices and
nursing turnover in Canada from primary quantitative data. They found that high
involvement of nurses in decision-making processes was related to lower voluntary
turnover. Researchers wanted to investigate into employee involvement and
participation and its associated effect in companies after privatization in Pakistan
(Khattak, Iqbal, Urooj, & Bashir, 2012). The results of the study revealed high levels
of dissatisfaction and turnover intentions among employees because of low levels of
employee involvement and participation in terms of team briefing, problem-solving
groups and modes of representative selections.
Dissatisfaction among employees were also associated with their intentions to leave the
companies in the study that was conducted in Indonesia in a state-owned enterprise
(Irawanto, 2015). Results. Employee participation in discussion on recent issues
(participation consultation) with employees and among workers was found to likely
have a negative significance with motivation and intentions to stay.
All in all, evidence in the literature shows that employee participation and involvement
in decision-making increases employee satisfaction and reduces unnecessary turnover
in organizations. Employees who perceive a reasonable level of participation and
involvement in terms of exposure to shared governance, consultation for merit pay
processes, and creation of teams for quality improvement and establishment of systems
for suggestion will reciprocate with satisfying work outcomes.

49
2.5.5 Human Resource Management Practices and Employee Retention in the
Health Care Setting
Evidence in the literature of human resources for health shows that human resource
management practices are major determinants of retention of health workers
(Daneshkohan et al., 2015; Ebuehi & Campbell, 2011; El-Jardali et al., 2009; Kabene,
Orchard, Howard, Soriano, & Leduc, 2006; Longmore & Ronnie, 2014; Nyandoro,
Masanga, Munyoro, & Muchopa, 2016; Ojakaa, Olango, & Jarvis, 2014; Oyetunde &
Ayeni, 2014; Songstad, Rekdal, Massay, & Blystad, 2011; Thi Hoai Thu, Wilson, &
McDonald, 2015; Wurie, Samai, & Witter, 2016). In order to investigate on the factors
that affect retention of medical doctors, Ronnie & Longmore (2014) did such a study
in a medical complex in the Eastern Cape, South Africa. Based on qualitative responses,
their conclusions stressed the need to embark on human resource management practices
in the health care setting in South Africa. In fact, it was realized that poor levels of the
dimension of human resource management led to frustration of doctors in the hospitals,
which hindered the institution’s capacity to retain medical staff. The unacceptable
consideration of the human resource department led to handicapped human resource
management practices and constituted a pushing factor to so many medical staff in the
institutions, and this created shortage of doctors and adversely affected retention of key
health personnel.
In the same view point, two studies were conducted in the health care setting in Kenya.
By assessing factors affecting retention of human resources for health in Trans-Nzoia
County, Butaki (2015) realized that nurses’ intentions to stay or leave health care
facilities were determined by the institutions’ capacity to integrate different HRM
practices including training and development of the health personnel, effective policies
for compensation and reward, and work life balance. Study results show that such

50
important factors affecting retention of the health personnel were not given weight in
the administration of health facilities, and this neglect had caused high rates of turnover
in the health sector. Another study in Kenya aimed at studying factors affecting
motivation and retention of health care workers in there desperate regions (Gikuya,
2014). Due to issues that were found in human resource management practices, the
study recommended that health care institutions should formulate policies and
strategies for both financial and non-financial incentives, benefits and other
intervention measures with the purpose of being able to retain health workers.
In an attempt to study the determinants of retention of health workers in rural hospitals
in Zimbabwe (Nyandoro et al., 2016), researchers came up with recommendations that
there was a need for proactive measures, interventions and strategies important to health
professionals at varied stages of their careers in order to attract and retain them in rural
areas. In their argument, they (ibid.) asserted that interventions for boosting hospitals
capacity to facilitate their employees meet their professional career and socio-economic
expectations were found to be very relevant in this framework. Another handicapping
factor for retention of health workers was lack of clear measures to initiate equity in
human capital development in hospitals, which called for efforts of human resource
management departments to work on such a hindrance in order to remove unfairness in
providing opportunities for training of health workers.
In a recent study conducted in Sierra Leone, researchers investigated into the
determinants of retention of health workers (Wurie et al., 2016). Qualitative findings
from life stories showed that though cases of Ebola outbreak had exacerbated
substantial health system and human resources for health challenges, there was a need
for a new move to motivation of health workers through more focused human resource

51
management approach, especially in the rural areas. While recent policy reforms had
focused on improving financial conditions especially for higher level health workers,
other non-financial factors needed more careful attention. In addition, the centralized
recruitment and posting system did not allow for responsiveness. Moreover, it was
stressed that health workers’ involvement and participation in decision-making
processes was for them to be integrated in the process of setting national goals,
designing strategies and implementing effective policies and programmes relating to
their work lives.
Another two studies were conducted in Nigeria. The first one wanted to seek what
contributes to the attraction and retention of qualified health workers (Ebuehi &
Campbell, 2011). The findings of the study revealed that working conditions, career
development opportunities, and appropriate infrastructural issues were still core factors
affecting an individual’s motivation for rural work, regardless of the health worker’s
geographic origin. The second study which explored the factors influencing recruitment
and retention of nurses in Lagos (Oyetunde & Ayeni, 2014) revealed that retention of
health workers was affected by a number of factors including provision of training and
growth opportunities, providing study leave for training, sponsoring nurses for
conferences and workshops, improving and maintaining safety of nurse, providing
assistance to nurses who worked alone, ensuring open and timely communication and
open door policies, ensuring availability of work resources, minimizing work related
injury by providing lifting equipment, and provision of car loan, house loan,
transportation allowance and vacation in form of annual leave. Other strategies included
ensuring annual promotion for eligible nurses, and increment in salary and allowances.

52
Researchers conducted a study in the area of retention of human resources for health in
Ghana District hospitals (Daneshkohan et al., 2015) and a move to HRMPs in the health
care institutions was recommended. Given the results of the study, strengthening
managerial capacity in health services should be emphasized in order to increase
motivation of health workers. Considering the negative impact of perceived unfairness
on motivation, it was recommended to managers to apply personnel policies fairly on
day to day basis, communicate appropriate information about equity to all employees
and act in a transparent manner. More on that, it was recommended that a particular
attention be given to developing a fair and objective performance appraisal system and
implementing supportive supervision strategies.
In Vietnam, researchers investigated into determinants of retention of health workers
(Thi Hoai Thu et al., 2015). In their findings, they realized that most disadvantaged part
of the health workforce were those working in difficult mountainous and rural
environments with limited resources, coupled with little opportunity to practice to
maintain and develop professional competencies and with poor supervision. While
health workers employed in these areas were considered as highly trained professionals,
they saw their knowledge and skills as being eroded, which affected their motivation.
The results from this study suggest efforts should focus on providing healthcare
workers with the appropriate medical equipment, drug supplies and infrastructure they
need to deliver high-quality care. In addition, effective human resource management
needs to allow adequate opportunity for HWs to practice, improve their knowledge and
maintain their skills. Provision of in-service training should take into account the
relevance of the training to the needs of HWs and adopt a practical approach that
essentially accelerates the development of the task-relevant skills and competencies of

53
HWs. In the same way, supervision mechanisms should be reviewed so that training
can contribute to boosting the quality of care and worker motivation.
2.6 Study Gaps
A number of studies were conducted to establish the relationship between human
resource management practices and retention of health workers. However, most of them
were conducted in other countries other than Rwanda; little or no research in Rwanda
was conducted with the aim of establishing the links between human resource
management practices and retention of professional health workers. This study has
provided the insights on the current status of performance management practices in the
Rwandan public hospitals, health workers’ levels of perception on the existing financial
and non-financial incentives, and the level of participation and involvement of
professional health workers in the hospitals’ decision-making processes. In the same
way, the study has shown the current status predicted retention capacity of health
workers in the public hospitals by establishing the current status of intentions to stay in
these institutions of health care service delivery.
Most studies which were conducted in this area established retention by use of existing
retention rates and turnover indices. In fact, while intentions to stay are major predictors
of retention and can assist organizations in strategic orientations regarding the future of
institutions, it was released that most of studies on this phenomenon relied on a single
source of data, without investigating into the views, perceptions and attitudes of current
employees in the organizations. In connection with this, most of these studies looked
into this phenomenon by considering its variables in isolation of each other, and
consequently limiting the possibility to predict retention by used of integrated human
resource management approach. This study therefore sought to go beyond this

54
perspective and establish a holistic view of the effect of human resource management
practices on retention of health workers.
The reviewed literature also presents methodological gap. It was noticed that most
studies which were conducted in this area used either of qualitative and quantitative
approaches, and this is believed to have limited the possibility to overcome barriers that
are caused by used of one single paradigm. The current study used mixed methods
approach combining both quantitative and qualitative methods of data collection and
analysis in order to better understand better the phenomenon under study and minimize
the shortcomings that could have been caused by one paradigm.
2.7 Conceptual Framework
The conceptual framework in the present study portrays the effect of human resource
management practices (independent variable) on retention (dependent variable) among
professional health workers in public district hospitals in Rwanda. This conceptual
framework also draws from the Social Exchange Theory as it shows the exchange
relationships between the organization (through its representatives) and employees,
where reciprocal exchanges happen when employees perceives equity between their
contributions to the organization and the way they are treated. In this regard, they
respond with positive work behavior by deciding to remain, which in turn leads to high
rates of retention. Therefore, the application of this theory to the current study assumes
that employee intentions to stay result from best human resource management
interventions in terms of financial and non-financial incentives, performance
management function, and participation and involvement in decision-making processes

55
The conceptual framework for the current study is portrayed in figure 3.
Human Resource Management Practices (IV) Retention (DV)
Figure 3: Conceptual framework of effect of human resource management
practices on retention
Source: Researcher (2016)
Performance Management
Financial Incentives
Non-financial Incentives
Involvement and Participation
H01
H02
Control Variables
Age
Sex
Marital Status
Type of work
Tenure
H03
H04

56
2.8 Operationalization of the Study Variables
As it has been mentioned, the typology of human resource management practices
(independent variable) in relation with employee retention entails performance
management function, financial incentives, non-financial incentives, employee
participation and involvement, and retention is portrayed throughout intentions to stay
as its major predictor. Therefore the study variables and their measurements were
conceptualized as shown in table 2.3.
Table 2.3: Operationalization of the Research Variables
Type Variable Indicators Measures Measurement
scale
DV Retention Intentions to
stay (IS)
Respondent’ intents to remain or
quit
IV
HRMPs
Performance
Management
Function
(PMF)
Respondents’ perceptions on the
level of implementation of PMF in
terms of:
Performance planning
Performance evaluation
Performance evaluation feedback
Four-point
likert scale
Financial
Incentives (FI)
Respondents perceptions on the
level of availability and provision of
FIs in terms of:
Conditions of employment
Allowances
Fellowships, loans and discounts
Four-point
likert scale
Non-Financial
Incentives
(NFI)
Respondents’ perceived status of
NFIs with regard to:
Work environment
Training and development
Career development opportunities
Four-point
likert scale
Participation
and
Involvement
(PI)
Respondents’ perceived level of
employee PI in decision-making
processes in terms of:
Exposure to shared governance
Teams for quality improvement
Consultation for merit pay
processes
Establishment of systems for
suggestions
Four-point
likert scale
Adapted from Sonali (2011) and Alsaqri (2014)

57
CHAPTER THREE
RESEARCH METHODOLOGY
3.0 Overview
The aim of this chapter was to describe the design and methodology that were used to
investigate the phenomenon being studied: human resource management practices and
retention of health workers. Therefore after describing philosophical paradigm that
guided the study, full details on other methodological processes that guided that study
were explained: the method, study variables, location of the study, target population,
sampling techniques and sample size, research instruments, pilot testing, data collection
techniques, data processing analysis procedures, the study limitations and finally
logistical and ethical considerations were described.
3.1 Area of the Study
The study was implemented in Kigali city, Rwanda. Indeed, Rwanda has four main
provinces (Southern Province, Northern Province, Eastern Province and the Western
Province) and Kigali City. Each province has Districts as the main units of local
administration. Kigali City is not called a province, but it is administered at the level of
province as it has districts as well.
With a population of more than 1 million (Nduwayezu, 2015), Kigali (Appendix 1) is
the capital and largest city of Rwanda. Its geographic situation is in the centre of the
country. Kigali city has been considered the economic, cultural, and transport hub of
Rwanda since 1962, the period of independence, and it became the capital of the country
(Kigali Institute of Sciences and Technology, 2001). The government ministries and
main administration headquarters offices are located in the city. The city is coterminous
with the province of Kigali City, which was enlarged in January 2006, as part of local

58
government reorganization in the country. The city's urban area covers about 70% of
the municipal boundaries.
The city is built in hilly country, sprawling across about four ridges and the valleys in
between. The tops of the ridges have an average elevation of 1,600 metres, while the
valleys are around 1,300 metres. The bigger houses and office buildings tend to be on
the tops of the ridges, while the poorer people live in the valleys. The city is ringed
most of the way round by higher hills, with some suburban sprawl rising up these. The
highest of these is Mount Kigali, with an elevation of 1,850 metres above sea level.
Kigali possesses a tropical savanna climate with a pronounced dry season. Kigali is
cooler throughout the year than in most other cities around the Equator due to its
elevation, which tempers the heat and results in warm rather than hot days and mild
rather than uncomfortably warm nights.
Kigali is a province-level city governed by a city council who appoint an executive
committee to run the day-to-day operations of the city. The executive committee
consists of a mayor and two deputies. The city is split into three administrative districts:
Gasabo, Kicukiro, and Nyarugenge, each of which is also governed by the mayor (of
the District). It contained parts of the former province of Kigali Rural.
As for the choice of Kigali City as the location of the study, Kigali is a major big city
in Rwanda. Kigali being the capital city of the country enjoys a good distribution of
health facilities. There are 2 referral hospitals in Kigali, 4 district hospitals, 1 military
hospital which also serves for the public, and currently there are 29 health centers in
(Joshi, Joshi, Damani, Ng, & Lauwa, 2013). With different types of health services
offered to people in the capital city of the country, Kigali attracts different types of
professional health workers who are employed in different public district hospitals

59
available in the city. By choosing Kigali City as the location of the study therefore, it
was felt that there was availability and variability of data among respondents. Therefore
the researcher targeted the following public district hospitals for data collection:
Kacyiru Hospital, Muhima Hospital, Kibagabaga Hospital and Masaka Hospital
(Appendix 1).
3.2 Research Philosophy
The philosophical paradigm within which a researcher operates determines the
methodology of the study. In fact, philosophical assumptions and theoretical paradigms
on the nature of reality and the way reality or knowledge can be studied are foundations
from which most researchers make a choice between advocates of quantitative research
paradigm and qualitative research paradigm (Campbell & Stanley, 1963; Lincoln &
Guba, 2000), and advocates for each side of both being qualified as purists, hence
qualitative purists and quantitative purists.
Assumptions that are consistent with the commonly called positivist philosophy are
articulated by quantitative purists (Ayer, 1959; Maxwell & Delaney, 2004; Popper,
1959; Schrag, 1992). According to the advocates of this paradigm, there is the same
method for both physical scientists and social scientists. It is argued that social
observations should be treated as entities and observed in the same way as physical
scientists treat physical phenomena (Johnson & Onwuegbuzie, 2004). In addition,
quantitative purists entities that are subject to observation should be separate from the
inquirer, that is, time and context free generalizations are desirable and possible, and
real causes of social scientific outcomes can be determined reliably and validly (Nagel,
1986).

60
As far as qualitative purists (or interpretivists) are concerned, they insist on the
superiority of constructivism (hence their other name, constructivists), idealism,
relativism, humanism, hermeneutics (and sometimes, postmodernism) and totally reject
positivism (Guba & Lincoln, 1989; Lincoln & Guba, 2000; Schwandt, 2000; J. K.
Smith, 1983, 1984). Guba (1990) states that in the point of view of qualitative purists,
there is neither need nor possibility for time-and context-free generalizations. In
addition, qualitative purists argue that it is not possible to separate the knower and the
known, differentiate causes and effects, which gives the power to logic flowing from
specific to general (as for example, stating that inductive generalizations generate
explanations from the data). Moreover, these purists insist that there is a need to contend
the multiple-constructed realities are abound.
From these two stand points, it is worth noticing that both qualitative and quantitative
purists view their associated paradigm as the ideal for any activity calling for research
procedures. Therefore, they advocate for incompatibility of using both quantitative and
qualitative paradigms. One of the leading qualitative purists (Guba, 1990), stated that
“accommodation between paradigms is impossible…we are led to vastly divers,
disparate, and totally antithetical ends” (p.81). From this standpoint it has been realized
for a long time that considerations between purists were considered divisive, then
creating two research orientations and cultures: one advocating for superiority of deep
and rich observational data, and the other one professing for hard and generalizable data
(Sieber, 1973).
Considering these research paradigm wars (Tashakkori & Teddlie, 2010) between
positivist and interpretivist paradigms, the third paradigm emerged in the 1960s and
became popular in the 1990s: a mixed methods approach. This approach came with the

61
purpose of bridging the schism between quantitative and qualitative research (Johnson
& Onwuegbuzie, 2004; Onwuegbuzie & I, 2004; Tashakkori & Teddlie, 2003, 2010).
However, some scientists considered that differences between post-positivism and
constructivism were conflicting as the period of paradigm was marked by emergence
of debate that focused on the ways in which paradigm and methodology are related
(Tashakkori & Teddlie, 2010). With regard to this, pragmatism paradigm emerged as a
third set of beliefs, recognizing the “what works” tactic allowing the researcher to
handle issues that cannot be dealt with using only either qualitative and quantitative
approach.
This study is therefore guided by pragmatism paradigm. Pragmatic paradigm which
leads this study is grounded in the mixed-methods approach. Indeed, the pragmatic
paradigm is suitable for social and management research (Creswell & Clark, 2011) as
well as for scientific research, as it offers a harmonious combination of both
quantitative and qualitative approaches suitable for practitioner-based research.
As the philosophical paradigm of the study involves assumptions on the nature of
knowledge, or ontology, this study takes the ontological stance of pragmatic paradigm
in order to make an exploration of the problem surrounding the issue of human resource
management practices in the health care setting. Pragmatism ontology gives priority to
the thinking that reality is constantly negotiated, debated, and interpreted in the light of
its usefulness in new unpredictable situations. As far as theoretical paradigms of how
reality of knowledge can be studied, the study is grounded in the pragmatist
epistemological standpoint which is based on the principle that the best method is the
one which better brings the solution to the problem under study. Therefore, the study
opted for mixed-methods approach of inquiry to the phenomenon, referring to both

62
quantitative and qualitative methods of data collection and analysis in order to
investigate into what professional health workers feel about human resource
management practices in public district hospitals at the one hand, and whether they
intend to remain in the health care institutions and health care service delivery.
Moreover, the choice of use of pragmatism as the philosophy to guide this study arose
from the fact that it permits the researcher a flexible approach to investigation,
accommodating an outcome‐ and adaptive-oriented enquiry method (Johnson &
Onwuegbuzie, 2004) and allowing for the use of mixed methods (Creswell & Clark,
2011). This kind of development therefore provides the opportunity of engaging with
issues as they emerge. As both inductive and deductive forms of inquiry are allowed by
this philosophy, the researcher then has the possibility to use both qualitative and
qualitative data analysis.
3.3 Research Design
The study used cross-sectional research design with mixed methods approach. The
choice of the design is based on the nature of the problem under study requiring
professional health workers’ perceived levels of the magnitude of human resource
management practices in public district hospitals and their perceived intentions to stay
in (or leave) hospitals, and therefore the researcher’s intention to measure the
respondents’ attitudes, opinions and reported observed behavior from a representative
sample at one point of time.
The use of mixed-methods approach for this study was motivated by the researcher’s
intention to use both quantitative and qualitative methods of inquiry in order to be able
to better understand the phenomenon under study by use of complementary methods of
data collection and analysis, especially in the understanding of the magnitude of human

63
resource management practices and intentions to stay. This complementarity, along
with integration and triangulation involved use of both questionnaires to collect
quantitative data, and interviews and focus group discussions to gather qualitative data.
In the same manner, mixed-methods approach offered the opportunity to use both
quantitative and qualitative data as a way of overcoming challenges that would be in
relation with one paradigm being either quantitative or qualitative, what gave the
researcher to base conclusions on stronger data provided by both methods.
As the study used both questionnaires, interviews and focus group discussions as data
collection tools in order to best understand or develop more complete understanding of
the research problem by obtaining different but complementary data, collection and
gathering of these data, their analysis and interpretation followed an appropriate
strategy. Therefore the study referred to convergent parallel strategy of mixing. This
was done for validation purposes and therefore the researcher collected two
independent strands of quantitative and qualitative data at the same time/in a single
phase, which also means that both methods were prioritized equally. Since each of
survey data and qualitative data analysis was kept independent, there was mixing of
results during the overall description and understanding of the level of human resource
management practices and intentions to stay. However, the methods used for
descriptive purposes only being able to show the magnitude of variables, they were
backed up by other inferential analysis techniques that are able to predict the effect of
independent variables on the outcome variable.
This process involved a number of steps. In fact, both quantitative and qualitative data
were collected and gathered to understand the phenomenon under study, which
explored the research problem in a manner that is better than just one paradigm. After

64
quantitative and qualitative data collection, which was done concurrently but
independently, the researcher analyzed scores on instruments statistically while dealing
with the quantitative component, and then proceeded with qualitative data where
interviews and focus group discussions from people’s actual words on the study topic
provided a complex picture of the situation being dealt with. Then, as part of the
process, the researcher integrated qualitative data into quantitative ones for better
explanation of their meaning through comparison. This was done to better understand
the status of the study variables, or their magnitude, in the area of study.
3.4 Target Population
The study targeted a total population of 402 individuals. These include 89 doctors, 162
nurses, 96 midwives, 23 pharmacists and 32 dentists from 4 district hospitals in Kigali
city. The population of the study as from each district hospital where the study was
conducted is presented in table 3.1.
Table 3.1: Distribution of the target population
Hospital Doctors Nurses Midwives Pharmacists Dentists Total
Kacyiru Police
Hospital
27 48 18 4 6 103
Muhima
Hospital
24 42 34 7 11 118
Kibagabaga
Hospital
18 35 18 6 7 84
Masaka
Hospital
20 37 26 6 8 97
Total 89 162 96 23 32 402
Source: (MOH, 2015)

65
3.5 Sample Design and Procedure
3.5.1 Sampling Techniques
Three sampling techniques were used to determine the sample size. These are purposive
sampling, stratified sampling and simple random sampling. Purposive sampling was
used to select Kigali city as the location of the study. Kigali city was chosen as a major
big city in Rwanda and the capital city of the country where there was believed to be a
variability of data among respondents. Purposive sampling was also used to consider
three hospitals apart from Kacyiru because the latter had been a district hospital for less
than one year. In fact, having served as a District hospital by less than a year by the
time the study was being conducted could not permit to measure the indicator of
performance management function as employee performance appraisal is conducted at
the end of the fiscal year. In addition, purposive sampling was used to consider all
pharmacists and dentists to be included in the study as their number was not big and
that they are expected to necessary provide information on human resource
management practices in hospitals.
Stratified sampling allowed the researcher to obtain desired representation from various
subgroups in the populations being doctors, nurses or midwives. Respondents were
selected in such a way that the selected subgroups were contained in the study. Simple
random sampling allowed the researcher to obtain single subjects or members from
accessible population among doctors, nurses and midwives. It was about assigning a
number to each member on the list of doctors or nurses or midwives in each hospital,
place them in a container and then pick a number at random until the desired numbers
were chosen to be participants in the study.

66
In order to determine the exact number of doctors, nurses and midwives to include in
the study, slovin formula (Guilford & Frucher, 1973) was used to sample them. This
formula is written as where N=total population, n=sample
size, e=error margin (0, 03). The formula was used to determine the overall total sample
of doctors, nurses and midwives in the three hospitals. In order to come up with the
number of each stratum (doctors, nurses or midwives), the procedure of proportionate
stratification(S. E. Mohammad & Dougherty, 2013) (S. E. Mohammad & Dougherty,
2013) was used. The same approach was used to determine the number of respondents
in each hospital. The proportionate stratification formula is written as nh = (Nh/N)*n
where nh is the sample size for stratum h, Nh = population for stratum h, N= total
population size and n =total sample size.
3.5.2 Sample Size
As it was pointed out in the previous section, the inclusion and exclusion criteria
allowed to work with a sample from three district hospitals: Kibagabaga, Muhima and
Masaka. Therefore, a sample including doctors, nurses, midwives, pharmacists and
dentists was drawn from the three hospitals through a number of steps including both
slovin formula and proportionate stratification:
Step one: Determination of the sample of doctors, nurses and midwives
As the researcher purposively decided to consider all pharmacists (19), and dentists
(26), the slovin formula was be applied to the remaining number of the population,
which means doctors (62), nurses (114) and midwives (78). Their total number 299, the
formula was applied to 299 - (19 + 26), which means 254 individuals including doctors,
nurses and midwives (the remaining 45 were considered; the researcher purposively

67
decided to consider all of them in the study). Applying the slovin formula
( ) to a total number of 254 individuals representing
doctors, nurses and midwives, their total sample is
;
then ; and therefore ,
and finally n= 207 respondents.
Hence the total number of the respondents to be included in the sample was 207
(doctors, nurses and midwives) + 19 pharmacists + 26 dentists, which turns out to be
252 respondents.
Step two: Determination of the total number for each stratum being either doctors,
nurses or midwives
In order to come up with the real number of doctors, nurses and midwives to be included
in the sample, the procedure of proportionate stratification was used: nh = (Nh/N)*n
(nh is the sample size for stratum h, Nh= population for stratum h, N= total population
size and n =total sample size).
Then for doctors, their number was nh = (62/254)*207; and then nh=51, hence the total
number of doctors to be included in the study is 51 doctors.
For nurses, their number was nh = (114/254)*207; and then nh = 93, hence the total
number of nurses to be included in the study is 93 nurses.

68
For midwives, their total number to be included in the study was nh = (78/254)*207,
and then nh = 63, hence their total respondents in the study will be 63 midwives.
Step three: Determination of the total number of doctors, nurses and midwives in each
hospital
The number of respondents calculated in step two include doctors, nurses and midwives
from 3 hospitals. As it has been mentioned earlier, the same procedure of proportionate
stratification was used for the researcher to have the exact number of doctors, nurses
and midwives in each hospital. Then applying the formula (nh = (Nh/N)*n) to sampled
respondents in each hospital, the number of doctors, nurses and midwives became:
For doctors, their number in each hospital was nh1…nh3 = (24/62)*51; (18/62)*51;
(20/62)*51 nh1 representing hospital 1…and nh3, hospital 3.
Therefore the number of doctors in each hospital was: nh1 (Muhima Hospital) = 20; nh2
(Kibagabaga Hospital) = 15; nh3 (Masaka Hospital) = 16.
The total number of nurses to be reached in each hospital was nh1…nh4: (42/114)*93;
(35/114)*93; (37/114)*93, nh1 representing hospital 1…and nh3, hospital 3.
Hence the number of nurses in each hospital was: nh1 (Muhima Hospital) = 34; nh2
(Kibagabaga Hospital) = 29; nh3 (Masaka Hospital) = 30.
And finally, the total number of midwives in each hospital was nh1… nh3: (34/78)*63;
(18/78)*63; (26/78)*63, nh1 representing hospital 1…and nh3, hospital 3.
And therefore the number of midwives in each hospital was: nh1 (Muhima Hospital) =
28; nh2 (Kibagabaga Hospital) 14; nh3 (Masaka Hospital) = 21.

69
Having purposively considered all pharmacists and dentists, the total sample size and
the number of respondents per each stratum is presented in table 3.2.
Table 3.2: The total sample size and the sample size for each stratum
Hospital Doctors Nurses Midwives Pharmacists Dentists Total
Muhima Hospital 20 34 28 7 11 100
Kibagabaga
Hospital
15 29 14 6 7 71
Masaka Hospital 16 30 21 6 8 81
Total 51 93 63 19 26 252
Source: The Researcher, 2016
3.6 Data Collection Methods and Procedures
3.6.1 Sources of Data
Data for this study was collected from primary sources through the study instruments
that included the questionnaire, interviews and focus group discussions. The data were
collected from doctors, nurses (and midwives), pharmacists and dentists from three
hospitals in public district hospitals in Kigali.
3.6.2 Data Collection Instruments
Three types of instruments were used in this study: the questionnaire, interview and
focus group discussions. The use of more than one research instrument was explained
by the fact that research used mixed methods approach soliciting use of both
quantitative and qualitative data collection tools, hence allowing the researcher to
overcome challenges that might result from the use of one method of inquiry.
3.6.2.1 Questionnaire
The questionnaire was of two categories. The first category was the questionnaire for
human resource management practices which was administered to professional health
workers. The second category was the questionnaire for professional health workers’

70
intentions to stay. The questionnaire was used in this study for the purpose of collecting
quantitative data. The questionnaire contained both structured and unstructured
questions to elicit respondents’ perceptions and opinions on the variables and indicators
of the study. The questionnaire was designed in such a way that it focused on the areas
in line with research objectives. In addition to the fact that he questionnaire was
believed to be a strong instrument to gain diversified views and opinions for large
samples (Hussey & Hussey, 1997), its use was also dictated by the design and approach
of the study. Moreover, the questionnaire was advantageous in that it not only elicited
data from respondents in an impersonal manner and that they could not only be able to
express their views and opinions freely, but also allowed them to use their own pace to
answer it.
Built on the four-point Likert scale (Amin, 2005; Boone & Boone, 2012; Sisson &
Stocker, 1989), close-ended questions were given to respondents opportunities to make
a definite choice expressing the direction and strength of each statement, and for them
not to give answers that are socially pleasant instead of providing the reality of the issue
being investigated on (Nowlis, Kahn, & Dhar, 2002). By designing the questionnaire
therefore, the neutral response from traditional five-point Likert scale was left out
(Sisson & Stocker, 1989). The mode of rating for closed ended questions in human
resource management practices and intentions to stay questionnaire was 4= strongly
agree 3= agree, 2= disagree and 1= strongly disagree. As for open-ended questions,
respondents expressed their views and experiences to answer questions in the full
writing style.

71
3.6.2.2 Interview Guide
The study instruments also contained interviews as its second type, and had two
categories. First, there was structured interview guide on both human resource
management practices, and, second, the one for intentions to stay and both of them were
administered to professional health workers. The purpose of the interview was to get
respondents’ opinions, ideas and attitudes on the subjects that had not been captured in
the questionnaire. It was also used to enrich the data collected by use of the
questionnaire, by providing details on such data. The interview guide was developed
on the assumption that respondents had knowledge on the topics that are being
discussed.
All in all, the interview as the type of instrument for this study was used because of its
strength to provide complex textual descriptions of how people understand, live or
experience the issue which was being studied, with full expression through behaviors,
opinions, relationships and emotions (Atieno, 2009). During the phase of data
collection also, respondents could ask questions which were answered by the researcher
and by doing so, the quality of the resultant data was increased. In addition, during the
interview, the researcher was able to stimulate additional information from the
interview participants so as to expand the findings.
3.6.2.3 Focus Group Discussion Guide
The third type of instrument was the focus group discussion guide .In order to explore
more on the issue of human resource management practices and health workers’
intentions to stay (or leave), focus group discussions were organized. In fact, it was
believed that by grouping together respondents with similar backgrounds and
experiences where involved health professionals would agree or disagree with each

72
other on different issues in the discussion, focus group discussions would generate
qualitative data containing a range of opinions and views that would be used to get the
meaning of findings from quantitative data. As for that, focus group discussions were
organized around the main indicators of the study variables: implementation of
performance management, availability and provision of financial incentives, the status
of non-financial incentives, the level of participation and involvement in decision-
making processes, and intentions to stay.
3.6.3 Data Collection Procedures
As per cross-sectional survey research design and convergent parallel strategy of mixed
methods approach, both quantitative and qualitative data were collected and gathered
at the same period of time and were given equal priority during this phase. In fact, the
researcher and research assistants administered the questionnaire for quantitative data
collection. It was ensured that the questionnaire was administered to targeted
respondents among professional health workers in hospitals where the study was
conducted. They also ensured on when to retrieve the questionnaires.
During the same period of time, the researcher and two research assistants embarked
onto gathering qualitative data by conducting interviews and focus group discussions.
These were electronically recorded to avoid any viewpoint that could go unnoticed or
forgotten before transcription. The number of interviews to be carried out was
determined following the phenomenon of data saturation (Bonde, 2013; G. Guest,
Bunce, & Johnson, 2006). The scenario of qualitative data gathering among
professional health workers in hospitals where the study was conducted is displayed in
table 3.3.

73
Table 3.3: The progression of interviews and definition of changes by rounds of
activities
Interview
guide
Interview
round
Total
number of
interviews
Total
number of
focus
group
discussions
Definition of
thematic
expressions in
interview and
FGDs rounds
Definition of
changes in
rounds’
thematic
expression
Human
resource
management
practices
1
2
3
4
.
N
4
8
12
16
.
N
1
2
3
.
.
N
Intentions to
stay
(or leave)
1
2
3
4
.
N
4
8
12
16
.
N
1
2
3
.
.
N
Source: Adapted from Guest, et al. (2006)
As it reads from table 3.3, the initial cases for interviews involved 4 interviewees among
professional health workers in one hospital for each interview guide followed by the
identification of their overarching thematic expressions. Additional four cases from
professional health workers were added until no new thematic expressions are identified
in the rounds of interviews (Bonde, 2013; G. Guest et al., 2006) and, as for that, until
saturation point was reached among professional health workers.
As for focus group discussion, the researcher and research assistants started with one
focus group discussion in the first hospital where they carried out the study. Each focus
group discussion had at least 7 individuals (Krueger, 1988) and the dual-moderator
focus group discussions (where one moderator ensured the smooth running of the
discussion while another one ensures all topics are covered) was conducted. As the
study was implemented in 3 public district hospitals, once the researcher and research
assistants realized that saturation point (that is, no more new ideas are coming up from
members of the groups) was reached before focus group discussions were conducted in

74
all hospitals of the study, they had to decide to wind up the activity. During focus group
discussions and interviews, respondents were coded depending on whether they were
from the first, second or their hospital. Therefore, during data analysis, such codes were
used to identify respondents. For example, NU: Nurse, DO: Doctor, MI; Midwife, DE;
Dentist and PHA: Pharmacist. Therefore, NUH102 means Nurse, Hospital 1,
respondent 2, MI320 means Midwife, Hospital 3, respondent 20, etc. In total 29
interviews were recorded and 4 focus group discussions were conducted.
3.7 Measurement of the Study Variables
3.7.1 Dependent Variable-Retention
Health workers’ retention was measured through intentions to stay. In fact, intention to
stay being a major predictor of retention of employees, it has been largely used in such
studies with the purpose of capturing current employees’ stand, which determines the
future retention status in the institution (Mustapha, Ahmad, Uli, & Idris, 2010; Nasyira,
Othman, & Ghazali, 2014; A. Zaghloul, M. F. Al-Hussaini, & N. K. Al-Bassam, 2008).
To this end, a two-item close-ended adapted questionnaire was used to measure
intentions to stay (Alsaqri, 2014; Markowitz, 2012; A. A. Zaghloul, M. F. Al-Hussaini,
& N. K. Al-Bassam, 2008) served to this purpose. In addition, this questionnaire also
contained one open ended question which was formulated in such a way that
respondents had the opportunity to express their own views and opinions in a full
writing style Moreover, interviews and focus groups discussion on this variable focused
on the main theme of considering to remain (or leave) the hospital.
3.7.2 Independent Variable-HRMPs
The independent variable (HRMPs) has four main indicators: performance
management function, financial incentives, non-financial incentives, and participation

75
and involvement and a 62-item questionnaire was used to collect data on these
variables. First, performance management function was measured by a 13-item adapted
questionnaire (Iowa Department of Public Health, 2012; KardasLarson [online])
investigating into health workers’ perceptions on the implementation of this function in
terms of development and planning of performance (6 items), performance review or
evaluation ( 5 items) , and rewarding performance (2 items). Qualitative data was also
collected under these main indicators.
In order to establish the dimension of financial incentives, the study used a 14-item
adapted questionnaire (Ekpudu & Ojeifo, 2014; Sonali, 2011)was used order to capture
health workers’ perceptions on the level of availability of conditions of payment:
including salaries, wages and other compensation in monetary value (4 items),
allowances (5 items), performance payments (2 items), fellowships, loans and discounts
(3 items) offered to employees.
For non-financial incentives, a 23-.item questionnaire (Akbar, Riaz, Arif, & Hayat,
2018; Mitchell, Goodman, Alter, Oh, & Faulkner, 2015) was used to investigate on the
status of work conditions: including work autonomy and clarity of roles and
responsibilities, sufficient resources, recognition of work and achievement, supportive
management, manageable workloads and their effective management, effective
management of occupational health and safety risks, effective employee representation
and communication, enforced equal opportunity policy, maternity and paternity leave,
and flexible working hours (11 items), training and development opportunities:
availability of training opportunities, fairness in sharing opportunities, management
support to apply what was learnt during training on the work site, quality of training (5
items), and support for career and professional development: including effective
supervision, access to and support for training and development opportunities,
76
continuous education, sabbatical and study leave opportunities, and planned career
breaks: (6 items). Qualitative data collection was also organized on the basis of the
main themes on the measures of non-financial incentives.
Finally, health workers’ participation and involvement in the hospitals’ decision-
making processes was investigated through a 13-item adapted questionnaire (Le Var,
2014; Siong, 2012) seeking health workers’ perceptions on the degree of satisfaction
with exposure to shared governance (2 items), terms for quality improvement (3 items),
consultation for establishment of merit pay processes (3 items), and establishment of
systems for suggestions (5 items). The main themes described by these measures were
also used to collect qualitative data on this indicator.
3.7.3 Control Variables
The control variables that were included in the study were gender of respondent, their
age, marital status, experience (tenure) and the type of work (whether the respondent is
a doctor, a nurse, midwives, dentist or pharmacist). The need to include control
variables was to reduce their possibility of affecting the relationship between dependent
and independent variables, which may lead to spurious results. Gender was measured
by establishing whether the respondent was male or female, the age was measured by
establishing whether the respondent’s age fell into the category of below the age of 30,
within 31-40 years, within 41-50 years, within 51-60 years and the age of 61 and above.
The respondents’ experience was established by whether they had worked for less than
one year, between 1 and 3 years, between 4 and 6 years, between 7 and 9 years, and 10
years and above. The type of work was established whether the respondent was a
doctor, a nurse or midwife, a dentist, or a pharmacist).
77
3.8 Reliability and Validity
It is essential for the researcher to conduct a pilot stud before embarking on the actual
study as a prior preparation to doing actual research, especially by testing or trying out
instruments that will be used in the study. Therefore the pilot study is very important in
that it tells the researcher whether there are issues with research instruments, that is
whether they are too complicated or inappropriate, and therefore gives prior warning
on whether the major or actual study might fail. In addition to this, the pilot study
provides opportunities for the researcher to identify issues about wording, phrasing,
contents, layout, length and coding, which are very significant for the overall results to
be expected from respondents. Therefore the pilot study is an opportunity to amend all
these issues in case they might be there. For the sake of improving the questionnaire
and checking whether it could be a comprehensive material for respondents therefore,
the researcher conducted a pilot study on the subjects with the same characteristics as
respondents who will participate in the actual study.
3.8.1 Reliability of Instruments
Internal consistency reliability was used. As the questionnaire for this study entailed
groups of items to measure different aspects of the same concept (either human resource
management practices or retention), it was believed that the Cronbach coefficient alpha
would be a good measurement of consistency reliability. The latter was considered
among groups of items combined to form a single scale to ascertain how the different
items complement each other in their measurement of different aspects of the same
variable. The use of internal consistency reliability was also triggered by the fact that
the questionnaire was constructed on the likert scale model, which provided interval
scale data. Therefore, the results that were obtained from the pilot study allowed the

78
corrections in the questionnaire, like for example rephrasing the statements to make
them more understandable by respondents.
To this end, the researcher determined the reliability of the questionnaire after pre-
testing the instrument. This was done through a pilot study which was conducted on 21
health workers with the same characteristics as respondents, from the southern province
3 district hospitals, and the pre-test data was subjected the Cronbach formula:
𝛼 = (𝑛
𝑛−1)1-
∑(𝑆𝐷𝑖2
𝑆𝐷𝑡2 where𝛼 is Cronbach alpha, n the number of respondents to the
questionnaire, 𝑆𝐷𝑖2, the variance of the questionnaire scores and ∑(𝑆𝐷𝑖
2 the sum of the
variances of item scores. Cronbach alpha coefficient test of reliability was calculated
based on the recommended acceptable alpha of 0.62 in social sciences (Hair Jr., Black,
Babin, & Anderson, 2010). Results of reliability testing are presented in table 4.1.
3.8.2 Validity of Instruments
In order to ensure that research instruments are real measures of what they are supposed
to measure (Zikmund, Babin, Carr, & Griffin, 2013), face validity content validity,
criterion validity, and construct validity approaches were addressed. To determine face
validity, personal opinion or appreciation was expressed as whether or not the construct
was measuring what it was supposed to measure by inspecting their appropriateness.
Therefore, the instrument for data collection was presented to lecturers from the School
of Business and Economics at Moi University with expertise in the area of human
resource management. These lecturers assessed the relevance of instruments, and
whether or not they fully represent the domain of study, and they provide their
comments and suggestions that helped the researcher to improve the research
instruments. In addition, the researcher ensured credibility by adopting strategies to
help ensure honesty among the interviewees during the administration of interviews

79
and focus group discussions. This was done specifically by giving opportunities to each
interviewee to refuse to participate in the interview or focus group discussion in order
to ensure that the sessions involved those who were genuinely willing to participate and
prepared to give information freely and encouraging the interviewees to be as much
frank as possible (Shenton, 2004).
In order to establish criterion validity, the findings of the study were generalized to the
population of professional health workers in the public district hospitals in Rwanda,
from which the sample of the study was drawn. As for construct validity as the extent
to which constructs theoretically identify with each other to measure an idea in light of
the speculations fundamental within a research (Milton & Gregory, 2009), a review of
theories that underlie the study variables was done to establish it. In addition, the
researcher looked at the correlation matrix and the inter-construct correlations to
establish it convergent and discriminant validity as they relate to construct validity.
Results for correlation matrix are presented in table 4. 21.
3.9 Data Processing and Analysis
3.9.1 Data Processing
After data collection, careful examination of the returned questionnaires was done in
order to make observations on the ones to be considered for data analysis. Then the
process of data coding by assigning numerical symbols for data entry was done. An
examination of coded data was done in order to minimize the errors while entering data
in the software. The data were therefore checked and cleaned to ensure accuracy and
completeness, and the data was processed to check on outliers.

80
3.9.2 Data Screening
Preliminary data screening was done by comparing the original data on the
questionnaire with the data entered in the software. Each questionnaire having been
assigned with a code in the same order as in the software, the code was used to counter-
check the data on the questionnaire and the entered ones. In addition, preliminary
descriptive statistics were run and observed in order to check on the accuracy. The data
were also subjected to correlations and preliminary regressions to test the assumptions
of the regression model and to detect whether there were outliers.
3.9.3 Data Analysis
The data analysis procedure for this study was informed by the research design. Both
quantitative data and qualitative data were analyzed. The study being guided by
convergent parallel strategy as a variant of mixed methods design, data from the survey
and those from interviews and focus group discussions were analyzed separately and
were later merged and compered to explain the status of human resource management
practices and intentions to stay.
3.9.3.1 Descriptive Statistics
Descriptive statistics were presented in a form of frequency distributions. Apart from
descriptive statistics for social and demographic characteristics of respondents (age,
gender, marital status, education level, tenure in the service and nationality), the
magnitude of human resource management practices from health workers and
intentions to stay was described in terms of health workers’ perceptions on the level of
status, availability and provision of the indicators of these variables in the hospitals.
Likert-scale data were analyzed using both descriptive and inferential statistics (Amin,
2005; Boone & Boone, 2012; Ockert, 2005) of the study variables. The analyzed data

81
were from close-ended questionnaires measuring human resource management
practices and intentions to stay. In this regard, descriptive statistics of means and
standard deviations were used to measure the magnitude of variables. The interpretation
of means was based on the mean real limits in the interpretation of the four-point Likert
scale responses (Amin, 2005; Anumaka & Kyolaba, 2013; Bizimana & Orodho, 2014)
where the mean within 3.26-4.00 = higher, 2.51-3.25 = high, 1.76-2.50 = low and 1.00-
1.75 = lower. The mean limits applied to the variables of the study were interpreted as
very satisfying, satisfying, fairly satisfying and no-satisfying level of implementation
of performance management function; higher, high, low and lower level of availability
and provision of financial incentives; higher, high, low and lower status of non-
financial incentives; higher, high, low and lower level of participation and involvement
of health workers in the hospital decision-making processes; and intentions to stay.
Table 3.4. Interpretation of the mean range in a four-point Likert scale
Response Value Lower
limit
Upper
limit
Interpretation
HRMPs SA 4 3.26 4.00 Very satisfying/very high/very
often
A 3 2.51 3.25 Satisfying/High/often
D 2 1.76 2.50 Fairly satisfying/Low/rarely
SD 1 1.00 1.75 Not satisfying at all/Lower/never
IS SA 4 3.26 4.00 Very high
A 3 2.51 3.25 High
D 2 1.76 2.50 Low
SD 1 1.00 1.75 Very low
SA=Strongly agree A=Agree D=Disagree SD=Strongly Disagree
Source: Amin (2005), Anumaka and Kyolaba (2013), Bizimana & Orodho (2014)

82
The standard deviation is an indication of the average distance from the mean. A low
standard deviation would mean that most observations cluster around the mean. A high
standard deviation would mean that there was a lot of variation in the answers (Bizimana
& Orodho, 2014; Christensen & Stoup, 1991).
3.9.3.2 Correlation Analysis
In order to identify associations between variables, correlation analysis was performed.
The data analysis software was used to compute the Pearson Product Moment
Correlation coefficient as the statistical measure to determine associations between
variables, with values ranging between +1 and -1 (Vanderstoep & Johnston, 2009). It
is assumed that high correlations between covariates will make it difficult to establish
their effect on the outcome variable (Hair Jr. et al., 2010). In this regard, the correlation
coefficients allowed to examine the strength of relationship between explanatory
variables and the outcome variable. The output was checked for correlation coefficients
greater than 0.04 at significance level of 0.05 as the acceptance level (Tabachnick &
Fidell, 2007). The establishment of correlations and correlation matrix was facilitated
by SPSS software.
3.9.3.3 Regression Model and Regression Analysis
Quantitative data were also be subjected to inferential statistics of multiple linear
regression analysis (Pallant, 2005; Sykes, 1992) to institute the R-square (R2). The R2
showed the coefficient of determination of the amount of variability explained in the
dependent variable (retention) by the independent variable (human resource
management practices). Multiple regression also established the Regression Weights
(Beta) which is the amount of contribution of a variant of the independent variable,
which is either performance management function, financial incentives, non-financial
incentives, or participation and involvement while holding other variants constant.

83
The Multiple Regression model (Keller, 2014) was used to compute the multiple
regression coefficients. This is written as exxxxy 443322110
where the predictors are x1= performance management function, x2= financial
incentives, x3= non-financial incentives, x4= participation and involvement, and e = the
error term that symbolizes other variables that may affect the dependent variable. β1,
β2, β3 and β4 being variations in the dependent variable explained by each of the
predictors while holding other factors constant therefore, β1 was the contribution of the
first independent variable (performance management function) to the dependent
variable (retention of health workers). β2 was the contribution of the second
independent variable (financial incentives) to the dependent variable (retention of
health workers). β3 was the contribution of the third independent variable (non-financial
incentives) to the dependent variable (retention of health workers) while β4 was the
contribution of the fourth independent variable, which is participation and involvement
on retention of health workers as a dependent variable.
In a nutshell, beta weights showed which variant (either performance management
function, financial incentives, non-financial incentives or participation and
involvement) of the independent variable had a larger contribution to the dependent
variable. The beta weights also showed the increase in the dependent variable for every
unit change in percentage of the variant of the independent variable (that is, for every
increase by a factor of one standard deviation). The significance of each beta coefficient
was established at p < .05, which also was used to test the hypotheses (Amin, 2005;
Christensen & Stoup, 1991; Ofori & Dampson, 2011). The computation of the required
statistics was facilitated by the Statistical Package for Social Sciences (SPSS).

84
3.9.3.4 Underlying Assumptions of Multiple Linear Regression
It was important to test statistical assumptions of the model used in the data analysis
before running regression analysis. In fact, owing to the fact that statistical tests are
based on assumptions, there was need to test whether the model used fulfilled such
assumptions in order to avoid errors that could have been caused by use of the model
which did not fit the data analysis (Park, 2013).
(1) Linearity
Linearity was checked as the assumption which is based on how the data
presented graphically are in a straight line (Tabachnick & Fidell, 2007).
Examination of the scatter plots and observation of histograms is one of the
most common technique to check for linearity of data, and identify non-linear
patterns within the data (Hair Jr. et al., 2010).
(2) Normality
Normality is the assumption that a data se tis well-modeled by a normal
distribution (Usadọlọ, 2016). Some of the techniques used to check for
normality of data include the observation of histograms and the examination of
kurtosis and skewness of data. (Usadọlọ, 2016). This study checked for
normality by use of kurtosis and skewness statistics which must be equal to or
less than a critical value of +/- 2.28 or +/-0.001 with 0.05 and 0.01 levels of
significance, respectively, to claim for existence of normality (Tabachnick &
Fidell, 2007).
(3) Homoscedasticity
This is the assumption that dependent variables show the same (or almost the
same) levels of variance, or in other words, that they are evenly distributed (Hair
et al. 2010; Kline 2011). There are different ways of checking for

85
homoscedasticity of data, but in this study the examination of residual scatter
plots (Hair Jr. et al., 2010) was referred to. In fact, there is homoscedasticity of
data when on the residual scatter plot the evenly distributed data take a
rectangular shape (Tabachnick & Fidell, 2007).
(4) Multicollinearity:
Multicollinearity is a phenomenon in which one predictor variable in a multiple
regression model can be linearly predicted from the others with a substantial
degree of accuracy, which affects both the explanation and estimation processes
(Tabachnick & Fidell, 2007). The variance inflation factor and tolerance value
(Kutner, 2004) were used to check for (multi)collinearity in this study, in order
to establish how a specific independent variable is explained by another
independent variable: VIF were supposed to be equal to or less than 1; tolerance
values were expected to be more than 1.
3.9.3.5 Qualitative Data Analysis
Qualitative data analysis for this study involved a number of activities. First, all the data
from interviews and focus group discussions were transcribed in the word format in
order to make them manageable for better organization and uploading into the software.
Second, data were uploaded in the NVivo software, and to start actual analysis, the
researcher proceeded with giving codes to different data themes and sub-themes
depending on different issues that were explored during qualitative data collection
phase of the study. In the same way, the researcher noted personal reflections and other
necessary comments in the margin of the original text in the word format while at the
same time using them to make comprehensive organization of data by themes by
creating the nodes in the software. Therefore, thematic analysis was done to identify
key themes in the textual data. In fact, this involved sorting and sifting through the data

86
in order to identify similar phrases and statements, relationships between variables,
patterns or themes, and distinct differences between subgroups and common sequences.
This involved the categorization of ideas and concepts. Using narrative forms therefore,
similar categories were brought under the main over-arching themes in order to make a
comprehensive text displaying data findings. During this phase also, the data from open
ended questions were analyzed in the same way as they included respondents’ free
writing on the issues that were investigated in the study. Therefore the main findings of
qualitative data were used to understand the magnitude of human resource management
practices as perceived by health workers.
3.9.3.6 Triangulation of Data
After the analysis of qualitative data, the process of data triangulation and interpretation
followed. This was done by siding the themes from textual data with numerical data
under descriptive statistics in narrative forms. By doing so, the researcher sought to
support the findings on the magnitude of indicators by exploring more on the status of
human resource management practices in terms of availability and provision of
financial incentives, the status of non-financial incentives and performance
management function, and the level of health workers’ participation and involvement
in the hospital decision-making processes.
3.10 Limitations of the Study
The research process might be affected by some limitations resulting from respondents,
methods of data collection and the data analysis techniques that are used in order to
achieve the objectives of the study. Firstly, the researcher had limited control over
respondents’ honesty and personal biases. In fact, the study being conducted in the
health care setting, health workers might have been reluctant to disclose true

87
information on the current practices of human resource management in their areas of
work. In the same way, there might have been cases where health workers feared to
disclose information on their intentions to leave the facilities fearing that this might
impact on their jobs. Moreover, it is possible that that respondents may have
exaggerated the situation compared to how it was in reality.
Secondly, the study being conducted in public district hospitals in Rwanda, its results
might be different from the ones that can be generated from health institutions of the
different type. This limits the possibility of generalization of results across all health
care institutions. In addition, the study having focused on professional health workers,
the findings might only be generalized to the types of respondents who participated in
the study and limiting the possibility of extending generalization of results to any other
personnel in the health care setting such as administrative and support staff or
community health workers.
Moreover, the study focused on employees who were in the service at the time when
the research was conducted. Therefore, it is possible that professional health workers
who have resigned might have provided different opinions on the levels of human
resource management practices in the health care setting and the major determinants of
employee turnover in the health institutions in Rwanda.
3.11 Logistical Considerations
First, the researcher established a research budget specifying the amounts to be incurred
on every activity of the study. Once the budget was drawn, the researcher drew a
detailed study implementation plan to allow a smooth succession of activities, printing,
packaging, data collection, transcription, reduction, editing, coding, collating and
encoding into the computer and statistical treatment using SPSS 20.0 for quantitative

88
data and NVivo for qualitative data. Second, the researcher applied for and secured an
introduction letter serving as the school management authorization to proceed with data
collection. Third, a research permit was applied for and secured from the University of
Rwanda Research Review Board for the research to abide by the laws governing the
framework for conducting research activities in Rwanda. Then the researcher recruited
two (2) research assistants and trained them on research materials. After acquiring the
research permit from the University of Rwanda Research Review Board, the researcher
sought authorization from the three hospitals which in turn officially introduced the
research team to the respective departments in order to start research activities in those
units. The authorization was provided in a form of official letter signed by the hospital
Director after recommendations from the hospital Research and Ethics Committee.
Thereafter and the research assistants embarked on the data collection process.
3.12 Ethical Considerations
Specific measures were devised to ensure adherence to the ethics of conduct of
research. Agreement was sought from the informants and informed-consent rules were
followed properly to ensure that the informants’ participation is voluntary. Firstly, the
purpose of the study was explained to respondents. Secondly, the researcher informed
respondents that participation in the study was voluntary, and that respondents were
free to withdraw from it at any time they judged it necessary. In addition to this, the
relevance and benefits from the study were communicated to the respondents
beforehand. In fact, the researcher emphasized the nature of the study and the principle
of free choice to adherence to informed consent by insisting more on volunteerism. In
this regard, respondents were given the opportunity ask questions before, during and at
the end of the study. Thirdly, the researcher respected respondents’ rights to safeguard
their personal integrity, by ensuring confidentiality and anonymity were kept to

89
guarantee that no harm could be visited to the participants. In addition, the researcher
adhered to the standards on intellectual property by properly acknowledging the sources
of information, and all references were uploaded in Endnote for proper citation and
referencing in the APA system.

90
CHAPTER FOUR
DATA ANALYSIS, PRESENTATION AND INTERPRETATION
OF FINDINGS
4.0 Overview
This chapter presents the findings of the study and their interpretation. Firstly, the
chapter starts with the response rates and presentation of social and demographic
characteristics of respondents who participated in the study. Secondly, descriptive
findings from both the survey and interviews and focus group discussions are presented.
Presentation of these findings is based on each of the main variables, and the outcome
variable. Thirdly, regression analysis was done to establish the effect of human resource
management practices on the retention of employees. Fourthly, the chapter ends with
the testing of hypotheses of the study:
4.1 Data Preparation and Screening
4.1.1 Reliability of Instruments
Before the survey questionnaire was used to collect the data in hospitals, reliability of
instruments was ensured. This was done by a pilot study individuals from the southern
Province having the same characteristics as the sample. Therefore, internal consistency
reliability was measured by use of Cronbach’s alpha. As it is displayed in table 4.1, the
Cronbach’s alpha was beyond the recommended value of between 6 and 7.
Table 4.1: Reliability tests results.
Variable Initial items Final Items Cronbach’s Alpha
PMF 13 13 .941
FI 14 14 .876
NFI 22 22 .930
PIDM 12 12 .933
INTS 2 2 .808
PMF: Performance Management Function, FI: Financial Incentives, NFI: Non-Financial
Incentives, PIDM: Participation and Involvement in Decision-Making
Source: Survey Data, 2017

91
4.1.2 Response Rate
The questionnaire for quantitative data collection was delivered to 5 categories of
professional health workers. As the questionnaire was distributer to 12 medical
specialists, 38 medical doctors, 93 nurses, 63 midwives, 19 pharmacists and 26
pharmacists, the total number of questionnaires distributed turned out to be 252. For all
the questionnaires distributed among medical specialists and medical doctors, the return
rate was 91.5% and 97.4% respectively. While all questionnaires distributed to nurses
and midwives were all returned for data analysis, the respective response rate among
pharmacists and dentists was 84.2% and 96.1%. All in all, 243 well filled
questionnaires out of 252 which had been distributed among professional health
workers in the hospitals were returned, resulting into the total response rate of 96.4%,
exceeding the minimum recommended response rate of 60% as suggested by Fincham
(2008).
4.1.3 Missing Data
Before undertaking the important stage of data analysis, the data have to be examined
carefully to check whether there are missing values as occurrences unavailability of
valid values for cases in one or more variables (Hayes, 2012). Before the questionnaire
was distributed to respondents, its items and the way it should be filled were explained
in the morning departmental meetings upon appointment with the head of department
(or service). The usefulness of fully filling the questionnaire was also explained along
with other ethical considerations during those short meeting sessions. After the data
collection process, all the questionnaires were checked for missing values and notes
were taken and recorded. According to Tabachnick and Fidell (2007) missing values of
less than 5% for each item can be substituted by the mean, and this technique was used

92
to respond to such issues in the screening of data for this study. It was noted, however,
that missing values were less than 2.7 % of the cases.
4.1.4 Analysis of Outliers
Outliers are abnormal which may be found in the data set and that substantially differs
from the rest, with respect to the values of one variable, or in a multivariate data, in
respect of combination of values for several variables (Barnett & Lewis, 1994). Outliers
are checked for before embarking on other data analysis procedures because they have
the potential to strongly influence on the parameters estimates of the model used for the
data, which in turn may create ambiguity or mistakes during the concluding phase, or
simply bring to inaccurate predictions [ibid]. Univariate outliers are checked for using
standardized scores within the interval of -3.0 to 3.0 (Osborne & Overbay, 2004). For
multivariate outliers, they are detected by use of Mahalanobis distance (D2) (Osborne
& Overbay, 2004; Tabachnick & Fidell, 2007), which indicates the distance of the case
to the centroid of all cases of explanatory variables. In case the probability of the D2 of
the case is below 0.001, it is considered as an outlier. By using these two techniques, it
came out that no outliers were identified.
4.2 Demographic Characteristics of Respondents
The social and demographic characteristics of the sample are described in this section
and provide the nature of respondents who participated in the study. The social and
demographic characteristics are concerned with 243 respondents whose questionnaires
were returned and considered for data analysis. To this end, the description of the study
participants was done by cross-tabulating the respondents’ area of work (considering
whether a professional health worker was a medical specialist, medical doctor, nurse,
midwife, dentist or pharmacist) with other social and demographic variables including
age, gender, marital status, level of education, experience in both the health service and

93
the current health facility, and the nationality. Table 4.2 summarizes the social and
demographic characteristics of the study participants in terms of counts and percentages
for each category.

94
Table 4.2: Social and demographic characteristics of respondents
Area of work
Medical
Specialists
General
Medical
doctors
Nurses Midwives Dentists Pharmacists Total
N 11 (4.52) 38 (16.23) 93 (38.27) 60 (24.69) 25 (10.28) 16 (6.58) 243 (100.00)
Gender
Male 7 (63.64) 19 (50.00) 52 (55.91) 31 (51.67) 11 (44.00) 9 (56.25) 129 (53.09)
Female 4 (36.36) 19 (50.00) 41 (44.09) 29 (48.33) 14 (56.00) 7 (43.75) 114 (46.91)
Age of Respondents
30 years and below 0 (0.00) 6 (15.79) 21 (22.58) 16 (26.67) 0 (0.00) 0 (0.00) 43 (17.70)
Between 31-40 years 3 ( 27.27) 14 (36.84) 33 (35.48) 25 (41.67) 11 (44.00) 4 (25.00) 90 (37.04)
Between 41-50 years 8 (72.73) 17 (44.74) 32 (34.41) 13 (21.67) 11 (44.00) 11 (68.75) 92 (37.86)
51 years + 0 (0.00) 1 (7.53) 7 (7.53) 6 (10.00) 3 (12.00) 1 (6.35) 18 (7.41)
Marital status
Single 4 (36.64) 14 (36.84) 25 (26.88) 15 (25.00) 2 (8.00) 5 (31.25) 65 (26.76)
Married 7 (64.64) 24 (63.16) 60 (64.16) 45 (75.00) 18 (72.00) 11 (68.75) 165 (67.90)
Divorced 0 (0.00) 0 (0.00) 3 (3.23) 0 (0.00) 5 (20.00) 0 (0.00) 8 (3.29)
Separated 0 (0.00) 0 (0.00) 3 (3.23) 0 (0.00) 0 (0.00) 0 (0.00) 3 (1.23)
Widowed 0 (0.00) 0 (0.00) 2 (2.15) 0 (0.00) 0 (0.00) 0 (0.00) 2 (0.82)
Level of Education
Secondary education (A2) 0 (0.00) 0 (0.00) 2 (2.15) 0 (0.00) 1 (4.00) 0 (0.00) 3 (1.234)
University Diploma (A1) 0 (0.00) 0 (0.00) 32 (34.41) 32 (53.33) 17 (68.00) 2 (12.50) 83 (34.16)
Bachelor’s Degree (A0) 0 (0.00) 33 (86.84) 55 (59.13) 28 (46.67) 7 (28.00) 14 (75.50) 137 (56.38)
Masters’ Degree 8 (72.72) 5 (13.46) 4 (4.31) 0 (0.00) 0 (0.00) 0 (0.00) 17 (7.00)

95
PhD 3 (27.28) 0 (0.00) 0 (0.00) 0 (0.00) 0 (0.00) 0 (0.00) 3 (1.23)
Experience in the Health Care Service Delivery
Below 1 year 0 (0.00) 0 (0.00) 5 (5.38) 1 (1.67) 0 (0.00) 0 (0.00) 6 (2.47)
Between 1 and 3 years 0 (0.00) 10 (26.32) 25 (26.88) 19 (31.67) 5 (20.00) 8 (50.00) 67 (27.57)
Between 4 and 6 years 2 (18.18) 18 (47.37) 31 (33.33) 15 (25.00) 4 (16.00) 4 (25.00) 74 (30.45)
Between 7 and 9 years 5 (45.45) 8 (21.05) 15 (16.13) 15 (25.00) 9 (36.00) 1 (6.25) 53 (21.81)
Between 7 and 9 years 0 (0.00) 0 (0.00) 7 (7.53) 0 (0.00) 1 (4.00) 0 (0.00) 8 (3.29)
Between 10 years and more 4 (36.36) 2 (5.26) 10 (10.75) 10 (16.67) 6 (24.00) 3 (18.75) 35 (14.40)
Experience in the Current Hospital
Below 1 year 0 (0.00) 10 (26.32) 12 (12.90) 5 (8.33) 2 (8.00) 0 (0.00) 29 (11.93)
Between 1 and 3 years 2 (18.18) 14 (36.84) 26 (27.96) 23 (38.33) 9 (36.00) 8 (50.00) 82 (33.74)
Between 4 and 6 years 7 (63.64) 12 (31.58) 43 (46.24) 28 (46.67) 11 (44.00) 5 (31.25) 106 (43.62)
Between 7 and 9 years 2 (18.18) 2 (5.26) 12 (22.90) 4 (6.67) 3 (12.00) 3 (18.75) 26 (10.70)
Between 7 and 9 years 0 (0.00) 0 (0.00) 0 (0.00) 0 (0.00) 0 (0.00) 0 (0.00) 0 (0.00)
10 years and more 0 (0.00) 0 (0.00) 0 (0.00) 0 (0.00) 0 (0.00) 0 (0.00) 0 (0.00)
Nationality
Rwandan 11 (100.00) 30 (78.95) 93 (100.00) 58 (96.67) 22 (88.00) 16 (100.00) 230 (94.65)
Non-Rwandan 0 (0.00) 8 (21.05) 0 (0.00) 2 (3.33) 3 (12.00) 0 (0.00) 13 (5.35)
Note: Figures in brackets show percentages to total
Source: Survey Data, 2017

96
As it reads out from table 4.2, a big number of respondents consists of nurses and
midwives represented by a respective percentage of 38.27% and 24.69% of the total
number of respondents whose returned questionnaires were considered for use in data
analysis. General medical doctors make 16.23 % of the total number of respondents,
followed by dentists who represent 10.28% of the sample. Another group of
respondents comes from pharmacists and medical specialists who respectively make a
percentage of 6.58% and 4.52% of respondents whose data provided in the answered
questionnaire was considered valid for use in data analysis.
The overall age of respondents varied according to the category of respondents. In fact,
while majority of medical specialists (72.73%) and pharmacists (68.75%) are in the age
category of 41 to 50 years age, majority of midwives (41.67%) and general medical
doctors (44.74%) are in the category of 31-40 years of age. Of all dentists who
participated in the study, 88% of them were concentrated in the age category of 31-40
(44%) and 41-50, with only six of them (12%) being in the category of 50 years of age
and above. Similarly, nurses in the age category of 31-40 and that of 41-50 make almost
a total of 70% while 22.58% and 7.53% fell in the categories of below 30 years of age
and 50 years of age, respectively. Medical specialists in the age category of 31-40 made
27.27% of the total respondents among specialists, which is close to the percentage of
pharmacists who fall in this age group (25%). While the category of age with the least
number of respondents is 50 years and above (7.53% among medical doctors and
nurses, 10% and 12% among midwives and dentists respectively, and 6.53% of the total
pharmacists), no single respondent was in the age of below 30 years of age among
medical specialists, dentists and pharmacists. It is also worth noticing that though the
age group of 30 years and below makes 43 % of the total number of respondents who
participated in the study, the percentage is relatively small across the respondents’ areas

97
of work in comparison with other groups of age: there is only 15.79% of this age group
among general medical doctors, 22.58% among nurses and 26.67% among midwives.
All in all out of 243 respondents whose returned questionnaires were considered for use
in this study, the categories of age of 31-40 and 41-50 made a percentage of 37.04%
and 37.86% respectively, then totalizing a percentage of almost 75% of the total number
of respondents.
In terms of marital status, the collected data on social and demographic characteristics
of respondents reveal that married respondents make 67.90% professional health
workers who participated in the study, followed by single respondents representing
26.76% of the total number of respondents. While only 8 (3.29%) respondents were
found out to be divorced, widowed and separated consisted of 1.23% and 0.82% of the
total number of respondents respectively. Among professional health workers who are
in the category of medical specialists, they were all found out to be in the categories of
married and single (64.36% and 36.64%, respectively) with none of them being in the
three last categories of divorced, widowed and separated. Another group of professional
health workers with no single respondent in the category of divorced, widowed and
separated consists of midwives and pharmacists; only 6 nurses reported to be either
divorced (3.23%) or widowed (3.23%) and 2 of them (2.15%) fall in the status of those
who are separated. It also turns out to realize that among dentists, married respondents
make a total of 72%, while 8% and 20% are single and divorced respectively. In
addition, while 64.16% of nurses and 75.00% of midwives are married, respondents
who reported to be single in these categories of health workers represented a respective
percentage of 26.88% and 25.00%.

98
Professional health workers with secondary education were identified among nurses
(2.15%) and dentists (8.00%) and none of them was counted among the remaining
categories of respondents. Similarly, none of respondents among medical specialists
had a university diploma or bachelor’s degree, as it was the case for general medical
doctors with university diploma. In the same viewpoint, it was realized that the
maximum level of education which was identified among midwives, dentists and
pharmacists was bachelor’s degree and none of these categories was reported to have
gone further with the university education with Masters and Doctor of Philosophy
(PhD). While all medical specialists had either master’s degree (72.72%) or PhD
(27.28%) as the highest level of education, most of general medical doctors had a
Bachelor’s degree (86.84%) with a very small number (13.46%) with Master’s degree.
The Bachelor’s degree was found to be also hold by many respondents among
pharmacists (75.50%), nurses (59.13%) and midwives (46.67%); respondents with
university diploma turned out to count in big number among dentists. All in all, 137
(56.38%) out of 243 respondents whose returned questionnaires were considered for
use in data analysis had university education with bachelor’s degree, followed by
professional health workers with university diploma (34.16%). While the respondents
with secondary education and PhD represented only 1.23% each, the total number
respondents with university education and who had gone further up to masters’ level
consisted of 7% of the total number of respondents.
The demographic characteristics of respondents in this study also considered
professional health workers’ tenure in the health care service. In this regard, it was
realized that no respondent among medical specialists, general medical doctors, dentists
and pharmacists has been working as a professional health workers for less than one
year. In the same way, there were no respondents among medical specialists in the

99
category of between 1 and 3 years as wells as between 10 to 12 years. Similarly, no
respondents were found with the experience of between 10 and 12 years among general
medical doctors, midwives, dentist and pharmacists. It was revealed through the data,
however, most medical specialists had between 7 and 9 years of experience in the health
care service profession (45.45%) and more than 13 years of experience (36.36%). As
far as general medical doctors are concerned, their experience in the health care service
delivery ranged from between 4 and 6 years (47.37%) through the range of between 1
and 3 years (26.32%) to that of between 7 and 9 years (21.05%) with only a percentage
of 5.26% who have been in this profession for more 13 years. The data also show that
half of both midwives and nurses are in the range of between 4 and 9 years; the range
of between 1 and 3 years of experience consists of 26.88% and 31.67% of nurses and
midwives respectively. While 50% of pharmacists had been in the profession for the
period ranging from 1 to 3 years, most dentists had been in the profession for the period
ranging from 7 to 9 years (36.00%) with the same percentage in the range or between
1 and 6 years (20% for between 1 and 3 years; 16% between 4 and 6 years of
experience). The overall count of years of experience among respondents shows that
the range of between 1 and 6 years had almost 60% of respondents (30.45% for the
range of 4-6 years and 27.57% for the range of 1-3 years of experience). While the
range of between 7 and 9 years of experience has 21.81% of respondents, those with
more than 14 years of experience in the health care service delivery were found out to
be 14.40% and only 2.47% of the total number of respondents had the experience of
less than one year in the health care service profession.
As far as the tenure in the current facility is concerned, it was realized that all
respondents have stayed for the hospitals where they are currently working for 9 years
or less, as none of them was found to have stayed in the hospital for 10 years or more.

100
It is worth noting that while majority of medical specialists (63.64%), nurses (46.24%),
midwives (46.67%), and dentists (44.00%) have been working in the current hospital
for the period ranging from 4 to 6 years, the period ranging from 1 to 3 years of stay in
the current hospital contains majority of general medical doctors (36.84%) and
pharmacists (50.00%), with another big number of general medical doctors in the period
ranging from 3 to 6 years of experience (31.58%) in the current health care institution.
Although no medical specialist had been in the current institution for less than one year,
a good number of them (18.18%) have been in the current hospital for a period ranging
from 1 to 3 years. Nurses, midwives and dentists who had been in the current hospital
make a total of 27.96%, 38.33% and 36.00% respectively, while the respective
percentage of 26.32%, 12.90%, 8.33% and 8.00% show the number of general medical
doctors, nurses, midwives and dentists who had been working for the current health
care institution of the period of less than one year. In a nutshell, while no professional
health worker among respondents was found to be working for the current institution
for 10 years or more, majority of them (43.62%) had stayed in the current hospital for
the period ranging between 4 and 6 years. Important is to note that the period ranging
from 1-3 years of experience in the current health care provision facility had a
percentage of 33.74% of respondents, with that of less than one year and the one of
between 7 and 9 years hold 11.93% and 10.70% of the total number of respondents.
The social and demographic characteristics of respondents also investigated into
whether a professional health worker is a national citizen or a foreigner. In this
viewpoint, almost all professional health workers who responded to the questionnaire
were Rwandan nationals (94.65%) with the rest being of foreign nationality (5.35%).
Foreign nationals were found to be performing their duties among medical general
doctors (21.05%), midwives (3.33%) and dentists (12.00%).

101
4.3 Performance Management Function
In order to assess the performance management function, a 14-item close-ended
questionnaire was distributed to health workers for them to express their perceptions on
how performance management is implemented in their respective hospitals. The items
on the questionnaire assessed the perceived level of planning of performance
management function, performance evaluation process and feedback after performance
management review.
In general, around 50% of respondents were on the view that there exists a performance
plan which is available to professional health workers (SA=30.50%; A: 23.50%) and
that the management and professional health workers discuss performance targets and
deliverables (SA: 28.8%, A: 24.7%). It was revealed through their responses that more
than 50% of respondents were in disagreement with the fact that professional health
workers are allowed to express their views and provide inputs for performance targets
(and performance management function in general) (D=35.4%; SD=16.5%) ,
professional health workers’ responsibilities being clearly defined in the performance
management document (D=45.3%; SD=6.2%), and performance measures for
professional health workers being well documented in writing and recorded for
reference for the next step of the process (D: 32.9%; D=22.2%). Generally, a slightly
high level of perceived performance management planning was noticed according to
the Likert scale mean ranges interpretation as the mean was 2.82 (St. Dev=0.88) for this
indicator. In fact, apart from documenting of performance measures which was rated
low (Mean=2.39; St. Dev=0.87), other measures of this indicator of performance
management function were perceived to be at high level: discussing performance
targets with management (Mean=2.78; St. Dev=0.91), clear definition of health

102
workers’ responsibilities in a performance management document (Mean=2.65; St.
Dev=0.89).
The status of performance management function was also examined through the
perceived level of health workers’ performance evaluation activity. In general, less than
50% of respondents who participated in the study were in agreement that professional
health workers were provided with right amount of constructive criticism (feedback
about the areas for improvement) as part of performance feedback (SA=18.9%;
A=39.9%), and that line managers reach employees agreed about the aspect of
performance (SA=19.9%; A=39.1%). On the other side, it was noticed that between
50% and 60% of respondents were in disagreement with periodical conducting of
performance review (D=37%; SD=16.9%), fairness in conducting professional health
workers’ performance evaluation in hospitals (D=12.8%; SD=42.8%) and allowing
health workers to take part in the process of performance evaluation by freely express
their views (D=38.7%; SD=15.8%). All in all, performance evaluation was perceived
high (mean=2.51; St. Dev=0.99) as its average mean slightly went beyond the minimum
cut off (2.50) for the categorization of a high range according to the interpretation of
likert scale mean ranges. This was due to the fact that apart from one measure of taking
part in the performance evaluation process which was rated low (mean=2.48; St.
Dev=0.87), others measures were perceived to be high.
The third indicator which was used to establish the level of implementation of
performance management process was provision of performance feedback after a
performance evaluation exercise. In fact, while a slightly high level of perception was
noticed in the measures of providing health workers with right amount of constructive
criticism (feedback about the areas for improvement) (mean=2.76; St. Dev=0.76),

103
positive feedback for good performance as part of performance feedback (mean=2.75;
St. Dev=0.76) and line managers and health workers reaching an agreement about the
aspect of their performance (mean=2.55; St. Dev=0.94), providing performance
feedback on due time was rated low (mean=2.44; St. Dev=0.92).
All in all, performance management function was established through three main
indicators: performance planning, performance evaluation and performance feedback
after a performance review exercise and 13 items were used to measure this variable. It
was revealed that health workers’ perceptions rated performance management function
as slightly high (mean=2.59; St. Dev=0.92). Descriptive statistics of perceived level of
implementation of performance management function are presented in 4.3.
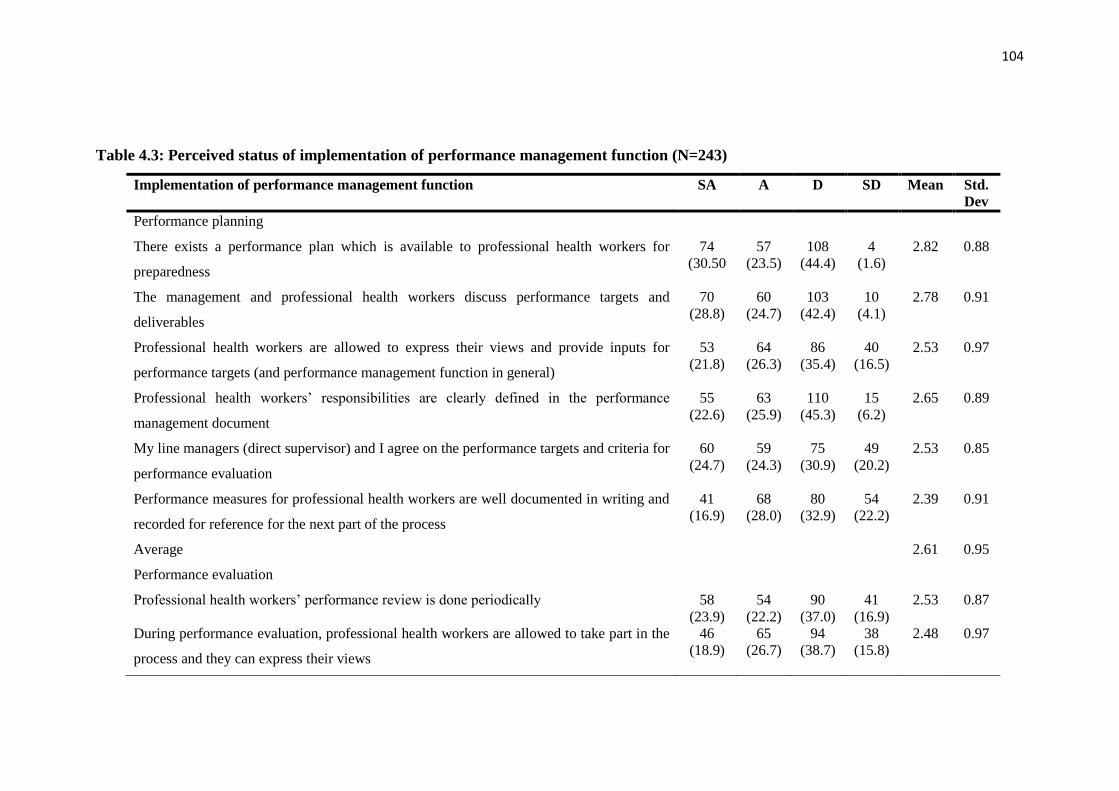
104
Table 4.3: Perceived status of implementation of performance management function (N=243)
Implementation of performance management function SA A D SD Mean Std.
Dev
Performance planning
There exists a performance plan which is available to professional health workers for
preparedness
74
(30.50
57
(23.5)
108
(44.4)
4
(1.6)
2.82 0.88
The management and professional health workers discuss performance targets and
deliverables
70
(28.8)
60
(24.7)
103
(42.4)
10
(4.1)
2.78 0.91
Professional health workers are allowed to express their views and provide inputs for
performance targets (and performance management function in general)
53
(21.8)
64
(26.3)
86
(35.4)
40
(16.5)
2.53 0.97
Professional health workers’ responsibilities are clearly defined in the performance
management document
55
(22.6)
63
(25.9)
110
(45.3)
15
(6.2)
2.65 0.89
My line managers (direct supervisor) and I agree on the performance targets and criteria for
performance evaluation
60
(24.7)
59
(24.3)
75
(30.9)
49
(20.2)
2.53 0.85
Performance measures for professional health workers are well documented in writing and
recorded for reference for the next part of the process
41
(16.9)
68
(28.0)
80
(32.9)
54
(22.2)
2.39 0.91
Average 2.61 0.95
Performance evaluation
Professional health workers’ performance review is done periodically 58
(23.9)
54
(22.2)
90
(37.0)
41
(16.9)
2.53 0.87
During performance evaluation, professional health workers are allowed to take part in the
process and they can express their views
46
(18.9)
65
(26.7)
94
(38.7)
38
(15.8)
2.48 0.97
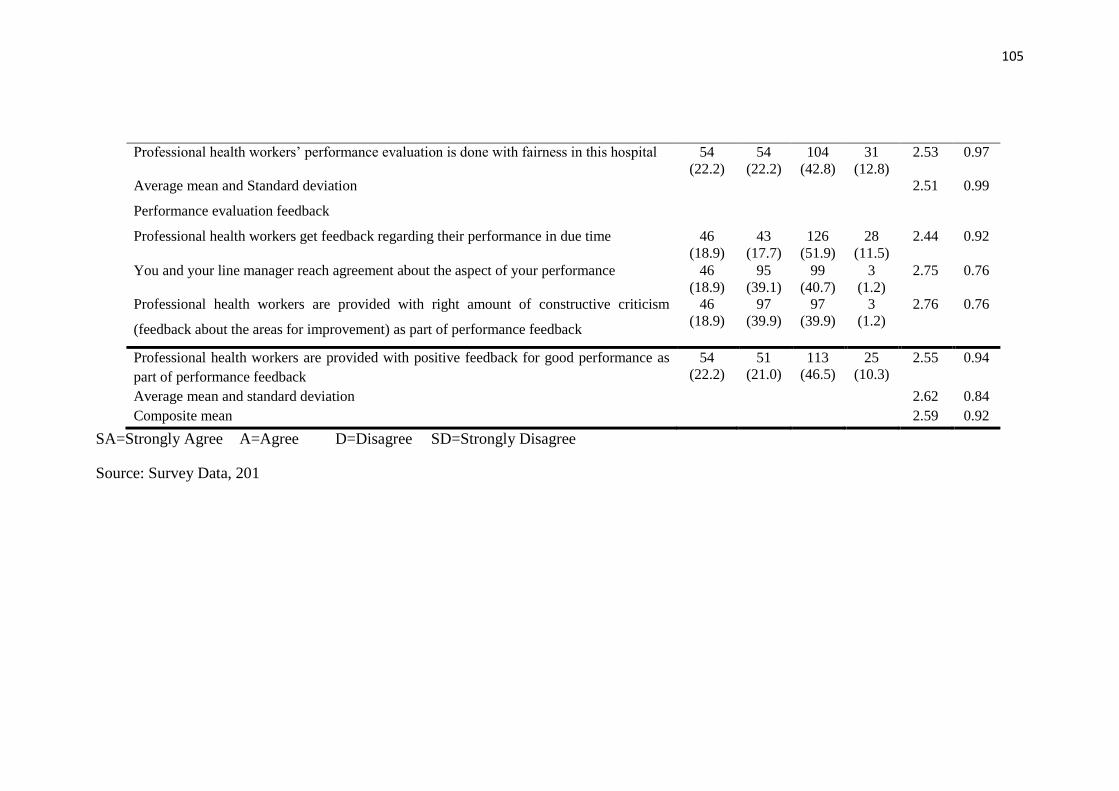
105
Professional health workers’ performance evaluation is done with fairness in this hospital 54
(22.2)
54
(22.2)
104
(42.8)
31
(12.8)
2.53 0.97
Average mean and Standard deviation 2.51 0.99
Performance evaluation feedback
Professional health workers get feedback regarding their performance in due time 46
(18.9)
43
(17.7)
126
(51.9)
28
(11.5)
2.44 0.92
You and your line manager reach agreement about the aspect of your performance 46
(18.9)
95
(39.1)
99
(40.7)
3
(1.2)
2.75 0.76
Professional health workers are provided with right amount of constructive criticism
(feedback about the areas for improvement) as part of performance feedback
46
(18.9)
97
(39.9)
97
(39.9)
3
(1.2)
2.76 0.76
Professional health workers are provided with positive feedback for good performance as
part of performance feedback
54
(22.2)
51
(21.0)
113
(46.5)
25
(10.3)
2.55 0.94
Average mean and standard deviation 2.62 0.84
Composite mean 2.59 0.92
SA=Strongly Agree A=Agree D=Disagree SD=Strongly Disagree
Source: Survey Data, 201
106
As from the mixed methods approach, qualitative data were used to complement
descriptive findings from quantitative data. The qualitative data gave more details on
professional health workers’ experiences and views on the implementation of performance
management function in order to complement quantitative data on this variable. The
analysis of interview and focus group discussion cases provided from different health
workers were presented using narrative and verbatim patterns.
In general, health workers’ views and experiences as they relate to the implementation of
performance management function were summarized around the main themes of how they
view performance planning signing performance contracts and setting goals in their
different hospitals, conducting of performance evaluation activity, challenges which are
associated with performance evaluation, issues related to fairness in this exercise, and
feedback after performance evaluation.
In this regard, respondents who participated in the interviews and focus group discussions
had different views on the implementation of performance management function. First, it
was noticed from majority of respondents that they understood the necessity for
performance planning, but the challenge was related to the rotation of health workers from
one department to another, which makes it difficult to make a follow up on the planned
targets. Second, performance evaluation was a recognized activity in hospitals. However,
some issues were raised about fairness during the process. Lastly, it was realized that for
performance feedback most of time it was for blaming health workers who did not perform
well, and positive feedback or constructive criticism was lacking.
Generally, it was noticed that qualitative findings supported findings of quantitative
findings on the perceived status of implementation of performance management function.
In fact, as it was captured from respondents’ submissions, most cases reported difficulties

107
in performance management planning as the core business of performance management
function in the hospitals.
The divergent experiences on performance planning in the hospitals, led to finding out
that this function existed in some hospitals as it was confirmed by respondents
DEH208, NUH211, DOH204 and PHAH312. Another one uttered that:
Thank you... Staff and managers in the same services sat together and
prepared their performance contracts. They set performance
contracts for themselves; for example, stating that each new born in
the maternity department (….) nothing is difficult since they are their
own performance contracts (MIH211).
Although this indicator was rated high, it had a mean closer the maximum of a low value
in the interpretation of mean ranges. Considering findings from interviews and focus group
discussions, this can be supported by movement to different services might come along
with different other responsibilities, as it was put by one nurse who said: “…what I know
is that an employee is deployed in this or that service. You cannot determine in advance
what to be done this year, next year…” (NUH303). This idea is not far from that of a
midwife who mentioned that:
“As you know things are not that easy in the health sector. I may
sign performance contract in service of ambulance today; then
next month I’m rotated to another service which has different
tasks. There are a lot of challenges. In addition, during the
performance planning, professional health workers are not
involved and the rotation process has an impact vis-a-vis the
implementation of performance.” (MIH101, 2017)
The reported difficulties in the performance management planning in the hospitals were
stressed by the fact that some health workers felt that it was almost inexistent as it emerged
from one of the respondents who asserted that “I don’t know….maybe you can ask
somebody else, but I can’t say I know that planning exists; I don’t see it here….in fact
I have never seen it…” (NUH105, 2017).

108
Considering the fact that performance planning often goes with signing performance
contracts and setting goals to achieve during a certain period of time, some health
workers reported that “we don’t have any performance contracts” (PHAH209, 2017).
Having performance planning was reported with some challenges which come along
with it in some units of work where setting a health worker’s performance targets may
be challenged by the fact that sometimes his/her task needs other people’s intervention
to be completed: “we agree on performance contract items but it is sometimes difficult
as, for example, in the maternity department, you need to meet other doctors, midwifes
and nurses for you to arrive to a full completion of the task. (DOH204, 2017).
The challenges related to performance management planning in the hospitals were also
thought to be due to the fact that setting the targets does not involve professional health
workers and consider their inputs, but rather are presented to them for signature as it
was submitted by one of them that:
That may be difficult. Actually, we are always given forms. I am not
involved in setting performance targets…they [line managers]
come and tell us what they have decided to put in performance
contracts. They often tell us what to put in performance contract,
(Uh-huh) and tell us that failure to achieve the targets will result
into a punishment (FH16, 2017).
Apart from performance planning, respondents also shared their experiences on
performance review. In general, it came out from their submissions that performance
appraisal was a function mostly involving line managers and did not have anything to
do with front line employees, as one of them stated that: “…unless it was done when I
was on leave. I do not have any information about that. Maybe it is done by our
managers on our behalf…” (NUH103, 2017). On the same, another professional health
worker stated that:

109
May be I have never had chance to do that. They have not given us
the evaluation results, showing how they evaluated. We really set
targets like performing this or that task and see how they are
achieved. On may have a certain problem leading to a certain
mistake but when time has come for us to evaluate our performance
contracts, we look at how we performed among ourselves. We can
identify someone with poor performance. They have not evaluated
and provided us with results and tell us that this was bad or good.”
(NUH315, 2017)
From respondents’ experiences, it was noticed then that that performance evaluation in
some instances consisted of just filling the form and not thoroughly consider agreed
upon targets. The respondent put it that:
The person in charge of the maternity ward brings the performance
forms, say like for ten of them for the whole service. After we have
filled them, s/he takes them to the HR, who in turn will put them in
everyone’s file. When it is time for evaluation, everyone is given the
form back to be filled before submission as we did at the beginning.
No other time is provided to look at better performance. (MIH101,
2017)
As far as feedback which is provided to employees after performance evaluation is
concerned, the general finding was related less exposure to this main component of
performance review, as it came out from one focus group discussion:
That is not possible; we do not meet. No, they don’t. That is what I
have been saying. May be they are going to change the way it used to
be. I think they are going to change it because it has been a topic
under discussion for the last four years, as most of us are not provided
with feedback after performance review (FH16, 2017).
Other respondents argued that: “They have never called me for feedback. Personally,
nobody has called me. Maybe others have been called. Maybe my direct line manager,
or maybe the responsible of service… Nobody has called me” (MIH211, 2017). “No.
Not yet….. I have never seen it [performance feedback] happening here” (PHAH2011,
2017). The following also mentioned the same worry:
That has never happened. What happens is just blaming us. They
never talk about better performances (DEH223, 2017)

110
This has never happened. Sometimes they call you early in the
morning before you rotate, telling you to sign the performance results.
Then, because of tiredness, it becomes impossible to have a
discussion. What you do is just to sign and rush home to rest (FH23,
2017).
In the whole, professional health workers’ views on performance management function
in the hospitals echoed the feeling that there were loopholes in the way it was done.
Having insisted that performance management “is not fair” in the institutions, another
two respondents (MIH313, FH11) said that there was a need for hospital managers to
devise a clear way to implement performance management function from its planning
through appraisal to feedback, especially by having professional health workers’
collaborate with line managers for better outcome, as they mentioned that “I think they
are going to change the approach. In fact, we are usually given the form at the beginning
and another one at the end of the year without any guidance, so there is a need for
change of the way it is done”( MIH313, 2017). Another respondent said: “I think they
are going to change the strategy. Otherwise, the employee was the one to set the targets
and evaluate her/himself, nothing else” (FH11, 2017). In the same view point, a nurse
respondent stated that:
That is what I said. I am saying that performance contracts are not
prepared because everyone sets the targets s/he feels able to achieve,
often lacking quality. For example, someone may state that s/he will
fill up forms because s/he knows how to write and take notes. S/he can
similarly say s/he will take vital signs. Anyway, one sets easy targets
in order to avoid having troubles during evaluation often because
there is no guideline, due to lack of collaboration between employees
and managers in that matter. Another example is about employee
promotion. In fact, it is often said that people should be promoted after
a given period of working time. However, this is not the case here; yet,
it should be done and related to performance contracts and reflect
evaluation results (NUH313, 2017).
All in all, it came out from descriptive findings that most measures of implementation
of performance management function were rated high, and this was supported by

111
qualitative findings. In fact, respondents’ views and experiences showed that they were
aware of performance planning because most of them said they knew performance
targets were set in advance. They also revealed that performance evaluation was
conducted and that in some instances, there was a performance feedback.
However, findings from the data on the perceived level of performance management
function were low in terms of documenting performance targets. This is in tandem with
findings from interviews and focus group discussions which raised many issues on
performance planning because of shifting from one department to another, some tasks
which needed the intervention of other health personnel for their full completion.
Quantitative findings also showed that there was lack of timely feedback after a
performance evaluation exercise, which corroborates with most respondents’
submissions in the interviews and focus group discussions, where the most important
claim was that they didn’t even get such a feedback.
4.4 Financial Incentives
In order to assess the level of availability and provision of financial incentives, a likert
scale questionnaire was distributed to health workers. Financial incentives were
established in terms of availability of conditions of employment (including
salaries/wages), allowances (including benefits) and discounts and fellowships, loans
and discounts.
As for conditions of employment, it was realized that a big number of respondents were
in disagreement with the statement that the salary provided was enough for them to
meet the requirements (D=30.9%; SD=45.33%). The same trend was observed for the
procedure for salary promotions and their being clearly understandable to health
workers (D=35.4%; SD=37.9%) and for equitable and fair payments (D=28.8%;

112
SD=36.6%). On the basis of the Likert scale mean ranges interpretation, it was found
that salaries and wages (mean=1.84; St. Dev=0.92), equity and fairness in payments
(mean=2.13; St. Dev=0.87) as well as availability and clear comprehensive procedures
for salary promotions (mean=2.01; St. Dev=0.93) were perceived to be at low level.
The only measure which was rated high is related to comprehensive policies and
procedures used to determine salary structure (mean=2.58; St. Dev=0.97). It was
consequently realized that the indicator of conditions of employment was generally
rated low (mean=2.14; St. Dev=0.99).
In terms of allowances provided to health workers, majority of respondents were in
agreement that medical and health insurance packages were well structured and
sufficient to cover medical and health costs (SA=52.3%; A=20.2%). This was the same
for allowances for retirement benefits (SA=3.3%; A=55.1%). For other measures of
this indicator, a big number of respondents were in disagreement with the statements
measuring them. In this regard, a perceived low level of availability and provision of
allowances was noticed for provision of overtime payments the job done out of normal
working hours (mean=1.74; St. Dev=0.76), transport allowances (mean=1.85; St.
Dev=0.76) and bonuses (mean=2.25; St. Dev=0.89). A slightly perceived high level
was noticed medical allowance to cover health costs (mean=2.81; St. Dev=0.87). All in
all, it was revealed that the overall consideration of availability and provision of
allowances as part of financial incentives in the hospitals was low (mean=2.28; St.
Dev=0.85).
Financial incentives were also established in terms of availability and provision of
fellowships, loans and discounts. It emerged from respondents’ provided responses that
the level of childcare benefits as additional compensation scheme was perceived low

113
(mean=2.03; St. Dev=0.85). A perceived low level was also noticed with availability
and provision of discounts and additional compensation scheme (mean=1.97; St.
Dev=0.88) and procedures for such payments (mean=2.44; St. Dev=0.85). The overall
average mean of the indicator of fellowships, loans and discounts showed that it was
perceived as low (mean=2.26=St. Dev= 0.83).
The availability and provision of financial incentives in hospitals being established in
terms of conditions of employment, allowances, fellowships loans and discounts was
perceived to be low (mean=2.23; Sd Dev=0.88) according to the Likert scale mean
ranges interpretation. The summarized descriptive statistics for this variable are
presented in table 4.4.
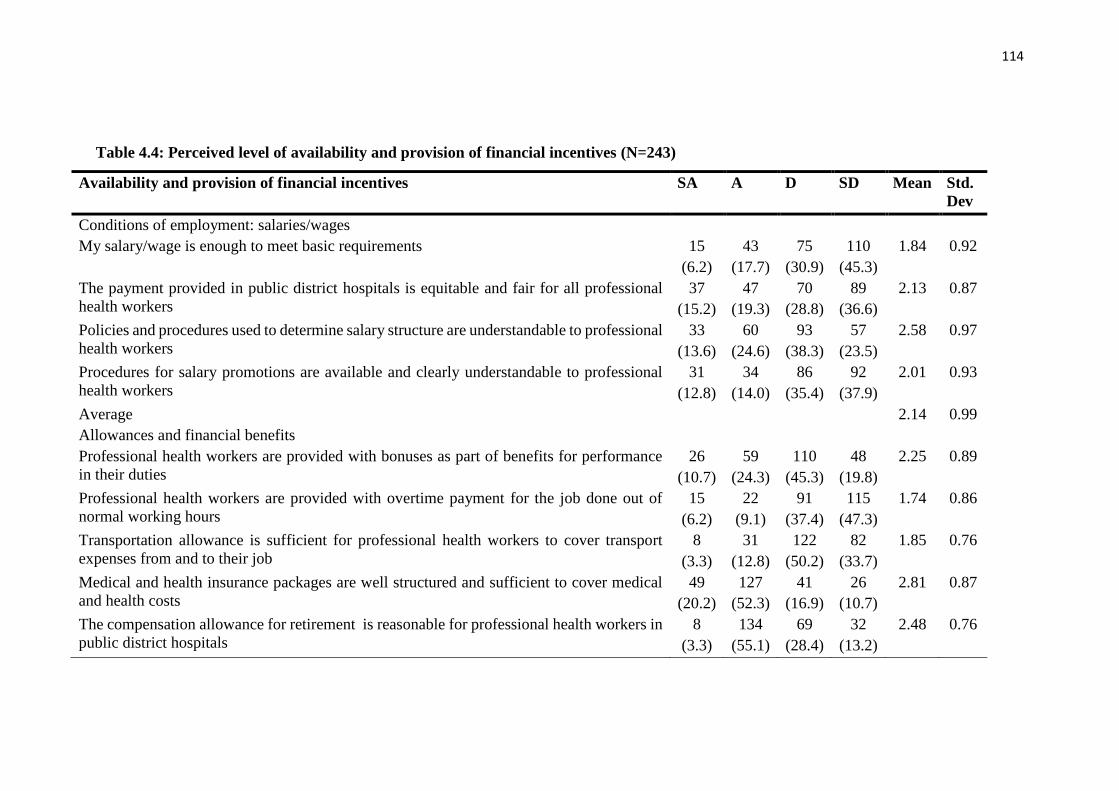
114
Table 4.4: Perceived level of availability and provision of financial incentives (N=243)
Availability and provision of financial incentives SA A D SD Mean Std.
Dev
Conditions of employment: salaries/wages
My salary/wage is enough to meet basic requirements 15
(6.2)
43
(17.7)
75
(30.9)
110
(45.3)
1.84 0.92
The payment provided in public district hospitals is equitable and fair for all professional
health workers
37
(15.2)
47
(19.3)
70
(28.8)
89
(36.6)
2.13 0.87
Policies and procedures used to determine salary structure are understandable to professional
health workers
33
(13.6)
60
(24.6)
93
(38.3)
57
(23.5)
2.58 0.97
Procedures for salary promotions are available and clearly understandable to professional
health workers
31
(12.8)
34
(14.0)
86
(35.4)
92
(37.9)
2.01 0.93
Average 2.14 0.99
Allowances and financial benefits
Professional health workers are provided with bonuses as part of benefits for performance
in their duties
26
(10.7)
59
(24.3)
110
(45.3)
48
(19.8)
2.25 0.89
Professional health workers are provided with overtime payment for the job done out of
normal working hours
15
(6.2)
22
(9.1)
91
(37.4)
115
(47.3)
1.74 0.86
Transportation allowance is sufficient for professional health workers to cover transport
expenses from and to their job
8
(3.3)
31
(12.8)
122
(50.2)
82
(33.7)
1.85 0.76
Medical and health insurance packages are well structured and sufficient to cover medical
and health costs
49
(20.2)
127
(52.3)
41
(16.9)
26
(10.7)
2.81 0.87
The compensation allowance for retirement is reasonable for professional health workers in
public district hospitals
8
(3.3)
134
(55.1)
69
(28.4)
32
(13.2)
2.48 0.76

115
Professional health workers in public district hospitals are provided with paid time-off
incentives
58
(23.9)
52
(21.4)
106
(43.6)
27
(11.1)
2.58 0.97
Average 2.28 0.85
Fellowships, loans and discounts
Our institution provides childcare benefits to professional health workers as an additional
compensation scheme
16
(6.6)
45
(18.5)
113
(46.5)
69
(28.4)
2.03 0.85
Some discounts on health services are provided to professional health workers in our
institution as an additional compensation scheme
16
(6.6)
43
(17.7)
102
(42.0)
82
(33.7)
1.97 0.88
The hospital has performance payments schemes available to professional health workers 32
(13.2)
99
(40.7)
102
(42.0)
10
(4.1)
2.62 0.76
Procedures for performance payments to professional health workers are fair and equitable
across staff levels
35
(14.4)
61
(25.1)
124
(51.0)
23
(9.5)
2.44 0.85
Average 2.26 0.83
Composite 2.23 0.88
SA=Strongly Agree A=Agree D=Disagree SD=Strongly Disagree
Source: Survey Data, 2017

116
In order to have a deep understanding of the level of availability and provision of
financial incentives, interviews and focus group discussion were organized around this
variable. The target was to have qualitative data to complement quantitative data on the
perceived status of financial incentives. The main themes that were noticed in the
course of qualitative data analysis included complaint about salaries, transport
allowances, facilitation and advocacy for loan acquisition, accommodation and
additional benefits as part of compensation scheme
In the course of qualitative data analysis on the conditions of employment, it came out
from respondents that that the salary was not the only big issue that faced them in their
health profession. It was mentioned by one pharmacist, for example, who stated that:
Ok, in general, I can say that…..It is not bad because…..people
are waged according to their level of education and these things
are standard in all hospitals except things related to PBF which
can be vary from time to time….So for the salary, I can really
say….there is no problem with it. (PHAH17, 2017).
On the side of health workers who mentioned that salaries provided to them was not
enough, it was reported in most cases that compared to the increasing change of in the
living expenses, salaries could not cover the basic necessities. One of them submitted
that:
Ok….For the time being, the salary isn’t enough at all compared
to the costs of things on the market. For example one kilo of rice
is now twice its cost in 2014, and it is the same for sugar. All things
have gone up in price but the salary has not. It remains the same.
Generally speaking, if one compares the worker’s needs and their
salary, they are all out of proportion. Although you wouldn’t think
so, the salary is a common matter in general. (DEH223, 2017)
Another one uttered that:
Salary itself is not enough compared to the prices on the market.
They increased too much whereas the salary is still the same. The
salary doesn’t go up. Long ago one kilo of beans was RwF200,
one kilo of potatoes was RwF100frs. Today, prices have changed

117
dramatically but salary hasn’t. It is not enough at all. (FH35,
2017)
The previous professional health workers’ views were not different from another nurse
who mentioned that the cost of basic necessities had been going up to such an extent
that there was a struggle in trying to cover them up. In addition to this, it was also
revealed that the salary did not go up in accordance with experience in the service. In
her submission, she stated that
In my opinion the salary is not still enough compared with the
prices on the market. Be it transport, shopping, school fees, or any
other thing in the everyday life of a health worker. Look…my
salary has not changed for the last ten years, whereas prices on
the market are growing too much. Let me tell you about transport
fee, for example at the time, one used to pay RwF from (……),
today one pays RwF200 whereas may salary is still the same, there
is no change (MIH320, 2017).
Participants to interviews and focus group discussions also expressed their views on
other financial benefits. For this, some of them recognized that there was the amount of
money which was contributed monthly for their medical insurance and retirement
allowances. In recognition of such allowances, one of them said that
Professional health workers in this hospital are still young.
Nobody has gone in retirement. I think there are regulations about
such allowances. However, I know that on the pay slip there is an
amount of money we contribute in RSSB, then covering medical
insurance and retirement allowances. I think the retirement
benefit is the money that one gets when it is time to retire
(PHAH318, 2017).
But for some respondents, it was realized that they did not have interest in the retirement
benefits as one of them mentioned that:
I don’t know anything about the Social Security Fund. What I
know is one can get updates. I hear about people talking about
getting retirement benefits, but I am not interested in knowing
about it. I don’t have any interest about it. Nobody has. Some
people get information when they request about it but I have never
done it. I haven’t thought about it [retirement benefits] yet,

118
eh….there is still much time. Unless you want to advise me to
follow it up and get information about it, I still have much time to
think about it. With regard to the RAMA (health insurance), I don’t
have any problem. Whenever I want a medical service, I don’t find
any problem with it. (NUH209, 2017).
On the other hand, it was difficult for professional health workers to describe such
allowances and make a difference between them and the basic salary, as one of them
said that “Ok….It isn’t clear. One cannot distinguish what transport is or housing
allowances from the salary, we just get our salaries at the end of the month. I can’t tell
you this is for transport, this is for house allowance” (NUH208, 2017).
On the same issue of transport, some respondents knew transport allowance was
provided with their salaries, but they mentioned that it was not enough to cover
transport costs. One of them said, for example:
In fact, as the number of public transport vehicles is small, you spend
too much time at the station and get late. And the allowance we are
given for transport is not enough. Actually, that is why we get late to
work. We spend too much time at stations waiting for a common
transport –which is usually cheap – because we cannot afford a
motorbike to be on time, because of the lack of enough money
(NUH102, 2017).
It was revealed, however, that there was availability of compensation benefits for health
care providers with additional responsibilities, though they were said to be at lower rate.
From one of professional health workers who talked about this, it was learnt that:
Well, I used to get some when I was the head of the maternity ward. I
also used to get it when I was in charge of the surgery room. Normally,
any staff with special responsibilities gets incentive at the end of the
month. I used to get fifteen thousand but this amount didn’t match my
responsibilities. In fact, I could even come at the weekend and work
whenever any staff was absent. As a result, I could leave very late. At
the moment, the amount has increased to thirty thousand (MIH320,
2017).
For other benefits like professional health workers benefitting study leaves for their
education, or their children and spouses benefiting special health care schemes and any

119
other benefits in terms of financial gain, it was reported that they were not available or
existed at a very low level. This emerged out from views of respondents DOH206,
FH13, FH32, NUH314, FH22 and DE105.
All in all, while professional health workers’ views from qualitative data were in line
with findings for quantitative survey. The overall consideration of professional health
workers’ perceptions on the level of availability and provision of financial incentives
in public district hospitals showed that generally there was a dominant low perception
on them. This low perceived levels of financial incentives across majority of its majors
was corroborated with qualitative findings which showed that respondents viewed that
salaries were low. In addition, transport allowances and other benefits were also said to
be low. It was also noticed from both the survey findings that loans and discounts were
perceived to be at low level, which was in relation with qualitative findings where
respondents said they did not have such schemes and that where they were available, it
was at very low rates. In the same way, having noticed that medical benefits were
perceived to be high was in line with qualitative findings that respondents confirmed
they were enough.
4.5 Non-financial Incentives
In order to assess the status of non-financial incentives, a 22-item questionnaire was
used to investigate into perceived status of working conditions, training and
development, and career development. Starting with working conditions, a combined
view of responses showed that between 50% and 60% of respondents were in agreement
(by either agreeing or strongly agreeing with the proposed statement) with provision of
enough equipment (SA=5.8%; A=48.1%), existence of appropriate and enough
lightning at the work place (SA=35.8%; A=30%) and the fact that health workers were

120
not frustrated because of poor working conditions (SA: 14.8%; A=375). For other
measure of this indicator, it was observed that more than 50% of respondents were in
disagreement (by either responding with “disagree” or “strongly disagree”). For
example, it turned out to realize that close to 63% respondents were in disagreement
with existence of reasonable workload for health workers. In the same way, more than
55% were in disagreement with hospitals facilities being in good conditions and the
availability of safety measures including personal protection against risks caused by the
nature of job at the hospital.
Basing on the interpretation of likert scale response mean ranges, it was noticed that
only three measures of working conditions had a mean of between 2.50 and 3.25,
therefore being rated as high: provision of enough equipment (mean=2.51; St.
Dev=0.72), appropriate and enough lightning at work place (mean=2.93; St.
Dev=0.97), and management recognition of the work-life-balance principle
(mean=2.61; St. Dev=0.86). Other measures were perceived by respondents as low: the
workload for professional health workers in our hospital is reasonable (mean=2.45; St.
Dev=0.94), professional health workers are facilitated to have flexible working hours
(mean=2.24; St. Dev=0.80), hospital facilities (offices, wards, theatres, wash rooms…)
are in good conditions for professional health workers (mean=2.16; St. dev=0.87),
mechanisms for noise reduction for better working conditions in the hospital
(mean=2.44; St. Dev=0.84, flexibility to allow lifestyle changes in the hospital
(mean=2.46; St. Dev=0.68), availability of safety measures including personal
protection against risks caused by the job in the hospital (mean=2.47; St. Dev=0.85),
feeling of enough security measures for health workers and their personal belongings
and the work equipment provided to them in this hospital (mean=2.41; St. Dev=0.97),
feeling non frustration at work because of poor working conditions at the hospital

121
(mean=2.44; St. Dev=0.99). The overall mean of conditions of work rated it as low
(mean=2.46).
The second indicator which was used to establish non-financial incentives was training
and development, which was measured using 5 items. Generally, the number of
respondents who were in disagreement with the proposed statements outweighed those
who were in agreement with them. For example, more than 70% of respondents
disagreed that training and development opportunities served as the basis for promotion
and allowances (SD=30.5%; D=44%) and fairness in sharing available training and
development opportunities (D=51.0%; SD=21.8%). All on all, the indicator of training
and development was rated low (mean=2.16; St. Dev=0.89). In fact, a perceived low
level of training and development was noticed across all its measures: existence a
training and development policy concerning all professional health workers in the
hospitals (mean=2.22; St. Dev=0.94), provision of opportunities to go for training and
development opportunities with fairness (mean=2.16; St. Dev=0.90), encouraging
health workers who come from training to share what they have learnt to other
colleagues (mean=2.23; St. Dev=0.95), line managers and supervisors supporting
professional health workers who come from training to use skills and techniques learnt
during training sessions (mean=2.20; St. Dev=0.81), and training and development
opportunities serving as the basis for professional health workers to be promoted and
given allowances (mean=2.01; St. Dev=0.87).
Finally, non-financial incentives were established in terms of perceived level
availability and provision career development opportunities. It observed through the
responses that in general a big umber of respondents were in disagreement with
proposed statements measuring the status of career development in the hospitals. It was

122
therefore realized that this indicators of career development was rated low (mean=2.29;
St Dev=0.79) as its measures were all perceived as low: hospital management and
administration initiating career development systems to support professional health
workers in developing their career, The hospital has self-assessment tools to facilitate
professional health workers to understand their own desires, aspirations, likes and
dislikes (mean=2.18; St. Dev=0.72), hospital management and administration
organizing career planning workshops to help professional health workers learn from
others’ reality in career development (mean=2.15; St. Dev=0.77), professional health
workers receiving individual counseling in order to understand their own goals and to
make changes in the everyday practices (mean=2.18; St. Dev=0.83), job rotation
programs and assessment centers for professional health workers to be able to reinforce
their career development (mean=2.44; St. Dev=0.91), professional health workers
being recognized for good job or high achievement (by being congratulated in the
public, being given certificates, etc) (mean=2.31; St. Dev=0.70)
The overall mean of non-financial incentives was 2.34 and it was below the threshold
of 2.50, which is the minimum for a four-point likert scale mean range interpretation to
be rated as high. Therefore non-financial incentives were perceived to be at low level
as it is presented in table 4.5.

123
Table 4.5: Perceived status of non-financial incentives (N=243)
Availability and provision of non- financial incentives SA A D SD Mean Std. Dev
Working conditions
The workload for professional health workers in our hospital is reasonable 48
(19.6)
45
(18.5)
120
(49.6)
30
(12.3)
2.45 0.94
Professional health workers are facilitated to have flexible working hours 15
(5.6)
75
(30.9)
110
(45.3)
43
(17.7)
2.24 0.80
Hospital facilities (offices, wards, theatres, wash rooms…) are in good conditions for
professional health workers
8
(3.3)
93
(38.3)
74
(30.5)
68
(28.0)
2.16 0.87
Professional health workers in this hospital are provided with enough equipment for
them to be able to do the job well
14
(5.8)
117
(48.1)
93
(38.3)
19
(7.8)
2.51 0.72
There is appropriate lightning in the working places in the hospital for me to be able
to do the job well
87
(35.8)
73
(30.0)
63
(25.9)
20
(8.2)
2.93 0.97
There are mechanisms for noise reduction for better working conditions in this
hospital
24
(9.9)
93
(38.3)
94
(38.7)
32
(13.2)
2.44 0.84
There is flexibility to allow lifestyle changes in the hospital 14
(5.8)
98
(40.3)
118
(48.6)
13
(5.3)
2.46 0.68
Hospital management recognize work-life-balance principle and I enjoy it at my
working place
48
(19.8)
67
(27.6)
114
(46.9)
14
(5.8)
2.61 0.86
There is availability of safety measures including personal protection against risks
caused by the job in this hospital
32
(13.2)
72
(29.6)
112
(46.1)
27
(11,1)
2.47 0.85

124
I feel that there are enough security measures for me, my personal belongings and
the work equipment provided to me in this hospital
38
(15.6)
73
(30.0)
85
(35.0)
47
(19.3)
2.41 0.97
I feel that I am not frustrated at work because of poor working conditions at this
hospital
36
(14.8)
90
(37.0)
64
(26.3)
53
(21.8)
2.44 0.99
Average
Training and development opportunities 2.46 0.86
There is a training and development policy concerning all professional health
workers in this hospital
30
(12.3)
52
(21.4)
103
(42.4)
58
(23.9)
2.22 0.94
Professional health workers in this institution are given opportunities to go for
training and development opportunities with fairness
28
(11.5)
38
(15.6)
124
(51.0)
53
(21.8)
2.16 0.90
Professional health workers who come from training in this hospital are encouraged
to share what they have learnt to other colleagues
30
(12.3)
56
(23.0)
99
(40.7)
58
(23.9)
2.23 0.95
Line managers and supervisors support professional health workers who come from
training to use skills and techniques learnt during training sessions
16
(6.6)
62
(25.5)
120
(49.4)
45
(18.5)
2.20 0.81
Training and development opportunities serve the basis for professional health
workers to be promoted and given allowances
16
(6.6)
46
(18.9)
107
(44.0)
74
(30.5)
2.01 0.87
Average 2.16 0.89
Career development opportunities
Hospital management and administration initiate career development systems to
support professional health workers in developing their career
14
(5.8)
52
(21.4)
142
(58.4)
35
(14.4)
2.18 0.72
The hospital has self-assessment tools to facilitate professional health workers to
understand their own desires, aspirations, likes and dislikes
16
(6.6)
46
(18.9)
140
(57.6)
41
(16.9)
2.15 0.77

125
Hospital management and administration organizes career planning workshops to
help professional health workers learn from others’ reality in career development
21
(8.6)
47
(19.3)
130
(53.5)
45
(18.5)
2.18 0.83
Professional health workers receive individual counseling in order to understand
their own goals and to make changes in the everyday practices, if possible
36
(14.8)
70
(28.8)
102
(42.0)
35
(14.4)
2.44 0.91
Job rotation programs and assessment centers for professional health workers to be
able to reinforce their career development
17
(7.0)
70
(28.8)
142
(58.4)
14
(5.8)
2.37 0.70
Professional health workers are recognized for good job or high achievement (by
being congratulated in the public, being given certificates, etc)
35
(14.4)
56
(23.0)
130
(53.5)
22
(9.1)
2.42 0.84
Average 2.29 0.79
Composite mean 2.34 0.85
SA: Strongly Agree A=Agree D=Disagree SD=Strongly Disagree
Source: Survey Data, 2017
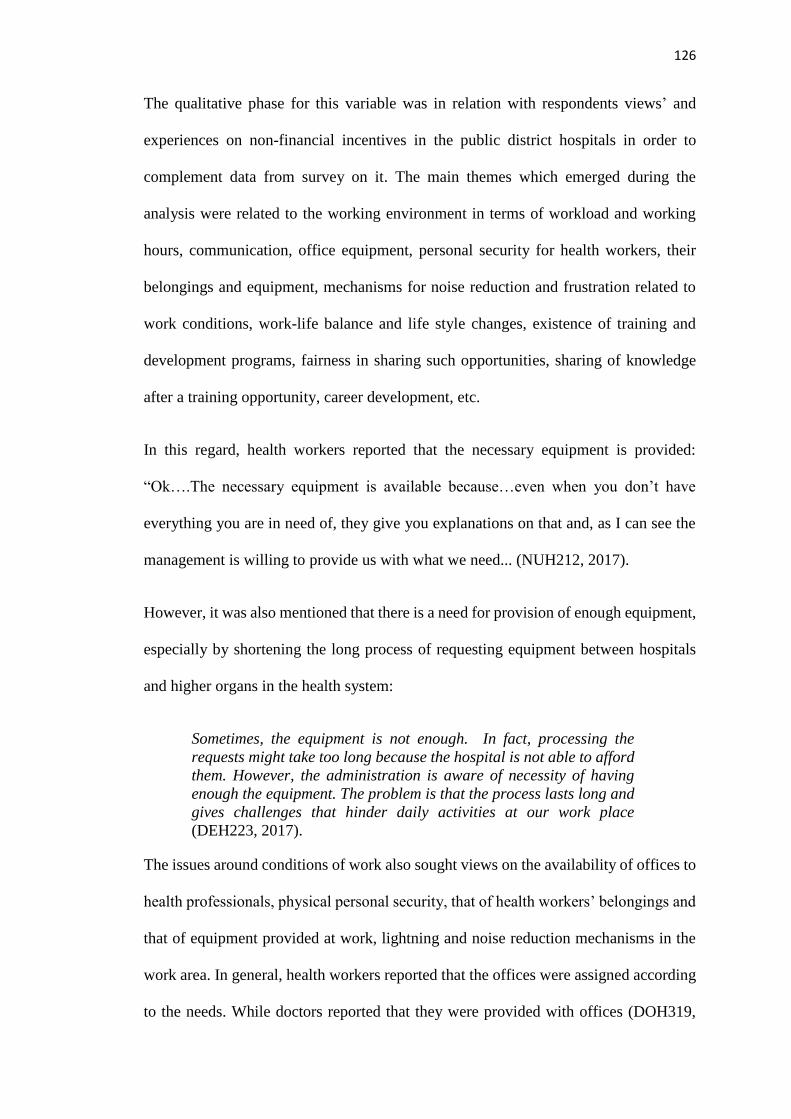
126
The qualitative phase for this variable was in relation with respondents views’ and
experiences on non-financial incentives in the public district hospitals in order to
complement data from survey on it. The main themes which emerged during the
analysis were related to the working environment in terms of workload and working
hours, communication, office equipment, personal security for health workers, their
belongings and equipment, mechanisms for noise reduction and frustration related to
work conditions, work-life balance and life style changes, existence of training and
development programs, fairness in sharing such opportunities, sharing of knowledge
after a training opportunity, career development, etc.
In this regard, health workers reported that the necessary equipment is provided:
“Ok….The necessary equipment is available because…even when you don’t have
everything you are in need of, they give you explanations on that and, as I can see the
management is willing to provide us with what we need... (NUH212, 2017).
However, it was also mentioned that there is a need for provision of enough equipment,
especially by shortening the long process of requesting equipment between hospitals
and higher organs in the health system:
Sometimes, the equipment is not enough. In fact, processing the
requests might take too long because the hospital is not able to afford
them. However, the administration is aware of necessity of having
enough the equipment. The problem is that the process lasts long and
gives challenges that hinder daily activities at our work place
(DEH223, 2017).
The issues around conditions of work also sought views on the availability of offices to
health professionals, physical personal security, that of health workers’ belongings and
that of equipment provided at work, lightning and noise reduction mechanisms in the
work area. In general, health workers reported that the offices were assigned according
to the needs. While doctors reported that they were provided with offices (DOH319,

127
DOH104 & DOH206), nurses and midwifes said they were provided with a common
room as one of them said that: “as nurses, we work together; we don’t have offices
(NUH102)” and that: “The nursing job requires you to be closer to the patients. There
is nothing we can do about it. We have to make sure we are not far from them. There is
no need for offices. (NUH122, 2017).
As it also emerged from respondents, there were companies in charge of cleaning the
work place, although for some of them the wards seemed to be small compared to the
number of people who sought health care services:
Keeping it clean is not a problem because there are companies in
charge of that. In case of dirtiness, we inform the person who is
responsible for that-normally one in each department. As far as its
size is concerned, the ward is not large enough compared to the
number of patients we have. For instance, in the neonatology section,
we can receive about 140 patients in a month. We can have around
40, 35, twenty per day. It is too small and there is nothing we can do
about it.” (MIH320, 2017)
In the same view point, it was reported that security of the equipment provided at work
and that of personnel belongings was assured by professional guards to such an extent
that they felt they were safe; it was also revealed through their views that the work place
was clean (FH12, FH16, FH13, FH24, FH35 & FH31). It came out from their feeling,
however, that a medical profession might exposes professional health workers to
feeling uncomfortable and insecure due to some patients’ behavior as it was revealed
by a health worker who stated that:
Oh…that is a challenge. Security may not be a problem as such,
among the staff. But the problem can be the reactions from the
patients: a patient may not accept her conditions. Let me give an
example as a nurse. After delivery, the patient may have pain or her
new born may die. Then she may react negatively. Two weeks ago, a
man was about fighting when he was in the maternity ward. He wanted
to beat a midwife. He couldn’t understand that the baby had died
before they got at the hospital-when they were at the health center. He
thought it was due to carelessness. It was difficult when he was called

128
to sign. It was clear he could behave badly. In a situation like this,
security is not good. And also to note is that there is no follow-up on
such a case, the patient cannot be charged of such misconduct
(NUH207).
It could also be heard from respondents that a medical profession exposes health
workers to risks of getting some illnesses, which is sometimes a threat them:
We are at risk. In fact, you may receive someone (…..) suffering from
tuberculosis and s/he can die in your eyes. This can result in an
infection. You can get infected with it. Similarly, you can get in contact
with someone with hepatitis and you are not aware of that-you know
that is transmitted through the blood. So you can get it very easily
(DOH206, 2017).
The working conditions in any work environment also is concerned with job security.
It was then realized that some grapevine stories that circle around hospitals cause
discomfort of health workers and feeling the fear of losing jobs because of lack of
efficient communication on the planned structures and reforms in the institutions and
the sector in general. One of them submitted that:
Well, we are worried we can lose our jobs due to the upcoming
restructuring, we hear people saying that. We didn’t use to have such
a worry. Now with the forthcoming restructuring, we are worried
some people will lose their jobs […] we don’t know why they want to
restructure, I heard people saying that. So it means that you are
always worried, wondering whether you will allowed to continue to
do your job or not (NUH315, 2017).
Non-financial incentives in terms of working conditions also relate to flexibility in
working hours, workload and timetable and reduction of working hours for staff who
are pursuing further education. As different views regarding this point emerged from
respondents, it was found out that staff might negotiate some working hours and time
off (FH12. FH33, FH34, FH23, DEH105 & NUH212). However, it was also reported
that there might be difficulties to get reduction of work hours unless it is an education
and training scheme which is recommended by the ministry, especially in the case of
scholarship as it was noticed from a respondent that:

129
It cannot happen unless the Ministry of Health provides you with a
scholarship. In this case, there used to be two categories: e-learning
where people study every two weeks, spending two weeks at work and
the other two studying. The program was live. Alternatively, one could
apply for a full time program which could take two or three years and
resume work afterwards. In this case, one could just go. Unlikely, one
could not expect to get any facility to study at weekends or in evenings
as it is at some universities. The manager could not reduce your
workload because of studies” (MIH224, 2017).
Availability and provision of training and development opportunities was main theme
during qualitative analysis for this variable. It was noticed that there was a number of
different opportunities available in hospitals in order strengthen the health personnel on
the current knowledge in the health profession. This was confirmed by respondents
(FH11, FH12, FH15, FH22, FH24, FH34, PHAH317 and PHAH318). One medical
doctor said that training may be dictated by current policies in the health system, which
requires hospital administration to align training with such policies, as he uttered that:
….for example, training on gender-based violence. Sometimes a
doctor is sent for training in order to help the victims. In fact, we may
find that there is a need to train the personnel who could help in
relieving the pain resulting from gender-based violence, non-
communicable diseases as well as maternity issues. Staff, especially
doctors, get together and assess the needs. Indeed, we have a team in
charge of supervision and mentoring. The committee advises us on
policies and indicates where there is a training need. They mediate
between us and the administration while making decisions on
identified areas where staff can be trained” (DOH104).
While reporting on how available opportunities were provided to health professional in
the hospitals, they said that on the one hand people who went for training were selected
with fairness as it was revealed that;
We convene a meeting and make a list of how people will follow each
other to attend trainings. The order is done randomly and then we
make a list. Whenever there is a training opportunity in the
department, we use the same list and the next person goes for training.
Everyone has to wait until their turn comes. However, since the
number of training is limited, one can spend the whole year without
attending any training. It is also possible that training invitation can
be specific for a given person like the head of the laboratory service.

130
In this case, s/he is the one to attend. On the contrary, it may be
seeking for one staff in the laboratory. In this case, we use the
timetable already established in the service to know the next person
attend the training (DOH206, 2017).
Another two staff with similar views said that “… there is a plan in different services
and when there are opportunities, professional health workers go for training according
to needs and priorities, and the pre-established list is used to determine who will attend
the training” (NUH121) and that “about trainings, there is a calendar in each service
which is submitted to the service of quality assurance where they are kept, and when
there are opportunities, professional health workers go for training according to needs
to the established calendar” (NUH122).
On the other hand, however, a bit of unfairness in appointing staff who went for training
was reported. Some health professionals reported that either the same people attended
trainings repeatedly or they did not know how a training plan was established among
the staff because they just realized that their colleagues had gone for training. One
respondent said that
We do not know how they are planned. We just hear that someone has
left for training. I think this depends on managers and who they want
to attend. We don’t have any training plan or timetable showing who
will attend the forthcoming training. One person can get training
opportunity for two consecutive times” (NUH314, 2017).
The same view was shared by another midwife who said that
No I went for trainings when this hospital started operations, long
time ago…… Sometime, I hear people saying that some of us went for
training. That is how things work here. One hears people saying that
someone from midwives unit went for training and it is the same
person who goes there one, two, three times (MIH320, 2017).
Another important point was in relation with the extent to which professional health
workers who came from training had opportunities to share what they had learnt during
training sessions with their colleagues at work or whether the training content was in

131
line with what they did at work. Though it was confirmed that the training content was
always in conformity with the trainees’ areas of work, the views on sharing skills
acquired from training were different, with some staff saying that it was not always
possible to share with colleagues what they had learnt during training. Therefore it was
mentioned, for example, that
Yes, of course. Well, after the training, you have to provide a report.
When you have finished, you ask for an opportunity to share you
experience with colleagues. Then they tell you the day for
presentation. When the training concerns everybody, you go to the
hospital hall; when it is for service staff only, you share with them.
Medical training often requires practice. That is why practice at work
is difficult.) Normally while at work, you have to train your colleague.
However, you may fail because of too much work. That is why it is
difficulty for people to know something while working at the same time
(NUH108, 2017).
Lack of opportunities to share what they learnt in the training was also reported by
professional health workers who said that “I’ve never seen it here. I always see people
in this department go for training but have never seen anyone coming and sharing with
us what the training was all about” (MIH313) and that “to tell you the truth, they don’t
[share what they have learnt]” (PHAH318).
However, it came out from respondents’ wishes that sharing what the staff have learnt
in training was very important. One health worker mentioned that “it is not frequent. It
does not happen frequently. This could be better because the trainee represents the
service/department or even the entire hospital in training where everyone is actually
supposed to attend. For this reason, we can be aware of the training targets” (FH21,
2017).
It was revealed that opportunities for career development were limited in the hospitals,
though professional health workers themselves had little knowledge on this practice. In
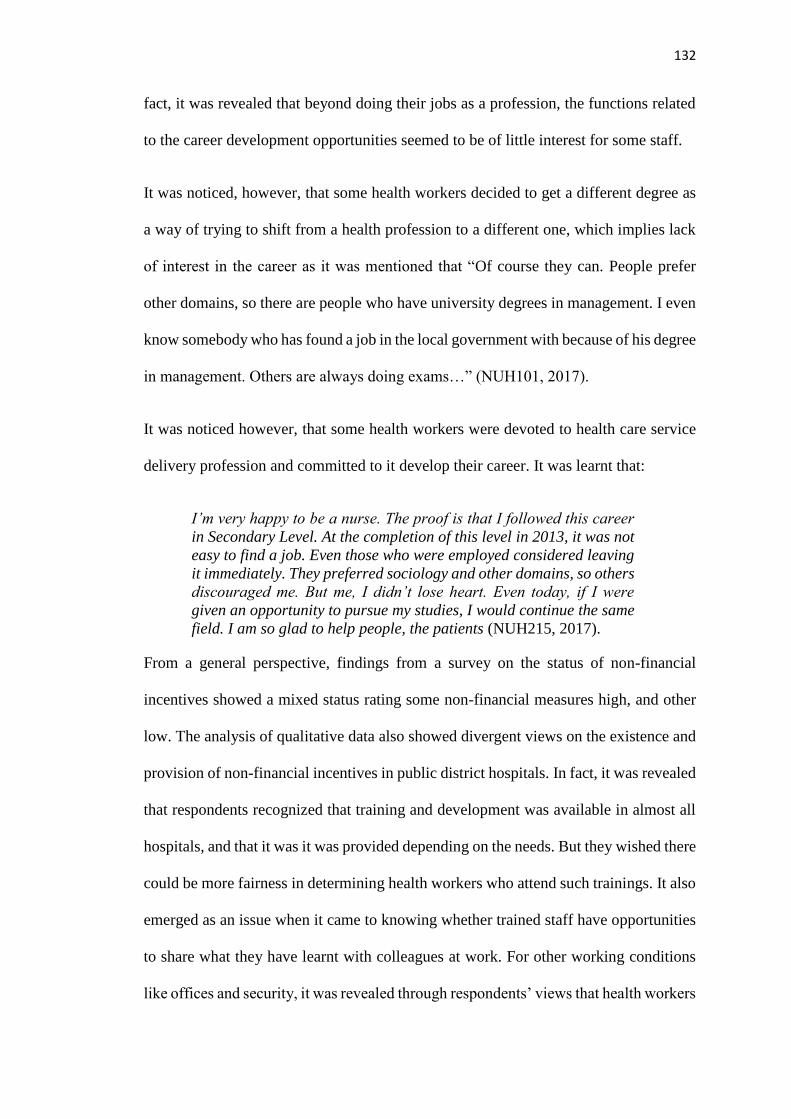
132
fact, it was revealed that beyond doing their jobs as a profession, the functions related
to the career development opportunities seemed to be of little interest for some staff.
It was noticed, however, that some health workers decided to get a different degree as
a way of trying to shift from a health profession to a different one, which implies lack
of interest in the career as it was mentioned that “Of course they can. People prefer
other domains, so there are people who have university degrees in management. I even
know somebody who has found a job in the local government with because of his degree
in management. Others are always doing exams…” (NUH101, 2017).
It was noticed however, that some health workers were devoted to health care service
delivery profession and committed to it develop their career. It was learnt that:
I’m very happy to be a nurse. The proof is that I followed this career
in Secondary Level. At the completion of this level in 2013, it was not
easy to find a job. Even those who were employed considered leaving
it immediately. They preferred sociology and other domains, so others
discouraged me. But me, I didn’t lose heart. Even today, if I were
given an opportunity to pursue my studies, I would continue the same
field. I am so glad to help people, the patients (NUH215, 2017).
From a general perspective, findings from a survey on the status of non-financial
incentives showed a mixed status rating some non-financial measures high, and other
low. The analysis of qualitative data also showed divergent views on the existence and
provision of non-financial incentives in public district hospitals. In fact, it was revealed
that respondents recognized that training and development was available in almost all
hospitals, and that it was it was provided depending on the needs. But they wished there
could be more fairness in determining health workers who attend such trainings. It also
emerged as an issue when it came to knowing whether trained staff have opportunities
to share what they have learnt with colleagues at work. For other working conditions
like offices and security, it was revealed through respondents’ views that health workers

133
were a bit satisfied with their status. It also emerged from their experiences that
opportunities for career development were very limited, although respondents
themselves had very little knowledge on it.
4.6 Participation and Involvement in Decision-Making
The variable of participation and involvement in decision-making was established
through four main indicators: exposure to shared governance, creation teams for
improvement, consultation for merit-pay processes and establishment of systems for
suggestions in the hospital. As it was noticed, close to 51% of the total number of
respondents were in agreement that health workers were consulted for their views
aiming at solving problems affecting them at the work place (SA=13.6%; A=38.7%)
and it was therefore perceived to be high (mean=2.54; St. Dev=0.86). However, the two
remaining measure of exposure to shared governance were rated low. In general, basing
on the four-point Likert scale mean ranges interpretation, exposure to shared
governance was rated low (mean=2.39; St. Dev=0.89).
Participation and involvement was also established in terms of creation of teams for
quality improvement within the hospital. It was noticed that one two measures were
rated high: professional health workers from different departments are facilitated to
meet (under supervision of management) in order to improve on the common goals
(like provision of quality of health care) (mean=2.56; St. Dev=0.89), and professional
health workers being given opportunities to meet in groups in order to identify, analyze
and solve work-related problems pertaining their job (mean=2.51, St. Dev=0.98). In
general the indicator of creation of teams for quality improvement within the hospital
was perceived to be at high level (mean=2.51; St. Dev=0.90).

134
As far as consultation for merit-pay process is concerned, only one measure of this
indicator was perceived to be at high level: management and administration provide
support for self-directed teams for the improvement of issues related to mission and
vision, policies and procedures within the hospital (mean=2.51; St. Dev=0.98). Other
measure of this indicator were perceived as low, and therefore, the mean average for
the responses on this indicator rated it as low (mean=2.35; St. Dev=0.91).
The last indicator of participation and involvement in decision-making was
establishment of systems for suggestion. The four-point likert scale response mean
range interpretation shows that the indicator was rated high (mean=2.71; St. Dev=0.86)
as all its measures were perceived as high: work councils for professional health
workers having effective channels to address professional health workers’ challenges
(mean=2.98; St. Dev=0.88), professional health workers’ council suggestions being
understood and considered by hospital management (mean=2.63; St. Dev=0.80), work
councils being considered as good organs for protection of professional health workers’
rights (mean=2.53; St. Dev=0.75)
In a nutshell, the interpretation of the likert scale responses mean range shows that
participation and involvement was perceived by respondents as low (mean=2.49; St.
Dev=0.86). Descriptive statistics for the level of participation and involvement in the
hospital decision-making processes are shown in table 4.6.

135
Table 4.6: Perceived level of participation and involvement in decision-making (N=243)
Participation and involvement in decision-making SA A D SD Mean Std.
Dev
Exposure to shared governance
Professional health workers are consulted for the views aiming at solving problems
affecting them at the work place
33
(13.6)
94
(38.7)
88
(36.2)
28
(11.5)
2.54 0.86
Employees are consulted for views on decisions regarding their work lives 9
(3.7)
80
(32.9)
110
(45.3)
44
(18.1)
2.24 0.78
Average 2.39 0.82
Teams for quality improvement
Professional health workers are given opportunities to meet in groups in order to
identify, analyze and solve work-related problems pertaining their job
56
(23.0)
50
(20.6)
100
(41.2)
37
(15.2)
2.51 0.98
Professional health workers from different departments are facilitated to meet (under
supervision of management) in order to improve on the common goals (like provision
of quality of health care)
32
(13.2)
79
(32.5)
107
(44.0)
25
(10.3)
2.48 0.84
Employee are grouped in self-directed teams (without supervision of management) for
improvement on common goal (like provision of quality of health care)
64
(26.3)
44
(18.1)
101
(41.6)
34
(14.0)
2.56 0.89
Average 2.51 0.90
Consultation for merit pay processes
Decision from these meeting are considered by management and administration of the
hospital
31
(12.8)
66
(27.2)
99
(40.7)
47
(19.3)
2.33 0.93
Hospital management and administration provide necessary support for self-directed
teams (internal rules and regulations, mission and vision of the hospital, policies and
procedures) for their improvement
48
(19.8)
66
(27.2)
91
(37.4)
38
(15.6)
2.51 0.98

136
Professional health workers in this hospital take part in determination of their
colleagues who should receive merit pay
33
(13.6)
69
(28.4)
108
(44.4)
33
(13.6)
2.41 0.88
Professional health workers take part in deciding the amount of merit pay to be given
to a colleague in the case such a practice is to happen at the hospital
29
(11.9)
31
(12.8)
139
(57.2)
44
(18.1)
2.18 0.86
Average 2.35 0.91
Establishment of systems for suggestion
Work councils for professional health workers have effective channels to address
professional health workers’ challenges
39
(16.0)
66
(27.2)
124
(51.0)
14
(5.8)
2.98 0.88
Professional health workers’ council suggestions are understood and considered by
hospital management
38
(15.6)
91
(37.4)
102
(42.0)
12
(4.9)
2.63 0.80
Work councils are considered as good organs for protection of professional health
workers’ rights
35
(14.4)
64
(26.3)
140
(57.6)
4
(1.6)
2.53 0.75
Average 2.71 081
Composite mean 2.51 0.86
SA= Strongly Agree A=Agree D=Disagree SD=Strongly Disagree
Source: Survey Data, 2018

137
In compliance with the design and approach of the study, quantitative findings in line
with perceived status of participation and involvement was complemented by
respondents’ views on how health workers participate and are involved in the hospital
decision-making processes. The main themes from the findings of this variable were in
relation with the conceptualized measure, and they mainly concerned exposed to shared
governance, communication, participation in decision making, creation of teams for
quality improvement, councils for and teams for merit pay processes, establishment of
systems for suggestion and consultation for merit pay within the hospital.
For exposure to shared governance, it was found that in some cases management
consults health workers for their in inputs for a well-informed decision-making. One
respondent stated that:
When there is a need to make a decision, a meeting of all the staff is
convened and any detail is given. In this case, medical staff give their
opinions before the final decision is made. This is done for decisions
regarding staff in general or any other person working here. Medical
staff are given the proposal decisions for them to react. Then they
agree on the final decisions (DOH312, 2017).
In some cases, it came out from respondents’ views that there could be meetings aiming
at endorsing a particular decision, but without necessarily having it enriched or
challenged by health workers’ interventions and inputs:
There is no problem. Our line managers welcome our opinion, but
sometimes, managers can bring their own suggestions at the meeting
and present to the audience for appreciation. Employees will try to
bring in their own inputs but managers will stick to their initial
propositions (FH34, 2017).
As for communication channel between the management and health workers, it came
out of their reported experiences that lack of effective and clear communication
strategies caused health workers to decide to find out information they needed directly
from managers’ offices: “This doesn’t happen. Indeed, when there is a need for

138
managers to explain things, they say that anyone who need explanations will meet them
in office (DEH223, 2017). Lack of effective communication channels was also
mentioned to such an extent that health workers found it impossible to have direct
communication with senior managers in the hospital as it was put that “no way has been
provided for ordinary staff to communicate with senior management (PHAH317,
2017). One of them noted that:
We are all mature. Whenever there is a problem, they should ask you
instead of warning you. You see, when someone has said something
behind your back, they should consult you before they give you
warning letter. This means there is a wide gap between managers and
ordinary staff (MIH313, 2017).
Another one uttered that
No. They don’t consult us in any way. When there is no information,
rumors start going round from anywhere. For example, when the
incentive motivation delays, they do not call us for a meeting to get
the right information about it; instead, they let rumors circulate
(MIH313, 2017).
Concerning teams and boards facilitating effective communication, it was reported that
in some institutions such organs were available and helped the staff do deal with some
issues, as it was mentioned:
…. what I can say is that the way things are done here is fair. We
have one or two customer care officers; when there is a claim from
either a patient or a health worker, they address those customer care
officers. In addition, there is a team in charge of accreditation,
another in charge of quality improvement. All these organs are
complementary to solve problems and to improve the quality of
service aiming at doing things as they have to be done (FH34, 2017).
Other measures of this variable included participation and consultation for merit pay
processes. Respondents’ views revealed that at the end of the year, the hospital may
need to award best employees. It was then noticed that health workers themselves
appoint such employees through established channels (PHAH31, 2017). Respondents
also revealed that the systems for suggestions were only limited to meetings from the

139
departments where they were expected to provide their inputs on how to improve the
services and send their wishes to senior management (NUH101, 2017).
In general, the perceived level of the variable of participation and involvement was
rated low in almost all its measures as it was captured from the findings of the survey.
Although qualitative findings reveal that in some instances health workers are consulted
for issues regarding decision-making in hospitals, it was also noticed that there are
loopholes in communication between senior management and front line health workers.
Therefore, in addition to low levels of perception on the measures professional health
workers’ participation and involvement in the hospitals decision-making processes
from a quantitative survey, the findings from interviews and focus group discussions
also showed that this practice was not at satisfying level in the hospitals.
4.7 Intentions to Stay
The outcome variable of this study is was the retention of professional health workers.
The concept of retention was measured through intentions to stay (which is a major
predictor of retention) with the indicators seeking the views of professional health
workers in terms of whether they would be willing to stay in the health institutions for
the next 5 years or whether they are planning to stay in the institutions as long as
possible. The respondents’ perceptions on whether they are considering to stay either
for the next five years or for as long as possible show that all in all, the intention to stay
is slightly high as the composite mean (mean=2.61; St. Dev=0.89) is closer to the upper
threshold of an estimated low intention. It was realized that feeling to stay in the hospital
for the next five years is at high level (mean=2.79; St. Dev=0.98), compared to a low
level of intentions to stay for as long as possible (mean=2.43; St. Dev=0.80).
Descriptive statistics of intentions to stay are presented in table 4.7.

140
Table 4.7: Perceived intention to stay in the hospital (N=243)
Intentions to stay SA A D SD Mean Std.
Dev
I am willing to stay in this
hospital for the next 5 years
80
(32.9)
60
(24.7)
76
(31.3)
27
(11.1)
2.79 0.98
I feel that I would continue to
work in this hospital as long as
possible
22
(8.8)
91
(37.4)
104
(42.8)
26
(10.9)
2.43 0.80
Composite mean 2.61 0.89
SA=Strongly Agree A= Agree D=Disagree SD=Strongly Disagree
Source: Survey Data, 2017
During the interviews, respondents were asked if they were intending to stay in the
hospitals or to go. It was realized that most of them were of the point that they were not
having the intentions to leave. It was however, noticed that some of the respondents
openly confirmed that they were looking for other jobs and that they were definitely
considering to leave (DEH101, DOH207). During the focus group discussions,
however, respondents were rather referring to the number of other health workers in the
same departments who are no longer in their institutions, pointing out that the same
conditions have remained unchanged and that it has not taught any lesson. It was
.observed that it could be a sign of intentions to quit for some of them.
4.8 Factor Analysis
Factor analysis is considered as a series of statistical techniques that help users to make
sense of complex multivariate data (Everitt & Hay, 1992). Generally speaking, factor
analysis groups variables into smaller number of underlying dimensions in order to find
relationships among them. In this regard, factor analysis determines the degree to which

141
a set of measured cluster is merged together and it extracts the salient dimensions from
the larger set of variables (Norman & Strelner, 2000).
By doing so, it acts as a tool for data reduction, which removes redundancy or
duplication from a set of correlated variables. In fact, someone dealing with data
analysis may not be able to observe relationships with eyes, but such checks are
performed by a software in order to ensure the existence of relationships which are
shown in the matrix, before proceeding to advanced statistics such as regression
analysis (Hodgetts, Hagler, & Hodgetts, 2006).
One of the most common technique used for factor analysis if exploratory factor
analysis, which involves common factor analysis or principal component analysis (Hair
Jr. et al., 2010). Common factor analysis consists of extracting factors from shared
variance and principal component analysis extracts them based on unique, shared and
error of total variance (Hair Jr. et al., 2010). These two techniques having the capacity
of giving the same results, though, principal component analysis is suggested as a better
technique because factor component analysis is associated with common factor analysis
problems of estimating commonalities (Hair Jr. et al., 2010; Stevens, 2002). Varimax
rotation is used in principal component analysis to ensure the number of factors in
accounting for variance in latent variables (Harman, 1976; Podsakoff, MacKenzie, &
Podsakoff, 2012). This rotation facilitates the distribution of variables into patterns that
represent different factors in a simple and clear manner for easier reading and
interpretation (Hair Jr. et al., 2010). Under Varimax rotation also, the loading score for
each variable on each factor extracted is highlighted. Bearing in mind that the term
score is considered to be the correlation between items and factors (Stevens, 2002), the
cut-off points of 0.32 and above have been suggested if one needs to determine which

142
variables to include in the factor (Tabachnick & Fidell, 2007). However, Hair Jr. et al
(2010) recommend a cut-off point of 0.40, but for studies of at least 200 units of sample.
Sampling adequacy was measured by both Kaiyer-Meyer-Oklin (KMO) measure and
Bartlett’s test of sphericity (Hodgetts et al., 2006; Norman & Strelner, 2000), where the
scholars recommend 0.60 of KMO (with some believing that 0.50 would still be
acceptable). With Bartlett's test of sphericity, a chi-square statistic is procuded and
allows to test the hypothesis (H0) the correlation matrix is made up of diagonal elements
equal to 1 and off-diagonal elements equal to 0 (Hodgetts et al., 2006).
4.8.1 Factor Analysis for Performance Management Function
Factor analysis for performance management function stated with checking for
sampling adequacy by use of KMO, in order to verify if the variable is suitable for
factor analysis. The KMO statistic was found to be 0.896 and Bartlett’s test was
significant at P<0.05 as it is shown in table 4.8.
Table 4.8: KMO and Bartlett’s test for performance management function
Kaiser-Meyer-Olkin .896
Approx. Chi-Square 2540.808
Bartlettls Test of Sphericity Df
Sign
78
0.000
Source: Survey data, 2017
Performance management function component that had Eigen values greater than 1
were extracted. As it is indicated in table 4.9, two components explaining a total
variance of 68.184% were extracted.

143
Table 4.9: Performance Management Function Total Variance Explained
Component Initial Eigenvalues Rotation Sums of Squared Loadings
Total % of
Variance
Cumulative
%
Total % of Variance Cumulative %
1 7.640 58.766 58.766 4.930 37.926 37.926
2 1.224 9.417 68.184 3.933 30.258 68.184
Extraction Method: Principal Component Analysis
Source: Survey Data, 2017
Then Varimax rotation with Kaiser Normalization was used as it is displayed in table
4.10.

144
Table 4.10: Rotated Factor Loadings for Performance Management Function
Factors Factor
loading
Cronbach
α
Factor one .937
Professional health workers are allowed to express their views and provide inputs for performance targets
(and performance management function in general)
.749
You and your line manager (direct supervisor) agree on the performance targets and criteria for performance
evaluation
.772
Performance measures for professional health workers are well documented in writing and recorded for
reference for the next part of the process
.826
Professional health workers’ performance review is done periodically .843
During performance evaluation, professional health workers are allowed to take part in the process and asked
their views
.825
Professional health workers’ performance evaluation is done with fairness in the hospital .716
Professional health workers get feedback regarding their performance in due time .751
Factor two .875
There exists a performance plan which is available to professional health workers .697
The management and professional health workers discuss performance targets and deliverables .823
Professional health workers’ responsibilities are clearly defined in the performance management document .772
You and your line manager reach agreement about the aspect of your performance .660
Professional health workers are provided with right amount of constructive criticism (feedback about the
areas for improvement) as part of performance feedback
.730
Professional health workers are provided with positive feedback for good performance as part of performance
feedback
.626
Cronbach’s α 0.706
Extraction Method: Principal Component Analysis.
Rotation Method: Varimax with Kaiser Normalization.
Source: Survey data, 2017

145
The items were rotated using the Varimax with Kaiser Normalization and, on this basis,
7 items were loaded on factor 1. Accounting for 58.76 %of variance, they included
“professional health workers are allowed to express their views and provide inputs for
performance targets (and performance management function in general)”, “you and
your line manager (direct supervisor) agree on the performance targets and criteria for
performance evaluation”, “Performance measures for professional health workers are
well documented in writing and recorded for reference for the next part of the process”,
“professional health workers’ performance review is done periodically”, “during
performance evaluation, professional health workers are allowed to take part in the
process and asked their views”, “professional health workers’ performance evaluation
is done with fairness in the hospital” and “Professional health workers get feedback
regarding their performance in due time”. The variable loadings on this factor ranged
between 0.749 and 0.843. The second factor in this category loaded with all the
remaining 6 items: “There exists a performance plan which is available to professional
health workers”, “The management and professional health workers discuss
performance targets and deliverables”, “Professional health workers’ responsibilities
are clearly defined in the performance management document”, “You and your line
manager reach agreement about the aspect of your performance”, “Professional health
workers are provided with right amount of constructive criticism (feedback about the
areas for improvement) as part of performance feedback” and “Professional health
workers are provided with positive feedback for good performance as part of
performance feedback”. This factor accounted for 9.41% and its variable loadings
ranged between 0.626 and 0.823.

146
4.8.2 Factor Analysis for Financial Incentives
KMO and Bartlett’s statistic test were performed the variable of financial incentives to
test for sampling adequacy. Results in table 4.11 show that the variable was suitable for
factor analysis.
Table 4.11: KMO and Bartlett’s test for financial incentives
Kaiser-Meyer-Olkin .779
Approx. Chi-Square 2033.315
Bartlettls Test of Sphericity Df
Sign
91
0.000
Source: Survey data, 2017
Financial incentives components that had Eigen values greater than 1 were extracted.
As it is indicated in table 4.12, three components explaining a total variance of 65.049%
were extracted.
Table 4.12: Financial Incentives Total Variance Explained
Component Initial Eigenvalues Rotation Sums of Squared Loadings
Total % of
Variance
Cumulative
%
Total % of Variance Cumulative %
1 5.477 39.120 39.120 3.098 22.129 22.129
2 2.316 16.542 55.661 3.093 22.092 44.221
3 1.314 9.388 65.049 2.916 20.828 65.049
Extraction Method: Principal Component Analysis
Source: Survey Data, 2017
Using Varimax rotation with Kaiser Normalization, items were rotated and results are
presented in table 4.12.

147
Table 4.13: Rotated Factor Loadings for Financial Incentives
Factors Factor
loading
Cronbach
α
Factor one .829
Professional health workers are provided with overtime payment for the job done out of normal working hours .865
Transportation allowance is sufficient for professional health workers to cover transport expenses from and to their
job
.845
The compensation allowance for retirement is reasonable for professional health workers in public district hospitals .651
Our institution provides childcare benefits to professional health workers as an additional compensation scheme .690
Some discounts on health services are provided to professional health workers in our institution as an additional
compensation scheme
.628
Factor two .855
My salary/wage is enough to meet basic requirements .780
The payment provided in public district hospitals is equitable and fair for all professional health workers .616
Policies and procedures used to determine salary structure are understandable to professional health workers .663
Professional health workers in public district hospitals are provided with paid time-off incentives .899
The hospital has performance payments schemes available to professional health workers .696
Factor three .734
Procedures for salary promotions are available and clearly understandable to professional health workers .809
Professional health workers are provided with bonuses as part of benefits for performance in their duties .663
Medical and health insurance packages are well structured and sufficient to cover medical and health costs .612
Procedures for performance payments to professional health workers are fair and equitable across staff levels .661
Composite Cronbach alpha .806
Extraction Method: Principal Component Analysis.
Rotation Method: Varimax with Kaiser Normalization.
Source: Survey Data, 2017
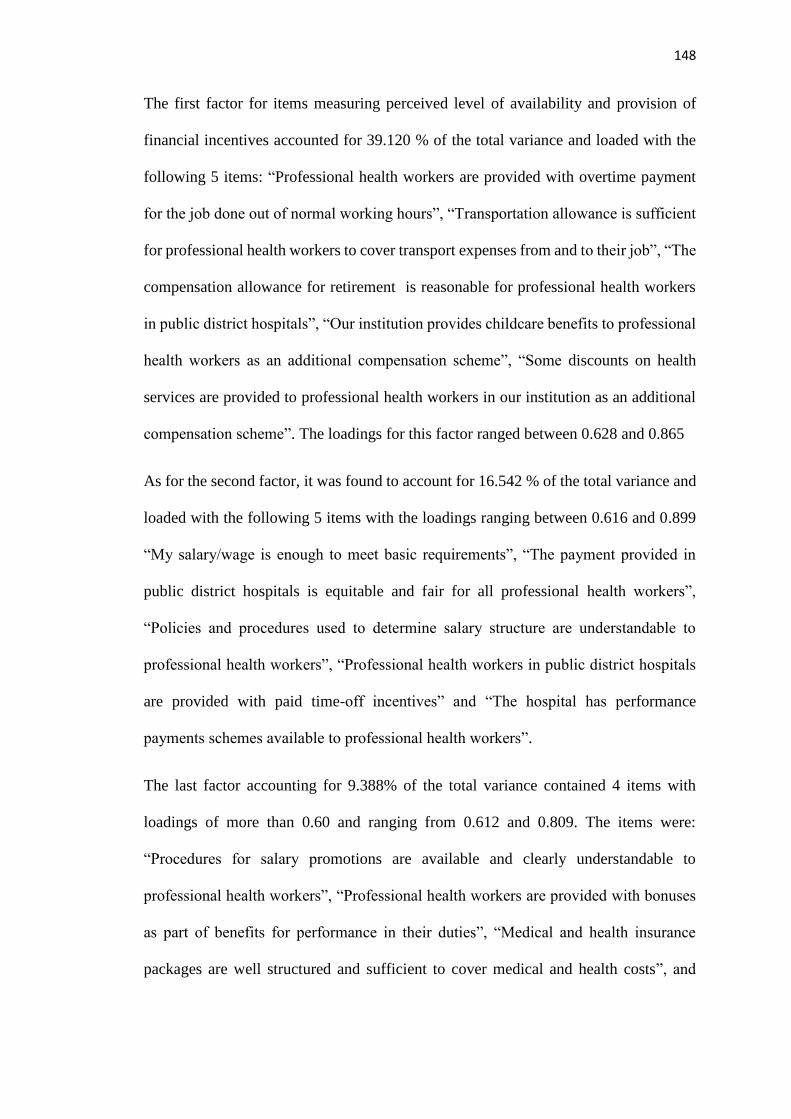
148
The first factor for items measuring perceived level of availability and provision of
financial incentives accounted for 39.120 % of the total variance and loaded with the
following 5 items: “Professional health workers are provided with overtime payment
for the job done out of normal working hours”, “Transportation allowance is sufficient
for professional health workers to cover transport expenses from and to their job”, “The
compensation allowance for retirement is reasonable for professional health workers
in public district hospitals”, “Our institution provides childcare benefits to professional
health workers as an additional compensation scheme”, “Some discounts on health
services are provided to professional health workers in our institution as an additional
compensation scheme”. The loadings for this factor ranged between 0.628 and 0.865
As for the second factor, it was found to account for 16.542 % of the total variance and
loaded with the following 5 items with the loadings ranging between 0.616 and 0.899
“My salary/wage is enough to meet basic requirements”, “The payment provided in
public district hospitals is equitable and fair for all professional health workers”,
“Policies and procedures used to determine salary structure are understandable to
professional health workers”, “Professional health workers in public district hospitals
are provided with paid time-off incentives” and “The hospital has performance
payments schemes available to professional health workers”.
The last factor accounting for 9.388% of the total variance contained 4 items with
loadings of more than 0.60 and ranging from 0.612 and 0.809. The items were:
“Procedures for salary promotions are available and clearly understandable to
professional health workers”, “Professional health workers are provided with bonuses
as part of benefits for performance in their duties”, “Medical and health insurance
packages are well structured and sufficient to cover medical and health costs”, and

149
“Procedures for performance payments to professional health workers are fair and
equitable across staff levels”.
4.8.3 Factor Analysis for Non-financial Incentives
KMO and Bartlett’s statistic test were performed the variable of non-financial
incentives to test for sampling adequacy. Results in table 4.14 show that the variable
was suitable for factor analysis.
Table 4.14: KMO and Bartlett’s test for non-financial incentives
Kaiser-Meyer-Olkin .853
Approx. Chi-Square 3597.844
Bartlettls Test of Sphericity Df
Sign
210
0.000
Source: Survey data, 2017
Non-financial incentives components that had Eigen values greater than 1 were
extracted. As it is indicated in table 4.15, five components explaining a total variance
of 71.763% were extracted.
Table. 4.15: Non-Financial Incentives Total Variance Explained
Component Initial Eigenvalues Rotation Sums of Squared Loadings
Total % of
Variance
Cumulat
ive %
Total % of Variance Cumulative %
1 9.246 42.027 42.027 5.512 25.055 25.055
2 2.361 10.733 52.759 4.765 21.660 46.715
3 1.737 7.895 60.655 2.170 9.862 56.577
4 1.425 6.476 67.131 2.011 9.141 65.719
5 1.019 4.632 71.763 1.330 6.044 71.763
Extraction Method: Principal Component Analysis
Source: Survey Data, 2017
Using Varimax rotation with Kaiser Normalization, items were rotated and results are
presented in table 4.15.

150
Table 4.16: Rotated Factor Loadings of Non-Financial Incentives
Factors Factor
loadings
Cronb
ach α
Factor one .918
The workload for professional health workers in our hospital is reasonable .700
There is flexibility to allow lifestyle changes in the hospital .673
Hospital management recognize work life balance principle and I enjoy it at m y working place .840
There is availability of safety measures including personal protection against risks caused by the job in this hospital .740
I feel that there are enough security measures for me, my personal belongings and the work equipment provided to
me in this hospital
.605
I feel that I am not frustrated at work because of poor working conditions at this hospital .812
There is a training and development policy concerning all professional health workers in this hospital .613
Professional health workers in this hospital are given opportunities to go for training and development opportunities
with fairness
.774
Hospital management and administration organizes career planning workshops to help professional health workers
learn from others’ reality in career development
.630
Professional health workers receive individual counseling in order to understand their own goals and to make
changes in the everyday practices, if possible
.803
Job rotation programs and assessment centers for professional health workers to be able to reinforce their career
development
.627
Factor two .898
Professional health workers are facilitated to have flexible working hours .603
Professional health workers in this institution are given opportunities to go for training and development
opportunities with fairness
.774
Professional health workers who come from training in this hospital are encouraged to share what they have learnt
to other colleagues
.811
Line managers and supervisors support professional health workers who come from training to use skills and
techniques learnt during training sessions
.825
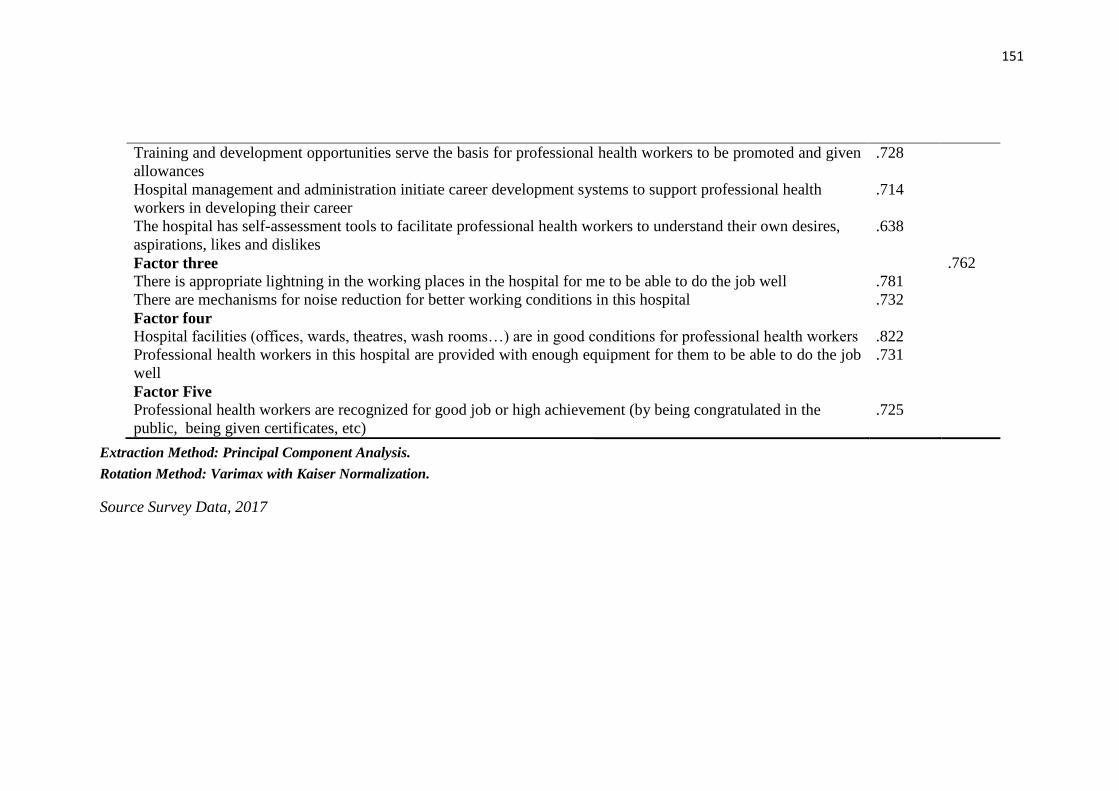
151
Training and development opportunities serve the basis for professional health workers to be promoted and given
allowances
.728
Hospital management and administration initiate career development systems to support professional health
workers in developing their career
.714
The hospital has self-assessment tools to facilitate professional health workers to understand their own desires,
aspirations, likes and dislikes
.638
Factor three .762
There is appropriate lightning in the working places in the hospital for me to be able to do the job well .781
There are mechanisms for noise reduction for better working conditions in this hospital .732
Factor four
Hospital facilities (offices, wards, theatres, wash rooms…) are in good conditions for professional health workers .822
Professional health workers in this hospital are provided with enough equipment for them to be able to do the job
well
.731
Factor Five
Professional health workers are recognized for good job or high achievement (by being congratulated in the
public, being given certificates, etc)
.725
Extraction Method: Principal Component Analysis.
Rotation Method: Varimax with Kaiser Normalization.
Source Survey Data, 2017

152
The first factor for this scale included the following 10 items: “The workload for
professional health workers in our hospital is reasonable”,” There is flexibility to allow
lifestyle changes in the hospital”, “ Hospital management recognize work life balance
principle and I enjoy it at m y working place”, “There is availability of safety measures
including personal protection against risks caused by the job in this hospital”, “I feel
that there are enough security measures for me, my personal belongings and the work
equipment provided to me in this hospital”, “I feel that I am not frustrated at work
because of poor working conditions at this hospital”, “There is a training and
development policy concerning all professional health workers in this hospital”,
“Professional health workers in this hospital are given opportunities to go for training
and development opportunities with fairness”, “Hospital management and
administration organizes career planning workshops to help professional health
workers learn from others’ reality in career development”, “Professional health workers
receive individual counseling in order to understand their own goals and to make
changes in the everyday practices, if possible”, and “Job rotation programs and
assessment centers for professional health workers to be able to reinforce their career
development”. With loadings ranging between 0.605 and 0.840, this factor accounted
for 42.027% of the total variance.
The second factor included items with loadings ranging between 0.603 and 0.825 and
explained 10.733% of the total variance. The items were “Professional health workers
are facilitated to have flexible working hours, Professional health workers in this
institution are given opportunities to go for training and development opportunities with
fairness”, “Professional health workers who come from training in this hospital are
encouraged to share what they have learnt to other colleagues”, “Line managers and
supervisors support professional health workers who come from training to use skills

153
and techniques learnt during training sessions”, “Training and development
opportunities serve the basis for professional health workers to be promoted and given
allowances”, “The hospital has self-assessment tools to facilitate professional health
workers to understand their own desires, aspirations, likes and dislikes”, and “Hospital
management and administration initiate career development systems to support
professional health workers in developing their career”.
The third factor had four items having loadings of more than 0.70 and explaining
7.895% of the total variance. These were “There is appropriate lightning in the working
places in the hospital for me to be able to do the job well”, “There are mechanisms for
noise reduction for better working conditions in this hospital”.
The fourth factor had two items having loadings of more than 0.70 and explaining
6.476% “The items were “Hospital facilities (offices, wards, theatres, wash rooms…)
are in good conditions for professional health workers”, and “Professional health
workers in this hospital are provided with enough equipment for them to be able to do
the job well”.
The last factor had one item: “Professional health workers are recognized for good job
or high achievement (by being congratulated in the public, being given certificates,
etc)” and it accounted for 4.632% of the total variance.
4.8.4 Factor Analysis for Participation and Involvement in Decision-making
KMO and Bartlett’s statistic test were performed the variable of participation and
involvement in decision-making to test for sampling adequacy. Results in table 4.17
show that the variable was suitable for factor analysis.

154
Table 4.17: KMO and Bartlett’s test for participation and involvement in decision-
making
Kaiser-Meyer-Olkin .869
Approx. Chi-Square 2438.229
Bartlettls Test of Sphericity Df
Sign
78
0.000
Source: Survey data, 2017
Participation and involvement components that had Eigen values greater than 1 were
extracted. As it is indicated in table 4.18, two components explaining a total variance
of 68.418% were extracted.
Table 4.18: Participation and Involvement in Decision-Making Total Variance
Explained
Component Initial Eigenvalues Rotation Sums of Squared Loadings
Total % of
Variance
Cumulat
ive %
Total % of Variance Cumulative %
1 7.030 58.586 58.586 4.169 34.741 34.741
2 1.180 9.832 68.418 4.041 33.677 68.418
Extraction Method: Principal Component Analysis
Source: Survey Data, 2017
Using Varimax rotation with Kaiser Normalization, items were rotated and results are
presented in table 4.19.

155
Table 4.19: Rotated Factor Loadings of Participation and Involvement in Decision-Making
Factors Factor
loadings
Cronbach
α
Factor one .894
Professional health workers from different departments are facilitated to meet (under supervision of management) in order
to improve on the common goals (like provision of quality of health care)
.718
Employees are grouped in self-directed teams (without supervision of management) for improvement on common goal
(like provision of quality of health care)
.677
Decision from these meeting are considered by management and administration of the hospital .794
Hospital management and administration provides necessary support for self-directed teams (internal rules and regulations,
mission and vision of the hospital, policies and procedures) for their improvement
.738
Professional health workers in this hospital take part in determination of their colleagues who should receive merit pay .794
Work councils for professional health workers have effective channels to address their challenges .713
Factor two .892
Professional health workers are consulted for the views aiming at solving problems which are in the hospital .762
Employees are consulted for views on decisions regarding their work lives .852
Professional health workers are given opportunities to meet in groups in order to identify, analyze and solve work-related
problems pertaining their job
.662
Professional health workers take part in deciding the amount of merit pay to be given to a colleague in the case such a
practice is to happen at the hospital
.712
Professional health workers’ council suggestions are understood and considered by hospital management .624
Work councils are considered as good organs for protection of professional health workers’ rights .854
Composite Cronbach alpha
Extraction Method: Principal Component Analysis.
Rotation Method: Varimax with Kaiser Normalization.
Source: Survey Data, 2017

156
The first factor of perceived participation and involvement in decision-making scale
had 6 items with loadings ranging between 0.677 and 0.794, and explaining 58.586%
of the total variance. This factor included the following items: “Professional health
workers from different departments are facilitated to meet (under supervision of
management) in order to improve on the common goals (like provision of quality of
health care)”, “Employees are grouped in self-directed teams (without supervision of
management) for improvement on common goal (like provision of quality of health
care), “Decision from these meeting are considered by management and administration
of the hospital”, “Hospital management and administration provides necessary support
for self-directed teams (internal rules and regulations, mission and vision of the
hospital, policies and procedures) for their improvement”, “Professional health workers
in this hospital take part in determination of their colleagues who should receive merit
pay”, and “Work councils for professional health workers have effective channels to
address their challenges”.
The second factor explaining 9.832% of the total variance had 6 items loadings ranging
between 0.624 and 0.854. These were: “Professional health workers are consulted for
the views aiming at solving problems which are in the hospital”, “Employees are
consulted for views on decisions regarding their work lives”, “Professional health
workers are given opportunities to meet in groups in order to identify, analyze and solve
work-related problems pertaining their job”, “Professional health workers take part in
deciding the amount of merit pay to be given to a colleague in the case such a practice
is to happen at the hospital”, “Professional health workers’ council suggestions are
understood and considered by hospital management”, and “Work councils are
considered as good organs for protection of professional health workers’ rights”.

157
4.8.5 Factor Analysis for Retention
Retention was measured by two items of intention to stay; so principal component analysis
was not conducted for this variable.
4.9 Testing Assumptions of Linear Regression Analysis
4.9.1 Linearity
According to Stock and Watson (2001), linearity is the assumption of linear regression
models that, there are linear relationships that can be observed between variables. It is
therefore important to check for this assumption before subjecting the data to a
regression analysis. There are different ways of examining linearity, but the most
common one and which was used in this study was suggested by Hair et al. (2010):
examining residual scatter plots in order to identify if there are nonlinear patterns in the
data. With an examination of the scatter plots (Appendix 12) and by examining the
correlation matrix, no major deviations were observed and the data were found to be
linear. A positive correlation indicates a positive linear association, and the strength of
the positive linear association increases as the correlation becomes closer to +1 (Moore
& Notz, 2012).
4.9.2 Normality
In the most commonly used statistical methods (correlation, regression and
experimental design), it is recommended to check for normality assumption as they all
basically assume that observations will follow a normal distribution, or in other words,
that the sample is drawn from a normally distributed population (Keya & Rahmatullah
Imon, 2016). There are several methods of detecting normality (Keya & Rahmatullah
Imon, 2016; Mardia, 1980), but Chambers et al. (1983) suggest that graphical methods
can be good tools where scatter plots and residual plots are advised for checking or
diagnostic statistical method. Normality can be examined by both kurtosis and

158
skewness, by calculating the z-values (Hair Jr. et al., 2010). The data will be confirmed
as normally distributed if the calculated z-value is equal to or less than a specific critical
value, which is frequently less than or equal to 2.58 (at 0.01 level significance) or less
than or equal to 1.96 (at 0.05 level of significance) (Hair Jr. et al., 2010; Usadọlọ, 2016).
By examining the skewness and kurtosis statistics therefore, it was found out that the
values were within the recommended ranges as presented in table 4.20
Table 4.20: Testing of normality
N Skewness Kurtosis
Statistic Statistic Std. Error Statistic Std. Error
PFMGT 243 .609 .156 -.985 .311
FINIC 243 1.223 .156 -1.047 .311
NONFINC 243 .859 .156 .214 .311
INVOLV 243 .505 .156 -.734 .311
INTS 243 -.166 .156 -1.028 .311
Valid N (listwise) 243
Source: Survey Data, 2017
4.9.3 Homoscedasticity
Homoscedasticity was another assumption to test in this study. It states that there should
be a similarity of variance in the across values of explanatory variables (Hair Jr. et al.,
2010) or, in other words, that the variances of the predictions determined by regression
remain constant. To this end, a test of homoscedasticity was carried out by plotting a
residual scatter plot. This plot shows one axis for predicted scores and one axis for
errors of prediction. Therefore, if the scatter plots are (or approximately are) in a
rectangular pattern, there is homoscedasticity (Tabachnick & Fidell, 2007). It was
found out that the assumption of homoscedasticity of data in this study was fulfilled
(Appendix 13).

159
4.9.4 Multicollinearity
The preliminary observations from correlation matrix served as the basis to predict how
the relationships between different variables looked like. However, the data were
subjected to regression analysis and run the Variance Inflation Factor where collinearity
statistics (including VIF and tolerance values) (Kutner, 2004) were captured as it is
presented in table 4.21.
Table 4.21: Results of multicollinearity test
Collinearity Statistic
Variable Tolerance VIF
Performance Management Function (PMF) .361 2.767 Financial Incentives (FI) .469 2.131 Non-financial Incentives (NFI) .260 3.852 Participation and Involvement in Decision Making
PIDM .230 4.354
a. Dependent variable: INTS (Intentions to stay)
Source: Survey data, 2017
The interpretation of the results of multicollinearity test rely on the recommended
thresholds of VIF, which should not be greater than 10, and that of tolerance ratio,
which should not be less than 0.1 (Kutner, 2004). As it is displayed in table 4.20, all the
values representing tolerance ratios were found to be more than 1. In the same way, the
VIF values were between 2 and 3.3, the values which are less than 10. To this end, there
was no multicollinearity problem in the data, which meant there was no doubt for
subjecting them to further regression tests.
4.10 Correlation Analysis
Correlation may be described as the degree of association between two variables
(Garcia Asuero, Sayago, & González, 2006). Correlation is done by assessing the
significance of connection between two variables. Correlation is done by performing
the Pearson correlation to study the extent of movement of two variables from one case

160
to the next one, which in turn shows how these two variables move together. The
correlation coefficient (r) ranges between 0 and 1. (Garcia Asuero et al., 2006).
According to Wei, Marthandan, Ching, Oi & Arumugam (2009), it is concluded that
there is no correlation between two variables when the value of (r) is 0; a perfect
correlation will be shown by the value of ( r) which is 1. They [ibid] also note that when
the r value is negative, the two variables are considered to be moving in the same
direction while a negative r value shows that there is a movement of two variables in
the different trend. The Pearson correlation coefficient within the values of 0.5 and 1.0
is considered strong, the one between 0.3 and 0.49 is considered as medium while a
week correlation coefficient is the one which is between 0.10 and 1.29 (Jangir and
Begum, 2008). Results of correlation analysis are presented in table 4.22.
Table 4.22: Correlation matrix of the study variables
Variable PMF FI NFI PIDM INTS
PMF 1.000
FI .467** 1.000
NFI .647** .722** 1.000
PIDM .794** .584** .793**
1.000
INTS .597** .361** .550** .655**
1.000
**Significant at P<0.01 (2-tailed)
PMF: Performance Management Function, FI: Financial Incentives, NFI: Non-Financial
Incentives, PIDM: Participation and Involvement in Decision-Making, INTS: Intention
to Stay
Source: Survey Data, 2017
As results from correlation analysis in table 4.22 show, all the hypothesized
relationships statistically significant at the level p≤0.01, which implies that there was a
satisfactory external validity of the measures. By examining the Pearson correlation
coefficients, it is noticed that PMF (r=0.597; P<0.01), FI (r=0.361; P<0.001), NFI

161
(r=0.550; P<0.01) and PIDM (r=.665; P<0.001) are positively and significantly
correlated with intentions to stay. It is also important to note that there are correlations
within predictors, and all correlations are within normal acceptable ranges.
4.11 Hypotheses Testing
In order to test the hypotheses for this study, quantitative data were subjected to
inferential statistics. Quantitative data were of the three categories: the data for
measures of human resource management practices, intentions to stay, and
demographic characteristics. The data for demographic characteristics were used as
control variables; the ones for measures of human resource management practices were
used as predictors of intentions to stay. Therefore, a hierarchical multiple regression
analysis was conducted of which the model summary is presented table 4.23.
Table 4.23: Model summary
Model R R
Square
Adjusted
R Square
R-Square
change
Std. Error of the
Estimate
1 .270a .081 .073 .081 .88343
2 .766b .738 .722 .657 .67728
a. Predictors: (Constant), Tenure, Area of Work, Gender, Marital Status, Age
b. Predictors: (Constant), Tenure, Area of Expertise,
Gender, Marital Status, Age, INVOLV, FINIC, PFMGT,
NONFINC
Legend: FINIC: Financial Incentives; INVOLV: Participation and Involvement;
PFMGT: Performance management function; NONFINC: Non-financial incentives
Source: Survey data, 2017
As it can be depicted from table 4.22, control variables were included in the first step
to observe the extent to which they explain change in the outcome variable. Control
variables were age, gender, marital status, area of expertise and tenure (experience).
The R-Square in the first model is 0.81, which means that they accounted for 8.1% of
variance in the outcome variable.

162
By considering the summary of the second model which included the main predictors
(PMF, FI, NFI & PIDM) while accounting for control variables, the R Square changed
to .738 from 0.81, which means a change of 0.657. This was interpreted that 65.7% of
variance in the outcome variable was explained by the four predictors (performance
management function, financial incentives, non-financial incentives and participation
and involvement in decision-making).
As a result of the hierarchical multiple regression model with results from both steps,
the unstandardized and coefficients, the t and significance values at 95% of confidence
intervals, and collinearity statistics are presented.

163
Table 4.24: Results of Regression Analysis
Model Unstandardized
Coefficients
Standardized
Coefficients
t Sign 95.0% Conf. Interval
for B
Collinearity
Statistics
B Std.
Error
Beta Lower
Bound
Upper
Bound
Tolera
nce
VIF
1 (Constant) 3.173 .322 9.841 .000 2.538 3.809
Gender .037 .122 .020 .301 .764 .178 .204 .951 1.051
Age .078 .035 .142 2.225 .027 -.035 .114 .837 1.195
Area of Work .135 .048 .172 2.818 .005 .042 .043 .980 1.020
Marital Status -.024 .106 -.016 -.229 .819 -.233 .184 .798 1.254
Tenure .363 .072 .332 5.042 .000 .014 .072 .712 1.405
2 (Constant) .318 .354 .899 .369 -.379 1.015
Gender of -.074 .092 -.040 -.809 .420 -.255 .107 .944 1.060
Age .031 .029 .057 1.095 .275 -.025 .087 .828 1.207
Area of Work -.085 .038 -.109 2.246 .026 -.160 -.010 .963 1.039
Marital Status .056 .081 .038 .691 .491 -.104 .216 .757 1.321
Tenure .033 .036 .054 .941 .348 -.037 .104 .697 1.436
PFMGT .284 .103 .183 2.434 .006 .081 .487 .361 2.767
FINIC .117 .117 .189 3.530 .003 .048 .115 .469 2.131
NONFINC .192 .160 .108 1.190 .007 .122 .107 .260 3.852
INVOLV .607 .138 .425 4.402 .000 .335 .880 .230 4.354
a. Dependent variable: INTS
Legend: INTS: Intention to stay, PFMGT: Performance Management Function, FINIC: Financial incentives, NONFINC: Non-financial
incentives, INVLOV: Participation and involvement. Source: Survey Data, 2017

164
Table 4.24 shows that control variables of age (β=0.078; p=0.027), area of expertise
(whether the respondent is a doctor, a nurse, a midwife, a dentist of a pharmacist)
(β=0.135; p=0.005) and tenure (experience) (β=363; p=0.000) positively and
significantly predict intentions to stay. For the main explanatory variables, it was found
out that they are all positive significant predictors of intentions to stay: performance
management function (β=0.183; p=0.004), financial incentives (β=0.189; p=0.004),
non-financial incentives (β=0.108; p=0.007) and participation and involvement in
decision-making (β=0.425; p=0.000). It was also noticed that by observing the t values,
participation and involvement in decision-making (t=4.402) highly contributed to the
model, followed by financial incentives (t=3.530), performance management function
(t=2.434) and non-financial incentives, in that order.
Based on the multiple linear regression results, therefore, all the hypotheses (Ho1, Ho2
Ho3 and Ho4) were rejected.

165
Table 4.25: Summary of hypotheses testing
Hypothesis P-value
Decision
H01: Performance management function has
no statistically significant effect on the
retention of professional health
workers on the public district hospitals
in Rwanda.
0.004 Significant Reject
H02: Financial incentives have no
statistically significant effect on the
retention of professional health
workers in the public district hospitals
in Rwanda.
0.003 Significant Reject
H03: Non-financial incentives have no
statistically significant effect on the
retention of professional health
workers in the public district hospitals
in Rwanda.
0.007 Significant Reject
H04: Employee participation and
involvement in decision-making has no
statistically significant effect on the
retention of professional health
workers in the public district hospitals
in Rwanda.
0.000 Significant Reject

166
CHAPTER FIVE
SUMMARY AND DISCUSSION OF FINDINGS, CONCLUSIONS AND
RECOMMENDATIONS
5.0 Overview
This chapter is concerned with the summary and discussion of the findings,
conclusions, recommendations and suggestions for further research.
5.1 Summary and Discussion of Findings
5.1.1 Effect of Performance Management Function on the Retention of Health
Workers in the Public District Hospitals
The first objective of the study was to examine the effect of performance management
function on professional health workers’ intentions to stay in the public district
hospitals. As it was dictated by the convergent parallel mixed-methods design, a variant
of mixed methods approach, both quantitative and qualitative data were analyzed in
order to understand the status of performance management function as perceived,
experienced and viewed by respondents who participated in this study. It was therefore
found out that performance management function in general was fairly satisfying, with
some weaknesses in some practices as it was confirmed by both quantitative and
qualitative findings.
These findings on the perceived status of implementation of performance management
function are in agreement which results of studies that were conducted in Uganda
(Lutwama, Roos, & Dolamo, 2013) and Malawi (Bradley & McAuliffe, 2009), where
in the former respondents reported that performance management was common
practice, but with some loopholes in its planning, setting performance targets and
timelines, which in essence is a challenge to having a comprehensive performance

167
appraisal framework. The divergent levels of perceptions on performance management
review coupled with the study participants’ revelations on issues regarding fairness in
the performance appraisal collaborate the findings from a study which was conducted
by Mathauer & Imhof (2006) which shows that some health workers in Kenya were
undergoing performance appraisal while others reported that they were not aware of
what the function was all about. In the same way, respondents’ perceptions and
experiences showed that although feedback was recognized as an existing practice after
a performance review, not everyone was exposed to receiving feedback and so being
rewarded for it, which in general supports findings from studies by Lutwama et al.
(2013), Bradley & McAuliffe (2009), and Manongi, Marchant & Bygbjerg (2006).
This objective having been to examine the effect, descriptive findings were not able to
perform such a function. In this regard, further analysis was carried out at the advanced
level in order to determine the effect of the predictor on the outcome variable. In
essence, the hypothesis for the first objective was (H01): Performance management
function has no statistically significant effect on the retention of professional health
workers on the public district hospitals in Rwanda. The results after multiple linear
regression did not support the hypothesis and it was rejected. In fact, the study found
out that performance management function is a predictor of intentions to stay in the
public district hospitals (β=0.183; p=0.004; t=2.434). This means that an increase by
one unit in standard deviation of performance management function will result in an
increase of 0.434 (0.183) standard deviation in intentions to stay.
The scholarly view of these findings is that a comprehensive performance management
function in health care institutions from its planning phase through performance
appraisal to feedback after a performance review will boost commitment of health
workers and create good work behavior leading to reduced or no intentions to quit. The

168
findings are therefore in congruence with the ones from a study conducted by Paul &
Anantharaman (2003) from which a significant effect of performance appraisal on
reduced turnover intentions was noticed. The findings are in tandem with those of a
study conducted by Krishnan, Warier & Kanaujia (2013) who found a negative
correlation between performance management function and intents to leave, then giving
ways to conclude that retention of employees is positively affected by a comprehensive
performance management system among other things. In another study conducted by
Moran et al. (2014), clear and fair performance evaluation systems and management
conducted expertly along with other HRM interventions were found to increase
commitment and retention of staff in the health care institutions.
5.1.2 Effect of Financial Incentives on the Retention of Health Workers in the
Public District Hospitals
The second objective of the study was to establish the effect of financial incentives on
professional health workers’ intentions to stay in public district hospitals in Kigali,
Rwanda. The analysis of this objective started with presentation and interpretation of
data from a quantitative survey on perceived availability and provision of financial
incentives in the public district hospitals, which were complemented and compared
with qualitative findings from interviews and focus group discussions on the same
variable. Generally, financial incentives were perceived to be low in almost all its
measures. It was however revealed that some indicators were rated high, like medical
allowances provided in the public district hospitals to cover for medical and other health
related costs. The findings from the survey were closely in relation with findings from
qualitative data, which showed that financial incentives in terms of salary, allowances,
fellowships and discounts were viewed to be at low level.

169
There is a number of studies which were conducted in the area of human resources for
health, especially in sub-saharan Africa, and which tackled health workers’ levels of
satisfaction as related to financial incentives in health care institutions, including
hospitals (Manafa et al., 2009; Rouleau, Fournier, Philibert, Mbengue, & Dumont,
2012; Willis-Shattuck et al., 2008). Most of these studies claimed a rethinking of new
strategies to improve financial incentives for the health personnel, including
professional health workers. In a recent conducted in Ghana (Bonenberger et al., 2014),
it was revealed that though there is a belief to say that the country is among those whose
health workers’ financial gain is high compared to other countries in the West African
region, but health workers still had to claim that salary levels and other financial
benefits were not satisfying to the because of increasing living costs and challenges
related to the health care service delivery profession.
Apart from the status of financial incentives in public district hospitals which was
captured through health workers’ views, perceptions and experiences on this
phenomenon, inferential statistics was used to plot the extent to which financial
incentives affect health workers’ intentions to stay. Conditions of employment which
include salaries and other allowances, as well as performance allowances, were found
to be associated with intentions to stay. While most studies on the effect of the influence
of financial incentives on the retention of health workers or their intentions to stay do
not specifically show the extent to which performance allowances predict either
intentions to stay of retention of health workers (Nyandoro et al., 2016; Willis-Shattuck
et al., 2008), salary (Aluku, 2012; Marjolein Dieleman, Cuong, Anh, & Martineau,
2003; Ojakaa et al., 2014), accommodation and transport allowances (Lehmann et al.,
2008) were found out to be determinants of health workers’ intentions to stay as lack

170
of health care institutions to provide adequate salaries and allowances was associated
with their intentions to leave institutions.
The results from the survey, interviews and focus group discussions being only
descriptive, they could not explain the effect of the predictor on the outcome variable.
It was therefore important to advance the study to further analysis by performing a
regression analysis in order to examine the effect of financial incentives on intentions
to stay (a major predictor of retention). The second objective was associated to the
hypothesis (H02) that “financial incentives have no statistically significant effect on the
retention of professional health workers in the public district hospitals in Rwanda”. In
fact, the regression findings showed that financial incentives were a positive predictor
if intentions to stay (β=0.189; p=003; t=3.530). It was found out that an increase in the
unit of standard deviation of financial incentives will result in the increase of 0.189
standard deviation of intentions to stay. Hence the hypothesis was not supported.
These findings support the results of the study by Ojakaa et al. (2014) which focused
on the role of financial incentives and retention of staff in the health sector and
concluded that a comprehensive remuneration to health workers positively affects
retention. The scholars recommended that there is need to devise better compensation
systems to be able to attract and retain competent professional health workers. In the
study conducted by Lai (2011), it was concluded that one of factors to make health
workers feel they are committed and reduce their intents to quit was to be paid a
reasonable, good salary.
The findings of the study are also in conformity with those of Thomas and Butts (2009)
whose study revealed a positive relationship between performance allowances and
retention. These findings are not far from conclusions from studies by Zimmerman &

171
Darnold (2009) and Griffeth (1999) who investigated into the role of allowances on the
retention and asserted that such financial schemes make employees high performance
remain because of the possibility of getting more reward.
In addition, a study conducted by Bonenberger et al. (2014) examined different human
resource management interventions that could be associated with retention of health
workers in in Ghana. The findings of the study established a positive relationship
between wages, health workers’ access to education and promotions opportunities, and
retention and reduced intentions to leave. A positive effect between financial incentives
and intentions to stay is also in conformity with results of other studies which examined
the role of compensation on retention in the Arabic countries (F. A. Mohammad,
Yoshifumi, Sakdan, & Ayman, 2013; S. E. Wagner, 2006).
5.1.3 Effect of Non-Financial Incentives on the Retention of Health Workers in the
Public District Hospitals
The third objective of the study was to examine the effect of non-financial incentives
on professional health workers’ intentions to stay in public district hospitals in Kigali,
Rwanda. The findings of the descriptive survey on the perceived status of work
conditions, training and development and career development as the key indicators of
this variable revealed that in general they are perceived low. Although the qualitative
findings revealed that respondents were not satisfied with fairness in sharing training
and development opportunities, workload, flexibility and working hours, a satisfying
level of the availability of such trainings according to the needs in the institutions was
noticed. It was also noticed that offices and equipment, security and general work
environment were at satisfying level. However, little knowledge on career development
was noticed across levels of respondents.

172
Findings of such patterns in the status of non-financial incentives were also found in
other studies, although most of them relied a quantitative approach to study this
phenomenon. In the study that was conducted in Port Harcourt, Nigeria (Gabriel &
Nwaeke, 2015), researchers found that a fairly interesting availability of job
enrichment, lifestyle changes and job autonomy. Kathure (2014) conducted a similar
study at the Kenya Tea Development Agency and found that career development
opportunities and training were being given much consideration. In conformity with
these findings also, a study conducted in Ethiopia (Haile, Yemane, & Gebreslassie,
2014) revealed that close to 70% of respondents were considering that training
opportunities, prizes and recognition among other non-financial incentives were at a
fairly good level.
In essence, the descriptive findings from the survey, interviews and focus group
discussions served as the basis to understand the status of non-financial incentives in
the public district hospitals as they were perceived, viewed and experienced by
respondents. As the second objective had the hypothesis (H03) that “non-financial
incentives have no statistically significant effect on the retention of professional health
workers in the public district hospitals in Rwanda”, quantitative data were subjected to
inferential statistics (regression analysis) in order to predict the effect of explanatory
variable on the outcome variable. To this end, it was found out that non-financial
incentives had a statistically significant effect on the intentions to stay (β=0.108;
p=0.007; t=1.190). In fact, it was noticed that an increase by one unit in standard
deviation of non-financial incentives results in the increase of 0.108 standard deviation
of intentions to stay. Therefore the hypothesis was rejected.
In relation with other studies that have been conducted with the purpose of examining
the effect of non-financial incentives on retention especially in the area of human

173
resources for health, the study findings are in agreement with study conducted by
Lehmann et al. (2008), which confirmed that working environment, working
conditions, coupled with mechanisms for supporting career development among health
workers positively influence health workers’ retention. The study argued that
manageable workload, job security and supervisor support among other interventions
leading to health workers’ reduced intentions to leave. Another recent study aimed at
studying factors that predict attraction and retention of primary health care workers in
Kenya (Ojakaa et al., 2014). Its findings confirmed the hypothesis that work conditions
and career development positively affected health workers’ intentions to stay, the latter
being a major predictor of retention. The study findings are also in congruence with
other studies which investigated into the determinants of health workers’ retention
(Marjolein Dieleman et al., 2003; M Dieleman, Toonen, Toure, & Martineau, 2006;
Zurn, Poz, Stilwell, & Adams, 2004). Generally, these studies realized that availability
of equipment at work place, support from management, mechanisms for supporting
health workers to develop their career and organizational arrangements positively
affected health workers’ intentions to stay. In the same way a positive strong association
between non-financial incentives and retention was confirmed by a study which
involved six countries: Cameroon, Ghana, Senegal, South Africa, Uganda and
Zimbabwe (Awases, Gbary, Nyoni, & Chatora, 2004).
Similarly, these findings confirm those from studies which were conducted by Dussalt
& Franceschini (2006) and Aluku (2012) who analyzed different aspects of human
resource management practices relating to non-financial incentives. Their conclusions
were that a less likelihood of staying in health institutions among health workers is
associated with lack of equipment, supplies and other infrastructure, stress, poor
management of workload and lack of mechanisms for flexible working hours, and poor
174
management support. In the same manner, the issue of equipment and supplies, coupled
with workload management policies and supervision are variables that were found to
positively affect health workers’ intentions to stay in Mullei et al. (2010) ’s study
findings.
In addition, the findings are another evidence that the more health workers are
facilitated to make their career growth dreams realized, the more they are likely to get
committed to their job and become loyal to their institutions, which reduces intentions
to leave and translates into high rates of retention (McCarthy, Tyrrell, & Cronin, 2002;
Willis-Shattuck et al., 2008). This is not far from Cavanagh & Coffin (1992a)’ study
which found out that a less likelihood of leaving among health workers was predicted
by high levels of promotional opportunities.
Moreover, a study conducted in Ethiopia (Ayalew et al., 2015) found out that training
of health workers predicts retention of health workers. Unfairness (Engeda, Birhanu, &
Alene, 2014) and lack of such opportunities was associated with intentions to leave
(Getie, Betre, & Hareri, 2015), and a study conducted in Malawi (Schmiedeknecht et
al., 2015) argued that continuous education of health workers positively affected their
retention. Other studies on non-financial incentives (M Dieleman, Gerretsen, & van
der Wilt, 2009; M Dieleman, Toonen, Toure, & TMartineau, 2006; Mathauer & Imhoff,
2006; K. V. Rondeau & Wagar, 2016; World Health Organization, 2010; YangYang,
Yan-Hui, Jing-Ying, & Hong-Fu) generally confirmed that a comprehensive review of
working conditions and training of health workers were crucial to the retention of the
health personnel.

175
5.1.4 Effect of Participation and Involvement in Decision Making on the Retention
of Health Workers in the Public District Hospitals
The forth objective of this study was to establish the influence of employee participation
and involvement in decision making processes on health workers’ intentions to stay in
public district hospitals in Kigali, Rwanda. The analysis for this objective started with
data from a survey which aimed at establishing the levels of perception on the extent to
which health workers participate and are involved in the hospitals decision-making
processes. The findings showed that, in general, health workers were fairly satisfied
with the level of participation and involvement in decision-making. It was noticed,
however, that there are some areas where health workers were not satisfied with,
especially with exposure to shared governance and communication between top
management and low level health professionals. The findings from interviews and focus
group discussions also were used to complement the ones from the survey, and their
comparison showed that they almost had many points in common.
Although the descriptive analysis of both the data from both the survey and interviews
and focus group discussions revealed the status of health workers’ participation and
involvement in decision-making in the public district hospitals, their tools of analysis
were limited and they were not able to predict the effect of health workers’ participation
and involvement in decision-making processes and intentions to stay. In fact, the fourth
objective had a hypothesis (H04) attached to it and it stated that “employee participation
and involvement in decision-making has no statistically significant effect on the
retention of professional health workers in the public district hospitals in Rwanda”. To
this end, further analysis was conducted by doing regression analysis for this purpose.
The findings from regression analysis showed that participation and involvement of
health workers in the hospitals decision-making processes statistically and significantly

176
affected intentions to stay (β=0.425; p<0.001; t=4.402). These findings mean that
increasing the level of participation and involvement in decision-making by a unit of
standard deviation results in 0.425 standard deviation of intentions to stay. Hence the
hypothesis was not supported.
Employee participation and involvement has been a matter of study and some scholars
have found that it positively affects employee retention. Therefore the findings
corroborate with Kand & Rekor (2005)’ s research findings that involving health
workers especially nurses in the hospital decision-making processes makes them feel
more committed to work. The scholars note that that systems for suggestion and
exposure to shared governance are key practices that need to be initiated in health care
institutions in order to reduce intentions to leave among nurses.
In the same view point, another two studies conducted by DiMeglio et al. (2005) and
Mohr, Burges, & Young (2008) examined the interventions that could lead to reduced
intentions to leave and turnover among health workers. It came out from the findings
of these studies that making good use of group cohesion and team-based strategies
influence health workers’ intentions to stay and leads to improved retention rates
(DiMeglio et al., 2005). In addition to this, connecting with line managers to share front
line health workers’ concerns coupled with encouraging and involving them in the
decision-making processes was found to be associated to change in the work behavior
while deciding whether to stay or not stay (Roche, Duffield, Dimitrelis, & Frew, 2015).
In the same view point, significant associations between health workers’ involvement
and participation and intentions to stay were recommended in the World Health
Organization (2010) survey s and it was stated that effective decision spaces influences

177
health workers’ stability and reduction in turnover intentions(K. V. Rondeau & Wagar,
2016) (K. V. Rondeau & Wagar, 2016).
5.2 Conclusions
This general purpose of this study was to establish the effect of human resource
management practices (HRMPs) on the retention of professional health workers in
public district hospitals in Rwanda. Using a cross-sectional survey research design with
a mixed-methods approach, the study collected used a survey questionnaire, interviews
and focus group discussions to establish the effect of performance management
function on the retention of professional health workers in the public district hospitals,
to examine the effect of financial incentives on the retention of professional health
workers in public district hospitals and to establish the effect of participation and
involvement in decision-making on the retention of professional health workers in the
public district hospitals.
The study tested four null hypotheses which were all not supported. In fact, results from
the first hypotheses showed that performance management function significantly and
positively affects health workers’ intentions to stay. From these results, it was
concluded that effective and comprehensive implementation of performance planning,
performance evaluation and performance feedback is greatly contributes to retention of
professional health workers.
The second hypothesis which was tested in this study showed that financial incentives
are significant and positive predictors of professional health workers’ intentions to stay.
Based on the findings, the research concluded policies and programs which are tailored
to the improvement of availability and provision of financial incentives in terms of
salaries, allowances, fellowships, discounts, loan schemes and other financial benefits

178
could significantly contribute boost workers’ positive response and contribute to
retention in the hospitals.
The third hypotheses tested showed that non-financial incentives positively and
significantly had an effect on health workers’ intentions to stay. Based on the findings,
the study concluded that non-…the improvement of the level of availability and
provision of financial incentives including improved good working conditions,
provision and fair sharing of training and development opportunities and career
development opportunities could lead to reduced turnover and boost retention of
professional health workers in the public district hospitals.
The fourth hypothesis tested revealed that there is a positive significant effect of
participation and involvement in decision-making on health workers’ intentions to stay.
Based on the findings of the study, a conclusion was made that professional health
workers’ participation and involvement in the hospital decision-making processes
through exposure to shared governance, creation of teams for quality improvement,
consultation for merit pay process and establishment for systems for suggestion could
contribute to the improvement of retention capacity in the public hospitals.
In general, by examining the effect of human resource management on the retention,
the study has contributed to the current understanding of major predictors of retention
of employees in the health care setting, and in the area of study. In fact, with very
limited studies in the health care institutions in Rwanda, the study has concluded that
while most studies investigate into retention of health workers through their levels of
satisfaction by focusing on financial incentives as the main predictors, it was concluded
that a human resource management approach focusing on a step-by-step
implementation of performance management function, coupled with policies and

179
programs regarding availability and provision of financial and non-financial incentives
along with high level integration of professional health workers in the hospital decision-
making processes would provide a response to the issue of turnover in the health care
institutions, including public district hospitals.
5.3 Implication of the Study to Theory and Practice
5.3.1 Contribution to Theory
The study sought to establish the effect of human resource management practices on the
retention of health works in the lens of social exchange theory. This theory being
fundamentally based on costs and rewards (Homans, 1961), it captures the concept of social
relationships within a reciprocal framework between the organization through managers or
its representatives and employees. In this regard, such social exchanges will stimulate
individuals (employees) to make decisions based on long-term benefits including the
organizational practices towards their satisfaction.
As it applies to this study, the theory was used as a tool to explain how social exchanges
work in the work environment. In fact, the fundamental principles of fairness and value
towards the employees, expressed in terms of what the organization does form them
(fair appraisal systems, strong and effective communication channels, clear and focused
training and development, strong career development strategies, policies governing
promotions and salary structures, participation and involvement in decision-making
processes) result in reciprocal relationships which act on employees behavior at work.
Therefore, the study findings have shown that the theory principals can be used to create
long-term relationships between public district hospitals (through the managers or
representatives) and health workers. It was found out that health workers’ intentions to
stay are largely determined by human resource management practices.

180
The findings of the study confirm the body of evidence in literature that an integrated
approach of human resource management practices in the organization will affect
employees who in turn will reciprocate with commitment and attachment, then leading
to the intentions to remain as a major predictor of retention (Bowen & Ostroff, 2010;
Hussain & Rehman, 2013; Laka-Mathebula, 2004; Nishii et al., 2008; Ozolina-Ozola,
2014; Patton, 2015; Rajendra, 2014) . And in fact, perceiving reciprocity between
health workers and the hospital creates trust, commitment, attachment among health
workers which builds up robust extended engagement into extra behavior of
considering to remain (Knights & Kennedy, 2005; Lester, Turnley, Bloodgood, &
Bolino, 2002) as a result of what the organization has done for them in terms of
analyzed human resource management practices.
In this regard, the study has emphasized the extent to which social exchange theory can
be used as a framework to study the work environment in terms of reciprocity between
employees and the organizations: employee response with intention to remain being a
reciprocal exchange to fairness and value from the organization in terms of how it treats
them.
This study was also conducted in the lens of perceived fairness as it is contained in the
equity theory developed by Adam (1965). In fact. The equity theory addresses fairness
on the basis that employees in the organization can make social comparisons and
thereafter perceive that it (through representatives and managers) is being fair or unfair
to them. By doing so, an assessment of the ratio of the level of inputs to that of outputs,
which is at the same time compared to other ratios of the same level employees within
or outside the system. As it was argued by Adams [ibid], the feeling of equity happens
when employees perceive that the level of input results into reasonable reward and, by

181
comparison of other employees with similar job level. In this situation, a level of justice
is perceived by the employees, which in turn results into satisfaction and balanced
exchange. This satisfaction will be followed by employee’s embracement of work
behavior including commitment and will to remain. The opposite, that is when
employees perceive unfairness and inequity between the level of inputs and that of
outputs, and especially when they feel that the ratio input-output is not similar with
other employees doing the same job, will lead to dissatisfaction and a different work
behavior like considering to quit.
In a nutshell, the equity theory has been used in the motivation studies especially in
explaining factors that affect employee retention (Azumah, 2011; Mamah & Ulo, 2015
; Sandhya & Kumar, 2011; Sun, 2016). This study having found out a significant and
positive effect of human resource management practices on the retention of health
workers, its findings have served as another basis to emphasize the usefulness of the
equity theory as the framework to understand how employee work behavior and job
outcomes are driven by what the organization does for the employees and how it treats
its them.
5.3.2 Contribution to Practice
The study is considered to be contributing on the literature of human resources for
health, especially in sub-saharan Africa and the region in general, and Rwanda in
particular. In fact, although there is an existing body of knowledge on retention of health
workers, but most studies in the study setting and area have rarely undertook a large
scale consideration of integrated human resource management practices and their effect
on the retention of health workers, as they mostly focused on financial incentives or
just coupled with very few measures of satisfaction to explain retention. This study

182
having deeply explored other factors that affect retention of health workers like
availability and provision of non-financial incentives to health professionals,
implementation of performance management function in health care institutions and
involvement and participation of health workers in the hospital decision making
processes, its findings can be used by human resources for health policy makers,
managers and researchers. In addition, studies on the retention of health workers in the
study setting have rarely predicted retention by investigating into intentions to stay.
Therefore, there has been a trend of investigating into such studies by just subjecting
inferential statistics on the retention rates and turnover indexes. Such studies are
absolutely necessary and can give insights on the current practices within the
organization and the existing retention rate and turnover, but a study on the intentions
to stay has been able to detect the current consideration of whether employees are
considering to remain or to quit, which predicts the future of organizations in terms of
retention. Moreover, a mixed-methods approach has been rarely used in such studies in
order to understand the views and experiences form different levels of health workers
on the existing human resource management practices as they apply in their
organizations. With such an approach, a deep understanding on the status of health
workers involvement in decision-making was revealed as well as the level of training
and career development opportunities, performance evaluation activity, and financial
incentives. Therefore, the study provides the insights on how health care institutions
including public hospitals can increase institutional retention capacity through an
integrated human resource management approach.
5.4 Recommendations
This study has found that there performance management function, financial incentives,
non-financial incentives and participation and involvement in decision-making

183
significantly and positively affect retention. Based on these findings therefore, it is
recommended that the ministry of health should revisit policies governing both
financial and non-financial incentives provided to health professionals in the public
district hospitals as a means of reducing intentions to leave and turnover in general. In
addition, human resource departments at hospital level in collaboration with senior
management and other departments should consider the guidelines of implementation
of performance management function in all its phases as a way of fostering motivation
of health professionals and increase health institutions to retain health workers.
Moreover, the hospitals’ senior management should consider involvement and
participation of professional health workers in the hospitals decision-making processes
as a way of reducing frustration and enhancing better outcomes in terms of commitment
which leads to reduction of intentions to leave.
5.5 Further Research
As this study was unfolding, some questions arose and did not find answers. Hence,
recommendations were made for further research so that an attempt can be made to
answer the questions left unanswered. Firstly, a study on human resource management
challenges in the public district hospitals would be carried out. Second, a study would
be conducted to analyze human resource management policies in the health care setting
in Rwanda. Thirdly, a comparative study on turnover intentions (or intentions to stay)
would be conducted in both public and private health care service provision institutions.

184
REFERENCES
Adams, J. S. (1965). Toward an Understanding of Inequity. Journal of Abnormal and
Social Psychology, 67, 422-436.
Agrela, R., Carr, R., Veyra, V., Dunn, C., Ellis, D., Gandolfi, A., . . . Troutman, I.
(Producer). (2008). Retention issues and solutions: tools to ensure University of
California becomes an employer of choice. Retrieved from
http://www.ucop.edu/cucsaldocuments
Aisha, A., Hardjomidjojo, P., & Yassierli, A. (2013). Effects of Working Ability,
Working Condition, Motivation and Incentive on Employees Multi-dimensional
Productivity. International Journal of Innovation, Management and
Technology, 46(6), 1-5.
Akbar, W., Riaz, S., Arif, K., & Hayat, A. (2018). Measuring The Non-Financial
Rewards In Escalating Employees Job Satisfaction (A Study Of Private
Companies In Pakistan) (Vol. 1). Malaysis: Univeristy of Malaya.
Albano, G. L., & Leaver, C. (2005). Transparency, Recuitment and Retention in the
Public Sector. Retrieved from University of Bristol:
Ali, S., Amin, S. M., & Hamid, R. A. (2016). A Review on Relationship between
Reward and Turnover Intention Journal of Advanced Review on Scientific
Research, 19(1), 1-16.
Allen, D. G. (2008). Retaining the Talent. A Guide to Analyzing and Managing
Employee Turnover. Alexandria: SHRM Foundation.
Allen, D. G., & Rodger, W. (1999). Job performance and turnover: a review and
integrative multi-route model. Human Resources Management Review, 9, 525-
548.
Alsaqri, S. H. (2014). A Survey of Intention to Leave, Job Stress, Burnout and Job
Satisfaction among Nurses Employed in the Ha’il Region’s Hospitals in Saudi
Arabia. (PhD), RMIT University, Melbourne, Australia.
Aluku, N. C. M. (2012). Factors Influencing retention of health workers in primary
health care facilities in Kakamega county, Kenya. Masters thesis. University of
Nairobi. Nairobi, Kenya.
Amin, M. E. (2005). Social Science Research: Conception, MetHoDsology and
Analysis. Kampala: Makerere University.
Anumaka, J. B., & Kyolaba, S. D. (2013). Gender and External Efficiency of Selected
Public and Private Universities in Kampala, Uganda. International Journal of
Educational Science and Research (IJESR), 3(3), 67-74.
Aquino, K., Griffeth, R. W., Allen, D. G., & Hom, P. W. (1997). Integrating justice
constructs into the turnover process: A test of a referent cognitions model.
Academy of Management Journal, 40, 1208-1227.
Arachchillage, G., & Senevirathna, E. (2017). Factors Affecting Employee Retention.
Armstrong, M. (2008). Performance Management. Key Strategies and Practical
Guidelines. London: Kogan Page.

185
Arthur, J. (1994). Effects of human resource systems on manufacturing performance
and turnover. Academy of Management Journal, 37(3), 670-687.
Aryee, S., Budhwar, P. S., & Chen, Z. X. (2002). Trust as a Mediator of the Relationship
between Organizational Justice and Work Outcomes: Test of a Social Exchange
Model. Journal of Organizational Behavior, 23(3), 267-285.
Aslam, H. D., Aslam, M., Ali, N., Habib, B., & Jabeen, M. (2013). A Historical View
of Human Resource Management Practice: Literature Review. International
Journal of Human Resource Studies, 3(2), 126-137.
Avanzi, L., Fraccaroli, F., Sarchielli, G., Ullrich, J., & van Dick, R. (2014). Staying or
Leaving: A Combined Social Identity and Social Exchange Approach to
Predicting Employee Turnover Intentions. International Journal of Productivity
and Performance Management, 63(3), 272-228.
Awases, A., Gbary, A., Nyoni, J., & Chatora, R. (2004). Migration of health
professionals in six countries: a synthesis report. Retrieved from Brazzaville:
Ayalew, F., Kols, A., Kim, Y.-M., Schuster, A., Emerson, M. R., Roosmalen, J. v., . . .
Gibson, H. (2015). Factors Affecting Turnover Intention among Nurses in
Ethiopia World Health & Population, 16(2), 62-74.
doi:10.12927/whp.2016.24491
Ayer, A. J. (1959). Logical positivism. New York: The Free Press.
Ayobami, R. B. T., Wallis, M., & Mahomed, K. A. (2016). Exploring the Factors that
affect Retention of Medical Doctors: A Case Study of Jane Furse Hospital,
Limpopo Province, South Africa. European Journal of Economics and
Business, 1(2), 1-23.
Azumah, K. K. (2011). Employee Retention Strategies: the case of a patent firm in
Australia. Academy of Management Journal, 44(6), 1102-1121.
Barlow, G. (1989). Deficiencies and the Perpetuation of Power: Latent Functions in
Management Appraisal. Journal of Management Studies, 26(5), 499.
Barnett, V., & Lewis, T. (1994). Outliers in Statistical Data (3 ed.). New Jersey: Wiley.
Beardwell, I., Holden, L., & Claydon, T. (2004). Human Resource Management. A
Contemporary Approach (4 ed.). Harlow: Prentice Hall.
Becker, B. E., Huselid, M. A., & Ulrich, D. (2001). The HR scorecard: Linking people,
strategy, and performance. Boston: Havard Business School Press.
Beer, M., Spector, B., & Lawrence, P. R. (1984). Managing Human Assets. New York:
Free Press.
Bidisha, L. D., & Mukulesh, B. (2013). Employee Retention: A Review of Literature.
IOSR Journal of Business and Management, 8(2), 8-16.
Biron, M., & Boon, C. (2013). Performance and Turnover Intentions: A Social
Exchange Perspective. Journal of Managerial Psychology, 28(5), 511-531.
186
Bizimana, B., & Orodho, J. A. (2014). Teaching and Learning Resource Availability
and Teachers‟ Effective Classroom Management and Content Delivery in
Secondary Schools in Huye District. Journal of Education and Practice, 5(9),
111-122.
Blau, M. P. (1964). Exchange and power in social life. New York: Wiley.
Blau, M. P. (1968). Interaction: Social Exchange. International Encyclopedia of the
Social Sciences, 7, 452-458.
Bohlander, G., & snell, S. (2004). Managing Human Resources (13 ed.). Mason:
Thompson.
Bonde, D. (2013). Qualitative Interviews: When Enough is Enough: Research by
Design.
Bonenberger, M., Aikins, M., Akweongo, P., & Wyss, K. (2014). The effects of health
worker motivation and job satisfaction on turnover intention in Ghana: a cross-
sectional study Human Resources for Health, 14(43).
Boomer Authority (Producer). (2009, November 4, 2016). Competitive Strategies for a
World Class Workforce. Retrieved from http://boomerauthority.ning.com
Boone, H. N., & Boone, D. A. (2012). Analyzing Likert Data. Journal of Extension,
50(2), 5.
Bowen, D. E., & Ostroff, C. (2010). Understanding HRfirm performance linkages-the
role of the'strength’ of the HRM system. . Academic Management Review,
29(2), 203-221.
Boxall, P. (1992). Strategic Human Resource Management: Beginnings of a New
Theoretical Sophistication? Human Resource Management Journal, 2(3), 60-
79.
Bradley, S., & McAuliffe, E. (2009). Mid-level providers in emergency obstetric and
newborn healthcare: factors affecting their performance and retention with the
Malawian health system. Human Resources for Health, 7(14).
Bratton, J., & Gold, J. (2000). Human Resource Management. Theory and Practice.
Mahwah, New Jersey: Lawrence Erlbaum Associates, Inc.
Brimhall, K. C., Lizano, E. L., & Mor Barak, M. E. (2014). The Mediating Role of
Inclusion: A Longitudinal Study of the Effects of Leader-Member Exchange
and Diversity Climate on Job Satisfaction and Intention to Leave Among Child
Welfare Workers. Children and Youth Services Review, 40, 9-88.
Burke, R., & Ng, E. (2006). The changing nature of work and organizations:
implications for human resource management. Human Resource Management
Review, 16, 86-94.
Butaki, D. N. (2015). Factors Affecting Retention of Human Resources for Health in
TRANS-NZOIA County, Kenya. International Journal of Recent Research in
Commerce Economics and Management 2(4), 143-170.

187
Caligiuri, P., Lepak, D., & Bonache, J. (2010). Global Dimensions of Human Resources
Management: Managing the Global Workforce. Hoboken, NJ: John Wiley &
Sons, Inc
Campbell, D. T., & Stanley, J. C. (1963). Experimental and Quasi-experimentald
Design for Research. Chicago, IL: Rand McNally.
Cavanagh, S. J., & Coffin, D. A. (1992a). Staff turnover among hospital nurses. Journal
of Advanced Nursing, 17, 1369-1379.
Cavanagh, S. J., & Coffin, D. A. (1992b). Staff turnover among hospital nurses. Journal
of Advanced Nursing, , 17, 1369-1376.
Chandranshu, S. (2012). Factors Affecting Employee Retention: A Comparative
Analysis of two Organizations from Heavy Engineering Industry European
Journal of Business and Management, 4(3), 145-163.
Chen, C. F., & Yu, T. (2014). Effects of Positive Vs Negative Forces on the Burnout-
Commitment-Turnover Relationship. Journal of Service Management, 25(3),
388-410.
Chen, L., Evans, T., Anand, S., Boufford, J. I., Brown, H., Chowdhury, M., . . .
Wibulpolprasert, S. (2004). Human Resources for Health: Overcoming the
Crisis. Lancet, 364, 1984–1990.
Chew, J. (2016). The Influence of Human Resource Management Practices on the
Retention of Core Employees of Australian Organisations: An Empirical Study.
Murdoch University, Australia.
Choudhary, S. (2016). Job Enrichment: A Tool for Employee Motivation International
Journal of Applied Research, 2(5), 1020-1024.
Christensen, L. B., & Stoup, C. M. (1991). Introduction to Statistics for the Social and
Behavioral Sciences (2 ed.). California: Brooks/Cole Publishing Company.
Cole, G. A. (2002). Personnel and Human Resource Management (5 ed.). Continuum
London: York Publishers.
Condo, J., Mugeni, C., Naughton, B., Hall, K., Tuazon, M. A., Omwega, A., . . .
Binagwaho, A. (2014). Rwanda’s Evolving Community Health Worker System:
A Qualitative Assessment of Client and Provider Perspectives. Human
Resources for Health, 12(71).
Connella, J., Zurnb, P., Stilwellc, B., Awasesd, M., & Braichetb, J.-M. (2007). Sub-
Saharan Africa: Beyond the Health Worker Migration Crisis? Social Science &
Medicine, 64(9), 1876-1891.
Cranny, C. J., Smith, P. C., & Stone, E. F. (1992). Job Satisfaction: How People Feel
About Their Jobs and How it Affects Their Performance. New York: Lexington
Books.
Creswell, J. W., & Clark, V. L. P. (2011). Designing and Conducting Mixed Methoda
Research (2 ed.). London: Sage Publications.
Criffeth, R. W., & Hom, P. W. (2001). Compensation and rewards: retaining valued
employees. London: International (educational) professional publishers.
188
Cropanzano, R., & Mitchell, M. S. (2005). Social exchange theory: An interdisciplinary
review. Journal of Management, 31, 874–900.
Cunningham, S. (Producer). (2002, November 3, 2016). Attracting and retaining
employees in a competitive world. Retrieved from
http://www.insurancejournal.com/magazines/southcentra1l2002/09/16/features
Czurak, D. (2011). Amway hotel corp. launches program to retain talent. Grand Rapids
Business Journal, 29 (7), 17-17.
Daneshkohan, A., Zarei, E., Mansouri, T., Maajani, K., Ghasemi, M. S., & Rezaeian,
M. (2015). Factors Affecting Job Motivation among Health Workers: A Study
From Iran. Global Journal of Health Science, 7(3), 153-160.
Danon-Hersch, N., & Paccaud, F. (2005). Future Trends in Human Resources for
Health Care: A Scenario Analysis. Lausanne: University Institute of Social and
Preventive Medicine.
de Kok, J., & Uhlaner, L. M. (2001). Organization Context and Human Resource
Management in the Small Firm. Small Business Economics, Springer, 17(4),
273-291.
de Kok, J., Uhlaner, M. L., & Thurik, A. R. (2003). Human Resource Management With
Small Firms; Facts And Explanations. Rotterdam, The Netherlands: Erasmus
Research Institute of Management (ERIM).
DeCenzo, D. A., & Robbins, S. P. (2010). Fundamentals of Human Resource
Management. Hoboken, NJ: John Wiley & Sons, Inc.
Dieleman, M., Cuong, P. V., Anh, L. V., & Martineau, T. (2003). Identifying factors
for job motivation of rural health workers in North Viet Nam. Human Resources
for Health, 1(10).
Dieleman, M., Gerretsen, B., & van der Wilt, G. J. (2009). Human resource
management interventions to improve health workers' performance in low and
middle income countries: a realist review. Health research policy and
systems/BioMed Central, 7(7).
Dieleman, M., Toonen, H., Toure, H., & TMartineau. (2006). The match between
motivation and performance management of health sector workers in Mali.
Human Resources for Health, 4(2).
Dieleman, M., Toonen, J., Toure, H., & Martineau, T. (2006). The match between
motivation and performance management of health sector workers in Mali.
Human Resources for Health, 4(2). doi:10.1186/1478-4491-4-2
DiMeglio, K., Padula, C., Piatek, C., Korber, S., Barrett, A., Ducharme, M., . . . Corry,
K. (2005). Group cohesion and nurse satisfaction. Examination of a team-
building approach. Journal of Nursing Administration, 35(3), 110-120.
Dussault, G., & Franceschini, M. C. (2006). Not enough there, too many here:
understanding geographical imbalances in the distribution of the health
workforce. Human Resources for Health, 4(12). doi:org/10.1186/1478-4491-4-
12

189
Ebuehi, O. M., & Campbell, P. C. (2011). Attraction and retention of qualified health
workers to rural areas in Nigeria: a case study of four LGAs in Ogun State,
Nigeria. International Electronic Journal of Rural and Remote Health
11(1515).
Edgar, F., & Geare, A. (2005). HRM Practice and Employee Attitudes: Different
Measures-Different Results. Personnel Review, 34(5), 534-549.
Eisen, P., Jasinowski, J., & Kleineli, R. (Producer). (2005). 2005 skills gap report - A
survey of the American manufacturing workforce. Retrieved from
http://www.deloitte.com
Eisenberger, R., Fasolo, P., & Davis-Lamastro, V. (1990). Perceived Organizational
Support and Employee Diligence, Commitment and Innovation. Journal of
Applied Psychology, 75(1), 51-59.
Ekpudu, J. E., & Ojeifo, S. A. (2014). Financial Incentives and Rewards on Employee
Motivation in the Nigerian Electricity Distribution Company European Journal
of Business and Management 6(2), 89-95.
El-Jardali, F., Tchaghchagian, V., & Jamal, D. (2009). Assessment of Human
Resources Management Practices in Lebanese Hospitals. Human Resources for
Health, 7(89), 1-9. doi:10.1186/1478-4491-7-84
Emerson, R. (1976). Social Exchange Theory. Annual Review of Sociology, 2, 335–
362.
Emerson, R. M. (1976). Social exchange theory. Annual Review of Sociology,, 2, 335–
362.
Engeda, E. H., Birhanu, A. M., & Alene, K. A. (2014). Intent to Stay in the Nursing
Profession and Associated Factors among Nurses Working in Amhara Regional
State Referral Hospitals, Ethiopia. BMC Nursing, 13(24). doi:10.1186/1472-
6955-13-24
Everitt, B., & Hay, D. (1992). Talking about statistics: A psychologist's guide to design
and analysis. Statistical Science, 4, 394-408
Eyster, L., Johnson, R., & Toder, E. (Producer). (2008). Current strategies to employ &
retain older workers. [PDF document]. Retrieved from
http://www.urban.orguploadedPDF/411626_0lderworkers.pdf
Farooq-E-Azam, C., Shujaat, S., & Alam, R. (2013). Impact of Non-monetary Rewards
on Employees’ Motivation: a Study of Commercial Banks in Karachi. Journal
of Management and Social Sciences, 9(2), 23-30.
Feldman, D. (2000). The Dilbert syndrome: How employee cynicism about ineffective
management is changing the nature of careers in organizations. American
Behavioral Scientist, 43, 1286-1301.
Fincham, J. E. (2008). Response Rates and Responsiveness for Survey, Standards and
the Journal. American Journal of Pharmacy Education, 72(2), 43-48.
Fox, R. J. (2012). A Study of Employee Retention Issues in the Hospitality Industry.
Masters Thesis. University of Wisconsin-Stout. Menomonie.

190
Friederike, P. (2009). Health Worker Motivation and the Role of Performance Based
Finance Systems in Africa: A Qualitative Study on Health Motivation and the
Rwandan Performance Based Finance Initiative in District Hospitals. Destin
Development Studies Institute, 08-89.
Gabriel, J., & Nwaeke, L. (2015). Non-Financial Incentives and Job Satisfaction among
Hotel Workers in Port Harcourt (Vol. 6).
Garcia Asuero, A., Sayago, A., & González, G. (2006). The Correlation Coefficient:
An Overview (Vol. 36).
Getie, G. A., Betre, E. T., & Hareri, H. A. (2015). Assessment of Factors Affecting
Turnover Intention among Nurses Working at Governmental Health Care
Institutions in East Gojjam, Amhara Region, Ethiopia, 2013. American Journal
of Nursing Science, 4(3), 107-112.
Giannetto, D. F. (2009). Get Your Money’s Worth from Incentives. Business
Performance Management 7(12).
Gikuya, C. N. (2014). Perceived Relationship between Non-financial Rewars and
Employee Motivation at Impact Marketing (K) Limited. Masters Thesis. School
of Business. University of Nairobi. Nairobi, Kenya.
Gnan, L., & Songini, L. (2003). The Professionalization of Family Firms: the Role of
Agency Cost Control Mechanisms. In L. P. Steier & P. a cura di Poutziouris
(Eds.), The Leadership Challenge IFERA: F.B.N. publications.
Golhar, D. Y., & Deshpande, S. P. (1997). HRM Practices of Large and Small Canadian
Manufacturing Firms. Journal of Small Business Management, 35(3), 93-97.
Gopinath, C., & Becker, T. E. (2000). Communication, procedural justice, and
employee attitudes: relationships under conditions of divestiture. Journal of
Management, 26, 63-83.
Gordon, B. (1992). Are Canadian Firms Under Investing in Training? . Canadian
Business Economics, 1(1), 25-33.
Gouldner, A. W. (1960). The Norm of Reciprocity: A Preliminary Statement. American
Sociological Review, 25(2), 161-178.
Griffeth, R. W., & Hom, P. W. (2001). Retaining valued employees. Thousand Oaks,
CA: Sage.
Guba, E. G. (1990). The Alternative Paradigm Dialog. In E. G. Guba (Ed.), The
Paradigm Dialog. V, CA: Sage.
Guba, E. G., & Lincoln, Y. S. (1989). Fourth Generation Evaluation. Newbury Park,
CA: Sage.
Guest, D. E. (1986). Worker Participation and Personnel Policy in the UK: Some Case
Studies. International Labour Review, 125(6), 407.
Guest, D. E. (1997). Human resource management and performance: a review and
research agenda. The International Journal of Human Resource Management,
8(3), 263-276.

191
Guest, G., Bunce, A., & Johnson, L. (2006). How Many Interviews Are Enough? An
Experiment with Data Saturation and Variability. Field Methods, 18(1), 59-82.
Haas, D. F., & Deseran, F. A. (1981). Trust and Symbolic Exchange. Social Psychology
Quarterly, 44(1), 3-13.
Habarugira, J. D. A. (2012). Job Satisfaction of Health Professionals in Kigali
University Teaching Hospital. Unpublished Masters Thesis. University of the
Western Cape-South Africa. Western Cape.
Hagopian, A., Zuyderduin, A., Kyobutungi, N., & Yumkella, F. (2009). Job Satisfaction
And Morale in The Ugandan Health Workforce. Health Affairs, 28(5), 863-875.
Haider, M., Aamir, A., Hamid, A.-B. A., & Hashim, M. (2014). A Literature Analysis
on the Importance of Non-Financial Rewards for Employees' Job Satisfaction.
Abasyn Journal of Social Sciences, 8(2), 67-73.
Haile, F., Yemane, D., & Gebreslassie, A. (2014). Assessment of non-financial
incentives for volunteer community health workers – the case of Wukro district,
Tigray, Ethiopia. Human Resources for Health, 12(54).
Hair Jr., J. F., Black, W. C., Babin, B. J., & Anderson, R. E. (2010). Multivariate Data
Analysis: A Global Perspective (7 ed.). Upper Saddle Rive: Pearson Education
Harman, H. H. (1976). Modern factor analysis, (3 ed.). London: University of Chicago
Press.
Hashmi, K. (2014). Human Resource Management Strategies and Teacher’s Efficiency
within Schools: A Co-relational Study. The IAFOR Journal of Education, 2(1),
65-87.
Henderson, R. J. (1994). Compensation management: Rewarding performance. N J:
Prentice-Hall.
Heneman, R. L., & Tansky, J. W. (2002). Human resource management models for
entrepreneurial opportunity: Existing knowledge and new directions. In J. A.
Katz & T. M. Welbourne (Eds.), Managing People in Entrepreneurial
Organiztions (Advances in Entrepreneurship, Firm Emergence and Growth
(Vol. 5, pp. 55-81): Emerald Group Publishing Limited.
Hewitt, P. (Producer). (2002). High Performance Workplaces: The Role of Employee
Involvement in a Modern Economy. Retrieved from
www.berr.gov.uk/files/file26555.pdf
Hodgetts, E. W., Hagler, P., & Hodgetts, S. T. (2006). Exploring the Use of Factor
Analysis to Determine the Relevant Dimensions of Outcome for a Given
Population in Rehabilitation Science: A Tutorial Journal of Speech-Language
Pathology and Audiology 30(2), 132-141.
Homans, G. (1958). Social Behavior as Exchange. American Journal of Sociology, 63
(May), 597-606.
Homans, G. (1961). Social Behaviour, Its Elementary Forms. London: Routledge &
Kegan Paul.

192
Houseman, R., Hatfield, J., & Miles, E. (1987). A new perspective on Equity Theory.
The Equity Sensitivity Construct. Academy of Management Review, 12(2), 232-
234.
Huselid, M. A. (1995). The Impact of Human Resource Management Practices on
Turnover, Productivity, and Corporate Financial Performance. Academy of
Management Journal, 38(3), 635-872.
Hussain, T., & Rehman, S. u. (2013). Do Human Resource Management Practices
Inspire Employees’ Retention? Research Journal of Applied Sciences,
Engineering and Technology 6(19), 3625-3633.
Iftikhar, H., Jan, Z., & Muhammad Najmi, S. (2015). Gaining Organizational
Competitiveness through Employee Retention: A Cost Cutting Strategy.
International Journal of Management Sciences, 6(9), 412-429.
Ihuah, P. W. (2014). A Review of Soft and Hard Approaches of Human Resource
Management and the Success of Real Estate Development in Nigeria. Journal
of Business Management and Economic Development (JBMED), 1(1), 16-23.
Imna, M., & Hassan, Z. (2015). Influence of Human Resource Management Practices
on Employee Retention in Maldives Retail Industry. International Journal of
Accounting, Business and Management, 1(1), 1-28.
International Labour Organization. (2012). International Standard Classification of
Occupations: ISCO-08. Geneva, Switzterland: International Labout Office.
Iowa Department of Public Health (Producer). (2012). Performance Management
Readiness Survey.
Irawanto, D. W. (2015). Employee Participation in Decision-making: Evidence from a
State-owned Entreprise in Indonesia. . Management, 20(1), 159-172
Islam, R., & Ismail, A. Z. (2004). Ranking of Employees’ Reward and Recognition
Approaches: A Malaysian Perspective. Journal of International Business and
Entrepreneurship Development, 2(2), 113-124.
Islam, S., Khatun, R., Faruk, M. O., & Mortoza, M. G. (2013). Human Resource
Management Practices in Private Commercial Banking Sector: A Study on
Khulna City, Bangl. International Journal of Management Sciences and
Business Research, 3(1), 157-170.
Jackson, S. E., & Schuler, R. S. (1995). Understanding Human Resource Management
in the Context of Organizations and their Environments. Annual Reviews, 46,
237-264.
Johnson, B., & Onwuegbuzie, A. (2004). Mixed methods research: A research
paradigm whose time has come. Educational Researcher, 33(7), 14-26.
Josan, I. J. (2013). Human Capital and Organizational Effectiveness. Change and
Leadership(17), 39-45.
Joshi, S., Joshi, S., Damani, H., Ng, J., & Lauwa, L. (2013). Kigali City - Analysis,
benchmarking and vision report. Detailed physical plan for gasabo and
kicukiro. . Kigali Kigali City.

193
Kabene, S. M., Orchard, C., Howard, J. M., Soriano, M. A., & Leduc, R. (2006). The
importance of human resources management in health care: a global context.
Human Resources for Health, 4(20).
Kacmar, M., Andrews, M., Rooy, D., Steilberg, C., & Cerrone, S. (2006). Sure
everyone can be replaced... but at what cost?: Turnover as a predictor of unit-
level performance. Academy of Management Journal, 49(1), 133-144.
Kamanzi, J., & Nkosi, Z. Z. (2011). Motivation Levels amog Nurses Working at Butare
University Teaching Hospitals Africa Journal of Nursing and Midwifery, 13(2),
119-132.
Kand, M., & Rekor, M. (2005). Perceived Involvement in Decision-Malking and Job
Satisfaction: the evidence from a job satisfaction survey among nurses in
Estonia SSE Riga Working Papers, 5(74).
KardasLarson [online] (Producer). Performance Management Evaluation
Questionnaire. Human Resource Consulting. Retrieved from
KardasLarson.com
Kathure, D. (2014). Influence of Non-Financial Rewards on Employee Commitment at
the Kenya Tea Development Agency. (Masters), University of Nairobi, Nairobi-
Kenya.
Keller, G. (2014). Statistics for Management and Economics (10 ed.). Ontario: South-
Western College Publishing.
Kenneth, W. T. (2000). Intrinsic motivation at work-Building energy and commitment.
San Francisco: Berrett-Koehler.
Keya, R. D., & Rahmatullah Imon, A. H. M. (2016). A Brief Review of Tests for
Normality. American Journal of Theoretical and Applied Statistics, 5(1), 5-12.
Khattak, M. A., Iqbal, N., Urooj, S. F., & Bashir, F. (2012). Employee Involvement
And Participation At Work: A Case Study Of OTCL After Privatization
International Journal of Academic Research in Business and Social Sciences,
2(6), 469-476.
Kigali Institute of Sciences and Technology. (2001). Kigali Economic Development
Strategy. Kigali: City of Kigali.
Kingir, S., & Mesci, M. (2010). Factors that affect Hotel Employees Motivation the
case of Bodrum. Serbian Journal of Management, 5(1), 59-76.
Knights, J. A., & Kennedy, B. J. (2005). Psychological contract violation: Impacts on
job satisfaction and organisational commitment among Australian senior public
servants. Applied HRM Research, 10(2), 57-72.
Krishnan, L. R. K., Warier, S., & Kanaujia, K. (2013). An Empirical Examination of
Performance Management on Employee Retention International Research
Journal of Management and Commerce, 4(1).
Krishnan, L. R. K., Warier, S., & Muslim, A. (2013). An Empirical Examination of
Performance Management on Employee Retention. International Journal of
Research in Commerce and Management, 4(1), 148-156.

194
Krueger, R. A. (1988). Focus Groups: A Practical Guide for Applied Research.
Newbury Park, CA: Sage Publications.
Kshirsagar, M., & Waghale, V. Y. (2014). Impact of Financial and Non-financial
Rewards on Employee Motivation International Research Journal of
Management and Commerce, 1(6), 61-74.
Kutner, N. N. (2004). Applied regression models (4 ed.). Maidenhead: McGraw-Hill.
Kuye, O. L., & Sulaimon, A.-H. A. (2011). Employee Involvement in Decision-Making
and Firms Performance in the Manufacturing Sector in Nigeria Serbian Journal
of Management 6(1), 1-15.
Kyndt, E., Dochy, F., Michielsen, M., & Moeyaert, B. (2009a). Employee Retention:
Organisational and Personal Perspectives (Vol. 2).
Kyndt, E., Dochy, F., Michielsen, M., & Moeyaert, B. (2009b). Employee Retention:
Organisational and Personal Perspectives. Vocations and Learning.
doi:10.1007/s12186-009-9024-7
Lai, H.-H. (2011). The influence of compensation system design on employee
satisfaction. African Journal of Business Management, 5(26), 10718-10723.
Laka-Mathebula, M. R. (2004). Modeling the relationship between organizational
commitment, leadership style, human resources management practices and
organizational trust. PhD Thesis. University of Pretoria. South Africa.
Le Var, R. M. H. (2014). A questionnaire study of the effect on work of participation
in and influence on decision-making. Research in Post-Compulsory Education,
3(2), 153-173 doi:DOI: 10.1080/13596749800200033
Legge, K. (1995). Human Resource Management: Rhetorics and Realities. London:
MacMillan Press.
Leghari, J. M., Suleman, U., Leghari, I. B., & Aslam, S. (2014). Role of HRM Practices
in Performance of Organization and Employee Retention. European Journal of
Business and Management, 6(31), 218-223.
Lehmann, U., Dieleman, M., & Martineau, T. (2008). Staffing remote rural areas in
middle- and low-income countries: A literature review of attraction and
retention. BMC Health Services Research, 8(19). doi:10.1186/1472-6963-8-19
Lester, S. W., Turnley, W. H., Bloodgood, J. M., & Bolino, M. C. (2002). Not seeing
eye to eye: Differences in supervisor and subordinate perceptions of and
attributions for psychological contract breach. Journal of Organisational
Behavior, 23(1), 39-56.
Lethbridge, J. (2017). Recruitment & Retention in Social Services. Unlocking the
Sector’s Job Creation Potential. Retrieved from Brussels:
Lievens, T., Serneels, P., Butera, J. D., & Soucat, A. (2010). Diversity in Career
Preferences of Future Health Workers in Rwanda. Where, Why, and for How
Much? World Bank Working Paper, No. 189.

195
Lincoln, Y. S., & Guba, E. G. (2000). Paradigmatic Controversies, Contradictions, and
Emerging Confluences. In N. K. Denzin & Y. S. Lincoln (Eds.), Handbook of
Qualitative Research. Thousand Oaks, CA: Sage.
Longmore, B., & Ronnie, L. (2014). Human resource management practices in a
medical complex in the Eastern Cape, South Africa: Assessing their impact on
the retention of doctors. South Africa Medicine Journal, 104(5), 368-371.
Lowell, B. (2003). Skilled Migration Abroad or Human Capital Flight? Georgetown
University: Institute for the Study of International Migration.
Lutwama, G. W., Roos, J. H., & Dolamo, B. L. (2013). Assessing the implementation
of performance management of health care workers in Uganda. BMC Health
Services Research 2013, 13(355).
Mamah, A. A., & Ulo, F. U. (2015 ). Application of Equity Theory on Skilled
Manpower retention: A Study of Medical Practitioners in Public Sprcialist
Hospitals in Enugu Metropolis, Nigeria. International Journal of Research in
Business Management, 3(11), 95-110
Manafa, O., McAuliffe, E., Maseko, F., Bowie, C., MacLachlan, M., & Normand, C.
(2009). Retention of health workers in Malawi: perspectives of health workers
and district management. Human Resources for Health, 7(65).
Manongi, R. N., Marchant, T. C., & Bygbjerg, I. C. (2006). Improving motivation
among primary health care workers in Tanzania: a health worker perspective.
Human Resources for Health, 4(6).
Marchington, M., & Grugulis, I. (2000). "Best Practice’’ Human Resource
Management: Perfect Opportunity or Dangerous Illusion. International Journal
of Human Resource Management, 11(6), 1104 – 1124.
Mardia, K. V. (1980). Tests of univariate and multivariate normality. In P. R.
Krishnaiah (Ed.), Handbook of Statistics 1: Analysis of Variance (pp. 279-320).
Amsterdam: North-Holland Publishing.
Markowitz, G. A. (2012). Faculty Intent to Stay and the Perceived Relationship with
Supervisor at a Career-Focused University. (PhD), Open Access Dissertations.
890.
Mathauer, I., & Imhoff, I. (2006). Health worker motivation in Africa: the role of non-
financial incentives and human resources management tools. Human Resources
for Health, 4(24).
Maxwell, S. E., & Delaney, H. D. (2004). Designing Experiments and Analyzing Data.
Mahwah, NJ: Lawrence Erlbaum.
Mbilinyi, D. R. (2008). Non-financial incentives and the retention of health workers in
Tanzania. Retrieved from Dar-Es-Salaam:
McCarthy, G., Tyrrell, M. P., & Cronin, C. (2002). National Study of Turnover in
Nursing and Midwifery. Dublin, Ireland: Department of Nursing Studies.
University College Cork, National University of Ireland Cork.

196
McIntosh, B. (Producer). (2001). An employer's guide to older workers: How to win
them back and convince them to stay. Retrieved from
http://www.doleta.gov/Seniors/other_docs/EmpIGuide.pdf
Mensab, K. (2008). Responding to the Challenge of Migration of Health Workers:
Rights, Obligations, and Equity in North/South Relations. Global Soc Pol, 8(1),
9-11.
Milkovich, G. M., & Newman, J. M. (2004). Compensation (8 ed.). Burr Ridge, IL:
Irwin McGraw-Hill.
Milkovich, G. T., & Newman, J. M. (2008). Compensation (9 ed.). Boston: McGraw-
Hill Irwin.
Milton, E. S., & Gregory, T. S. (2009). Construct Validity: Advances in Theory and
Methodology. Annual Review of Clinical Psychology, 27(5), 1-25.
MINISANTE. (2014). Health Sector Policy. Kigali: Republic of Rwanda.
Mitchell, M. S., Goodman, J. M., Alter, D. A., Oh, P. I., & Faulkner, G. E. J. (2015).
Development of the Health Incentive Program Questionnaire (HIP-Q) in a
cardiac rehabilitation population. Translational Behavioral Medicine, 5(4),
443-459.
MOH. (2015). Human Resources for Health report. Kigali, Rwanda: Government of
Rwanda.
Mohammad, F. A., Yoshifumi, H., Sakdan, M. F., & Ayman, M. A. (2013). Integrating
Herzberg and Social Exchange Theories to Underpinned Human Resource
Practices, Leadership Style and Employee Retention in Health Sector. World
Journal of Business Management, 3(1), 16-34.
Mohammad, S. E., & Dougherty, E. R. (2013). Effect of Separate Sampling on
Classification Accuracy (Vol. 30).
Mohr, D. C., Burgess, J. F., & Young, G. J. (2008). The influence of teamwork culture
on physician and nurse resignation rates in hospital. Health Services
Management Research, 21, 23-31.
Molm, L. D. (2003). Theoretical Comparisons of Forms of Exchange. Washington:
American Sociological Association.
Moncraz, E., Zhao, J., & Kay, C. (2009). An exploratory study on US lodging
properties’, organizational practices and employee turnover and retention.
International Journal of Contemporary Hospitality Managemen, 21(4), 437-
458.
Moore, D. S., & Notz, W. I. (2012). Statistics: Concepts & Controversies (9 ed.).
Moorman, R. H., Blakely, G. L., & Niehoff, B. P. (1998). Does Perceived
Organizational Support Mediate the Relationship between Procedural Justice
and Organizational Citizenship Behavior. Academy of Management Journal,
41(3), 351-357.

197
Moran, A. M., Coyle, J., Pope, R., Boxall, D., Nancarrow, S. A., & Young, J. (2014).
Supervision, support and mentoring interventions for health practitioners in
rural and remote contexts: an integrative review and thematic synthesis of the
literature to identify mechanisms for successful outcomes. Human Resources
for Health, 12(10).
Moses, B. (Producer). (1999). Career planning mirrors social change. Retrieved from
http://www.bbmcareerdev.com/careerplan.html
Mullei, K., Mudhune, S., Wafula, J., Masamo, E., English, M., Goodman, C., . . .
Blaauw, D. (2010). Attracting and retaining health workers in rural areas:
investigating nurses’ views on rural posts and policy interventions BMC Health
Services Research, 10(Suppl.1).
Mullins, J. L. (2005). Management and Organisational Behaviour (7 ed.). England:
Prentice Hall / Financial Times.
Munga, B. M. (2013). The Relationship Between Non-financial Rewards and Teacher
Retention inPrivate Schools in Kirinyaga-South District. Masres Thesis. School
of Business. Kenyatta University. Nairobi, Kenya.
Munga, M. A., & Mbilinyi, D. R. (2008). Non-financial Incentives and the Retention of
Health Workers in Tanzania Working Paper No 61. National Institute for
Medical Research. . Dar Es Salaam, Tanzania.
Mustapha, N., Ahmad, A., Uli, J., & Idris, K. (2010). Job Characteristics as Antecedents
of Intention to Stay and Mediating Effects of Work Family Facilitation and
Family Satisfaction among Single Mothers in Malaysia International Journal
of Business and Social Science 1(3), 59-74.
Mwaniki, D. L., & Dulo, C. O. (2008). Migration of Health Workers in Kenya: The
Impact on Health Service Delivery. Regional Network for Equity in Health in
east and southern Africa. Equinet Discussion Paper No 55.
Nagel, T. (1986). The View From Nowhere. New York: Oxford University Press.
Nasyira, M. N., Othman, M., & Ghazali, H. (2014). Predictors of intention to stay for
employees of casual dining restaurant in Klang Valley area. International Food
Research Journal, 21(3), 863-887.
Nduwayezu, G. (2015). Modelling Urban Growth in Kigali City, Rwanda (Masters),
University of Twente, Eschede, The Netherlands.
Nedd, N. (2006). Perceptions of Empowerment And Intent to Stay. Nursing Economics.
Continuing Education Series, 24(1), 13-19.
Neelkamal, N. (2012). Comparing the Impact of Monetary and Non-monetary Reward
Programmes towards Employee and Organization Motivation Masters Thesis.
Gordon Institute of Business Science. University of Pretoria. Pretoria, South
Africa.
Nettle, R., Semmelroth, A., Ford, R., Zheng, C., & Ullah, A. (2011). Retention of people
in dairyfarming – what is working and why? : Gardiner Foundation.
Nickson, D. (2007). Human Resource Management for the Hospitality and Tourism
Industries Burlington, USA: Elsevier.

198
Nishii, L. H., Lepak, D., & Schneider, B. (2008). Employees’ attributions of the ‘why’
of HR practices: Their effects on employee attitudes and behaviors and
customer satisfaction. Pers. Psychol, 61(3), 503545.
Nkomeje, E. (2008). Exploring the Factors that Contribute to Job Satisfaction among
Registered Nurses at King Faisal Hospital, Kigali-Rwanda. Unpublished
Masters Thesis. University of KwaZulu-Natal. Durban.
Noah, Y. (2008). A Study of Worker Participation in Management Decision Making
Within Selected Establishments in Lagos, Nigeria. Journal of Social Science,
17(1), 31-39.
Noe, R. A., Hollenbeck, J., & Gerhart, B. (2008). Human Resource Management:
Gaining a Competitive Advantage (6 ed.). Boston: McGraw-Hill.
Norman, G. R., & Strelner, D. L. (2000). Biostatistics: The bare essentials (2 ed.).
Hamilton: ON: B. C. Decker.
Nouri, H., & Parker, R. J. (2013). Career Growth Opportunities and Employee Turnover
Intentions in Public Accounting Firms. The British Accounting Review, 45, 38-
148.
Nwokocha, I., & Iheriohanma, B. J. (2012). Emerging Trends in Employee Retention
Strategies in a Globalizing Economy: Nigeria in Focus Asian Social Science,
8(10), 198-207.
Nyamubarwa, W., Mupani, H., & Chiduuro, C. (2013). An analysis of the Human
Resource practices in the Mining Industry in Zimbabwe’s Midlands Province:
A relook at the Resource Based View of Managing Human Resources. IOSR
Journal Of Humanities And Social Science, 17(1), 116-123.
Nyandoro, Z. F., Masanga, G. G., Munyoro, G., & Muchopa, P. (2016). Retention oh
Health Workers in Rural Hospitals in Zimbabwe: A case study of Makonde
District, Mashonaland West Province International Journal of Research in
Business Management 4(6), 27-40.
Ockert, D. (2005). Substantive Scale Verification: A Likert Scale Analysis and Critique
of University Student Pedagogical Activity Preferences. JALT Hokkaido
Journal, 9, 48-64.
Ofori, R., & Dampson, D. G. (2011). Research Methods and Statistics Using SPSS.
Amakon: Kumasi Publishing Ltd.
Oginni, B. O., Ogunlosi, C. F., & Faseyiku, I. O. (2013). A study of employee retention
strategies and organizational survival in private universities in Southern West,
Nigeria International Journal of Management, 2(1).
Ojakaa, D., Olango, S., & Jarvis, J. (2014). Factors affecting motivation and retention
of primary health care workers in three disparate regions in Kenya. Human
Resources for Health, 12(33).
Oni-Ojo, E. E., Salau, O. P., Dirisu, J. I., & Waribo, Y. J. (2015). Incentives and Job
Satisfaction: Its Implications for Competitive Positioning and Organizational
Survival in Nigerian Manufacturing Industries American Journal of
Management, 15(2), 74-85.
199
Onwuegbuzie, A. J., & I, N. L. L. (2004). Taking the "Q" Out of Research: Teaching
Research Methodology Courses without the Divide between Quantitative and
Qualitative Paradigms. Quality & Quantity. International Journal of
Methodology, 5(2), 21-35.
Osborne, J. W., & Overbay, A. (2004). The power of outliers (and why researchers
should always check for them). Practical Assessment, Research and Evaluation,
9 (6).
Osibanjo, O. A., Adeniji, A. A., Falola, H. O., & Heirsmac, P. T. (2014). Compensation
Packages: A Strategic Toll for Employees' Performance and Retention.
Leonaldo Journal of Sciences(25), 65-84.
Osman, I., Noordina, F., Dauda, N., & Othmanb, M. Z. (2016). The Dynamic Role of
Social Exchange and Personality in Predicting Turnover Intentions among
Professional Workers, 5th & 6th October 2015. Paper presented at the 7th
International Economics & Business Management Conference.
Oyetunde, M. O., & Ayeni, O. O. (2014). Exploring Factors Influencing Recruitment
and Retention of Nurses in Lagos State, Nigeria within Year 2008 and 2012.
Open Journal of Nursing, 4, 590-601.
Ozolina-Ozola, I. (2014). The impact of human resource management practices on
employee turnover. Prodecia-Social and behavioral Sciences 156, 223-226.
Padron, T. (2004). Retention Of Employees in The Wisconsin Restaurant Industry.
Masters Thesis. University of Wisconsin-Stout. Menomonie.
Pallant, J. (2005). SPSS Survival Manual: A Step By Step Guide to Data Analysis Using
SPSS for Windows (Version 12) (2 ed.). Berkshire: Open University Press.
Pang, T., Lansang, M. A., & Haines, A. A. (2002). Brain Drain and Health
Professionals: A Global Problem Needs Global Solutions. Brit Med J,
324(7336), 499-500.
Panoch, A. (2001). The Relationship Between Diversity and Employee Retention.
Masters Thesis. University of Wisconsin-Stout. Menomonie.
Paré, G., & Tremblay, M. (2007). The influence of high-involvement human resources
practices, procedural justice, organizational commitment, and citizenship
behaviors on information technology professionals' turnover intentions. . Group
& Organization Management,, 32(3), 326-357.
Park, H.-A. (2013). An Introduction to Logistic Regression: From Basic Concepts to
Interpretation with Particular Attention to Nursing Domain. Journal of the
Korean Academy of Nursing, 43(2), 154-164.
Patton, J. (2015). Human Resource Management (HRM) in the Aviation Industry. The
Journal of Global Business Management, 11(1), 1-12.
Paul, A. K., & Anantharaman, R. N. (2003). Impact of people management practices
on organizational performance: analysis of a causal model. International
Journal of Human Resource Management, 1246-1266.
Pfeffer, J. (1998). The Human Equation: Building profits by putting people first.
Boston: Harvard Business School Press.
200
Pleffer, A. (Producer). (2007, November 4, 2016). Work-Life Balance: The Number 1
Retention Factor. Retrieved from http://www.mccrindle.com.
Podsakoff, P. M., MacKenzie, S. B., & Podsakoff, N. P. (2012). Sources of method bias
in social science research and recommendations on how to control it. Annual
Review of Psychology, 63, 539-569.
Popper, K. R. (1959). The Logic of Scientific Discovery. New York: Routledge.
Prenda, K., & Stahl, S. (2001). Peak job performance at any age: The truth about older
workers5(30). Retrieved from
Price, J. L., & Mueller, C. W. (1981). A causal model of turnover for nurses. Academy
of Management Journal, 24, 543-565.
Pulakos, E. D. (2004). Performance Management. A roadmap for developing,
implementing and evaluating performance management systems. Alexandria,
USA: SHRM Foundations.
Rajendra, S. (2014). To Study the Effectiveness of HRM Practice in Textile industries
in Madhya Pradesh, India Global Journal of Human Resource Management,
2(3), 59-72.
Rawe, I. (2006). Why Your Boss May Start Sweating The Small Stuff. Time, 167(12),
78-79.
Redman, T., & Mathews, P. B. (1998). Service quality and human resource
management: A review and research agends. Personnel Review, 27(1), 57-77.
Roche, M. A., Duffield, C., Dimitrelis, S., & Frew, B. (2015). Leadership skills for
nursing unit managers to decrease intention to leave. Nursing: Research and
Reviews, 5, 57-64.
Rondeau, K., & Wagner, T. H. (2016). Human Resource Management Practicens and
Nursing Turnover. Journal of Nusing Education and Practice, 6(10).
Rondeau, K. V., & Wagar, T. H. (2016). Human resource management practices and
nursing turnover. Journal of Nursing Education and Practice, 6(10), 101-109.
Rotich, K. J. (2015). History, Evolution and Development of Human Resource
Management: A Contemporary Perspective. Global Journal of Human
Resource Management, 3(3), 58-73.
Rouleau, D., Fournier, P., Philibert, A., Mbengue, B., & Dumont, A. (2012). The effects
of midwives' job satisfaction on burnout, intention to quit and turnover: a
longitudinal study in Senegal. Human Resources for Health, 10(9).
Rue, L. W., & Byars, L. L. (2005). Management: Skills and Application (11 ed.). New
York: The McGraw Hill Companies
Saleem, S. (2011). The Impact of Financial Incentives on Employees Commitment.
European Journal of Business and Management, 3(4), 258-266.
Salman, A., Ahmad, N., & Matin, F. (2014). Factors Affecting on Employees Retention
in Banking Sector: An Investigation from Karachi (Vol. 6).

201
Sandhya, K., & Kumar, D. P. (2011). Employee retention by motivation. Indian Journal
of Science and Technology, 4(12), 1778-1782.
Sanjeevkumar, V. (2012). A Study on Employee’s Intention to Stay in Public
Companies, Kedah, Malaysia. Zenith International Journal of Business
Economics & Management Research, 2(4).
Sapkota, T. N., Teijlingen, E. v., & Simkhada, P. P. (2014). Nepalese health workers’
migration to the United Kingdom: A qualitative study. Health Science Journal,
8(1), 57-74.
Sara, L. R., Gerhart, S. B., & Minette, A. K. (2004). The Importance of Pay in Employee
Motivation: Discrepancy Between what People Say and what they Do. Human
resource management, 43 (4), 381-394.
Sarbapriya, R. (2011). Human Resource Management Practices and Its Effect on
Employees’ Job Satisfaction: A Study on Selected Small and Medium Sized
Iron &Steel Firms in India. Public Policy and Administration Research, 1(1).
Saxena, K., & Tiwari, P. (2009). A Study of HRM Practices in Selected IT Companies
of India. AIMS Journal of Management, 1(3), 29-44.
Schmiedeknecht, K. M., Perera, E., Schell, E., Jere, J., Geoffroy, E., & Rankin, S.
(2015). Predictors of Workforce Retention among Malawian Nurse Graduates
of a Scholarship Program: A Mixed-Methods Study. Global Health: Science
and Practice 3(1), 85-96. doi:10.9745/GHSP-D-14-00170
Schrag, F. (1992). In Defense of Positivist Research Paradigms. Educational
Researcher, 21(5), 5-8.
Schuler, R. S., & Jackson, S. E. (1987a). Linking competitive strategies with human
resource management practices. Academy of Management Executive, 1(3), 207-
219.
Schuler, R. S., & Jackson, S. E. (1987b). Organisational Strategy and Organisational
Level as Determinants of Human Resource Management Practices. Human
Resource Planning, 10(3), 125-141.
Schulz, S. A., Luthans, K. W., & Messersmith, J. G. (2014). Psychological Capital: A
New Tool for Driver Retention. International Journal of Physical Distribution
& Logistics Management, 44(8/9), 621-634.
Schwandt, T. A. (2000). Three Epistemological Stances for Qualitative Inquiry:
Interpretivism, Hermeneutics, and Social Constructionism. In N. K. Denzin &
Y. S. Lincoln (Eds.), Handbook of Qualitative Research. Thousand Oaks, CA
Sage.
Selvarajan, R., & Cloninger, P. A. (2008). The Importance of Accurate Performance
Appraisals for Creating Ethical Organizations. Journal of Applied Business
Research, 3rd quarter, 24(3), 39-44.
Settoon, R. P., Bennett, N., & Liden, R. C. (1996). Social Exchange in Organizations:
Perceived Organizational Support, Leader-Member Exchange and Employees
Reciprocity. Journal of Applied Psychology, 81(3), 219 – 227.

202
Shenton, A. K. (2004). Strategies for ensuring trustworthiness in qualitative research
projects. Education for Information, 22, 63-75.
Sieber, S. D. (1973). The Integration of Fieldwork and Survey Methods. American
Journal of Sociology, 73, 1335-1359.
Singh, S. K. G. (2009). A Study on Employee Participation in Decision Making. Unitar
E-Journal, 5(1), 20-38.
Siong, T. K. (2012). The Level and Effects of Participation in Decision-Making (PDM)
on Employee Groups for the Manufacturing and Servicing Sectors in Malaysis
University Tunku Abdul Rahma Malaysis.
Smith, B. D. (2005). Job Retention in Child Welfare: Effects of Perceived
Organizational Support, Supervisor Support, and Intrinsic Job Value. Children
and Youth Services Review 27, 153-169.
Smith, J. K. (1983). Quantitative versus Qualitative Research: An Attempt to Clarify
the Issue. Educational Researcher, 12, 6-13.
Smith, J. K. (1984). The Problem of Criteria for Judging Interpretive Inquiry. .
Educational Evaluation and Policy Analysis, 6, 379-391.
Sofijanova, E., & Zabijakin-Chatleska, V. (2013). Employee Involvement and
Organizational Performance: Evidence from the Manufacturing Sector in the
Republic of Macedonia Trakia Journal of Sciences, 11(1), 31-36.
Sonali, A. (Producer). (2011). Questionnaire on Effectiveness of Monetary Benefits on
Motivation and Retention of Employees. Retrieved from
https://www.scribd.com/doc/55729697
Songstad, N. G., Rekdal, O. B., Massay, D. A., & Blystad, A. (2011). Perceived
unfairness in working conditions:The case of public health services in Tanzania
BMC Health Service Research, 11(34).
Steinhaus, C. S., & Perry, J. L. (1996). Organizational Commitment: Does Sector
Matter? Public Productivity & Management Review, 19(3), 278-288.
Stevens, J. (2002). Applied multivariate statistics for the social sciences (4 ed.). NJ:
Lawrence Erlbaum Associates, Mahwah.
Stock, J., & Watson, M. (2001). Introduction to econometrics: . New York: Prentice
Hall.
Storey, J. (1989). New Perspectives on Human Resource Management. London:
Routledge.
Strebler, M., Robinson, D., & Heron, P. (1997). Getting the Best Out of Your
Competencies, Report 334. Brighton: Institute of Employment Studies.
Sun, K. (2016). The Power of Perks: Equity Theory and Job Satisfaction in Silicon
Valley. Scripps Senior Theses, Paper 846.
https://scholarship.claremont.edu/scripps_theses/846.
Swalhah, A., Irtima, H., & Zouby, A. (2013). The Relationship between Job Stress and
Job Productivity among Workers in Alisraa Hospital. East Journal of
Psychology and Business, 12(2), 1-11.

203
Swathi, B. (2014). A Comprehensive Review on Human Resource Management
Practices IMPACT: International Journal of Research in Business
Management, 2(21), 27.
Sykes, O. A. (Producer). (1992, 16 April 2017). The Inaugural Coase Lecture: An
Introduction to Regression Analysis. Retrieved from
http://www.law.uchicago.edu/files/files/20.Sykes_.Regression.pdf
Tabachnick, B. G., & Fidell, L. S. (2007). Using multivariate statistics. Boston: MA:
Allyn and Bacon.
Tashakkori, A., & Teddlie, C. (2003). Handbook of Mixed Methods in Social and
Behavioral Research. Thousand Oaks, CA: Sage.
Tashakkori, A., & Teddlie, C. (2010). Handbook of mixed methods in social &
behavioral research (2 ed.). London: Sage Publication.
Taylor, S. (2011). Contemporary Issues in Human Resource Management. UK: CIPD.
Thi Hoai Thu, N., Wilson, A., & McDonald, F. (2015). Motivation or demotivation of
health workers providing maternal health services in rural areas in Vietnam:
findings from a mixed-methods study. Human Resources for Health, 13(91).
Thibaut, J. W., & Kelley, H. H. (1959). The social psychology of groups. Oxford,
England: John Wiley.
Thomas, W. H., & Butts, M. M. (2009). Effectiveness of Organizational Efforts to
Lower Turnover Intentions: The Moderating Role of Employee Locus of
Control. Human Resource Management, 48(2), 289-310.
Torrington, D., Hall, L., & Taylor, S. (2002). Human Resource Management (5 ed.).
International edition: Prentice Hall/Financial Times, International edition.
Trevor, C. O., Gerhart, B., & Boudreau, J. W. (1997). Voluntary turnover and job
performance: curvilinear and the moderating influences of salary growth and
promotions. Journal of Applied. Psychology, 82(1), 44-61.
Truss, C., Gratton, L., Hope-Hailey, V., McGovern, P., & Stiles, P. (1997). Soft and
Hard Models of Human Resource Management: A reappraisal. Journal of
Management Studies, 34, 53-73.
U.S. Chamber of Commerce. (2008). Employee Benefits Study. Washington, D.C.: U.S.
Chamber of Commerce.
Usadọlọ, Q. E. (2016). The impact of social exchange on volunteer's workplace
outcomes in non-profit organisations. (PhD), Southern Cross University,
Lismore, NSW.
Van Breukelen, W., Van Der Vlist, R., & Steensma, H. (2004). Voluntary employee
turnover: Combining variables from the traditional turnover literature with the
theory of planned behavior Journal of Organizational Behavior,, 25, 893-914.
Vanderstoep, S. W., & Johnston, D. D. (2009). Research Methods for Everyday Life
Blending Qualitative and Quantitative Approaches. San Francisco: Jossey-Bass.

204
Verma, A. (1995). Employee Involvement in the Workplace. In M. Gunderson & A.
Ponak (Eds.), Union-Management Relations in Canada (3 ed.). Don Mills,
Ontario: AddisonWesley.
Vos, A. D., & Meganck, A. (2009). What HR managers do versus what employees
value: Exploring both parties' views on retention management from a
psychological contract perspective. Personnel Review, 38(1), 45-60.
Wagner, S. E. (2006). Staff retention: from “satisfied” to “engaged”. Nursing
Management, 37(3), 24-29.
Wagner, T. H. (1998). Determinants of Human Resource Management Practices in
Small Firms: Some Evidence from Atlantic Canada. J Small Business Mgmt,
36, 13-23.
Walker, J. W. (2001). Zero defections. Human Resource Planning, 24(1), 6-8.
Waster, E. E., Berscheid, G. A., & Waster, G. W. (1973). New Dimensions in Equity
Research. Journal of Personality and Social Psychology, 151-176.
Wei, T. T., Marthandan, G., Ching, A. Y. L., Oi, K. B., & Arumugam, S. (2009). What
drives Malaysian m-Commerce adoption? An empirical analysis. Industrial
Management & Data Systems, 109(3), 370-388.
Weiss, H. M. (2002). Deconstructing Job Satisfaction: Separating Evaluations, Beliefs
and Affective Experiences. Human Resource Management Review, 12(2), 173-
194.
WHO. (2006). Working Together for Health: The World Health Report 2006 (W. H.
Organization Ed.). Geneva, Switzerland: World Health Organization.
Wiley, C. (1997). What Motivates Employees according to over 40 Years of Motivation
Surveys. International journal of manpower, 18(3), 263-281.
Willis-Shattuck, M., Bidwell, P., Thomas, S., Wyness, L., Blaauw, D., & Ditlopo, P.
(2008). Motivation and retention of health workers in developing countries: a
systematic review. BMC Health Services Research, 8(847).
Willis-Shattuck, M., Bidwell, P., Thomas, S., Wyness, L., Blaauw, D., & Ditlopo, P.
(2009). Motivation and retention of health workers in developing countries: A
systematic review (Vol. 8).
Wittmer, J. L. S., Martin, J. E., & Tekleab, A. G. (2010). Procedural Justice and Work
Outcomes in a Unionized Setting: The Mediating Role of Leader-Member
Exchange American Journal of Business 25(2), 55–70.
World Health Organisation. (2000). The World Health Report 2000: Health Systems:
Improving Performance. Geneva: WHO.
World Health Organisation. (2010). Health Workforce, Infrastructure and Essential
Medicine. Retrieved from
World Health Organization. (2010). Increasing Access to Health Workers in Remote
and Rural Areas Through Improved Retention: Global Policy
Recommendations. Retrieved from Geneva:
205
Wurie, H. R., Samai, M., & Witter, S. (2016). Retention of health workers in rural Sierra
Leone: findings from life histories. Human Resources for Health, 143(3).
doi:10.1186/s12960-016-0099-6
YangYang, Yan-Hui, L., Jing-Ying, L., & Hong-Fu, Z. The impact of work support and
organizational career growth on nurse turnover intention in China. International
Journal of Nursing Sciences, 2(2), 134-139.
Yazinski, S. (2009). Strategies for retaining employees and minimizing turnover.
Yousaf, S., Latif, M., Aslam, S., & Saddiqui, A. (2014). Impact of Financial and non
Financial Rewards on Employee Motivation. Middle-East Journal of Scientific
Research, 21(10), 1776-1786.
Zaghloul, A., Al-Hussaini, M. F., & Al-Bassam, N. K. (2008). Intention to stay and
nurses’ satisfaction dimensions.
Zaghloul, A. A., Al-Hussaini, M. F., & Al-Bassam, N. K. (2008). Intention to stay and
nurses’ satisfaction dimensions. Journal of Multidisciplinary Healthcare, 1, 51–
58.
Zikmund, W. G., Babin, B. J., Carr, J. C., & Griffin, M. (2013). Business research
methods. Hon, A. H: Cengage Learning.
Zimmerman, R. D., & Darnold, T. C. (2009). The impact of job performance on
employee turnover intentions and the voluntary turnover process: A meta‐analysis and path model. Personal Review, 38(2), 142-158.
Zurn, P., Poz, M. R. D., Stilwell, B., & Adams, O. (2004). Imbalance in the health
workforce. Human Resources for Health, 2(13). doi:10.1186/1478-4491-2-13

206
APPENDICES
Appendix 1: Human Resource Management Practices and Intentions to Stay
Survey Questionnaire
Instructions:
This questionnaire has two parts (Part I & Part II). Part has five (5) sections (A,
B, C, D, E)
For close ended questions, answer by putting a tick (˅) under the rating that best
fits your perception with regards to the statement. For open ended questions,
answer in full writing. You are requested to write in the provided space.
PART I
SECTION A: Demographic information of professional health workers in public
district hospitals
1. Gender: Male ( ) Female ( )
2. Age range: Below 20 ( ) 21 -25 ( ) 26-30 ( ) 31-35 ( ) 36-40 ( )
41-45 ( ) 46-50 ( ) 51-55 ( ) 56-60 ( )…..61-65 ( )……66 and above
3. Highest level of education:
Secondary (Advanced level) (A2) ( )
University/College level (Diploma level) (A1) ( )
University level (Bachelor’s degree) (A0) ( )
University level with Master’s degree (Maitrise) ( )
University level with a PhD (Doctorat) ( )
Any other (Please specify): …………………………………………………………..
4. Area of qualification……………………………………………………………….
5. Area of work: Medical Specialist ( ) General Medical Doctor ( ) Nurse ( ) Midwife
( ) Dentist ( ) Pharmacist ( )
6. Add any other responsibility that you have (e.g., Director, Head Nurse, Matron, Head
of Department, etc): …………………………………………………………………….
6. Marital status: Single ( ) Married ( ) Divorced ( ) Separated ( ) Widowed ( )
7. How many years have you been in the health professional career?
Below 1 year ( ) 1-3 years ( ) 4-6 years ( ) 7-9 years ( ) 10 and above-
8. How many years have you been to this facility/Hospital?
Below 1 year ( ) 1-3 years ( ) 4-6 years ( ) 7-9 years ( ) 10 and above-
11. Nationality: Rwandan ( ) Non Rwandan ( )
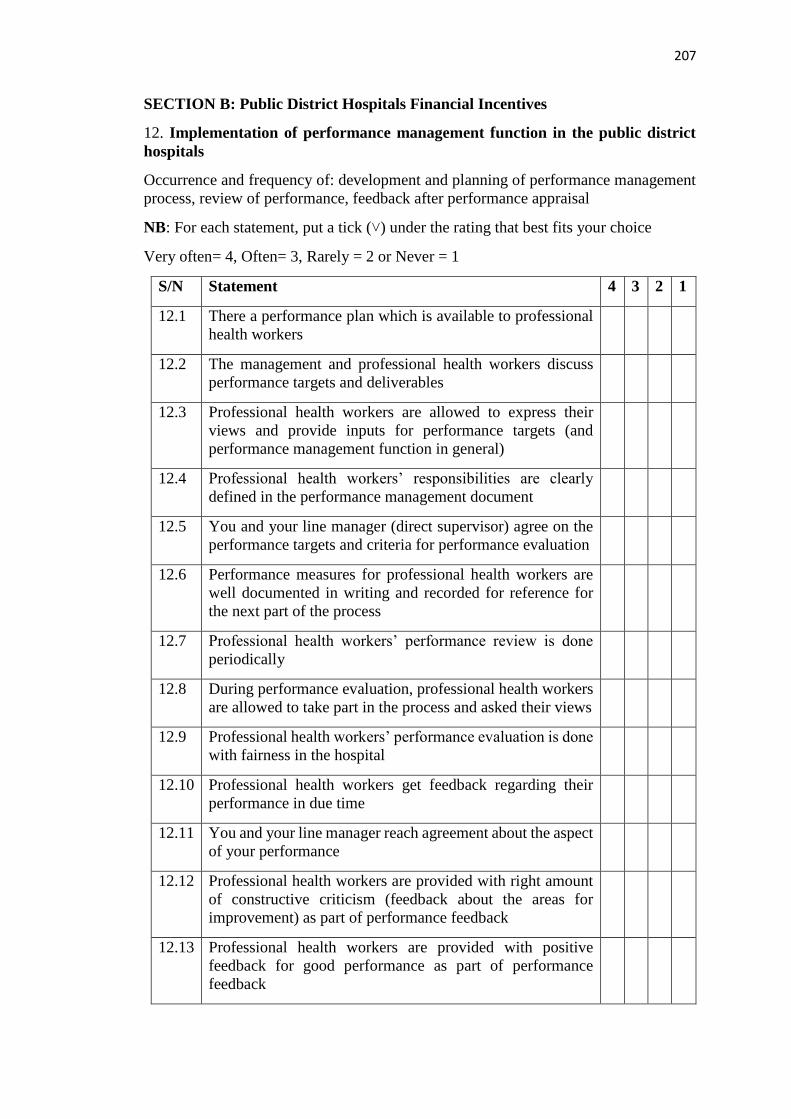
207
SECTION B: Public District Hospitals Financial Incentives
12. Implementation of performance management function in the public district
hospitals
Occurrence and frequency of: development and planning of performance management
process, review of performance, feedback after performance appraisal
NB: For each statement, put a tick (˅) under the rating that best fits your choice
Very often= 4, Often= 3, Rarely = 2 or Never = 1
S/N Statement 4 3 2 1
12.1 There a performance plan which is available to professional
health workers
12.2 The management and professional health workers discuss
performance targets and deliverables
12.3 Professional health workers are allowed to express their
views and provide inputs for performance targets (and
performance management function in general)
12.4 Professional health workers’ responsibilities are clearly
defined in the performance management document
12.5 You and your line manager (direct supervisor) agree on the
performance targets and criteria for performance evaluation
12.6 Performance measures for professional health workers are
well documented in writing and recorded for reference for
the next part of the process
12.7 Professional health workers’ performance review is done
periodically
12.8 During performance evaluation, professional health workers
are allowed to take part in the process and asked their views
12.9 Professional health workers’ performance evaluation is done
with fairness in the hospital
12.10 Professional health workers get feedback regarding their
performance in due time
12.11 You and your line manager reach agreement about the aspect
of your performance
12.12 Professional health workers are provided with right amount
of constructive criticism (feedback about the areas for
improvement) as part of performance feedback
12.13 Professional health workers are provided with positive
feedback for good performance as part of performance
feedback
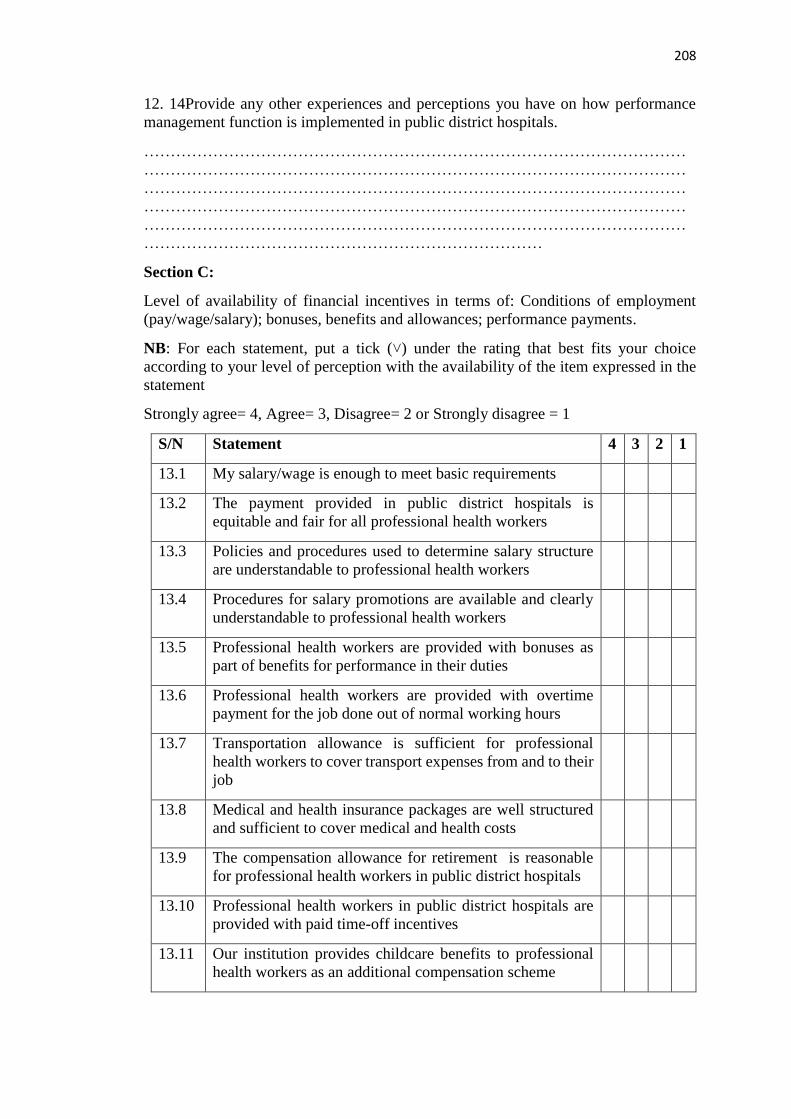
208
12. 14Provide any other experiences and perceptions you have on how performance
management function is implemented in public district hospitals.
…………………………………………………………………………………………
…………………………………………………………………………………………
…………………………………………………………………………………………
…………………………………………………………………………………………
…………………………………………………………………………………………
…………………………………………………………………
Section C:
Level of availability of financial incentives in terms of: Conditions of employment
(pay/wage/salary); bonuses, benefits and allowances; performance payments.
NB: For each statement, put a tick (˅) under the rating that best fits your choice
according to your level of perception with the availability of the item expressed in the
statement
Strongly agree= 4, Agree= 3, Disagree= 2 or Strongly disagree = 1
S/N Statement 4 3 2 1
13.1 My salary/wage is enough to meet basic requirements
13.2 The payment provided in public district hospitals is
equitable and fair for all professional health workers
13.3 Policies and procedures used to determine salary structure
are understandable to professional health workers
13.4 Procedures for salary promotions are available and clearly
understandable to professional health workers
13.5 Professional health workers are provided with bonuses as
part of benefits for performance in their duties
13.6 Professional health workers are provided with overtime
payment for the job done out of normal working hours
13.7 Transportation allowance is sufficient for professional
health workers to cover transport expenses from and to their
job
13.8 Medical and health insurance packages are well structured
and sufficient to cover medical and health costs
13.9 The compensation allowance for retirement is reasonable
for professional health workers in public district hospitals
13.10 Professional health workers in public district hospitals are
provided with paid time-off incentives
13.11 Our institution provides childcare benefits to professional
health workers as an additional compensation scheme

209
13.12 Some discounts on health services are provided to
professional health workers in our institution as an
additional compensation scheme
13.13. The hospital has performance payments schemes available
to professional health workers
13.14. Procedures for performance payments to professional health
workers are fair and equitable across staff levels
13.14 Provide any other experiences and perceptions you have on salaries and benefits
offered to professional health workers in public district hospitals.
…………………………………………………………………………………………
…………………………………………………………………………………………
…………………………………………………………………………………………
…………………………………………………………………………………………
…………………………………………………………………………………………
…………………………………………………………………
SECTION D: Non-financial incentives for professional health workers in public
district hospitals
14. Level of availability of non-financial incentives in terms of conditions of work
environment, training and development practices, and career development
NB: For each statement, put a tick (˅) under the rating that best fits your choice
according to your level of perception with the availability of the item expressed in the
statement
Strongly agree= 4, Agree= 3, Disagree= 2 or Strongly disagree = 1
Very often= 4, Often= 3, Rarely= 2 or Never = 1
S/N Statement 4 3 2 1
14.1 The workload for professional health workers in our hospital
is reasonable
14.2 Professional health workers are facilitated to have flexible
working hours
14.3 Hospital facilities (offices, wards, theatres, wash rooms…)
are in good conditions for professional health workers
14.4 Professional health workers in this hospital are provided with
enough equipment for them to be able to do the job well
14.5 There is appropriate lightning in the working places in the
hospital for me to be able to do the job well
14.6 There are mechanisms for noise reduction for better working
conditions in this hospital
14.7 There is flexibility to allow lifestyle changes in the hospital

210
14.8 Hospital management recognize work life balance principle
and I enjoy it at m y working place
14.9 There is availability of safety measures including personal
protection against risks caused by the job in this hospital
14.10 I feel that there are enough security measures for me, my
personal belongings and the work equipment provided to me
in this hospital
14.11 I feel that I am not frustrated at work because of poor
working conditions at this hospital
14.12 There is a training and development policy concerning all
professional health workers in this hospital
14.13 Professional health workers in this institution are given
opportunities to go for training and development
opportunities with fairness
14.14 Professional health workers who come from training in this
hospital are encouraged to share what they have learnt to
other colleagues
14.15 Line managers and supervisors support professional health
workers who come from training to use skills and techniques
learnt during training sessions
14.16 Training and development opportunities serve the basis for
professional health workers to be promoted and given
allowances
14.17 Hospital management and administration initiate career
development systems to support professional health workers
in developing their career
14.18 The hospital has self-assessment tools to facilitate
professional health workers to understand their own desires,
aspirations, likes and dislikes
14.19 Hospital management and administration organizes career
planning workshops to help professional health workers
learn from others’ reality in career development
14.20 Professional health workers receive individual counseling in
order to understand their own goals and to make changes in
the everyday practices, if possible
14.21 Job rotation programs and assessment centers for
professional health workers to be able to reinforce their
career development
14.22 Professional health workers are recognized for good job or
high achievement (by being congratulated in the public,
being given certificates, etc)

211
14.23 Provide any other experiences and perceptions you have on non-financial
incentives (conditions of work, training and development, career development,
recognition, etc) that are provided to professional health workers in public district
hospitals.
…………………………………………………………………………………………
…………………………………………………………………………………………
…………………………………………………………………………………………
…………………………………………………………………………………………
…………………………………………………………………………………………
…………………………………………………………………
SECTION E: Involvement and participation of professional health workers in
public district hospitals’ decision-making processes
15. Occurrence and frequency of: exposure to shared governance in the hospital,
upward problem-solving, teams for quality improvement (quality circles, cross-
functional teams, self-directed teams), collective bargaining, worker councils,
consultation for merit pay process, establishment of systems for suggestions
NB: For each statement, put a tick (˅) under the rating that best fits your choice
Very often= 4, Often= 3, Rarely= 2 or Never = 1
S/N Statement 4 3 2 1
15.1 Professional health workers are consulted for the views
aiming at solving problems which are in the hospital
15.2 Employees are consulted for views on decisions regarding
their work lives
15.3 Professional health workers are given opportunities to meet
in groups in order to identify, analyze and solve work-related
problems pertaining their job
15.4 Professional health workers from different departments are
facilitated to meet (under supervision of management) in
order to improve on the common goals (like provision of
quality of health care)
15.5 Employee are grouped in self-directed teams (without
supervision of management) for improvement on common
goal (like provision of quality of health care)
15.6 Decision from these meeting are considered by management
and administration of the hospital
15.7 Hospital management and administration provides necessary
support for self-directed teams (internal rules and
regulations, mission and vision of the hospital, policies and
procedures) for their improvement

212
15.8 Professional health workers in this hospital take part in
determination of their colleagues who should receive merit
pay
15.9 Professional health workers take part in deciding the amount
of merit pay to be given to a colleague in the case such a
practice is to happen at the hospital
15.10 Work councils for professional health workers have effective
channels to address professional health workers’ challenges
15.11 Professional health workers’ council suggestions are
understood and considered by hospital management
15.12 Work councils are considered as good organs for protection
of professional health workers’ rights
15.13. Provide any other experiences and perceptions you have on professional health
workers’ involvement and participation in the public district hospitals’ decision-making
processes
…………………………………………………………………………………………
…………………………………………………………………………………………
…………………………………………………………………………………………
…………………………………………………………………………………………
…………………………………………………………………………………………
…………………………………………………………………
Part II
Intentions to stay in the hospital
NB: For each statement, put a tick (˅) under the rating that best fits your choice
(whether you have a very high intention, high intention, low intention, or no intention
at all)
Strongly agree = 4, Agree= 3, Disagree= 2 or strongly disagree = 1
S/N Statement 4 3 2 1
1.1 I am willing to stay in this hospital for the next 5 years
1.2 I feel that I would continue to work in this hospital as long
as possible
1.4.Provide any other perceptions you have about leaving or staying at the job as a
professional health worker………………………………………………………….
………………………………………………………………………………………
………………………………………………………………………………………
………………………………………………………………………………………
………………………………………………………………………………………
………………………………………………………………………………………
………………………………………………………………………………

213
Appendix 2: Human Resource Management Practices and Intentions to Leave
Interview Guide for Professional Health Workers
I am a PhD student conducting research on Reengineering Human Resource
Management Practices towards Retention of Professional Health Workers in Public
District Hospitals in Kigali and the Western Province in Rwanda. The study interest is
to assess current existing human resource management practices in public district
hospitals and how they affect professional health workers’ intentions to leave or stay in
their working areas. I would like you to tell me about the status of human resource
management practices in the hospital where you are employed and what you feel about
continuing to work either as a professional health worker or in this hospital. I hope that
your professional experience will provide an important perspective on the questions
that I want to ask you. Could you please tell me if you have any questions in relation to
this interview before we proceed?
1. Tell me about your responsibilities as [position] at [institution].
2. How long have you been working as [current position]?
3. How do you think of financial incentives that are provide to professional health
workers in public district hospitals in terms of
a. Salary/pay/wage?
b. Bonuses?
c. Performance pay?
d. Benefits (transport allowance, hospital car, health insurance, retirement
benefit, childcare benefits, …)?
4. How can you describe non-financial incentives available in this hospital for
professional health workers in terms of
a. Conditions of work (offices, lightning, noise reduction, wards, equipment,
security,…)?
b. Training and development opportunities for professional health workers?
c. Career development?
d. Employee recognition?
5. What do you think of professional health workers’ involvement and
participation in the hospital decision-making processes?
6. How do you perceive the implementation of performance management function
in this hospital?
7. What is you general appreciation of these hospitals in this hospital? Why?
8. Do you think they would be important in the current management of
professional health workers? How?

214
PART TWO
9. Suppose that you were free to choose,
a. Would you consider staying in this hospital for long?
b. Would you consider continuing to work as professional health worker?
c. Would you continue to work in the same area?
d. Would you consider finding the job (same job) in another country?
10. Do you have anything else to add to this interview

215
Appendix 3: Focus Group Discussion Guide
(Participants have been contacted and they have been gathered in the room)
I. Introduction
Good morning everyone.
My name is Celestin Ndikumana.
I work in the College of Arts and Social Sciences of the University of Rwanda and a
PhD student at Moi University, Kenya. I am conducting research on Reengineering
Human Resource Management Practices towards Retention of Professional Health
Workers in Public District Hospitals in Kigali and the Western Province in Rwanda.
I have come with…………………………………………… who serves as the research
assistant for this study.
We thank you for agreeing to participate.
The purpose of this study is to learn about the magnitude of human resource
management practices in the public district hospitals and how these practices affect
retention of professional health workers. We hope to learn things that policy makers
and health planners in the department of health systems can use to improve management
interventions including incentives, performance management and improvement of
other working conditions in order to boost retention of professional health workers in
public hospitals in Rwanda
The information you give us is completely confidential, and we will not associate your
name with anything you say in the focus group discussion.
We would like to tape the focus groups so that we can make sure to capture the thoughts,
opinions, and ideas we hear from the group. No names will be attached to the focus
groups and the tapes will be destroyed as soon as they are transcribed.
If you have any questions now or after you have participated in the discussion, you can
always contact me or the research assistants.
Note to the moderator: Before the discussion starts, the researcher and research
assistants will check on the following
Letting participants know that the discussion group will last about one hour
Reminding the participants that we want to learn from them (positive and
negative)
Recalling that we are not trying to achieve consensus, we’re gathering
information
Bearing in mind that there is no virtue in long lists: we’re looking for priorities
Reminding participants that they can feel free to move around
To recall where the toilets and exit (if in the room) are

216
Set up ground rules (asking the group to suggest some ground rules. After they
brainstorm some, make sure the following are on the list: everyone should
participate, information provided in the focus group must be kept
confidential, stay with the group and please don’t have side conversations,
turn off cell phones if possible, have fun)
II. Discussion
(Turn on the recorder)
Well, let us get started.
1. How do you think of financial incentives that are provide to professional health
workers in public district hospitals in terms of
e. Salary/pay/wage?
f. Bonuses?
g. Performance pay?
h. Benefits (transport allowance, hospital car, health insurance, retirement
benefit, childcare benefits, …)?
2. How can you describe non-financial incentives available in this hospital for
professional health workers in terms of
e. Conditions of work (offices, lightning, noise reduction, wards, equipment,
security,…)?
f. Training and development opportunities for professional health workers?
g. Career development?
h. Employee recognition?
3. What do you think of professional health workers’ involvement and
participation in the hospital decision-making processes?
4. How do you perceive the implementation of performance management function
in this hospital?
5. What is you general appreciation of these hospitals in this hospital? Why?
6. Do you think they would be important in the current management of
professional health workers? How?
7. If you were given an opportunity to be employed elsewhere, would you consider
leaving
a. Your current job?
b. Your profession?
c. Your institution?
Why?
8. Is there anything else that you would like to add on this discussion?
Well, we have come to the end of our focus group discussion.
Thank you very much for your inputs

217
Appendix 4: Consent Form I
Consent Form
This consent form should be read and signed by all the respondents accepting to be
included in the study entitled: Reengineering Human Resource Management Practices
Towards the Retention of Professional Health Workers in Public District Hospitals in
Kigali, Rwanda.
PART A: This part deals with the general provisions of the informed consent.
Participants are requested to read and understand these provisions before signing the
form.
Introduction
My name is Celestin Ndikumana working at the College of Arts and Social Sciences-
University of Rwanda and pursuing a Doctor of Philosophy (PhD) in Human Resource
Management at Moi University, Kenya. As a partial fulfilment of the requirements for
the award of the degree, I am undertaking a study to investigate into human resource
management practices and their influence on retention of professional health workers
in public district hospitals in Kigali, Rwanda. You have been selected to take part in the
study and are therefore invited to participate in it.
Study procedures
If you agree to take part in this study, a questionnaire to fill will be given to you. The
questionnaire completion will take about fifteen minutes, but the time can be allocated
to different sessions depending on your rhythm to fill the questionnaire, and the
availability of time to you. Once filled up they will be collected by the research
assistant, sealed and delivered to the researcher.
Risks of study participation
Generally, there are no risks anticipated to cause any pain or discomfort to you during
the study. The research assistant will explain the procedures. You are free to ask any
questions, and these will be handled.
Study costs
There are no payments for respondents who will agree to take part in the study and for
the study procedures
Confidentiality
The information collected from you shall be strictly confidential and shall be kept under
lock and key. Your names or any other information that can identify you will not be
sought for to be used in this study, reports, publications or presentations. You are
assured that immediately the data is analysed and research completed all the raw data
shall be destroyed.

218
Participation information
Participation is voluntary and there are no risks at all. It is your decision to participate
or not to participate in this study. If at any time you wish to withdraw from participating
in the study, you can do so, and this will not affect any future participation or relations
with anyone or any institution.
Contacts and questions
The researcher conducting this study is Celestin Ndikumana.
You may ask any questions you have to the research assistants, or if you have any
questions later, you are encouraged to contact the researcher through mobile telephone
number: (+250)788 833975, or emails [email protected] or
We kindly appreciate you support and cooperation.

219
Appendix 5: Consent Form II
CONSENT FORM: PART B
Please read the information sheet (PART A) carefully before completing and signing
this consent form. If there are any questions you have which are not clear to you
regarding this study, please feel free to ask the research assistant prior to signing the
consent form.
Participant Statement
I,(initials only)………………………………......hereby give consent to Celestin
Ndikumana or his research assistant (by the name) ------------------------------------------
------------------------ to include me the proposed study entitled “Reengineering Human
Resource Management Practices Towards the Retention of Professional Health
Workers in Public District Hospitals in Kigali, Rwanda)”.
I have read the information concerning this study, and I fully understand the aim of the
study and what will be required of me if I accept to take part in the study. The risks and
benefits have been explained to me. Any questions I have concerning the study have
been adequately answered and I am satisfied. I understand that I can withdraw from this
study anytime if I wish to do so without giving any reason and this will not affect any
future participation or relations with anyone or any institution. I understand that I will
fill a questionnaire that will take about fifteen minutes to complete. I therefore consent
voluntarily to participate in this study.
Name of Participant or Respondent (initials only) ............................................................
Signature ........................................Date / .......................................................................
Name of the person taking consent…………………………………………
Signature /…...................................................... Date …………………….
Name of the researcher……………………………………………………
Signature ….........................................................Date ……….........................

220
Appendix 6: Map of Kigali City

221
Appendix 7: Data Collection Authorization provided by the School

222
Appendix 8: Research Clearance

223
Appendix 9: Data Collection Authorization-Hospital 1

224
Appendix 10: Data Collection Authorization-Hospital 2

225
Appendix 11: Data Collection Authorization-Hospital 3

226
Appendix 12: Normal P-P Plot of Regression Standardized Residual

227
Appendix 13: Regression Standardized residual