
Human-computer interaction - Parag Narendra Achaliya
861
ALAN DIX, JANET FINLAY, GREGORY D. ABOWD, RUSSELL BEALE THIRD EDITION HUMAN–COMPUTER INTERACTION
-
Upload
khangminh22 -
Category
Documents
-
view
1 -
download
0
Transcript of Human-computer interaction - Parag Narendra Achaliya

ALAN DIX, JANET FINLAY,GREGORY D. ABOWD, RUSSELL BEALE
THIRD EDITION
THIRDEDITION
HUMAN–COMPUTERINTERACTION
Much has changed since the first edition ofHuman–Computer Interaction was published. Ubiquitouscomputing and rich sensor-filled environments arefinding their way out of the laboratory, not just intomovies but also into our workplaces and homes. Thecomputer has broken out of its plastic and glassbounds providing us with networked societies wherepersonal computing devices from mobile phones tosmart cards fill our pockets and electronic devicessurround us at home and work. The web too has grownfrom a largely academic network into the hub ofbusiness and everyday lives. As the distinctions betweenthe physical and the digital, and between work andleisure start to break down, human–computerinteraction is also changing radically.
The excitement of these changes is captured in this newedition, which also looks forward to other emergingtechnologies. However, the book is firmly rooted instrong principles and models independent of thepassing technologies of the day: these foundations willbe the means by which today’s students willunderstand tomorrow’s technology.
The third edition of Human–Computer Interaction can beused for introductory and advanced courses on HCI,Interaction Design, Usability or Interactive SystemsDesign. It will also prove an invaluable reference forprofessionals wishing to design usable computingdevices.
Accompanying the text is a comprehensive websitecontaining a broad range of material for instructors,students and practitioners, a full text search facility forthe book, links to many sites of additional interest andmuch more: go to www.hcibook.com
Alan Dix is Professor in the Department of Computing, Lancaster, UK. Janet Finlay isProfessor in the School of Computing, Leeds Metropolitan University, UK. Gregory D. Abowd isAssociate Professor in the College of Computing and GVU Center at Georgia Tech, USA.Russell Beale is lecturer at the School of Computer Science, University ofBirmingham, UK.
Cover illustration by Peter Gudynas
New to this edition:
� A revised structure, reflecting the
growth of HCI as a discipline,
separates out basic material suitable
for introductory courses from more
detailed models and theories.
� New chapter on interaction designadds material on scenarios and basic
navigation design.
� New chapter on universal design,
substantially extending the coverage
of this material in the book.
� Updated and extended treatment of
socio/contextual issues.
� Extended and new material on novelinteraction, including updated
ubicomp material, designing
experience, physical sensors and a
new chapter on rich interaction.
� Updated material about the webincluding dynamic content.
� Relaunched website including case
studies, WAP access and search.
www.pearson-books.com
HUM
AN–CO
MPU
TERIN
TERACTION
DIXFINLAYABOWDBEALE

Human–Computer Interaction

We work with leading authors to develop the strongest educational materials in computing, bringing cutting-edge thinking and best learning practice to a global market.
Under a range of well-known imprints, including Prentice Hall, we craft high quality print and electronic publications which help readers to understand and apply their content, whether studying or at work.
To find out more about the complete range of our publishing, please visit us on the world wide web at: www.pearsoned.co.uk

Human–Computer Interaction
Third Edition
Alan Dix, Lancaster University
Janet Finlay, Leeds Metropolitan University
Gregory D. Abowd, Georgia Institute of Technology
Russell Beale, University of Birmingham

Pearson Education LimitedEdinburgh GateHarlowEssex CM20 2JEEngland
and Associated Companies throughout the world
Visit us on the world wide web at:www.pearsoned.co.uk
First published 1993Second edition published 1998Third edition published 2004
© Prentice-Hall Europe 1993, 1998© Pearson Education Limited 2004
The rights of Alan Dix, Janet E. Finlay, Gregory D. Abowd and Russell Beale to be identified as authors of this work have been asserted by them in accordance with the Copyright, Designs and Patents Act 1988.
All rights reserved. No part of this publication may be reproduced, stored in a retrieval system, or transmitted in any form or by any means, electronic,mechanical, photocopying, recording or otherwise, without either the prior written permission of the publisher or a licence permitting restricted copying in the United Kingdom issued by the Copyright Licensing Agency Ltd, 90 Tottenham Court Road, London W1T 4LP.
All trademarks used herein are the property of their respective owners. The use of any trademark in this text does not vest in the author or publisher any trademarkownership rights in such trademarks, nor does the use of such trademarks imply anyaffiliation with or endorsement of this book by such owners.
ISBN-13: 978-0-13-046109-4ISBN-10: 0-13-046109-1
British Library Cataloguing-in-Publication DataA catalogue record for this book is available from the British Library
10 9 8 7 6 5 4 310 09 08 07 06
Typeset in 10/121/2pt Minion by 35Printed and bound by Scotprint, Haddington
BRIEF CONTENTS
Guided tour xivForeword xviPreface to the third edition xixPublisher’s acknowledgements xxiiiIntroduction 1
FOUNDATIONS 9
Chapter 1 The human 11Chapter 2 The computer 59Chapter 3 The interaction 123Chapter 4 Paradigms 164
DESIGN PROCESS 189
Chapter 5 Interaction design basics 191Chapter 6 HCI in the software process 225Chapter 7 Design rules 258Chapter 8 Implementation support 289Chapter 9 Evaluation techniques 318Chapter 10 Universal design 365Chapter 11 User support 395
MODELS AND THEORIES 417
Chapter 12 Cognitive models 419Chapter 13 Socio-organizational issues and stakeholder requirements 450
Part 3
Part 2
Part 1

vi Brief Contents
Chapter 14 Communication and collaboratio0n models 475Chapter 15 Task analysis 510Chapter 16 Dialog notations and design 544Chapter 17 Models of the system 594Chapter 18 Modeling rich interaction 629
OUTSIDE THE BOX 661
Chapter 19 Groupware 663Chapter 20 Ubiquitous computing and augmented realities 716Chapter 21 Hypertext, multimedia and the world wide web 748
References 791Index 817
Part 4

CONTENTS
Guided tour xivForeword xviPreface to the third edition xixPublisher’s acknowledgements xxiiiIntroduction 1
FOUNDATIONS 9
Chapter 1 The human 11
1.1 Introduction 121.2 Input–output channels 13
Design Focus: Getting noticed 16Design Focus: Where’s the middle? 22
1.3 Human memory 27Design Focus: Cashing in 30Design Focus: 7 ± 2 revisited 32
1.4 Thinking: reasoning and problem solving 39Design Focus: Human error and false memories 49
1.5 Emotion 511.6 Individual differences 521.7 Psychology and the design of interactive systems 531.8 Summary 55
Exercises 56Recommended reading 57
Chapter 2 The computer 59
2.1 Introduction 602.2 Text entry devices 63
Design Focus: Numeric keypads 672.3 Positioning, pointing and drawing 71
Part 1
viii Contents
2.4 Display devices 78Design Focus: Hermes: a situated display 86
2.5 Devices for virtual reality and 3D interaction 872.6 Physical controls, sensors and special devices 91
Design Focus: Feeling the road 94Design Focus: Smart-Its – making using sensors easy 96
2.7 Paper: printing and scanning 97Design Focus: Readability of text 101
2.8 Memory 1072.9 Processing and networks 114
Design Focus: The myth of the infinitely fast machine 1162.10 Summary 120
Exercises 121Recommended reading 122
Chapter 3 The interaction 123
3.1 Introduction 1243.2 Models of interaction 124
Design Focus: Video recorder 1303.3 Frameworks and HCI 1303.4 Ergonomics 131
Design Focus: Industrial interfaces 1333.5 Interaction styles 136
Design Focus: Navigation in 3D and 2D 1443.6 Elements of the WIMP interface 145
Design Focus: Learning toolbars 1513.7 Interactivity 1523.8 The context of the interaction 154
Design Focus: Half the picture? 1553.9 Experience, engagement and fun 156
3.10 Summary 160Exercises 161Recommended reading 162
Chapter 4 Paradigms 164
4.1 Introduction 1654.2 Paradigms for interaction 1654.3 Summary 185
Exercises 186Recommended reading 187
Contents ix
DESIGN PROCESS 189
Chapter 5 Interaction design basics 191
5.1 Introduction 1925.2 What is design? 1935.3 The process of design 1955.4 User focus 197
Design Focus: Cultural probes 2005.5 Scenarios 2015.6 Navigation design 203
Design Focus: Beware the big button trap 206Design Focus: Modes 207
5.7 Screen design and layout 211Design Focus: Alignment and layout matter 214Design Focus: Checking screen colors 219
5.8 Iteration and prototyping 2205.9 Summary 222
Exercises 223Recommended reading 224
Chapter 6 HCI in the software process 225
6.1 Introduction 2266.2 The software life cycle 2266.3 Usability engineering 2376.4 Iterative design and prototyping 241
Design Focus: Prototyping in practice 2456.5 Design rationale 2486.6 Summary 256
Exercises 257Recommended reading 257
Chapter 7 Design rules 258
7.1 Introduction 2597.2 Principles to support usability 2607.3 Standards 2757.4 Guidelines 2777.5 Golden rules and heuristics 2827.6 HCI patterns 2847.7 Summary 286
Exercises 287Recommended reading 288
Part 2

x Contents
Chapter 8 Implementation support 289
8.1 Introduction 2908.2 Elements of windowing systems 2918.3 Programming the application 296
Design Focus: Going with the grain 3018.4 Using toolkits 302
Design Focus: Java and AWT 3048.5 User interface management systems 3068.6 Summary 313
Exercises 314Recommended reading 316
Chapter 9 Evaluation techniques 318
9.1 What is evaluation? 3199.2 Goals of evaluation 3199.3 Evaluation through expert analysis 3209.4 Evaluation through user participation 3279.5 Choosing an evaluation method 3579.6 Summary 362
Exercises 363Recommended reading 364
Chapter 10 Universal design 365
10.1 Introduction 36610.2 Universal design principles 36610.3 Multi-modal interaction 368
Design Focus: Designing websites for screen readers 374Design Focus: Choosing the right kind of speech 375Design Focus: Apple Newton 381
10.4 Designing for diversity 384Design Focus: Mathematics for the blind 386
10.5 Summary 393Exercises 393Recommended reading 394
Chapter 11 User support 395
11.1 Introduction 39611.2 Requirements of user support 39711.3 Approaches to user support 39911.4 Adaptive help systems 404
Design Focus: It’s good to talk – help from real people 40511.5 Designing user support systems 41211.6 Summary 414
Exercises 415Recommended reading 416

Contents xi
MODELS AND THEORIES 417
Chapter 12 Cognitive models 419
12.1 Introduction 42012.2 Goal and task hierarchies 421
Design Focus: GOMS saves money 42412.3 Linguistic models 43012.4 The challenge of display-based systems 43412.5 Physical and device models 43612.6 Cognitive architectures 44312.7 Summary 447
Exercises 448Recommended reading 448
Chapter 13 Socio-organizational issues and stakeholder requirements 450
13.1 Introduction 45113.2 Organizational issues 451
Design Focus: Implementing workflow in Lotus Notes 45713.3 Capturing requirements 458
Design Focus: Tomorrow’s hospital – using participatory design 46813.4 Summary 472
Exercises 473Recommended reading 474
Chapter 14 Communication and collaboration models 475
14.1 Introduction 47614.2 Face-to-face communication 476
Design Focus: Looking real – Avatar Conference 48114.3 Conversation 48314.4 Text-based communication 49514.5 Group working 50414.6 Summary 507
Exercises 508Recommended reading 509
Chapter 15 Task analysis 510
15.1 Introduction 51115.2 Differences between task analysis and other techniques 51115.3 Task decomposition 51215.4 Knowledge-based analysis 51915.5 Entity–relationship-based techniques 52515.6 Sources of information and data collection 53215.7 Uses of task analysis 538
Part 3

xii Contents
15.8 Summary 541Exercises 542Recommended reading 543
Chapter 16 Dialog notations and design 544
16.1 What is dialog? 54516.2 Dialog design notations 54716.3 Diagrammatic notations 548
Design Focus: Using STNs in prototyping 551Design Focus: Digital watch – documentation and analysis 563
16.4 Textual dialog notations 56516.5 Dialog semantics 57316.6 Dialog analysis and design 58216.7 Summary 589
Exercises 591Recommended reading 592
Chapter 17 Models of the system 594
17.1 Introduction 59517.2 Standard formalisms 59517.3 Interaction models 60817.4 Continuous behavior 61817.5 Summary 624
Exercises 625Recommended reading 627
Chapter 18 Modeling rich interaction 629
18.1 Introduction 63018.2 Status–event analysis 63118.3 Rich contexts 63918.4 Low intention and sensor-based interaction 649
Design Focus: Designing a car courtesy light 65518.5 Summary 657
Exercises 658Recommended reading 659
OUTSIDE THE BOX 661
Chapter 19 Groupware 663
19.1 Introduction 66419.2 Groupware systems 664
Part 4
Contents xiii
19.3 Computer-mediated communication 667Design Focus: SMS in action 673
19.4 Meeting and decision support systems 67919.5 Shared applications and artifacts 68519.6 Frameworks for groupware 691
Design Focus: TOWER – workspace awareness 70119.7 Implementing synchronous groupware 70219.8 Summary 713
Exercises 714Recommended reading 715
Chapter 20 Ubiquitous computing and augmented realities 716
20.1 Introduction 71720.2 Ubiquitous computing applications research 717
Design Focus: Ambient Wood – augmenting the physical 723Design Focus: Classroom 2000/eClass – deploying and evaluating ubicomp 727Design Focus: Shared experience 732
20.3 Virtual and augmented reality 733Design Focus: Applications of augmented reality 737
20.4 Information and data visualization 738Design Focus: Getting the size right 740
20.5 Summary 745Exercises 746Recommended reading 746
Chapter 21 Hypertext, multimedia and the world wide web 748
21.1 Introduction 74921.2 Understanding hypertext 74921.3 Finding things 76121.4 Web technology and issues 76821.5 Static web content 77121.6 Dynamic web content 77821.7 Summary 787
Exercises 788Recommended reading 788
References 791Index 817

xiv Guided tour
DESIGN PROCESS
In this part, we concentrate on how design practiceaddresses the critical feature of an interactive system –usability from the human perspective. The chapters in this part promote the purposeful design of more usableinteractive systems. We begin in Chapter 5 by introducingthe key elements in the interaction design process. Theseelements are then expanded in later chapters.
Chapter 6 discusses the design process in more detail,specifically focussing on the place of user-centered designwithin a software engineering framework. Chapter 7 high-lights the range of design rules that can help us to specifyusable interactive systems, including abstract principles,guidelines and other design representations.
In Chapter 8, we provide an overview of implementa-tion support for the programmer of an interactive system.Chapter 9 is concerned with the techniques used to evalu-ate the interactive system to see if it satisfies user needs.Chapter 10 discusses how to design a system to be univer-sally accessible, regardless of age, gender, cultural backgroundor ability. In Chapter 11 we discuss the provision of usersupport in the form of help systems and documentation.
P A R T
2 MODELING RICH
INTERACTION
OV E RV I E W
We operate within an ecology of people, physical artifactsand electronic systems, and this rich ecology has recentlybecome more complex as electronic devices invade theworkplace and our day-to-day lives. We need methods to deal with these rich interactions.
n Status–event analysis is a semi-formal, easy to applytechnique that:– classifies phenomena as event or status– embodies naïve psychology– highlights feedback problems in interfaces.
n Aspects of rich environments can be incorporated intomethods such as task analysis:– other people– information requirements– triggers for tasks– modeling artifacts– placeholders in task sequences.
n New sensor-based systems do not require explicitinteraction; this means:– new cognitive and interaction models– new design methods– new system architectures.
18
19.3 Computer-mediated communication 675
CuSeeMe
Special-purpose video conferencing is still relatively expensive, but low-fidelity desktopvideo conferencing is now within the reach of many users of desktop computers. Digital video cameras are now inexpensive and easily obtainable. They often come with pre-packaged videophone or video conferencing software. However, the system which has really popularized video conferencing is a web-based tool. CuSeeMe works over the internet allowing participantsacross the world owning only a basic digital video camera to see and talk to one another. The soft-ware is usually public domain (although there are commercial versions) and the services allowingconnection are often free. The limited bandwidth available over long-distance internet links meansthat video quality and frame rates are low and periodic image break-up may occur. In fact, it issound break-up which is more problematic. After all, we can talk to one another quite easily with-out seeing one another, but find it very difficult over a noisy phone line. Often participants maysee one another’s video image, but actually discuss using a synchronous text-based ‘talk’ program.
CuSeeMe – video conferencing on the internet. Source: Courtesy of Geoff Ellis
440 Chapter 12 n Cognitive models
Worked exercise Do a keystroke-level analysis for opening up an application in a visual desktop interface usinga mouse as the pointing device, comparing at least two different methods for performing thetask. Repeat the exercise using a trackball. Consider how the analysis would differ for variouspositions of the trackball relative to the keyboard and for other pointing devices.
Answer We provide a keystroke-level analysis for three different methods for launching anapplication on a visual desktop. These methods are analyzed for a conventional one-button mouse, a trackball mounted away from the keyboard and one mounted close tothe keyboard. The main distinction between the two trackballs is that the second onedoes not require an explicit repositioning of the hands, that is there is no time requiredfor homing the hands between the pointing device and the keyboard.
Method 1 Double clicking on application icon
Steps Operator Mouse Trackball1 Trackball2
1. Move hand to mouse H[mouse] 0.400 0.400 0.0002. Mouse to icon P[to icon] 0.664 1.113 1.1133. Double click 2B[click] 0.400 0.400 0.4004. Return to keyboard H[kbd] 0.400 0.400 0.000Total times 1.864 2.313 1.513
Method 2 Using an accelerator key
Steps Operator Mouse Trackball1 Trackball2
1. Move hand to mouse H[mouse] 0.400 0.400 0.0002. Mouse to icon P[to icon] 0.664 1.113 1.1133. Click to select B[click] 0.200 0.200 0.2004. Pause M 1.350 1.350 1.3505. Return to keyboard H[kbd] 0.400 0.400 0.0006. Press accelerator K 0.200 0.200 0.200Total times 3.214 3.663 2.763
Method 3 Using a menu
Steps Operator Mouse Trackball1 Trackball2
1. Move hand to mouse H[mouse] 0.400 0.400 0.0002. Mouse to icon P[to icon] 0.664 1.113 1.1133. Click to select B[click] 0.200 0.200 0.2004. Pause M 1.350 1.350 1.3505. Mouse to file menu P 0.664 1.113 1.1136. Pop-up menu B[down] 0.100 0.100 0.1007. Drag to open P[drag] 0.713 1.248 1.2488. Release mouse B[up] 0.100 0.100 0.1009. Return to keyboard H[kbd] 0.400 0.400 0.000Total times 4.591 6.024 5.224
The part structure separates out introductory and moreadvanced material, with each part opener giving a simpledescription of what its constituent chapters cover
Bullet points at the start of each chapter highlight thecore coverage
Worked exercises within chapters provide step-by-stepguidelines to demonstrate problem-solving techniques
Boxed asides contain descriptions of particular tasks ortechnologies for additional interest, experimentationand discussion
Guided tour xv
732 Chapter 20 n Ubiquitous computing and augmented realities
within these environments. Much of our understanding of work has developed fromFordist and Taylorist principles on the structuring of activities and tasks. Evaluationwithin HCI reflects these roots and is often predicated on notions of task and themeasurement of performance and efficiency in meeting these goals and tasks.
However, it is not clear that these measures can apply universally across activitieswhen we move away from structured and paid work to other activities. For example,
DESIGN FOCUS
Shared experience
You are in the Mackintosh Interpretation Centre in an arts center in Glasgow, Scotland. You notice aman wearing black wandering around looking at the exhibits and then occasionally at a small PDA he isholding. As you get closer he appears to be talking to himself, but then you realize he is simply talkinginto a head-mounted microphone. ‘Some people can never stop using their mobile phone’, you think.As you are looking at one exhibit, he comes across and suddenly cranes forward to look more closely,getting right in front of you. ‘How rude’, you think.
The visitor is taking part in the City project – a mixed-reality experience. He is talking to two otherpeople at remote sites, one who has a desktop VR view of the exhibition and the other just a website.However, they can all see representations of each other. The visitor is being tracked by ultrasound andhe appears in the VR world. Also, the web user’s current page locates her in a particular part of thevirtual exhibition. All of the users see a map of the exhibitiion showing where they all are.
You might think that in such an experiment the person actually in the museum would take the lead, butin fact real groups using this system seemed to have equal roles and really had a sense of shared experi-ence despite their very different means of seeing the exhibition.
See the book website for a full case study: /e3/casestudy/city/
City project: physical presence, VR interfaces and web interface. Source: Courtesy of Matthew Chalmers, note: City is an Equator project
Recommended reading 509
RECOMMENDED READING
J. Carroll, editor, HCI Models, Theories, and Frameworks: Toward an InterdisciplinaryScience, Morgan Kaufmann, 2003.See chapters by Perry on distributed cognition, Monk on common ground andKraut on social psychology.
L. A. Suchman, Plans and Situated Actions: The Problem of Human–MachineCommunication, Cambridge University Press, 1987.This book popularized ethnography within HCI. It puts forward the viewpointthat most actions are not pre-planned, but situated within the context in whichthey occur. The principal domain of the book is the design of help for a photo-copier. This is itself a single-user task, but the methodology applied is based onboth ethnographic and conversational analysis. The book includes several chap-ters discussing the contextual nature of language and analysis of conversationtranscripts.
T. Winograd and F. Flores, Understanding Computers and Cognition: A NewFoundation for Design, Addison-Wesley, 1986.Like Suchman, this book emphasizes the contextual nature of language and theweakness of traditional artificial intelligence research. It includes an account ofspeech act theory as applied to Coordinator. Many people disagree with theauthors’ use of speech act theory, but, whether by application or reaction, thiswork has been highly influential.
S. Greenberg, editor, Computer-supported Cooperative Work and Groupware,Academic Press, 1991.The contents of this collection originally made up two special issues of theInternational Journal of Man–Machine Studies. In addition, the book containsGreenberg’s extensive annotated bibliography of CSCW, a major entry point forany research into the field. Updated versions of the bibliography can be obtainedfrom the Department of Computer Science, University of Calgary, Calgary,Alberta, Canada.
Communications of the ACM, Vol. 34, No. 12, special issue on ‘collaborative com-puting’, December 1991.
Several issues of the journal Interacting with Computers from late 1992 through early1993 have a special emphasis on CSCW.
Computer-Supported Cooperative Work is a journal dedicated to CSCW. See also backissues of the journal Collaborative Computing. This ran independently for a while,but has now merged with Computer-Supported Cooperative Work.
See also the recommended reading list for Chapter 19, especially the conference proceedings.
Exercises 393
SUMMARY
Universal design is about designing systems that are accessible by all users in all circumstances, taking account of human diversity in disabilities, age and culture.Universal design helps everyone – for example, designing a system so that it can beused by someone who is deaf or hard of hearing will benefit other people working innoisy environments or without audio facilities. Designing to be accessible to screen-reading systems will make websites better for mobile users and older browsers.
Multi-modal systems provide access to system information and functionalitythrough a range of different input and output channels, exploiting redundancy. Such systems will enable users with sensory, physical or cognitive impairments tomake use of the channels that they can use most effectively. But all users benefit from multi-modal systems that utilize more of our senses in an involving interactiveexperience.
For any design choice we should ask ourselves whether our decision is excludingsomeone and whether there are any potential confusions or misunderstandings inour choice.
10.5
EXERCISES
10.1 Is multi-modality always a good thing? Justify your answer.
10.2 What are (i) auditory icons and (ii) earcons? How can they be used to benefit both visuallyimpaired and sighted users?
10.3 Research your country’s legislation relating to accessibility of technology for disabled people.What are the implications of this to your future career in computing?
10.4 Take your university website or another site of your choice and assess it for accessibility usingBobby. How would you recommend improving the site?
10.5 How could systems be made more accessible to older users?
10.6 Interview either (i) a person you know over 65 or (ii) a child you know under 16 about their experience, attitude and expectations of computers. What factors would you take into account if you were designing a website aimed at this person?
10.7 Use the screen reader simulation available at www.webaim.org/simulations/screenreader to experience something of what it is like to access the web using a screen reader. Can you find the answers to the test questions on the site?
Annotated further reading encourages readers toresearch topics in depth
Design Focus mini case studies highlight practicalapplications of HCI concepts
Frequent links to thebook website forfurther information
Chapter summaries reinforce student learning.Exercises at the end of chapters can be used byteachers or individuals to test understanding

FOREWORD
Human–computer interaction is a difficult endeavor with glorious rewards.Designing interactive computer systems to be effective, efficient, easy, and enjoyable touse is important, so that people and society may realize the benefits of computation-based devices. The subtle weave of constraints and their trade-offs – human,machine, algorithmic, task, social, aesthetic, and economic – generates the difficulty.The reward is the creation of digital libraries where scholars can find and turn thepages of virtual medieval manuscripts thousands of miles away; medical instrumentsthat allow a surgical team to conceptualize, locate, and monitor a complex neuro-surgical operation; virtual worlds for entertainment and social interaction, respon-sive and efficient government services, from online license renewal to the analysis of parliamentary testimony; or smart telephones that know where they are and under-stand limited speech. Interaction designers create interaction in virtual worlds andembed interaction in physical worlds.
Human–computer interaction is a specialty in many fields, and is therefore multi-disciplinary, but it has an intrinsic relationship as a subfield to computer science.Most interactive computing systems are for some human purpose and interact withhumans in human contexts. The notion that computer science is the study of algo-rithms has virtue as an attempt to bring foundational rigor, but can lead to ignoringconstraints foundational to the design of successful interactive computer systems. A lesson repeatedly learned in engineering is that a major source of failure is the narrow optimization of a design that does not take sufficient account of contextualfactors. Human users and their contexts are major components of the design problem that cannot be wished away simply because they are complex to address. Infact, that largest part of program code in most interactive systems deals with userinteraction. Inadequate attention to users and task context not only leads to bad userinterfaces, it puts entire systems at risk.
The problem is how to take into account the human and contextual part of a sys-tem with anything like the rigor with which other parts of the system are understoodand designed – how to go beyond fuzzy platitudes like ‘know the user’ that are true,but do not give a method for doing or a test for having done. This is difficult to do,but inescapable, and, in fact, capable of progress. Over the years, the need to takeinto account human aspects of technical systems has led to the creation of new fieldsof study: applied psychology, industrial engineering, ergonomics, human factors,
Foreword xvii
man–machine systems. Human–computer interaction is the latest of these, morecomplex in some ways because of the breadth of user populations and applications,the reach into cognitive and social constraints, and the emphasis on interaction. Theexperiences with other human-technical disciplines lead to a set of conclusions abouthow a discipline of human–computer interaction should be organized if it is to besuccessful.
First, design is where the action is. An effective discipline of human–computerinteraction cannot be based largely on ‘usability analysis’, important though thatmay be. Usability analysis happens too late; there are too few degrees of freedom; andmost importantly, it is not generative. Design thrives on understanding constraints,on insight into the design space, and on deep knowledge of the materials of thedesign, that is, the user, the task, and the machine. The classic landmark designs inhuman–computer interaction, such as the Xerox Star and the Apple Lisa/Macintosh,were not created from usability analysis (although usability analysis had importantroles), but by generative principles for their designs by user interface designers whohad control of the design and implementation.
Second, although the notion of ‘user-centered design’ gets much press, we shouldreally be emphasizing ‘task-centered design’. Understanding the purpose and con-text of a system is key to allocating functions between people and machines and todesigning their interaction. It is only in deciding what a human–machine systemshould do and the constraints on this goal that the human and technical issues canbe resolved. The need for task-centered design brings forward the need for methodsof task analysis as a central part of system design.
Third, human–computer interaction needs to be structured to include both analytic and implementation methods together in the same discipline and taughttogether as part of the core. Practitioners of the discipline who can only evaluate, butnot design and build are under a handicap. Builders who cannot reason analyticallyabout the systems they build or who do not understand the human information pro-cessing or social contexts of their designs are under a handicap. Of course, there willbe specialists in one or another part of human–computer interaction, but for thereto be a successful field, there must be a common core.
Finally, what makes a discipline is a set of methods for doing something. A fieldmust have results that can be taught and used by people other than their originatorsto do something. Historically, a field naturally evolves from a set of point results toa set of techniques to a set of facts, general abstractions, methods, and theories. Infact, for a field to be cumulative, there must be compaction of knowledge by crunch-ing the results down into methods and theories; otherwise the field becomes fad-driven and a collection of an almost unteachably large set of weak results. The mostuseful methods and theories are generative theories: from some task analysis it ispossible to compute some insightful property that constrains the design space of asystem. In a formula: task analysis, approximation, and calculation. For example, we can predict that if a graphics system cannot update the display faster than 10times/second then the illusion of animation will begin to break down. This con-straint worked backwards has architectural implications for how to guarantee theneeded display rate under variable computational load. It can be designed against.
xviii Foreword
This textbook, by Alan Dix, Janet Finlay, Gregory Abowd, and Russell Beale, represents how far human–computer interaction has come in developing and organizing technical results for the design and understanding of interactive systems. Remarkably, by the light of their text, it is pretty far, satisfying all the just-enumerated conclusions. This book makes an argument that by now there are manyteachable results in human–computer interaction by weight alone! It makes an argu-ment that these results form a cumulative discipline by its structure, with sectionsthat organize the results systematically, characterizing human, machine, interaction,and the design process. There are analytic models, but also code implementation examples. It is no surprise that methods of task analysis play a prominent role in the text as do theories to help in the design of the interaction. Usability evaluationmethods are integrated in their proper niche within the larger framework.
In short, the codification of the field of human–computer interaction in this text is now starting to look like other subfields of computer science. Students bystudying the text can learn how to understand and build interactive systems.Human–computer interaction as represented by the text fits together with otherparts of computer science. Moreover, human–computer interaction as presented isa challenge problem for advancing theory in cognitive science, design, business, orsocial-technical systems. Given where the field was just a few short years ago, the creation of this text is a monumental achievement. The way is open to reap the glorious rewards of interactive systems through a markedly less difficult endeavor,both for designer and for user.
Stuart K. CardPalo Alto Research Center, Palo Alto, California
PREFACE TO THE THIRD EDITION
It is ten years since the first edition of this book was published and much haschanged. Ubiquitous computing and rich sensor-filled environments are findingtheir way out of the laboratory, not just into films and fiction, but also into ourworkplaces and homes. Now the computer really has broken its bounds of plasticand glass: we live in networked societies where personal computing devices frommobile phones to smart cards fill our pockets, and electronic devices surround us athome and at work. The web too has grown from a largely academic network into thehub of business and everyday lives. As the distinctions between physical and digital,work and leisure start to break down, human–computer interaction is also radicallychanging.
We have tried to capture some of the excitement of these changes in this revisededition, including issues of physical devices in Chapters 2 and 3, discussion of web interfaces in Chapter 21, ubiquitous computing in Chapters 4 and 20, and newmodels and paradigms for interaction in these new environments in Chapters 17 and18. We have reflected aspects of the shift in use of technology from work to leisurein the analysis of user experience in Chapter 3, and in several of the boxed examplesand case studies in the text. This new edition of Human–Computer Interaction is notjust tracking these changes but looking ahead at emerging areas.
However, it is also rooted in strong principles and models that are not dependenton the passing technologies of the day. We are excited both by the challenges of thenew and by the established foundations, as it is these foundations that will be themeans by which today’s students understand tomorrow’s technology. So we make noapology for continuing the focus of previous editions on the theoretical and con-ceptual models that underpin our discipline. As the use of technology has changed,these models have expanded. In particular, the insular individual focus of early work is increasingly giving way to include the social and physical context. This isreflected in the expanded treatment of social and organizational analysis, includingethnography, in Chapter 13, and the analysis of artifacts in the physical environmentin Chapter 18.
xx Preface to the third edition
STRUCTURE
The structure of the new edition has been completely revised. This in part reflects thegrowth of the area: ten years ago HCI was as often as not a minority optional sub-ject, and the original edition was written to capture the core material for a standardcourse. Today HCI is much expanded: some areas (like CSCW) are fully fledged dis-ciplines in their own right, and HCI is studied from a range of perspectives and atdifferent levels of detail. We have therefore separated basic material suitable for intro-ductory courses into the first two parts, including a new chapter on interactiondesign, which adds new material on scenarios and navigation design and provides anoverview suitable for a first course. In addition, we have included a new chapter onuniversal design, to reflect the growing emphasis on design that is inclusive of all,regardless of ability, age or cultural background. More advanced material focussingon different HCI models and theories is presented in Part 3, with extended cover-age of social and contextual models and rich interaction. It is intended that these sections will be suitable for more advanced HCI courses at undergraduate and postgraduate level, as well as for researchers new to the field. Detailed coverage of theparticular domains of web applications, ubiquitous computing and CSCW is givenin Part 4.
New to this edition is a full color plate section. Images flagged with a camera iconin the text can be found in color in the plate section.
WEBSITE AND SUPPORT MATERIALS
We have always believed that support materials are an essential part of a textbook ofthis kind. These are designed to supplement and enhance the printed book – phys-ical and digital integration in practice. Since the first edition we have had exercises, mini-case studies and presentation slides for all chapters available electronically. For the second edition these were incorporated into a website including links and an online search facility that acts as an exhaustive index to the book and mini-encyclopedia of HCI. For visually disabled readers, access to a full online electronictext has also been available. The website is continuing to develop, and for the thirdedition provides all these features plus more, including WAP search, multi-choicequestions, and extended case study material (see also color plate section). We will usethe book website to bring you new exercises, information and other things, so dovisit us at www.hcibook.com (also available via www.booksites.net/dix). Throughoutthe book you will find shorthand web references of the form /e3/a-page-url/. Justprepend http://www.hcibook.com to find further information. To assist users of thesecond edition, a mapping between the structures of the old and new editions isavailable on the web at: http://www.hcibook.com/e3/contents/map2e/
Preface to the third edition xxi
STYLISTIC CONVENTION
As with all books, we have had to make some global decisions regarding style and terminology. Specifically, in a book in which the central characters are ‘the user’ and ‘the designer’, it is difficult to avoid the singular pronoun. We therefore use thepronoun ‘he’ when discussing the user and ‘she’ when referring to the designer. Inother cases we use ‘she’ as a generic term. This should not be taken to imply anythingabout the composition of any actual population.
Similarly, we have adopted the convention of referring to the field of ‘Human–Computer Interaction’ and the notion of ‘human–computer interaction’. In manycases we will also use the abbreviation HCI.
ACKNOWLEDGEMENTS
In a book of this size, written by multiple authors, there will always be myriad people behind the scenes who have aided, supported and abetted our efforts. Wewould like to thank all those who provided information, pictures and software thathave enhanced the quality of the final product. In particular, we are indebted toWendy Mackay for the photograph of EVA; Wendy Hall and her colleagues at theUniversity of Southampton for the screen shot of Microcosm; Saul Greenberg for the reactive keyboard; Alistair Edwards for Soundtrack; Christina Engelbart for thephotographs of the early chord keyset and mouse; Geoff Ellis for the screen shot ofDevina and himself using CuSeeMe; Steve Benford for images of the Internet Foyer;and Tony Renshaw who provided photographs of the eye tracking equipment.Thanks too to Simon Shum for information on design rationale, Robert Ward whogave us material on psycho-physiology, and Elizabeth Mynatt and Tom Rodden whoworked with Gregory on material adapted in Chapter 20. Several of the boxed casestudies are based on the work of multi-institution projects, and we are grateful to all those from the project teams of CASCO, thePooch SMART-ITS, TOWER,AVATAR-Conference and TEAM-HOS for boxes and case studies based on theirwork; and also to the EQUATOR project from which we drew material for the boxeson cultural probes, ‘Ambient Wood’ and ‘City’. We would also like to thank all thereviewers and survey respondents whose feedback helped us to select our subjectmatter and improve our coverage; and our colleagues at our respective institutionsand beyond who offered insight, encouragement and tolerance throughout the revi-sion. We are indebted to all those who have contributed to the production process at Pearson Education and elsewhere, especially Keith Mansfield, Anita Atkinson,Lynette Miller, Sheila Chatten and Robert Chaundy.
Personal thanks must go to Fiona, Esther, Miriam, Rachel, Tina, Meghan, Aidanand Blaise, who have all endured ‘The Book’ well beyond the call of duty and over

xxii Preface to the third edition
many years, and Bruno and ‘the girls’ who continue to make their own inimitablecontribution.
Finally we all owe huge thanks to Fiona for her continued deep personal supportand for tireless proofreading, checking of figures, and keeping us all moving. Wewould never have got beyond the first edition without her.
The efforts of all of these have meant that the book is better than it would other-wise have been. Where it could still be better, we take full responsibility.

PUBLISHER’S ACKNOWLEDGEMENTS
We are grateful to the following for permission to reproduce copyright material:
Figure p. 2, Figures 3.14, 3.15, 3.16 and 5.13 and Exercise 8.4 screen shots reprintedby permission from Apple Computer, Inc.; Figure 2.11 reprinted by permission ofKeith Cheverst; Figure 3.13 from The WebBook and Web Forager: An informationworkspace for the world-wide web in CHI Conference Proceedings, © 1996 ACM, Inc.,reprinted by permission (Card, S. K., Robertson, G. G. and York, W. 1996); Figures3.9, 3.19, 5.5, Chapter 14, Design Focus: Looking real – Avatar Conference screenshots, Figures 21.3, 21.10, 21.11 screen shot frames reprinted by permission fromMicrosoft Corporation; Tables 6.2 and 6.3 adapted from Usability engineering: ourexperience and evolution in Handbook for Human–Computer Interaction edited byM. Helander, Copyright 1988, with permission from Elsevier (Whiteside, J., Bennett,J. and Hotzblatt, K. 1988); Figure 7.1 adapted from The alternate reality kit – an animated environment for creating interactive simulations in Proceedings ofWorkshop on Visual Languages, © 1986 IEEE, reprinted by permission of IEEE(Smith, R. B. 1986); Figure 7.2 from Guidelines for designing user interface softwarein MITRE Corporation Report MTR-9420, reprinted by permission of The MITRECorporation (Smith, S. L. and Mosier, J. N. 1986); Figure 7.3 reprinted by permis-sion of Jenifer Tidwell; Figures 8.6 and 8.9 from Xview Programming Manual,Volume 7 of The X Window System, reprinted by permission of O’Reilly andAssociates, Inc. (Heller, D. 1990); Figure 9.8 screen shot reprinted by permission ofDr. R. D. Ward; Figure 10.2 after Earcons and icons: their structure and commondesign principles in Human-Computer Interaction, 4(1), published and reprinted by permission of Lawrence Erlbaum Associates, Inc. (Blattner, M., Sumikawa, D. andGreenberg, R. 1989); Figure 10.5 reprinted by permission of Alistair D. N. Edwards;Figure 10.7 reprinted by permission of Saul Greenberg; Figure 11.2 screen shotreprinted by permission of Macromedia, Inc.; Table 12.1 adapted from ThePsychology of Human Computer Interaction, published and reprinted by permissionof Lawrence Erlbaum Associates, Inc. (Card, S. K., Moran, T. P. and Newell, A.1983); Table 12.2 after Table in A comparison of input devices in elemental pointing and dragging tasks in Reaching through technology – CHI’91 ConferenceProceedings, Human Factors in Computing Systems, April, edited by S. P. Robertson,G. M. Olson and J. S. Olson, © 1991 ACM, Inc., reprinted by permission (Mackenzie,
xxiv Publisher’s acknowledgements
I. S., Sellen, A. and Buxton, W. 1991); Figure 14.1 from Understanding Computersand Cognition: A New Foundation for Design, published by Addison-Wesley,reprinted by permission of Pearson Education, Inc. (Winograd, T. and Flores, F.1986); Figure 14.5 from Theories of multi-party interaction. Technical report, Socialand Computer Sciences Research Group, University of Surrey and Queen Mary andWestfield Colleges, University of London, reprinted by permission of Nigel Gilbert(Hewitt, B., Gilbert, N., Jirotka, M. and Wilbur, S. 1990); Figure 14.6 from Dialogueprocesses in computer-mediated communication: a study of letters in the com system.Technical report, Linköping Studies in Arts and Sciences, reprinted by permission ofKerstin Severinson Eklundh (Eklundh, K. S. 1986); Chapter 14, Design Focus:Looking real – Avatar Conference, screen shots reprinted by permission ofAVATAR-Conference project team; Figure 16.17 screen shot reprinted by permis-sion of Harold Thimbleby; Figure 17.5 based on Verifying the behaviour of virtualworld objects in DSV-IS 2000 Interactive Systems: Design, Specification andVerification. LNCS 1946, edited by P. Palanque and F. Paternò, published andreprinted by permission of Spinger-Verlag GmbH & Co. KG (Willans, J. S. andHarrison, M. D. 2001); Figure 18.4 icons reprinted by permission of Fabio Paternò;Chapter 19, p.675 CuSeeMe screen shot reprinted by permission of Geoff Ellis;Chapter 19, Design Focus: TOWER – workspace awareness, screen shots reprintedby permission of Wolfgang Prinz; Figure 20.1 reprinted by permission of MitsubishiElectric Research Laboratories, Inc.; Figure 20.4 (right) reprinted by permission ofSony Computer Science Laboratories, Inc; Figure 20.9 from Cone trees. Animated 3dvisualisation of hierarchical information in Proceedings of the CH’91 Conference ofHuman Factors in Computing Systems, © 1991 ACM, Inc., reprinted by permission(Robertson, G. G., Card, S. K., and Mackinlay, J. D. 1991); Figure 20.10 fromLifelines: visualising personal histories in Proceedings of CH’96, © 1996 ACM, Inc.,reprinted by permission (Plaisant, C., Milash, B., Rose, A., Widoff, S. andShneiderman, B. 1996); Figure 20.11 from Browsing anatomical image databases: acase study of the Visible Human in CH’96 Conference Companion, © 1996 ACM,Inc., reprinted by permission (North, C. and Korn, F. 1996); Figure 20.12 fromExternalising abstract mathematical models in Proceedings of CH’96, © 1996 ACM,Inc., reprinted by permission (Tweedie, L., Spence, R., Dawkes, H. and Su, H. 1996);Figure 21.2 from The impact of Utility and Time on Distributed InformationRetrieval in People and Computers XII: Proceedings of HCI’97, edited by H.Thimbleby, B. O’Conaill and P. Thomas, published and reprinted by permission of Spinger-Verlag GmbH & Co. KG (Johnson, C. W. 1997); Figure 21.4 screen shot reprinted by permission of the Departments of Electronics and ComputerScience and History at the University of Southampton; Figure 21.6 Netscape browserwindow © 2002 Netscape Communications Corporation. Used with permission.Netscape has not authorized, sponsored, endorsed, or approved this publication andis not responsible for its content.
We are grateful to the following for permission to reproduce photographs:
Chapter 1, p. 50, Popperfoto.com; Chapter 2, p. 65, PCD Maltron Ltd; Figure 2.2Electrolux; Figures 2.6 and 19.6 photos courtesy of Douglas Engelbart and BootstrapInstitute; Figure 2.8 (left) British Sky Broadcasting Limited; Figure 2.13 (bottom

Publisher’s acknowledgements xxv
right) Sony (UK) Ltd; Chapter 2, Design Focus: Feeling the Road, BMW AG;Chapter 2, Design Focus: Smart-Its – making using sensors easy, Hans Gellersen;Figures 4.1 (right) and 20.2 (left) Palo Alto Research Center; Figure 4.2 and 20.3(left) François Guimbretière; Figure 4.3 (bottom left) Franklin Electronic Publishers;Figure 5.2 (top plate and middle plate) Kingston Museum and Heritage Service,(bottom plate) V&A Images, The Victoria and Albert Museum, London; Chapter 5,Design Focus: Cultural probes, William W. Gaver, Anthony Boucher, SarahPennington and Brendan Walker, Equator IRC, Royal College of Art; Chapter 6, p. 245, from The 1984 Olympic Message System: a text of behavioural principle ofsystem design in Communications of the ACM, 30(9), © 1987 ACM, Inc., reprintedby permission (Gould, J. D., Boies, S. J., Levy, S., Richards, J. T. and Schoonard, J.1987); Figures 9.5 and 9.6 J. A. Renshaw; Figure 9.7 Dr. R. D. Ward; Figure 10.3SensAble Technologies; Chapter 13, Design Focus: Tomorrow’s hospital – using participatory design, Professor J. Artur Vale Serrano; Chapter 18, p. 650, MichaelBeigl; Chapter 19, p. 678, Steve Benford, The Mixed Reality Laboratory, Universityof Nottingham; Chapter 19, Design Focus: SMS in action, Mark Rouncefield; Figure20.2 (right) Ken Hinckley; Figure 20.3 (right) MIT Media Lab; Figure 20.4 (left)from Interacting with paper on the digital desk in Communications of the ACM,36(7), © 1993 ACM, Inc., reprinted by permission (Wellner, P. 1993); Chapter 20, p. 726, Peter Phillips; Chapter 20, Design Focus: Ambient wood – augmenting thephysical, Yvonne Rogers; Chapter 20, Design Focus: Shared experience, MatthewChalmers.
We are grateful to the following for permission to reproduce text extracts:
Pearson Education, Inc. Publishing as Pearson Addison Wesley for an extractadapted from Designing the User Interface: Strategies for Effective Human–ComputerInteraction 3/e by B. Shneiderman © 1998, Pearson Education, Inc; Perseus BooksGroup for an extract adapted from The Design of Everyday Things by D. Norman,1998; and Wiley Publishing, Inc. for extracts adapted from ‘Heuristic Evaluation’ byJakob Nielson and Robert L. Mack published in Usability Inspection Methods © 1994Wiley Publishing, Inc.; IEEE for permission to base chapter 20 on ‘The human ex-perience’ by Gregory Abowd, Elizabeth Mynatt and Tom Rodden which appeared in IEEE Pervasive Computing Magazine, Special Inaugural Issue on Reaching forWeiser’s Vision, Vol. 1, Issue 1, pp. 48–58, Jan–March 2002. © 2002 IEEE.
In some instances we have been unable to trace the owners of copyright material, andwe would appreciate any information that would enable us to do so.

INTRODUCTION
WHY HUMAN–COMPUTER INTERACTION?
In the first edition of this book we wrote the following:
This is the authors’ second attempt at writing this introduction. Our first attempt fell victim to a design quirk coupled with an innocent, though weary and less thanattentive, user. The word-processing package we originally used to write this intro-duction is menu based. Menu items are grouped to reflect their function. The ‘save’and ‘delete’ options, both of which are correctly classified as file-level operations, areconsequently adjacent items in the menu. With a cursor controlled by a trackball it is all too easy for the hand to slip, inadvertently selecting delete instead of save. Ofcourse, the delete option, being well thought out, pops up a confirmation box allow-ing the user to cancel a mistaken command. Unfortunately, the save option producesa very similar confirmation box – it was only as we hit the ‘Confirm’ button that wenoticed the word ‘delete’ at the top . . .
Happily this word processor no longer has a delete option in its menu, but unfortu-nately, similar problems to this are still an all too common occurrence. Errors suchas these, resulting from poor design choices, happen every day. Perhaps they are notcatastrophic: after all nobody’s life is endangered nor is there environmental damage(unless the designer happens to be nearby or you break something in frustration!).However, when you lose several hours’ work with no written notes or backup and a publisher’s deadline already a week past, ‘catastrophe’ is certainly the word thatsprings to mind.
Why is it then that when computers are marketed as ‘user friendly’ and ‘easy touse’, simple mistakes like this can still occur? Did the designer of the word processoractually try to use it with the trackball, or was it just that she was so expert with thesystem that the mistake never arose? We hazard a guess that no one tried to use itwhen tired and under pressure. But these criticisms are not levied only on the design-ers of traditional computer software. More and more, our everyday lives involve pro-grammed devices that do not sit on our desk, and these devices are just as unusable.Exactly how many VCR designers understand the universal difficulty people havetrying to set their machines to record a television program? Do car radio designers

2 Introduction
actually think it is safe to use so many knobs and displays that the driver has to divert attention away from the road completely in order to tune the radio or adjustthe volume?
Computers and related devices have to be designed with an understanding thatpeople with specific tasks in mind will want to use them in a way that is seamless withrespect to their everyday work. To do this, those who design these systems need toknow how to think in terms of the eventual users’ tasks and how to translate thatknowledge into an executable system. But there is a problem with trying to teach thenotion of designing computers for people. All designers are people and, most prob-ably, they are users as well. Isn’t it therefore intuitive to design for the user? Whydoes it need to be taught when we all know what a good interface looks like? As aresult, the study of human–computer interaction (HCI) tends to come late in thedesigner’s training, if at all. The scenario with which we started shows that this is amistaken view; it is not at all intuitive or easy to design consistent, robust systems
DESIGN FOCUS
Things don’t change
It would be nice to think that problems like those described at the start of the Introduction wouldnever happen now. Think again! Look at the MacOS X ‘dock’ below. It is a fast launch point for applica-tions; folders and files can be dragged there for instant access; and also, at the right-hand side, theresits the trash can. Imagine what happens as you try to drag a file into one of the folders. If your fingeraccidentally slips whilst the icon is over the trash can – oops!
Happily this is not quite as easy in reality as it looks in the screen shot, since the icons in the dock con-stantly move around as you try to drag a file into it. This is to make room for the file in case you wantto place it in the dock. However, it means you have to concentrate very hard when dragging a file overthe dock. We assume this is not a deliberate feature, but it does have the beneficial side effect thatusers are less likely to throw away a file by accident – whew!
In fact it is quite fun to watch a new user trying to throw away a file. The trash can keeps moving as ifit didn’t want the file in it. Experienced users evolve coping strategies. One user always drags files intothe trash from the right-hand side as then the icons in the dock don’t move around. So two lessons:
n designs don’t always get bettern but at least users are clever.
Screen shot reprinted by permission from Apple Computer, Inc.
that will cope with all manner of user carelessness. The interface is not somethingthat can be plugged in at the last minute; its design should be developed integrallywith the rest of the system. It should not just present a ‘pretty face’, but should sup-port the tasks that people actually want to do, and forgive the careless mistakes. Wetherefore need to consider how HCI fits into the design process.
Designing usable systems is not simply a matter of altruism towards the eventualuser, or even marketing; it is increasingly a matter of law. National health and safetystandards constrain employers to provide their workforce with usable computer sys-tems: not just safe but usable. For example, EC Directive 90/270/EEC, which has beenincorporated into member countries’ legislation, requires employers to ensure thefollowing when designing, selecting, commissioning or modifying software:
n that it is suitable for the taskn that it is easy to use and, where appropriate, adaptable to the user’s knowledge
and experiencen that it provides feedback on performancen that it displays information in a format and at a pace that is adapted to the usern that it conforms to the ‘principles of software ergonomics’.
Designers and employers can no longer afford to ignore the user.
WHAT IS HCI?
The term human–computer interaction has only been in widespread use since the early1980s, but has its roots in more established disciplines. Systematic study of humanperformance began in earnest at the beginning of the last century in factories, withan emphasis on manual tasks. The Second World War provided the impetus forstudying the interaction between humans and machines, as each side strove to pro-duce more effective weapons systems. This led to a wave of interest in the area amongresearchers, and the formation of the Ergonomics Research Society in 1949. Tradi-tionally, ergonomists have been concerned primarily with the physical characteristicsof machines and systems, and how these affect user performance. Human Factorsincorporates these issues, and more cognitive issues as well. The terms are often usedinterchangeably, with Ergonomics being the preferred term in the United Kingdomand Human Factors in the English-speaking parts of North America. Both of thesedisciplines are concerned with user performance in the context of any system, whethercomputer, mechanical or manual. As computer use became more widespread, anincreasing number of researchers specialized in studying the interaction betweenpeople and computers, concerning themselves with the physical, psychological andtheoretical aspects of this process. This research originally went under the name man–machine interaction, but this became human–computer interaction in recognition ofthe particular interest in computers and the composition of the user population!
Another strand of research that has influenced the development of HCI is infor-mation science and technology. Again the former is an old discipline, pre-dating theintroduction of technology, and is concerned with the management and manipulation
What is HCI? 3

4 Introduction
of information within an organization. The introduction of technology has had aprofound effect on the way that information can be stored, accessed and utilized and, consequently, a significant effect on the organization and work environment.Systems analysis has traditionally concerned itself with the influence of technologyin the workplace, and fitting the technology to the requirements and constraints ofthe job. These issues are also the concern of HCI.
HCI draws on many disciplines, as we shall see, but it is in computer science andsystems design that it must be accepted as a central concern. For all the other discip-lines it can be a specialism, albeit one that provides crucial input; for systems designit is an essential part of the design process. From this perspective, HCI involves thedesign, implementation and evaluation of interactive systems in the context of theuser’s task and work.
However, when we talk about human–computer interaction, we do not necessarilyenvisage a single user with a desktop computer. By user we may mean an individualuser, a group of users working together, or a sequence of users in an organization,each dealing with some part of the task or process. The user is whoever is trying toget the job done using the technology. By computer we mean any technology rangingfrom the general desktop computer to a large-scale computer system, a process control system or an embedded system. The system may include non-computerizedparts, including other people. By interaction we mean any communication betweena user and computer, be it direct or indirect. Direct interaction involves a dialog with feedback and control throughout performance of the task. Indirect interactionmay involve batch processing or intelligent sensors controlling the environment. The important thing is that the user is interacting with the computer in order toaccomplish something.
WHO IS INVOLVED IN HCI?
HCI is undoubtedly a multi-disciplinary subject. The ideal designer of an interactivesystem would have expertise in a range of topics: psychology and cognitive science to give her knowledge of the user’s perceptual, cognitive and problem-solving skills; ergonomics for the user’s physical capabilities; sociology to help her under-stand the wider context of the interaction; computer science and engineering to be able to build the necessary technology; business to be able to market it; graphicdesign to produce an effective interface presentation; technical writing to producethe manuals, and so it goes on. There is obviously too much expertise here to be heldby one person (or indeed four!), perhaps even too much for the average design team.Indeed, although HCI is recognized as an interdisciplinary subject, in practice peo-ple tend to take a strong stance on one side or another. However, it is not possible todesign effective interactive systems from one discipline in isolation. Input is neededfrom all sides. For example, a beautifully designed graphic display may be unusableif it ignores dialog constraints or the psychological limitations of the user.

Theory and HCI 5
In this book we want to encourage the multi-disciplinary view of HCI but we toohave our ‘stance’, as computer scientists. We are interested in answering a particularquestion. How do principles and methods from each of these contributing dis-ciplines in HCI help us to design better systems? In this we must be pragmatistsrather than theorists: we want to know how to apply the theory to the problem rather than just acquire a deep understanding of the theory. Our goal, then, is to bemulti-disciplinary but practical. We concentrate particularly on computer science,psychology and cognitive science as core subjects, and on their application to design;other disciplines are consulted to provide input where relevant.
THEORY AND HCI
Unfortunately for us, there is no general and unified theory of HCI that we can present. Indeed, it may be impossible ever to derive one; it is certainly out of ourreach today. However, there is an underlying principle that forms the basis of ourown views on HCI, and it is captured in our claim that people use computers toaccomplish work. This outlines the three major issues of concern: the people, thecomputers and the tasks that are performed. The system must support the user’stask, which gives us a fourth focus, usability: if the system forces the user to adopt anunacceptable mode of work then it is not usable.
There are, however, those who would dismiss our concentration on the task, saying that we do not even know enough about a theory of human tasks to supportthem in design. There is a good argument here (to which we return in Chapter 15).However, we can live with this confusion about what real tasks are because ourunderstanding of tasks at the moment is sufficient to give us direction in design. Theuser’s current tasks are studied and then supported by computers, which can in turn affect the nature of the original task and cause it to evolve. To illustrate, wordprocessing has made it easy to manipulate paragraphs and reorder documents,allowing writers a completely new freedom that has affected writing styles. No longeris it vital to plan and construct text in an ordered fashion, since free-flowing prosecan easily be restructured at a later date. This evolution of task in turn affects thedesign of the ideal system. However, we see this evolution as providing a motivatingforce behind the system development cycle, rather than a refutation of the whole ideaof supportive design.
This word ‘task’ or the focus on accomplishing ‘work’ is also problematic when wethink of areas such as domestic appliances, consumer electronics and e-commerce.There are three ‘use’ words that must all be true for a product to be successful; itmust be:
useful – accomplish what is required: play music, cook dinner, format a document;
usable – do it easily and naturally, without danger of error, etc.;
used – make people want to use it, be attractive, engaging, fun, etc.

6 Introduction
The last of these has not been a major factor until recently in HCI, but issues of motivation, enjoyment and experience are increasingly important. We are certainlyeven further from having a unified theory of experience than of task.
The question of whether HCI, or more importantly the design of interactive sys-tems and the user interface in particular, is a science or a craft discipline is an inter-esting one. Does it involve artistic skill and fortuitous insight or reasoned methodicalscience? Here we can draw an analogy with architecture. The most impressive struc-tures, the most beautiful buildings, the innovative and imaginative creations thatprovide aesthetic pleasure, all require inventive inspiration in design and a sense ofartistry, and in this sense the discipline is a craft. However, these structures also haveto be able to stand up to fulfill their purpose successfully, and to be able to do thisthe architect has to use science. So it is for HCI: beautiful and/or novel interfaces areartistically pleasing and capable of fulfilling the tasks required – a marriage of art andscience into a successful whole. We want to reuse lessons learned from the past abouthow to achieve good results and avoid bad ones. For this we require both craft andscience. Innovative ideas lead to more usable systems, but in order to maximize thepotential benefit from the ideas, we need to understand not only that they work, buthow and why they work. This scientific rationalization allows us to reuse related con-cepts in similar situations, in much the same way that architects can produce a bridgeand know that it will stand, since it is based upon tried and tested principles.
The craft–science tension becomes even more difficult when we consider novelsystems. Their increasing complexity means that our personal ideas of good and badare no longer enough; for a complex system to be well designed we need to rely onsomething more than simply our intuition. Designers may be able to think abouthow one user would want to act, but how about groups? And what about new media?Our ideas of how best to share workloads or present video information are open todebate and question even in non-computing situations, and the incorporation of oneversion of good design into a computer system is quite likely to be unlike anyoneelse’s version. Different people work in different ways, whilst different media colorthe nature of the interaction; both can dramatically change the very nature of theoriginal task. In order to assist designers, it is unrealistic to assume that they can relyon artistic skill and perfect insight to develop usable systems. Instead we have to pro-vide them with an understanding of the concepts involved, a scientific view of thereasons why certain things are successful whilst others are not, and then allow theircreative nature to feed off this information: creative flow, underpinned with science;or maybe scientific method, accelerated by artistic insight. The truth is that HCI isrequired to be both a craft and a science in order to be successful.
HCI IN THE CURRICULUM
If HCI involves both craft and science then it must, in part at least, be taught.Imagination and skill may be qualities innate in the designer or developed throughexperience, but the underlying theory must be learned. In the past, when computers

HCI in the curriculum 7
were used primarily by expert specialists, concentration on the interface was a lux-ury that was often relinquished. Now designers cannot afford to ignore the interfacein favour of the functionality of their systems: the two are too closely intertwined. Ifthe interface is poor, the functionality is obscured; if it is well designed, it will allowthe system’s functionality to support the user’s task.
Increasingly, therefore, computer science educators cannot afford to ignore HCI.We would go as far as to claim that HCI should be integrated into every computerscience or software engineering course, either as a recurring feature of other modulesor, preferably, as a module itself. It should not be viewed as an ‘optional extra’(although, of course, more advanced HCI options can complement a basic corecourse). This view is shared by the ACM SIGCHI curriculum development group,who propose a curriculum for such a core course [9]. The topics included in thisbook, although developed without reference to this curriculum, cover the mainemphases of it, and include enough detail and coverage to support specializedoptions as well.
In courses other than computer science, HCI may well be an option specializingin a particular area, such as cognitive modeling or task analysis. Selected use of therelevant chapters of this book can also support such a course.
HCI must be taken seriously by designers and educators if the requirement foradditional complexity in the system is to be matched by increased clarity and usabil-ity in the interface. In this book we demonstrate how this can be done in practice.
DESIGN FOCUS
Quick fixes
You should expect to spend both time and money on interface design, just as you would with otherparts of a system. So in one sense there are no quick fixes. However, a few simple steps can make adramatic improvement.
Think ‘user’Probably 90% of the value of any interface design technique is that it forces the designer to rememberthat someone (and in particular someone else) will use the system under construction.
Try it outOf course, many designers will build a system that they find easy and pleasant to use, and they find it incomprehensible that anyone else could have trouble with it. Simply sitting someone down with an early version of an interface (without the designer prompting them at each step!) is enormously valuable. Professional usability laboratories will have video equipment, one-way mirrors and othersophisticated monitors, but a notebook and pencil and a home-video camera will suffice (more aboutevaluation in Chapter 9).
Involve the usersWhere possible, the eventual users should be involved in the design process. They have vital know-ledge and will soon find flaws. A mechanical syringe was once being developed and a prototype wasdemonstrated to hospital staff. Happily they quickly noticed the potentially fatal flaw in its interface.

The doses were entered via a numeric keypad: an accidental keypress and the dose could be out by afactor of 10! The production version had individual increment/decrement buttons for each digit (moreabout participatory design in Chapter 13).
IteratePeople are complicated, so you won’t get it right first time. Programming an interface can be a verydifficult and time-consuming business. So, the result becomes precious and the builder will want to defend it and minimize changes. Making early prototypes less precious and easier to throw away iscrucial. Happily there are now many interface builder tools that aid this process. For example, mock-ups can be quickly constructed using HyperCard on the Apple Macintosh or Visual Basic on the PC.For visual and layout decisions, paper designs and simple models can be used (more about iterativedesign in Chapter 5).
8 Introduction
Figure 0.1 Automatic syringe: setting the dose to 1372. The effect of one key slip before and afteruser involvement

P A R T
1FOUNDATIONS
In this part we introduce the fundamental components of an interactive system: the human user, the computer systemitself and the nature of the interactive process. We thenpresent a view of the history of interactive systems by look-ing at key interaction paradigms that have been significant.
Chapter 1 discusses the psychological and physiologicalattributes of the user, providing us with a basic overview ofthe capabilities and limitations that affect our ability to usecomputer systems. It is only when we have an understand-ing of the user at this level that we can understand whatmakes for successful designs. Chapter 2 considers the computer in a similar way. Input and output devices aredescribed and explained and the effect that their individualcharacteristics have on the interaction highlighted. Thecomputational power and memory of the computer isanother important component in determining what can beachieved in the interaction, whilst due attention is also paidto paper output since this forms one of the major uses of computers and users’ tasks today. Having approachedinteraction from both the human and the computer side,we then turn our attention to the dialog between them in Chapter 3, where we look at models of interaction. InChapter 4 we take a historical perspective on the evolutionof interactive systems and how they have increased theusability of computers in general.


THE HUMAN 1
OV E RV I E W
n Humans are limited in their capacity to processinformation. This has important implications for design.
n Information is received and responses given via anumber of input and output channels:– visual channel– auditory channel– haptic channel– movement.
n Information is stored in memory:– sensory memory– short-term (working) memory– long-term memory.
n Information is processed and applied:– reasoning– problem solving– skill acquisition– error.
n Emotion influences human capabilities.
n Users share common capabilities but are individualswith differences, which should not be ignored.

12 Chapter 1 n The human
INTRODUCTION
This chapter is the first of four in which we introduce some of the ‘foundations’ ofHCI. We start with the human, the central character in any discussion of interactivesystems. The human, the user, is, after all, the one whom computer systems are de-signed to assist. The requirements of the user should therefore be our first priority.
In this chapter we will look at areas of human psychology coming under the generalbanner of cognitive psychology. This may seem a far cry from designing and buildinginteractive computer systems, but it is not. In order to design something for some-one, we need to understand their capabilities and limitations. We need to know ifthere are things that they will find difficult or, even, impossible. It will also help us toknow what people find easy and how we can help them by encouraging these things.We will look at aspects of cognitive psychology which have a bearing on the use of com-puter systems: how humans perceive the world around them, how they store andprocess information and solve problems, and how they physically manipulate objects.
We have already said that we will restrict our study to those things that are relev-ant to HCI. One way to structure this discussion is to think of the user in a way thathighlights these aspects. In other words, to think of a simplified model of what isactually going on. Many models have been proposed and it useful to consider one ofthe most influential in passing, to understand the context of the discussion that is tofollow. In 1983, Card, Moran and Newell [56] described the Model Human Processor,which is a simplified view of the human processing involved in interacting with computer systems. The model comprises three subsystems: the perceptual system,handling sensory stimulus from the outside world, the motor system, which controlsactions, and the cognitive system, which provides the processing needed to connectthe two. Each of these subsystems has its own processor and memory, although obviously the complexity of these varies depending on the complexity of the tasks the subsystem has to perform. The model also includes a number of principles ofoperation which dictate the behavior of the systems under certain conditions.
We will use the analogy of the user as an information processing system, but in our model make the analogy closer to that of a conventional computer system.Information comes in, is stored and processed, and information is passed out. Wewill therefore discuss three components of this system: input–output, memory andprocessing. In the human, we are dealing with an intelligent information-processingsystem, and processing therefore includes problem solving, learning, and, con-sequently, making mistakes. This model is obviously a simplification of the real situation, since memory and processing are required at all levels, as we have seen inthe Model Human Processor. However, it is convenient as a way of grasping howinformation is handled by the human system. The human, unlike the computer, isalso influenced by external factors such as the social and organizational environ-ment, and we need to be aware of these influences as well. We will ignore such factors for now and concentrate on the human’s information processing capabilitiesonly. We will return to social and organizational influences in Chapter 3 and, inmore detail, in Chapter 13.
1.1
1.2 Input–output channels 13
In this chapter, we will first look at the human’s input–output channels, the sensesand responders or effectors. This will involve some low-level processing. Secondly,we will consider human memory and how it works. We will then think about howhumans perform complex problem solving, how they learn and acquire skills, andwhy they make mistakes. Finally, we will discuss how these things can help us in thedesign of computer systems.
INPUT–OUTPUT CHANNELS
A person’s interaction with the outside world occurs through information beingreceived and sent: input and output. In an interaction with a computer the userreceives information that is output by the computer, and responds by providinginput to the computer – the user’s output becomes the computer’s input and viceversa. Consequently the use of the terms input and output may lead to confusion sowe shall blur the distinction somewhat and concentrate on the channels involved.This blurring is appropriate since, although a particular channel may have a primaryrole as input or output in the interaction, it is more than likely that it is also used inthe other role. For example, sight may be used primarily in receiving informationfrom the computer, but it can also be used to provide information to the computer,for example by fixating on a particular screen point when using an eyegaze system.
Input in the human occurs mainly through the senses and output through themotor control of the effectors. There are five major senses: sight, hearing, touch, tasteand smell. Of these, the first three are the most important to HCI. Taste and smelldo not currently play a significant role in HCI, and it is not clear whether they couldbe exploited at all in general computer systems, although they could have a role toplay in more specialized systems (smells to give warning of malfunction, for example)or in augmented reality systems. However, vision, hearing and touch are central.
Similarly there are a number of effectors, including the limbs, fingers, eyes, headand vocal system. In the interaction with the computer, the fingers play the primaryrole, through typing or mouse control, with some use of voice, and eye, head andbody position.
Imagine using a personal computer (PC) with a mouse and a keyboard. The appli-cation you are using has a graphical interface, with menus, icons and windows. Inyour interaction with this system you receive information primarily by sight, fromwhat appears on the screen. However, you may also receive information by ear: forexample, the computer may ‘beep’ at you if you make a mistake or to draw attentionto something, or there may be a voice commentary in a multimedia presentation.Touch plays a part too in that you will feel the keys moving (also hearing the ‘click’)or the orientation of the mouse, which provides vital feedback about what you havedone. You yourself send information to the computer using your hands, either by hitting keys or moving the mouse. Sight and hearing do not play a direct role in sending information in this example, although they may be used to receive
1.2
14 Chapter 1 n The human
information from a third source (for example, a book, or the words of another per-son) which is then transmitted to the computer.
In this section we will look at the main elements of such an interaction, first con-sidering the role and limitations of the three primary senses and going on to considermotor control.
1.2.1 Vision
Human vision is a highly complex activity with a range of physical and perceptuallimitations, yet it is the primary source of information for the average person. We can roughly divide visual perception into two stages: the physical reception of the stimulus from the outside world, and the processing and interpretation of thatstimulus. On the one hand the physical properties of the eye and the visual systemmean that there are certain things that cannot be seen by the human; on the otherthe interpretative capabilities of visual processing allow images to be constructedfrom incomplete information. We need to understand both stages as both influencewhat can and cannot be perceived visually by a human being, which in turn directlyaffects the way that we design computer systems. We will begin by looking at the eye as a physical receptor, and then go on to consider the processing involved in basic vision.
The human eye
Vision begins with light. The eye is a mechanism for receiving light and transform-ing it into electrical energy. Light is reflected from objects in the world and theirimage is focussed upside down on the back of the eye. The receptors in the eye transform it into electrical signals which are passed to the brain.
The eye has a number of important components (see Figure 1.1) which we willlook at in more detail. The cornea and lens at the front of the eye focus the light intoa sharp image on the back of the eye, the retina. The retina is light sensitive and con-tains two types of photoreceptor: rods and cones.
Rods are highly sensitive to light and therefore allow us to see under a low level ofillumination. However, they are unable to resolve fine detail and are subject to lightsaturation. This is the reason for the temporary blindness we get when moving froma darkened room into sunlight: the rods have been active and are saturated by thesudden light. The cones do not operate either as they are suppressed by the rods. Weare therefore temporarily unable to see at all. There are approximately 120 millionrods per eye which are mainly situated towards the edges of the retina. Rods there-fore dominate peripheral vision.
Cones are the second type of receptor in the eye. They are less sensitive to lightthan the rods and can therefore tolerate more light. There are three types of cone,each sensitive to a different wavelength of light. This allows color vision. The eye hasapproximately 6 million cones, mainly concentrated on the fovea, a small area of theretina on which images are fixated.
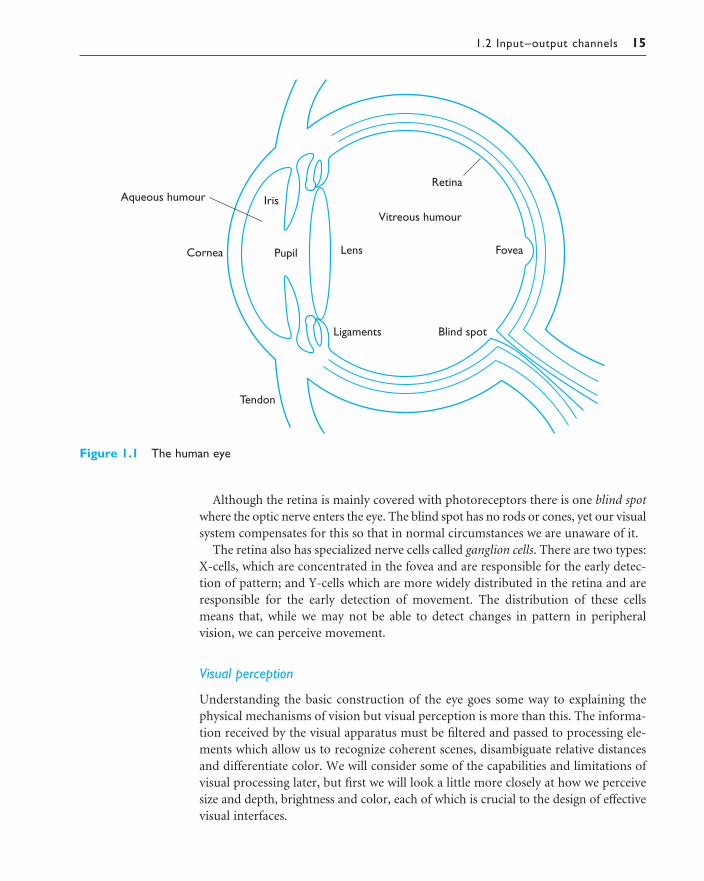
1.2 Input–output channels 15
Although the retina is mainly covered with photoreceptors there is one blind spotwhere the optic nerve enters the eye. The blind spot has no rods or cones, yet our visualsystem compensates for this so that in normal circumstances we are unaware of it.
The retina also has specialized nerve cells called ganglion cells. There are two types:X-cells, which are concentrated in the fovea and are responsible for the early detec-tion of pattern; and Y-cells which are more widely distributed in the retina and areresponsible for the early detection of movement. The distribution of these cellsmeans that, while we may not be able to detect changes in pattern in peripheralvision, we can perceive movement.
Visual perception
Understanding the basic construction of the eye goes some way to explaining thephysical mechanisms of vision but visual perception is more than this. The informa-tion received by the visual apparatus must be filtered and passed to processing ele-ments which allow us to recognize coherent scenes, disambiguate relative distancesand differentiate color. We will consider some of the capabilities and limitations ofvisual processing later, but first we will look a little more closely at how we perceivesize and depth, brightness and color, each of which is crucial to the design of effectivevisual interfaces.
Figure 1.1 The human eye

16 Chapter 1 n The human
Perceiving size and depth Imagine you are standing on a hilltop. Beside you on thesummit you can see rocks, sheep and a small tree. On the hillside is a farmhouse withoutbuildings and farm vehicles. Someone is on the track, walking toward the summit. Below in the valley is a small market town.
Even in describing such a scene the notions of size and distance predominate. Ourvisual system is easily able to interpret the images which it receives to take accountof these things. We can identify similar objects regardless of the fact that they appearto us to be of vastly different sizes. In fact, we can use this information to judge distances.
So how does the eye perceive size, depth and relative distances? To understand thiswe must consider how the image appears on the retina. As we noted in the previoussection, reflected light from the object forms an upside-down image on the retina.The size of that image is specified as a visual angle. Figure 1.2 illustrates how thevisual angle is calculated.
If we were to draw a line from the top of the object to a central point on the frontof the eye and a second line from the bottom of the object to the same point, thevisual angle of the object is the angle between these two lines. Visual angle is affectedby both the size of the object and its distance from the eye. Therefore if two objectsare at the same distance, the larger one will have the larger visual angle. Similarly, if two objects of the same size are placed at different distances from the eye, the
DESIGN FOCUS
Getting noticed
The extensive knowledge about the human visual system can be brought to bear in practical design. Forexample, our ability to read or distinguish falls off inversely as the distance from our point of focusincreases. This is due to the fact that the cones are packed more densely towards the center of ourvisual field. You can see this in the following image. Fixate on the dot in the center. The letters on theleft should all be equally readable, those on the right all equally harder.
This loss of discrimination sets limits on the amount that can be seen or read without moving one’seyes. A user concentrating on the middle of the screen cannot be expected to read help text on thebottom line.
However, although our ability to discriminate static text diminishes, the rods, which are concentratedmore in the outer parts of our visual field, are very sensitive to changes; hence we see movement wellat the edge of our vision. So if you want a user to see an error message at the bottom of the screen ithad better be flashing! On the other hand clever moving icons, however impressive they are, will bedistracting even when the user is not looking directly at them.
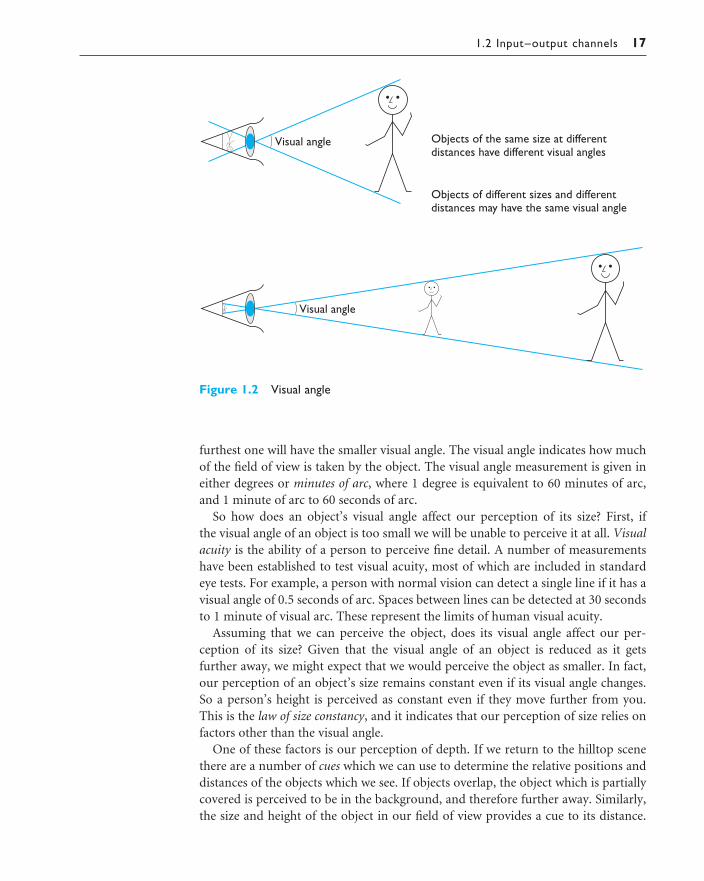
1.2 Input–output channels 17
furthest one will have the smaller visual angle. The visual angle indicates how muchof the field of view is taken by the object. The visual angle measurement is given ineither degrees or minutes of arc, where 1 degree is equivalent to 60 minutes of arc, and 1 minute of arc to 60 seconds of arc.
So how does an object’s visual angle affect our perception of its size? First, if the visual angle of an object is too small we will be unable to perceive it at all. Visualacuity is the ability of a person to perceive fine detail. A number of measurementshave been established to test visual acuity, most of which are included in standardeye tests. For example, a person with normal vision can detect a single line if it has avisual angle of 0.5 seconds of arc. Spaces between lines can be detected at 30 secondsto 1 minute of visual arc. These represent the limits of human visual acuity.
Assuming that we can perceive the object, does its visual angle affect our per-ception of its size? Given that the visual angle of an object is reduced as it gets further away, we might expect that we would perceive the object as smaller. In fact,our perception of an object’s size remains constant even if its visual angle changes.So a person’s height is perceived as constant even if they move further from you. This is the law of size constancy, and it indicates that our perception of size relies onfactors other than the visual angle.
One of these factors is our perception of depth. If we return to the hilltop scenethere are a number of cues which we can use to determine the relative positions anddistances of the objects which we see. If objects overlap, the object which is partiallycovered is perceived to be in the background, and therefore further away. Similarly,the size and height of the object in our field of view provides a cue to its distance.
Figure 1.2 Visual angle

18 Chapter 1 n The human
A third cue is familiarity: if we expect an object to be of a certain size then we canjudge its distance accordingly. This has been exploited for humour in advertising:one advertisement for beer shows a man walking away from a bottle in the fore-ground. As he walks, he bumps into the bottle, which is in fact a giant one in thebackground!
Perceiving brightness A second aspect of visual perception is the perception ofbrightness. Brightness is in fact a subjective reaction to levels of light. It is affected byluminance which is the amount of light emitted by an object. The luminance of anobject is dependent on the amount of light falling on the object’s surface and itsreflective properties. Luminance is a physical characteristic and can be measuredusing a photometer. Contrast is related to luminance: it is a function of the luminanceof an object and the luminance of its background.
Although brightness is a subjective response, it can be described in terms of theamount of luminance that gives a just noticeable difference in brightness. However,the visual system itself also compensates for changes in brightness. In dim lighting,the rods predominate vision. Since there are fewer rods on the fovea, objects in lowlighting can be seen less easily when fixated upon, and are more visible in peripheralvision. In normal lighting, the cones take over.
Visual acuity increases with increased luminance. This may be an argument for using high display luminance. However, as luminance increases, flicker alsoincreases. The eye will perceive a light switched on and off rapidly as constantly on. But if the speed of switching is less than 50 Hz then the light is perceived toflicker. In high luminance flicker can be perceived at over 50 Hz. Flicker is also more noticeable in peripheral vision. This means that the larger the display (andconsequently the more peripheral vision that it occupies), the more it will appear to flicker.
Perceiving color A third factor that we need to consider is perception of color.Color is usually regarded as being made up of three components: hue, intensity andsaturation. Hue is determined by the spectral wavelength of the light. Blues have shortwavelengths, greens medium and reds long. Approximately 150 different hues can bediscriminated by the average person. Intensity is the brightness of the color, and saturation is the amount of whiteness in the color. By varying these two, we can perceive in the region of 7 million different colors. However, the number of colorsthat can be identified by an individual without training is far fewer (in the region of 10).
The eye perceives color because the cones are sensitive to light of different wave-lengths. There are three different types of cone, each sensitive to a different color(blue, green and red). Color vision is best in the fovea, and worst at the peripherywhere rods predominate. It should also be noted that only 3–4% of the fovea isoccupied by cones which are sensitive to blue light, making blue acuity lower.
Finally, we should remember that around 8% of males and 1% of females sufferfrom color blindness, most commonly being unable to discriminate between red andgreen.
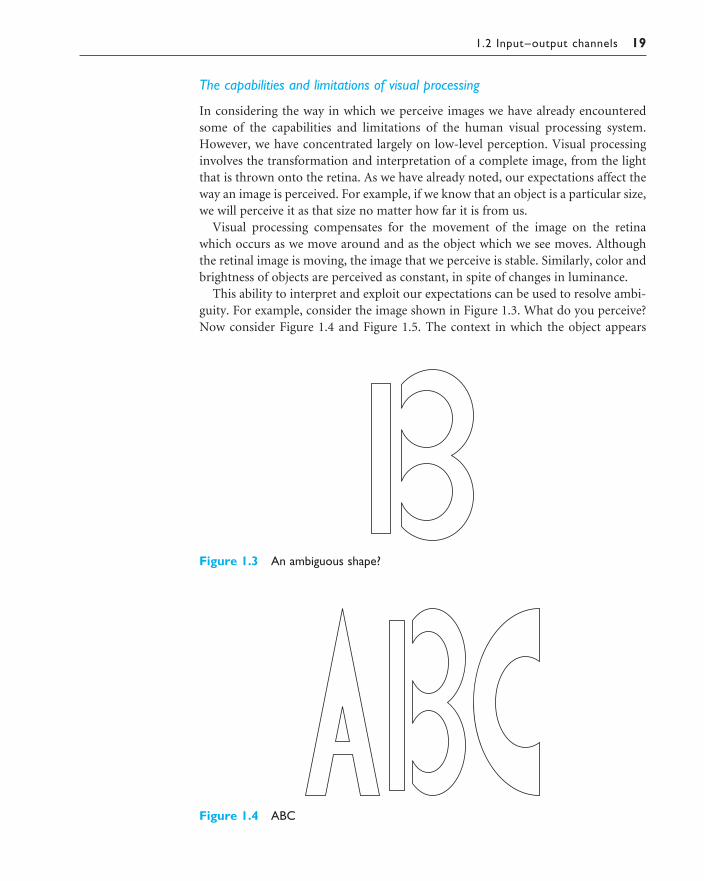
1.2 Input–output channels 19
The capabilities and limitations of visual processing
In considering the way in which we perceive images we have already encounteredsome of the capabilities and limitations of the human visual processing system.However, we have concentrated largely on low-level perception. Visual processinginvolves the transformation and interpretation of a complete image, from the lightthat is thrown onto the retina. As we have already noted, our expectations affect theway an image is perceived. For example, if we know that an object is a particular size,we will perceive it as that size no matter how far it is from us.
Visual processing compensates for the movement of the image on the retina which occurs as we move around and as the object which we see moves. Althoughthe retinal image is moving, the image that we perceive is stable. Similarly, color andbrightness of objects are perceived as constant, in spite of changes in luminance.
This ability to interpret and exploit our expectations can be used to resolve ambi-guity. For example, consider the image shown in Figure 1.3. What do you perceive?Now consider Figure 1.4 and Figure 1.5. The context in which the object appears
Figure 1.3 An ambiguous shape?
Figure 1.4 ABC

20 Chapter 1 n The human
allows our expectations to clearly disambiguate the interpretation of the object, aseither a B or a 13.
However, it can also create optical illusions. For example, consider Figure 1.6.Which line is longer? Most people when presented with this will say that the top line is longer than the bottom. In fact, the two lines are the same length. This may bedue to a false application of the law of size constancy: the top line appears like a con-cave edge, the bottom like a convex edge. The former therefore seems further awaythan the latter and is therefore scaled to appear larger. A similar illusion is the Ponzoillusion (Figure 1.7). Here the top line appears longer, owing to the distance effect,although both lines are the same length. These illusions demonstrate that our per-ception of size is not completely reliable.
Another illusion created by our expectations compensating an image is the proof-reading illusion. Read the text in Figure 1.8 quickly. What does it say? Most peoplereading this rapidly will read it correctly, although closer inspection shows that theword ‘the’ is repeated in the second and third line.
These are just a few examples of how the visual system compensates, and some-times overcompensates, to allow us to perceive the world around us.
Figure 1.5 12 13 14
Figure 1.6 The Muller–Lyer illusion – which line is longer?

1.2 Input–output channels 21
Figure 1.7 The Ponzo illusion – are these the same size?
Figure 1.8 Is this text correct?

22 Chapter 1 n The human
Reading
So far we have concentrated on the perception of images in general. However, the perception and processing of text is a special case that is important to interfacedesign, which invariably requires some textual display. We will therefore end this section by looking at reading. There are several stages in the reading process.First, the visual pattern of the word on the page is perceived. It is then decoded with reference to an internal representation of language. The final stages of lan-guage processing include syntactic and semantic analysis and operate on phrases orsentences.
We are most concerned with the first two stages of this process and how theyinfluence interface design. During reading, the eye makes jerky movements calledsaccades followed by fixations. Perception occurs during the fixation periods, whichaccount for approximately 94% of the time elapsed. The eye moves backwards overthe text as well as forwards, in what are known as regressions. If the text is complexthere will be more regressions.
Adults read approximately 250 words a minute. It is unlikely that words arescanned serially, character by character, since experiments have shown that words canbe recognized as quickly as single characters. Instead, familiar words are recognizedusing word shape. This means that removing the word shape clues (for example, bycapitalizing words) is detrimental to reading speed and accuracy.
The speed at which text can be read is a measure of its legibility. Experiments haveshown that standard font sizes of 9 to 12 points are equally legible, given pro-portional spacing between lines [346]. Similarly line lengths of between 2.3 and 5.2inches (58 and 132 mm) are equally legible. However, there is evidence that readingfrom a computer screen is slower than from a book [244]. This is thought to be due to a number of factors including a longer line length, fewer words to a page,
DESIGN FOCUS
Where’s the middle?
Optical illusions highlight the differences between the way things are and the way we perceive them –and in interface design we need to be aware that we will not always perceive things exactly as they are.The way that objects are composed together will affect the way we perceive them, and we do not per-ceive geometric shapes exactly as they are drawn. For example, we tend to magnify horizontal lines andreduce vertical. So a square needs to be slightly increased in height to appear square and lines willappear thicker if horizontal rather than vertical.
Optical illusions also affect page symmetry. We tend to see the center of a page as being a little abovethe actual center – so if a page is arranged symmetrically around the actual center, we will see it as toolow down. In graphic design this is known as the optical center – and bottom page margins tend to beincreased by 50% to compensate.

1.2 Input–output channels 23
orientation and the familiarity of the medium of the page. These factors can ofcourse be reduced by careful design of textual interfaces.
A final word about the use of contrast in visual display: a negative contrast (darkcharacters on a light screen) provides higher luminance and, therefore, increasedacuity, than a positive contrast. This will in turn increase legibility. However, it willalso be more prone to flicker. Experimental evidence suggests that in practice negat-ive contrast displays are preferred and result in more accurate performance [30].
1.2.2 Hearing
The sense of hearing is often considered secondary to sight, but we tend to under-estimate the amount of information that we receive through our ears. Close your eyesfor a moment and listen. What sounds can you hear? Where are they coming from?What is making them? As I sit at my desk I can hear cars passing on the road outside,machinery working on a site nearby, the drone of a plane overhead and bird song.But I can also tell where the sounds are coming from, and estimate how far away theyare. So from the sounds I hear I can tell that a car is passing on a particular road nearmy house, and which direction it is traveling in. I know that building work is inprogress in a particular location, and that a certain type of bird is perched in the treein my garden.
The auditory system can convey a lot of information about our environment. Buthow does it work?
The human ear
Just as vision begins with light, hearing begins with vibrations in the air or soundwaves. The ear receives these vibrations and transmits them, through various stages,to the auditory nerves. The ear comprises three sections, commonly known as theouter ear, middle ear and inner ear.
The outer ear is the visible part of the ear. It has two parts: the pinna, which is the structure that is attached to the sides of the head, and the auditory canal, alongwhich sound waves are passed to the middle ear. The outer ear serves two purposes.First, it protects the sensitive middle ear from damage. The auditory canal containswax which prevents dust, dirt and over-inquisitive insects reaching the middle ear. It also maintains the middle ear at a constant temperature. Secondly, the pinna andauditory canal serve to amplify some sounds.
The middle ear is a small cavity connected to the outer ear by the tympanicmembrane, or ear drum, and to the inner ear by the cochlea. Within the cavity are theossicles, the smallest bones in the body. Sound waves pass along the auditory canaland vibrate the ear drum which in turn vibrates the ossicles, which transmit thevibrations to the cochlea, and so into the inner ear. This ‘relay’ is required because,unlike the air-filled outer and middle ears, the inner ear is filled with a densercochlean liquid. If passed directly from the air to the liquid, the transmission of thesound waves would be poor. By transmitting them via the ossicles the sound wavesare concentrated and amplified.
24 Chapter 1 n The human
The waves are passed into the liquid-filled cochlea in the inner ear. Within the cochlea are delicate hair cells or cilia that bend because of the vibrations in thecochlean liquid and release a chemical transmitter which causes impulses in theauditory nerve.
Processing sound
As we have seen, sound is changes or vibrations in air pressure. It has a number ofcharacteristics which we can differentiate. Pitch is the frequency of the sound. A lowfrequency produces a low pitch, a high frequency, a high pitch. Loudness is propor-tional to the amplitude of the sound; the frequency remains constant. Timbre relatesto the type of the sound: sounds may have the same pitch and loudness but be madeby different instruments and so vary in timbre. We can also identify a sound’s loca-tion, since the two ears receive slightly different sounds, owing to the time differencebetween the sound reaching the two ears and the reduction in intensity caused by thesound waves reflecting from the head.
The human ear can hear frequencies from about 20 Hz to 15 kHz. It can distin-guish frequency changes of less than 1.5 Hz at low frequencies but is less accurate athigh frequencies. Different frequencies trigger activity in neurons in different partsof the auditory system, and cause different rates of firing of nerve impulses.
The auditory system performs some filtering of the sounds received, allowing usto ignore background noise and concentrate on important information. We areselective in our hearing, as illustrated by the cocktail party effect, where we can pickout our name spoken across a crowded noisy room. However, if sounds are too loud,or frequencies too similar, we are unable to differentiate sound.
As we have seen, sound can convey a remarkable amount of information. It israrely used to its potential in interface design, usually being confined to warningsounds and notifications. The exception is multimedia, which may include music,voice commentary and sound effects. However, the ear can differentiate quite subtlesound changes and can recognize familiar sounds without concentrating attentionon the sound source. This suggests that sound could be used more extensively ininterface design, to convey information about the system state, for example. This isdiscussed in more detail in Chapter 10.
Worked exercise Suggest ideas for an interface which uses the properties of sound effectively.
Answer You might approach this exercise by considering how sound could be added to an appli-cation with which you are familiar. Use your imagination. This is also a good subject fora literature survey (starting with the references in Chapter 10).
Speech sounds can obviously be used to convey information. This is useful not only forthe visually impaired but also for any application where the user’s attention has to bedivided (for example, power plant control, flight control, etc.). Uses of non-speechsounds include the following:
n Attention – to attract the user’s attention to a critical situation or to the end of aprocess, for example.

1.2 Input–output channels 25
n Status information – continuous background sounds can be used to convey statusinformation. For example, monitoring the progress of a process (without the needfor visual attention).
n Confirmation – a sound associated with an action to confirm that the action hasbeen carried out. For example, associating a sound with deleting a file.
n Navigation – using changing sound to indicate where the user is in a system. Forexample, what about sound to support navigation in hypertext?
1.2.3 Touch
The third and last of the senses that we will consider is touch or haptic perception.Although this sense is often viewed as less important than sight or hearing, imaginelife without it. Touch provides us with vital information about our environment. It tells us when we touch something hot or cold, and can therefore act as a warning. Italso provides us with feedback when we attempt to lift an object, for example. Con-sider the act of picking up a glass of water. If we could only see the glass and not feel when our hand made contact with it or feel its shape, the speed and accuracy ofthe action would be reduced. This is the experience of users of certain virtual realitygames: they can see the computer-generated objects which they need to manipulatebut they have no physical sensation of touching them. Watching such users can bean informative and amusing experience! Touch is therefore an important means offeedback, and this is no less so in using computer systems. Feeling buttons depress isan important part of the task of pressing the button. Also, we should be aware that,although for the average person, haptic perception is a secondary source of informa-tion, for those whose other senses are impaired, it may be vitally important. For suchusers, interfaces such as braille may be the primary source of information in theinteraction. We should not therefore underestimate the importance of touch.
The apparatus of touch differs from that of sight and hearing in that it is not local-ized. We receive stimuli through the skin. The skin contains three types of sensoryreceptor: thermoreceptors respond to heat and cold, nociceptors respond to intensepressure, heat and pain, and mechanoreceptors respond to pressure. It is the last ofthese that we are concerned with in relation to human–computer interaction.
There are two kinds of mechanoreceptor, which respond to different types of pressure. Rapidly adapting mechanoreceptors respond to immediate pressure as theskin is indented. These receptors also react more quickly with increased pressure.However, they stop responding if continuous pressure is applied. Slowly adaptingmechanoreceptors respond to continuously applied pressure.
Although the whole of the body contains such receptors, some areas have greatersensitivity or acuity than others. It is possible to measure the acuity of different areasof the body using the two-point threshold test. Take two pencils, held so their tips areabout 12 mm apart. Touch the points to your thumb and see if you can feel twopoints. If you cannot, move the points a little further apart. When you can feel twopoints, measure the distance between them. The greater the distance, the lower thesensitivity. You can repeat this test on different parts of your body. You should find

26 Chapter 1 n The human
that the measure on the forearm is around 10 times that of the finger or thumb. Thefingers and thumbs have the highest acuity.
A second aspect of haptic perception is kinesthesis: awareness of the position of the body and limbs. This is due to receptors in the joints. Again there are three types: rapidly adapting, which respond when a limb is moved in a particular direc-tion; slowly adapting, which respond to both movement and static position; andpositional receptors, which only respond when a limb is in a static position. This perception affects both comfort and performance. For example, for a touch typist,awareness of the relative positions of the fingers and feedback from the keyboard arevery important.
1.2.4 Movement
Before leaving this section on the human’s input–output channels, we need to consider motor control and how the way we move affects our interaction with com-puters. A simple action such as hitting a button in response to a question involves a number of processing stages. The stimulus (of the question) is received through the sensory receptors and transmitted to the brain. The question is processed and avalid response generated. The brain then tells the appropriate muscles to respond.Each of these stages takes time, which can be roughly divided into reaction time andmovement time.
Movement time is dependent largely on the physical characteristics of the subjects:their age and fitness, for example. Reaction time varies according to the sensorychannel through which the stimulus is received. A person can react to an auditory
Handling the goods
E-commerce has become very successful in some areas of sales, such as travel services,books and CDs, and food. However, in some retail areas, such as clothes shopping, e-commercehas been less successful. Why?
When buying train and airline tickets and, to some extent, books and food, the experience of shop-ping is less important than the convenience. So, as long as we know what we want, we are happyto shop online. With clothes, the experience of shopping is far more important. We need to beable to handle the goods, feel the texture of the material, check the weight to test quality. Even ifwe know that something will fit us we still want to be able to handle it before buying.
Research into haptic interaction (see Chapter 2 and Chapter 10) is looking at ways of solving thisproblem. By using special force feedback and tactile hardware, users are able to feel surfaces and shape. For example, a demonstration environment called TouchCity allows people to walkaround a virtual shopping mall, pick up products and feel their texture and weight. A key problemwith the commercial use of such an application, however, is that the haptic experience requiresexpensive hardware not yet available to the average e-shopper. However, in future, such immer-sive e-commerce experiences are likely to be the norm. (See www.novint.com/)
1.3 Human memory 27
signal in approximately 150 ms, to a visual signal in 200 ms and to pain in 700 ms.However, a combined signal will result in the quickest response. Factors such as skillor practice can reduce reaction time, and fatigue can increase it.
A second measure of motor skill is accuracy. One question that we should ask iswhether speed of reaction results in reduced accuracy. This is dependent on the taskand the user. In some cases, requiring increased reaction time reduces accuracy. Thisis the premise behind many arcade and video games where less skilled users fail atlevels of play that require faster responses. However, for skilled operators this is notnecessarily the case. Studies of keyboard operators have shown that, although thefaster operators were up to twice as fast as the others, the slower ones made 10 timesthe errors.
Speed and accuracy of movement are important considerations in the design of interactive systems, primarily in terms of the time taken to move to a particulartarget on a screen. The target may be a button, a menu item or an icon, for example.The time taken to hit a target is a function of the size of the target and the distancethat has to be moved. This is formalized in Fitts’ law [135]. There are many vari-ations of this formula, which have varying constants, but they are all very similar.One common form is
Movement time = a + b log2(distance/size + 1)
where a and b are empirically determined constants.This affects the type of target we design. Since users will find it more difficult
to manipulate small objects, targets should generally be as large as possible and the distance to be moved as small as possible. This has led to suggestions that pie-chart-shaped menus are preferable to lists since all options are equidistant. However,the trade-off is increased use of screen estate, so the choice may not be so simple. If lists are used, the most frequently used options can be placed closest to the user’sstart point (for example, at the top of the menu). The implications of Fitts’ law indesign are discussed in more detail in Chapter 12.
HUMAN MEMORY
Have you ever played the memory game? The idea is that each player has to recounta list of objects and add one more to the end. There are many variations but theobjects are all loosely related: ‘I went to the market and bought a lemon, someoranges, bacon . . .’ or ‘I went to the zoo and saw monkeys, and lions, and tigers . . .’and so on. As the list grows objects are missed out or recalled in the wrong order andso people are eliminated from the game. The winner is the person remaining at theend. Such games rely on our ability to store and retrieve information, even seeminglyarbitrary items. This is the job of our memory system.
Indeed, much of our everyday activity relies on memory. As well as storing all ourfactual knowledge, our memory contains our knowledge of actions or procedures.
1.3

28 Chapter 1 n The human
It allows us to repeat actions, to use language, and to use new information receivedvia our senses. It also gives us our sense of identity, by preserving information fromour past experiences.
But how does our memory work? How do we remember arbitrary lists such asthose generated in the memory game? Why do some people remember more easilythan others? And what happens when we forget?
In order to answer questions such as these, we need to understand some of thecapabilities and limitations of human memory. Memory is the second part of ourmodel of the human as an information-processing system. However, as we notedearlier, such a division is simplistic since, as we shall see, memory is associated witheach level of processing. Bearing this in mind, we will consider the way in whichmemory is structured and the activities that take place within the system.
It is generally agreed that there are three types of memory or memory function:sensory buffers, short-term memory or working memory, and long-term memory. Thereis some disagreement as to whether these are three separate systems or differentfunctions of the same system. We will not concern ourselves here with the details of this debate, which is discussed in detail by Baddeley [21], but will indicate the evidence used by both sides as we go along. For our purposes, it is sufficient to notethree separate types of memory. These memories interact, with information beingprocessed and passed between memory stores, as shown in Figure 1.9.
1.3.1 Sensory memory
The sensory memories act as buffers for stimuli received through the senses. A sensory memory exists for each sensory channel: iconic memory for visual stimuli,echoic memory for aural stimuli and haptic memory for touch. These memories areconstantly overwritten by new information coming in on these channels.
We can demonstrate the existence of iconic memory by moving a finger in frontof the eye. Can you see it in more than one place at once? This indicates a persistenceof the image after the stimulus has been removed. A similar effect is noticed mostvividly at firework displays where moving sparklers leave a persistent image.Information remains in iconic memory very briefly, in the order of 0.5 seconds.
Similarly, the existence of echoic memory is evidenced by our ability to ascertainthe direction from which a sound originates. This is due to information beingreceived by both ears. However, since this information is received at different times,we must store the stimulus in the meantime. Echoic memory allows brief ‘play-back’
Figure 1.9 A model of the structure of memory
1.3 Human memory 29
of information. Have you ever had someone ask you a question when you are reading? You ask them to repeat the question, only to realize that you know what wasasked after all. This experience, too, is evidence of the existence of echoic memory.
Information is passed from sensory memory into short-term memory by atten-tion, thereby filtering the stimuli to only those which are of interest at a given time.Attention is the concentration of the mind on one out of a number of competingstimuli or thoughts. It is clear that we are able to focus our attention selectively,choosing to attend to one thing rather than another. This is due to the limited capa-city of our sensory and mental processes. If we did not selectively attend to the stimuli coming into our senses, we would be overloaded. We can choose which stimulito attend to, and this choice is governed to an extent by our arousal, our level ofinterest or need. This explains the cocktail party phenomenon mentioned earlier: we can attend to one conversation over the background noise, but we may choose to switch our attention to a conversation across the room if we hear our name mentioned. Information received by sensory memories is quickly passed into a morepermanent memory store, or overwritten and lost.
1.3.2 Short-term memory
Short-term memory or working memory acts as a ‘scratch-pad’ for temporary recallof information. It is used to store information which is only required fleetingly. Forexample, calculate the multiplication 35 × 6 in your head. The chances are that youwill have done this calculation in stages, perhaps 5 × 6 and then 30 × 6 and added the results; or you may have used the fact that 6 = 2 × 3 and calculated 2 × 35 = 70followed by 3 × 70. To perform calculations such as this we need to store the inter-mediate stages for use later. Or consider reading. In order to comprehend this sentence you need to hold in your mind the beginning of the sentence as you readthe rest. Both of these tasks use short-term memory.
Short-term memory can be accessed rapidly, in the order of 70 ms. However, italso decays rapidly, meaning that information can only be held there temporarily, inthe order of 200 ms.
Short-term memory also has a limited capacity. There are two basic methods formeasuring memory capacity. The first involves determining the length of a sequencewhich can be remembered in order. The second allows items to be freely recalled inany order. Using the first measure, the average person can remember 7 ± 2 digits.This was established in experiments by Miller [234]. Try it. Look at the followingnumber sequence:
265397620853
Now write down as much of the sequence as you can remember. Did you get it allright? If not, how many digits could you remember? If you remembered between fiveand nine digits your digit span is average.
Now try the following sequence:
44 113 245 8920

30 Chapter 1 n The human
Did you recall that more easily? Here the digits are grouped or chunked. A general-ization of the 7 ± 2 rule is that we can remember 7 ± 2 chunks of information.Therefore chunking information can increase the short-term memory capacity. Thelimited capacity of short-term memory produces a subconscious desire to createchunks, and so optimize the use of the memory. The successful formation of a chunkis known as closure. This process can be generalized to account for the desire to com-plete or close tasks held in short-term memory. If a subject fails to do this or is pre-vented from doing so by interference, the subject is liable to lose track of what she isdoing and make consequent errors.
DESIGN FOCUS
Cashing in
Closure gives you a nice ‘done it’ when we complete some part of a task. At this point our minds havea tendency to flush short-term memory in order to get on with the next job. Early automatic tellermachines (ATMs) gave the customer money before returning their bank card. On receiving the moneythe customer would reach closure and hence often forget to take the card. Modern ATMs return thecard first!
The sequence of chunks given above also makes use of pattern abstraction: it iswritten in the form of a UK telephone number which makes it easier to remember.We may even recognize the first sets of digits as the international code for the UKand the dialing code for Leeds – chunks of information. Patterns can be useful as aids

1.3 Human memory 31
to memory. For example, most people would have difficulty remembering the fol-lowing sequence of chunks:
HEC ATR ANU PTH ETR EET
However, if you notice that by moving the last character to the first position, you getthe statement ‘the cat ran up the tree’, the sequence is easy to recall.
In experiments where subjects were able to recall words freely, evidence shows thatrecall of the last words presented is better than recall of those in the middle [296].This is known as the recency effect. However, if the subject is asked to performanother task between presentation and recall (for example, counting backwards) therecency effect is eliminated. The recall of the other words is unaffected. This suggeststhat short-term memory recall is damaged by interference of other information.However, the fact that this interference does not affect recall of earlier items providessome evidence for the existence of separate long-term and short-term memories. Theearly items are held in a long-term store which is unaffected by the recency effect.
Interference does not necessarily impair recall in short-term memory. Baddeley askedsubjects to remember six-digit numbers and attend to sentence processing at the sametime [21]. They were asked to answer questions on sentences, such as ‘A precedes B:AB is true or false?’. Surprisingly, this did not result in interference, suggesting thatin fact short-term memory is not a unitary system but is made up of a number ofcomponents, including a visual channel and an articulatory channel. The task of sen-tence processing used the visual channel, while the task of remembering digits usedthe articulatory channel, so interference only occurs if tasks utilize the same channel.
These findings led Baddeley to propose a model of working memory that incorp-orated a number of elements together with a central processing executive. This isillustrated in Figure 1.10.
Figure 1.10 A more detailed model of short-term memory

32 Chapter 1 n The human
1.3.3 Long-term memory
If short-term memory is our working memory or ‘scratch-pad’, long-term memoryis our main resource. Here we store factual information, experiential knowledge,procedural rules of behavior – in fact, everything that we ‘know’. It differs fromshort-term memory in a number of significant ways. First, it has a huge, if not unlim-ited, capacity. Secondly, it has a relatively slow access time of approximately a tenthof a second. Thirdly, forgetting occurs more slowly in long-term memory, if at all.These distinctions provide further evidence of a memory structure with several parts.
Long-term memory is intended for the long-term storage of information.Information is placed there from working memory through rehearsal. Unlike work-ing memory there is little decay: long-term recall after minutes is the same as thatafter hours or days.
Long-term memory structure
There are two types of long-term memory: episodic memory and semantic memory.Episodic memory represents our memory of events and experiences in a serial form.It is from this memory that we can reconstruct the actual events that took place at agiven point in our lives. Semantic memory, on the other hand, is a structured recordof facts, concepts and skills that we have acquired. The information in semanticmemory is derived from that in our episodic memory, such that we can learn newfacts or concepts from our experiences.
Semantic memory is structured in some way to allow access to information, representation of relationships between pieces of information, and inference. Onemodel for the way in which semantic memory is structured is as a network. Items are
DESIGN FOCUS
7 ± 2 revisited
When we looked at short-term memory, we noted the general rule that people can hold 7 ± 2 itemsor chunks of information in short-term memory. It is a principle that people tend to remember but itcan be misapplied. For example, it is often suggested that this means that lists, menus and other groupsof items should be designed to be no more than 7 items long. But use of menus and lists of course haslittle to do with short-term memory – they are available in the environment as cues and so do not needto be remembered.
On the other hand the 7 ± 2 rule would apply in command line interfaces. Imagine a scenario where aUNIX user looks up a command in the manual. Perhaps the command has a number of parameters ofoptions, to be applied in a particular order, and it is going to be applied to several files that have longpath names. The user then has to hold the command, its parameters and the file path names in short-term memory while he types them in. Here we could say that the task may cause problems if the num-ber of items or chunks in the command line string is more than 7.

1.3 Human memory 33
associated to each other in classes, and may inherit attributes from parent classes.This model is known as a semantic network. As an example, our knowledge aboutdogs may be stored in a network such as that shown in Figure 1.11.
Specific breed attributes may be stored with each given breed, yet general doginformation is stored at a higher level. This allows us to generalize about specificcases. For instance, we may not have been told that the sheepdog Shadow has fourlegs and a tail, but we can infer this information from our general knowledge aboutsheepdogs and dogs in general. Note also that there are connections within the net-work which link into other domains of knowledge, for example cartoon characters.This illustrates how our knowledge is organized by association.
The viability of semantic networks as a model of memory organization has beendemonstrated by Collins and Quillian [74]. Subjects were asked questions about different properties of related objects and their reaction times were measured. Thetypes of question asked (taking examples from our own network) were ‘Can a colliebreathe?’, ‘Is a beagle a hound?’ and ‘Does a hound track?’ In spite of the fact that theanswers to such questions may seem obvious, subjects took longer to answer ques-tions such as ‘Can a collie breathe?’ than ones such as ‘Does a hound track?’ The reason for this, it is suggested, is that in the former case subjects had to search fur-ther through the memory hierarchy to find the answer, since information is stored at its most abstract level.
A number of other memory structures have been proposed to explain how we represent and store different types of knowledge. Each of these represents a different
Figure 1.11 Long-term memory may store information in a semantic network

34 Chapter 1 n The human
aspect of knowledge and, as such, the models can be viewed as complementary ratherthan mutually exclusive. Semantic networks represent the associations and relation-ships between single items in memory. However, they do not allow us to model therepresentation of more complex objects or events, which are perhaps composed of a number of items or activities. Structured representations such as frames and scriptsorganize information into data structures. Slots in these structures allow attributevalues to be added. Frame slots may contain default, fixed or variable information. A frame is instantiated when the slots are filled with appropriate values. Frames and scripts can be linked together in networks to represent hierarchical structuredknowledge.
Returning to the ‘dog’ domain, a frame-based representation of the knowledgemay look something like Figure 1.12. The fixed slots are those for which the attributevalue is set, default slots represent the usual attribute value, although this may beoverridden in particular instantiations (for example, the Basenji does not bark), andvariable slots can be filled with particular values in a given instance. Slots can alsocontain procedural knowledge. Actions or operations can be associated with a slotand performed, for example, whenever the value of the slot is changed.
Frames extend semantic nets to include structured, hierarchical information. Theyrepresent knowledge items in a way which makes explicit the relative importance ofeach piece of information.
Scripts attempt to model the representation of stereotypical knowledge about situ-ations. Consider the following sentence:
John took his dog to the surgery. After seeing the vet, he left.
From our knowledge of the activities of dog owners and vets, we may fill in a substantial amount of detail. The animal was ill. The vet examined and treated theanimal. John paid for the treatment before leaving. We are less likely to assume thealternative reading of the sentence, that John took an instant dislike to the vet onsight and did not stay long enough to talk to him!
Figure 1.12 A frame-based representation of knowledge
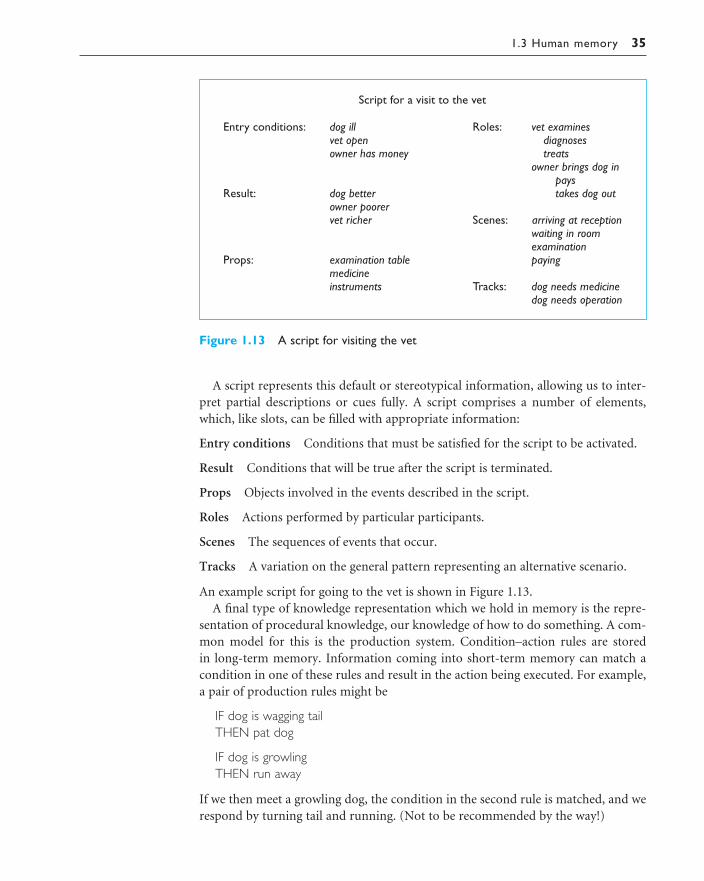
1.3 Human memory 35
A script represents this default or stereotypical information, allowing us to inter-pret partial descriptions or cues fully. A script comprises a number of elements,which, like slots, can be filled with appropriate information:
Entry conditions Conditions that must be satisfied for the script to be activated.
Result Conditions that will be true after the script is terminated.
Props Objects involved in the events described in the script.
Roles Actions performed by particular participants.
Scenes The sequences of events that occur.
Tracks A variation on the general pattern representing an alternative scenario.
An example script for going to the vet is shown in Figure 1.13.A final type of knowledge representation which we hold in memory is the repre-
sentation of procedural knowledge, our knowledge of how to do something. A com-mon model for this is the production system. Condition–action rules are stored in long-term memory. Information coming into short-term memory can match acondition in one of these rules and result in the action being executed. For example,a pair of production rules might be
IF dog is wagging tailTHEN pat dog
IF dog is growlingTHEN run away
If we then meet a growling dog, the condition in the second rule is matched, and werespond by turning tail and running. (Not to be recommended by the way!)
Figure 1.13 A script for visiting the vet

36 Chapter 1 n The human
Long-term memory processes
So much for the structure of memory, but what about the processes which it uses?There are three main activities related to long-term memory: storage or remember-ing of information, forgetting and information retrieval. We shall consider each ofthese in turn.
First, how does information get into long-term memory and how can we improvethis process? Information from short-term memory is stored in long-term memory byrehearsal. The repeated exposure to a stimulus or the rehearsal of a piece of informa-tion transfers it into long-term memory.
This process can be optimized in a number of ways. Ebbinghaus performednumerous experiments on memory, using himself as a subject [117]. In these experi-ments he tested his ability to learn and repeat nonsense syllables, comparing hisrecall minutes, hours and days after the learning process. He discovered that theamount learned was directly proportional to the amount of time spent learning. This is known as the total time hypothesis. However, experiments by Baddeley andothers suggest that learning time is most effective if it is distributed over time [22].For example, in an experiment in which Post Office workers were taught to type, those whose training period was divided into weekly sessions of one hour performedbetter than those who spent two or four hours a week learning (although the formerobviously took more weeks to complete their training). This is known as the distribu-tion of practice effect.
However, repetition is not enough to learn information well. If information is not meaningful it is more difficult to remember. This is illustrated by the fact that it is more difficult to remember a set of words representing concepts than a set ofwords representing objects. Try it. First try to remember the words in list A and testyourself.
List A: Faith Age Cold Tenet Quiet Logic Idea Value Past Large
Now try list B.
List B: Boat Tree Cat Child Rug Plate Church Gun Flame Head
The second list was probably easier to remember than the first since you could visualize the objects in the second list.
Sentences are easier still to memorize. Bartlett performed experiments on remem-bering meaningful information (as opposed to meaningless such as Ebbinghausused) [28]. In one such experiment he got subjects to learn a story about an un-familiar culture and then retell it. He found that subjects would retell the storyreplacing unfamiliar words and concepts with words which were meaningful tothem. Stories were effectively translated into the subject’s own culture. This is relatedto the semantic structuring of long-term memory: if information is meaningful andfamiliar, it can be related to existing structures and more easily incorporated intomemory.

1.3 Human memory 37
So if structure, familiarity and concreteness help us in learning information, whatcauses us to lose this information, to forget? There are two main theories of forget-ting: decay and interference. The first theory suggests that the information held inlong-term memory may eventually be forgotten. Ebbinghaus concluded from hisexperiments with nonsense syllables that information in memory decayed logarith-mically, that is that it was lost rapidly to begin with, and then more slowly. Jost’s law,which follows from this, states that if two memory traces are equally strong at a giventime the older one will be more durable.
The second theory is that information is lost from memory through interference.If we acquire new information it causes the loss of old information. This is termedretroactive interference. A common example of this is the fact that if you change tele-phone numbers, learning your new number makes it more difficult to rememberyour old number. This is because the new association masks the old. However, some-times the old memory trace breaks through and interferes with new information.This is called proactive inhibition. An example of this is when you find yourself driv-ing to your old house rather than your new one.
Forgetting is also affected by emotional factors. In experiments, subjects givenemotive words and non-emotive words found the former harder to remember in the short term but easier in the long term. Indeed, this observation tallies with ourexperience of selective memory. We tend to remember positive information ratherthan negative (hence nostalgia for the ‘good old days’), and highly emotive eventsrather than mundane.
Memorable or secure?
As online activities become more widespread, people are having to remember more andmore access information, such as passwords and security checks. The average active internet usermay have separate passwords and user names for several email accounts, mailing lists, e-shoppingsites, e-banking, online auctions and more! Remembering these passwords is not easy.
From a security perspective it is important that passwords are random. Words and names are veryeasy to crack, hence the recommendation that passwords are frequently changed and constructedfrom random strings of letters and numbers. But in reality these are the hardest things for people tocommit to memory. Hence many people will use the same password for all their online activities(rarely if ever changing it) and will choose a word or a name that is easy for them to remember,in spite of the obviously increased security risks. Security here is in conflict with memorability!
A solution to this is to construct a nonsense password out of letters or numbers that will havemeaning to you but will not make up a word in a dictionary (e.g. initials of names, numbers fromsignificant dates or postcodes, and so on). Then what is remembered is the meaningful rule forconstructing the password, and not a meaningless string of alphanumeric characters.

38 Chapter 1 n The human
It is debatable whether we ever actually forget anything or whether it just becomesincreasingly difficult to access certain items from memory. This question is in someways moot since it is impossible to prove that we do forget: appearing to have for-gotten something may just be caused by not being able to retrieve it! However, thereis evidence to suggest that we may not lose information completely from long-termmemory. First, proactive inhibition demonstrates the recovery of old informationeven after it has been ‘lost’ by interference. Secondly, there is the ‘tip of the tongue’experience, which indicates that some information is present but cannot be satisfac-torily accessed. Thirdly, information may not be recalled but may be recognized, ormay be recalled only with prompting.
This leads us to the third process of memory: information retrieval. Here we needto distinguish between two types of information retrieval, recall and recognition. Inrecall the information is reproduced from memory. In recognition, the presentationof the information provides the knowledge that the information has been seenbefore. Recognition is the less complex cognitive activity since the information isprovided as a cue.
However, recall can be assisted by the provision of retrieval cues, which enable the subject quickly to access the information in memory. One such cue is the use ofcategories. In an experiment subjects were asked to recall lists of words, some ofwhich were organized into categories and some of which were randomly organized.The words that were related to a category were easier to recall than the others [38].Recall is even more successful if subjects are allowed to categorize their own lists ofwords during learning. For example, consider the following list of words:
child red plane dog friend blood cold tree big angry
Now make up a story that links the words using as vivid imagery as possible. Now tryto recall as many of the words as you can. Did you find this easier than the previousexperiment where the words were unrelated?
The use of vivid imagery is a common cue to help people remember information.It is known that people often visualize a scene that is described to them. They canthen answer questions based on their visualization. Indeed, subjects given a descrip-tion of a scene often embellish it with additional information. Consider the follow-ing description and imagine the scene:
The engines roared above the noise of the crowd. Even in the blistering heat peoplerose to their feet and waved their hands in excitement. The flag fell and they were off.Within seconds the car had pulled away from the pack and was careering round thebend at a desperate pace. Its wheels momentarily left the ground as it cornered.Coming down the straight the sun glinted on its shimmering paint. The driver grippedthe wheel with fierce concentration. Sweat lay in fine drops on his brow.
Without looking back to the passage, what color is the car?If you could answer that question you have visualized the scene, including the
car’s color. In fact, the color of the car is not mentioned in the description at all.

1.4 Thinking: reasoning and problem solving 39
THINKING: REASONING AND PROBLEM SOLVING
We have considered how information finds its way into and out of the human system and how it is stored. Finally, we come to look at how it is processed andmanipulated. This is perhaps the area which is most complex and which separates
1.4
Improve your memory
Many people can perform astonishing feats of memory: recalling the sequence of cards in apack (or multiple packs – up to six have been reported), or recounting π to 1000 decimal places,for example. There are also adverts to ‘Improve Your Memory’ (usually leading to success, orwealth, or other such inducement), and so the question arises: can you improve your memory abilities? The answer is yes; this exercise shows you one technique.
Look at the list below of numbers and associated words:
1 bun 6 sticks2 shoe 7 heaven3 tree 8 gate4 door 9 wine5 hive 10 hen
Notice that the words sound similar to the numbers. Now think about the words one at a timeand visualize them, in as much detail as possible. For example, for ‘1’, think of a large, sticky icedbun, the base spiralling round and round, with raisins in it, covered in sweet, white, gooey icing.Now do the rest, using as much visualization as you can muster: imagine how things would look,smell, taste, sound, and so on.
This is your reference list, and you need to know it off by heart.
Having learnt it, look at a pile of at least a dozen odd items collected together by a colleague. Thetask is to look at the collection of objects for only 30 seconds, and then list as many as possiblewithout making a mistake or viewing the collection again. Most people can manage between fiveand eight items, if they do not know any memory-enhancing techniques like the following.
Mentally pick one (say, for example, a paper clip), and call it number one. Now visualize it inter-acting with the bun. It can get stuck into the icing on the top of the bun, and make your fingers allgooey and sticky when you try to remove it. If you ate the bun without noticing, you’d get acrunched tooth when you bit into it – imagine how that would feel. When you’ve really got agraphic scenario developed, move on to the next item, call it number two, and again visualize itinteracting with the reference item, shoe. Continue down your list, until you have done 10 things.
This should take you about the 30 seconds allowed. Then hide the collection and try and recall thenumbers in order, the associated reference word, and then the image associated with that word.You should find that you can recall the 10 associated items practically every time. The techniquecan be easily extended by extending your reference list.

40 Chapter 1 n The human
humans from other information-processing systems, both artificial and natural.Although it is clear that animals receive and store information, there is little evid-ence to suggest that they can use it in quite the same way as humans. Similarly,artificial intelligence has produced machines which can see (albeit in a limited way)and store information. But their ability to use that information is limited to smalldomains.
Humans, on the other hand, are able to use information to reason and solve problems, and indeed do these activities when the information is partial or unavail-able. Human thought is conscious and self-aware: while we may not always be able to identify the processes we use, we can identify the products of these processes,our thoughts. In addition, we are able to think about things of which we have no experience, and solve problems which we have never seen before. How is thisdone?
Thinking can require different amounts of knowledge. Some thinking activitiesare very directed and the knowledge required is constrained. Others require vastamounts of knowledge from different domains. For example, performing a subtrac-tion calculation requires a relatively small amount of knowledge, from a constraineddomain, whereas understanding newspaper headlines demands knowledge of pol-itics, social structures, public figures and world events.
In this section we will consider two categories of thinking: reasoning and problemsolving. In practice these are not distinct since the activity of solving a problem maywell involve reasoning and vice versa. However, the distinction is a common one andis helpful in clarifying the processes involved.
1.4.1 Reasoning
Reasoning is the process by which we use the knowledge we have to draw conclusionsor infer something new about the domain of interest. There are a number of differ-ent types of reasoning: deductive, inductive and abductive. We use each of these typesof reasoning in everyday life, but they differ in significant ways.
Deductive reasoning
Deductive reasoning derives the logically necessary conclusion from the given pre-mises. For example,
If it is Friday then she will go to workIt is FridayTherefore she will go to work.
It is important to note that this is the logical conclusion from the premises; it doesnot necessarily have to correspond to our notion of truth. So, for example,
If it is raining then the ground is dryIt is rainingTherefore the ground is dry.

1.4 Thinking: reasoning and problem solving 41
is a perfectly valid deduction, even though it conflicts with our knowledge of what istrue in the world.
Deductive reasoning is therefore often misapplied. Given the premises
Some people are babiesSome babies cry
many people will infer that ‘Some people cry’. This is in fact an invalid deductionsince we are not told that all babies are people. It is therefore logically possible thatthe babies who cry are those who are not people.
It is at this point, where truth and validity clash, that human deduction is poorest.One explanation for this is that people bring their world knowledge into the reason-ing process. There is good reason for this. It allows us to take short cuts which makedialog and interaction between people informative but efficient. We assume a certainamount of shared knowledge in our dealings with each other, which in turn allowsus to interpret the inferences and deductions implied by others. If validity ratherthan truth was preferred, all premises would have to be made explicit.
Inductive reasoning
Induction is generalizing from cases we have seen to infer information about caseswe have not seen. For example, if every elephant we have ever seen has a trunk, weinfer that all elephants have trunks. Of course, this inference is unreliable and cannotbe proved to be true; it can only be proved to be false. We can disprove the inferencesimply by producing an elephant without a trunk. However, we can never prove ittrue because, no matter how many elephants with trunks we have seen or are knownto exist, the next one we see may be trunkless. The best that we can do is gather evid-ence to support our inductive inference.
In spite of its unreliability, induction is a useful process, which we use constantlyin learning about our environment. We can never see all the elephants that have everlived or will ever live, but we have certain knowledge about elephants which we areprepared to trust for all practical purposes, which has largely been inferred by induc-tion. Even if we saw an elephant without a trunk, we would be unlikely to move fromour position that ‘All elephants have trunks’, since we are better at using positivethan negative evidence. This is illustrated in an experiment first devised by Wason[365]. You are presented with four cards as in Figure 1.14. Each card has a numberon one side and a letter on the other. Which cards would you need to pick up to testthe truth of the statement ‘If a card has a vowel on one side it has an even numberon the other’?
A common response to this (was it yours?) is to check the E and the 4. However,this uses only positive evidence. In fact, to test the truth of the statement we need tocheck negative evidence: if we can find a card which has an odd number on one sideand a vowel on the other we have disproved the statement. We must therefore checkE and 7. (It does not matter what is on the other side of the other cards: the state-ment does not say that all even numbers have vowels, just that all vowels have evennumbers.)
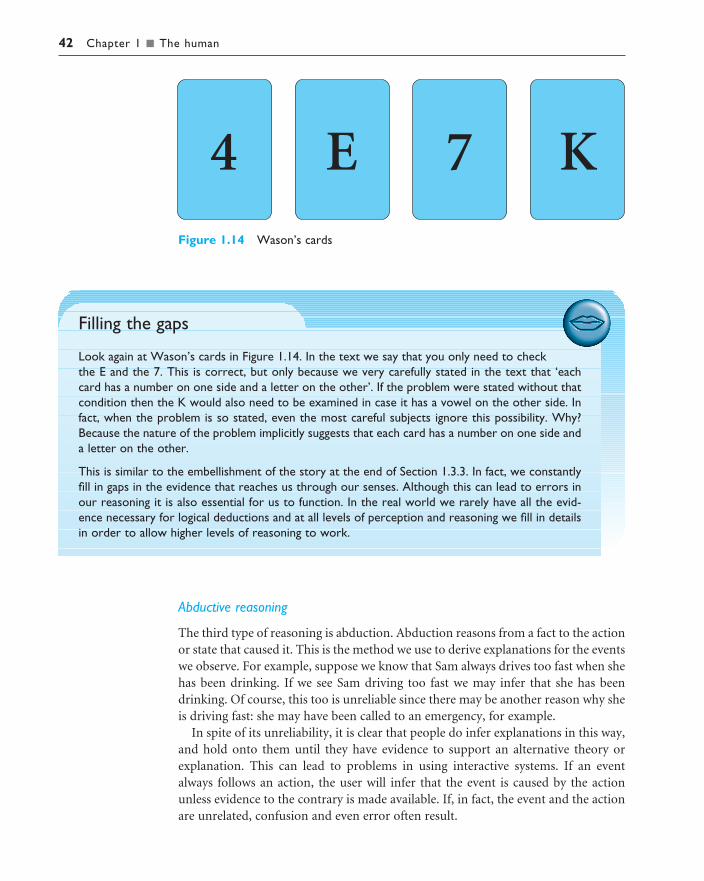
42 Chapter 1 n The human
Abductive reasoning
The third type of reasoning is abduction. Abduction reasons from a fact to the actionor state that caused it. This is the method we use to derive explanations for the eventswe observe. For example, suppose we know that Sam always drives too fast when shehas been drinking. If we see Sam driving too fast we may infer that she has beendrinking. Of course, this too is unreliable since there may be another reason why sheis driving fast: she may have been called to an emergency, for example.
In spite of its unreliability, it is clear that people do infer explanations in this way,and hold onto them until they have evidence to support an alternative theory orexplanation. This can lead to problems in using interactive systems. If an eventalways follows an action, the user will infer that the event is caused by the actionunless evidence to the contrary is made available. If, in fact, the event and the actionare unrelated, confusion and even error often result.
Figure 1.14 Wason’s cards
Filling the gaps
Look again at Wason’s cards in Figure 1.14. In the text we say that you only need to checkthe E and the 7. This is correct, but only because we very carefully stated in the text that ‘eachcard has a number on one side and a letter on the other’. If the problem were stated without thatcondition then the K would also need to be examined in case it has a vowel on the other side. Infact, when the problem is so stated, even the most careful subjects ignore this possibility. Why?Because the nature of the problem implicitly suggests that each card has a number on one side anda letter on the other.
This is similar to the embellishment of the story at the end of Section 1.3.3. In fact, we constantlyfill in gaps in the evidence that reaches us through our senses. Although this can lead to errors inour reasoning it is also essential for us to function. In the real world we rarely have all the evid-ence necessary for logical deductions and at all levels of perception and reasoning we fill in detailsin order to allow higher levels of reasoning to work.

1.4 Thinking: reasoning and problem solving 43
1.4.2 Problem solving
If reasoning is a means of inferring new information from what is already known,problem solving is the process of finding a solution to an unfamiliar task, using theknowledge we have. Human problem solving is characterized by the ability to adaptthe information we have to deal with new situations. However, often solutions seemto be original and creative. There are a number of different views of how people solve problems. The earliest, dating back to the first half of the twentieth century, isthe Gestalt view that problem solving involves both reuse of knowledge and insight.This has been largely superseded but the questions it was trying to address remainand its influence can be seen in later research. A second major theory, proposed inthe 1970s by Newell and Simon, was the problem space theory, which takes the viewthat the mind is a limited information processor. Later variations on this drew on theearlier theory and attempted to reinterpret Gestalt theory in terms of information-processing theories. We will look briefly at each of these views.
Gestalt theory
Gestalt psychologists were answering the claim, made by behaviorists, that prob-lem solving is a matter of reproducing known responses or trial and error. Thisexplanation was considered by the Gestalt school to be insufficient to account forhuman problem-solving behavior. Instead, they claimed, problem solving is both pro-ductive and reproductive. Reproductive problem solving draws on previous experi-ence as the behaviorists claimed, but productive problem solving involves insight andrestructuring of the problem. Indeed, reproductive problem solving could be a hind-rance to finding a solution, since a person may ‘fixate’ on the known aspects of theproblem and so be unable to see novel interpretations that might lead to a solution.
Gestalt psychologists backed up their claims with experimental evidence. Kohlerprovided evidence of apparent insight being demonstrated by apes, which heobserved joining sticks together in order to reach food outside their cages [202].However, this was difficult to verify since the apes had once been wild and so couldhave been using previous knowledge.
Other experiments observed human problem-solving behavior. One well-knownexample of this is Maier’s pendulum problem [224]. The problem was this: the subjects were in a room with two pieces of string hanging from the ceiling. Also inthe room were other objects including pliers, poles and extensions. The task set was to tie the pieces of string together. However, they were too far apart to catch hold of both at once. Although various solutions were proposed by subjects, few chose to use the weight of the pliers as a pendulum to ‘swing’ the strings together. How-ever, when the experimenter brushed against the string, setting it in motion, thissolution presented itself to subjects. Maier interpreted this as an example of produc-tive restructuring. The movement of the string had given insight and allowed thesubjects to see the problem in a new way. The experiment also illustrates fixation:subjects were initially unable to see beyond their view of the role or use of a pair of pliers.

44 Chapter 1 n The human
Although Gestalt theory is attractive in terms of its description of human problemsolving, it does not provide sufficient evidence or structure to support its theories. It does not explain when restructuring occurs or what insight is, for example. How-ever, the move away from behaviorist theories was helpful in paving the way for theinformation-processing theory that was to follow.
Problem space theory
Newell and Simon proposed that problem solving centers on the problem space. Theproblem space comprises problem states, and problem solving involves generatingthese states using legal state transition operators. The problem has an initial state and a goal state and people use the operators to move from the former to the latter.Such problem spaces may be huge, and so heuristics are employed to select appro-priate operators to reach the goal. One such heuristic is means–ends analysis. Inmeans–ends analysis the initial state is compared with the goal state and an oper-ator chosen to reduce the difference between the two. For example, imagine you arereorganizing your office and you want to move your desk from the north wall of theroom to the window. Your initial state is that the desk is at the north wall. The goalstate is that the desk is by the window. The main difference between these two is thelocation of your desk. You have a number of operators which you can apply to mov-ing things: you can carry them or push them or drag them, etc. However, you knowthat to carry something it must be light and that your desk is heavy. You thereforehave a new subgoal: to make the desk light. Your operators for this may involveremoving drawers, and so on.
An important feature of Newell and Simon’s model is that it operates within theconstraints of the human processing system, and so searching the problem space islimited by the capacity of short-term memory, and the speed at which informationcan be retrieved. Within the problem space framework, experience allows us to solveproblems more easily since we can structure the problem space appropriately andchoose operators efficiently.
Newell and Simon’s theory, and their General Problem Solver model which is basedon it, have largely been applied to problem solving in well-defined domains, forexample solving puzzles. These problems may be unfamiliar but the knowledge thatis required to solve them is present in the statement of the problem and the expectedsolution is clear. In real-world problems finding the knowledge required to solve the problem may be part of the problem, or specifying the goal may be difficult.Problems such as these require significant domain knowledge: for example, to solvea programming problem you need knowledge of the language and the domain inwhich the program operates. In this instance specifying the goal clearly may be asignificant part of solving the problem.
However, the problem space framework provides a clear theory of problem solving, which can be extended, as we shall see when we look at skill acquisition inthe next section, to deal with knowledge-intensive problem solving. First we will lookbriefly at the use of analogy in problem solving.

1.4 Thinking: reasoning and problem solving 45
Worked exercise Identify the goals and operators involved in the problem ‘delete the second paragraph of thedocument’ on a word processor. Now use a word processor to delete a paragraph and noteyour actions, goals and subgoals. How well did they match your earlier description?
Answer Assume you have a document open and you are at some arbitrary position within it.You also need to decide which operators are available and what their preconditions andresults are. Based on an imaginary word processor we assume the following operators(you may wish to use your own WP package):
Operator Precondition Result
delete_paragraph Cursor at start of paragraph Paragraph deletedmove_to_paragraph Cursor anywhere in document Cursor moves to start of
next paragraph (except where there is no next paragraph when no effect)
move_to_start Cursor anywhere in document Cursor at start of document
Goal: delete second paragraph in documentLooking at the operators an obvious one to resolve this goal is delete_paragraph whichhas the precondition ‘cursor at start of paragraph’. We therefore have a new subgoal:move_to_paragraph. The precondition is ‘cursor anywhere in document’ (which we canmeet) but we want the second paragraph so we must initially be in the first.
We set up a new subgoal, move_to_start, with precondition ‘cursor anywhere in docu-ment’ and result ‘cursor at start of document’. We can then apply move_to_paragraphand finally delete_paragraph.
We assume some knowledge here (that the second paragraph is the paragraph after thefirst one).
Analogy in problem solving
A third element of problem solving is the use of analogy. Here we are interested inhow people solve novel problems. One suggestion is that this is done by mappingknowledge relating to a similar known domain to the new problem – called analo-gical mapping. Similarities between the known domain and the new one are notedand operators from the known domain are transferred to the new one.
This process has been investigated using analogous stories. Gick and Holyoak[149] gave subjects the following problem:
A doctor is treating a malignant tumor. In order to destroy it he needs to blast it with high-intensity rays. However, these will also destroy the healthy tissue sur-rounding the tumor. If he lessens the rays’ intensity the tumor will remain. How doeshe destroy the tumor?

46 Chapter 1 n The human
The solution to this problem is to fire low-intensity rays from different directionsconverging on the tumor. That way, the healthy tissue receives harmless low-intensity rays while the tumor receives the rays combined, making a high-intensitydose. The investigators found that only 10% of subjects reached this solution with-out help. However, this rose to 80% when they were given this analogous story andtold that it may help them:
A general is attacking a fortress. He can’t send all his men in together as the roads aremined to explode if large numbers of men cross them. He therefore splits his men intosmall groups and sends them in on separate roads.
In spite of this, it seems that people often miss analogous information, unless it issemantically close to the problem domain. When subjects were not told to use thestory, many failed to see the analogy. However, the number spotting the analogy rosewhen the story was made semantically close to the problem, for example a generalusing rays to destroy a castle.
The use of analogy is reminiscent of the Gestalt view of productive restructuringand insight. Old knowledge is used to solve a new problem.
1.4.3 Skill acquisition
All of the problem solving that we have considered so far has concentrated on handling unfamiliar problems. However, for much of the time, the problems that we face are not completely new. Instead, we gradually acquire skill in a particulardomain area. But how is such skill acquired and what difference does it make to ourproblem-solving performance? We can gain insight into how skilled behavior works,and how skills are acquired, by considering the difference between novice and expertbehavior in given domains.
Chess: of human and artificial intelligence
A few years ago, Deep Blue, a chess-playing computer, beat Gary Kasparov, the world’s topGrand Master, in a full tournament. This was the long-awaited breakthrough for the artificial intelligence (AI) community, who have traditionally seen chess as the ultimate test of their art.However, despite the fact that computer chess programs can play at Grand Master level againsthuman players, this does not mean they play in the same way. For each move played, Deep Blueinvestigated many millions of alternative moves and counter-moves. In contrast, a human chessplayer will only consider a few dozen. But, if the human player is good, these will usually be theright few dozen. The ability to spot patterns allows a human to address a problem with far lesseffort than a brute force approach. In chess, the number of moves is such that finally brute force,applied fast enough, has overcome human pattern-matching skill. In Go, which has far more pos-sible moves, computer programs do not even reach a good club level of play. Many models of themental processes have been heavily influenced by computation. It is worth remembering thatalthough there are similarities, computer ‘intelligence’ is very different from that of humans.

1.4 Thinking: reasoning and problem solving 47
A commonly studied domain is chess playing. It is particularly suitable since itlends itself easily to representation in terms of problem space theory. The initial stateis the opening board position; the goal state is one player checkmating the other;operators to move states are legal moves of chess. It is therefore possible to examineskilled behavior within the context of the problem space theory of problem solving.
Studies of chess players by DeGroot, Chase and Simon, among others, producedsome interesting observations [64, 65, 88, 89]. In all the experiments the behavior ofchess masters was compared with less experienced chess players. The first observa-tion was that players did not consider large numbers of moves in choosing theirmove, nor did they look ahead more than six moves (often far fewer). Masters con-sidered no more alternatives than the less experienced, but they took less time tomake a decision and produced better moves.
So what makes the difference between skilled and less skilled behavior in chess? It appears that chess masters remember board configurations and good moves associated with them. When given actual board positions to remember, masters are much better at reconstructing the board than the less experienced. However,when given random configurations (which were unfamiliar), the groups of playerswere equally bad at reconstructing the positions. It seems therefore that expert players ‘chunk’ the board configuration in order to hold it in short-term memory.Expert players use larger chunks than the less experienced and can therefore re-member more detail.
This behavior is also seen among skilled computer programmers. They can alsoreconstruct programs more effectively than novices since they have the structuresavailable to build appropriate chunks. They acquire plans representing code to solveparticular problems. When that problem is encountered in a new domain or newprogram they will recall that particular plan and reuse it.
Another observed difference between skilled and less skilled problem solving is in the way that different problems are grouped. Novices tend to group problemsaccording to superficial characteristics such as the objects or features common toboth. Experts, on the other hand, demonstrate a deeper understanding of the prob-lems and group them according to underlying conceptual similarities which may notbe at all obvious from the problem descriptions.
Each of these differences stems from a better encoding of knowledge in the expert:information structures are fine tuned at a deep level to enable efficient and accurateretrieval. But how does this happen? How is skill such as this acquired? One modelof skill acquisition is Anderson’s ACT* model [14]. ACT* identifies three basic levels of skill:
1. The learner uses general-purpose rules which interpret facts about a problem.This is slow and demanding on memory access.
2. The learner develops rules specific to the task.3. The rules are tuned to speed up performance.
General mechanisms are provided to account for the transitions between these levels. For example, proceduralization is a mechanism to move from the first to thesecond. It removes the parts of the rule which demand memory access and replaces

48 Chapter 1 n The human
variables with specific values. Generalization, on the other hand, is a mechanismwhich moves from the second level to the third. It generalizes from the specific casesto general properties of those cases. Commonalities between rules are condensed toproduce a general-purpose rule.
These are best illustrated by example. Imagine you are learning to cook. Initiallyyou may have a general rule to tell you how long a dish needs to be in the oven, anda number of explicit representations of dishes in memory. You can instantiate therule by retrieving information from memory.
IF cook[type, ingredients, time]THEN
cook for: timecook[casserole, [chicken,carrots,potatoes], 2 hours]cook[casserole, [beef,dumplings,carrots], 2 hours]cook[cake, [flour,sugar,butter,eggs], 45 mins]
Gradually your knowledge becomes proceduralized and you have specific rules foreach case:
IF type is casseroleAND ingredients are [chicken,carrots,potatoes]THEN
cook for: 2 hoursIF type is casseroleAND ingredients are [beef,dumplings,carrots]THEN
cook for: 2 hoursIF type is cakeAND ingredients are [flour,sugar,butter,eggs]THEN
cook for: 45 mins
Finally, you may generalize from these rules to produce general-purpose rules, whichexploit their commonalities:
IF type is casseroleAND ingredients are ANYTHINGTHEN
cook for: 2 hours
The first stage uses knowledge extensively. The second stage relies upon knownprocedures. The third stage represents skilled behavior. Such behavior may in factbecome automatic and as such be difficult to make explicit. For example, think of an activity at which you are skilled, perhaps driving a car or riding a bike. Try todescribe to someone the exact procedure which you go through to do this. You willfind this quite difficult. In fact experts tend to have to rehearse their actions mentallyin order to identify exactly what they do. Such skilled behavior is efficient but maycause errors when the context of the activity changes.
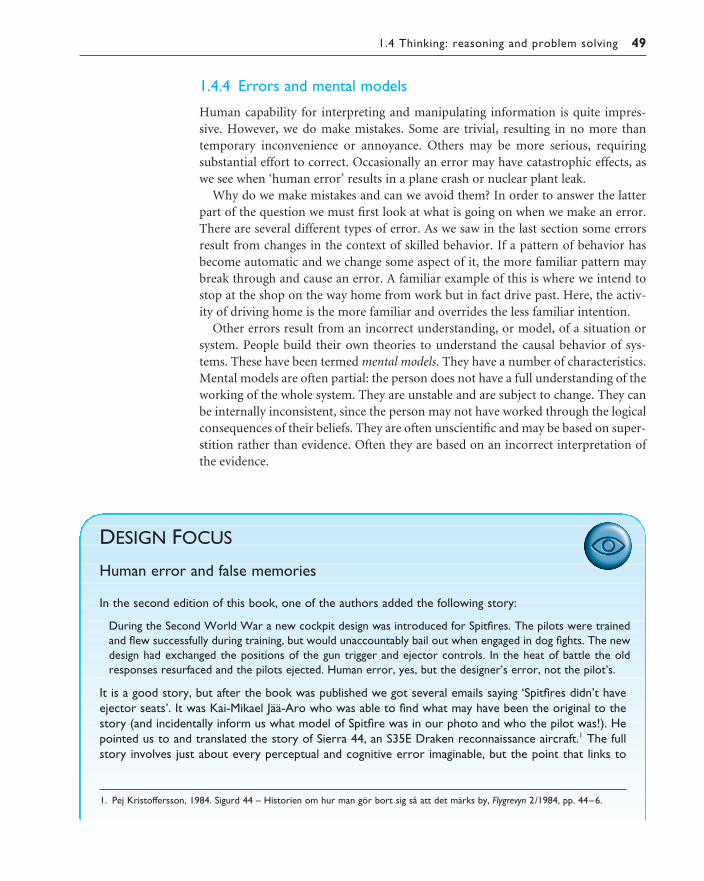
1.4 Thinking: reasoning and problem solving 49
1.4.4 Errors and mental models
Human capability for interpreting and manipulating information is quite impres-sive. However, we do make mistakes. Some are trivial, resulting in no more thantemporary inconvenience or annoyance. Others may be more serious, requiring substantial effort to correct. Occasionally an error may have catastrophic effects, aswe see when ‘human error’ results in a plane crash or nuclear plant leak.
Why do we make mistakes and can we avoid them? In order to answer the latterpart of the question we must first look at what is going on when we make an error.There are several different types of error. As we saw in the last section some errorsresult from changes in the context of skilled behavior. If a pattern of behavior hasbecome automatic and we change some aspect of it, the more familiar pattern maybreak through and cause an error. A familiar example of this is where we intend tostop at the shop on the way home from work but in fact drive past. Here, the activ-ity of driving home is the more familiar and overrides the less familiar intention.
Other errors result from an incorrect understanding, or model, of a situation orsystem. People build their own theories to understand the causal behavior of sys-tems. These have been termed mental models. They have a number of characteristics.Mental models are often partial: the person does not have a full understanding of theworking of the whole system. They are unstable and are subject to change. They canbe internally inconsistent, since the person may not have worked through the logicalconsequences of their beliefs. They are often unscientific and may be based on super-stition rather than evidence. Often they are based on an incorrect interpretation ofthe evidence.
DESIGN FOCUS
Human error and false memories
In the second edition of this book, one of the authors added the following story:
During the Second World War a new cockpit design was introduced for Spitfires. The pilots were trainedand flew successfully during training, but would unaccountably bail out when engaged in dog fights. The newdesign had exchanged the positions of the gun trigger and ejector controls. In the heat of battle the oldresponses resurfaced and the pilots ejected. Human error, yes, but the designer’s error, not the pilot’s.
It is a good story, but after the book was published we got several emails saying ‘Spitfires didn’t haveejector seats’. It was Kai-Mikael Jää-Aro who was able to find what may have been the original to thestory (and incidentally inform us what model of Spitfire was in our photo and who the pilot was!). Hepointed us to and translated the story of Sierra 44, an S35E Draken reconnaissance aircraft.1 The fullstory involves just about every perceptual and cognitive error imaginable, but the point that links to
1. Pej Kristoffersson, 1984. Sigurd 44 – Historien om hur man gör bort sig så att det märks by, Flygrevyn 2/1984, pp. 44–6.

Assuming a person builds a mental model of the system being dealt with, errorsmay occur if the actual operation differs from the mental model. For example, onone occasion we were staying in a hotel in Germany, attending a conference. In thelobby of the hotel was a lift. Beside the lift door was a button. Our model of the sys-tem, based on previous experience of lifts, was that the button would call the lift. Wepressed the button and the lobby light went out! In fact the button was a light switchand the lift button was on the inside rim of the lift, hidden from view.
the (false) Spitfire story is that in the Draken the red buttons for releasing the fuel ‘drop’ tanks and forthe canopy release differed only in very small writing. In an emergency (burning fuel tanks) the pilotaccidentally released the canopy and so ended up flying home cabriolet style.
There is a second story of human error here – the author’s memory. When the book was written hecould not recall where he had come across the story but was convinced it was to do with a Spitfire. Itmay be that he had been told the story by someone else who had got it mixed up, but it is as likely thathe simply remembered the rough outline of the story and then ‘reconstructed’ the rest. In fact that isexactly how our memories work. Our brains do not bother to lay down every little detail, but whenwe ‘remember’ we rebuild what the incident ‘must have been’ using our world knowledge. This pro-cess is completely unconscious and can lead to what are known as false memories. This is particularlyproblematic in witness statements in criminal trials as early questioning by police or lawyers can unin-tentionally lead to witnesses being sure they have seen things that they have not. Numerous controlledpsychological experiments have demonstrated this effect which furthermore is strongly influenced bybiasing factors such as the race of supposed criminals.
To save his blushes we have not said here which author’s failing memory was responsible for the Spitfirestory, but you can read more on this story and also find who it was on the book website at:/e3/online/spitfire/
50 Chapter 1 n The human
Courtesy of popperfoto.com

1.5 Emotion 51
Although both the light switch and the lift button were inconsistent with our men-tal models of these controls, we would probably have managed if they had beenencountered separately. If there had been no button beside the lift we would havelooked more closely and found the one on the inner rim. But since the light switchreflected our model of a lift button we looked no further. During our stay weobserved many more new guests making the same error.
This illustrates the importance of a correct mental model and the dangers ofignoring conventions. There are certain conventions that we use to interpret theworld and ideally designs should support these. If these are to be violated, explicitsupport must be given to enable us to form a correct mental model. A label on thebutton saying ‘light switch’ would have been sufficient.
EMOTION
So far in this chapter we have concentrated on human perceptual and cognitive abil-ities. But human experience is far more complex than this. Our emotional responseto situations affects how we perform. For example, positive emotions enable us tothink more creatively, to solve complex problems, whereas negative emotion pushesus into narrow, focussed thinking. A problem that may be easy to solve when we arerelaxed, will become difficult if we are frustrated or afraid.
Psychologists have studied emotional response for decades and there are manytheories as to what is happening when we feel an emotion and why such a responseoccurs. More than a century ago, William James proposed what has become knownas the James–Lange theory (Lange was a contemporary of James whose theories were similar): that emotion was the interpretation of a physiological response, ratherthan the other way around. So while we may feel that we respond to an emotion,James contended that we respond physiologically to a stimulus and interpret that as emotion:
Common sense says, we lose our fortune, are sorry and weep; we meet a bear, arefrightened and run; we are insulted by a rival, are angry and strike. The hypothesis here . . . is that we feel sorry because we cry, angry because we strike, afraid because wetremble.
(W. James, Principles of Psychology, page 449. Henry Holt, New York, 1890.)
Others, however, disagree. Cannon [54a], for example, argued that our physio-logical processes are in fact too slow to account for our emotional reactions, and that the physiological responses for some emotional states are too similar (e.g. anger and fear), yet they can be easily distinguished. Experience in studies with the use of drugs that stimulate broadly the same physiological responses as anger or fear seems to support this: participants reported physical symptoms but not the emotion, which suggests that emotional response is more than a recognition of physiologicalchanges.
1.5

52 Chapter 1 n The human
Schachter and Singer [312a] proposed a third interpretation: that emotion resultsfrom a person evaluating physical responses in the light of the whole situation. Sowhereas the same physiological response can result from a range of different situ-ations, the emotion that is felt is based on a cognitive evaluation of the circumstanceand will depend on what the person attributes this to. So the same physiologicalresponse of a pounding heart will be interpreted as excitement if we are in a com-petition and fear if we find ourselves under attack.
Whatever the exact process, what is clear is that emotion involves both physicaland cognitive events. Our body responds biologically to an external stimulus and weinterpret that in some way as a particular emotion. That biological response – knownas affect – changes the way we deal with different situations, and this has an impacton the way we interact with computer systems. As Donald Norman says:
Negative affect can make it harder to do even easy tasks; positive affect can make it easier to do difficult tasks.
(D. A. Norman, Emotion and design: attractive things work better. Interactions Magazine, ix(4): 36–42, 2002.)
So what are the implications of this for design? It suggests that in situations ofstress, people will be less able to cope with complex problem solving or managingdifficult interfaces, whereas if people are relaxed they will be more forgiving of limitations in the design. This does not give us an excuse to design bad interfaces but does suggest that if we build interfaces that promote positive responses – forexample by using aesthetics or reward – then they are likely be more successful.
INDIVIDUAL DIFFERENCES
In this chapter we have been discussing humans in general. We have made theassumption that everyone has similar capabilities and limitations and that we can therefore make generalizations. To an extent this is true: the psychological principles and properties that we have discussed apply to the majority of people.Notwithstanding this, we should remember that, although we share processes incommon, humans, and therefore users, are not all the same. We should be aware ofindividual differences so that we can account for them as far as possible within ourdesigns. These differences may be long term, such as sex, physical capabilities andintellectual capabilities. Others are shorter term and include the effect of stress or fatigue on the user. Still others change through time, such as age.
These differences should be taken into account in our designs. It is useful to consider, for any design decision, if there are likely to be users within the targetgroup who will be adversely affected by our decision. At the extremes a decision mayexclude a section of the user population. For example, the current emphasis on visualinterfaces excludes those who are visually impaired, unless the design also makes useof the other sensory channels. On a more mundane level, designs should allow for
1.6

1.7 Psychology and the design of interactive systems 53
users who are under pressure, feeling ill or distracted by other concerns: they shouldnot push users to their perceptual or cognitive limits.
We will consider the issues of universal accessibility in more detail in Chapter 10.
PSYCHOLOGY AND THE DESIGN OF INTERACTIVE SYSTEMS
So far we have looked briefly at the way in which humans receive, process and store information, solve problems and acquire skill. But how can we apply what wehave learned to designing interactive systems? Sometimes, straightforward conclu-sions can be drawn. For example, we can deduce that recognition is easier than recalland allow users to select commands from a set (such as a menu) rather than inputthem directly. However, in the majority of cases, application is not so obvious or simple. In fact, it may be dangerous, leading us to make generalizations which arenot valid. In order to apply a psychological principle or result properly in design, we need to understand its context, both in terms of where it fits in the wider field of psychology and in terms of the details of the actual experiments, the measuresused and the subjects involved, for example. This may appear daunting, particularlyto the novice designer who wants to acknowledge the relevance of cognitive psy-chology but does not have the background to derive appropriate conclusions.Fortunately, principles and results from research in psychology have been distilledinto guidelines for design, models to support design and techniques for evaluatingdesign. Parts 2 and 3 of this book include discussion of a range of guidelines, models and techniques, based on cognitive psychology, which can be used to supportthe design process.
1.7.1 Guidelines
Throughout this chapter we have discussed the strengths and weaknesses of humancognitive and perceptual processes but, for the most part, we have avoided attempt-ing to apply these directly to design. This is because such an attempt could only be partial and simplistic, and may give the impression that this is all psychology has to offer.
However, general design principles and guidelines can be and have been derivedfrom the theories we have discussed. Some of these are relatively straightforward: for instance, recall is assisted by the provision of retrieval cues so interfaces shouldincorporate recognizable cues wherever possible. Others are more complex and con-text dependent. In Chapter 7 we discuss principles and guidelines further, many ofwhich are derived from psychological theory. The interested reader is also referred toGardiner and Christie [140] which illustrates how guidelines can be derived frompsychological theory.
1.7

54 Chapter 1 n The human
1.7.2 Models to support design
As well as guidelines and principles, psychological theory has led to the developmentof analytic and predictive models of user behavior. Some of these include a specificmodel of human problem solving, others of physical activity, and others attempt a more comprehensive view of cognition. Some predict how a typical computer user would behave in a given situation, others analyze why particular user behavioroccurred. All are based on cognitive theory. We discuss these models in detail inChapter 12.
1.7.3 Techniques for evaluation
In addition to providing us with a wealth of theoretical understanding of the humanuser, psychology also provides a range of empirical techniques which we can employto evaluate our designs and our systems. In order to use these effectively we need tounderstand the scope and benefits of each method. Chapter 9 provides an overviewof these techniques and an indication of the circumstances under which each shouldbe used.
Worked exercise Produce a semantic network of the main information in this chapter.
Answer This network is potentially huge so it is probably unnecessary to devise the whole thing!Be selective. One helpful way to tackle the exercise is to approach it in both a top-downand a bottom-up manner. Top-down will give you a general overview of topics and howthey relate; bottom-up can fill in the details of a particular field. These can then be
Top-down view

1.8 Summary 55
‘glued’ together to build up the whole picture. You may be able to tackle this problemin a group, each taking one part of it. We will not provide the full network here but willgive examples of the level of detail anticipated for the overview and the detailed ver-sions. In the overview we have not included labels on the arcs for clarity.
SUMMARY
In this chapter we have considered the human as an information processor, re-ceiving inputs from the world, storing, manipulating and using information, andreacting to the information received. Information is received through the senses,particularly, in the case of computer use, through sight, hearing and touch. It isstored in memory, either temporarily in sensory or working memory, or perman-ently in long-term memory. It can then be used in reasoning and problem solving.Recurrent familiar situations allow people to acquire skills in a particular domain, astheir information structures become better defined. However, this can also lead toerror, if the context changes.
Human perception and cognition are complex and sophisticated but they are notwithout their limitations. We have considered some of these limitations in this chap-ter. An understanding of the capabilities and limitations of the human as informa-tion processor can help us to design interactive systems which support the formerand compensate for the latter. The principles, guidelines and models which can bederived from cognitive psychology and the techniques which it provides are invalu-able tools for the designer of interactive systems.
1.8
Bottom-up view

56 Chapter 1 n The human
EXERCISES
1.1 Devise experiments to test the properties of (i) short-term memory, (ii) long-termmemory, using the experiments described in this chapter to help you. Try out your experimentson your friends. Are your results consistent with the properties described in this chapter?
1.2 Observe skilled and novice operators in a familiar domain, for example touch and ‘hunt-and-peck’typists, expert and novice game players, or expert and novice users of a computer application.What differences can you discern between their behaviors?
1.3 From what you have learned about cognitive psychology devise appropriate guidelines for use byinterface designers. You may find it helpful to group these under key headings, for example visualperception, memory, problem solving, etc., although some may overlap such groupings.
1.4 What are mental models, and why are they important in interface design?
1.5 What can a system designer do to minimize the memory load of the user?
1.6 Human short-term memory has a limited span. This is a series of experiments to determine whatthat span is. (You will need some other people to take part in these experiments with you – theydo not need to be studying the course – try it with a group of friends.)
(a) Kim’s gameDivide into groups. Each group gathers together an assortment of objects – pens, pencils, paper-clips, books, sticky notes, etc. The stranger the object, the better! You need a large number ofthem – at least 12 to 15. Place them in some compact arrangement on a table, so that all itemsare visible. Then, swap with another group for 30 seconds only and look at their pile. Return toyour table, and on your own try to write down all the items in the other group’s pile.
Compare your list with what they actually have in their pile. Compare the number of things youremembered with how the rest of your group did. Now think introspectively: what helped youremember certain things? Did you recognize things in their pile that you had in yours? Did thathelp? Do not pack the things away just yet.
Calculate the average score for your group. Compare that with the averages from the othergroup(s).
Questions: What conclusions can you draw from this experiment? What does this indicateabout the capacity of short-term memory? What does it indicate that helps improve the capa-city of short-term memory?
(b) ‘I went to market . . .’In your group, one person starts off with ‘I went to market and I bought a fish’ (or some otherproduce, or whatever!). The next person continues ‘I went to market and I bought a fish and I bought a bread roll as well’. The process continues, with each person adding some item to the list each time. Keep going around the group until you cannot remember the list accurately.Make a note of the first time someone gets it wrong, and then record the number of items that you can successfully remember. Some of you will find it hard to remember more than a few,others will fare much better. Do this a few more times with different lists, and then calculate youraverage score, and your group’s average score.

RECOMMENDED READING
E. B. Goldstein, Sensation and Perception, 6th edition, Wadsworth, 2001.A textbook covering human senses and perception in detail. Easy to read withmany home experiments to illustrate the points made.
A. Baddeley, Human Memory: Theory and Practice, revised edition, Allyn & Bacon,1997.The latest and most complete of Baddeley’s texts on memory. Provides up-to-datediscussion on the different views of memory structure as well as a detailed surveyof experimental work on memory.
M. W. Eysenck and M. T. Keane, Cognitive Psychology: A Student’s Handbook, 4thedition, Psychology Press, 2000.A comprehensive and readable textbook giving more detail on cognitive psycho-logy, including memory, problem solving and skill acquisition.
S. K. Card, T. P. Moran and A. Newell, The Psychology of Human–ComputerInteraction, Lawrence Erlbaum Associates, 1983.A classic text looking at the human as an information processor in interactionwith the computer. Develops and describes the Model Human Processor in detail.
A. Newell and H. Simon, Human Problem Solving, Prentice Hall, 1972.Describes the problem space view of problem solving in more detail.
M. M. Gardiner and B. Christie, editors, Applying Cognitive Psychology to User-Interface Design, John Wiley, 1987.A collection of essays on the implications of different aspects of cognitive psycho-logy to interface design. Includes memory, thinking, language and skill acquisition.Provides detailed guidelines for applying psychological principles in design practice.
Questions: What does this tell you about short-term memory? What do you do that helps youremember? What do you estimate is the typical capacity of human short-term memory? Is this agood test for short-term memory?
(c) Improving your memoryTry experiment 1.6(a) again, using the techniques on page 39.
Has your recall ability improved? Has your group’s average improved? What does this show youabout memory?
1.7 Locate one source (through the library or the web) that reports on empirical evidence on humanlimitations. Provide a full reference to the source. In one paragraph, summarize what the result ofthe research states in terms of a physical human limitation.
In a separate paragraph, write your thoughts on how you think this evidence on human capabil-ities impacts interactive system design.
Recommended reading 57

58 Chapter 1 n The human
A. Monk, editor, Fundamentals of Human Computer Interaction, Academic Press,1985.A good collection of articles giving brief coverage of aspects of human psychologyincluding perception, memory, thinking and reading. Also contains articles onexperimental design which provide useful introductions.
ACT-R site. Website of resources and examples of the use of the cognitive archi-tecture ACT-R, which is the latest development of Anderson’s ACT model,http://act-r.psy.cmu.edu/

THE COMPUTER
OV E RV I E W
A computer system comprises various elements, each of which affects theuser of the system.
n Input devices for interactive use, allowing text entry, drawing andselection from the screen:– text entry: traditional keyboard, phone text entry, speech and
handwriting– pointing: principally the mouse, but also touchpad, stylus and others– 3D interaction devices.
n Output display devices for interactive use:– different types of screen mostly using some form of bitmap display– large displays and situated displays for shared and public use– digital paper may be usable in the near future.
n Virtual reality systems and 3D visualization which have special interactionand display devices.
n Various devices in the physical world:– physical controls and dedicated displays– sound, smell and haptic feedback– sensors for nearly everything including movement, temperature,
bio-signs.
n Paper output and input: the paperless office and the less-paper office:– different types of printers and their characteristics, character styles
and fonts– scanners and optical character recognition.
n Memory:– short-term memory: RAM– long-term memory: magnetic and optical disks– capacity limitations related to document and video storage– access methods as they limit or help the user.
n Processing:– the effects when systems run too slow or too fast, the myth of the
infinitely fast machine– limitations on processing speed– networks and their impact on system performance.
2
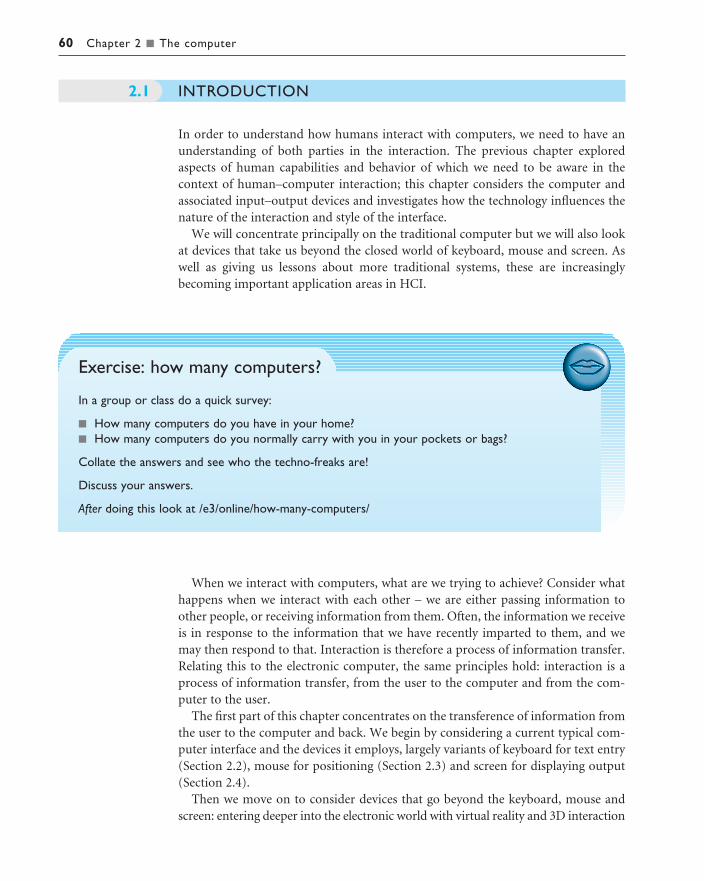
60 Chapter 2 n The computer
INTRODUCTION
In order to understand how humans interact with computers, we need to have anunderstanding of both parties in the interaction. The previous chapter exploredaspects of human capabilities and behavior of which we need to be aware in the context of human–computer interaction; this chapter considers the computer andassociated input–output devices and investigates how the technology influences thenature of the interaction and style of the interface.
We will concentrate principally on the traditional computer but we will also lookat devices that take us beyond the closed world of keyboard, mouse and screen. Aswell as giving us lessons about more traditional systems, these are increasinglybecoming important application areas in HCI.
2.1
Exercise: how many computers?
In a group or class do a quick survey:
n How many computers do you have in your home?n How many computers do you normally carry with you in your pockets or bags?
Collate the answers and see who the techno-freaks are!
Discuss your answers.
After doing this look at /e3/online/how-many-computers/
When we interact with computers, what are we trying to achieve? Consider whathappens when we interact with each other – we are either passing information toother people, or receiving information from them. Often, the information we receiveis in response to the information that we have recently imparted to them, and wemay then respond to that. Interaction is therefore a process of information transfer.Relating this to the electronic computer, the same principles hold: interaction is aprocess of information transfer, from the user to the computer and from the com-puter to the user.
The first part of this chapter concentrates on the transference of information fromthe user to the computer and back. We begin by considering a current typical com-puter interface and the devices it employs, largely variants of keyboard for text entry(Section 2.2), mouse for positioning (Section 2.3) and screen for displaying output(Section 2.4).
Then we move on to consider devices that go beyond the keyboard, mouse andscreen: entering deeper into the electronic world with virtual reality and 3D interaction
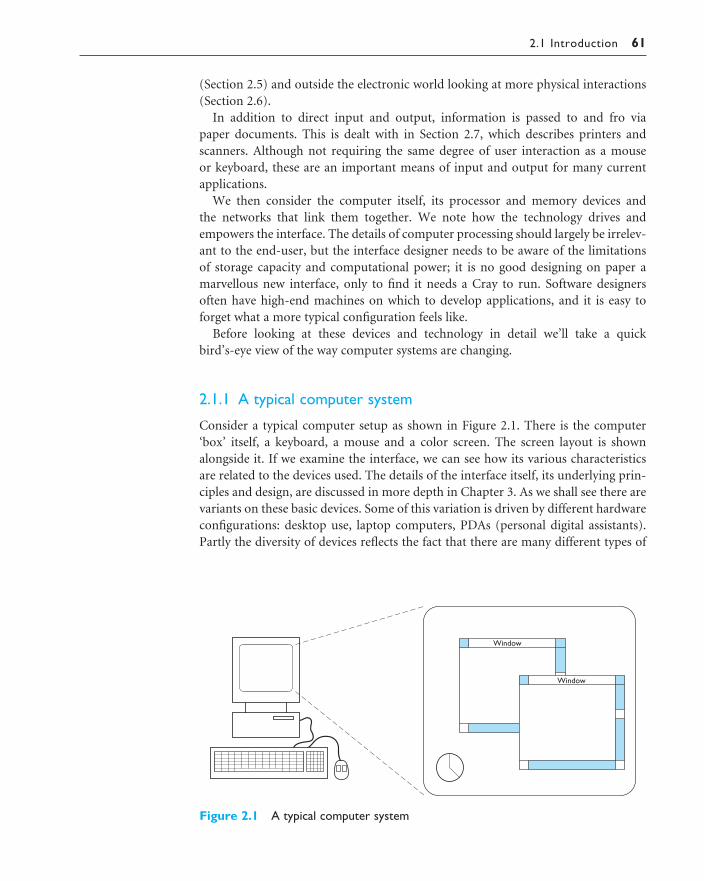
2.1 Introduction 61
(Section 2.5) and outside the electronic world looking at more physical interactions(Section 2.6).
In addition to direct input and output, information is passed to and fro via paper documents. This is dealt with in Section 2.7, which describes printers andscanners. Although not requiring the same degree of user interaction as a mouse or keyboard, these are an important means of input and output for many currentapplications.
We then consider the computer itself, its processor and memory devices and the networks that link them together. We note how the technology drives andempowers the interface. The details of computer processing should largely be irrelev-ant to the end-user, but the interface designer needs to be aware of the limitations of storage capacity and computational power; it is no good designing on paper amarvellous new interface, only to find it needs a Cray to run. Software designersoften have high-end machines on which to develop applications, and it is easy to forget what a more typical configuration feels like.
Before looking at these devices and technology in detail we’ll take a quick bird’s-eye view of the way computer systems are changing.
2.1.1 A typical computer system
Consider a typical computer setup as shown in Figure 2.1. There is the computer‘box’ itself, a keyboard, a mouse and a color screen. The screen layout is shownalongside it. If we examine the interface, we can see how its various characteristicsare related to the devices used. The details of the interface itself, its underlying prin-ciples and design, are discussed in more depth in Chapter 3. As we shall see there arevariants on these basic devices. Some of this variation is driven by different hardwareconfigurations: desktop use, laptop computers, PDAs (personal digital assistants).Partly the diversity of devices reflects the fact that there are many different types of
Window
Window
Figure 2.1 A typical computer system

62 Chapter 2 n The computer
data that may have to be entered into and obtained from a system, and there are alsomany different types of user, each with their own unique requirements.
2.1.2 Levels of interaction – batch processing
In the early days of computing, information was entered into the computer in a large mass – batch data entry. There was minimal interaction with the machine: theuser would simply dump a pile of punched cards onto a reader, press the start button, and then return a few hours later. This still continues today although nowwith pre-prepared electronic files or possibly machine-read forms. It is clearly themost appropriate mode for certain kinds of application, for example printing paychecks or entering the results from a questionnaire.
With batch processing the interactions take place over hours or days. In contrastthe typical desktop computer system has interactions taking seconds or fractions ofa second (or with slow web pages sometimes minutes!). The field of Human–Computer Interaction largely grew due to this change in interactive pace. It is easy toassume that faster means better, but some of the paper-based technology discussedin Section 2.7 suggests that sometimes slower paced interaction may be better.
2.1.3 Richer interaction – everywhere, everywhen
Computers are coming out of the box! Information appliances are putting internetaccess or dedicated systems onto the fridge, microwave and washing machine: toautomate shopping, give you email in your kitchen or simply call for maintenancewhen needed. We carry with us WAP phones and smartcards, have security systemsthat monitor us and web cams that show our homes to the world. Is Figure 2.1 reallythe typical computer system or is it really more like Figure 2.2?
Figure 2.2 A typical computer system? Photo courtesy Electrolux

2.2 Text entry devices 63
TEXT ENTRY DEVICES
Whether writing a book like this, producing an office memo, sending a thank youletter after your birthday, or simply sending an email to a friend, entering text is one of our main activities when using the computer. The most obvious means of text entry is the plain keyboard, but there are several variations on this: different keyboard layouts, ‘chord’ keyboards that use combinations of fingers to enter let-ters, and phone key pads. Handwriting and speech recognition offer more radical alternatives.
2.2.1 The alphanumeric keyboard
The keyboard is still one of the most common input devices in use today. It is usedfor entering textual data and commands. The vast majority of keyboards have a stand-ardized layout, and are known by the first six letters of the top row of alphabeticalkeys, QWERTY. There are alternative designs which have some advantages over theQWERTY layout, but these have not been able to overcome the vast technologicalinertia of the QWERTY keyboard. These alternatives are of two forms: 26 key layoutsand chord keyboards. A 26 key layout rearranges the order of the alphabetic keys,putting the most commonly used letters under the strongest fingers, or adoptingsimpler practices. In addition to QWERTY, we will discuss two 26 key layouts, alphabetic and DVORAK, and chord keyboards.
The QWERTY keyboard
The layout of the digits and letters on a QWERTY keyboard is fixed (see Figure 2.3),but non-alphanumeric keys vary between keyboards. For example, there is a differ-ence between key assignments on British and American keyboards (in particular,above the 3 on the UK keyboard is the pound sign £, whilst on the US keyboard there is a dollar sign $). The standard layout is also subject to variation in the place-ment of brackets, backslashes and suchlike. In addition different national keyboardsinclude accented letters and the traditional French layout places the main letters indifferent locations – the top line starts AZERTY.
2.2
Figure 2.3 The standard QWERTY keyboard

64 Chapter 2 n The computer
The QWERTY arrangement of keys is not optimal for typing, however. The reason for the layout of the keyboard in this fashion can be traced back to the daysof mechanical typewriters. Hitting a key caused an arm to shoot towards the carriage,imprinting the letter on the head on the ribbon and hence onto the paper. If twoarms flew towards the paper in quick succession from nearly the same angle, they would often jam – the solution to this was to set out the keys so that commoncombinations of consecutive letters were placed at different ends of the keyboard,which meant that the arms would usually move from alternate sides. One appealingstory relating to the key layout is that it was also important for a salesman to be able to type the word ‘typewriter’ quickly in order to impress potential customers: the letters are all on the top row!
The electric typewriter and now the computer keyboard are not subject to theoriginal mechanical constraints, but the QWERTY keyboard remains the dominantlayout. The reason for this is social – the vast base of trained typists would be reluct-ant to relearn their craft, whilst the management is not prepared to accept an initiallowering of performance whilst the new skills are gained. There is also a large invest-ment in current keyboards, which would all have to be either replaced at great cost,or phased out, with the subsequent requirement for people to be proficient on bothkeyboards. As whole populations have become keyboard users this technologicalinertia has probably become impossible to change.
How keyboards work
Current keyboards work by a keypress closing a connection, causing a character code tobe sent to the computer. The connection is usually via a lead, but wireless systems also exist. Oneaspect of keyboards that is important to users is the ‘feel’ of the keys. Some keyboards require avery hard press to operate the key, much like a manual typewriter, whilst others are featherlight.The distance that the keys travel also affects the tactile nature of the keyboard. The keyboards thatare currently used on most notebook computers are ‘half-travel’ keyboards, where the keys travelonly a small distance before activating their connection; such a keyboard can feel dead to beginwith, but such qualitative judgments often change as people become more used to using it. By mak-ing the actual keys thinner, and allowing them a much reduced travel, a lot of vertical space can besaved on the keyboard, thereby making the machine slimmer than would otherwise be possible.
Some keyboards are even made of touch-sensitive buttons, which require a light touch and practically no travel; they often appear as a sheet of plastic with the buttons printed on them. Such keyboards are often found on shop tills, though the keys are not QWERTY, but specific tothe task. Being fully sealed, they have the advantage of being easily cleaned and resistant to dirtyenvironments, but have little feel, and are not popular with trained touch-typists. Feedback isimportant even at this level of human–computer interaction! With the recent increase of repetit-ive strain injury (RSI) to users’ fingers, and the increased responsibilities of employers in these circumstances, it may be that such designs will enjoy a resurgence in the near future. RSI in fingersis caused by the tendons that control the movement of the fingers becoming inflamed owing tooveruse and making repeated unnatural movements.

2.2 Text entry devices 65
Ease of learning – alphabetic keyboard
One of the most obvious layouts to be produced is the alphabetic keyboard, in whichthe letters are arranged alphabetically across the keyboard. It might be expected thatsuch a layout would make it quicker for untrained typists to use, but this is not thecase. Studies have shown that this keyboard is not faster for properly trained typists,as we may expect, since there is no inherent advantage to this layout. And even fornovice or occasional users, the alphabetic layout appears to make very little differ-ence to the speed of typing. These keyboards are used in some pocket electronic per-sonal organizers, perhaps because the layout looks simpler to use than the QWERTYone. Also, it dissuades people from attempting to use their touch-typing skills on avery small keyboard and hence avoids criticisms of difficulty of use!
Ergonomics of use – DVORAK keyboard and split designs
The DVORAK keyboard uses a similar layout of keys to the QWERTY system, butassigns the letters to different keys. Based upon an analysis of typing, the keyboard isdesigned to help people reach faster typing speeds. It is biased towards right-handedpeople, in that 56% of keystrokes are made with the right hand. The layout of thekeys also attempts to ensure that the majority of keystrokes alternate between hands,thereby increasing the potential speed. By keeping the most commonly used keys onthe home, or middle, row, 70% of keystrokes are made without the typist having to stretch far, thereby reducing fatigue and increasing keying speed. The layout also
There are a variety of specially shaped keyboards to relieve the strain of typing or to allow people to type with some injury (e.g. RSI) or disability. These may slope the keys towards thehands to improve the ergonomic position, be designed for single-handed use, or for no hands atall. Some use bespoke key layouts to reduce strain of finger movements. The keyboard illustratedis produced by PCD Maltron Ltd. for left-handed use. See www.maltron.com/
Source: www.maltron.com, reproduced courtesy of PCD Maltron Ltd.

66 Chapter 2 n The computer
aims to minimize the number of keystrokes made with the weak fingers. Many of these requirements are in conflict, and the DVORAK keyboard represents onepossible solution. Experiments have shown that there is a speed improvement ofbetween 10 and 15%, coupled with a reduction in user fatigue due to the increasedergonomic layout of the keyboard [230].
Other aspects of keyboard design have been altered apart from the layout of thekeys. A number of more ergonomic designs have appeared, in which the basic tiltedplanar base of the keyboard is altered. Moderate designs curve the plane of the key-board, making it concave, whilst more extreme ones split the keys into those for theleft and right hand and curve both halves separately. Often in these the keys are alsomoved to bring them all within easy reach, to minimize movement between keys.Such designs are supposed to aid comfort and reduce RSI by minimizing effort, buthave had practically no impact on the majority of systems sold.
2.2.2 Chord keyboards
Chord keyboards are significantly different from normal alphanumeric keyboards.Only a few keys, four or five, are used (see Figure 2.4) and letters are produced bypressing one or more of the keys at once. For example, in the Microwriter, the pat-tern of multiple keypresses is chosen to reflect the actual letter shape.
Such keyboards have a number of advantages. They are extremely compact: simply reducing the size of a conventional keyboard makes the keys too small andclose together, with a correspondingly large increase in the difficulty of using it. The
Figure 2.4 A very early chord keyboard (left) and its lettercodes (right)

2.2 Text entry devices 67
learning time for the keyboard is supposed to be fairly short – of the order of a fewhours – but social resistance is still high. Moreover, they are capable of fast typingspeeds in the hands (or rather hand!) of a competent user. Chord keyboards can also be used where only one-handed operation is possible, in cramped and confinedconditions.
Lack of familiarity means that these are unlikely ever to be a mainstream form oftext entry, but they do have applications in niche areas. In particular, courtroomstenographers use a special form of two-handed chord keyboard and associatedshorthand to enter text at full spoken speed. Also it may be that the compact size andone-handed operation will find a place in the growing wearables market.
DESIGN FOCUS
Numeric keypads
Alphanumeric keyboards (as the name suggests) include numbers as well as letters. In the QWERTYlayout these are in a line across the top of the keyboard, but in most larger keyboards there is also aseparate number pad to allow faster entry of digits. Number keypads occur in other contexts too,including calculators, telephones and ATM cash dispensers. Many people are unaware that there aretwo different layouts for numeric keypads: the calculator style that has ‘123’ on the bottom and thetelephone style that has ‘123’ at the top.
It is a demonstration of the amazing adaptability of humans that we move between these two styleswith such ease. However, if you need to include a numeric keypad in a device you must consider whichis most appropriate for your potential users. For example, computer keyboards use calculator-style layout, as they are primarily used for entering numbers for calculations.
One of the authors was caught out by this once when he forgot the PIN number of his cash card. Hehalf remembered the digits, but also his fingers knew where to type, so he ‘practiced’ on his calculator.Unfortunately ATMs use telephone-style layout!
calculator ATM phone

68 Chapter 2 n The computer
2.2.3 Phone pad and T9 entry
With mobile phones being used for SMS text messaging (see Chapter 19) and WAP(see Chapter 21), the phone keypad has become an important form of text input.Unfortunately a phone only has digits 0–9, not a full alphanumeric keyboard.
To overcome this for text input the numeric keys are usually pressed several times– Figure 2.5 shows a typical mapping of digits to letters. For example, the 3 key has‘def ’ on it. If you press the key once you get a ‘d’, if you press 3 twice you get an ‘e’,if you press it three times you get an ‘f ’. The main number-to-letter mapping is stand-ard, but punctuation and accented letters differ between phones. Also there needs tobe a way for the phone to distinguish, say, the ‘dd’ from ‘e’. On some phones youneed to pause for a short period between successive letters using the same key, forothers you press an additional key (e.g. ‘#’).
Most phones have at least two modes for the numeric buttons: one where the keysmean the digits (for example when entering a phone number) and one where theymean letters (for example when typing an SMS message). Some have additionalmodes to make entering accented characters easier. Also a special mode or setting isneeded for capital letters although many phones use rules to reduce this, for ex-ample automatically capitalizing the initial letter in a message and letters followingfull stops, question marks and exclamation marks.
This is all very laborious and, as we will see in Chapter 19, experienced mobilephone users make use of a highly developed shorthand to reduce the number ofkeystrokes. If you watch a teenager or other experienced txt-er, you will see they
Figure 2.5 Mobile phone keypad. Source: Photograph by Alan Dix (Ericsson phone)
Typical key mapping:1 – space, comma, etc. (varies)2 – a b c3 – d e f4 – g h i5 – j k l6 – m n o7 – p q r s8 – t u v9 – w x y z0 – +, &, etc.

2.2 Text entry devices 69
often develop great typing speed holding the phone in one hand and using only their thumb. As these skills spread through society it may be that future devices use this as a means of small format text input. For those who never develop thisphysical dexterity some phones have tiny plug-in keyboards, or come with fold-outkeyboards.
Another technical solution to the problem is the T9 algorithm. This uses a largedictionary to disambiguate words by simply typing the relevant letters once. Forexample, ‘3926753’ becomes ‘example’ as there is only one word with letters thatmatch (alternatives like ‘ewbosld’ that also match are not real words). Where thereare ambiguities such as ‘26’, which could be an ‘am’ or an ‘an’, the phone gives aseries of options to choose from.
2.2.4 Handwriting recognition
Handwriting is a common and familiar activity, and is therefore attractive as amethod of text entry. If we were able to write as we would when we use paper, butwith the computer taking this form of input and converting it to text, we can see thatit is an intuitive and simple way of interacting with the computer. However, there area number of disadvantages with handwriting recognition. Current technology is still fairly inaccurate and so makes a significant number of mistakes in recognizingletters, though it has improved rapidly. Moreover, individual differences in hand-writing are enormous, and make the recognition process even more difficult. Themost significant information in handwriting is not in the letter shape itself but in thestroke information – the way in which the letter is drawn. This means that deviceswhich support handwriting recognition must capture the stroke information, notjust the final character shape. Because of this, online recognition is far easier thanreading handwritten text on paper. Further complications arise because letterswithin words are shaped and often drawn very differently depending on the actualword; the context can help determine the letter’s identity, but is often unable to pro-vide enough information. Handwriting recognition is covered in more detail later inthe book, in Chapter 10. More serious in many ways is the limitation on speed; it isdifficult to write at more than 25 words a minute, which is no more than half thespeed of a decent typist.
The different nature of handwriting means that we may find it more useful in situations where a keyboard-based approach would have its own problems. Such situations will invariably result in completely new systems being designed around the handwriting recognizer as the predominant mode of textual input, and these may bear very little resemblance to the typical system. Pen-based systems that usehandwriting recognition are actively marketed in the mobile computing market,especially for smaller pocket organizers. Such machines are typically used for takingnotes and jotting down and sketching ideas, as well as acting as a diary, address bookand organizer. Using handwriting recognition has many advantages over using akeyboard. A pen-based system can be small and yet still accurate and easy to use,whereas small keys become very tiring, or even impossible, to use accurately. Also the
70 Chapter 2 n The computer
pen-based approach does not have to be altered when we move from jotting downtext to sketching diagrams; pen-based input is highly appropriate for this also.
Some organizer designs have dispensed with a keyboard completely. With suchsystems one must consider all sorts of other ways to interact with the system that arenot character based. For example, we may decide to use gesture recognition, ratherthan commands, to tell the system what to do, for example drawing a line through aword in order to delete it. The important point is that a different input device thatwas initially considered simply as an alternative to the keyboard opens up a wholehost of alternative interface designs and different possibilities for interaction.
Signature authentication
Handwriting recognition is difficult principally because of the great differences between dif-ferent people’s handwriting. These differences can be used to advantage in signature authenticationwhere the purpose is to identify the user rather than read the signature. Again this is far easierwhen we have stroke information as people tend to produce signatures which look slightly differ-ent from one another in detail, but are formed in a similar fashion. Furthermore, a forger who hasa copy of a person’s signature may be able to copy the appearance of the signature, but will notbe able to reproduce the pattern of strokes.
2.2.5 Speech recognition
Speech recognition is a promising area of text entry, but it has been promising for anumber of years and is still only used in very limited situations. There is a naturalenthusiasm for being able to talk to the machine and have it respond to commands,since this form of interaction is one with which we are very familiar. Successfulrecognition rates of over 97% have been reported, but since this represents one let-ter in error in approximately every 30, or one spelling mistake every six or so words,this is stoll unacceptible (sic)! Note also that this performance is usually quoted onlyfor a restricted vocabulary of command words. Trying to extend such systems to thelevel of understanding natural language, with its inherent vagueness, imprecisionand pauses, opens up many more problems that have not been satisfactorily solvedeven for keyboard-entered natural language. Moreover, since every person speaksdifferently, the system has to be trained and tuned to each new speaker, or its per-formance decreases. Strong accents, a cold or emotion can also cause recognitionproblems, as can background noise. This leads us on to the question of practicalitywithin an office environment: not only may the background level of noise causeerrors, but if everyone in an open-plan office were to talk to their machine, the levelof noise would dramatically increase, with associated difficulties. Confidentialitywould also be harder to maintain.
Despite its problems, speech technology has found niche markets: telephoneinformation systems, access for the disabled, in hands-occupied situations (especially

2.3 Positioning, pointing and drawing 71
military) and for those suffering RSI. This is discussed in greater detail in Chapter 10,but we can see that it offers three possibilities. The first is as an alternative text entrydevice to replace the keyboard within an environment and using software originallydesigned for keyboard use. The second is to redesign a system, taking full advantageof the benefits of the technique whilst minimizing the potential problems. Finally, itcan be used in areas where keyboard-based input is impractical or impossible. It is inthe latter, more radical areas that speech technology is currently achieving success.
POSITIONING, POINTING AND DRAWING
Central to most modern computing systems is the ability to point at something onthe screen and thereby manipulate it, or perform some function. There has been along history of such devices, in particular in computer-aided design (CAD), wherepositioning and drawing are the major activities. Pointing devices allow the user topoint, position and select items, either directly or by manipulating a pointer on thescreen. Many pointing devices can also be used for free-hand drawing although theskill of drawing with a mouse is very different from using a pencil. The mouse is stillmost common for desktop computers, but is facing challenges as laptop and hand-held computing increase their market share. Indeed, these words are being typed ona laptop with a touchpad and no mouse.
2.3.1 The mouse
The mouse has become a major component of the majority of desktop computer sys-tems sold today, and is the little box with the tail connecting it to the machine in ourbasic computer system picture (Figure 2.1). It is a small, palm-sized box housing aweighted ball – as the box is moved over the tabletop, the ball is rolled by the tableand so rotates inside the housing. This rotation is detected by small rollers that arein contact with the ball, and these adjust the values of potentiometers. If you removethe ball occasionally to clear dust you may be able to see these rollers. The changingvalues of these potentiometers can be directly related to changes in position of theball. The potentiometers are aligned in different directions so that they can detectboth horizontal and vertical motion. The relative motion information is passed to the computer via a wire attached to the box, or in some cases using wireless orinfrared, and moves a pointer on the screen, called the cursor. The whole arrange-ment tends to look rodent-like, with the box acting as the body and the wire as thetail; hence the term ‘mouse’. In addition to detecting motion, the mouse has typicallyone, two or three buttons on top. These are used to indicate selection or to initiateaction. Single-button mice tend to have similar functionality to multi-button mice,and achieve this by instituting different operations for a single and a double buttonclick. A ‘double-click’ is when the button is pressed twice in rapid succession. Multi-button mice tend to allocate one operation to each particular button.
2.3

72 Chapter 2 n The computer
The mouse operates in a planar fashion, moving around the desktop, and is anindirect input device, since a transformation is required to map from the horizontalnature of the desktop to the vertical alignment of the screen. Left–right motion isdirectly mapped, whilst up–down on the screen is achieved by moving the mouseaway–towards the user. The mouse only provides information on the relative move-ment of the ball within the housing: it can be physically lifted up from the desktopand replaced in a different position without moving the cursor. This offers theadvantage that less physical space is required for the mouse, but suffers from beingless intuitive for novice users. Since the mouse sits on the desk, moving it about iseasy and users suffer little arm fatigue, although the indirect nature of the mediumcan lead to problems with hand–eye coordination. However, a major advantage ofthe mouse is that the cursor itself is small, and it can be easily manipulated withoutobscuring the display.
The mouse was developed around 1964 by Douglas C. Engelbart, and a photo-graph of the first prototype is shown in Figure 2.6. This used two wheels that slid across the desktop and transmitted x–y coordinates to the computer. The hous-ing was carved in wood, and has been damaged, exposing one of the wheels. Theoriginal design actually offers a few advantages over today’s more sleek versions: by tilting it so that only one wheel is in contact with the desk, pure vertical or hori-zontal motion can be obtained. Also, the problem of getting the cursor across the large screens that are often used today can be solved by flicking your wrist to get the horizontal wheel spinning. The mouse pointer then races across the screen withno further effort on your behalf, until you stop it at its destination by dropping themouse down onto the desktop.
Figure 2.6 The first mouse. Photograph courtesy of Douglas Engelbart andBootstrap Institute

2.3 Positioning, pointing and drawing 73
Although most mice are hand operated, not all are – there have been experimentswith a device called the footmouse. As the name implies, it is a foot-operated device,although more akin to an isometric joystick than a mouse. The cursor is moved byfoot pressure on one side or the other of a pad. This allows one to dedicate hands tothe keyboard. A rare device, the footmouse has not found common acceptance!
Interestingly foot pedals are used heavily in musical instruments including pianos,electric guitars, organs and drums and also in mechanical equipment including cars,cranes, sewing machines and industrial controls. So it is clear that in principle this isa good idea. Two things seem to have limited their use in computer equipment(except simulators and games). One is the practicality of having foot controls in thework environment: pedals under a desk may be operated accidentally, laptops withfoot pedals would be plain awkward. The second issue is the kind of control beingexercised. Pedals in physical interfaces are used predominantly to control one ormore single-dimensional analog controls. It may be that in more specialized interfacesappropriate foot-operated controls could be more commonly and effectively used.
2.3.2 Touchpad
Touchpads are touch-sensitive tablets usually around 2–3 inches (50–75 mm)square. They were first used extensively in Apple Powerbook portable computers butare now used in many other notebook computers and can be obtained separately toreplace the mouse on the desktop. They are operated by stroking a finger over theirsurface, rather like using a simulated trackball. The feel is very different from otherinput devices, but as with all devices users quickly get used to the action and becomeproficient.
Because they are small it may require several strokes to move the cursor across thescreen. This can be improved by using acceleration settings in the software linkingthe trackpad movement to the screen movement. Rather than having a fixed ratio ofpad distance to screen distance, this varies with the speed of movement. If the finger
Optical mice
Optical mice work differently from mechanical mice. A light-emitting diode emits a weakred light from the base of the mouse. This is reflected off a special pad with a metallic grid-like pat-tern upon which the mouse has to sit, and the fluctuations in reflected intensity as the mouse ismoved over the gridlines are recorded by a sensor in the base of the mouse and translated intorelative x, y motion. Some optical mice do not require special mats, just an appropriate surface,and use the natural texture of the surface to detect movement. The optical mouse is less suscept-ible to dust and dirt than the mechanical one in that its mechanism is less likely to become blockedup. However, for those that rely on a special mat, if the mat is not properly aligned, movement ofthe mouse may become erratic – especially difficult if you are working with someone and pass themouse back and forth between you.

74 Chapter 2 n The computer
moves slowly over the pad then the pad movements map to small distances on thescreen. If the finger is moving quickly the same distance on the touchpad moves thecursor a long distance. For example, on the trackpad being used when writing thissection a very slow movement of the finger from one side of the trackpad to the othermoves the cursor less than 10% of the width of the screen. However, if the finger ismoved very rapidly from side to side, the cursor moves the whole width of the screen.
In fact, this form of acceleration setting is also used in other indirect positioningdevices including the mouse. Fine settings of this sort of parameter makes a great dif-ference to the ‘feel’ of the device.
2.3.3 Trackball and thumbwheel
The trackball is really just an upside-down mouse! A weighted ball faces upwards andis rotated inside a static housing, the motion being detected in the same way as for a mechanical mouse, and the relative motion of the ball moves the cursor. Becauseof this, the trackball requires no additional space in which to operate, and is there-fore a very compact device. It is an indirect device, and requires separate buttons for selection. It is fairly accurate, but is hard to draw with, as long movements aredifficult. Trackballs now appear in a wide variety of sizes, the most usual being aboutthe same as a golf ball, with a number of larger and smaller devices available. The sizeand ‘feel’ of the trackball itself affords significant differences in the usability of thedevice: its weight, rolling resistance and texture all contribute to the overall effect.
Some of the smaller devices have been used in notebook and portable computers,but more commonly trackpads or nipples are used. They are often sold as altern-atives to mice on desktop computers, especially for RSI sufferers. They are also heavily used in video games where their highly responsive behavior, including beingable to spin the ball, is ideally suited to the demands of play.
Thumbwheels are different in that they have two orthogonal dials to control thecursor position. Such a device is very cheap, but slow, and it is difficult to manipu-late the cursor in any way other than horizontally or vertically. This limitation cansometimes be a useful constraint in the right application. For instance, in CAD thedesigner is almost always concerned with exact verticals and horizontals, and adevice that provides such constraints is very useful, which accounts for the appear-ance of thumbwheels in CAD systems. Another successful application for such adevice has been in a drawing game such as Etch-a-Sketch in which straight lines canbe created on a simple screen, since the predominance of straight lines in simpledrawings means that the motion restrictions are an advantage rather than a handi-cap. However, if you were to try to write your signature using a thumbwheel, the limitations would be all too apparent. The appropriateness of the device depends onthe task to be performed.
Although two-axis thumbwheels are not heavily used in mainstream applications,single thumbwheels are often included on a standard mouse in order to offer analternative means to scroll documents. Normally scrolling requires you to grab thescroll bar with the mouse cursor and drag it down. For large documents it is hard to
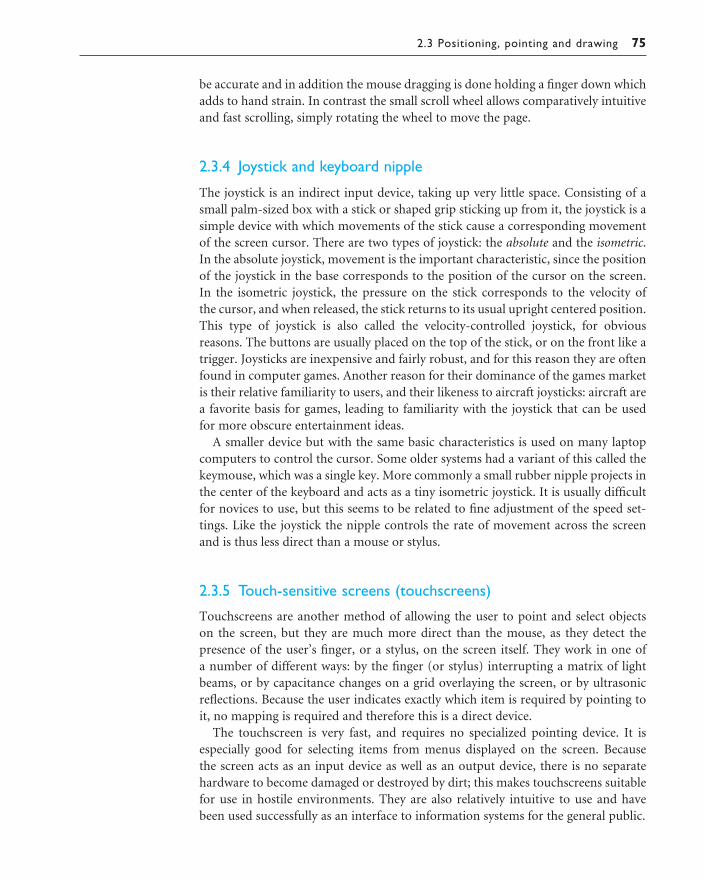
2.3 Positioning, pointing and drawing 75
be accurate and in addition the mouse dragging is done holding a finger down whichadds to hand strain. In contrast the small scroll wheel allows comparatively intuitiveand fast scrolling, simply rotating the wheel to move the page.
2.3.4 Joystick and keyboard nipple
The joystick is an indirect input device, taking up very little space. Consisting of asmall palm-sized box with a stick or shaped grip sticking up from it, the joystick is asimple device with which movements of the stick cause a corresponding movementof the screen cursor. There are two types of joystick: the absolute and the isometric.In the absolute joystick, movement is the important characteristic, since the positionof the joystick in the base corresponds to the position of the cursor on the screen. In the isometric joystick, the pressure on the stick corresponds to the velocity of the cursor, and when released, the stick returns to its usual upright centered position.This type of joystick is also called the velocity-controlled joystick, for obvious reasons. The buttons are usually placed on the top of the stick, or on the front like atrigger. Joysticks are inexpensive and fairly robust, and for this reason they are oftenfound in computer games. Another reason for their dominance of the games marketis their relative familiarity to users, and their likeness to aircraft joysticks: aircraft area favorite basis for games, leading to familiarity with the joystick that can be used for more obscure entertainment ideas.
A smaller device but with the same basic characteristics is used on many laptopcomputers to control the cursor. Some older systems had a variant of this called thekeymouse, which was a single key. More commonly a small rubber nipple projects inthe center of the keyboard and acts as a tiny isometric joystick. It is usually difficultfor novices to use, but this seems to be related to fine adjustment of the speed set-tings. Like the joystick the nipple controls the rate of movement across the screenand is thus less direct than a mouse or stylus.
2.3.5 Touch-sensitive screens (touchscreens)
Touchscreens are another method of allowing the user to point and select objects on the screen, but they are much more direct than the mouse, as they detect the presence of the user’s finger, or a stylus, on the screen itself. They work in one of a number of different ways: by the finger (or stylus) interrupting a matrix of lightbeams, or by capacitance changes on a grid overlaying the screen, or by ultrasonicreflections. Because the user indicates exactly which item is required by pointing toit, no mapping is required and therefore this is a direct device.
The touchscreen is very fast, and requires no specialized pointing device. It is especially good for selecting items from menus displayed on the screen. Because the screen acts as an input device as well as an output device, there is no separatehardware to become damaged or destroyed by dirt; this makes touchscreens suitablefor use in hostile environments. They are also relatively intuitive to use and havebeen used successfully as an interface to information systems for the general public.

76 Chapter 2 n The computer
They suffer from a number of disadvantages, however. Using the finger to point isnot always suitable, as it can leave greasy marks on the screen, and, being a fairlyblunt instrument, it is quite inaccurate. This means that the selection of smallregions is very difficult, as is accurate drawing. Moreover, lifting the arm to point toa vertical screen is very tiring, and also means that the screen has to be within abouta meter of the user to enable it to be reached, which can make it too close for com-fort. Research has shown that the optimal angle for a touchscreen is about 15 degreesup from the horizontal.
2.3.6 Stylus and light pen
For more accurate positioning (and to avoid greasy screens), systems with touch-sensitive surfaces often emply a stylus. Instead of pointing at the screen directly asmall pen-like plastic stick is used to point and draw on the screen. This is particu-larly popular in PDAs, but they are also being used in some laptop computers.
An older technology that is used in the same way is the light pen. The pen is con-nected to the screen by a cable and, in operation, is held to the screen and detects a burst of light from the screen phosphor during the display scan. The light pen can therefore address individual pixels and so is much more accurate than the touchscreen.
Both stylus and light pen can be used for fine selection and drawing, but both can be tiring to use on upright displays and are harder to take up and put down when used together with a keyboard. Interestingly some users of PDAs with fold-outkeyboards learn to hold the stylus held outwards between their fingers so that theycan type whilst holding it. As it is unattached the stylus can easily get lost, but aclosed pen can be used in emergencies.
Stylus, light pen and touchscreen are all very direct in that the relationshipbetween the device and the thing selected is immediate. In contrast, mouse, touch-pad, joystick and trackball all have to map movements on the desk to cursor move-ment on the screen.
However, the direct devices suffer from the problem that, in use, the act of point-ing actually obscures the display, making it harder to use, especially if complexdetailed selections or movements are required in rapid succession. This means thatscreen designs have to take into account where the user’s hand will be. For example,you may want to place menus at the bottom of the screen rather than the top. Alsoyou may want to offer alternative layouts for right-handed and left-handed users.
2.3.7 Digitizing tablet
The digitizing tablet is a more specialized device typically used for freehand drawing,but may also be used as a mouse substitute. Some highly accurate tablets, usuallyusing a puck (a mouse-like device), are used in special applications such as digitizinginformation for maps.
The tablet provides positional information by measuring the position of somedevice on a special pad, or tablet, and can work in a number of ways. The resistive
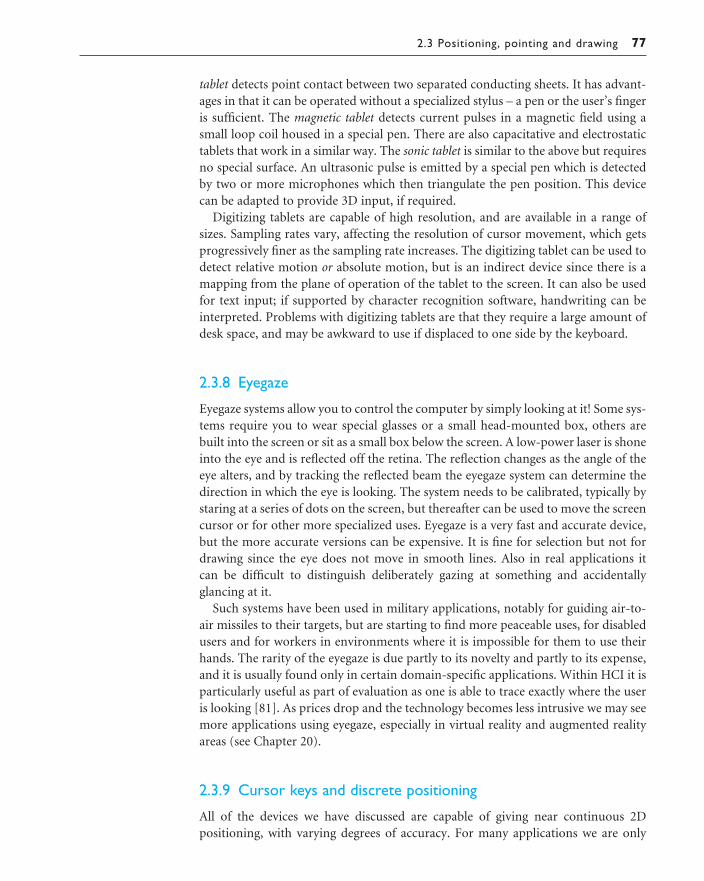
2.3 Positioning, pointing and drawing 77
tablet detects point contact between two separated conducting sheets. It has advant-ages in that it can be operated without a specialized stylus – a pen or the user’s fingeris sufficient. The magnetic tablet detects current pulses in a magnetic field using asmall loop coil housed in a special pen. There are also capacitative and electrostatictablets that work in a similar way. The sonic tablet is similar to the above but requiresno special surface. An ultrasonic pulse is emitted by a special pen which is detectedby two or more microphones which then triangulate the pen position. This devicecan be adapted to provide 3D input, if required.
Digitizing tablets are capable of high resolution, and are available in a range ofsizes. Sampling rates vary, affecting the resolution of cursor movement, which getsprogressively finer as the sampling rate increases. The digitizing tablet can be used todetect relative motion or absolute motion, but is an indirect device since there is amapping from the plane of operation of the tablet to the screen. It can also be usedfor text input; if supported by character recognition software, handwriting can beinterpreted. Problems with digitizing tablets are that they require a large amount ofdesk space, and may be awkward to use if displaced to one side by the keyboard.
2.3.8 Eyegaze
Eyegaze systems allow you to control the computer by simply looking at it! Some sys-tems require you to wear special glasses or a small head-mounted box, others arebuilt into the screen or sit as a small box below the screen. A low-power laser is shoneinto the eye and is reflected off the retina. The reflection changes as the angle of theeye alters, and by tracking the reflected beam the eyegaze system can determine thedirection in which the eye is looking. The system needs to be calibrated, typically bystaring at a series of dots on the screen, but thereafter can be used to move the screencursor or for other more specialized uses. Eyegaze is a very fast and accurate device,but the more accurate versions can be expensive. It is fine for selection but not fordrawing since the eye does not move in smooth lines. Also in real applications it can be difficult to distinguish deliberately gazing at something and accidentallyglancing at it.
Such systems have been used in military applications, notably for guiding air-to-air missiles to their targets, but are starting to find more peaceable uses, for disabledusers and for workers in environments where it is impossible for them to use theirhands. The rarity of the eyegaze is due partly to its novelty and partly to its expense,and it is usually found only in certain domain-specific applications. Within HCI it isparticularly useful as part of evaluation as one is able to trace exactly where the useris looking [81]. As prices drop and the technology becomes less intrusive we may seemore applications using eyegaze, especially in virtual reality and augmented realityareas (see Chapter 20).
2.3.9 Cursor keys and discrete positioning
All of the devices we have discussed are capable of giving near continuous 2D positioning, with varying degrees of accuracy. For many applications we are only
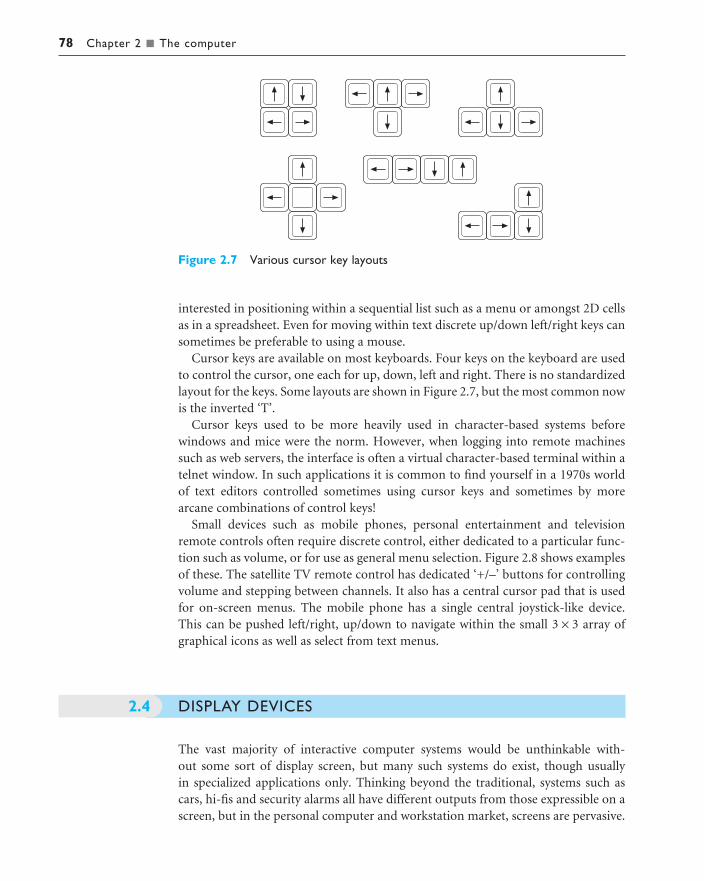
78 Chapter 2 n The computer
interested in positioning within a sequential list such as a menu or amongst 2D cellsas in a spreadsheet. Even for moving within text discrete up/down left/right keys cansometimes be preferable to using a mouse.
Cursor keys are available on most keyboards. Four keys on the keyboard are usedto control the cursor, one each for up, down, left and right. There is no standardizedlayout for the keys. Some layouts are shown in Figure 2.7, but the most common nowis the inverted ‘T’.
Cursor keys used to be more heavily used in character-based systems before windows and mice were the norm. However, when logging into remote machinessuch as web servers, the interface is often a virtual character-based terminal within atelnet window. In such applications it is common to find yourself in a 1970s worldof text editors controlled sometimes using cursor keys and sometimes by morearcane combinations of control keys!
Small devices such as mobile phones, personal entertainment and televisionremote controls often require discrete control, either dedicated to a particular func-tion such as volume, or for use as general menu selection. Figure 2.8 shows examplesof these. The satellite TV remote control has dedicated ‘+/–’ buttons for controllingvolume and stepping between channels. It also has a central cursor pad that is usedfor on-screen menus. The mobile phone has a single central joystick-like device. This can be pushed left/right, up/down to navigate within the small 3 × 3 array ofgraphical icons as well as select from text menus.
DISPLAY DEVICES
The vast majority of interactive computer systems would be unthinkable with-out some sort of display screen, but many such systems do exist, though usually in specialized applications only. Thinking beyond the traditional, systems such ascars, hi-fis and security alarms all have different outputs from those expressible on ascreen, but in the personal computer and workstation market, screens are pervasive.
2.4
Figure 2.7 Various cursor key layouts

2.4 Display devices 79
In this section, we discuss the standard computer display in detail, looking at theproperties of bitmap screens, at different screen technologies, at large and situateddisplays, and at a new technology, ‘digital paper’.
2.4.1 Bitmap displays – resolution and color
Virtually all computer displays are based on some sort of bitmap. That is the displayis made of vast numbers of colored dots or pixels in a rectangular grid. These pixelsmay be limited to black and white (for example, the small display on many TVremote controls), in grayscale, or full color.
Figure 2.8 Satellite TV remote control and mobile phone. Source: Photograph left by Alan Dix withpermission from British Sky Broadcasting Limited, photograph right by Alan Dix (Ericsson phone)

80 Chapter 2 n The computer
The color or, for monochrome screens, the intensity at each pixel is held by thecomputer’s video card. One bit per pixel can store on/off information, and hence onlyblack and white (the term ‘bitmap’ dates from such displays). More bits per pixelgive rise to more color or intensity possibilities. For example, 8 bits/pixel give rise to28 = 256 possible colors at any one time. The set of colors make up what is called thecolormap, and the colormap can be altered at any time to produce a different set ofcolors. The system is therefore capable of actually displaying many more than thenumber of colors in the colormap, but not simultaneously. Most desktop computersnow use 24 or 32 bits per pixel which allows virtually unlimited colors, but devices suchas mobile phones and PDAs are often still monochrome or have limited color range.
As well as the number of colors that can be displayed at each pixel, the other measurethat is important is the resolution of the screen. Actually the word ‘resolution’ is usedin a confused (and confusing!) way for screens. There are two numbers to consider:
n the total number of pixels: in standard computer displays this is always in a 4:3ratio, perhaps 1024 pixels across by 768 down, or 1600 × 1200; for PDAs this willbe more in the order of a few hundred pixels in each direction.
n the density of pixels: this is measured in pixels per inch. Unlike printers (seeSection 2.7 below) this density varies little between 72 and 96 pixels per inch.
To add to the confusion, a monitor, liquid crystal display (LCD) screen or otherdisplay device will quote its maximum resolution, but the computer may actuallygive it less than this. For example, the screen may be a 1200 × 900 resolution with 96pixels per inch, but the computer only sends it 800 × 600. In the case of a cathode raytube (CRT) this typically will mean that the image is stretched over the screen sur-face giving a lower density of 64 pixels per inch. An LCD screen cannot change itspixel size so it would keep 96 pixels per inch and simply not use all its screen space,adding a black border instead. Some LCD projectors will try to stretch or reducewhat they are given, but this may mean that one pixel gets stretched to two, or twopixels get ‘squashed’ into one, giving rise to display ‘artifacts’ such as thin lines dis-appearing, or uniform lines becoming alternately thick or thin.
Although horizontal and vertical lines can be drawn perfectly on bitmap screens,and lines at 45 degrees reproduce reasonably well, lines at any other angle and curveshave ‘jaggies’, rough edges caused by the attempt to approximate the line with pixels.
When using a single color jaggies are inevitable. Similar effects are seen in bitmapfonts. The problem of jaggies can be reduced by using high-resolution screens, or bya technique known as anti-aliasing. Anti-aliasing softens the edges of line segments,blurring the discontinuity and making the jaggies less obvious.
Look at the two images in Figure 2.9 with your eyes slightly screwed up. See howthe second anti-aliased line looks better. Of course, screen resolution is much higher,but the same principle holds true. The reason this works is because our brains areconstantly ‘improving’ what we see in the world: processing and manipulating theraw sensations of the rods and cones in our eyes and turning them into somethingmeaningful. Often our vision is blurred because of poor light, things being out offocus, or defects in our vision. Our brain compensates and tidies up blurred images.By deliberately blurring the image, anti-aliasing triggers this processing in our brainand we appear to see a smooth line at an angle.

2.4 Display devices 81
2.4.2 Technologies
Cathode ray tube
The cathode ray tube is the television-like computer screen still most common as we write this, but rapidly being displaced by flat LCD screens. It works in a similarway to a standard television screen. A stream of electrons is emitted from an electrongun, which is then focussed and directed by magnetic fields. As the beam hits thephosphor-coated screen, the phosphor is excited by the electrons and glows (seeFigure 2.10). The electron beam is scanned from left to right, and then flicked backto rescan the next line, from top to bottom. This is repeated, at about 30 Hz (that is,30 times a second), per frame, although higher scan rates are sometimes used toreduce the flicker on the screen. Another way of reducing flicker is to use interlacing,in which the odd lines on the screen are all scanned first, followed by the even lines.Using a high-persistence phosphor, which glows for a longer time when excited, alsoreduces flicker, but causes image smearing especially if there is significant animation.
Black and white screens are able to display grayscale by varying the intensity of theelectron beam; color is achieved using more complex means. Three electron guns are used, one each to hit red, green and blue phosphors. Combining these colors can
Figure 2.9 Magnified anti-aliased lines
Figure 2.10 CRT screen

82 Chapter 2 n The computer
produce many others, including white, when they are all fully on. These three phosphordots are focussed to make a single point using a shadow mask, which is imprecise andgives color screens a lower resolution than equivalent monochrome screens.
An alternative approach to producing color on the screen is to use beam penetra-tion. A special phosphor glows a different color depending on the intensity of thebeam hitting it.
The CRT is a cheap display device and has fast enough response times for rapidanimation coupled with a high color capability. Note that animation does not neces-sarily mean little creatures and figures running about on the screen, but refers in a more general sense to the use of motion in displays: moving the cursor, openingwindows, indicating processor-intensive calculations, or whatever. As screen resolu-tion increases, however, the price rises. Because of the electron gun and focussingcomponents behind the screen, CRTs are fairly bulky, though recent innovationshave led to flatter displays in which the electron gun is not placed so that it firesdirectly at the screen, but fires parallel to the screen plane with the resulting beambent through 90 degrees to hit the screen.
Health hazards of CRT displays
Most people who habitually use computers are aware that screens can often cause eyestrainand fatigue; this is usually due to flicker, poor legibility or low contrast. There have also been manyconcerns relating to the emission of radiation from screens. These can be categorized as follows:
n X-rays which are largely absorbed by the screen (but not at the rear!)n ultraviolet and infrared radiation from phosphors in insignificant levelsn radio frequency emissions, plus ultrasound (approximately 16 kHz)n electrostatic field which leaks out through the tube to the user. The intensity is dependent on
distance and humidity. This can cause rashes in the usern electromagnetic fields (50 Hz to 0.5 MHz) which create induction currents in conductive
materials, including the human body. Two types of effects are attributed to this: in the visualsystem, a high incidence of cataracts in visual display unit (VDU) operators, and concern overreproductive disorders (miscarriages and birth defects).
Research into the potentially harmful effect of these emissions is generally inconclusive, in that itis difficult to determine precisely what the causes of illness are, and many health scares have beenthe result of misinformed media opinion rather than scientific fact. However, users who are preg-nant ought to take especial care and observe simple precautions. Generally, there are a number ofcommon-sense things that can be done to relieve strain and minimize any risk. These include
n not sitting too close to the screenn not using very small fontsn not looking at the screen for a long time without a breakn working in well-lit surroundingsn not placing the screen directly in front of a bright window.

2.4 Display devices 83
Liquid crystal display
If you have used a personal organizer or notebook computer, you will have seen the light, flat plastic screens. These displays utilize liquid crystal technology and aresmaller, lighter and consume far less power than traditional CRTs. These are alsocommonly referred to as flat-panel displays. They have no radiation problems asso-ciated with them, and are matrix addressable, which means that individual pixels canbe accessed without the need for scanning.
Similar in principle to the digital watch, a thin layer of liquid crystal is sandwichedbetween two glass plates. The top plate is transparent and polarized, whilst the bot-tom plate is reflective. External light passes through the top plate and is polarized,which means that it only oscillates in one direction. This then passes through thecrystal, reflects off the bottom plate and back to the eye, and so that cell looks white.When a voltage is applied to the crystal, via the conducting glass plates, the crystaltwists. This causes it to turn the plane of polarization of the incoming light, rotatingit so that it cannot return through the top plate, making the activated cell look black.The LCD requires refreshing at the usual rates, but the relatively slow response of thecrystal means that flicker is not usually noticeable. The low intensity of the lightemitted from the screen, coupled with the reduced flicker, means that the LCD is lesstiring to use than standard CRT ones, with reduced eyestrain.
This different technology can be used to replace the standard screen on a desktopcomputer, and this is now common. However, the particular characteristics of com-pactness, light weight and low power consumption have meant that these screenshave created a large niche in the computer market by monopolizing the notebookand portable computer systems side. The advent of these screens allowed small, lightcomputers to be built, and created a large market that did not previously exist. Suchcomputers, riding on the back of the technological wave, have opened up a differentway of working for many people, who now have access to computers when awayfrom the office, whether out on business or at home. Working in a different locationon a smaller machine with different software obviously represents a different style of interaction and so once again we can see that differences in devices may alter the human–computer interaction considerably. The growing notebook computermarket fed back into an investment in developing LCD screen technology, withsupertwisted crystals increasing the viewing angle dramatically. Response times havealso improved so that LCD screens are now used in personal DVD players and evenin home television.
When the second edition of this book was being written the majority of LCDscreens were black and white or grayscale, We wrote then ‘it will be interesting to seewhether color LCD screens supersede grayscale by the time the third edition of thisbook is prepared’. Of course, this is precisely the case. Our expectation is that by thetime we produce the next edition LCD monitors will have taken over from CRTmonitors completely.
84 Chapter 2 n The computer
Special displays
There are a number of other display technologies used in niche markets. The one you are most likely to see is the gas plasma display, which is used in large screens (see Section 2.4.3 below).
The random scan display, also known as the directed beam refresh, or vector display,works differently from the bitmap display, also known as raster scan, that we dis-cussed in Section 2.4.1. Instead of scanning the whole screen sequentially and hori-zontally, the random scan draws the lines to be displayed directly. By updating thescreen at at least 30 Hz to reduce flicker, the direct drawing of lines at any anglemeans that jaggies are not created, and higher resolutions are possible, up to 4096 ×4096 pixels. Color on such displays is achieved using beam penetration technology,and is generally of a poorer quality. Eyestrain and fatigue are still a problem, andthese displays are more expensive than raster scan ones, so they are now only used inniche applications.
The direct view storage tube is used extensively as the display for an analog storage oscilloscope, which is probably the only place that these displays are used inany great numbers. They are similar in operation to the random scan CRT but theimage is maintained by flood guns which have the advantage of producing a stabledisplay with no flicker. The screen image can be incrementally updated but not selectively erased; removing items has to be done by redrawing the new image on a completely erased screen. The screens have a high resolution, typically about 4096 × 3120 pixels, but suffer from low contrast, low brightness and a difficulty indisplaying color.
2.4.3 Large displays and situated displays
Displays are no longer just things you have on your desktop or laptop. In Chapter 19we will discuss meeting room environments that often depend on large sharedscreens. You may have attended lectures where the slides are projected from a com-puter onto a large screen. In shops and garages large screen adverts assault us fromall sides.
There are several types of large screen display. Some use gas plasma technology to create large flat bitmap displays. These behave just like a normal screen exceptthey are big and usually have the HDTV (high definition television) wide screen format which has an aspect ratio of 16:9 instead of the 4:3 on traditional TV andmonitors.
Where very large screen areas are required, several smaller screens, either LCD orCRT, can be placed together in a video wall. These can display separate images, or asingle TV or computer image can be split up by software or hardware so that eachscreen displays a portion of the whole and the result is an enormous image. This is the technique often used in large concerts to display the artists or video imagesduring the performance.
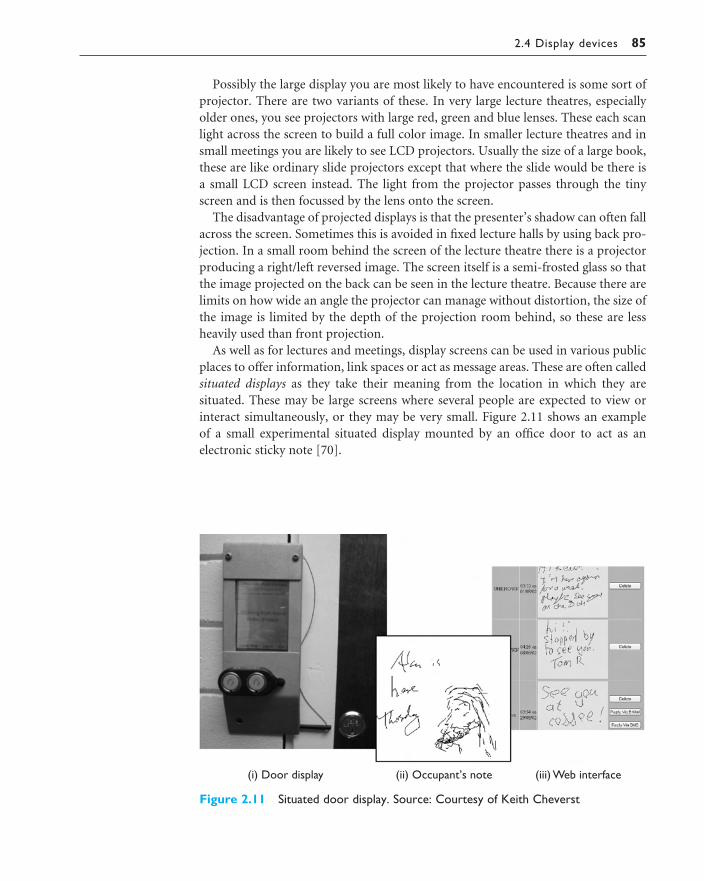
2.4 Display devices 85
Possibly the large display you are most likely to have encountered is some sort ofprojector. There are two variants of these. In very large lecture theatres, especiallyolder ones, you see projectors with large red, green and blue lenses. These each scanlight across the screen to build a full color image. In smaller lecture theatres and insmall meetings you are likely to see LCD projectors. Usually the size of a large book,these are like ordinary slide projectors except that where the slide would be there isa small LCD screen instead. The light from the projector passes through the tinyscreen and is then focussed by the lens onto the screen.
The disadvantage of projected displays is that the presenter’s shadow can often fallacross the screen. Sometimes this is avoided in fixed lecture halls by using back pro-jection. In a small room behind the screen of the lecture theatre there is a projectorproducing a right/left reversed image. The screen itself is a semi-frosted glass so thatthe image projected on the back can be seen in the lecture theatre. Because there arelimits on how wide an angle the projector can manage without distortion, the size ofthe image is limited by the depth of the projection room behind, so these are lessheavily used than front projection.
As well as for lectures and meetings, display screens can be used in various publicplaces to offer information, link spaces or act as message areas. These are often calledsituated displays as they take their meaning from the location in which they are situated. These may be large screens where several people are expected to view orinteract simultaneously, or they may be very small. Figure 2.11 shows an example of a small experimental situated display mounted by an office door to act as an electronic sticky note [70].
Figure 2.11 Situated door display. Source: Courtesy of Keith Cheverst

86 Chapter 2 n The computer
2.4.4 Digital paper
A new form of ‘display’ that is still in its infancy is the various forms of digital paper.These are thin flexible materials that can be written to electronically, just like a com-puter screen, but which keep their contents even when removed from any electricalsupply.
There are various technologies being investigated for this. One involves the wholesurface being covered with tiny spheres, black one side, white the other. Electronicsembedded into the material allow each tiny sphere to be rotated to make it black or white. When the electronic signal is removed the ball stays in its last orientation.A different technique has tiny tubes laid side by side. In each tube is light-absorbingliquid and a small reflective sphere. The sphere can be made to move to the top sur-face or away from it making the pixel white or black. Again the sphere stays in its lastposition once the electronic signal is removed.
Probably the first uses of these will be for large banners that can be reprogrammedor slowly animated. This is an ideal application, as it does not require very rapidupdates and does not require the pixels to be small. As the technology matures, theaim is to have programmable sheets of paper that you attach to your computer to geta ‘soft’ printout that can later be changed. Perhaps one day you may be able to havea ‘soft’ book that appears just like a current book with soft pages that can be turnedand skimmed, but where the contents and cover can be changed when you decide todownload a new book from the net!
DESIGN FOCUS
Hermes: a situated display
Office doors are often used as a noticeboard with messages from the occupant such as ‘just gone out’ or ‘timetable for the week’ and from visitors ‘missed you, call when you get back’. The Hermessystem is an electronic door display that offers some of the functions of sticky notes on a door [70].Figure 2.11(i) shows an installed Hermes device fixed just beside the door, including the socket to use a Java iButton to authenticate the occupant. The occupant can leave messages that others can read(Figure 2.11(ii) ) and people coming to the door can leave messages for the occupant. Electronic notesare smaller than paper ones, but because they are electronic they can be read remotely using a webinterface (Figure 2.11(iii) ), or added by SMS (see Chapter 19, Section 19.3.2).
The fact that it is situated – by a person’s door – is very important. It establishes a context, ‘Alan’sdoor’, and influences the way the system is used. For example, the idea of anonymous messages left onthe door, where the visitor has had to be physically present, feels different from, say, anonymous emails.
See the book website for the full case study: /e3/casestudy/hermes/

2.5 Devices for virtual reality and 3D interaction 87
DEVICES FOR VIRTUAL REALITY AND 3D INTERACTION
Virtual reality (VR) systems and various forms of 3D visualization are discussed indetail in Chapter 20. These require you to navigate and interact in a three-dimensionalspace. Sometimes these use the ordinary controls and displays of a desktop computersystem, but there are also special devices used both to move and interact with 3Dobjects and to enable you to see a 3D environment.
2.5.1 Positioning in 3D space
Virtual reality systems present a 3D virtual world. Users need to navigate throughthese spaces and manipulate the virtual objects they find there. Navigation is notsimply a matter of moving to a particular location, but also of choosing a particularorientation. In addition, when you grab an object in real space, you don’t simplymove it around, but also twist and turn it, for example when opening a door. Thusthe move from mice to 3D devices usually involves a change from two degrees offreedom to six degrees of freedom, not just three.
Cockpit and virtual controls
Helicopter and aircraft pilots already have to navigate in real space. Many arcadegames and also more serious applications use controls modeled on an aircraft cockpit to ‘fly’ through virtual space. However, helicopter pilots are very skilled andit takes a lot of practice for users to be able to work easily in such environments.
In many PC games and desktop virtual reality (where the output is shown on an ordinary computer screen), the controls are themselves virtual. This may be asimulated form of the cockpit controls or more prosaic up/down left/right buttons.The user manipulates these virtual controls using an ordinary mouse (or other 2Ddevice). Note that this means there are two levels of indirection. It is a tribute to theflexibility of the human mind that people can not only use such systems but alsorapidly become proficient.
The 3D mouse
There are a variety of devices that act as 3D versions of a mouse. Rather than justmoving the mouse on a tabletop, you can pick it up, move it in three dimensions,rotate the mouse and tip it forward and backward. The 3D mouse has a full sixdegrees of freedom as its position can be tracked (three degrees), and also itsup/down angle (called pitch), its left/right orientation (called yaw) and the amountit is twisted about its own axis (called roll) (see Figure 2.12). Various sensors are usedto track the mouse position and orientation: magnetic coils, ultrasound or evenmechanical joints where the mouse is mounted rather like an angle-poise lamp.
With the 3D mouse, and indeed most 3D positioning devices, users may experi-ence strain from having to hold the mouse in the air for a long period. Putting the
2.5

88 Chapter 2 n The computer
3D mouse down may even be treated as an action in the virtual environment, that istaking a nose dive.
Dataglove
One of the mainstays of high-end VR systems (see Chapter 20), the dataglove is a 3Dinput device. Consisting of a lycra glove with optical fibers laid along the fingers, itdetects the joint angles of the fingers and thumb. As the fingers are bent, the fiberoptic cable bends too; increasing bend causes more light to leak from the fiber, andthe reduction in intensity is detected by the glove and related to the degree of bendin the joint. Attached to the top of the glove are two sensors that use ultrasound todetermine 3D positional information as well as the angle of roll, that is the degree ofwrist rotation. Such rich multi-dimensional input is currently a solution in search of a problem, in that most of the applications in use do not require such a compre-hensive form of data input, whilst those that do cannot afford it. However, the avail-ability of cheaper versions of the dataglove will encourage the development of morecomplex systems that are able to utilize the full power of the dataglove as an inputdevice. There are a number of potential uses for this technology to assist disabledpeople, but cost remains the limiting factor at present.
The dataglove has the advantage that it is very easy to use, and is potentially verypowerful and expressive (it can provide 10 joint angles, plus the 3D spatial informa-tion and degree of wrist rotation, 50 times a second). It suffers from extremeexpense, and the fact that it is difficult to use in conjunction with a keyboard.However, such a limitation is shortsighted; one can imagine a keyboard drawn ontoa desk, with software detecting hand positions and interpreting whether the virtualkeys had been hit or not. The potential for the dataglove is vast; gesture recognitionand sign language interpretation are two obvious areas that are the focus of activeresearch, whilst less obvious applications are evolving all the time.
Figure 2.12 Pitch, yaw and roll

2.5 Devices for virtual reality and 3D interaction 89
Virtual reality helmets
The helmets or goggles worn in some VR systems have two purposes: (i) they displaythe 3D world to each eye and (ii) they allow the user’s head position to be tracked.We will discuss the former later when we consider output devices. The head trackingis used primarily to feed into the output side. As the user’s head moves around theuser ought to see different parts of the scene. However, some systems also use theuser’s head direction to determine the direction of movement within the space andeven which objects to manipulate (rather like the eyegaze systems). You can think ofthis rather like leading a horse in reverse. If you want a horse to go in a particulardirection, you use the reins to pull its head in the desired direction and the horse follows its head.
Whole-body tracking
Some VR systems aim to be immersive, that is to make the users feel as if they arereally in the virtual world. In the real world it is possible (although not usually wise)to walk without looking in the direction you are going. If you are driving down the road and glance at something on the roadside you do not want the car to do asudden 90-degree turn! Some VR systems therefore attempt to track different kindsof body movement. Some arcade games have a motorbike body on which you canlean into curves. More strangely, small trampolines have been wired up so that theuser can control movement in virtual space by putting weight on different parts ofthe trampoline. The user can literally surf through virtual space. In the extreme themovement of the whole body may be tracked using devices similar to the dataglove,or using image-processing techniques. In the latter, white spots are stuck at variouspoints of the user’s body and the position of these tracked using two or more cam-eras, allowing the location of every joint to be mapped. Although the last of thesesounds a little constraining for the fashion conscious it does point the way to lessintrusive tracking techniques.
2.5.2 3D displays
Just as the 3D images used in VR have led to new forms of input device, they also require more sophisticated outputs. Desktop VR is delivered using a standardcomputer screen and a 3D impression is produced by using effects such as shadows,occlusion (where one object covers another) and perspective. This can be very effective and you can even view 3D images over the world wide web using a VRML(virtual reality markup language) enabled browser.
Seeing in 3D
Our eyes use many cues to perceive depth in the real world (see also Chapter 1). It isin fact quite remarkable as each eye sees only a flattened form of the world, like a photograph. One important effect is stereoscopic vision (or simply stereo vision).

90 Chapter 2 n The computer
Because each eye is looking at an object from a slightly different angle each sees a different image and our brain is able to use this to assess the relative distance of dif-ferent objects. In desktop VR this stereoscopic effect is absent. However, variousdevices exist to deliver true stereoscopic images.
The start point of any stereoscopic device is the generation of images from differ-ent perspectives. As the computer is generating images for the virtual world anyway,this just means working out the right positions and angles corresponding to the typ-ical distance between eyes on a human face. If this distance is too far from the naturalone, the user will be presented with a giant’s or gnat’s eye view of the world!
Different techniques are then used to ensure that each eye sees the appropriateimage. One method is to have two small screens fitted to a pair of goggles. A differ-ent image is then shown to each eye. These devices are currently still quite cumber-some and the popular image of VR is of a user with head encased in a helmet withsomething like a pair of inverted binoculars sticking out in front. However, smallerand lighter LCDs are now making it possible to reduce the devices towards the sizeand weight of ordinary spectacles.
An alternative method is to have a pair of special spectacles connected so that eacheye can be blanked out by timed electrical signals. If this is synchronized with theframe rate of a computer monitor, each eye sees alternate images. Similar techniquesuse polarized filters in front of the monitor and spectacles with different polarizedlenses. These techniques are both effectively using similar methods to the red–green3D spectacles given away in some breakfast cereals. Indeed, these red–green spectacleshave been used in experiments in wide-scale 3D television broadcasts. However, the quality of the 3D image from the polarized and blanked eye spectacles is sub-stantially better.
The ideal would be to be able to look at a special 3D screen and see 3D images justas one does with a hologram – 3D television just like in all the best sci-fi movies! But there is no good solution to this yet. One method is to inscribe the screen withsmall vertical grooves forming hundreds of prisms. Each eye then sees only alternatedots on the screen allowing a stereo image at half the normal horizontal resolution.However, these screens have very narrow viewing angles, and are not ready yet forfamily viewing.
In fact, getting stereo images is not the whole story. Not only do our eyes see dif-ferent things, but each eye also focusses on the current object of interest (small mus-cles change the shape of the lens in the pupil of the eye). The images presented to theeye are generated at some fixed focus, often with effectively infinite depth of field.This can be confusing and tiring. There has been some progress recently on usinglasers to detect the focal depth of each eye and adjust the images correspondingly,similar to the technology used for eye tracking. However, this is not currently usedextensively.
VR motion sickness
We all get annoyed when computers take a long time to change the screen, pop up a window, or play a digital movie. However, with VR the effects of poor display

2.6 Physical controls, sensors and special devices 91
performance can be more serious. In real life when we move our head the image oureyes see changes accordingly. VR systems produce the same effect by using sensors inthe goggles or helmet and then using the position of the head to determine the rightimage to show. If the system is slow in producing these images a lag developsbetween the user moving his head and the scene changing. If this delay is more thana hundred milliseconds or so the feeling becomes disorienting. The effect is very similar to that of being at sea. You stand on the deck looking out to sea, the boat gently rocking below you. Tiny channels in your ears detect the movement tellingyour brain that you are moving; your eyes see the horizon moving in one directionand the boat in another. Your brain gets confused and you get sick. Users of VR canexperience similar nausea and few can stand it for more than a short while. In fact,keeping laboratories sanitary has been a major push in improving VR technology.
Simulators and VR caves
Because of the problems of delivering a full 3D environment via head-mounted displays, some virtual reality systems work by putting the user within an environ-ment where the virtual world is displayed upon it. The most obvious examples of thisare large flight simulators – you go inside a mock-up of an aircraft cockpit and thescenes you would see through the windows are projected onto the virtual windows.In motorbike or skiing simulators in video arcades large screens are positioned to fillthe main part of your visual field. You can still look over your shoulder and see yourfriends, but while you are engaged in the game it surrounds you.
More general-purpose rooms called caves have large displays positioned allaround the user, or several back projectors. In these systems the user can look allaround and see the virtual world surrounding them.
PHYSICAL CONTROLS, SENSORS AND SPECIAL DEVICES
As we have discussed, computers are coming out of the box. The mouse keyboardand screen of the traditional computer system are not relevant or possible in applications that now employ computers such as interactive TV, in-car navigationsystems or personal entertainment. These devices may have special displays, may usesound, touch and smell as well as visual displays, may have dedicated controls andmay sense the environment or your own bio-signs.
2.6.1 Special displays
Apart from the CRT screen there are a number of visual outputs utilized in com-plex systems, especially in embedded systems. These can take the form of analog representations of numerical values, such as dials, gauges or lights to signify a certainsystem state. Flashing light-emitting diodes (LEDs) are used on the back of some
2.6

92 Chapter 2 n The computer
computers to signify the processor state, whilst gauges and dials are found in processcontrol systems. Once you start in this mode of thinking, you can contemplatenumerous visual outputs that are unrelated to the screen. One visual display that hasfound a specialized niche is the head-up display that is used in aircraft. The pilot isfully occupied looking forward and finds it difficult to look around the cockpit to getinformation. There are many different things that need to be known, ranging fromdata from tactical systems to navigational information and aircraft status indicators.The head-up display projects a subset of this information into the pilot’s line of vision so that the information is directly in front of her eyes. This obviates theneed for large banks of information to be scanned with the corresponding lack of attention to what is happening outside, and makes the pilot’s job easier. Lessimportant information is usually presented on a smaller number of dials and gaugesin the cockpit to avoid cluttering the head-up display, and these can be monitoredless often, during times of low stress.
2.6.2 Sound output
Another mode of output that we should consider is that of auditory signals. Oftendesigned to be used in conjunction with screen displays, auditory outputs are poorlyunderstood: we do not yet know how to utilize sound in a sensible way to achievemaximum effect and information transference. We have discussed speech previ-ously, but other sounds such as beeps, bongs, clanks, whistles and whirrs are all usedto varying effect. As well as conveying system output, sounds offer an important levelof feedback in interactive systems. Keyboards can be set to emit a click each time a key is pressed, and this appears to speed up interactive performance. Telephonekeypads often sound different tones when the keys are pressed; a noise occurringsignifies that the key has been successfully pressed, whilst the actual tone providessome information about the particular key that was pressed. The advantage of audit-ory feedback is evident when we consider a simple device such as a doorbell. If wepress it and hear nothing, we are left undecided. Should we press it again, in case we did not do it right the first time, or did it ring but we did not hear it? And if wepress it again but it actually did ring, will the people in the house think we are veryrude, ringing insistently? We feel awkward and a little stressed. If we were using acomputer system instead of a doorbell and were faced with a similar problem, wewould not enjoy the interaction and would not perform as well. Yet it is a simpleproblem that could be easily rectified by a better initial design, using sound. Chap-ter 10 will discuss the use of the auditory channel in more detail.
2.6.3 Touch, feel and smell
Our other senses are used less in normal computer applications, but you may haveplayed computer games where the joystick or artificial steering wheel vibrated, per-haps when a car was about to go off the track. In some VR applications, such as theuse in medical domains to ‘practice’ surgical procedures, the feel of an instrument

2.6 Physical controls, sensors and special devices 93
moving through different tissue types is very important. The devices used to emulatethese procedures have force feedback, giving different amounts of resistance depend-ing on the state of the virtual operation. These various forms of force, resistance andtexture that influence our physical senses are called haptic devices.
Haptic devices are not limited to virtual environments, but are used in specialistinterfaces in the real world too. Electronic braille displays either have pins that riseor fall to give different patterns, or may involve small vibration pins. Force feedbackhas been used in the design of in-car controls.
In fact, the car gives a very good example of the power of tactile feedback. If you drive over a small bump in the road the car is sent slightly off course; however,the chances are that you will correct yourself before you are consciously aware of thebump. Within your body you have reactions that push back slightly against pressureto keep your limbs where you ‘want’ them, or move your limbs out of the way whenyou brush against something unexpected. These responses occur in your lower brain and are very fast, not involving any conscious effort. So, haptic devices canaccess very fast responses, but these responses are not fully controlled. This can beused effectively in design, but of course also with caution.
Texture is more difficult as it depends on small changes between neighboringpoints on the skin. Also, most of our senses notice change rather than fixed stimuli,so we usually feel textures when we move our fingers over a surface, not just whenresting on it. Technology for this is just beginning to become available
There is evidence that smell is one of the strongest cues to memory. Various historical recreations such as the Jorvik Centre in York, England, use smells to createa feeling of immersion in their static displays of past life. Some arcade games alsogenerate smells, for example, burning rubber as your racing car skids on the track.These examples both use a fixed smell in a particular location. There have been several attempts to produce devices to allow smells to be recreated dynamically inresponse to games or even internet sites. The technical difficulty is that our noses donot have a small set of basic smells that are mixed (like salt/sweet/sour/bitter/savouryon our tongue), but instead there are thousands of different types of receptorresponding to different chemicals in the air. The general pattern of devices to gener-ate smells is to have a large repertoire of tiny scent-containing capsules that arereleased in varying amounts on demand – rather like a printer cartridge with hundreds of ink colors! So far there appears to be no mass market for these devices,but they may eventually develop from niche markets.
Smell is a complex multi-dimensional sense and has a peculiar ability to triggermemory, but cannot be changed rapidly. These qualities may prove valuable in areaswhere a general sense of location and awareness is desirable. For example, a projectat the Massachusetts Institute of Technology explored the use of a small battery of scent generators which may be particularly valuable for ambient displays and background awareness [198, 161].

94 Chapter 2 n The computer
2.6.4 Physical controls
Look at Figure 2.13. In it you can see the controls for a microwave, a washingmachine and a personal MiniDisc player. See how they each use very different phys-ical devices: the microwave has a flat plastic sheet with soft buttons, the washingmachine large switches and knobs, and the MiniDisc has small buttons and an inter-esting multi-function end.
A desktop computer system has to serve many functions and so has generic keysand controls that can be used for a variety of purposes. In contrast, these dedicatedcontrol panels have been designed for a particular device and for a single use. This iswhy they differ so much.
Looking first at the microwave, it has a flat plastic control panel. The buttons onthe panel are pressed and ‘give’ slightly. The choice of the smooth panel is probablypartly for visual design – it looks streamlined! However, there are also good prac-tical reasons. The microwave is used in the kitchen whilst cooking, with hands thatmay be greasy or have food on them. The smooth controls have no gaps where foodcan accumulate and clog buttons, so it can easily be kept clean and hygienic.
When using the washing machine you are handling dirty clothes, which may begrubby, but not to the same extent, so the smooth easy-clean panel is less important(although some washing machines do have smooth panels). It has several major
DESIGN FOCUS
Feeling the road
In the BMW 7 Series you will find a single haptic feedback control for many of the functions that wouldnormally have dedicated controls. It uses technology developed by Immersion Corporation who arealso behind the force feedback found in many medical and entertainment haptic devices. The iDrivecontrol slides backwards and forwards and rotates to give access to various menus and lists of options.The haptic feedback allows the user to feel ‘clicks’ appropriate to the number of items in the variousmenu lists.
See: www.immersion.com/ and www.bmw.com/ Picture courtesy of BMW AG

2.6 Physical controls, sensors and special devices 95
settings and the large buttons act both as control and display. Also the dials for dryer timer and the washing program act both as a means to set the desired time orprogram and to display the current state whilst the wash is in progress.
Finally, the MiniDisc controller needs to be small and unobtrusive. It has tiny buttons, but the end control is most interesting. It twists from side to side and also can be pulled and twisted. This means the same control can be used for two different purposes. This form of multi-function control is common in small devices.
We discussed the immediacy of haptic feedback and these lessons are also import-ant at the level of creating physical devices; do keys, dials, etc., feel as if they havebeen pressed or turned? Getting the right level of resistance can make the devicework naturally, give you feedback that you have done something, or let you knowthat you are controlling something. Where for some reason this is not possible,something has to be done to prevent the user getting confused, perhaps pressing but-tons twice; for example, the smooth control panel of the microwave in Figure 2.13offers no tactile feedback, but beeps for each keypress. We will discuss these designissues further when we look at user experience in Chapter 3 (Section 3.9).
Figure 2.13 Physical controls on microwave, washing machine and MiniDisc. Source: Photograph bottomright by Alan Dix with permission from Sony (UK)

96 Chapter 2 n The computer
Whereas texture is difficult to generate, it is easy to build into materials. This canmake a difference to the ease of use of a device. For example, a touchpad is smooth,but a keyboard nipple is usually rubbery. If they were the other way round it wouldbe hard to drag your finger across the touchpad or to operate the nipple without slipping. Texture can also be used to disambiguate. For example, most keyboardshave a small raised dot on the ‘home’ keys for touch typists and some calculators andphones do the same on the ‘5’ key. This is especially useful in applications when theeyes are elsewhere.
2.6.5 Environment and bio-sensing
In a public washroom there are often no controls for the wash basins, you simply putyour hands underneath and (hope that) the water flows. Similarly when you openthe door of a car, the courtesy light turns on. The washbasin is controlled by a smallinfrared sensor that is triggered when your hands are in the basin (although it is
DESIGN FOCUS
Smart-Its – making using sensors easy
Building systems with physical sensors is no easy task. You need a soldering iron, plenty of experiencein electronics, and even more patience. Although some issues are unique to each sensor or project,many of the basic building blocks are similar – connecting simple microprocessors to memory and networks, connecting various standard sensors such as temperature, tilt, etc.
The Smart-Its project has made this job easier by creating a collection of components and an architecture for adding new sensors. There are a number of basic Smart-It boards – the photo on the left shows a microprocessor with wireless connectivity. Onto these boards are plugged a variety ofmodules – in the center is a sensor board including temperature and light, and on the right is a powercontroller.
See: www.smart-its.org/ Source: Courtesy of Hans Gellersen
sometimes hard to find the ‘sweet spot’ where this happens!). The courtesy lights aretriggered by a small switch in the car door.
Although we are not always conscious of them, there are many sensors in our environment – controlling automatic doors, energy saving lights, etc. and devicesmonitoring our behavior such as security tags in shops. The vision of ubiquitouscomputing (see Chapters 4 and 20) suggests that our world will be filled with suchdevices. Certainly the gap between science fiction and day-to-day life is narrow; for example, in the film Minority Report (20th Century Fox) iris scanners identifyeach passer-by to feed them dedicated advertisements, but you can buy just such aniris scanner as a security add-on for your home computer.
There are many different sensors available to measure virtually anything: temper-ature, movement (ultrasound, infrared, etc.), location (GPS, global positioning, inmobile devices), weight (pressure sensors). In addition audio and video informationcan be analyzed to identify individuals and to detect what they are doing. This all sounds big brother like, but is also used in ordinary applications, such as thewashbasin.
Sensors can also be used to capture physiological signs such as body temperature,unconscious reactions such as blink rate, or unconscious aspects of activities such as typing rate, vocabulary shifts (e.g. modal verbs). For example, in a speech-basedgame, Tsukahara and Ward use gaps in speech and prosody (patterns of rhythm,pitch and loudness in speech) to infer the user’s emotional state and thus the natureof acceptable responses [350] and Allanson discusses a variety of physiological sensors to create ‘electrophysiological interactive computer systems’ [12].
PAPER: PRINTING AND SCANNING
Some years ago, a recurrent theme of information technology was the paperless office.In the paperless office, documents would be produced, dispatched, read and filedonline. The only time electronic information would be committed to paper would bewhen it went out of the office to ordinary customers, or to other firms who were lag-gards in this technological race. This vision was fuelled by rocketing property prices,and the realization that the floor space for a wastepaper basket could cost thousandsin rent each year. Some years on, many traditional paper files are now online, but thedesire for the completely paperless office has faded. Offices still have wastepaper bas-kets, and extra floor space is needed for the special computer tables to house 14-inchcolor monitors.
In this section, we will look at some of the available technology that exists to getinformation to and from paper. We will look first at printing, the basic technology,and issues raised by it. We will then go on to discuss the movement from paper backinto electronic media. Although the paperless office is no longer seen as the goal, theless-paper office is perhaps closer, now that the technologies for moving betweenmedia are better.
2.7
2.7 Paper: printing and scanning 97

98 Chapter 2 n The computer
2.7.1 Printing
If anything, computer systems have made it easier to produce paper documents. It isso easy to run off many copies of a letter (or book), in order to get it looking ‘justright’. Older printers had a fixed set of characters available on a printhead. These var-ied from the traditional line printer to golf-ball and daisy-wheel printers. To changea typeface or the size of type meant changing the printhead, and was an awkward,and frequently messy, job, but for many years the daisy-wheel printer was the onlymeans of producing high-quality output at an affordable price. However, the drop inthe price of laser printers coupled with the availability of other cheap high-qualityprinters means that daisy-wheels are fast becoming a rarity.
All of the popular printing technologies, like screens, build the image on the paperas a series of dots. This enables, in theory, any character set or graphic to be printed,
Common types of dot-based printers
Dot-matrix printersThese use an inked ribbon, like a typewriter, but instead of a single character-shaped head strikingthe paper, a line of pins is used, each of which can strike the ribbon and hence dot the paper.Horizontal resolution can be varied by altering the speed of the head across the paper, and ver-tical resolution can be improved by sending the head twice across the paper at a slightly differentposition. So, dot-matrix printers can produce fast draft-quality output or slower ‘letter’-qualityoutput. They are cheap to run, but could not compete with the quality of jet and laser printers forgeneral office and home printing. They are now only used for bulk printing, or where carbon paperis required for payslips, check printing, etc.)
Ink-jet and bubble-jet printersThese operate by sending tiny blobs of ink from the printhead to the paper. The ink is squirted atpressure from an ink-jet, whereas bubble-jets use heat to create a bubble. Both are quite quiet inoperation. The ink from the bubble-jet (being a bubble rather than a droplet) dries more quicklythan the ink-jet and so is less likely to smear. Both approach laser quality, but the bubble-jet dotstend to be more accurately positioned and of a less broken shape.
Laser printerThis uses similar technology to a photocopier: ‘dots’ of electrostatic charge are deposited on adrum, which then picks up toner (black powder). This is then rolled onto the paper and cured byheat. The curing is why laser printed documents come out warm, and the electrostatic charge iswhy they smell of ozone! In addition, some toner can be highly toxic if inhaled, but this is more aproblem for full-time maintenance workers than end-users changing the occasional toner cartridge.
Laser printers give nearly typeset-quality output, with top-end printers used by desktop publishingfirms. Indeed, many books are nowadays produced using laser printers. The authors of this bookhave produced camera-ready copy for other books on 300 and 600 dpi laser printers, although thisbook required higher quality and the first edition was typeset at 1200 dpi onto special bromidepaper.
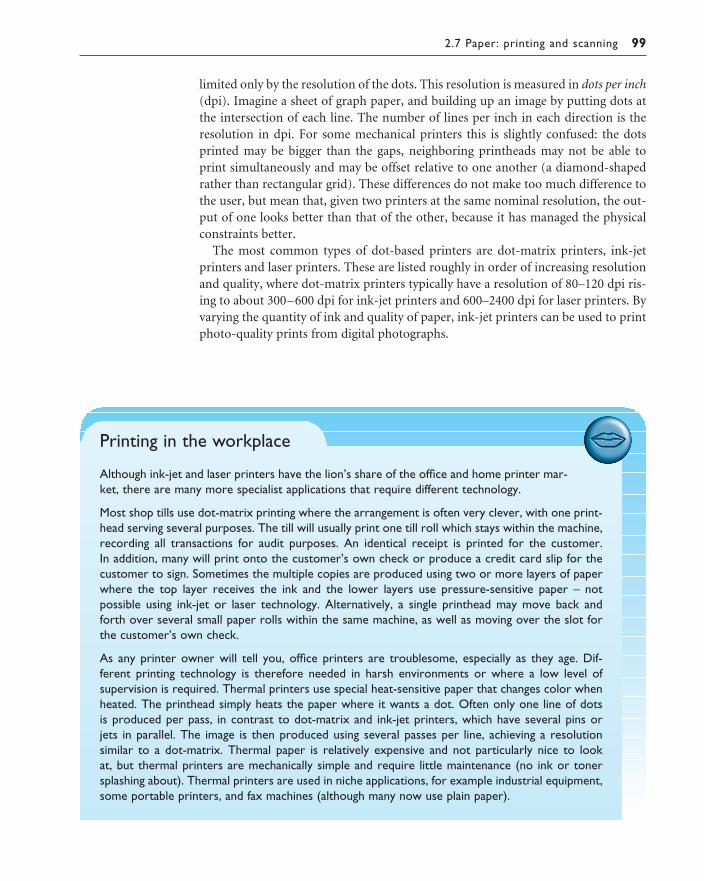
2.7 Paper: printing and scanning 99
limited only by the resolution of the dots. This resolution is measured in dots per inch(dpi). Imagine a sheet of graph paper, and building up an image by putting dots atthe intersection of each line. The number of lines per inch in each direction is theresolution in dpi. For some mechanical printers this is slightly confused: the dotsprinted may be bigger than the gaps, neighboring printheads may not be able to print simultaneously and may be offset relative to one another (a diamond-shapedrather than rectangular grid). These differences do not make too much difference tothe user, but mean that, given two printers at the same nominal resolution, the out-put of one looks better than that of the other, because it has managed the physicalconstraints better.
The most common types of dot-based printers are dot-matrix printers, ink-jetprinters and laser printers. These are listed roughly in order of increasing resolutionand quality, where dot-matrix printers typically have a resolution of 80–120 dpi ris-ing to about 300–600 dpi for ink-jet printers and 600–2400 dpi for laser printers. Byvarying the quantity of ink and quality of paper, ink-jet printers can be used to printphoto-quality prints from digital photographs.
Printing in the workplace
Although ink-jet and laser printers have the lion’s share of the office and home printer mar-ket, there are many more specialist applications that require different technology.
Most shop tills use dot-matrix printing where the arrangement is often very clever, with one print-head serving several purposes. The till will usually print one till roll which stays within the machine,recording all transactions for audit purposes. An identical receipt is printed for the customer. In addition, many will print onto the customer’s own check or produce a credit card slip for thecustomer to sign. Sometimes the multiple copies are produced using two or more layers of paperwhere the top layer receives the ink and the lower layers use pressure-sensitive paper – not possible using ink-jet or laser technology. Alternatively, a single printhead may move back and forth over several small paper rolls within the same machine, as well as moving over the slot forthe customer’s own check.
As any printer owner will tell you, office printers are troublesome, especially as they age. Dif-ferent printing technology is therefore needed in harsh environments or where a low level ofsupervision is required. Thermal printers use special heat-sensitive paper that changes color whenheated. The printhead simply heats the paper where it wants a dot. Often only one line of dots is produced per pass, in contrast to dot-matrix and ink-jet printers, which have several pins or jets in parallel. The image is then produced using several passes per line, achieving a resolution similar to a dot-matrix. Thermal paper is relatively expensive and not particularly nice to look at, but thermal printers are mechanically simple and require little maintenance (no ink or tonersplashing about). Thermal printers are used in niche applications, for example industrial equipment,some portable printers, and fax machines (although many now use plain paper).
100 Chapter 2 n The computer
As well as resolution, printers vary in speed and cost. Typically, office-quality ink-jet or laser printers produce between four and eight pages per minute. Dot-matrixprinters are more often rated in characters per second (cps), and typical speeds maybe 200 cps for draft and 50 cps for letter-quality print. In practice, this means nomore than a page or so per minute. These are maximum speeds for simple text, andprinters may operate much more slowly for graphics.
Color ink-jet printers are substantially cheaper than even monochrome laserprinters. However, the recurrent costs of consumables may easily dominate this initial cost. Both jet and laser printers have special-purpose parts (print cartridges,toner, print drums), which need to be replaced every few thousand sheets; and theymust also use high-grade paper. It may be more difficult to find suitable grades ofrecycled paper for laser printers.
2.7.2 Fonts and page description languages
Some printers can act in a mode whereby any characters sent to them (encoded inASCII, see Section 2.8.5) are printed, typewriter style, in a single font. Another case,simple in theory, is when you have a bitmap picture and want to print it. The dots to print are sent to the printer, and no further interpretation is needed. However, inpractice, it is rarely so simple.
Many printed documents are far more complex – they incorporate text in manydifferent fonts and many sizes, often italicized, emboldened and underlined. Withinthe text you will find line drawings, digitized photographs and pictures generatedfrom ‘paint’ packages, including the ubiquitous ‘clip art’. Sometimes the computerdoes all the work, converting the page image into a bitmap of the right size to be sentto the printer. Alternatively, a description of the page may be sent to the printer. At the simplest level, this will include commands to set the print position on thepage, and change the font size.
More sophisticated printers can accept a page description language, the most com-mon of which is PostScript. This is a form of programming language for printing. Itincludes some standard programming constructs, but also some special ones: pathsfor drawing lines and curves, sophisticated character and font handling and scaledbitmaps. The idea is that the description of a page is far smaller than the associatedbitmap, reducing the time taken to send the page to the printer. A bitmap version of an A4 laser printer page at 300 dpi takes 8 Mbytes; to send this down a standardserial printer cable would take 10 minutes! However, a computer in the printer hasto interpret the PostScript program to print the page; this is typically faster than 10minutes, but is still the limiting factor for many print jobs.
Text is printed in a font with a particular size and shape. The size of a font is measured in points (pt). The point is a printer’s measure and is about 1/72 of aninch. The point size of the font is related to its height: a 12 point font has about six lines per inch. The shape of a font is determined by its font name, for exampleTimes Roman, Courier or Helvetica. Times Roman font is similar to the type ofmany newspapers, such as The Times, whereas Courier has a typewritten shape.

2.7 Paper: printing and scanning 101
Some fonts, such as Courier, are fixed pitch, that is each character has the same width. The alternative is a variable-pitched font, such as Times Roman or Gill Sans, where some characters, such as the ‘m’, are wider than others, such as the ‘i’. Another characteristic of fonts is whether they are serif or sans-serif. A seriffont has fine, short cross-lines at the ends of the strokes, imitating those found on cutstone lettering. A sans-serif font has square-ended strokes. In addition, there are special fonts looking like Gothic lettering or cursive script, and fonts of Greek lettersand special mathematical symbols.
This book is set in 10 point Minion font using PostScript. Minion is a variable-pitched serif font. Figure 2.14 shows examples of different fonts.
A mathematics font: αβξ±π∈∀∞⊥≠ℵ∂√∃Figure 2.14 Examples of different fonts
DESIGN FOCUS
Readability of text
There is a substantial body of knowledge about the readability of text, both on screen and on paper.An MSc student visited a local software company and, on being shown some of their systems, remarkedon the fact that they were using upper case throughout their displays. At that stage she had only com-pleted part of an HCI course but she had read Chapter 1 of this book and already knew that WORDSWRITTEN IN BLOCK CAPITALS take longer to read than those in lower case. Recall that this is largelybecause of the clues given by word shapes and is the principle behind ‘look and say’ methods of teach-ing children to read. The company immediately recognized the value of the advice and she instantly rosein their esteem!
However, as with many interface design guidelines there are caveats. Although lower-case words areeasier to read, individual letters and nonsense words are clearer in upper case. For example, one writesflight numbers as ‘BA793’ rather than ‘ba793’. This is particularly important when naming keys to press(for example, ‘Press Q to quit’) as keyboards have upper-case legends.
Font shapes can also make a difference; for printed text, serif fonts make it easier to run one’s eye along a line of text. However, they usually reproduce less well on screen where the resolution ispoorer.
102 Chapter 2 n The computer
2.7.3 Screen and page
A common requirement of word processors and desktop publishing software is thatwhat you see is what you get (see also Chapters 4 and 17), which is often called by itsacronym WYSIWYG (pronounced whizz-ee-wig). This means that the appearance of the document on the screen should be the same as its eventual appearance on the printed page. In so far as this means that, for example, centered text is displayedcentered on the screen, this is reasonable. However, this should not cloud the factthat screen and paper are very different media.
A typical screen resolution is about 72 dpi compared with a laser printer at over600 dpi. Some packages can show magnified versions of the document in order tohelp in this. Most screens use an additive color model using red, green and blue light,whereas printers use a subtractive color model with cyan, magenta, yellow and blackinks, so conversions have to be made. In addition, the sizes and aspect ratios are verydifferent. An A4 page is about 11 inches tall by 8 wide (297 × 210 mm), whereas ascreen is often of similar dimensions, but wider than it is tall.
These differences cause problems when designing software. Should you try tomake the screen image as close to the paper as possible, or should you try to makethe best of each? One approach to this would be to print only what could be dis-played, but that would waste the extra resolution of the printer. On the other hand, one can try to make the screen as much like paper as possible, which is the intention behind the standard use of black text on a white background, rotatable A4 displays, and tablet PCs. This is a laudable aim, but cannot get rid of all the problems.
A particular problem lies with fonts. Imagine we have a line of ‘m’s, each having awidth of 0.15 inch (4 mm). If we print them on a 72 dpi screen, then we can makethe screen character 10 or 11 dots wide, in which case the screen version will be narrower or wider than the printed version. Alternatively, we can print the screenversion as near as possible to where the printed characters would lie, in which casethe ‘m’s on the screen would have different spaces between them: ‘mm mm mm mmm’. The latter looks horrible on the screen, so most software chooses the formerapproach. This means that text that aligns on screen may not do so on printing.Some systems use a uniform representation for screen and printer, using the samefont descriptions and even, in the case of the Next operating system, PostScript for screen display as well as printer output (also PDF with MacOS X). However, this simply exports the problem from the application program to the operating system.
The differences between screen and printer mean that different forms of graphicdesign are needed for each. For example, headings and changes in emphasis are madeusing font style and size on paper, but using color, brightness and line boxes onscreen. This is not usually a problem for the display of the user’s own documents asthe aim is to give the user as good an impression of the printed page as possible, giventhe limitations. However, if one is designing parallel paper and screen forms, thenone has to trade off consistency between the two representations with clarity in each.

2.7 Paper: printing and scanning 103
An overall similar layout, but with different forms of presentation for details, may beappropriate.
2.7.4 Scanners and optical character recognition
Printers take electronic documents and put them on paper – scanners reverse thisprocess. They start by turning the image into a bitmap, but with the aid of opticalcharacter recognition can convert the page right back into text. The image to be con-verted may be printed, but may also be a photograph or hand-drawn picture.
There are two main kinds of scanner: flat-bed and hand-held. With a flat-bedscanner, the page is placed on a flat glass plate and the whole page is converted into a bitmap. A variant of the flat-bed is where sheets to be scanned are pulledthrough the machine, common in multi-function devices (printer/fax/copier). Manyflat-bed scanners allow a small pile of sheets to be placed in a feed tray so that they can all be scanned without user intervention. Hand-held scanners are pulledover the image by hand. As the head passes over an area it is read in, yielding a bitmap strip. A roller at the ends ensures that the scanner knows how fast it is being pulled and thus how big the image is. The scanner is typically only 3 or 4 inches(80 or 100 mm) wide and may even be the size of a large pen (mainly used for scanning individual lines of text). This means at least two or three strips must be‘glued’ together by software to make a whole page image, quite a difficult process as the strips will overlap and may not be completely parallel to one another, as well as suffering from problems of different brightness and contrast. However, for desktop publishing small images such as photographs are quite common, and as long as one direction is less than the width of the scanner, they can be read in one pass.
Scanners work by shining a beam of light at the page and then recording the intens-ity and color of the reflection. Like photocopiers, the color of the light that is shonemeans that some colors may appear darker than others on a monochrome scanner.For example, if the light is pure red, then a red image will reflect the light completelyand thus not appear on the scanned image.
Like printers, scanners differ in resolution, commonly between 600 and 2400 dpi,and like printers the quoted resolution needs careful interpretation. Many have alower resolution scanhead but digitally interpolate additional pixels – the same istrue for some digital cameras. Monochrome scanners are typically only found inmulti-function devices, but color scanners usually have monochrome modes forblack and white or grayscale copying. Scanners will usually return up to 256 levels of gray or RGB (red, green, blue) color. If a pure monochrome image is required (for instance, from a printed page), then it can threshold the grayscale image; that is,turn all pixels darker than some particular value black, and the rest white.
Scanners are used extensively in desktop publishing (DTP) for reading in hand-drawn pictures and photographs. This means that cut and paste can be performedelectronically rather than with real glue. In addition, the images can be rotated,

104 Chapter 2 n The computer
scaled and otherwise transformed, using a variety of image manipulation softwaretools. Such tools are becoming increasingly powerful, allowing complex image trans-formations to be easily achieved; these range from color correction, through themerging of multiple images to the application of edge-detection and special effectsfilters. The use of multiple layers allows photomontage effects that would be imposs-ible with traditional photographic or paper techniques. Even where a scanned imageis simply going to be printed back out as part of a larger publication, some process-ing typically has to be performed to match the scanned colors with those producedduring printing. For film photographs there are also special film scanners that canscan photographic negatives or color slides. Of course, if the photographs are digitalno scanning is necessary.
Another application area is in document storage and retrieval systems, wherepaper documents are scanned and stored on computer rather than (or sometimes aswell as) in a filing cabinet. The costs of maintaining paper records are enormous, andelectronic storage can be cheaper, more reliable and more flexible. Storing a bitmapimage is neither most useful (in terms of access methods), nor space efficient (as wewill see later), so scanning may be combined with optical character recognition toobtain the text rather than the page image of the document.
Optical character recognition (OCR) is the process whereby the computer can‘read’ the characters on the page. It is only comparatively recently that print could bereliably read, since the wide variety of typefaces and print sizes makes this moredifficult than one would imagine – it is not simply a matter of matching a charactershape to the image on the page. In fact, OCR is rather a misnomer nowadays as,although the document is optically scanned, the OCR software itself operates on thebitmap image. Current software can recognize ‘unseen’ fonts and can even produceoutput in word-processing formats, preserving super- and subscripts, centering, italics and so on.
Another important area is electronic publishing for multimedia and the worldwide web. Whereas in desktop publishing the scanned image usually ends up (afterediting) back on paper, in electronic publishing the scanned image is destined to beviewed on screen. These images may be used simply as digital photographs or maybe made active, whereby clicking on some portion of the image causes pertinentinformation to be displayed (see Chapter 3 for more on the point-and-click style of interaction). One big problem when using electronic images is the plethora of formats for storing graphics (see Section 2.8.5). Another problem is the fact that different computers can display different numbers of colors and that the appearanceof the same image on different monitors can be very different.
The importance of electronic publishing and also the ease of electronically manip-ulating images for printing have made the digital camera increasingly popular.Rather than capturing an image on film, a digital camera has a small light-sensitivechip that can directly record an image into memory.

2.7 Paper: printing and scanning 105
Worked exercise What input and output devices would you use for the following systems? For each, compareand contrast alternatives, and if appropriate indicate why the conventional keyboard, mouseand CRT screen may be less suitable.
(a) portable word processor(b) tourist information system(c) tractor-mounted crop-spraying controller
Paper-based interaction
Paper is principally seen as an output medium. You type in some text, format it, print it andread it. The idea of the paperless office was to remove the paper from the write–read loop entirely,but it didn’t fundamentally challenge its place in the cycle as an output medium. However, this view ofpaper as output has changed as OCR technology has improved and scanners become commonplace.
Workers at Xerox Palo Alto Research Center (also known as Xerox PARC) capitalized on this byusing paper as a medium of interaction with computer systems [195]. A special identifying mark isprinted onto forms and similar output. The printed forms may have check boxes or areas for writ-ing numbers or (in block capitals!) words. The form can then be scanned back in. The system readsthe identifying mark and thereby knows what sort of paper form it is dealing with. It doesn’t haveto use OCR on the printed text of the form as it printed it, but can detect the check boxes thathave been filled in and even recognize the text that has been written. The identifying mark theresearchers used is composed of backward and forward slashes, ‘\’ and ‘/’, and is called a glyph. An alternative would have been to use bar codes, but the slashes were found to fax and scan more reliably. The research version of this system was known as XAX, but it is now marketed asXerox PaperWorks.
One application of this technology is mail order catalogs. The order form is printed with a glyph.When completed, forms can simply be collected into bundles and scanned in batches, generatingorders automatically. If the customer faxes an order the fax-receiving software recognizes theglyph and the order is processed without ever being handled at the company end. Such a paperuser interface may involve no screens or keyboards whatsoever.
Some types of paper now have identifying marks micro-printed like a form of textured water-mark. This can be used both to identify the piece of paper (as the glyph does), and to identify thelocation on the paper. If this book were printed on such paper it would be possible to point at a word or diagram with a special pen-like device and have it work out what page you are on and where you are pointing and thus take you to appropriate web materials . . . perhaps the fourthedition . . .
It is paradoxical that Xerox PARC, where much of the driving work behind current ‘mouse andwindow’ computer interfaces began, has also developed this totally non-screen and non-mouseparadigm. However, the common principle behind each is the novel and appropriate use of differ-ent media for graceful interaction.

106 Chapter 2 n The computer
(d) air traffic control system(e) worldwide personal communications system(f ) digital cartographic system.
Answer In the later exercise on basic architecture (see Section 2.8.6), we focus on ‘typical’ systems, whereas here the emphasis is on the diversity of different devices needed forspecialized purposes. You can ‘collect’ devices – watch out for shop tills, bank tellers,taxi meters, lift buttons, domestic appliances, etc.
(a) Portable word processorThe determining factors are size, weight and battery power. However, rememberthe purpose: this is a word processor not an address book or even a data entrydevice.(i) LCD screen – low-power requirement(ii) trackball or stylus for pointing(iii) real keyboard – you can’t word process without a reasonable keyboard and
stylus handwriting recognition is not good enough(iv) small, low-power bubble-jet printer – although not always necessary, this
makes the package stand alone. It is probably not so necessary that the printerhas a large battery capacity as printing can probably wait until a power point isfound.
(b) Tourist information systemThis is likely to be in a public place. Most users will only visit the system once, sothe information and mode of interaction must be immediately obvious.(i) touchscreen only – easy and direct interaction for first-time users (see also
Chapter 3)(ii) NO mice or styluses – in a public place they wouldn’t stay long!
(c) Tractor-mounted crop-spraying controllerA hostile environment with plenty of mud and chemicals. Requires numerical inputfor flow rates, etc., but probably no text(i) touch-sensitive keypad – ordinary keypads would get blocked up(ii) small dedicated LED display (LCDs often can’t be read in sunlight and large
screens are fragile)(iii) again no mice or styluses – they would get lost.
(d) Air traffic control systemThe emphasis is on immediately available information and rapid interaction. Thecontroller cannot afford to spend time searching for information; all frequently usedinformation must be readily available.(i) several specialized displays – including overlays of electronic information on
radar(ii) light pen or stylus – high-precision direct interaction(iii) keyboard – for occasional text input, but consider making it fold out of the way.
(e) Worldwide personal communications systemBasically a super mobile phone! If it is to be kept on hand all the time it must bevery light and pocket sized. However, to be a ‘communications’ system one wouldimagine that it should also act as a personal address/telephone book, etc.

2.8 Memory 107
(i) standard telephone keypad – the most frequent use(ii) small dedicated LCD display – low power, specialized functions(iii) possibly stylus for interaction – it allows relatively rich interaction with the
address book software, but little space(iv) a ‘docking’ facility – the system itself will be too small for a full-sized key-
board(!), but you won’t want to enter in all your addresses and telephone num-bers by stylus!
(f) Digital cartographic systemThis calls for very high-precision input and output facilities. It is similar to CAD interms of the screen facilities and printing, but in addition will require specializeddata capture.(i) large high-resolution color VDU (20 inch or bigger) – these tend to be enor-
mously big (from back to front). LCD screens, although promising far thinnerdisplays in the long term, cannot at present be made large enough
(ii) digitizing tablet – for tracing data on existing paper maps. It could also doubleup as a pointing device for some interaction
(iii) possibly thumbwheels – for detailed pointing and positioning tasks(iv) large-format printer – indeed very large: an A2 or A1 plotter at minimum.
MEMORY
Like human memory, we can think of the computer’s memory as operating at dif-ferent levels, with those that have the faster access typically having less capacity. Byanalogy with the human memory, we can group these into short-term and long-termmemories (STM and LTM), but the analogy is rather weak – the capacity of the com-puter’s STM is a lot more than seven items! The different levels of computer mem-ory are more commonly called primary and secondary storage.
The details of computer memory are not in themselves of direct interest to theuser interface designer. However, the limitations in capacity and access methods areimportant constraints on the sort of interface that can be designed. After some fairlybasic information, we will put the raw memory capacity into perspective with thesort of information which can be stored, as well as again seeing how advances intechnology offer more scope for the designer to produce more effective interfaces. Inparticular, we will see how the capacity of typical memory copes with video images asthese are becoming important as part of multimedia applications (see Chapter 21).
2.8.1 RAM and short-term memory (STM)
At the lowest level of computer memory are the registers on the computer chip, butthese have little impact on the user except in so far as they affect the general speed of
2.8

108 Chapter 2 n The computer
the computer. Most currently active information is held in silicon-chip randomaccess memory (RAM). Different forms of RAM differ as to their precise access times,power consumption and characteristics. Typical access times are of the order of 10 nanoseconds, that is a hundred-millionth of a second, and information can beaccessed at a rate of around 100 Mbytes (million bytes) per second. Typical storagein modern personal computers is between 64 and 256 Mbytes.
Most RAM is volatile, that is its contents are lost when the power is turned off.However, many computers have small amount of non-volatile RAM, which retains itscontents, perhaps with the aid of a small battery. This may be used to store setupinformation in a large computer, but in a pocket organizer will be the whole mem-ory. Non-volatile RAM is more expensive so is only used where necessary, but withmany notebook computers using very low-power static RAM, the divide is shrink-ing. By strict analogy, non-volatile RAM ought to be classed as LTM, but the import-ant thing we want to emphasize is the gulf between STM and LTM in a traditionalcomputer system.
In PDAs the distinctions become more confused as the battery power means thatthe system is never completely off, so RAM memory effectively lasts for ever. Somealso use flash memory, which is a form of silicon memory that sits between fixedcontent ROM (read-only memory) chips and normal RAM. Flash memory is relat-ively slow to write, but once written retains its content even with no power whatso-ever. These are sometimes called silicon disks on PDAs. Digital cameras typicallystore photographs in some form of flash media and small flash-based devices areused to plug into a laptop or desktop’s USB port to transfer data.
2.8.2 Disks and long-term memory (LTM)
For most computer users the LTM consists of disks, possibly with small tapes forbackup. The existence of backups, and appropriate software to generate and retrievethem, is an important area for user security. However, we will deal mainly with thoseforms of storage that impact the interactive computer user.
There are two main kinds of technology used in disks: magnetic disks and opticaldisks. The most common storage media, floppy disks and hard (or fixed) disks, are coated with magnetic material, like that found on an audio tape, on which theinformation is stored. Typical capacities of floppy disks lie between 300 kbytes and1.4 Mbytes, but as they are removable, you can have as many as you have room foron your desk. Hard disks may store from under 40 Mbytes to several gigabytes(Gbytes), that is several thousand million bytes. With disks there are two access timesto consider, the time taken to find the right track on the disk, and the time to readthe track. The former dominates random reads, and is typically of the order of 10 msfor hard disks. The transfer rate once the track is found is then very high, perhapsseveral hundred kilobytes per second. Various forms of large removable media arealso available, fitting somewhere between floppy disks and removable hard disks, andare especially important for multimedia storage.

2.8 Memory 109
Optical disks use laser light to read and (sometimes) write the information on thedisk. There are various high capacity specialist optical devices, but the most commonis the CD-ROM, using the same technology as audio compact discs. CD-ROMs havea capacity of around 650 megabytes, but cannot be written to at all. They are usefulfor published material such as online reference books, multimedia and software distribution. Recordable CDs are a form of WORM device (write-once read-many)and are more flexible in that information can be written, but (as the name suggests)only once at any location – more like a piece of paper than a blackboard. They areobviously very useful for backups and for producing very secure audit information.Finally, there are fully rewritable optical disks, but the rewrite time is typically muchslower than the read time, so they are still primarily for archival not dynamic storage.Many CD-ROM reader/writers can also read DVD format, originally developed forstoring movies. Optical media are more robust than magnetic disks and so it is easierto use a jukebox arrangement, whereby many optical disks can be brought online auto-matically as required. This can give an online capacity of many hundreds of giga-bytes. However, as magnetic disk capacities have grown faster than the fixed standardof CD-ROMs, some massive capacity stores are moving to large disk arrays.
2.8.3 Understanding speed and capacity
So what effect do the various capacities and speeds have on the user? Thinking of ourtypical personal computer system, we can summarize some typical capacities as inTable 2.1.
We think first of documents. This book is about 320,000 words, or about 2Mbytes, so it would hardly make a dent in 256 Mbytes of RAM. (This size – 2 Mbytes– is unformatted and without illustrations; the actual size of the full data files is anorder of magnitude bigger, but still well within the capacity of main memory.) Totake a more popular work, the Bible would use about 4.5 Mbytes. This would stillconsume only 2% of main memory, and disappear on a hard disk. However, it mightlook tight on a smaller PDA. This makes the memory look not too bad, so long asyou do not intend to put your entire library online. However, many word processorscome with a dictionary and thesaurus, and there is no standard way to use the sameone with several products. Together with help files and the program itself, it is not
Table 2.1 Typical capacities of different storage media
STM small/fast LTM large/slower
Media: RAM Hard diskCapacity: 256 Mbytes 100 GbytesAccess time: 10 ns 7 msTransfer rate: 100 Mbyte/s 30 Mbyte/s

110 Chapter 2 n The computer
unusual to find each application consuming tens or even hundreds of megabytes ofdisk space – it is not difficult to fill a few gigabytes of disk at all!
Similarly, although 256 Mbytes of RAM are enough to hold most (but not all) sin-gle programs, windowed systems will run several applications simultaneously, soonusing up many megabytes. Operating systems handle this by paging unused bits ofprograms out of RAM onto disk, or even swapping the entire program onto disk.This makes little difference to the logical functioning of the program, but has asignificant effect on interaction. If you select a window, and the relevant applicationhappens to be currently swapped out onto the disk, it has to be swapped back in. Thedelay this causes can be considerable, and is both noticeable and annoying on manysystems.
The delays due to swapping are a symptom of the von Neumann bottleneckbetween disk and main memory. There is plenty of information in the memory, butit is not where it is wanted, in the machine’s RAM. The path between them is limitedby the transfer rate of the disk and is too slow. Swapping due to the operating systemmay be difficult to avoid, but for an interactive system designer some of these prob-lems can be avoided by thinking carefully about where information is stored andwhen it is transferred. For example, the program can be lazy about informationtransfer. Imagine the user wants to look at a document. Rather than reading in thewhole thing before letting the user continue, just enough is read in for the first pageto be displayed, and the rest is read during idle moments.
Returning to documents, if they are scanned as bitmaps (and not read usingOCR), then the capacity of our system looks even less impressive. Say an 11 × 8 inch(297 × 210 mm) page is scanned with an 8 bit grayscale (256 levels) setting at 1200 dpi.The image contains about one billion bits, that is about 128 Mbyte. So, our 100 Gbytedisk could store 800 pages – just OK for this book, but not for the Bible.
If we turn to video, things are even worse. Imagine we want to store moving video using 12 bits for each pixel (4 bits for each primary color giving 16 levels ofbrightness), each frame is 512 × 512 pixels, and we store at 25 frames per second.
Technological change and storage capacity
Most of the changes in this book since the first and second editions have been additionswhere new developments have come along. However, this portion has had to be scrutinized lineby line as the storage capacities of high-end machines when this book was first published in 1993looked ridiculous as we revised it in 1997 and then again in 2003. One of our aims in this chapterwas to give readers a concrete feel for the capacities and computational possibilities in standardcomputers. However, the pace of advances in this area means that it becomes out of date almostas fast as it is written! This is also a problem for design; it is easy to build a system that is sensiblegiven a particular level of technology, but becomes meaningless later. The solution is either to issueever more frequent updates and new versions, or to exercise a bit of foresight . . .

2.8 Memory 111
This is by no means a high-quality image, but each frame requires approximately 400 kbytes giving 10 Mbytes per second. Our disk will manage about three hours of video – one good movie. Lowering our sights to still photographs, good digitalcameras usually take 2 to 4 mega pixels at 24 bit color; that is 10 Mbytes of rawuncompressed image – you’d not get all your holiday snaps into main memory!
2.8.4 Compression
In fact, things are not quite so bad, since compression techniques can be used toreduce the amount of storage required for text, bitmaps and video. All of these thingsare highly redundant. Consider text for a moment. In English, we know that if we usethe letter ‘q’ then ‘u’ is almost bound to follow. At the level of words, some wordslike ‘the’ and ‘and’ appear frequently in text in general, and for any particular workone can find other common terms (this book mentions ‘user’ and ‘computer’ ratherfrequently). Similarly, in a bitmap, if one bit is white, there is a good chance the nextwill be as well. Compression algorithms take advantage of this redundancy. Forexample, Huffman encoding gives short codes to frequent words [182], and run-length encoding represents long runs of the same value by length value pairs. Text can easily be reduced by a factor of five and bitmaps often compress to 1% of theiroriginal size.
For video, in addition to compressing each frame, we can take advantage of thefact that successive frames are often similar. We can compute the difference betweensuccessive frames and then store only this – compressed, of course. More sophistic-ated algorithms detect when the camera pans and use this information also. Thesedifferencing methods fail when the scene changes, and so the process periodically hasto restart and send a new, complete (but compressed) image. For storage purposesthis is not a problem, but when used for transmission over telephone lines or net-works it can mean glitches in the video as the system catches up.
With these reductions it is certainly possible to store low-quality video at 64 kbyte/s; that is, we can store five hours of highly compressed video on our 1 Gbytehard disk. However, it still makes the humble video cassette look very good value.
Probably the leading edge of video still and photographic compression is fractalcompression. Fractals have been popularized by the images of the Mandelbrot set (thatswirling pattern of computer-generated colors seen on many T-shirts and posters).Fractals refer to any image that contains parts which, when suitably scaled, are sim-ilar to the whole. If we look at an image, it is possible to find parts which are approx-imately self-similar, and these parts can be stored as a fractal with only a few numericparameters. Fractal compression is especially good for textured features, which causeproblems for other compression techniques. The decompression of the image can be performed to any degree of accuracy, from a very rough soft-focus image, to one more detailed than the original. The former is very useful as one can producepoor-quality output quickly, and better quality given more time. The latter is ratherremarkable – the fractal compression actually fills in details that are not in the original. These details are not accurate, but look convincing!

112 Chapter 2 n The computer
2.8.5 Storage format and standards
The most common data types stored by interactive programs are text and bitmapimages, with increasing use of video and audio, and this subsection looks at theridiculous range of file storage standards. We will consider database retrieval in thenext subsection.
The basic standard for text storage is the ASCII (American standard code for information interchange) character codes, which assign to each standard printablecharacter and several control characters an internationally recognized 7 bit code(decimal values 0–127), which can therefore be stored in an 8 bit byte, or be transmit-ted as 8 bits including parity. Many systems extend the codes to the values 128–255,including line-drawing characters, mathematical symbols and international letters suchas ‘æ’. There is a 16 bit extension, the UNICODE standard, which has enough roomfor a much larger range of characters including the Japanese Kanji character set.
As we have already discussed, modern documents consist of more than just characters.The text is in different fonts and includes formatting information such as centering,page headers and footers. On the whole, the storage of formatted text is vendor specific,since virtually every application has its own file format. This is not helped by the factthat many suppliers attempt to keep their file formats secret, or update them fre-quently to stop others’ products being compatible. With the exception of bare ASCII,the most common shared format is rich text format (RTF), which encodes formattinginformation including style sheets. However, even where an application will importor export RTF, it may represent a cut-down version of the full document style.
RTF regards the document as formatted text, that is it concentrates on the appear-ance. Documents can also be regarded as structured objects: this book has chapterscontaining sections, subsections . . . paragraphs, sentences, words and characters. Thereare ISO standards for document structure and interchange, which in theory could beused for transfer between packages and sites, but these are rarely used in practice.Just as the PostScript language is used to describe the printed page, SGML (standardgeneralized markup language) can be used to store structured text in a reasonablyextensible way. You can define your own structures (the definition itself in SGML),and produce documents according to them. XML (extensible markup language), alightweight version of SGML, is now used extensively for web-based applications.
For bitmap storage the range of formats is seemingly unending. The stored imageneeds to record the size of the image, the number of bits per pixel, possibly a colormap, as well as the bits of the image itself. In addition, an icon may have a ‘hot-spot’for use as a cursor. If you think of all the ways of encoding these features, or leavingthem implicit, and then consider all the combinations of these different encodings,you can see why there are problems. And all this before we have even considered the effects of compression! There is, in fact, a whole software industry producingpackages that convert from one format to another.
Given the range of storage standards (or rather lack of standards), there is no easyadvice as to which is best, but if you are writing a new word processor and are aboutto decide how to store the document on disk, think, just for a moment, beforedefining yet another format.

2.8 Memory 113
2.8.6 Methods of access
Standard database access is by special key fields with an associated index. The userhas to know the key before the system can find the information. A telephone direct-ory is a good example of this. You can find out someone’s telephone number if youknow their name (the key), but you cannot find the name given the number. This isevident in the interface of many computer systems. So often, when you contact anorganization, they can only help you if you give your customer number, or last ordernumber. The usability of the system is seriously impaired by a shortsighted relianceon a single key and index. In fact, most database systems will allow multiple keys andindices, allowing you to find a record given partial information. So these problemsare avoidable with only slight foresight.
There are valid reasons for not indexing on too many items. Adding extra indicesadds to the size of the database, so one has to balance ease of use against storage cost.However, with ever-increasing disk sizes, this is not a good excuse for all but extremeexamples. Unfortunately, brought up on lectures about algorithmic efficiency, it iseasy for computer scientists to be stingy with storage. Another, more valid, reasonfor restricting the fields you index is privacy and security. For example, telephonecompanies will typically hold an online index that, given a telephone number, wouldreturn the name and address of the subscriber, but to protect the privacy of their cus-tomers, this information is not divulged to the general public.
It is often said that dictionaries are only useful for people who can spell. Badspellers do not know what a word looks like so cannot look it up to find out. Not onlyin spelling packages, but in general, an application can help the user by matchingbadly spelt versions of keywords. One example of this is do what I mean (DWIM)used in several of Xerox PARC’s experimental programming environments. If acommand name is misspelt the system prompts the user with a close correct name.Menu-based systems make this less of an issue, but one can easily imagine doing the same with, say, file selection. Another important instance of this principle isSoundex, a way of indexing words, especially names. Given a key, Soundex findsthose words which sound similar. For example, given McCloud, it would findMacCleod. These are all examples of forgiving systems, and in general one should aimto accommodate the user’s mistakes. Again, there are exceptions to this: you do notwant a bank’s automated teller machine (ATM) to give money when the PIN num-ber is almost correct!
Not all databases allow long passages of text to be stored in records, perhaps set-ting a maximum length for text strings, or demanding the length be fixed in advance.Where this is the case, the database seriously restricts interface applications wheretext forms an important part. At the other extreme, free text retrieval systems are cen-tered on unformatted, unstructured text. These systems work by keeping an index of every word in every document, and so you can ask ‘give me all documents withthe words “human” and “computer” in them’. Programs, such as versions of theUNIX ‘grep’ command, give some of the same facilities by quickly scanning a list offiles for a certain word, but are much slower. On the web, free text search is of coursethe standard way to find things using search engines.

114 Chapter 2 n The computer
Worked exercise What is the basic architecture of a computer system?
Answer In an HCI context, you should be assessing the architecture from the point of view ofthe user. The material for this question is scattered throughout the chapter. Look tooat personal computer magazines, where adverts and articles will give you some idea oftypical capabilities . . . and costs. They may also raise some questions: just what is thedifference to the user between an 8 ms and a 10 ms disk drive?
The example answer below gives the general style, although more detail would beexpected of a full answer. In particular, you need to develop a feel for capacities either as ball-park figures or in terms of typical capabilities (seconds of video, pages of text).
ExampleThe basic architecture of a computer system consists of the computer itself (with asso-ciated memory), input and output devices for user interaction and various forms ofhard-copy devices. (Note, the ‘computer science’ answer regards output to the userand output to a printer as essentially equivalent. This is not an acceptable user-centeredview.)
A typical configuration of user input–output devices would be a screen with a keyboardfor typing text and a mouse for pointing and positioning. Depending on circumstance,different pointing devices may be used such as a stylus (for more direct interaction) ora touchpad (especially on portable computers).
The computer itself can be considered as composed of some processing element andmemory. The memory is itself divided into short-term memory which is lost when themachine is turned off and permanent memory which persists.
PROCESSING AND NETWORKS
Computers that run interactive programs will process in the order of 100 millioninstructions per second. It sounds a lot and yet, like memory, it can soon be used up.Indeed, the first program written by one of the authors (some while ago) ‘hung’ andall attempts to debug it failed. Later calculation showed that the program would havetaken more than the known age of the universe to complete! Failures need not be asspectacular as that to render a system unusable. Consider, for example, one drawingsystem known to the authors. To draw a line you press down the mouse button atone end, drag the mouse and then release the mouse button at the other end of theline – but not too quickly. You have to press down the button and then actually holdyour hand steady for a moment, otherwise the line starts half way! For activitiesinvolving the user’s hand–eye coordination, delays of even a fraction of a second canbe disastrous.
2.9

2.9 Processing and networks 115
2.9.1 Effects of finite processor speed
As we can see, speed of processing can seriously affect the user interface. These effectsmust be taken into account when designing an interactive system. There are twosorts of faults due to processing speed: those when it is too slow, and those when itis too fast!
We saw one example of the former above. This was a functional fault, in that theprogram did the wrong thing. The system is supposed to draw lines from where themouse button is depressed to where it is released. However, the program gets itwrong – after realizing the button is down, it does not check the position of themouse fast enough, and so the user may have moved the mouse before the start position is registered. This is a fault at the implementation stage of the system ratherthan of the design. But to be fair, the programmer may not be given the right sort ofinformation from lower levels of system software.
A second fault due to slow processing is where, in a sense, the program does theright thing, but the feedback is too slow, leading to strange effects at the interface. Inorder to avoid faults of the first kind, the system buffers the user input; that is, itremembers keypresses and mouse buttons and movement. Unfortunately, this leadsto problems of its own. One example of this sort of problem is cursor tracking, whichhappens in character-based text editors. The user is trying to move backwards on thesame line to correct an error, and so presses the cursor-left key. The cursor movesand when it is over the correct position, the user releases the key. Unfortunately, thesystem is behind in responding to the user, and so has a few more cursor-left keys
Moore’s law
Everyone knows that computers just get faster and faster. However, in 1965 GordonMoore, co-founder of Intel, noticed a regularity. It seemed that the speed of processors, relatedclosely to the number of transistors that could be squashed on a silicon wafer, was doubling every18 months – exponential growth. One of the authors bought his first ‘proper’ computer in 1987;it was a blindingly fast 1.47 MHz IBM compatible (Macs were too expensive). By 2002 a systemcosting the same in real terms would have had a 1.5 GHz processor – 1000 times faster or 210 in15 years, that is 10 × 18 months.
There is a similar pattern for computer memory, except that the doubling time for magnetic stor-age seems to be closer to one year. For example, when the first edition of this book was writtenone of the authors had a 20 Mbyte hard disk; now, 11 years later, his disk is 30 Gbytes – around210 times more storage in just 10 years.
The effects of this are dramatic. If you took a young baby today and started recording a full audiovideo diary of every moment, day and night, of that child’s life, by the time she was an old lady herwhole life experience would fit into memory the size of a small grain of dust.
For more on Moore’s law and life recording see: /e3/online/moores-law/
116 Chapter 2 n The computer
to process – the cursor then overshoots. The user tries to correct this by pressing thecursor-right key, and again overshoots. There is typically no way for the user to tellwhether the buffer is empty or not, except by interacting very slowly with the systemand observing that the cursor has moved after every keypress.
A similar problem, icon wars, occurs on window systems. The user clicks themouse on a menu or icon, and nothing happens; for some reason the machine isbusy or slow. So the user clicks again, tries something else – then, suddenly, all the buffered mouse clicks are interpreted and the screen becomes a blur of flashingwindows and menus. This time, it is not so much that the response is too slow – it isfast enough when it happens – but that the response is variable. The delays due toswapping programs in and out of main memory typically cause these problems.
Furthermore, a style of interaction that is optimal on one machine may not be so on a slower machine. In particular, mouse-based interfaces cannot tolerate delaysbetween actions and feedback of more than a fraction of a second, otherwise theimmediacy required for successful interaction is lost. If these responses cannot bemet then a more old-fashioned, command-based interface may be required.
Whereas it is immediately obvious that slow responses can cause problems for theuser, it is not so obvious why one should not always aim for a system to be as fast as possible. However, there are exceptions to this – the user must be able to read andunderstand the output of the system. For example, one of the authors was once givena demonstration disk for a spreadsheet. Unfortunately, the machine the demo waswritten on was clearly slower than the author’s machine, not much, at worst half thespeed, but different enough. The demo passed in a blur over the screen with nothingremaining on the screen long enough to read. Many high-resolution monitors suf-fer from a similar problem when they display text. Whereas older character-based terminals scrolled new text from the bottom of the screen or redrew from the top,bitmap screens often ‘flash’ up the new page, giving no indication of direction ofmovement. A final example is the rate of cursor flashing: the rate is often at a fixed
DESIGN FOCUS
The myth of the infinitely fast machine
The adverse effects of slow processing are made worse because the designers labor under the myth of the infinitely fast machine [93]. That is, they design and document their systems as if response will beimmediate. Rather than blithely hoping that the eventual machine will be ‘fast enough’, the designerought to plan explicitly for slow responses where these are possible. A good example, where buffer-ing is clear and audible (if not visible) to the user, is telephones. Even if the user gets ahead of the telephone when entering a number, the tones can be heard as they are sent over the line. Now this isprobably an accident of the design rather than deliberate policy, as there are so many other problemswith telephones as interfaces. However, this type of serendipitous feedback should be emulated inother areas.

frequency, so varying the speed of the processor does not change the screen display.But a rate which is acceptable for a CRT screen is too fast for an LCD screen, whichis more persistent, and the cursor may become invisible or a slight gray color.
In some ways the solution to these problems is easier: the designer can demandfixed delays (dependent on media and user preference) rather than just going as fastas the machine allows. To plan for the first problem, that of insufficient speed, thedesigner needs to understand the limitations of the computer system and takeaccount of these at all stages in the design process.
2.9.2 Limitations on interactive performance
There are several factors that can limit the speed of an interactive system:
Computation bound This is rare for an interactive program, but possible, forexample when using find/replace in a large document. The system should bedesigned so that long delays are not in the middle of interaction and so that theuser gets some idea of how the job is progressing. For a very long process try togive an indication of duration before it starts; and during processing an indicationof the stage that the process has reached is helpful. This can be achieved by hav-ing a counter or slowly filling bar on the screen that indicates the amount done,or by changing the cursor to indicate that processing is occurring. Many systemsnotice after they have been computing for some time and then say ‘this may takesome time: continue (Y/N)?’. Of course, by the time it says this the process maybe nearly finished anyway!
Storage channel bound As we discussed in the previous section, the speed of memory access can interfere with interactive performance. We discussed onetechnique, laziness, for reducing this effect. In addition, if there is plenty of rawcomputation power and the system is held up solely by memory, it is possible totrade off memory against processing speed. For example, compressed data takeless space to store, and is faster to read in and out, but must be compressed beforestorage and decompressed when retrieved. Thus faster memory access leads toincreased processing time. If data is written more often than it is read, one canchoose a technique that is expensive to compress but fairly simple to decompress.For many interactive systems the ability to browse quickly is very important, butusers will accept delays when saving updated information.
Graphics bound For many modern interfaces, this is the most common bottle-neck. It is easy to underestimate the time taken to perform what appear to be simple interface operations. Sometimes clever coding can reduce the time takenby common graphics operations, and there is tremendous variability in per-formance between programs running on the same hardware. Most computersinclude a special-purpose graphics card to handle many of the most commongraphics operations. This is optimized for graphics operations and allows themain processor to do other work such as manipulating documents and other user data.
2.9 Processing and networks 117

118 Chapter 2 n The computer
Network capacity Most computers are linked by networks. At the simplest this canmean using shared files on a remote machine. When accessing such files it can bethe speed of the network rather than that of the memory which limits perform-ance. This is discussed in greater detail below.
2.9.3 Networked computing
Computer systems in use today are much more powerful than they were a few yearsago, which means that the standard computer on the desktop is quite capable of high-performance interaction without recourse to outside help. However, it isoften the case that we use computers not in their standalone mode of operation, butlinked together in networks. This brings added benefits in allowing communicationbetween different parties, provided they are connected into the same network, as wellas allowing the desktop computer to access resources remote from itself. Such net-works are inherently much more powerful than the individual computers that makeup the network: increased computing power and memory are only part of the story,since the effects of allowing people much more extensive, faster and easier access toinformation are highly significant to individuals, groups and institutions.
One of the biggest changes since the first edition of this book has been the explos-ive growth of the internet and global connectivity. As well as fixed networks it is now normal to use a high bandwidth modem or wireless local area network (LAN)to connect into the internet and world wide web from home or hotel room anywherein the world. The effects of this on society at large can only be speculated upon at present, but there are already major effects on computer purchases and perhapsthe whole face of personal computation. As more and more people buy computersprincipally to connect to the internet the idea of the network computer has arisen – asmall computer with no disks whose sole purpose is to connect up to networks.
The internet
The internet has its roots back in 1969 as DARPANET when the US Government’sDepartment of Defense commissioned research into networking. The initial four mainframe com-puters grew to 23 in 1971 and the system had been renamed ARPANET. Growth has acceleratedever since: in 1984 there were over a thousand machines connected, in 1989 the 100,000 markhad been reached, and the latest estimates are in the millions. All the computers on the system,now known as the internet, speak a set of common languages (protocols); the two most import-ant of these are Transmission Control Protocol (TCP) which moves data from A to B, and the InternetProtocol (IP) which specifies which B is being referred to so that the data goes to the correct place.Together these protocols are known as TCP/IP. Thus, at its most basic level, the internet is simplymillions of computers connected together and talking to each other. Other protocols then buildon these low-level capabilities to provide services such as electronic mail, in which participantssend messages to each other; news, where articles of interest are posted to a special interestgroup and can be read by anyone subscribing to that group; and of course the world wide web.

2.9 Processing and networks 119
Such networked systems have an effect on interactivity, over and above any addi-tional access to distant peripherals or information sources. Networks sometimesoperate over large distances, and the transmission of information may take someappreciable time, which affects the response time of the system and hence the natureof the interactivity. There may be a noticeable delay in response, and if the user is notinformed of what is going on, he may assume that his command has been ignored,or lost, and may then repeat it. This lack of feedback is an important factor in thepoor performance and frustration users feel when using such systems, and can bealleviated by more sensible use of the capabilities of the desktop machine to informusers of what is happening over the network.
Another effect is that the interaction between human and machine becomes an open loop, rather than a closed one. Many people may be interacting with themachine at once, and their actions may affect the response to your own. Many usersaccessing a single central machine will slow its response; database updates carried outby one user may mean that the same query by another user at slightly different timesmay produce different results. The networked computer system, by the very natureof its dispersal, distribution and multi-user access, has been transformed from a fullypredictable, deterministic system, under the total control of the user, into a non-deterministic one, with an individual user being unaware of many important thingsthat are happening to the system as a whole. Such systems pose a particular problemsince ideals of consistency, informative feedback and predictable response are viol-ated (see Chapter 7 for more on these principles). However, the additional powerand flexibility offered by networked systems means that they are likely to be with usfor a long time, and these issues need to be carefully addressed in their design.
Worked exercise How do you think new, fast, high-density memory devices and quick processors have influencedrecent developments in HCI? Do they make systems any easier to use? Do they expand therange of applications of computer systems?
Answer Arguably it is not so much the increase in computer power as the decrease in the costof that power which has had the most profound effect. Because ‘ordinary’ users havepowerful machines on their desktops it has become possible to view that power asavailable for the interface rather than hoarded for number-crunching applications.
Modern graphical interaction consumes vast amounts of processing power and wouldhave been completely impossible only a few years ago. There is an extent to which sys-tems have to run faster to stay still, in that as screen size, resolution and color rangeincrease, so does the necessary processing power to maintain the ‘same’ interaction.However, this extra processing is not really producing the same effect; screen quality isstill a major block on effective interaction.
The increase in RAM means that larger programs can be written, effectively allowing theprogrammer ‘elbow room’. This is used in two ways: to allow extra functionality and tosupport easier interaction. Whether the former really improves usability is debatable –unused functionality is a good marketing point, but is of no benefit to the user. The ease of use of a system is often determined by a host of small features, such as the

120 Chapter 2 n The computer
appropriate choice of default options. These features make the interface seem ‘simple’,but make the program very complex . . . and large. Certainly the availability of elbow room,both in terms of memory and processing power, has made such features possible.
The increase in both short-term (RAM) and long-term (disks and optical storage) mem-ory has also removed many of the arbitrary limits in systems: it is possible to edit docu-ments of virtually unlimited size and to treat the computer (suitably backed up) as one’sprimary information repository.
Some whole new application areas have become possible because of advances in mem-ory and processing. Most applications of multimedia including voice recognition andonline storage and capture of video and audio, require enormous amounts of process-ing and/or memory. In particular, large magnetic and optical storage devices have beenthe key to electronic document storage whereby all paper documents are scanned andstored within a computer system. In some contexts such systems have completelyreplaced paper-based filing cabinets.
SUMMARY
In Sections 2.2 and 2.3, we described a range of input devices. These performed two main functions: text entry and pointing. The principal text entry device is theQWERTY keyboard, but we also discussed alternative keyboards, chord keyboards,the telephone keypad and speech input. Pointing devices included the mouse, touchpad, trackball and joystick, as well as a large array of less common alternativesincluding eyegaze systems.
Section 2.4 dealt mainly with the screen as a direct output device. We discussedseveral different technologies, in particular CRT and LCD screens and the commonproperties of all bitmap display devices. We considered some more recent displaymethods including large displays, situated displays and digital paper.
Section 2.5 looked at the devices used for manipulating and seeing virtual realityand 3D spaces. This included the dataglove, body tracking, head-mounted displaysand cave environments.
In Section 2.6 we moved outside the computer entirely and looked at physicaldevices such as the special displays, knobs and switches of electronic appliances. Wealso briefly considered sound, touch and smell as outputs from computer systemsand environmental and bio-sensing as inputs. These are topics that will be revisitedlater in the book.
Section 2.7 discussed various forms of printer and scanner. Typical office printersinclude ink-jet, bubble-jet and laser printers. In addition, dot-matrix and thermalprinters are used in specialized equipment. We also discussed font styles and pagedescription languages. Scanners are used to convert printed images and documentsinto electronic form. They are particularly valuable in desktop publishing and forelectronic document storage systems.
2.10

Exercises 121
In Section 2.8, we considered the typical capacities of computer memory, both ofmain RAM, likened to human short-term memory, and long-term memory storedon magnetic and optical disks. The storage capacities were compared with documentsizes and video images. We saw that a typical hard disk could only hold about twominutes of moving video, but that compression techniques can increase the capacitydramatically. We also discussed storage standards – or rather the lack of them –including the ASCII character set and markup languages. The user ought to be ableto access information in ways that are natural and tolerant of small slips. Techniqueswhich can help this included multiple indices, free text databases, DWIM (do what I mean) and Soundex.
Section 2.9 showed how processing speed, whether too slow or too fast, can affectthe user interface. In particular, we discussed the effects of buffering: cursor trackingand icon wars. Processing speed is limited by various factors: computation, memoryaccess, graphics and network delays.
The lesson from this chapter is that the interface designer needs to be aware of theproperties of the devices with which a system is built. This includes not only inputand output devices, but all the factors that influence the behavior of the interface,since all of these influence the nature and style of the interaction.
EXERCISES
2.1 Individually or in a group find as many different examples as you can of physical con-trols and displays.
(a) List them.(b) Try to group them, or classify them.(c) Discuss whether you believe the control or display is suitable for its purpose (Section 3.9.3
may also help).
Exercises 2.2 and 2.3 involve you examining a range of input and output devices in order to understandhow they influence interaction.
2.2 A typical computer system comprises a QWERTY keyboard, a mouse and a color screen. Thereis usually some form of loudspeaker as well. You should know how the keyboard, mouse andscreen work – if not, read up on it.
What sort of input does the keyboard support? What sort of input does the mouse support? Are these adequate for all possible applications? If not, to which areas are they most suited? Do these areas map well onto the typical requirements for users of computer systems?
If you were designing a keyboard for a modern computer, and you wanted to produce a faster,easier-to-use layout, what information would you need to know and how would that influence the design?
2.3 Pick a couple of computer input devices that you are aware of (joystick, light pen, touchscreen,trackball, eyegaze, dataglove, etc.) and note down how each has different attributes that supportcertain forms of interaction. You ought to know a little about all of these devices – if you don’t,research them.
RECOMMENDED READING
W. Buxton, There’s more to interaction than meets the eye: some issues in manualinput. In R. Baecker and W. Buxton, editors, Readings in Human–ComputerInteraction: A Multidisciplinary Approach, Morgan Kaufmann, 1987.
D. J. Mayhew, Principles and Guidelines in Software User Interface Design, Chapter 12,Prentice Hall, 1992.A look at input and output devices, complete with guidelines for using differentdevices.
A. Dix, Network-based interaction. In J. Jacko and A. Sears, editors, Human–Computer Interaction Handbook, Chapter 16, pp. 331–57, Lawrence Erlbaum,2003.Includes different kinds of network application and the effects of networks oninteraction including rich media. Also look at all of Part II of Jacko and Sears,which includes chapters on input technology and on haptic interfaces.
2.4 What is the myth of the infinitely fast machine?
2.5 Pick one of the following scenarios, and choose a suitable combination of input and output devicesto best support the intended interaction. It may help to identify typical users or classes of user,and identify how the devices chosen support these people in their tasks. Explain the major prob-lems that the input and output devices solve.
(a) Environmental databaseA computer database is under development that will hold environmental information. This rangesfrom meteorological measurements through fish catches to descriptions of pollution, and willinclude topographical details and sketches and photographs. The data has to be accessed only byexperts, but they want to be able to describe and retrieve any piece of data within a few seconds.
(b) Word processor for blind peopleA word processor for blind users is needed, which can also be operated by sighted people. It hasto support the standard set of word-processing tasks.
2.6 Describe Fitts’ law (see Chapter 1). How does Fitts’ law change for different physical selectiondevices, such as a three-button mouse, a touchpad, or a pen/stylus? (You’ll need to do someresearch for this.)
122 Chapter 2 n The computer

THE INTERACTION
OV E RV I E W
n Interaction models help us to understand what is goingon in the interaction between user and system. Theyaddress the translations between what the user wantsand what the system does.
n Ergonomics looks at the physical characteristics of theinteraction and how these influence its effectiveness.
n The dialog between user and system is influenced bythe style of the interface.
n The interaction takes place within a social andorganizational context that affects both user andsystem.
3

124 Chapter 3 n The interaction
INTRODUCTION
In the previous two chapters we have looked at the human and the computer respect-ively. However, in the context of this book, we are not concerned with them in isolation. We are interested in how the human user uses the computer as a tool toperform, simplify or support a task. In order to do this the user must communicatehis requirements to the computer.
There are a number of ways in which the user can communicate with the system.At one extreme is batch input, in which the user provides all the information to thecomputer at once and leaves the machine to perform the task. This approach doesinvolve an interaction between the user and computer but does not support manytasks well. At the other extreme are highly interactive input devices and paradigms,such as direct manipulation (see Chapter 4) and the applications of virtual reality(Chapter 20). Here the user is constantly providing instruction and receiving feed-back. These are the types of interactive system we are considering.
In this chapter, we consider the communication between user and system: theinteraction. We will look at some models of interaction that enable us to identify andevaluate components of the interaction, and at the physical, social and organiza-tional issues that provide the context for it. We will also survey some of the differentstyles of interaction that are used and consider how well they support the user.
MODELS OF INTERACTION
In previous chapters we have seen the usefulness of models to help us to under-stand complex behavior and complex systems. Interaction involves at least two par-ticipants: the user and the system. Both are complex, as we have seen, and are verydifferent from each other in the way that they communicate and view the domainand the task. The interface must therefore effectively translate between them to allowthe interaction to be successful. This translation can fail at a number of points andfor a number of reasons. The use of models of interaction can help us to understandexactly what is going on in the interaction and identify the likely root of difficulties.They also provide us with a framework to compare different interaction styles and to consider interaction problems.
We begin by considering the most influential model of interaction, Norman’s execution–evaluation cycle; then we look at another model which extends the ideas of Norman’s cycle. Both of these models describe the interaction in terms of the goals and actions of the user. We will therefore briefly discuss the terminology used and the assumptions inherent in the models, before describing the modelsthemselves.
3.2
3.1
3.2 Models of interaction 125
3.2.1 The terms of interaction
Traditionally, the purpose of an interactive system is to aid a user in accomplishinggoals from some application domain. (Later in this book we will look at alternativeinteractions but this model holds for many work-oriented applications.) A domaindefines an area of expertise and knowledge in some real-world activity. Some ex-amples of domains are graphic design, authoring and process control in a factory. A domain consists of concepts that highlight its important aspects. In a graphicdesign domain, some of the important concepts are geometric shapes, a drawing surface and a drawing utensil. Tasks are operations to manipulate the concepts of adomain. A goal is the desired output from a performed task. For example, one taskwithin the graphic design domain is the construction of a specific geometric shapewith particular attributes on the drawing surface. A related goal would be to producea solid red triangle centered on the canvas. An intention is a specific action requiredto meet the goal.
Task analysis involves the identification of the problem space (which we discussedin Chapter 1) for the user of an interactive system in terms of the domain, goals,intentions and tasks. We can use our knowledge of tasks and goals to assess the inter-active system that is designed to support them. We discuss task analysis in detail in Chapter 15. The concepts used in the design of the system and the description ofthe user are separate, and so we can refer to them as distinct components, called theSystem and the User, respectively. The System and User are each described by meansof a language that can express concepts relevant in the domain of the application.The System’s language we will refer to as the core language and the User’s language we will refer to as the task language. The core language describes computationalattributes of the domain relevant to the System state, whereas the task languagedescribes psychological attributes of the domain relevant to the User state.
The system is assumed to be some computerized application, in the context of thisbook, but the models apply equally to non-computer applications. It is also a com-mon assumption that by distinguishing between user and system we are restricted tosingle-user applications. This is not the case. However, the emphasis is on the viewof the interaction from a single user’s perspective. From this point of view, otherusers, such as those in a multi-party conferencing system, form part of the system.
3.2.2 The execution–evaluation cycle
Norman’s model of interaction is perhaps the most influential in Human–ComputerInteraction, possibly because of its closeness to our intuitive understanding of theinteraction between human user and computer [265]. The user formulates a plan ofaction, which is then executed at the computer interface. When the plan, or part ofthe plan, has been executed, the user observes the computer interface to evaluate theresult of the executed plan, and to determine further actions.
The interactive cycle can be divided into two major phases: execution and evalu-ation. These can then be subdivided into further stages, seven in all. The stages inNorman’s model of interaction are as follows:

126 Chapter 3 n The interaction
1. Establishing the goal.2. Forming the intention.3. Specifying the action sequence.4. Executing the action.5. Perceiving the system state.6. Interpreting the system state.7. Evaluating the system state with respect to the goals and intentions.
Each stage is, of course, an activity of the user. First the user forms a goal. This is theuser’s notion of what needs to be done and is framed in terms of the domain, in thetask language. It is liable to be imprecise and therefore needs to be translated into the more specific intention, and the actual actions that will reach the goal, before it can be executed by the user. The user perceives the new state of the system, afterexecution of the action sequence, and interprets it in terms of his expectations. If thesystem state reflects the user’s goal then the computer has done what he wanted andthe interaction has been successful; otherwise the user must formulate a new goaland repeat the cycle.
Norman uses a simple example of switching on a light to illustrate this cycle.Imagine you are sitting reading as evening falls. You decide you need more light; that is you establish the goal to get more light. From there you form an intention to switch on the desk lamp, and you specify the actions required, to reach over andpress the lamp switch. If someone else is closer the intention may be different – youmay ask them to switch on the light for you. Your goal is the same but the intentionand actions are different. When you have executed the action you perceive the result,either the light is on or it isn’t and you interpret this, based on your knowledge of the world. For example, if the light does not come on you may interpret this as indicating the bulb has blown or the lamp is not plugged into the mains, and you will formulate new goals to deal with this. If the light does come on, you will evaluate the new state according to the original goals – is there now enough light? If so, thecycle is complete. If not, you may formulate a new intention to switch on the mainceiling light as well.
Norman uses this model of interaction to demonstrate why some interfaces causeproblems to their users. He describes these in terms of the gulfs of execution and thegulfs of evaluation. As we noted earlier, the user and the system do not use the sameterms to describe the domain and goals – remember that we called the language of the system the core language and the language of the user the task language. Thegulf of execution is the difference between the user’s formulation of the actions toreach the goal and the actions allowed by the system. If the actions allowed by thesystem correspond to those intended by the user, the interaction will be effective.The interface should therefore aim to reduce this gulf.
The gulf of evaluation is the distance between the physical presentation of the system state and the expectation of the user. If the user can readily evaluate the presentation in terms of his goal, the gulf of evaluation is small. The more effort that is required on the part of the user to interpret the presentation, the less effectivethe interaction.

3.2 Models of interaction 127
Norman’s model is a useful means of understanding the interaction, in a way thatis clear and intuitive. It allows other, more detailed, empirical and analytic work to be placed within a common framework. However, it only considers the system asfar as the interface. It concentrates wholly on the user’s view of the interaction. It does not attempt to deal with the system’s communication through the interface.An extension of Norman’s model, proposed by Abowd and Beale, addresses thisproblem [3]. This is described in the next section.
3.2.3 The interaction framework
The interaction framework attempts a more realistic description of interaction byincluding the system explicitly, and breaks it into four main components, as shownin Figure 3.1. The nodes represent the four major components in an interactive sys-tem – the System, the User, the Input and the Output. Each component has its ownlanguage. In addition to the User’s task language and the System’s core language,which we have already introduced, there are languages for both the Input and Outputcomponents. Input and Output together form the Interface.
As the interface sits between the User and the System, there are four steps in theinteractive cycle, each corresponding to a translation from one component toanother, as shown by the labeled arcs in Figure 3.2. The User begins the interactivecycle with the formulation of a goal and a task to achieve that goal. The only way the user can manipulate the machine is through the Input, and so the task must bearticulated within the input language. The input language is translated into the core
Human error – slips and mistakes
Human errors are often classified into slips and mistakes. We can distinguish these usingNorman’s gulf of execution.
If you understand a system well you may know exactly what to do to satisfy your goals – you haveformulated the correct action. However, perhaps you mistype or you accidentally press the mousebutton at the wrong time. These are called slips; you have formulated the right action, but fail toexecute that action correctly.
However, if you don’t know the system well you may not even formulate the right goal. For ex-ample, you may think that the magnifying glass icon is the ‘find’ function, but in fact it is to magnifythe text. This is called a mistake.
If we discover that an interface is leading to errors it is important to understand whether they areslips or mistakes. Slips may be corrected by, for instance, better screen design, perhaps puttingmore space between buttons. However, mistakes need users to have a better understanding of thesystems, so will require far more radical redesign or improved training, perhaps a totally differentmetaphor for use.

128 Chapter 3 n The interaction
language as operations to be performed by the System. The System then transformsitself as described by the operations; the execution phase of the cycle is complete andthe evaluation phase now begins. The System is in a new state, which must now be communicated to the User. The current values of system attributes are renderedas concepts or features of the Output. It is then up to the User to observe the Outputand assess the results of the interaction relative to the original goal, ending the evalu-ation phase and, hence, the interactive cycle. There are four main translationsinvolved in the interaction: articulation, performance, presentation and observation.
The User’s formulation of the desired task to achieve some goal needs to be articu-lated in the input language. The tasks are responses of the User and they need to betranslated to stimuli for the Input. As pointed out above, this articulation is judgedin terms of the coverage from tasks to input and the relative ease with which thetranslation can be accomplished. The task is phrased in terms of certain psycholo-gical attributes that highlight the important features of the domain for the User. Ifthese psychological attributes map clearly onto the input language, then articulationof the task will be made much simpler. An example of a poor mapping, as pointed
Figure 3.1 The general interaction framework
Figure 3.2 Translations between components

3.2 Models of interaction 129
out by Norman, is a large room with overhead lighting controlled by a bank ofswitches. It is often desirable to control the lighting so that only one section of theroom is lit. We are then faced with the puzzle of determining which switch controlswhich lights. The result is usually repeated trials and frustration. This arises from thedifficulty of articulating a goal (for example, ‘Turn on the lights in the front of theroom’) in an input language that consists of a linear row of switches, which may ormay not be oriented to reflect the room layout.
Conversely, an example of a good mapping is in virtual reality systems, whereinput devices such as datagloves are specifically geared towards easing articulation by making the user’s psychological notion of gesturing an act that can be directlyrealized at the interface. Direct manipulation interfaces, such as those found on common desktop operating systems like the Macintosh and Windows, make thearticulation of some file handling commands easier. On the other hand, some tasks,such as repetitive file renaming or launching a program whose icon is not visible, arenot at all easy to articulate with such an interface.
At the next stage, the responses of the Input are translated to stimuli for theSystem. Of interest in assessing this translation is whether the translated input lan-guage can reach as many states of the System as is possible using the System stimulidirectly. For example, the remote control units for some compact disc players do notallow the user to turn the power off on the player unit; hence the off state of theplayer cannot be reached using the remote control’s input language. On the panel ofthe compact disc player, however, there is usually a button that controls the power.The ease with which this translation from Input to System takes place is of less import-ance because the effort is not expended by the user. However, there can be a realeffort expended by the designer and programmer. In this case, the ease of the trans-lation is viewed in terms of the cost of implementation.
Once a state transition has occurred within the System, the execution phase of the interaction is complete and the evaluation phase begins. The new state of theSystem must be communicated to the User, and this begins by translating the Systemresponses to the transition into stimuli for the Output component. This presentationtranslation must preserve the relevant system attributes from the domain in the lim-ited expressiveness of the output devices. The ability to capture the domain conceptsof the System within the Output is a question of expressiveness for this translation.
For example, while writing a paper with some word-processing package, it is necessary at times to see both the immediate surrounding text where one is currentlycomposing, say, the current paragraph, and a wider context within the whole paperthat cannot be easily displayed on one screen (for example, the current chapter).
Ultimately, the user must interpret the output to evaluate what has happened. Theresponse from the Output is translated to stimuli for the User which trigger assess-ment. The observation translation will address the ease and coverage of this finaltranslation. For example, it is difficult to tell the time accurately on an unmarkedanalog clock, especially if it is not oriented properly. It is difficult in a command line interface to determine the result of copying and moving files in a hierarchical file system. Developing a website using a markup language like HTML would be virtually impossible without being able to preview the output through a browser.

130 Chapter 3 n The interaction
Assessing overall interaction
The interaction framework is presented as a means to judge the overall usability of an entire interactive system. In reality, all of the analysis that is suggested by theframework is dependent on the current task (or set of tasks) in which the User isengaged. This is not surprising since it is only in attempting to perform a particulartask within some domain that we are able to determine if the tools we use are adequate. For example, different text editors are better at different things. For a particular editing task, one can choose the text editor best suited for interaction relative to the task. The best editor, if we are forced to choose only one, is the one that best suits the tasks most frequently performed. Therefore, it is not too disappointing that we cannot extend the interaction analysis beyond the scope of a particular task.
DESIGN FOCUS
Video recorder
A simple example of programming a VCR from a remote control shows that all four translations in theinteraction cycle can affect the overall interaction. Ineffective interaction is indicated by the user notbeing sure the VCR is set to record properly. This could be because the user has pressed the keys onthe remote control unit in the wrong order; this can be classified as an articulatory problem. Or maybethe VCR is able to record on any channel but the remote control lacks the ability to select channels,indicating a coverage problem for the performance translation. It may be the case that the VCR displaypanel does not indicate that the program has been set, a presentation problem. Or maybe the user doesnot interpret the feedback properly, an observational error. Any one or more of these deficiencieswould give rise to ineffective interaction.
FRAMEWORKS AND HCI
As well as providing a means of discussing the details of a particular interaction,frameworks provide a basis for discussing other issues that relate to the interaction.The ACM SIGCHI Curriculum Development Group presents a framework similar tothat presented here, and uses it to place different areas that relate to HCI [9].
In Figure 3.3 these aspects are shown as they relate to the interaction framework.In particular, the field of ergonomics addresses issues on the user side of the interface,covering both input and output, as well as the user’s immediate context. Dialogdesign and interface styles can be placed particularly along the input branch of theframework, addressing both articulation and performance. However, dialog is mostusually associated with the computer and so is biased to that side of the framework.
3.3

3.4 Ergonomics 131
Presentation and screen design relates to the output branch of the framework. Theentire framework can be placed within a social and organizational context that alsoaffects the interaction. Each of these areas has important implications for the designof interactive systems and the performance of the user. We will discuss these in briefin the following sections, with the exception of screen design which we will save untilChapter 5.
ERGONOMICS
Ergonomics (or human factors) is traditionally the study of the physical character-istics of the interaction: how the controls are designed, the physical environment inwhich the interaction takes place, and the layout and physical qualities of the screen.A primary focus is on user performance and how the interface enhances or detractsfrom this. In seeking to evaluate these aspects of the interaction, ergonomics will certainly also touch upon human psychology and system constraints. It is a large and established field, which is closely related to but distinct from HCI, and full coverage would demand a book in its own right. Here we consider a few of the issuesaddressed by ergonomics as an introduction to the field. We will briefly look at thearrangement of controls and displays, the physical environment, health issues andthe use of color. These are by no means exhaustive and are intended only to give an
3.4
Figure 3.3 A framework for human–computer interaction. Adapted from ACMSIGCHI Curriculum Development Group [9]

132 Chapter 3 n The interaction
indication of the types of issues and problems addressed by ergonomics. For moreinformation on ergonomic issues the reader is referred to the recommended readinglist at the end of the chapter.
3.4.1 Arrangement of controls and displays
In Chapter 1 we considered perceptual and cognitive issues that affect the way we present information on a screen and provide control mechanisms to the user. In addition to these cognitive aspects of design, physical aspects are also important.Sets of controls and parts of the display should be grouped logically to allow rapidaccess by the user (more on this in Chapter 5). This may not seem so importantwhen we are considering a single user of a spreadsheet on a PC, but it becomes vitalwhen we turn to safety-critical applications such as plant control, aviation and airtraffic control. In each of these contexts, users are under pressure and are faced witha huge range of displays and controls. Here it is crucial that the physical layout ofthese be appropriate. Indeed, returning to the less critical PC application, inappro-priate placement of controls and displays can lead to inefficiency and frustration. For example, on one particular electronic newsreader, used by one of the authors,the command key to read articles from a newsgroup (y) is directly beside the com-mand key to unsubscribe from a newsgroup (u) on the keyboard. This poor designfrequently leads to inadvertent removal of newsgroups. Although this is recover-able it wastes time and is annoying to the user. We saw similar examples in theIntroduction to this book including the MacOS X dock. We can therefore see thatappropriate layout is important in all applications.
We have already touched on the importance of grouping controls together logic-ally (and keeping opposing controls separate). The exact organization that this willsuggest will depend on the domain and the application, but possible organizationsinclude the following:
functional controls and displays are organized so that those that are functionallyrelated are placed together;
sequential controls and displays are organized to reflect the order of their use in atypical interaction (this may be especially appropriate in domains where a particu-lar task sequence is enforced, such as aviation);
frequency controls and displays are organized according to how frequently they areused, with the most commonly used controls being the most easily accessible.
In addition to the organization of the controls and displays in relation to eachother, the entire system interface must be arranged appropriately in relation to the user’s position. So, for example, the user should be able to reach all controls necessary and view all displays without excessive body movement. Critical displaysshould be at eye level. Lighting should be arranged to avoid glare and reflection dis-torting displays. Controls should be spaced to provide adequate room for the user tomanoeuvre.

3.4 Ergonomics 133
DESIGN FOCUS
Industrial interfaces
The interfaces to office systems have changed dramatically since the 1980s. However, some care isneeded in transferring the idioms of office-based systems into the industrial domain. Office informationis primarily textual and slow varying, whereas industrial interfaces may require the rapid assimilation ofmultiple numeric displays, each of which is varying in response to the environment. Furthermore, theenvironmental conditions may rule out certain interaction styles (for example, the oil-soaked mouse).Consequently, industrial interfaces raise some additional design issues rarely encountered in the office.
Glass interfaces vs. dials and knobsThe traditional machine interface consists of dials and knobs directly wired or piped to the equipment.Increasingly, some or all of the controls are replaced with a glass interface, a computer screen throughwhich the equipment is monitored and controlled. Many of the issues are similar for the two kinds ofinterface, but glass interfaces do have some special advantages and problems. For a complex system, aglass interface can be both cheaper and more flexible, and it is easy to show the same information inmultiple forms (Figure 3.4). For example, a data value might be given both in a precise numeric field andalso in a quick to assimilate graphical form. In addition, the same information can be shown on severalscreens. However, the information is not located in physical space and so vital clues to context aremissing – it is easy to get lost navigating complex menu systems. Also, limited display resolution oftenmeans that an electronic representation of a dial is harder to read than its physical counterpart; in somecircumstances both may be necessary, as is the case on the flight deck of a modern aircraft.
Figure 3.4 Multiple representations of the same information
Indirect manipulationThe phrase ‘direct manipulation’ dominates office system design (Figure 3.5). There are argumentsabout its meaning and appropriateness even there, but it is certainly dependent on the user being inprimary control of the changes in the interface. The autonomous nature of industrial processes makesthis an inappropriate model. In a direct manipulation system, the user interacts with an artificial worldinside the computer (for example, the electronic desktop).
In contrast, an industrial interface is merely an intermediary between the operator and the real world. One implication of this indirectness is that the interface must provide feedback at two levels
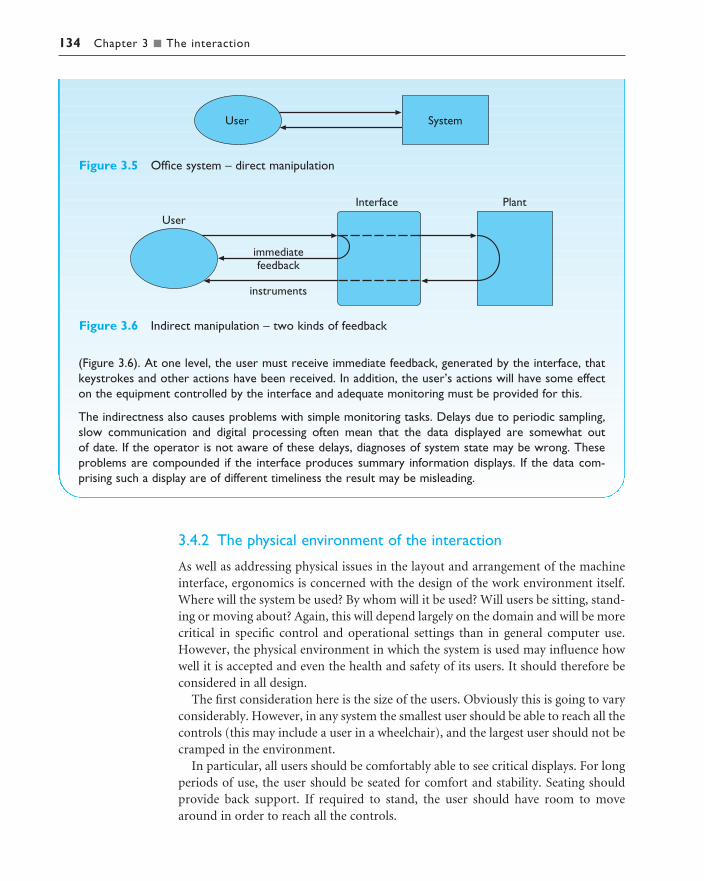
3.4.2 The physical environment of the interaction
As well as addressing physical issues in the layout and arrangement of the machineinterface, ergonomics is concerned with the design of the work environment itself.Where will the system be used? By whom will it be used? Will users be sitting, stand-ing or moving about? Again, this will depend largely on the domain and will be morecritical in specific control and operational settings than in general computer use.However, the physical environment in which the system is used may influence howwell it is accepted and even the health and safety of its users. It should therefore beconsidered in all design.
The first consideration here is the size of the users. Obviously this is going to varyconsiderably. However, in any system the smallest user should be able to reach all thecontrols (this may include a user in a wheelchair), and the largest user should not becramped in the environment.
In particular, all users should be comfortably able to see critical displays. For longperiods of use, the user should be seated for comfort and stability. Seating shouldprovide back support. If required to stand, the user should have room to movearound in order to reach all the controls.
(Figure 3.6). At one level, the user must receive immediate feedback, generated by the interface, thatkeystrokes and other actions have been received. In addition, the user’s actions will have some effecton the equipment controlled by the interface and adequate monitoring must be provided for this.
The indirectness also causes problems with simple monitoring tasks. Delays due to periodic sampling,slow communication and digital processing often mean that the data displayed are somewhat out of date. If the operator is not aware of these delays, diagnoses of system state may be wrong. Theseproblems are compounded if the interface produces summary information displays. If the data com-prising such a display are of different timeliness the result may be misleading.
134 Chapter 3 n The interaction
Figure 3.5 Office system – direct manipulation
Figure 3.6 Indirect manipulation – two kinds of feedback

3.4 Ergonomics 135
3.4.3 Health issues
Perhaps we do not immediately think of computer use as a hazardous activity but weshould bear in mind possible consequences of our designs on the health and safetyof users. Leaving aside the obvious safety risks of poorly designed safety-critical sys-tems (aircraft crashing, nuclear plant leaks and worse), there are a number of factorsthat may affect the use of more general computers. Again these are factors in thephysical environment that directly affect the quality of the interaction and the user’sperformance:
Physical position As we noted in the previous section, users should be able to reachall controls comfortably and see all displays. Users should not be expected tostand for long periods and, if sitting, should be provided with back support. If a particular position for a part of the body is to be adopted for long periods (for example, in typing) support should be provided to allow rest.
Temperature Although most users can adapt to slight changes in temperaturewithout adverse effect, extremes of hot or cold will affect performance and, inexcessive cases, health. Experimental studies show that performance deterioratesat high or low temperatures, with users being unable to concentrate efficiently.
Lighting The lighting level will again depend on the work environment. However,adequate lighting should be provided to allow users to see the computer screenwithout discomfort or eyestrain. The light source should also be positioned toavoid glare affecting the display.
Noise Excessive noise can be harmful to health, causing the user pain, and in acutecases, loss of hearing. Noise levels should be maintained at a comfortable level inthe work environment. This does not necessarily mean no noise at all. Noise canbe a stimulus to users and can provide needed confirmation of system activity.
Time The time users spend using the system should also be controlled. As we sawin the previous chapter, it has been suggested that excessive use of CRT displayscan be harmful to users, particularly pregnant women.
3.4.4 The use of color
In this section we have concentrated on the ergonomics of physical characteristics of systems, including the physical environment in which they are used. However,ergonomics has a close relationship to human psychology in that it is also con-cerned with the perceptual limitations of humans. For example, the use of color in displays is an ergonomics issue. As we saw in Chapter 1, the visual system hassome limitations with regard to color, including the number of colors that are dis-tinguishable and the relatively low blue acuity. We also saw that a relatively high proportion of the population suffers from a deficiency in color vision. Each of thesepsychological phenomena leads to ergonomic guidelines; some examples are dis-cussed below.

136 Chapter 3 n The interaction
Colors used in the display should be as distinct as possible and the distinctionshould not be affected by changes in contrast. Blue should not be used to display critical information. If color is used as an indicator it should not be the only cue:additional coding information should be included.
The colors used should also correspond to common conventions and user expecta-tions. Red, green and yellow are colors frequently associated with stop, go andstandby respectively. Therefore, red may be used to indicate emergency and alarms;green, normal activity; and yellow, standby and auxiliary function. These conven-tions should not be violated without very good cause.
However, we should remember that color conventions are culturally determined.For example, red is associated with danger and warnings in most western cultures,but in China it symbolizes happiness and good fortune. The color of mourning isblack in some cultures and white in others. Awareness of the cultural associations ofcolor is particularly important in designing systems and websites for a global market.We will return to these issues in more detail in Chapter 10.
3.4.5 Ergonomics and HCI
Ergonomics is a huge area, which is distinct from HCI but sits alongside it. Its contribution to HCI is in determining constraints on the way we design systemsand suggesting detailed and specific guidelines and standards. Ergonomic factors are in general well established and understood and are therefore used as the basis forstandardizing hardware designs. This issue is discussed further in Chapter 7.
INTERACTION STYLES
Interaction can be seen as a dialog between the computer and the user. The choice ofinterface style can have a profound effect on the nature of this dialog. Dialog designis discussed in detail in Chapter 16. Here we introduce the most common interfacestyles and note the different effects these have on the interaction. There are a num-ber of common interface styles including
n command line interfacen menusn natural languagen question/answer and query dialogn form-fills and spreadsheetsn WIMPn point and clickn three-dimensional interfaces.
As the WIMP interface is the most common and complex, we will discuss each of itselements in greater detail in Section 3.6.
3.5

3.5 Interaction styles 137
3.5.1 Command line interface
The command line interface (Figure 3.7) was the first interactive dialog style to becommonly used and, in spite of the availability of menu-driven interfaces, it is stillwidely used. It provides a means of expressing instructions to the computer directly,using function keys, single characters, abbreviations or whole-word commands. Insome systems the command line is the only way of communicating with the system,especially for remote access using telnet. More commonly today it is supplementaryto menu-based interfaces, providing accelerated access to the system’s functionalityfor experienced users.
Command line interfaces are powerful in that they offer direct access to systemfunctionality (as opposed to the hierarchical nature of menus), and can be combinedto apply a number of tools to the same data. They are also flexible: the commandoften has a number of options or parameters that will vary its behavior in some way,and it can be applied to many objects at once, making it useful for repetitive tasks.However, this flexibility and power brings with it difficulty in use and learning.Commands must be remembered, as no cue is provided in the command line toindicate which command is needed. They are therefore better for expert users thanfor novices. This problem can be alleviated a little by using consistent and meaning-ful commands and abbreviations. The commands used should be terms within thevocabulary of the user rather than the technician. Unfortunately, commands areoften obscure and vary across systems, causing confusion to the user and increasingthe overhead of learning.
3.5.2 Menus
In a menu-driven interface, the set of options available to the user is displayed on the screen, and selected using the mouse, or numeric or alphabetic keys. Since the options are visible they are less demanding of the user, relying on recognitionrather than recall. However, menu options still need to be meaningful and logic-ally grouped to aid recognition. Often menus are hierarchically ordered and theoption required is not available at the top layer of the hierarchy. The grouping
sable.soc.staffs.ac.uk> javac HelloWorldApp
javac: invalid argument: HelloWorldApp
use: javac [-g][-O][-classpath path][-d dir] file.java…
sable.soc.staffs.ac.uk> javac HelloWorldApp.java
sable.soc.staffs.ac.uk> java HelloWorldApp
Hello world!!
sable.soc.staffs.ac.uk>
Figure 3.7 Command line interface

138 Chapter 3 n The interaction
and naming of menu options then provides the only cue for the user to find therequired option. Such systems either can be purely text based, with the menu options being presented as numbered choices (see Figure 3.8), or may have a graphical component in which the menu appears within a rectangular box andchoices are made, perhaps by typing the initial letter of the desired selection, or by entering the associated number, or by moving around the menu with the arrowkeys. This is a restricted form of a full WIMP system, described in more detailshortly.
3.5.3 Natural language
Perhaps the most attractive means of communicating with computers, at least at firstglance, is by natural language. Users, unable to remember a command or lost in ahierarchy of menus, may long for the computer that is able to understand instruc-tions expressed in everyday words! Natural language understanding, both of speechand written input, is the subject of much interest and research. Unfortunately, however, the ambiguity of natural language makes it very difficult for a machine to understand. Language is ambiguous at a number of levels. First, the syntax, orstructure, of a phrase may not be clear. If we are given the sentence
The boy hit the dog with the stick
we cannot be sure whether the boy is using the stick to hit the dog or whether thedog is holding the stick when it is hit.
Even if a sentence’s structure is clear, we may find ambiguity in the meaning of the words used. For example, the word ‘pitch’ may refer to a sports field, a throw, a waterproofing substance or even, colloquially, a territory. We often rely on the con-text and our general knowledge to sort out these ambiguities. This information isdifficult to provide to the machine. To complicate matters more, the use of pronounsand relative terms adds further ambiguity.
PAYMENT DETAILS P3-7
please select payment method:
1. cash
2. check
3. credit card
4. invoice
9. abort transaction
Figure 3.8 Menu-driven interface

3.5 Interaction styles 139
Given these problems, it seems unlikely that a general natural language inter-face will be available for some time. However, systems can be built to understandrestricted subsets of a language. For a known and constrained domain, the systemcan be provided with sufficient information to disambiguate terms. It is importantin interfaces which use natural language in this restricted form that the user is awareof the limitations of the system and does not expect too much understanding.
The use of natural language in restricted domains is relatively successful, but it is debatable whether this can really be called natural language. The user still has to learn which phrases the computer understands and may become frustrated if too much is expected. However, it is also not clear how useful a general natural language interface would be. Language is by nature vague and imprecise: this gives it its flexibility and allows creativity in expression. Computers, on the other hand,require precise instructions. Given a free rein, would we be able to describe ourrequirements precisely enough to guarantee a particular response? And, if we could,would the language we used turn out to be a restricted subset of natural languageanyway?
3.5.4 Question/answer and query dialog
Question and answer dialog is a simple mechanism for providing input to an applica-tion in a specific domain. The user is asked a series of questions (mainly with yes/noresponses, multiple choice, or codes) and so is led through the interaction step bystep. An example of this would be web questionnaires.
These interfaces are easy to learn and use, but are limited in functionality andpower. As such, they are appropriate for restricted domains (particularly informa-tion systems) and for novice or casual users.
Query languages, on the other hand, are used to construct queries to retrieveinformation from a database. They use natural-language-style phrases, but in factrequire specific syntax, as well as knowledge of the database structure. Queries usually require the user to specify an attribute or attributes for which to search the database, as well as the attributes of interest to be displayed. This is straight-forward where there is a single attribute, but becomes complex when multipleattributes are involved, particularly if the user is interested in attribute A or attributeB, or attribute A and not attribute B, or where values of attributes are to be com-pared. Most query languages do not provide direct confirmation of what wasrequested, so that the only validation the user has is the result of the search. Theeffective use of query languages therefore requires some experience. A specializedexample is the web search engine.
3.5.5 Form-fills and spreadsheets
Form-filling interfaces are used primarily for data entry but can also be useful in data retrieval applications. The user is presented with a display resembling a paper

140 Chapter 3 n The interaction
form, with slots to fill in (see Figure 3.9). Often the form display is based upon an actual form with which the user is familiar, which makes the interface easier touse. The user works through the form, filling in appropriate values. The data are then entered into the application in the correct place. Most form-filling interfacesallow easy movement around the form and allow some fields to be left blank. Theyalso require correction facilities, as users may change their minds or make a mistakeabout the value that belongs in each field. The dialog style is useful primarily for data entry applications and, as it is easy to learn and use, for novice users. How-ever, assuming a design that allows flexible entry, form filling is also appropriate forexpert users.
Spreadsheets are a sophisticated variation of form filling. The spreadsheet com-prises a grid of cells, each of which can contain a value or a formula (see Figure 3.10).The formula can involve the values of other cells (for example, the total of all cells in this column). The user can enter and alter values and formulae in any order and the system will maintain consistency amongst the values displayed, ensuring that all formulae are obeyed. The user can therefore manipulate values to see theeffects of changing different parameters. Spreadsheets are an attractive medium for interaction: the user is free to manipulate values at will and the distinc-tion between input and output is blurred, making the interface more flexible andnatural.
Figure 3.9 A typical form-filling interface. Screen shot frame reprinted bypermission from Microsoft Corporation

3.5 Interaction styles 141
3.5.6 The WIMP interface
Currently many common environments for interactive computing are examples ofthe WIMP interface style, often simply called windowing systems. WIMP stands forwindows, icons, menus and pointers (sometimes windows, icons, mice and pull-downmenus), and is the default interface style for the majority of interactive computer sys-tems in use today, especially in the PC and desktop workstation arena. Examples ofWIMP interfaces include Microsoft Windows for IBM PC compatibles, MacOS forApple Macintosh compatibles and various X Windows-based systems for UNIX.
Figure 3.10 A typical spreadsheet
Mixing styles
The UNIX windowing environments are interesting as the contents of many of the windowsare often themselves simply command line or character-based programs (see Figure 3.11). In fact,this mixing of interface styles in the same system is quite common, especially where older legacysystems are used at the same time as more modern applications. It can be a problem if usersattempt to use commands and methods suitable for one environment in another. On the AppleMacintosh, HyperCard uses a point-and-click style. However, HyperCard stack buttons look very like Macintosh folders. If you double click on them, as you would to open a folder, your twomouse clicks are treated as separate actions. The first click opens the stack (as you wanted), butthe second is then interpreted in the context of the newly opened stack, behaving in an apparentlyarbitrary fashion! This is an example of the importance of consistency in the interface, an issue weshall return to in Chapter 7.
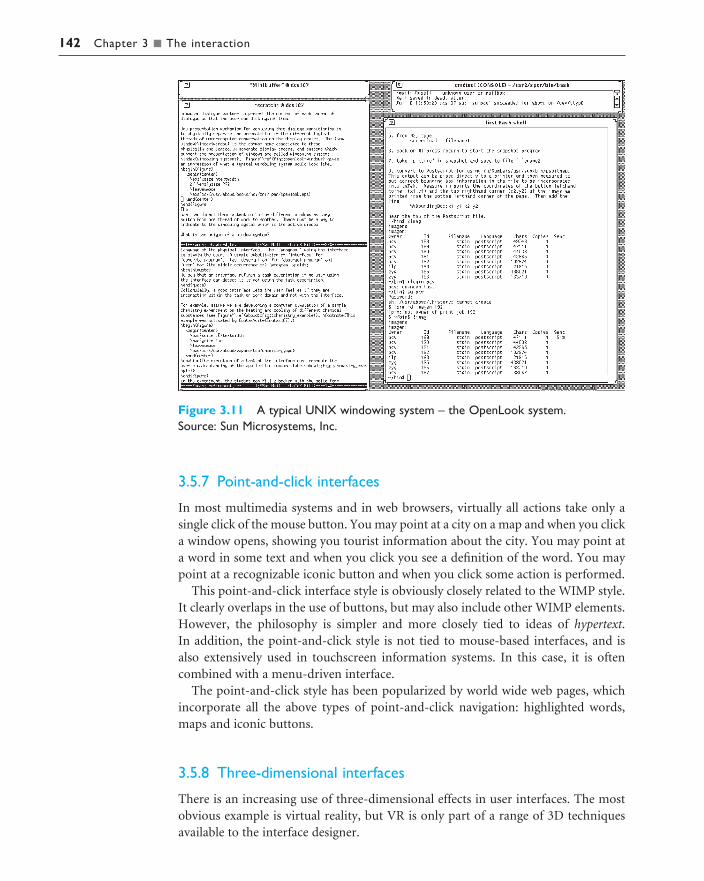
142 Chapter 3 n The interaction
3.5.7 Point-and-click interfaces
In most multimedia systems and in web browsers, virtually all actions take only a single click of the mouse button. You may point at a city on a map and when you clicka window opens, showing you tourist information about the city. You may point ata word in some text and when you click you see a definition of the word. You maypoint at a recognizable iconic button and when you click some action is performed.
This point-and-click interface style is obviously closely related to the WIMP style.It clearly overlaps in the use of buttons, but may also include other WIMP elements.However, the philosophy is simpler and more closely tied to ideas of hypertext. In addition, the point-and-click style is not tied to mouse-based interfaces, and isalso extensively used in touchscreen information systems. In this case, it is oftencombined with a menu-driven interface.
The point-and-click style has been popularized by world wide web pages, whichincorporate all the above types of point-and-click navigation: highlighted words,maps and iconic buttons.
3.5.8 Three-dimensional interfaces
There is an increasing use of three-dimensional effects in user interfaces. The mostobvious example is virtual reality, but VR is only part of a range of 3D techniquesavailable to the interface designer.
Figure 3.11 A typical UNIX windowing system – the OpenLook system. Source: Sun Microsystems, Inc.

3.5 Interaction styles 143
The simplest technique is where ordinary WIMP elements, buttons, scroll bars, etc.,are given a 3D appearance using shading, giving the appearance of being sculpted outof stone. By unstated convention, such interfaces have a light source at their topright. Where used judiciously, the raised areas are easily identifiable and can be usedto highlight active areas (Figure 3.12). Unfortunately, some interfaces make indis-criminate use of sculptural effects, on every text area, border and menu, so all senseof differentiation is lost.
A more complex technique uses interfaces with 3D workspaces. The objects displayed in such systems are usually flat, but are displayed in perspective when at anangle to the viewer and shrink when they are ‘further away’. Figure 3.13 shows onesuch system, WebBook [57]. Notice how size, light and occlusion provide a sense of
Figure 3.12 Buttons in 3D say ‘press me’
Figure 3.13 WebBook – using 3D to make more space (Card S.K., Robertson G.G.and York W. (1996). The WebBook and the Web Forager: An Information workspacefor the World-Wide Web. CHI96 Conference Proceedings, 111–17. Copyright © 1996ACM, Inc. Reprinted by permission)

144 Chapter 3 n The interaction
distance. Notice also that as objects get further away they take up less screen space.Three-dimensional workspaces give you extra space, but in a more natural way thaniconizing windows.
Finally, there are virtual reality and information visualization systems where theuser can move about within a simulated 3D world. These are discussed in detail inChapter 20.
These mechanisms overlap with other interaction styles, especially the use ofsculptured elements in WIMP interfaces. However, there is a distinct interactionstyle for 3D interfaces in that they invite us to use our tacit abilities for the real world,and translate them into the electronic world. Novice users must learn that an ovalarea with a word or picture in it is a button to be pressed, but a 3D button says ‘pushme’. Further, more complete 3D environments invite one to move within the virtualenvironment, rather than watch as a spectator.
DESIGN FOCUS
Navigation in 3D and 2D
We live in a three-dimensional world. So clearly 3D interfaces are good . . . or are they? Actually, our3D stereo vision only works well close to us and after that we rely on cruder measures such as ‘this isin front of that’. We are good at moving obects around with our hands in three dimensions, rotating,turning them on their side. However, we walk around in two dimensions and do not fly. Not surpris-ingly, people find it hard to visualize and control movement in three dimensions.
Normally, we use gravity to give us a fixed direction in space. This is partly through the channels in theinner ear, but also largely through kinesthetic senses – feeling the weight of limbs. When we lose thesesenses it is easy to become disoriented and we can lose track of which direction is up: divers are trainedto watch the direction their bubbles move and if buried in an avalanche you should spit and feel whichdirection the spittle flows.
Where humans have to navigate in three dimensions they need extra aids such as the artificial horizonin an airplane. Helicopters, where there are many degrees of freedom, are particularly difficult.
Even in the two-dimensional world of walking about we do not rely on neat Cartesian maps in our head. Instead we mostly use models of locationsuch as ‘down the road near the church’ that rely on approximate topolo-gical understanding and landmarks. We also rely on properties of normalspace, such as the ability to go backwards and the fact that things that areclose can be reached quickly. When two-dimensional worlds are not like this, for example in a one-way traffic system or in a labyrinth, we have greatdifficulty [98].
When we design systems we should take into account how people navigate in the real world and usethis to guide our navigation aids. For example, if we have a 3D interface or a virtual reality world weshould normally show a ground plane and by default lock movement to be parallel to the ground. Ininformation systems we can recruit our more network-based models of 2D space by giving landmarksand making it as easy to ‘step back’ as to go forwards (as with the web browser ‘back’ button).
See the book website for more about 3D vision: /e3/online/seeing-3D/

3.6 Elements of the WIMP interface 145
ELEMENTS OF THE WIMP INTERFACE
We have already noted the four key features of the WIMP interface that give it itsname – windows, icons, pointers and menus – and we will now describe these inturn. There are also many additional interaction objects and techniques commonlyused in WIMP interfaces, some designed for specific purposes and others more general. We will look at buttons, toolbars, palettes and dialog boxes. Most of theseelements can be seen in Figure 3.14.
Together, these elements of the WIMP interfaces are called widgets, and they com-prise the toolkit for interaction between user and system. In Chapter 8 we willdescribe windowing systems and interaction widgets more from the programmer’sperspective. There we will discover that though most modern windowing systemsprovide the same set of basic widgets, the ‘look and feel’ – how widgets are physicallydisplayed and how users can interact with them to access their functionality – of dif-ferent windowing systems and toolkits can differ drastically.
3.6.1 WindowsWindows are areas of the screen that behave as if they were independent terminalsin their own right. A window can usually contain text or graphics, and can be moved
3.6
Figure 3.14 Elements of the WIMP interface – Microsoft Word 5.1 on an Apple Macintosh. Screen shotreprinted by permission from Apple Computer, Inc.

146 Chapter 3 n The interaction
or resized. More than one window can be on a screen at once, allowing separate tasks to be visible at the same time. Users can direct their attention to the differentwindows as they switch from one thread of work to another.
If one window overlaps the other, the back window is partially obscured, and then refreshed when exposed again. Overlapping windows can cause problems by obscuring vital information, so windows may also be tiled, when they adjoin but do not overlap each other. Alternatively, windows may be placed in a cascadingfashion, where each new window is placed slightly to the left and below the previouswindow. In some systems this layout policy is fixed, in others it can be selected by theuser.
Usually, windows have various things associated with them that increase their use-fulness. Scrollbars are one such attachment, allowing the user to move the contentsof the window up and down, or from side to side. This makes the window behave asif it were a real window onto a much larger world, where new information is broughtinto view by manipulating the scrollbars.
There is usually a title bar attached to the top of a window, identifying it to theuser, and there may be special boxes in the corners of the window to aid resizing,closing, or making as large as possible. Each of these can be seen in Figure 3.15.
In addition, some systems allow windows within windows. For example, inMicrosoft Office applications, such as Excel and Word, each application has its ownwindow and then within this each document has a window. It is often possible tohave different layout policies within the different application windows.
Figure 3.15 A typical window. Screen shot reprinted by permission from Apple Computer, Inc.

3.6 Elements of the WIMP interface 147
3.6.2 Icons
Windows can be closed and lost for ever, or they can be shrunk to some very reducedrepresentation. A small picture is used to represent a closed window, and this repre-sentation is known as an icon. By allowing icons, many windows can be available onthe screen at the same time, ready to be expanded to their full size by clicking on theicon. Shrinking a window to its icon is known as iconifying the window. When a usertemporarily does not want to follow a particular thread of dialog, he can suspendthat dialog by iconifying the window containing the dialog. The icon saves space onthe screen and serves as a reminder to the user that he can subsequently resume thedialog by opening up the window. Figure 3.16 shows a few examples of some iconsused in a typical windowing system (MacOS X).
Icons can also be used to represent other aspects of the system, such as a waste-basket for throwing unwanted files into, or various disks, programs or functions thatare accessible to the user. Icons can take many forms: they can be realistic represen-tations of the objects that they stand for, or they can be highly stylized. They can evenbe arbitrary symbols, but these can be difficult for users to interpret.
3.6.3 Pointers
The pointer is an important component of the WIMP interface, since the interactionstyle required by WIMP relies very much on pointing and selecting things such asicons. The mouse provides an input device capable of such tasks, although joysticksand trackballs are other alternatives, as we have previously seen in Chapter 2. Theuser is presented with a cursor on the screen that is controlled by the input device. A variety of pointer cursors are shown in Figure 3.17.
Figure 3.16 A variety of icons. Screen shot reprinted by permission from Apple Computer, Inc.

148 Chapter 3 n The interaction
The different shapes of cursor are often used to distinguish modes, for example thenormal pointer cursor may be an arrow, but change to cross-hairs when drawing aline. Cursors are also used to tell the user about system activity, for example a watchor hour-glass cursor may be displayed when the system is busy reading a file.
Pointer cursors are like icons, being small bitmap images, but in addition all cur-sors have a hot-spot, the location to which they point. For example, the three arrowsat the start of Figure 3.17 each have a hot-spot at the top left, whereas the right-pointing hand on the second line has a hot-spot on its right. Sometimes the hot-spotis not clear from the appearance of the cursor, in which case users will find it hard toclick on small targets. When designing your own cursors, make sure the image hasan obvious hot-spot.
3.6.4 Menus
The last main feature of windowing systems is the menu, an interaction techniquethat is common across many non-windowing systems as well. A menu presents achoice of operations or services that can be performed by the system at a given time.In Chapter 1, we pointed out that our ability to recall information is inferior to ourability to recognize it from some visual cue. Menus provide information cues in theform of an ordered list of operations that can be scanned. This implies that thenames used for the commands in the menu should be meaningful and informative.
The pointing device is used to indicate the desired option. As the pointer movesto the position of a menu item, the item is usually highlighted (by inverse video, or some similar strategy) to indicate that it is the potential candidate for selection.Selection usually requires some additional user action, such as pressing a button onthe mouse that controls the pointer cursor on the screen or pressing some special key on the keyboard. Menus are inefficient when they have too many items, and socascading menus are utilized, in which item selection opens up another menu adja-cent to the item, allowing refinement of the selection. Several layers of cascadingmenus can be used.
Figure 3.17 A variety of pointer cursors. Source: Sun Microsystems, Inc.

3.6 Elements of the WIMP interface 149
The main menu can be visible to the user all the time, as a menu bar and submenuscan be pulled down or across from it upon request (Figure 3.18). Menu bars areoften placed at the top of the screen (for example, MacOS) or at the top of each window (for example, Microsoft Windows). Alternatives include menu bars alongone side of the screen, or even placed amongst the windows in the main ‘desktop’area. Websites use a variety of menu bar locations, including top, bottom and eitherside of the screen. Alternatively, the main menu can be hidden and upon request itwill pop up onto the screen. These pop-up menus are often used to present context-sensitive options, for example allowing one to examine properties of particular on-screen objects. In some systems they are also used to access more global actionswhen the mouse is depressed over the screen background.
Pull-down menus are dragged down from the title at the top of the screen, bymoving the mouse pointer into the title bar area and pressing the button. Fall-downmenus are similar, except that the menu automatically appears when the mousepointer enters the title bar, without the user having to press the button. Some menusare pin-up menus, in that they can be ‘pinned’ to the screen, staying in place untilexplicitly asked to go away. Pop-up menus appear when a particular region of thescreen, maybe designated by an icon, is selected, but they only stay as long as themouse button is depressed.
Another approach to menu selection is to arrange the options in a circular fashion. The pointer appears in the center of the circle, and so there is the same distance to travel to any of the selections. This has the advantages that it is easier toselect items, since they can each have a larger target area, and that the selection timefor each item is the same, since the pointer is equidistant from them all. Comparethis with a standard menu: remembering Fitts’ law from Chapter 1, we can see thatit will take longer to select items near the bottom of the menu than at the top.However, these pie menus, as they are known [54], take up more screen space and aretherefore less common in interfaces.
Figure 3.18 Pull-down menu

150 Chapter 3 n The interaction
The major problems with menus in general are deciding what items to include and how to group those items. Including too many items makes menus too long orcreates too many of them, whereas grouping causes problems in that items that relateto the same topic need to come under the same heading, yet many items could begrouped under more than one heading. In pull-down menus the menu label shouldbe chosen to reflect the function of the menu items, and items grouped within menusby function. These groupings should be consistent across applications so that theuser can transfer learning to new applications. Menu items should be ordered in themenu according to importance and frequency of use, and opposite functionalities(such as ‘save’ and ‘delete’) should be kept apart to prevent accidental selection of thewrong function, with potentially disastrous consequences.
3.6.5 Buttons
Buttons are individual and isolated regions within a display that can be selected by the user to invoke specific operations. These regions are referred to as buttonsbecause they are purposely made to resemble the push buttons you would find on a control panel. ‘Pushing’ the button invokes a command, the meaning of which is usually indicated by a textual label or a small icon. Buttons can also be used to toggle between two states, displaying status information such as whether the currentfont is italicized or not in a word processor, or selecting options on a web form. Suchtoggle buttons can be grouped together to allow a user to select one feature from aset of mutually exclusive options, such as the size in points of the current font. Theseare called radio buttons, since the collection functions much like the old-fashionedmechanical control buttons on car radios. If a set of options is not mutually exclus-ive, such as font characteristics like bold, italics and underlining, then a set of toggle buttons can be used to indicate the on/off status of the options. This type ofcollection of buttons is sometimes referred to as check boxes.
Keyboard accelerators
Menus often offer keyboard accelerators, key combinations that have the same effect as selectingthe menu item. This allows more expert users, familiar with the system, to manipulate things with-out moving off the keyboard, which is often faster. The accelerators are often displayed alongsidethe menu items so that frequent use makes them familiar. Unfortunately most systems do notallow you to use the accelerators while the menu is displayed. So, for example, the menu might say
However, when the user presses function key F3 nothing happens. F3 only works when the menuis not displayed – when the menu is there you must press ‘F’ instead! This is an example of an inter-face that is dishonest (see also Chapter 7).
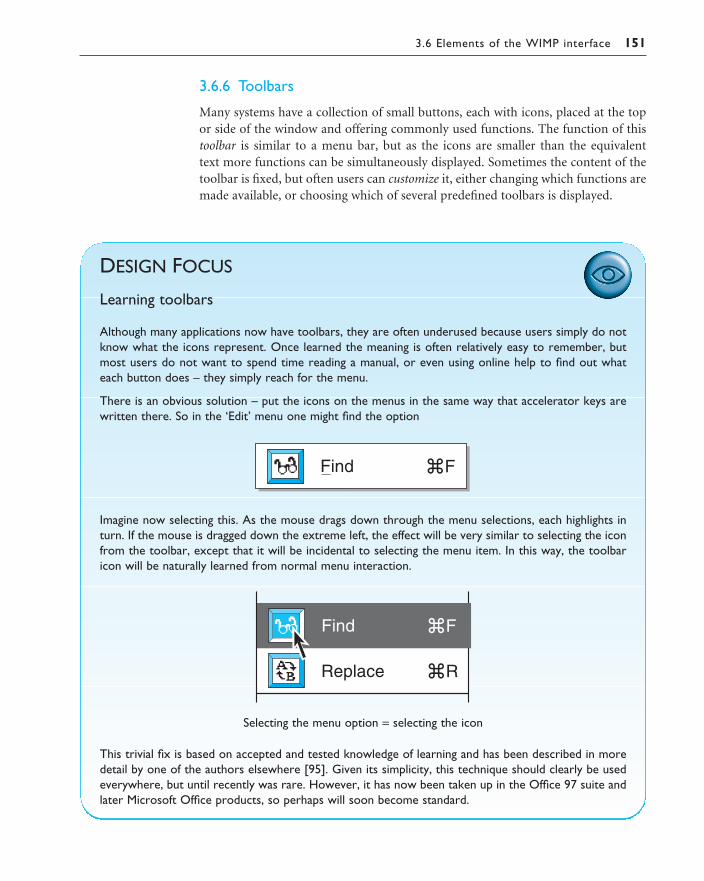
3.6 Elements of the WIMP interface 151
3.6.6 Toolbars
Many systems have a collection of small buttons, each with icons, placed at the topor side of the window and offering commonly used functions. The function of thistoolbar is similar to a menu bar, but as the icons are smaller than the equivalent text more functions can be simultaneously displayed. Sometimes the content of thetoolbar is fixed, but often users can customize it, either changing which functions aremade available, or choosing which of several predefined toolbars is displayed.
DESIGN FOCUS
Learning toolbars
Although many applications now have toolbars, they are often underused because users simply do notknow what the icons represent. Once learned the meaning is often relatively easy to remember, butmost users do not want to spend time reading a manual, or even using online help to find out whateach button does – they simply reach for the menu.
There is an obvious solution – put the icons on the menus in the same way that accelerator keys arewritten there. So in the ‘Edit’ menu one might find the option
Imagine now selecting this. As the mouse drags down through the menu selections, each highlights inturn. If the mouse is dragged down the extreme left, the effect will be very similar to selecting the iconfrom the toolbar, except that it will be incidental to selecting the menu item. In this way, the toolbaricon will be naturally learned from normal menu interaction.
Selecting the menu option = selecting the icon
This trivial fix is based on accepted and tested knowledge of learning and has been described in moredetail by one of the authors elsewhere [95]. Given its simplicity, this technique should clearly be usedeverywhere, but until recently was rare. However, it has now been taken up in the Office 97 suite andlater Microsoft Office products, so perhaps will soon become standard.
152 Chapter 3 n The interaction
3.6.7 Palettes
In many application programs, interaction can enter one of several modes. Thedefining characteristic of modes is that the interpretation of actions, such askeystrokes or gestures with the mouse, changes as the mode changes. For example,using the standard UNIX text editor vi, keystrokes can be interpreted either as operations to insert characters in the document (insert mode) or as operations toperform file manipulation (command mode). Problems occur if the user is notaware of the current mode. Palettes are a mechanism for making the set of possiblemodes and the active mode visible to the user. A palette is usually a collection oficons that are reminiscent of the purpose of the various modes. An example in adrawing package would be a collection of icons to indicate the pixel color or patternthat is used to fill in objects, much like an artist’s palette for paint.
Some systems allow the user to create palettes from menus or toolbars. In the caseof pull-down menus, the user may be able ‘tear off ’ the menu, turning it into a paletteshowing the menu items. In the case of toolbars, he may be able to drag the toolbaraway from its normal position and place it anywhere on the screen. Tear-off menusare usually those that are heavily graphical anyway, for example line-style or colorselection in a drawing package.
3.6.8 Dialog boxes
Dialog boxes are information windows used by the system to bring the user’s atten-tion to some important information, possibly an error or a warning used to preventa possible error. Alternatively, they are used to invoke a subdialog between user andsystem for a very specific task that will normally be embedded within some largertask. For example, most interactive applications result in the user creating some file that will have to be named and stored within the filing system. When the user orsystem wants to save the file, a dialog box can be used to allow the user to name the file and indicate where it is to be located within the filing system. When the savesubdialog is complete, the dialog box will disappear. Just as windows are used to separate the different threads of user–system dialog, so too are dialog boxes used tofactor out auxiliary task threads from the main task dialog.
INTERACTIVITY
When looking at an interface, it is easy to focus on the visually distinct parts (the but-tons, menus, text areas) but the dynamics, the way they react to a user’s actions, areless obvious. Dialog design, discussed in Chapter 16, is focussed almost entirely onthe choice and specification of appropriate sequences of actions and correspondingchanges in the interface state. However, it is typically not used at a fine level of detailand deliberately ignores the ‘semantic’ level of an interface: for example, the valida-tion of numeric information in a forms-based system.
3.7

3.7 Interactivity 153
It is worth remembering that interactivity is the defining feature of an interactivesystem. This can be seen in many areas of HCI. For example, the recognition rate for speech recognition is too low to allow transcription from tape, but in an airlinereservation system, so long as the system can reliably recognize yes and no it canreflect back its understanding of what you said and seek confirmation. Speech-basedinput is difficult, speech-based interaction easier. Also, in the area of informationvisualization the most exciting developments are all where users can interact with avisualization in real time, changing parameters and seeing the effect.
Interactivity is also crucial in determining the ‘feel’ of a WIMP environment. AllWIMP systems appear to have virtually the same elements: windows, icons, menus,pointers, dialog boxes, buttons, etc. However, the precise behavior of these elementsdiffers both within a single environment and between environments. For example,we have already discussed the different behavior of pull-down and fall-down menus.These look the same, but fall-down menus are more easily invoked by accident (andnot surprisingly the windowing environments that use them have largely fallen intodisuse!). In fact, menus are a major difference between the MacOS and MicrosoftWindows environments: in MacOS you have to keep the mouse depressed through-out menu selection; in Windows you can click on the menu bar and a pull-downmenu appears and remains there until an item is selected or it is cancelled. Similarlythe detailed behavior of buttons is quite complex, as we shall see in Chapter 17.
In older computer systems, the order of interaction was largely determined by themachine. You did things when the computer was ready. In WIMP environments, theuser takes the initiative, with many options and often many applications simultan-eously available. The exceptions to this are pre-emptive parts of the interface, wherethe system for various reasons wrests the initiative away from the user, perhapsbecause of a problem or because it needs information in order to continue.
The major example of this is modal dialog boxes. It is often the case that when adialog box appears the application will not allow you to do anything else until thedialog box has been completed or cancelled. In some cases this may simply block theapplication, but you can perform tasks in other applications. In other cases you cando nothing at all until the dialog box has been completed. An especially annoyingexample is when the dialog box asks a question, perhaps simply for confirmation ofan action, but the information you need to answer is hidden by the dialog box!
There are occasions when modal dialog boxes are necessary, for example when a major fault has been detected, or for certain kinds of instructional software.However, the general philosophy of modern systems suggests that one should mini-mize the use of pre-emptive elements, allowing the user maximum flexibility.
Interactivity is also critical in dealing with errors. We discussed slips and mistakesearlier in the chapter, and some ways to try to prevent these types of errors. The otherway to deal with errors is to make sure that the user or the system is able to tell whenerrors have occurred. If users can detect errors then they can correct them. So, evenif errors occur, the interaction as a whole succeeds. Several of the principles inChapter 7 deal with issues that relate to this. This ability to detect and correct isimportant both at the small scale of button presses and keystrokes and also at thelarge scale. For example, if you have sent a client a letter and expect a reply, you can
154 Chapter 3 n The interaction
put in your diary a note on the day you expect a reply. If the other person forgets to reply or the letter gets lost in the post you know to send a reminder or ring whenthe due day passes.
THE CONTEXT OF THE INTERACTION
We have been considering the interaction between a user and a system, and how thisis affected by interface design. This interaction does not occur within a vacuum. Wehave already noted some of the physical factors in the environment that can directlyaffect the quality of the interaction. This is part of the context in which the interac-tion takes place. But this still assumes a single user operating a single, albeit complex,machine. In reality, users work within a wider social and organizational context. Thisprovides the wider context for the interaction, and may influence the activity andmotivation of the user. In Chapter 13, we discuss some methods that can be used togain a fuller understanding of this context, and, in Chapter 14, we consider in moredetail the issues involved when more than one user attempts to work together on asystem. Here we will confine our discussion to the influence social and organiza-tional factors may have on the user’s interaction with the system. These may not befactors over which the designer has control. However, it is important to be aware ofsuch influences to understand the user and the work domain fully.
3.8
Bank managers don’t type . . .
The safe in most banks is operated by at least two keys, held by different employees of thebank. This makes it difficult for a bank robber to obtain both keys, and also protects the bankagainst light-fingered managers! ATMs contain a lot of cash and so need to be protected by sim-ilar measures. In one bank, which shall remain nameless, the ATM had an electronic locking device.The machine could not be opened to replenish or remove cash until a long key sequence had beenentered. In order to preserve security, the bank gave half the sequence to one manager and halfto another, so both managers had to be present in order to open the ATM. However, these weretraditional bank managers who were not used to typing – that was a job for a secretary! So theyeach gave their part of the key sequence to a secretary to type in when they wanted to gain entryto the ATM. In fact, they both gave their respective parts of the key sequence to the same secret-ary. Happily the secretary was honest, but the moral is you cannot ignore social expectations andrelationships when designing any sort of computer system, however simple it may be.
The presence of other people in a work environment affects the performance ofthe worker in any task. In the case of peers, competition increases performance, atleast for known tasks. Similarly the desire to impress management and superiorsimproves performance on these tasks. However, when it comes to acquisition of
3.8 The context of the interaction 155
new skills, the presence of these groups can inhibit performance, owing to the fear of failure. Consequently, privacy is important to allow users the opportunity toexperiment.
In order to perform well, users must be motivated. There are a number of pos-sible sources of motivation, as well as those we have already mentioned, includingfear, allegiance, ambition and self-satisfaction. The last of these is influenced by theuser’s perception of the quality of the work done, which leads to job satisfaction. If a system makes it difficult for the user to perform necessary tasks, or is frustrating touse, the user’s job satisfaction, and consequently performance, will be reduced.
The user may also lose motivation if a system is introduced that does not matchthe actual requirements of the job to be done. Often systems are chosen and intro-duced by managers rather than the users themselves. In some cases the manager’sperception of the job may be based upon observation of results and not on actualactivity. The system introduced may therefore impose a way of working that is unsat-isfactory to the users. If this happens there may be three results: the system will berejected, the users will be resentful and unmotivated, or the user will adapt theintended interaction to his own requirements. This indicates the importance ofinvolving actual users in the design process.
DESIGN FOCUS
Half the picture?
When systems are not designed to match the way people actually work, then users end up having to do ‘work arounds’. Integrated student records systems are becoming popular in universities in theUK. They bring the benefits of integrating examination systems with enrolment and finance systems soall data can be maintained together and cross-checked. All very useful and time saving – in theory.However, one commonly used system only holds a single overall mark per module for each student,whereas many modules on UK courses have multiple elements of assessment. Knowing a student’smark on each part of the assessment is often useful to academics making decisions in examinationboards as it provides a more detailed picture of performance. In many cases staff are therefore supplementing the official records system with their own unofficial spreadsheets to provide this information – making additional work for staff and increased opportunity for error.
On the other hand, the introduction of new technology may prove to be a motiva-tion to users, particularly if it is well designed, integrated with the user’s currentwork, and challenging. Providing adequate feedback is an important source of motiva-tion for users. If no feedback is given during a session, the user may become bored,unmotivated or, worse, unsure of whether the actions performed have been success-ful. In general, an action should have an obvious effect to prevent this confusion andto allow early recovery in the case of error. Similarly, if system delays occur, feedbackcan be used to prevent frustration on the part of the user – the user is then aware ofwhat is happening and is not left wondering if the system is still working.

156 Chapter 3 n The interaction
EXPERIENCE, ENGAGEMENT AND FUN
Ask many in HCI about usability and they may use the words ‘effective’ and‘efficient’. Some may add ‘satisfaction’ as well. This view of usability seems to stemmainly from the Taylorist tradition of time and motion studies: if you can get theworker to pull the levers and turn the knobs in the right order then you can shave10% off production costs.
However, users no longer see themselves as cogs in a machine. Increasingly, applications are focussed outside the closed work environment: on the home, leisure,entertainment, shopping. It is not sufficient that people can use a system, they mustwant to use it.
Even from a pure economic standpoint, your employees are likely to work betterand more effectively if they enjoy what they are doing!
In this section we’ll look at these more experiential aspects of interaction.
3.9.1 Understanding experience
Shopping is an interesting example to consider. Most internet stores allow you to buy things, but do you go shopping? Shopping is as much about going to theshops, feeling the clothes, being with friends. You can go shopping and never intendto spend money. Shopping is not about an efficient financial transaction, it is anexperience.
But experience is a difficult thing to pin down; we understand the idea of a good experience, but how do we define it and even more difficult how do we designit?
Csikszentimihalyi [82] looked at extreme experiences such as climbing a rock facein order to understand that feeling of total engagement that can sometimes happen.He calls this flow and it is perhaps related to what some sportspeople refer to as being‘in the zone’. This sense of flow occurs when there is a balance between anxiety and boredom. If you do something that you know you can do it is not engaging; youmay do it automatically while thinking of something else, or you may simply becomebored. Alternatively, if you do something completely outside your abilities you may become anxious and, if you are half way up a rock face, afraid. Flow comes whenyou are teetering at the edge of your abilities, stretching yourself to or a little beyondyour limits.
In education there is a similar phenomenon. The zone of proximal development isthose things that you cannot quite do yourself, but you can do with some support,whether from teachers, fellow pupils, or electronic or physical materials. Learning isat its best in this zone. Notice again this touching of limits.
Of course, this does not fully capture the sense of experience, and there is an activesubfield of HCI researchers striving to make sense of this, building on the work ofpsychologists and philosophers on the one hand and literary analysis, film makingand drama on the other.
3.9

3.9 Experience, engagement and fun 157
3.9.2 Designing experience
Some of the authors were involved in the design of virtual Christmas crackers. Theseare rather like electronic greetings cards, but are based on crackers. For those whohave not come across them, Christmas crackers are small tubes of paper between 8and 12 inches long (20–30 cm). Inside there are a small toy, a joke or motto and apaper hat. A small strip of card is threaded through, partly coated with gunpowder.When two people at a party pull the cracker, it bursts apart with a small bang fromthe gunpowder and the contents spill out.
The virtual cracker does not attempt to fully replicate each aspect of the physicalcharacteristics and process of pulling the cracker, but instead seeks to reproduce the experience. To do this the original crackers experience was deconstructed andeach aspect of the experience produced in a similar, but sometimes different, way inthe new media. Table 3.1 shows the aspects of the experience deconstructed andreconstructed in the virtual cracker.
For example, the cracker contents are hidden inside; no one knows what toy orjoke will be inside. Similarly, when you create a virtual cracker you normally cannotsee the contents until the recipient has opened it. Even the recipient initially sees a page with just an image of the cracker; it is only after the recipient has clicked on the ‘open’ icon that the cracker slowly opens and you get to see the joke, web toyand mask.
The mask is also worth looking at. The first potential design was to have a pictureof a face with a hat on it – well, it wouldn’t rank highly on excitement! The essentialfeature of the paper hat is that you can dress up. An iconic hat hardly does that.
Table 3.1 The crackers experience [101]
Real cracker Virtual cracker
Surface elementsDesign Cheap and cheerful Simple page/graphicsPlay Plastic toy and joke Web toy and jokeDressing up Paper hat Mask to cut out
Experienced effectsShared Offered to another Sent by email, messageCo-experience Pulled together Sender can’t see content until
opened by recipientExcitement Cultural connotations Recruited expectationHiddenness Contents inside First page – no contentsSuspense Pulling cracker Slow . . . page changeSurprise Bang (when it works) WAV file (when it works)

158 Chapter 3 n The interaction
Instead the cracker has a link to a web page with a picture of a mask that you can print, cut out and wear. Even if you don’t actually print it out, the fact that youcould changes the experience – it is some dressing up you just happen not to havedone yet.
A full description of the virtual crackers case study is on the book website at:/e3/casestudy/crackers/
3.9.3 Physical design and engagement
In Chapter 2 we talked about physical controls. Figure 2.13 showed controllers for amicrowave, washing machine and personal MiniDisc player. We saw then how cer-tain physical interfaces were suited for different contexts: smooth plastic controls foran easy clean microwave, multi-function knob for the MiniDisc.
Designers are faced with many constraints:
Ergonomic You cannot physically push buttons if they are too small or too close.
Physical The size or nature of the device may force certain positions or styles of con-trol, for example, a dial like the one on the washing machine would not fit on theMiniDisc controller; high-voltage switches cannot be as small as low-voltage ones.
Legal and safety Cooker controls must be far enough from the pans that you do notburn yourself, but also high enough to prevent small children turning them on.
Context and environment The microwave’s controls are smooth to make themeasy to clean in the kitchen.
Aesthetic The controls must look good.
Economic It must not cost too much!
These constraints are themselves often contradictory and require trade-offs to be made. For example, even within the safety category front-mounted controls arebetter in that they can be turned on or off without putting your hands over the pansand hot steam, but back-mounted controls are further from children’s grasp. TheMiniDisc player is another example; it physically needs to be small, but this meansthere is not room for all the controls you want given the minimum size that can be manipulated. In the case of the cooker there is no obvious best solution and sodifferent designs favor one or the other. In the case of the MiniDisc player the endknob is multi-function. This means the knob is ergonomically big enough to turnand physically small enough to fit, but at the cost of a more complex interactionstyle.
To add to this list of constraints there is another that makes a major impact on theease of use and also the ability of the user to become engaged with the device, for itto become natural to use:
Fluidity The extent to which the physical structure and manipulation of the devicenaturally relate to the logical functions it supports.

3.9 Experience, engagement and fun 159
This is related closely to the idea of affordances, which we discuss in Section 5.7.2.The knob at the end of the MiniDisc controller affords turning – it is an obviousthing to do. However, this may not have mapped naturally onto the logical func-tions. Two of the press buttons are for cycling round the display options and forchanging sound options. Imagine a design where turning the knob to clockwisecycled through the display options and turning it anti-clockwise cycled through thesound options. This would be a compact design satisfying all the ergonomic, physi-cal and aesthetic constraints, but would not have led to as fluid an interaction. Thephysically opposite motions lead to logically distinct effects. However, the designersdid a better job than this! The twist knob is used to move backwards and forwardsthrough the tracks of the MiniDisc – that is, opposite physical movements produceopposite logical effects. Holding the knob out and twisting turns the volume up anddown. Again, although the pull action is not a natural mapping, the twist maps verynaturally onto controlling the sound level.
As well as being fluid in action, some controls portray by their physical appearancethe underlying state they control. For example, the dial on the washing machine both sets the program and reflects the current stage in the washing cycle as it turns.A simple on/off switch also does this. However, it is also common to see the poweron computers and hifi devices controlled by a push button – press for on, then press again for off. The button does not reflect the state at all. When the screen is onthis is not a problem as the fact that there is something on the screen acts as a veryimmediate indicator of the state. But if the screen has a power save then you mightaccidentally turn the machine off thinking that you are turning it on! For this reason,this type of power button often has a light beside it to show you the power is on. A simple switch tells you that itself !
3.9.4 Managing value
If we want people to want to use a device or application we need to understand theirpersonal values. Why should they want to use it? What value do they get from usingit? Now when we say value here we don’t mean monetary value, although that maybe part of the story, but all the things that drive a person. For some people this mayinclude being nice to colleagues, being ecologically friendly, being successful in theircareer. Whatever their personal values are, if we ask someone to do something or usesomething they are only likely to do it if the value to them exceeds the cost.
This is complicated by the fact that for many systems the costs such as purchasecost, download time of a free application, learning effort are incurred up front,whereas often the returns – faster work, enjoyment of use – are seen later. In eco-nomics, businesses use a measure called ‘net present value’ to calculate what a futuregain is worth today; because money can be invested, £100 today is worth the same asperhaps £200 in five years’ time. Future gain is discounted. For human decision mak-ing, future gains are typically discounted very highly; many of us are bad at savingfor tomorrow or even keeping the best bits of our dinner until last. This means thatnot only must we understand people’s value systems, but we must be able to offer
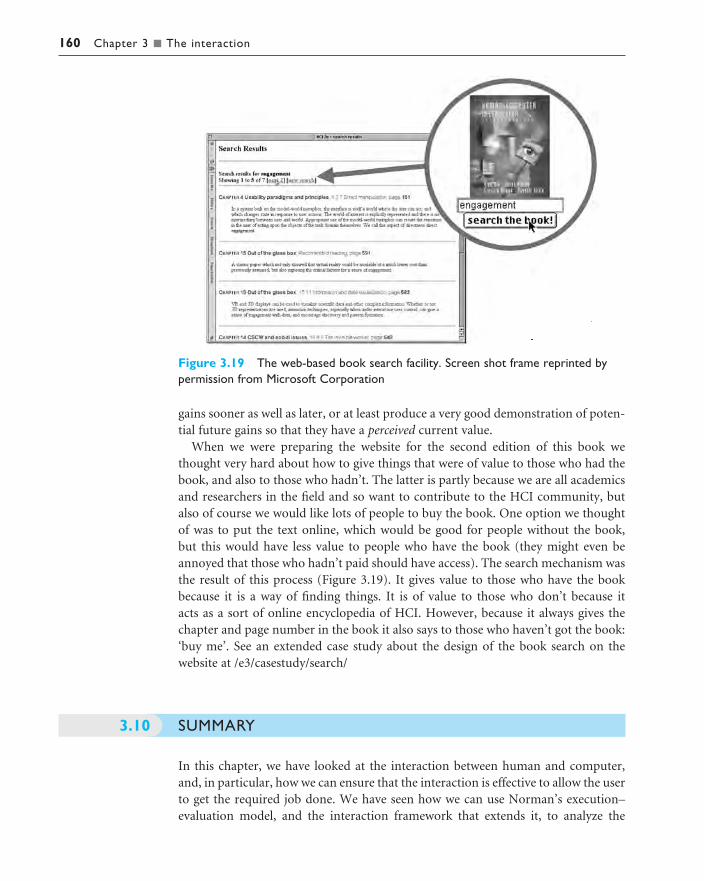
160 Chapter 3 n The interaction
gains sooner as well as later, or at least produce a very good demonstration of poten-tial future gains so that they have a perceived current value.
When we were preparing the website for the second edition of this book wethought very hard about how to give things that were of value to those who had thebook, and also to those who hadn’t. The latter is partly because we are all academicsand researchers in the field and so want to contribute to the HCI community, butalso of course we would like lots of people to buy the book. One option we thoughtof was to put the text online, which would be good for people without the book, but this would have less value to people who have the book (they might even beannoyed that those who hadn’t paid should have access). The search mechanism wasthe result of this process (Figure 3.19). It gives value to those who have the bookbecause it is a way of finding things. It is of value to those who don’t because it acts as a sort of online encyclopedia of HCI. However, because it always gives thechapter and page number in the book it also says to those who haven’t got the book:‘buy me’. See an extended case study about the design of the book search on the website at /e3/casestudy/search/
SUMMARY
In this chapter, we have looked at the interaction between human and computer,and, in particular, how we can ensure that the interaction is effective to allow the userto get the required job done. We have seen how we can use Norman’s execution–evaluation model, and the interaction framework that extends it, to analyze the
3.10
Figure 3.19 The web-based book search facility. Screen shot frame reprinted bypermission from Microsoft Corporation

Exercises 161
interaction in terms of how easy or difficult it is for the user to express what he wantsand determine whether it has been done.
We have also looked at the role of ergonomics in interface design, in analyzing the physical characteristics of the interaction, and we have discussed a number ofinterface styles. We have considered how each of these factors can influence theeffectiveness of the interaction.
Interactivity is at the heart of all modern interfaces and is important at many levels. Interaction between user and computer does not take place in a vacuum, butis affected by numerous social and organizational factors. These may be beyond the designer’s control, but awareness of them can help to limit any negative effectson the interaction.
EXERCISES
3.1 Choose two of the interface styles (described in Section 3.5) that you have experienceof using. Use the interaction framework to analyze the interaction involved in using these inter-face styles for a database selection task. Which of the distances is greatest in each case?
3.2 Find out all you can about natural language interfaces. Are there any successful systems? For whatapplications are these most appropriate?
3.3 What influence does the social environment in which you work have on your interaction with thecomputer? What effect does the organization (commercial or academic) to which you belong haveon the interaction?
3.4 (a) Group the following functions under appropriate headings, assuming that they are to form thebasis for a menu-driven word-processing system – the headings you choose will become themenu titles, with the functions appearing under the appropriate one. You can choose as manyor as few menu headings as you wish. You may also alter the wordings of the functions slightlyif you wish.
save, save as, new, delete, open mail, send mail, quit, undo, table, glossary, preferences,character style, format paragraph, lay out document, position on page, plain text, bold text,italic text, underline, open file, close file, open copy of file, increase point size, decreasepoint size, change font, add footnote, cut, copy, paste, clear, repaginate, add page break,insert graphic, insert index entry, print, print preview, page setup, view page, find word,change word, go to, go back, check spelling, view index, see table of contents, count words,renumber pages, repeat edit, show alternative document, help
(b) If possible, show someone else your headings, and ask them to group the functions under yourheadings. Compare their groupings with yours. You should find that there are areas of greatsimilarity, and some differences. Discuss the similarities and discrepancies.
Why do some functions always seem to be grouped together?Why do some groups of functions always get categorized correctly?Why are some less easy to place under the ‘correct’ heading?Why is this important?
RECOMMENDED READING
D. A. Norman, The Psychology of Everyday Things, Basic Books, 1988. (Republishedas The Design of Everyday Things by Penguin, 1991.)A classic text, which discusses psychological issues in designing everyday objects andaddresses why such objects are often so difficult to use. Discusses the execution–evaluation cycle. Very readable and entertaining. See also his more recent booksTurn Signals are the Facial Expressions of Automobiles [267], Things That Make UsSmart [268] and The Invisible Computer [269].
R. W. Bailey, Human Performance Engineering: A Guide for System Designers, PrenticeHall, 1982.Detailed coverage of human factors and ergonomics issues, with plenty of examples.
3.5 Using your function groupings from Exercise 3.4, count the number of items in your menus.
(a) What is the average?What is the disadvantage of putting all the functions on the screen at once?What is the problem with using lots of menu headings?What is the problem of using very few menu headings?
Consider the following: I can group my functions either into three menus, with lots of func-tions in each one, or into eight menus with fewer in each. Which will be easier to use? Why?
(b) Optional experimentDesign an experiment to test your answers. Perform the experiment and report on yourresults.
3.6 Describe (in words as well as graphically) the interaction framework introduced in Human–Computer Interaction. Show how it can be used to explain problems in the dialog between a userand a computer.
3.7 Describe briefly four different interaction styles used to accommodate the dialog between userand computer.
3.8 The typical computer screen has a WIMP setup (what does WIMP stand for?). Most commonWIMP arrangements work on the basis of a desktop metaphor, in which common actions arelikened to similar actions in the real world. For example, moving a file is achieved by selecting itand dragging it into a relevant folder or filing cabinet. The advantage of using a metaphor is thatthe user can identify with the environment presented on the screen. Having a metaphor allowsusers to predict the outcome of their actions more easily.
Note that the metaphor can break down, however. What is the real-world equivalent of format-ting a disk? Is there a direct analogy for the concept of ‘undo’? Think of some more examplesyourself.
162 Chapter 3 n The interaction

Recommended reading 163
G. Salvendy, Handbook of Human Factors and Ergonomics, John Wiley, 1997.Comprehensive collection of contributions from experts in human factors andergonomics.
M. Helander, editor, Handbook of Human–Computer Interaction. Part II: UserInterface Design, North-Holland, 1988.Comprehensive coverage of interface styles.
J. Raskin, The Humane Interface: New Directions for Designing Interactive Systems,Addison Wesley, 2000.Jef Raskin was one of the central designers of the original Mac user interface. This book gives a personal, deep and practical examination of many issues ofinteraction and its application in user interface design.
M. Blythe, A. Monk, K. Overbeeke and P. Wright, editors, Funology: From Usabilityto Enjoyment, Kluwer, 2003.This is an edited book with chapters covering many areas of user experience. It includes an extensive review of theory from many disciplines from psychologyto literary theory and chapters giving design frameworks based on these. The theoretical and design base is grounded by many examples and case studiesincluding a detailed analysis of virtual crackers.

PARADIGMS
OV E RV I E W
n Examples of effective strategies for building interactivesystems provide paradigms for designing usableinteractive systems.
n The evolution of these usability paradigms also providesa good perspective on the history of interactivecomputing.
n These paradigms range from the introduction of time-sharing computers, through the WIMP and web, toubiquitous and context-aware computing.
4

4.2 Paradigms for interaction 165
INTRODUCTION
As we noted in Chapter 3, the primary objective of an interactive system is to allowthe user to achieve particular goals in some application domain, that is, the inter-active system must be usable. The designer of an interactive system, then, is posedwith two open questions:
1. How can an interactive system be developed to ensure its usability?2. How can the usability of an interactive system be demonstrated or measured?
One approach to answering these questions is by means of example, in which suc-cessful interactive systems are commonly believed to enhance usability and, there-fore, serve as paradigms for the development of future products.
We believe that we now build interactive systems that are more usable than thosebuilt in the past. We also believe that there is considerable room for improvement indesigning more usable systems in the future. As discussed in Chapter 2, the greatadvances in computer technology have increased the power of machines and enhancedthe bandwidth of communication between humans and computers. The impact oftechnology alone, however, is not sufficient to enhance its usability. As our machineshave become more powerful, the key to increased usability has come from the creativeand considered application of the technology to accommodate and augment thepower of the human. Paradigms for interaction have for the most part been dependentupon technological advances and their creative application to enhance interaction.
In this chapter, we investigate some of the principal historical advances in inter-active designs. What is important to notice here is that the techniques and designsmentioned are recognized as major improvements in interaction, though it is some-times hard to find a consensus for the reason behind the success. It is even harder to predict ahead what the new paradigms will be. Often new paradigms have arisenthrough exploratory designs that have then been seen, after the fact, to have createda new base point for future design.
We will discuss 15 different paradigms in this chapter. They do not provide mutu-ally exclusive categories, as particular systems will often incorporate ideas from morethan one of the following paradigms. In a way, this chapter serves as a history ofinteractive system development, though our emphasis is not so much on historicalaccuracy as on interactive innovation. We are concerned with the advances in inter-action provided by each paradigm.
PARADIGMS FOR INTERACTION
4.2.1 Time sharingIn the 1940s and 1950s, the significant advances in computing consisted of new hard-ware technologies. Mechanical relays were replaced by vacuum electron tubes. Tubeswere replaced by transistors, and transistors by integrated chips, all of which meant
4.2
4.1

166 Chapter 4 n Paradigms
that the amount of sheer computing power was increasing by orders of magnitude.By the 1960s it was becoming apparent that the explosion of growth in computingpower would be wasted if there was not an equivalent explosion of ideas about howto channel that power. One of the leading advocates of research into human-centeredapplications of computer technology was J. C. R. Licklider, who became the directorof the Information Processing Techniques Office of the US Department of Defense’sAdvanced Research Projects Agency (ARPA). It was Licklider’s goal to finance vari-ous research centers across the United States in order to encourage new ideas abouthow best to apply the burgeoning computing technology.
One of the major contributions to come out of this new emphasis in research wasthe concept of time sharing, in which a single computer could support multiple users.Previously, the human (or more accurately, the programmer) was restricted to batchsessions, in which complete jobs were submitted on punched cards or paper tape toan operator who would then run them individually on the computer. Time-sharingsystems of the 1960s made programming a truly interactive venture and broughtabout a subculture of programmers known as ‘hackers’ – single-minded masters ofdetail who took pleasure in understanding complexity. Though the purpose of thefirst interactive time-sharing systems was simply to augment the programming cap-abilities of the early hackers, it marked a significant stage in computer applications forhuman use. Rather than rely on a model of interaction as a pre-planned activity thatresulted in a complete set of instructions being laid out for the computer to follow,truly interactive exchange between programmer and computer was possible. Thecomputer could now project itself as a dedicated partner with each individual userand the increased throughput of information between user and computer allowedthe human to become a more reactive and spontaneous collaborator. Indeed, withthe advent of time sharing, real human–computer interaction was now possible.
4.2.2 Video display units
As early as the mid-1950s researchers were experimenting with the possibility of presenting and manipulating information from a computer in the form of images on a video display unit (VDU). These display screens could provide a more suitablemedium than a paper printout for presenting vast quantities of strategic informationfor rapid assimilation. The earliest applications of display screen images were developed in military applications, most notably the Semi-Automatic GroundEnvironment (SAGE) project of the US Air Force. It was not until 1962, however,when a young graduate student at the Massachusetts Institute of Technology (MIT),Ivan Sutherland, astonished the established computer science community with hisSketchpad program, that the capabilities of visual images were realized. As describedin Howard Rheingold’s history of computing book Tools for Thought [305]:
Sketchpad allowed a computer operator to use the computer to create, very rapidly,sophisticated visual models on a display screen that resembled a television set. Thevisual patterns could be stored in the computer’s memory like any other data, andcould be manipulated by the computer’s processor. . . . But Sketchpad was much more

4.2 Paradigms for interaction 167
than a tool for creating visual displays. It was a kind of simulation language thatenabled computers to translate abstractions into perceptually concrete forms. And itwas a model for totally new ways of operating computers; by changing something on thedisplay screen, it was possible, via Sketchpad, to change something in the computer’smemory.
Sketchpad demonstrated two important ideas. First, computers could be used formore than just data processing. They could extend the user’s ability to abstract awayfrom some levels of detail, visualizing and manipulating different representations ofthe same information. Those abstractions did not have to be limited to representa-tions in terms of bit sequences deep within the recesses of computer memory. Rather,the abstractions could be made truly visual. To enhance human interaction, theinformation within the computer was made more amenable to human consumption.The computer was made to speak a more human language, instead of the humanbeing forced to speak more like a computer. Secondly, Sutherland’s efforts demon-strated how important the contribution of one creative mind (coupled with a doggeddetermination to see the idea through) could be to the entire history of computing.
4.2.3 Programming toolkits
Douglas Engelbart’s ambition since the early 1950s was to use computer technologyas a means of complementing human problem-solving activity. Engelbart’s idea as agraduate student at the University of California at Berkeley was to use the computerto teach humans. This dream of naïve human users actually learning from a com-puter was a stark contrast to the prevailing attitude of his contemporaries that com-puters were a purposely complex technology that only the intellectually privilegedwere capable of manipulating. Engelbart’s dedicated research team at the StanfordResearch Institute in the 1960s worked towards achieving the manifesto set forth inan article published in 1963 [124]:
By ‘augmenting man’s intellect’ we mean increasing the capability of a man toapproach a complex problem situation, gain comprehension to suit his particularneeds, and to derive solutions to problems. . . . We refer to a way of life in an integrateddomain where hunches, cut-and-try, intangibles, and the human ‘feel for the situation’usefully coexist with powerful concepts, streamlined terminology and notation,sophisticated methods, and high-powered electronic aids.
Many of the ideas that Engelbart’s team developed at the Augmentation ResearchCenter – such as word processing and the mouse – only attained mass commercialsuccess decades after their invention. A live demonstration of his oNLine System(NLS, also later known as NLS/Augment) was given in the autumn of 1968 at the FallJoint Computer Conference in San Francisco before a captivated audience of computersceptics. We are not so concerned here with the interaction techniques that were pre-sent in NLS, as many of those will be discussed later. What is important here is themethod that Engelbart’s team adopted in creating their very innovative and power-ful interactive systems with the relatively impoverished technology of the 1960s.
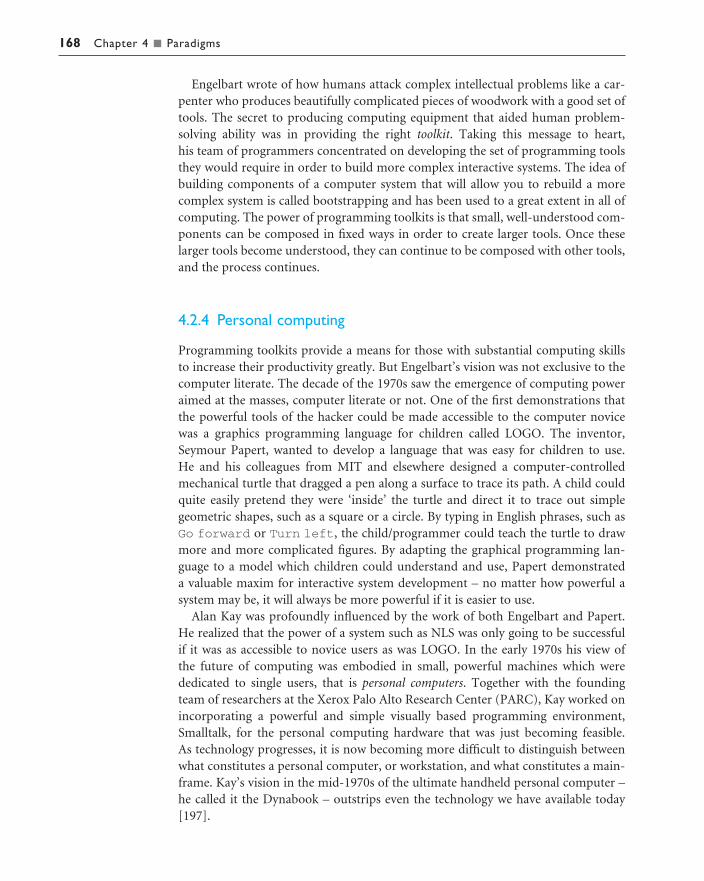
168 Chapter 4 n Paradigms
Engelbart wrote of how humans attack complex intellectual problems like a car-penter who produces beautifully complicated pieces of woodwork with a good set oftools. The secret to producing computing equipment that aided human problem-solving ability was in providing the right toolkit. Taking this message to heart, his team of programmers concentrated on developing the set of programming toolsthey would require in order to build more complex interactive systems. The idea ofbuilding components of a computer system that will allow you to rebuild a morecomplex system is called bootstrapping and has been used to a great extent in all ofcomputing. The power of programming toolkits is that small, well-understood com-ponents can be composed in fixed ways in order to create larger tools. Once theselarger tools become understood, they can continue to be composed with other tools,and the process continues.
4.2.4 Personal computing
Programming toolkits provide a means for those with substantial computing skills to increase their productivity greatly. But Engelbart’s vision was not exclusive to thecomputer literate. The decade of the 1970s saw the emergence of computing poweraimed at the masses, computer literate or not. One of the first demonstrations thatthe powerful tools of the hacker could be made accessible to the computer novicewas a graphics programming language for children called LOGO. The inventor,Seymour Papert, wanted to develop a language that was easy for children to use. He and his colleagues from MIT and elsewhere designed a computer-controlledmechanical turtle that dragged a pen along a surface to trace its path. A child couldquite easily pretend they were ‘inside’ the turtle and direct it to trace out simple geometric shapes, such as a square or a circle. By typing in English phrases, such as Go forward or Turn left, the child/programmer could teach the turtle to drawmore and more complicated figures. By adapting the graphical programming lan-guage to a model which children could understand and use, Papert demonstrated a valuable maxim for interactive system development – no matter how powerful asystem may be, it will always be more powerful if it is easier to use.
Alan Kay was profoundly influenced by the work of both Engelbart and Papert. He realized that the power of a system such as NLS was only going to be successfulif it was as accessible to novice users as was LOGO. In the early 1970s his view of the future of computing was embodied in small, powerful machines which were dedicated to single users, that is personal computers. Together with the founding team of researchers at the Xerox Palo Alto Research Center (PARC), Kay worked onincorporating a powerful and simple visually based programming environment,Smalltalk, for the personal computing hardware that was just becoming feasible. As technology progresses, it is now becoming more difficult to distinguish betweenwhat constitutes a personal computer, or workstation, and what constitutes a main-frame. Kay’s vision in the mid-1970s of the ultimate handheld personal computer –he called it the Dynabook – outstrips even the technology we have available today[197].
4.2 Paradigms for interaction 169
4.2.5 Window systems and the WIMP interface
With the advent and immense commercial success of personal computing, theemphasis for increasing the usability of computing technology focussed on address-ing the single user who engaged in a dialog with the computer in order to completesome work. Humans are able to think about more than one thing at a time, and in accomplishing some piece of work, they frequently interrupt their current train ofthought to pursue some other related piece of work. A personal computer systemwhich forces the user to progress in order through all of the tasks needed to achievesome objective, from beginning to end without any diversions, does not correspondto that standard working pattern. If the personal computer is to be an effective dia-log partner, it must be as flexible in its ability to ‘change the topic’ as the human is.
But the ability to address the needs of a different user task is not the only require-ment. Computer systems for the most part react to stimuli provided by the user, sothey are quite amenable to a wandering dialog initiated by the user. As the userengages in more than one plan of activity over a stretch of time, it becomes difficultfor him to maintain the status of the overlapping threads of activity. It is thereforenecessary for the computer dialog partner to present the context of each thread ofdialog so that the user can distinguish them.
One presentation mechanism for achieving this dialog partitioning is to separatephysically the presentation of the different logical threads of user–computer con-versation on the display device. The window is the common mechanism associatedwith these physically and logically separate display spaces. We discussed windowingsystems in detail in Chapter 3.
Interaction based on windows, icons, menus and pointers – the WIMP interface –is now commonplace. These interaction devices first appeared in the commercialmarketplace in April 1981, when Xerox Corporation introduced the 8010 StarInformation System. But many of the interaction techniques underlying a window-ing system were used in Engelbart’s group in NLS and at Xerox PARC in the experimental precursor to Star, the Alto.
4.2.6 The metaphor
In developing the LOGO language to teach children, Papert used the metaphor of aturtle dragging its tail in the dirt. Children could quickly identify with the real-worldphenomenon and that instant familiarity gave them an understanding of how theycould create pictures. Metaphors are used quite successfully to teach new concepts interms of ones which are already understood, as we saw when looking at analogy inChapter 1. It is no surprise that this general teaching mechanism has been successfulin introducing computer novices to relatively foreign interaction techniques. Wehave already seen how metaphors are used to describe the functionality of manyinteraction widgets, such as windows, menus, buttons and palettes. Tremendouscommercial successes in computing have arisen directly from a judicious choice of metaphor. The Xerox Alto and Star were the first workstations based on themetaphor of the office desktop. The majority of the management tasks on a standard

170 Chapter 4 n Paradigms
workstation have to do with file manipulation. Linking the set of tasks associatedwith file manipulation to the filing tasks in a typical office environment makes theactual computerized tasks easier to understand at first. The success of the desktopmetaphor is unquestionable. Another good example in the personal computingdomain is the widespread use of the spreadsheet metaphor for accounting and financial modeling.
Very few will debate the value of a good metaphor for increasing the initial familiarity between user and computer application. The danger of a metaphor is usually realized after the initial honeymoon period. When word processors were first introduced, they relied heavily on the typewriter metaphor. The keyboard of a computer closely resembles that of a standard typewriter, so it seems like a goodmetaphor from which to start. However, the behavior of a word processor is differ-ent from any typewriter. For example, the space key on a typewriter is passive, producing nothing on the piece of paper and just moving the guide further along thecurrent line. For a typewriter, a space is not a character. However, for a word pro-cessor, the blank space is a character which must be inserted within a text just as anyother character is inserted. So an experienced typist is not going to be able to predictcorrectly the behavior of pressing the spacebar on the keyboard by appealing to his experience with a typewriter. Whereas the typewriter metaphor is beneficial for providing a preliminary understanding of a word processor, the analogy is inadequate for promoting a full understanding of how the word processor works. Infact, the metaphor gets in the way of the user understanding the computer.
A similar problem arises with most metaphors. Although the desktop metaphor isinitially appealing, it falls short in the computing world because there are no officeequivalents for ejecting a floppy disk or printing a document. When designers try too hard to make the metaphor stick, the resulting system can be more confusing.Who thinks it is intuitive to drag the icon of a floppy disk to the wastebasket in order to eject it from the system? Ordinarily, the wastebasket is used to dispose ofthings that we never want to use again, which is why it works for deleting files. Wemust accept that some of the tasks we perform with a computer do not have real-world equivalents, or if they do, we cannot expect a single metaphor to account for all of them.
Another problem with a metaphor is the cultural bias that it portrays. With thegrowing internationalization of software, it should not be assumed that a metaphorwill apply across national boundaries. A meaningless metaphor will only add anotherlayer of complexity between the user and the system.
A more extreme example of metaphor occurs with virtual reality systems. In a VRsystem, the metaphor is not simply captured on a display screen. Rather, the user is also portrayed within the metaphor, literally creating an alternative, or virtual,reality. Any actions that the user performs are supposed to become more natural andso more movements of the user are interpreted, instead of just keypresses, buttonclicks and movements of an external pointing device. A VR system also needs to know the location and orientation of the user. Consequently, the user is often‘rigged’ with special tracking devices so that the system can locate them and interprettheir motion correctly.

4.2 Paradigms for interaction 171
4.2.7 Direct manipulation
In the early 1980s as the price of fast and high-quality graphics hardware was steadilydecreasing, designers were beginning to see that their products were gaining popu-larity as their visual content increased. As long as the user–system dialog remainedlargely unidirectional – from user command to system command line prompt –computing was going to stay within the minority population of the hackers who revelled in the challenge of complexity. In a standard command line interface, theonly way to get any feedback on the results of previous interaction is to know thatyou have to ask for it and to know how to ask for it. Rapid visual and audio feedbackon a high-resolution display screen or through a high-quality sound system makes itpossible to provide evaluative information for every executed user action.
Rapid feedback is just one feature of the interaction technique known as directmanipulation. Ben Shneiderman [320, 321] is attributed with coining this phrase in1982 to describe the appeal of graphics-based interactive systems such as Sketchpadand the Xerox Alto and Star. He highlights the following features of a direct manip-ulation interface:
n visibility of the objects of interestn incremental action at the interface with rapid feedback on all actionsn reversibility of all actions, so that users are encouraged to explore without severe
penaltiesn syntactic correctness of all actions, so that every user action is a legal operationn replacement of complex command languages with actions to manipulate directly
the visible objects (and, hence, the name direct manipulation).
The first real commercial success which demonstrated the inherent usability ofdirect manipulation interfaces for the general public was the Macintosh personalcomputer, introduced by Apple Computer, Inc. in 1984 after the relatively unsuc-cessful marketing attempt in the business community of the similar but more priceyLisa computer. We discussed earlier how the desktop metaphor makes the computerdomain of file management, usually described in terms of files and directories, easierto grasp by likening it to filing in the typical office environment, usually described interms of documents and folders. The direct manipulation interface for the desktopmetaphor requires that the documents and folders are made visible to the user as icons which represent the underlying files and directories. An operation such asmoving a file from one directory to another is mirrored as an action on the visibledocument which is ‘picked up and dragged’ along the desktop from one folder to thenext. In a command line interface to a filing system, it is normal that typographicalerrors in constructing the command line for a move operation would result in a syntactically incorrect command (for example, mistyping the file’s name results in anerror if you are fortunate enough not to spell accidentally the name of another file inthe process). It is impossible to formulate a syntactically incorrect move operationwith the pick-up-and-drag style of command. It is still possible for errors to occur ata deeper level, as the user might move a document to the wrong place, but it is relat-ively easy to detect and recover from those errors. While the document is dragged,

172 Chapter 4 n Paradigms
continual visual feedback is provided, creating the illusion that the user is actuallyworking in the world of the desktop and not just using the metaphor to help himunderstand.
Ed Hutchins, Jim Hollan and Donald Norman [187] provide a more psycho-logical justification in terms of the model-world metaphor for the directness that the above example suggests. In Norman and Draper’s collection of papers on user-centered design [270] they write:
In a system built on the model-world metaphor, the interface is itself a world wherethe user can act, and which changes state in response to user actions. The world ofinterest is explicitly represented and there is no intermediary between user and world.Appropriate use of the model-world metaphor can create the sensation in the user ofacting upon the objects of the task domain themselves. We call this aspect of directnessdirect engagement.
In the model-world metaphor, the role of the interface is not so much one of medi-ating between the user and the underlying system. From the user’s perspective, theinterface is the system.
A consequence of the direct manipulation paradigm is that there is no longer aclear distinction between input and output. In the interaction framework in Chap-ter 3 we talked about a user articulating input expressions in some input languageand observing the system-generated output expressions in some output language. In a direct manipulation system, the output expressions are used to formulate subsequent input expressions. The document icon is an output expression in the desktop metaphor, but that icon is used by the user to articulate the move operation.This aggregation of input and output is reflected in the programming toolkits, aswidgets are not considered as input or output objects exclusively. Rather, widgetsembody both input and output languages, so we consider them as interaction objects.
Somewhat related to the visualization provided by direct manipulation is theWYSIWYG paradigm, which stands for ‘what you see is what you get’. What you seeon a display screen, for example when you are using a word processor, is not theactual document that you will be producing in the end. Rather, it is a representationor rendering of what that final document will look like. The implication with aWYSIWYG interface is that the difference between the representation and the finalproduct is minimal, and the user is easily able to visualize the final product from thecomputer’s representation. So, in the word-processing example, you would be ableto see what the overall layout of your document would be from its image on screen,minimizing any guesswork on your part to format the final printed copy.
With WYSIWYG interfaces, it is the simplicity and immediacy of the mappingbetween representation and final product that matters. In terms of the interactionframework, the observation of an output expression is made simple so that assess-ment of goal achievement is straightforward. But WYSIWYG is not a panacea forusability. What you see is all you get! In the case of a word processor, it is difficult toachieve more sophisticated page design if you must always see the results of the lay-out on screen. For example, suppose you want to include a picture in a documentyou are writing. You design the picture and then place it in the current draft of your

4.2 Paradigms for interaction 173
document, positioning it at the top of the page on which it is first referenced. As youmake changes to the paper, the position of the picture will change. If you still wantit to appear at the top of a page, you will no doubt have to make adjustments to thedocument. It would be easier if you only had to include the picture once, with adirective that it should be positioned at the top of the printed page, whether or notit appears that way on screen. You might sacrifice the WYSIWYG principle in orderto make it easier to incorporate such floatable objects in your documents.
Worked exercise Discuss the ways in which a full-page word processor is or is not a direct manipulation interfacefor editing a document using Shneiderman’s criteria. What features of a modern word processorbreak the metaphor of composition with pen (or typewriter) and paper?
Answer We will answer the first point by evaluating the word processor relative to the criteriafor direct manipulation given by Shneiderman.
Visibility of the objects of interestThe most important objects of interest in a word processor are the words themselves.Indeed, the visibility of the text on a continual basis was one of the major usabilityadvances in moving from line-oriented to display-oriented editors. Depending on theuser’s application, there may be other objects of interest in word processing that mayor may not be visible. For example, are the margins for the text on screen similar tothe ones which would eventually be printed? Is the spacing within a line and the linebreaks similar? Are the different fonts and formatting characteristics of the text visible(without altering the spacing)? Expressed in this way, we can see the visibility criterionfor direct manipulation as very similar to the criteria for a WYSIWYG interface.
Incremental action at the interface with rapid feedback on all actionsWe expect from a word processor that characters appear in the text as we type themin at the keyboard, with little delay. If we are inserting text on a page, we might alsoexpect that the format of the page adjust immediately to accommodate the new changes.Various word processors do this reformatting immediately, whereas with otherschanges in page breaks may take some time to be reflected. One of the other import-ant actions which requires incremental and rapid feedback is movement of the windowusing the scroll button. If there is a significant delay between the input command tomove the window down and the actual movement of the window on screen, it is quitepossible that the user will ‘overshoot’ the target when using the scrollbar button.
Reversibility of all actions, so that users are encouraged to explore withoutsevere penaltiesSingle-step undo commands in most word processors allow the user to recover fromthe last action performed. One problem with this is that the user must recognize theerror before doing any other action. More sophisticated undo facilities allow the userto retrace back more than one command at a time. The kind of exploration this revers-ibility provides in a word processor is best evidenced with the ease of experimentationthat is now available for formatting changes in a document (font types and sizes andmargin changes). One problem with the ease of exploration is that emphasis may moveto the look of a document rather than what the text actually says (style over content).

174 Chapter 4 n Paradigms
Syntactic correctness of all actions, so that every user action is a legal operationWYSIWYG word processors usually provide menus and buttons which the user usesto articulate many commands. These interaction mechanisms serve to constrain theinput language to allow only legal input from the user. Document markup systems, such as HTML and LaTeX, force the user to insert textual commands (which may beerroneously entered by the user) to achieve desired formatting effects.
Replacement of complex command languages with actions to manipulatedirectly the visible objectsThe case for word processors is similar to that described above for syntactic correct-ness. In addition, operations on portions of text are achieved many times by allowingthe user to highlight the text directly with a mouse (or arrow keys). Subsequent actionon that text, such as moving it or copying it to somewhere else, can then be achievedmore directly by allowing the user to ‘drag’ the selected text via the mouse to its newlocation.
To answer the second question concerning the drawback of the pen (or typewriter)metaphor for word processing, we refer to the discussion on metaphors in Section4.2.6. The example there compares the functionality of the space key in typewriting ver-sus word processing. For a typewriter, the space key is passive; it merely moves theinsertion point one space to the right. In a word processor, the space key is active, as it inserts a character (the space character) into the document. The functionality ofthe typewriter space key is produced by the movement keys for the word processor(typically an arrow key pointing right to move forward within one line). In fact, much ofthe functionality that we have come to expect of a word processor is radically differentfrom that expected of a typewriter, so much so that the typewriter as a metaphor forword processing is not all that instructive. In practice, modern typewriters have begunto borrow from word processors when defining their functionality!
4.2.8 Language versus action
Whereas it is true that direct manipulation interfaces make some tasks easier to per-form correctly, it is equally true that some tasks are more difficult, if not impossible.Contrary to popular wisdom, it is not generally true that actions speak louder thanwords. The image we projected for direct manipulation was of the interface as areplacement for the underlying system as the world of interest to the user. Actionsperformed at the interface replace any need to understand their meaning at anydeeper, system level. Another image is of the interface as the interlocutor or medi-ator between the user and the system. The user gives the interface instructions and itis then the responsibility of the interface to see that those instructions are carried out.The user–system communication is by means of indirect language instead of directactions.
We can attach two meaningful interpretations to this language paradigm. The firstrequires that the user understands how the underlying system functions and the

4.2 Paradigms for interaction 175
interface as interlocutor need not perform much translation. In fact, this inter-pretation of the language paradigm is similar to the kind of interaction which existed before direct manipulation interfaces were around. In a way, we have comefull circle!
The second interpretation does not require the user to understand the underlyingsystem’s structure. The interface serves a more active role, as it must interpretbetween the intended operation as requested by the user and the possible systemoperations that must be invoked to satisfy that intent. Because it is more active, somepeople refer to the interface as an agent in these circumstances. We can see this kindof language paradigm at work in an information retrieval system. You may knowwhat kind of information is in some internal system database, such as the UK high-way code, but you would not know how that information is organized. If you had aquestion about speed limits on various roads, how would you ask? The answer in thiscase is that you would ask the question in whatever way it comes to mind, typing ina question such as, ‘What are the speed limits on different roads?’ You then leave itup to the interface agent to reinterpret your request as a legal query to the highwaycode database.
Whatever interpretation we attach to the language paradigm, it is clear that it hasadvantages and disadvantages when compared with the action paradigm implied bydirect manipulation interfaces. In the action paradigm, it is often much easier to per-form simple tasks without risk of certain classes of error. For example, recognizingand pointing to an object reduces the difficulty of identification and the possibilityof misidentification. On the other hand, more complicated tasks are often rathertedious to perform in the action paradigm, as they require repeated execution of thesame procedure with only minor modification. In the language paradigm, there isthe possibility of describing a generic procedure once (for example, a looping con-struct which will perform a routine manipulation on all files in a directory) and thenleaving it to be executed without further user intervention.
The action and language paradigms need not be completely separate. In the aboveexample, we distinguished between the two paradigms by saying that we can describegeneric and repeatable procedures in the language paradigm and not in the actionparadigm. An interesting combination of the two occurs in programming by examplewhen a user can perform some routine tasks in the action paradigm and the systemrecords this as a generic procedure. In a sense, the system is interpreting the user’sactions as a language script which it can then follow.
4.2.9 Hypertext
In 1945, Vannevar Bush, then the highest-ranking scientific administrator in the USwar effort, published an article entitled ‘As We May Think’ in The Atlantic Monthly.Bush was in charge of over 6000 scientists who had greatly pushed back the frontiersof scientific knowledge during the Second World War. He recognized that a majordrawback of these prolific research efforts was that it was becoming increasinglydifficult to keep in touch with the growing body of scientific knowledge in the

176 Chapter 4 n Paradigms
literature. In his opinion, the greatest advantages of this scientific revolution were tobe gained by those individuals who were able to keep abreast of an ever-increasingflow of information. To that end, he described an innovative and futuristic informa-tion storage and retrieval apparatus – the memex – which was constructed with technology wholly existing in 1945 and aimed at increasing the human capacity tostore and retrieve connected pieces of knowledge by mimicking our ability to createrandom associative links.
The memex was essentially a desk with the ability to produce and store a massivequantity of photographic copies of documented information. In addition to its hugestorage capacity, the memex could keep track of links between parts of different docu-ments. In this way, the stored information would resemble a vast interconnectedmesh of data, similar to how many perceive information is stored in the humanbrain. In the context of scientific literature, where it is often very difficult to keeptrack of the origins and interrelations of the ever-growing body of research, a devicewhich explicitly stored that information would be an invaluable asset.
We have already discussed some of the contributions of ‘disciples’ of Bush’s vision– Douglas Engelbart and Alan Kay. One other follower was equally influenced by theideas behind the memex, though his dreams have not yet materialized to the extentof Engelbart’s and Kay’s. Ted Nelson was another graduate student/dropout whoseresearch agenda was forever transformed by the advent of the computer. An unsuc-cessful attempt to create a machine language equivalent of the memex on early 1960scomputer hardware led Nelson on a lifelong quest to produce Xanadu, a potentiallyrevolutionary worldwide publishing and information retrieval system based on theidea of interconnected, non-linear text and other media forms. A traditional paper isread from beginning to end, in a linear fashion. But within that text, there are oftenideas or footnotes that urge the reader to digress into a richer topic. The linear for-mat for information does not provide much support for this random and associatedbrowsing task. What Bush’s memex suggested was to preserve the non-linear brows-ing structure in the actual documentation. Nelson coined the phrase hypertext in themid-1960s to reflect this non-linear text structure.
It was nearly two decades after Nelson coined the term that the first hypertext sys-tems came into commercial use. In order to reflect the use of such non-linear andassociative linking schemes for more than just the storage and retrieval of textualinformation, the term hypermedia (or multimedia) is used for non-linear storage ofall forms of electronic media. We will discuss these systems in Part 4 of this book (seeChapter 21). Most of the riches won with the success of hypertext and hypermediawere not gained by Nelson, though his project Xanadu survives to this day.
4.2.10 Multi-modality
The majority of interactive systems still use the traditional keyboard and a pointingdevice, such as a mouse, for input and are restricted to a color display screen withsome sound capabilities for output. Each of these input and output devices can be considered as communication channels for the system and they correspond to

4.2 Paradigms for interaction 177
certain human communication channels, as we saw in Chapter 1. A multi-modalinteractive system is a system that relies on the use of multiple human communica-tion channels. Each different channel for the user is referred to as a modality of inter-action. In this sense, all interactive systems can be considered multi-modal, forhumans have always used their visual and haptic (touch) channels in manipulatinga computer. In fact, we often use our audio channel to hear whether the computer isactually running properly.
However, genuine multi-modal systems rely to a greater extent on simultaneoususe of multiple communication channels for both input and output. Humans quitenaturally process information by simultaneous use of different channels. We pointto someone and refer to them as ‘you’, and it is only by interpreting the simultan-eous use of voice and touch that our directions are easily articulated and understood.Designers have wanted to mimic this flexibility in both articulation and observationby extending the input and output expressions an interactive system will support. So, for example, we can modify a gesture made with a pointing device by speaking,indicating what operation is to be performed on the selected object.
Multi-modal, multimedia and virtual reality systems form a large core of currentresearch in interactive system design. These are discussed in more detail in Chapters10, 20 and 21.
4.2.11 Computer-supported cooperative work
Another development in computing in the 1960s was the establishment of the firstcomputer networks which allowed communication between separate machines.Personal computing was all about providing individuals with enough computingpower so that they were liberated from dumb terminals which operated on a time-sharing system. It is interesting to note that as computer networks becamewidespread, individuals retained their powerful workstations but now wanted toreconnect themselves to the rest of the workstations in their immediate workingenvironment, and even throughout the world! One result of this reconnection was the emergence of collaboration between individuals via the computer – calledcomputer-supported cooperative work, or CSCW.
The main distinction between CSCW systems and interactive systems designed for a single user is that designers can no longer neglect the society within which anysingle user operates. CSCW systems are built to allow interaction between humans viathe computer and so the needs of the many must be represented in the one product.A fine example of a CSCW system is electronic mail – email – yet another metaphorby which individuals at physically separate locations can communicate via electronicmessages which work in a similar way to conventional postal systems. One user cancompose a message and ‘post’ it to another user (specified by his electronic mailaddress). When the message arrives at the remote user’s site, he is informed that anew message has arrived in his ‘mailbox’. He can then read the message and respondas desired. Although email is modeled after conventional postal systems, its majoradvantage is that it is often much faster than the traditional system (jokingly referred

178 Chapter 4 n Paradigms
to by email devotees as ‘snail mail’). Communication turnarounds between sitesacross the world are in the order of minutes, as opposed to weeks.
Electronic mail is an instance of an asynchronous CSCW system because the par-ticipants in the electronic exchange do not have to be working at the same time inorder for the mail to be delivered. The reason we use email is precisely because of its asynchronous characteristics. All we need to know is that the recipient will eventually receive the message. In contrast, it might be desirable for synchronouscommunication, which would require the simultaneous participation of sender andrecipient, as in a phone conversation.
CSCW is a major emerging topic in current HCI research, and so we devote muchmore attention to it later in this book. CSCW systems built to support users work-ing in groups are referred to as groupware. Chapter 19 discusses groupware systemsin depth. In Chapter 14 the more general issues and theories arising from CSCW arediscussed.
4.2.12 The world wide webProbably the most significant recent development in interactive computing is theworld wide web, often referred to as just the web, or WWW. The web is built on top of the internet, and offers an easy to use, predominantly graphical interface to information, hiding the underlying complexities of transmission protocols,addresses and remote access to data.
The internet (see Section 2.9) is simply a collection of computers, each linked by any sort of data connection, whether it be slow telephone line and modem orhigh-bandwidth optical connection. The computers of the internet all communic-ate using common data transmission protocols (TCP/IP) and addressing systems (IP addresses and domain names). This makes it possible for anyone to read anythingfrom anywhere, in theory, if it conforms to the protocol. The web builds on this withits own layer of network protocol (http), a standard markup notation (such asHTML) for laying out pages of information and a global naming scheme (uniformresource locators or URLs). Web pages can contain text, color images, movies, soundand, most important, hypertext links to other web pages. Hypermedia documentscan therefore be ‘published’ by anyone who has access to a computer connected tothe internet.
The world wide web project was conceived in 1989 by Tim Berners-Lee, work-ing at CERN, the European Particle Physics Laboratory at Geneva, as a means toenable the widespread distribution of scientific data generated at CERN and to shareinformation between physicists worldwide. In 1991 the first text-based web browserwas released. This was followed in early 1993 by several graphical web browsers, most significantly Mosaic developed by Marc Andreesen at the National Center forSupercomputer Applications (NCSA) at Champaign, Illinois. This was the definingmoment at which the meteoric growth of the web began, rapidly growing to domin-ate internet traffic and change the public view of computing. Of all the ‘heroes’ ofinteractive computing named in this chapter, it is only Berners-Lee who has achievedwidespread public fame.
4.2 Paradigms for interaction 179
Whilst the internet has been around since 1969, it did not become a major para-digm for interaction until the advent and ease of availability of well-designed graphicalinterfaces (browsers) for the web. These browsers allow users to access multimediainformation easily, using only a mouse to point and click. This shift towards the integ-ration of computation and communication is transparent to users; all they realize isthat they can get the current version of published information practically instantly.In addition, the language used to create these multimedia documents is relativelysimple, opening the opportunity of publishing information to any literate, and con-nected, person. However, there are important limitations of the web as a hypertextmedium and in Chapter 21 we discuss some of the special design issues for the web.Interestingly, the web did not provide any technological breakthroughs; all therequired functionality previously existed, such as transmission protocols, distributedfile systems, hypertext and so on. The impact has been due to the ease of use of both thebrowsers and HTML, and the fact that critical mass (see Chapter 13) was established,first in academic circles, and then rapidly expanded into the leisure and businessdomains. The burgeoning interest led to service providers, those providing connec-tions to the internet, to make it cheap to connect, and a whole new subculture was born.
Currently, the web is one of the major reasons that new users are connecting tothe internet (probably even buying computers in the first place), and is rapidlybecoming a major activity for people both at work and for leisure. It is much more a social phenomenon than anything else, with users attracted to the idea that com-puters are now boxes that connect them with interesting people and exciting placesto go, rather than soulless cases that deny social contact. Computing often used to beseen as an anti-social activity; the web has challenged this by offering a ‘global village’with free access to information and a virtual social environment. Web culture hasemphasized liberality and (at least in principle) equality regardless of gender, raceand disability. In practice, the demographics of web users are only now coming closeto equal proportions in terms of gender, and, although internet use is increasingglobally, the vast majority of websites are still hosted in the United States. Indeed, theweb is now big business; corporate images and e-commerce may soon dominate theindividual and often zany aspects of the web.
4.2.13 Agent-based interfacesIn the human world agents are people who work on someone’s behalf: estate agentsbuy and sell property for their customers, literary agents find publishers for authors,travel agents book hotels and air tickets for tourists and secret agents obtain infor-mation (secretly) for their governments. Software agents likewise act on behalf ofusers within the electronic world. Examples include email agents which filter yourmail for you and web crawlers which search the world wide web for documents youmight find interesting. Agents can perform repetitive tasks, watch and respond toevents when the user is not present and even learn from the user’s own actions.
Some agents simply do what they are told. For example, many email systems allowyou to specify filters, simple if then rules, which determine the action to perform oncertain kinds of mail message:

180 Chapter 4 n Paradigms
If Sender: is bank managerThen Urgency: is high
A major problem with such agents is developing a suitable language between humanand agent which allows the user to express intentions. This is especially importantwhen the agent is going to act in the user’s absence. In this case, the user may notreceive feedback of any mistake until long after the effects have become irreversible;hence the instructions have to be correct, and believed to be correct.
Other agents use artificial intelligence techniques to learn based on the user’sactions. An early example of this was Eager [83]. Eager watches users while they workon simple HyperCard applications. When it notices that the user is repeating similaractions a small icon appears (a smiling cat!), suggesting the next action. The user isfree either to accept the suggestion or to ignore it. When the user is satisfied thatEager knows what it is doing, it can be instructed to perform all the remainingactions in a sequence.
Eager is also an example of an agent, which has a clear embodiment, that is, thereis a representation of Eager (the cat icon) in the interface. In contrast, considerMicrosoft Excel which incorporates some intelligence in its sum (Σ) function. If thecurrent cell is directly below a column of numbers, or if there is a series of numbersto the left of the current cell, the sum range defaults to be the appropriate cells. It isalso clever about columns of numbers with subtotals so that they are not includedtwice in the overall total. As around 80% of all spreadsheet formulae are simple sumsthis is a very useful feature. However, the intelligence in this is not embodied, it is diffuse, somewhere in ‘the system’. Although embodiment is not essential to anagent-based system it is one of the key features which enable users to determinewhere autonomy and intelligence may lie, and also which parts are stable [107].
We have already discussed the relationship between language and actionparadigms in human–computer interaction. To some extent agent-based systemsinclude aspects of both. Old command-based systems acted as intermediaries: youasked them to do something, they did what you wanted (if you were lucky), and thenreported the results back to you. In contrast, direct manipulation emphasizes theuser’s own actions, possibly augmented by tools, on the electronic world. Agents acton the user’s behalf, possibly, but not necessarily, instructed in a linguistic fashion.But unlike the original intermediary paradigm, an agent is typically acting within aworld the user could also act upon. The difference is rather like that between a tradi-tional shopkeeper who brings items to you as opposed to a shop assistant in a super-market who helps you as you browse amongst the aisles. The latter does not preventyou from selecting your own items from the shelves, but aids you when asked.
In fact, the proponents of direct manipulation and agent-based systems do not seethe paradigms as being quite as complementary as we have described them above.Although amicable, the positions on each side are quite entrenched.
4.2.14 Ubiquitous computing
Where does computing happen, and more importantly, where do we as users go tointeract with a computer? The past 50 years of interactive computing show that we
4.2 Paradigms for interaction 181
still think of computers as being confined to a box on a desk or in an office or lab.The actual form of the physical interface has been transformed from a noisy teletypeterminal to a large, graphical display with a WIMP or natural language interface, butin all cases the user knows where the computer is and must walk over to it to begininteracting with it.
In the late 1980s, a group of researchers at Xerox PARC, led by Mark Weiser, ini-tiated a research program with the goal of moving human–computer interactionaway from the desktop and out into our everyday lives. Weiser observed:
The most profound technologies are those that disappear. They weave themselves intothe fabric of everyday life until they are indistinguishable from it.
These words have inspired a new generation of researchers in the area of ubiquitouscomputing [369, 370]. Another popular term for this emerging paradigm is pervasivecomputing, first coined by IBM. The intention is to create a computing infrastruc-ture that permeates our physical environment so much that we do not notice thecomputer any longer. A good analogy for the vision of ubiquitous computing is theelectric motor. When the electric motor was first introduced, it was large, loud andvery noticeable. Today, the average household contains so many electric motors that we hardly ever notice them anymore. Their utility led to ubiquity and, hence,invisibility.
How long in the future will it be before we no longer notice the interactive com-puter? To some extent, this is already happening, since many everyday items, such aswatches, microwaves or automobiles, contain many microprocessors that we don’tdirectly notice. But, to a large extent, the vision of Weiser, in which the computer ishardly ever noticed, is a long way off.
To pursue the analogy with the electric motor a little further, one of the motor’scharacteristics is that it comes in many sizes. Each size is suited to a particular use.Weiser thought that it was also important to think of computing technology in dif-ferent sizes. The original work at PARC looked at three different scales of comput-ing: the yard, the foot and the inch. In the middle of the scale, a foot-sized computeris much like the personal computers we are familiar with today. Its size is suitable forevery individual to have one, perhaps on their desk or perhaps in their bedroom or in their briefcase. A yard-sized computer, on the other hand, is so large that itwould be suitable for wide open public spaces, and would be shared by a group ofpeople. Perhaps there would be one of these in every home, or in a public hallway orauditorium. On the opposite side of the scale, an inch-sized computer would be a truly personal computing device that could fit in the palm of a hand. Everyonewould have a number of these at their disposal, and they would be as prevalent andunremarkable as a pen or a pad of sticky notes.
There is an increasing number of examples of computing devices at these differ-ent scales. At the foot scale, laptop computers are, of course, everywhere, but moreinteresting examples of computing at this scale are commercially available tabletcomputers or research prototypes, such as an interactive storybook (see Figure 4.1).At the yard scale, there are various forms of high-resolution large screens and pro-jected displays as we discussed in Chapter 2 (Section 2.4.3). These are still mainlyused as output-only devices showing presentations or fixed messages, but there is

182 Chapter 4 n Paradigms
increasing use of more interactive shared public displays, such as the StanfordInteractive Mural shown in Figure 4.2. At the inch scale, there are many examples,from powerful, pocket-sized personal organizers or personal digital assistants (PDAs)to even smaller cellular phones or pagers, and many pocket electronic devices suchas electronic dictionaries and translators (see Figure 4.3). There are even badgeswhose position can be automatically tracked.
Figure 4.1 Examples of computing devices at the foot scale. On the left is a tabletcomputer – a Tablet PC from MotionComputing (Source: Motion Computing, Inc.).On the right is a research prototype, the Listen Reader, an interactive storybookdeveloped at Palo Alto Research Center (picture courtesy Palo Alto Research Center)
Figure 4.2 The Stanford Interactive Mural, an example of a yard-scale interactivedisplay surface created by tiling multiple lower-resolution projectors. Picture courtesyFrançois Guimbretière

4.2 Paradigms for interaction 183
Figure 4.3 Example inch-scale devices. From left to right, a PDA, a mobile phone and pocket-sizedelectronic bible. Source: Top left photograph by Alan Dix (Palm Pilot Series V), bottom left photograph byAlan Dix with permission from Franklin Electronic Publishers, photograph right by Alan Dix (Ericsson phone)

184 Chapter 4 n Paradigms
This influx of diverse computing devices represents the third wave of computing, in which the ratio of computers to human drastically changes. In the first wave ofcomputing, one large mainframe computer served many people. In the second wave,the PC revolution, computing devices roughly equalled the number of people usingthem. In the third wave, the devices far outnumber the people. It is precisely becauseof the large ratio of devices to people that Weiser and others note the importance ofminimizing the attention demands of any single device.
Many different technologies are converging to make the dream of ubiquitouscomputing possible. These technologies include wireless networking, voice recogni-tion, camera and vision systems, pen-based computing and positioning systems, to name a few. What all of these technologies provide is the ability to move the computer user away from a desktop, allow interaction in a number of modes (voice,gesture, handwriting) in addition to a keyboard, and make information about theuser (through vision, speech recognition or positioning information) available to acomputational device that may be far removed from the actual user.
Ubiquitous computing is not simply about nifty gadgets, it is what can be done with those gadgets. As Weiser pointed out, it is the applications that makeubiquitous computing revolutionary. In Chapter 20, we discuss some examples ofthe applications that ubiquitous computing makes possible, including the way this is becoming part of everyday life in places as diverse as the home, the car and evenour own bodies. The vision of ubiquitous computing – first expressed by Weiser andgrounded in experimental work done at Xerox PARC – is now starting to becomereality.
4.2.15 Sensor-based and context-aware interaction
The yard-scale, foot-scale and inch-scale computers are all still clearly embodieddevices with which we interact, whether or not we consider them ‘computers’. Thereare an increasing number of proposed and existing technologies that embed com-putation even deeper, but unobtrusively, into day-to-day life. Weiser’s dream wascomputers that ‘permeate our physical environment so much that we do not noticethe computers anymore’, and the term ubiquitous computing encompasses a widerange from mobile devices to more pervasive environments.
We can consider the extreme situation in which the user is totally unaware ofinteraction taking place. Information can be gathered from sensors in the environ-ment (pressure mats, ultrasonic movement detectors, weight sensors, video cam-eras), in our information world (web pages visited, times online, books purchasedonline), and even from our own bodies (heart rate, skin temperature, brain signals).This information is then used by systems that make inferences about our past patterns and current context in order to modify the explicit interfaces we deal with(e.g., modify default menu options) or to do things in the background (e.g., adjustthe air conditioning).
We already encounter examples of this: lights that turn on when we enter a room,suggestions made for additional purchases at online bookstores, automatic doors
4.3 Summary 185
and washbasins. For elderly and disabled people, assistive technologies alreadyembody quite radical aspects of this. However, the vision of many is a world in whichthe whole environment is empowered to sense and even understand the context ofactivities within it.
Previous interactive computation has focussed on the user explicitly telling thecomputer exactly what to do and the computer doing what it is told. In context-awarecomputing the interaction is more implicit. The computer, or more accurately thesensor-enhanced environment, is using heuristics and other semi-intelligent meansto predict what would be useful for the user. The data used for this inference and theinference itself are both fuzzy, probabilistic and uncertain. Automatically sensingcontext is, and will likely always remain, an imperfect activity, so it is important thatthe actions resulting from these ‘intelligent’ predictions be made with caution.Context-aware applications should follow the principles of appropriate intelligence:
1. Be right as often as possible, and useful when acting on these correct predictions.2. Do not cause inordinate problems in the event of an action resulting from a
wrong prediction.
The failure of ‘intelligent’ systems in the past resulted from following the first principle, but not the second. These new applications, which impinge so closely onour everyday lives, demand that the second principle of appropriate intelligence isupheld. (There is more on using intelligence in interfaces on the book website at/e3/online/intelligence/)
Arguably this is a more radical paradigm shift than any other since the introduc-tion of interactive computing itself. Whereas ubiquitous computing challenges theidea of where computers are and how apparent they are to us, context-aware com-puting challenges what it means to interact with a computer. It is as if we have come full circle from the early days of computing. Large mainframes were placed in isolation from the principle users (programmers) and interaction was usuallydone through an intermediary operator. Half a century later, the implicit nature ofinteraction implied by sensing creates a human–computer relationship that becomesso seamless there is no conscious interaction at all.
This shift is so radical that one could even say it does not belong in this chapterabout paradigms for interaction! In fact, this shift is so dramatic that it is unclearwhether the basic models of interaction that have proved universal across techno-logies, for example Norman’s execution–evaluation cycle (Chapter 3, Section 3.2.2),are applicable at all. We will return to this issue in Chapter 18.
SUMMARY
In this chapter, we have discussed paradigms that promote the usability of inter-active systems. We have seen that the history of computing is full of examples of creative insight into how the interaction between humans and computers can be
4.3

186 Chapter 4 n Paradigms
enhanced. While we expect never to replace the input of creativity in interactive system design, we still want to maximize the benefit of one good idea by repeating itsbenefit in many other designs. The problem with these paradigms is that they arerarely well defined. It is not always clear how they support a user in accomplishingsome tasks. As a result, it is entirely possible that repeated use of some paradigm willnot result in the design of a more usable system. The derivation of principles and theoretical models for interaction has often arisen out of a need to explain why a paradigm is successful and when it might not be. Principles can provide therepeatability that paradigms in themselves cannot provide. However, in definingthese principles, it is all too easy to provide general and abstract definitions that arenot very helpful to the designer. Therefore, the future of interactive system designrelies on a complementary approach. The creativity that gives rise to new paradigmsshould be strengthened by the development of a theory that provides principles tosupport the paradigm in its repeated application. We will consider such principlesand design rules in detail in Chapter 7 and more theoretical perspectives in Part 3.
EXERCISES
4.1. Choose one of the people mentioned in this chapter, or another important figure inthe history of HCI, and create a web page biography on them. Try to get at least one picture ofyour subject, and find out about their life and work, with particular reference to their contribu-tion to HCI.
4.2. Choose one paradigm of interaction and find three specific examples of it, not included in thischapter. Compare these three – can you identify any general principles of interaction that areembodied in each of your examples (see Chapter 7 for example principles)?
4.3. What new paradigms do you think may be significant in the future of interactive computing?
4.4. A truly ubiquitous computing experience would require the spread of computational capabilitiesliterally everywhere. Another way to achieve ubiquity is to carry all of your computational needswith you everywhere, all the time. The field of wearable computing explores this interactionparadigm. How do you think the first-person emphasis of wearable computing compares with thethird-person, or environmental, emphasis of ubiquitous computing? What impact would there beon context-aware computing if all of the sensors were attached to the individual instead of embed-ded in the environment?

Recommended reading 187
RECOMMENDED READING
H. Rheingold, Tools for Thought, Prentice Hall, 1985.An easy to read history of computing, with particular emphasis on developmentsin interactive systems. Much of the historical perspective of this chapter wasinfluenced by this book.
T. Berners-Lee, Weaving the Web: The Original Design and Ultimate Destiny of theWorld Wide Web, Harper, 2000.The history of the world wide web as told by its inventor Tim Berners-Lee makesinteresting and enlightening reading.
M. M. Waldrop, The Dream Machine: J.C.R. Licklider and the Revolution That MadeComputing Personal, Penguin, 2002.A readable biography of Licklider and his pioneering work in making computingavailable to all.
T. Bardini, Bootstrapping: Douglas Englebart, Coevolution and the Origins of PersonalComputing (Writing Science), Stanford University Press, 2000.Biography of another great pioneer of interactive computing, Doug Engelbart andhis work at Stanford.
J. M. Nyce and P. Kahn, editors, and V. Bush, From Memex to Hypertext: VannevarBush and the Mind’s Machine, Academic Press, 1992.An edited collection of Bush’s writing about Memex, together with essays fromcomputing historians.
M. Weiser, Some computer science issues in ubiquitous computing, Communica-tions of the ACM, Vol. 36, No. 7, pp. 75–84, July 1993.Classic article on issues relating to ubiquitous computing, including hardware,interaction software, networks, applications and methods.
A. Dix, T. Rodden, N. Davies, J. Trevor, A. Friday and K. Palfreyman, Exploitingspace and location as a design framework for interactive mobile systems, ACMTransactions on Computer–Human Interaction (TOCHI), Vol. 7, No. 3, pp. 285–321, September 2000.Explores the space of context sensitive designs focussed especially on location.
There are also a number of special journal issues on ubiquitous, sensor-based andcontext-aware computing in ACM TOCHI, Human–Computer Interaction and Com-munications of the ACM and dedicated journals such as IEEE Pervasive and PersonalTechnologies Journal.


DESIGN PROCESS
In this part, we concentrate on how design practiceaddresses the critical feature of an interactive system –usability from the human perspective. The chapters in this part promote the purposeful design of more usableinteractive systems. We begin in Chapter 5 by introducingthe key elements in the interaction design process. Theseelements are then expanded in later chapters.
Chapter 6 discusses the design process in more detail,specifically focussing on the place of user-centered designwithin a software engineering framework. Chapter 7 high-lights the range of design rules that can help us to specifyusable interactive systems, including abstract principles,guidelines and other design representations.
In Chapter 8, we provide an overview of implementa-tion support for the programmer of an interactive system.Chapter 9 is concerned with the techniques used to evalu-ate the interactive system to see if it satisfies user needs.Chapter 10 discusses how to design a system to be univer-sally accessible, regardless of age, gender, cultural backgroundor ability. In Chapter 11 we discuss the provision of usersupport in the form of help systems and documentation.
P A R T
2


INTERACTION DESIGN
BASICS
OV E RV I E W
Interaction design is about creating interventions in oftencomplex situations using technology of many kinds including PCsoftware, the web and physical devices.
n Design involves:– achieving goals within constraints and trade-off between
these– understanding the raw materials: computer and human– accepting limitations of humans and of design.
n The design process has several stages and is iterative andnever complete.
n Interaction starts with getting to know the users and theircontext:– finding out who they are and what they are like . . .
probably not like you!– talking to them, watching them.
n Scenarios are rich design stories, which can be used andreused throughout design:– they help us see what users will want to do– they give a step-by-step walkthrough of users’ interactions:
including what they see, do and are thinking.
n Users need to find their way around a system. This involves:– helping users know where they are, where they have been
and what they can do next– creating overall structures that are easy to understand and
fit the users’ needs– designing comprehensible screens and control panels.
n Complexity of design means we don’t get it right first time:– so we need iteration and prototypes to try out and
evaluate– but iteration can get trapped in local maxima, designs that
have no simple improvements, but are not good– theory and models can help give good start points.
5

192 Chapter 5 n Interaction design basics
INTRODUCTION
Some of HCI is focussed on understanding: the academic study of the way peopleinteract with technology. However, a large part of HCI is about doing things andmaking things – design.
In this chapter we will think about interaction design. Note that we are not justthinking about the design of interactive systems, but about the interaction itself. An office has just got a new electric stapler. It is connected to the mains electricityand is hard to move around, so when you want to staple papers together you go to the stapler. In the past when someone wanted to staple things they would take the stapler to their desk and keep it until someone else wanted it. You might write aletter, print it, staple it, write the next letter, staple it, and so on. Now you have totake the letters to be stapled across the office, so instead you write–print, write–printuntil you have a pile of things to staple and then take them across. The staplerinfluences the whole pattern of interaction.
So, interaction design is not just about the artifact that is produced, whether a physical device or a computer program, but about understanding and choosinghow that is going to affect the way people work. Furthermore, the artifacts we give topeople are not just these devices and programs, but also manuals, tutorials, onlinehelp systems. In some cases we may realize that no additional system is required atall, we may simply suggest a different way of using existing tools.
Because of this it may be better not to think of designing a system, or an artifact,but to think instead about designing interventions. The product of a design exercise is that we intervene to change the situation as it is; we hope, of course, changing itfor the better!
In the next section we will ask ‘what is design?’ which sets the spirit for the rest ofthe chapter. Section 5.3 looks at the design process as a whole and this gives a frame-work for the following sections. Section 5.4 looks at aspects of the requirements-gathering phase of design focussed on getting to know and understand the user. This is followed in Section 5.5 by a look at scenarios, which are a way of recordingexisting situations and examining proposed designs. We then look at the details ofdesigning the overall application structure in Section 5.6 and individual screendesign in Section 5.7. Because design is never perfect first time (or ever!), most inter-action design involves several cycles of prototyping and evaluation. The chapter endswith an examination of the limits of this and why this emphasizes the importance ofdeep knowledge of more general theories and models of interaction.
This chapter also functions as an introduction to much of Part 2 and Part 3 of thisbook. In particular, Section 5.3 puts many of the succeeding chapters into the con-text of the overall design process. Many of the individual sections of this chapter giveearly views, or simple techniques, for issues and areas dealt with in detail later in thebook.
5.1
5.2 What is design? 193
WHAT IS DESIGN?
So what is design? A simple definition is:
achieving goals within constraints
This does not capture everything about design, but helps to focus us on certainthings:
Goals What is the purpose of the design we are intending to produce? Who is itfor? Why do they want it? For example, if we are designing a wireless personalmovie player, we may think about young affluent users wanting to watch the lat-est movies whilst on the move and download free copies, and perhaps wanting toshare the experience with a few friends.
Constraints What materials must we use? What standards must we adopt? Howmuch can it cost? How much time do we have to develop it? Are there health andsafety issues? In the case of the personal movie player: does it have to withstandrain? Must we use existing video standards to download movies? Do we need tobuild in copyright protection?
Of course, we cannot always achieve all our goals within the constraints. So perhapsone of the most important things about design is:
Trade-off Choosing which goals or constraints can be relaxed so that others can bemet. For example, we might find that an eye-mounted video display, a bit likethose used in virtual reality, would give the most stable image whilst walkingalong. However, this would not allow you to show friends, and might be danger-ous if you were watching a gripping part of the movie as you crossed the road.
Often the most exciting moments in design are when you get a radically differentidea that allows you to satisfy several apparently contradictory constraints. However,the more common skill needed in design is to accept the conflict and choose themost appropriate trade-off. The temptation is to focus on one or other goal and opti-mize for this, then tweak the design to make it just satisfy the constraints and othergoals. Instead, the best designs are where the designer understands the trade-offs andthe factors affecting them. Paradoxically, if you focus on the trade-off itself the moreradical solutions also become more apparent.
5.2.1 The golden rule of design
Part of the understanding we need is about the circumstances and context of the par-ticular design problem. We will return to this later in the chapter. However, there arealso more generic concepts to understand. The designs we produce may be different,but often the raw materials are the same. This leads us to the golden rule of design:
understand your materials
5.2

194 Chapter 5 n Interaction design basics
In the case of a physical design this is obvious. Look at a chair with a steel frame andone with a wooden frame. They are very different: often the steel frames are tubularor thin L or H section steel. In contrast wooden chairs have thicker solid legs. If youmade a wooden chair using the design for a metal one it would break; if you madethe metal one in the design for the wooden one it would be too heavy to move.
For Human–Computer Interaction the obvious materials are the human and thecomputer. That is we must:
n understand computers– limitations, capacities, tools, platforms
n understand people– psychological, social aspects, human error.
Of course, this is exactly the focus of Chapters 1 and 2. This is why they came first;we must understand the fundamental materials of human–computer interaction inorder to design. In Chapters 3 and 4 we also looked at the nature of interaction itself.This is equally important in other design areas. For example, the way you fit seatsand windows into an airplane’s hull affects the safety and strength of the aircraft asa whole.
5.2.2 To err is human
It might sound demeaning to regard people as ‘materials’, possibly even dehumaniz-ing. In fact, the opposite is the case: physical materials are treated better in mostdesigns than people. This is particularly obvious when it comes to failures.
The news headlines: an aircrash claims a hundred lives; an industrial accidentcauses millions of pounds’ worth of damage; the discovery of systematic mistreat-ment leads to thousands of patients being recalled to hospital. Some months later thepublic inquiries conclude: human error in the operation of technical instruments.The phrase ‘human error’ is taken to mean ‘operator error’, but more often than not the disaster is inherent in the design or installation of the human interface. Badinterfaces are slow or error-prone to use. Bad interfaces cost money and cost lives.
People make mistakes. This is not ‘human error’, an excuse to hide behind in accident reports, it is human nature. We are not infallible consistent creatures, but often make slips, errors and omissions. A concrete lintel breaks and a buildingcollapses. Do the headlines read ‘lintel error’? No. It is the nature of concrete lintelsto break if they are put under stress and it is the responsibility of architect and engi-neer to ensure that a building only puts acceptable stress on the lintel. Similarly it isthe nature of humans to make mistakes, and systems should be designed to reducethe likelihood of those mistakes and to minimize the consequences when mistakeshappen.
Often when an aspect of an interface is obscure and unclear, the response is to addanother line in the manual. People are remarkably adaptable and, unlike concretelintels, can get ‘stronger’, but better training and documentation (although necessary)are not a panacea. Under stress, arcane or inconsistent interfaces will lead to errors.

5.3 The process of design 195
If you design using a physical material, you need to understand how and wherefailures would occur and strengthen the construction, build in safety features or redundancy. Similarly, if you treat the human with as much consideration as apiece of steel or concrete, it is obvious that you need to understand the way humanfailures occur and build the rest of the interface accordingly.
5.2.3 The central message – the user
In this book you will find information on basic psychology, on particular techno-logies, on methods and models. However, there is one factor that outweighs all this knowledge. It is about attitude. Often it is said that the success of the variousmethods used in HCI lies not in how good they are, but in that they simply focus themind of the designer on the user.
This is the core of interaction design: put the user first, keep the user in the centerand remember the user at the end.
THE PROCESS OF DESIGN
Often HCI professionals complain that they are called in too late. A system has beendesigned and built, and only when it proves unusable do they think to ask how to doit right! In other companies usability is seen as equivalent to testing – checkingwhether people can use it and fixing problems, rather than making sure they canfrom the beginning. In the best companies, however, usability is designed in from the start.
In Chapter 6 we will look in detail at the software development process and howHCI fits within it. Here we’ll take a simplified view of four main phases plus an iteration loop, focussed on the design of interaction (Figure 5.1).
5.3
Figure 5.1 Interaction design process

196 Chapter 5 n Interaction design basics
Requirements – what is wanted The first stage is establishing what exactly isneeded. As a precursor to this it is usually necessary to find out what is currentlyhappening. For example, how do people currently watch movies? What sort ofpersonal appliances do they currently use?
There are a number of techniques used for this in HCI: interviewing people,videotaping them, looking at the documents and objects that they work with,observing them directly. We don’t have a chapter dedicated to this, but aspectswill be found in various places throughout the book. In particular, ethnography,a form of observation deriving from anthropology, has become very influentialand is discussed in Chapter 13. We will look at some ways of addressing this stagein Section 5.4.
Analysis The results of observation and interview need to be ordered in some wayto bring out key issues and communicate with later stages of design. Chapter 15and part of Chapter 18 deal with task models, which are a means to capture howpeople carry out the various tasks that are part of their work and life. In this chap-ter (Section 5.5), we will look at scenarios, rich stories of interaction, which canbe used in conjunction with a method like task analysis or on their own to recordand make vivid actual interaction. These techniques can be used both to representthe situation as it is and also the desired situation.
Design Well, this is all about design, but there is a central stage when you movefrom what you want, to how to do it. There are numerous rules, guidelines anddesign principles that can be used to help with this and Chapter 7 discusses thesein detail; whilst Chapter 10 looks at how to design taking into account many dif-ferent kinds of user. We need to record our design choices in some way and thereare various notations and methods to do this, including those used to record theexisting situation. Chapters 16, 17 and 18 deal with ways of modeling and describ-ing interaction. In this chapter, Section 5.6 will look at some simple notations for designing navigation within a system and some basic heuristics to guide thedesign of that navigation. Section 5.7 will look more closely at the layout of indi-vidual screens. It is at this stage also where input from theoretical work is mosthelpful, including cognitive models, organizational issues and understandingcommunication (Chapters 12, 13 and 14).
Iteration and prototyping Humans are complex and we cannot expect to getdesigns right first time. We therefore need to evaluate a design to see how well it is working and where there can be improvements. We will discuss some techniques for evaluation in Chapter 9. Some forms of evaluation can be doneusing the design on paper, but it is hard to get real feedback without trying it out. Most user interface design therefore involves some form of prototyping, producing early versions of systems to try out with real users. We’ll discuss this in Section 5.8.
Implementation and deployment Finally, when we are happy with our design, we need to create it and deploy it. This will involve writing code, perhaps makinghardware, writing documentation and manuals – everything that goes into a real

5.4 User focus 197
system that can be given to others. Chapter 8 will deal with software architec-tures for user interfaces and there are details about implementing groupware inChapter 19 and web interfaces in Chapter 21.
If you read all the chapters and look at all the techniques you might think ‘help! how can I ever do all this?’. Of course the answer is you can’t. Your time is limited – there is a trade-off between the length of the design period and the quality of the final design. This means one sometimes has to accept a design as finaleven if it is not perfect: it is often better to have a product that is acceptable but ontime and to cost than it is to have one that has perfect interaction but is late and over budget.
It is easy to think that the goal, especially of the iterative stages, is to find usabilityproblems and fix them. As you experience real designs, however, you soon find thatthe real problem is not to find faults – that is easy; nor to work out how to fix them– that may not be too difficult; instead the issue is: which usability problems is itworth fixing?
In fact, if you ever come across a system that seems to be perfect it is a badlydesigned system – badly designed not because the design is bad, but because toomuch effort will have been spent in the design process itself. Just as with all trade-offs, it may be possible to find radically different solutions that have a major effectbut are cheap to implement. However, it is best not to plan assuming such bolts ofinspiration will strike when wanted!
USER FOCUS
As we’ve already said, the start of any interaction design exercise must be theintended user or users. This is often stated as:
know your users
Because this sounds somewhat like a commandment it is sometimes even written‘know thy user’ (and originally ‘know the user’ [162]). Note, too, a little indecisionabout user/users – much of traditional user interface design has focussed on a singleuser. We will discuss issues of collaboration extensively in Chapters 13 and 19, buteven at this stage it is important to be aware that there is rarely one user of a system.This doesn’t mean that every system is explicitly supporting collaboration like emaildoes. However, almost every system has an impact beyond the person immediatelyusing it.
Think about a stock control system. The warehouse manager queries the systemto find out how many six-inch nails are in stock – just a single user? Why did he dothis? Perhaps a salesperson has been asked to deliver 100,000 six-inch nails within afortnight and wants to know if the company is able to fulfill the order in time. So theact of looking at the stock control system involves the warehouse manager, the sales-person and the client. The auditors want to produce a valuation of company assets
5.4
198 Chapter 5 n Interaction design basics
including stock in hand, the assistant warehouse manager needs to update the stocklevels while his boss is on holiday.
Over time many people are affected directly or indirectly by a system and thesepeople are called stakeholders (see also Chapter 13). Obviously, tracing the tenuouslinks between people could go on for ever and you need to draw boundaries as towhom you should consider. This depends very much on the nature of the systemsbeing designed, but largely requires plain common sense.
So, how do you get to know your users?
n Who are they?
Of course, the first thing to find out is who your users are. Are they young or old,experienced computer users or novices? As we saw with the stock control system, itmay not be obvious who the users are, so you may need to ask this question again asyou find out more about the system and its context. This question becomes harderto answer if you are designing generic software, such as a word processor, as there aremany different users with different purposes and characteristics. A similar problemarises with many websites where the potential visitors are far from homogenous. It may be tempting to try to think of a generic user with generic skills and genericgoals; however, it is probably better, either instead or in addition, to think of severalspecific users.
n Probably not like you!
When designing a system it is easy to design it as if you were the main user: youassume your own interests and abilities. So often you hear a designer say ‘but it’s obvious what to do’. It may be obvious for her! This is not helped by the fact that many software houses are primarily filled with male developers. Although individuals differ a lot there is a tendency for women to have better empathetic skills.
n Talk to them.
It is hard to get yourself inside someone else’s head, so the best thing is usually to ask them. This can take many forms: structured interviews about their job or life,open-ended discussions, or bringing the potential users fully into the design process.The last of these is called participatory design (see Chapter 13, Section 13.3.4). Byinvolving users throughout the design process it is possible to get a deep knowledgeof their work context and needs. The obvious effect of this is that it produces betterdesigns. However, there is a second motivational effect, perhaps at least as importantas the quality of the design. By being involved, users come to ‘own’ the design andbecome champions for it once deployed. Recall that a system must be not only use-ful and usable, but also used.
People may also be able to tell you about how things really happen, not just howthe organization says they should happen. To encourage users to tell you this, youwill need to win their trust, since often the actual practices run counter to corporatepolicy. However it is typically these ad hoc methods that make organizations work,not the official story!

5.4 User focus 199
n Watch them.
Although what people tell you is of the utmost importance, it is not the whole story.
When black-belt judo players are asked how they throw an opponent, their explana-tions do not match what they actually do. Think about walking – how do your legsand arms move? It is harder than you would think! Although people have run sincethe earliest times, it was only with Eadweard Muybridge’s pioneering time-lapsephotography in the 1870s that the way people actually walk, run and move becameclear (see Figure 5.2). This is even more problematic with intellectual activities as itis notoriously difficult to introspect.
A professional in any field is very practiced and can do things in the domain. Anacademic in the same field may not be able to do things, but she knows about thethings in the domain. These are different kinds of knowledge and skill. Sometimespeople know both, but not necessarily so. The best sports trainers may not be the bestathletes, the best painters may not be the best art critics.
Because of this it is important to watch what people do as well as hear what theysay. This may involve sitting and taking notes of how they spend a day, watching particular activities, using a video camera or tape recorder. It can be done in aninformal manner or using developed methods such as ethnography or contextualinquiry, which we will discuss in Chapter 13.
Sometimes users can be involved in this; for example, asking them to keep a diaryor having a 15-minute buzzer and asking them to write down what they are doingwhen the buzzer sounds. Although this sounds just like asking the users what theydo, the structured format helps them give a more accurate answer.
Another way to find out what people are doing is to look at the artifacts they areusing and creating. Look at a typical desk in an office. There are papers, letters, files,perhaps a stapler, a computer, sticky notes . . . Some of these carry information, butif they were only important for the information in them they could equally well be
Figure 5.2 Eadweard Muybridge’s time-lapse photography. Source for top plate and middle plate: Kingston Museum and Heritage Service; source for bottom plate:V&A Images, The Victoria and Albert Museum, London
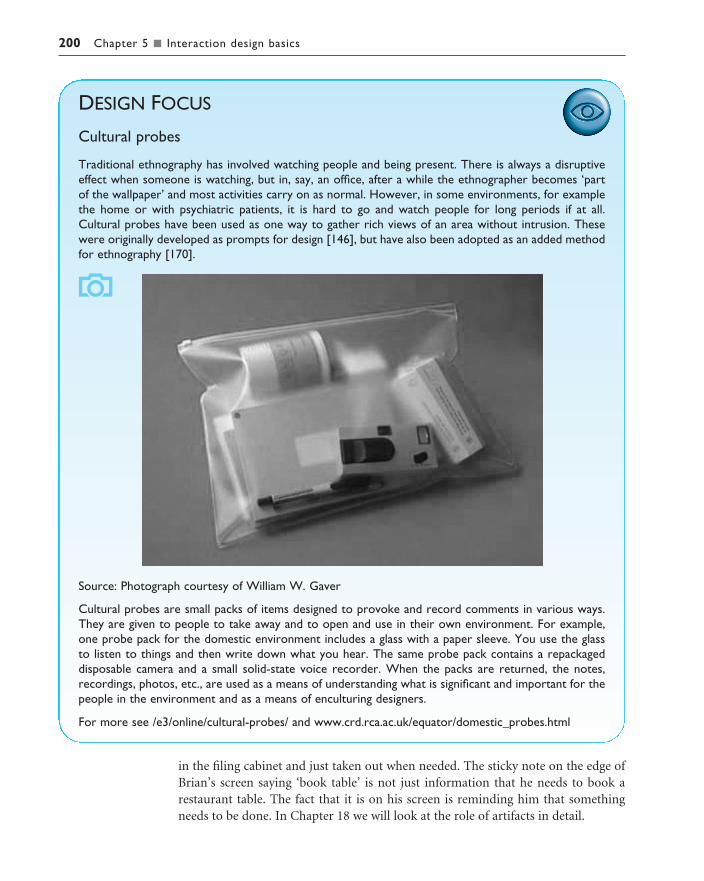
200 Chapter 5 n Interaction design basics
in the filing cabinet and just taken out when needed. The sticky note on the edge ofBrian’s screen saying ‘book table’ is not just information that he needs to book arestaurant table. The fact that it is on his screen is reminding him that somethingneeds to be done. In Chapter 18 we will look at the role of artifacts in detail.
DESIGN FOCUS
Cultural probes
Traditional ethnography has involved watching people and being present. There is always a disruptiveeffect when someone is watching, but in, say, an office, after a while the ethnographer becomes ‘partof the wallpaper’ and most activities carry on as normal. However, in some environments, for examplethe home or with psychiatric patients, it is hard to go and watch people for long periods if at all.Cultural probes have been used as one way to gather rich views of an area without intrusion. Thesewere originally developed as prompts for design [146], but have also been adopted as an added methodfor ethnography [170].
Source: Photograph courtesy of William W. Gaver
Cultural probes are small packs of items designed to provoke and record comments in various ways.They are given to people to take away and to open and use in their own environment. For example,one probe pack for the domestic environment includes a glass with a paper sleeve. You use the glassto listen to things and then write down what you hear. The same probe pack contains a repackageddisposable camera and a small solid-state voice recorder. When the packs are returned, the notes,recordings, photos, etc., are used as a means of understanding what is significant and important for thepeople in the environment and as a means of enculturing designers.
For more see /e3/online/cultural-probes/ and www.crd.rca.ac.uk/equator/domestic_probes.html

5.5 Scenarios 201
In all these observational methods one should not just stop at the observation, butgo back and discuss the observations with the users. Even if they were not previouslyaware of what they were doing, they are likely to be able to explain when shown. Theobservations tell you what they do, they will tell you why.
n Use your imagination.
Even if you would like to involve many users throughout your design exercise thiswill not always be possible. It may be too costly, it may be hard to get time with them(e.g. hospital consultant), it may be that there are just too many (e.g. the web).However, even if you cannot involve actual users you can at least try to imagine theirexperiences.
Now this is very dangerous! It would be easy to think, ‘if I were a warehouse man-ager I would do this’. The issue is not what you would do in the user’s shoes but whatthey would do. This requires almost a kind of method acting. Imagine being a ware-house manager. What does the word ‘undo’ in the menu mean to him?
One method that has been quite successful in helping design teams produce user-focussed designs is the persona. A persona is a rich picture of an imaginary personwho represents your core user group. Figure 5.3 gives an example persona of Bettythe warehouse manager. A design team will have several of these personae coveringdifferent types of intended users and different roles. The personae will themselves bebased on studies of actual users, observation, etc. When a design solution is proposedthe team can ask, ‘how would Betty react to this?’. The detail is deliberately morethan is strictly necessary, but this is essential. It is only by feeling that Betty is a realperson that the team can start to imagine how she will behave.
SCENARIOS
Scenarios are stories for design: rich stories of interaction. They are perhaps the simplest design representation, but one of the most flexible and powerful. Some scen-arios are quite short: ‘the user intends to press the “save” button, but accidentally
5.5
Betty is 37 years old. She has been Warehouse Manager for five years and has workedfor Simpkins Brothers Engineering for 12 years. She didn’t go to university, but hasstudied in her evenings for a business diploma. She has two children aged 15 and 7 anddoes not like to work late. She did part of an introductory in-house computer coursesome years ago, but it was interrupted when she was promoted and could no longerafford to take the time. Her vision is perfect, but her right-hand movement is slightlyrestricted following an industrial accident three years ago. She is enthusiastic about her work and is happy to delegate responsibility and take suggestions from her staff.However, she does feel threatened by the introduction of yet another new computersystem (the third in her time at SBE).
Figure 5.3 Persona – a rich description of Betty the Warehouse Manager

202 Chapter 5 n Interaction design basics
presses the “quit” button so loses his work’. Others are focussed more on describingthe situation or context.
Figure 5.4 gives an example of a scenario for the personal movie player. Like thepersona it is perhaps more detailed than appears necessary, but the detail helps makethe events seem real. The figure shows plain text, but scenarios can be augmented bysketches, simulated screen shots, etc. These sketches and pictures are called story-boards and are similar to the techniques used in film making to envisage plot-lines.
Where the design includes physical artifacts the scenarios can be used as a scriptto act out potential patterns of use. For example, we might imagine a digital Swissarmy knife, which has a small LCD screen and uses the toothpick as a stylus. The knife connects to the internet via a wireless link through your phone and givesinteresting tips from other Swiss army knife users. Try getting two together at a party– you will see this would appeal! It sounds like a great design idea – but wait, try act-ing out the use. If you have a Swiss army knife, use it, or use something penknife-sized if you don’t. The tip on the LCD says, ‘open the stone remover’: a small LEDglows near the right blade – you open it. ‘Now push the blade into the rubber of thegrommet’, it says. You do this and then look for the next instruction. Look at theknife in your hand . . . oops, your thumb is covering where the screen would be.Perhaps a voice interface would be better.
You can see already how scenarios force you to think about the design in detailand notice potential problems before they happen. If you add more detail you canget to a blow-by-blow account of the user–system interactions and then ask ‘what isthe user intending now?’; ‘what is the system doing now?’. This can help to verify that
Brian would like to see the new film Moments of Significance and wants to invite Alison,but he knows she doesn’t like ‘arty’ films. He decides to take a look at it to see if shewould like it and so connects to one of the movie-sharing networks. He uses his workmachine as it has a higher bandwidth connection, but feels a bit guilty. He knows he will be getting an illegal copy of the film, but decides it is OK as he is intending to go to the cinema to watch it. After it downloads to his machine he takes out his newpersonal movie player. He presses the ‘menu’ button and on the small LCD screen hescrolls using the arrow keys to ‘bluetooth connect’ and presses the ‘select’ button. On his computer the movie download program now has an icon showing that it hasrecognized a compatible device and he drags the icon of the film over the icon for theplayer. On the player the LCD screen says ‘downloading now’, with a per cent doneindicator and small whirling icon.
During lunchtime Brian takes out his movie player, plugs in his earphones and starts to watch. He uses the arrow keys to skip between portions of the film and decides that,yes, Alison would like it. Then he feels a tap on his shoulder. He turns round. It is Alison.He had been so absorbed he hadn’t noticed her. ‘What are you watching’, she says. ‘Here,listen’, he says and flicks a small switch. The built-in directional speaker is loud enoughfor both Brian and Alison to hear, but not loud enough to disturb other people in thecanteen. Alison recognizes the film from trailers, ‘surprised this is out yet’ she says. ‘Wellactually . . .’, Brian confesses, ‘you’d better come with me to see it and make an honestman of me’. ‘I’ll think about it’, she replies.
Figure 5.4 Scenario for proposed movie player

5.6 Navigation design 203
the design would make sense to the user and also that proposed implementationarchitectures would work.
In addition scenarios can be used to:
Communicate with others – other designers, clients or users. It is easy to misunder-stand each other whilst discussing abstract ideas. Concrete examples of use are fareasier to share.
Validate other models A detailed scenario can be ‘played’ against various moreformal representations such as task models (discussed in Chapter 15) or dialogand navigation models (Chapter 16 and below).
Express dynamics Individual screen shots and pictures give you a sense of what asystem would look like, but not how it behaves.
In the next section we will discuss ways of describing the patterns of interaction with a system. These are more complex and involve networks or hierarchies. In contrast scenarios are linear – they represent a single path amongst all the potentialinteractions.
This linearity has both positive and negative points:
Time is linear Our lives are linear as we live in time and so we find it easier tounderstand simple linear narratives. We are natural storytellers and story listeners.
But no alternatives Real interactions have choices, some made by people, some bysystems. A simple scenario does not show these alternative paths. In particular, itis easy to miss the unintended things a person may do.
Scenarios are a resource that can be used and reused throughout the design pro-cess: helping us see what is wanted, suggesting how users will deal with the potentialdesign, checking that proposed implementations will work, and generating test casesfor final evaluation.
For more examples of scenarios see: /e3/online/scenario/
NAVIGATION DESIGN
As we stressed, the object of design is not just a computer system or device, but thesocio-technical intervention as a whole. However, as design progresses we come to apoint where we do need to consider these most tangible outputs of design.
Imagine yourself using a word processor. You will be doing this in some particu-lar social and physical setting, for a purpose. But now we are focussing on the com-puter system itself. You interact at several levels:
Widgets The appropriate choice of widgets and wording in menus and buttons willhelp you know how to use them for a particular selection or action.
Screens or windows You need to find things on the screen, understand the logicalgrouping of buttons.
5.6

204 Chapter 5 n Interaction design basics
Navigation within the application You need to be able to understand what willhappen when a button is pressed, to understand where you are in the interaction.
Environment The word processor has to read documents from disk, perhaps someare on remote networks. You swap between applications, perhaps cut and paste.
You can see similar levels in other types of application and device, as Table 5.1 shows.There are differences; for example, in the web we have less control of how peopleenter a site and on a physical device we have the same layout of buttons and displaysno matter what the internal state (although we may treat them differently).
We discussed graphical user interface widgets in Chapter 3 and in the next sectionwe will look at details of screen design. In this section we will look mainly at naviga-tion design, that is the main screens or modes within a system and how they inter-connect. We will also briefly consider how this interacts with the wider environment.
Just in case you haven’t already got the idea, the place to start when consideringthe structure of an application is to think about actual use:
n who is going to use the application?n how do they think about it?n what will they do with it?
This can then drive the second task – thinking about structure. Individual screens orthe layout of devices will have their own structure, but this is for the next section.Here we will consider two main kinds of issue:
n local structure– looking from one screen or page out
n global structure– structure of site, movement between screens.
5.6.1 Local structure
Much of interaction involves goal-seeking behavior. Users have some idea of whatthey are after and a partial model of the system. In an ideal world if users had perfectknowledge of what they wanted and how the system worked they could simply take the shortest path to what they want, pressing all the right buttons and links.However, in a world of partial knowledge users meander through the system. The
Table 5.1 Levels of interaction
PC application
WidgetsScreen designNavigation designOther apps and operating system
Physical device
Buttons, dials, lights, displaysPhysical layoutMain modes of deviceThe real world!
Website
Form elements, tags and linksPage designSite structureThe web, browser, external links

5.6 Navigation design 205
important thing is not so much that they take the most efficient route, but that at each point in the interaction they can make some assessment of whether they aregetting closer to their (often partially formed) goal.
To do this goal seeking, each state of the system or each screen needs to give theuser enough knowledge of what to do to get closer to their goal. In Chapter 7 we willlook at various design rules, some of which address this issue. To get you started,here are four things to look for when looking at a single web page, screen or state ofa device.
n knowing where you aren knowing what you can don knowing where you are going – or what will happenn knowing where you’ve been – or what you’ve done.
The screen, web page or device displays should make clear where you are in terms of the interaction or state of the system. Some websites show ‘bread crumbs’ at thetop of the screen, the path of titles showing where the page is in the site (Figure 5.5).Similarly, in the scenario in Figure 5.4, the personal movie player says ‘downloadingnow’, so Brian knows that it is in the middle of downloading a movie from the PC.
It is also important to know what you can do – what can be pressed or clicked to gosomewhere or do something. Some web pages are particularly bad in that it is unclearwhich images are pure decoration and which are links to take you somewhere.
On the web the standard underlined links make it clear which text is clickable andwhich is not. However, in order to improve the appearance of the page many siteschange the color of links and may remove the underline too. This is especially con-fusing if underline is then used as simple emphasis on words that are not links! The
Figure 5.5 Breadcrumbs. Screen shot frame reprinted by permission fromMicrosoft Corporation
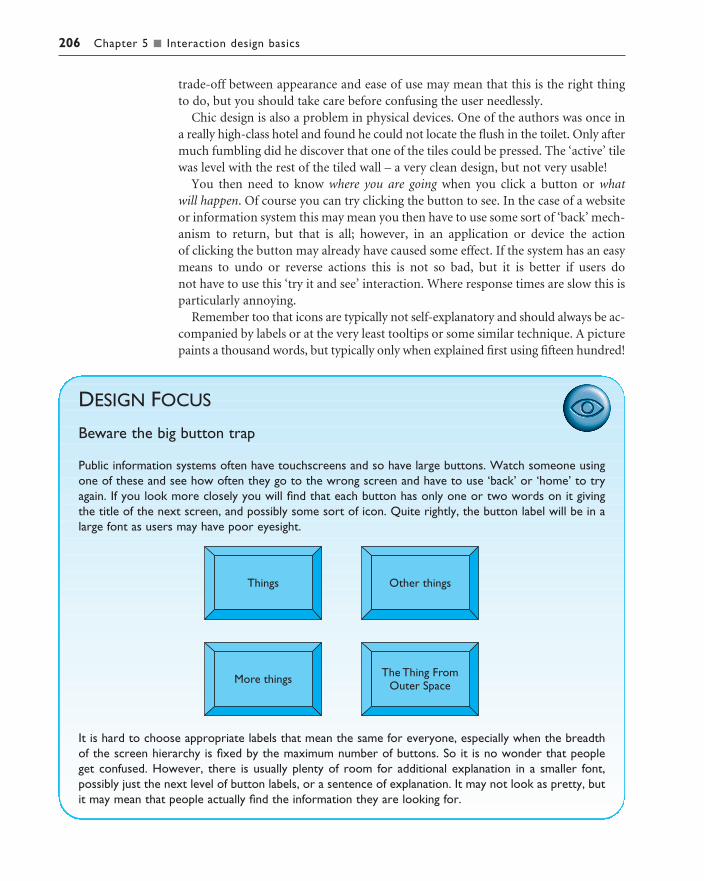
206 Chapter 5 n Interaction design basics
trade-off between appearance and ease of use may mean that this is the right thingto do, but you should take care before confusing the user needlessly.
Chic design is also a problem in physical devices. One of the authors was once ina really high-class hotel and found he could not locate the flush in the toilet. Only aftermuch fumbling did he discover that one of the tiles could be pressed. The ‘active’ tilewas level with the rest of the tiled wall – a very clean design, but not very usable!
You then need to know where you are going when you click a button or what will happen. Of course you can try clicking the button to see. In the case of a websiteor information system this may mean you then have to use some sort of ‘back’ mech-anism to return, but that is all; however, in an application or device the action of clicking the button may already have caused some effect. If the system has an easymeans to undo or reverse actions this is not so bad, but it is better if users do not have to use this ‘try it and see’ interaction. Where response times are slow this isparticularly annoying.
Remember too that icons are typically not self-explanatory and should always be ac-companied by labels or at the very least tooltips or some similar technique. A picturepaints a thousand words, but typically only when explained first using fifteen hundred!
DESIGN FOCUS
Beware the big button trap
Public information systems often have touchscreens and so have large buttons. Watch someone usingone of these and see how often they go to the wrong screen and have to use ‘back’ or ‘home’ to tryagain. If you look more closely you will find that each button has only one or two words on it givingthe title of the next screen, and possibly some sort of icon. Quite rightly, the button label will be in alarge font as users may have poor eyesight.
It is hard to choose appropriate labels that mean the same for everyone, especially when the breadthof the screen hierarchy is fixed by the maximum number of buttons. So it is no wonder that people get confused. However, there is usually plenty of room for additional explanation in a smaller font, possibly just the next level of button labels, or a sentence of explanation. It may not look as pretty, butit may mean that people actually find the information they are looking for.

Special care has to be taken if the same command or button press means some-thing different in different contexts. These different contexts that change the inter-pretation of commands are called modes. Many older text editors would interpretpressing ‘x’ to mean ‘enter me into the text’ in a normal typing mode, but ‘exit’ in aspecial command mode. If modes are clearly visible or audible this is less of a prob-lem and in Chapter 3 (Section 3.6.7) we saw how palettes are one way to achieve this.In general, modes are less of a problem in windowed systems where the mode ismade apparent by the current window (if you remember which it is). However,physical devices may have minimal displays and may be operated without visualattention.
Finally, if you have just done some major action you also want some sort ofconfirmation of what you’ve done. If you are faultless and have perfect knowledge, of course you will be sure that you have hit the right key and know exactly what
5.6 Navigation design 207
DESIGN FOCUS
Modes
Alan’s mobile phone has a lock feature to prevent accidental use. To remove the lock he has to pressthe ‘C’ (cancel) button which then asks for an additional ‘yes’ to confirm removing the lock. So, in‘locked’ mode, ‘C’ followed by ‘yes’ means ‘turn off lock’ and these are the most frequent actions whenAlan takes the phone from his pocket.
However, Alan is forgetful and sometimes puts the phone in his pocket unlocked. This leads to occa-sional embarrassing phone calls and also to another problem.
The ‘yes’ button is quite big and so this is often pressed while in his pocket. This puts the phone into‘dial recent numbers’ mode with a list of recent calls on screen. In this mode, pressing ‘C’ gives aprompt ‘delete number’ and pressing ‘yes’ then deletes the number from the phone’s address book.Unhappily, this often means he takes the phone from his pocket, automatically presses ‘C’, ‘yes’ only tosee as he looks down to the handset the fatal words ‘number deleted’. Of course there is no undo!
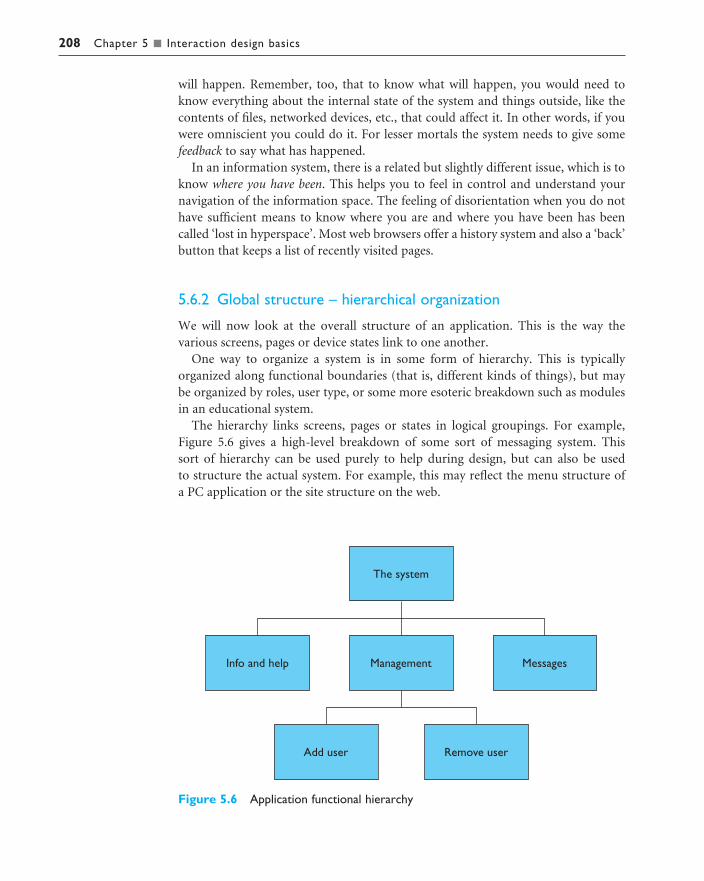
will happen. Remember, too, that to know what will happen, you would need toknow everything about the internal state of the system and things outside, like thecontents of files, networked devices, etc., that could affect it. In other words, if youwere omniscient you could do it. For lesser mortals the system needs to give somefeedback to say what has happened.
In an information system, there is a related but slightly different issue, which is toknow where you have been. This helps you to feel in control and understand yournavigation of the information space. The feeling of disorientation when you do nothave sufficient means to know where you are and where you have been has beencalled ‘lost in hyperspace’. Most web browsers offer a history system and also a ‘back’button that keeps a list of recently visited pages.
5.6.2 Global structure – hierarchical organization
We will now look at the overall structure of an application. This is the way the various screens, pages or device states link to one another.
One way to organize a system is in some form of hierarchy. This is typically organized along functional boundaries (that is, different kinds of things), but may be organized by roles, user type, or some more esoteric breakdown such as modulesin an educational system.
The hierarchy links screens, pages or states in logical groupings. For example,Figure 5.6 gives a high-level breakdown of some sort of messaging system. This sort of hierarchy can be used purely to help during design, but can also be used to structure the actual system. For example, this may reflect the menu structure of a PC application or the site structure on the web.
208 Chapter 5 n Interaction design basics
Figure 5.6 Application functional hierarchy
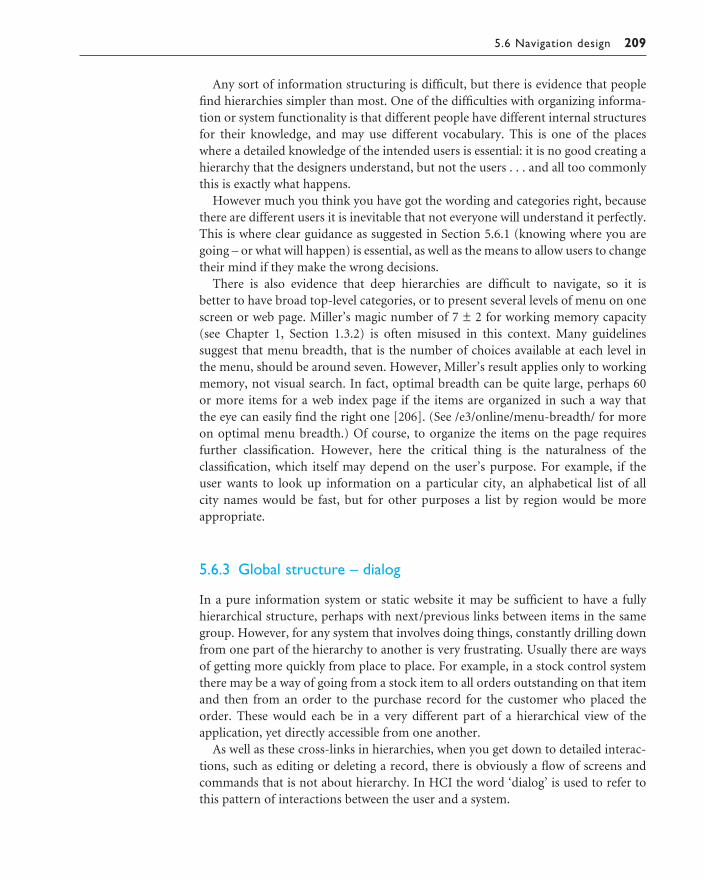
5.6 Navigation design 209
Any sort of information structuring is difficult, but there is evidence that peoplefind hierarchies simpler than most. One of the difficulties with organizing informa-tion or system functionality is that different people have different internal structuresfor their knowledge, and may use different vocabulary. This is one of the placeswhere a detailed knowledge of the intended users is essential: it is no good creating ahierarchy that the designers understand, but not the users . . . and all too commonlythis is exactly what happens.
However much you think you have got the wording and categories right, becausethere are different users it is inevitable that not everyone will understand it perfectly.This is where clear guidance as suggested in Section 5.6.1 (knowing where you aregoing – or what will happen) is essential, as well as the means to allow users to changetheir mind if they make the wrong decisions.
There is also evidence that deep hierarchies are difficult to navigate, so it is better to have broad top-level categories, or to present several levels of menu on onescreen or web page. Miller’s magic number of 7 ± 2 for working memory capacity(see Chapter 1, Section 1.3.2) is often misused in this context. Many guidelines suggest that menu breadth, that is the number of choices available at each level in the menu, should be around seven. However, Miller’s result applies only to workingmemory, not visual search. In fact, optimal breadth can be quite large, perhaps 60 or more items for a web index page if the items are organized in such a way that the eye can easily find the right one [206]. (See /e3/online/menu-breadth/ for moreon optimal menu breadth.) Of course, to organize the items on the page requires further classification. However, here the critical thing is the naturalness of theclassification, which itself may depend on the user’s purpose. For example, if the user wants to look up information on a particular city, an alphabetical list of all city names would be fast, but for other purposes a list by region would be moreappropriate.
5.6.3 Global structure – dialog
In a pure information system or static website it may be sufficient to have a fully hierarchical structure, perhaps with next/previous links between items in the samegroup. However, for any system that involves doing things, constantly drilling downfrom one part of the hierarchy to another is very frustrating. Usually there are waysof getting more quickly from place to place. For example, in a stock control systemthere may be a way of going from a stock item to all orders outstanding on that itemand then from an order to the purchase record for the customer who placed theorder. These would each be in a very different part of a hierarchical view of the application, yet directly accessible from one another.
As well as these cross-links in hierarchies, when you get down to detailed interac-tions, such as editing or deleting a record, there is obviously a flow of screens andcommands that is not about hierarchy. In HCI the word ‘dialog’ is used to refer tothis pattern of interactions between the user and a system.

210 Chapter 5 n Interaction design basics
Consider the following fragment from a marriage service:
Minister: Do you name take this woman . . .Man: I doMinister: Do you name take this man . . .Woman: I doMinister: I now pronounce you man and wife
Notice this describes the general flow of the service, but has blanks for the names ofthe bride and groom. So it gives the pattern of the interaction between the parties,but is instantiated differently for each service. Human–computer dialog is just thesame; there are overall patterns of movement between main states of a device or windows in a PC application, but the details differ each time it is run.
Recall that scenarios gave just one path through the system. To describe a full system we need to take into account different paths through a system and loopswhere the system returns to the same screen. There are various ways to do this, andin Chapter 16 we will expand on the wedding example and look at several differenttypes of dialog model.
A simple way is to use a network diagram showing the principal states or screenslinked together with arrows. This can:
n show what leads to whatn show what happens whenn include branches and loopsn be more task oriented than a hierarchy.
Figure 5.7 shows a network diagram illustrating the main screens for adding or delet-ing a user from the messaging system in Figure 5.6. The arrows show the general flowbetween the states. We can see that from the main screen we can get to either the‘remove user’ screen or the ‘add user’ screen. This is presumably by selecting buttonsor links, but the way these are shown we leave to detailed screen design. We can alsosee that from the ‘add user’ screen the system always returns to the main screen, butafter the ‘remove user’ screen there is a further confirmation screen.
Figure 5.7 Network of screens/states

5.7 Screen design and layout 211
5.6.4 Wider still
Donne said ‘No man is an Iland, intire of it selfe’. This is also true of the things wedesign. Each sits amongst other devices and applications and this in turn has to bereflected within our design.
This has several implications:
Style issues We should normally conform to platform standards, such as positionsfor menus on a PC application, to ensure consistency between applications. Forexample, on our proposed personal movie player we should make use of standardfast-forward, play and pause icons.
Functional issues On a PC application we need to be able to interact with files, readstandard formats and be able to handle cut and paste.
Navigation issues We may need to support linkages between applications, for example allowing the embedding of data from one application in another, or, ina mail system, being able to double click an attachment icon and have the rightapplication launched for the attachment.
On the web we have the added difficulty that other sites and applications mayinclude links that bypass our ‘home page’ and other pages and go direct into the heartof our site or web application. Also, when we link to other sites, we have no controlover them or the way their content may change over time.
SCREEN DESIGN AND LAYOUT
We have talked about the different elements that make up interactive applications,but not about how we put them together. A single screen image often has to presentinformation clearly and also act as the locus for interacting with the system. This isa complex area, involving some of the psychological understanding from Chapter 1as well as aspects of graphical design.
The basic principles at the screen level reflect those in other areas of interactiondesign:
Ask What is the user doing?
Think What information is required? What comparisons may the user need tomake? In what order are things likely to be needed?
Design Form follows function: let the required interactions drive the layout.
5.7.1 Tools for layout
We have a number of visual tools available to help us suggest to the user appropriateways to read and interact with a screen or device.
5.7
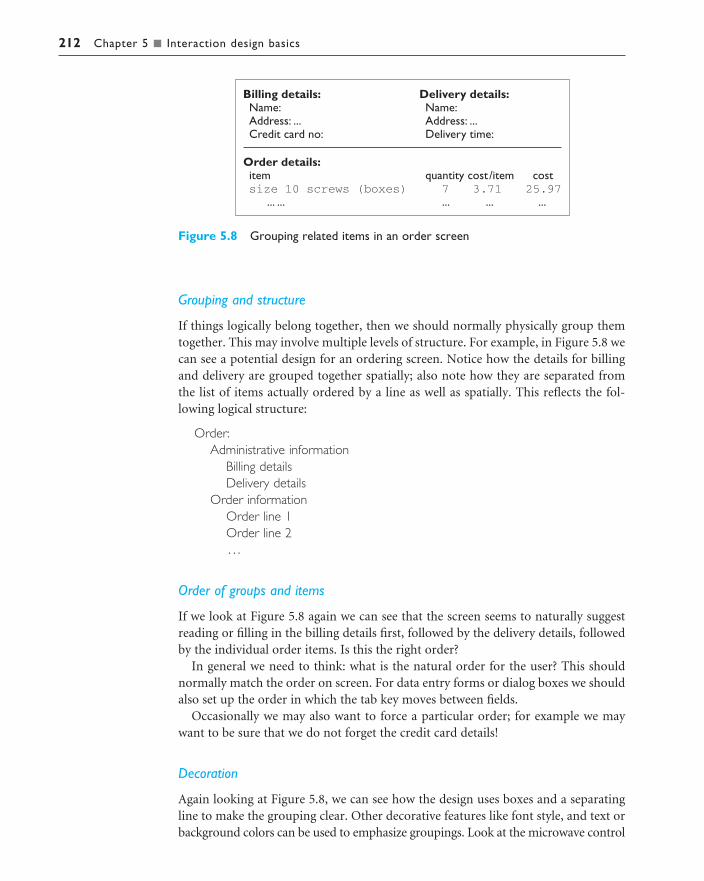
212 Chapter 5 n Interaction design basics
Grouping and structure
If things logically belong together, then we should normally physically group themtogether. This may involve multiple levels of structure. For example, in Figure 5.8 wecan see a potential design for an ordering screen. Notice how the details for billingand delivery are grouped together spatially; also note how they are separated fromthe list of items actually ordered by a line as well as spatially. This reflects the fol-lowing logical structure:
Order:Administrative information
Billing detailsDelivery details
Order informationOrder line 1Order line 2. . .
Order of groups and items
If we look at Figure 5.8 again we can see that the screen seems to naturally suggestreading or filling in the billing details first, followed by the delivery details, followedby the individual order items. Is this the right order?
In general we need to think: what is the natural order for the user? This shouldnormally match the order on screen. For data entry forms or dialog boxes we shouldalso set up the order in which the tab key moves between fields.
Occasionally we may also want to force a particular order; for example we maywant to be sure that we do not forget the credit card details!
Decoration
Again looking at Figure 5.8, we can see how the design uses boxes and a separatingline to make the grouping clear. Other decorative features like font style, and text orbackground colors can be used to emphasize groupings. Look at the microwave control
Figure 5.8 Grouping related items in an order screen

5.7 Screen design and layout 213
panel in Figure 5.9. See how the buttons differ in using the foreground and back-ground colors (green and gold) so that groups are associated with one another. Seealso how the buttons are laid out to separate them into groups of similar function.
Alignment
Alignment of lists is also very important. For users who read text from left to right,lists of text items should normally be aligned to the left. Numbers, however, should
Figure 5.9 Microwave control panel
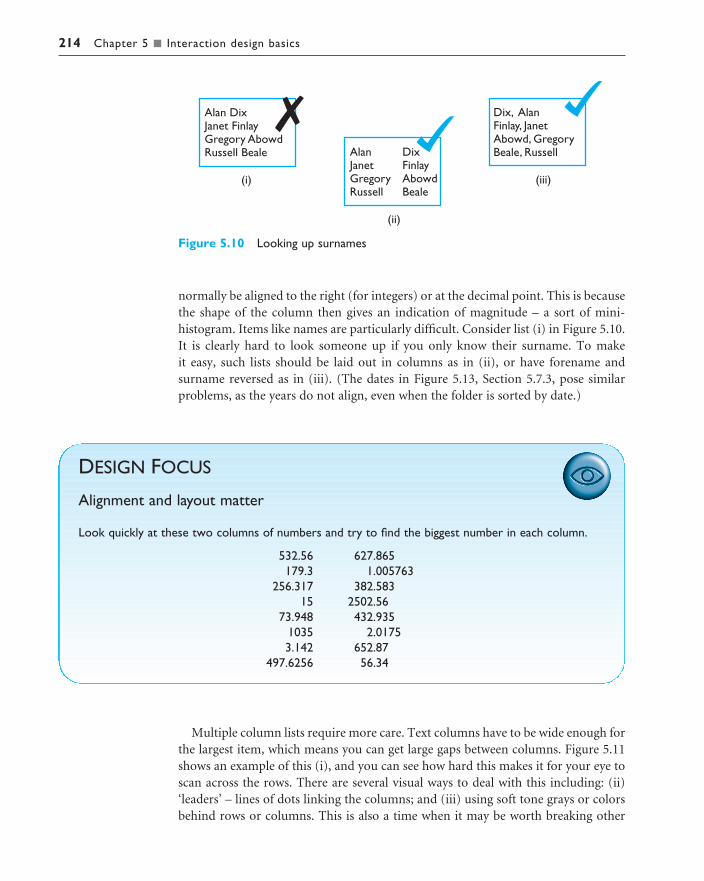
214 Chapter 5 n Interaction design basics
normally be aligned to the right (for integers) or at the decimal point. This is becausethe shape of the column then gives an indication of magnitude – a sort of mini-histogram. Items like names are particularly difficult. Consider list (i) in Figure 5.10.It is clearly hard to look someone up if you only know their surname. To make it easy, such lists should be laid out in columns as in (ii), or have forename and surname reversed as in (iii). (The dates in Figure 5.13, Section 5.7.3, pose similarproblems, as the years do not align, even when the folder is sorted by date.)
Figure 5.10 Looking up surnames
DESIGN FOCUS
Alignment and layout matter
Look quickly at these two columns of numbers and try to find the biggest number in each column.
532.56 627.865179.3 1.005763
256.317 382.58315 2502.56
73.948 432.9351035 2.01753.142 652.87
497.6256 56.34
Multiple column lists require more care. Text columns have to be wide enough forthe largest item, which means you can get large gaps between columns. Figure 5.11shows an example of this (i), and you can see how hard this makes it for your eye toscan across the rows. There are several visual ways to deal with this including: (ii)‘leaders’ – lines of dots linking the columns; and (iii) using soft tone grays or colorsbehind rows or columns. This is also a time when it may be worth breaking other

5.7 Screen design and layout 215
alignment rules, perhaps right aligning some text items as in (iv). This last alternat-ive might be a good solution if you were frequently scanning the numbers and onlyoccasionally scanning the names of items, but not if you needed frequently to lookup names (which anyway are not sorted in this figure!). You can also see that this isan example of a design trade-off – good alignment for individual columns versusability to see relationship across rows.
White space
In typography the space between the letters is called the counter. In painting this isalso important and artists may focus as much on the space between the foregroundelements such as figures and buildings as on the elements themselves. Often theshape of the counter is the most important part of the composition of a painting andin calligraphy and typography the balance of a word is determined by giving an evenweight to the counters. If one ignores the ‘content’ of a screen and instead concen-trates on the counter – the space between the elements – one can get an overall feelfor the layout. If elements that are supposed to be related look separate when youfocus on the counter, then something is wrong. Screwing up your eyes so that thescreen becomes slightly blurred is another good technique for taking your attentionaway from the content and looking instead at the broad structure.
Space can be used in several ways. Some of these are shown in Figure 5.12. The colored areas represent continuous areas of text or graphics. In (i) we can see spaceused to separate blocks as you often see in gaps between paragraphs or space between sections in a report. Space can also be used to create more complex structures. In (ii) there are clearly four main areas: ABC, D, E and F. Within one of these are threefurther areas, A, B and C, which themselves are grouped as A on its own, followed byB and C together. In Figure 5.12 (iii), we can see space used to highlight. This is atechnique used frequently in magazines to highlight a quote or graphic.
Figure 5.11 Managing multiple columns

216 Chapter 5 n Interaction design basics
5.7.2 User action and control
Entering information
Some of the most complicated and difficult screen layouts are found in forms-basedinterfaces and dialog boxes. In each case the screen consists not only of informationpresented to the user, but also of places for the user to enter information or selectoptions. Actually, many of the same layout issues for data presentation also apply tofields for data entry. Alignment is still important. It is especially common to see thetext entry boxes aligned in a jagged fashion because the field names are of differentlengths. This is an occasion where right-justified text for the field labels may be bestor, alternatively, in a graphical interface a smaller font can be used for field labels andthe labels placed just above and to the left of the field they refer to.
For both presenting and entering information a clear logical layout is important.The task analysis techniques in Chapter 15 can help in determining how to groupscreen items and also the order in which users are likely to want to read them or fillthem in. Knowing also that users are likely to read from left to right and top to bot-tom (depending on their native language!) means that a screen can be designed sothat users encounter items in an appropriate order for the task at hand.
Knowing what to do
Some elements of a screen are passive, simply giving you information; others areactive, expecting you to fill them in, or do something to them. It is often not evenclear which elements are active, let alone what the effect is likely to be when youinteract with them!
This is one of the reasons for platform and company style guides. If everyonedesigns buttons to look the same and menus to look the same, then users will be ableto recognize them when they see them. However, this is not sufficient in itself. It isimportant that the labels and icons on menus are also clear. Again, standards canhelp for common actions such as save, delete or print. For more system-specificactions, one needs to follow broader principles. For example, a button says ‘bold’:does this represent the current state of a system or the action that will be performedif the button is pressed?
Figure 5.12 Using white space in layout

5.7 Screen design and layout 217
Affordances
These are especially difficult problems in multimedia applications where one maydeliberately adopt a non-standard and avant-garde style. How are users supposed to know where to click? The psychological idea of affordance says that things maysuggest by their shape and other attributes what you can do to them: a handle affords pulling or lifting; a button affords pushing. These affordances can be used when designing novel interaction elements. One can either mimic real-worldobjects directly, or try to emulate the critical aspects of those objects. What you mustnot do is depict a real-world object in a context where its normal affordances do not work!
Note also that affordances are not intrinsic, but depend on the background andculture of users. Most computer-literate users will click on an icon. This is notbecause they go around pushing pictures in art galleries, but because they havelearned that this is an affordance of such objects in a computer domain. Similarly,such experienced users may well double click if a single click has no effect, yetnovices would not even think of double clicking – after all, double clicking on mostreal buttons turns them off again!
5.7.3 Appropriate appearance
Presenting information
The way of presenting information on screen depends on the kind of information:text, numbers, maps, tables; on the technology available to present it: character dis-play, line drawing, graphics, virtual reality; and, most important of all, on the pur-pose for which it is being used. Consider the window in Figure 5.13. The file listingis alphabetic, which is fine if we want to look up the details of a particular file, butmakes it very difficult to find recently updated files. Of course, if the list were orderedby date then it would be difficult to find a particular file. Different purposes requiredifferent representations. For more complex numerical data, we may be consideringscatter graphs, histograms or 3D surfaces; for hierarchical structures, we may con-sider outlines or organization diagrams. But, no matter how complex the data, theprinciple of matching presentation to purpose remains.
The issue of presentation has been around for many years, long before computers,interactive systems or HCI! Probably the best source for this issue is Tufte’s book[351]. It is targeted principally at static presentations of information, as in books, butmost design principles transfer directly.
We have an advantage when presenting information in an interactive system inthat it is easy to allow the user to choose among several representations, thus mak-ing it possible to achieve different goals. For example, with Macintosh folder windows(as in Figure 5.13) the user can click on a column heading and the file list isreordered, so one can look at the files by, say, name or date. This is not an excuse forignoring the user’s purpose, but means that we can plan for a range of possible uses.

218 Chapter 5 n Interaction design basics
Aesthetics and utility
Remember that a pretty interface is not necessarily a good interface. Ideally, as with any well-designed item, an interface should be aesthetically pleasing. Indeed,good graphic design and attractive displays can increase users’ satisfaction and thusimprove productivity.
However, beauty and utility may sometimes be at odds. For example, an industrialcontrol panel will often be built up of the individual controls of several subsystems,some designed by different teams, some bought in. The resulting inconsistency inappearance may look a mess and suggest tidying up. Certainly some of this inconsist-ency may cause problems. For example, there may be a mix of telephone-style andcalculator-style numeric keypads. Under stress it would be easy to mis-key whenswapping between these. However, the diversity of controls can also help the oper-ator keep track of which controls refer to which subsystem – any redesign must preserve this advantage.
The conflict between aesthetics and utility can also be seen in many ‘well-designed’ posters and multimedia systems. In particular, the backdrop behind textmust have low contrast in order to leave the text readable; this is often not the caseand graphic designers may include excessively complex and strong backgroundsbecause they look good. The results are impressive, perhaps even award winning, butcompletely unusable!
On a more positive note, careful application of aesthetic concepts can also aidcomprehensibility. An example of this is the idea of the counter and use of space that
Figure 5.13 Alphabetic file listing. Screen shot reprinted by permission from Apple Computer, Inc.
5.7 Screen design and layout 219
we discussed earlier. In consumer devices these aesthetic considerations may often bethe key differentiator between products, for example, the sleek curves of a car. Thisis not missed by designers of electronic goods: devices are designed to be good totouch and feel as well as look at and this is certainly one of the drivers for the futur-istic shapes of the Apple iMac family.
Making a mess of it: color and 3D
One of the worst features in many interfaces is their appalling use of color. This ispartly because many monitors only support a limited range of primary colors andpartly because, as with the overuse of different fonts in word processors, the designergot carried away. Aside from issues of good taste, an overuse of color can be dis-tracting and, remembering from Chapter 1 that a significant proportion of the population is color blind, may mean that parts of the text are literally invisible tosome users. In general, color should be used sparingly and not relied upon to giveinformation, but rather to reinforce other attributes.
The increasing use of 3D effects in interfaces has posed a whole new set of problems for text and numerical information. Whilst excellent for presenting phys-ical information and certain sorts of graphs, text presented in perspective can be very difficult to read and the all too common 3D pie chart is all but useless. We willdiscuss ways to make 3D actually useful for visualization in Chapter 20.
DESIGN FOCUS
Checking screen colors
Even non-color-blind users will find it hard to read text where the intensity of the text and backgroundare similar. A good trick is to adjust the color balance on your monitor so that it is reduced to grays,or to print screens on a black and white printer. If your screen is unreadable in grayscale then it is prob-ably difficult to read in full color.
Localization / internationalization
If you are working in a different country, you might see a document being word processed where the text of the document and the file names are in the local language, but all the menus and instructions are still in English. The process of mak-ing software suitable for different languages and cultures is called localization orinternationalization.
It is clear that words have to change and many interface construction toolkitsmake this easy by using resources. When the program uses names of menu items,
220 Chapter 5 n Interaction design basics
error messages and other text, it does not use the text directly, but instead uses aresource identifier, usually simply a number. A simple database is constructed separ-ately that binds these identifiers to particular words and phrases. A different resourcedatabase is constructed for each language, and so the program can be customized touse in a particular country by simply choosing the appropriate resource database.
However, changing the language is only the simplest part of internationalization.Much of the explicit guidance on alignment and layout is dependent on a left-to-right, top-to-bottom language such as English and most European languages. Thisobviously changes completely for other types of language. Furthermore, many icons and images are only meaningful within a restricted cultural context. Despitethe apparent international hegemony of Anglo-American culture, one cannot simply assume that its symbols and norms will be universally understood. A goodexample of this is the use of ticks 3 and crosses 7. In Anglo-American culture these represent opposites, positive and negative, whereas in most of Europe the twoare interchangeable.
ITERATION AND PROTOTYPING
Because human situations are complex and designers are not infallible it is likely thatour first design will not be perfect! For this reason, almost all interaction designincludes some form of iteration of ideas. This often starts early on with paper designsand storyboards being demonstrated to colleagues and potential users. Later in the design process one might use mockups of physical devices or tools such asShockwave or Visual Basic to create prototype versions of software.
Any of these prototypes, whether paper-based or running software, can then beevaluated to see whether they are acceptable and where there is room for improve-ment. This sort of evaluation, intended to improve designs, is called formative evalu-ation. This is in contrast to summative evaluation, which is performed at the end toverify whether the product is good enough. Chapter 9 considers evaluation in detail.One approach is to get an expert to use a set of guidelines, for example the ‘knowingwhere you are’ list above, and look screen by screen to see if there are any violations.The other main approach is to involve real users either in a controlled experimentalsetting, or ‘in the wild’ – a real-use environment.
The result of evaluating the system will usually be a list of faults or problems and this is followed by a redesign exercise, which is then prototyped, evaluated . . .Figure 5.14 shows this process. The end point is when there are no more problems that can economically be fixed.
So iteration and prototyping are the universally accepted ‘best practice’ approachfor interaction design. However, there are some major pitfalls of prototyping, rarelyacknowledged in the literature.
Prototyping is an example of what is known as a hill-climbing approach. Imagineyou are standing somewhere in the open countryside. You walk uphill and keepgoing uphill as steeply as possible. Eventually you will find yourself at a hill top. This
5.8

5.8 Iteration and prototyping 221
is exactly how iterative prototyping works: you start somewhere, evaluate it to seehow to make it better, change it to make it better and then keep on doing this untilit can’t get any better.
However, hill climbing doesn’t always work. Imagine you start somewhere nearCambridge, UK. If you keep moving uphill (and it is very difficult to work out whichdirection that is because it is very flat!), then eventually you would end up at the top of the Gog Magog hills, the nearest thing around . . . all of 300 feet. However, ifyou started somewhere else you might end up at the top of the Matterhorn. Hill-climbing methods always have the potential to leave you somewhere that is the bestin the immediate area, but very poor compared with more distant places. Figure 5.15shows this schematically: if you start at A you get trapped at the local maximum at B,but if you start at C you move up through D to the global maximum at E.
This problem of getting trapped at local maxima is also possible with interfaces. Ifyou start with a bad design concept you may end at something that is simply a tidiedup version of that bad idea!
From this we can see that there are two things you need in order for prototypingmethods to work:
1. To understand what is wrong and how to improve.2. A good start point.
The first is obvious; you cannot iterate the design unless you know what must bedone to improve it. The second, however, is needed to avoid local maxima. If you
Figure 5.14 Role of prototyping
Figure 5.15 Moving little by little . . . but to where?

222 Chapter 5 n Interaction design basics
wanted to climb as high as you could, you would probably book a plane to theHimalayas, not Cambridgeshire.
A really good designer might guess a good initial design based on experience andjudgment. However, the complexity of interaction design problems means that thisinsight is hard. Another approach, very common in graphical design, is to have several initial design ideas and drop them one by one as they are developed further.This is a bit like parachuting 10 people at random points of the earth. One of themis perhaps likely to end up near a high mountain.
One of the things that theoretical methods and models, as found in Part 3 of thisbook, can do is to help us with both (1) and (2).
SUMMARY
We have seen that design in HCI is not just about creating devices or software, butinstead is about the whole interaction between people, software and their environ-ment. Because of this it is good to see the product of design not just as the obviousartifacts but as the whole intervention that changes the existing situation to a new one.
In Section 5.2, design was defined as ‘achieving goals within constraints’. In the case of interaction design the goals are about improving some aspect of work,home or leisure using technology. The constraints remind us that the final designwill inevitably involve trade-offs between different design issues and furthermoreshould never be ‘perfect’ as cost and timeliness should prevent indefinite tinkering.To achieve good design we must understand our materials and in the case of inter-action design these materials include not just the computers and technical devices,but also humans. If we treated humans in design with only as much care as physicalmaterials it is clear that ‘human error’ after accidents would be regarded as ‘designerror’ – a good designer understands the natural limitations of ordinary people.
Section 5.3 gave a bird’s-eye view of the design process, which gives a context formuch of the rest of this book.
The process starts with understanding the situation as it is and the requirementsfor change. Section 5.4 provided some simple techniques for dealing with this: get-ting to know your users, who they are, remembering that they are different from you,but trying to imagine what it is like for them. You can talk to users, but you shouldalso observe them in other ways, as we are all bad at articulating what we do. Oneway to help retain a user focus in design is to use personae – detailed word picturesof imaginary but typical users.
Section 5.5 introduced scenarios and rich stories about design, which can help usexplore the design space and to discuss potential designs with other designers andpotential users. Both scenarios and personae need to be vivid and to include richcontextual details – not just a record of user actions on the system!
The details of potential designs need to be worked out and in Section 5.6 welooked at the overall navigation design of the system. We started by looking at local structure, the way one screen, page or state of an application relates to those it
5.9

Exercises 223
immediately links to. The users need to know where they are, what they can do, whatwill happen when they do things, and what has happened in the past. This can aidusers as they goal seek, or move closer towards their goals without having to neces-sarily understand completely the whole route there. The global structure of the appli-cation is also important. We saw how hierarchy diagrams can give a logical view of an application, which can be used to design menu or site structures. In contrast,the user dialog focusses on the flow of user and system actions. One way to do this isusing network diagrams of screens or states of the system and how they link to oneanother. Any designed system must also relate to its environment: other applica-tions, other websites, other physical devices.
In Section 5.7 we looked at screen design and layout. We saw that there were various visual tools that could help us to ensure that the physical structure of ourscreen emphasized the logical structure of the user interaction. These tools includedphysical grouping, ordering of items, decoration such as fonts, lines and color, align-ment and the use of white space. These are important both for appropriate displayof information and to lay out controls and data entry fields for ease of use. It is also important that controls have appropriate affordances – that is have visual andtactile attributes that suggest their use. Information presented on screen, whetherindividual items, tabular or graphical, should be appropriate to the user’s purposeand this may mean allowing interactions to change the layout, for example re-sorttables by different columns. Aesthetics are also important, but may conflict with util-ity. Depending on the context you may need to make different trade-offs betweenthese. Good graphical design is an area and a skill all of its own, but some featuressuch as bad use of color and 3D effects are bad for both aesthetics and usability!
Finally, in Section 5.8, we saw that iteration is an essential part of virtually anyinteraction design process because we cannot get things right first time. However,iterative methods may get trapped in local maxima. To make iterative processeswork, we need either extensive personal experience or theoretical understanding tohelp us get better initial designs.
EXERCISES
5.1 Use a pocket alarm clock or wristwatch to set yourself alarms every 15 minutes oneworking day. Write down exactly what you are doing. How surprising is it?
Exercises 5.2, 5.3, 5.4 and 5.5 are based around a nuclear reactor scenario on the book website at:/e3/scenario/nuclear/ You will need to read the scenario in order to answer these exercises.
5.2 Comment on the user of color in the Alarm Control, Emergency Shutdown and EmergencyConfirm panels (Figure CS.2 – for figures, see the web scenario).
5.3 Comment on the use of layout and other elements in the control panels (Figures CS.1, CS.2 and CS.3),including the way in which various visual elements support or hinder logical grouping and sequence.
5.4 Working through the accident scenario, explain why the various problems arise.
5.5 Suggest potential ways of improving the interface to avoid a similar problem recurring.
224 Chapter 5 n Interaction design basics
RECOMMENDED READING
J. Preece, Y. Rogers and H. Sharp, Interaction Design: Beyond Human–ComputerInteraction, John Wiley, 2002.A general textbook on interaction design with especially strong focus on evaluation.
J. Carroll, editor, Interacting with Computers, Vol. 13, No. 1, special issue on‘Scenario-based system development’, 2000.Contributions from several authors on using scenarios in design.
J. Carroll, Making Use: Scenario-Based Design of Human–Computer Interactions, MITPress, 2000.John Carroll’s own book dedicated solely to using scenarios in design.
J. McGrenere and W. Ho, Affordances: clarifying and evolving a concept, Proceedingsof Graphics Interface 2000, pp. 179–86, 2000.This paper reviews all the major work on affordances from Gibson’s originaldefinition and focusses especially on Norman’s popularization of the word whichhas been the way many encounter it. It also reviews the work of Bill Gaver, whois probably the first person to use affordance as a concept within HCI.
E. Tufte, Envisioning Information, Graphics Press, Cheshire, USA, 1990, andE. Tufte, The Visual Display of Quantitative Information, Graphics Press,Cheshire, USA, 1997.Tufte’s books are the ‘must read’ for graphical presentation, packed with exam-ples and pictures – from timetables to Napoleon’s disastrous Russian campaign.

HCI IN THE SOFTWARE
PROCESS
OV E RV I E W
n Software engineering provides a means ofunderstanding the structure of the design process, andthat process can be assessed for its effectiveness ininteractive system design.
n Usability engineering promotes the use of explicitcriteria to judge the success of a product in terms of its usability.
n Iterative design practices work to incorporate crucialcustomer feedback early in the design process toinform critical decisions which affect usability.
n Design involves making many decisions amongnumerous alternatives. Design rationale provides anexplicit means of recording those design decisions and the context in which the decisions were made.
6

226 Chapter 6 n HCI in the software process
INTRODUCTION
In Chapter 4 we concentrated on identifying aspects of usable interactive systems by means of concrete examples of successful paradigms. The design goal is to pro-vide reliable techniques for the repeated design of successful and usable interactive systems. It is therefore necessary that we go beyond the exercise of identifyingparadigms and examine the process of interactive system design. In the previouschapter we introduced some of the elements of a user-centered design process. Here we expand on that process, placing the design of interactive systems within theestablished frameworks of software development.
Within computer science there is already a large subdiscipline that addresses themanagement and technical issues of the development of software systems – calledsoftware engineering. One of the cornerstones of software engineering is the softwarelife cycle, which describes the activities that take place from the initial concept formation for a software system up until its eventual phasing out and replacement.This is not intended to be a software engineering textbook, so it is not our majorconcern here to discuss in depth all of the issues associated with software engineer-ing and the myriad life-cycle models.
The important point that we would like to draw out is that issues from HCI affect-ing the usability of interactive systems are relevant within all the activities of the software life cycle. Therefore, software engineering for interactive system design isnot simply a matter of adding one more activity that slots in nicely with the existingactivities in the life cycle. Rather, it involves techniques that span the entire life cycle.
We will begin this chapter by providing an introduction to some of the importantconcepts of software engineering, in Section 6.2. Specifically, we will describe themajor activities within the traditional software life cycle and discuss the issues raisedby the special needs of interactive systems. We will then describe some specificapproaches to interactive system design, which are used to promote product usabil-ity throughout the life cycle. In Section 6.3, we will discuss a particular methodologycalled usability engineering in which explicit usability requirements are used as goalsfor the design process. In Section 6.4, we consider iterative design practices thatinvolve prototyping and participative evaluation. We conclude this chapter with adiscussion of design rationale. Design is a decision-making activity and it is import-ant to keep track of the decisions that have been made and the context in which theywere made. Various design rationale techniques, presented in Section 6.5, are usedto support this critical activity.
THE SOFTWARE LIFE CYCLE
One of the claims for software development is that it should be considered as anengineering discipline, in a way similar to how electrical engineering is considered forhardware development. One of the distinguishing characteristics of any engineering
6.2
6.1
6.2 The software life cycle 227
discipline is that it entails the structured application of scientific techniques to thedevelopment of some product. A fundamental feature of software engineering,therefore, is that it provides the structure for applying techniques to develop soft-ware systems. The software life cycle is an attempt to identify the activities that occurin software development. These activities must then be ordered in time in any devel-opment project and appropriate techniques must be adopted to carry them through.
In the development of a software product, we consider two main parties: the customer who requires the use of the product and the designer who must provide theproduct. Typically, the customer and the designer are groups of people and somepeople can be both customer and designer. It is often important to distinguishbetween the customer who is the client of the designing company and the customerwho is the eventual user of the system. These two roles of customer can be played by different people. The group of people who negotiate the features of the intendedsystem with the designer may never be actual users of the system. This is often par-ticularly true of web applications. In this chapter, we will use the term ‘customer’ torefer to the group of people who interact with the design team and we will refer tothose who will interact with the designed system as the user or end-user.
6.2.1 Activities in the life cycle
A more detailed description of the life cycle activities is depicted in Figure 6.1. Thegraphical representation is reminiscent of a waterfall, in which each activity naturallyleads into the next. The analogy of the waterfall is not completely faithful to the realrelationship between these activities, but it provides a good starting point for dis-cussing the logical flow of activity. We describe the activities of this waterfall modelof the software life cycle next.1
Requirements specification
In requirements specification, the designer and customer try to capture a descriptionof what the eventual system will be expected to provide. This is in contrast to deter-mining how the system will provide the expected services, which is the concern oflater activities. Requirements specification involves eliciting information from thecustomer about the work environment, or domain, in which the final product willfunction. Aspects of the work domain include not only the particular functions thatthe software product must perform but also details about the environment in whichit must operate, such as the people whom it will potentially affect and the new pro-duct’s relationship to any other products which it is updating or replacing.
Requirements specification begins at the start of product development. Thoughthe requirements are from the customer’s perspective, if they are to be met by the
1 Some authors distinguish between the software development process and the software life cycle, thewaterfall model being used to describe the former and not the latter. The main distinction for our pur-poses is that operation and maintenance of the product is not part of the development process.

228 Chapter 6 n HCI in the software process
software product they must be formulated in a language suitable for implementa-tion. Requirements are usually initially expressed in the native language of the cus-tomer. The executable languages for software are less natural and are more closelyrelated to a mathematical language in which each term in the language has a preciseinterpretation, or semantics. The transformation from the expressive but relativelyambiguous natural language of requirements to the more precise but less expressiveexecutable languages is one key to successful development. In Chapter 15 we discusstask analysis techniques, which are used to express work domain requirements in aform that is both expressive and precise.
Architectural design
As we mentioned, the requirements specification concentrates on what the system is supposed to do. The next activities concentrate on how the system provides the services expected from it. The first activity is a high-level decomposition of the sys-tem into components that can either be brought in from existing software productsor be developed from scratch independently. An architectural design performs thisdecomposition. It is not only concerned with the functional decomposition of thesystem, determining which components provide which services. It must also describe
Figure 6.1 The activities in the waterfall model of the software life cycle

6.2 The software life cycle 229
the interdependencies between separate components and the sharing of resourcesthat will arise between components.
There are many structured techniques that are used to assist a designer in derivingan architectural description from information in the requirements specification(such as CORE, MASCOT and HOOD). Details of these techniques are outside thescope of this book, but can be found in any good software engineering textbook.What we will mention here is that the majority of these techniques are adequate forcapturing the functional requirements of the system – the services the system mustprovide in the work domain – but do not provide an immediate way to capture othernon-functional requirements – features of the system that are not directly related tothe actual services provided but relate to the manner in which those services must beprovided. Some classic examples of non-functional requirements are the efficiency,reliability, timing and safety features of the system. Interactive features of the system,such as those that will be described by the principles in Chapter 7, also form a largeclass of non-functional requirements.
Detailed design
The architectural design provides a decomposition of the system description thatallows for isolated development of separate components which will later be integ-rated. For those components that are not already available for immediate integra-tion, the designer must provide a sufficiently detailed description so that they may be implemented in some programming language. The detailed design is a refinementof the component description provided by the architectural design. The behaviorimplied by the higher-level description must be preserved in the more detaileddescription.
Typically, there will be more than one possible refinement of the architecturalcomponent that will satisfy the behavioral constraints. Choosing the best refinementis often a matter of trying to satisfy as many of the non-functional requirements ofthe system as possible. Thus the language used for the detailed design must allowsome analysis of the design in order to assess its properties. It is also important tokeep track of the design options considered, the eventual decisions that were madeand the reasons why, as we will discuss in Section 6.5 on design rationale.
Coding and unit testing
The detailed design for a component of the system should be in such a form that itis possible to implement it in some executable programming language. After coding,the component can be tested to verify that it performs correctly, according to sometest criteria that were determined in earlier activities. Research on this activity withinthe life cycle has concentrated on two areas. There is plenty of research that is gearedtowards the automation of this coding activity directly from a low-level detaileddesign. Most of the work in formal methods operates under the hypothesis that, intheory, the transformation from the detailed design to the implementation is fromone mathematical representation to another and so should be able to be entirely

230 Chapter 6 n HCI in the software process
automated. Other, more practical work concentrates on the automatic generation oftests from output of earlier activities which can be performed on a piece of code toverify that it behaves correctly.
Integration and testing
Once enough components have been implemented and individually tested, theymust be integrated as described in the architectural design. Further testing is done to ensure correct behavior and acceptable use of any shared resources. It is also pos-sible at this time to perform some acceptance testing with the customers to ensurethat the system meets their requirements. It is only after acceptance of the integratedsystem that the product is finally released to the customer.
It may also be necessary to certify the final system according to requirementsimposed by some outside authority, such as an aircraft certification board. As of1993, a European health and safety act requires that all employers provide their staffwith usable systems. The international standards authority, ISO, has also produced astandard (ISO 9241) to define the usability of office environment workstations.Coupled together, the health and safety regulations and ISO 9241 provide impetusfor designers to take seriously the HCI implications of their design.
Maintenance
After product release, all work on the system is considered under the category of maintenance, until such time as a new version of the product demands a totalredesign or the product is phased out entirely. Consequently, the majority of the lifetime of a product is spent in the maintenance activity. Maintenance involves thecorrection of errors in the system which are discovered after release and the revisionof the system services to satisfy requirements that were not realized during previousdevelopment. Therefore, maintenance provides feedback to all of the other activitiesin the life cycle, as shown in Figure 6.2.
6.2.2 Validation and verification
Throughout the life cycle, the design must be checked to ensure that it both satisfiesthe high-level requirements agreed with the customer and is also complete and internally consistent. These checks are referred to as validation and verification,respectively. Boehm [36a] provides a useful distinction between the two, charac-terizing validation as designing ‘the right thing’ and verification as designing ‘thething right’. Various languages are used throughout design, ranging from informal natural language to very precise and formal mathematical languages. Validation andverification exercises are difficult enough when carried out within one language; theybecome much more difficult, if not impossible, when attempted between languages.
Verification of a design will most often occur within a single life-cycle activity orbetween two adjacent activities. For example, in the detailed design of a component

6.2 The software life cycle 231
of a payroll accounting system, the designer will be concerned with the correctnessof the algorithm to compute taxes deducted from an employee’s gross income. Thearchitectural design will have provided a general specification of the informationinput to this component and the information it should output. The detailed descrip-tion will introduce more information in refining the general specification. Thedetailed design may also have to change the representations for the information andwill almost certainly break up a single high-level operation into several low-leveloperations that can eventually be implemented. In introducing these changes toinformation and operations, the designer must show that the refined description is a legal one within its language (internal consistency) and that it describes all of thespecified behavior of the high-level description (completeness) in a provably correctway (relative consistency).
Validation of a design demonstrates that within the various activities the cus-tomer’s requirements are satisfied. Validation is a much more subjective exercisethan verification, mainly because the disparity between the language of the require-ments and the language of the design forbids any objective form of proof. In inter-active system design, the validation against HCI requirements is often referred to asevaluation and can be performed by the designer in isolation or in cooperation withthe customer. We discuss evaluation in depth in Chapter 9.
Figure 6.2 Feedback from maintenance activity to other design activities

232 Chapter 6 n HCI in the software process
An important question, which applies to both verification and validation, asksexactly what constitutes a proof. We have repeatedly mentioned the language used in any design activity and the basis for the semantics of that language. Languageswith a mathematical foundation allow reasoning and proof in the objective sense. An argument based entirely within some mathematical language can be accepted orrefuted based upon universally accepted measures. A proof can be entirely justifiedby the rules of the mathematical language, in which case it is considered a formalproof. More common is a rigorous proof, which is represented within some mathem-atical language but which relies on the understanding of the reader to accept its correctness without appeal to the full details of the argument, which could be provided but usually are not. The difference between formality and rigour is in theamount of detail the prover leaves out while still maintaining acceptance of theproof.
Proofs that are for verification of a design can frequently occur within one lan-guage or between two languages which both have a precise mathematical semantics.Time constraints for a design project and the perceived economic implications of theseparate components usually dictate which proofs are carried out in full formalityand which are done only rigorously (if at all). As research in this area matures andautomated tools provide assistance for the mechanical aspects of proof, the cost ofproof should decrease.
Validation proofs are much trickier, as they almost always involve a transforma-tion between languages. Furthermore, the origin of customer requirements arises in the inherent ambiguity of the real world and not the mathematical world. Thisprecludes the possibility of objective proof, rigorous or formal. Instead, there willalways be a leap from the informal situations of the real world to any formal andstructured development process. We refer to this inevitable disparity as the formalitygap, depicted in Figure 6.3.
The formality gap means that validation will always rely to some extent on sub-jective means of proof. We can increase our confidence in the subjective proof byeffective use of real-world experts in performing certain validation chores. Theseexperts will not necessarily have design expertise, so they may not understand the
Figure 6.3 The formality gap between the real world and structured design
6.2 The software life cycle 233
design notations used. Therefore, it is important that the design notations narrowthe formality gap, making clear the claims that the expert can then validate. Forinteractive systems, the expert will have knowledge from a cognitive or psycholo-gical domain, so the design specification must be readily interpretable from a psy-chological perspective in order to validate it against interactive requirements of thesystem. We will discuss design techniques and notations that narrow the formalitygap for validation of interactive properties of systems in Part 3.
6.2.3 Management and contractual issues
The life cycle described above concentrated on the more technical features of software development. In a technical discussion, managerial issues of design, such astime constraints and economic forces, are not as important. The different activitiesof the life cycle are logically related to each other. We can see that requirements for a system precede the high-level architectural design which precedes the detaileddesign, and so on. In reality, it is quite possible that some detailed design isattempted before all of the architectural design. In management, a much wider perspective must be adopted which takes into account the marketability of a system,its training needs, the availability of skilled personnel or possible subcontractors, andother topics outside the activities for the development of the isolated system.
As an example, we will take the development of a new aircraft on which there will be many software subsystems. The aircraft company will usually go through aconcept evaluation period of up to 10 years before making any decision about actualproduct development. Once it has been decided to build a certain type of aircraft,loosely specified in the case of commercial aircraft in terms of passenger capacity and flight range, more explicit design activity follows. This includes joint analysis for both the specification of the aircraft and determination of training needs. It isonly after the architectural specification of the aircraft is complete that the separatesystems to be developed are identified. Some of these systems will be software sys-tems, such as the flight management system or the training simulator, and these willbe designed according to the life cycle described earlier. Typically, this will take fourto five years. The separate aircraft systems are then integrated for ground and flighttesting and certification before the aircraft is delivered to any customer airlines. Theoperating lifetime of an aircraft model is expected to be in the range of 20–40 years,during which time maintenance must be provided. The total lifetime of an aircraftfrom conception to phasing out is up to 55 years, only 4–5 years (excluding mainten-ance) of which contain the software life cycle which we are discussing in this chapter.
In managing the development process, the temporal relationship between the various activities is more important, as are the intermediate deliverables which represent the technical content, as the designer must demonstrate to the customerthat progress is being made. A useful distinction, taken from McDermid [232], isthat the technical perspective of the life cycle is described in stages of activity, whereasthe managerial perspective is described in temporally bound phases. A phase is usually defined in terms of the documentation taken as input to the phase and the

234 Chapter 6 n HCI in the software process
documentation delivered as output from the phase. So the requirements phase willtake any marketing or conceptual development information, identifying potentialcustomers, as input and produce a requirements specification that must be agreedupon between customer and designer.
This brings up another important issue from the management perspective. As thedesign activity proceeds, the customer and the designer must sign off on various docu-ments, indicating their satisfaction with progress to date. These signed documentscan carry a varying degree of contractual obligation between customer and designer.A signed requirements specification indicates both that the customer agrees to limitdemands of the eventual product to those listed in the specification and also that thedesigner agrees to meet all of the requirements listed. From a technical perspective,it is easy to acknowledge that it is difficult, if not impossible, to determine all of therequirements before embarking on any other design activity. A satisfactory require-ments specification may not be known until after the product has been in operation!From a management perspective, it is unacceptable to both designer and customerto delay the requirements specification that long.
So contractual obligation is a necessary consequence of managing software development, but it has negative implications on the design process as well. It is verydifficult in the design of an interactive system to determine a priori what require-ments to impose on the system to maximize its usability. Having to fix on somerequirements too early will result either in general requirements that are very littleguide for the designer or in specific requirements that compromise the flexibility of design without guaranteeing any benefits.
6.2.4 Interactive systems and the software life cycle
The traditional software engineering life cycles arose out of a need in the 1960s and1970s to provide structure to the development of large software systems. In thosedays, the majority of large systems produced were concerned with data-processingapplications in business. These systems were not highly interactive; rather, they werebatch-processing systems. Consequently, issues concerning usability from an end-user’s perspective were not all that important. With the advent of personal comput-ing in the late 1970s and its huge commercial success and acceptance, most modernsystems developed today are much more interactive, and it is vital to the success ofany product that it be easy to operate for someone who is not expected to knowmuch about how the system was designed. The modern user has a great amount of skill in the work that he performs without necessarily having that much skill insoftware development.
The life cycle for development we described above presents the process of designin a somewhat pipeline order. In reality, even for batch-processing systems, theactual design process is iterative, work in one design activity affecting work in anyother activity both before or after it in the life cycle. We can represent this iterativerelationship as in Figure 6.4, but that does not greatly enhance any understanding of the design process for interactive systems. You may ask whether it is worth the

6.2 The software life cycle 235
intellectual effort to understand the interactive system design process. Is there reallymuch design effort spent on the interactive aspects of a system to warrant our atten-tion? A classic survey in 1978 by Sutton and Sprague at IBM resulted in an estimatethat 50% of the designer’s time was spent on designing code for the user interface[338]. A more recent and convincing survey by Myers and Rosson has confirmedthat that finding holds true for the 1990s [247]. So it is definitely worth the effort to provide structure and techniques to understand, structure and improve the inter-active design process! In this section, we will address features of interactive systemdesign which are not treated properly by the traditional software life cycle.
The traditional software life cycle suits a principled approach to design; that is, ifwe know what it is we want to produce from the beginning, then we can structureour approach to design in order to attain the goal. We have already mentioned how,in practice, designers do not find out all of the requirements for a system before theybegin. Figure 6.4 depicts how discovery in later activities can be reflected in iterationsback to earlier stages. This is an admission that the requirements capture activity is not executed properly. The more serious claim we are making here is that all of the requirements for an interactive system cannot be determined from the start, and there are many convincing arguments to support this position. The result is thatsystems must be built and the interaction with users observed and evaluated in orderto determine how to make them more usable.
Figure 6.4 Representing iteration in the waterfall model
236 Chapter 6 n HCI in the software process
Our models of the psychology and sociology of the human and human cognition,whether in isolation or in a group, are incomplete and do not allow us to predict how to design for maximum usability. There is much research on models of humanusers that allow prediction of their performance with interactive systems, which wewill discuss in Chapter 12. These models, however, either rely on too much detail ofthe system to be useful at very early and abstract stages of design (see the section in Chapter 12 on the keystroke-level model) or they only apply to goal-orientedplanned activity and not highly interactive WIMP systems (refer to the discussion atthe end of Chapter 12).
This dearth of predictive psychological theory means that in order to test certainusability properties of their designs, designers must observe how actual users inter-act with the developed product and measure their performance. In order for theresults of those observations to be worthwhile, the experiments must be as close to areal interaction situation as possible. That means the experimental system must bevery much like it would be in the final product whose requirements the designer is trying to establish! As John Carroll has pointed out, the very detail of the actualsystem can crucially affect its usability, so it is not worthwhile to experiment oncrude estimates of it, as that will provide observations whose conclusions will notnecessarily apply to the real system [59].
One principled approach to interactive system design, which will be important in later chapters, relies on a clear understanding early on in the design of the tasksthat the user wishes to perform. One problem with this assumption is that the tasksa user will perform are often only known by the user after he is familiar with the system on which he performs them. The chicken-and-egg puzzle applies to tasks andthe artifacts on which he performs those tasks. For example, before the advent ofword processors, an author would not have considered the use of a contracting andexpanding outlining facility to experiment easily and quickly with the structure of a paper while it was being typed. A typewriter simply did not provide the ability to perform such a task, so how would a designer know to support such a task indesigning the first word processor?
Also, some of the tasks a user performs with a system were never explicitlyintended as tasks by its designer. Take the example of a graphics drawing packagethat separates the constructed picture into separate layers. One layer is used to buildgraphical pictures which are entire objects – a circle or a square, for instance – andcan be manipulated as those objects and retain their object identity. The other layeris used to paint pictures which are just a collection of pixels. The user can switchbetween the layers in order to create very complex pictures which are part object,part painted scene. But because of the complex interplay between overlappingimages between the two layers, it is also possible to hide certain parts of the picturewhen in one layer and reveal them in the other layer. Such a facility will allow the user to do simple simulations, such as showing the effect of shadowing whenswitching a light on and off. It is very doubtful that the designers were think-ing explicitly of supporting such simulation or animation tasks when they weredesigning these graphics systems, which were meant to build complex, but static, pictures.

6.3 Usability engineering 237
A final point about the traditional software life cycle is that it does not promotethe use of notations and techniques that support the user’s perspective of the inter-active system. We discussed earlier the purpose of validation and the formality gap.It is very difficult for an expert on human cognition to predict the cognitive demandsthat an abstract design would require of the intended user if the notation for thedesign does not reflect the kind of information the user must recall in order to inter-act. The same holds for assessing the timing behavior of an abstract design that doesnot explicitly mention the timing characteristics of the operations to be invoked or their relative ordering. Though no structured development process will entirelyeliminate the formality gap, the particular notations used can go a long way towardsmaking validation of non-functional requirements feasible with expert assistance.
In the remaining sections of this chapter, we will describe various approaches toaugment the design process to suit better the design of interactive systems. Theseapproaches are categorized under the banner of user-centered design.
USABILITY ENGINEERING
One approach to user-centered design has been the introduction of explicit usabilityengineering goals into the design process, as suggested by Whiteside and colleagues atIBM and Digital Equipment Corporation [377] and by Nielsen at Bellcore [260,261]. Engineering depends on interpretation against a shared background of mean-ing, agreed goals and an understanding of how satisfactory completion will bejudged. The emphasis for usability engineering is in knowing exactly what criteriawill be used to judge a product for its usability.
The ultimate test of a product’s usability is based on measurements of users’ experi-ence with it. Therefore, since a user’s direct experience with an interactive system is at the physical interface, focus on the actual user interface is understandable. The danger with this limited focus is that much of the work that is accomplished in interaction involves more than just the surface features of the systems used to perform that work. In reality, the whole functional architecture of the system and thecognitive capacity of the users should be observed in order to arrive at meaningfulmeasures. But it is not at all simple to derive measurements of activity beyond the physical actions in the world, and so usability engineering is limited in its application.
In relation to the software life cycle, one of the important features of usabilityengineering is the inclusion of a usability specification, forming part of the require-ments specification, that concentrates on features of the user–system interactionwhich contribute to the usability of the product. Various attributes of the system aresuggested as gauges for testing the usability. For each attribute, six items are definedto form the usability specification of that attribute. Table 6.1 provides an example ofa usability specification for the design of a control panel for a video cassette recorder(VCR), based on the technique presented by Whiteside, Bennett and Holtzblatt [377].
6.3

238 Chapter 6 n HCI in the software process
In this example, we choose the principle of recoverability, described fully inChapter 7, as the particular usability attribute of interest. Recoverability refers to theability to reach a desired goal after recognition of some error in previous interaction.The recovery procedure can be in either a backward or forward sense. Current VCRdesign has resulted in interactive systems that are notoriously difficult to use; theredesign of a VCR provides a good case study for usability engineering. In designinga new VCR control panel, the designer wants to take into account how a user mightrecover from a mistake he discovers while trying to program the VCR to record sometelevision program in his absence. One approach that the designer decides to followis to allow the user the ability to undo the programming sequence, reverting the stateof the VCR to what it was before the programming task began.
The backward recoverability attribute is defined in terms of a measuring concept,which makes the abstract attribute more concrete by describing it in terms of theactual product. So in this case, we realize backward recoverability as the ability to undo an erroneous programming sequence. The measuring method states how the attribute will be measured, in this case by the number of explicit user actionsrequired to perform the undo, regardless of where the user is in the programmingsequence.
The remaining four entries in the usability specification then provide the agreedcriteria for judging the success of the product based on the measuring method. Thenow level indicates the value for the measurement with the existing system, whetherit is computer based or not. The worst case value is the lowest acceptable measure-ment for the task, providing a clear distinction between what will be acceptable andwhat will be unacceptable in the final product. The planned level is the target for the design and the best case is the level which is agreed to be the best possible measurement given the current state of development tools and technology.
In the example, the designers can look at their previous VCR products and thoseof their competitors to determine a suitable now level. In this case, it is determinedthat no current model allows an undo which returns the state of the VCR to what itwas before the programming task. For example, if a VCR allows you three separaterecording programs, once you begin entering a new program in the number 1 pro-gram slot, the VCR forgets the previous contents of that slot and so you cannotrecover it unless you remember what it was and then reprogram it.
Table 6.1 Sample usability specification for undo with a VCR
Attribute: Backward recoverability
Measuring concept: Undo an erroneous programming sequenceMeasuring method: Number of explicit user actions to undo current programNow level: No current product allows such an undoWorst case: As many actions as it takes to program in mistakePlanned level: A maximum of two explicit user actionsBest case: One explicit cancel action

6.3 Usability engineering 239
Determining the worst case value depends on a number of things. Usually, itshould be no lower than the now level. The new product should provide someimprovement on the current state of affairs, and so it seems that at least some of theusability attributes should provide worst case values that are better than the nowlevel. Otherwise, why would the customer bother with the new system (unless it canbe shown to provide the same usability at a fraction of the cost)? The designers in theexample have determined that the minimal acceptable undo facility would requirethe user to perform as many actions as he had done to program in the mistake. This is a clear improvement over the now level, since it at least provides for the pos-sibility of undo. One way to provide such a capability would be by including an undobutton on the control panel, which would effectively reverse the previous non-undoaction. The designers figure that they should allow for the user to do a completerestoration of the VCR state in a maximum of two explicit user actions, though theyrecognize that the best case, at least in terms of the number of explicit actions, wouldrequire only one.
Tables 6.2 and 6.3, adapted from Whiteside, Bennett and Holtzblatt [377], providea list of measurement criteria which can be used to determine the measuring methodfor a usability attribute and the possible ways to set the worst/best case and planned/now level targets. Measurements such as those promoted by usability engineering arealso called usability metrics.
Table 6.2 Criteria by which measuring method can be determined (adapted fromWhiteside, Bennett and Holtzblatt [377], Copyright 1988, reprinted with permission from Elsevier)
1. Time to complete a task2. Per cent of task completed3. Per cent of task completed per unit time4. Ratio of successes to failures5. Time spent in errors6. Per cent or number of errors7. Per cent or number of competitors better than it8. Number of commands used9. Frequency of help and documentation use
10. Per cent of favorable/unfavorable user comments11. Number of repetitions of failed commands12. Number of runs of successes and of failures13. Number of times interface misleads the user14. Number of good and bad features recalled by users15. Number of available commands not invoked16. Number of regressive behaviors17. Number of users preferring your system18. Number of times users need to work around a problem19. Number of times the user is disrupted from a work task20. Number of times user loses control of the system21. Number of times user expresses frustration or satisfaction
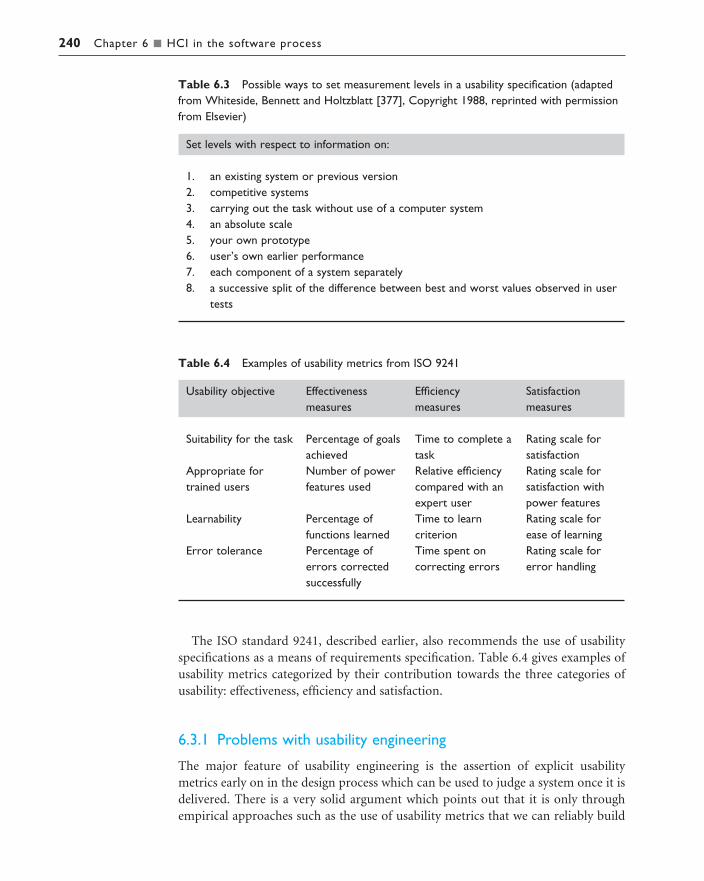
240 Chapter 6 n HCI in the software process
The ISO standard 9241, described earlier, also recommends the use of usabilityspecifications as a means of requirements specification. Table 6.4 gives examples ofusability metrics categorized by their contribution towards the three categories ofusability: effectiveness, efficiency and satisfaction.
6.3.1 Problems with usability engineering
The major feature of usability engineering is the assertion of explicit usability metrics early on in the design process which can be used to judge a system once it isdelivered. There is a very solid argument which points out that it is only throughempirical approaches such as the use of usability metrics that we can reliably build
Table 6.3 Possible ways to set measurement levels in a usability specification (adaptedfrom Whiteside, Bennett and Holtzblatt [377], Copyright 1988, reprinted with permissionfrom Elsevier)
Set levels with respect to information on:
1. an existing system or previous version2. competitive systems3. carrying out the task without use of a computer system4. an absolute scale5. your own prototype6. user’s own earlier performance7. each component of a system separately8. a successive split of the difference between best and worst values observed in user
tests
Table 6.4 Examples of usability metrics from ISO 9241
Usability objective
Suitability for the task
Appropriate for trained users
Learnability
Error tolerance
Effectivenessmeasures
Percentage of goalsachievedNumber of powerfeatures used
Percentage offunctions learnedPercentage oferrors correctedsuccessfully
Efficiency measures
Time to complete ataskRelative efficiencycompared with anexpert userTime to learncriterionTime spent oncorrecting errors
Satisfactionmeasures
Rating scale forsatisfactionRating scale forsatisfaction withpower featuresRating scale forease of learningRating scale forerror handling

6.4 Iterative design and prototyping 241
more usable systems. Although the ultimate yardstick for determining usability may be by observing and measuring user performance, that does not mean that these measurements are the best way to produce a predictive design process forusability.
The problem with usability metrics is that they rely on measurements of very specificuser actions in very specific situations. When the designer knows what the actionsand situation will be, then she can set goals for measured observations. However, atearly stages of design, designers do not have this information. Take our exampleusability specification for the VCR. In setting the acceptable and unacceptable levelsfor backward recovery, there is an assumption that a button will be available to invokethe undo. In fact, the designer was already making an implicit assumption that theuser would be making errors in the programming of the VCR. Why not address the origin of the programming errors, then maybe undo would not be necessary?
We should recognize another inherent limitation for usability engineering, that isit provides a means of satisfying usability specifications and not necessarily usability.The designer is still forced to understand why a particular usability metric enhancesusability for real people. Again, in the VCR example, the designer assumed that fewer explicit actions make the undo operation easier. Is that kind of assumptionwarranted?
ITERATIVE DESIGN AND PROTOTYPING
A point we raised earlier is that requirements for an interactive system cannot becompletely specified from the beginning of the life cycle. The only way to be sureabout some features of the potential design is to build them and test them out on real users. The design can then be modified to correct any false assumptions thatwere revealed in the testing. This is the essence of iterative design, a purposeful designprocess which tries to overcome the inherent problems of incomplete requirementsspecification by cycling through several designs, incrementally improving upon thefinal product with each pass.
The problems with the design process, which lead to an iterative design philo-sophy, are not unique to the usability features of the intended system. The problemholds for requirements specification in general, and so it is a general software engineering problem, together with technical and managerial issues.
On the technical side, iterative design is described by the use of prototypes, artifactsthat simulate or animate some but not all features of the intended system. There arethree main approaches to prototyping:
Throw-away The prototype is built and tested. The design knowledge gained from this exercise is used to build the final product, but the actual prototype isdiscarded. Figure 6.5 depicts the procedure in using throw-away prototypes to arrive at a final requirements specification in order for the rest of the designprocess to proceed.
6.4

242 Chapter 6 n HCI in the software process
Incremental The final product is built as separate components, one at a time.There is one overall design for the final system, but it is partitioned into inde-pendent and smaller components. The final product is then released as a series of products, each subsequent release including one more component. This isdepicted in Figure 6.6.
Evolutionary Here the prototype is not discarded and serves as the basis for thenext iteration of design. In this case, the actual system is seen as evolving from a very limited initial version to its final release, as depicted in Figure 6.7.Evolutionary prototyping also fits in well with the modifications which must bemade to the system that arise during the operation and maintenance activity inthe life cycle.
Prototypes differ according to the amount of functionality and performance theyprovide relative to the final product. An animation of requirements can involve no
Figure 6.5 Throw-away prototyping within requirements specification
Figure 6.6 Incremental prototyping within the life cycle

6.4 Iterative design and prototyping 243
real functionality, or limited functionality to simulate only a small aspect of theinteractive behavior for evaluative purposes. At the other extreme, full functionalitycan be provided at the expense of other performance characteristics, such as speed or error tolerance. Regardless of the level of functionality, the importance of a pro-totype lies in its projected realism. The prototype of an interactive system is used totest requirements by evaluating their impact with real users. An honest appraisal ofthe requirements of the final system can only be trusted if the evaluation conditionsare similar to those anticipated for the actual operation. But providing realism iscostly, so there must be support for a designer/programmer to create a realistic pro-totype quickly and efficiently.
On the management side, there are several potential problems, as pointed out bySommerville [327]:
Time Building prototypes takes time and, if it is a throw-away prototype, it can beseen as precious time taken away from the real design task. So the value of proto-typing is only appreciated if it is fast, hence the use of the term rapid prototyping.However, rapid development and manipulation of a prototype should not be mis-taken for rushed evaluation which might lead to erroneous results and invalidatethe only advantage of using a prototype in the first place.
Planning Most project managers do not have the experience necessary for adequately planning and costing a design process which involves prototyping.
Non-functional features Often the most important features of a system will benon-functional ones, such as safety and reliability, and these are precisely thekinds of features which are sacrificed in developing a prototype. For evaluatingusability features of a prototype, response time – yet another feature often com-promised in a prototype – could be critical to product acceptance. This problemis similar to the technical issue of prototype realism.
Figure 6.7 Evolutionary prototyping throughout the life cycle

244 Chapter 6 n HCI in the software process
Contracts The design process is often governed by contractual agreements betweencustomer and designer which are affected by many of these managerial and tech-nical issues. Prototypes and other implementations cannot form the basis for alegal contract, and so an iterative design process will still require documentationwhich serves as the binding agreement. There must be an effective way of trans-lating the results derived from prototyping into adequate documentation. A rapidprototyping process might be amenable to quick changes, but that does not alsoapply to the design process.
6.4.1 Techniques for prototyping
Here we will describe some of the techniques that are available for producing rapidprototypes.
Storyboards
Probably the simplest notion of a prototype is the storyboard, which is a graphicaldepiction of the outward appearance of the intended system, without any accom-panying system functionality. Storyboards do not require much in terms of com-puting power to construct; in fact, they can be mocked up without the aid of anycomputing resource. The origins of storyboards are in the film industry, where aseries of panels roughly depicts snapshots from an intended film sequence in orderto get the idea across about the eventual scene. Similarly, for interactive systemdesign, the storyboards provide snapshots of the interface at particular points in theinteraction. Evaluating customer or user impressions of the storyboards can deter-mine relatively quickly if the design is heading in the right direction.
Modern graphical drawing packages now make it possible to create storyboardswith the aid of a computer instead of by hand. Though the graphic design achievableon screen may not be as sophisticated as that possible by a professional graphicdesigner, it is more realistic because the final system will have to be displayed on ascreen. Also, it is possible to provide crude but effective animation by automatedsequencing through a series of snapshots. Animation illustrates the dynamic aspectsof the intended user–system interaction, which may not be possible with traditionalpaper-based storyboards. If not animated, storyboards usually include annotationsand scripts indicating how the interaction will occur.
Limited functionality simulations
More functionality must be built into the prototype to demonstrate the work that theapplication will accomplish. Storyboards and animation techniques are not sufficientfor this purpose, as they cannot portray adequately the interactive aspects of the system.To do this, some portion of the functionality must be simulated by the design team.
Programming support for simulations means a designer can rapidly build graph-ical and textual interaction objects and attach some behavior to those objects, whichmimics the system’s functionality. Once this simulation is built, it can be evaluatedand changed rapidly to reflect the results of the evaluation study with various users.

6.4 Iterative design and prototyping 245
For example, we might want to build a prototype for the VCR with undo describedearlier using only a workstation display, keyboard and mouse. We could draw a pictureof the VCR with its control panel using a graphics drawing package, but then we wouldwant to allow a subject to use the mouse to position a finger cursor over one of thebuttons to ‘press’ it and actuate some behavior of the VCR. In this way, we couldsimulate the programming task and experiment with different options for undoing.
DESIGN FOCUS
Prototyping in practice
IBM supplied the computerized information and messaging booths for the 1984 Olympics in LosAngeles. These booths were to be used by the many thousands of residents in the Olympic village whowould have to use them with no prior training (extensive instructions in several hundred languagesbeing impractical). IBM sampled several variants on the kiosk design of the telephone-based system,using what they called the hallway and storefront methodology [152]. The final system was intended tobe a walk-up-and-use system, so it was important to get comments from people with no knowledge ofthe process. Early versions of the kiosk were displayed as storyboards on a mock kiosk design in thefront hallway of the Yorktown Research Lab. Passers-by were encouraged to browse at the displaymuch as they would a storefront in the window. As casual comments were made and the kiosk wasmodified according to those comments, more and more active evaluation was elicited. This procedurehelped to determine the ultimate positioning of display screens and telephones for the final design.
An Olympic Message System Kiosk (Gould J. D., Boies S. J., Levy S., Richards J. T. and Schoonard J. (1987).The 1984 Olympic Message System: a test of behavioral principles of system design. Communications ofthe ACM, 30(9), 758–69. Copyright © 1987 ACM, Inc. Reprinted by permission)

246 Chapter 6 n HCI in the software process
There are now plenty of prototyping tools available which allow the rapid develop-ment of such simulation prototypes. These simulation tools are meant to provide a quick development process for a very wide range of small but highly interactiveapplications. A well-known and successful prototyping tool is HyperCard, a simula-tion environment for the Macintosh line of Apple computers. HyperCard is similarto the animation tools described above in that the user can create a graphical depic-tion of some system, say the VCR, with common graphical tools. The graphicalimages are placed on cards, and links between cards can be created which control thesequencing from one card to the next for animation effects. What HyperCard pro-vides beyond this type of animation is the ability to describe more sophisticatedinteractive behavior by attaching a script, written in the HyperTalk programminglanguage, to any object. So for the VCR, we could attach a script to any control panelbutton to highlight it or make an audible noise when the user clicks the mouse cur-sor over it. Then some functionality could be associated to that button by reflectingsome change in the VCR display window. Similar functionality is provided throughtools such as Macromedia Flash and Director.
Most of the simulations produced are intended to be throw-away prototypesbecause of their relatively inefficient implementation. They are not intended to sup-port full-blown systems development and they are unsatisfactory in that role.However, as more designers recognize the utility of prototyping and iterative design,they are beginning to demand ways of incorporating the prototypes into the finaldelivered systems – more along the lines of evolutionary prototyping. A good exam-ple of this is in the avionics industry, where it has long been recognized that iterativedevelopment via rapid prototyping and evaluation is essential for the design of flightdeck instrumentation and controls. Workstation technology provides sufficientgraphics capabilities to enable a designer to produce very realistic gauges, which canbe assessed and critiqued by actual pilots. With the advent of the glass cockpit – inwhich traditional mechanical gauges are replaced by gauges represented on videodisplays – there is no longer a technology gap between the prototype designs of flightdeck instruments and the actual instruments in flight. Therefore, it is a reasonablerequest by these designers that they be able to reuse the functionality of the proto-types in the actual flight simulators and cockpits, and this demand is starting to bemet by commercial prototyping systems which produce efficient code for use in suchsafety-critical applications.
One technique for simulation, which does not require very much computer-supported functionality, is the Wizard of Oz technique. With this technique, thedesigners can develop a limited functionality prototype and enhance its functional-ity in evaluation by providing the missing functionality through human interven-tion. A participant in the evaluation of a new accounting system may not have anycomputer training but is familiar with accounting procedures. He is asked to sitdown in front of the prototype accounting system and to perform some task, say to check the accounts receivable against some newly arrived payments. The naïvecomputer user will not know the specific language of the system, but you do notwant him to worry about that. Instead, he is given instructions to type whateverseems the most natural commands to the system. One of the designers – the wizard

6.4 Iterative design and prototyping 247
in this scenario – is situated in another room, out of sight of the subject, but she isable to receive the subject’s input commands and translate them into commands thatwill work on the prototype. By intervening between the user and system, the wizardis able to increase the perceived functionality of the system so that evaluation canconcentrate on how the subject would react to the complete system. Examination ofhow the wizard had to interpret the subject’s input can provide advice as to how theprototype must be enhanced in its later versions.
High-level programming support
HyperTalk was an example of a special-purpose high-level programming languagewhich makes it easy for the designer to program certain features of an interactive sys-tem at the expense of other system features like speed of response or space efficiency.HyperTalk and many similar languages allow the programmer to attach functionalbehavior to the specific interactions that the user will be able to do, such as positionand click on the mouse over a button on the screen. Previously, the difficulty ofinteractive programming was that it was so implementation dependent that the programmer would have to know quite a bit of intimate detail of the hardware sys-tem in order to control even the simplest of interactive behavior. These high-levelprogramming languages allow the programmer to abstract away from the hardwarespecifics and think in terms that are closer to the way the input and output devicesare perceived as interaction devices.
Though not usually considered together with such simulation environments, a user interface management system – or UIMS (pronounced ‘you-imz’) – can be con-sidered to provide such high-level programming support. The frequent conceptualmodel put forth for interactive system design is to separate the application function-ality from its presentation. It is then possible to program the underlying functional-ity of the system and to program the behavior of the user interface separately. The job of a UIMS, then, is to allow the programmer to connect the behavior at theinterface with the underlying functionality. In Chapter 8 we will discuss in moredetail the advantages and disadvantages of such a conceptual model and concentrateon the programming implementation support provided by a UIMS. What is of interest here is that the separation implied by a UIMS allows the independent development of the features of the interface apart from the underlying functionality.If the underlying system is already developed, then various prototypes of its interfacecan be quickly constructed and evaluated to determine the optimal one.
6.4.2 Warning about iterative design
Though we have presented the process of iterative design as not only beneficial butalso necessary for good interactive system design, it is important to recognize someof its drawbacks, in addition to the very real management issues we have alreadyraised. The ideal model of iterative design, in which a rapid prototype is designed,evaluated and modified until the best possible design is achieved in the given projecttime, is appealing. But there are two problems.

248 Chapter 6 n HCI in the software process
First, it is often the case that design decisions made at the very beginning of theprototyping process are wrong and, in practice, design inertia can be so great asnever to overcome an initial bad decision. So, whereas iterative design is, in theory,amenable to great changes through iterations, it can be the case that the initial pro-totype has bad features that will not be amended. We will examine this problemthrough a real example of a clock on a microwave oven.2 The clock has a numericdisplay of four digits. Thus the display is capable of showing values in the range from00:00 to 99:99. The functional model of time for the actual clock is only 12 hours,so quite a few of the possible clock displays do not correspond to possible times (forexample, 63:00, 85:49), even though some of them are legal four-digit time desig-nations. That poses no problem, as long as both the designer and the ultimate usersof the clock both share the knowledge of the discrepancy between possible clock dis-plays and legal times. Such would not be the case for someone assuming a 24-hourtime format, in which case the displays 00:30 and 13:45 would represent validtimes in their model but not in the microwave’s model. In this particular example,the subjects tested during the evaluation must have all shared the 12-hour timemodel, and the mismatch with the other users (with a 24-hour model) was only dis-covered after the product was being shipped. At this point, the only impact of iterat-ive design was a change to the documentation alerting the reader to the 12-hour format, as it was too late to perform any hardware change.
The second problem is slightly more subtle, and serious. If, in the process of evalu-ation, a potential usability problem is diagnosed, it is important to understand thereason for the problem and not just detect the symptom. In the clock example, thedesigners could have noticed that some subjects with a 24-hour time model werehaving difficulty setting the time. Say they were trying to set the time for 14:45, butthey were not being allowed to do that. If the designers did not know the subject’sgoals, they might not detect the 24/12 hour discrepancy. They would instead noticethat the users were having trouble setting the time and so they might change the but-tons used to set the time instead of other possible changes, such as an analog timedial, or displaying AM or PM on the clock dial to make the 12-hour model moreobvious, or to change to a 24-hour clock.
The moral for iterative design is that it should be used in conjunction with other, more principled approaches to interactive system design. These principledapproaches are the subject of Part 3 of this book.
DESIGN RATIONALE
In designing any computer system, many decisions are made as the product goes from a set of vague customer requirements to a deliverable entity. Often it isdifficult to recreate the reasons, or rationale, behind various design decisions. Design
6.5
2 This example has been provided by Harold Thimbleby.

6.5 Design rationale 249
rationale is the information that explains why a computer system is the way it is,including its structural or architectural description and its functional or behavioraldescription. In this sense, design rationale does not fit squarely into the software lifecycle described in this chapter as just another phase or box. Rather, design rationalerelates to an activity of both reflection (doing design rationale) and documentation(creating a design rationale) that occurs throughout the entire life cycle.
It is beneficial to have access to the design rationale for several reasons:
n In an explicit form, a design rationale provides a communication mechanismamong the members of a design team so that during later stages of design and/ormaintenance it is possible to understand what critical decisions were made, whatalternatives were investigated (and, possibly, in what order) and the reason whyone alternative was chosen over the others. This can help avoid incorrect assump-tions later.
n Accumulated knowledge in the form of design rationales for a set of products can be reused to transfer what has worked in one situation to another situationwhich has similar needs. The design rationale can capture the context of a designdecision in order that a different design team can determine if a similar rationaleis appropriate for their product.
n The effort required to produce a design rationale forces the designer to deliberatemore carefully about design decisions. The process of deliberation can be assistedby the design rationale technique by suggesting how arguments justifying or discarding a particular design option are formed.
In the area of HCI, design rationale has been particularly important, again for severalreasons:
n There is usually no single best design alternative. More often, the designer is facedwith a set of trade-offs between different alternatives. For example, a graphicalinterface may involve a set of actions that the user can invoke by use of the mouseand the designer must decide whether to present each action as a ‘button’ on thescreen, which is always visible, or hide all of the actions in a menu which must beexplicitly invoked before an action can be chosen. The former option maximizesthe operation visibility (see Chapter 7) but the latter option takes up less screenspace. It would be up to the designer to determine which criterion for evaluatingthe options was more important and then communicating that information in adesign rationale.
n Even if an optimal solution did exist for a given design decision, the space of altern-atives is so vast that it is unlikely a designer would discover it. In this case, it isimportant that the designer indicates all alternatives that have been investigated.Then later on it can be determined if she has not considered the best solution orhad thought about it and discarded it for some reason. In project management,this kind of accountability for design is good.
n The usability of an interactive system is very dependent on the context of its use.The flashiest graphical interface is of no use if the end-user does not have accessto a high-quality graphics display or a pointing device. Capturing the context in

250 Chapter 6 n HCI in the software process
which a design decision is made will help later when new products are designed.If the context remains the same, then the old rationale can be adopted withoutrevision. If the context has changed somehow, the old rationale can be re-examined to see if any rejected alternatives are now more favorable or if any newalternatives are now possible.
Lee and Lai [209] explain that various proponents of design rationale have differ-ent interpretations of what it actually is. We will make use of their classification todescribe various design rationale techniques in this section. The first set of tech-niques concentrates on providing a historical record of design decisions and is verymuch tailored for use during actual design discussions. These techniques are referredto as process-oriented design rationale because they are meant to be integrated in theactual design process itself. The next category is not so concerned with historical orprocess-oriented information but rather with the structure of the space of all designalternatives, which can be reconstructed by post hoc consideration of the designactivity. The structure-oriented approach does not capture historical information.Instead, it captures the complete story of the moment, as an analysis of the designspace which has been considered so far. The final category of design rationale con-centrates on capturing the claims about the psychology of the user that are impliedby an interactive system and the tasks that are performed on them.
There are some issues that distinguish the various techniques in terms of theirusability within design itself. We can use these issues to sketch an informal rationale fordesign rationale. One issue is the degree to which the technique impinges on the designprocess. Does the use of a particular design rationale technique alter the decision pro-cess, or does it just passively serve to document it? Another issue is the cost of usingthe technique, both in terms of creating the design rationale and in terms of access-ing it once created. A related issue is the amount of computational power the designrationale provides and the level to which this is supported by automated tools. A designrationale for a complex system can be very large and the exploration of the design spacechanges over time. The kind of information stored in a given design rationale willaffect how that vast amount of information can be effectively managed and browsed.
6.5.1 Process-oriented design rationale
Much of the work on design rationale is based on Rittel’s issue-based information system, or IBIS, a style for representing design and planning dialog developed in the 1970s [308]. In IBIS (pronounced ‘ibbiss’), a hierarchical structure to a designrationale is created. A root issue is identified which represents the main problem orquestion that the argument is addressing. Various positions are put forth as potentialresolutions for the root issue, and these are depicted as descendants in the IBIS hierarchy directly connected to the root issue. Each position is then supported orrefuted by arguments, which modify the relationship between issue and position. Thehierarchy grows as secondary issues are raised which modify the root issue in someway. Each of these secondary issues is in turn expanded by positions and arguments,further sub-issues, and so on.

6.5 Design rationale 251
A graphical version of IBIS has been defined by Conklin and Yakemovic [77],called gIBIS (pronounced ‘gibbiss’), which makes the structure of the design ratio-nale more apparent visually in the form of a directed graph which can be directlyedited by the creator of the design rationale. Figure 6.8 gives a representation of thegIBIS vocabulary. Issues, positions and arguments are nodes in the graph and theconnections between them are labeled to clarify the relationship between adjacentnodes. So, for example, an issue can suggest further sub-issues, or a position canrespond to an issue or an argument can support a position. The gIBIS structure canbe supported by a hypertext tool to allow a designer to create and browse variousparts of the design rationale.
There have been other versions of the IBIS notation, both graphical and textual,besides gIBIS. Most versions retain the distinction between issues, positions andarguments. Some add further nodes, such as Potts and Bruns’s [297] addition ofdesign artifacts which represent the intermediate products of a design that lead to thefinal product and are associated with the various alternatives discussed in the designrationale. Some add a richer vocabulary to modify the relationships between thenode elements, such as McCall’s Procedural Hierarchy of Issues (PHI) [231], whichexpands the variety of inter-issue relationships. Interesting work at the University of Colorado has attempted to link PHI argumentation to computer-aided design(CAD) tools to allow critique of design (in their example, the design of a kitchen) asit occurs. When the CAD violates some known design rule, the designer is warnedand can then browse a PHI argument to see the rationale for the design rule.
Figure 6.8 The structure of a gIBIS design rationale

252 Chapter 6 n HCI in the software process
The use of IBIS and any of its descendants is process oriented, as we describedabove. It is intended for use during design meetings as a means of recording andstructuring the issues deliberated and the decisions made. It is also intended to preserve the order of deliberation and decision making for a particular product,placing less stress on the generalization of design knowledge for use between dif-ferent products. This can be contrasted with the structure-oriented technique discussed next.
6.5.2 Design space analysis
MacLean and colleagues [222] have proposed a more deliberative approach to designrationale which emphasizes a post hoc structuring of the space of design alternativesthat have been considered in a design project. Their approach, embodied in theQuestions, Options and Criteria (QOC) notation, is characterized as design spaceanalysis (see Figure 6.9).
The design space is initially structured by a set of questions representing the majorissues of the design. Since design space analysis is structure oriented, it is not so important that the questions recorded are the actual questions asked duringdesign meetings. Rather, these questions represent an agreed characterization of the
Figure 6.9 The QOC notation
6.5 Design rationale 253
issues raised based on reflection and understanding of the actual design activities.Questions in a design space analysis are therefore similar to issues in IBIS except in the way they are captured. Options provide alternative solutions to the question.They are assessed according to some criteria in order to determine the most favorable option. In Figure 6.9 an option which is favorably assessed in terms of a criterion is linked with a solid line, whereas negative links have a dashed line. The most favorable option is boxed in the diagram.
The key to an effective design space analysis using the QOC notation is decidingthe right questions to use to structure the space and the correct criteria to judge theoptions. The initial questions raised must be sufficiently general that they cover alarge enough portion of the possible design space, but specific enough that a rangeof options can be clearly identified. It can be difficult to decide the right set of criteria with which to assess the options. The QOC technique advocates the use ofgeneral criteria, like the usability principles we shall discuss in Chapter 7, which areexpressed more explicitly in a given analysis. In the example of the action buttonsversus the menu of actions described earlier, we could contextualize the general principle of operation visibility as the criterion that all possible actions are displayedat all times. It can be very difficult to decide from a design space analysis whichoption is most favorable. The positive and negative links in the QOC notation do not provide all of the context for a trade-off decision. There is no provision forindicating, for example, that one criterion is more important than any of the othersand the most favorable option must be positively linked.
Another structure-oriented technique, called Decision Representation Language(DRL), developed by Lee and Lai, structures the design space in a similar fashion to QOC, though its language is somewhat larger and it has a formal semantics. The questions, options and criteria in DRL are given the names: decision problem,alternatives and goals. QOC assessments are represented in DRL by a more complexlanguage for relating goals to alternatives. The sparse language in QOC used to assessan option relative to a criterion (positive or negative assessment only) is probablyinsufficient, but there is a trade-off involved in adopting a more complex vocabularywhich may prove too difficult to use in practice. The advantage of the formal seman-tics of DRL is that the design rationale can be used as a computational mechanismto help manage the large volume of information. For example, DRL can track thedependencies between different decision problems, so that subsequent changes tothe design rationale for one decision problem can be automatically propagated toother dependent problems.
Design space analysis directly addresses the claim that no design activity can hopeto uncover all design possibilities, so the best we can hope to achieve is to documentthe small part of the design space that has been investigated. An advantage of the posthoc technique is that it can abstract away from the particulars of a design meetingand therefore represent the design knowledge in such a way that it can be of use inthe design of other products. The major disadvantage is the increased overhead suchan analysis warrants. More time must be taken away from the design activity to dothis separate documentation task. When time is scarce, these kinds of overhead costsare the first to be trimmed.

254 Chapter 6 n HCI in the software process
6.5.3 Psychological design rationale
The final category of design rationale tries to make explicit the psychological claimsof usability inherent in any interactive system in order better to suit a product for the tasks users have. This psychological design rationale has been introduced byCarroll and Rosson [62], and before we describe the application of the technique itis important to understand some of its theoretical background.
People use computers to accomplish some tasks in their particular work domain,as we have seen before. When designing a new interactive system, the designers takeinto account the tasks that users currently perform and any new ones that they maywant to perform. This task identification serves as part of the requirements for thenew system, and can be done through empirical observation of how people performtheir work currently and presented through informal language or a more formal task analysis language (see Chapter 15). When the new system is implemented, or becomes an artifact, further observation reveals that in addition to the requiredtasks it was built to support, it also supports users in tasks that the designer neverintended. Once designers understand these new tasks, and the associated problemsthat arise between them and the previously known tasks, the new task definitions canserve as requirements for future artifacts.
Carroll refers to this real-life phenomenon as the task–artifact cycle. He provides agood example of this cycle through the evolution of the electronic spreadsheet.When the first electronic spreadsheet, VisiCalc, was marketed in the late 1970s, it waspresented simply as an automated means of supporting tabular calculation, a taskcommonly used in the accounting world. Within little over a decade of its introduc-tion, the application of spreadsheets had far outstripped its original intent withinaccounting. Spreadsheets were being used for all kinds of financial analysis, ‘what-if ’simulations, report formatting and even as a general programming languageparadigm! As the set of tasks expands, new spreadsheet products have flooded themarketplace trying to satisfy the growing customer base. Another good example of the task–artifact cycle in action is with word processing, which was originallyintroduced to provide more automated support for tasks previously achieved with atypewriter and now provides users with the ability to carry out various authoringtasks that they never dreamed possible with a conventional typewriter. And today,the tasks for the spreadsheet and the word processor are intermingled in the sameartifact.
The purpose of psychological design rationale is to support this natural task–artifact cycle of design activity. The main emphasis is not to capture the designer’sintention in building the artifact. Rather, psychological design rationale aims tomake explicit the consequences of a design for the user, given an understanding ofwhat tasks he intends to perform. Previously, these psychological consequences wereleft implicit in the design, though designers would make informal claims about theirsystems (for example, that it is more ‘natural’ for the user, or easier to learn).
The first step in the psychological design rationale is to identify the tasks that theproposed system will address and to characterize those tasks by questions that theuser tries to answer in accomplishing them. For instance, Carroll gives an example

6.5 Design rationale 255
of designing a system to help programmers learn the Smalltalk object-oriented programming language environment. The main task the system is to support islearning how Smalltalk works. In learning about the programming environment, theprogrammer will perform tasks that help her answer the questions:
n What can I do: that is, what are the possible operations or functions that this programming environment allows?
n How does it work: that is, what do the various functions do?n How can I do this: that is, once I know a particular operation I want to perform,
how do I go about programming it?
For each question, a set of scenarios of user–system behavior is suggested to supportthe user in addressing the question. For example, to address the question ‘What canI do?’, the designers can describe a scenario whereby the novice programmer is firstconfronted with the learning environment and sees that she can invoke some demoprograms to investigate how Smalltalk programs work. The initial system can thenbe implemented to provide the functionality suggested by the scenarios (for example,some demos would be made accessible and obvious to the user/programmer fromthe very beginning). Once this system is running, observation of its use and somedesigner reflection is used to produce the actual psychological design rationale forthat version of the system. This is where the psychological claims are made explicit.For example, there is an assumption that the programmer knows that what she cansee on the screen relates to what she can do (if she sees the list of programs under aheading ‘Demos’, she can click on one program name to see the associated demo).The psychological claim of this demo system is that the user learns by doing, whichis a good thing. However, there may also be negative aspects that are equally import-ant to mention. The demo may not be very interactive, in which case the user clickson it to initiate it and then just sits back and watches a graphic display, never reallylearning how the demo application is constructed in Smalltalk. These negativeaspects can be used to modify later versions of the system to allow more interactivedemos, which represent realistic, yet simple, applications, whose behavior and struc-ture the programmer can appreciate.
By forcing the designer to document the psychological design rationale, it is hoped that she will become more aware of the natural evolution of user tasks and theartifact, taking advantage of how consequences of one design can be used to improvelater designs.
Worked exercise What is the distinction between a process-oriented and a structure-oriented design rationaletechnique? Would you classify psychological design rationale as process or structure oriented?Why?
Answer The distinction between a process- and structure-oriented design rationale resides inwhat information the design rationale attempts to capture. Process-oriented designrationale is interested in recording an historically accurate description of a design teammaking some decision on a particular issue for the design. In this sense, process-oriented design rationale becomes an activity concurrent with the rest of the design
256 Chapter 6 n HCI in the software process
process. Structure-oriented design rationale is less interested in preserving the histor-ical evolution of the design. Rather, it is more interested in providing the conclusions ofthe design activity, so it can be done in a post hoc and reflective manner after the fact.
The purpose of psychological design rationale is to support the task–artifact cycle. Here,the tasks that the users perform are changed by the systems on which they perform thetasks. A psychological design rationale proceeds by having the designers of the systemrecord what they believe are the tasks that the system should support and then build-ing the system to support the tasks. The designers suggest scenarios for the tasks whichwill be used to observe new users of the system. Observations of the users provide theinformation needed for the actual design rationale of that version of the system. Theconsequences of the design’s assumptions about the important tasks are then gaugedagainst the actual use in an attempt to justify the design or suggest improvements.
Psychological design rationale is mainly a process-oriented approach. The activity of a claims analysis is precisely about capturing what the designers assumed about the system at one point in time and how those assumptions compared with actual use.Therefore, the history of the psychological design rationale is important. The disciplineinvolved in performing a psychological design rationale requires designers to performthe claims analysis during the actual design activity, and not as post hoc reconstruction.
SUMMARY
In this chapter, we have shown how software engineering and the design processrelate to interactive system design. The software engineering life cycle aims to struc-ture design in order to increase the reliability of the design process. For interactivesystem design, this would equate to a reliable and reproducible means of designingpredictably usable systems. Because of the special needs of interactive systems, it isessential to augment the standard life cycle in order to address issues of HCI.
Usability engineering encourages incorporating explicit usability goals within thedesign process, providing a means by which the product’s usability can be judged.Iterative design practices admit that principled design of interactive systems alonecannot maximize product usability, so the designer must be able to evaluate earlyprototypes and rapidly correct features of the prototype which detract from theproduct usability.
The design process is composed of a series of decisions, which pare down the vast set of potential systems to the one that is actually delivered to the customer.Design rationale, in its many forms, is aimed at allowing the designer to manage theinformation about the decision-making process, in terms of when and why designdecisions were made and what consequences those decisions had for the user inaccomplishing his work.
6.6
Recommended reading 257
RECOMMENDED READING
J. A. McDermid, editor, The Software Engineer’s Reference Book, Butterworth–Heinemann, 1992.A very good general reference book for all topics in software engineering. In particular, we refer you to Chapter 15 on software life cycles and Chapter 40 onprototyping.
I. Sommerville, Software Engineering, 6th edition, Addison-Wesley, 2000.This textbook is one of the few texts in software engineering that specifically treatsissues of interface design.
X. Faulkner, Usability Engineering, Macmillan, 2000.An excellent and accessible introduction to usability engineering covering,amongst other things, user requirements capture and usability metrics.
J. Whiteside, J. Bennett and K. Holtzblatt, Usability engineering: our experience andevolution. In M. Helander, editor, Handbook for Human–Computer Interaction,North-Holland, 1988.The seminal work on usability engineering. More recent work on usability engi-neering has also been published by Jakob Nielsen [260, 261].
J. M. Carroll and T. P. Moran, editors, Design Rationale: Concepts, Techniques andUse, Lawrence Erlbaum, 1996.Expanded from a double special journal issue, this provides comprehensive coverage of relevant work in the field.
EXERCISES
6.1 (a) How can design rationale benefit interface design and why might it be rejected bydesign teams?
(b) Explain QOC design rationale using an example to illustrate.
6.2 Imagine you have been asked to produce a prototype for the diary system discussed in the workedexercise in Section 7.2.3. What would be an appropriate prototyping approach to enable you totest the design using the usability metrics specified, and why?
DESIGN RULES
OV E RV I E W
n Designing for maximum usability is the goal ofinteractive systems design.
n Abstract principles offer a way of understandingusability in a more general sense, especially if we canexpress them within some coherent catalog.
n Design rules in the form of standards and guidelinesprovide direction for design, in both general and moreconcrete terms, in order to enhance the interactiveproperties of the system.
n The essential characteristics of good design are oftensummarized through ‘golden rules’ or heuristics.
n Design patterns provide a potentially generativeapproach to capturing and reusing design knowledge.
7

7.1 Introduction 259
INTRODUCTION
One of the central problems that must be solved in a user-centered design process ishow to provide designers with the ability to determine the usability consequences oftheir design decisions. We require design rules, which are rules a designer can followin order to increase the usability of the eventual software product. We can classifythese rules along two dimensions, based on the rule’s authority and generality. Byauthority, we mean an indication of whether or not the rule must be followed indesign or whether it is only suggested. By generality, we mean whether the rule canbe applied to many design situations or whether it is focussed on a more limitedapplication situation. Rules also vary in their level of abstraction, with some abstract-ing away from the detail of the design solution and others being quite specific. It isalso important to determine the origins of a design rule. We will consider a numberof different types of design rules. Principles are abstract design rules, with high gen-erality and low authority. Standards are specific design rules, high in authority andlimited in application, whereas guidelines tend to be lower in authority and moregeneral in application.
Design rules for interactive systems can be supported by psychological, cognitive,ergonomic, sociological, economic or computational theory, which may or may not have roots in empirical evidence. Designers do not always have the relevant background in psychology, cognitive science, ergonomics, sociology, business orcomputer science necessary to understand the consequences of those theories in the instance of the design they are creating. The design rules are used to apply thetheory in practice. Often a set of design rules will be in conflict with each other,meaning that strict adherence to all of them is impossible. The theory underlying theseparate design rules can help the designer understand the trade-off for the designthat would result in following or disregarding some of the rules. Usually, the moregeneral a design rule is, the greater the likelihood that it will conflict with other rulesand the greater the need for the designer to understand the theory behind it.
We can make another rough distinction between principles, standards and guide-lines. Principles are derived from knowledge of the psychological, computationaland sociological aspects of the problem domains and are largely independent of thetechnology; they depend to a much greater extent on a deeper understanding of thehuman element in the interaction. They can therefore be applied widely but are notso useful for specific design advice. Guidelines are less abstract and often more tech-nology oriented, but as they are also general, it is important for a designer to knowwhat theoretical evidence there is to support them. A designer will have less of a needto know the underlying theory for applying a standard. However, since standardscarry a much higher level of authority, it is more important that the theory under-lying them be correct or sound.
The previous chapter was about the process of design, and we need to considerwhen design rules can be of use within that process. Design rules are mechanisms forrestricting the space of design options, preventing a designer from pursuing designoptions that would be likely to lead to an unusable system. Thus, design rules would
7.1

260 Chapter 7 n Design rules
be most effective if they could be adopted in the earliest stages of the life cycle, suchas in requirements specification and architectural design, when the space of possibledesigns is still very large. We have already seen, for example, in Chapter 6, howabstract principles can be applied in usability engineering.
However, if the designer does not understand the assumptions underlying adesign rule, it is quite possible that early application can prevent the best designchoice. For example, a set of design rules might be specific to a particular hardwareplatform and inappropriate for other platforms (for example, color versus mono-chrome screens, one- versus two- or three-button mouse). Such bias in some designrules causes them to be applicable only in later stages of the life cycle.
We will first discuss abstract principles, then go on to consider in more depthsome examples of standards and guidelines for user-centered design. Finally, we willconsider some well-known heuristics or ‘golden rules’ which, it has been suggested,provide a succinct summary of the essence of good design. We end the chapter with a discussion of design patterns, a relatively new approach to capturing designknowledge in HCI.
PRINCIPLES TO SUPPORT USABILITY
The most abstract design rules are general principles, which can be applied to thedesign of an interactive system in order to promote its usability. In Chapter 4 welooked at the different paradigms that represent the development of interactive systems. Derivation of principles for interaction has usually arisen out of a need to explain why a paradigm is successful and when it might not be. Principles can provide the repeatability which paradigms in themselves cannot provide. In this sec-tion we present a collection of usability principles. Since it is too bold an objective to produce a comprehensive catalog of such principles, our emphasis will be on struc-turing the presentation of usability principles in such a way that the catalog can beeasily extended as our knowledge increases.
The principles we present are first divided into three main categories:
Learnability – the ease with which new users can begin effective interaction andachieve maximal performance.
Flexibility – the multiplicity of ways in which the user and system exchange information.
Robustness – the level of support provided to the user in determining successfulachievement and assessment of goals.
In the following, we will subdivide these main categories into more specific prin-ciples that support them. In most cases, we are able to situate these more specificprinciples within a single category, but we have made explicit those cases when aprinciple falls into two of the above categories.
7.2

7.2 Principles to support usability 261
7.2.1 Learnability
Learnability concerns the features of the interactive system that allow novice users tounderstand how to use it initially and then how to attain a maximal level of perform-ance. Table 7.1 contains a summary of the specific principles that support learn-ability, which we will describe below.
Predictability
Except when interacting with some video games, a user does not take very well tosurprises. Predictability of an interactive system means that the user’s knowledge ofthe interaction history is sufficient to determine the result of his future interactionwith it. There are many degrees to which predictability can be satisfied. The knowledgecan be restricted to the presently perceivable information, so that the user need notremember anything other than what is currently observable. The knowledge require-ment can be increased to the limit where the user is actually forced to remember whatevery previous keystroke was and what every previous screen display contained (andthe order of each!) in order to determine the consequences of the next input action.
Predictability of an interactive system is distinguished from deterministic behavior of the computer system alone. Most computer systems are ultimately deter-ministic machines, so that given the state at any one point in time and the operationwhich is to be performed at that time, there is only one possible state that can result. Predictability is a user-centered concept; it is deterministic behavior from theperspective of the user. It is not enough for the behavior of the computer system tobe determined completely from its state, as the user must be able to take advantageof the determinism.
Table 7.1 Summary of principles affecting learnability
Principle
Predictability
Synthesizability
Familiarity
Generalizability
Consistency
Related principles
Operation visibility
Immediate/eventualhonestyGuessability,affordance
–
–
Definition
Support for the user to determine the effect offuture action based on past interaction historySupport for the user to assess the effect of past operations on the current stateThe extent to which a user’s knowledge andexperience in other real-world or computer-based domains can be applied when interactingwith a new systemSupport for the user to extend knowledge of specific interaction within and acrossapplications to other similar situationsLikeness in input–output behavior arising fromsimilar situations or similar task objectives

262 Chapter 7 n Design rules
For example, a common mathematical puzzle would be to present you with asequence of three or more numbers and ask you what would be the next number inthe sequence. The assumption in this puzzle (and one that can often be incorrect) isthat there is a unique function or algorithm that produces the entire sequence ofnumbers and it is up you to figure it out. We know the function, but all you knoware the results it provides from the first three calculations. The function is certainlydeterministic; the test for you is a test of its predictability given the first three num-bers in the sequence.
As another, possibly more pertinent, example, imagine you have created a com-plex picture using a mouse-driven graphical drawing package. You leave the picturefor a few days and then go back to change it around a bit. You are allowed to selectcertain objects for editing by positioning the mouse over the object and clicking amouse button to highlight it. Can you tell what the set of selectable objects is? Canyou determine which area of the screen belongs to which of these objects, especiallyif some objects overlap? Does the visual image on the screen indicate what objectsform a compound object that can only be selected as a group? Predictability of selec-tion in this example depends on how much of the history of the creation of the visualimage is necessary in order for you to determine what happens when you click on themouse button.
This notion of predictability deals with the user’s ability to determine the effect ofoperations on the system. Another form of predictability has to do with the user’sability to know which operations can be performed. Operation visibility refers to howthe user is shown the availability of operations that can be performed next. If anoperation can be performed, then there may be some perceivable indication of thisto the user. This principle supports the superiority in humans of recognition overrecall. Without it, the user will have to remember when he can perform the opera-tion and when he cannot. Likewise, the user should understand from the interface ifan operation he might like to invoke cannot be performed.
Synthesizability
Predictability focusses on the user’s ability to determine the effect of future inter-actions. This assumes that the user has some mental model (see Chapter 1) of howthe system behaves. Predictability says nothing about the way the user forms a modelof the system’s behavior. In building up some sort of predictive model of the system’sbehavior, it is important for the user to assess the consequences of previous inter-actions in order to formulate a model of the behavior of the system. Synthesis, there-fore, is the ability of the user to assess the effect of past operations on the currentstate.
When an operation changes some aspect of the internal state, it is important thatthe change is seen by the user. The principle of honesty relates to the ability of theuser interface to provide an observable and informative account of such change. In the best of circumstances, this notification can come immediately, requiring nofurther interaction initiated by the user. At the very least, the notification shouldappear eventually, after explicit user directives to make the change observable. A

7.2 Principles to support usability 263
good example of the distinction between immediacy and eventuality can be seen inthe comparison between command language interfaces and visual desktop interfacesfor a file management system. You have moved a file from one directory to another.The principle of honesty implies that after moving the file to its new location in thefile system you are then able to determine its new whereabouts. In a command lan-guage system, you would typically have to remember the destination directory andthen ask to see the contents of that directory in order to verify that the file has beenmoved (in fact, you would also have to check that the file is no longer in its originaldirectory to determine that it has been moved and not copied). In a visual desktopinterface, a visual representation (or icon) of the file is dragged from its originaldirectory and placed in its destination directory where it remains visible (assumingthe destination folder is selected to reveal its contents). In this case, the user need not expend any more effort to assess the result of the move operation. The visualdesktop is immediately honest.
The problem with eventual honesty is that the user must know to look for thechange. In a situation in which the user is learning a new interactive system, it islikely that he will not know to look for change. In earlier versions of the AppleMacintosh Finder, performing the operation to create a new folder in another folderdid not necessarily result in that new folder’s icon being visible in the original folder.New users (and even some experienced users) would often think that they had notissued the new folder operations correctly and would ask for another new folder (andanother, and another, . . . ). They would not know to search through the entire openfolder for the latest addition. Then several minutes (hours, days) later, they wouldnotice that there were a number of empty and untitled folders lying around. Theeventual (accidental) discovery of the change brought about by the new folder operation was then difficult to associate to that operation. Fortunately, this problemwas addressed in Version 7 of the Finder.
As another example of the benefit of immediate over eventual honesty, let usexamine a typical global search and replace function in a word processor. Imagineyou have noticed in the past a tendency to repeat words in a document (for exam-ple, you type ‘the the’ without noticing the error). In an attempt to automate yourproofreading, you decide to replace globally all occurrences of ‘the the’ with ‘the’.The typical global search and replace function performs this substitution withoutrevealing the changes made to you. Suddenly, a careless typing error is transformedinto unacceptable grammar as the sentence
We will prove the theorem holds as a corollary of the following lemma.
is transformed to
We will prove theorem holds as a corollary of the following lemma.
Familiarity
New users of a system bring with them a wealth of experience across a wide numberof application domains. This experience is obtained both through interaction in the

264 Chapter 7 n Design rules
real world and through interaction with other computer systems. For a new user, the familiarity of an interactive system measures the correlation between the user’sexisting knowledge and the knowledge required for effective interaction. For ex-ample, when word processors were originally introduced the analogy between theword processor and a typewriter was intended to make the new technology moreimmediately accessible to those who had little experience with the former but a lot of experience with the latter. Familiarity has to do with a user’s first impressionof the system. In this case, we are interested in how the system is first perceived andwhether the user can determine how to initiate any interaction. An advantage of a metaphor, such as the typewriter metaphor for word processing described above,is precisely captured by familiarity. Jordan et al. refer to this familiarity as the guess-ability of the system [196].
Some psychologists argue that there are intrinsic properties, or affordances, of anyvisual object that suggest to us how they can be manipulated (see also Chapter 5,Section 5.7.2). The appearance of the object stimulates a familiarity with its beha-vior. For example, the shape of a door handle can suggest how it should be manipu-lated to open a door, and a key on a keyboard suggests to us that it can be pushed.In the design of a graphical user interface, it is implied that a soft button used in aform’s interface suggests it should be pushed (though it does not suggest how it is tobe pushed via the mouse). Effective use of the affordances that exist for interfaceobjects can enhance the familiarity of the interactive system.
Generalizability
Users often try to extend their knowledge of specific interaction behavior to situationsthat are similar but previously unencountered. The generalizability of an interactivesystem supports this activity, leading to a more complete predictive model of the sys-tem for the user. We can apply generalization to situations in which the user wantsto apply knowledge that helps achieve one particular goal to another situation wherethe goal is in some way similar. Generalizability can be seen as a form of consistency.
Generalization can occur within a single application or across a variety of applica-tions. For example, in a graphical drawing package that draws a circle as a con-strained form of ellipse, we would want the user to generalize that a square can bedrawn as a constrained rectangle. A good example of generalizability across a varietyof applications can be seen in multi-windowing systems that attempt to providecut/paste/copy operations to all applications in the same way (with varying degreesof success). Generalizability within an application can be maximized by any con-scientious designer. One of the main advantages of standards and programming style guides, which we will discuss in Sections 7.3 and 7.4, is that they increase generalizability across a wide variety of applications within the same environment.
Consistency
Consistency relates to the likeness in behavior arising from similar situations or similar task objectives. Consistency is probably the most widely mentioned principle

7.2 Principles to support usability 265
in the literature on user interface design. ‘Be consistent!’ we are constantly urged.The user relies on a consistent interface. However, the difficulty of dealing with consistency is that it can take many forms. Consistency is not a single property of aninteractive system that is either satisfied or not satisfied. Instead, consistency must be applied relative to something. Thus we have consistency in command naming, orconsistency in command/argument invocation.
Another consequence of consistency having to be defined with respect to someother feature of the interaction is that many other principles can be ‘reduced’ toqualified instances of consistency. Hence, familiarity can be considered as consist-ency with respect to past real-world experience, and generalizability as consistencywith respect to experience with the same system or set of applications on the sameplatform. Because of this pervasive quality of consistency, it might be argued thatconsistency should be a separate category of usability principles, on the same level aslearnability, flexibility and robustness. Rather than do that, we will discuss differentways in which consistency can be manifested.
Consistency can be expressed in terms of the form of input expressions or outputresponses with respect to the meaning of actions in some conceptual model of thesystem. For example, before the introduction of explicit arrow keys, some word pro-cessors used the relative position of keys on the keyboard to indicate directionalityfor operations (for example, to move one character to the left, right, up or down).The conceptual model for display-based editing is a two-dimensional plane, so theuser would think of certain classes of operations in terms of movements up, down,left or right in the plane of the display. Operations that required directional infor-mation, such as moving within the text or deleting some unit of text, could be articulated by using some set of keys on the keyboard that form a pattern consistentwith up, down, left and right (for example, the keys e, x, s and d, respectively). Foroutput responses, a good example of consistency can be found in a warnings systemfor an aircraft. Warnings to the pilot are classified into three categories, dependingon whether the situation with the aircraft requires immediate recovery action, even-tual but not immediate action, or no action at all (advisory) on the part of the crew.These warnings are signalled to the crew by means of a centralized warnings panel in which the categories are consistently color coded (red for immediate, amber foreventual and green for advisory).
Grudin has argued that because of the relative nature of consistency it can be a dangerous principle to follow [160]. A good example he gives is the developmentand evolution of the standard typewriter keyboard. When keyboards for typewriterswere first made, the designers laid out the keys in alphabetical order. Then it was dis-covered that such an arrangement of keys was both inefficient from the machine’sperspective (adjacent typewriter keys pressed in succession caused jams in the mechanism, so the likelihood of this occurrence had to be designed out) and tiringfor the typist (a touch-typist would not have equal stress distributed over all fingers).The resulting QWERTY and DVORAK keyboards have since been adopted to combat the problems of the ‘consistent’ keyboard layout.1
1 See Chapter 2 for a discussion of different keyboards.
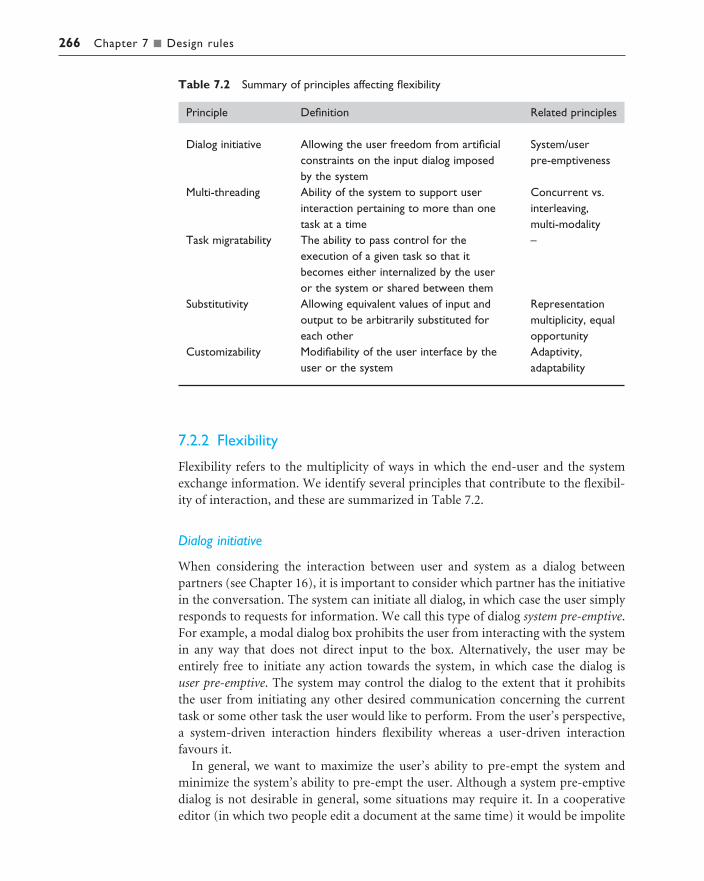
266 Chapter 7 n Design rules
7.2.2 Flexibility
Flexibility refers to the multiplicity of ways in which the end-user and the systemexchange information. We identify several principles that contribute to the flexibil-ity of interaction, and these are summarized in Table 7.2.
Dialog initiative
When considering the interaction between user and system as a dialog between partners (see Chapter 16), it is important to consider which partner has the initiativein the conversation. The system can initiate all dialog, in which case the user simplyresponds to requests for information. We call this type of dialog system pre-emptive.For example, a modal dialog box prohibits the user from interacting with the systemin any way that does not direct input to the box. Alternatively, the user may beentirely free to initiate any action towards the system, in which case the dialog is user pre-emptive. The system may control the dialog to the extent that it prohibits the user from initiating any other desired communication concerning the currenttask or some other task the user would like to perform. From the user’s perspective,a system-driven interaction hinders flexibility whereas a user-driven interactionfavours it.
In general, we want to maximize the user’s ability to pre-empt the system andminimize the system’s ability to pre-empt the user. Although a system pre-emptivedialog is not desirable in general, some situations may require it. In a cooperativeeditor (in which two people edit a document at the same time) it would be impolite
Table 7.2 Summary of principles affecting flexibility
Principle
Dialog initiative
Multi-threading
Task migratability
Substitutivity
Customizability
Related principles
System/user pre-emptiveness
Concurrent vs.interleaving, multi-modality–
Representationmultiplicity, equalopportunityAdaptivity,adaptability
Definition
Allowing the user freedom from artificialconstraints on the input dialog imposedby the systemAbility of the system to support userinteraction pertaining to more than one task at a timeThe ability to pass control for theexecution of a given task so that itbecomes either internalized by the useror the system or shared between themAllowing equivalent values of input andoutput to be arbitrarily substituted foreach otherModifiability of the user interface by theuser or the system

7.2 Principles to support usability 267
for you to erase a paragraph of text that your partner is currently editing. For safetyreasons, it may be necessary to prohibit the user from the ‘freedom’ to do potentiallyserious damage. A pilot about to land an aircraft in which the flaps have asymmetric-ally failed in their extended position2 should not be allowed to abort the landing, asthis failure will almost certainly result in a catastrophic accident.
On the other hand, a completely user pre-emptive dialog allows the user to offerany input action at any time for maximum flexibility. This is not an entirely desir-able situation, since it increases the likelihood that the user will lose track of the tasksthat have been initiated and not yet completed. However, if the designers have a good understanding of the sets of tasks the user is likely to perform with a systemand how those tasks are related, they can minimize the likelihood that the user willbe prevented from initiating some task at a time when he wishes to do so.
Multi-threading
A thread of a dialog is a coherent subset of that dialog. In the user–system dialog, wecan consider a thread to be that part of the dialog that relates to a given user task.Multi-threading of the user–system dialog allows for interaction to support morethan one task at a time. Concurrent multi-threading allows simultaneous commun-ication of information pertaining to separate tasks. Interleaved multi-threading permitsa temporal overlap between separate tasks, but stipulates that at any given instant the dialog is restricted to a single task.
Multi-modality of a dialog is related to multi-threading. Coutaz has characterizedtwo dimensions of multi-modal systems [80]. First, we can consider how the separ-ate modalities (or channels of communication) are combined to form a single inputor output expression. Multiple channels may be available, but any one expressionmay be restricted to just one channel (keyboard or audio, for example). As an ex-ample, to open a window the user can choose between a double click on an icon, a keyboard shortcut, or saying ‘open window’. Alternatively, a single expression can be formed by a mixing of channels. Examples of such fused modality are errorwarnings, which usually contain a textual message accompanied by an audible beep. On the input side, we could consider chord sequences of input with a keyboardand mouse (pressing the shift key while a mouse button is pressed, or saying ‘drop’as you drag a file over the trash icon). We can also characterize a multi-modality dialog depending on whether it allows concurrent or interleaved use of multiplemodes.
A windowing system naturally supports a multi-threaded dialog that is interleavedamongst a number of overlapping tasks. Each window can represent a different task,for example text editing in one window, file management in another, a telephonedirectory in another and electronic mail in yet another. A multi-modal dialog canallow for concurrent multi-threading. A very simple example can occur in the
2 Flaps increase the surface area and curvature of the aircraft’s wing, providing the extra lift necessary for,among other things, a smooth touchdown. An asymmetric failure results in extreme instability and theaircraft will not fly level.

268 Chapter 7 n Design rules
windowing system with an audible bell. You are editing a program when a beep indicates that a new electronic mail message has arrived. Even though at the level ofthe system the audible beep has been interleaved with your requests from the key-board to perform edits, the overlap between the editing task and the mail messagefrom your perspective is simultaneous.
Task migratability
Task migratability concerns the transfer of control for execution of tasks betweensystem and user. It should be possible for the user or system to pass the control of a task over to the other or promote the task from a completely internalized one to a shared and cooperative venture. Hence, a task that is internal to one can becomeinternal to the other or shared between the two partners.
Spell-checking a paper is a good example of the need for task migratability.Equipped with a dictionary, you are perfectly able to check your spelling by readingthrough the entire paper and correcting mistakes as you spot them. This mundanetask is perfectly suited to automation, as the computer can check words against its own list of acceptable spellings. It is not desirable, however, to leave this task completely to the discretion of the computer, as most computerized dictionaries donot handle proper names correctly, nor can they distinguish between correct andunintentional duplications of words. In those cases, the task is handed over to theuser. The spell-check is best performed in such a cooperative way.
In safety-critical applications, task migratability can decrease the likelihood of an accident. For example, on the flight deck of an aircraft, there are so many controltasks that must be performed that a pilot would be overwhelmed if he had to perform them all. Therefore, mundane control of the aircraft’s position within itsflight envelope is greatly automated. However, in the event of an emergency, it mustbe possible to transfer flying controls easily and seamlessly from the system to thepilot.
Substitutivity
Substitutivity requires that equivalent values can be substituted for each other. Forexample, in considering the form of an input expression to determine the margin for a letter, you may want to enter the value in either inches or centimeters. You may also want to input the value explicitly (say 1.5 inches) or you may want to entera calculation which produces the right input value (you know the width of the textis 6.5 inches and the width of the paper is 8.5 inches and you want the left margin to be twice as large as the right margin, so you enter 2/3 (8.5 − 6.5) inches). This input substitutivity contributes towards flexibility by allowing the user to choosewhichever form best suits the needs of the moment. By avoiding unnecessary calcu-lations in the user’s head, substitutivity can minimize user errors and cognitiveeffort.
We can also consider substitutivity with respect to output, or the system’s render-ing of state information. Representation multiplicity illustrates flexibility for state

7.2 Principles to support usability 269
rendering. For example, the temperature of a physical object over a period of timecan be presented as a digital thermometer if the actual numerical value is importantor as a graph if it is only important to notice trends. It might even be desirable tomake these representations simultaneously available to the user. Each representationprovides a perspective on the internal state of the system. At a given time, the user isfree to consider the representations that are most suitable for the current task.
Equal opportunity blurs the distinction between input and output at the interface.The user has the choice of what is input and what is output; in addition, output canbe reused as input. Thimbleby describes this principle as, ‘If you can see it, you canuse it!’ It is a common belief that input and output are separate. Many have stressedthe significance of the link between input and output. Equal opportunity pushes that view to the extreme. For example, in spreadsheet programs, the user fills in somecells and the system automatically determines the values attributed to some othercells. Conversely, if the user enters values for those other cells, the system wouldcompute the values for the first ones. In this example, it is not clear which cells arethe inputs and which are the outputs. Furthermore, this distinction might not beclear or useful to the user. In a drawing package, the user may draw a line by directmanipulation and the system would compute the length of the line; or conversely,the user may specify the line coordinates and the system would draw the line. Bothmeans of manipulating the line are equally important and must be made equallyavailable. Note that equal opportunity implies that the system is not pre-emptivetowards the user.
Customizability
Customizability is the modifiability of the user interface by the user or the system.From the system side, we are not concerned with modifications that would beattended to by a programmer actually changing the system and its interface duringsystem maintenance. Rather, we are concerned with the automatic modification thatthe system would make based on its knowledge of the user. We distinguish betweenthe user-initiated and system-initiated modification, referring to the former asadaptability and the latter as adaptivity.
Adaptability refers to the user’s ability to adjust the form of input and output. This customization could be very limited, with the user only allowed to adjust the position of soft buttons on the screen or redefine command names. This type of modifiability, which is restricted to the surface of the interface, is referred to as lexical customization. The overall structure of the interaction is kept unchanged. Thepower given to the user can be increased by allowing the definition of macros tospeed up the articulation of certain common tasks. In the extreme, the interface canprovide the user with programming language capabilities, such as the UNIX shell orthe script language Hypertalk in HyperCard. Thimbleby points out that in thesecases it would be suitable to apply well-known principles of programming languagesto the user’s interface programming language.
Adaptivity is automatic customization of the user interface by the system.Decisions for adaptation can be based on user expertise or observed repetition of
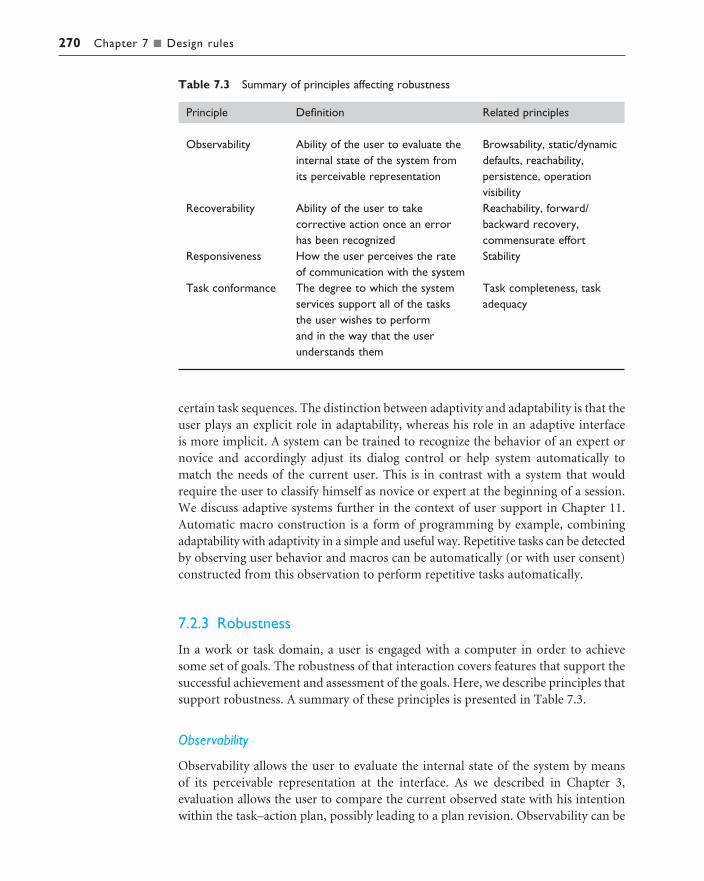
270 Chapter 7 n Design rules
certain task sequences. The distinction between adaptivity and adaptability is that theuser plays an explicit role in adaptability, whereas his role in an adaptive interface is more implicit. A system can be trained to recognize the behavior of an expert ornovice and accordingly adjust its dialog control or help system automatically tomatch the needs of the current user. This is in contrast with a system that wouldrequire the user to classify himself as novice or expert at the beginning of a session.We discuss adaptive systems further in the context of user support in Chapter 11.Automatic macro construction is a form of programming by example, combiningadaptability with adaptivity in a simple and useful way. Repetitive tasks can be detectedby observing user behavior and macros can be automatically (or with user consent)constructed from this observation to perform repetitive tasks automatically.
7.2.3 Robustness
In a work or task domain, a user is engaged with a computer in order to achieve some set of goals. The robustness of that interaction covers features that support thesuccessful achievement and assessment of the goals. Here, we describe principles thatsupport robustness. A summary of these principles is presented in Table 7.3.
Observability
Observability allows the user to evaluate the internal state of the system by means of its perceivable representation at the interface. As we described in Chapter 3, evaluation allows the user to compare the current observed state with his intentionwithin the task–action plan, possibly leading to a plan revision. Observability can be
Table 7.3 Summary of principles affecting robustness
Principle
Observability
Recoverability
Responsiveness
Task conformance
Related principles
Browsability, static/dynamicdefaults, reachability,persistence, operationvisibilityReachability, forward/backward recovery,commensurate effortStability
Task completeness, taskadequacy
Definition
Ability of the user to evaluate theinternal state of the system fromits perceivable representation
Ability of the user to takecorrective action once an errorhas been recognizedHow the user perceives the rateof communication with the systemThe degree to which the systemservices support all of the tasksthe user wishes to perform and in the way that the userunderstands them
7.2 Principles to support usability 271
discussed through five other principles: browsability, defaults, reachability, persist-ence and operation visibility. Operation visibility was covered in Section 7.2.1 inrelation to predictability. The remaining four are discussed next.
Browsability allows the user to explore the current internal state of the system viathe limited view provided at the interface. Usually the complexity of the domain doesnot allow the interface to show all of the relevant domain concepts at once. Indeed,this is one reason why the notion of task is used, in order to constrain the domaininformation needed at one time to a subset connected with the user’s current activ-ity. While you may not be able to view an entire document’s contents, you may beable to see all of an outline view of the document, if you are only interested in itsoverall structure. Even with a restriction of concepts relevant to the current task, it isprobable that all of the information a user needs to continue work on that task is notimmediately perceivable. Or perhaps the user is engaged in a multi-threaded dialogcovering several tasks. There needs to be a way for the user to investigate, or browse,the internal state. This browsing itself should not have any side-effects on that state;that is, the browsing commands should be passive with respect to the domain-specific parts of the internal state.
The availability of defaults can assist the user by passive recall (for example, a sug-gested response to a question can be recognized as correct instead of recalled). It alsoreduces the number of physical actions necessary to input a value. Thus, providingdefault values is a kind of error prevention mechanism. There are two kinds ofdefault values: static and dynamic. Static defaults do not evolve with the session.They are either defined within the system or acquired at initialization. On the otherhand, dynamic defaults evolve during the session. They are computed by the systemfrom previous user inputs; the system is then adapting default values.
Reachability refers to the possibility of navigation through the observable systemstates. There are various levels of reachability that can be given precise mathematicaldefinitions (see Chapter 17), but the main notion is whether the user can navigatefrom any given state to any other state. Reachability in an interactive system affectsthe recoverability of the system, as we will discuss later. In addition, different levelsof reachability can reflect the amount of flexibility in the system as well, though wedid not make that explicit in the discussion on flexibility.
Persistence deals with the duration of the effect of a communication act and theability of the user to make use of that effect. The effect of vocal communication does not persist except in the memory of the receiver. Visual communication, on theother hand, can remain as an object which the user can subsequently manipulatelong after the act of presentation. If you are informed of a new email message by abeep at your terminal, you may know at that moment and for a short while later thatyou have received a new message. If you do not attend to that message immediately,you may forget about it. If, however, some persistent visual information informs youof the incoming message (say, the flag goes up on your electronic mailbox), then thatwill serve as a reminder that an unread message remains long after its initial receipt.3
3 Chapter 19 discusses notification mechanisms for email in more detail.

272 Chapter 7 n Design rules
Recoverability
Users make mistakes from which they want to recover. Recoverability is the abilityto reach a desired goal after recognition of some error in a previous interaction.There are two directions in which recovery can occur, forward or backward. Forwarderror recovery involves the acceptance of the current state and negotiation from thatstate towards the desired state. Forward error recovery may be the only possibility forrecovery if the effects of interaction are not revocable (for example, in building a houseof cards, you might sneeze whilst placing a card on the seventh level, but you cannotundo the effect of your misfortune except by rebuilding). Backward error recovery isan attempt to undo the effects of previous interaction in order to return to a priorstate before proceeding. In a text editor, a mistyped keystroke might wipe out a largesection of text which you would want to retrieve by an equally simple undo button.
Recovery can be initiated by the system or by the user. When performed by thesystem, recoverability is connected to the notions of fault tolerance, safety, reliabilityand dependability, all topics covered in software engineering. However, in softwareengineering this recoverability is considered only with respect to system functional-ity; it is not tied to user intent. When recovery is initiated by the user, it is importantthat it determines the intent of the user’s recovery actions; that is, whether he desiresforward (negotiation) or backward (using undo/redo actions) corrective action.
Recoverability is linked to reachability because we want to avoid blocking the userfrom getting to a desired state from some other undesired state (going down a blindalley).
In addition to providing the ability to recover, the procedure for recovery shouldreflect the work being done (or undone, as the case may be). The principle of com-mensurate effort states that if it is difficult to undo a given effect on the state, then itshould have been difficult to do in the first place. Conversely, easily undone actionsshould be easily doable. For example, if it is difficult to recover files which have beendeleted in an operating system, then it should be difficult to remove them, or at leastit should require more effort by the user to delete the file than to, say, rename it.
Responsiveness
Responsiveness measures the rate of communication between the system and theuser. Response time is generally defined as the duration of time needed by the system to express state changes to the user. In general, short durations and instantan-eous response times are desirable. Instantaneous means that the user perceives system reactions as immediate. But even in situations in which an instantaneousresponse cannot be obtained, there must be some indication to the user that the system has received the request for action and is working on a response.
As significant as absolute response time is response time stability. Response timestability covers the invariance of the duration for identical or similar computationalresources. For example, pull-down menus are expected to pop up instantaneously as soon as a mouse button is pressed. Variations in response time will impede anticipation exploited by motor skill.
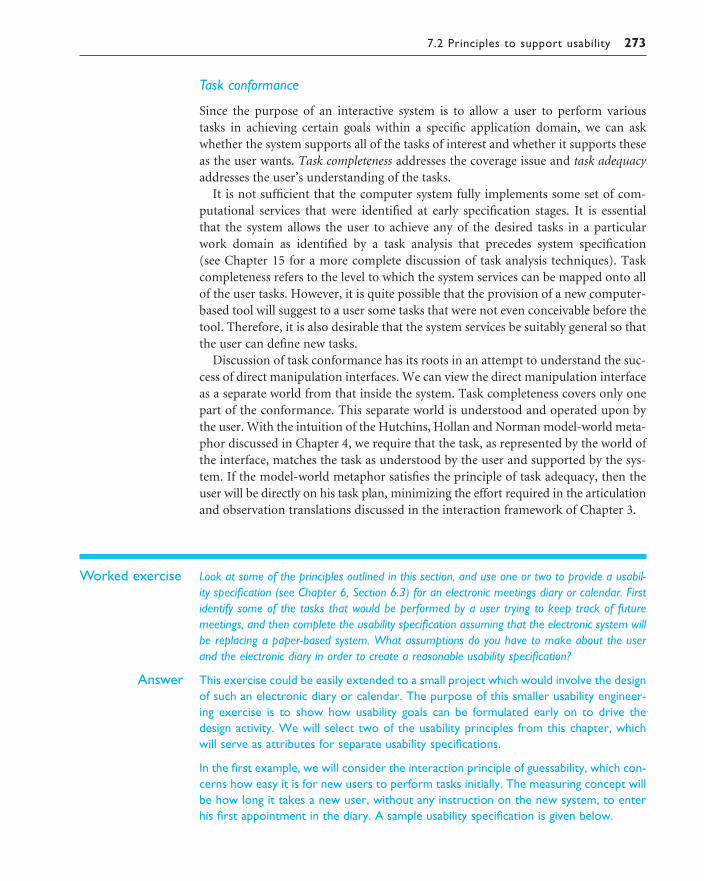
7.2 Principles to support usability 273
Task conformance
Since the purpose of an interactive system is to allow a user to perform various tasks in achieving certain goals within a specific application domain, we can askwhether the system supports all of the tasks of interest and whether it supports theseas the user wants. Task completeness addresses the coverage issue and task adequacyaddresses the user’s understanding of the tasks.
It is not sufficient that the computer system fully implements some set of com-putational services that were identified at early specification stages. It is essential that the system allows the user to achieve any of the desired tasks in a particular work domain as identified by a task analysis that precedes system specification (see Chapter 15 for a more complete discussion of task analysis techniques). Task completeness refers to the level to which the system services can be mapped onto allof the user tasks. However, it is quite possible that the provision of a new computer-based tool will suggest to a user some tasks that were not even conceivable before thetool. Therefore, it is also desirable that the system services be suitably general so thatthe user can define new tasks.
Discussion of task conformance has its roots in an attempt to understand the suc-cess of direct manipulation interfaces. We can view the direct manipulation interfaceas a separate world from that inside the system. Task completeness covers only onepart of the conformance. This separate world is understood and operated upon bythe user. With the intuition of the Hutchins, Hollan and Norman model-world meta-phor discussed in Chapter 4, we require that the task, as represented by the world ofthe interface, matches the task as understood by the user and supported by the sys-tem. If the model-world metaphor satisfies the principle of task adequacy, then theuser will be directly on his task plan, minimizing the effort required in the articulationand observation translations discussed in the interaction framework of Chapter 3.
Worked exercise Look at some of the principles outlined in this section, and use one or two to provide a usabil-ity specification (see Chapter 6, Section 6.3) for an electronic meetings diary or calendar. Firstidentify some of the tasks that would be performed by a user trying to keep track of futuremeetings, and then complete the usability specification assuming that the electronic system willbe replacing a paper-based system. What assumptions do you have to make about the userand the electronic diary in order to create a reasonable usability specification?
Answer This exercise could be easily extended to a small project which would involve the designof such an electronic diary or calendar. The purpose of this smaller usability engineer-ing exercise is to show how usability goals can be formulated early on to drive thedesign activity. We will select two of the usability principles from this chapter, whichwill serve as attributes for separate usability specifications.
In the first example, we will consider the interaction principle of guessability, which con-cerns how easy it is for new users to perform tasks initially. The measuring concept willbe how long it takes a new user, without any instruction on the new system, to enterhis first appointment in the diary. A sample usability specification is given below.
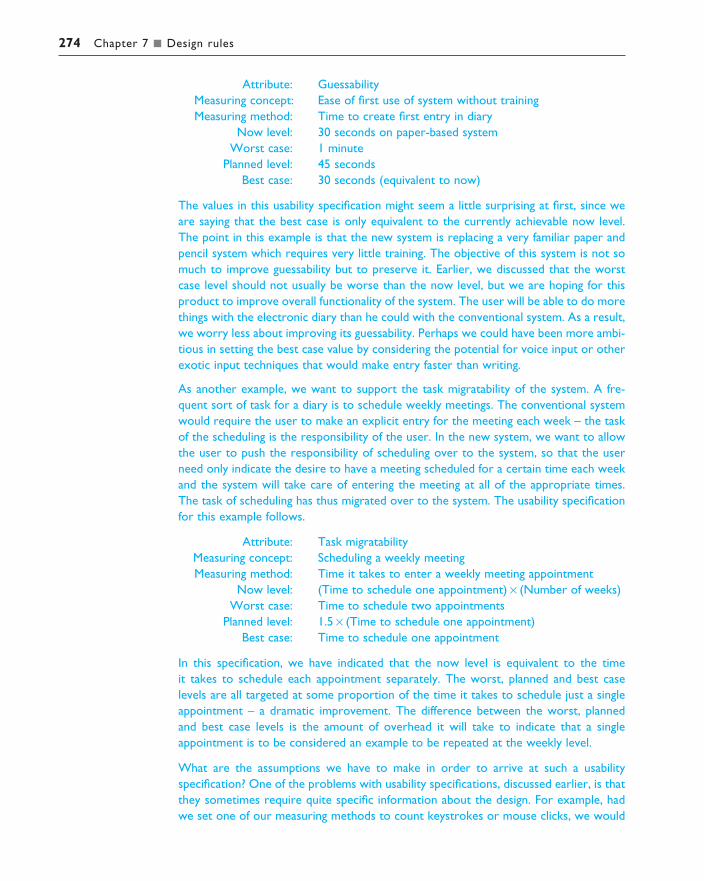
274 Chapter 7 n Design rules
Attribute: GuessabilityMeasuring concept: Ease of first use of system without trainingMeasuring method: Time to create first entry in diary
Now level: 30 seconds on paper-based systemWorst case: 1 minute
Planned level: 45 secondsBest case: 30 seconds (equivalent to now)
The values in this usability specification might seem a little surprising at first, since weare saying that the best case is only equivalent to the currently achievable now level.The point in this example is that the new system is replacing a very familiar paper andpencil system which requires very little training. The objective of this system is not somuch to improve guessability but to preserve it. Earlier, we discussed that the worstcase level should not usually be worse than the now level, but we are hoping for thisproduct to improve overall functionality of the system. The user will be able to do morethings with the electronic diary than he could with the conventional system. As a result,we worry less about improving its guessability. Perhaps we could have been more ambi-tious in setting the best case value by considering the potential for voice input or otherexotic input techniques that would make entry faster than writing.
As another example, we want to support the task migratability of the system. A fre-quent sort of task for a diary is to schedule weekly meetings. The conventional systemwould require the user to make an explicit entry for the meeting each week – the taskof the scheduling is the responsibility of the user. In the new system, we want to allowthe user to push the responsibility of scheduling over to the system, so that the userneed only indicate the desire to have a meeting scheduled for a certain time each weekand the system will take care of entering the meeting at all of the appropriate times.The task of scheduling has thus migrated over to the system. The usability specificationfor this example follows.
Attribute: Task migratabilityMeasuring concept: Scheduling a weekly meetingMeasuring method: Time it takes to enter a weekly meeting appointment
Now level: (Time to schedule one appointment) × (Number of weeks)Worst case: Time to schedule two appointments
Planned level: 1.5 × (Time to schedule one appointment)Best case: Time to schedule one appointment
In this specification, we have indicated that the now level is equivalent to the time it takes to schedule each appointment separately. The worst, planned and best case levels are all targeted at some proportion of the time it takes to schedule just a singleappointment – a dramatic improvement. The difference between the worst, plannedand best case levels is the amount of overhead it will take to indicate that a singleappointment is to be considered an example to be repeated at the weekly level.
What are the assumptions we have to make in order to arrive at such a usabilityspecification? One of the problems with usability specifications, discussed earlier, is thatthey sometimes require quite specific information about the design. For example, hadwe set one of our measuring methods to count keystrokes or mouse clicks, we would

7.3 Standards 275
have had to start making assumptions about the method of interaction that the systemwould allow. Had we tried to set a usability specification concerning the browsing ofthe diary, we would have had to start making assumptions about the layout of the calen-dar (monthly, weekly, daily) in order to make our estimates specific enough to measure.In the examples we have provided above, we have tried to stay as abstract as possible,so that the usability specifications could be of use as early in the design life cycle as pos-sible. A consequence of this abstractness, particularly evident in the second example, isthat we run the risk in the usability specification of setting goals that may be completelyunrealistic, though well intentioned. If the usability specification were to be used as acontract with the customer, such speculation could spell real trouble for the designer.
STANDARDS
Standards for interactive system design are usually set by national or internationalbodies to ensure compliance with a set of design rules by a large community.Standards can apply specifically to either the hardware or the software used to buildthe interactive system. Smith [324] points out the differing characteristics betweenhardware and software, which affect the utility of design standards applied to them:
Underlying theory Standards for hardware are based on an understanding of physiology or ergonomics/human factors, the results of which are relatively wellknown, fixed and readily adaptable to design of the hardware. On the other hand,software standards are based on theories from psychology or cognitive science,which are less well formed, still evolving and not very easy to interpret in the language of software design. Consequently, standards for hardware can directlyrelate to a hardware specification and still reflect the underlying theory, whereassoftware standards would have to be more vaguely worded.
Change Hardware is more difficult and expensive to change than software, whichis usually designed to be very flexible. Consequently, requirements changes forhardware do not occur as frequently as for software. Since standards are also relatively stable, they are more suitable for hardware than software.
Historically, for these reasons, a given standards institution, such as the BritishStandards Institution (BSI) or the International Organization for Standardization (ISO)or a national military agency, has had standards for hardware in place before any forsoftware. For example, the UK Ministry of Defence has published an Interim DefenceStandard 00–25 on Human Factors for Designers of Equipment, produced in 12 parts:
Part 1 IntroductionPart 2 Body SizePart 3 Body Strength and StaminaPart 4 Workplace DesignPart 5 Stresses and HazardsPart 6 Vision and Lighting
7.3

276 Chapter 7 n Design rules
Part 7 Visual DisplaysPart 8 Auditory InformationPart 9 Voice CommunicationPart 10 ControlsPart 11 Design for MaintainabilityPart 12 Systems
Only the last of these is concerned with the software design process. The inter-national standard ISO 9241, entitled Ergonomic Requirements for Office Work withVisual Display Terminals (VDT)s, has 17 parts. Seven of these are concerned withhardware issues – requirements for visual display, keyboard layout, workstation lay-out, environment, display with reflections, display colors and non-keyboard inputdevices. Seven parts are devoted to software issues – general dialog principles, menu dialogs, presentation of information, user guidance, command dialogs, directmanipulation dialogs and form-filling dialogs. However, standards covering soft-ware issues are now being produced, for example, the draft standard ISO 14915 covers software ergonomics for multimedia user interfaces.
Figure 7.1 provides examples of the language of standards for displays. Note theincreasing generality and vagueness of the language as we progress from the hard-ware issues in a UK defence standard for pilot cockpit controls and instrumentationthrough a German standard for user interface design of display workstations to a USmilitary standard for display contents.
11.3 Arrangement of displays11.3.1 Vertical Grouping. The engine display parameters shall be arranged so that theprimary or most important display for a particular engine and airplane (thrust, torque,RPM, etc.) be located at the top of the display group if a vertical grouping is provided.The next most important display parameter shall be positioned under the primary displayprogressing down the panel with the least important at the bottom.
(a) A typical example of a military standard
5.1 Subdivision of the display areaIn consideration of a simple, fast and accurate visual acquisition, the display area shall bedivided into different sub-areas.Such a division should be:n Input arean Output arean Area for operational indications (such as status and alarms)
(b) From German standard DIN 66 234 Part 3 (1984), adapted from Smith [324]
5.15.3.2.1 StandardizationThe content of displays within a system shall be presented in a consistent manner.
(c) From US military standard MIL-STD-1472C, revised (1983), adapted from Smith [324]
Figure 7.1 Sample design standards for displays. Adapted from Smith [324].Copyright © 1986 IEEE
7.4 Guidelines 277
One component of the ISO standard 9241, pertaining to usability specification,applies equally to both hardware and software design. In the beginning of that document, the following definition of usability is given:
Usability The effectiveness, efficiency and satisfaction with which specified usersachieve specified goals in particular environments.
Effectiveness The accuracy and completeness with which specified users canachieve specified goals in particular environments.
Efficiency The resources expended in relation to the accuracy and completeness ofgoals achieved.
Satisfaction The comfort and acceptability of the work system to its users andother people affected by its use.
The importance of such a definition in the standard is as a means of describingexplicit measurements for usability. Such metrics can support usability engineering,as we saw in Chapter 6.
The strength of a standard lies in its ability to force large communities to abide –the so-called authority we have referred to earlier. It should be noted that suchauthority does not necessarily follow from the publication of a standard by a nationalor international body. In fact, many standards applying to software design are putforth as suggestive measures, rather than obligatory. The authority of a standard (ora guideline, for that matter) can only be determined from its use in practice. Somesoftware products become de facto standards long before any formal standards docu-ment is published (for example, the X windowing system).
There is a much longer history of standards in safety-critical domains, such asnuclear power plants or aircraft design, where the consequences of poor design out-weigh the expense of principled design. It is only as the perceived costs of unusablesoftware in less safety-critical domains have become less acceptable that there hasbeen a greater effort in developing standards for promoting usability.
GUIDELINES
We have observed that the incompleteness of theories underlying the design of inter-active software makes it difficult to produce authoritative and specific standards. Asa result, the majority of design rules for interactive systems are suggestive and moregeneral guidelines. Our concern in examining the wealth of available guidelines is indetermining their applicability to the various stages of design. The more abstract theguideline, the more it resembles the principles that we outlined in Section 7.2, whichwould be most suited to requirements specification. The more specific the guideline,the more suited it is to detailed design. The guidelines can also be automated to some extent, providing a direct means for translating detailed design specificationsinto actual implementation. There are a vast amount of published guidelines for
7.4

278 Chapter 7 n Design rules
interactive system design (they are frequently referred to as guidelines for user inter-face design). We will present only a few examples here to demonstrate the content ofguidelines in that vast literature.
Several books and technical reports contain huge catalogs of guidelines. A classicexample was a very general list compiled by Smith and Mosier in 1986 at the MitreCorporation and sponsored by the Electronic Systems Division of the US Air Force[325]. The basic categories of the Smith and Mosier guidelines are:
1. Data Entry2. Data Display3. Sequence Control4. User Guidance5. Data Transmission6. Data Protection
Each of these categories is further broken down into more specific subcategorieswhich contain the particular guidelines. Figure 7.2 provides an example of the information contained in the Smith and Mosier guidelines. A striking feature of thiscompendium of guidelines is the extensive cross-referencing within the catalog, andcitation to published work that supports each guideline. The Mitre Corporation hastaken advantage of this structure and implemented the Smith and Mosier guidelineson a hypertext system, which provides rapid traversal of the network of guidelines toinvestigate the cross-references and citations.
1. Data Entry
1.1 Position Designation
1.1–1 Distinctive CursorFor position designation on an electronic display, provide a movable cursor with distinct-ive visual features (shape, blink, etc.).
Exception When position designation involves only selection among displayedalternatives, highlighting selected items might be used instead of a separately displayedcursor.
Comment When choosing a cursor shape, consider the general content of the display.For instance, an underscore cursor would be difficult to see on a display of under-scored text, or on a graphical display containing many other lines.
Comment If the cursor is changed to denote different functions (e.g. to signal deletionrather than entry), then each different cursor should be distinguishable from theothers.
Comment If multiple cursors are used on the same display (e.g. one for alphanumericentry and one for line drawing), then each cursor should be distinguishable from theothers.
Reference Whitfield, Ball and Bird, 1983
See also 1.1–17 Distinctive multiple cursors4.0–9 Distinctive cursor
Figure 7.2 Sample guideline from Smith and Mosier [325], courtesy of The MITRECorporation
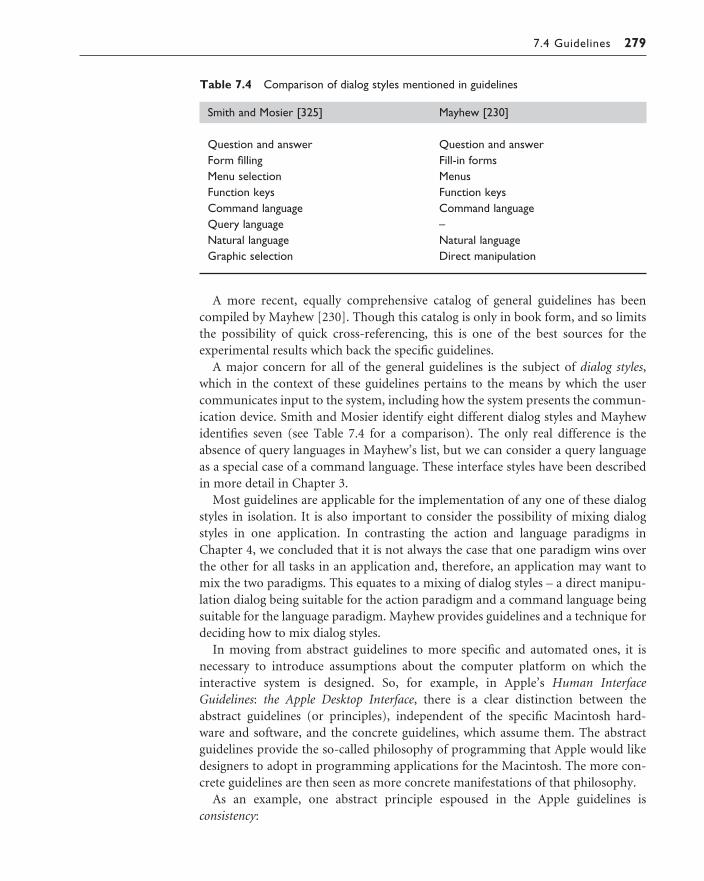
7.4 Guidelines 279
A more recent, equally comprehensive catalog of general guidelines has been compiled by Mayhew [230]. Though this catalog is only in book form, and so limitsthe possibility of quick cross-referencing, this is one of the best sources for the experimental results which back the specific guidelines.
A major concern for all of the general guidelines is the subject of dialog styles,which in the context of these guidelines pertains to the means by which the usercommunicates input to the system, including how the system presents the commun-ication device. Smith and Mosier identify eight different dialog styles and Mayhewidentifies seven (see Table 7.4 for a comparison). The only real difference is theabsence of query languages in Mayhew’s list, but we can consider a query languageas a special case of a command language. These interface styles have been describedin more detail in Chapter 3.
Most guidelines are applicable for the implementation of any one of these dialogstyles in isolation. It is also important to consider the possibility of mixing dialogstyles in one application. In contrasting the action and language paradigms inChapter 4, we concluded that it is not always the case that one paradigm wins overthe other for all tasks in an application and, therefore, an application may want tomix the two paradigms. This equates to a mixing of dialog styles – a direct manipu-lation dialog being suitable for the action paradigm and a command language beingsuitable for the language paradigm. Mayhew provides guidelines and a technique fordeciding how to mix dialog styles.
In moving from abstract guidelines to more specific and automated ones, it is necessary to introduce assumptions about the computer platform on which theinteractive system is designed. So, for example, in Apple’s Human InterfaceGuidelines: the Apple Desktop Interface, there is a clear distinction between theabstract guidelines (or principles), independent of the specific Macintosh hard-ware and software, and the concrete guidelines, which assume them. The abstractguidelines provide the so-called philosophy of programming that Apple would like designers to adopt in programming applications for the Macintosh. The more con-crete guidelines are then seen as more concrete manifestations of that philosophy.
As an example, one abstract principle espoused in the Apple guidelines is consistency:
Table 7.4 Comparison of dialog styles mentioned in guidelines
Smith and Mosier [325] Mayhew [230]
Question and answer Question and answerForm filling Fill-in formsMenu selection MenusFunction keys Function keysCommand language Command languageQuery language –Natural language Natural languageGraphic selection Direct manipulation
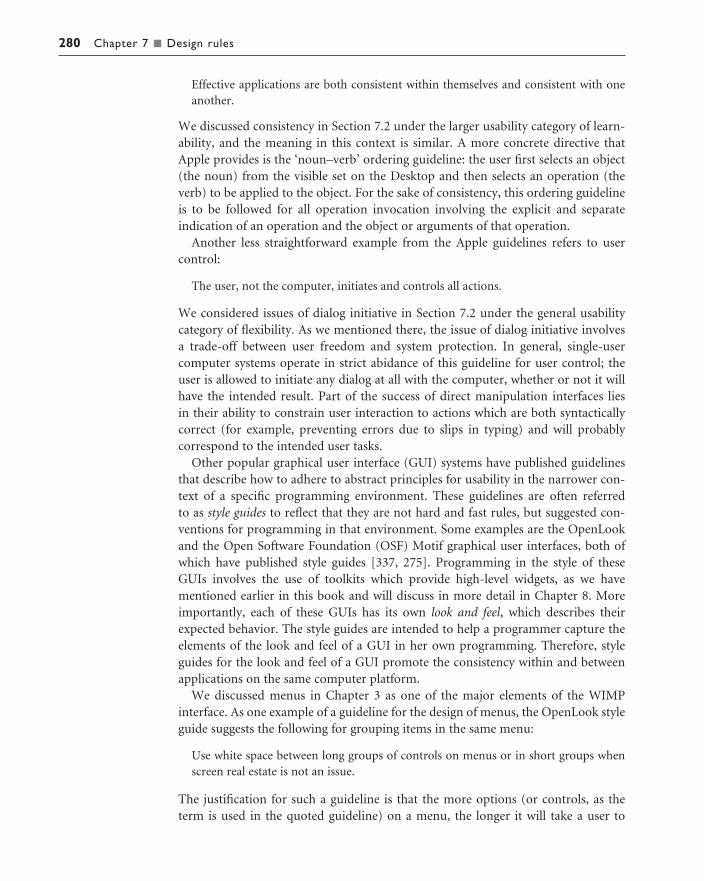
280 Chapter 7 n Design rules
Effective applications are both consistent within themselves and consistent with oneanother.
We discussed consistency in Section 7.2 under the larger usability category of learn-ability, and the meaning in this context is similar. A more concrete directive thatApple provides is the ‘noun–verb’ ordering guideline: the user first selects an object(the noun) from the visible set on the Desktop and then selects an operation (theverb) to be applied to the object. For the sake of consistency, this ordering guidelineis to be followed for all operation invocation involving the explicit and separate indication of an operation and the object or arguments of that operation.
Another less straightforward example from the Apple guidelines refers to usercontrol:
The user, not the computer, initiates and controls all actions.
We considered issues of dialog initiative in Section 7.2 under the general usabilitycategory of flexibility. As we mentioned there, the issue of dialog initiative involves a trade-off between user freedom and system protection. In general, single-usercomputer systems operate in strict abidance of this guideline for user control; theuser is allowed to initiate any dialog at all with the computer, whether or not it willhave the intended result. Part of the success of direct manipulation interfaces lies in their ability to constrain user interaction to actions which are both syntacticallycorrect (for example, preventing errors due to slips in typing) and will probably correspond to the intended user tasks.
Other popular graphical user interface (GUI) systems have published guidelinesthat describe how to adhere to abstract principles for usability in the narrower con-text of a specific programming environment. These guidelines are often referred to as style guides to reflect that they are not hard and fast rules, but suggested con-ventions for programming in that environment. Some examples are the OpenLookand the Open Software Foundation (OSF) Motif graphical user interfaces, both ofwhich have published style guides [337, 275]. Programming in the style of theseGUIs involves the use of toolkits which provide high-level widgets, as we have mentioned earlier in this book and will discuss in more detail in Chapter 8. Moreimportantly, each of these GUIs has its own look and feel, which describes theirexpected behavior. The style guides are intended to help a programmer capture theelements of the look and feel of a GUI in her own programming. Therefore, styleguides for the look and feel of a GUI promote the consistency within and betweenapplications on the same computer platform.
We discussed menus in Chapter 3 as one of the major elements of the WIMPinterface. As one example of a guideline for the design of menus, the OpenLook styleguide suggests the following for grouping items in the same menu:
Use white space between long groups of controls on menus or in short groups whenscreen real estate is not an issue.
The justification for such a guideline is that the more options (or controls, as theterm is used in the quoted guideline) on a menu, the longer it will take a user to

7.4 Guidelines 281
locate and point to a desired item. As we discussed in Chapter 1, humans chunkrelated information in the learning process and this can be used to increase theefficiency of searching. Grouping of related items in a menu can supplement thischunking procedure. But be warned! Remember the scenario described in the Intro-duction to this book, in which we fell victim to closely grouped menu items whichhad drastically different effects in our word processor. Saving and deleting files mightbe considered logically similar since they both deal with operations on the file level.But simple slips made in pointing (which are all too easy with trackball devices) canchange an intended save operation into an unintended and dangerous delete.
Worked exercise Look up and report back guidelines for the use of color. Be able to state the empirical psy-chological evidence that supports the guidelines. Do the guidelines conflict with any otherknown guidelines? Which principles of interaction do they support?
Answer There are many examples of guidelines for the use of color in the literature. Here arethree good sources:
n C. Marlin Brown, Human–Computer Interface Design Guidelines, Ablex, 1988.n Deborah J. Mayhew, Principles and Guidelines in Software User Interface Design, Prentice
Hall, 1992.n Sun Microsystems, Inc., OpenLook Graphical User Interface Application Style Guidelines,
Addison-Wesley, 1990.
Taking an example from Mayhew, we have the following design guideline for the use ofcolor as an informational cue for the user (for example, to inform the user that a stringof text is a warning or error message):
Do not use color without some other redundant cue.
Mayhew provides three reasons which empirically support this guideline:
1. Color may not be available on all machines on which the system is to be imple-mented. Therefore, if use of color is the only means to convey some importantinformation to the user, then that information will be lost in a monochrome (nocolor) system. Redundant color coding will allow for portability across differentcomputing platforms.
2. Empirical evidence shows that 8% of the (general) male population and 0.4% of thefemale population has some color deficiency, so they cannot accurately recognize ordistinguish between various colors. Again, if color is the only means for conveyingsome information, this significant portion of the user population will be slighted.
3. It has been shown that redundant color coding enhances user performance
This guideline supports several of the principles discussed in this chapter:
Substitutivity The system is able to substitute color-coded information and othermeans (for example, text, sound) to represent some important information. Wecould turn the argument around and suggest that the user be able to provide colorinput (by selecting from a palette menu) or other forms of input to provide relevantinformation to the system.

282 Chapter 7 n Design rules
Observability This principle is all about the system being able to provide the userwith enough information about its internal state to assist his task. Relying strictly oncolor-coded information, as pointed out above, could reduce the observability of asystem for some users.
Synthesis If a change in color is used to indicate the changing status of some systementity (perhaps a change in temperature above a threshold value is signalled by anicon becoming red), those who cannot detect the change in color would be deprivedof this information. Synthesis is about supporting the user’s ability to detect suchsignificant changes, especially when they are a result of previous user actions.
There is no evidence of existing guidelines that this particular guideline for color violates.
Another example of a color guideline (found in all three of the above references) is thedemand to consider cultural information in the selection of particular colors. For example,Mayhew states that western cultures tend to interpret green to mean go or safe; redto mean stop, on, hot or emergency; and blue to mean cold or off. Using color to suggestthese kinds of meanings is in support of the familiarity principle within learnability.However, in other cultures different meanings may be associated with these colors, as wesaw in Chapter 3, and consistent use of color (another guideline) might lead to confusion.Hence, strict adherence to this guideline would suggest a violation of the consistency ofcolor application guideline. However, if consistency is applied relative to the meaning ofthe color (as opposed to its actual color), this guideline would not have to conflict.
GOLDEN RULES AND HEURISTICS
So far we have considered a range of abstract principles and detailed guidelines,which can be used to help designers produce more usable systems. But all of theserules require a certain amount of commitment on the part of the designer, either totrack down appropriate guidelines or to interpret principles. Is there a simpler way?
A number of advocates of user-centered design have presented sets of ‘golden rules’ or heuristics. While these are inevitably ‘broad-brush’ design rules, which maynot be always be applicable to every situation, they do provide a useful checklist or summary of the essence of design advice. It is clear that any designer followingeven these simple rules will produce a better system than one who ignores them.
There are many sets of heuristics, but the most well used are Nielsen’s ten heur-istics, Shneiderman’s eight golden rules and Norman’s seven principles. Nielsen’sheuristics are intended to be used in evaluation and will therefore be discussed inChapter 9. We will consider the other two sets here.
7.5.1 Shneiderman’s Eight Golden Rules of Interface Design
Shneiderman’s eight golden rules provide a convenient and succinct summary of the key principles of interface design. They are intended to be used during design but
7.5
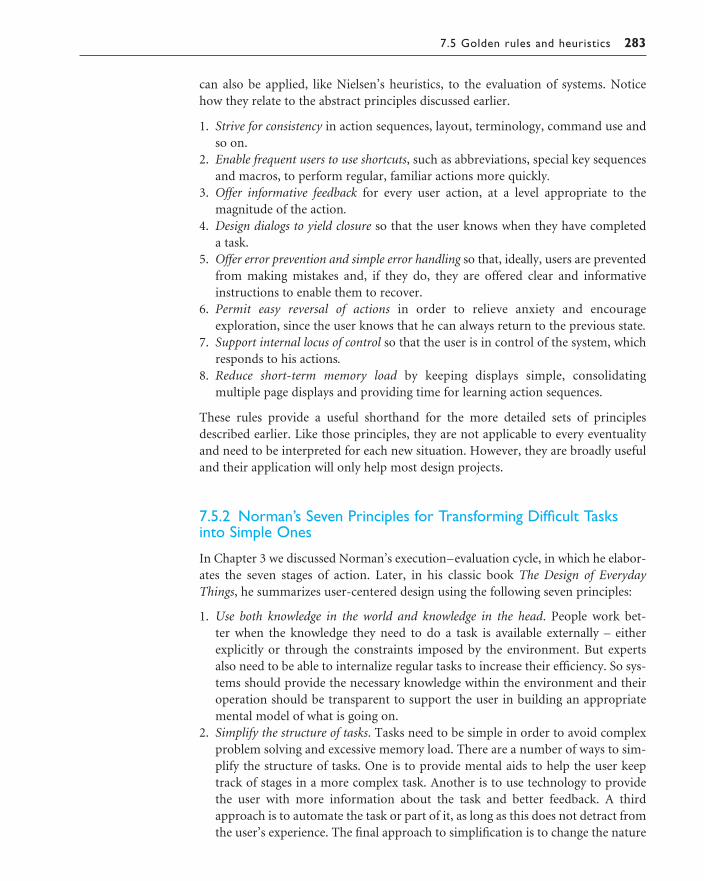
7.5 Golden rules and heuristics 283
can also be applied, like Nielsen’s heuristics, to the evaluation of systems. Notice how they relate to the abstract principles discussed earlier.
1. Strive for consistency in action sequences, layout, terminology, command use andso on.
2. Enable frequent users to use shortcuts, such as abbreviations, special key sequencesand macros, to perform regular, familiar actions more quickly.
3. Offer informative feedback for every user action, at a level appropriate to the magnitude of the action.
4. Design dialogs to yield closure so that the user knows when they have completed a task.
5. Offer error prevention and simple error handling so that, ideally, users are preventedfrom making mistakes and, if they do, they are offered clear and informativeinstructions to enable them to recover.
6. Permit easy reversal of actions in order to relieve anxiety and encourage exploration, since the user knows that he can always return to the previous state.
7. Support internal locus of control so that the user is in control of the system, whichresponds to his actions.
8. Reduce short-term memory load by keeping displays simple, consolidating multiple page displays and providing time for learning action sequences.
These rules provide a useful shorthand for the more detailed sets of principlesdescribed earlier. Like those principles, they are not applicable to every eventualityand need to be interpreted for each new situation. However, they are broadly usefuland their application will only help most design projects.
7.5.2 Norman’s Seven Principles for Transforming Difficult Tasksinto Simple Ones
In Chapter 3 we discussed Norman’s execution–evaluation cycle, in which he elabor-ates the seven stages of action. Later, in his classic book The Design of EverydayThings, he summarizes user-centered design using the following seven principles:
1. Use both knowledge in the world and knowledge in the head. People work bet-ter when the knowledge they need to do a task is available externally – eitherexplicitly or through the constraints imposed by the environment. But experts also need to be able to internalize regular tasks to increase their efficiency. So sys-tems should provide the necessary knowledge within the environment and theiroperation should be transparent to support the user in building an appropriatemental model of what is going on.
2. Simplify the structure of tasks. Tasks need to be simple in order to avoid complexproblem solving and excessive memory load. There are a number of ways to sim-plify the structure of tasks. One is to provide mental aids to help the user keeptrack of stages in a more complex task. Another is to use technology to providethe user with more information about the task and better feedback. A thirdapproach is to automate the task or part of it, as long as this does not detract fromthe user’s experience. The final approach to simplification is to change the nature
284 Chapter 7 n Design rules
of the task so that it becomes something more simple. In all of this, it is import-ant not to take control away from the user.
3. Make things visible: bridge the gulfs of execution and evaluation. The interfaceshould make clear what the system can do and how this is achieved, and shouldenable the user to see clearly the effect of their actions on the system.
4. Get the mappings right. User intentions should map clearly onto system controls.User actions should map clearly onto system events. So it should be clear whatdoes what and by how much. Controls, sliders and dials should reflect the task –so a small movement has a small effect and a large movement a large effect.
5. Exploit the power of constraints, both natural and artificial. Constraints are things inthe world that make it impossible to do anything but the correct action in the cor-rect way. A simple example is a jigsaw puzzle, where the pieces only fit together in oneway. Here the physical constraints of the design guide the user to complete the task.
6. Design for error. To err is human, so anticipate the errors the user could make anddesign recovery into the system.
7. When all else fails, standardize. If there are no natural mappings then arbitrarymappings should be standardized so that users only have to learn them once. It is this standardization principle that enables drivers to get into a new car anddrive it with very little difficulty – key controls are standardized. Occasionally one might switch on the indicator lights instead of the windscreen wipers, but thecritical controls (accelerator, brake, clutch, steering) are always the same.
Norman’s seven principles provide a useful summary of his user-centered design philosophy but the reader is encouraged to read the complete text of The Design ofEveryday Things to gain the full picture.
HCI PATTERNS
As we observed in Chapter 4, one way to approach design is to learn from examplesthat have proven to be successful in the past: to reuse the knowledge of what made asystem – or paradigm – successful. Patterns are an approach to capturing and reusingthis knowledge – of abstracting the essential details of successful design so that thesecan be applied again and again in new situations.
Patterns originated in architecture, where they have been used successfully, and theyare also used widely in software development to capture solutions to common pro-gramming problems. More recently they have been used in interface and web design.
A pattern is an invariant solution to a recurrent problem within a specific context. Patterns address the problems that designers face by providing a ‘solutionstatement’. This is best illustrated by example. Alexander, who initiated the patternconcept, proposes a pattern for house building called ‘Light on Two Sides of EveryRoom’. The problem being addressed here is that
When they have a choice, people will always gravitate to those rooms which have lighton two sides, and leave the rooms which are lit only from one side unused and empty.
The proposed solution is to provide natural light from two sides of every room:
7.6

7.6 HCI patterns 285
Locate each room so that it has outdoor space outside it on at least two sides, and thenplace windows in these outdoor walls so that natural light falls into every room frommore than one direction [9a, pattern 159].
Note that the solution says nothing about where these windows should be located or at what angle they should be to each other. A room with windows on oppositewalls, or at right angles, or with a window and a skylight would all fulfill the pattern.Patterns capture only the invariant properties of good design – the common ele-ments that hold between all instances of the solution. The specific implementationof the pattern will depend on the circumstance and the designer’s creativity.
There are many examples of HCI patterns, and the interested reader is referred to pattern collections and languages such as [345, 37, 356] and the Pattern Gallery,which illustrates some of the various forms used in HCI patterns [132]. A well-known example, ‘go back to a safe place’, adapted from Tidwell’s Common Groundcollection, is given as an illustration (Figure 7.3). This is quite a low-level interfacepattern, but patterns can also address high-level issues such as organizational struc-tures or cooperative groups. As you can see, the pattern states the problem and thesolution but also includes a rationale, explaining where the pattern has come fromand in what context it applies, and examples to illustrate the pattern.
The pattern also has references to other patterns, indicating both the context in which it can be applied (the top references) and the patterns that may be neededto complete it (the bottom references). This connects the patterns together into alanguage. Patterns in isolation have limited use, but by traversing the hierarchy,through these references, the user is assisted in generating a complete design.
Patterns and pattern languages are characterized by a number of features, which,taken as a whole, distinguish them from other design rules:
n They capture design practice and embody knowledge about successful solutions:they come from practice rather than psychological theory.
n They capture the essential common properties of good design: they do not tell thedesigner how to do something but what needs to be done and why.
n They represent design knowledge at varying levels, ranging from social and organ-izational issues through conceptual design to detailed widget design.
n They are not neutral but embody values within their rationale. Alexander’s language clearly expresses his values about architecture. HCI patterns can expressvalues about what is humane in interface design.
n The concept of a pattern language is generative and can therefore assist in thedevelopment of complete designs.
n They are generally intuitive and readable and can therefore be used for commun-ication between all stakeholders.
Patterns are a relatively recent addition to HCI representations, in which there arestill many research issues to resolve. For instance, it is not clear how patterns can bestbe identified or how languages should be structured to reflect the temporal concernsof interaction. However, the recent publication of a complete pattern language forweb design [356], aimed at commercial designers, may mark a turning point and seea more widespread adoption of the approach in interface design.

286 Chapter 7 n Design rules
SUMMARY
We have seen how design rules can be used to provide direction for the design pro-cess, although the more general and interesting the design rule is for promotingusability, the further away it is from the actual language of design.
7.7
Figure 7.3 An example pattern ‘go back to a safe place’ adapted from Tidwell’s Common Groundcollection. Courtesy of Jenifer Tidwell
Exercises 287
We have considered abstract principles, standards and guidelines, golden rulesand heuristics, and patterns, and have looked at examples of each. The most abstractdesign rules are principles, which represent generic knowledge about good designpractice. Standards and guidelines are more specific. Standards have the highestauthority, being set by national or international bodies to ensure compliance by alarge community. Guidelines are less authoritative but offer specific contextualadvice, which can inform detailed design. Heuristics and ‘golden rules’ are succinctcollections of design principles and advice that are easily assimilated by any designer.Patterns capture design practice and attempt to provide a generative structure tosupport the design process.
EXERCISES
7.1 What was the problem with the synthesis example comparing a command languageinterface with a visual interface? Can you suggest a fix to make a visual interface really immedi-ately honest?
7.2 It has been suggested in this chapter that consistency could be considered a major category ofinteractive principles, on the same level as learnability, flexibility and robustness. If this was thecase, which principles discussed in this chapter would appear in support of consistency?
7.3 Find as much information as you can on ISO standards that relate to usability. (Hint: Many stan-dards are discussed in terms of ergonomics.) How many different standards and draft standardscan you find?
7.4 Can you think of any instances in which the ‘noun–verb’ guideline for operations, as suggested inthe Apple human interface guidelines for the Desktop Interface, would be violated? Suggest otherabstract guidelines or principles besides consistency which support your example. (Hint: Thinkabout moving files around on the Desktop.)
7.5 Can you think of any instances in which the user control guideline suggested by Apple is not followed? (Hint: Think about the use of dialog boxes.)
7.6 Find a book on guidelines. List the guidelines that are provided and classify them in terms of theactivity in the software life cycle to which they would most likely apply.
7.7 (a) Distinguish between principles, guidelines and standards, using examples of each to illustrate.(b) Why is context important in selecting and applying guidelines and principles for interface
design? Illustrate your answer with examples.
7.8 (a) Why are there few effective HCI standards?(b) How do ‘golden rules’ and heuristics help interface designers take account of cognitive
psychology? Illustrate your answer with examples.
7.9 Using the web design pattern language in The Design of Sites [356] produce a design for an e-commerce site for a small retail business. How well does the language support the design process?

RECOMMENDED READING
H. Thimbleby, Design of interactive systems. In J. A. McDermid, editor, The SoftwareEngineer’s Reference Book, Chapter 57, Butterworth–Heinemann, 1992.Thimbleby provides a very insightful list of general principles which apply tointeractive systems. Some of the principles we have described in this chapter comefrom Thimbleby’s work, though we have concentrated more on providing anoverall organizational framework for the principles.
T. Stewart, Ergonomics user interface standards: are they more trouble than they areworth?, Ergonomics, Vol. 43, No. 7, pp. 1030–44, July 2000.A review of the development of user interface standards, which considers the his-tory of the endeavour, its successes and failures.
D. J. Mayhew, Principles and Guidelines in Software User Interface Design, PrenticeHall, 1992.A comprehensive catalog of general interactive system guidelines which providesmuch of the experimental evidence to support specific guidelines.
B. Shneiderman, Designing the User Interface, 3rd edition, Addison-Wesley, 1998.The source of Eight Golden Rules.
D. Norman, The Design of Everyday Things, MIT Press, 1998.Classic exposition of design, including the seven principles.
D. Van Duyne, J. Landay and J. Hong, The Design of Sites: Patterns, Principles andProcesses for Crafting a Customer-centred Web Experience, Addison-Wesley, 2003.The first substantial and widely applicable HCI complete pattern language (forweb design) presented accessibly for use in design teams.
The HCI Service, HCI Tools & Methods Handbook, 1991.This booklet was produced under the United Kingdom Department of Trade andIndustry (DTI) Usability Now! program. It contains a list of books on guidelinesas well as a summary of the available user-centered design techniques as they canbe applied to the software life cycle. The booklet and other information about theprogram is available from the HCI Service, PO Box 31, Loughborough,Leicestershire LE11 1QU, United Kingdom.
288 Chapter 7 n Design rules

IMPLEMENTATION SUPPORT
OV E RV I E W
n Programming tools for interactive systems provide ameans of effectively translating abstract designs andusability principles into an executable form. These toolsprovide different levels of services for the programmer.
n Windowing systems are a central environment for boththe programmer and user of an interactive system,allowing a single workstation to support separateuser–system threads of action simultaneously.
n Interaction toolkits abstract away from the physicalseparation of input and output devices, allowing theprogrammer to describe behaviors of objects at a levelsimilar to how the user perceives them.
n User interface management systems are the final levelof programming support tools, allowing the designerand programmer to control the relationship betweenthe presentation objects of a toolkit with theirfunctional semantics in the actual application.
8
290 Chapter 8 n Implementation support
INTRODUCTION
In this chapter, we will discuss the programming support that is provided for theimplementation of an interactive system. We have spent much effort up to this pointconsidering design and analysis of interactive systems from a relatively abstract per-spective. We did this because it was not necessary to consider the specific details ofthe devices used in the interaction. Furthermore, consideration of that detail was anobstacle to understanding the interaction from the user’s perspective. But we cannotforever ignore the specifics of the device. It is now time to devote some attention tounderstanding just how the task of coding the interactive application is structured.
The detailed specification gives the programmer instructions as to what the inter-active application must do and the programmer must translate that into machineexecutable instructions to say how that will be achieved on the available hardwaredevices. The objective of the programmer then is to translate down to the level of thesoftware that runs the hardware devices. At its crudest level, this software providesthe ability to do things like read events from various input devices and write primit-ive graphics commands to a display. Whereas it is possible in that crude language toproduce highly interactive systems, the job is very tedious and highly error prone,amenable to computer hackers who relish the intricacy and challenge but not neces-sarily those whose main concern is the design of very usable interactive systems.
The programming support tools which we describe in this chapter aim to movethat executable language up from the crudely expressive level to a higher level inwhich the programmer can code more directly in terms of the interaction objects ofthe application. The emphasis here is on how building levels of abstraction on top of the essential hardware and software services allows the programmer to build thesystem in terms of its desired interaction techniques, a term we use to indicate theintimate relationship between input and output. Though there is a fundamental separation between input and output devices in the hardware devices and at the lowest software level, the distinction can be removed at the programming level withthe right abstractions and hiding of detail.
In the remainder of this chapter, we will address the various layers which consti-tute the move from the low-level hardware up to the more abstract programmingconcepts for interaction. We begin in Section 8.2 with the elements of a windowingsystem, which provide for device independence and resource sharing at the pro-gramming level. Programming in a window system frees the programmer from someof the worry about the input and output primitives of the machines the applicationwill run on, and allows her to program the application under the assumption that itwill receive a stream of event requests from the window manager. In Section 8.3 wedescribe the two fundamental ways this stream of events can be processed to link the interface with the application functionality: by means of a read–evaluation con-trol loop internal to the application program or by a centralized notification-basedtechnique external to it. In Section 8.4, we describe the use of toolkits as mechanismsto link input and output at the programming level. In Section 8.5, we discuss thelarge class of development tools lumped under the categories of user interface man-agement systems, or UIMS, and user interface development systems, UIDS.
8.1

8.2 Elements of windowing systems 291
ELEMENTS OF WINDOWING SYSTEMS
In earlier chapters, we have discussed the elements of the WIMP interface but onlywith respect to how they enhance the interaction with the end-user. Here we willdescribe more details of windowing systems used to build the WIMP interface.
The first important feature of a windowing system is its ability to provide pro-grammer independence from the specifics of the hardware devices. A typical work-station will involve some visual display screen, a keyboard and some pointing device,such as a mouse. Any variety of these hardware devices can be used in any interact-ive system and they are all different in terms of the data they communicate and thecommands that are used to instruct them. It is imperative to be able to program anapplication that will run on a wide range of devices. To do this, the programmerwants to direct commands to an abstract terminal, which understands a more genericlanguage and can be translated to the language of many other specific devices.Besides making the programming task easier, the abstract terminal makes portabil-ity of application programs possible. Only one translation program – or device driver– needs to be written for a particular hardware device and then any application pro-gram can access it.
A given windowing system will have a fixed generic language for the abstract terminal which is called its imaging model. The imaging models are sufficient to describe very arbitrary images. For efficiency reasons, specific primitives are used to handle text images, either as specific pixel images or as more generic fontdefinitions.
8.2
Examples of imaging models
PixelsThe display screen is represented as a series of columns and rows of points – or pixels – whichcan be explicitly turned on or off, or given a color. This is a common imaging model for personalcomputers and is also used by the X windowing system.
Graphical kernel system (GKS)An international standard which models the screen as a collection of connected segments, each ofwhich is a macro of elementary graphics commands.
Programmer’s hierarchical interface to graphics (PHIGS)Another international standard, based on GKS but with an extension to model the screen aseditable segments.
PostScriptA programming language developed by Adobe Corporation which models the screen as a collec-tion of paths which serve as infinitely thin boundaries or stencils which can be filled in with vari-ous colors or textured patterns and images.

292 Chapter 8 n Implementation support
Though these imaging models were initially defined to provide abstract languagesfor output only, they can serve at least a limited role for input as well. So, for ex-ample, the pixel model can be used to interpret input from a mouse in terms of thepixel coordinate system. It would then be the job of the application to process theinput event further once it knows where in the image it occurred. The other modelsabove can provide even more expressiveness for the input language, because they canrelate the input events to structures that are identifiable by the application program.Both PHIGS and PostScript have been augmented to include a more explicit modelof input.
When we discussed the WIMP interface as an interaction paradigm in Chapter 4,we pointed out its ability to support several separate user tasks simultaneously.Windowing systems provide this capability by sharing the resources of a single hardware configuration with several copies of an abstract terminal. Each abstract terminal will behave as an independent process and the windowing system will coordinate the control of the concurrent processes. To ease the programming taskagain, this coordination of simultaneously active processes can be factored out of the individual applications, so that they can be programmed as if they were to oper-ate in isolation. The window system must also provide a means of displaying the separate applications, and this is accomplished by dedicating a region of the dis-play screen to each active abstract terminal. The coordination task then involvesresolving display conflicts when the visible screen regions of two abstract terminalsoverlap.
In summary, we can see the role of a windowing system, depicted in Figure 8.1, as providing
independence from the specifics of programming separate hardware devices;
management of multiple, independent but simultaneously active applications.
Next, we discuss the possible architectures of a windowing system to achieve thesetwo tasks.
8.2.1 Architectures of windowing systems
Bass and Coutaz [29] identify three possible architectures for the software to imple-ment the roles of a windowing system. All of them assume that device drivers are sep-arate from the application programs. The first option is to implement and replicatethe management of the multiple processes within each of the separate applications.This is not a very satisfactory architecture because it forces each application to con-sider the difficult problems of resolving synchronization conflicts with the sharedhardware devices. It also reduces the portability of the separate applications. The second option is to implement the management role within the kernel of the oper-ating system, centralizing the management task by freeing it from the individualapplications. Applications must still be developed with the specifics of the particu-lar operating system in mind. The third option provides the most portability, as the management function is written as a separate application in its own right and
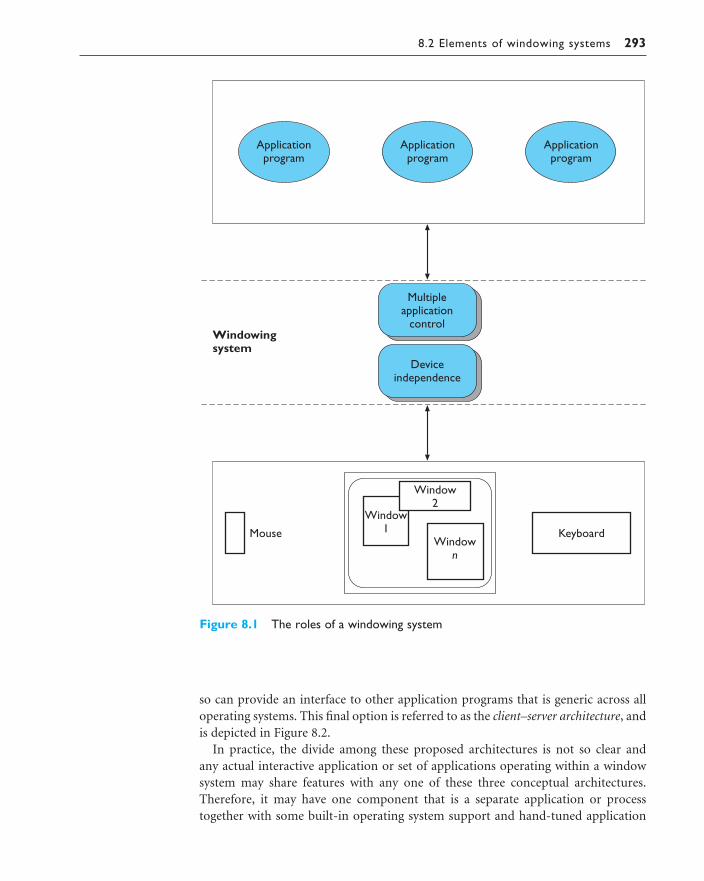
8.2 Elements of windowing systems 293
so can provide an interface to other application programs that is generic across alloperating systems. This final option is referred to as the client–server architecture, andis depicted in Figure 8.2.
In practice, the divide among these proposed architectures is not so clear and any actual interactive application or set of applications operating within a windowsystem may share features with any one of these three conceptual architectures.Therefore, it may have one component that is a separate application or processtogether with some built-in operating system support and hand-tuned application
Figure 8.1 The roles of a windowing system
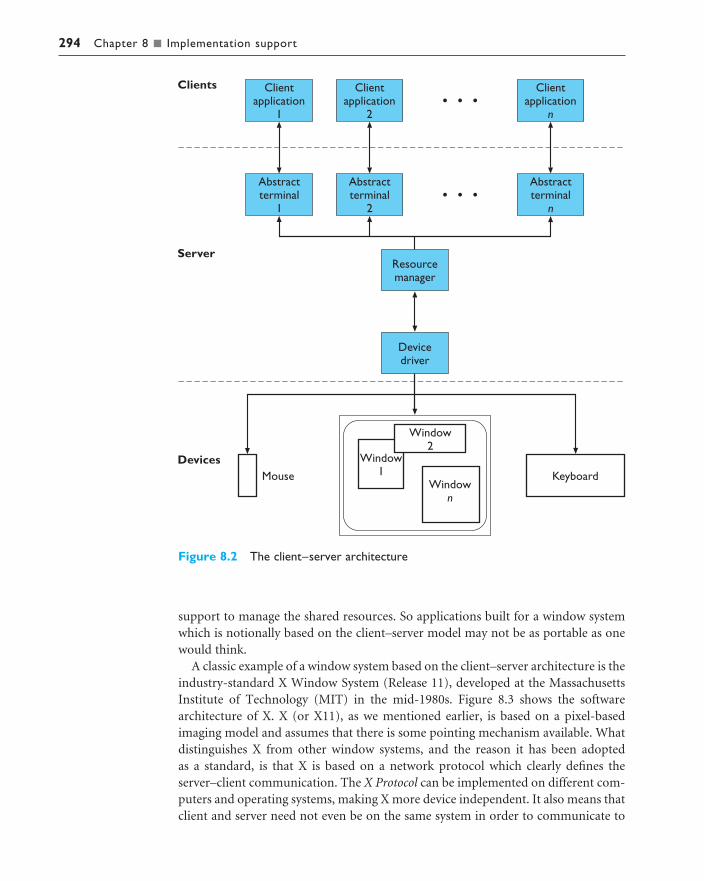
294 Chapter 8 n Implementation support
support to manage the shared resources. So applications built for a window systemwhich is notionally based on the client–server model may not be as portable as onewould think.
A classic example of a window system based on the client–server architecture is theindustry-standard X Window System (Release 11), developed at the MassachusettsInstitute of Technology (MIT) in the mid-1980s. Figure 8.3 shows the softwarearchitecture of X. X (or X11), as we mentioned earlier, is based on a pixel-basedimaging model and assumes that there is some pointing mechanism available. Whatdistinguishes X from other window systems, and the reason it has been adopted as a standard, is that X is based on a network protocol which clearly defines theserver–client communication. The X Protocol can be implemented on different com-puters and operating systems, making X more device independent. It also means thatclient and server need not even be on the same system in order to communicate to
Figure 8.2 The client–server architecture

8.2 Elements of windowing systems 295
the server. Each client of the X11 server is associated to an abstract terminal or mainwindow. The X server performs the following tasks:
n allows (or denies) access to the display from multiple client applications;n interprets requests from clients to perform screen operations or provide other
information;n demultiplexes the stream of physical input events from the user and passes them
to the appropriate client;n minimizes the traffic along the network by relieving the clients from having to
keep track of certain display information, like fonts, in complex data structuresthat the clients can access by ID numbers.
A separate client – the window manager – enforces policies to resolve conflictinginput and output requests to and from the other clients. There are several differentwindow managers which can be used in X, and they adopt different policies. Forexample, the window manager would decide how the user can change the focus ofhis input from one application to another. One option is for the user to nominateone window as the active one to which all subsequent input is directed. The otheroption is for the active window to be implicitly nominated by the position of thepointing device. Whenever the pointer is in the display space of a window, all inputis directed to it. Once the pointer is moved to a position inside another window, thatwindow becomes active and receives subsequent input. Another example of windowmanager policy is whether visible screen images of the client windows can overlap ormust be non-overlapping (called tiling). As with many other windowing systems, the
Figure 8.3 The X Window System (Release 11) architecture

296 Chapter 8 n Implementation support
client applications can define their own hierarchy of subwindows, each of which isconstrained to the coordinate space of the parent window. This subdivision of themain client window allows the programmer to manage the input and output for asingle application similar to the window manager.
To aid in the design of specific window managers, the X Consortium has producedthe Inter-Client Communication Conventions Manual (ICCCM), which providesconventions for various policy issues that are not included in the X definition. Thesepolicies include:
n rules for transferring data between clients;n methods for selecting the active client for input focus;n layout schemes for overlapping/tiled windows as screen regions.
PROGRAMMING THE APPLICATION
We now concentrate our attention on programming the actual interactive applica-tion, which would correspond to a client in the client–server architecture of Figure8.2. Interactive applications are generally user driven in the sense that the action theapplication takes is determined by the input received from the user. We describe twoprogramming paradigms which can be used to organize the flow of control withinthe application. The windowing system does not necessarily determine which ofthese two paradigms is to be followed.
The first programming paradigm is the read–evaluation loop, which is internal to the application program itself (see Figure 8.4). Programming on the Macintoshfollows this paradigm. The server sends user inputs as structured events to the clientapplication. As far as the server is concerned, the only importance of the event is theclient to which it must be directed. The client application is programmed to read anyevent passed to it and determine all of the application-specific behavior that resultsas a response to it. The logical flow of the client application is indicated in the left-most box of Figure 8.4. In pseudocode the read–evaluation loop would look like thefollowing:
repeat
read-event(myevent)
case myevent.type
type_1 :
do type_1 processing
type_2 :
do type_2 processing
.
.
.
8.3

8.3 Programming the application 297
type_n :
do type_n processing
end case
end repeat
The application has complete control over the processing of events that it receives.The downside is that the programmer must execute this control over every possibleevent that the client will receive, which could prove a very cumbersome task. On the Macintosh, this process can be aided somewhat by programming tools, such asMacApp, which automate some of the tedium.
The other programming paradigm is notification based, in which the main con-trol loop for the event processing does not reside within the application. Instead, a centralized notifier receives events from the window system and filters them to the application program in a way declared by the program (see Figure 8.5). Theapplication program informs the notifier what events are of interest to it, and foreach event declares one of its own procedures as a callback before turning controlover to the notifier. When the notifier receives an event from the window system, it sees if that event was identified by the application program and, if so, passes theevent and control over to the callback procedure that was registered for the event.After processing, the callback procedure returns control to the notifier, either tellingit to continue receiving events or requesting termination.
Figure 8.4 The read–evaluate loop paradigm

298 Chapter 8 n Implementation support
Figure 8.5 The notification-based programming paradigm
Control flow is centralized in the notifier, which relieves the application programof much of the tedium of processing every possible event passed to it by the windowsystem. But this freedom from control does not come without a price. Suppose, forexample, that the application program wanted to produce a pre-emptive dialog box,perhaps because it has detected an error and wants to obtain confirmation from the user before proceeding. The pre-emptive dialog effectively discards all sub-sequent user actions except for ones that it requires, say selection by the user insidea certain region of the screen. To do this in the read–evaluation paradigm is fairly

8.3 Programming the application 299
1. /*2. * quit.c -- simple program to display a panel button that says
"Quit".3. * Selecting the panel button exits the program.4. */5. # include <xview/xview.h>6. # include <xview/frame.h>7. # include <xview/panel.h>
8. Frame frame;
9. main (argc, argv)10. int argc;11. char *argv[];12. {13. Panel panel;14. void quit();15.16. xv_init(XV_INIT_ARGC_PTR_ARGV, &argc, argv, NULL);
17. frame = (Frame) xv_create(NULL, FRAME,18. FRAME_LABEL, argv[0],19. XV_WIDTH, 200,20. XV_HEIGHT, 100,21. NULL);
22. panel = (Panel) xv_create(frame, PANEL, NULL);
23. (void) xv_create(panel, PANEL_BUTTON,24. PANEL_LABEL_STRING, "Quit",25. PANEL_NOTIFY_PROC, quit,26. NULL);
27. xv_main_loop(frame);28. exit(0);29. }
30. void quit()31. {32. xv_destroy_safe(frame);33. }
Figure 8.6 A simple program to demonstrate notification-based programming. Example takenfrom Dan Heller [169], reproduced by permission of O’Reilly and Associates, Inc
Example: a notification-based program
Figure 8.6 provides an example of notification-based programming in C using the XViewtoolkit (toolkits are described in the next section).

300 Chapter 8 n Implementation support
straightforward. Suppose the error condition occurred during the processing of anevent of type type_2. Once the error condition is recognized, the application thenbegins another read–evaluation loop contained within that branch of the casestatement. Within that loop, all non-relevant events can be received and discarded.The pseudocode example given earlier would be modified in the following way:
repeat
read-event(myevent)
case myevent.type
type_1 :
do type_1 processing
type_2 :
. . .
if (error-condition) then
repeat
read-event(myevent2)
case myevent2.type
The program produces a window, or frame, with one button, labeled Quit, which when selectedby the pointer device causes the program to quit, destroying the window (see Figure 8.7 for the screen image produced by the sample program quit.c). Three objects are created in thisprogram: the outermost frame, a panel within that frame and the button in the panel. The pro-cedure xv_create, used on lines 17, 22 and 23 in the source code of Figure 8.6, is used by the application program to register the objects with the XView notifier. In the last instance on line 23, the application programmer informs the notifier of the callback procedure to beinvoked when the object, a button, is selected. The application program then initiates the notifierby the procedure call xv_main_loop. When the notifier receives a select event for the button,control is passed to the procedure quit which destroys the outermost frame and requests termination.
Figure 8.7 Screen image produced by sample program quit.c
8.3 Programming the application 301
type_1 :
.
.
.
type_n :
end case
until (end-condition2)
end if
. . .
.
.
.
type_n :
do type_n processing
end case
until (end-condition)
In the notification-based paradigm, such a pre-emptive dialog would not be sosimple, because the control flow is out of the hands of the application programmer.The callback procedures would all have to be modified to recognize the situations inwhich the pre-emptive dialog is needed and in those situations disregard all eventswhich are passed to them by the notifier. Things would be improved, however, if the application programmer could in such situations access the notifier directly torequest that previously acceptable events be ignored until further notice.
DESIGN FOCUS
Going with the grain
It is possible to use notification-based code to produce pre-emptive interface dialog such as a modal dia-log box, but much more difficult than with an event-loop-based system. Similarly, it is possible to writeevent-loop-based code which is not pre-emptive, but again it is difficult to do so. If you are not care-ful, systems built using notification-based code will have lots of non-modal dialog boxes and vice versa.Each programming paradigm has a grain, a tendency to push you towards certain kinds of interface.
If you know that the interface you require fits more closely to one paradigm or another then it is worthselecting the programming paradigm to make your life easier! Often, however, you do not have achoice. In this case you have to be very careful to decide what kind of interface dialog you want beforeyou (or someone else) start coding. Where the desired interface fits the grain of the paradigm youdon’t have to worry. Where the desired behavior runs against the grain you must be careful, both incoding and testing as these are the areas where things will go wrong.
Of course, if you don’t explicitly decide what behavior you want or you specify it unclearly, then it is likely that the resulting system will simply run with the grain, whether or not that makes a good interface.

302 Chapter 8 n Implementation support
USING TOOLKITS
As we discussed in Chapter 4, a key feature of WIMP interfaces from the user’s per-spective is that input and output behaviors are intrinsically linked to independententities on the display screen. This creates the illusion that the entities on the screenare the objects of interest – interaction objects we have called them – and that is necessary for the action world of a direct manipulation interface. A classic exampleis the mouse as a pointing device. The input coming from the hardware device is separate from the output of the mouse cursor on the display screen. However, sincethe visual movement of the screen cursor is linked with the physical movement of themouse device, the user feels as if he is actually moving the visual cursor. Even thoughinput and output are actually separate, the illusion causes the user to treat them as one; indeed, both the visual cursor and the physical device are referred to simplyas ‘the mouse’. In situations where this link is broken, it is easy to see the user’s frustration.
In Figure 8.8, we show an example of how input and output are combined forinteraction with a button object. As the user moves the mouse cursor over the but-ton, it changes to a finger to suggest that the user can push it. Pressing the mousebutton down causes the button to be highlighted and might even make an audibleclick like the keys on some keyboards, providing immediate feedback that the buttonhas been pushed. Releasing the mouse button unhighlights the button and movingthe mouse off the button changes the cursor to its initial shape, indicating that theuser is no longer over the active area of the button.
From the programmer’s perspective, even at the level of a windowing system,input and output are still quite separate for everything except the mouse, and it takes quite a bit of effort in the application program to create the illusion of the interaction object such as the button we have just described. To aid the programmerin fusing input and output behaviors, another level of abstraction is placed on top ofthe window system – the toolkit. A toolkit provides the programmer with a set ofready-made interaction objects – alternatively called interaction techniques, gadgetsor widgets – which she can use to create her application programs. The interaction
8.4
Figure 8.8 Example of behavior of a button interaction object

8.4 Using toolkits 303
objects have a predefined behavior, such as that described for the button, that comesfor free without any further programming effort. Toolkits exist for all windowingenvironments (for example, OSF/Motif and XView for the X Window system, the Macintosh Toolbox and the Software Development Toolkit for MicrosoftWindows).
To provide flexibility, the interaction objects can be tailored to the specific situation in which they are invoked by the programmer. For example, the label onthe button could be a parameter which the programmer can set when a particularbutton is created. More complex interaction objects can be built up from smaller,simpler ones. Ultimately, the entire application can be viewed as a collection of interaction objects whose combined behavior describes the semantics of the wholeapplication.
The sample program quit.c in Figure 8.6 uses the XView toolkit. Programmingwith toolkits is suited to the notification-based programming paradigm. As we cansee in the example, the button is created as a PANEL_BUTTON object (lines 23–26)and registers the appropriate callback routine for when the notifier receives a selec-tion event for the button object. The button interaction object in the toolkit alreadyhas defined what actual user action is classified as the selection event, so the pro-grammer need not worry about that when creating an instance of the button. Theprogrammer can think of the event at a higher level of abstraction, that is as a selec-tion event instead of as a release of the left mouse button.
In Chapter 7 we discussed the benefits of consistency and generalizability for an interactive system. One of the advantages of programming with toolkits is thatthey can enforce consistency in both input form and output form by providing similar behavior to a collection of widgets. For example, every button interactionobject, within the same application program or between different ones, by defaultcould have a behavior like the one described in Figure 8.8. All that is required is thatthe developers for the different applications use the same toolkit. This consistency of behavior for interaction objects is referred to as the look and feel of the toolkit.Style guides, which were described in the discussion on guidelines in Chapter 7, giveadditional hints to a programmer on how to preserve the look and feel of a giventoolkit beyond that which is enforced by the default definition of the interactionobjects.
Two features of interaction objects and toolkits make them amenable to an object-oriented approach to programming. First, they depend on being able to define a classof interaction objects which can then be invoked (or instantiated) many times withinone application with only minor modifications to each instance. Secondly, buildingcomplex interaction objects is made easier by building up their definition based onexisting simpler interaction objects. These notions of instantiation and inheritanceare cornerstones of object-oriented programming. Classes are defined as templatesfor interaction objects. When an interaction object is created, it is declared as aninstance of some predefined class. So, in the example quit.c program, frame isdeclared as an instance of the class FRAME (line 17), panel is declared as an instanceof the class PANEL (line 22) and the button (no name) is declared as an instance ofthe class PANEL_BUTTON (line 23). Typically, a class template will provide default

304 Chapter 8 n Implementation support
values for various attributes. Some of those attributes can be altered in any oneinstance; they are sometimes distinguished as instance attributes.
In defining the classes of interaction objects themselves, new classes can be builtwhich inherit features of one or other classes. In the simplest case, there is a strictclass hierarchy in which each class inherits features of only one other class, its parentclass. This simple form of inheritance is called single inheritance and is exhibited inthe XView toolkit standard hierarchy for the window class in Figure 8.9. A morecomplicated class hierarchy would permit defining new classes which inherit frommore than one parent class – called multiple inheritance.
DESIGN FOCUS
Java and AWT
The Java toolkit for developing windowed applications is called the Abstract Windowing Toolkit, AWT.It maps interface objects such as buttons, menus and dialog boxes onto corresponding Java classes. The programmer builds an interface either by using these classes directly or by subclassing them, that is specializing the behavior of the object in some way. This subclassing means that new interactionwidgets can easily be added. The toolkit is notification based, but the mechanism has changed slightlybetween versions. In AWT 1.0 the programmer needs to subclass a button in order to specify its beha-vior when pressed. Since AWT 1.1 the programmer can use a method more like traditional callbacks,but based on registering special Java objects rather than functions.
Figure 8.9 The single inheritance class hierarchy of the XView toolkit, after Heller [169], reproduced by permission of O’Reilly and Associates, Inc

8.4 Using toolkits 305
We should point out that though most toolkits are structured in an object-oriented manner, that does not mean that the actual application programming language is object oriented. The example program quit.c was written in the C programming language, which is not an object-oriented language. It is best to thinkof object orientation as yet another programming paradigm which structures theway the programmer attacks the programming task without mandating a particularsyntax or semantics for the programming language.
The programmer can tailor the behavior and appearance of an interaction objectby setting the values of various instance attributes. These attributes must be setbefore the application program is compiled. In addition, some windowing systemsallow various attributes of interaction objects to be altered without necessitatingrecompilation, though they may have to be set before the actual program is run. This tailorability is achieved via resources which can be accessed by the applicationprogram and change the compiled value of some attributes. For efficiency reasons,this tailorability is often limited to a small set of attributes for any given class.
Worked exercise Scrolling is an effective means of browsing through a document in a window that is too smallto show the whole document. Compare the different interactive behavior of the following twointeraction objects to implement scrolling:
n A scrollbar is attached to the side of the window with arrows at the top and bottom. Whenthe mouse is positioned over the arrow at the top of the screen (which points up), the window frame is moved upwards to reveal a part of the document above/before what iscurrently viewed. When the bottom arrow is selected, the frame moves down to reveal thedocument below/after the current view.
n The document is contained in a textual interaction object. Pressing the mouse button in thetext object allows you to drag the document within the window boundaries. You drag up tobrowse down in the document and you drag down to browse up.
The difference between the two situations can be characterized by noticing that, in the firstcase, the user is actually manipulating the window (moving it up or down to reveal the con-tents of the document), whereas, in the second case, the user is manipulating the document (pushing it up or down to reveal its contents through the windows). What usability principleswould you use to justify one method over the other (also consider the case when you want toscroll from side to side as well as up and down)? What implementation considerations areimportant?
Answer There are many usability principles that can be brought to bear on an examination ofscrolling principles. For example:
Observability The whole reason why scrolling is used is because there is too muchinformation to present all at once. Providing a means of viewing document contentswithout changing the contents increases the observability of the system. Scrollbarsalso increase observability because they help to indicate the wider context of theinformation which is currently visible, typically by showing where the window ofinformation fits within the whole document. However, observability does notaddress the particular design options put forth here.

306 Chapter 8 n Implementation support
Predictability The value of a scrolling mechanism lies in the user being able to knowwhere a particular scrolling action will lead in the document. The use of arrows onthe scrollbar is to help the user predict the effect of the scrolling operation. If anarrow points up, the question is whether that indicates the direction the window isbeing moved (the first case) or the direction the actual text would have to move (thesecond case). The empirical question here is: to what object do users associate thearrow – the text or the text window? The arrow of the scrollbar is more closelyconnected to the boundary of a text window, so the more usual interpretationwould be to have it indicate the direction of the window movement.
Synthesizability You might think that it does not matter which object the user asso-ciates to the arrow. He will just have to learn the mapping and live with it. In thiscase, how easy is it to learn the mapping, that is can the user synthesize the mean-ing of the scrolling actions from changes made at the display? Usually, the movementof a box within the scrollbar itself will indicate the result of a scrolling operation.
Familiarity/guessability It would be an interesting experiment to see whetherthere was a difference in the performance of new users for the different scrollingmechanisms. This might be the subject of a more extended exercise.
Task conformance There are some implementation limitations for these scrollingmechanisms (see below). In light of these limitations, does the particular scrollingtask prefer one over the other? In considering this principle, we need to know whatkinds of scrolling activity will be necessary. Is the document a long text that will bebrowsed from end to end, or is it possibly a map or a picture which is only slightlylarger than the actual screen so scrolling will only be done in small increments?
Some implementation considerations:
n What scroll mechanisms does a toolkit provide? Is it easy to access the two optionsdiscussed above within the same toolkit?
n In the case of the second scrolling option, are there enough keys on the mouse toallow this operation without interfering with other important mouse operations,such as arbitrarily moving the insertion point or selecting a portion of text or select-ing a graphical item?
n In the second option, the user places the mouse on a specific location within the window, and gestures to dictate the movement of the underlying document. Whatkind of behavior is expected when the mouse hits the boundary of the window? Is thescrolling limited in this case to steps bounded in size by the size of the window, so thatscrolling between two distant points requires many separate smaller scrolling actions?
USER INTERFACE MANAGEMENT SYSTEMS
Despite the availability of toolkits and the valuable abstraction they provide pro-grammers, there are still significant hurdles to overcome in the specification, designand implementation of interactive systems. Toolkits provide only a limited range
8.5

8.5 User interface management systems 307
of interaction objects, limiting the kinds of interactive behavior allowed betweenuser and system. Toolkits are expensive to create and are still very difficult to use bynon-programmers. Even experienced programmers will have difficulty using themto produce an interface that is predictably usable. There is a need for additional sup-port for programmers in the design and use of toolkits to overcome their deficien-cies. Also, none of the programming mechanisms we have discussed so far in thischapter is appropriate for non-expert programmers, so we still have a long way to gotowards the goal of opening up interactive system implementation to those whosemain concerns are with HCI and not programming.
The set of programming and design techniques which are supposed to addanother level of services for interactive system design beyond the toolkit level are user interface management systems, or UIMS for short. The term UIMS is used quitewidely in both industrial and academic circles and has come to represent a variety oftopics. The main concerns of a UIMS, for our purposes, are:
n a conceptual architecture for the structure of an interactive system which con-centrates on a separation between application semantics and presentation;
n techniques for implementing a separated application and presentation whilst preserving the intended connection between them;
n support techniques for managing, implementing and evaluating a run-time interactive environment.
We should acknowledge that some people feel that the term UIMS is inappropriatefor all of the above tasks, preferring the term user interface development systems, orUIDS, to distinguish support tools which address many of the design activities thatprecede the management of the run-time system.
8.5.1 UIMS as a conceptual architecture
A major issue in this area of research is one of separation between the semantics ofthe application and the interface provided for the user to make use of that semantics.There are many good arguments to support this separation of concerns:
Portability To allow the same application to be used on different systems it is bestto consider its development separate from its device-dependent interface.
Reusability Separation increases the likelihood that components can be reused inorder to cut development costs.
Multiple interfaces To enhance the interactive flexibility of an application, severaldifferent interfaces can be developed to access the same functionality.
Customization The user interface can be customized by both the designer and theuser to increase its effectiveness without having to alter the underlying application.
Once we allow for a separation between application and presentation, we mustconsider how those two partners communicate. This role of communication is referred to as dialog control. Conceptually, this provides us with the three major

308 Chapter 8 n Implementation support
components of an interactive system: the application, the presentation and the dialogcontrol. In terms of the actual implementation, this separation may not be so clear.
In Section 8.3, we described the two basic approaches to programming the applica-tion within an interactive system. In the read–evaluation loop, the control of the dia-log is internal to the application. The application calls interface procedures wheninput or output is required. In notification-based programming, the dialog controlresides external to the application. When the user performs some input action, thenotifier then invokes the correct application procedure to handle the event. MostUIMS fall into this class of external dialog control systems, since they promote, to agreater extent, the separation between presentation and application. They do not,however, all use the technique of callbacks as was demonstrated in Section 8.4 for theuse of toolkits.
The first acknowledged instance of a development system that supported thisapplication–presentation separation was in 1968 with Newman’s Reaction Handler.The term UIMS was coined by Kasik in 1982 [196a] after some preliminary research onhow graphical input could be used to broaden the scope of HCI. The first conceptualarchitecture of what constituted a UIMS was formulated at a workshop in 1985 atSeeheim, Germany [285]. The logical components of a UIMS were identified as:
Presentation The component responsible for the appearance of the interface,including what output and input is available to the user.
Dialog control The component which regulates the communication between thepresentation and the application.
Application interface The view of the application semantics that is provided as theinterface.
Figure 8.10 presents a graphical interpretation of the Seeheim model. We haveincluded both application and user in Figure 8.10 to place the UIMS model more in the context of the interactive system (though you could argue that we have not provided enough of that context by mentioning only a single user and a singleapplication). The application and the user are not explicit in the Seeheim model
Figure 8.10 The Seeheim model of the logical components of a UIMS
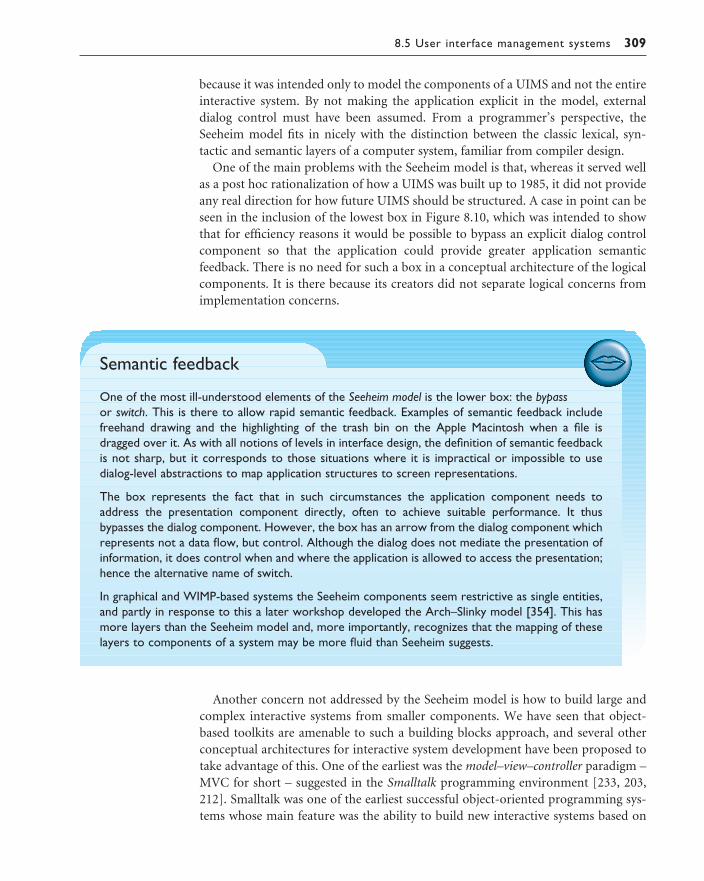
8.5 User interface management systems 309
because it was intended only to model the components of a UIMS and not the entireinteractive system. By not making the application explicit in the model, external dialog control must have been assumed. From a programmer’s perspective, theSeeheim model fits in nicely with the distinction between the classic lexical, syn-tactic and semantic layers of a computer system, familiar from compiler design.
One of the main problems with the Seeheim model is that, whereas it served wellas a post hoc rationalization of how a UIMS was built up to 1985, it did not provideany real direction for how future UIMS should be structured. A case in point can beseen in the inclusion of the lowest box in Figure 8.10, which was intended to showthat for efficiency reasons it would be possible to bypass an explicit dialog controlcomponent so that the application could provide greater application semantic feedback. There is no need for such a box in a conceptual architecture of the logicalcomponents. It is there because its creators did not separate logical concerns fromimplementation concerns.
Semantic feedback
One of the most ill-understood elements of the Seeheim model is the lower box: the bypassor switch. This is there to allow rapid semantic feedback. Examples of semantic feedback includefreehand drawing and the highlighting of the trash bin on the Apple Macintosh when a file isdragged over it. As with all notions of levels in interface design, the definition of semantic feedbackis not sharp, but it corresponds to those situations where it is impractical or impossible to use dialog-level abstractions to map application structures to screen representations.
The box represents the fact that in such circumstances the application component needs toaddress the presentation component directly, often to achieve suitable performance. It thusbypasses the dialog component. However, the box has an arrow from the dialog component whichrepresents not a data flow, but control. Although the dialog does not mediate the presentation ofinformation, it does control when and where the application is allowed to access the presentation;hence the alternative name of switch.
In graphical and WIMP-based systems the Seeheim components seem restrictive as single entities,and partly in response to this a later workshop developed the Arch–Slinky model [354]. This hasmore layers than the Seeheim model and, more importantly, recognizes that the mapping of theselayers to components of a system may be more fluid than Seeheim suggests.
Another concern not addressed by the Seeheim model is how to build large andcomplex interactive systems from smaller components. We have seen that object-based toolkits are amenable to such a building blocks approach, and several otherconceptual architectures for interactive system development have been proposed totake advantage of this. One of the earliest was the model–view–controller paradigm –MVC for short – suggested in the Smalltalk programming environment [233, 203,212]. Smalltalk was one of the earliest successful object-oriented programming sys-tems whose main feature was the ability to build new interactive systems based on

310 Chapter 8 n Implementation support
existing ones. Within Smalltalk, the link between application semantics and presenta-tion can be built up in units by means of the MVC triad. The model represents theapplication semantics; the view manages the graphical and/or textual output of theapplication; and the controller manages the input (see Figure 8.11).
The basic behavior of models, views and controllers has been embodied in generalSmalltalk object classes, which can be inherited by instances and suitably modified.Smalltalk, like many other window toolkits, prescribes its own look and feel on input and output, so the generic view and controller classes (called View andController, respectively) do not need much modification after instantiation.Models, on the other hand, are very general because they must be used to portray any possible application semantics. A single model can be associated with severalMVC triads, so that the same piece of application semantics can be represented bydifferent input–output techniques. Each view–controller pair is associated to onlyone model.
Another so-called multi-agent architecture for interactive systems is the presenta-tion–abstraction–control PAC model suggested by Coutaz [79]. PAC is based on acollection of triads also: with application semantics represented by the abstractioncomponent; input and output combined in one presentation component; and anexplicit control component to manage the dialog and correspondence betweenapplication and presentation (see Figure 8.12). There are three important differencesbetween PAC and MVC. First, PAC groups input and output together, whereas MVCseparates them. Secondly, PAC provides an explicit component whose duty it is tosee that abstraction and presentation are kept consistent with each other, whereasMVC does not assign this important task to any one component, leaving it to theprogrammer/designer to determine where that chore resides. Finally, PAC is notlinked to any programming environment, though it is certainly conducive to anobject-oriented approach. It is probably because of this last difference that PACcould so easily isolate the control component; PAC is more of a conceptual architec-ture than MVC because it is less implementation dependent.
Figure 8.11 The model–view–controller triad in Smalltalk
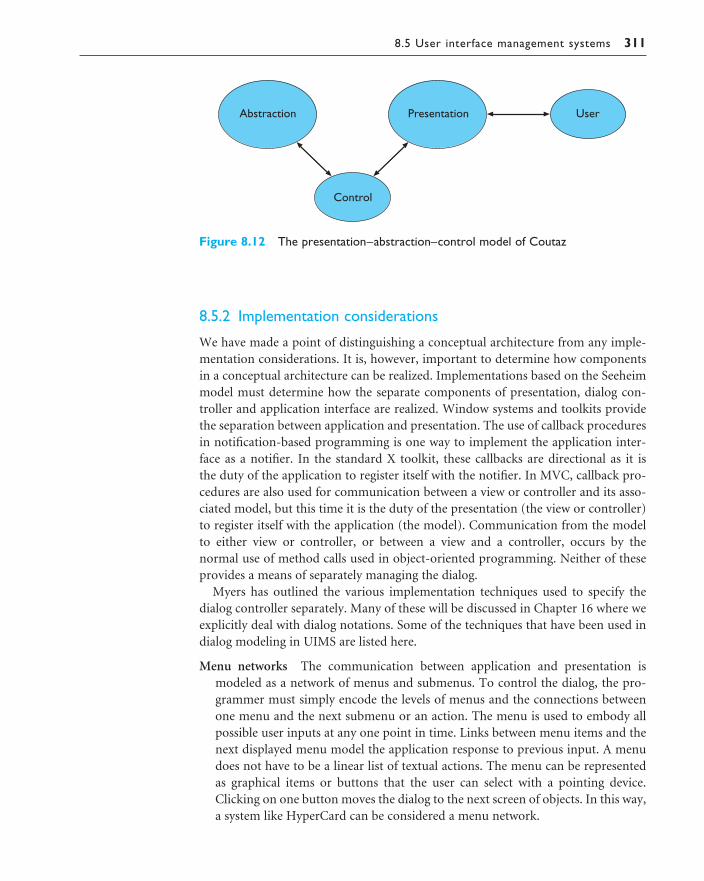
8.5 User interface management systems 311
8.5.2 Implementation considerations
We have made a point of distinguishing a conceptual architecture from any imple-mentation considerations. It is, however, important to determine how componentsin a conceptual architecture can be realized. Implementations based on the Seeheimmodel must determine how the separate components of presentation, dialog con-troller and application interface are realized. Window systems and toolkits providethe separation between application and presentation. The use of callback proceduresin notification-based programming is one way to implement the application inter-face as a notifier. In the standard X toolkit, these callbacks are directional as it is the duty of the application to register itself with the notifier. In MVC, callback pro-cedures are also used for communication between a view or controller and its asso-ciated model, but this time it is the duty of the presentation (the view or controller)to register itself with the application (the model). Communication from the modelto either view or controller, or between a view and a controller, occurs by the normal use of method calls used in object-oriented programming. Neither of theseprovides a means of separately managing the dialog.
Myers has outlined the various implementation techniques used to specify the dialog controller separately. Many of these will be discussed in Chapter 16 where weexplicitly deal with dialog notations. Some of the techniques that have been used indialog modeling in UIMS are listed here.
Menu networks The communication between application and presentation ismodeled as a network of menus and submenus. To control the dialog, the pro-grammer must simply encode the levels of menus and the connections betweenone menu and the next submenu or an action. The menu is used to embody allpossible user inputs at any one point in time. Links between menu items and thenext displayed menu model the application response to previous input. A menudoes not have to be a linear list of textual actions. The menu can be representedas graphical items or buttons that the user can select with a pointing device.Clicking on one button moves the dialog to the next screen of objects. In this way,a system like HyperCard can be considered a menu network.
Figure 8.12 The presentation–abstraction–control model of Coutaz
312 Chapter 8 n Implementation support
Grammar notations The dialog between application and presentation can betreated as a grammar of actions and responses, and, therefore, described by meansof a formal context-free grammar notation, such as BNF (Backus–Naur form).These are good for describing command-based interfaces, but are not so good formore graphically-based interaction techniques. It is also not clear from a formalgrammar what directionality is associated to each event in the grammar; that is,whether an event is initiated by the user or by the application. Therefore, it isdifficult to model communication of values across the dialog controller, and thatis necessary to maintain any semantic feedback from application to presentation.
State transition diagrams State transition diagrams can be used as a graphicalmeans of expressing dialog. Many variants on state transition diagrams will bediscussed in Chapter 16. The difficulty with these notations lies in linking dialogevents with corresponding presentation or application events. Also, it is not clearhow communication between application and presentation is represented.
Event languages Event languages are similar to grammar notations, except that theycan be modified to express directionality and support some semantic feedback.Event languages are good for describing localized input–output behavior in termsof production rules. A production rule is activated when input is received and itresults in some output responses. This control of the input–output relationshipcomes at a price. It is now more difficult to model the overall flow of the dialog.
Declarative languages All of the above techniques (except for menu networks) arepoor for describing the correspondence between application and presentationbecause they are unable to describe effectively how information flows between the two. They only view the dialog as a sequence of events that occur between two communicating partners. A declarative approach concentrates more ondescribing how presentation and application are related. This relationship can bemodeled as a shared database of values that both presentation and application canaccess. Declarative languages, therefore, describe what should result from thecommunication between application and presentation, not how it should happenin terms of event sequencing.
Constraints Constraints systems are a special subset of declarative languages.Constraints can be used to make explicit the connection between independentinformation of the presentation and the application. Implicit in the control com-ponent of the PAC model is this notion of constraint between values of the applica-tion and values of the presentation. Hill has proposed the abstraction–link–view,or ALV (pronounced ‘AL-vee’), which makes the same distinctions as PAC [172].However, Hill suggests an implementation of the communication betweenabstraction and view by means of the link component as a collection of two-wayconstraints between abstraction and view. Constraints embody dependenciesbetween different values that must always be maintained. For instance, an intelli-gent piggy bank might display the value of its contents; there is the constraint thatthe value displayed to the outside observer of the piggy bank is the same as thevalue of money inside it. By using constraints, the link component is described

8.6 Summary 313
separately from the abstraction and view. Hence, describing the link in terms of con-straints is a way of achieving an independent description of the dialog controller.
Graphical specification These techniques allow the dialog specification to be pro-grammed graphically in terms of the presentation language itself. This techniquecan be referred to as programming by demonstration since the programmer isbuilding up the interaction dialog directly in terms of the actual graphical inter-action objects that the user will see, instead of indirectly by means of some textualspecification language that must still be linked with the presentation objects. The major advantage of this graphical technique is that it opens up the dialogspecification to the non-programmer, which is a very significant contribution.
Ultimately, the programmer would want access to a variety of these techniques inany one UIMS. For example, the Myers Garnet system combines a declarative con-straints language with a graphical specification technique. There is an intriguingtrend we should note as we proceed away from internal control of dialog in the appli-cation itself to external control in an independent dialog component to presentationcontrol in the graphical specification languages. When the dialog is specified internalto the application, then it must know about presentation issues, which make theapplication less generic. External control is about specifying the dialog independentof the application or presentation. One of the problems with such an independentdescription is that the intended link between application and presentation is imposs-ible to describe without some information about each, so a good deal of informa-tion of each must be represented, which may be both inefficient and cumbersome.Presentation control describes the dialog in the language in terms of the objects theuser can see at the interface. Whereas this might provide a simple means of pro-ducing a dialog specification and be more amenable to non-programmers, it is alsorestrictive because the graphical language of a modern workstation is nowhere nearas expressive as programming languages.
In summary, components of a UIMS which allow the description of the applicationseparate from the presentation are advantageous from a software engineering per-spective, but there has not yet been conclusive proof that they are as desirable indesigning for usability. There is currently a struggle between difficult-to-use butpowerful techniques for describing both the communication and the correspondencebetween application and presentation and simple-to-use but limited techniques. Pro-grammers will probably always opt for powerful techniques that provide the mostflexibility. Non-programmers will opt for simplicity despite the lack of expressiveness.
SUMMARY
In this chapter, we have concentrated on describing the programming support toolsthat are available for implementing interactive systems. We began with a descriptionof windowing systems, which are the foundation of modern WIMP interfaces.
8.6
314 Chapter 8 n Implementation support
Window systems provide only the crudest level of abstraction for the programmer,allowing her to gain device independence and multiple application control. They do not, however, provide a means of separating the control of presentation andapplication dialog. We described two paradigms for interactive programming, andsaw that these relate to two means of controlling that dialog – either internal to theapplication by means of a read–evaluation loop or external to the application bymeans of notification-based programming. Toolkits used with particular windowingsystems add another level of abstraction by combining input and output behaviorsto provide the programmer with access to interaction objects from which to buildthe components of the interactive system. Toolkits are amenable to external dialogcontrol by means of callback procedures within the application. Other dialog controltechniques are provided with yet another level of abstraction in interactive systemdevelopment: user interface management systems. UIMS provide a conceptual archi-tecture for dividing up the relationship between application and presentation, andvarious techniques were described to implement the logical components of a UIMS.An interesting additional means of dialog control can be seen to emerge in the use ofgraphical specification languages which move dialog control all the way across thespectrum to reside entirely within the presentation language. This presentation con-trol opens up interactive programming to the non-expert programmer, but at thecost of a loss of expressiveness.
EXERCISES
8.1 In contrasting the read–evaluation loop and the notification-based paradigm for inter-active programs, construction of a pre-emptive dialog was discussed. How would a programmerdescribe a pre-emptive dialog by purely graphical means? (Hint: Refer to the discussion in Sec-tion 8.5 concerning the shift from external and independent dialog management to presentationcontrol of the dialog.)
8.2 Look ahead to the example of the state transition diagram for font characteristics presented in Chapter 16 (Section 16.3.3). Compare different interaction objects that could implement thiskind of dialog. Use examples from existing toolkits (pull-down menus or dialog boxes) or createa novel interaction object.
8.3 This exercise is based on the nuclear reactor scenario on the book website at:/e3/scenario/nuclear/
(a) In the Seeheim model: treating the Application Interface model and Application together,there are three main layers:(i) presentation/lexical(ii) dialog/syntactic(iii) application/semantic.For each of these three layers, list at least two different items of the description of the nuclearreactor control panel that are relevant to the level (that is, at least six items in total, two foreach level).

Exercises 315
(b) There are no items in the description that relate to the switch (rapid feedback) part of theSeeheim model. Why do you think this is?
8.4 A user has a word processor and a drawing package open. The word processor’s window isuppermost. The user then clicks on the drawing window (see figure below). The drawing windowpops to the front.
Describe in detail the things that the window manager and applications perform during the pro-cessing of the mouse click in the above scenario. Explain any assumptions you make about thekind of window manager or application toolkits that are being used.
Screen shot reprinted by permission from Apple Computer, Inc.
8.5 A designer described the following interface for a save operation.The users initially see a screen with a box where they can type the file name (see Screen 1).
The screen also has a ‘list’ button that they can use to obtain a listing of all the files in the currentdirectory (folder). This list appears in a different window. When the user clicks the save button,the system presents a dialog box to ask the user to confirm the save (see Screen 2).
Screen 1

RECOMMENDED READING
L. Bass and J. Coutaz, Developing Software for the User Interface, Addison-Wesley, 1991.This is dedicated to the issues we discuss in this chapter, along with general issues about software engineering for interactive systems. Full of programmingexamples and a detailed discussion of the Serpent UIMS.
B. A. Myers, Creating User Interfaces by Demonstration, Academic Press, 1988.Myers’ work on the Peridot system is summarized in this book. Peridot was theprecursor to the Garnet system. Readers interested in learning more about Garnetshould consult the November 1990 issue of the journal IEEE Computer for anexcellent introductory overview.
D. Olsen, User Interface Management Systems: Models and Algorithms, MorganKaufmann, 1992.Serious interactive system programmers who want to learn more details about the workings of a wide variety of UIMS should consult this book, written by a veryrespected member of the UIMS community.
D. Hix, Generations of user-interface management systems, IEEE Software, Vol. 7,No. 5, pp. 77–87, September 1990.A good introductory overview of the advances in UIMS technology and the futurepossibilities.
Screen 2
Two programmers independently coded the interface using two different window managers.Programmer A used an event-loop style of program whereas programmer B used a notifier (call-back) style.
(a) Sketch out the general structure of each program.(b) Highlight any potential interface problems you expect from each programmer and how they
could attempt to correct them.
316 Chapter 8 n Implementation support

Recommended reading 317
B. A. Myers, User-interface tools: introduction and survey, IEEE Software, Vol. 6, No. 1, pp. 47–61, January 1989.As well as providing a review of user interface tools, this article provides a goodset of references into the relevant literature.
G. F. Coulouris and H. W. Thimbleby, HyperProgramming, Addison-Wesley, 1993.An introduction to programming HyperCard. Use of the programming facilitiesof HyperTalk allows one to prototype substantial parts of the functionality as wellas the surface features of an interface.
P. H. Winston and S. Narasimhan, On to Java, 3rd edition, Addison-Wesley, 2001.Java is another good way to get into user interface programming, as examples caneasily be embedded into web pages as applets. This is a good first book on Javausing the construction of an applet in AWT as its motivating example. For clearreference books on aspects of the language, look at the O’Reilly series.
C. Gram and G. Cockton, editors, Design Principles for Interactive Software,Chapman and Hall, 1996.Produced by IFIP Working Group 2.7 (User Interface Engineering). This criticallydiscusses several user interface architectures and looks at the way architecture canhelp or hinder the pursuit of principles similar to those in Chapter 7.

EVALUATION TECHNIQUES
OV E RV I E W
n Evaluation tests the usability, functionality andacceptability of an interactive system.
n Evaluation may take place:– in the laboratory– in the field.
n Some approaches are based on expert evaluation:– analytic methods– review methods– model-based methods.
n Some approaches involve users:– experimental methods– observational methods– query methods.
n An evaluation method must be chosen carefully andmust be suitable for the job.
9

9.2 Goals of evaluation 319
WHAT IS EVALUATION?
In previous chapters we have discussed a design process to support the design ofusable interactive systems. However, even if such a process is used, we still need toassess our designs and test our systems to ensure that they actually behave as weexpect and meet user requirements. This is the role of evaluation.
Evaluation should not be thought of as a single phase in the design process (stillless as an activity tacked on the end of the process if time permits). Ideally, evalu-ation should occur throughout the design life cycle, with the results of the evaluationfeeding back into modifications to the design. Clearly, it is not usually possible toperform extensive experimental testing continuously throughout the design, butanalytic and informal techniques can and should be used. In this respect, there is aclose link between evaluation and the principles and prototyping techniques we havealready discussed – such techniques help to ensure that the design is assessed con-tinually. This has the advantage that problems can be ironed out before considerableeffort and resources have been expended on the implementation itself: it is mucheasier to change a design in the early stages of development than in the later stages.We can make a broad distinction between evaluation by the designer or a usabilityexpert, without direct involvement by users, and evaluation that studies actual use of the system. The former is particularly useful for assessing early designs and prototypes; the latter normally requires a working prototype or implementation.However, this is a broad distinction and, in practice, the user may be involved inassessing early design ideas (for example, through focus groups), and expert-basedanalysis can be performed on completed systems, as a cheap and quick usabilityassessment. We will consider evaluation techniques under two broad headings:expert analysis and user participation.
Before looking at specific techniques, however, we will consider why we do evalu-ation and what we are trying to achieve.
GOALS OF EVALUATION
Evaluation has three main goals: to assess the extent and accessibility of the system’sfunctionality, to assess users’ experience of the interaction, and to identify anyspecific problems with the system.
The system’s functionality is important in that it must accord with the user’srequirements. In other words, the design of the system should enable users to per-form their intended tasks more easily. This includes not only making the appro-priate functionality available within the system, but making it clearly reachable bythe user in terms of the actions that the user needs to take to perform the task. It alsoinvolves matching the use of the system to the user’s expectations of the task. Forexample, if a filing clerk is used to retrieving a customer’s file by the postal address,
9.2
9.1
320 Chapter 9 n Evaluation techniques
the same capability (at least) should be provided in the computerized file system.Evaluation at this level may also include measuring the user’s performance with thesystem, to assess the effectiveness of the system in supporting the task.
In addition to evaluating the system design in terms of its functional capabilities,it is important to assess the user’s experience of the interaction and its impact uponhim. This includes considering aspects such as how easy the system is to learn, itsusability and the user’s satisfaction with it. It may also include his enjoyment andemotional response, particularly in the case of systems that are aimed at leisure orentertainment. It is important to identify areas of the design that overload the userin some way, perhaps by requiring an excessive amount of information to be remem-bered, for example. A fuller classification of principles that can be used as evaluationcriteria is provided in Chapter 7. Much evaluation is aimed at measuring featuressuch as these.
The final goal of evaluation is to identify specific problems with the design. Thesemay be aspects of the design which, when used in their intended context, cause unexpected results, or confusion amongst users. This is, of course, related to both thefunctionality and usability of the design (depending on the cause of the problem).However, it is specifically concerned with identifying trouble-spots which can thenbe rectified.
EVALUATION THROUGH EXPERT ANALYSIS
As we have noted, evaluation should occur throughout the design process. In particular, the first evaluation of a system should ideally be performed before anyimplementation work has started. If the design itself can be evaluated, expensive mis-takes can be avoided, since the design can be altered prior to any major resourcecommitments. Typically, the later in the design process that an error is discovered,the more costly it is to put right and, therefore, the less likely it is to be rectified.However, it can be expensive to carry out user testing at regular intervals during thedesign process, and it can be difficult to get an accurate assessment of the experienceof interaction from incomplete designs and prototypes. Consequently, a number ofmethods have been proposed to evaluate interactive systems through expert analysis.These depend upon the designer, or a human factors expert, taking the design andassessing the impact that it will have upon a typical user. The basic intention is to identify any areas that are likely to cause difficulties because they violate knowncognitive principles, or ignore accepted empirical results. These methods can be used at any stage in the development process from a design specification, throughstoryboards and prototypes, to full implementations, making them flexible evalu-ation approaches. They are also relatively cheap, since they do not require userinvolvement. However, they do not assess actual use of the system, only whether ornot a system upholds accepted usability principles.
We will consider four approaches to expert analysis: cognitive walkthrough,heuristic evaluation, the use of models and use of previous work.
9.3
9.3 Evaluation through expert analysis 321
9.3.1 Cognitive walkthrough
Cognitive walkthrough was originally proposed and later revised by Polson and col-leagues [294, 376] as an attempt to introduce psychological theory into the informaland subjective walkthrough technique.
The origin of the cognitive walkthrough approach to evaluation is the code walk-through familiar in software engineering. Walkthroughs require a detailed review ofa sequence of actions. In the code walkthrough, the sequence represents a segmentof the program code that is stepped through by the reviewers to check certain char-acteristics (for example, that coding style is adhered to, conventions for spelling variables versus procedure calls, and to check that system-wide invariants are notviolated). In the cognitive walkthrough, the sequence of actions refers to the stepsthat an interface will require a user to perform in order to accomplish some knowntask. The evaluators then ‘step through’ that action sequence to check it for poten-tial usability problems. Usually, the main focus of the cognitive walkthrough is toestablish how easy a system is to learn. More specifically, the focus is on learningthrough exploration. Experience shows that many users prefer to learn how to use asystem by exploring its functionality hands on, and not after sufficient training orexamination of a user’s manual. So the checks that are made during the walkthroughask questions that address this exploratory learning. To do this, the evaluators gothrough each step in the task and provide a ‘story’ about why that step is or is notgood for a new user. To do a walkthrough (the term walkthrough from now on refersto the cognitive walkthrough, and not to any other kind of walkthrough), you needfour things:
1. A specification or prototype of the system. It doesn’t have to be complete, but itshould be fairly detailed. Details such as the location and wording for a menu canmake a big difference.
2. A description of the task the user is to perform on the system. This should be arepresentative task that most users will want to do.
3. A complete, written list of the actions needed to complete the task with the pro-posed system.
4. An indication of who the users are and what kind of experience and knowledgethe evaluators can assume about them.
Given this information, the evaluators step through the action sequence(identified in item 3 above) to critique the system and tell a believable story about itsusability. To do this, for each action, the evaluators try to answer the following fourquestions for each step in the action sequence.
1. Is the effect of the action the same as the user’s goal at that point? Each useraction will have a specific effect within the system. Is this effect the same as whatthe user is trying to achieve at this point? For example, if the effect of the actionis to save a document, is ‘saving a document’ what the user wants to do?
2. Will users see that the action is available? Will users see the button or menu item,for example, that is used to produce the action? This is not asking whether theywill recognize that the button is the one they want. This is merely asking whether
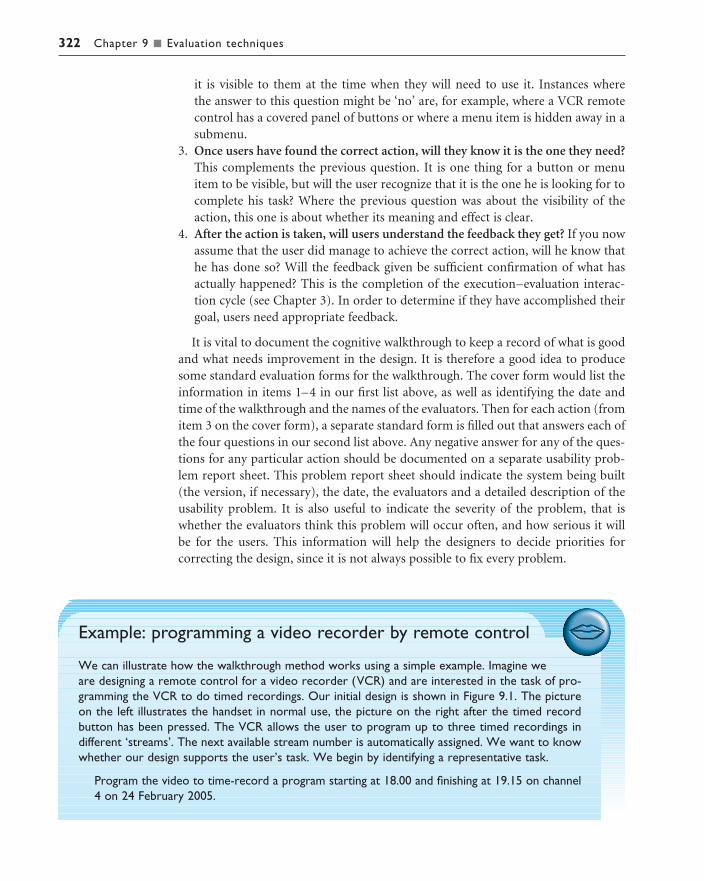
322 Chapter 9 n Evaluation techniques
it is visible to them at the time when they will need to use it. Instances where the answer to this question might be ‘no’ are, for example, where a VCR remotecontrol has a covered panel of buttons or where a menu item is hidden away in asubmenu.
3. Once users have found the correct action, will they know it is the one they need?This complements the previous question. It is one thing for a button or menuitem to be visible, but will the user recognize that it is the one he is looking for tocomplete his task? Where the previous question was about the visibility of theaction, this one is about whether its meaning and effect is clear.
4. After the action is taken, will users understand the feedback they get? If you nowassume that the user did manage to achieve the correct action, will he know thathe has done so? Will the feedback given be sufficient confirmation of what hasactually happened? This is the completion of the execution–evaluation interac-tion cycle (see Chapter 3). In order to determine if they have accomplished theirgoal, users need appropriate feedback.
It is vital to document the cognitive walkthrough to keep a record of what is goodand what needs improvement in the design. It is therefore a good idea to producesome standard evaluation forms for the walkthrough. The cover form would list theinformation in items 1–4 in our first list above, as well as identifying the date andtime of the walkthrough and the names of the evaluators. Then for each action (fromitem 3 on the cover form), a separate standard form is filled out that answers each ofthe four questions in our second list above. Any negative answer for any of the ques-tions for any particular action should be documented on a separate usability prob-lem report sheet. This problem report sheet should indicate the system being built(the version, if necessary), the date, the evaluators and a detailed description of theusability problem. It is also useful to indicate the severity of the problem, that iswhether the evaluators think this problem will occur often, and how serious it willbe for the users. This information will help the designers to decide priorities for correcting the design, since it is not always possible to fix every problem.
Example: programming a video recorder by remote control
We can illustrate how the walkthrough method works using a simple example. Imagine weare designing a remote control for a video recorder (VCR) and are interested in the task of pro-gramming the VCR to do timed recordings. Our initial design is shown in Figure 9.1. The pictureon the left illustrates the handset in normal use, the picture on the right after the timed recordbutton has been pressed. The VCR allows the user to program up to three timed recordings indifferent ‘streams’. The next available stream number is automatically assigned. We want to knowwhether our design supports the user’s task. We begin by identifying a representative task.
Program the video to time-record a program starting at 18.00 and finishing at 19.15 on channel4 on 24 February 2005.

9.3 Evaluation through expert analysis 323
We will assume that the user is familiar with VCRs but not with this particular design.
The next step in the walkthrough is to identify the action sequence for this task. We specify thisin terms of the user’s action (UA) and the system’s display or response (SD). The initial display isas the left-hand picture in Figure 9.1.
UA 1: Press the ‘timed record’ buttonSD 1: Display moves to timer mode. Flashing cursor appears after ‘start:’UA 2: Press digits 1 8 0 0SD 2: Each digit is displayed as typed and flashing cursor moves to next positionUA 3: Press the ‘timed record’ buttonSD 3: Flashing cursor moves to ‘end:’UA 4: Press digits 1 9 1 5SD 4: Each digit is displayed as typed and flashing cursor moves to next positionUA 5: Press the ‘timed record’ buttonSD 5: Flashing cursor moves to ‘channel:’UA 6: Press digit 4SD 6: Digit is displayed as typed and flashing cursor moves to next positionUA 7: Press the ‘timed record’ buttonSD 7: Flashing cursor moves to ‘date:’UA 8: Press digits 2 4 0 2 0 5SD 8: Each digit is displayed as typed and flashing cursor moves to next positionUA 9: Press the ‘timed record’ buttonSD 9: Stream number in top right-hand corner of display flashesUA 10: Press the ‘transmit’ buttonSD 10: Details are transmitted to video player and display returns to normal mode
Figure 9.1 An initial remote control design
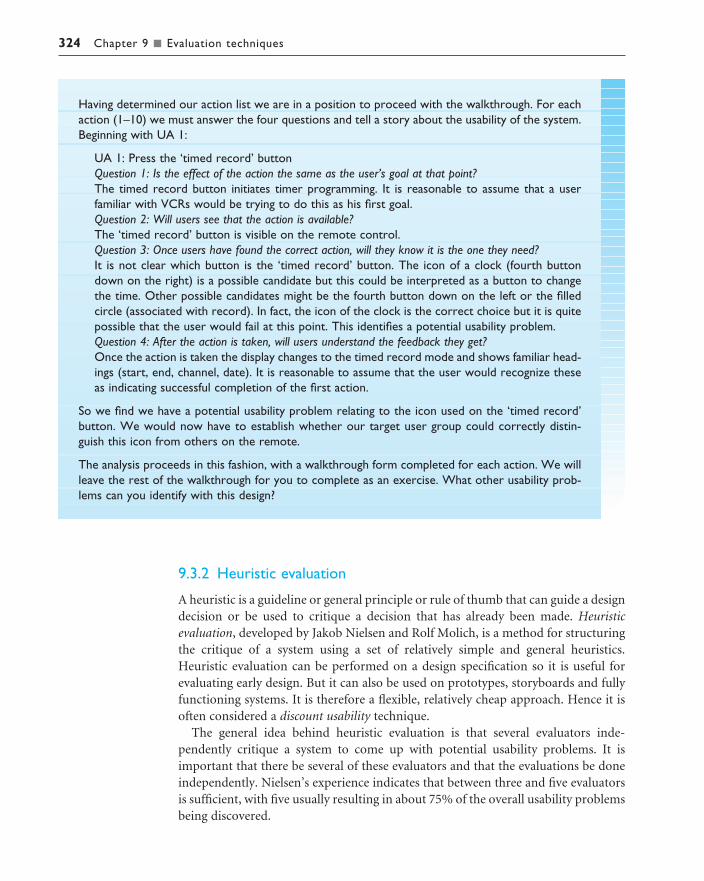
324 Chapter 9 n Evaluation techniques
9.3.2 Heuristic evaluation
A heuristic is a guideline or general principle or rule of thumb that can guide a designdecision or be used to critique a decision that has already been made. Heuristicevaluation, developed by Jakob Nielsen and Rolf Molich, is a method for structuringthe critique of a system using a set of relatively simple and general heuristics.Heuristic evaluation can be performed on a design specification so it is useful forevaluating early design. But it can also be used on prototypes, storyboards and fullyfunctioning systems. It is therefore a flexible, relatively cheap approach. Hence it isoften considered a discount usability technique.
The general idea behind heuristic evaluation is that several evaluators inde-pendently critique a system to come up with potential usability problems. It isimportant that there be several of these evaluators and that the evaluations be doneindependently. Nielsen’s experience indicates that between three and five evaluatorsis sufficient, with five usually resulting in about 75% of the overall usability problemsbeing discovered.
Having determined our action list we are in a position to proceed with the walkthrough. For eachaction (1–10) we must answer the four questions and tell a story about the usability of the system.Beginning with UA 1:
UA 1: Press the ‘timed record’ buttonQuestion 1: Is the effect of the action the same as the user’s goal at that point?The timed record button initiates timer programming. It is reasonable to assume that a userfamiliar with VCRs would be trying to do this as his first goal.Question 2: Will users see that the action is available?The ‘timed record’ button is visible on the remote control.Question 3: Once users have found the correct action, will they know it is the one they need?It is not clear which button is the ‘timed record’ button. The icon of a clock (fourth buttondown on the right) is a possible candidate but this could be interpreted as a button to changethe time. Other possible candidates might be the fourth button down on the left or the filledcircle (associated with record). In fact, the icon of the clock is the correct choice but it is quitepossible that the user would fail at this point. This identifies a potential usability problem.Question 4: After the action is taken, will users understand the feedback they get?Once the action is taken the display changes to the timed record mode and shows familiar head-ings (start, end, channel, date). It is reasonable to assume that the user would recognize theseas indicating successful completion of the first action.
So we find we have a potential usability problem relating to the icon used on the ‘timed record’button. We would now have to establish whether our target user group could correctly distin-guish this icon from others on the remote.
The analysis proceeds in this fashion, with a walkthrough form completed for each action. We willleave the rest of the walkthrough for you to complete as an exercise. What other usability prob-lems can you identify with this design?

9.3 Evaluation through expert analysis 325
To aid the evaluators in discovering usability problems, a set of 10 heuristics areprovided. The heuristics are related to principles and guidelines (see Chapter 7). Thesecan be supplemented where required by heuristics that are specific to the particulardomain. So, for example, if the system is for synchronous group communication, onemight add ‘awareness of other users’ as a heuristic. Although Nielsen recommendsthe use of these 10 as providing the most effective coverage of the most common us-ability problems, other rules, such as those discussed in Chapter 7, could also be used.
Each evaluator assesses the system and notes violations of any of these heuristicsthat would indicate a potential usability problem. The evaluator also assesses theseverity of each usability problem, based on four factors: how common is the prob-lem, how easy is it for the user to overcome, will it be a one-off problem or a persist-ent one, and how seriously will the problem be perceived? These can be combinedinto an overall severity rating on a scale of 0–4:
0 = I don’t agree that this is a usability problem at all1 = Cosmetic problem only: need not be fixed unless extra time is available on project2 = Minor usability problem: fixing this should be given low priority3 = Major usability problem: important to fix, so should be given high priority4 = Usability catastrophe: imperative to fix this before product can be released (Nielsen)
Nielsen’s ten heuristics are:
1. Visibility of system status Always keep users informed about what is going on,through appropriate feedback within reasonable time. For example, if a systemoperation will take some time, give an indication of how long and how much iscomplete.
2. Match between system and the real world The system should speak the user’slanguage, with words, phrases and concepts familiar to the user, rather than system-oriented terms. Follow real-world conventions, making informationappear in natural and logical order.
3. User control and freedom Users often choose system functions by mistake and need a clearly marked ‘emergency exit’ to leave the unwanted state withouthaving to go through an extended dialog. Support undo and redo.
4. Consistency and standards Users should not have to wonder whether words,situations or actions mean the same thing in different contexts. Follow platformconventions and accepted standards.
5. Error prevention Make it difficult to make errors. Even better than good errormessages is a careful design that prevents a problem from occurring in the firstplace.
6. Recognition rather than recall Make objects, actions and options visible. Theuser should not have to remember information from one part of the dialog toanother. Instructions for use of the system should be visible or easily retrievablewhenever appropriate.
7. Flexibility and efficiency of use Allow users to tailor frequent actions.Accelerators – unseen by the novice user – may often speed up the interactionfor the expert user to such an extent that the system can cater to both inexperi-enced and experienced users.

326 Chapter 9 n Evaluation techniques
8. Aesthetic and minimalist design Dialogs should not contain information thatis irrelevant or rarely needed. Every extra unit of information in a dialog competeswith the relevant units of information and diminishes their relative visibility.
9. Help users recognize, diagnose and recover from errors Error messages shouldbe expressed in plain language (no codes), precisely indicate the problem, andconstructively suggest a solution.
10. Help and documentation Few systems can be used with no instructions so itmay be necessary to provide help and documentation. Any such informationshould be easy to search, focussed on the user’s task, list concrete steps to be carried out, and not be too large.
Once each evaluator has completed their separate assessment, all of the problemsare collected and the mean severity ratings calculated. The design team will thendetermine the ones that are the most important and will receive attention first.
9.3.3 Model-based evaluation
A third expert-based approach is the use of models. Certain cognitive and designmodels provide a means of combining design specification and evaluation into thesame framework. These are discussed in detail in Chapter 12. For example, theGOMS (goals, operators, methods and selection) model predicts user performancewith a particular interface and can be used to filter particular design options.Similarly, lower-level modeling techniques such as the keystroke-level model pro-vide predictions of the time users will take to perform low-level physical tasks.
Design methodologies, such as design rationale (see Chapter 6), also have a role toplay in evaluation at the design stage. Design rationale provides a framework inwhich design options can be evaluated. By examining the criteria that are associatedwith each option in the design, and the evidence that is provided to support these criteria, informed judgments can be made in the design.
Dialog models can also be used to evaluate dialog sequences for problems, such asunreachable states, circular dialogs and complexity. Models such as state transitionnetworks are useful for evaluating dialog designs prior to implementation. These arediscussed in detail in Chapter 16.
9.3.4 Using previous studies in evaluation
Experimental psychology and human–computer interaction between them possess a wealth of experimental results and empirical evidence. Some of this is specific to aparticular domain, but much deals with more generic issues and applies in a varietyof situations. Examples of such issues are the usability of different menu types, therecall of command names, and the choice of icons.
A final approach to expert evaluation exploits this inheritance, using previousresults as evidence to support (or refute) aspects of the design. It is expensive torepeat experiments continually and an expert review of relevant literature can avoid

9.4 Evaluation through user participation 327
the need to do so. It should be noted that experimental results cannot be expected to hold arbitrarily across contexts. The reviewer must therefore select evidence care-fully, noting the experimental design chosen, the population of participants used, theanalyses performed and the assumptions made. For example, an experiment testingthe usability of a particular style of help system using novice participants may notprovide accurate evaluation of a help system designed for expert users. The reviewshould therefore take account of both the similarities and the differences between the experimental context and the design under consideration. This is why this is an expert review: expertise in the area is required to ensure that correct assumptionsare made.
EVALUATION THROUGH USER PARTICIPATION
The techniques we have considered so far concentrate on evaluating a design or system through analysis by the designer, or an expert evaluator, rather than testingwith actual users. However, useful as these techniques are for filtering and refiningthe design, they are not a replacement for actual usability testing with the people for whom the system is intended: the users. In this section we will look at a numberof different approaches to evaluation through user participation. These includeempirical or experimental methods, observational methods, query techniques, andmethods that use physiological monitoring, such as eye tracking and measures ofheart rate and skin conductance.
User participation in evaluation tends to occur in the later stages of developmentwhen there is at least a working prototype of the system in place. This may rangefrom a simulation of the system’s interactive capabilities, without its underlyingfunctionality (for example, the Wizard of Oz technique, which is discussed inChapter 6, through a basic functional prototype to a fully implemented system.However, some of the methods discussed can also contribute to the earlier designstages, such as requirements capture, where observation and surveying users areimportant (see Chapter 13).
9.4.1 Styles of evaluation
Before we consider some of the techniques that are available for evaluation withusers, we will distinguish between two distinct evaluation styles: those performedunder laboratory conditions and those conducted in the work environment or ‘in thefield’.
Laboratory studies
In the first type of evaluation studies, users are taken out of their normal work envir-onment to take part in controlled tests, often in a specialist usability laboratory
9.4

328 Chapter 9 n Evaluation techniques
(although the ‘lab’ may simply be a quiet room). This approach has a number ofbenefits and disadvantages.
A well-equipped usability laboratory may contain sophisticated audio/visualrecording and analysis facilities, two-way mirrors, instrumented computers and thelike, which cannot be replicated in the work environment. In addition, the particip-ant operates in an interruption-free environment. However, the lack of context – forexample, filing cabinets, wall calendars, books or interruptions – and the unnaturalsituation may mean that one accurately records a situation that never arises in thereal world. It is especially difficult to observe several people cooperating on a task ina laboratory situation, as interpersonal communication is so heavily dependent oncontext (see Section 9.4.2).
There are, however, some situations where laboratory observation is the onlyoption, for example, if the system is to be located in a dangerous or remote loca-tion, such as a space station. Also some very constrained single-user tasks may beadequately performed in a laboratory. Finally, and perhaps most commonly, we maydeliberately want to manipulate the context in order to uncover problems or observeless used procedures, or we may want to compare alternative designs within a con-trolled context. For these types of evaluation, laboratory studies are appropriate.
Field studies
The second type of evaluation takes the designer or evaluator out into the user’swork environment in order to observe the system in action. Again this approach hasits pros and cons.
High levels of ambient noise, greater levels of movement and constant inter-ruptions, such as phone calls, all make field observation difficult. However, the very ‘open’ nature of the situation means that you will observe interactions betweensystems and between individuals that would have been missed in a laboratory study.The context is retained and you are seeing the user in his ‘natural environment’. In addition, some activities, such as those taking days or months, are impossible tostudy in the laboratory (though difficult even in the field).
On balance, field observation is to be preferred to laboratory studies as it allows usto study the interaction as it occurs in actual use. Even interruptions are importantas these will expose behaviors such as saving and restoring state during a task.However, we should remember that even in field observations the participants arelikely to be influenced by the presence of the analyst and/or recording equipment, sowe always operate at a slight remove from the natural situation, a sort of Heisenberguncertainty principle.
This is, of course, a generalization: there are circumstances, as we have noted, inwhich laboratory testing is necessary and desirable. In particular, controlled experi-ments can be useful for evaluation of specific interface features, and must normallybe conducted under laboratory conditions. From an economic angle, we need toweigh the costs of establishing recording equipment in the field, and possibly dis-rupting the actual work situation, with the costs of taking one or more participants

9.4 Evaluation through user participation 329
away from their jobs into the laboratory. This balance is not at all obvious and anystudy must weigh the loss of contextual information against the increased costs anddifficulty of field studies.
9.4.2 Empirical methods: experimental evaluation
One of the most powerful methods of evaluating a design or an aspect of a design is to use a controlled experiment. This provides empirical evidence to support a particular claim or hypothesis. It can be used to study a wide range of different issuesat different levels of detail.
Any experiment has the same basic form. The evaluator chooses a hypothesis totest, which can be determined by measuring some attribute of participant behavior.A number of experimental conditions are considered which differ only in the valuesof certain controlled variables. Any changes in the behavioral measures are attributedto the different conditions. Within this basic form there are a number of factors thatare important to the overall reliability of the experiment, which must be consideredcarefully in experimental design. These include the participants chosen, the variablestested and manipulated, and the hypothesis tested.
Participants
The choice of participants is vital to the success of any experiment. In evaluationexperiments, participants should be chosen to match the expected user populationas closely as possible. Ideally, this will involve experimental testing with the actualusers but this is not always possible. If participants are not actual users, they shouldbe chosen to be of a similar age and level of education as the intended user group.Their experience with computers in general, and with systems related to that beingtested, should be similar, as should their experience or knowledge of the taskdomain. It is no good testing an interface designed to be used by the general publicon a participant set made up of computer science undergraduates: they are simplynot representative of the intended user population.
A second issue relating to the participant set is the sample size chosen. Often this is something that is determined by pragmatic considerations: the availability ofparticipants is limited or resources are scarce. However, the sample size must be largeenough to be considered to be representative of the population, taking into accountthe design of the experiment and the statistical methods chosen.
Nielsen and Landauer [264] suggest that usability testing with a single participantwill find about a third of the usability problems, and that there is little to be gainedfrom testing with more than five. While this may be true of observational studieswhere the aim is simply to uncover usability issues, it is not possible to discovermuch about the extent of usability problems from such small numbers. Certainly, ifthe intention is to run a controlled experiment and perform statistical analysis on theresults, at least twice this number is recommended.

330 Chapter 9 n Evaluation techniques
Variables
Experiments manipulate and measure variables under controlled conditions, inorder to test the hypothesis. There are two main types of variable: those that are‘manipulated’ or changed (known as the independent variables) and those that aremeasured (the dependent variables).
Independent variables are those elements of the experiment that are manipu-lated to produce different conditions for comparison. Examples of independent variables in evaluation experiments are interface style, level of help, number of menu items and icon design. Each of these variables can be given a number of dif-ferent values; each value that is used in an experiment is known as a level of the variable. So, for example, an experiment that wants to test whether search speedimproves as the number of menu items decreases may consider menus with five,seven, and ten items. Here the independent variable, number of menu items, hasthree levels.
More complex experiments may have more than one independent variable. Forexample, in the above experiment, we may suspect that the speed of the user’sresponse depends not only on the number of menu items but also on the choice ofcommands used on the menu. In this case there are two independent variables. If there were two sets of command names (that is, two levels), we would require six experimental conditions to investigate all the possibilities (three levels of menusize × two levels of command names).
Dependent variables, on the other hand, are the variables that can be measured inthe experiment, their value is ‘dependent’ on the changes made to the independentvariable. In the example given above, this would be the speed of menu selection. The dependent variable must be measurable in some way, it must be affected by theindependent variable, and, as far as possible, unaffected by other factors. Commonchoices of dependent variable in evaluation experiments are the time taken to com-plete a task, the number of errors made, user preference and the quality of the user’sperformance. Obviously, some of these are easier to measure objectively than others.However, the more subjective measures can be applied against predetermined scales,and can be very important factors to consider.
Hypotheses
A hypothesis is a prediction of the outcome of an experiment. It is framed in termsof the independent and dependent variables, stating that a variation in the inde-pendent variable will cause a difference in the dependent variable. The aim of theexperiment is to show that this prediction is correct. This is done by disproving thenull hypothesis, which states that there is no difference in the dependent variablebetween the levels of the independent variable. The statistical measures describedbelow produce values that can be compared with various levels of significance. If a result is significant it shows, at the given level of certainty, that the differences measured would not have occurred by chance (that is, that the null hypothesis isincorrect).
9.4 Evaluation through user participation 331
Experimental design
In order to produce reliable and generalizable results, an experiment must be care-fully designed. We have already looked at a number of the factors that the experi-menter must consider in the design, namely the participants, the independent anddependent variables, and the hypothesis. The first phase in experimental design thenis to choose the hypothesis: to decide exactly what it is you are trying to demonstrate.In doing this you are likely to clarify the independent and dependent variables, inthat you will have identified what you are going to manipulate and what change youexpect. If your hypothesis does not clearly identify these variables then you need torethink it. At this stage you should also consider your participants: how many areavailable and are they representative of the user group?
The next step is to decide on the experimental method that you will use. There are two main methods: between-subjects and within-subjects. In a between-subjects(or randomized) design, each participant is assigned to a different condition. There are at least two conditions: the experimental condition (in which the variable hasbeen manipulated) and the control, which is identical to the experimental conditionexcept for this manipulation. This control serves to ensure that it is the manipulationthat is responsible for any differences that are measured. There may, of course, bemore than two groups, depending on the number of independent variables and thenumber of levels that each variable can take.
The advantage of a between-subjects design is that any learning effect resultingfrom the user performing in one condition and then the other is controlled: eachuser performs under only one condition. The disadvantages are that a greater num-ber of participants are required, and that significant variation between the groupscan negate any results. Also, individual differences between users can bias the results. These problems can be handled by a careful selection of participants, ensur-ing that all are representative of the population and by matching participantsbetween groups.
The second experimental design is within-subjects (or repeated measures). Hereeach user performs under each different condition. This design can suffer fromtransfer of learning effects, but this can be lessened if the order in which the condi-tions are tackled is varied between users, for example, group A do first condition fol-lowed by second and group B do second condition followed by first. Within-subjectsis less costly than between-subjects, since fewer users are required, and it can be particularly effective where learning is involved. There is also less chance of effectsfrom variation between participants.
The choice of experimental method will depend on the resources available, howfar learning transfer is likely or can be controlled, and how representative the particip-ant group is considered to be. A popular compromise, in cases where there is morethan one independent variable, is to devise a mixed design where one variable isplaced between-groups and one within-groups. So, returning to our example of themenu design, the participants would be split into two groups, one for each commandset, but each group would perform in three conditions, corresponding to the threepossible levels of the number of menu items.

332 Chapter 9 n Evaluation techniques
Once we have determined the hypothesis we are trying to test, the variables we arestudying, the participants at our disposal, and the design that is most appropriate, we have to decide how we are going to analyze the results we record. There are anumber of statistical tests available, and the choice of test is vital to the success of theexperiment. Different tests make different assumptions about the data and if aninappropriate test is chosen, the results can be invalid. The next subsection discussesthe factors to consider in choosing a statistical test and surveys the most commonstatistical measures available.
Statistical measures
The first two rules of statistical analysis are to look at the data and to save the data. It is easy to carry out statistical tests blindly when a glance at a graph, histogram or table of results would be more instructive. In particular, looking at the data can expose outliers, single data items that are very different from the rest. Outliers are often the result of a transcription error or a freak event not connected to theexperiment. For example, we notice that one participant took three times as long aseveryone else to do a task. We investigate and discover that the participant had beensuffering from flu on the day of the experiment. Clearly, if the participant’s data wereincluded it would bias the results.
Saving the data is important, as we may later want to try a different analysismethod. It is all too common for an experimenter to take some averages or other-wise tabulate results, and then throw away the original data. At worst, the remainingstatistics can be useless for statistical purposes, and, at best, we have lost the abilityto trace back odd results to the original data, as, for example, we want to do for outliers.
Our choice of statistical analysis depends on the type of data and the questions wewant to answer. It is worth having important results checked by an experiencedstatistician, but in many situations standard tests can be used.
Variables can be classified as either discrete variables or continuous variables. A discrete variable can only take a finite number of values or levels, for example, ascreen color that can be red, green or blue. A continuous variable can take any value(although it may have an upper or lower limit), for example a person’s height or thetime taken to complete a task. A special case of continuous data is when they are pos-itive, for example a response time cannot be negative. A continuous variable can berendered discrete by clumping it into classes, for example we could divide heightsinto short (<5 ft (1.5 m)), medium (5–6 ft (1.5–1.8 m)) and tall (>6 ft (1.8 m)). Inmany interface experiments we will be testing one design against another. In thesecases the independent variable is usually discrete.
The dependent variable is the measured one and subject to random experimentalvariation. In the case when this variable is continuous, the random variation maytake a special form. If the form of the data follows a known distribution then specialand more powerful statistical tests can be used. Such tests are called parametric testsand the most common of these are used when the variation follows the normal distribution. This means that if we plot a histogram of the random errors, they will

9.4 Evaluation through user participation 333
form the well-known bell-shaped graph (Figure 9.2). Happily, many of these tests arefairly robust, that is they give reasonable results even when the data are not preciselynormal. This means that you need not worry too much about checking normalityduring early analysis.
There are ways of checking whether data are really normal, but for these the reader should consult a statistics book, or a professional statistician. However, as a general rule, if data can be seen as the sum or average of many small independ-ent effects they are likely to be normal. For example, the time taken to complete acomplex task is the sum of the times of all the minor tasks of which it is composed.On the other hand, a subjective rating of the usability of an interface will not be normal. Occasionally data can be transformed to become approximately normal. The most common is the log-transformation, which is used for positive data with near-zero values. As a log-transformation has little effect when the data are clustered well away from zero, many experimenters habitually log-transform.However, this practice makes the results more difficult to interpret and is not recommended.
When we cannot assume that data are normally distributed, we must often resortto non-parametric tests. These are statistical tests that make no assumptions aboutthe particular distribution and are usually based purely on the ranking of the data.That is, each item of a data set (for example, 57, 32, 61, 49) is reduced to its rank (3, 1, 4, 2), before analysis begins. Because non-parametric tests make fewer assump-tions about the data than parametric tests, and are more resistant to outliers, there is less danger of getting spurious results. However, they are less powerful than thecorresponding parametric tests. This means that, given the same set of data, a para-metric test might detect a difference that the non-parametric test would miss.
A third sort of test is the contingency table, where we classify data by several discrete attributes and then count the number of data items with each attribute combination.
Table 9.1 lists some of the standard tests categorized by the form of independentand dependent variables (discrete/continuous/normal). Normality is not an issue
Figure 9.2 Histogram of normally distributed errors

334 Chapter 9 n Evaluation techniques
for the independent variable, but a special case is when it is discrete with only two values, for example comparing two systems. We cannot describe all the tech-niques here; for this you should use a standard statistics text, such as one of thoserecommended in the reading list. The table is only intended to guide you in yourchoice of test.
An extensive and accurate analysis is no use if it answers the wrong question.Examples of questions one might ask about the data are as follows:
Is there a difference? For example, is one system better than another? Techniquesthat address this are called hypothesis testing. The answers to this question are notsimply yes/no, but of the form: ‘we are 99% certain that selection from menus offive items is faster than that from menus of seven items’.
How big is the difference? For example, ‘selection from five items is 260 ms faster than from seven items’. This is called point estimation, often obtained byaverages.
How accurate is the estimate? For example, ‘selection is faster by 260 ± 30 ms’.Statistical answers to this are in the form of either measures of variation such asthe standard deviation of the estimate, or confidence intervals. Again, the answersone obtains are probabilistic: ‘we are 95% certain that the difference in responsetime is between 230 and 290 ms’.
The experimental design issues we have discussed have been principally addressed at the first question. However, most of the statistical techniques listed above, bothparametric and non-parametric, give some answer to one or both of the other questions.
Table 9.1 Choosing a statistical technique
Independent Dependent variable variable
ParametricTwo valued Normal Student’s t test on difference of meansDiscrete Normal ANOVA (ANalysis Of VAriance)Continuous Normal Linear (or non-linear) regression factor analysis
Non-parametricTwo valued Continuous Wilcoxon (or Mann–Whitney) rank-sum testDiscrete Continuous Rank-sum versions of ANOVAContinuous Continuous Spearman’s rank correlation
Contingency testsTwo valued Discrete No special test, see next entryDiscrete Discrete Contingency table and chi-squared testContinuous Discrete (Rare) Group independent variable and then as above

9.4 Evaluation through user participation 335
An example: evaluating icon designs
Imagine you are designing a new interface to a document-processing package, whichis to use icons for presentation. You are considering two styles of icon design and youwish to know which design will be easier for users to remember. One set of icons usesnaturalistic images (based on a paper document metaphor), the other uses abstractimages (see Figure 9.3). How might you design an experiment to help you decidewhich style to use?
The first thing you need to do is form a hypothesis: what do you consider to be thelikely outcome? In this case, you might expect the natural icons to be easier to recallsince they are more familiar to users. We can therefore form the following hypothesis:
Example of non-parametric statistics
We will not see an example of the use of non-parametric statistics later, so we will gothrough a small example here. Imagine we had the following data for response times under twoconditions:
condition A: 33, 42, 25, 79, 52condition B: 87, 65, 92, 93, 91, 55
We gather the data together and sort them into order: 25, 33, 42, . . . , 92, 93. We then substitutefor each value its rank in the list: 25 becomes 1, 33 becomes 2, etc. The transformed data are then
condition A: 2, 3, 1, 7, 4condition B: 8, 6, 10, 11, 9, 5
Tests are then carried out on the data. For example, to test whether there is any differencebetween the two conditions we can use the Wilcoxon test. To do this, we take each condition andcalculate the sum of ranks, and subtract the least value it could have (that is, 1 + 2 + 3 + 4 + 5 = 15for condition A, 1 + 2 + 3 + 4 + 5 + 6 = 21 for condition B), giving the statistic U:
rank sum least Ucondition A: (2 + 3 + 1 + 7 + 4) − 15 = 2condition B: (8 + 6 + 10 + 11 + 9 + 5) − 21 = 28
In fact, the sum of these two U statistics, 2 + 28 = 30, is the product of the number of data valuesin each condition 5 × 6. This will always happen and so one can always get away with calculatingonly one of the U. Finally, we then take the smaller of two U values and compare it with a set ofcritical values in a book of statistical tables, to see if it is unusually small. The table is laid out depend-ent on the number of data values in each condition (five and six). The critical value at the 5% levelturns out to be 3. As the smallest statistic is smaller than this, we can reject the null hypothesis andconclude that there is likely to be a difference between the conditions. To be precise, it says thatthere is only a 1 in 20 (5%) chance that the data happened by chance. In fact the test is right – theauthors constructed random data in the range 1–100 and then subtracted 10 from each of the values in condition A.

336 Chapter 9 n Evaluation techniques
Users will remember the natural icons more easily than the abstract ones.
The null hypothesis in this case is that there will be no difference between recall ofthe icon types.
This hypothesis clearly identifies the independent variable for our experiment: weare varying the style of icon. The independent variable has two levels: natural andabstract. However, when we come to consider the dependent variable, things are notso obvious. We have expressed our hypothesis in terms of users being able to remem-ber more easily. How can we measure this? First we need to clarify exactly what wemean by the phrase more easily: are we concerned with the user’s performance interms of accurate recall or in terms of speed, for example, or are we looking at moresubjective measures like user preference? In this example, we will assume that thespeed at which a user can accurately select an icon is an indication of how easily it is remembered. Our dependent variables are therefore the number of mistakes inselection and the time taken to select an icon.
Of course, we need to control the experiment so that any differences we observeare clearly attributable to the independent variable, and so that our measurements ofthe dependent variables are comparable. To do this, we provide an interface that is identical in every way except for the icon design, and a selection task that can berepeated for each condition. The latter could be either a naturalistic task (such as producing a document) or a more artificial task in which the user has to select the appropriate icon to a given prompt. The second task has the advantage that it is more controlled (there is little variation between users as to how they will performthe task) and it can be varied to avoid transfer of learning. Before performing theselection task, the users will be allowed to learn the icons in controlled conditions:for example, they may be given a fixed amount of time to learn the icon meanings.
The next stage is to decide upon an experimental method. This may depend on theparticipants that are available, but in this case we will assume that we have sufficientparticipants from the intended user group. A between-subjects experiment wouldremove any learning effect for individual participants, but it would be more difficult
Figure 9.3 Abstract and concrete icons for file operations
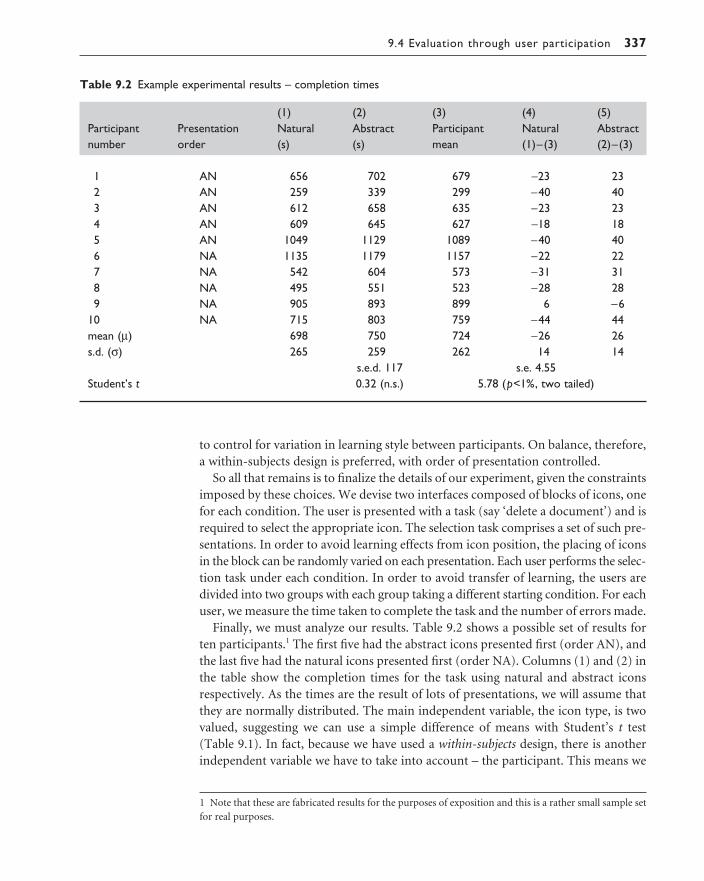
9.4 Evaluation through user participation 337
to control for variation in learning style between participants. On balance, therefore,a within-subjects design is preferred, with order of presentation controlled.
So all that remains is to finalize the details of our experiment, given the constraintsimposed by these choices. We devise two interfaces composed of blocks of icons, onefor each condition. The user is presented with a task (say ‘delete a document’) and isrequired to select the appropriate icon. The selection task comprises a set of such pre-sentations. In order to avoid learning effects from icon position, the placing of iconsin the block can be randomly varied on each presentation. Each user performs the selec-tion task under each condition. In order to avoid transfer of learning, the users aredivided into two groups with each group taking a different starting condition. For eachuser, we measure the time taken to complete the task and the number of errors made.
Finally, we must analyze our results. Table 9.2 shows a possible set of results for ten participants.1 The first five had the abstract icons presented first (order AN), andthe last five had the natural icons presented first (order NA). Columns (1) and (2) inthe table show the completion times for the task using natural and abstract iconsrespectively. As the times are the result of lots of presentations, we will assume thatthey are normally distributed. The main independent variable, the icon type, is twovalued, suggesting we can use a simple difference of means with Student’s t test(Table 9.1). In fact, because we have used a within-subjects design, there is anotherindependent variable we have to take into account – the participant. This means we
Table 9.2 Example experimental results – completion times
(1) (2) (3) (4) (5)Participant Presentation Natural Abstract Participant Natural Abstractnumber order (s) (s) mean (1)–(3) (2)–(3)
1 AN 656 702 679 −23 232 AN 259 339 299 −40 403 AN 612 658 635 −23 234 AN 609 645 627 −18 185 AN 1049 1129 1089 −40 406 NA 1135 1179 1157 −22 227 NA 542 604 573 −31 318 NA 495 551 523 −28 289 NA 905 893 899 6 −6
10 NA 715 803 759 −44 44mean (μ) 698 750 724 −26 26s.d. (σ) 265 259 262 14 14
s.e.d. 117 s.e. 4.55Student’s t 0.32 (n.s.) 5.78 (p<1%, two tailed)
1 Note that these are fabricated results for the purposes of exposition and this is a rather small sample setfor real purposes.

338 Chapter 9 n Evaluation techniques
have more than one discrete independent variable, and referring again to Table 9.1,we see that this implies we should use analysis of variance (ANOVA). A full analysisof variance is quite complex, and is ideally done with the aid of a statistics package.However, this experiment is particularly simple, so we can use a simplified analysis.
Look at columns (2) and (3) of Table 9.2. The completion times range from lessthan 5 minutes (participant 2) to nearly 20 minutes (participant 6), showing a widevariation between individuals. This wide variation emphasizes the importance of thewithin-subjects design. To see how this affects the results, we will first try to analyzethem ignoring the fact that each participant performed under each condition. At the end of the table, the mean and standard deviation have been calculated for eachcondition. These means can then be compared using Student’s t test. The differencebetween the means is 52 seconds, but the standard error of the difference (s.e.d.) is 117. This is calculated as follows:
where σN and σA are the standard deviations (s.d.) of the two conditions, and nN
and nA are the number of data items in each condition (10 in each). The s.e.d. is a measure of the expected variability of the difference between the means, and as we see the actual difference is well within this random variation. Testing the ratio52/117 against tables of Student’s t distribution indeed shows that this is notsignificant.
However, if we glance down the table, we see that in almost every case the timetaken with the abstract icons is greater than the time taken for the natural icons. Thatis, the data seem to support our claim that natural icons are better than abstract ones,but the wide variation between individuals has hidden the effect.
A more sophisticated analysis, a special case of ANOVA, can expose the difference.Looking back at the table, column (3) shows, for each participant, the average of the time they took under the two conditions. This participant mean is then sub-tracted from the data for each condition, yielding columns (4) and (5). Thesecolumns show the effect of the icon design once the differences between participantshave been removed. The two columns are redundant as they always add up to zero.They show that in all but one case (participant 9) the natural icons are faster than theabstract ones.
Even a non-parametric test would show this as a significant difference at the 5%level, but the use of a t test is more precise. We can take either column and see that the column average 26 is much greater than the standard error (14.4/ ). Theratio (mean/s.e.) is compared with the Student’s t table (in statistical tables) usingnine degrees of freedom (10 values minus 1 for the mean), and is indeed far greaterthan the 1% level (3.250); that is, the likelihood of getting our results by chance isless than 1 in 100. So, we reject the null hypothesis that there is no difference andconclude that natural icons are more easily remembered than abstract ones.
In fact, the last statement is not quite correct. What we have shown is that in this experiment natural icons are more rapidly remembered. Possibly, if we go on to
10
s.e.d. N
N
A
A
.= + = + =σ σ2 2 2 2265
10
259
10117 2
n n
9.4 Evaluation through user participation 339
analyze the errors, these may present a different story. If these error figures werequite large (say 15 errors or more per condition), then we may be able to assumethese are normal and use ANOVA. If not, we can either use non-parametric tests, ormake use of special tests based on the binomial distribution. We will not performthese analyses here. Possibly, looking at the errors we may find that the natural icons have more errors – it could well be that they are more rapidly, but less accurately,remembered. It is always worth keeping in mind the difference between the intendedpurpose of the experiment (to see which is better remembered) and the actual meas-urements (speed and accuracy).
Finally, one ought to look carefully at the experimental results to see whether there is any other effect that might confuse the results. The graphical presentation of results will help with this, possibly highlighting odd clumps in the data or otherirregularities. In this experiment we may want to check to see if there has been anysignificant transfer effect between the first and second condition for each participant.The second set may be faster as the participants are more practiced, or possibly thesecond set may be slower as learning a second set of icons may be confusing. This willnot matter if the effect is uniform – say they always are 15 seconds slower on the sec-ond test. But there may be systematic effects. For example, seeing the natural iconsfirst might make it more difficult to learn the abstract ones, but not vice versa. If thiswere the case, our observed effect may be about the interference between the iconsets, rather than that one is better than the other.
Worked exercise Design an experiment to test whether adding color coding to an interface will improve accur-acy. Identify your hypothesis, participant group, dependent and independent variables, experi-mental design, task and analysis approach.
Answer The following is only an example of the type of experiment that might be devised.
Participants Taken from user population.
Hypothesis Color coding will make selection more accurate.
IV (Independent Variable) Color coding.
DV (Dependent Variable) Accuracy measured as number of errors.
Design Between-groups to ensure no transfer of learning (or within-groups withappropriate safeguards if participants are scarce).
Task The interfaces are identical in each of the conditions, except that, in the second,color is added to indicate related menu items. Participants are presented with ascreen of menu choices (ordered randomly) and verbally told what they have toselect. Selection must be done within a strict time limit when the screen clears.Failure to select the correct item is deemed an error. Each presentation places itemsin new positions. Participants perform in one of the two conditions.
Analysis t test.

340 Chapter 9 n Evaluation techniques
Studies of groups of users
So far we have considered the experimental evaluation of single-user systems.Experiments to evaluate elements of group systems bring additional problems. Giventhe complexities of human–human communication and group working, it is hardlysurprising that experimental studies of groups and of groupware are more difficultthan the corresponding single-user experiments already considered. For the purposeof discussion, let us assume that we are evaluating a shared application with videoconnections between the participants and consider some of the problems we willencounter.
The participant groups To organize, say, 10 experiments of a single-user systemrequires 10 participants. For an experiment involving groups of three, we will, ofcourse, need 30 participants for the same number of experiments. In addition, experi-ments in group working are often longer than the single-user equivalents as we mustallow time for the group to ‘settle down’ and some rapport to develop. This all meansmore disruption for participants and possibly more expense payments.
Arranging a mutually convenient slot when both participants and the equipmentare available is no mean feat. Often the workstations being used in the experimentwill be colleagues’ personal systems, so we are trying to accommodate at least sixpeople, not to mention the experimenters themselves.
Not surprisingly, many reports of group working involve only three or four groups.This is obviously a problem for statistical purposes, but not the primary obstacle.
The experimental task Choosing a suitable task is also difficult. We may want to test a variety of different task types: creative, structured, information passing, and so on. Also, the tasks must encourage active cooperation, either because the task requires consensus, or because information and control is distributed amongthe participants. Obviously, the task also depends on the nature of the groupware system: if it has several available channels, we want to encourage broad use. Forexample, in the case of shared application with video, it should not be possible (or atleast not easy) to perform the task without using the application, otherwise we aresimply investigating video conferencing.
Creative tasks such as ‘write a short report on . . .’ or ‘write a research proposal’are often effective, in that the participants must reach agreement, and can be askedto produce their final report using the shared application. Design tasks are also used.For instance, in one experiment, users of the York Conferencer system (see Fig-ure 14.2 in Section 14.4) were asked to redesign a bank layout. A picture of the current layout was used as a background for the spatially arranged electronic pin-board, and the participants made use of this to arrange comments and suggestionsclose to the features they referred to.
Decision games, as used in management courses, are designed to test and traincooperative activity. They often rely for their success on group coordination, notindividual ability. An example of this is the desert survival task, where the particip-ants are told that they have crashed in the desert. They are given a list of items to rank

9.4 Evaluation through user participation 341
in order of importance for their survival: knife, plastic sheet, etc. The participantsmust produce one list between them, a single knowledgeable participant cannot ‘goit alone’. A computerized version of the game of Diplomacy has also been used (seeFigure 14.5 in Section 14.4) as it includes aspects of conflict as well as cooperation.
Finally, time-critical simulated process control tasks force a higher pace of inter-action as the participants control different parts of the model. An example of this is ARKola [147], a simulated bottling plant, which was used at Xerox PARC to invest-igate the importance of background noise in complex cooperative control tasks.
Often the chosen task will require extra implementation effort, and in the case of games this may be extensive. This is obviously a strong factor in the choice of asuitable task.
Data gathering Even in a single-user experiment we may well use several videocameras as well as direct logging of the application. In a group setting this is replic-ated for each participant. So for a three-person group, we are trying to synchronizethe recording of six or more video sources and three keystroke logs. To compoundmatters, these may be spread over different offices, or even different sites. The tech-nical problems are clearly enormous. Four-into-one video recording is possible,storing a different image in each quadrant of the screen, but even this is insufficientfor the number of channels we would like.
One way round this is to focus on the participants individually, recording, for eachone, the video images that are being relayed as part of the system (assuming there is a video connection) and the sounds that the participant hears. These can then be synchronized with the particular participant’s keystrokes and additional videoobservations. Thus, we can recreate the situation as it appeared to the participant.From this recording, we may not be able to interpret the other participants’ actions,but at least we have a complete record for one.
Given sufficient recording equipment, this can be repeated for each participant.Happily, the level of synchronization required between participants is not as great asthat required for each one individually. One can simply start the recorders’ clocks atthe same time, but not worry about sub-second accuracy between participants. Theimportant thing is that we can, as it were, relive the experience for each individual.
Analysis In true experimental tradition, we would like to see statistical differencesbetween experimental conditions. We saw earlier that individual differences madethis difficult in single-user experiments. If anything, group variation is moreextreme. Given randomly mixed groups, one group will act in a democratic fashion;in another, a particular pair will dominate discussion; in a third, one of the parti-cipants will act as coordinator, filtering the others’ contributions. The level of variation is such that even catastrophic failures under one condition and fabuloussuccesses in another may not always lead to statistically significant results.
As an example of this, imagine we have some quantitative measure of quality ofoutput. We will almost certainly have to use non-parametric tests, so imagine wehave found that all the groups under one condition obtained higher scores than anygroup under the other condition. We would need at least four in each condition to

342 Chapter 9 n Evaluation techniques
obtain even 5% significance (one tailed). If our results were only slightly less good,say one of the generally better groups performed poorly, we would then require atleast five in each condition.
Now this example only considered one condition, and assumed the best possibleresults. In general, we would expect that the spread between groups within condi-tions would be greater, and we may want to test more conditions at once. Our 10groups will have to increase rapidly to stand any chance of statistically significantresults. However, we saw above that even gathering 10 experimental groups is asignificant problem.
There are three possible solutions to this problem. First, one can use within-groupexperiments, having each group work under several conditions. We have, of course,the normal problems of such analysis, transfer effects and the like, but we also havemore chance of cancelling out the group effect. Secondly, we can look to a micro-analysis of features like gaps between utterances. Such measures are more likely to fit a standard distribution, and thus one can use more powerful parametric tests. Inaddition, they may be more robust to the large-scale social differences between groups.
The third solution is to opt for a more anecdotal analysis, looking for critical incidents – for example, interesting events or breakdowns – in the data. The conceptsand methods for analyzing conversation in Chapter 14 can be used to drive such an analysis. The advantage of this approach is that instead of regarding group differ-ences as a ‘problem’, they can be included in the analysis. That is, we can begin to look for the systematic ways in which different group structures interact with thecommunications media and applications they use.
Of course, experiments can be analyzed using both quantitative and qualitativemethods. Indeed, any detailed anecdotal analysis of the logs will indicate fruitfulmeasures for statistical analysis. However, if the number of experimental groups islimited, attempts at controlled experiments may not be productive, and may effect-ively ‘waste’ the groups used in the control. Given the high costs of group-workingexperiments, one must choose conditions that are likely to give interesting results,even if statistical analysis proves impossible.
Field studies with groups There are, of course, problems with taking groups ofusers and putting them in an experimental situation. If the groups are randomlymixed, then we are effectively examining the process of group formation, rather thanthat of a normal working group. Even where a pre-existent group is used, excludingpeople from their normal working environment can completely alter their workingpatterns. For a new system, there may be no ‘normal’ workplace and all we can do isproduce an artificial environment. However, even with a new system we have thechoice of producing a ‘good’ experiment or a naturalistic setting. The traditions of experimental psychology are at odds with those of more qualitative sociologicalanalysis.
It can be argued that group work can only be studied in context. Moving out ofthe real situation will alter the very nature of the work that is studied. Alternativeapproaches from the social sciences, such as ethnography, have therefore becomepopular, particularly in relation to studying group interaction. Ethnography involves

9.4 Evaluation through user participation 343
very detailed recording of the interactions between people, their environment and each other. The ethnographer attempts to remain outside the situation beingstudied and does not impose a particular viewpoint on what is observed. This is verydifferent from the experimental perspective with its hypothesis testing. Ethnographyis discussed in more detail in Chapter 13.
9.4.3 Observational techniques
A popular way to gather information about actual use of a system is to observe usersinteracting with it. Usually they are asked to complete a set of predetermined tasks,although, if observation is being carried out in their place of work, they may beobserved going about their normal duties. The evaluator watches and records theusers’ actions (using a variety of techniques – see below). Simple observation is seldom sufficient to determine how well the system meets the users’ requirementssince it does not always give insight into the their decision processes or attitude.Consequently users are asked to elaborate their actions by ‘thinking aloud’. In thissection we consider some of the techniques used to evaluate systems by observinguser behavior.
Think aloud and cooperative evaluation
Think aloud is a form of observation where the user is asked to talk through what he is doing as he is being observed; for example, describing what he believes is happening, why he takes an action, what he is trying to do.
Think aloud has the advantage of simplicity; it requires little expertise to perform(though can be tricky to analyze fully) and can provide useful insight into problemswith an interface. It can also be employed to observe how the system is actually used.It can be used for evaluation throughout the design process, using paper or simu-lated mock-ups for the earlier stages. However, the information provided is oftensubjective and may be selective, depending on the tasks provided. The process ofobservation can alter the way that people perform tasks and so provide a biased view.The very act of describing what you are doing often changes the way you do it – likethe joke about the centipede who was asked how he walked . . .
A variation on think aloud is known as cooperative evaluation [240] in which theuser is encouraged to see himself as a collaborator in the evaluation and not simplyas an experimental participant. As well as asking the user to think aloud at the begin-ning of the session, the evaluator can ask the user questions (typically of the ‘why?’or ‘what-if ?’ type) if his behavior is unclear, and the user can ask the evaluator forclarification if a problem arises. This more relaxed view of the think aloud processhas a number of advantages:
n the process is less constrained and therefore easier to learn to use by the evaluatorn the user is encouraged to criticize the systemn the evaluator can clarify points of confusion at the time they occur and so maxim-
ize the effectiveness of the approach for identifying problem areas.

344 Chapter 9 n Evaluation techniques
The usefulness of think aloud, cooperative evaluation and observation in generalis largely dependent on the effectiveness of the recording method and subsequentanalysis. The record of an evaluation session of this type is known as a protocol, andthere are a number of methods from which to choose.
Protocol analysis
Methods for recording user actions include the following:
Paper and pencil This is primitive, but cheap, and allows the analyst to note inter-pretations and extraneous events as they occur. However, it is hard to get detailedinformation, as it is limited by the analyst’s writing speed. Coding schemes forfrequent activities, developed during preliminary studies, can improve the rate of recording substantially, but can take some time to develop. A variation of paper and pencil is the use of a notebook computer for direct entry, but then oneis limited to the analyst’s typing speed, and one loses the flexibility of paper for writing styles, quick diagrams and spatial layout. If this is the only record-ing facility available then a specific note-taker, separate from the evaluator, is recommended.
Audio recording This is useful if the user is actively ‘thinking aloud’. However, itmay be difficult to record sufficient information to identify exact actions in lateranalysis, and it can be difficult to match an audio recording to some other formof protocol (such as a handwritten script).
Video recording This has the advantage that we can see what the participant isdoing (as long as the participant stays within the range of the camera). Choosingsuitable camera positions and viewing angles so that you get sufficient detail and yet keep the participant in view is difficult. Alternatively, one has to ask theparticipant not to move, which may not be appropriate for studying normalbehavior! For single-user computer-based tasks, one typically uses two videocameras, one looking at the computer screen and one with a wider focus includ-ing the user’s face and hands. The former camera may not be necessary if thecomputer system is being logged.
Computer logging It is relatively easy to get a system automatically to record useractions at a keystroke level, particularly if this facility has been considered early inthe design. It can be more difficult with proprietary software where source codeis not available (although some software now provides built-in logging and play-back facilities). Obviously, computer logging only tells us what the user is doingon the system, but this may be sufficient for some purposes. Keystroke data arealso ‘semantics free’ in that they only tell us about the lowest-level actions, notwhy they were performed or how they are structured (although slight pauses andgaps can give clues). Direct logging has the advantages that it is cheap (except in terms of disk storage), unobtrusive and can be used for longitudinal studies,where we look at one or more users over periods of weeks or months. Technical

9.4 Evaluation through user participation 345
problems with it are that the sheer volume of data can become unmanageablewithout automatic analysis, and that one often has to be careful to restore thestate of the system (file contents, etc.) before replaying the logs.
User notebooks The participants themselves can be asked to keep logs of activity/problems. This will obviously be at a very coarse level – at most, records every few minutes and, more likely, hourly or less. It also gives us ‘interpreted’ records,which have advantages and problems. The technique is especially useful in longit-udinal studies, and also where we want a log of unusual or infrequent tasks andproblems.
In practice, one uses a mixture of recording methods as they complement oneanother. For instance, we may keep a paper note of special events and circum-stances, even when we have more sophisticated audio/visual recording. Similarly, we may use separate audio recording, even where a video recorder is used, as thequality of specialist audio recording is better than most built-in video micro-phones. In addition, we may use stereo audio recording, which helps us to locateout-of-screen noises. If one is using a collection of different sources, say audio, video (×2) and keystroke logging, there is considerable difficulty in synchronizingthem during play-back. Most video recorders can superimpose an on-screen clock, which can help, but ideally one uses specialized equipment that can automaticallysynchronize the different sources, possibly merging several video displays onto a single screen. Unfortunately, this sort of equipment is often only available in spe-cialized laboratories.
With both audio and video recording, a major problem is transcription. Typing a transcript from a tape is not the same as taped dictation. The conversation will typically consist of part or broken sentences, mumbled words and inarticulatednoises. In addition, the transcript will need annotating with the different voices(which may only be clear from context) and with non-verbal items such as pauses, emphases, equipment noises, phones ringing, etc. A good audio-typist will be accustomed to completing mumbled words and correcting ungrammatical sentences – typing exactly what is recorded may prove difficult. Some practitionerssay that the use of typists is not good practice anyway as the analyst will miss many nuances that are lost in the written transcript. However, if you wish to pro-duce your own typed transcripts from tape, a course in touch-typing is highly recommended.
For video transcription, professional typists are not an option; there is no standardway of annotating video recordings, and the analyst must invent notations to suit theparticular circumstances. The scale of this task is not to be underestimated. It is com-mon to talk to practitioners who have tens or hundreds of hours of video recording,but have only analyzed tiny fragments in detail. Of course, the fragments will havebeen chosen after more extensive perusal of the material, but it certainly removes anyidea of comprehensive coverage.
Coding can be introduced to indicate particular events but it is sometimes difficultto determine a suitable coding scheme and to use this consistently, particularly if

346 Chapter 9 n Evaluation techniques
more than one person is doing the coding. A range of transcribers should thereforetest coding schemes to ensure that they are being interpreted appropriately for a particular data set.
Automatic protocol analysis tools
Analyzing protocols, whether video, audio or system logs, is time consuming andtedious by hand. It is made harder if there is more than one stream of data to synchronize. One solution to this problem is to provide automatic analysis tools tosupport the task. These offer a means of editing and annotating video, audio and system logs and synchronizing these for detailed analysis.
EVA (Experimental Video Annotator) is a system that runs on a multimedia work-station with a direct link to a video recorder [220]. The evaluator can devise a set ofbuttons indicating different events. These may include timestamps and snapshots, aswell as notes of expected events and errors. The buttons are used within a recordingsession by the evaluator to annotate the video with notes. During the session the userworks at a workstation and is recorded, using video and perhaps audio and systemlogging as well. The evaluator uses the multimedia workstation running EVA. On thescreen is the live video record and a view of the user’s screen (see Figure 9.4). Theevaluator can use the buttons to tag interesting events as they occur and can recordadditional notes using a text editor. After the session, the evaluator can ask to reviewthe tagged segments and can then use these and standard video controls to search the information. Links can be made with other types of record such as audio and system logs. A system such as EVA alleviates the burden of video analysis but it is not without its problems. The act of tagging and annotating events can prevent theevaluator from actually concentrating on the events themselves. This may mean thatevents are missed or tagged late.
Commercial systems such as Observer Pro from Noldus have similar functionalityto EVA; portable versions are now available for use in field studies (www.noldus.com).
Figure 9.4 EVA: an automatic protocol analysis tool. Source: Wendy Mackay

9.4 Evaluation through user participation 347
The Workplace project at Xerox PARC [348] also includes a system to aid pro-tocol analysis. The main emphasis here is to support the analysis of synchronizedinformation from different data streams, such as video, audio, notes and dia-grams. Each data stream is viewed in an aligned display so that it is possible to compare the records of each for a given point in the interaction. The alignment may be based on timestamps or on an event or action and is implemented usinghypertext links.
A third example is DRUM [223], which also provides video annotation and tag-ging facilities. DRUM is part of the MUSiC (Measuring the Usability of Systems inContext/Metrics for Usability Standards in Computing) toolkit, which supports a complete methodology for evaluation, based upon the application of usability metrics on analytic metrics, cognitive workload, performance and user satisfaction.DRUM is concerned particularly with measuring performance. The methodologyprovides a range of tools as well as DRUM, including manuals, questionnaires, analysis software and databases.
Systems such as these are extremely important as evaluation tools since they offera means of handling the data that are collected in observational studies and allowinga more systematic approach to the analysis. The evaluator’s task is facilitated and itis likely that more valuable observations will emerge as a result.
Post-task walkthroughs
Often data obtained via direct observation lack interpretation. We have the basicactions that were performed, but little knowledge as to why. Even where the particip-ant has been encouraged to think aloud through the task, the information may be atthe wrong level. For example, the participant may say ‘and now I’m selecting theundo menu’, but not tell us what was wrong to make undo necessary. In addition, a think aloud does not include information such as alternative, but not pursued,actions.
A walkthrough attempts to alleviate these problems, by reflecting the participants’actions back to them after the event. The transcript, whether written or recorded, is replayed to the participant who is invited to comment, or is directly questioned by the analyst. This may be done straightaway, when the participant may actuallyremember why certain actions were performed, or after an interval, when theanswers are more likely to be the participant’s post hoc interpretation. (In fact, inter-pretation is likely even in the former case.) The advantage of a delayed walkthroughis that the analyst has had time to frame suitable questions and focus on specific incidents. The disadvantage is a loss of freshness.
There are some circumstances when the participant cannot be expected to talkduring the actual observation, for instance during a critical task, or when the task is too intensive. In these circumstances, the post-task walkthrough is the only way to obtain a subjective viewpoint on the user’s behavior. There is also an argumentthat it is preferable to minimize non-task-related talk during direct observation inorder to get as natural a performance as possible. Again this makes the walkthroughessential.

348 Chapter 9 n Evaluation techniques
9.4.4 Query techniques
Another set of evaluation techniques relies on asking the user about the interfacedirectly. Query techniques can be useful in eliciting detail of the user’s view of a system. They embody the philosophy that states that the best way to find out how asystem meets user requirements is to ‘ask the user’. They can be used in evaluationand more widely to collect information about user requirements and tasks. Theadvantage of such methods is that they get the user’s viewpoint directly and mayreveal issues that have not been considered by the designer. In addition, they are relatively simple and cheap to administer. However, the information gained is neces-sarily subjective, and may be a ‘rationalized’ account of events rather than a whollyaccurate one. Also, it may be difficult to get accurate feedback about alternativedesigns if the user has not experienced them, which limits the scope of the informa-tion that can be gleaned. However, the methods provide useful supplementary mater-ial to other methods. There are two main types of query technique: interviews andquestionnaires.
Interviews
Interviewing users about their experience with an interactive system provides adirect and structured way of gathering information. Interviews have the advantagesthat the level of questioning can be varied to suit the context and that the evaluatorcan probe the user more deeply on interesting issues as they arise. An interview willusually follow a top-down approach, starting with a general question about a taskand progressing to more leading questions (often of the form ‘why?’ or ‘what if ?’) toelaborate aspects of the user’s response.
Interviews can be effective for high-level evaluation, particularly in eliciting information about user preferences, impressions and attitudes. They may also revealproblems that have not been anticipated by the designer or that have not occurredunder observation. When used in conjunction with observation they are a usefulmeans of clarifying an event (compare the post-task walkthrough).
In order to be as effective as possible, the interview should be planned in advance,with a set of central questions prepared. Each interview is then structured aroundthese questions. This helps to focus the purpose of the interview, which may, forinstance, be to probe a particular aspect of the interaction. It also helps to ensure abase of consistency between the interviews of different users. That said, the evalu-ator may, of course, choose to adapt the interview form to each user in order to get the most benefit: the interview is not intended to be a controlled experimentaltechnique.
Questionnaires
An alternative method of querying the user is to administer a questionnaire. This isclearly less flexible than the interview technique, since questions are fixed in advance,
9.4 Evaluation through user participation 349
and it is likely that the questions will be less probing. However, it can be used toreach a wider participant group, it takes less time to administer, and it can be ana-lyzed more rigorously. It can also be administered at various points in the designprocess, including during requirements capture, task analysis and evaluation, inorder to get information on the user’s needs, preferences and experience.
Given that the evaluator is not likely to be directly involved in the completion ofthe questionnaire, it is vital that it is well designed. The first thing that the evaluatormust establish is the purpose of the questionnaire: what information is sought? It isalso useful to decide at this stage how the questionnaire responses are to be analyzed.For example, do you want specific, measurable feedback on particular interface fea-tures, or do you want the user’s impression of using the interface?
There are a number of styles of question that can be included in the questionnaire.These include the following:
General These are questions that help to establish the background of the user and his place within the user population. They include questions about age, sex,occupation, place of residence, and so on. They may also include questions onprevious experience with computers, which may be phrased as open-ended,multi-choice or scalar questions (see below).
Open-ended These ask the user to provide his own unprompted opinion on aquestion, for example ‘Can you suggest any improvements to the interface?’. Theyare useful for gathering general subjective information but are difficult to analyzein any rigorous way, or to compare, and can only be viewed as supplementary.They are also most likely to be missed out by time-conscious respondents!However, they may identify errors or make suggestions that have not been con-sidered by the designer. A special case of this type is where the user is asked forfactual information, for example how many commands were used.
Scalar These ask the user to judge a specific statement on a numeric scale, usuallycorresponding to a measure of agreement or disagreement with the statement.For example,
It is easy to recover from mistakes.Disagree 1 2 3 4 5 Agree
The granularity of the scale varies: a coarse scale (say, from 1 to 3) gives a clearindication of the meaning of the numbers (disagree, neutral and agree). However,it gives no room for varying levels of agreement, and users may therefore betempted to give neutral responses to statements that they do not feel stronglyabout but with which they mildly disagree or agree. A very fine scale (say 1 to 10)suffers from the opposite problem: the numbers become difficult to interpret in a consistent way. One user will undoubtedly interpret the scale differently from another. A middle ground is therefore advisable. Scales of 1 to 5 or 1 to 7have been used effectively. They are fine enough to allow users to differentiateadequately but still retain clarity in meaning. It can help to provide an indication

350 Chapter 9 n Evaluation techniques
of the meaning of intermediate scalar values. Odd-numbered scales are used mostoften but it is possible to use even-numbered scales (e.g. 1–6) if the ‘neutral’option is not wanted. This does not allow for fence sitting – except decisively byselecting 31/2!).
Multi-choice Here the respondent is offered a choice of explicit responses, andmay be asked to select only one of these, or as many as apply. For example,
How do you most often get help with the system (tick one)?Online manual qContextual help system qCommand prompt qAsk a colleague q
Which types of software have you used (tick all that apply)?Word processor qDatabase qSpreadsheet qExpert system qOnline help system qCompiler q
These are particularly useful for gathering information on a user’s previous experi-ence. A special case of this type is where the offered choices are ‘yes’ or ‘no’.
Ranked These place an ordering on items in a list and are useful to indicate a user’spreferences. For example,
Please rank the usefulness of these methods of issuing a command (1 most useful,2 next, 0 if not used).
Menu selection qCommand line qControl key accelerator q
These question types are all useful for different purposes, as we have noted.However, in order to reduce the burden of effort on the respondent, and so encour-age a high response rate amongst users, it is best to use closed questions, such asscalar, ranked or multi-choice, as much as possible. These provide the user withalternative responses and so reduce the effort required. They also have the advantageof being easier to analyze. Responses can be analyzed in a number of ways, fromdetermining simple percentages for each response, to looking at correlations and factor analysis. For more detail on available methods the reader is referred to the recommended reading list at the end of the chapter.
Whatever type of questionnaire is planned, it is wise to carry out a pilot study. This allows any problems with the questionnaire design to be ironed out before thequestionnaire is distributed to potentially hundreds of users! The questionnaireshould be tested on four or five users to see if the questions are comprehensible andthe results are as expected and can be used in the manner intended. If users seem to

9.4 Evaluation through user participation 351
be misunderstanding a particular question, it can then be rephrased (and retested)before the final version is sent out.
Distribution of questionnaires can also be problematic. It is important that therespondents are representative of the user population but you also need to ensurethat you are able to reach as many potential respondents as possible. Return rate for questionnaires is quite low (often 25–30%) so many more need to be sent out to get a reasonable return. Questionnaires should ideally be distributed to a randomsubset of the user population. So, for example, if the population is all workers in a company, one may choose to send a questionnaire to every fourth person on analphabetically ordered personnel list. However, questionnaires are now often dis-tributed via the internet, either by email, where potential respondents can be selectedrandomly, or via a website, where the respondents are limited to those who visit the site and who may not be representative. In practice, questionnaire respondentsare self-selecting anyway, in that only those who choose to respond are included inthe study; if the questionnaire is designed to capture demographic informationabout each respondent then the level of representativeness (or otherwise) can bedetermined from the responses.
Worked exercise You have been asked to compare user performance and preferences with two different learn-ing systems, one using hypermedia (see Chapter 21), the other sequential lessons. Design aquestionnaire to find out what the users think of the system. How would you go about com-paring user performance with these two systems?
Answer Assume that all users have used both systems.
QuestionnaireConsider the following questions in designing the questionnaire:
n what information is required?n how is the questionnaire to be analyzed?
You are particularly interested in user preferences so questions should focus on differ-ent aspects of the systems and try to measure levels of satisfaction. The use of scaleswill make responses for each system easier to compare.
Table 9.3 shows an example questionnaire.
To test performance you would design an experiment where two groups of participantslearn the same material using the two systems, and test how well they have learned(using a standard measurable test).
Participants User group
IV (Independent Variable) Style of learning system
DV (Dependent Variable) Performance (measured as test score)
Design Between-subjects design

352 Chapter 9 n Evaluation techniques
Table 9.3 Questionnaire to compare two systems
PART I: Repeat for each systemIndicate your agreement or disagreement with the following statements. (1 indicates completedisagreement and 5 complete agreement.)
The system tells me what to do at every point.Disagree 1 2 3 4 5 Agree
It is easy to recover from mistakes.Disagree 1 2 3 4 5 Agree
It is easy to get help when needed.Disagree 1 2 3 4 5 Agree
I always know what the system is doing.Disagree 1 2 3 4 5 Agree
I always know where I am in the training material.Disagree 1 2 3 4 5 Agree
I have learned the material well using the system.Disagree 1 2 3 4 5 Agree
I could have learned the material more effectively using a book.Disagree 1 2 3 4 5 Agree
I always know how well I am doing.Disagree 1 2 3 4 5 Agree
PART II: Comparing both systems:
Which system (choose 1) was most:Helpful to use A BEfficient to use A BEnjoyable to use A B
Please add any comments you have about either system:
9.4.5 Evaluation through monitoring physiological responses
One of the problems with most evaluation techniques is that we are reliant on obser-vation and the users telling us what they are doing and how they are feeling. What ifwe were able to measure these things directly? Interest has grown recently in the useof what is sometimes called objective usability testing, ways of monitoring physi-ological aspects of computer use. Potentially this will allow us not only to see moreclearly exactly what users do when they interact with computers, but also to measurehow they feel. The two areas receiving the most attention to date are eye tracking andphysiological measurement.
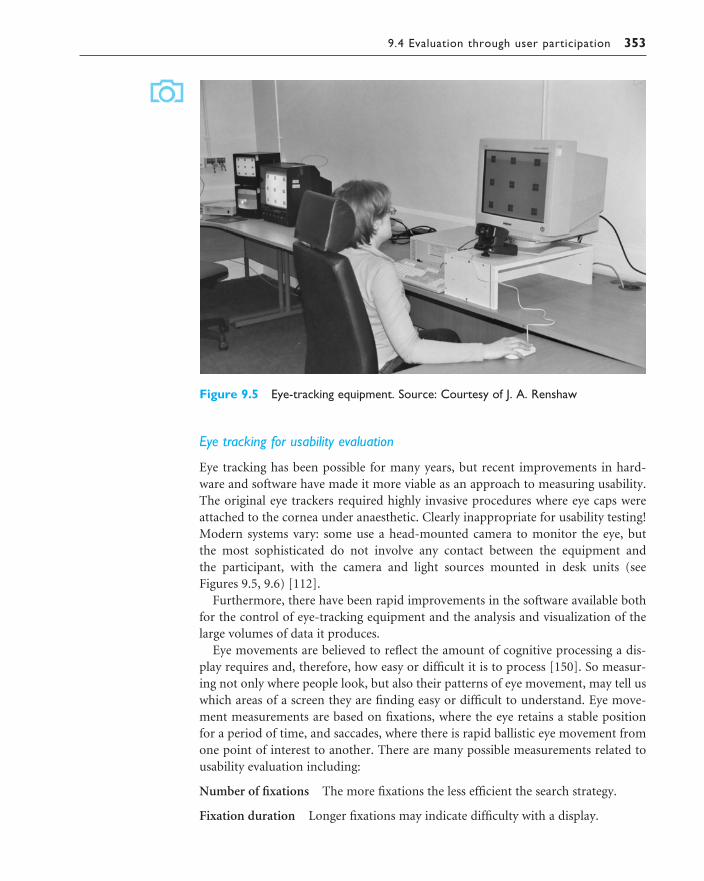
9.4 Evaluation through user participation 353
Eye tracking for usability evaluation
Eye tracking has been possible for many years, but recent improvements in hard-ware and software have made it more viable as an approach to measuring usability.The original eye trackers required highly invasive procedures where eye caps wereattached to the cornea under anaesthetic. Clearly inappropriate for usability testing!Modern systems vary: some use a head-mounted camera to monitor the eye, but the most sophisticated do not involve any contact between the equipment and the participant, with the camera and light sources mounted in desk units (see Figures 9.5, 9.6) [112].
Furthermore, there have been rapid improvements in the software available bothfor the control of eye-tracking equipment and the analysis and visualization of thelarge volumes of data it produces.
Eye movements are believed to reflect the amount of cognitive processing a dis-play requires and, therefore, how easy or difficult it is to process [150]. So measur-ing not only where people look, but also their patterns of eye movement, may tell uswhich areas of a screen they are finding easy or difficult to understand. Eye move-ment measurements are based on fixations, where the eye retains a stable position for a period of time, and saccades, where there is rapid ballistic eye movement fromone point of interest to another. There are many possible measurements related tousability evaluation including:
Number of fixations The more fixations the less efficient the search strategy.
Fixation duration Longer fixations may indicate difficulty with a display.
Figure 9.5 Eye-tracking equipment. Source: Courtesy of J. A. Renshaw

354 Chapter 9 n Evaluation techniques
Scan path indicating areas of interest, search strategy and cognitive load. Movingstraight to a target with a short fixation at the target is the optimal scan path butplotting scan paths and fixations can indicate what people look at, how often andfor how long.
Eye tracking for usability is still very new and equipment is prohibitively expens-ive for everyday use. However, it is a promising technique for providing insights into what really attracts the eye in website design and where problem areas are in system use. More research is needed to interpret accurately the meaning of the vari-ous eye movement measurements, as well as to develop more accessible and robustequipment. But, given the potential for gathering new data measurements relativelyunobtrusively, it is likely that eye tracking will become part of the standard equip-ment for usability laboratories in the coming few years.
Figure 9.6 Calibrating the eye tracker. Source: Courtesy of J. A. Renshaw

9.4 Evaluation through user participation 355
Physiological measurements
As we saw in Chapter 1, emotional response is closely tied to physiological changes.These include changes in heart rate, breathing and skin secretions. Measuring thesephysiological responses may therefore be useful in determining a user’s emotionalresponse to an interface [288, 363]. Could we determine which interaction eventsreally cause a user stress or which promote relaxation?
Physiological measurement involves attaching various probes and sensors to theuser (see Figure 9.7). These measure a number of factors:
Figure 9.7 Data Lab Psychophysiology equipment showing some of the sensors(above) and a typical experimental arrangement (below) with sensors attached to theparticipant’s fingers and the monitoring software displayed on the evaluator’s machine.Source: Courtesy of Dr R. D. Ward

356 Chapter 9 n Evaluation techniques
Heart activity, indicated by blood pressure, volume and pulse. These may respondto stress or anger.
Activity of the sweat glands, indicated by skin resistance or galvanic skin response(GSR). These are thought to indicate levels of arousal and mental effort.
Electrical activity in muscle, measured by the electromyogram (EMG). These appearto reflect involvement in a task.
Electrical activity in the brain, measured by the electroencephalogram (EEG). Theseare associated with decision making, attention and motivation.
Figure 9.8 illustrates the output obtained from such measurements.One of the problems with applying these measurements to interaction events is
that it is not clear what the relationship between these events and measurementsmight be. For example, if increased pulse rate is observed during an interactive task,does that indicate frustration with the interface or stress at being unable to completethe task? How will physiological changes differ in response to discrete events or tocontinuous interface use? Is it possible to map patterns of physiological measure-ment to specific emotional states?
These are still research questions but the approach is interesting, as it offers apotential means of objectively capturing information about the user’s emotional
Figure 9.8 Output of monitoring pulse rate (above) and skin conductivity (below).Source: Screen shot courtesy of Dr R. D. Ward; frame source: National InstrumentsBioBench software

9.5 Choosing an evaluation method 357
state, which, as we saw in Chapter 1, impacts on our ability to solve problems andperform tasks.
CHOOSING AN EVALUATION METHOD
As we have seen in this chapter, a range of techniques is available for evaluating aninteractive system at all stages in the design process. So how do we decide whichmethods are most appropriate for our needs? There are no hard and fast rules in this– each method has its particular strengths and weaknesses and each is useful ifapplied appropriately. However, there are a number of factors that should be takeninto account when selecting evaluation techniques. These also provide a way of cat-egorizing the different methods so that we can compare and choose between them.In this final section we will consider these factors.
9.5.1 Factors distinguishing evaluation techniques
We can identify at least eight factors that distinguish different evaluation techniquesand therefore help us to make an appropriate choice. These are:
n the stage in the cycle at which the evaluation is carried outn the style of evaluationn the level of subjectivity or objectivity of the techniquen the type of measures providedn the information providedn the immediacy of the responsen the level of interference impliedn the resources required.
Design vs. implementation
The first factor to affect our choice of evaluation method is the stage in the designprocess at which evaluation is required. As we saw earlier in this chapter, it is desir-able to include evaluation of some sort throughout the design process. The main distinction between evaluation of a design and evaluation of an implementation isthat in the latter case a physical artifact exists. This may be anything from a papermock-up to a full implementation, but it is something concrete that can be tested.Evaluation of a design, on the other hand, precedes this stage and seeks instead toprovide information to feed the development of the physical artifact.
Roughly speaking, evaluation at the design stage needs to be quick and cheap so might involve design experts only and be analytic, whereas evaluation of theimplementation needs to be more comprehensive, so brings in users as participants.There are, of course, exceptions to this: participatory design (see Chapter 13)
9.5

358 Chapter 9 n Evaluation techniques
involves users throughout the design process, and techniques such as cognitive walk-through are expert based and analytic but can be used to evaluate implementationsas well as designs.
Early evaluation, whether of a design or an early prototype or mock-up, will bringthe greatest pay-off since problems can be easily resolved at this stage. As more commitment is made to a particular design in the implementation, it becomesincreasingly difficult for changes to be made, no matter what the evaluation suggests.Ironically, the most resources are often ploughed into late evaluations. This is lessprofitable and should be avoided, although obviously some evaluation with users isrequired with a complete, or almost complete, system, since some elements (such assystem performance) will only be evident in the working system.
Laboratory vs. field studies
We have already discussed the pros and cons of these two styles of evaluation.Laboratory studies allow controlled experimentation and observation while losingsomething of the naturalness of the user’s environment. Field studies retain the latter but do not allow control over user activity. Ideally the design process shouldinclude both styles of evaluation, probably with laboratory studies dominating theearly stages and field studies conducted with the new implementation.
Subjective vs. objective
Evaluation techniques also vary according to their objectivity – some techniques rely heavily on the interpretation of the evaluator, others would provide similarinformation for anyone correctly carrying out the procedure. The more subjectivetechniques, such as cognitive walkthrough or think aloud, rely to a large extent onthe knowledge and expertise of the evaluator, who must recognize problems andunderstand what the user is doing. They can be powerful if used correctly and willprovide information that may not be available from more objective methods.However, the problem of evaluator bias should be recognized and avoided. One way to decrease the possibility of bias is to use more than one evaluator. Objectivetechniques, on the other hand, should produce repeatable results, which are notdependent on the persuasion of the particular evaluator. Controlled experiments are an example of an objective measure. These avoid bias and provide comparableresults but may not reveal the unexpected problem or give detailed feedback on userexperience. Ideally, both objective and subjective approaches should be used.
The extent to which the results are dependent on the subjective response of the user also varies. At one extreme is asking for the user’s opinions, which is highlysubjective; at the other is measuring physiological changes in the body, which areoutside the user’s control.
Qualitative vs. quantitative measures
The type of measurement provided by the evaluation technique is also an importantconsideration. There are two main types: quantitative measurement and qualitative

9.5 Choosing an evaluation method 359
measurement. The former is usually numeric and can be easily analyzed using statist-ical techniques. The latter is non-numeric and is therefore more difficult to analyze,but can provide important detail that cannot be determined from numbers. The typeof measure is related to the subjectivity or objectivity of the technique, with subject-ive techniques tending to provide qualitative measures and objective techniques,quantitative measures. This is not a hard and fast rule, however. It is sometimes possible to quantify what is, in fact, qualitative information by mapping it onto ascale or similar measure. A common example of this is in questionnaires where qual-itative information is being sought (for example, user preferences) but a quantitativescale is used. This is also common in experimental design where factors such as thequality of the user’s performance are used as dependent variables, and measured ona quantitative scale.
Information provided
The level of information required from an evaluation may also vary. The informa-tion required by an evaluator at any stage of the design process may range from low-level information to enable a design decision to be made (for example, whichfont is most readable) to higher-level information, such as ‘Is the system usable?’.Some evaluation techniques, such as controlled experiments, are excellent at provid-ing low-level information – an experiment can be designed to measure a particularaspect of the interface. Higher-level information can be gathered using questionnaireand interview techniques, which provide a more general impression of the user’sview of the system.
Immediacy of response
Another factor distinguishing evaluation techniques is the immediacy of theresponse they provide. Some methods, such as think aloud, record the user’s behavior at the time of the interaction itself. Others, such as post-task walkthrough,rely on the user’s recollection of events. Such recollection is liable to suffer from bias in recall and reconstruction, with users interpreting events according to their preconceptions. Recall may also be incomplete. However, immediate techniques canalso be problematic, since the process of measurement can actually alter the way theuser works.
Intrusiveness
Related to the immediacy of the response is the intrusiveness of the technique itself.Certain techniques, particularly those that produce immediate measurements, areobvious to the user during the interaction and therefore run the risk of influencingthe way the user behaves. Sensitive activity on the part of the evaluator can help toreduce this but cannot remove it altogether. Most immediate evaluation techniquesare intrusive, with the exception of automatic system logging. Unfortunately, this islimited in the information that it can provide and is difficult to interpret.

360 Chapter 9 n Evaluation techniques
Resources
The final consideration when selecting an evaluation technique is the availability of resources. Resources to consider include equipment, time, money, participants,expertise of evaluator and context. Some decisions are forced by resource limita-tions: it is not possible to produce a video protocol without access to a video camera(and probably editing facilities as well). However, other decisions are not so clearcut. For example, time and money may be limited, forcing a choice between two pos-sible evaluations. In these circumstances, the evaluator must decide which evaluationtactic will produce the most effective and useful information for the system underconsideration. It may be possible to use results from other people’s experiments to avoid having to conduct new experiments.
Some techniques are more reliant on evaluator expertise than others, for examplethe more formal analytic techniques. If evaluator expertise is limited, it may be morepractical to use more simple heuristic methods than methods that require under-standing of user goal structures and so on.
Finally, the context in which evaluation can occur will influence what can be done.For practical reasons it may not be possible to gain access to the intended users of a system (if it is a general system, for example). Or it may not be feasible to test thesystem in its intended environment (for example, a system for a space station or adefence system). In these circumstances simulations must be used.
9.5.2 A classification of evaluation techniques
Using the factors discussed in the previous section we can classify the evaluationtechniques we have considered in this chapter. This allows us to identify the tech-niques that most closely fit our requirements. Table 9.4 shows the classification for
Table 9.4 Classification of analytic evaluation techniques
Cognitive Heuristic Review Modelwalkthrough evaluation based based
Stage Throughout Throughout Design DesignStyle Laboratory Laboratory Laboratory LaboratoryObjective? No No As source NoMeasure Qualitative Qualitative As source QualitativeInformation Low level High level As source Low levelImmediacy N/A N/A As source N/AIntrusive? No No No NoTime Medium Low Low–medium MediumEquipment Low Low Low LowExpertise High Medium Low High
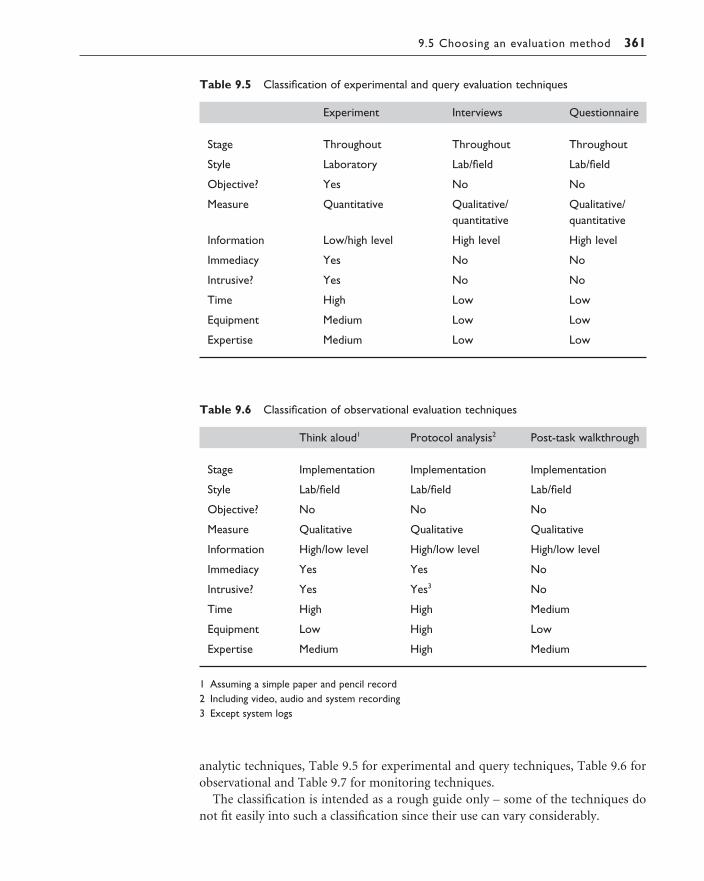
9.5 Choosing an evaluation method 361
analytic techniques, Table 9.5 for experimental and query techniques, Table 9.6 forobservational and Table 9.7 for monitoring techniques.
The classification is intended as a rough guide only – some of the techniques donot fit easily into such a classification since their use can vary considerably.
Table 9.5 Classification of experimental and query evaluation techniques
Experiment Interviews Questionnaire
Stage Throughout Throughout Throughout
Style Laboratory Lab/field Lab/field
Objective? Yes No No
Measure Quantitative Qualitative/ Qualitative/quantitative quantitative
Information Low/high level High level High level
Immediacy Yes No No
Intrusive? Yes No No
Time High Low Low
Equipment Medium Low Low
Expertise Medium Low Low
Table 9.6 Classification of observational evaluation techniques
Think aloud1 Protocol analysis2 Post-task walkthrough
Stage Implementation Implementation Implementation
Style Lab/field Lab/field Lab/field
Objective? No No No
Measure Qualitative Qualitative Qualitative
Information High/low level High/low level High/low level
Immediacy Yes Yes No
Intrusive? Yes Yes3 No
Time High High Medium
Equipment Low High Low
Expertise Medium High Medium
1 Assuming a simple paper and pencil record2 Including video, audio and system recording3 Except system logs

362 Chapter 9 n Evaluation techniques
SUMMARY
Evaluation is an integral part of the design process and should take place through-out the design life cycle. Its aim is to test the functionality and usability of the designand to identify and rectify any problems. It can also try to determine the user’s attitude and response to the system. It can take place in a specialist laboratory or inthe user’s workplace, and may or may not involve active participation on the part ofthe user.
A design can be evaluated before any implementation work has started, to min-imize the cost of early design errors. Most techniques for evaluation at this stage are analytic and involve using an expert to assess the design against cognitive andusability principles. Previous experimental results and modeling approaches can alsoprovide insight at this stage. Once an artifact has been developed (whether a pro-totype or full system), experimental and observational techniques can be used to get both quantitative and qualitative results. Query techniques provide subjectiveinformation from the user. If more objective information is required, physiologicalmonitoring can capture the user’s physical responses to the system.
The choice of evaluation method is largely dependent on what is required of theevaluation. Evaluation methods vary in the stage at which they are commonly usedand where they can be used. Some are more subjective than others and provide qualitative rather than quantitative measures. Some provide immediate informationwhile others get feedback after the event. However, the more immediate methodsalso tend to intrude most seriously on the interaction. Finally, some require moreresources in terms of time, equipment and expertise than others.
9.6
Table 9.7 Classification of monitoring evaluation techniques
Eye tracking Physiological measurement
Stage Implementation ImplementationStyle Lab LabObjective? Yes YesMeasure Quantitative QuantitativeInformation Low level Low levelImmediacy Yes YesIntrusive? No1 YesTime Medium/high Medium/highEquipment High HighExpertise High High
1 If the equipment is not head mounted

Exercises 363
EXERCISES
9.1 In groups or pairs, use the cognitive walkthrough example, and what you know aboutuser psychology (see Chapter 1), to discuss the design of a computer application of your choice(for example, a word processor or a drawing package). (Hint: Focus your discussion on one ortwo specific tasks within the application.)
9.2 What are the benefits and problems of using video in experimentation? If you have access to avideo recorder, attempt to transcribe a piece of action and conversation (it does not have to bean experiment – a soap opera will do!). What problems did you encounter?
9.3 In Section 9.4.2, we saw that the observed results could be the result of interference. Can youthink of alternative designs that may make this less likely? Remember that individual variation wasvery high, so you must retain a within-subjects design, but you may perform more tests on eachparticipant.
9.4 Choose an appropriate evaluation method for each of the following situations. In each case identify:
(i) the participants(ii) the technique used(iii) representative tasks to be examined(iv) measurements that would be appropriate(v) an outline plan for carrying out the evaluation.
(a) You are at an early stage in the design of a spreadsheet package and you wish to test whattype of icons will be easiest to learn.
(b) You have a prototype for a theatre booking system to be used by potential theatre-goers toreduce queues at the box office.
(c) You have designed and implemented a new game system and want to evaluate it beforerelease.
(d) You have developed a group decision support system for a solicitor’s office.(e) You have been asked to develop a system to store and manage student exam results and
would like to test two different designs prior to implementation or prototyping.
9.5 Complete the cognitive walkthrough example for the video remote control design.
9.6 In defining an experimental study, describe:
(a) how you as an experimenter would formulate the hypothesis to be supported or refuted byyour study;
(b) how you would decide between a within-groups or between-groups experimental design withyour subjects.
9.7 What are the factors governing the choice of an appropriate evaluation method for different inter-active systems? Give brief details.
364 Chapter 9 n Evaluation techniques
RECOMMENDED READING
C. Robson, Experiment, Design and Statistics in Psychology, 3rd edition, Penguin,1994.An accessible introduction to statistics and experimental design and analysis forthe uninitiated, using worked examples throughout.
A. Monk, P. Wright, J. Haber and L. Davenport, Improving your Human ComputerInterface: A Practical Approach, Prentice Hall, 1992.An evaluator’s guide to using the cooperative evaluation approach successfully.
M. Helander, editor, Handbook of Human–Computer Interaction, Part V: Tools forDesign and Evaluation, North-Holland, 1988.Reviews the major evaluation techniques.
C. Wharton, J. Rieman, C. Lewis and P. Polson, The cognitive walkthrough: a practitioner’s guide. In J. Nielsen and R. L. Mack, editors, Usability InspectionMethods, John Wiley, 1994.Describes the revised version of the cognitive walkthrough method of evaluation.
J. Nielsen, Heuristic evaluation. In J. Nielsen and R. L. Mack, editors, UsabilityInspection Methods, John Wiley, 1994.Covers the heuristic evaluation method in detail.
Interacting with Computers, Vol. 14, No. 2, special issue on emotion in interaction,February 2002.A special journal issue containing several papers on the use of psychophysiologyin studying emotional response to interaction.
A. T. Duchowski, Eye Tracking Methodology: Theory and Practice, Springer-Verlag,2003.A recent book providing a detailed introduction to eye-tracking theory, equip-ment and applications.

UNIVERSAL DESIGN
OV E RV I E W
n Universal design is about designing systems so that theycan be used by anyone in any circumstance.
n Multi-modal systems are those that use more than onehuman input channel in the interaction.
n These systems may, for example, use:– speech– non-speech sound– touch– handwriting– gestures.
n Universal design means designing for diversity,including:– people with sensory, physical or cognitive
impairment– people of different ages– people from different cultures and backgrounds.
10

366 Chapter 10 n Universal design
INTRODUCTION
We have already discussed the importance of designing for the user, consideringhuman abilities and requirements. But is it possible to generalize about people and,if not, how do we address the issue of human diversity in our designs?
The discussion that we had on human psychology in Chapter 1 talked about gen-eral human abilities and, in reality, people are much more varied than the discussionsuggests. People have different abilities and weaknesses; they come from differentbackgrounds and cultures; they have different interests, viewpoints and experiences;they are different ages and sizes. All of these things have an impact on the way inwhich an individual will use a particular computing application and, indeed, onwhether or not they can use it at all. Given such diversity, we cannot assume a ‘typical’ user or design only for people like ourselves.
Universal design is the process of designing products so that they can be used byas many people as possible in as many situations as possible. In our case, this meansparticularly designing interactive systems that are usable by anyone, with any rangeof abilities, using any technology platform. This can be achieved by designing systemseither to have built in redundancy or to be compatible with assistive technologies. Anexample of the former might be an interface that has both visual and audio access to commands; an example of the latter, a website that provides text alternatives for graphics, so that it can be read using a screen reader.
In this chapter, we will look at universal design in more detail. We will begin byexamining seven principles of universal design. We will then look at multi-modaltechnology and how it can help to provide redundancy in interaction. Havingidentified some of the available technologies at our disposal, we will look in moredetail at the particular areas of human diversity that we need to address.
UNIVERSAL DESIGN PRINCIPLES
We have defined universal design as ‘the process of designing products so that theycan be used by as many people as possible in as many situations as possible’. But whatdoes that mean in practice? Is it possible to design anything so that anyone can useit – and if we could, how practical would it be? Wouldn’t the cost be prohibitive? Inreality, we may not be able to design everything to be accessible to everyone, and wecertainly cannot ensure that everyone has the same experience of using a product,but we can work toward the aim of universal design and try to provide an equivalentexperience.
Although it may seem like a huge task, universal design does not have to be com-plex or costly. In fact, if you are observant, you will see many examples of design thatattempt to take account of user diversity. Next time you cross the road, look at thepavement. The curb may be lowered, to enable people who use wheelchairs to crossmore easily. The paving near the curb may be of a different texture – with raised
10.2
10.1

10.2 Universal design principles 367
bumps or ridges – to enable people who cannot see to find the crossing point. Noticehow many modern buildings have automatic doors that open on approach. Or liftsthat offer both visual and auditory notification of the floor reached. And, whilst thesedesigns make the crossing, the building and the lift more accessible to people whohave disabilities, notice too how they also help other users. The parent with a childin a buggy, or the traveller with wheeled luggage, can cross the road more easily; theshopper with heavy bags, or the small child, can enter the building; and people areless likely to miss their floor because they weren’t paying attention. Universal designis primarily about trying to ensure that you do not exclude anyone through thedesign choices you make but, by giving thought to these issues, you will invariablymake your design better for everyone.
In the late 1990s a group at North Carolina State University in the USA proposedseven general principles of universal design [333]. These were intended to cover allareas of design and are equally applicable to the design of interactive systems. Theseprinciples give us a framework in which to develop universal designs.
Principle one is equitable use: the design is useful to people with a range of abil-ities and appealing to all. No user is excluded or stigmatized. Wherever possible,access should be the same for all; where identical use is not possible, equivalent useshould be supported. Where appropriate, security, privacy and safety provisionshould be available to all.
Principle two is flexibility in use: the design allows for a range of ability and pref-erence, through choice of methods of use and adaptivity to the user’s pace, precisionand custom.
Principle three is that the system be simple and intuitive to use, regardless of theknowledge, experience, language or level of concentration of the user. The designneeds to support the user’s expectations and accommodate different language andliteracy skills. It should not be unnecessarily complex and should be organized to facilitate access to the most important areas. It should provide prompting andfeedback as far as possible.
Principle four is perceptible information: the design should provide effective communication of information regardless of the environmental conditions or theuser’s abilities. Redundancy of presentation is important: information should berepresented in different forms or modes (e.g. graphic, verbal, text, touch). Essentialinformation should be emphasized and differentiated clearly from the peripheralcontent. Presentation should support the range of devices and techniques used toaccess information by people with different sensory abilities.
Principle five is tolerance for error : minimizing the impact and damage caused by mistakes or unintended behavior. Potentially dangerous situations should beremoved or made hard to reach. Potential hazards should be shielded by warnings.Systems should fail safe from the user’s perspective and users should be supported intasks that require concentration.
Principle six is low physical effort : systems should be designed to be comfortable to use, minimizing physical effort and fatigue. The physical design of the systemshould allow the user to maintain a natural posture with reasonable operating effort.Repetitive or sustained actions should be avoided.
368 Chapter 10 n Universal design
Principle seven requires size and space for approach and use: the placement of thesystem should be such that it can be reached and used by any user regardless of bodysize, posture or mobility. Important elements should be on the line of sight for bothseated and standing users. All physical components should be comfortably reachableby seated or standing users. Systems should allow for variation in hand size and provide enough room for assistive devices to be used.
These seven principles give us a good starting point in considering universaldesign. They are not all equally applicable to all situations, of course. For example,principles six and seven would be vital in designing an information booth but lessimportant in designing word-processing software. But they provide a useful check-list of considerations for designers, together with guidelines on how each principlecan be achieved. It is interesting to note that these principles are closely related to the ones we met in Chapter 7, in the context of general user-centered design rules,indicating again that universal design is fundamentally good design for all.
MULTI-MODAL INTERACTION
As we have seen in the previous section, providing access to information throughmore than one mode of interaction is an important principle of universal design.Such design relies on multi-modal interaction.
As we saw in Chapter 1, there are five senses: sight, sound, touch, taste and smell.Sight is the predominant sense for the majority of people, and most interactive
systems consequently use the visual channel as their primary means of presentation,through graphics, text, video and animation.
However, sound is also an important channel, keeping us aware of our surround-ings, monitoring people and events around us, reacting to sudden noises, providingclues and cues that switch our attention from one thing to another. It can also havean emotional effect on us, particularly in the case of music. Music is almost com-pletely an auditory experience, yet is able to alter moods, conjure up visual images,evoke atmospheres or scenes in the mind of the listener.
Touch, too, provides important information: tactile feedback forms an intrinsicpart of the operation of many common tools – cars, musical instruments, pens, anything that requires holding or moving. It can form a sensuous bond betweenindividuals, communicating a wealth of non-verbal information.
Taste and smell are often less appreciated (until they are absent) but they also provide useful information in daily life: checking if food is bad, detecting early signsof fire, noticing that manure has been spread in a field, pleasure.
Examples of the use of sensory information are easy to come by (we looked atsome in Chapter 1), but the important point is that our everyday interaction witheach other and the world around us is multi-sensory, each sense providing differ-ent information that informs the whole. Since our interaction with the world isimproved by multi-sensory input, it makes sense that interactive systems that utilize
10.3

10.3 Multi-modal interaction 369
more than one sensory channel will also provide a richer interactive experience. In addition, such multi-sensory or multi-modal systems support the principle ofredundancy required for universal design, enabling users to access the system usingthe mode of interaction that is most appropriate to their abilities.
The majority of interactive computer systems are predominantly visual in theirinteractive properties; often WIMP based, they usually make use of only rudi-mentary sounds while adding more and more visual information to the screen. As systems become more complex, the visual channel may be overloaded if too muchinformation is presented all at once. This may lead to frustration or errors in use. By utilizing the other sensory channels, the visual channel can be relieved of the pres-sure of providing all the information required and so interaction should improve.The use of multiple sensory channels increases the bandwidth of the interactionbetween the human and the computer, and it also makes human–computer inter-action more like the interaction between humans and their everyday environment,perhaps making the use of such systems more natural. However, it should always beremembered that multi-modal interaction is not just about enhancing the richnessof the interaction, but also about redundancy. Redundant systems provide the sameinformation through a range of channels, so, for example, information presentedgraphically is also captioned in readable text or speech, or a verbal narrative is provided with text captions. The aim is to provide at least an equivalent experienceto all, regardless of their primary channel of interaction.
Usable sensory inputs
In computing, the visual channel is used as the predominant channel for communication, butif we are to use the other senses we have to consider their suitability and the nature of the information that they can convey.
The use of sound is an obvious area for further exploitation. There is little doubt that we use hear-ing a great deal in daily life, and so developing its application to the interface may be beneficial.Sound is already used, to a limited degree, in many interfaces: beeps are used as warnings andnotification, recorded or synthesized speech and music are also used. Tactile feedback, as we havealready seen, is also important in improving interactivity and so this represents another sense thatwe can utilize more effectively. However, taste and smell pose more serious problems for us. Theyare the least used of our senses, and are used more for receiving information than for commun-icating it. There are currently very few ways of implementing devices that can generate tastes andsmells, and so these two areas are not supported. Whether this is a serious omission remains tobe seen, but the tertiary nature of those senses tends to suggest that their incorporation, if it werepossible, would focus on specialist applications, for example, in enhancing virtual reality systems.
Even if we do not use other senses in our systems, it is certainly worth thinking about the natureof these senses and what we gain from them as this will improve our understanding of thestrengths and weaknesses of visual communication [96].

370 Chapter 10 n Universal design
The next sections of this chapter will look at some of the alternative modes ofhuman–computer communication, concentrating particularly on sound, touch,handwriting and gesture. We will consider how each mode can be used to createricher interaction and provide redundancy.
10.3.1 Sound in the interface
Sound is an important contributor to usability. There is experimental evidence tosuggest that the addition of audio confirmation of modes, in the form of changes inkeyclicks, reduces errors [237]. Video games offer further evidence, since expertstend to score less well when the sound is turned off than when it is on; they pick upvital clues and information from the sound while concentrating their visual attentionon different things. The dual presentation of information through sound and visionsupports universal design, by enabling access for users with visual and hearingimpairments respectively. It also enables information to be accessed in poorly lit ornoisy environments. Sound can convey transient information and does not take upscreen space, making it potentially useful for mobile applications.
However, in spite of this, the auditory channel is comparatively little used in standard interfaces, and where it is used it is often peripheral to the interaction.Information provision is predominantly visual. There is a danger that this will over-load the visual channel, demanding that the user attend to too many things at onceand select appropriate information from a mass of detail in the display. Reliance onvisual information forces attention to remain focussed on the screen, and the per-sistence of visual information means that even detail that is quickly out of date mayremain on display after it is required, cluttering the screen further. It also presentssignificant problems for people with visual impairment, whose access to applicationscan be severely restricted by solely visual output. More widespread effective use ofsound in the interface would alleviate these problems. There are two types of soundthat we could use: speech and non-speech.
Speech in the interface
Language is rich and complex. We learn speech naturally as children ‘by example’ –by listening to and mimicking the speech of those around us. This process seems so effortless that we often do not appreciate its complex structures, and it is not until we attempt to learn a new language later in life, or to make explicit the rules of the one we speak, that the difficulties inherent in language understanding becomeapparent. This complexity makes speech recognition and synthesis by computer verydifficult.
Structure of speech If we are fully to appreciate the problems involved with thecomputer-based recognition and generation of speech, we need first to understandthe basic structure of speech. We will use English to illustrate but most other lan-guages have similar issues.
10.3 Multi-modal interaction 371
The English language is made up of 40 phonemes, which are the atomic elementsof speech. Each phoneme represents a distinct sound, there being 24 consonants and16 vowel sounds. Language is more than simple sounds, however. Emphasis, stress,pauses and pitch can all be used to alter the meaning and nature of an utterance, acommon example being the rise in pitch at the end of a sentence to indicate a ques-tion in English. This alteration in tone and quality of the phonemes is termed prosodyand is used, in addition to the actual words, to convey a great deal of meaning andemotion within a sentence. Prosodic information gives language its richness and texture, but is very difficult to quantify. Owing to the manner in which sound is produced in the vocal tract, mouth and nose of the speaker, the limitation inresponse speed means that phonemes sound differently when preceded by differentphonemes. This is termed co-articulation, and the resulting differences in sound canbe used to construct a set of allophones, which represent all the different soundswithin the language. Ignoring prosodic information, the concatenation of allo-phones together should produce intelligible, articulate speech. However, dependingon the analysis of language used, and the regional accent studied, there are between120 and 130 allophones. These, in turn, can be formed into morphemes, which represent the smallest unit of language that has meaning. They are the basic buildingblocks of language rather than of speech. Morphemes can be either parts of words or whole words, and they are built into sentences using the rules of grammar of thelanguage.
Even being able to decompose sentences into their basic parts does not mean that we can then understand them: the syntax (structure) only serves as a stand-ard foundation upon which the semantics (meaning) is based. We are rarely aware of the complex structure of speech, and concentrate on extracting the meaning from the sentences we hear, rather than decomposing the sounds into their con-stituent parts.
Speech recognition There have been many attempts at developing speech recogni-tion systems, but, although commercial systems are now commonly and cheaplyavailable, their success is still limited to single-user systems that require considerabletraining.
The complexity of language is one barrier to success, but there are other, morepractical, problems also associated with the automatic recognition of the spokenword. Background noise can interfere with the input, masking or distorting theinformation, while speakers can introduce redundant or meaningless noises into theinformation stream by repeating themselves, pausing or using ‘continuation’ noisessuch as ‘ummm’ and ‘errr’ to fill in gaps in their usual speech. Variations betweenindividuals also cause problems; people have unique voices, and systems that are successful are tuned to be sensitive to minute variations in tone and frequency of the speaker’s voice – new speakers present different inflections to the system, whichthen fails to perform as well. A more serious problem is caused by regional accents,which vary considerably. This strong variation upsets the trained response of therecognition system. More serious still is the problem posed by different languages:everything from phonemes up can be different.

372 Chapter 10 n Universal design
Speech recognition offers another mode of communication that may be used to supplement existing channels or be the primary one. When a user’s hands arealready occupied, such as in a factory, speech may prove to be the ideal inputmedium. Speech input does not require the use of a cumbersome keyboard and so in lightweight mobile situations there is a potential role for such systems. It alsoprovides an alternative means of input for users with visual, physical and cognitiveimpairment as we will see later. Single-user, limited vocabulary systems can worksatisfactorily, but the current success rate of recognition for general users and uncon-strained language is still low.
The phonetic typewriter
One early successful speech-based system is the phonetic typewriter. This uses a neural net-work that clusters similar sounds together (see Figure 10.1).
Designed to produce typed output from speech input in Finnish, it is trained on one particularspeaker, and then generalizes to others. However, its performance with speakers other than theone on which it was trained is noticeably poorer, and it relies on a large dictionary of minute vari-ations to supplement its general transcription mechanism. Without the dictionary, it achieves asignificantly lower recognition rate.
One reason that the phonetic typewriter was able to achieve acceptable levels of recognition andtranscription is that Finnish is a phonetic language, that is one which is spelt as it sounds. Thereare other phonetic languages, for example Welsh, but most languages do not have such a straight-forward mapping between sound and text. Think of English words such as ‘wait’ and ‘weight’ or‘one’ and ‘won’, for example.
Puzzle: How do you pronounce ‘ghuti’? (Answer on the web pages!)
Figure 10.1 The phonetic typewriter

10.3 Multi-modal interaction 373
Despite its limitations there are commercial systems employing speech recogni-tion. Speech-based word processors are easily available and several computers usespeech input as a marketing feature. Telephone-based systems also use speech, butthey face a more difficult task as they must be speaker independent. At the simplestend, some systems ask you to speak an extension number, but, as tone dialingbecomes universal, the advantage of this over typing the number is dubious! Othersystems make more active use of voice, including information systems for airlinebookings. These more sophisticated systems work because they are interactive: thesystem reflects back to the user its interpretation of the speech input, allowing theuser to enter into a dialog to correct any errors. This is precisely what happens innormal conversation – we don’t get it right all the time.
Speech synthesis Complementary to speech recognition is speech synthesis. Thenotion of being able to converse naturally with a computer is an appealing one formany users, especially those who do not regard themselves as computer literate, sinceit reflects their natural, daily medium of expression and communication. However,there are as many problems in speech synthesis as there are in recognition. The most difficult problem is that we are highly sensitive to variations and intonation inspeech, and are therefore intolerant of imperfections in synthesized speech. We areso used to hearing natural speech that we find it difficult to adjust to the monotonic,non-prosodic tones that synthesized speech can produce. In fact, most speech syn-thesizers can deliver a degree of prosody, but in order to decide what intonation togive to a word, the system must have an understanding of the domain. So an effect-ive automatic reader would also need to be able to understand natural language,which is difficult. However, for ‘canned’ messages and responses, the prosody can behand coded yielding much more acceptable speech.
Synthesized speech also brings other problems. Being transient, spoken outputcannot be reviewed or browsed easily. It is intrusive, requiring either an increase innoise in the office environment or the use of headphones, either of which may be toolarge a price to pay for the benefits the system may offer.
However, there are some application areas in which speech synthesis has been successful. For users who are blind or partially sighted, synthesized speech offers anoutput medium which they can access. Screen readers are software packages thatread the contents of a computer screen, using synthesized speech. Modern screenreaders read more than simply the text on the screen. They read exactly what theyfind including icons, menus, punctuation and controls. They also read events, suchas dialog boxes opening, so that they can be used with graphical interfaces.
Speech synthesis is also useful as a communication tool to assist people with physical disabilities that affect their speech. Here speech synthesis needs to produceoutput that is as natural as possible with as little input effort from the user as pos-sible, perhaps using a simple switch. Human conversation is rapid and complex,making this a significant challenge. Most communication tools of this type usepredefined messages, enabling the user to select a message appropriate to the contextquickly and easily.

Used as a supplement to other output channels, speech can also enhance applications where the user’s visual attention is focussed elsewhere, such as warningsin aircraft cockpits and, more recently, in cars. We will return to some of these applications later in the chapter.
Uninterpreted speech Speech does not have to be recognized by a computer to beuseful in the interface. Fixed pre-recorded messages can be used to supplement or
374 Chapter 10 n Universal design
DESIGN FOCUS
Designing websites for screen readers
While screen readers provide users with visual impairments access to standard interfaces and software,web access can be more problematic. Screen readers can only read textual elements of web pages, sographics and scripts cannot be interpreted. It is therefore important that web designers take accountof these limitations and design sites to be accessible to people using screen readers. For example,HTML ‘alt’ tags should always be used for necessary graphics, and text alternative menus and naviga-tion controls provided.
In addition, most read text across the page, so text arranged in columns can become garbled. For example, consider text arranged in two columns, such as the opening lines of these nursery rhymes:
Jack and Jill went up the hill Mary had a little lambTo fetch a pail of water Its fleece was white as snow
With some screen readers, this text would be read as ‘Jack and Jill went up the hill Mary had a littlelamb To fetch a pail of water Its fleece was white as snow’ – clearly nonsense. Where possible, textshould make sense when read across a page.
Users of screen readers may also find it difficult to follow links embedded in text, particularly wherethere are several in a block of text. It can therefore be helpful to provide links to the main sections ina clear location where they will be read horizontally, such as at the top of the page.
If you want to experience something of what it is like to access the web using a screen reader, try the simulation produced by the Web Accessibility in Mind project, available at www.webaim.org/simulations/screenreader (accessed March 2003). Their site also contains a wealth of information aboutweb accessibility.
Another useful resource to help you design accessible websites is the Web Accessibility Initiative’s(WAI) checklist for accessibility. This is available on their website www.w3.org (accessed March 2003).
A tool that you can use to test your websites for accessibility is Bobby from Watchfire (bobby.cast.org,accessed March 2003). Bobby is a web-based accessibility evaluation tool that highlights problem areasof a given website and encourages accessible solutions. It provides suggestions for improvement usingthe guidelines provided by the WAI and the US Government’s Section 508 legislation. Using Bobby,web designers can test their sites for accessibility and get advice for resolving any problems before thesite goes live.

10.3 Multi-modal interaction 375
replace visual information. Recordings have natural human prosody and pronunci-ation, although quality is sometimes low. Segments of speech can be used together toconstruct messages, for example the announcements in many airports and railwaystations.
Recordings of users’ speech can also be very useful, especially in collaborativeapplications, for example many readers will have used voicemail systems. Also,recordings can be attached to other artifacts as audio annotations in order to com-municate with others or to remind oneself at a later time. For example, audio annotations can be attached to Microsoft Word documents.
When recordings are replayed, they can be digitally speeded up. If you simply playan audio recording faster, the pitch rises – and human speech ends up soundingrather like Mickey Mouse. However, digital signal-processing techniques can acceler-ate a recording while keeping the same pitch. Speech can be played back at up totwice the normal rate without any loss of comprehensibility. This can be used in atelephone help desk where a pre-recorded message asks the enquirer to state hisproblem. The problem can then be replayed at an accelerated rate to the operator,reducing the operator time per enquiry. The utility of such methods needs carefulanalysis, however. The operator may often begin to act on a message while it is stillplaying, hence reducing any gain from faster playback. Furthermore, reduced inter-activity may lead to more misunderstandings, and the enquirer’s waiting time maybe increased.
DESIGN FOCUS
Choosing the right kind of speech
If you include speech input in an interface you must decide what level of speech interaction you wishto support:
recording simply recording and replaying messages or annotations;
transcription turning speech into text as in a word processor;
control telling the computer what to do: for example, ‘print this file’.
Each level has its own problems and advantages; for example, control only requires a limited vocabu-lary, but is more dangerous: ‘I said print not delete . . . !’ However, the biggest problem arises if you tryto mix these levels. In text we use quotes to make such distinctions, but they are hard in speech: ‘insertthe word “delete” before the word “before” ’.
In fact, for general interface use, speech is best mixed with other modes of communication as happensin everyday life. For example, in a word processor you may use a tablet and pen to ring a word andthen say ‘move this word to here’ as you tap the pen at the target location. This is exactly what youwould do when talking through corrections to a document with someone.

376 Chapter 10 n Universal design
Non-speech sound
We have considered the use of speech in the interface, but non-speech sounds canoffer a number of advantages. As speech is serial, we have to listen to most of a sentence before we understand what is being said. Non-speech sounds can often beassimilated much more quickly. Speech is language dependent – a speech-based sys-tem requires translation for it to be used for another language group. The meaningof non-speech sounds can be learned regardless of language. Speech requires theuser’s attention. Non-speech sound can make use of the phenomenon of auditoryadaptation: background sounds are ignored unless they change or cease. However, adisadvantage is that non-speech sounds have to be learned, whereas the meaning ofa spoken message is obvious (at least to a user who is familiar with the languageused).
Non-speech sound can be used in a number of ways in interactive systems. It isoften used to provide transitory information, such as indications of network or sys-tem changes, or of errors. It can also be used to provide status information on back-ground processes, since we are able to ignore continuous sounds but still respond tochanges in those sounds. Users of early home computers with their noisy power sup-plies, and computer operators listening to the chatter of the printer and the spinningof disks and tape drives, both report that they are able to tell what stage a process isat by the characteristic sounds that are made.
Non-speech sound can also be used to provide a second representation of actions and objects in the interface to support the visual mode and provide confirma-tion for the user. It can be used for navigation round a system, either giving redund-ant supporting information to the sighted user or providing the primary source ofinformation for the visually impaired. Experiments on auditory navigation [290]have demonstrated that auditory clues are adequate for a user to locate up to eighttargets on a screen with reasonable speed and accuracy. This suggests that there is little reason for ignoring the role of sound in interfaces on the grounds that it maybe too vague or inaccurate.
But what kind of non-speech sounds should we use in the interface? There are twoalternatives: using sounds that occur naturally in the world and using more abstractgenerated sounds. We will consider an example of each type.
Auditory icons Auditory icons [141] use natural sounds to represent different typesof objects and actions in the interface. The SonicFinder [142] for the Macintosh wasdeveloped from these ideas, to enhance the interface through redundancy. Naturalsounds are used because people recognize the source of a sound and its behaviorrather than timbre and pitch [364]. For example, a noise will be identified as glassbreaking or a hollow pipe being tapped. Such recognition is quite sophisticated: wecan identify not only the source of a sound (e.g. tapping a pipe) but characteristicsof the sound source (e.g. whether the pipe is hollow or solid).
In the SonicFinder, auditory icons are used to represent desktop objects andactions. So, for example, a folder is represented by a papery noise, and throwingsomething in the wastebasket by the sound of smashing. This helps the user to learn

10.3 Multi-modal interaction 377
the sounds since they suggest familiar actions from everyday life. However, thisadvantage also creates a problem for auditory icons. Some objects and actions do nothave obvious, naturally occurring sounds that identify them. In these cases a soundeffect can be created to suggest the action or object but this moves away from theideal of using familiar everyday sounds that require little learning. For example,copying has no immediate analog sound and in the SonicFinder it is indicated by thesound of pouring a liquid into a receptacle, with the pitch rising to indicate theprogress of the copying.
SharedARK and ARKola
Natural sounds have been used to model environments such as a physics laboratory [145],called SharedARK (Shared Alternate Reality Kit) and a virtual manufacturing plant, ARKola [147]. In SharedARK, multiple users could perform physics experiments in a virtual laboratory. Sound was used in three different ways: as confirmation of actions, for status information and as aids tonavigation. Confirmatory sounds use similar principles to the SonicFinder, providing redundantinformation that increases feedback. Process and state information sounds exist on two levels,global and local. Global sounds represent the state of the whole system and can be heard any-where, while local sounds are specific to particular experiments and alter when the user changesfrom one experiment to another. Navigational information is provided by soundholders, which areauditory landmarks. They can be placed anywhere in the system and get louder as the user movestowards them, decreasing in volume when moving away. This allows the user to wander throughan arena much greater than the size of the screen without getting lost and lets him return tospecific areas very easily by returning to the soundholder.
In ARKola, a soft drinks factory was modeled, with two users attempting to optimize the factory’soutput, working remotely from each other and using an audio/video link. Input machines suppliedraw materials while output machines capped the bottles and shipped them out. Each machine hadan on/off switch and a rate control, with a sound that indicated its status; for example, the bottledispenser made the sound of clinking glass, with a rhythm that indicated its operating speed.Splashing sounds indicated spilled liquids, while breaking glass showed that bottles were being lost.The users monitored the status of the plant by listening to the auditory clues, and were able to help each other more effectively, since they found it easier to monitor their own machines without having to spend time looking at them, and could hear when something had gone wrongwith their partner’s part of the system.
Non-speech sounds such as this can convey a lot of meaning very economically. Afile arrives in a mailbox and, being a large file, it makes a weighty sound. If it is a textfile it makes a rustling noise, whereas a compiled program may make a metallicclang. The sound can be muffled or clear, indicating whether the mailbox is hiddenby other windows or not, while the direction of the sound would indicate the posi-tion of the mailbox icon on the screen. If the sound then echoes, as it would in alarge, empty room, the system load is low. All this information can be presented in asecond or so.

378 Chapter 10 n Universal design
Worked exercise Think of a set of naturally occurring sounds to represent the operations in a standard drawingpackage (for example, draw, move, copy, delete, rotate).
Answer This can exercise the imagination! Are there natural analogies? For example, does thephysical action, say, of drawing have a sound associated with it? The sound of a pencilon paper may be appropriate but is it identifiable? Similarly, a photocopier whirringcould represent the copy operation, and tearing paper delete. Rotate and move aremore difficult since the physical operation is not associated with a sound. Perhaps direc-tion and movement can be indicated by sounds becoming nearer or more distant?
Earcons
An alternative to using natural sounds is to devise synthetic sounds. Earcons [36] usestructured combinations of notes, called motives, to represent actions and objects(see Figure 10.2). These vary according to rhythm, pitch, timbre, scale and volume.There are two types of combination of earcon. Compound earcons combine differentmotives to build up a specific action, for example combining the motives for ‘create’and ‘file’. Family earcons represent compound earcons of similar types. As an ex-ample, operating system errors and syntax errors would be in the ‘error’ family. Inthis way, earcons can be hierarchically structured to represent menus. Earcons areeasily grouped and refined owing to their compositional and hierarchical nature, butthey require learning to associate with a specific task in the interface since there is an
Figure 10.2 Earcons (after Blattner [36], reprinted by permission of LawrenceErlbaum Associates, Inc.)

10.3 Multi-modal interaction 379
arbitrary mapping. Conversely, auditory icons have a semantic relationship with thefunction that they represent, but can suffer from there being no appropriate soundfor some actions.
Earcons provide a structured approach to designing sound for the interface, butcan users learn the sounds adequately, and what factors influence their use? Evidencesuggests that people can learn to recognize earcons, and that the most important element in distinguishing different sounds is timbre, the characteristic quality of the sound produced by different instruments and voices [47]. Other factors such aspitch, rhythm and register should be used to supplement timbre in creating distinct-ive sets of musical earcons. Interestingly, the user’s musical ability appears to havelittle effect on his ability to remember earcons: users were able to identify around80% of earcons from hierarchically ordered sets of 30 or more, regardless of theirmusical background [45]. It is also possible to create compound earcons by playingsounds in parallel as well as serially. This obviously reduces the time taken to hearthe sound but does not affect the user’s accuracy [45].
10.3.2 Touch in the interface
We have already considered the importance of touch in our interaction with ourenvironment, in Chapter 1. Touch is the only sense that can be used to both send andreceive information. Although it is not yet widely used in interacting with computers,there is a significant research effort in this area and commercial applications arebecoming available.
The use of touch in the interface is known as haptic interaction. Haptics is a genericterm relating to touch, but it can be roughly divided into two areas: cutaneous perception, which is concerned with tactile sensations through the skin; and kin-esthetics, which is the perception of movement and position. Both are useful in interaction but they require different technologies.
In Chapter 2, Section 2.6.3, we considered a number of examples of haptic devices,including some based on vibration against the skin (cutaneous) and others on resist-ance or force feedback (kinesthethic). They facilitate perception of properties such as shape, texture, resistance and temperature as well as comparative spatial pro-perties such as size, height and position. This means haptics can provide informationon the character of objects in the interface, as well as more realistic simulations ofphysical activities, either for entertainment or for training.
In this section, we will look in a little more detail at some of the different types ofhaptic devices and consider, in particular, the role of haptics in universal design. Aswe will see, touch can provide both a primary source of information for users withvisual impairments and a richer multi-modal experience for sighted users.
One example of a tactile device is an electronic – or soft – braille display. Brailledisplays are made up of a number of cells (typically between 20 and 80), each con-taining six or eight electronically controlled pins that move up and down to producebraille representations of characters displayed on the screen. Whereas printed braillenormally has six dots per cell, electronic braille typically has eight pins, with the extra

380 Chapter 10 n Universal design
Figure 10.3 A PHANTOM Premium 1.5 haptic device. Source: Courtesy ofSensAble Technologies
two representing additional information about that cell, such as cursor position andcharacter case.
Electronic braille displays benefit from two factors: a well-established tactile nota-tion (braille) and a user group with expertise in using this notation. But can similartechniques be used to provide more generic tactile feedback, such as to displaygraphics? The problem with using raised pins for this type of display is the resolu-tion required. Braille requires only six or eight pins; a graphical display wouldrequire many more, which raises the problem of fitting the necessary number of fastactuators (to move the pins) into a few cubic centimeters. This presents a seriousengineering challenge.
The other main type of haptic device is the force feedback device, which provideskinesthetic information back to the user, allowing him to feel resistance, textures,friction and so on. One of the most commonly used examples is the PHANTOMrange, from SensAble Technologies. The PHANTOM provides three-dimensional
10.3 Multi-modal interaction 381
DESIGN FOCUS
Apple Newton
The Apple Newton was the first popular pen-based computer. Other systems, such as the GO Pen-Point computer, were available earlier, but did not achieve a significant breakthrough. One reason isthat the Newton targeted the organizer market where miniature keyboards were difficult to use (andanyway managers don’t use them!). Also this niche market did not demand large amounts of text input,and the graphical interface made it easy to do non-text-based tasks.
force feedback, allowing users to touch virtual objects. As well as offering the func-tionality of the mouse, in addition, the user’s movement is monitored by optical sen-sors on the device, and these, together with models of the virtual objects, are used tocalculate the forces applied back to the user. The user therefore can feel the outlineand resistance of objects, their texture and position. This type of device has potentialapplication for simulations and training situations where touch is important, such asmedicine. It can also be used to provide a haptic ‘image’ of an interface, providingthe user with information about the objects and their functionality based on howthey feel. This offers another channel of information, which enhances the richness ofthe interaction and makes the design more universal.
At present, the hardware needed to support haptic interaction is prohibitivelyexpensive for most users. But this is liable to change as the applications become morewidespread and commercially viable.
10.3.3 Handwriting recognition
Like speech, we consider handwriting to be a very natural form of communication.The idea of being able to interpret handwritten input is very appealing, and hand-writing appears to offer both textual and graphical input using the same tools. Thereare problems associated with the use of handwriting as an input medium, however,and in this section we shall consider these. We will first look at the mechanisms forcapturing handwritten information, and then look at the problems of interpreting it.
Technology for handwriting recognition
The major piece of technology used to capture handwriting is the digitizing tablet,explained in more detail in Chapter 2. Free-flowing strokes made with a pen aretransformed into a series of coordinates, approximately one every 1/50th of a second(or at the sampling rate of the digitizer). Rapid movements produce widely spaceddots, in comparison with slow movements: this introduces immediate errors into theinformation, since the detail of the stroke between dots is lost, as is the pressureinformation.
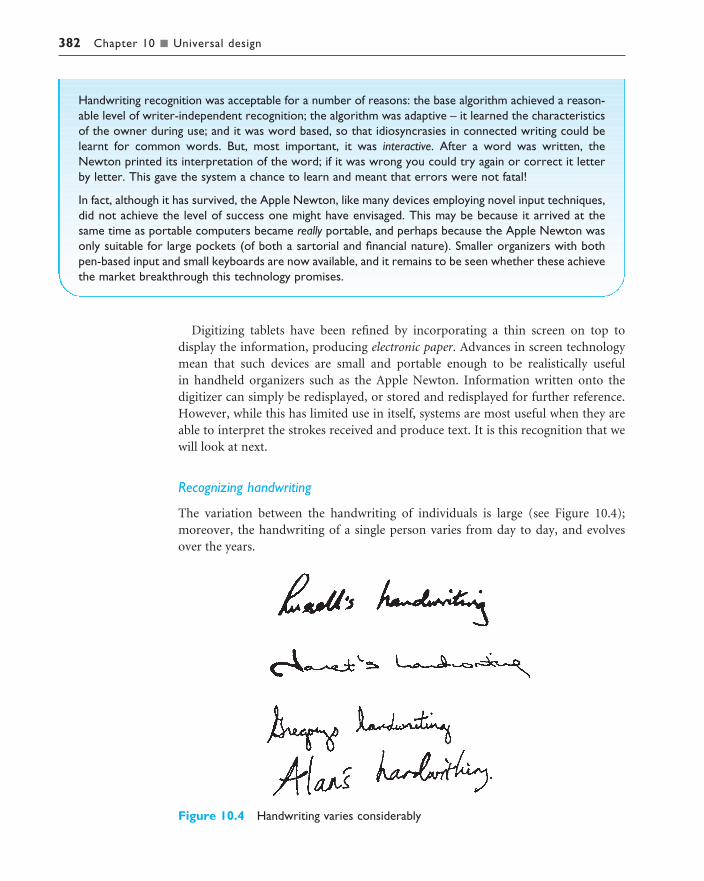
Digitizing tablets have been refined by incorporating a thin screen on top to display the information, producing electronic paper. Advances in screen technologymean that such devices are small and portable enough to be realistically useful in handheld organizers such as the Apple Newton. Information written onto the digitizer can simply be redisplayed, or stored and redisplayed for further reference.However, while this has limited use in itself, systems are most useful when they areable to interpret the strokes received and produce text. It is this recognition that wewill look at next.
Recognizing handwriting
The variation between the handwriting of individuals is large (see Figure 10.4);moreover, the handwriting of a single person varies from day to day, and evolvesover the years.
Handwriting recognition was acceptable for a number of reasons: the base algorithm achieved a reason-able level of writer-independent recognition; the algorithm was adaptive – it learned the characteristicsof the owner during use; and it was word based, so that idiosyncrasies in connected writing could belearnt for common words. But, most important, it was interactive. After a word was written, theNewton printed its interpretation of the word; if it was wrong you could try again or correct it letterby letter. This gave the system a chance to learn and meant that errors were not fatal!
In fact, although it has survived, the Apple Newton, like many devices employing novel input techniques,did not achieve the level of success one might have envisaged. This may be because it arrived at thesame time as portable computers became really portable, and perhaps because the Apple Newton wasonly suitable for large pockets (of both a sartorial and financial nature). Smaller organizers with bothpen-based input and small keyboards are now available, and it remains to be seen whether these achievethe market breakthrough this technology promises.
382 Chapter 10 n Universal design
Figure 10.4 Handwriting varies considerably

10.3 Multi-modal interaction 383
These problems are reminiscent of those already discussed in speech recognition,and indeed the recognition problem is not dissimilar. The equivalent of co-articulationis also prevalent in handwriting, since different letters are written differently accord-ing to the preceding and successive ones. This causes problems for recognition systems, which work by trying to identify the lines that contain text, and then to segment the digitized image into separate characters. This is so difficult to achievereliably that there are no systems in use today that are good at general cursive scriptrecognition. However, when letters are individually written, with a small separation,the success of systems becomes more respectable, although they have to be trained torecognize the characteristics of the different users. If tested on an untrained person,success is limited again. Many of the solutions that are being attempted in speechrecognition are also being tried in handwriting recognition systems, such as whole-word recognition, the use of context to disambiguate characters, and neural net-works, which learn by example.
10.3.4 Gesture recognition
Gesture is a component of human–computer interaction that has become the sub-ject of attention in multi-modal systems. Being able to control the computer withcertain movements of the hand would be advantageous in many situations wherethere is no possibility of typing, or when other senses are fully occupied. It could alsosupport communication for people who have hearing loss, if signing could be ‘trans-lated’ into speech or vice versa. But, like speech, gesture is user dependent, subject tovariation and co-articulation. The technology for capturing gestures is expensive,using either computer vision or a special dataglove (see Chapter 2). The datagloveprovides easier access to highly accurate information, but is a relatively intrusivetechnology, requiring the user to wear the special Lycra glove. The interpretation ofthe sampled data is very difficult, since segmenting the gestures causes problems. Ateam from Toronto [131] has produced a gesture recognition system that translateshand movements into synthesized speech, using five neural networks working inparallel to learn and then interpret different parts of the inputs.
The Media Room at MIT uses a different approach in order to incorporate ges-tures into the interaction. The Media Room has one wall that acts as a large screen,with smaller touchscreens on either side of the user, who sits in a central chair. Theuser can navigate through information using the touchscreens, or by joystick, or byvoice. Gestures are incorporated by using a position-sensing cube attached to awristband worn by the user. The put that there system uses this gestural informationcoupled with speech recognition to allow the user to indicate what should be movedwhere by pointing at it. This is a much more natural form of interaction than havingto specify verbally what it is that has to be moved and describing where it has to go,as well has having the advantage of conciseness. Such a short, simple verbal state-ment is much more easily interpreted by the speech recognition system than a longand complex one, with the resolution of ambiguity done by interpreting the othermode of interaction, the gesture. Each modality supports the other.

384 Chapter 10 n Universal design
DESIGNING FOR DIVERSITY
We noted in Chapter 1 that, although we can make general observations abouthuman capabilities, users in fact have different needs and limitations. Interfaces areusually designed to cater for the ‘average’ user, but unfortunately this may excludepeople who are not ‘average’. As we saw in the introduction to this chapter, peopleare diverse and there are many factors that must be taken into account if we are tocome close to universal design.
In this section, we will consider briefly some of these factors and the particularchallenges that each raises. We will consider three key areas: disability, age and culture.
10.4.1 Designing for users with disabilities
It is estimated that at least 10% of the population of every country has a disabilitythat will affect interaction with computers. Employers and manufacturers of com-puting equipment have not only a moral responsibility to provide accessible products,but often also a legal responsibility. In many countries, legislation now demands thatthe workplace must be designed to be accessible or at least adaptable to all – thedesign of software and hardware should not unnecessarily restrict the job prospectsof people with disabilities.
We will look briefly at sensory, physical and cognitive impairments and the issuesthey raise for interface design.
Visual impairment
The sensory impairment that has attracted the most attention from researchers, per-haps because it is potentially also one of the most debilitating as far as interaction isconcerned, is visual impairment. The rise in the use of graphical interfaces reducesthe possibilities for visually impaired users. In text-based interaction, screen readersusing synthesized speech or braille output devices provided complete access to com-puters: input relied on touch-typing, with these mechanisms providing the output.However, today the standard interface is graphical. Screen readers and braille outputare far more restricted in interpreting the graphical interface, as we saw in Section10.3.1, meaning that access to computers, and therefore work involving computers,has been reduced rather than expanded for visually impaired people.
There are two key approaches to extending access: the use of sound and the use oftouch. We have already considered these in Section 10.3 so we will summarize onlybriefly here.
A number of systems use sound to provide access to graphical interfaces for people with visual impairment. In Section 10.3.1 we looked at a range of approachesto the use of sound such as speech, earcons and auditory icons. All of these have beenused in interfaces for blind users.
10.4

10.4 Designing for diversity 385
Soundtrack (see the box above) was an early example of the use of non-speechsound to provide an auditory interface to a word processor. A major limitation ofthis application was the fact that it was a specialized system; it could not be used toaugment commercially available software. Ideally, users with disabilities should have
Soundtrack
Soundtrack is an early example of a word processor with an auditory interface, designed forusers who are blind or partially sighted [118]. The visual items in the display have been given auditory analogs, made up of tones, with synthesized speech also being used. A two-row grid offour columns is Soundtrack’s main screen (see Figure 10.5); each cell makes a different tone whenthe cursor is in it, and by using these tones the user can navigate around the system. The tonesincrease in pitch from left to right, while the two rows have different timbres. Clicking on a cell makes it speak its name, giving precise information that can reorient a user who is lost or confused. Double clicking on a cell reveals a submenu of items associated with the main screenitem. Items in the submenu also have tones; moving down the menu causes the tone to fall whilstmoving up makes it rise. A single click causes the cell to speak its name, as before, whilst doubleclicking executes the associated action.
Soundtrack allows text entry by speaking the words or characters as they are entered, with theuser having control over the degree of feedback provided. It was found that users tended to countthe different tones in order to locate their position on the screen, rather than just listen to thetones themselves, although one user with musical training did use the pitch.
Soundtrack provides an auditory solution to representing a visually based word processor, thoughthe results are not extensible to visual interfaces in general. However, it does show that the humanauditory system is capable of coping with the demands of highly interactive systems, and that thenotion of auditory interfaces is a reasonable one.
Figure 10.5 The screen division in Soundtrack. Source: Courtesy of Alistair D. N. Edwards

386 Chapter 10 n Universal design
DESIGN FOCUS
Mathematics for the blind
Solve the following equation: 3(x − 2) + 4 = 7 − 2(3 − x).
Did you do it in your head or use a piece of paper? When an equation is even slightly complex theinstant response of a sighted person is to reach for paper and pencil. The paper acts as an external mem-ory, allowing you to record and recall previous steps in a calculation. Blind children learning mathem-atics have to perform nearly all such calculations in their head, putting them at a severe disadvantage.
Mathtalk is a system developed as part of a European project to create a mathematics workstation for blind people [330]. It uses speech synthesis to speak formulae, and keyboard input to navigate and manipulate them. The first stage, simply speaking a formula out loud, is complex in itself. Given thespoken equation ‘three x plus four equals seven’, how do you know whether this is ‘3x + 4 = 7’ or ‘3(x + 4) = 7’? To make it unambiguous one could say the latter as ‘three open bracket x plus four closebracket equals seven’, but this soon becomes very tedious. In fact, when reading mathematics peopleuse several cues in their speech: longer and shorter gaps between terms, and prosody: rising and falling pitch (see Figure 10.6). The Mathtalk system includes a set of rules for generating such patternssuitable for most equations.
Figure 10.6 Pausing and pitch help distinguish between two expressions
Visual interaction with paper isn’t just at the level of reading and writing whole equations. Recall fromChapter 1 that reading usually includes regressions where our eyes move backwards as well as forwardsthrough text. Also, when seeing graphical material (remember that mathematics makes heavy use of brackets, symbols, superscripts, etc.), we rely on getting a quick feel for the material at a glancebefore examining it in detail. Both of these factors are crucial when reading an equation and so Mathtalksupports rapid keyboard-based navigation within each equation, and algebra earcons, short motives basedon the rise and fall of the prosody of an equation.
Notice that Mathtalk uses keyboard input combined with speech output. Speech input is slow and error-prone compared with a keyboard. Braille output can also be used for mathematics, but only asmall percentage of blind people read braille. Choosing the right input and output devices requires adeep knowledge of the user population and careful analysis of the intended tasks.

10.4 Designing for diversity 387
access to the same applications as anyone else. Outspoken is a Macintosh applicationthat uses synthetic speech to make other Macintosh applications available to visuallyimpaired users. A common problem with this and other screen readers and talkingbrowsers (see Section 10.3.1) is the sheer amount of information represented.Browsing is difficult and all of the information must be held in the head of the user,putting a heavy load on memory.
A more recent development is the use of touch in the interface. As we saw inSection 10.3.2, there are two key approaches to this, both of which can be used tosupport people with visual impairment. Tactile interaction is already widely used inelectronic braille displays, which represent what is on the screen through a dynamicbraille output. It could also be used to provide more information about graphics andshape, if the engineering challenges of building higher resolution tactile devices canbe overcome. Force feedback devices also have the potential to improve accessibilityto users with visual impairment, since elements in the interface can be touched, andedges, textures and behavior used to indicate objects and actions. A limitation of thistechnology at present is that objects must be rendered using specialist software in order for the devices to calculate the appropriate force to apply back to the user.This again represents a move away from use of generic applications to specialistapplications. However, it is likely that major applications will become ‘hapticenabled’ in the near future.
Hearing impairment
Compared with a visual disability where the impact on interacting with a graphicalinterface is immediately obvious, a hearing impairment may appear to have littleimpact on the use of an interface. After all, it is the visual not the auditory channelthat is predominantly used. To an extent this is true, and computer technology canactually enhance communication opportunities for people with hearing loss. Emailand instant messaging are great levellers and can be used equally by hearing and deafusers alike.
Gesture recognition has also been proposed to enable translation of signing tospeech or text, again to improve communication particularly with non-signers.
However, the increase in multimedia and the use of sound in interfaces has, ironically, created some access difficulties for people with hearing problems. Manymultimedia presentations contain auditory narrative. If this is not supplemented bytextual captions, this information is lost to deaf users. Captioning audio content,where there is not already a graphical or textual version, also has the advantage ofmaking audio files easier and more efficient to index and search, which in turnenhances the experience of all users – a sure sign of good universal design!
Physical impairment
Users with physical disabilities vary in the amount of control and movement thatthey have over their hands, but many find the precision required in mouse controldifficult. Speech input and output is an option for those without speech difficulties.
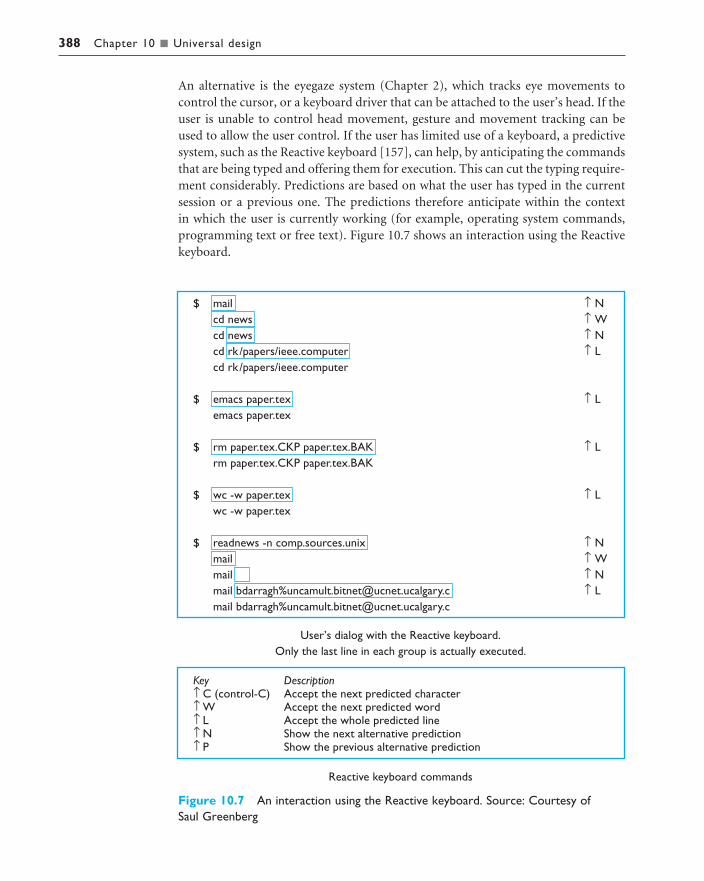
388 Chapter 10 n Universal design
An alternative is the eyegaze system (Chapter 2), which tracks eye movements tocontrol the cursor, or a keyboard driver that can be attached to the user’s head. If theuser is unable to control head movement, gesture and movement tracking can beused to allow the user control. If the user has limited use of a keyboard, a predictivesystem, such as the Reactive keyboard [157], can help, by anticipating the commandsthat are being typed and offering them for execution. This can cut the typing require-ment considerably. Predictions are based on what the user has typed in the currentsession or a previous one. The predictions therefore anticipate within the context in which the user is currently working (for example, operating system commands,programming text or free text). Figure 10.7 shows an interaction using the Reactivekeyboard.
Figure 10.7 An interaction using the Reactive keyboard. Source: Courtesy of Saul Greenberg

10.4 Designing for diversity 389
Speech impairment
For users with speech and hearing impairments, multimedia systems provide a num-ber of tools for communication, including synthetic speech (see Section 10.3.1) andtext-based communication and conferencing systems (see Chapter 19). Textualcommunication is slow, which can lower the effectiveness of the communication.Predictive algorithms have been used to anticipate the words used and fill them in,to reduce the amount of typing required. Conventions can help to provide context,which is lost from face-to-face communication, for example the ‘smilie’ :-), to indicate a joke. Facilities to allow turn-taking protocols to be established also helpnatural communication [256]. Speech synthesis also needs to be rapid to reflect natural conversational pace, so responses can be pre-programmed and selected usinga single switch.
Dyslexia
Users with cognitive disabilities such as dyslexia can find textual informationdifficult. In severe cases, speech input and output can alleviate the need to read andwrite and allow more accurate input and output. In cases where the problem is less severe, spelling correction facilities can help users. However, these need to bedesigned carefully: often conventional spelling correction programs are useless fordyslexic users since the programs do not recognize their idiosyncratic word con-struction methods. As well as simple transpositions of characters, dyslexic users mayspell phonetically, and correction programs must be able to deal with these errors.
Consistent navigation structure and clear signposting cues are also important topeople with dyslexia. Color coding information can help in some cases and provisionof graphical information to support textual can make the meaning of text easier tograsp.
Autism
Autism affects a person’s ability to communicate and interact with people aroundthem and to make sense of their environment. This manifests itself in a range of waysbut is characterized by the triad of impairments:
1. Social interaction – problems in relating to others in a meaningful way orresponding appropriately to social situations.
2. Communication – problems in understanding verbal and textual languageincluding the use of gestures and expressions.
3. Imagination – problems with rigidity of thought processes, which may lead torepetitive behavior and inflexibility.
How might universal design of technology assist people with autism? There are twomain areas of interest: communication and education.
Communication and social interaction are major areas of difficulty for peoplewith autism. Computers, on the other hand, are often motivating, perhaps because

390 Chapter 10 n Universal design
they are relatively consistent, predictable and impersonal in their responses. The user is in control. Computer-mediated communication and virtual environmentshave been suggested as possible ways of enabling people with autism to communic-ate more easily with others, by giving the user control over the situation. Some people with autism have difficulties with language and may be helped by graphicalrepresentations of information and graphical input to produce text and speech.Again this is supported by providing redundancy in the design.
Computers may also have a role to play in education of children with autism, particularly by enabling them to experience (through virtual environments andgames) social situations and learn appropriate responses. This can again provide a secure and consistent environment where the child is in control of his own learning. The use of computers to support people with autism in this way is still a new research area and it is likely that new software and tools will develop in thenext few years.
10.4.2 Designing for different age groups
We have considered how people differ along a range of sensory, physical and cognit-ive abilities. However, there are other areas of diversity that impact upon the way wedesign interfaces. One of these is age. In particular, older people and children havespecific needs when it comes to interactive technology.
Older people
The proportion of older people in the population is growing steadily. Contrary topopular stereotyping, there is no evidence that older people are averse to using newtechnologies, so this group represents a major and growing market for interactiveapplications. People are living longer, have more leisure time and disposable income,and older people have increased independence. These factors have all led to anincrease in older users.
But the requirements of the older population may differ significantly from otherpopulation groups, and will vary considerably within the population group. The proportion of disabilities increases with age: more than half of people over 65 havesome kind of disability. Just as in younger people with disabilities, technology canprovide support for failing vision, hearing, speech and mobility. New communica-tion tools, such as email and instant messaging, can provide social interaction incases where lack of mobility or speech difficulties reduce face-to-face possibilities.Mobile technologies can be used to provide memory aids where there is age-relatedmemory loss.
Some older users, while not averse to using technology, may lack familiarity withit and fear learning. They may find the terminology used in manuals and trainingbooks difficult to follow and alien (words like ‘monitor’ and ‘boot’, for example, may have a completely different meaning to an older person than a young person).Interests and concerns may also be different from younger users.

10.4 Designing for diversity 391
Once again, basic universal design principles are important here. Access to infor-mation must make use of redundancy and support the use of access technologies.Designs must be clear and simple and forgiving of errors. In addition, thought needs to be given to sympathetic and relevant training aimed at the user’s currentknowledge and skills.
In spite of the potential benefits of interactive technology to older people, very little attention has been paid to this area until recently. Researchers are now beginningto address issues such as how technology can best support older people, what the key design issues are, and how older people can be effectively included in the designprocess [46], and this area is likely to grow in importance in the future.
Children
Like older people, children have distinct needs when it comes to technology, andagain, as a population, they are diverse. The requirements of a three year old will bequite different from those of a 12 year old, as will be the methods that can be used to uncover them. Children are, however, different from adults, and have their owngoals and likes and dislikes. It is therefore important to involve them in the design ofinteractive systems that are for their use, though this in itself can be challenging as they may not share the designer’s vocabulary or be able to verbalize what theythink. Design approaches have therefore been developed specifically to include children actively as members of the design team. Alison Druin’s Cooperative Inquiryapproach [110] is based on contextual inquiry and participatory design, which wewill consider in more detail in Chapter 13. Children are included in an intergenera-tional design team that focusses on understanding and analyzing context. Teammembers, including children, use a range of sketching and note-taking techniques to record their observations. Paper prototyping, using art tools familiar to children,enables both adults and children to participate in building and refining prototypedesigns on an equal footing. The approach has been used effectively to develop arange of new technologies for children.
As well as their likes and dislikes, children’s abilities will also be different fromthose of adults. Younger children may have difficulty using a keyboard for instance,and may not have well-developed hand–eye coordination. Pen-based interfaces canbe a useful alternative input device [300]. Again, universal design principles guide usin designing interfaces that children can use. Interfaces that allow multiple modes ofinput, including touch or handwriting, may be easier for children than keyboard andmouse. Redundant displays, where information is presented through text, graphicsand sound will also enhance their experience.
10.4.3 Designing for cultural differences
The final area of diversity we will consider is cultural difference. Cultural differenceis often used synonymously with national differences but this is too simplistic.Whilst there are clearly important national cultural differences, such as those we saw

392 Chapter 10 n Universal design
in Chapter 5, other factors such as age, gender, race, sexuality, class, religion andpolitical persuasion, may all influence an individual’s response to a system. This isparticularly the case when considering websites where often the explicit intention isto design for a particular culture or subculture.
Clearly, while all of these contribute to a person’s cultural identity, they will notall always be relevant in the design of a given system. However, we can draw outsome key factors that we need to consider carefully if we are to practice universaldesign. These include language, cultural symbols, gestures and use of color.
We encountered the problem of localization of software in Chapter 5. Whiletoolkits, with different language resource databases, facilitate the translation of menuitems, error messages and other text into the local language, this does not fully dealwith the language issue. Layouts and designs may reflect a language read from left to right and top to bottom, which will be unworkable with languages that do not follow this pattern.
Similarly, symbols have different meanings in different cultures. As we saw inChapter 5, ticks 3 and crosses 7 represent positive and negative respectively in somecultures, and are interchangeable in others. The rainbow is a symbol of covenantwith God in Judeo–Christian religions, of diversity in the gay community and ofhope and peace in the cooperative movement. We cannot assume that everyone willinterpret symbols in the same way and should ensure that alternative meanings ofsymbols will not create problems or confusion for the user. The study of the mean-ing of symbols is known as semiotics and is a worthwhile diversion for the student ofuniversal design.
Another area where diversity can cause misunderstanding is in the use of gesture.Recently, one of the authors was teaching a new class of international students and was disconcerted to see one sitting in the front row, smiling and shaking hishead. After the lecture this student came and asked a question. Every time the authorasked the student if he understood the explanation, he shook his head, so furtherexplanation ensued, much to the frustration of the student! It was only after a few minutes that it became clear: the student was from India and his gestural con-vention was to shake his head in agreement, the opposite of the European inter-pretation of the gesture. Use of gesture is quite common in video and animation andcare must be taken with differences such as this. As interactions begin to incorporategesture in virtual reality and avatars, issues such as this will become even moresignificant.
Finally, colors are often used in interfaces to reflect ‘universal’ conventions, suchas red for danger and green for go. But how universal are these conventions? In fact,red and green mean many different things in different countries. As well as danger,red represents life (India), happiness (China) and royalty (France). Green is a symbol of fertility (Egypt) and youth (China) as well as safety (Anglo-American). It is difficult to assume any universal interpretation of color but the intendedsignificance of particular colors can be supported and clarified through redundancy– providing the same information in another form as well.
Exercises 393
SUMMARY
Universal design is about designing systems that are accessible by all users in all circumstances, taking account of human diversity in disabilities, age and culture.Universal design helps everyone – for example, designing a system so that it can beused by someone who is deaf or hard of hearing will benefit other people working innoisy environments or without audio facilities. Designing to be accessible to screen-reading systems will make websites better for mobile users and older browsers.
Multi-modal systems provide access to system information and functionalitythrough a range of different input and output channels, exploiting redundancy. Such systems will enable users with sensory, physical or cognitive impairments tomake use of the channels that they can use most effectively. But all users benefit from multi-modal systems that utilize more of our senses in an involving interactiveexperience.
For any design choice we should ask ourselves whether our decision is excludingsomeone and whether there are any potential confusions or misunderstandings inour choice.
10.5
EXERCISES
10.1 Is multi-modality always a good thing? Justify your answer.
10.2 What are (i) auditory icons and (ii) earcons? How can they be used to benefit both visuallyimpaired and sighted users?
10.3 Research your country’s legislation relating to accessibility of technology for disabled people.What are the implications of this to your future career in computing?
10.4 Take your university website or another site of your choice and assess it for accessibility usingBobby. How would you recommend improving the site?
10.5 How could systems be made more accessible to older users?
10.6 Interview either (i) a person you know over 65 or (ii) a child you know under 16 about their experience, attitude and expectations of computers. What factors would you take into account if you were designing a website aimed at this person?
10.7 Use the screen reader simulation available at www.webaim.org/simulations/screenreader to experience something of what it is like to access the web using a screen reader. Can you find the answers to the test questions on the site?

394 Chapter 10 n Universal design
RECOMMENDED READING
M. F. Story, J. L. Mueller and R. L. Mace, The Universal Design File: Designing for People of All Ages and Abilities, The Center for Universal Design, NC StateUniversity, USA, 1998. Available at: www.design.ncsu.edu/cud/pubs/center/books/ud_file/toc3b14.htm (last accessed March 2003).A full discussion of universal design principles with examples to illustrate.
A. D. N. Edwards, editor, Extra-ordinary Human–Computer Interaction, CambridgeUniversity Press, 1993.A collection of papers representing research on interfaces for users with disabil-ities. The first of its kind.
The Web Accessibility Initiative: www.w3.org/WAI/The World Wide Web Consortium’s own project to make the web universallyaccessible. Contains extensive advice and guidelines.
I. Pitt and A. Edwards, Design of Speech-based Devices: A Practical Guide, Springer,2002.Covers the use of speech in the interface, including both the practical and theor-etical issues.
J. Yunker, Beyond Borders: Web Globalization Strategies, New Riders Publishing,2002.A practical guide to internationalization of websites.
D. J. Moore and J. Taylor, Interactive multimedia systems for people with autism,Journal of Educational Media, Vol. 25, No. 3, pp. 169–77, 2001.A useful review of the actual and potential uses of interactive media in the educa-tion of people with autism.

USER SUPPORT
OV E RV I E W
n Users have different requirements for support atdifferent times.
n User support should be:– available but unobtrusive– accurate and robust– consistent and flexible.
n User support comes in a number of styles:– command-based methods– context-sensitive help– tutorial help– online documentation– wizards and assistants– adaptive help.
n Design of user support must take account of:– presentation issues– implementation issues.
1 1

396 Chapter 11 n User support
INTRODUCTION
There is often an implicit assumption that if an interactive system is properlydesigned it will be completely intuitive to use and the user will require little or nohelp or training. This may be a grand ideal but it is far from true with even the best-designed systems currently available. It is even perhaps an unhelpful ideal: a com-puter is a complex piece of equipment – what other such equipment do we expectpeople to use without instruction or help? A more helpful approach is to assume thatthe user will require assistance at various times and design this help into the system.
The type of assistance users require varies and is dependent on many factors: theirfamiliarity with the system, the job they are trying to do, and so on. There are fourmain types of assistance that users require:
n quick referencen task-specific helpn full explanationn tutorial.
Quick reference is used primarily as a reminder to the user of the details of tools heis basically familiar with and has used before. It may, for example, be used to find aparticular command option, or to remind the user of the syntax of the command.Task-specific help is required when the user has encountered a problem in perform-ing a particular task or when he is uncertain how to apply the tool to his particularproblem. The help that is offered is directly related to what is being done. The moreexperienced or inquisitive user may require a full explanation of a tool or commandto enable him to understand it more fully. This explanation will almost certainlyinclude information that the user does not need at that time. The fourth type of support required by users is tutorial help. This is particularly aimed at new users ofa tool and provides step-by-step instruction (perhaps by working through examples)of how to use the tool.
Each of these types of user support is complementary – they are required at different points in the user’s experience with the system and fulfill distinct needs.Within these types of required support there will be numerous pieces of informationthat the user wants – definitions, examples, known errors and error recovery infor-mation, command options and accelerators, to name but a few. Some of these maybe provided within the design of the interface itself but others must be includedwithin the help or support system. We will look at appropriate ways of supportingthese requirements. The different types of help required also imply the need for provision of different types of help system. In this chapter, we will look at a numberof different types of user support system and will try to determine how to design agood user support system.
A distinction is often made between help systems and documentation. Help sys-tems are problem oriented and specific, whereas documentation is system orientedand generic. This is an artificial distinction when considering the design of such sys-tems since the same principles apply to both, and indeed there is a lot of overlap
11.1

11.2 Requirements of user support 397
between the two. Instead of drawing a fixed line between the two, we will considerall types of user support in terms of the requirements they fulfill. We will also con-centrate on online support, although much of what is said will be helpful in design-ing paper documentation and tutorials. Before we look in more detail at the differentapproaches to providing user support, we will think for a while about the generalrequirements that the ideal help system should have.
REQUIREMENTS OF USER SUPPORT
If we were to design the ideal help system, what would it look like? This is a difficultquestion to answer, but we can point to some features that we might like our helpsystem to have. Not every help system will have all of these features, sometimes for good reason, but they are useful as benchmarks against which we can test the sup-port tools we design. Then, if our system does not have these features, it will be bydesign and not by accident! Some of these terms have also been used in Chapter 7 in discussing principles for usability. The use of the terms here is more constrainedbut related.
11.2.1 Availability
The user needs to be able to access help at any time during his interaction with thesystem. In particular, he should not have to quit the application he is working on in order to open the help application. Ideally, it should run concurrently with anyother application. This is obviously a problem for non-windowed systems if the helpsystem is independent of the application that is running. However, in windowed systems there is no reason why a help facility should not be available constantly, at the press of a button.
11.2.2 Accuracy and completeness
It may seem obvious to state that the assistance provided should be accurate andcomplete. But in an age where applications are frequently updated, and different versions may be active at the same time, it is not a trivial problem. However, if theassistance provided proves not to match the actual behavior of the system the userwill, at best, become disillusioned with the help facilities, and, at worst, get intodifficulties. As well as providing an accurate reflection of the current state of the system, help should cover the whole system. This completeness is very important if the help provided is to be used effectively. The designer cannot predict the parts ofthe system the user will need help with, and must therefore assume that all partsmust be supported. Finding no help available on a topic of interest is guaranteed tofrustrate the user.
11.2

398 Chapter 11 n User support
11.2.3 Consistency
As we have noted, users require different types of help for different purposes. Thisimplies that a help system may incorporate a number of parts. The help provided byeach of these must be consistent with all the others and within itself. Online helpshould also be consistent with paper documentation. It should be consistent in termsof content, terminology and style of presentation. This is also an issue where applica-tions have internal user support – these should be consistent across the system. It is unhelpful if a command is described in one way here and in another there, or ifthe way in which help is accessed varies across applications. In fact, consistency itselfcan be thought of as a means of supporting the user since it reinforces learning ofsystem usage.
11.2.4 Robustness
Help systems are often used by people who are in difficulty, perhaps because the system is behaving unexpectedly or has failed altogether. It is important then that the help system itself should be robust, both by correct error handling and pre-dictable behavior. The user should be able to rely on being able to get assistancewhen required. For these reasons robustness is even more important for help systemsthan for any other part of the system.
11.2.5 Flexibility
Many help systems are rigid in that they will produce the same help message regard-less of the expertise of the person seeking help or the context in which they are work-ing. A flexible help system will allow each user to interact with it in a way appropriateto his needs. This will range from designing a modularized interactive help system,through context-sensitive help, to a full-blown adaptive help system, which will inferthe user’s expertise and task. We will look at context-sensitive and adaptive help in more detail later in the chapter. However, any help system can be designed toallow greater interactivity and flexibility in the level of help presented. For example,help systems built using hypertext principles allow the user to browse through the help, expanding topics as required. The top level provides a map of the subjectscovered by the help and the user can get back to this level at any point. Althoughhypertext may not be appropriate for all help systems, the principle of flexible accessis a useful one.
11.2.6 Unobtrusiveness
The final principle for help system design is unobtrusiveness. The help system shouldnot prevent the user from continuing with normal work, nor should it interfere withthe user’s application. This is a problem at both ends of the spectrum. At one end thetextual help system on a non-windowed interface may interrupt the user’s work. Apossible solution to this if no alternative is available is to use a split-screen presentation.
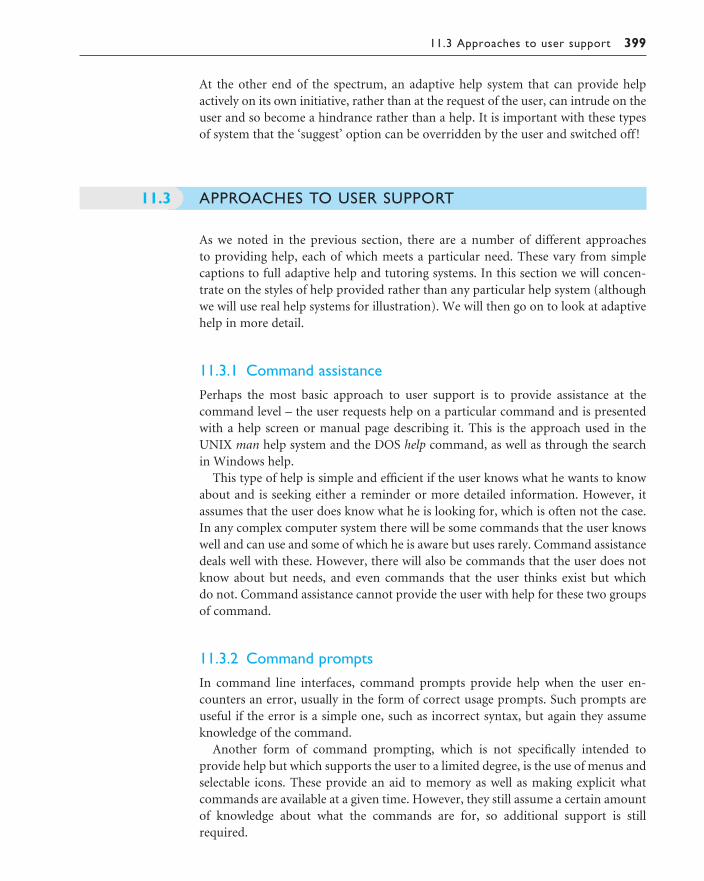
11.3 Approaches to user support 399
At the other end of the spectrum, an adaptive help system that can provide helpactively on its own initiative, rather than at the request of the user, can intrude on theuser and so become a hindrance rather than a help. It is important with these typesof system that the ‘suggest’ option can be overridden by the user and switched off !
APPROACHES TO USER SUPPORT
As we noted in the previous section, there are a number of different approaches to providing help, each of which meets a particular need. These vary from simplecaptions to full adaptive help and tutoring systems. In this section we will concen-trate on the styles of help provided rather than any particular help system (althoughwe will use real help systems for illustration). We will then go on to look at adaptivehelp in more detail.
11.3.1 Command assistance
Perhaps the most basic approach to user support is to provide assistance at the command level – the user requests help on a particular command and is presentedwith a help screen or manual page describing it. This is the approach used in theUNIX man help system and the DOS help command, as well as through the searchin Windows help.
This type of help is simple and efficient if the user knows what he wants to knowabout and is seeking either a reminder or more detailed information. However, itassumes that the user does know what he is looking for, which is often not the case.In any complex computer system there will be some commands that the user knowswell and can use and some of which he is aware but uses rarely. Command assistancedeals well with these. However, there will also be commands that the user does notknow about but needs, and even commands that the user thinks exist but which do not. Command assistance cannot provide the user with help for these two groupsof command.
11.3.2 Command prompts
In command line interfaces, command prompts provide help when the user en-counters an error, usually in the form of correct usage prompts. Such prompts areuseful if the error is a simple one, such as incorrect syntax, but again they assumeknowledge of the command.
Another form of command prompting, which is not specifically intended to provide help but which supports the user to a limited degree, is the use of menus andselectable icons. These provide an aid to memory as well as making explicit whatcommands are available at a given time. However, they still assume a certain amountof knowledge about what the commands are for, so additional support is stillrequired.
11.3

400 Chapter 11 n User support
11.3.3 Context-sensitive help
Some help systems are context sensitive. These range from those that have specificknowledge of the particular user (which we will consider under adaptive help) tothose that provide a simple help key or function that is interpreted according to thecontext in which it is called and will present help accordingly. Such systems are notnecessarily particularly sophisticated. However, they do move away from placing theonus on the user to remember the command. They are often used in menu-basedsystems to provide help on menu options. The Microsoft Office What’s This? option,tool-tips and some kinds of web page rollover are examples of this. When enabled,explanatory text is displayed when the cursor is over a screen widget (see Fig-ure 11.1). The invocation of help is interpreted in terms of the context in which it is made.
11.3.4 Online tutorials
Online tutorials allow the user to work through the basics of an application within a test environment. The user can progress at his own speed and can repeat parts of the tutorial if needed. He will also get a feel for how the application works byexperimenting with examples, albeit small ones, or by watching an automateddemonstration of how to perform a task.
Most online tutorials have no intelligence: they know nothing about the user and his previous experience, nor about the domain nor even about teaching style.Intelligent tutoring systems, which use similar techniques to adaptive help systems(see Section 11.4), attempt to address this issue but, apart from tutoring pro-gramming applications, are impractical as tutorials for most applications. Online
Figure 11.1 Context sensitive help on a web page using JavaScript rollovers

11.3 Approaches to user support 401
tutorials are therefore inflexible and often unforgiving. Some will fail to recognizethe correct answer to a problem, simply because it is not formatted as expected.
An alternative to the traditional online tutorial is to allow the user to learn the system by exploring and experimenting with a version with limited functionality.This is the idea behind the Training Wheels interface proposed by Carroll and his colleagues at IBM [60]. The user is presented with a version of the full interface inwhich some of the functionality has been disabled. He can explore the rest of the system freely but if he attempts to use the blocked functionality he is told that it is unavailable. This approach allows the user freedom to investigate the system as he pleases but without risk. It was found that new users spent more time using thissystem than they did the full version, spent less time recovering from errors andgained a better understanding of the operation of the system.
11.3.5 Online documentation
Online documentation effectively makes the existing paper documentation availableon computer. This makes the material available continually (assuming the machineis running!) in the same medium as the user’s work and, potentially, to a large num-ber of users concurrently. However, it can be argued that the type of (usually large)manuals that are appropriate as paper reference systems are less appropriate online.Paper is a familiar medium to most of us, and it is still the case that people preferreading text on paper than on a computer screen. We have developed quite sophis-ticated browsing skills with a paper medium and books are designed to provide cues to aid this, such as indexing, contents and page numbering, as well as havingphysical cues such as position in the book. These features are not reproduced in mostdocumentation systems. But paper manuals get lost easily, are constrained to onephysical location, and are invariably somewhere else when you want them. Onlinedocumentation is one way of avoiding these problems.
Documentation is designed to provide a full description of the system’s function-ality and behavior in a systematic manner. It provides generic information that is not directed at any particular problem. The amount of information contained inmanual pages is usually high, which can in itself create problems for the user – thereis too much detail and this effectively ‘masks’ the information the user wants to find.Perhaps for this reason, online documentation is often used by more expert users asa resource or reference, sometimes to enable them to advise less experienced users.The experts may not know the information off the top of their head but they knowwhere to find it and how to extract the details that are relevant to a given problem.
The use of hypertext can make online documentation more accessible to the inexperienced user (see Chapter 21 for more details of hypertext). Hypertext storestext in a network and connects related sections of text using selectable links. By clicking on a link, the user can go to a related subject instantly. Documentationstructured using hypertext supports browsing and usually includes different media(for example, diagrams and visual examples). An example is the help system shownin Figure 11.2, and most Windows applications’ help systems.

402 Chapter 11 n User support
However, this does suffer from a problem common to hypertext systems – navigation. The user can get lost within the hypertext and lose track of where he isand where he has been. A facility to return ‘home’ (to the top level) is usually pro-vided but this may mean that the user wastes considerable time restarting his search.
An alternative approach which attempts to simplify online documentation andmake it more accessible to novice and casual users is the minimal manual [58]. Thissimplifies the documentation by stripping out all but the bare essentials. The docu-mentation that remains is focussed towards the user’s tasks and emphasizes errorrecovery. Experiments with this manual showed that users learned to use the system40% faster than with the full manual.
Figure 11.2 Screen shot of the online documentation for Macromedia’sDreamweaver Ultradev version 4.0. Courtesy of Macromedia, Inc.
Simple guidelines for online documentation
n Use clear structure with headings to provide signposting.n Organize information according to user tasks.n Keep sentences short, to the point and jargon free. Use simple but unpatronizing language.n Set out procedures in order and number steps. Highlight important steps.n Use examples where possible.n Support searching via an index, contents, glossary and free search.n Include a list of error messages.n Include Frequently Asked Questions (FAQ) with clear answers.
(Adapted from Hobbs and Moore [177]).

11.3 Approaches to user support 403
11.3.6 Wizards and assistants
A wizard is a task-specific tool that leads the user through the task, step by step, usinginformation supplied by the user in response to questions along the way. They aredistinct from demonstrations in that they allow the user actually to complete thetask. For example, if the user wishes to format a resumé, the Microsoft Word resuméwizard will take him through a series of questions on the style and sections required,and ask him to enter some basic personal data. The wizard then creates a resumématching the parameters submitted.
Wizards are common in modern applications and provide support for task com-pletion. The user can perform quite complex tasks safely, quickly and accurately.This is particularly helpful in the case of infrequent tasks where the learning cost of doing the task manually may be prohibitive or where there are many steps thatmust be completed in a specific sequence. However, wizards can be unnecessarilyconstraining, they may not offer the user the options he wants, or they may requestinformation that the user does not have. A well-designed wizard will allow the userto move back a step as well as forward, will provide a progress indicator showing howmuch of the task is completed and how many steps remain, and will offer sufficientinformation to allow the user to answer the questions.
Another more recent development in user support is the assistant. Assistants aresoftware tools that monitor user behavior and offer suggestions or hints when theyrecognize familiar sequences. An early example of this is Eager (see also Chapter 4),a software agent that watches users as they work. When it notices the user repeatinga sequence of actions, a cat icon appears, suggesting the next action. The user canaccept or ignore the suggestion. Eager is unobtrusive and under user control at all times.
More recent examples of assistants have not been so successful. The MicrosoftOffice Assistant, ‘Clippy’, the infamous animated paper clip with the expressive eyebrows, was introduced in Office 97 but scrapped just a few years later with theintroduction of XP. The official reason is that XP features make the need for theOffice Assistant redundant, but the underlying reason is clear from Microsoft’s ownself-deprecating ‘Clippy’ homepage – the paper clip assistant was universally despised as irritating and unhelpful. So what went wrong? Remember the requirements for online help that we outlined at the beginning? One of these states that onlineassistance should be unobtrusive, and Clippy, with his long lists of suggestions, and continuous animations, was anything but. In addition, the suggestions madewere often inappropriate – ‘It looks like you’re writing a letter’ when you are in fact doing something completely different. Finally, the embodiment of the paperclip, though intended to be ‘cute’, was perceived by many frequent users as simplyirritating.
Microsoft Office Assistant may have retired but he provides an important lessonin online user support. Help must be under the user’s control and offers of helpshould be unobtrusive – it should not be up to the user to switch off the assistant or to close it down. The replacement Microsoft XP features such as smart tags havelearned this lesson. Smart tags provide rapid access to actions associated with a

404 Chapter 11 n User support
particular task (for instance formatting a table) much as Office Assistant did. Butsmart tags are indicated by a small icon, which appears near the object of interest,then disappears when the user performs another action. It is up to the user to selectthe smart tag if it is of interest at that point, but the icon is small and unobtrusiveenough to be ignored if not required. It is interesting that the tags are offeredthrough a functional iconic representation – it seems that assistants with ‘attitude’are out!
ADAPTIVE HELP SYSTEMS
In any large or complex computer system, users will be familiar with a subset of the available functionality, demonstrating expertise in some applications and having no experience with others, even to the point of being unaware of their existence. In addition, different users will have different needs and levels of under-standing. Adaptive help systems attempt to address these problems by adapting the help that they provide to the individual user who is making the request and by actively suggesting alternative courses of action of which the user may not beaware.
Adaptive help is a special case of a general class of interactive systems, known as intelligent systems. These include domain-specific expert systems, intelligenttutoring systems and general adaptive interfaces. We will concentrate in this discus-sion on adaptive help systems, since they are most relevant here, and incorporateaspects of the others, but it should be noted that many of the techniques we will lookat can be applied in these other systems. Since these represent a significant class ofinteractive system, we will cover the techniques in some detail.
Adaptive help systems operate by monitoring the activity of the user and con-structing a model of him. This may include a model of his experience, preferences,mistakes, or a combination of some or all of these. Using this knowledge, togetherwith knowledge of the domain in which the user is working, and, sometimes, generaladvisory or tutorial strategies, the adaptive help system will present help relevant to the user’s current task and suited to his experience. That at least is the theory. In practice it is not as simple as it sounds. First, the knowledge requirements of such a system are considerable, and data on interaction are particularly difficult to interpret. Secondly, there is the issue of control and initiative within the inter-action. Should the help system take an active role, removing some control from the user, and will the adaptivity confuse the user, if he perceives it as ‘shiftingground’? Thirdly, what exactly should be adapted and what will be the result of the adaptivity? Finally, what is the scope of the modeling and adaptivity: does itextend beyond the application level and, if so, how does it deal with the variation in expertise of a single user across an entire system? We will consider some of the developments and solutions, concentrating, in particular, on the knowledgerequirements.
11.4

11.4 Adaptive help systems 405
11.4.1 Knowledge representation: user modeling
Every interactive system that is built incorporates some model of the user for whomit is intended. In many systems this model is the designer’s view of the user and isimplicit within the design. The designer has in mind a ‘typical’ user, and builds theinterface accordingly. If the designer has done her homework this model can be quiteeffective. However, it does assume that all users are essentially the same and have thesame requirements.
Other systems allow the user to provide a model of himself around which the sys-tem will be configured. Simple examples of this are browser or email preferences thatcan adjust certain parameters of the system to the requirements of the user. Such sys-tems are called adaptable, since the user is able to adapt his own environment to suithis preferences. This increases the flexibility of the system but places the onus of thecustomization on the user. The result of this is that users have access only to thedefault system when they most need flexibility: that is, when they first start out. It isonly later that they have the know-how to construct the necessary model.
DESIGN FOCUS
It’s good to talk – help from real people
Although well-designed documentation and intelligent help systems are important, there is, perhaps,nothing like talking to a real person! As we noted in Section 11.3.5, expert users are often more likely to consult documentation, as there is a skill in knowing how it is organized. Studies of UNIX helpfound that novice users preferred not to look at man pages, instead they asked local experts who did look at the pages. This pattern of local experts has been found across all types of systems in manyenvironments.
In web-based systems there are many ways of linking more static documentation with dynamic inter-personal support. There may be a link from the electronic to the personal: technical support sites oftenhave some sort of email query form for when you cannot find what you want online. There may alsobe inter-personal to electronic links: a telephone support desk may email you a URL to guide you tosuitable information.
Other users of a product can also be a source of help, and many product sites, especially open-sourceproducts, include some way for users to submit their tips or advice. For example, the online manualpages for the PHP web scripting language have for each function a series of user tips that you can addto yourself. There are important issues of community culture here as the tips are generally useful anddo not include extraneous comments.
User community and manufacturers’ technical support may be integrated. For example, Sun’s Javadeveloper support site includes a community area with online user forums and live chat with Sun staff,authors and other experts.
See www.php.net/ and http://developer.java.sun.com/developer/community/
406 Chapter 11 n User support
The third approach to providing the system with a model of the user, and the one used in adaptive help systems, is to have the system construct and maintain a model of the user based on data gleaned from monitoring the user’s interaction.This model can then be consulted when required. This automatic approach to usermodeling also has the problem of the setup time required, during which time theuser has a default system, but the onus to build the model is taken away from theuser. Various suggestions have been made as to how to deal with the setup time, including getting the user to choose an initial default model, and building a modelbased on pre-use activity, such as game playing. The former is problematic in that again it makes the user decide on a model at a time when he may not havesufficient experience to do so effectively. The latter may not produce a model that istransferable to the actual domain. The most common approach is still to provide abasic start-up default model and concentrate on rapidly updating this for the actualuser. The default model may be based on experimental or observational resultsgleaned in evaluation.
So how are user models constructed and maintained? There are a number ofapproaches. Some quantify user experience or classify users into stereotypes; somecompare the user’s behavior with some norm; others maintain a catalog of knownerrors and compare user actions to these.
Quantification
This is one of the most simple approaches to user modeling. The system recognizesa number of levels of expertise, which it will respond to in different ways. The useris placed on one of these levels, and moves between them, based on a quantitativemeasure of his expertise at that time. Different activities are given weightings, andthe user is scored according to the weightings of the activities he takes part in. If thescore exceeds a certain threshold, the user is moved to a different expertise level andthe system adapts accordingly.
This approach is simple and measures the user at a coarse level of granularity.However, it is effective for simple adaptivity. For example, this method was used by Mason to adapt the presentation of command prompts to the user’s level of experience [228]. The system used a set of rules, which dictated when a user’s levelof expertise changed. For example,
Move from Level 1 to Level 2If
the system has been used more than twice (0.25)commands x and y have been used effectively (0.20)help has not been accessed this session (0.25)the system has been used in the last 5 days
Such a model can only give a rough approximation of the user’s expertise, but at thesame time requires little analysis to extract the required information from the systemlogs. This approach can be used effectively in adaptive tutorials.

11.4 Adaptive help systems 407
Stereotypes
Another approach to automatic user modeling is to work with stereotypes. Ratherthan attempting to build a truly individual model of the user, the system classifies the user as a member of a known category of users or stereotype. Stereotypes arebased on user characteristics and may be simple, such as making a distinctionbetween novice and expert users, or more complex, for example building a com-pound stereotype based on more than one piece of information. There are severalways of building stereotypes. One is to use information such as command use anderrors to categorize different types of user and then to use rules to identify the stereo-type to which the user belongs. An alternative method is to use a machine learningapproach, such as neural networks, to learn examples of different types of userbehavior (from actual logs) and then to classify users according to their closeness tothe examples previously learned. Stereotypes are useful in that they represent theuser at the level of granularity at which most adaptive help systems work, and do not attempt to produce a sophisticated model, which will not be fully utilized. Afterall, if the only information that is available about the user at any time is how he is interacting with the system, it is not possible to infer very much about the userhimself. However, what can be inferred may be exactly what is required to providethe necessary level of help.
Overlay models
One of the most common techniques used is the overlay model. Here an idealizedmodel, often of an expert user, is constructed and the individual user’s behaviorcompared with it. The resulting user profile may represent either the commonalitybetween the two models or the differences. An advantage of this style of modeling is that it allows a certain degree of diagnostic activity on the part of the system. Notonly is the system aware of what the user is doing, but it also has a representation of optimal behavior. This provides a benchmark against which to measure the user’sperformance, and, if the user does not take the optimal course of action, gives anindication of the type of help or hint that is required.
A similar approach is used in error-based models where the system holds a recordof known user errors and the user’s actual behavior is compared with these. If this behavior matches an error in the catalog, then remedial action can be taken.Potential errors may be matched when partially executed and help given to enablethe user to avoid the error, or recover more quickly. These types of modeling are alsouseful in intelligent tutoring systems where diagnostic information is required inorder to decide how to proceed with the tutorial.
11.4.2 Knowledge representation: domain and task modeling
All adaptive help systems must have some knowledge of the system itself, in order toprovide relevant and appropriate advice. This knowledge may include commanduse, common errors and common tasks. However, some help systems also attempt

408 Chapter 11 n User support
to build a model of the user’s current task or plan. The motivation behind this is that the user is engaged in a particular problem-solving task and requires help at that level. Generic help, even adapted to the expertise and preference of the user, is not enough.
One common approach to this problem is to represent user tasks in terms of thecommand sequences that are required to execute them. As the user works, the com-mands used are compared with the stored task sequences and matched sequences arerecovered. If the user’s command sequence does not match a recognized task, help is offered. This approach was used in the PRIAM system [85].
Although an attractive idea, task recognition is problematic. In large domains it is unlikely that every possible method for reaching every possible user goal could be represented. Users may reasonably approach a task in a non-standard way, andinferring the user’s intention from command usage is not a trivial problem. As wesaw in Chapter 9, system logs do not always contain sufficient information for ahuman expert to ascertain what the user was trying to do. The problem is far greaterfor a computer.
Assistants and agents use task recognition at a basic level to monitor user beha-vior and provide hints and macros when a familiar or repeated sequence is noticed(see Section 11.3.6).
11.4.3 Knowledge representation: modeling advisory strategy
A third area of knowledge representation, which is sometimes included in adaptivehelp, is modeling advisory or tutorial strategies. Providing a help system with thistype of information allows it not only to select appropriate advice for the user butalso to use an appropriate method of giving advice.
As we have already seen, people require different types of help depending on their knowledge and circumstances. These include reminders, task-specific help and tutorial help. There is evidence to indicate that human experts follow differentstrategies when advising colleagues [293]. These include inferring the intention ofthe person seeking help and advising at that level or providing a number of solutionsto the person’s problem. Alternatively they may attempt to place the problem in acontext and provide a ‘sample solution’ in that context.
Few adaptive help systems have attempted to model advisory strategy, and thosethat do provide a limited choice. Ideally, it would be useful if the help system had access to a number of alternative strategies and was able to choose an appro-priate style of guidance in each case. However, this is very ambitious – too little is known about what makes a guidance strategy appropriate in which contexts.However, it is important that designers of adaptive help systems give some thoughtto advisory strategies, if only to make an informed choice about the strategy that is to be used.
The EuroHelp adaptive help system adopts a model of teacher–pupil, in which thesystem is envisaged as a teacher watching the user (pupil) work and offering adviceand suggestions in an ‘over-the-shoulder’ fashion [126, 44]. In this case, instruction
11.4 Adaptive help systems 409
may be high to begin with but will become less obtrusive as the user finds his feet.The user is able to question the system at any point and responses are given in termsof the current context.
This mixed-initiative dialog is also used in the Activist/Passivist help system,which will accept requests from the user and actively offer suggestions and hints, par-ticularly about areas of functionality that it infers the user is unfamiliar with [133].
11.4.4 Techniques for knowledge representation
All of the modeling approaches described rely heavily on techniques for knowledgerepresentation from artificial intelligence. This is a whole subject in its own right andthere is only room to outline the methods here (although some of the techniques are based on theories of memory and problem solving as discussed in Chapter 1).The interested reader is also referred to the text on artificial intelligence in the recommended reading list.
There are four main groups of techniques used in knowledge representation for adaptive help systems: rule based, frame based, network based and examplebased. Note that these general techniques are often combined to produce hybrid systems.
Rule-based techniques
Knowledge is represented as a set of rules and facts, which are interpreted using some inference mechanism. Predicate logic provides a powerful mechanism for representing declarative information, while production rules represent proceduralinformation. Rule-based techniques can be used in relatively large domains and can represent actions to perform as well as knowledge for inference. A user modelimplemented using rule-based methods may include rules of the form
IFcommand is EDIT file1
ANDlast command is COMPILE file1
THENtask is DEBUGaction is describe automatic debugger
Frame-based techniques
Frame-based systems are used to represent commonly occurring situations anddefault knowledge. A frame is a structure that contains labeled slots, representingrelated features. Each slot can be assigned a value or alternatively be given a defaultvalue. User input is matched against the frame values and a successful match maycause some action to be taken. They are useful in small domains. In user modelingthe frame may represent the current profile of the user:

410 Chapter 11 n User support
UserExpertise level: noviceCommand: EDIT file1Last command: COMPILE file1Errors this session: 6Action: describe automatic debugger
Network-based techniques
Networks represent knowledge about the user and system in terms of relationshipsbetween facts. One of the most common examples is the semantic network. The net-work is a hierarchy and children can inherit properties associated with their parents.This makes it a relatively efficient representation scheme and is useful for linkinginformation clearly. Networks can also be used to link frame-based representations.
The compile example could be expanded within a semantic network:
CC is an instance of COMPILECOMPILE is a commandCOMPILE is related to DEBUGCOMPILE is related to EDITAutomatic debugger facilitates DEBUG
Example-based techniques
Example-based techniques represent knowledge implicitly within a decision struc-ture of a classification system. This may be a decision tree, in the case of an induct-ive learning approach such as ID3 [298], or links in a network in the case of neuralnetworks. The decision structure is constructed automatically based on examplespresented to the classifier. The classifiers effectively detect recurrent features withinthe examples and are able to use these to classify other input. An example may be atrace of user activity:
EDIT file1COMPILE file1
This would be trained as an example of a particular task, for example DEBUG.
11.4.5 Problems with knowledge representation and modeling
Knowledge representation is the central issue in adaptive help systems, but it is notwithout its problems. Knowledge is often difficult to elicit, particularly if a domainexpert is not available. This is particularly true of knowledge of user behavior, owingto its variability. It is especially difficult to ensure completeness and correctness of the knowledge base in these circumstances. Even if knowledge is available, theamount of knowledge required is substantial, making adaptive help an expensiveoption.

11.4 Adaptive help systems 411
A second problem is interpreting the information appropriately. Although theknowledge base can be provided with detailed knowledge of the expected contextsand the domain in advance, during the interaction the only information that is available is the system log of the user’s actions. As we saw in Chapter 9, interpretingsystem logs is very difficult because it is stripped of much context and there is noaccess to the user’s intention or goal (except by inference). However, this data is not arbitrary and does contain recurrent patterns of activity, which can be used withcare to infer task sequences and the like. However, it should be realized that theserepresent approximations only.
11.4.6 Other issues
Other issues that should be considered in designing an adaptive help system are initiative, effect and scope.
Initiative A major issue in adaptive help system design is that of initiative and control: should the user retain complete control over the system; should the system direct the interaction; or should a mixed dialog be supported? Systemactivity can be intrusive to the user, particularly if badly handled. No user wantsto be constantly told he is not performing a task in the most efficient manner!However, we know that there are normally large sections of system functional-ity of which the user is simply not aware. Without some form of system activitythis problem will not be addressed. The solution seems to be to encourage mixed initiative in the interaction. The user should be able to question the sys-tem at any time, and the system can offer hints to the user. However, the lattershould be offered sensitively and the user always allowed to continue as before if he wishes.
Effect Another issue that the designer should consider is the effect of the modeling and adaptivity: what exactly is going to be adapted and what informa-tion is needed to do this? All too often modeling systems use vast resources pro-ducing a detailed profile of the user, the bulk of which is never used. Modeling,whether of the user, the domain or strategies, should be directed towards therequirements of the help system. For example, if it is simply to offer different helpto novices and experts, the system does not need details of task execution. Suchconsiderations may reduce the overheads of adaptive help systems and makethem more viable.
Scope Finally, the designer must consider the scope of the help: is it to be offeredat an application level or system wide? The latter may be the ideal but is muchmore complex. If users are to be modeled at a system level, the model should take into account the levels of activity in which they are engaged and be able todistinguish actions at an application level. In many systems it would also have tocope with interleaving of activities and concurrent execution. Each of these makesthe modeling activity more complex.

412 Chapter 11 n User support
DESIGNING USER SUPPORT SYSTEMS
There are many ways of providing user support and it is up to the designer to decidewhich is most appropriate for any given system. However, there are a number ofthings which the designer should take into account. First, the design of user supportshould not be seen as an ‘add-on’ to system design. Ideally, the help system shouldbe designed integrally with the rest of the system. If this is done, the help system will be relevant and consistent with the rest of the system. The same modeling andanalytic techniques (for example, task analysis, see Chapter 15) used to design thesystem can guide the design of support material as well. Secondly, the designershould consider the content of the help and the context in which it will be usedbefore the technology that will be required. Obviously, available technology is animportant issue. However, concentrating on the task and the user will help to clarifythe type of help required within the constraints of technical resources. Viewing theprocess in reverse may prevent the designer seeing beyond the technology she isfamiliar with. Bearing in mind the expected user requirements, the designer of helpalso needs to make decisions about how the help will be presented to the user andhow this will be affected by implementation issues.
11.5.1 Presentation issues
How is help requested?
The first decision the designer must make is how the user will access help. There area number of choices. Help may be a command, a button, a function which can beswitched on or off, or a separate application. A command (usually) requires the userto specify a topic, and therefore assumes some knowledge, but may fit most consist-ently within the rest of the interface. A help button is readily accessible and does notinterfere with existing applications, but may not always provide information specificto the user’s needs. However, if the help button is a keyboard or mouse button, it cansupport context sensitivity, as we saw earlier. The help function is flexible since it can be activated when required and disabled when not. The separate applicationallows flexibility and multiple help styles but may interfere with the user’s currentapplication.
How is help displayed?
The second major decision that the designer must make is how the user will view thehelp. In a windowed system it may be presented in a new window. In other systemsit may use the whole screen or part of the screen. Alternatively, help hints andprompts can be given in pop-up boxes or at the command line level. The presenta-tion style that is appropriate depends largely on the level of help being offered and
11.5

11.5 Designing user support systems 413
the space that it requires. Obviously, opening a manual page line by line is unhelp-ful, as is taking over the whole screen to give the user a hint. Some active help sys-tems provide visual cues when they have a suggestion to make (for example, an iconmay be highlighted) – this gives the user the option of taking the suggestion withoutforcing him to abandon or interrupt his work. Again this decision should takeaccount of the rest of the design, and aim to provide consistency.
Effective presentation of help
Help screens and documentation should be designed in much the same way as aninterface should be designed, taking into account the capabilities and task require-ments of the user. No matter what technology is used to provide support, there aresome principles for writing and presenting it effectively. Help and tutorial materialshould be written in clear, familiar language, avoiding jargon as much as possible. Ifpaper manuals and tutorials exist, the terminology should be consistent betweenthese and the online support material. Instructional material requires instructionallanguage, and a help system should tell the user how to use the system rather thansimply describing the system. It should not make assumptions about what the userknows in advance. For example, a help message on the use of windows might read
To close the window, click on the box in the top right-hand corner of thewindow.
rather than
Windows can be closed by clicking on the box in the top right-hand corner ofthe window.
An exception to this is in documentation where the intention is not only toinstruct the user in how to use the system but to record a full description of the sys-tem’s functionality. However, documentation should be presented so that informa-tion is readily accessible, and should present both instructional and descriptiveinformation clearly. The physical layout of documentation can make a difference toits usability. Large blocks of text are difficult to read on screen, for example. This canbe alleviated by breaking the documentation into clear logical sections, or by usingtechnology such as hypertext to organize it. A useful style is to provide a summary ofthe key information prominently, with further information available if required.This can be done either by devising a hierarchical help system where each layer in thehierarchy provides increasing detail, or simply by using layout carefully. An indexcan be used as a summary of available topics but should be organized to reflect thefunctional relationships between the subjects rather than their alphabetic ordering.Consistency is also important here – each topic in the documentation should bedescribed using the same format so that the user knows where to look for a particu-lar type of information. Documentation and help may contain definitions, descrip-tions, examples, details of error messages, options and instructions. These should beclearly recognizable.
414 Chapter 11 n User support
11.5.2 Implementation issues
Alongside the presentation issues the designer must make implementation decisions.Some of these may be forced by physical constraints, others by the choices maderegarding the user’s requirements for help. We have already considered how helpmay be requested and how it appears to the user. Obviously each of these decisionsinvolves implementation questions: will help be an operating system command, a meta-command or an application? What physical constraints does the machineimpose in terms of screen space, memory capacity and speed? Speed is a very import-ant consideration, since an unacceptably slow response time is liable to make the system unusable no matter how well it has been designed. It is better to provide a simple help facility that responds quickly than a sophisticated, intelligent one thattakes minutes to provide a solution.
Another issue the designer must decide is how the help data is to be structured: ina single file, a file hierarchy, a database? Again this will depend on the type of helpthat is required, but any structure should be flexible and extensible – systems are notstatic and new topics will inevitably need to be added to the help system. The datastructure used will, to an extent, determine the type of search or navigation strategythat is provided. Will users be able to browse through the system or only request helpon one topic at a time? The user may also want to make a hard copy of part of thehelp system to study later (this is particularly true of manuals and documentation).Will this facility be provided as part of the support system?
Finally, the designer should consider the authors of help material as well as itsusers. It is likely that, even if the designer writes the initial help texts, these will beextended by other authors at different times. Clear conventions and constraints onthe presentation and implementation of help facilitate the addition of new material.
SUMMARY
This chapter has been concerned with user support in the form of help and documentation. No interactive system of any complexity is so intuitive that the usernever requires help. Help should therefore be an integral part of the design. Usersrequire different types of help, depending on the context and circumstances, and theuser support facilities should support these. Different styles of help support differentrequirements and different types of user. We have considered several types of helpsystem, including adaptive user support. It is important to select a support style and design user support with the user in mind, just as the design of the system is usercentered. In particular, the presentation of help should take into account usabilityprinciples, and the language should be clear and instructional.
11.6

Exercises 415
EXERCISES
11.1 Write a manual page for making a cup of coffee. Assume your user has no experiencebut will recognize a cup, a kettle, a spoon, etc. Swap your manual with a partner. Does your partner’s manual give you sufficient instruction to make the cup of coffee? Discuss improvementswith your partner and agree on a final version of the manual.
11.2 Find a computer application that you have never used before. Attempt to learn to use it usingonly the online support. Is there enough information to allow you to use the application effect-ively? Is the information easy to find? What improvements (if any) would you suggest?
11.3 What knowledge is needed to build an adaptive help system? Which do you think is most difficultto provide and why?
11.4 Look at as many online support systems as you can. Which do you find most useful and why? Try to assess them using the requirements discussed in Section 11.2.
11.5 Using your library facilities and the world wide web, investigate the benefits and limitations ofadaptive help systems. What examples of adaptive and adaptable help are available and how useful are they?
11.6 What are the four main types of help that users may require? For each type, give an example ofa situation in which it would be appropriate.
11.7 Which usability principles are especially important in the design of help systems, and why?
11.8 Describe some of the different approaches to providing user support systems, with examples.
11.9 Applications are often supported by an online version of the paper documentation; in some casesthere is no paper documentation at all.
What are the advantages of online documentation? What are the disadvantages, and how can theybe overcome?
11.10 Discuss the presentation issues involved in the design of effective and relevant help systems.
416 Chapter 11 n User support
RECOMMENDED READING
R. C. Houghton, Online help systems: a conspectus, Communications of the ACM,Vol. 27, No. 2, February 1984.A good review of non-adaptive help systems, most of which is still relevant today.
C. Turk and J. Kirkman, Effective Writing, 2nd edition, E. and F. N. Spon, 1989.An excellent introduction to technical writing, including writing instructionalmaterial.
E. Rich and K. Knight, Artificial Intelligence, 2nd edition, McGraw-Hill, 1991.A detailed text on artificial intelligence techniques. Readers should select appro-priate sections on knowledge representation.
Clippy’s home page: www.microsoft.com/Office/clippy/.An interesting case study on how help can fail – and how failure can be turned toadvantage. Accessed March 2003.

MODELS AND THEORIES
In all engineering disciplines, the designer recruits a selectionof models to contribute to the design process. If we werebuilding a new office block, for example, then we would usemodels of air circulation to design the ventilation system,structural models for the fabric and possibly social models forthe detailed design of the office layout.
Models are used in other disciplines too. We may analyzethe structure of a piece of music and decide that it is a rondo,or say that a poem is in sonnet form. Further, we may delib-erately set out to write a sonnet, thus imposing the modelupon the creative process. Craft is the art of design within con-straint, and models help to formulate the constraints.
The chapters in Part 3 describe a range of models that canbe used during the interface design process. Just as in thedesign of the office block several different types of model arerequired for different aspects of the building, so in interfacedesign we would expect to use a whole selection of comple-mentary methods.
Chapter 12 considers models with psychological or cognit-ive origins, where the emphasis is on formulating aspects ofuser behavior such as goal formation and problem solving.Chapter 13 discusses socio-technical models that attempt todescribe the user within a social and organizational context,while Chapter 14 looks at models of collaboration and groupinteraction. Chapter 15 describes task analysis techniques fordetermining the relevant actions a user performs in some workdomain. Chapter 16 is concerned with dialog description tech-niques used to specify and analyze the communication betweenuser and system. Chapter 17 describes the use of general math-ematical notations used in software engineering to specify and analyze abstract descriptions of interactive systems, andChapter 18 extends these notations to model rich interactions.
P A R T
3

COGNITIVE MODELS
OV E RV I E W
Cognitive models represent users of interactive systems.
n Hierarchical models represent a user’s task and goalstructure.
n Linguistic models represent the user–system grammar.
n Physical and device models represent human motorskills.
n Cognitive architectures underlie all of these cognitivemodels.
12
420 Chapter 12 n Cognitive models
INTRODUCTION
The techniques and models in this chapter all claim to have some representation ofusers as they interact with an interface; that is, they model some aspect of the user’sunderstanding, knowledge, intentions or processing. The level of representation dif-fers from technique to technique – from models of high-level goals and the results ofproblem-solving activities, to descriptions of motor-level activity, such as keystrokesand mouse clicks. The formalisms have largely been developed by psychologists, orcomputer scientists, whose interest is in understanding user behavior.
One way to classify the models is in respect to how well they describe features ofthe competence and performance of the user. Quoting from Simon [323]:
Competence models tend to be ones that can predict legal behaviour sequences but generally do this without reference to whether they could actually be executed by users.In contrast, performance models not only describe what the necessary behavioursequences are but usually describe both what the user needs to know and how this isemployed in actual task execution.
Competence models, therefore, represent the kinds of behavior expected of a user,but they provide little help in analyzing that behavior to determine its demands on the user. Performance models provide analytical power mainly by focussing onroutine behavior in very limited applications.
Another useful distinction between these models is whether they address the acquisi-tion or formulation of a plan of activity or the execution of that plan. Referring back to the interaction framework presented in Chapter 3, this classification wouldmean that some models are concerned with understanding the User and his associ-ated task language while others are concerned with the articulation translationbetween that task language and the Input language. The presentation of the cognitivemodels in this chapter follows this classification scheme, divided into the followingcategories:
n hierarchical representation of the user’s task and goal structuren linguistic and grammatical modelsn physical and device-level models.
The first category deals directly with the issue of formulation of goals and tasks. The second deals with the grammar of the articulation translation and how it isunderstood by the user. The third category again deals with articulation, but at thehuman motor level instead of at a higher level of human understanding.
Architectural assumptions about the user are needed in any of the cognitive modelsdiscussed here. Some of the more basic architectural assumptions were covered inChapter 1, such as the distinction between long- and short-term memory. After dis-cussing models in the three categories above, we will describe two additional cognitivearchitectures and how they are relevant for analyzing interactive system design.
Many of these nominally cognitive models have a rather computational flavor.This reflects the way that computational analogies are often used in cognitive
12.1

12.2 Goal and task hierarchies 421
psychology. The similarity between the language describing the user and thatdescribing the computer has some advantages and some dangers. On the positiveside it makes communication and analysis of the combined human–computer sys-tem easier. For instance, cognitive complexity theory (described later) producesmodels of both user goals and the system grammar, and can reason about their inter-action. On the other hand, there is a danger that this will encourage a mechanisticview of the user.
GOAL AND TASK HIERARCHIES
Many models make use of a model of mental processing in which the user achievesgoals by solving subgoals in a divide-and-conquer fashion. We will consider twomodels, GOMS and CCT, where this is a central feature. However, we will see sim-ilar features in other models, such as TAG (Section 12.3.2) and when we considertask analysis techniques (Chapter 15).
Imagine we want to produce a report on sales of introductory HCI textbooks. To achieve this goal we divide it into several subgoals, say gathering the datatogether, producing the tables and histograms, and writing the descriptive material.Concentrating on the data gathering, we decide to split this into further subgoals:find the names of all introductory HCI textbooks and then search the book salesdatabase for these books. Similarly, each of the other subgoals is divided up into further subgoals, until some level of detail is found at which we decide to stop. Wethus end up with a hierarchy of goals and subgoals. The example can be laid out to expose this structure:
produce report
gather data
. find book names
. . do keywords search of names database
<<further subgoals>>
. . sift through names and abstracts by hand
<<further subgoals>>
. search sales database
<<further subgoals>>
layout tables and histograms
<<further subgoals>>
write description
<<further subgoals>>
Various issues arise as one attempts such analyses of computer use.Where do we stop? We can go on decomposing tasks until we get down to the
individual hand and eye movements of the user, or we can stop at a more abstractlevel. Where do we start? In a similar way, we can start our analyses at different
12.2

422 Chapter 12 n Cognitive models
points in the hierarchy of goals. At the extreme we could extend our analysis to largerand larger goals: ‘light hob’ is a subgoal of ‘boil peas’ and so on to goals such as ‘havemy dinner’, ‘feed’ and ‘stay alive’.
These two questions are issues of granularity, and both of the methods describedbelow leave this to some extent in the hands of the designer. Different design issuesdemand different levels of analysis. However, both methods operate at a relativelylow level; neither would attempt to start with such an abstract goal as ‘produce areport’ which will involve real creativity and difficult problem solving. Instead theyconfine themselves to more routine learned behavior. This most abstract task is referred to as the unit task. The unit task does not require any problem-solvingskills on the part of the user, though it frequently demands quite sophisticated problem-solving skills on the part of the designer to determine them.
What do we do when there are several ways of solving a problem, or if the solu-tions to two subgoals interact? Users will often have more than one way to achieve a goal and there must be some way of representing how they select between com-peting solutions.
Another important issue has to do with the treatment of error. Users are not perfect. A goal hierarchy may show how the perfect user would achieve a goal, butwhat can it say about difficulties the user may have along the way? In general, pre-diction of error behavior is poor amongst these hierarchical modeling techniques,though some (cognitive complexity theory (CCT), for example) can represent errorbehavior.
12.2.1 GOMS
The GOMS model of Card, Moran and Newell is an acronym for Goals, Operators,Methods and Selection [56]. A GOMS description consists of these four elements:
Goals These are the user’s goals, describing what the user wants to achieve.Further, in GOMS the goals are taken to represent a ‘memory point’ for the user,from which he can evaluate what should be done and to which he may returnshould any errors occur.
Operators These are the lowest level of analysis. They are the basic actions that the user must perform in order to use the system. They may affect the system (for example, press the ‘X’ key) or only the user’s mental state (for example, readthe dialog box). There is still a degree of flexibility about the granularity of operators; we may take the command level ‘issue the SELECT command’ or bemore primitive: ‘move mouse to menu bar, press center mouse button . . .’.
Methods As we have already noted, there are typically several ways in which a goalcan be split into subgoals. For instance, in a certain window manager a currentlyselected window can be closed to an icon either by selecting the ‘CLOSE’ optionfrom a pop-up menu, or by hitting the ‘L7’ function key. In GOMS these two goaldecompositions are referred to as methods, so we have the CLOSE-METHOD andthe L7-METHOD:
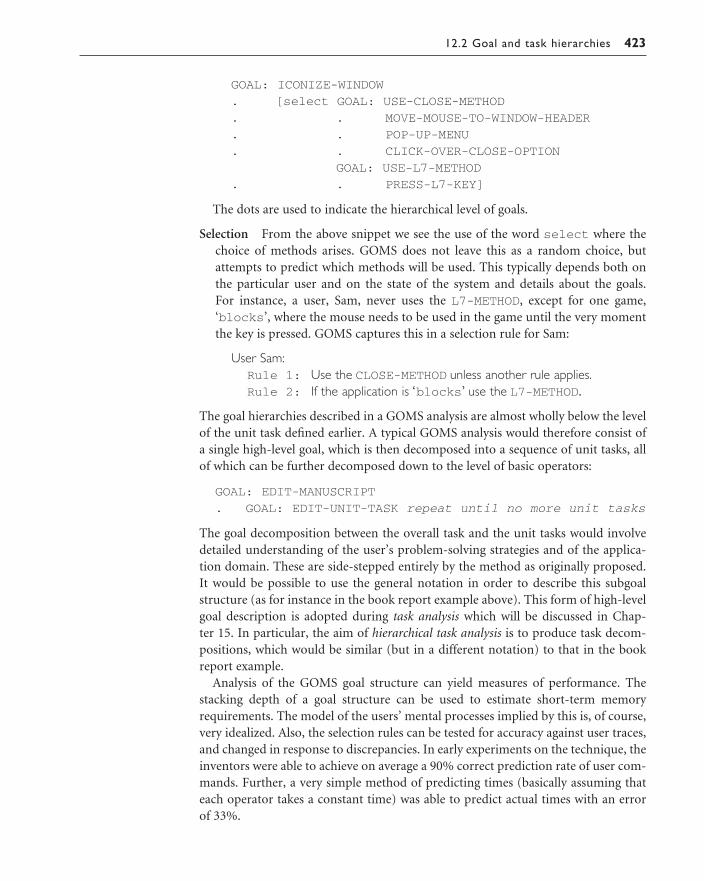
12.2 Goal and task hierarchies 423
GOAL: ICONIZE-WINDOW
. [select GOAL: USE-CLOSE-METHOD
. . MOVE-MOUSE-TO-WINDOW-HEADER
. . POP-UP-MENU
. . CLICK-OVER-CLOSE-OPTION
GOAL: USE-L7-METHOD
. . PRESS-L7-KEY]
The dots are used to indicate the hierarchical level of goals.
Selection From the above snippet we see the use of the word select where thechoice of methods arises. GOMS does not leave this as a random choice, butattempts to predict which methods will be used. This typically depends both onthe particular user and on the state of the system and details about the goals. For instance, a user, Sam, never uses the L7-METHOD, except for one game,‘blocks’, where the mouse needs to be used in the game until the very momentthe key is pressed. GOMS captures this in a selection rule for Sam:
User Sam:Rule 1: Use the CLOSE-METHOD unless another rule applies.Rule 2: If the application is ‘blocks’ use the L7-METHOD.
The goal hierarchies described in a GOMS analysis are almost wholly below the levelof the unit task defined earlier. A typical GOMS analysis would therefore consist ofa single high-level goal, which is then decomposed into a sequence of unit tasks, allof which can be further decomposed down to the level of basic operators:
GOAL: EDIT-MANUSCRIPT
. GOAL: EDIT-UNIT-TASK repeat until no more unit tasks
The goal decomposition between the overall task and the unit tasks would involvedetailed understanding of the user’s problem-solving strategies and of the applica-tion domain. These are side-stepped entirely by the method as originally proposed.It would be possible to use the general notation in order to describe this subgoalstructure (as for instance in the book report example above). This form of high-levelgoal description is adopted during task analysis which will be discussed in Chap-ter 15. In particular, the aim of hierarchical task analysis is to produce task decom-positions, which would be similar (but in a different notation) to that in the bookreport example.
Analysis of the GOMS goal structure can yield measures of performance. Thestacking depth of a goal structure can be used to estimate short-term memoryrequirements. The model of the users’ mental processes implied by this is, of course,very idealized. Also, the selection rules can be tested for accuracy against user traces,and changed in response to discrepancies. In early experiments on the technique, theinventors were able to achieve on average a 90% correct prediction rate of user com-mands. Further, a very simple method of predicting times (basically assuming thateach operator takes a constant time) was able to predict actual times with an error of 33%.
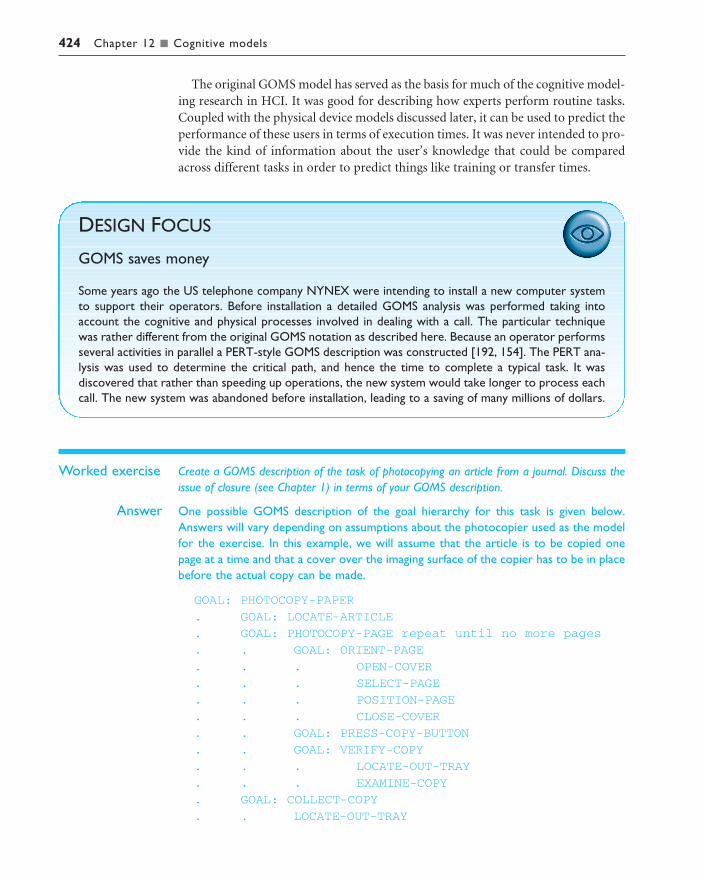
424 Chapter 12 n Cognitive models
The original GOMS model has served as the basis for much of the cognitive model-ing research in HCI. It was good for describing how experts perform routine tasks.Coupled with the physical device models discussed later, it can be used to predict theperformance of these users in terms of execution times. It was never intended to pro-vide the kind of information about the user’s knowledge that could be comparedacross different tasks in order to predict things like training or transfer times.
DESIGN FOCUS
GOMS saves money
Some years ago the US telephone company NYNEX were intending to install a new computer systemto support their operators. Before installation a detailed GOMS analysis was performed taking intoaccount the cognitive and physical processes involved in dealing with a call. The particular techniquewas rather different from the original GOMS notation as described here. Because an operator performsseveral activities in parallel a PERT-style GOMS description was constructed [192, 154]. The PERT ana-lysis was used to determine the critical path, and hence the time to complete a typical task. It was discovered that rather than speeding up operations, the new system would take longer to process eachcall. The new system was abandoned before installation, leading to a saving of many millions of dollars.
Worked exercise Create a GOMS description of the task of photocopying an article from a journal. Discuss theissue of closure (see Chapter 1) in terms of your GOMS description.
Answer One possible GOMS description of the goal hierarchy for this task is given below.Answers will vary depending on assumptions about the photocopier used as the modelfor the exercise. In this example, we will assume that the article is to be copied onepage at a time and that a cover over the imaging surface of the copier has to be in placebefore the actual copy can be made.
GOAL: PHOTOCOPY-PAPER
. GOAL: LOCATE-ARTICLE
. GOAL: PHOTOCOPY-PAGE repeat until no more pages
. . GOAL: ORIENT-PAGE
. . . OPEN-COVER
. . . SELECT-PAGE
. . . POSITION-PAGE
. . . CLOSE-COVER
. . GOAL: PRESS-COPY-BUTTON
. . GOAL: VERIFY-COPY
. . . LOCATE-OUT-TRAY
. . . EXAMINE-COPY
. GOAL: COLLECT-COPY
. . LOCATE-OUT-TRAY

12.2 Goal and task hierarchies 425
. . REMOVE-COPY (outer goal satisfied!)
. GOAL: RETRIEVE-JOURNAL
. . OPEN-COVER
. . REMOVE-JOURNAL
. . CLOSE-COVER
The closure problem which appears in this example occurs when the copy of the articleis removed from the photocopier out tray, satisfying the overall goal for the task. In theabove description, however, the original journal article is still on the imaging surface ofthe photocopier, and the cover is closed. The user could easily forget to remove thejournal. How could the photocopying procedure be revised to eliminate this prob-lem? One answer is to force the goal RETRIEVE-JOURNAL to be satisfied beforeCOLLECT-COPY.
12.2.2 Cognitive complexity theory
Cognitive complexity theory, introduced by Kieras and Polson [199], begins with the basic premises of goal decomposition from GOMS and enriches the model toprovide more predictive power. CCT has two parallel descriptions: one of the user’sgoals and the other of the computer system (called the device in CCT). The descrip-tion of the user’s goals is based on a GOMS-like goal hierarchy, but is expressed primarily using production rules. We introduced production rules in Chapter 1 andwe further describe their use in CCT below. For the system grammar, CCT uses generalized transition networks, a form of state transition network. This will not bedescribed here, but state transition networks will be discussed in detail in Chapter 16.
The production rules are a sequence of rules:
if condition then action
where condition is a statement about the contents of working memory. If the condi-tion is true then the production rule is said to fire. An action may consist of one ormore elementary actions, which may be either changes to the working memory, or external actions such as keystrokes. The production rule ‘program’ is written in aLISP-like language.
As an example, we consider an editing task using the UNIX vi text editor. The taskis to insert a space where one has been missed out in the text, for instance if wenoticed that in the above paragraph we had written ‘cognitivecomplexity theory’.This is a reasonably frequent typing error and so we assume that we have developedgood procedures to perform the task. We consider a fragment of the associated CCTproduction rules.
(SELECT-INSERT-SPACE
IF (AND (TEST-GOAL perform unit task)
(TEST-TEXT task is insert space)
(NOT (TEST-GOAL insert space))
(NOT (TEST-NOTE executing insert space)) )

426 Chapter 12 n Cognitive models
THEN ( (ADD-GOAL insert space)
(ADD-NOTE executing insert space)
(LOOK-TEXT task is at %LINE %COL) ))
(INSERT-SPACE-DONE
IF (AND (TEST-GOAL perform unit task)
(TEST-NOTE executing insert space)
(NOT (TEST-GOAL insert space)) )
THEN ( (DELETE-NOTE executing insert space)
(DELETE-GOAL perform unit task)
(UNBIND %LINE %COL) ))
(INSERT-SPACE-1
IF (AND (TEST-GOAL insert space)
(NOT (TEST-GOAL move cursor))
(NOT (TEST-CURSOR %LINE %COL)) )
THEN ( (ADD-GOAL move cursor to %LINE %COL) ))
(INSERT-SPACE-2
IF (AND (TEST-GOAL insert space)
(TEST-CURSOR %LINE %COL) )
THEN ( (DO-KEYSTROKE ‘I’)
(DO-KEYSTROKE SPACE)
(DO-KEYSTROKE ESC)
(DELETE-GOAL insert space) ))
To see how these rules work, imagine that the user has just seen the typing mis-take and thus the contents of working memory (w.m.) are
(GOAL perform unit task)
(TEXT task is insert space)
(TEXT task is at 5 23)
(CURSOR 8 7)
TEXT refers to the text of the manuscript that is being edited and CURSOR refers tothe insertion cursor on the screen. Of course, these items are not actually located inworking memory – they are external to the user – but we assume that knowledgefrom observing them is stored in the user’s working memory.
The location (5,23) is the line and column of the typing mistake where the spaceis required. However, the current cursor position is at line 8 and column 7. This is of course acquired into the user’s working memory by looking at the screen. Look-ing at the four rules above (SELECT-INSERT-SPACE, INSERT-SPACE-DONE,INSERT-SPACE-1 and INSERT-SPACE-2), only the first can fire. The conditionfor SELECT-INSERT-SPACE is:
(AND (TEST-GOAL perform unit task)
true because (GOAL perform unit task) is in w.m.(TEST-TEXT task is insert space)
true because (TEXT task is insert space) is in w.m.

12.2 Goal and task hierarchies 427
(NOT (TEST-GOAL insert space))
true because (GOAL insert space) is not in w.m.(NOT (TEST-NOTE executing insert space)) )
true because (NOTE executing insert space)is not in w.m.
So, the rule fires and its action is performed. This action has no external effect interms of keystrokes, but adds extra information to working memory. The (LOOK-TEXT task is at %LINE %COL) looks for a corresponding entry and binds LINEand COL to 5 and 23 respectively. These are variables, somewhat as in a normal programming language, which are referred to again in other rules.
The contents of working memory after the firing of rule SELECT-INSERT-SPACEare as follows (note that the order of elements of working memory is arbitrary):
(GOAL perform unit task)
(TEXT task is insert space)
(TEXT task is at 5 23)
(NOTE executing insert space)
(GOAL insert space)
(LINE 5)
(COL 23)
(CURSOR 8 7)
At this point neither rule SELECT-INSERT-SPACE nor INSERT-SPACE-DONEwill fire as the entry (GOAL insert space) will make their conditions false. AsLINE is bound to 5 and COL is bound to 23, the condition (TEST-CURSOR %LINE%COL) will be false also, and hence only rule INSERT-SPACE-1 can fire.
After this rule’s actions have been performed, the working memory will includethe entry (GOAL move cursor to 5 23). The rules for moving the cursor are not included here, but would be quite extensive, moving up/down and right/leftdepending on the relative positions of the cursor and the target location. Eventually,assuming the cursor movement is successful, the cursor would be at (5,23) whencerule INSERT-SPACE-2 would be able to fire. This would perform the keystrokes: I, SPACE and ESC, which in vi puts the editor into insert mode, types the space and then leaves insert mode. The action also removes the insert space goal fromworking memory as this goal has been achieved.
Now the goal has been removed, the second rule INSERT-SPACE-DONE is free tofire, which ‘tidies up’ working memory. In particular, it ‘unbinds’ the variables LINEand COL, that is it removes the bindings for them from working memory.
Notice that the rules did not fire in the order they were written. Although theylook somewhat like the if–then–else commands one would get in a standard pro-gramming language, they behave very differently. The rules are all active and at eachmoment any rule that has its conditions true may fire. Some rules may never fire; for instance, if the cursor is at the correct position the third rule would not fire.Furthermore, the same rule may fire repeatedly; for example, if we were to write outthe production rules for moving the cursor, one rule may well be
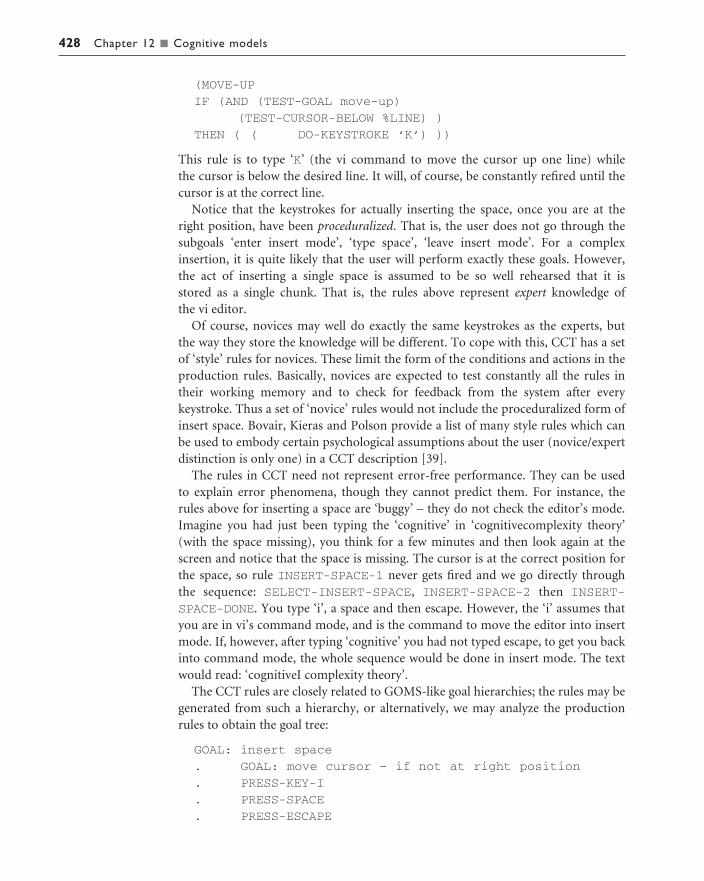
428 Chapter 12 n Cognitive models
(MOVE-UP
IF (AND (TEST-GOAL move-up)
(TEST-CURSOR-BELOW %LINE) )
THEN ( ( DO-KEYSTROKE ‘K’) ))
This rule is to type ‘K’ (the vi command to move the cursor up one line) while the cursor is below the desired line. It will, of course, be constantly refired until thecursor is at the correct line.
Notice that the keystrokes for actually inserting the space, once you are at the right position, have been proceduralized. That is, the user does not go through thesubgoals ‘enter insert mode’, ‘type space’, ‘leave insert mode’. For a complex insertion, it is quite likely that the user will perform exactly these goals. However, the act of inserting a single space is assumed to be so well rehearsed that it is stored as a single chunk. That is, the rules above represent expert knowledge of the vi editor.
Of course, novices may well do exactly the same keystrokes as the experts, but the way they store the knowledge will be different. To cope with this, CCT has a setof ‘style’ rules for novices. These limit the form of the conditions and actions in theproduction rules. Basically, novices are expected to test constantly all the rules intheir working memory and to check for feedback from the system after everykeystroke. Thus a set of ‘novice’ rules would not include the proceduralized form ofinsert space. Bovair, Kieras and Polson provide a list of many style rules which canbe used to embody certain psychological assumptions about the user (novice/expertdistinction is only one) in a CCT description [39].
The rules in CCT need not represent error-free performance. They can be used to explain error phenomena, though they cannot predict them. For instance, therules above for inserting a space are ‘buggy’ – they do not check the editor’s mode.Imagine you had just been typing the ‘cognitive’ in ‘cognitivecomplexity theory’(with the space missing), you think for a few minutes and then look again at thescreen and notice that the space is missing. The cursor is at the correct position forthe space, so rule INSERT-SPACE-1 never gets fired and we go directly through the sequence: SELECT-INSERT-SPACE, INSERT-SPACE-2 then INSERT-SPACE-DONE. You type ‘i’, a space and then escape. However, the ‘i’ assumes thatyou are in vi’s command mode, and is the command to move the editor into insertmode. If, however, after typing ‘cognitive’ you had not typed escape, to get you backinto command mode, the whole sequence would be done in insert mode. The textwould read: ‘cognitiveI complexity theory’.
The CCT rules are closely related to GOMS-like goal hierarchies; the rules may begenerated from such a hierarchy, or alternatively, we may analyze the productionrules to obtain the goal tree:
GOAL: insert space
. GOAL: move cursor – if not at right position
. PRESS-KEY-I
. PRESS-SPACE
. PRESS-ESCAPE

12.2 Goal and task hierarchies 429
The stacking depth of this goal hierarchy (as described for GOMS) is directly relatedto the number of (GOAL ...) terms in working memory.
In fact, the CCT rules can represent more complex plans than the simple sequen-tial hierarchies of GOMS. The continuous activity of all production rules makes itpossible to represent concurrent plans. For example, one could have one set of pro-duction rules representing the goal of writing a book, and another set representingthe goal of drinking tea. These rules could both be active simultaneously, thus allow-ing an author to drink tea whilst typing. Despite this apparent flexibility, CCT is notnormally used in this way. It is not clear why this is, except that CCT, like GOMS, is aimed at low-level, proceduralized goals – that is, the unit task. It is reasonable that successive unit tasks be chosen from different activities: the author may delete a word, have a drink, do a word search, but each time a complete unit task would beperformed – the author does not take a drink of tea in the middle of deleting a word.
We have seen how CCT rules may be informally analyzed to discuss issues of proceduralization and error behavior, and how we can relate them to GOMS-likegoal hierarchies. However, the main aim of CCT is (as its name suggests) to be ableto measure the complexity of an interface.
Basically, the more production rules in the CCT description the more difficult theinterface is to learn. This claim rests on the assumption that the production rulesrepresent reasonably accurately the way knowledge is stored and therefore that thetime taken to learn an interface is roughly proportional to the number of rules youhave to learn.
We have only discussed the user side of CCT here. If the cognitive user descrip-tion is complemented by a description of the system, it is claimed that one can pre-dict the difficulty of the mapping between the user’s goals and the system model. The generalized transition networks that describe the system grammar themselveshave a hierarchical structure. Thus both the description of the user and that of the system can be represented as hierarchies. These can then be compared to findmismatches and to produce a measure of dissonance.
There are various problems with CCT. As with many ‘rich’ description methods,the size of description for even a part of an interface can be enormous. Furthermore,there may be several ways of representing the same user behavior and interfacebehavior, yielding different measures of dissonance. To some extent this is catered forby the novice style rules, but there is no such set of rules for the system description.
Another problem is the particular choice of notations. Production rules are oftensuggested as a good model of the way people remember procedural knowledge, butthere are obvious ‘cludges’ in the CCT description given above. In particular, theworking memory entry (NOTE executing insert space) is there purely to allowthe INSERT-SPACE-DONE rule to fire at the appropriate time. It is not at all clearthat it has any real cognitive significance. One may also question whether the particu-lar notation chosen for the system is critical to the method. One might choose to represent the system using any one of the dialog description notations in Chapter 16.Different notations would probably yield slightly different measures of dissonance.
However, one should regard CCT as an engineering tool giving one a rough measureof learnability and difficulty combined with a detailed description of user behavior.
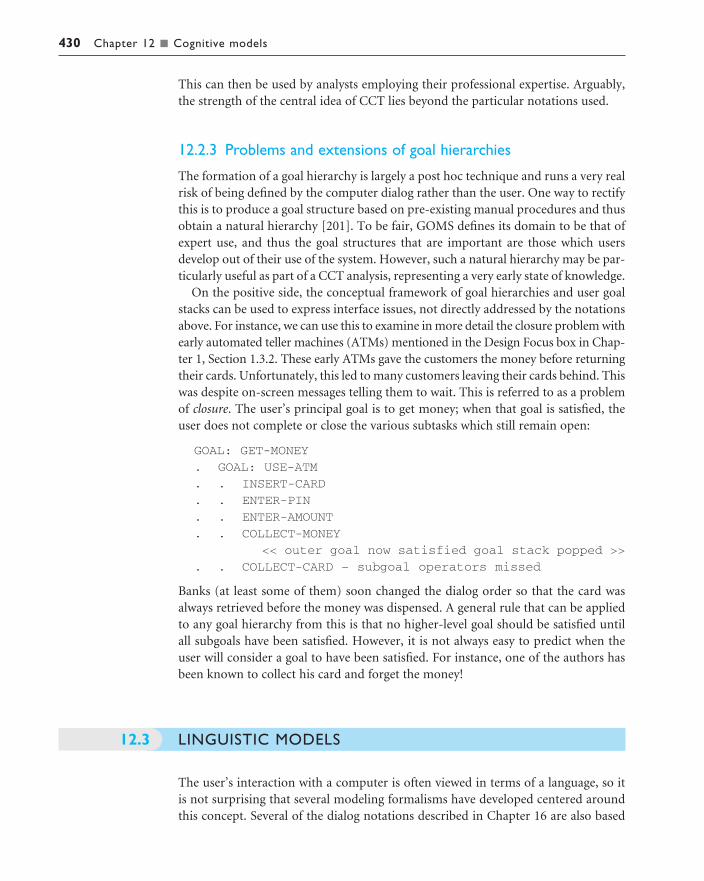
430 Chapter 12 n Cognitive models
This can then be used by analysts employing their professional expertise. Arguably,the strength of the central idea of CCT lies beyond the particular notations used.
12.2.3 Problems and extensions of goal hierarchies
The formation of a goal hierarchy is largely a post hoc technique and runs a very realrisk of being defined by the computer dialog rather than the user. One way to rectifythis is to produce a goal structure based on pre-existing manual procedures and thusobtain a natural hierarchy [201]. To be fair, GOMS defines its domain to be that ofexpert use, and thus the goal structures that are important are those which usersdevelop out of their use of the system. However, such a natural hierarchy may be par-ticularly useful as part of a CCT analysis, representing a very early state of knowledge.
On the positive side, the conceptual framework of goal hierarchies and user goalstacks can be used to express interface issues, not directly addressed by the notationsabove. For instance, we can use this to examine in more detail the closure problem withearly automated teller machines (ATMs) mentioned in the Design Focus box in Chap-ter 1, Section 1.3.2. These early ATMs gave the customers the money before returningtheir cards. Unfortunately, this led to many customers leaving their cards behind. Thiswas despite on-screen messages telling them to wait. This is referred to as a problemof closure. The user’s principal goal is to get money; when that goal is satisfied, theuser does not complete or close the various subtasks which still remain open:
GOAL: GET-MONEY
. GOAL: USE-ATM
. . INSERT-CARD
. . ENTER-PIN
. . ENTER-AMOUNT
. . COLLECT-MONEY
<< outer goal now satisfied goal stack popped >>
. . COLLECT-CARD – subgoal operators missed
Banks (at least some of them) soon changed the dialog order so that the card wasalways retrieved before the money was dispensed. A general rule that can be appliedto any goal hierarchy from this is that no higher-level goal should be satisfied untilall subgoals have been satisfied. However, it is not always easy to predict when theuser will consider a goal to have been satisfied. For instance, one of the authors hasbeen known to collect his card and forget the money!
LINGUISTIC MODELS
The user’s interaction with a computer is often viewed in terms of a language, so itis not surprising that several modeling formalisms have developed centered aroundthis concept. Several of the dialog notations described in Chapter 16 are also based
12.3

12.3 Linguistic models 431
on linguistic ideas. Indeed, BNF grammars are frequently used to specify dialogs. The models here, although similar in form to dialog design notations, have been proposed with the intention of understanding the user’s behavior and analyzing thecognitive difficulty of the interface.
12.3.1 BNF
Representative of the linguistic approach is Reisner’s use of Backus–Naur Form (BNF)rules to describe the dialog grammar [301]. This views the dialog at a purely syntacticlevel, ignoring the semantics of the language. BNF has been used widely to specify the syntax of computer programming languages, and many system dialogs can bedescribed easily using BNF rules. For example, imagine a graphics system that has aline-drawing function. To select the function the user must select the ‘line’ menu option.The line-drawing function allows the user to draw a polyline, that is a sequence ofline arcs between points. The user selects the points by clicking the mouse button inthe drawing area. The user double clicks to indicate the last point of the polyline.
draw-line ::= select-line + choose-points
+ last-point
select-line ::= position-mouse + CLICK-MOUSE
choose-points ::= choose-one
| choose-one + choose-points
choose-one ::= position-mouse + CLICK-MOUSE
last-point ::= position-mouse + DOUBLE-CLICK-MOUSE
position-mouse ::= empty | MOVE-MOUSE + position-mouse
The names in the description are of two types: non-terminals, shown in lower case,and terminals, shown in upper case. Terminals represent the lowest level of userbehavior, such as pressing a key, clicking a mouse button or moving the mouse.Non-terminals are higher-level abstractions. The non-terminals are defined in termsof other non-terminals and terminals by a definition of the form
name ::= expression
The ‘::=’ symbol is read as ‘is defined as’. Only non-terminals may appear on theleft of a definition. The right-hand side is built up using two operators ‘+’ (sequence)and ‘|’ (choice). For example, the first rule says that the non-terminal draw-lineis defined to be select-line followed by choose-points followed by last-point. All of these are non-terminals, that is they do not tell us what the basic useractions are. The second rule says that select-line is defined to be position-mouse (intended to be over the ‘line’ menu entry) followed by CLICK-MOUSE. Thisis our first terminal and represents the actual clicking of a mouse.
To see what position-mouse is, we look at the last rule. This tells us that thereare two possibilities for position-mouse (separated by the ‘|’ symbol). Oneoption is that position-mouse is empty – a special symbol representing noaction. That is, one option is not to move the mouse at all. The other option is to do

432 Chapter 12 n Cognitive models
a MOVE-MOUSE action followed by position-mouse. This rule is recursive, andthis second position-mouse may itself either be empty or be a MOVE-MOUSEaction followed by position-mouse, and so on. That is, position-mouse maybe any number of MOVE-MOUSE actions whatsoever.
Similarly, choose-points is defined recursively, but this time it does not havethe option of being empty. It may be one or more of the non-terminal choose-onewhich is itself defined to be (like select-line) position-mouse followed byCLICK-MOUSE.
The BNF description of an interface can be analyzed in various ways. One mea-sure is to count the number of rules. The more rules an interface requires to use it,the more complicated it is. This measure is rather sensitive to the exact way the inter-face is described. For example, we could have replaced the rules for choose-points and choose-one with the single definition
choose-points ::= position-mouse + CLICK-MOUSE
| position-mouse + CLICK-MOUSE + choose-points
A more robust measure also counts the number of ‘+’ and ‘|’ operators. Thiswould, in effect, penalize the more complex single rule. Another problem arises withthe rule for select-line. This is identical to the choose-one rule. However, the acts of selecting a menu option and choosing a point on a drawing surface are obviously so different that they must surely be separated. Decisions like thisabout the structure of a BNF description are less of a problem in practice than thecorresponding problems we had with CCT.
In addition to these complexity measures for the language as a whole, we can usethe BNF definition to work out how many basic actions are required for a particulartask, and thus obtain a crude estimate of the difficulty of that task.
The BNF description above only represented the user’s actions, not the user’s perception of the system’s responses. This input bias is surprisingly commonamongst cognitive models, as we will discuss in Section 12.4. Reisner has developedextensions to the basic BNF descriptions, which attempt to deal with this by adding‘information-seeking actions’ to the grammar.
12.3.2 Task–action grammar
Measures based upon BNF have been criticized as not ‘cognitive’ enough. Theyignore the advantages of consistency both in the language’s structure and in its use of command names and letters. Task–action grammar (TAG) [284] attempts to deal with some of these problems by including elements such as parametrizedgrammar rules to emphasize consistency and encoding the user’s world knowledge(for example, up is the opposite of down).
To illustrate consistency, we consider the three UNIX commands: cp (for copyingfiles), mv (for moving files) and ln (for linking files). Each of these has two possibleforms. They either have two arguments, a source and destination filename, or haveany number of source filenames followed by a destination directory:

12.3 Linguistic models 433
copy ::= ‘cp’ + filename + filename
| ‘cp’ + filenames + directory
move ::= ‘mv’ + filename + filename
| ‘mv’ + filenames + directory
link ::= ‘ln’ + filename + filename
| ‘ln’ + filenames + directory
Measures based upon BNF could not distinguish between these consistent com-mands and an inconsistent alternative – say if ln took its directory argument first. Task–action grammar was designed to reveal just this sort of consistency. Itsdescription of the UNIX commands would be
file-op[Op] := command[Op] + filename + filename
| command[Op] + filenames + directory
command[Op=copy] := ‘cp’
command[Op=move] := ‘mv’
command[Op=link] := ‘ln’
This captures the consistency of the commands and closely resembles the originaltextual description. One would imagine that a measure of the complexity of the language based on the TAG description would be better at predicting actual learningand performance than a simple BNF one.
As well as handling consistency well, TAG has features for talking about ‘worldknowledge’. For example, imagine we have two command line interfaces for movinga mechanical turtle around the floor.
Command interface 1movement[Direction]
:= command[Direction] + distance + RETURN
command[Direction=forward] := ‘go 395’
command[Direction=backward] := ‘go 013’
command[Direction=left] := ‘go 712’
command[Direction=right] := ‘go 956’
Command interface 2movement[Direction]
:= command[Direction] + distance + RETURN
command[Direction=forward] := ‘FORWARD’
command[Direction=backward] := ‘BACKWARD’
command[Direction=left] := ‘LEFT’
command[Direction=right] := ‘RIGHT’
The first interface may not be as silly as it seems; the command ‘go 395’ couldrefer to the address of a machine-code routine, which performs the appropriatemovement. However, it is absolutely clear that the second interface is preferable tothe first. TAG includes a special form known-item, which is used to denote infor-mation that the user will already know, and thus not need to learn in order to use thesystem. Using this form, the TAG rules for the second interface are rewritten

434 Chapter 12 n Cognitive models
Command interface 2movement[Direction]
:= command[Direction] + distance + RETURN
command[Direction]:= known-item[Type=word,Direction]
* command[Direction=forward] := ‘FORWARD’
* command[Direction=backward] := ‘BACKWARD’
* command[Direction=left] := ‘LEFT’
* command[Direction=right] := ‘RIGHT’
The starred rules can be generated from the second rule using the user’s worldknowledge. They are included in any TAG description for completeness, but are notcounted in any measure of complexity.
Sometimes it may not be clear what the appropriate command is, but once weknow one, the rest become obvious. For example, consider a simple database dis-playing a list of records. We are expecting two commands, one to move up the list tothe previous record, and another to move down the list to the next record. There areseveral options for the commands, for instance UP/DOWN, PREVIOUS/NEXT,possibly in upper or lower case, possibly also just the first letter of the relevant word. In addition, one might have mixed-up command sets such as UP/NEXT orN/previous. The fact that any of the former set of commands is easier to learn thanthe mixed-up commands is called congruence. TAG has a notation to describe thecongruence of an interface. The notation F(‘next’) is used to denote the featureset related to the word ‘next’. That is, next/previous. With this notation a congruentgrammar requires only one ‘real’ rule, such as
browse[Direction] := F(‘next’) + return
* browse[Direction=up] := ‘previous’ + return
* browse[Direction=down] := ‘next’ + return
We have seen that the notation allows one to say that the commands RIGHT andLEFT are consistent for opposite actions. How do we know that the user regards theopposite of RIGHT to be LEFT rather than WRONG? Obviously, the inclusion ofworld knowledge depends upon the user of the system – the above certainly assumesthat the user’s language is English. The designer is responsible for the input of thisworld knowledge into the TAG description and its validity will depend on the pro-fessional judgment of the designer. However, TAG will make these assumptions clearand thus, by highlighting them, hold them up for inspection.
THE CHALLENGE OF DISPLAY-BASED SYSTEMS
Both goal hierarchical and grammar-based techniques were initially developed whenmost interactive systems were command line, or at most, keyboard and cursor based.There are significant worries, therefore, about how well these approaches can gener-alize to deal with more modern windowed and mouse-driven interfaces.
12.4
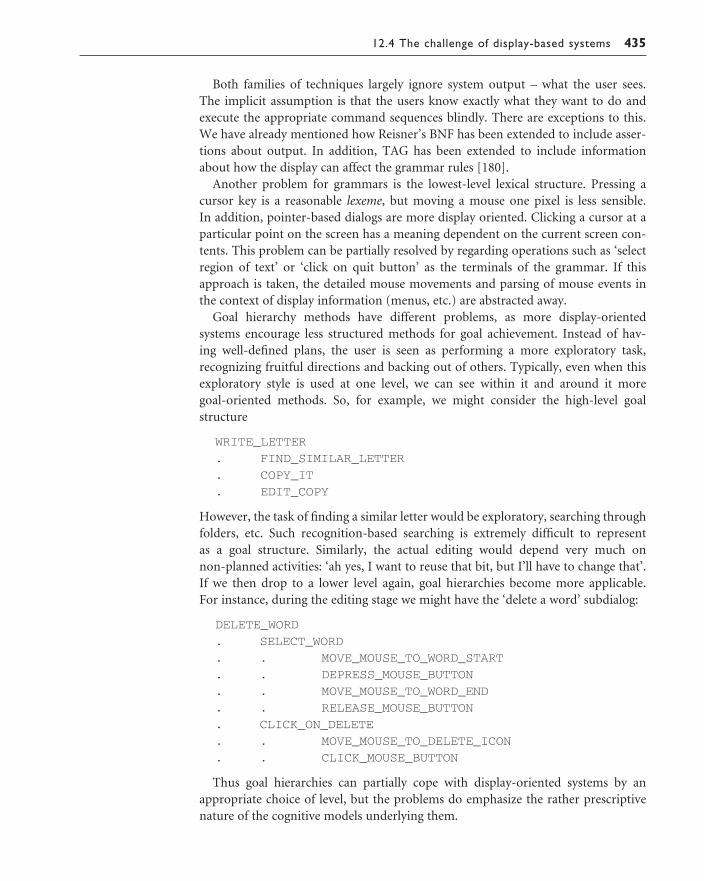
12.4 The challenge of display-based systems 435
Both families of techniques largely ignore system output – what the user sees. The implicit assumption is that the users know exactly what they want to do and execute the appropriate command sequences blindly. There are exceptions to this.We have already mentioned how Reisner’s BNF has been extended to include asser-tions about output. In addition, TAG has been extended to include informationabout how the display can affect the grammar rules [180].
Another problem for grammars is the lowest-level lexical structure. Pressing a cursor key is a reasonable lexeme, but moving a mouse one pixel is less sensible. In addition, pointer-based dialogs are more display oriented. Clicking a cursor at aparticular point on the screen has a meaning dependent on the current screen con-tents. This problem can be partially resolved by regarding operations such as ‘selectregion of text’ or ‘click on quit button’ as the terminals of the grammar. If thisapproach is taken, the detailed mouse movements and parsing of mouse events inthe context of display information (menus, etc.) are abstracted away.
Goal hierarchy methods have different problems, as more display-oriented systems encourage less structured methods for goal achievement. Instead of hav-ing well-defined plans, the user is seen as performing a more exploratory task, recognizing fruitful directions and backing out of others. Typically, even when thisexploratory style is used at one level, we can see within it and around it more goal-oriented methods. So, for example, we might consider the high-level goal structure
WRITE_LETTER
. FIND_SIMILAR_LETTER
. COPY_IT
. EDIT_COPY
However, the task of finding a similar letter would be exploratory, searching throughfolders, etc. Such recognition-based searching is extremely difficult to represent as a goal structure. Similarly, the actual editing would depend very much on non-planned activities: ‘ah yes, I want to reuse that bit, but I’ll have to change that’.If we then drop to a lower level again, goal hierarchies become more applicable. For instance, during the editing stage we might have the ‘delete a word’ subdialog:
DELETE_WORD
. SELECT_WORD
. . MOVE_MOUSE_TO_WORD_START
. . DEPRESS_MOUSE_BUTTON
. . MOVE_MOUSE_TO_WORD_END
. . RELEASE_MOUSE_BUTTON
. CLICK_ON_DELETE
. . MOVE_MOUSE_TO_DELETE_ICON
. . CLICK_MOUSE_BUTTON
Thus goal hierarchies can partially cope with display-oriented systems by anappropriate choice of level, but the problems do emphasize the rather prescriptivenature of the cognitive models underlying them.

436 Chapter 12 n Cognitive models
These problems have been one of the factors behind the growing popularity of situated action [334] and distributed cognition [208, 185] in HCI (see also Chap-ter 14). Both approaches emphasize the way in which actions are contingent uponevents and determined by context, rather than being pre-planned. At one extreme,protagonists of these approaches seem to deny any planned actions or long-termgoals. On the other hand, traditional cognitive modelers are modeling display-basedcognition using production rules and similar methods, which include sensory datawithin the models.
At a low level, chunked expert behavior is modeled effectively using hierarchicalor linguistic models, and is where the keystroke-level model (discussed in Section12.5.1 below) has proved effective. In contrast, it is clear that no amount of cognitivemodeling can capture the activity during the writing of a poem. Between these two,cognitive models will have differing levels of success and utility. Certainly, models at allbut the lowest levels must take into account the user’s reactions to feedback from thesystem, otherwise they cannnot address the fundamental issue of interactivity at all.
PHYSICAL AND DEVICE MODELS
12.5.1 Keystroke-level model
Compared with the deep cognitive understanding required to describe problem-solving activities, the human motor system is well understood. KLM (Keystroke-LevelModel [55]) uses this understanding as a basis for detailed predictions about userperformance. It is aimed at unit tasks within interaction – the execution of simplecommand sequences, typically taking no more than 20 seconds. Examples of thiswould be using a search and replace feature, or changing the font of a word. It doesnot extend to complex actions such as producing a diagram. The assumption is thatthese more complex tasks would be split into subtasks (as in GOMS) before the userattempts to map them into physical actions. The task is split into two phases:
acquisition of the task, when the user builds a mental representation of the task;
execution of the task using the system’s facilities.
KLM only gives predictions for the latter stage of activity. During the acquisitionphase, the user will have decided how to accomplish the task using the primitives ofthe system, and thus, during the execution phase, there is no high-level mental activ-ity – the user is effectively expert. KLM is related to the GOMS model, and can bethought of as a very low-level GOMS model where the method is given.
The model decomposes the execution phase into five different physical motoroperators, a mental operator and a system response operator:
K Keystroking, actually striking keys, including shifts and other modifier keys.
B Pressing a mouse button.
P Pointing, moving the mouse (or similar device) at a target.
12.5

12.5 Physical and device models 437
H Homing, switching the hand between mouse and keyboard.
D Drawing lines using the mouse.
M Mentally preparing for a physical action.
R System response which may be ignored if the user does not have to wait for it, asin copy typing.
The execution of a task will involve interleaved occurrences of the various oper-ators. For instance, imagine we are using a mouse-based editor. If we notice a singlecharacter error we will point at the error, delete the character and retype it, and thenreturn to our previous typing point. This is decomposed as follows:
1. Move hand to mouse H[mouse]2. Position mouse after bad character PB[LEFT]3. Return to keyboard H[keyboard]4. Delete character MK[DELETE]5. Type correction K[char]6. Reposition insertion point H[mouse]MPB[LEFT]
Notice that some operators have descriptions added to them, representing whichdevice the hand homes to (for example, [mouse]) and what keys are hit (for example,LEFT – the left mouse button).
The model predicts the total time taken during the execution phase by adding thecomponent times for each of the above activities. For example, if the time taken forone keystroke is tK, then the total time doing keystrokes is
TK = 2tK
Similar calculations for the rest of the operators give a total time of
Texecute = TK + TB + TP + TH + TD + TM + TR
= 2tK + 2tB + tP + 3tH + 0 + 2tM + 0
In this example, the system response time was zero. However, if the user had towait for the system then the appropriate time would be added. In many typing tasks,the user can type ahead anyway and thus there is no need to add response times.Where needed, the response time can be measured by observing the system.
The times for the other operators are obtained from empirical data. The keyingtime obviously depends on the typing skill of the user, and different times are thusused for different users. Pressing a mouse button is usually quicker than typing(especially for two-finger typists), and a more accurate time prediction can be madeby separating out the button presses B from the rest of the keystrokes K. The point-ing time can be calculated using Fitts’ law (see Chapter 1), and thus depends on thesize and position of the target.1 Alternatively, a fixed time based on average within
1 The form of Fitts’ law used with the original KLM is K log2(D/S + 0.5), where D is the distance to thetarget and S is the target size. We will use this form for calculations in this subsection, but revert to theform a + b log2(D/S + 1) in the next subsection when we consider Buxton’s three-state model, as this formwas used for these experiments.

438 Chapter 12 n Cognitive models
screen pointing can be used. Drawing time depends on the number and length of thelines drawn, and is fairly domain specific, but one can easily use empirical data formore general drawing tasks. Finally, homing time and mental preparation time areassumed constant. Typical times are summarized in Table 12.1.
The mental operator is probably the most complex part of KLM. Remember thatthe user is assumed to have decided what to do, and how to do it. The mental pre-paration is thus just the slight pauses made as the user recalls what to do next. There are complicated heuristics for deciding where to put M operators, but they allboil down to the level of chunking (see Chapter 1 for a discussion of chunking). If the user types a word, or a well-known command name, this will be one chunk,and hence only require one mental operator. However, if a command name was anacronym which the user was recalling letter by letter, then we would place one Moperator per letter.
The physical operator times all depend on the skills of the user. Also, the mentaloperator depends on the level of chunking, and hence the expertise of the user. Youmust therefore decide before using KLM predictions just what sort of user you arethinking about. You cannot even work out the operators and then fill in the timeslater, as different users may choose different methods and have different placings ofM operators due to chunking. This sounds rather onerous, but the predictions madeby KLM are only meant to be an approximation, and thus reasonable guesses aboutlevels of expertise are enough.
Individual predictions may be interesting, but the power of KLM lies in compar-ison. Given several systems, we can work out the methods to perform key tasks, andthen use KLM to tell us which system is fastest. This is considerably cheaper than
Table 12.1 Times for various operators in the keystroke-level model (adapted fromCard, Moran and Newell [56], published and reprinted by permission of Lawrence ErlbaumAssociates, Inc.)
Operator Remarks Time (s)
K Press keygood typist (90 wpm) 0.12poor typist (40 wpm) 0.28non-typist 1.20
B Mouse button pressdown or up 0.10click 0.20
P Point with mouseFitts’ law 0.1 log2(D/S + 0.5)average movement 1.10
H Home hands to and from keyboard 0.40D Drawing – domain dependent –M Mentally prepare 1.35R Response from system – measure –
wpm = words per minute

12.5 Physical and device models 439
conducting lengthy experiments (levels of individual variation would demand vastnumbers of trials – see Chapter 9). Furthermore, the systems need not even exist.From a description of a proposed system, we can predict the times taken for tasks.As well as comparing systems, we can compare methods within a system. This can beuseful in preparing training materials, as we can choose to teach the faster methods.
Using the keystroke-level model
As an example, we compare the two methods for iconizing a window given in Section12.2.1. One used the ‘L7’ function key, and the other the ‘CLOSE’ option from the window’s pop-up menu. The latter is obtained by moving to the window’s title bar, depressing the left mousebutton, dragging the mouse down the pop-up menu to the ‘CLOSE’ option, and then releasing themouse button. We assume that the user’s hand is on the mouse to begin with, and hence only theL7-METHOD will require a homing operator. The operators for the two methods are as follows:
L7-METHOD H[to keyboard] MK[L7 function key]CLOSE-METHOD P[to menu bar] B[LEFT down] MP[to option] B[LEFT up]
The total times are thus
L7-METHOD = 0.4 + 1.35 + 0.28= 2.03 seconds
CLOSE-METHOD = 1.1 + 0.1 + 1.35 + 1.1 + 0.1= 3.75 seconds
The first calculation is quite straightforward, but the second needs a little unpacking. The buttonpresses are separate down and then up actions and thus each is timed at only 0.1 of a second,rather than 0.2 for a click, or 0.28 for typing. We have also used the simplified average of 1.1 sec-onds for the pointing task. From these predictions, we can see that the L7-METHOD is far faster.In Section 12.2.1, Sam’s selection rule was to use the L7-METHOD when playing blocks. To do so,he can go on playing the game using the mouse in his right hand whilst moving his left hand overthe key. Thus the real time for Sam, from when he takes his attention from the game to when thecommand is given, is less: 2.03 seconds minus the homing time, that is 1.63 seconds. Given themethod is so fast, why does Sam not use it all the time?
Perhaps the average estimates for pointing times have biased our estimate. We can be a little more precise about the CLOSE-METHOD timing if we use Fitts’ law instead of the average 1.1 seconds.The mouse will typically be in the middle of a 25 line high window. The title bar is 1.25 lines high.Thus the distance to target ratio for the first pointing task is 10:1. The ‘CLOSE’ option is four itemsdown on the pop-up menu; hence the ratio for the second pointing task is 4:1. Thus we can calcu-late the pointing times:
P[to menu bar] = 0.1 log2(10.5) = 0.339P[to option] = 0.1 log2(4.5) = 0.217
With these revised timings, KLM predicts the CLOSE-METHOD will take 2.1 seconds. So Sam’sselection rule is not quite as bad as it initially seemed!

440 Chapter 12 n Cognitive models
Worked exercise Do a keystroke-level analysis for opening up an application in a visual desktop interface usinga mouse as the pointing device, comparing at least two different methods for performing thetask. Repeat the exercise using a trackball. Consider how the analysis would differ for variouspositions of the trackball relative to the keyboard and for other pointing devices.
Answer We provide a keystroke-level analysis for three different methods for launching anapplication on a visual desktop. These methods are analyzed for a conventional one-button mouse, a trackball mounted away from the keyboard and one mounted close tothe keyboard. The main distinction between the two trackballs is that the second onedoes not require an explicit repositioning of the hands, that is there is no time requiredfor homing the hands between the pointing device and the keyboard.
Method 1 Double clicking on application icon
Steps Operator Mouse Trackball1 Trackball2
1. Move hand to mouse H[mouse] 0.400 0.400 0.0002. Mouse to icon P[to icon] 0.664 1.113 1.1133. Double click 2B[click] 0.400 0.400 0.4004. Return to keyboard H[kbd] 0.400 0.400 0.000Total times 1.864 2.313 1.513
Method 2 Using an accelerator key
Steps Operator Mouse Trackball1 Trackball2
1. Move hand to mouse H[mouse] 0.400 0.400 0.0002. Mouse to icon P[to icon] 0.664 1.113 1.1133. Click to select B[click] 0.200 0.200 0.2004. Pause M 1.350 1.350 1.3505. Return to keyboard H[kbd] 0.400 0.400 0.0006. Press accelerator K 0.200 0.200 0.200Total times 3.214 3.663 2.763
Method 3 Using a menu
Steps Operator Mouse Trackball1 Trackball2
1. Move hand to mouse H[mouse] 0.400 0.400 0.0002. Mouse to icon P[to icon] 0.664 1.113 1.1133. Click to select B[click] 0.200 0.200 0.2004. Pause M 1.350 1.350 1.3505. Mouse to file menu P 0.664 1.113 1.1136. Pop-up menu B[down] 0.100 0.100 0.1007. Drag to open P[drag] 0.713 1.248 1.2488. Release mouse B[up] 0.100 0.100 0.1009. Return to keyboard H[kbd] 0.400 0.400 0.000Total times 4.591 6.024 5.224

12.5 Physical and device models 441
Card, Moran and Newell empirically validated KLM against a range of systems,both keyboard and mouse based, and a wide selection of tasks. The predictions werefound to be remarkably accurate (an error of about 20%). KLM is thus one of the fewmodels capable of giving accurate quantitative predictions about performance.However, the range of applications is correspondingly small. It tells us a lot about themicro-interaction, but not about the larger-scale dialog.
We have seen that you have to be quite careful, as the approximations you makecan radically change the results – KLM is a guide, not an oracle. We should also adda word of caution about the assumption that fastest is best. There are certainly situ-ations where this is so, for example highly repetitive tasks such as telephony or dataentry. However, even expert users will often not use the fastest method. For exam-ple, the expert may have a set of general-purpose, non-optimal methods, rather thana few task-specific methods.
12.5.2 Three-state model
In Chapter 2, we saw that a range of pointing devices exists in addition to the mouse.Often these devices are considered logically equivalent, if the same inputs are avail-able to the application. That is, so long as you can select a point on the screen, theyare all the same. However, these different devices – mouse, trackball, light pen – feelvery different. Although the devices are similar from the application’s viewpoint,they have very different sensory–motor characteristics.
Buxton has developed a simple model of input devices [53], the three-state model,which captures some of these crucial distinctions. He begins by looking at a mouse.If you move it with no buttons pushed, it normally moves the mouse cursor about.This tracking behavior is termed state 1. Depressing a button over an icon and thenmoving the mouse will often result in an object being dragged about. This he callsstate 2 (see Figure 12.1).
If instead we consider a light pen with a button, it behaves just like a mouse whenit is touching the screen. When its button is not depressed, it is in state 1, and whenits button is down, state 2. However, the light pen has a third state, when the lightpen is not touching the screen. In this state the system cannot track the light pen’sposition. This is called state 0 (see Figure 12.2).
A touchscreen is like the light pen with no button. While the user is not touchingthe screen, the system cannot track the finger – that is, state 0 again. When the usertouches the screen, the system can begin to track – state 1. So a touchscreen is a state0–1 device whereas a mouse is a state 1–2 device. As there is no difference between astate 0–2 and a state 0–1 device, there are only the three possibilities we have seen.
Figure 12.1 Mouse transitions: states 1 and 2

442 Chapter 12 n Cognitive models
The only additional complexity is if the device has several buttons, in which case wewould have one state for each button: 2left, 2middle, 2right.
One use of this classification is to look at different pointing tasks, such as iconselection or line drawing, and see what state 0–1–2 behavior they require. We canthen see whether a particular device can support the required task. If we have to usean inadequate device, it is possible to use keyboard keys to add device states. Forexample, with a touchscreen, we may nominate the escape key to be the ‘virtual’mouse button whilst the user’s finger is on the screen. Although the mixing of key-board and mouse keys is normally a bad habit, it is obviously necessary on occasions.
At first, the model appears to characterize the states of the device by the inputsavailable to the system. So, from this perspective, state 0 is clearly different from states 1 and 2. However, if we look at the state 1–2 transaction, we see that it is symmetric with respect to the two states. In principle, there is no reason why a program should not decide to do simple mouse tracking whilst in state 2 and dragthings about in state 1. That is, there is no reason until you want to type something!The way we can tell state 1 from state 2 is by the activity of the user. State 2 requiresa button to be pressed, whereas state 1 is one of relative relaxation (whilst still requir-ing hand–eye coordination for mouse movement). There is a similar difference intension between state 0 and state 1.
It is well known that Fitts’ law has different timing constants for different devices.Recall that Fitts’ law says that the time taken to move to a target of size S at a distanceD is:
a + b log2(D/S + 1)
The constants a and b depend on the particular pointing device used and the skill ofthe user with that device. However, the insight given by the three-state model is thatthese constants also depend on the device state. In addition to the timing, the finalaccuracy may be affected.
These observations are fairly obvious for state 0–1 devices. With a touchscreen, orlight pen, a cursor will often appear under the finger or pen when it comes in con-tact with the screen. The accuracy with which you can move the cursor around willbe far greater than the accuracy with which you can point in the first place. Also it isreasonable to expect that the Fitts’ law constant will be different, although not soobvious which will be faster.
There is a similar difference between states 1 and 2. Because the user is holding abutton down, the hand is in a state of tension and thus pointing accuracy and speedmay be different. Experiments to calculate Fitts’ law constants in states 1 and 2 have
Figure 12.2 Light pen transitions: three states

12.6 Cognitive architectures 443
shown that these differences do exist [221]. Table 12.2 shows the results obtained fora mouse and trackball.
We can recalculate the KLM prediction for the CLOSE-METHOD using these data.Recall that the method had two pointing operators, one to point to the window’s titlebar (with a distance to target size ratio of 10:1), the second to drag the selection downto ‘CLOSE’ on the pop-up menu (4:1). Thus the first pointing operator is state 1 andthe second is state 2. The times are thus
MouseP[to menu bar] = −107 + 223 log2(11) = 664 msP[to option] = 135 + 249 log2(5) = 713 ms
TrackballP[to menu bar] = 75 + 300 log2(11) = 1113 msP[to option] = −349 + 688 log2(5) = 1248 ms
giving a further revised time for the CLOSE-METHOD of 2.93 seconds using a mouseand 3.91 seconds using a trackball.
COGNITIVE ARCHITECTURES
The formalisms we have seen so far have some implicit or explicit model of how theuser performs the cognitive processing involved in carrying out a task. For instance,the concept of taking a problem and solving it by divide and conquer using subgoalsis central to GOMS. CCT assumes the distinction between long- and short-termmemory, with production rules being stored in long-term memory and ‘matched’against the contents of short-term (or working) memory to determine which ‘fire’.The values for various motor and mental operators in KLM were based on the ModelHuman Processor (MHP) architecture of Card, Moran and Newell [56]. Anothercommon assumption, which we have not discussed in this chapter, is the distinctionbetween linguistic levels – semantic, syntactic and lexical – as an architectural modelof the user’s understanding.
12.6
Table 12.2 Fitts’ law coefficients (after MacKenzie, Sellen and Buxton [221], © 1991ACM, Inc. Reprinted by permission)
Device a (ms) b (ms/bit)
Pointing (state 1)Mouse −107 223Trackball 75 300
Dragging (state 2)Mouse 135 249Trackball −349 688

444 Chapter 12 n Cognitive models
In Chapter 1, we discussed some of these architectural descriptions of the user asan information-processing machine. Our emphasis in this section will be to describea couple more architectural models that are quite distinct from those described inChapter 1 and assumed in the earlier parts of this chapter. Here we will see that thearchitectural assumptions are central to the description of the cognitive modelingthat these approaches offer.
There are interesting differences of emphasis between these architectural modelsand the previous models. The hierarchical and linguistic notations tend to assumeperfect dialog on the user’s part. They may measure the complexity of that perfectdialog, but tend not to consider diversions from the optimal command sequences.However, for the architectural models in this section the prediction and under-standing of error is central to their analyses.
12.6.1 The problem space model
Rational behavior is characterized as behavior that is intended to achieve a specificgoal. This element of rationality is often used to distinguish between intelligent andmachine-like behavior. In the field of artificial intelligence (AI), a system exhibitingrational behavior is referred to as a knowledge-level system. A knowledge-level systemcontains an agent behaving in an environment. The agent has knowledge about itself and its environment, including its own goals. It can perform certain actions and sense information about its changing environment. As the agent behaves in itsenvironment, it changes the environment and its own knowledge. We can view theoverall behavior of the knowledge-level system as a sequence of environment andagent states as they progress in time. The goal of the agent is characterized as a preference over all possible sequences of agent/environment states.
Contrast this rational behavior with another general computational model for a machine, which is not rational. In computer science, it is common to describe aproblem as the search through a set of possible states, from some initial state to a desired state. The search proceeds by moving from one state to another possiblestate by means of operations or actions, the ultimate goal of which is to arrive at oneof the desired states. This very general model of computation is used in the ordinarytask of the programmer. Once she has identified a problem and a means of arrivingat the solution to the problem (the algorithm), the programmer then represents the problem and algorithm in a programming language, which can be executed on amachine to reach the desired state. The architecture of the machine only allows thedefinition of the search or problem space and the actions that can occur to traversethat space. Termination is also assumed to happen once the desired state is reached.Notice that the machine does not have the ability to formulate the problem spaceand its solution, mainly because it has no idea of the goal. It is the job of the pro-grammer to understand the goal and so define the machine to achieve it.
We can adapt the state-based computational model of a machine in order to real-ize the architecture of a knowledge-level system. The new computational model is

12.6 Cognitive architectures 445
the problem space model, based on the problem-solving work of Newell and Simon at Carnegie–Mellon University (see Chapter 1). A problem space consists of a set ofstates and a set of operations that can be performed on the states. Behavior in a problem space is a two-step process. First, the current operator is chosen based onthe current state and then it is applied to the current state to achieve the new state.The problem space must represent rational behavior, and so it must characterize thegoal of the agent. A problem space represents a goal by defining the desired states as a subset of all possible states. Once the initial state is set, the task within the prob-lem space is to find a sequence of operations that form a path within the state spacefrom the initial state to one of the desired states, whereupon successful terminationoccurs.
From the above description, we can highlight four different activities that occurwithin a problem space: goal formulation, operation selection, operation applicationand goal completion. The relationship between these problem space processes andknowledge-level activity is key. Perception that occurs at the knowledge level is performed by the goal formulation process, which creates the initial state based onobservations of the external environment. Actions at the knowledge level are opera-tions in the problem space which are selected and applied. The real knowledge about the agent and its environment and goals is derived from the state/operatorinformation in the problem space. Because of the goal formulation process, the setof desired states indicates the knowledge-level goal within the problem space. Theoperation selection process selects the appropriate operation at a given point in timebecause it is deemed the most likely to transform the state in the problem space toone of the desired states; hence rational behavior is implied.
The cycle of activity within the problem space is as follows. Some change in theexternal environment, which is relevant to the goal of the agent, is sensed by the goal formulation process, which in turn defines the set of desired states for the agentand its initial state for the following task. The operation selection process suggests an operation that can act on that state and transform it ‘closer’ to a desired state. Theoperation application process executes the operation, changing the current state andsurrounding environment. If the new state is a desired state, then the goal has beenachieved and the goal completion process reverts the agent to inactive.
The real power of the problem space architecture is in recursion. The activity ofany of the processes occurs only when the knowledge it needs to complete its choreis immediately available. For example, to decide which operation is most likely tolead to a desired state, the problem space will need to know things about its currentstate and that of the environment. If that information is not immediately available,then activity cannot continue. In that case, another problem space is invoked withthe goal of finding out the information that was needed by the parent problem space.In this way, we can see the evolution of problems spaces as a stack-like structure, newspaces being invoked and placed on the problem space stack only to be popped offthe stack once they achieve their goal.
Though the problem space model described briefly above is not directly imple-mentable, it is the basis for at least one executable cognitive architecture, called Soar.

446 Chapter 12 n Cognitive models
We shall not discuss the details of Soar’s implementation here; instead we refer you to Laird, Newell and Rosenbloom [205]. An interesting application of the Soar implementation of problem spaces has been done by Young and colleagues onprogrammable user models (or PUMs) [386]. Given a designer’s description of anintended procedure or task that is to be carried out with an interactive system, an analysis of that procedure produces the knowledge that would be necessary andavailable for any user attempting the task. That knowledge is encoded in the prob-lem space architecture of Soar, producing a ‘programmed’ user model (the PUM) to accomplish the goal of performing the task. By executing the PUM, the stackingand unstacking of problem spaces needed to accomplish the goal can be analyzed to measure the cognitive load of the intended procedure. More importantly, if the PUM cannot achieve the goal because it cannot find some knowledge necessaryto complete the task, this indicates to the designer that there is a problem with the intended design. In this way, erroneous behavior can be predicted before implementation.
12.6.2 Interacting cognitive subsystems
Barnard has proposed a very different cognitive architecture, called interacting cog-nitive subsystems (ICS) [24, 25, 27]. ICS provides a model of perception, cognitionand action, but unlike other cognitive architectures, it is not intended to produce a description of the user in terms of sequences of actions that he performs. ICS provides a more holistic view of the user as an information-processing machine. Theemphasis is on determining how easy particular procedures of action sequencesbecome as they are made more automatic within the user.
ICS attempts to incorporate two separate psychological traditions within one cognitive architecture. On the one hand is the architectural and general-purposeinformation-processing approach of short-term memory research. On the otherhand is the computational and representational approach characteristic of psycho-linguistic research and AI problem-solving literature.
The architecture of ICS is built up by the coordinated activity of nine smaller subsystems: five peripheral subsystems are in contact with the physical world andfour are central, dealing with mental processes. Each subsystem has the same gen-eric structure. A subsystem is described in terms of its typed inputs and outputs along with a memory store for holding typed information. It has transformationfunctions for processing the input and producing the output and permanently storedinformation. Each of the nine subsystems is specialized for handling some aspect ofexternal or internal processing. For example, one peripheral subsystem is the visualsystem for describing what is seen in the world. An example of a central subsystemis one for the processing of propositional information, capturing the attributes andidentities of entities and their relationships with each other (a particular example isthat propositional information represents ‘“knowing” that a particular word has foursyllables, begins with “P” and refers to an area in central London’ [27]).

12.7 Summary 447
ICS is another example of a general cognitive architecture that can be applied to interactive design. One of the features of ICS is its ability to explain how a userproceduralizes action. Remember in the discussion of CCT we distinguishedbetween novice and expert use of an interactive system. Experts can perform com-plicated sequences of actions as if without a thought, whereas a novice user mustcontemplate each and every move (if you do not believe this distinction is accurate,observe users at an ATM and see if you can tell the expert from the novice). Theexpert recognizes the task situation and recalls a ‘canned’ procedure of actionswhich, from experience, results in the desired goal being achieved. They do not haveto think beyond the recognition of the task and consequent invocation of the correctprocedure. Such proceduralized behavior is much less prone to error. A gooddesigner will aid the user in proceduralizing his interaction with the system and willattempt to design an interface that suggests to the user a task for which he alreadyhas a proceduralized response. It is for this reason that ICS has been suggested as a design tool that can act as an expert system to advise a designer in developing an interface.
SUMMARY
In this chapter, we have discussed a wide selection of cognitive models of the users of interactive systems. Cognitive models attempt to represent the users as they interact with a system, modeling aspects of their understanding, knowledge,intentions or processing. We divided cognitive models into three categories. The first described the hierarchical structuring of the user’s task and goal structures. The GOMS model and CCT were examples of cognitive models in this category. The second category was concerned with linguistic and grammatical models, whichemphasized the user’s understanding of the user–system dialog. BNF and TAG weredescribed as examples in this category. Most of these cognitive models have focussedon the execution activity of the user, neglecting his perceptive ability and how that might affect less planned and natural interaction strategies. The third categoryof cognitive models was based on the more solid understanding of the human motorsystem, applicable in situations where the user does no planning of behavior and executes actions automatically. KLM was used to provide rough measures of userperformance in terms of execution times for basic sequences of actions. Buxton’sthree-state model for pointing devices allowed for a finer distinction between execu-tion times than with KLM. We concluded this chapter with a discussion of cognitivearchitectures, the assumptions of which form the foundation for any cognitive models. In addition to the basic architectural distinction between long- and short-term memory, we discussed two other cognitive architectures – the problem spacemodel and ICS – which apply different assumptions to the analysis of interactive systems.
12.7

448 Chapter 12 n Cognitive models
RECOMMENDED READING
S. K. Card, T. P. Moran and A. Newell, The Psychology of Human ComputerInteraction, Lawrence Erlbaum, 1983.A classic text in this field of cognitive models, in which the basic architecturalassumptions of the Model Human Processor architecture are explained as well asthe GOMS model and KLM.
S. Bovair, D. E. Kieras and P. G. Polson, The acquisition and performance of text-editing skill: a cognitive complexity analysis, Human–Computer Interaction,Vol. 5, No. 1, pp. 1–48, 1990.This article provides a definitive description of CCT by means of an extendedexample. The authors also provide the definition of various style rules for writingCCT descriptions to distinguish, for example, between novice and expert users.
F. Schiele and T. Green, HCI formalisms and cognitive psychology: the case oftask–action grammars. In M. D. Harrison and H. W. Thimbleby, editors, FormalMethods in Human–Computer Interaction, Chapter 2, Cambridge UniversityPress, 1990.
EXERCISES
12.1 Recall the CCT description of the rule INSERT-SPACE-2 discussed in Section 12.2.2:
(INSERT-SPACE-2
IF (AND (TEST-GOAL insert space)
(TEST-CURSOR %LINE %COL) )
THEN ( (DO-KEYSTROKE ‘I’)
(DO-KEYSTROKE SPACE)
(DO-KEYSTROKE ESC)
(DELETE-GOAL insert space) ))
As we discussed, this is already proceduralized; that is, the rule is an expert rule. Write new ‘novice’ rules where the three keystrokes are not proceduralized. That is, you should haveseparate rules for each keystroke and suitable goals (such as GET-INTO-INSERT-MODE) to firethem.
12.2 One of the assumptions underlying the programmable user model approach is that it is possibleto provide an algorithm to describe the user’s behavior in interacting with a system. Taking this position to the extreme, choose some common task with a familiar interactive system (forexample, creating a column of numbers in a spreadsheet and calculating their sum, or any othertask you can think of) and describe the algorithm needed by the user to accomplish this task.Write the description in pseudocode. Does this exercise suggest any improvements in the system?

Recommended reading 449
A good description of TAG with several extended examples based on theMacintosh interface. The authors provide a good comparative analysis of TAGversus other cognitive modeling techniques.
A. Newell, G. Yost, J. E. Laird, P. S. Rosenbloom and E. Altmann, Formulating theproblem-space computational model. In R. F. Rashid, editor, CMU ComputerScience: A 25th Anniversary Commemorative, Chapter 11, ACM Press, 1991.The description of the problem space cognitive architecture was informed by thisarticle, which also contains references to essential work on the Soar platform.
J. Carroll, editor, HCI Models, Theories, and Frameworks: Toward an InterdisciplinaryScience, Morgan Kaufmann, 2003.See chapters by Scott MacKenzie on motor behavior models (Fitts’ law andbeyond), Bonnie John on information processing and skilled behavior (GOMSand related models) and Stephen Payne on cognitive and mental models.

SOCIO-ORGANIZATIONAL
ISSUES AND STAKEHOLDER
REQUIREMENTS
OV E RV I E W
n There are several organizational issues that affect theacceptance of technology by users and that musttherefore be considered in system design:– systems may not take into account conflict and
power relationships– those who benefit may not do the work– not everyone may use systems.
n In addition to generic issues, designers must identifyspecific stakeholder requirements within theirorganizational context.
n Socio-technical models capture both human andtechnical requirements.
n Soft systems methodology takes a broader view ofhuman and organizational issues.
n Participatory design includes the user directly in thedesign process.
n Ethnographic methods study users in context,attempting to take an unbiased perspective.
13

13.2 Organizational issues 451
INTRODUCTION
As we saw in Chapter 3, technology does not exist in a vacuum. It is used within aspecific context, and is influenced by many factors within that context. The differentpeople affected by the introduction of a system are known as stakeholders and theirneeds can be both complex and conflicting. In addition, we need to understand howthe introduction of the system might actually change the organizational and workpractices that are currently in place and what the impact of this might be.
In this chapter we look in more detail at the socio-organizational context of useand discuss some of the generic issues that can affect the acceptance of technology in organizations. We then look at a number of approaches to modeling the socio-organizational context and the requirements of the stakeholders within it.
Requirements capture is an important part of all software engineering methodo-logies but often this activity focusses primarily on the functional requirements of thesystem – what the system must be able to do – with less emphasis on non-functionalhuman issues such as usability and acceptability. Even where such matters are considered, they may reflect only the management’s view of the user’s needs ratherthan gathering information from the users themselves. Stakeholder requirementsmodeling redresses this balance by identifying the needs of all stakeholders, includ-ing the user and anyone else affected by the system, within the context in which itwill be used.
We will begin this chapter by discussing some of the organizational issues thatarise when new technological solutions are introduced. We then outline a number ofmodels and methods that can be used to capture this broader view of stakeholderrequirements, including socio-technical models, soft systems methodology, particip-atory design and the ethnographic approach.
ORGANIZATIONAL ISSUES
In this section, we shall look at some of the organizational issues that affect theacceptance and relevance of information and communication systems. These factorsoften sit ‘outside’ the system as such, and may involve individuals who never use it.Yet it is often these factors more than any other that determine the success or failureof computer systems. Many systems supporting work in organizations are support-ing groups of workers, but this may be through specialist groupware systems (seeChapter 19) or through shared data or processes.
13.2.1 Cooperation or conflict?
The term ‘computer-supported cooperative work’ (CSCW) seems to assume thatgroups will be acting in a cooperative manner. This is obviously true to some extent;
13.2
13.1
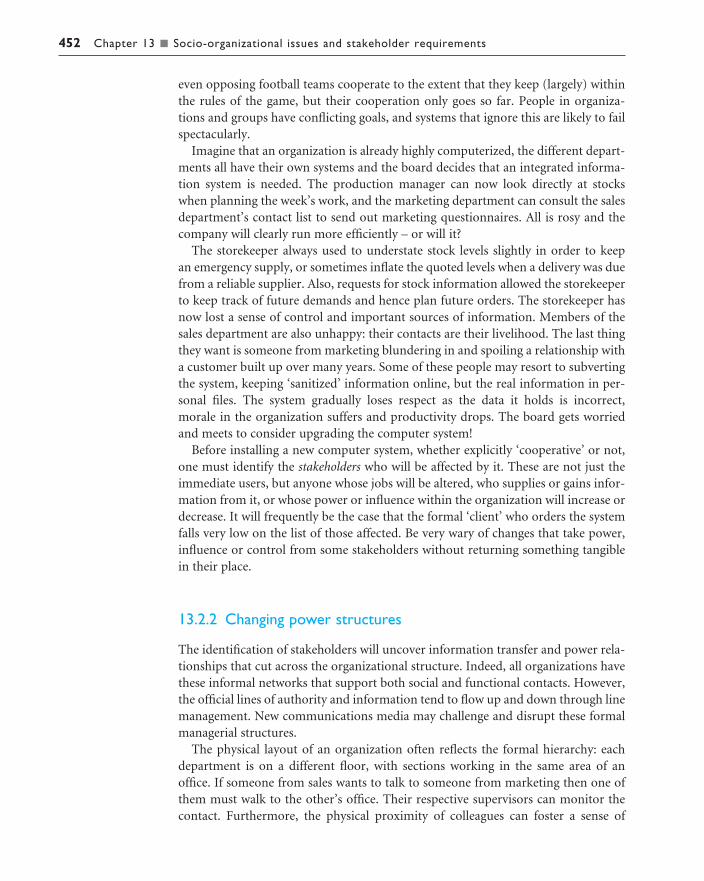
452 Chapter 13 n Socio-organizational issues and stakeholder requirements
even opposing football teams cooperate to the extent that they keep (largely) withinthe rules of the game, but their cooperation only goes so far. People in organiza-tions and groups have conflicting goals, and systems that ignore this are likely to failspectacularly.
Imagine that an organization is already highly computerized, the different depart-ments all have their own systems and the board decides that an integrated informa-tion system is needed. The production manager can now look directly at stocks when planning the week’s work, and the marketing department can consult the salesdepartment’s contact list to send out marketing questionnaires. All is rosy and thecompany will clearly run more efficiently – or will it?
The storekeeper always used to understate stock levels slightly in order to keep an emergency supply, or sometimes inflate the quoted levels when a delivery was duefrom a reliable supplier. Also, requests for stock information allowed the storekeeperto keep track of future demands and hence plan future orders. The storekeeper hasnow lost a sense of control and important sources of information. Members of thesales department are also unhappy: their contacts are their livelihood. The last thingthey want is someone from marketing blundering in and spoiling a relationship witha customer built up over many years. Some of these people may resort to subvertingthe system, keeping ‘sanitized’ information online, but the real information in per-sonal files. The system gradually loses respect as the data it holds is incorrect, morale in the organization suffers and productivity drops. The board gets worriedand meets to consider upgrading the computer system!
Before installing a new computer system, whether explicitly ‘cooperative’ or not,one must identify the stakeholders who will be affected by it. These are not just theimmediate users, but anyone whose jobs will be altered, who supplies or gains infor-mation from it, or whose power or influence within the organization will increase ordecrease. It will frequently be the case that the formal ‘client’ who orders the systemfalls very low on the list of those affected. Be very wary of changes that take power,influence or control from some stakeholders without returning something tangiblein their place.
13.2.2 Changing power structures
The identification of stakeholders will uncover information transfer and power rela-tionships that cut across the organizational structure. Indeed, all organizations havethese informal networks that support both social and functional contacts. However,the official lines of authority and information tend to flow up and down through linemanagement. New communications media may challenge and disrupt these formalmanagerial structures.
The physical layout of an organization often reflects the formal hierarchy: eachdepartment is on a different floor, with sections working in the same area of anoffice. If someone from sales wants to talk to someone from marketing then one ofthem must walk to the other’s office. Their respective supervisors can monitor thecontact. Furthermore, the physical proximity of colleagues can foster a sense of

13.2 Organizational issues 453
departmental loyalty. An email system has no such barriers; it is as easy to ‘chat’ tosomeone in another department as in your own. This challenges the mediating andcontrolling role of the line managers.
Furthermore, in face-to-face conversation, the manager can easily exert influenceover a subordinate: both know their relative positions and this is reflected in the patterns of conversation and in other non-verbal cues. Email messages lose much of this sense of presence and it is more difficult for a manager to exercise authority.The ‘levelling’ effect even makes it possible for subordinates to direct messages ‘diagonally’ across the hierarchy, to their manager’s peers, or, even worse, to theirmanager’s manager!
Many organizations are moving toward flatter management structures anyway, sofrom a strategic viewpoint these effects may be acceptable. But can the organizationcope with a disaffected junior management during the transition? For other organ-izations the effects may be less welcome and the system dropped or heavily regulated.In one case, an email system was introduced and was agreed to be functioning well,but the management, feeling a loss of control and suspicion over their subordinates’communications, introduced logging so that all email messages could be monitored.The system quickly fell into disuse. Logging of email is becoming more widespreadwith employers using it to identify cases of system ‘abuse’ by employees. But suchactivity must be handled carefully: it is as likely to backfire on the management byreducing the productive use of email as it is to have the desired effect.
Technology can be an important vector of social change, but if violent reaction isto be avoided, the impact of the technology must be assessed before it is introduced.In the short term, solutions must be carefully matched to the existing social andorganizational structures.
13.2.3 The invisible worker
The ability to work and collaborate at a distance can allow functional groups to be distributed over different sites. This can take the form of cross-functionalneighbourhood centers, where workers from different departments do their jobs in electronic contact with their functional colleagues. Alternatively, distributed group-ware can allow the true home-based teleworker to operate on similar terms to anoffice-based equivalent. The ecological and economic advantages of such workingpractices are now becoming well established, and it seems that communications andCSCW technology can overcome many of the traditional barriers.
In fact, a closer examination reveals that the barriers to such working are not technological but managerial. First of all, management style may make remote working all but impossible. If the approach in an organization is ‘management bypresence’, that is you know someone is working because they are in the office, thenthere is no way a remote worker is going to be trusted. If, on the other hand, the styleis ‘management by objectives’, that is you know your subordinates are workingbecause they are doing their jobs and producing results, then remote working is not so problematical. Even where remote working is accepted, the lack of physical

454 Chapter 13 n Socio-organizational issues and stakeholder requirements
presence can be a problem. When the time comes for promotion, the presentemployee may seem more worthy than the distant one – not because of any object-ive criteria, but because presence increases perceived worth.
We can see that, again, social and managerial relationships completely dominatetechnological considerations. Many video-based groupware systems are intended tocreate a sense of engagement, of active participation and social presence. Whetherthis will be sufficient to overcome ingrained attitudes remains to be seen.
13.2.4 Who benefits?
One frequent reason for the failure of information systems is that the people who getthe benefits from the system are not the same as those who do the work. One ex-ample, which we discuss in more detail in Chapter 19, is structured message systemssuch as Lens. In these systems the sender has to do work in putting information intofields appropriately, but it is the recipient who benefits. Another example is sharedcalendars. The beneficiary of the system is a manager who uses the system to arrangemeeting times, but whose personal secretary does the work of keeping the calendarup to date. Subordinates are less likely to have secretarial support, yet must keep upthe calendar with little perceived benefit. Of course, chaos results when a meeting isautomatically arranged and the subordinates may have to rearrange commitmentsthat have not been recorded on the system. The manager may force use by edict orthe system may simply fall into disuse. Many such groupware systems are introducedon a ‘see if it works’ basis, and so the latter option is more likely.
The lesson is that information systems should aim for some level of symmetry. If you have to do work for the system, you should obtain some benefit from it. For the shared calendar, this might involve improving the personal user interface, sothat there are definite advantages in using the online system to plan your time ratherthan using paper (it could even print out Filofax pages). In addition, if people useelectronic organizers one could consider integrating these into the system.
13.2.5 Free rider problem
Even where there is no bias toward any particular people, a system may still not function symmetrically, which may be a problem, particularly with shared com-munication systems. One issue is the free rider problem. Take an electronic con-ferencing system. If there is plenty of discussion of relevant topics then there areobvious advantages to subscribing and reading the contributions. However, whenconsidering writing a contribution, the effort of doing so may outweigh any benefits.The total benefit of the system for each user outweighs the costs, but for any particu-lar decision the balance is overturned.
To see this situation in a different context imagine an eccentric philanthropist whohas gathered three strangers into a room. They are invited to throw money into a potin the center. When they have done so, the philanthropist will double the money in the pot and then divide it up between them and send them on their way. Each
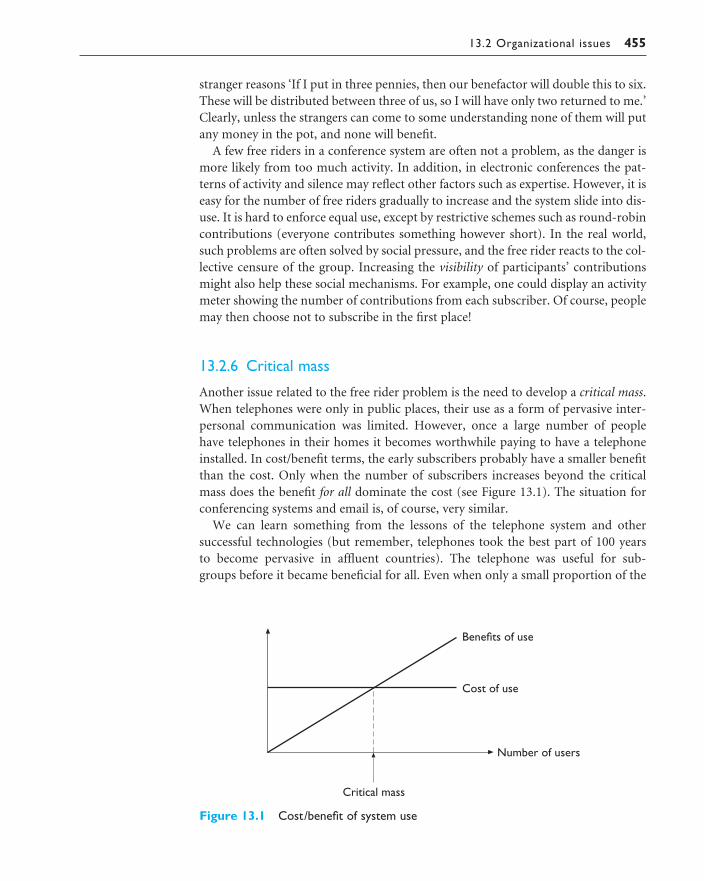
13.2 Organizational issues 455
stranger reasons ‘If I put in three pennies, then our benefactor will double this to six.These will be distributed between three of us, so I will have only two returned to me.’Clearly, unless the strangers can come to some understanding none of them will putany money in the pot, and none will benefit.
A few free riders in a conference system are often not a problem, as the danger ismore likely from too much activity. In addition, in electronic conferences the pat-terns of activity and silence may reflect other factors such as expertise. However, it iseasy for the number of free riders gradually to increase and the system slide into dis-use. It is hard to enforce equal use, except by restrictive schemes such as round-robincontributions (everyone contributes something however short). In the real world,such problems are often solved by social pressure, and the free rider reacts to the col-lective censure of the group. Increasing the visibility of participants’ contributionsmight also help these social mechanisms. For example, one could display an activitymeter showing the number of contributions from each subscriber. Of course, peoplemay then choose not to subscribe in the first place!
13.2.6 Critical mass
Another issue related to the free rider problem is the need to develop a critical mass.When telephones were only in public places, their use as a form of pervasive inter-personal communication was limited. However, once a large number of people have telephones in their homes it becomes worthwhile paying to have a telephoneinstalled. In cost/benefit terms, the early subscribers probably have a smaller benefitthan the cost. Only when the number of subscribers increases beyond the criticalmass does the benefit for all dominate the cost (see Figure 13.1). The situation forconferencing systems and email is, of course, very similar.
We can learn something from the lessons of the telephone system and other successful technologies (but remember, telephones took the best part of 100 years to become pervasive in affluent countries). The telephone was useful for sub-groups before it became beneficial for all. Even when only a small proportion of the
Figure 13.1 Cost/benefit of system use

456 Chapter 13 n Socio-organizational issues and stakeholder requirements
population had personal telephones, they still formed a significant proportion oftheir social group, so these cliques of use could grow gradually over time.
The same is true of email. Even a group of two or three people in an organizationcan use email effectively between themselves. If an organization consists of wideningcircles of highly connected subgroups, then take-up can grow from the core to thewider group. Of course, the benefits increase as it becomes pervasive, but even a tinyuser group ensures that the benefits outweigh the costs. Clearly, we must design anynew system so that it has benefits even when its user population is small.
13.2.7 Automating processes – workflow and BPR
The major task in many organizations is moving pieces of paper around. An order is received by phone and an order form filled in by the sales executive. The orderform is passed to accounts who check the credit rating and if all is okay it is passedon to stores who check availability and collect the order together at the picking line.When the order is dispatched, a delivery note is packed with the order and a copy isreturned to accounts, who send an invoice to the customer.
Organizations have many such processes, and workflow systems aim to automatemuch of the process using electronic forms, which are forwarded to the relevant person based on pre-coded rules. Some workflow systems are built using special-purpose groupware, often based on a notation for describing the desired workflow.Coordinator (see Section 14.3.6) is an example of a workflow system where the rulesare heavily influenced by speech act theory. In addition, workflow systems may beimplemented using more general structured message systems, including Lotus Notes(see the Design Focus in this section).
The rigid form of a typical workflow system is an example of global structuring(see Chapter 19 for more details). The danger with any form of global structuring isthat it may conflict with or inhibit more informal and less structured patterns ofactivity which also contribute to the organization’s free running.
A more radical approach to organizational processes is found in business processre-engineering (BPR). Traditionally, organizations have been structured aroundfunctions: sales, accounts, stores, manufacturing. However, the purpose of an organ-ization can be seen in terms of key business processes. The ordering/delivery pro-cess described above is a typical and important example. In BPR these processes are recorded and analyzed. Problems in the current process are noted and the whole process may be redesigned in order to make the path of the process moreefficient. For example, instead of sending an order to the accounts department toapprove, a list of customer credit limits could be given to the sales executives. Theycould then check the credit rating of the customer whilst on the phone and only forward the order to accounts if there are any unusual problems. Finally, and mostradically, the whole structure of the organization may be modified to reflect andsupport the key processes more closely. Typically, this involves stripping layers ofmiddle management. BPR as an issue engenders zealots and reactionaries in equalmeasure.

13.2 Organizational issues 457
13.2.8 Evaluating the benefits
We have seen several problems that can arise from the mismatch between informa-tion systems and organizational and social factors. Let us assume that we have a sys-tem in place – and it has not fallen apart at the seams. Everyone seems happy with itand there are no secret resentments. Now it is time to count the cost – it was anexpensive system to buy and install, but was it worth it?
This is an almost impossible question to answer. The benefits from cooperativesystems, especially organization-wide systems such as email or electronic conferen-cing, are in terms of job satisfaction or more fluid information flow. Some, such as the video wall (see Chapter 19), are expected primarily to help social contact withinthe organization. It may be possible to measure contentment and job satisfaction
DESIGN FOCUS
Implementing workflow in Lotus Notes
Lotus Notes can be used to implement workflow systems in a straightforward manner. The sales execut-ive fills in an electronic form which is automatically emailed to the accounts department. When it isapproved the order form is automatically emailed to stores, and so on.
However, interruptions due to email can be disruptive and reduce efficiency. An alternative is activelynot to mail items for action to people, but instead to make them available within their electronic envir-onment. This is like the difference between having a form for approval pushed in front of you to signcompared with having a pile of order forms sitting in your in-tray. In the latter case you can organizeyour own work, but cannot forget to process the forms as they sit as a permanent reminder – an environmental cue.
Within the electronic world of Notes such environmental cues can be implemented using its viewsmechanism. Each database can have associated several views, lists of items in the database. Thedefinition of the view specifies which fields of each item should be listed and also which items shouldbe included in the list, based on various criteria. The simplest filtering criterion is the type of the mes-sage, but more complex criteria can include the state of various fields.
In the ordering process example, there can be a single database. When an order is received, the salesexecutive creates a new order item and fills in the details of the customer and required products.However, the sales executive does not have write permission for the ‘approved’ field. The accountsdepartment has a view of the same database. This view lists only those orders which have completedcustomer details, but a blank ‘approved’ field. Thus all orders received appear in this listing until theyhave the ‘approved’ field completed, at which point they disappear from the view (but not thedatabase). Similarly, the stores department has a view whose rule only shows orders with a completed‘approved’ field. Thus the views act as a sort of to-do list.
In the first scenario, the workflow is automated and control rests in the system. In the second scenario,the workflow is supported leaving control to the users.

458 Chapter 13 n Socio-organizational issues and stakeholder requirements
using attitude questionnaires (see Chapter 9), but any hard economic benefit will be so diffuse as to be unquantifiable.
However, a similar argument could be (and has been) framed for computer use in general. The benefits are difficult to quantify, but, over time, it has become clearthat the competitive edge of information technology is necessary for survival in themodern world. Perhaps the same will be said of cooperative systems in a few years.
CAPTURING REQUIREMENTS
As we have already seen, problems can arise when a system is introduced without a full understanding of all the people who will be affected by it. But how can we better understand and support complex organizational structures, workgroups andpotentially conflicting stakeholder needs? We begin by capturing and analyzingrequirements, but we need to do this within the work context, taking account of thecomplex mix of concerns felt by different stakeholders and the structures and pro-cesses operating in the workgroups.
In this section we consider several approaches: socio-technical modeling, soft systems methodology, participatory design, ethnographic methods and contextualinquiry. All are aimed at understanding the reality of work contexts and the per-spectives of different stakeholders. All recognize that technology can be successfullydeployed only if it is done with an understanding of the context of use, but each takesa slightly different approach to the problem. Before we look in more detail at theseapproaches we need to clarify what we mean when we talk about ‘stakeholders’.
13.3.1 Who are the stakeholders?
Understanding stakeholders is key to many of the approaches to requirements cap-ture, since in an organizational setting it is not simply the end-user who is affectedby the introduction of new technology. Imagine that a new billing system is to beintroduced by a local gas supplier. Who will be affected by this decision? Obviously,the people who are responsible for producing and sending out bills – they will be the ones using the system directly. But where do they get the information from to produce the bills? To whom do they send the bills? Who determines the level of charging and on what grounds? Who stands to make a profit from increased revenue? Who will suffer if customers choose to switch supplier due to the improvedservice? Meter readers, customers, managers, regulators, shareholders and com-petitors are all stakeholders in the system. We need approaches that will capture thecomplexity of their concerns, which may be in conflict with each other.
A stakeholder, therefore, can be defined as anyone who is affected by the successor failure of the system. It can be useful to distinguish different categories of stake-holder, and the following categorization from the CUSTOM approach (see [200]) ishelpful for this:
13.3

13.3 Capturing requirements 459
Primary stakeholders are people who actually use the system – the end-users.
Secondary stakeholders are people who do not directly use the system, but receiveoutput from it or provide input to it (for example, someone who receives a reportproduced by the system).
Tertiary stakeholders are people who do not fall into either of the first two categoriesbut who are directly affected by the success or failure of the system (for example,a director whose profits increase or decrease depending on the success of the system).
Facilitating stakeholders are people who are involved with the design, developmentand maintenance of the system.
The aim of the design team is to meet the needs of as many stakeholders as pos-sible. However, the reality is that usually stakeholder needs are in conflict with eachother. Sometimes this does not matter: a company is unlikely to be too concernedthat its competitors’ requirement to maintain advantage over it is under threat by the new system (though they need to be aware to monitor how effectively they aremaintaining their advantage). However, sometimes it does matter. In the exampleabove, the airline booking system must be usable by travel agency staff but must also fulfill the customer need to find an appropriate ticket at the right price. If it fails in this, the whole system will fail, as the customer will go elsewhere and businesswill be lost.
As a general rule, the priority of stakeholder needs diminishes as you go down thecategories. So primary stakeholders usually take priority over the others. However,this is not always the case. Imagine designing the control panel of a hospital life sup-port machine. The primary stakeholders will be medical staff monitoring a patient’scondition. But who, in fact, has the greatest interest in this system working? Surely itis the patient, whose life is dependent on the system’s success? In this case the tertiarystakeholder is of vital importance.
All of the approaches we are considering here are concerned with understandingstakeholders within their organizational context.
Classifying stakeholders – an airline booking system
An international airline is considering introducing a new booking system for use by associ-ated travel agents to sell flights directly to the public. The stakeholders can be classified as follows:
n Primary stakeholders: travel agency staff, airline booking staffn Secondary stakeholders: customers, airline managementn Tertiary stakeholders: competitors, civil aviation authorities, customers’ traveling compan-
ions, airline shareholdersn Facilitating stakeholders: design team, IT department staff

460 Chapter 13 n Socio-organizational issues and stakeholder requirements
13.3.2 Socio-technical models
Early in the twentieth century, studies of work focussed on how humans needed to adapt to technical innovations. Technological determinism, the view that socialchange is primarily dictated by technology, with human and social factors being secondary concerns, was prevalent. The socio-technical systems view came about to counter this technology-centric position, by stressing that work systems werecomposed of both human and machine elements and that it was the interrelation-ship between these that should be central.
Socio-technical models for interactive systems are therefore concerned with tech-nical, social, organizational and human aspects of design. They recognize the factthat technology is not developed in isolation but as part of a wider organizationalenvironment. It is important to consider social and technical issues side by side so that human issues are not overruled by technical considerations.
The key focus of the socio-technical approach is to describe and document theimpact of the introduction of a specific technology into an organization. Methodsvary but most attempt to capture certain common elements:
n The problem being addressed: there is a need to understand why the technologyis being proposed and what problem it is intended to solve.
n The stakeholders affected, including primary, secondary, tertiary and facilitating,together with their objectives, goals and tasks.
n The workgroups within the organization, both formal and informal.n The changes or transformations that will be supported.n The proposed technology and how it will work within the organization.n External constraints and influences and performance measures.
Information is gathered using methods such as interviews, observation, focus groupsand document analysis. The methods guide this information-gathering process andhelp the analyst to make sense of what is discovered. By attempting to understandthese issues, socio-technical approaches aim to provide a detailed view of the roletechnology will play and the requirements of successful deployment.
We will compare two approaches to illustrate how this may work in practice.
CUSTOM methodology
CUSTOM is a socio-technical methodology designed to be practical to use in small organizations [200]. It is based on the User Skills and Task Match (USTM)approach, developed to allow design teams to understand and fully document userrequirements [219]. CUSTOM focusses on establishing stakeholder requirements: all stakeholders are considered, not just the end-users.
It is applied at the initial stage of design when a product opportunity has beenidentified, so the emphasis is on capturing requirements. It is a forms-based methodo-logy, providing a set of questions to apply at each of its stages.
There are six key stages to carry out in a CUSTOM analysis:

13.3 Capturing requirements 461
1. Describe the organizational context, including its primary goals, physical charac-teristics, political and economic background.
2. Identify and describe stakeholders. All stakeholders are named, categorized (asprimary, secondary, tertiary or facilitating) and described with regard to personalissues, their role in the organization and their job. For example, CUSTOMaddresses issues such as stakeholder motivation, disincentives, knowledge, skills,power and influence within the organization, daily tasks and so on.
3. Identify and describe work-groups. A work-group is any group of people who worktogether on a task, whether formally constituted or not. Again, work-groups aredescribed in terms of their role within the organization and their characteristics.
4. Identify and describe task–object pairs. These are the tasks that must be performed,coupled with the objects that are used to perform them or to which they are applied.
5. Identify stakeholder needs. Stages 2–4 are described in terms of both the currentsystem and the proposed system. Stakeholder needs are identified by consideringthe differences between the two. For example, if a stakeholder is identified as cur-rently lacking a particular skill that is required in the proposed system then a needfor training is identified.
6. Consolidate and check stakeholder requirements. Here the stakeholder needs listis checked against the criteria determined at earlier stages.
Stages 2 to 4 are described in terms of the current situation (before the new techno-logy is introduced) and the proposed situation (after deployment). Stakeholders areasked to express their views not only of their current role and position but of theirexpectations in the light of the changes that will be made. In this way, stakeholderconcerns and goals are elaborated. In addition, the impact of the technology onworking practices is considered (Stage 3) and the transformations that will be sup-ported by the system specified (Stage 4).
A shorter version of CUSTOM stakeholder analysis
CUSTOM questions investigate a range of stakeholder characteristics, such as the following:
n What does the stakeholder have to achieve and how is success measured?n What are the stakeholder’s sources of job satisfaction? What are the sources of dissatisfaction
and stress?n What knowledge and skills does the stakeholder have?n What is the stakeholder’s attitude toward work and computer technology?n Are there any work-group attributes that will affect the acceptability of the product to the
stakeholder?n What are the characteristics of the stakeholder’s task in terms of frequency, fragmentation and
choice of actions?n Does the stakeholder have to consider any particular issues relating to responsibility, security
or privacy?n What are the physical conditions in which the stakeholder is working?

462 Chapter 13 n Socio-organizational issues and stakeholder requirements
The changes from the current position to the proposed position represent theissues that need to be addressed to ensure successful deployment, and these are madeexplicit during Stages 5 and 6.
CUSTOM provides a useful framework for considering stakeholder requirementsand the use of forms and questions (a ‘manual’ for its use is available [200]) makesit relatively straightforward, if somewhat time consuming, to apply. For less complexsituations, a shortened version of CUSTOM stakeholder analysis is available (see theboxed text above). This also provides a checklist for investigations for stages 2–4.
Open System Task Analysis (OSTA)
OSTA [116] is an alternative socio-technical approach, which attempts to describewhat happens when a technical system is introduced into an organizational workenvironment. Like CUSTOM, OSTA specifies both social and technical aspects of thesystem. However, whereas in CUSTOM these aspects are framed in terms of stake-holder perspectives, in OSTA they are captured through a focus on tasks.
OSTA has eight main stages:
1. The primary task which the technology must support is identified in terms ofusers’ goals.
2. Task inputs to the system are identified. These may have different sources andforms that may constrain the design.
3. The external environment into which the system will be introduced is described,including physical, economic and political aspects.
4. The transformation processes within the system are described in terms of actionsperformed on or with objects.
5. The social system is analyzed, considering existing work-groups and relationshipswithin and external to the organization.
6. The technical system is described in terms of its configuration and integrationwith other systems.
7. Performance satisfaction criteria are established, indicating the social and tech-nical requirements of the system.
8. The new technical system is specified.
OSTA uses notations familiar to designers, such as data flow diagrams and textualdescriptions.
13.3.3 Soft systems methodology
The socio-technical models we have looked at focus on identifying requirementsfrom both human and technical perspectives, but they assume a technological solu-tion is being proposed. Soft systems methodology (SSM) arises from the same tradi-tion but takes a view of the organization as a system of which technology and peopleare components. There is no assumption of a particular solution: the emphasis israther on understanding the situation fully. SSM was developed by Checkland [66]
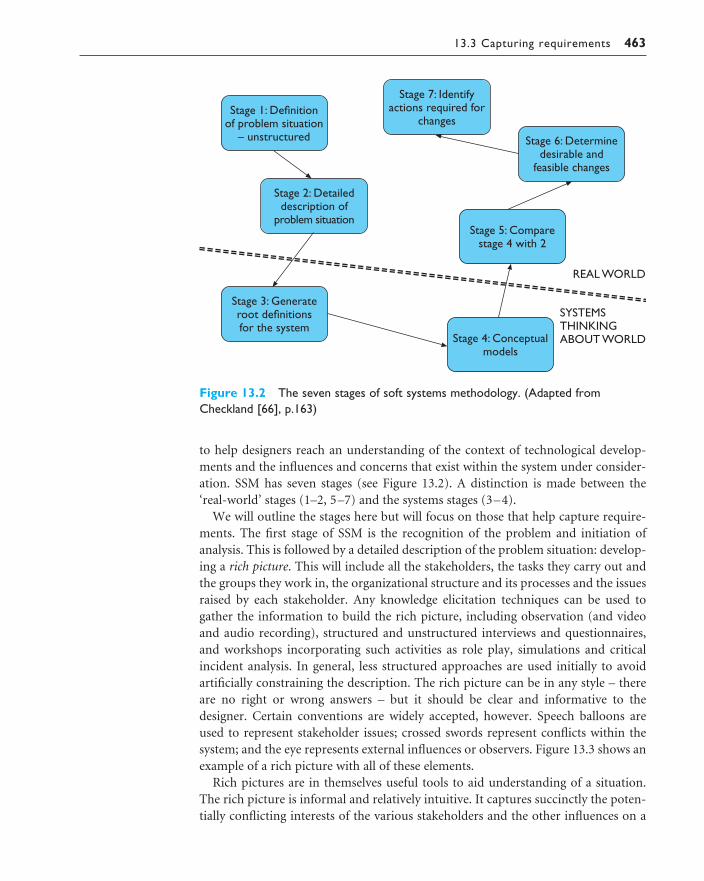
13.3 Capturing requirements 463
to help designers reach an understanding of the context of technological develop-ments and the influences and concerns that exist within the system under consider-ation. SSM has seven stages (see Figure 13.2). A distinction is made between the‘real-world’ stages (1–2, 5–7) and the systems stages (3–4).
We will outline the stages here but will focus on those that help capture require-ments. The first stage of SSM is the recognition of the problem and initiation of analysis. This is followed by a detailed description of the problem situation: develop-ing a rich picture. This will include all the stakeholders, the tasks they carry out andthe groups they work in, the organizational structure and its processes and the issuesraised by each stakeholder. Any knowledge elicitation techniques can be used togather the information to build the rich picture, including observation (and videoand audio recording), structured and unstructured interviews and questionnaires,and workshops incorporating such activities as role play, simulations and criticalincident analysis. In general, less structured approaches are used initially to avoidartificially constraining the description. The rich picture can be in any style – thereare no right or wrong answers – but it should be clear and informative to thedesigner. Certain conventions are widely accepted, however. Speech balloons areused to represent stakeholder issues; crossed swords represent conflicts within thesystem; and the eye represents external influences or observers. Figure 13.3 shows anexample of a rich picture with all of these elements.
Rich pictures are in themselves useful tools to aid understanding of a situation.The rich picture is informal and relatively intuitive. It captures succinctly the poten-tially conflicting interests of the various stakeholders and the other influences on a
Figure 13.2 The seven stages of soft systems methodology. (Adapted fromCheckland [66], p.163)

464 Chapter 13 n Socio-organizational issues and stakeholder requirements
Fig
ure
13.3
A r
ich
pict
ure
of a
tra
vel a
genc
y

13.3 Capturing requirements 465
design situation. It provides an understandable summary of the designer’s under-standing that can be easily checked with stakeholders, and it can even be developedcollaboratively with stakeholders as part of the consultation process – allowing allparties to contribute to the rich picture sketch. These benefits have led to a numberof researchers in HCI proposing their use (outside the full SSM methodology) toinform the design process (see, for example, [239]).
At the next stage in SSM we move from the real world to the systems world andattempt to generate root definitions for the system, which define the essence of whatthe system is about. There may be several root definitions of a system, representingdifferent stakeholder perspectives, for example. Root definitions are described interms of specific elements, summarized using the acronym, CATWOE:
Clients – those who receive output or benefit from the system.
Actors – those who perform activities within the system.
Transformations – the changes that are effected by the system. This is a critical partof the root definition as it leads to the activities that need to be included in thenext stage. These ‘transform’ the inputs of the system into the required outputs.
Weltanschauung – (from the German) meaning world view. This is how the systemis perceived in a particular root definition.
Owner – those to whom the system belongs, to whom it is answerable and who canauthorize changes to it.
Environment – the world in which the system operates and by which it is influenced.
Root definition for airline management: an airline booking system
Revisiting our earlier example, an international airline is considering introducing a new booking system for use by associated travel agents to sell flights directly to the public. That is, a systemowned by the airline management; operated by associated travel agency staff; working in associatedtravel agency offices worldwide; operating within regulations specified by international civil aviationauthorities and national contract legislation; to sell flights to and reserve seats for customers; andto generate a profit for the company.
n Client: customern Actor: travel agency staffn Transformation: customer’s intention and request to travel transformed into sale of seat on
flight and profit for organizationn Weltanschauung: profits can be optimized by more efficient salesn Owner: airline managementn Environment: Regulations of international civil aviation authorities and national contract leg-
islation. Local agency policies worldwide

466 Chapter 13 n Socio-organizational issues and stakeholder requirements
Once the root definitions have been developed, the conceptual model is devised.The conceptual model defines what the system has to do to fulfill the rootdefinitions. It includes identifying the transformations and activities in the systemand modeling them hierarchically in terms of what is achieved and how it isachieved. This process is iterative and is likely to take several cycles before it is complete and accurate.
Next we return to the real world with our systems descriptions and compare theactual system with the conceptual model, identifying discrepancies and thereby highlighting any necessary changes or potential problems. For example, a particularactivity may have more processes in the real world than in the conceptual model,which may suggest that a reduction of processes for that activity is needed.
In the final stages, we determine which changes are necessary and beneficial to thesystem as a whole – changes may be structural, procedural or social, for example –and decide on the actions required to effect those changes.
SSM is a flexible approach, which supports detailed consideration of the designcontext. However, it takes practice to use effectively. There is no single right (orwrong) answer – the SSM is successful if it aids the designer’s understanding of thewider system.
13.3.4 Participatory design
Participatory design is a philosophy that encompasses the whole design cycle. It isdesign in the workplace, where the user is involved not only as an experimental subject or as someone to be consulted when necessary but as a member of the design team. Users are therefore active collaborators in the design process, ratherthan passive participants whose involvement is entirely governed by the designer.The argument is that users are experts in the work context and a design can only be effective within that context if these experts are allowed to contribute actively to the design process. In addition, introduction of a new system is liable to changethe work context and organizational processes, and will only be accepted if thesechanges are acceptable to the user. Participatory design therefore aims to refine sys-tem requirements iteratively through a design process in which the user is activelyinvolved.
Participatory design has three specific characteristics. It aims to improve the workenvironment and task by the introduction of the design. This makes design and evaluation context or work oriented rather than system oriented. Secondly, it is char-acterized by collaboration: the user is included in the design team and can contributeto every stage of the design. Finally, the approach is iterative: the design is subject toevaluation and revision at each stage.
The participatory design process utilizes a range of methods to help convey infor-mation between the user and designer. They include
Brainstorming This involves all participants in the design pooling ideas. This isinformal and relatively unstructured although the process tends to involve ‘on-the-fly’ structuring of the ideas as they materialize. All information is recorded

13.3 Capturing requirements 467
without judgment. The session provides a range of ideas from which to work.These can be filtered using other techniques.
Storyboarding This has been discussed in more detail in Chapter 6. Storyboardscan be used as a means of describing the user’s day-to-day activities as well as thepotential designs and the impact they will have.
Workshops These can be used to fill in the missing knowledge of both user anddesigner and provide a more focussed view of the design. They may involvemutual enquiry in which both parties attempt to understand the context of thedesign from each other’s point of view. The designer questions the user about the work environment in which the design is to be used, and the user can querythe designer on the technology and capabilities that may be available. This estab-lishes common ground between the user and designer and sets the foundation forthe design that is to be produced. The use of role play can also allow both user anddesigner to step briefly into one another’s shoes.
Pencil and paper exercises These allow designs to be talked through and evaluatedwith very little commitment in terms of resources. Users can ‘walk through’ typ-ical tasks using paper mock-ups of the system design. This is intended to show updiscrepancies between the user’s requirements and the actual design as proposed.Such exercises provide a simple and cheap technique for early assessment of models. PICTIVE [242] is one such approach to paper prototyping, which includesrepresentative stakeholders in a video recorded design session. Each participantprepares ‘homework’ focussing on the requirements of the system from their par-ticular perspective, which is then used to introduce and orientate the PICTIVEsession. Materials such as sticky notes, highlighters, plastic labels, paper and scis-sors are used on a shared design surface to produce a low-tech prototype of theproposed system, which is finally tested by the group against the tasks identified.
Such methods are not exclusively used in participatory design, of course, and can beused more widely to promote clearer understanding between designer and stakeholders.
Participatory design originated in Scandinavia, where it is now promoted by lawand in accepted work practices, but it has not been widely practiced, at least in itsfullest form, elsewhere. This may be due to the time and cost involved in what is, bydefinition, a context-specific design, as well as the organizational implications of the shift of power and responsibility.
However, principles from the participatory design approach have been incorp-orated in a number of widely used methodologies. We outline one of them – to show how a participatory philosophy can be integrated into organizational andstakeholder analysis.
Effective Technical and Human Implementation of Computer-based Systems(ETHICS)
ETHICS [243] is a method developed by Enid Mumford within the socio-technicaltradition, but it is distinct in its view of the role of stakeholders in the process. In the
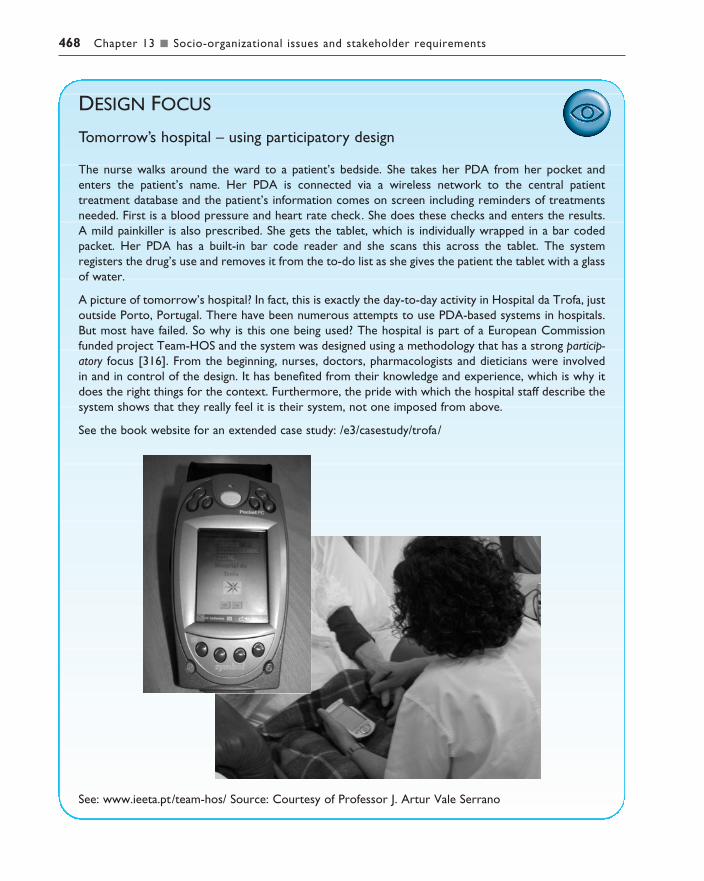
468 Chapter 13 n Socio-organizational issues and stakeholder requirements
DESIGN FOCUS
Tomorrow’s hospital – using participatory design
The nurse walks around the ward to a patient’s bedside. She takes her PDA from her pocket and enters the patient’s name. Her PDA is connected via a wireless network to the central patient treatment database and the patient’s information comes on screen including reminders of treatmentsneeded. First is a blood pressure and heart rate check. She does these checks and enters the results.A mild painkiller is also prescribed. She gets the tablet, which is individually wrapped in a bar codedpacket. Her PDA has a built-in bar code reader and she scans this across the tablet. The system registers the drug’s use and removes it from the to-do list as she gives the patient the tablet with a glassof water.
A picture of tomorrow’s hospital? In fact, this is exactly the day-to-day activity in Hospital da Trofa, justoutside Porto, Portugal. There have been numerous attempts to use PDA-based systems in hospitals.But most have failed. So why is this one being used? The hospital is part of a European Commissionfunded project Team-HOS and the system was designed using a methodology that has a strong particip-atory focus [316]. From the beginning, nurses, doctors, pharmacologists and dieticians were involved in and in control of the design. It has benefited from their knowledge and experience, which is why itdoes the right things for the context. Furthermore, the pride with which the hospital staff describe thesystem shows that they really feel it is their system, not one imposed from above.
See the book website for an extended case study: /e3/casestudy/trofa/
See: www.ieeta.pt/team-hos/ Source: Courtesy of Professor J. Artur Vale Serrano

13.3 Capturing requirements 469
ETHICS methodology, stakeholders are included as participants in the decision-making process. ETHICS considers the process of system development as one ofmanaging change: conflicts will occur and must be negotiated to ensure acceptanceand satisfaction with the system. If any party is excluded from the decision-makingprocess then their knowledge and contribution is not utilized and they are morelikely to be dissatisfied. However, participation is not always complete. Mumfordrecognizes three levels of participation:
Consultative – the weakest form of participation where participants are asked fortheir opinions but are not decision makers.
Representative – a representative of the participant group is involved in the decision-making process.
Consensus – all stakeholders are included in the decision-making process.
The usual practice is that design groups are set up to include representatives fromeach stakeholder group and these groups make the design decisions, overseen by a steering committee of management and employee representatives. The designgroups then address the following issues and activities:
1. Make the case for change. Change for its own sake is inappropriate. If a case can-not be made for changing the current situation then the process ends and thesystem remains as it is.
2. Identify system boundaries. This focusses on the context of the current systemand its interactions with other systems, in terms of business, existing techno-logy, and internal and external organizational elements. How will the changeimpact upon each of these?
3. Describe the existing system, including a full analysis of inputs and outputs and thevarious other activities supported, such as operations, control and coordination.
4. Define key objectives, identifying the purpose and function of each area of theorganization.
5. Define key tasks: what tasks need to be performed to meet these objectives?6. Define key information needs, including those identified by analysis of the exist-
ing system and those highlighted by definition of key tasks.7. Diagnose efficiency needs, those elements in the system that cause it to under-
perform or perform incorrectly. If these are internal they can be redesigned outof the new system; if they are external then the new system must be designed tocope with them.
8. Diagnose job satisfaction needs, with a view to increasing job satisfaction where itis low.
9. Analyze likely future changes, whether in technology, external constraints (suchas legal requirements), economic climate or stakeholder attitudes. This is neces-sary to ensure that the system is flexible enough to cope with change.
10. Specify and prioritize objectives based on efficiency, job satisfaction and futureneeds. All stakeholders should be able to contribute here as it is a critical stageand conflicting priorities need to be negotiated. Objectives are grouped as eitherprimary (must be met) or secondary (desirable to meet).

470 Chapter 13 n Socio-organizational issues and stakeholder requirements
The final stages of the ETHICS approach focus on the actual design and evaluationof the system. Necessary organizational changes are designed alongside the technicalsystem. These are then specified in detail, implemented and evaluated.
The ETHICS approach attempts to reach a solution that meets both user and taskrequirements by having specialist teams negotiate objectives and rank potential solu-tions. The emphasis is on reaching a solution that ranks highly on job satisfaction toensure that the solution is acceptable.
It ensures participation at every stage through representative design teams, butcan be expensive and time consuming to carry out. However, the benefits in terms ofjob satisfaction and higher productivity may balance out the initial investment.
13.3.5 Ethnographic methods
All of the approaches considered so far have included some level of consultation and observation of the stakeholders. However, the focus of this has been on gathering stakeholder perspectives rather than specifically studying actual workpractice. It can be argued that work can only be understood and studied in context.This is consonant with the ideas of distributed cognition. Taking a worker away from the workplace changes the very nature of the worker’s actions. Real action is situated action; it occurs in interaction with the materials and people of the workplace [334]. In extremis, it is claimed that an action can only be understood in the place, in the social situation, and at the time at which it occurred. Such a level of contextualization is obviously useless for design, and its advocates will in practice generalize from their observations, even if they ostensibly eschew suchgeneralization.
Even if one does not wish to take such an extreme view, it is clear that studyingworkers in their own situations is extremely worthwhile.
Many branches of sociology and anthropology have long recognized that one cannot study people divorced from their social and cultural context. In particular,ethnography has become very influential, particularly in the study of group systems.We were introduced to ethnography briefly in Chapter 9 but here we will consider it in a little more detail, and discuss an approach to contextual requirements cap-ture that reflects the ethnographic tradition but has been developed to be highlypractical.
Ethnography is based on very detailed recording of the interactions between people and between people and their environment. It has a special focus on socialrelationships and how they affect the nature of work. The ethnographer does notenter actively into the situation, and does not see things from a particular person’sviewpoint. However, an aim is to be encultured, to understand the situation fromwithin its own cultural framework. Culture here means that of the particular work-group or organization, rather than that of society as a whole. Ethnographers try to take an unbiased and open-ended view of the situation. They report and do notlike to speculate, so it is often unclear how well their approach can contribute to thedesign of new systems.

13.3 Capturing requirements 471
We now look briefly at an approach that takes a pragmatic rather than puristethnographic perspective, contextual inquiry.
Contextual inquiry
Contextual inquiry has much in common with the ethnographic tradition: it studiesthe user in context, trying to capture the reality of his work culture and practice.However, it is also an approach rooted in practice and it differs in a number ofsignificant ways from pure ethnographic study: the intention is to understand and tointerpret the data gathered, and rather than attempting to take an open-ended view,the investigator acknowledges and challenges her particular focus. In addition, theexplicit aim is to design a new system, whereas in a pure ethnographic study, it wouldbe open ended.
The model of contextual inquiry is of the investigator being apprenticed to theuser to learn about his work. Interviews take place in the workplace so that theobjects, artifacts and relationships of the work can be better understood. Examplesof work are collected and both verbal and non-verbal communication is studied. Theidea is to be as comprehensive in the data gathering as possible and to be concrete.Another central notion of contextual inquiry is that of partnership: the user is theexpert in the workplace and is therefore encouraged to lead the investigation.However, the investigator is not a passive observer. Her objective is to gain a sharedunderstanding of how the work happens and, to do so, she questions meaning andoffers interpretations of what she observes. The aim is to draw out the implicationsof comments and actions and understand (rather than assume) what they reallymean. In order to do this honestly and effectively the investigator must know herfocus – her pre-existing beliefs and assumptions about the situation – and be pre-pared to challenge and adjust them in the face of new information.
Contextual inquiry focusses on a 2–3 hour interview with the user in the work-place. The idea is to capture and record as much detail as possible, including whatthe user says and does (step by step), how he communicates and coordinates with
Ethnography and participatory design
The ethnographic approach differs markedly from the approach of participatory design. In participatory design the workers come out of their work situation, either physically or mentally,and share the design task with the professional designers – effectively the workers become designers. The participatory designer enters into the subjective experience of the workplace.Ethnographic and other situated approaches take the analyst into the workplace, while retaining alevel of objectivity. The advantage is that the analyst sees the whole group’s perspective, ratherthan that of involved individuals, but the analyst, however much in tune with the workers, is still‘out there’. On the other hand, involving the workers in the design process in itself increases theirmotivation and acceptance whether or not the resulting design is ‘optimal’.
472 Chapter 13 n Socio-organizational issues and stakeholder requirements
others, his feelings and responses to the situation, and a shared understanding of themeaning of actions and artifacts. In addition, objects, examples and artifacts of workare collected and annotated, and the physical work environment is sketched andannotated to show how it is used.
A number of models of the work are developed to capture what is important in theuser’s work situation:
n The sequence model elaborates the steps required to complete a specific task, aswell as the triggers that initiate that sequence of steps.
n The physical model maps the physical work environment and how it impactsupon work practice, for example, an office plan showing where different workactivities happen.
n The flow model shows the lines of coordination and communication between theuser and other participants within and outside the workplace.
n The cultural model reflects the influences of work culture and policy and showsthe scope of these influences. This may include official or unofficial codes ofbehavior, common expectations (which may or may not be explicit) and valuesystems.
n The artifact model describes the structure and use of a particular artifact withinthe work process.
Once the interview is complete, the data must be consolidated with those fromother users and stakeholders. There is not space here to elaborate the whole process(see [35] for details) but interviews are transcribed and interpreted as soon as pos-sible after the event by the design team. The team comes together to consider theinterview data and to identify commonalities across stakeholders. Affinity diagramsare used to group related information by posting notes on the wall representing aparticular comment or observation and grouping these into a hierarchy of relatedthemes. The themes are not pre-determined but arise from the data as they are examined.
Each of the models above is also consolidated across users to provide a commonview of the situation. The result is a representation of the required task sequences,artifacts and communication channels that must be supported in the new system aswell as the physical and cultural constraints that must be taken into account.
SUMMARY
We have seen that organizational factors can make or break the deployment of information and communications technology. Any computer system may interferewith the existing authority and social relationships within an organization. Theremay be a mismatch between those who benefit, and those who do the work. Evenwhere there is no in-built bias, the free rider may put in little personal effort,benefiting from the work of the rest of the group.
13.4

Exercises 473
We need to identify stakeholders who will be affected directly or indirectly. In particular, junior and middle management may feel they lose control and authorityby the introduction of electronic communications. Another example is teleworking,which is made easier by advances in telecommunications, but which makes theworker less visible to management. Even where a system is perceived to be useful, itis hard to quantify its benefits as they are diffused throughout the organization.
In this chapter, we have discussed a selection of socio-organizational approachesto capturing stakeholder requirements, including socio-technical models, soft systems methodology, participatory design and ethnographic approaches. Socio-technical models focus on representing both the human and technical sides of thesystem in parallel to reach a solution that is compatible with each. SSM models the organization, of which the user is part, as a system. Participatory design sees theuser as active not only in using the technology but in designing it. Ethnography, onthe other hand, views the user in context, attempting to collect an unbiased view ofthe user’s work culture and practice.
EXERCISES
13.1 A group of universities has decided to collaborate to produce an information system tohelp potential students find appropriate courses. The system will be distributed free to schoolsand careers offices on CD-ROM and will provide information about course contents andrequirements, university and local facilities, fees and admissions procedures. Identify the main stake-holders for this system, categorize them and describe them and their activities, currently and withregard to the proposed system, using the CUSTOM framework.
13.2 For the scenario proposed above:
(i) Produce a rich picture showing the problem situation (you can use any format that you findhelpful).
(ii) Produce a root definition, using CATWOE, of the system from the viewpoint of the university.
What transformations or activities are required to make sure that the root definition is supported?
13.3 The example in Section 13.3.2 (soft systems methodology) provides a root definition for an airline booking system from the perspective of the airline owner. How would this change if it waspresented from the perspective of the customer?
13.4 Find case studies of participatory design in action and use these to provide a critique of theapproach. What are the benefits and weaknesses of participatory design and how might any weak-nesses be addressed?
13.5 You are designing a new system to help people manage their ‘to do’ lists. Use the contextualinquiry approach to interview a colleague to see how they make use of such lists. Make sure youinterview them in context – in their study or workplace for example. Produce sequence, flow,artifact, cultural and physical models of the activity.
474 Chapter 13 n Socio-organizational issues and stakeholder requirements
RECOMMENDED READING
K. D. Eason, Information Technology and Organizational Change, Taylor and Francis,1988.Clear coverage of socio-technical and organizational issues in design.
P. B. Checkland, Systems Thinking, Systems Practice: includes a 30 Year Retrospective,John Wiley, 1999.The classic text on soft systems methodology in detail, in a new edition withreflections on the development and use of the methodology.
J. Greenbaum and M. Kyng, Design at Work: Cooperative Design of Computer Systems,Lawrence Erlbaum, 1991.An excellent collection of papers on participatory design philosophy and practice.
E. Mumford, Effective Systems Design and Requirements Analysis: The ETHICSApproach, Palgrave, 1995.A book outlining the ETHICS approach by its developer.
H. Beyer and K. Holtzblatt, Contextual Design: Defining Customer Centered Systems,Morgan Kaufmann, 1998.A full exposition of the contextual design methodology, of which contextualinquiry is a part.

COMMUNICATION AND
COLLABORATION MODELS
OV E RV I E W
All computer systems, single-user or multi-user, interactwith the work-groups and organizations in which they areused.
n We need to understand normal human–humancommunication:– face-to-face communication involves eyes, face and
body– conversation can be analyzed to establish its detailed
structure.
n This can then be applied to text-based conversation,which has:– reduced feedback for confirmation– less context to disambiguate utterances– slower pace of interactionbut is more easily reviewed.
n Group working is more complex than that of a singleperson:– it is influenced by the physical environment– experiments are more difficult to control and record– field studies must take into account the social
situation.
14

476 Chapter 14 n Communication and collaboration models
INTRODUCTION
No man is an Iland, intire of it selfe; every man is a peece of the Continent, a part ofthe maine.
John Donne1
It is clear that groupware systems, such as email or conferencing systems, involvemore than one person. However, to some extent all systems influence and areinfluenced by the groups and social situations in which they are placed. The field ofcomputer-supported cooperative work (CSCW) encompasses both specific group-ware systems and the effects of computers on cooperative working in general.
We begin this chapter by looking at human communication. Effective commun-ication clearly underlies much collaborative work and many systems aim to supportcommunication at a distance. Face-to-face communication is often seen as the idealto which computer-mediated communication should aim. Section 14.2 describessome of its features, and shows how even video-based communications lose many of the subtle cues. Body language, tone of voice and eye contact are all crucial inenabling smooth conversation. We then look at a slightly higher level in Section 14.3,at the structure of conversation. In particular, we will see that typical utterances areambiguous and dependent on the context in which they are spoken. This sectionconcludes by looking at speech act theory and the Coordinator system which hasbeen both influential and controversial in CSCW. Understanding spoken conversa-tion gives some clues as to the effective design of text-based communication such as email systems or electronic conferencing. Section 14.4 discusses text-based com-munication in this context, including a discussion of the relative merits and featuresof linear text and hypertext systems.
In Section 14.5 we move away from computer-mediated communication and lookat the wider issues of group working. Groups are dynamic both in composition andbehavior, and effective group working is dependent on the work environment.Because of these and other factors, the study of group behavior, and therefore evaluating groupware, is far more complex than that of single-user systems.
FACE-TO-FACE COMMUNICATION
Face-to-face contact is the most primitive form of communication – primitive, thatis, in terms of technology. If, on the other hand, we consider the style of commun-ication, the interplay between different channels and productivity, we instead findthat face-to-face is the most sophisticated communication mechanism available.
14.2
14.1
1 Devotions upon Emergent Occasions, XVII, 1624.

14.2 Face-to-face communication 477
The first thing to note is that face-to-face communication involves not just speechand hearing, but also the subtle use of body language and eyegaze. We will discuss arange of these phenomena, and how they influence our use of computer-mediatedcommunications. We will concentrate on two-person conversations as groupdynamics are discussed later in Section 14.5. Also, we will principally compare face-to-face with video and audio channels and we will address the special problems oftext-based communications in Section 14.4.
14.2.1 Transfer effects and personal space
When we come to use computer-mediated forms of communication, we carry forwardall our expectations and social norms from face-to-face communication. People arevery adaptable and can learn new norms to go with new media (for example, the useof ‘over’ for turn-taking when using a walkie-talkie). However, success with newmedia is often dependent on whether the participants can use their existing norms.Furthermore, the rules of face-to-face conversation are not conscious, so, when theyare broken, we do not always recognize the true problem. We may just have a feeling of unease, or we may feel that our colleague has been rude.
An example of these problems concerns personal space. When we converse withone another we tend to stand with our heads a fairly constant distance apart. If people start to converse at opposite ends of a room, they will quickly move towardone another until they are a few feet apart. The exact distance depends somewhat on context; a high level of noise may make people come closer just to be heard.However, even in crowded rooms, conversants will dip their heads toward oneanother whilst speaking and then straighten up to restore their personal distance.Direction is also important. We can accept people closer to us if they are at our sidesor behind than if we are facing them. Because of this, passengers on tube trains,forced to be close, will incline their faces at an angle to one another whilst talking.
Personal space also differs across cultures: North Americans get closer thanBritons, and southern Europeans and Arabs closer still. This can cause considerableproblems during cross-cultural meetings. Imagine a Briton, Eustace Warbuck-Smyth, and an American, Bud Sterton, conversing. After a few minutes Eustace is bent backwards over a table, trying to maintain his personal distance, whilst Bud stands almost knee to knee trying to get close enough. Eustace feels Bud is either rather aggressive, or possibly over-friendly. Bud, on the other hand, feelsEustace is rather distant and uninterested. Unless the situation gets extreme, or theparticipants are trained in non-verbal skills, they will be unaware of why they feeluncomfortable.
A similar problem can occur in a video conference. Imagine Eustace and Bud have monitors with cameras mounted above, so that their offices are connected. Thezoom on each camera is adjustable and Bud’s camera is set with a wide focus, whilstEustace’s is set with a high level of zoom. So, if Bud and Eustace are the same dis-tance from their cameras and monitors, then Bud sees Eustace’s whole face filling thescreen, whereas Eustace sees Bud sat on his chair in the middle of his office. Eustace

478 Chapter 14 n Communication and collaboration models
moves closer to the monitor to see Bud more clearly, while Bud pushes his chair backto get away from Eustace’s 2 foot (60 cm) high face – touché. Of course, the problemgets worse if the cameras are positioned in different places relative to the monitors,or if the monitors are different sizes. Ideally, Bud ought to be able to adjust the zoomon Eustace’s camera and vice versa. In fact, there is some evidence that the ‘glass wall’afforded by the video screen makes the precise distance less important, which couldhave a positive effect during cross-cultural meetings. However, gross distortions, asdescribed above, need to be avoided.
14.2.2 Eye contact and gaze
Long-term gazing into one another’s eyes is usually reserved for lovers. However,normal conversation uses eye contact extensively, if not as intently. Our eyes tell uswhether our colleague is listening or not; they can convey interest, confusion orboredom. Sporadic direct eye contact (both looking at one another’s eyes) is import-ant in establishing a sense of engagement and social presence. People who look away when you look at them may seem shifty and appear to be hiding something.Furthermore, relative frequency of eye contact and who ‘gives way’ from direct eyecontact is closely linked to authority and power.
Naturally, all these clues are lost if we have no visual contact. However, the mis-leading clues via a video connection can be worse. In Chapter 19 (Section 19.3.4) we discuss the problems of obtaining effective eye contact with standard videoequipment. If the camera is strapped to the top of the monitor (a common arrange-ment) both participants will look as if their eyes are slightly dropped. We will look atsome technical solutions to this in Chapter 19.
Despite these problems with direct eye contact, many signals can be easily readthrough a video channel. You can see whether your colleague looks quizzical orbored, confused or excited. This involves not just the eyes, but the whole facialexpression, and this is apparent even on poor-quality video or very small (pocket-TV-sized) monitors. Experiments have shown that remotely working participantsexperience a greater sense of social presence if video is used in addition to an audiolink.
As well as having a role in establishing rapport between the participants, eyegazeis useful in establishing the focus of the conversation. If you say ‘now where does thisscrew go?’, there may be many screws, but your colleague can see which one you arelooking at. Video connections are unlikely to show enough of your office for yourcolleague to be able to interpret such clues, but a focus that just catches the corner ofthe monitor and desk can help.
14.2.3 Gestures and body language
In a similar but more direct way, we use our hands to indicate items of interest. Thismay be conscious and deliberate as we point to the item, or may be a slight wave ofthe hand or alignment of the body. Again, a video connection may not be sufficient
14.2 Face-to-face communication 479
to allow our colleagues to read our movements. This can be a serious problem sinceour conversation is full of expressions such as ‘let’s move this one there’, where the‘this’ and ‘there’ are indicated by gestures (or eyegaze). This is called deictic reference(see Chapter 19, Sections 19.4 and 19.6 for more details).
Several groupware systems attempt to compensate for these losses. In Section19.4.2, we discuss the idea of a group pointer, a mouse-controlled icon which can be used to point to things on a shared screen. Somewhat more esoteric, but moreimmediate, are the shared work surfaces (Section 19.4.3) which mix an image of theparticipants’ hands with the electronic screen. The participants can then simplypoint at the relevant item on the screen, as they would face-to-face.
Of course, the group pointer, although used in remote groupware, is also used insynchronous co-located groupware such as meeting rooms. That is, even though theparticipants can converse face-to-face, they still need deictic aids. One reason for thisis that their electronic screens, although logically shared (they can all see the samething), are not physically shared (they are in different places). So, if Jemima pointsto her own screen, her colleagues do not know what she is pointing at.
Even when the participants are in the same room, the existence of electronicequipment can interfere with the body language used in normal face-to-face com-munication. The fact that attention is focused on keyboard and screen can reduce theopportunities for eye contact. Also, large monitors may block participants’ views ofone another’s bodies, reducing their ability to interpret gestures and body position.Most computer-supported meeting rooms recess monitors into the desks to reducethese problems.
14.2.4 Back channels, confirmation and interruption
It is easy to think of conversation as a sequence of utterances: A says something, thenB says something, then back to A. This process is called turn-taking and is one of thefundamental structures of conversation. However, each utterance is itself the resultof intricate negotiation and interaction. Consider the following transcript:
Alison: Do you fancy that film . . . er . . . ‘The Green’ um . . . it starts at eight.Brian: Great!
Alison has asked Brian whether he wants to go to the cinema (or possibly to watchthe television at home). She is a bit vague about the film, but Brian obviously doesnot mind! However, if we had listened to the conversation more closely and watchedAlison and Brian we would have seen more exchanges. As Alison says ‘that film er . . .’, she looks at Brian. From the quizzical look on his face he obviously does notknow which film she is talking about. She begins to expand ‘The Green um . . .’, and light dawns; she can see it in his eyes and he probably makes a small affirmativesound ‘uh huh’.
The nods, grimaces, shrugs of the shoulder and small noises are called back channels. They feed information back from the listener to the speaker at a level belowthe turn-taking of the conversation. The existence of back channels means that the

480 Chapter 14 n Communication and collaboration models
speaker can afford to be slightly vague, adding details until it is obvious that the listener understands. Imagine making no response as someone talks to you, no little‘yes’es, no nods or raised eyebrows. You could answer questions and speak in turn,but not use back channels. It is likely that your colleague would soon become veryuncomfortable, possibly rambling on with ever more detailed explanations, lookingfor some sign of understanding:2
Do you fancy that film . . . er . . . ‘The Green’ um . . . the one with Charles Dermot in. . . you know with that song, er and the black cat on the poster . . . uhh
These back channel responses use a range of sensory channels. So, as we restrictthe forms of communication we lose the back channels. Even video communicationstend to use, at most, head and shoulder shots, so we lose some body movement andgestures. On the other hand, a larger view means reduced detail, so we lose informa-tion whatever focus we choose. Audio-only links (such as the telephone) have to rely on purely verbal back channel responses – the little ‘yes’es. Surprisingly,despite the loss of many back channels, people still cope well with these restrictedmedia, and communication is still reasonably effective. However, you may have hadthe experience, when speaking to someone on the telephone, of suddenly getting the feeling that they have gone away, or the line has gone dead. This is likely to be when you have received insufficient back channel responses (and perhaps youhave been going on a bit). Transcontinental telephones are especially problematic as they are often only half duplex, that is the sound only goes in one direction at atime. So, while you are speaking, you can hear none of your partner’s back channelresponses.
Text-based communication, in electronic conferencing, usually has no back chan-nels whatsoever. Any confirmation must be given explicitly in the listener’s nextutterance. This may confuse an analysis of text-based conversation as the utterancesdo not correspond simply to utterances in speech.
14.2.5 Turn-taking
As well as giving confirmation to the speaker that you understand, and indicationswhen you do not, back channels can be used to interrupt politely. Starting to speakin the middle of someone’s utterance can be rude, but one can say something like‘well uh’ accompanied by a slight raising of the hands and a general tensing of the body and screwing of the eyes. This tells the speaker that you would like to inter-rupt, allowing a graceful transition. In this case, the listener requested the floor. Turn-taking is the process by which the roles of speaker and listener are exchanged.Back channels are often a crucial part of this process.
2 Don’t try this as an experiment on your friends, or you may end up without any! Instead try it with acolleague who knows what is going on. Even when you both know not to expect back channel responsesthe experience can be disconcerting. Furthermore, you will both find it very difficult to refrain from backchannel responses.

14.2 Face-to-face communication 481
In other cases, the speaker may explicitly offer the floor to the other participant.This may be in the form of a direct question, ‘what do you think?’, or simply a verystrong change of tone.
More often the speaker will offer the floor to the listener by leaving a small gap inspeech. These gaps are typically no more than a fraction of a second; indeed gaps of even a few seconds give completely different signals and interrupt the flow of
DESIGN FOCUS
Looking real – Avatar Conference
Avatars, artificial representations of people, are used in various forms of online communication. Oftenthese are based on some form of cartoon image, but the Avatar Conference project has produced a virtual meeting environment with photo-realistic avatars. These are produced by photographing participants from several angles and then using the photographs to texture map an artificial figure. Thisis then rendered in a 3D virtual meeting room.
Participants can use internet phone or simple text chat and the latter has translation options to aid international meetings. The avatar for the current speaker moves its mouth and makes other animations, but is not synchronized with the actual speech. The aim is to make the participants moreengaged in the online meeting.
The screen shots show two views of the conference application. One with the virtual meeting roomcentral (left), the other with the currently displayed presentation materials central (right). People foundthe 3D avatars exciting and an initial ‘hook’ – this is very important, remember in the Introduction, theneed for a system to be actually used.
However, the participant response after using the application for even a short time was in favor of themore presentation-centered rather than avatar-centered view. It may be that current avatars are notquite realistic enough to warrant the central position, or it may reflect the fact that in a real meetingthe focus is on the presentation rather than on the other participants.
See: www.exodus.gr/Avatar_Conference/ and www.avatame.com/ Screen shot frame reprinted by permission from Microsoft Corporation. Screen shots courtesy of AVATAR-Conference project team

482 Chapter 14 n Communication and collaboration models
conversation. The gap is often at some point which may require clarification, orwhere the listener may want to comment. So, Alison may well have waited for half a second after saying ‘Do you fancy that film’, in case Brian were to respond ‘Oh you mean the one with the black cat on the poster’. As he did not say anything,she continued with her turn.
The role of ‘um’s and ‘ah’s is very important. They can be used by either particip-ant during the gap to claim the turn. So, if Brian wanted to respond in the middle of the utterance, but had not yet framed his utterance, he might begin ‘um the one . . .’. As it was, Brian did not respond, so Alison starts ‘er’ which says to Brian‘I’m going to continue, but I’m thinking’. Alternatively, Alison could have started to ‘er’ as soon as she had said the word ‘film’. This would have told Brian not to interrupt.
These turn-offering gaps are just the places where the speaker expects some backchannel response even if no turn exchange takes place. A total lack of response willbe taken, depending on the circumstances, as assent to the speaker, or perhaps as lack of understanding.
As we can see, turn-offering gaps form a central part in the eliciting of back channel responses and in negotiating turn-taking. They are obviously connectedprincipally with the audio channel (although some gestures may be used to maintainor claim the floor). Half-duplex channels (such as intercontinental phone calls) arevolume sensitive in order to track the speaker. Unfortunately, some of the ‘um’s and ‘er’s used to maintain or claim the floor may fall below the volume threshold and thus not be transmitted. This may lead to apparent rude interruptions or snub-bing of one party by the other.
An even more serious problem is encountered during long-distance, satellite-based communications due to the time lags. To transmit a signal, it must go up tothe satellite and then back down to the earth. A geostationary satellite is at a heightof approximately 100,000 km above the earth – a quarter of the distance to themoon. Radio waves will take about 700 milliseconds to go up to the satellite and back down again. This time, together with the processing delays on the ground andin the satellite, add up to about a 2 second lag. There is thus a 4 second gap betweenone participant doing or saying something and when the effects of that upon theother participant become evident.
We now imagine Alison and Brian talking via satellite. Alison pauses for half a second after the words ‘that film’, 2 seconds later Brian hears the end of the word‘film’, after a few hundred milliseconds he notices the gap and begins to say ‘Oh’; by this time Alison has waited 21/2 seconds, and the gap is getting embarrassing, soshe continues ‘The Green um . . . the one with Charles Dermot in’. Then, 2 secondsinto this, that is over 4 seconds since she began to pause, she hears Brian try to cutin (how rude!), but he stops talking again when he hears her continuing.
The above scenario is not contrived. Tapes of video conferences show just thisbehavior, with a single speaker going on and on as all her attempts to pass on thefloor fail. There is no obvious solution to this problem, except the technological one of using high-bandwidth land or sub-ocean lines, when these become available,rather than satellite.

14.3 Conversation 483
CONVERSATION
We have looked at the low-level issues of speech and gesture during face-to-face conversation. We now turn to the structure of the conversation itself. Most analysisof conversation focusses on two-person conversations, but this can range from informal social chat over the telephone to formal courtroom cross-examination. As well as the discipline of conversational analysis, there are other sociological andpsychological understandings of conversation. However, the techniques, as ‘bor-rowed’ and used to study computer-mediated conversation, would not always findfavor with the purist from the discipline from which they originated!
There are three uses for theories of conversation in CSCW. First, they can be usedto analyze transcripts, for example from an electronic conference. This can help usto understand how well the participants are coping with electronic communication.Secondly, they can be used as a guide for design decisions – an understanding of normal human–human conversation can help avoid blunders in the design of elec-tronic media. Thirdly, and most controversially, they can be used to drive design –structuring the system around the theory.
We will concentrate mainly on the first goal, although this will have implicationsthroughout for design. Only when we consider speech act theory and Coordinator inSection 14.3.6 will we see an example of a theory-driven system.
14.3.1 Basic conversational structure
Imagine we have a transcript of a conversation, recalling from Chapter 9 that theproduction of such a transcript is not a simple task. For example, a slightly differentversion of Alison and Brian’s conversation may look like this:
Alison: Do you fancy that film?Brian: The uh (500 ms) with the black cat – ‘The Green whatsit’?Alison: Yeah, go at uh . . . (looks at watch – 1.2 s) . . . 20 to?Brian: Sure.
This transcript is quite heavily annotated with the lengths of pauses and evenAlison’s action of looking at her watch. However, it certainly lacks the wealth of gesture and back channel activity that were present during the actual conversation.Transcripts may be less well documented, perhaps dropping the pause timings, ormore detailed, adding more actions, where people were looking and some backchannelling. Whilst thinking about the structure of conversation, the transcriptabove is sufficient.
As we have noted previously, the most basic conversational structure is turn-taking. On the whole we have an alternating pattern: Alison says something, thenBrian, then Alison again. The speech within each turn is called an utterance. Therecan be exceptions to this turn-taking structure even within two-party conversation.For example, if there is a gap in the conversation, the same party may pick up the
14.3

484 Chapter 14 n Communication and collaboration models
thread, even if she was the last speaker. However, such gaps are normally of shortduration, enough to allow turn-claiming if required, but short enough to considerthe speech a single utterance.
Often we can group the utterances of the conversation into pairs: a question andan answer, a statement and an agreement. The answer or response will normally follow directly after the question or statement and so these are called adjacency pairs.We can look at Alison and Brian’s conversation above as two adjacency pairs, oneafter the other. First, Alison asks Brian whether he knows about the film and heresponds. Second, she suggests a time to go and he agrees. We can codify this struc-ture as: A-x, B-x, A-y, B-y, where the first letter denotes the speaker (Alison or Brian)and the second letter labels the adjacency pair.
The requirement of adjacency can be broken if the pair is interposed with otherpairs for clarification, etc.:
Brian: Do you want some gateau?Alison: Is it very fattening?Brian: Yes, very.Alison: And lots of chocolate?Brian: Masses.Alison: I’ll have a big slice then.
This conversation can be denoted: B-x, A-y, B-y, A-z, B-z, A-x. Adjacency pair ‘x’(‘Do you want some gateau?’–‘I’ll have a big slice then’) is split by two other pairs ‘y’and ‘z’. One would normally expect the interposed pairs to be relevant to the outerpair, seeking clarification or determining information needed for the response.
Some would say that the adjacency pair is not just a basic structure of conversa-tion but the fundamental structure. It is clearly true that we normally respond to themost recent utterance. However, it is less clear whether a simple pairing up of utter-ances is always possible or useful.
For an example of this difficulty, let us look back to the transcript at the beginningof the section. We see that the pair structure is not completely clear. Alison’s secondutterance begins a new pair, ‘go at 20 to?’, but it began with ‘yeah’ responding toBrian’s previous utterance. Indeed, Brian’s first response ‘the uh . . . with the blackcat . . .’ could be seen as a request for clarification. That is, we are now looking at theconversation as having a structure of A-x, B-y, A-yz, B-z, where Alison’s secondutterance serves as both a response to Brian’s request for clarification (‘y’) and startsa new pair concerning the time (‘z’). But in this case, what happens to the second halfof the original ‘x’ pair? We are forced to regard it as implicit in one of Brian’s utter-ances. Alison’s ‘go at 20 to?’ clearly suggests that Brian has committed himself, so we assume that the tone of Brian’s description of the film suggested acceptance. So, Brian’s first utterance, like Alison’s second, serves a dual purpose: A-x, B-xy, A-yz, B-z.
Despite these difficulties, we see that the search for adjacency pairs forces us toexamine closely the structure of the conversation. Whether such structures are reallypart of the conversation, or imposed by us upon it, is less clear. Later we shall see farmore complex conversational structures.

14.3 Conversation 485
14.3.2 Context
Take a single utterance from a conversation, and it will usually be highly ambiguousif not meaningless: ‘the uh with the black cat – “The Green whatsit”’. Each utterance andeach fragment of conversation is heavily dependent on context, which must be used todisambiguate the utterance. We can identify two types of context within conversation:
internal context – dependence on earlier utterances. For example, when Brian says‘masses’ in the last transcript, this is meaningful in the light of Alison’s question‘and lots of chocolate?’. This in turn is interpreted in the context of Brian’s original offer of gateau.
external context – dependence on the environment. For example, if Brian had saidsimply ‘do you want one?’, this could have meant a slice of gateau, or, if he hadbeen holding a bottle, a glass of wine, or, if accompanied by a clenched fist, apunch on the nose.
Arguably, even a complete conversation is heavily context dependent – withoutknowing the situation and the social relations between the participants, how can we understand their words? Taking a more pragmatic approach, the importance ofexternal context has implications for system design and for data collection. From a design perspective, we will look for groupware which both maximizes shared context and which makes the level of sharing clear.
Turning to data collection, we can see the importance of annotating transcriptswith gestures, eyegaze and details of the environment. However, if one noted everything down, 90% would be irrelevant to the conversational level of analysis.Recording the interesting details without flooding the transcript is clearly a skilledjob. If one has rich recordings, say from several video sources, then a simple verbaltranscript may be sufficient as it will be possible to refer back to the video when interesting incidents are found in the written transcript.
When collecting data from groupware systems, it is also very important to havesynchronized records of the participants’ conversation (whether audio, video or textbased) and their electronic workspaces. We need to know what the participants can see on their screens in order to interpret their remarks to one another. In the case where participants may have different views at the same time, we are likely to seebreakdowns in the conversation, where one participant makes an utterance depend-ing on his screen, whereas his colleague sees something different on her screen.
A specific form of context dependence is deictic reference (Section 14.2.3). Whenaccompanied by a pointed finger, an expression like ‘that post is leaning a bit’ is clearly dependent on external context. However, there are very similar uses ofinternal context:
Brian: (Points) That post is leaning a bit.Alison: That’s the one you put in.
Brian’s utterance uses external context, whereas Alison’s very similar utterance usesinternal context. Her ‘that’ refers to the post Brian was talking about, not the one heis pointing at. To see this, consider the similar fragment:

486 Chapter 14 n Communication and collaboration models
Brian: The corner post is leaning a bit.Alison: That’s the one you put in.
Real speech, probably more than the written word, is full of indexicals, words like‘that’, ‘this’, ‘he’, ‘she’ and ‘it’. Obviously when used in written text, like this, wordssuch as these make use of purely internal context. In spoken speech any of the abovewords can be accompanied by gestures or eyegaze for external context, or simplyused, as Alison did, to refer to previous things in the conversation. Some of thewords tend to be more likely to be external (‘that’, ‘this’) than others (‘he’, ‘she’), butyou can easily think of cases of both forms of use. Furthermore, the attachment ofpronouns and other indexicals to the things they denote may depend on the seman-tics of a sentence: ‘Oh no! Eustace has hit Bud. He’ll kill him, I know he will.’ Doesthe speaker mean that Eustace will kill Bud, or vice versa? The answer depends on thespeaker’s knowledge of Eustace and Bud. If Bud is a 22 stone (138 kg) trucker andEustace has trouble lifting cans of beans then we interpret the sentence one way. If,on the other hand, Eustace has a black belt in karate . . .
One consequence of the use of context in speech is the fragmentary nature of utterances. The example transcripts are, if anything, atypically grammatical.Although there is evidence of rules of grammar for the spoken word, these are verydifferent, and much more relaxed, than the written equivalent.
14.3.3 Topics, focus and forms of utterance
Given that conversation is so dependent on context, it is important that the particip-ants have a shared focus. We have addressed this in terms of the external focus – theobjects that are visible to the participants – but it is also true of the internal focus ofthe conversation.
Alison: Oh, look at your roses . . .Brian: Mmm, but I’ve had trouble with greenfly.Alison: They’re the symbol of the English summer.Brian: Greenfly?Alison: No roses silly!
Alison began the conversation with the topic of roses. Brian shifts to the related, butdistinct, topic of greenfly. However, for some reason Alison has missed this shift infocus, so when she makes her second utterance, her focus and Brian’s differ, leadingto the breakdown in communication. The last two utterances are a recovery which re-establishes a shared dialog focus.
In general, we can go through a transcript annotating the utterances by the topicsto which they refer. The identification of topics and assigning utterances to them isa somewhat subjective affair, and one may want to use several levels of topic categor-ization. Of course, those points where such a labeling is difficult are interesting inthemselves. They may either represent potential points of breakdown (as above), or show where external context is needed to disambiguate the conversation. Also of interest is the way that the participants negotiate changes in dialog focus, either

14.3 Conversation 487
because they recognize a divergence, or because one party wants to shift the focus ofthe conversation.
This sort of analysis can be pursued for its own sake, but has a more pragmaticinterest in the analysis of computer-mediated conversation and design of groupware.We want to know where breakdowns occur in order to see whether these are due to the electronic medium. We also want to understand the shifts in focus and thereliance on external context and compare these with the shared objects availablethrough the computer system.
Another way of classifying utterances is by their relation to the task in hand. Atone extreme the utterance may have no direct relevance at all, either a digression or purely social. Looking at the task-related conversation, the utterances can beclassified into three kinds [335]:
substantive directly relevant to the development of the topic;
annotative points of clarification, elaborations, etc.;
procedural talking about the process of collaboration itself.
In addition, the procedural utterances may be related to the structure of collabora-tion itself, or may be about the technology supporting the collaboration. The latteris usually in response to a breakdown where the technology has intruded into thecommunication.
Alison and Brian are now discussing the best way to get to the cinema. Alison isusing a whiteboard to draw a map.
1. Alison: You go along this road until you get to the river.2. Brian: Do you stop before the river or after you cross it?3. Alison: Before.4. Brian: Draw the river in blue and the roads black . . .5. Alison: So, you turn right beside the river.6. Brian: Past the pub.7. Alison: Yeah . . . Is there another black pen, this one’s gone dry?
Alison’s first utterance, turn 1, is substantive. Brian then interrupts with an annotat-ive utterance, asking a question of clarification, which is answered by Alison at 3.Brian then makes a procedural point (perhaps prompted by his confusion at 2). In turns 5 and 6, the conversation again becomes substantive, but then the pen runs out, and utterance 7 is a procedural remark concerning the communication technology (pen and whiteboard).
The last form of utterance (procedural technological) is most interesting whenanalyzing transcripts of computer-mediated conversation as it represents pointswhere the system became apparent to the participants. However, it is also interestingto compare the forms of conversation used in, say, an electronic conference withthose in normal speech. For example, a hypertext-oriented conference will allowdigressions without any danger of losing the flow of the conference, thus encourag-ing annotative and procedural utterances.
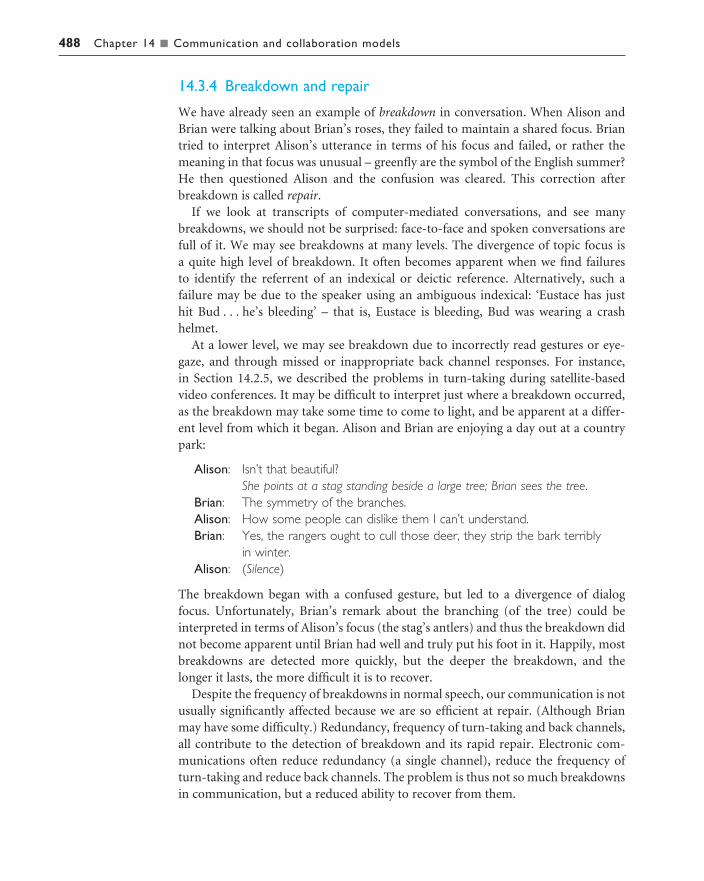
488 Chapter 14 n Communication and collaboration models
14.3.4 Breakdown and repair
We have already seen an example of breakdown in conversation. When Alison andBrian were talking about Brian’s roses, they failed to maintain a shared focus. Briantried to interpret Alison’s utterance in terms of his focus and failed, or rather themeaning in that focus was unusual – greenfly are the symbol of the English summer?He then questioned Alison and the confusion was cleared. This correction afterbreakdown is called repair.
If we look at transcripts of computer-mediated conversations, and see manybreakdowns, we should not be surprised: face-to-face and spoken conversations arefull of it. We may see breakdowns at many levels. The divergence of topic focus is a quite high level of breakdown. It often becomes apparent when we find failures to identify the referrent of an indexical or deictic reference. Alternatively, such a failure may be due to the speaker using an ambiguous indexical: ‘Eustace has just hit Bud . . . he’s bleeding’ – that is, Eustace is bleeding, Bud was wearing a crash helmet.
At a lower level, we may see breakdown due to incorrectly read gestures or eye-gaze, and through missed or inappropriate back channel responses. For instance, in Section 14.2.5, we described the problems in turn-taking during satellite-basedvideo conferences. It may be difficult to interpret just where a breakdown occurred,as the breakdown may take some time to come to light, and be apparent at a differ-ent level from which it began. Alison and Brian are enjoying a day out at a countrypark:
Alison: Isn’t that beautiful?She points at a stag standing beside a large tree; Brian sees the tree.
Brian: The symmetry of the branches.Alison: How some people can dislike them I can’t understand.Brian: Yes, the rangers ought to cull those deer, they strip the bark terribly
in winter.Alison: (Silence)
The breakdown began with a confused gesture, but led to a divergence of dialogfocus. Unfortunately, Brian’s remark about the branching (of the tree) could beinterpreted in terms of Alison’s focus (the stag’s antlers) and thus the breakdown didnot become apparent until Brian had well and truly put his foot in it. Happily, mostbreakdowns are detected more quickly, but the deeper the breakdown, and thelonger it lasts, the more difficult it is to recover.
Despite the frequency of breakdowns in normal speech, our communication is notusually significantly affected because we are so efficient at repair. (Although Brianmay have some difficulty.) Redundancy, frequency of turn-taking and back channels,all contribute to the detection of breakdown and its rapid repair. Electronic com-munications often reduce redundancy (a single channel), reduce the frequency ofturn-taking and reduce back channels. The problem is thus not so much breakdownsin communication, but a reduced ability to recover from them.

14.3 Conversation 489
14.3.5 Constructing a shared understanding
We have seen that human conversation is in itself inherently ambiguous, relying oncontext and shared understanding between the parties to disambiguate the utter-ances. In some spheres, such as legal contracts, the precise meaning out of contextbecomes very important and thus highly stylized language is used to reduce ambigu-ity.3 However, even the legal profession depends on a large body of shared knowledgeand understanding about legal terms, case law, etc. Similarly, a book, such as this,attempts to use less ambiguous language and only commonly available knowledge.
The major difference between a book and conversation is that the latter is inter-active. The shared knowledge used in a book is static, whereas that used during aconversation is dynamic, as the participants increase their understanding of oneanother and as they shift their focus from topic to topic.
When participants come to a conversation, they may come from different back-grounds and bring different knowledge. Even close colleagues will have differentrecent experiences, and as we have seen in previous examples, have different foci.The participants do not try to unify their knowledge and background – indeed, they could not fully do so without living one another’s lives. Instead, they seek toobtain a common ground, a shared understanding sufficient for the task in hand.Establishing this common ground will involve negotiating the meanings of wordsand constructing shared interpretations of the world. Clark and Schaefer [72] referto this process as grounding.
A consequence of this model of conversation is that the participants are aware, atvarious levels both conscious and subconscious, that their common ground isincomplete. Their conversation is not then just an exchange of information abouttheir task, but involves continual testing and cross-checking of the other party’sunderstanding. Consider again a fragment from Alison’s conversation about the wayto the cinema:
Alison: So, you turn right beside the river.Brian: Past the pub.Alison: Yeah . . .
Alison makes an utterance concerning the way to the cinema. Brian interprets this utterance given his current understanding of the conversation and the world.However, in order to check this understanding he makes the statement ‘past thepub’. Now this is not a question of clarification like his earlier question about thebridge; instead it merely echoes back some evidence that he has correctly interpretedAlison’s utterance. Alison is happy with this and so confirms it ‘yeah’.
Such exchanges can be more protracted: for instance, if Brian’s reply does not satisfy Alison she may reflect Brian’s evidence back to him: ‘you mean the BlackBull’, or attempt to re-present her original utterance: ‘along the road on this side ofthe river’. Alternatively, the exchange may be much shorter: rather than explicitlypresenting evidence, Brian could have simply continued the conversation, making
3 Or left deliberately ambiguous.
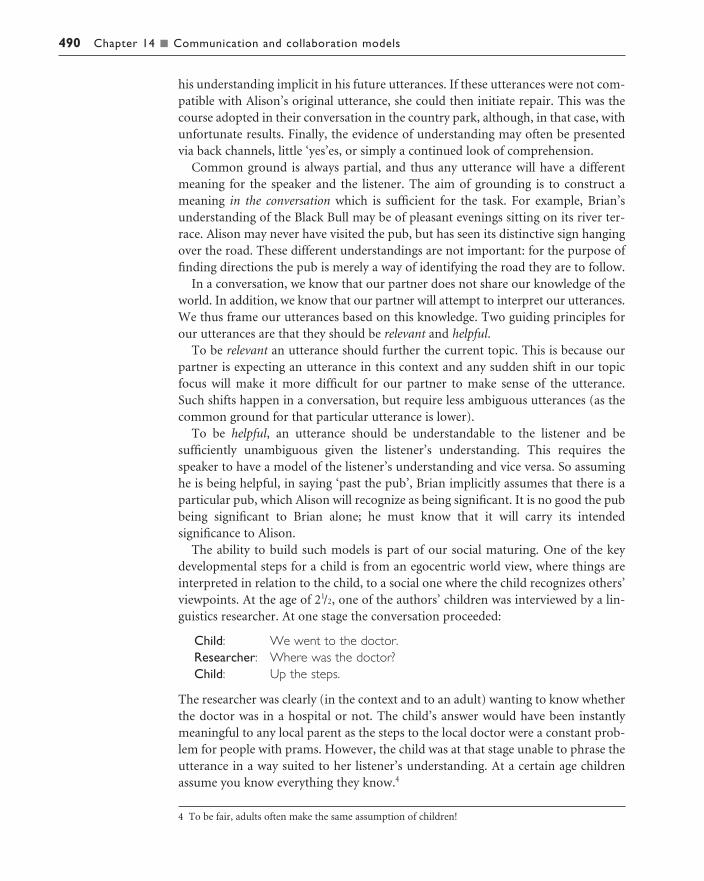
490 Chapter 14 n Communication and collaboration models
his understanding implicit in his future utterances. If these utterances were not com-patible with Alison’s original utterance, she could then initiate repair. This was thecourse adopted in their conversation in the country park, although, in that case, withunfortunate results. Finally, the evidence of understanding may often be presentedvia back channels, little ‘yes’es, or simply a continued look of comprehension.
Common ground is always partial, and thus any utterance will have a differentmeaning for the speaker and the listener. The aim of grounding is to construct ameaning in the conversation which is sufficient for the task. For example, Brian’sunderstanding of the Black Bull may be of pleasant evenings sitting on its river ter-race. Alison may never have visited the pub, but has seen its distinctive sign hangingover the road. These different understandings are not important: for the purpose offinding directions the pub is merely a way of identifying the road they are to follow.
In a conversation, we know that our partner does not share our knowledge of theworld. In addition, we know that our partner will attempt to interpret our utterances.We thus frame our utterances based on this knowledge. Two guiding principles forour utterances are that they should be relevant and helpful.
To be relevant an utterance should further the current topic. This is because ourpartner is expecting an utterance in this context and any sudden shift in our topicfocus will make it more difficult for our partner to make sense of the utterance. Such shifts happen in a conversation, but require less ambiguous utterances (as thecommon ground for that particular utterance is lower).
To be helpful, an utterance should be understandable to the listener and besufficiently unambiguous given the listener’s understanding. This requires thespeaker to have a model of the listener’s understanding and vice versa. So assuminghe is being helpful, in saying ‘past the pub’, Brian implicitly assumes that there is aparticular pub, which Alison will recognize as being significant. It is no good the pubbeing significant to Brian alone; he must know that it will carry its intendedsignificance to Alison.
The ability to build such models is part of our social maturing. One of the keydevelopmental steps for a child is from an egocentric world view, where things areinterpreted in relation to the child, to a social one where the child recognizes others’viewpoints. At the age of 21/2, one of the authors’ children was interviewed by a lin-guistics researcher. At one stage the conversation proceeded:
Child: We went to the doctor.Researcher: Where was the doctor?Child: Up the steps.
The researcher was clearly (in the context and to an adult) wanting to know whetherthe doctor was in a hospital or not. The child’s answer would have been instantlymeaningful to any local parent as the steps to the local doctor were a constant prob-lem for people with prams. However, the child was at that stage unable to phrase theutterance in a way suited to her listener’s understanding. At a certain age childrenassume you know everything they know.4
4 To be fair, adults often make the same assumption of children!
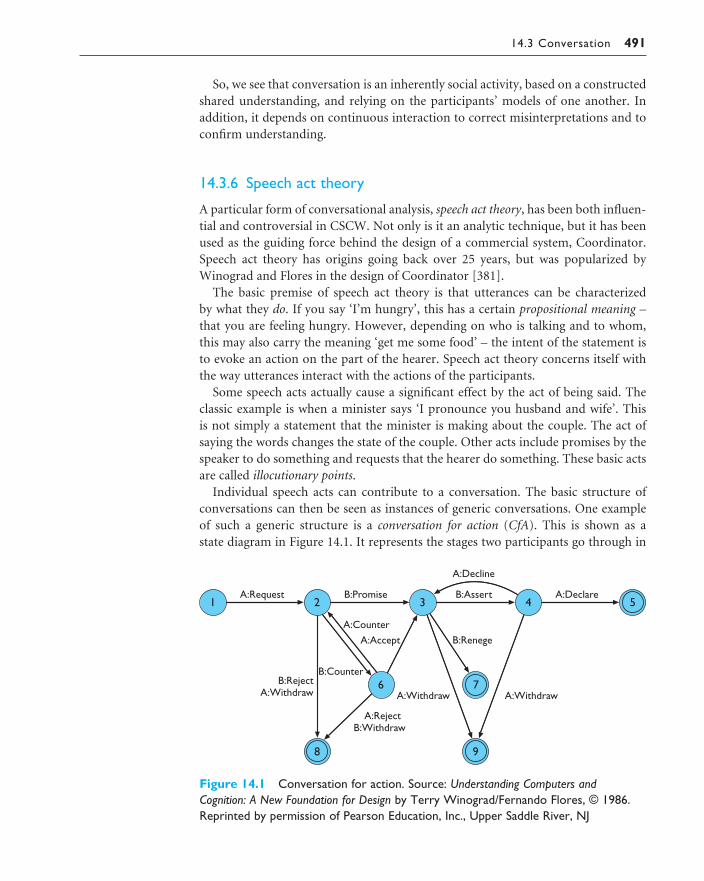
14.3 Conversation 491
So, we see that conversation is an inherently social activity, based on a constructedshared understanding, and relying on the participants’ models of one another. Inaddition, it depends on continuous interaction to correct misinterpretations and toconfirm understanding.
14.3.6 Speech act theory
A particular form of conversational analysis, speech act theory, has been both influen-tial and controversial in CSCW. Not only is it an analytic technique, but it has beenused as the guiding force behind the design of a commercial system, Coordinator.Speech act theory has origins going back over 25 years, but was popularized byWinograd and Flores in the design of Coordinator [381].
The basic premise of speech act theory is that utterances can be characterized by what they do. If you say ‘I’m hungry’, this has a certain propositional meaning –that you are feeling hungry. However, depending on who is talking and to whom,this may also carry the meaning ‘get me some food’ – the intent of the statement isto evoke an action on the part of the hearer. Speech act theory concerns itself withthe way utterances interact with the actions of the participants.
Some speech acts actually cause a significant effect by the act of being said. Theclassic example is when a minister says ‘I pronounce you husband and wife’. This is not simply a statement that the minister is making about the couple. The act ofsaying the words changes the state of the couple. Other acts include promises by thespeaker to do something and requests that the hearer do something. These basic actsare called illocutionary points.
Individual speech acts can contribute to a conversation. The basic structure ofconversations can then be seen as instances of generic conversations. One exampleof such a generic structure is a conversation for action (CfA). This is shown as a state diagram in Figure 14.1. It represents the stages two participants go through in
Figure 14.1 Conversation for action. Source: Understanding Computers andCognition: A New Foundation for Design by Terry Winograd/Fernando Flores, © 1986.Reprinted by permission of Pearson Education, Inc., Upper Saddle River, NJ

492 Chapter 14 n Communication and collaboration models
initiating an external action that one of them should perform. There are two variants, the one shown representing a conversation where the first speaker (A) isrequesting that the other participant (B) does something. The other, similar, variantis where the first speaker begins with an offer.
The numbered circles in Figure 14.1 are ‘states’ of the conversation, and thelabeled arcs represent the speech acts, which move the conversation from state tostate. Note that the speech acts are named slightly differently in different sources (bythe same author even!), but the structure of a CfA is the same. The simplest routethrough the diagram is through states 1–5.
Alison: Have you got the market survey on chocolate mousse?Brian: Sure.
Rummages in filing cabinet and hands it to AlisonBrian: There you are.Alison: Thanks.
Alison makes a request for the survey (although it is phrased as a question). Brianpromises to fulfill the request (‘sure’). After he feels he has done so (by handing it toAlison), Brian asserts that the request has been fulfilled (‘there you are’) and Alisondeclares her satisfaction that Brian has completed her request (‘thanks’).
More complex routes may involve some negotiating between the parties. Forexample, the conversation might have begun:
Alison: Have you got the market survey on chocolate mousse?Brian: I’ve only got the summary figures.Alison: That’ll do.
In this Alison’s request is met by a counter from Brian, that is Brian attempts to modify Alison’s request. This brings us to state 6 in the diagram. Alison then acceptsBrian’s counter, bringing the conversation back to state 3.
The network has some nodes marked with a double circle. These are the comple-tion nodes, and at these points neither party expects any more acts by the other aspart of this conversation. So the fragment above which left Alison and Brian in state3 must continue. Of these completion nodes only state 5 represents conclusionswhere the request has been satisfied. For example, Alison’s initial request could havebeen answered with ‘it’s confidential’ (meaning ‘you can’t have it’). This is the actionof Brian rejecting Alison’s request, leaving the conversation in state 8 and complete.
Not all speech acts need be spoken! Often a silence or an unspoken action formsa speech act. For example, let us imagine that the market survey had not been handyand so Brian answers Alison’s request with ‘sure, I’ll get it later’. Later in the day hefinds an electronic copy of the report and then emails it to Alison. His action will beinterpreted as asserting completion. If Alison does not respond within a short time,her silence will be read as declaring satisfaction and the conversation will be com-pleted.
There are other generic conversation forms as well as CfA. These include:
conversation for clarification usually embedded within a CfA to clarify the requiredaction (different from countering a request);

14.3 Conversation 493
conversation for possibilities looking toward future actions;
conversation for orientation building up a shared understanding.
In addition, the participants may indulge in meta-conversation, discussing the actsthemselves, perhaps questioning the legitimacy of an act: ‘I’m hungry’ . . . ‘well I’m not your skivvy, get your own food’. Also CfA is the most extensive and welldeveloped of the conversational forms. For example, the ‘creative’ conversation forpossibilities will have a much less structured form.
The importance of CfA is that actions are central to organizational administration.In the words of Terry Winograd [380]:
Conversations for action are the central coordinating structure for human organizations.
This belief in the importance of CfA, together with the assumption that makingspeech acts explicit will aid communication, prompted the design of the toolCoordinator. Coordinator is a form of structured email system. When sending a message, the participants must say what kind of illocutionary act they are perform-ing and what part it plays in a conversation. The tool knows about CfA and a fewother conversational forms. In addition, it allows time limits to be put on messages.Together these facilities allow the participants to keep track of their own commit-ments and those of others.
As an example, imagine Alison wishes to use Coordinator to request the marketsurvey from Brian. She selects a menu option saying that she wants to initiate a CfA.The system then offers her two possibilities, a request or an offer. She chooses to make a request and from now on the system knows that a CfA is in progress. She then types ‘have you got the market survey on chocolate mousse’ into the textarea of the message. Note that the system does not try to structure or interpret thenatural language content of the utterance, but only demands that the sender declaresthe illocutionary point of it. Brian receives Alison’s message and is told by the systemthat it is a request. He is then offered the various conversational moves that can follow: promise, counter-offer or decline (reject), plus a few more not on Figure 14.1.If he chooses promise, the system fills the message area with the default words ‘I promise to do as you request’, which can be altered (to ‘sure’) if Brian desires, orsent as it is. The intention is that many simple acts can be completed by the defaults.
Coordinator, being one of the earlier CSCW systems, has had plenty of criticism.Indeed, ‘Coordinator bashing’ has become so common in CSCW circles that it (thebashing) is coming under criticism itself. There are three main problems: reserva-tions about speech act theory itself and CfA in particular, that people dislike usingCoordinator, and whether the whole concept of making intentions explicit is a good idea.
The first criticism is that speech acts do not adequately describe conversations. Forexample, Alison walks into Brian’s office while he is on the phone, he picks a reportfrom the table and gives it to her, she walks out. Speech act theory would regard thisas a conversation for action. The request is implicit; presumably Brian knows whatAlison wants from some previous context. Then when Brian hands over the report,

494 Chapter 14 n Communication and collaboration models
he is, by complying with her request, both implicitly promising to fulfill and assertingcompletion of the request. Finally, by going out of the office Alison implicitly declarescompletion. There seems to be an awful lot of squeezing to get the interchange to fitthe CfA! Indeed, this is recognized in part within Coordinator as a valid response toa request is a report of completion (assert), that is taking the promise as read.
There have been mixed responses as to the usefulness of Coordinator, but most(certainly the most vocal) have been negative. The conversational forms basically donot do what people want. Those users who continued to use it ended up using ‘free-form’ messages – a non-interpreted action. Effectively, they used Coordinator as astandard email. It has been claimed that the only organizations that have usedCoordinator successfully are those with strong authoritarian managerial structureswhere the employees have been ordered to use it. Coordinator has even been dubbed‘the world’s first fascist computer system’5 – which was certainly not the intention of the designers. As you can see, emotions tend to run high when discussingCoordinator!
The fundamental approach of Coordinator is different from any previous system,and from most since. Rather than starting with technology – build it and play with it – Coordinator started with a theory of communication and then used this to drive design. Such theory-led design is a thoroughly proper design approach. Thedebatable issue is the way in which the theory was incorporated into the tool.
Coordinator expects its users to make explicit what is normally implicit in ourutterances. We hope the reader will have realized by now just how rich human conversation is, and how effective people are at communication. However, one ofthe fundamental lessons learnt by the expert systems community is that experts dothings, they do not know how they do them. Forcing expert communicators (people)to think about their communication is rather like asking a centipede to think aboutwalking. This all suggests that theory should be used to guide the design, but shouldnot be embedded explicitly within it.
There is a counter-argument, however. First of all, there is some evidence to sug-gest that teaching managers to recognize their speech acts improves their commun-ication. The extrapolation is that making the acts explicit improves communication,but that is a major extrapolation. A more measured claim would be that explicit representation is at least a good tool for training communication skills. The secondargument concerns the nature of electronic communication. Although we are allexperts at face-to-face communication with all its subtleties, our expertise is sorelychallenged when faced with a blank screen. We lack the facilities to make our inten-tions implicit in our communications and thus explicit means will help.
Whatever the rights and wrongs of Coordinator’s design, the evidence is that itsusers have largely voted with their feet. More recent systems have included a muchgreater level of user control, allowing users to build conversational structures of theirown. Possibly, the structures they build are merely special cases of CfA and otherspeech act structures, but users clearly prefer to feel that they have the power over thesystem.
5 Even if one agreed with the sentiment, it would certainly not be the first.

14.4 Text-based communication 495
TEXT-BASED COMMUNICATION
For asynchronous groupware (and even some synchronous systems), the major formof direct communication is text based. There are exceptions to this, for instance voicemessaging systems and answerphones, and other media may be used in addition totext such as graphics, voice annotation or even video clips. But despite these, text isstill the dominant medium.
Text-based communication is familiar to most people, in that they will have written and received letters. However, the style of letter writing and that of face-to-face communication are very different. The text-based communication in groupwaresystems is acting as a speech substitute, and, thus, there are some problems adaptingbetween the two media.
There are four types of textual communication in current groupware:
discrete – directed message as in email. There is no explicit connection between dif-ferent messages, except in so far as the text of the message refers to a previous one.
linear – participants’ messages are added in (usually temporal) order to the end of asingle transcript.
non-linear – when messages are linked to one another in a hypertext fashion.
spatial – where messages are arranged on a two-dimensional surface.
In addition, the communication may be connected to other shared computer artefacts, which will be described further in Chapter 19 (Section 19.6). In the casewhere the communication is an annotation, the annotation itself may be structuredin any of the ways listed above.
A special case of a linear transcript is structured message systems such asCoordinator, where not only the order but also the function of each message is deter-mined. The other extreme is where the transcript is presented as a single stream, withno special fields except the name of the contributor. Figure 14.2 shows a screen shotof the York Conferencer system showing such a transcript on the left of the screen.On the right is an electronic pin-board, an example of spatially organized text.
In this section, we will discuss some of the differences between face-to-face con-versation and text-based communications. We will use several of the concepts intro-duced during our discussion of face-to-face communication and conversationalstructure in Sections 14.2 and 14.3.
14.4.1 Back channels and affective state
One of the most profound differences between face-to-face and text-based com-munication is the lack of fine-grained channels. Much of the coordination of face-to-face conversation depends on back channels and interpretation of the listener’s expressions. Text-based communication loses these back channels com-pletely. Consider the effect of this on even a two-party conversation. Where the
14.4

496 Chapter 14 n Communication and collaboration models
speaker would pause to seek back channel confirmation or to offer the floor, the text‘speaker’ must either continue regardless, or finish the message, effectively passingthe turn. One consequence of the lack of interruptions and more measured pace of interaction is that the utterances are more grammatical than speech – but still not Queen’s English!
In addition to this loss of back channels, the speaker’s tone of voice and body language are of course absent. These normally convey the affective state of the speaker (happy, sad, angry, humorous) and the illocutionary force of the message (animportant and urgent demand or a deferential request). Email users have developedexplicit tokens of their affective state by the use of ‘flaming’ and ‘smilies’, using punctuation and acronyms; for example:
:-) – smiling face, happy:-( – sad face, upset or angry;-) – winking face, humorousLOL – laughing out loud.
People tend to use stronger language in email than in face-to-face conversation,for example they are more likely to be highly and emotively critical. On the otherhand, they are less likely to get emotionally charged themselves. These apparentlycontradictory findings make sense when you take into account the lack of implicitaffective communication. The participants have to put this explicitly into their
Figure 14.2 Conferencer screen shot showing text transcript and pin-board

14.4 Text-based communication 497
messages – thus accounting for their stronger language. At the same time, they areemotionally ‘distanced’ by the text from their conversants and have the conversationspread out over time. In addition, they do not have to express their affective state byacting emotionally. Together these factors contribute to a more heated conversationby calmer conversants!
14.4.2 Grounding constraints
In Section 14.3.5, we discussed the process by which conversants obtain commonground. This grounding process is linked strongly with the types of channels throughwhich the conversants communicate. Clark and Brennan [71] describe the proper-ties of these channels in terms of grounding constraints. These include:
The culture of electronic mail
We use or receive many different kinds of paper messages: formal letters, memos, handwrit-ten notes, pre-printed letters and postcards. In addition, we communicate by voice: in meetingsand lectures, by telephone and as we pass in the corridor. The same message delivered by differ-ent media has a different meaning for us. Someone asks us to do something as we pass them in thecorridor, but we forget. We don’t feel too guilty. But if the same request came by formal letterwe would be expected to respond.
These communication mechanisms have been around a long time and we largely understand thesocial force of different media. That is, we have a shared culture for paper and voice media. Thesituation for electronic media is far less clear.
In the past, email used to be very unreliable. So, if someone sent you a mail and you were slow to respond or didn’t respond at all, you didn’t feel too guilty. After all, for all the sender knew, you might never have received the message! That is, the unreliable nature of the medium built upa culture where the social force of email was weak – rather like the comment while passing in thecorridor.
However, increasingly email is used within organizations for passing critical information or makingimportant decisions. The expectation is that email will be treated with the same force as a formalletter or memo.
Imagine what happens when the two cultures meet . . . Sending a message to someone asking themto come to a meeting in half an hour will obviously only have its intended effect if the sender andrecipient have a shared culture of use.
Often you cannot know when you send a message what the email culture of the recipient is. Itvaries between organizations and even between groups and individuals within an organization. Themedium itself gives few clues. Even more frightening, many people do not even realize that thereare such cultural differences.

498 Chapter 14 n Communication and collaboration models
cotemporality – an utterance is heard as soon as it is said (or typed);
simultaneity – the participants can send and receive at the same time;
sequence – the utterances are ordered.
These are all constraints which are weaker in text-based compared with face-to-faceinteraction. For example, simultaneity in face-to-face conversation allows backchannel responses. Even where, say, two participants can see each other’s typed mes-sages as they are produced, the nature of typing makes it all but impossible to typeyour message whilst looking for your colleague’s ‘back channel’ response.
In a text-based system, different participants can compose simultaneously, butthey lack cotemporality. As we saw, even if the messages appear as they are pro-duced, they will not be read in real time. In addition, the messages may only be delivered when complete and even then may be delayed by slow communicationsnetworks.
Linear transcripts obviously have some idea of sequence, but this is confused bythe overlap and interleaving caused by the lack of cotemporality and simultaneity.Consider this typical interchange during the use of the York Conferencer system:
1. Bethan: How many should be in the group?2. Rowena: Maybe this could be one of the four strongest reasons?3. Rowena: Please clarify what you mean.4. Bethan: I agree.5. Rowena: Hang on.6. Rowena: Bethan what did you mean?
Rowena and Bethan composed their first utterances simultaneously. When Rowenalooks up to the transcript area, she sees Bethan’s message and does not under-stand it, so she enters the canned phrase ‘Please clarify what you mean’ which is generated by a button marked ‘Clarify’. Simultaneously, Bethan reads Rowena’smessage (2) and hits her canned phrase button ‘Agree’. Rowena is then confusedabout what Bethan means by ‘I agree’ as the preceding message was her request forclarification.
In a spoken conversation, Rowena and Bethan would have quickly correctedthemselves if they began to speak at once, and the linearity would have reflected acommon experience. The trouble is that the participants in the text-based conferenceeach experienced the messages in a different order:
Rowena: 2 1 3 4 5 6Bethan: 1 2 4 3 5 6
We will discuss these problems of interleaving and overlapped messages further inthe following sections.
Altogether, the lack of grounding constraints in text-based communication makesit more difficult to obtain a common ground. It has also been found that email and text-based meetings are less effective at resolving conflicts than a face-to-facemeeting.

14.4 Text-based communication 499
14.4.3 Turn-taking
We saw that one of the fundamental structures of conversation was turn-taking(Section 14.2.5). The last transcript was an example of a breakdown in turn-taking.In fact, such breakdowns are quite rare in two-party electronic conversations and arequickly corrected. What is more surprising is that such breakdowns so rarely occurduring letter writing, which is in some ways similar. However, when conversing byletter, one has an objective timescale with which to work out whether one’s fellowconversant ought to have replied. One therefore does not send a second letter unlessthe conversant is very remiss in replying to the first missive. However, in synchronoustext-based conversation, the time taken to compose a message (from 30 seconds toseveral minutes) is far greater than the few seconds which feel ‘immediate’ on a com-puter system, but is too short to be able to reason about rationally. The replies alwaysseem a long time coming and hence one is tempted to send a ‘follow-on’ message.
Despite the occasional breakdown, most observers of two-party text-based inter-action report an overall turn-taking protocol, which exhibits many of the structuresof normal conversation including adjacency pairs. However, when we look at threeor more participants, turn-taking and adjacency pair structure begin to break downcompletely.
In a pair of participants, turn-taking is simple; first one person says something,then the other. The only problem is deciding exactly when the exchange should happen.With three or more participants, turn-taking is more complex. They must decidewho should have the next turn. This is resolved by face-to-face groups in a numberof ways. First, the conversation may, for a period, be focused on two of the parties,in which case normal two-party turn-taking holds. Secondly, the speaker mayspecifically address another participant as the utterance is finished, either implicitlyby body position, or explicitly: ‘what do you think Alison?’ Finally, the next speakermay be left open, but the cotemporality of the audio channel allows the other particip-ants to negotiate the turn. Basically, whoever speaks first, or most strongly, gets in.
These mechanisms are aided by back channels, as one of the listeners may make it clear that she wants to speak. In this case, either the speaker will explicitly pass theturn (the second option above), or at least the other listeners are expecting her to speak. In addition, the movement between effective two-party conversation (thefirst option) and open discussion will be mediated by back channel messages fromthe other participants.
In an unstructured text-based conversation the third option is not available, nor, of course, are the back channels. Paired conversation is quite common and thesecond option, explicitly naming the next speaker, is possible. However, this namingis not particularly natural unless a direct question is being asked. In both options, the absence of back channels makes it difficult for another listener to interrupt theconversation. Some systems use more structured mechanisms to get round theseproblems, perhaps having a round-robin protocol (each participant ‘speaks’ in turn)or having a queue of turn-requests. Whether the strictures of such mechanisms are worse than the problems of occasional breakdown depends very much on thecontext and is a matter of opinion.

500 Chapter 14 n Communication and collaboration models
14.4.4 Context and deixis
We have seen how important context is in ordinary speech. Utterances are highlyambiguous and are only meaningful with respect to external context, the state of theworld, and internal context, the state of the conversation. Both of these are problemsin text-based communication.
The very fact that the participants are not co-present makes it more difficult to use external context to disambiguate utterances. This is why many groupware sys-tems strive so hard to make the participants’ views the same; that is, to maintainWYSIWIS (‘what you see is what I see’). In Chapter 19 we will look at an examplethat shows that this is an issue even when the participants have audio/video com-munications or are in the same room!
Whatever the means of direct communication, remote participants have diffi-culty in using deictic reference. They cannot simply say ‘that one’, but must usu-ally describe the referrant: ‘the big circle in the corner’. If their displays are notWYSIWIS then they must also ensure that their colleague’s display includes the objectreferred to and that the description is unambiguous. Asynchronous participantshave even more problems with deixis as there is no opportunity for their colleaguesto clarify a reference (without extremely lengthy exchanges). Furthermore, theobjects referred to by a message may have changed by the time someone comes toread it! Similarly, group pointers are not really an option, but one can use methodsof linking the conversation to its context, either by embedding it within the objectsas annotations or by having hypertext links between the conversation and the object.
The trouble does not end with external context; there are also problems with deictic reference to internal context. In speech, the context is intimately connectedto linear sequence and adjacency. As we have seen, even in linear text transcripts,overlap breaks the strict sequentiality of the conversation, and thus causes problemswith indexicals and with context in general.
1. Alison: Brian’s got some lovely roses.2. Brian: I’m afraid they’re covered in greenfly.3. Clarise: I’ve seen them, they’re beautiful.
Brian and Clarise both reply to Alison’s message at the same time. However, in the transcript, where Clarise says ‘they’ this appears, at first, to refer to the greenfly.Brian is expecting a consoling reply like ‘I’ve seen them. Have you tried companionplanting?’ Of course, the breakdown quickly becomes apparent in this case. Theproblem is not so much that people cannot recover from such breakdowns, as in theextra burden the recovery puts on the participants. If these messages are being sent, say, between continents, network delays and time differences may limit exchanges to once a day. Even one or two messages recovering from breakdown are then amajor disaster.
Most email systems and some bulletin boards lack any implied sequentiality and thus any context to the messages. The users (ever inventive) get round this byincluding copies of previous messages in their replies. This is only partially effectiveand, of course, incredibly clumsy.

14.4 Text-based communication 501
Hypertext-based systems avoid the implied sequentiality of a linear transcript. In the above example, both Brian and Clarise replied to Alison’s message at the same time. In a hypertext these would form parallel conversations. This is shown inFigure 14.3, where in addition Clarise has sent a second message offering advice onBrian’s greenfly. The use of ‘they’ in Clarise’s message (3) is now perfectly clear.
14.4.5 Pace and granularity
In a spoken conversation, the turns are often only a few tens of seconds long. If we take into account minor confirmations and back channels, the pace is still faster,perhaps a turn or back channel response every few seconds. Compared with this, thepace of email is very slow: messages can take from a few seconds to hours to deliver.Even synchronous text-based conversations are limited by the participants’ typingspeed and have a pace of at most one turn every minute or so.
The term pace is being used in a precise sense above. Imagine a message beingcomposed and sent, the recipient reading (or hearing) the message and then com-posing and sending a reply. The pace of the conversation is the rate of such asequence of connected messages and replies. Clearly, as the pace of a conversationreduces, there is a tendency for the granularity to increase. To get the same informa-tion across, you must send more per message. However, it is not as easy as that. Wehave seen the importance of feedback from listener to speaker in clarifying meaningand negotiating common ground. Even most monologs are interactive in the sensethat the speaker is constantly looking for cues of comprehension in the listener.Reducing the pace of a conversation reduces its interactivity.
As well as at the small scale of clarifying individual utterances, interactivity is im-portant in determining the direction of a conversation. Imagine that the conversation
Figure 14.3 Hypertext conversation structure

502 Chapter 14 n Communication and collaboration models
is a little like a game, where the participants can make moves. In Figure 14.4, we can see some of the moves Alison and Brian can make whilst talking in the garden(Clarise has gone home). At each turn of the conversation, Alison or Brian canchoose to say one thing which continues the discussion. That is, they gradually workout a path from the top of the tree downwards. A particularly promising conversa-tion path is shown with bold lines.
In a hypertext-based system one can expand several branches of a conversationtree, but in speech or in a linear text transcript the conversation follows one branch.Whatever medium is used, you cannot normally progress down the tree faster thanthe pace of the conversation. To overcome these limitations, people adopt severalcoping strategies.
The simplest strategy is just to avoid conversation. This can be done by delegatingparts of a task to the different participants. Each participant can then perform muchof the task without communication. They must still communicate for large-scalestrategic decisions, but have significantly reduced the normal communications. Of course, this approach reduces communication by reducing collaboration.
More interesting in a cooperative work setting are two coping strategies whichincrease the chunk size of messages in order to reduce the number of interactionsrequired to complete a task. These strategies are frequently seen in both text-basedconferences and in letter writing.
The first of these coping strategies is multiplexing. Basically, the conversants holdseveral conversations in parallel, each message referring to several topics. In terms of theconversation tree, this corresponds to going down several branches at once. For anexample, consider the transcript in Figure 14.5 taken during a computer-mediated
Figure 14.4 The conversation ‘game’

14.4 Text-based communication 503
game of Diplomacy as part of the TMPI (theories of multi-party interaction) project[171]. The turn by England (E) introduces two topics: the forming of an alliance (forsubversive purposes), and a particular line of attack (through Holland).
The second coping strategy for increasing the size of message chunks is eagerness.The participants can foresee the possible course of the interaction and frame com-munications which encompass many of the possibilities: for example, ‘If you don’tpay within seven days we will take you to court’. Thinking of the conversation tree,eagerness is a sort of depth-first strategy. The participant explores a branch of thetree guessing the other participant’s responses.
If we compare spoken with written communication we find that letters are farmore eager than speech. When writing a letter, one takes more care that the pointsare stated clearly, and one may even consider alternative responses of the recipientand state one’s position on each. For instance, a letter may say ‘if you marry me I willbe happy for ever, but if not, life will lie like bitter herbs upon my tongue’ (lovershave a tradition of being overeager). In extremis one frames a communication whichdescribes one’s reaction in all possible situations.
One can find similar incidents of eagerness in electronic conversations, for ex-ample the messages in Figure 14.6 from Severinson Eklundh’s corpus [317], quotedby Bowers and Churcher [42], both exhibit eagerness, the contingent part of eachmessage being introduced by the key phrase ‘In that case’.
Eagerness is less likely to lead to breakdown, except where the message tries toforesee too great a breadth of possibilities and becomes confusing. However, thereare various circumstances: for instance, in many process control tasks, where thenumber of possibilities at each stage of the tree is large. In this case eagerness cannotsolve the communication problems.
E: I don’t like the other three being incahoots – shall I form an alliance withone to stitch them up? I’ll move toHolland first.
Figure 14.5 Excerpt of transcript from Hewitt et al. [171]. Source: Courtesy ofProfessor Nigel Gilbert
A: Subject: Report C 123660The above mentioned report is out of stock. The remaining ones are C 12366 + C 123660. What to do? Reprint? In that case, do you have any changes to suggest?
· · · · · ·A: Subject: SIGSIM meeting
Are you going to Linkoping tomorrow?In that case when are you leaving?Does SIGSIM pay for the trip or what?
Figure 14.6 Excerpt from Severinson Eklundh’s corpus [317]. Source: Courtesy ofKerstin Severinson Eklundh

504 Chapter 14 n Communication and collaboration models
A potential problem of eagerness is that by following a particular branch of theconversation, other branches, which your colleague would have liked to explore, aremissed. In spoken conversations it is quite difficult to return to a previous point. It is possible to say ‘going back to . . .’, but this can form a potentially rude break inthe conversation. In text-based communications, the reviewability of the mediumreduces this effect. It is easier to return to a missed point as both participants can refer to the conversation up to that point. In addition, the break in the line ofconversation is less rude as both participants know that the current topic can itselfbe picked up again. Finally, there is even the option of multiplexing the current topicwith the lost point.
Reviewability is another grounding constraint of communication, but this timeone where text-based communication has the advantage over speech. You can ofcourse tape speech, but it is far from easy to use this as a review mechanism.
14.4.6 Linear text vs. hypertext
Considerations of potential overlap suggest that hypertext-based communica-tions may be better suited as a text-based communication medium. Similarly, theproblems of pace may be partially solved in a hypertext. Multiplexed messages can be represented as updates to several parts of the hypertext, thus reducing thelikelihood of breakdown and lost topics. In addition, if the messages themselves canbe mini-hypertexts, then eager messages listing several possible courses of action canbe explicitly represented by the message.
On the other hand, hypertext has its disadvantages. Even static hypertexts, whichhave been carefully crafted by their authors, can be difficult to navigate. A hypertextthat is created ‘on the fly’ is unlikely to be comprehensible to any but those involvedin its creation. Conklin and Begeman, themselves associated with the hypertext-based argumentation tool gIBIS, conclude that ‘traditional linear text provides acontinuous, unwinding thread of context as ideas are proposed and discussed’ [76].For the asynchronous reader trying to catch up with a conversation, a linear transcript is clearly easier, but it is precisely in more asynchronous settings whereoverlap in linear text is most likely to cause confusion.
We can see that there is no best solution, with possibly the best course in many situations being linear transcripts arranged by topic, with some automatically gener-ated indication of overlap.
GROUP WORKING
So far we have been principally looking at the properties of direct communication,and largely two-party conversations. Group behavior is more complex still as wehave to take into account the dynamic social relationships during group working.We will begin by looking at several factors which affect group working, and then
14.5

14.5 Group working 505
discuss the problems of studying group working. This section deals with groups thatare actively working together, rather than the organizational issues considered in the previous chapter, which are primarily concerned with the long-term structureswithin which people work.
14.5.1 Group dynamics
Whereas organizational relationships such as supervisor/supervisee are relatively stable, the roles and relationships within a group may change dramatically within thelifetime of a task and even within a single work session. For example, studies of jointauthoring have found that roles such as author, co-author and commentator changethroughout the lifetime of a document [254, 295]. This means that systems, such asco-authoring systems, which use a formal concept of role, must allow these roles tochange together with the socially defined roles.
Even the naming of roles can cause problems. A person may be an author of abook or paper, but never write the words in it, acting instead as a source of ideas andcomments. A particular case of this is the biographical story where the individualconcerned and a professional writer co-author the book, but only the professionalauthor writes. A co-authoring system such as Quilt would call the non-writingauthor a ‘commentator’ or a ‘reviewer’, but not an ‘author’. One can imagine someof the social friction such naming will cause.
Within the microcosm of group interaction, authority roles can be entirelyinverted. For example, if the managing director of a coal mining company visits thecoal face, he should act under the authority of the supervisor at the face, for his ownsafety and that of the mine. These inversions can cause problems even in computer-free situations – it is hard for the supervisor to say ‘No’ to the MD. But, if a systemdemands an explicit controlling role, it is even harder for the manager to relinquishthis explicit role, even if in the context the subordinate should be in control.
Not only do the social relationships within the group change, but the group membership and structure can change in time. A member leaving or a new memberjoining can cause dramatic changes in the behavior of the group. For example, if avery dominant member leaves, the group may change from a leader–follower to a democratic structure. New members have special problems adapting to the par-ticular group subculture, which can develop very quickly among close colleagues. In addition to this social adaptation, the new member must ‘catch up’ with the substantive work of the group. Groupware systems, for example argumentation tools,can help in that they record the history of the group. Groupware designers should ingeneral be aware that new members can and will enter the group and should designtheir software accordingly. For example, a latecomer to a synchronous conferenceshould be able to review all past contributions, not just the new ones.
The group may also divide into subgroups for detailed discussion and thenreform. Tools must be able to support this. For example, early versions of CoLab’ssoftware only catered for a single WYSIWIS screen – that is, they only supported asingle group. Later versions were forced to allow subgroups to work independently

506 Chapter 14 n Communication and collaboration models
and then share results. Note that the CoLab meeting room only has room for six persons; in larger meeting rooms subgroup working is the norm.
14.5.2 Physical layout
In Section 14.2, we discussed the importance of eyegaze and gesture in face-to-facecommunication and how these help to mediate turn-taking. In particular, we notedin Section 14.2.3 that we must ensure that monitors do not block the participants’views of one another. In general, the physical layout of a room has a profound effectupon the working relationship of those in it. This is particularly obvious for meetingrooms, but should be considered in any group-working environment.
As well as being unobtrusive, the orientation of computing equipment can affectgroup working. If we wish to encourage conversation, as we do in a meeting room,the participants must be encouraged to look toward one another. Meeting roomshave a natural focus toward the screen at the front of the room, but inward-facingterminals can counteract this focus and thus encourage eye contact [226].
The designers of Capture Lab, an eight-person meeting room, considered all thesefeatures and many other subtle effects. However, the users still had some difficulty in adapting to the power positions in the electronic meeting room. At first sight, theelectronic meeting room is not unlike a normal conference room. If the sharedscreen is a whiteboard or an overhead projector, then the most powerful position istoward the front of the room (seats 1 or 6 in Figure 14.7). Managers would normallytake this seat as they can then easily move to the whiteboard or overhead projectorto point out some item and draw the group’s attention.
Unless primed beforehand, managers of groups using Capture Lab took one of these seats, but quickly became uncomfortable and moved. In the electronic meeting room, there is no advantage to being at the front, because the screen can becontrolled from any terminal. Instead, the power seat is at the back of the room(seats 3 or 4), as from here the manager can observe other people whilst still seeingthe screen. Also, the other participants have to turn round when the manager speaks,adding to the manager’s authority over the meeting.
14.5.3 Distributed cognition
In Chapter 1, we discussed human cognition, but the emphasis was, as in all tradi-tional psychology, upon the activity within the person’s head. A school of thinkinghas recently developed which regards thinking as happening not just within the head,but in the external relationships with things in the world and with other people. Thisviewpoint is called distributed cognition [208, 185].
In fact, this viewpoint is not as radical as it first appears. Traditional views talk about the movement of information between working memory and long-termmemory: it is not so difficult then to regard bits of paper, books and computer systems as extensions to these internal memory systems. Similarly, many models ofhuman cognition regard the mind as a set of interacting subsystems (see Chapter 12):the step to regarding several people as involved in joint thinking is not difficult.

14.6 Summary 507
Remember that this is a view of cognition, that is thinking; it says nothing aboutawareness, personality or individuality.
Distributed cognition has profound effects on the way we look at group workingand even individual work. It emphasizes the importance of mediating representations,for example the drawings on a whiteboard. These are no longer just a means of communicating between the parties, but can be a concrete embodiment of groupknowledge. Furthermore, it constantly reminds us that communication is not justabout getting knowledge from one person’s head to another, but about the creationof new group knowledge, not necessarily grasped in totality by any single member.
The emphasis on external forms is encouraging for a designer. It is not necessaryto understand completely the individual’s cognitive processing in order to designeffective groupware. That is an impossible task. Instead, we can focus our analysis ofexisting group situations and design of groupware on the external representationsused by the participants.
SUMMARY
Face-to-face communication is extremely complex. People maintain precise dis-tances, which can be disrupted through video links. Each utterance is mediated bysubtle back channel responses signifying agreement, or on attempting to interrupt.
14.6
Figure 14.7 Meeting room layout
508 Chapter 14 n Communication and collaboration models
Body movement, facial expression, eye contact and eyegaze are all used for these backchannels and also to establish context.
At a higher level, the structure of conversation can be seen as a sequence of turns,usually alternating between the participants. Context is important in disambiguat-ing utterances, especially when deictic reference is also used. This also depends onthe participants establishing a common understanding during the conversation.Breakdowns do occur in conversation, but conversational repair is very effective.Speech act theory, a detailed analysis of conversational structure, has been used to drive the design of Coordinator, a highly controversial, commercial, structuredmessaging system.
Text-based communication loses most of the low-level feedback of face-to-faceconversation. This, and the possibility of overlapping turns, makes it more difficultto establish the context of a textual utterance, and therefore to disambiguate deixis.The reduced pace of text-based conversation means that participants are forced toincrease the granularity of their messages. They may achieve this by multiplexingmessages or by being eager, predicting their colleagues’ responses.
Group dynamics make it very difficult to predict how a particular group willbehave. In particular, small things, such as the layout of chairs in a room, can have amajor effect. We can see the thinking in a group as being distributed, not locked inany individual, but being within the whole group and the physical representationsthey use.
EXERCISES
14.1 In Section 14.3.2, we discussed the highly contextual nature of the spoken word, includ-ing the use of deictic reference and indexicals, and the (officially) ungrammatical and fragmentaryuse of sentences. Try listening to social chat over cups of tea – collect examples of different formsof contextual utterance.
14.2 Go into an office or other place where several people are working together. Try to note downin as much detail as possible what they are doing and when. Do this with different foci: focus onthe direct interpersonal communications, focus on the shared objects such as a calendar or docu-ment, or focus on one worker at a time. Whilst collecting data and when ordering your notes,look for breakdowns and misunderstandings, and for implicit communication through objects.Look also at a particular task over a period of time, and note the number of interruptions as aworker performs the task, or the way a single task is contributed to by several workers.
14.3 What is speech act theory? Describe positive and negative issues that have arisen when it has beenembodied in a specific system.
14.4 Compare turn-taking, round-robin and free-for-all as floor control mechanisms. When might eachbe effective?

Recommended reading 509
RECOMMENDED READING
J. Carroll, editor, HCI Models, Theories, and Frameworks: Toward an InterdisciplinaryScience, Morgan Kaufmann, 2003.See chapters by Perry on distributed cognition, Monk on common ground andKraut on social psychology.
L. A. Suchman, Plans and Situated Actions: The Problem of Human–MachineCommunication, Cambridge University Press, 1987.This book popularized ethnography within HCI. It puts forward the viewpointthat most actions are not pre-planned, but situated within the context in whichthey occur. The principal domain of the book is the design of help for a photo-copier. This is itself a single-user task, but the methodology applied is based onboth ethnographic and conversational analysis. The book includes several chap-ters discussing the contextual nature of language and analysis of conversationtranscripts.
T. Winograd and F. Flores, Understanding Computers and Cognition: A NewFoundation for Design, Addison-Wesley, 1986.Like Suchman, this book emphasizes the contextual nature of language and theweakness of traditional artificial intelligence research. It includes an account ofspeech act theory as applied to Coordinator. Many people disagree with theauthors’ use of speech act theory, but, whether by application or reaction, thiswork has been highly influential.
S. Greenberg, editor, Computer-supported Cooperative Work and Groupware,Academic Press, 1991.The contents of this collection originally made up two special issues of theInternational Journal of Man–Machine Studies. In addition, the book containsGreenberg’s extensive annotated bibliography of CSCW, a major entry point forany research into the field. Updated versions of the bibliography can be obtainedfrom the Department of Computer Science, University of Calgary, Calgary,Alberta, Canada.
Communications of the ACM, Vol. 34, No. 12, special issue on ‘collaborative com-puting’, December 1991.
Several issues of the journal Interacting with Computers from late 1992 through early1993 have a special emphasis on CSCW.
Computer-Supported Cooperative Work is a journal dedicated to CSCW. See also backissues of the journal Collaborative Computing. This ran independently for a while,but has now merged with Computer-Supported Cooperative Work.
See also the recommended reading list for Chapter 19, especially the conference proceedings.

TASK ANALYSIS
OV E RV I E W
Task analysis is the study of the way people perform taskswith existing systems.
n Techniques for task analysis:– decomposition of tasks into subtasks– taxonomic classification of task knowledge– listing things used and actions performed.
n Sources of information:– existing documentation– observation– interviews.
n Using task analysis to design:– manuals and documentation– new systems.
15
15.2 Differences between task analysis and other techniques 511
INTRODUCTION
Task analysis is the process of analyzing the way people perform their jobs: the thingsthey do, the things they act on and the things they need to know. For example, if wewere considering the job of housekeeping, we would want to say things like:
in order to clean the houseget the vacuum cleaner outfix the appropriate attachmentclean the roomswhen the dust bag gets full, empty itput the vacuum cleaner and tools away
To perform such a task, we need to know about vacuum cleaners, their attachments,dust bags (if used), cupboards (in which the vacuum cleaner is kept), rooms (to becleaned) and so on.
We will consider three different approaches to task analysis, which overlap butwhich lay their emphases on slightly different areas. These are as follows:
Task decomposition which looks at the way a task is split into subtasks, and theorder in which these are performed.
Knowledge-based techniques which look at what users need to know about theobjects and actions involved in a task, and how that knowledge is organized.
Entity–relation-based analysis which is an object-based approach where the emphasisis on identifying the actors and objects, the relationships between them and theactions they perform.
Task analysis is about existing systems and procedures; its main tools are those ofobservation in various forms. We will discuss these sources of information later. Oneof the purposes of task analysis is to help in the production of training materials anddocumentation. For this purpose, analysis of existing systems is sufficient.
However, where a new computer system is required, the task analysis also con-tributes to the statement of requirements of this system. We will see how it can beapplied in a fairly straightforward way to menu design. The process of designing anew system based on an analysis of an existing system will involve a considerableamount of professional insight and the contribution of task analysis to this is princip-ally one of clarifying and organizing one’s knowledge about the current situation.
DIFFERENCES BETWEEN TASK ANALYSIS AND OTHER TECHNIQUES
The scope of task analysis is quite wide. In addition to those tasks which directlyinvolve a computer, the task analyst will typically model aspects of the world that are not, and are not expected to be, part of a computer system. So a task analysis of
15.2
15.1

512 Chapter 15 n Task analysis
word processing would include activities such as fetching documents from the filingcabinet, changing the printer ribbon and putting floppy disks in and out of the com-puter as well as the more obvious interaction with the machine.
So, like traditional systems analysis, task analysis is not limited to activities includ-ing a computer, although (again like systems analysis) the intention is usually that a computer system will be installed. In fact, it is often hard to differentiate manymodern task analysis techniques from their older cousins. The main difference is one of emphasis; task analysis is there specifically to recognize the importance of the user.
Some aspects of task analysis will look very like the goal-oriented cognitive models discussed in Chapter 12. Indeed, there would be little to prevent one using aGOMS-like notation to represent a task decomposition such as the vacuum cleaningabove. The difference between the two lies in the intention of the models. The pur-pose of the goal-oriented models is to understand the internal cognitive processes asa person performs a task – the granularity is thus usually rather small. The emphasisof task analysis is more one of observing the user from the outside and will includeactions, such as retrieval of a document from a filing cabinet, which would never be included in a GOMS analysis.
Task analysis therefore tends to look more at the observable behavior of users thantheir internal mental state. Some practitioners would say that task analysis should berestricted to precisely this objective observable behavior – you should be interestedin what, not why. However, even the most objective analysis will include some infer-ences about the user’s internal goals, and this will often be evident in the names used in task decomposition. Furthermore, other practitioners explicitly state thattheir intention is to build a conceptual model – the way the user views the system andthe task. This latter approach will be particularly evident in the knowledge-basedapproaches.
Sometimes task analysis will produce quite low-level task decompositions whichare identical to those one would expect from a goal-oriented analysis. However, fortask analysis this would tend to be the end of the process, to be used, for instance, bythe interface designer in structuring the dialog. For goal-oriented cognitive models,such a goal hierarchy is the central feature, to be further analyzed for complexity,learnability and the like.
In terms of the design life cycle (Chapter 6), task analysis belongs at the beginningin requirements capture, whereas the cognitive models are normally used toward theend of the process during evaluation.
TASK DECOMPOSITION
The example above of vacuum cleaning showed how a task, ‘clean the house’, wasdecomposed into several subtasks: ‘get the vacuum cleaner out’ and so on. Most taskanalysis techniques involve some form of task decomposition to express this sort of
15.3

15.3 Task decomposition 513
behavior. Hierarchical task analysis (HTA) is typical of such an approach [15, 318].The outputs of HTA are a hierarchy of tasks and subtasks and also plans describingin what order and under what conditions subtasks are performed.
For example, we could express the house-cleaning example as in Figure 15.1, fur-ther decomposing the subtask ‘clean rooms’. Indentation is used to denote the levelsin the task hierarchy, and the tasks are also numbered to emphasize this hierarchy.The plans are labeled by the task to which they correspond. So plan 0 refers to theway in which we perform the subtasks 1–5 of task 0. Similarly plan 3 refers to the wayin which we perform 3.1–3.3. There are no plans for subtasks 1, 2, 4 and 5 as thesehave not been decomposed.
Reading the plans, we see that not all the subtasks need be performed, and notnecessarily in the order presented. Looking first at plan 0, subtask 4 ‘empty the dustbag’ need only be performed when the dust bag is found to be full. As this is put inplan 0, we assume that we may empty the dust bag at any stage including when wefirst get the vacuum cleaner out or when we put it away. If we know that we only evernotice the bag is full when we are actively using the machine, we might choose to putthis subtask within 3 ‘clean the rooms’. This sort of restructuring, finding the appro-priate and meaningful hierarchy, is part of the process of HTA.
Looking now at plan 3, how to clean the rooms, we see that we are allowed to clean the rooms in any order. If the task had been varnishing the floors rather thancleaning them, we would presumably do the hall after the rest of the rooms!Furthermore, we only clean those rooms which need vacuuming. The bedrooms will not get dirty as fast as the hall, so we need not clean them so often. If we wantedto be more precise about when the rooms are cleaned, we could produce a morespecific plan:
Plan 3: do 3.1 every day3.2 once a weekwhen visitors are due 3.3
Figure 15.1 How to clean a house
0. in order to clean the house1. get the vacuum cleaner out2. fix the appropriate attachment3. clean the rooms
3.1. clean the hall3.2. clean the living rooms3.3. clean the bedrooms
4. empty the dust bag5. put the vacuum cleaner and attachments away
Plan 0: do 1 – 2 – 3 – 5 in that order.when the dust bag gets full do 4
Plan 3: do any of 3.1, 3.2 or 3.3 in any orderdepending on which rooms need cleaning

514 Chapter 15 n Task analysis
How does one produce such a hierarchy with attendant rules? The process is iterative. Assume for the moment that we have some overall task in mind, such ashouse cleaning. We then ask, what subtasks must be accomplished in order to per-form the main task? To answer this question we refer to various sources: directobservation, expert opinion, documentation and so on. These sources will be dis-cussed later in Section 15.6. We then look at each subtask and seek to subdivide it,and so on.
One could go on with this process indefinitely, so one applies some form of stopping rule in order to decide when the tasks are basic enough. The level at whichwe do this will, of course, depend on the purpose of the task analysis. For example,imagine we were looking at a chemical plant and had produced a first-level decom-position of what to do in an emergency:
0. in an emergency1. read the alarms2. work out appropriate corrective action3. perform corrective action
If our ultimate aim is to install computer monitoring of the plant, we would be inter-ested in expanding tasks 1 and 3. On the other hand, if the aim is to produce onlineoperations manuals, then it is task 2 which would require expansion. In fact, at thishigh level of task description the analyst would probably expand all the subtasks asshe ought to take a somewhat larger view. However, one would obviously put moreeffort into those subtasks which are directly relevant to the intended purpose.
A rule, which is particularly appropriate when the aim is to design training mater-ials, is the P × C rule. This says that if the probability of making a mistake in the task(P) multiplied by the cost of the mistake (C) is below a threshold, then stop expand-ing. That is, simple tasks need not be expanded (because no one needs training),unless they are critical.
Another obvious stopping point is where the task contains complex motorresponses (like mouse movement) or where it involves internal decision making. In the first case, decomposition would not be productive; explaining how suchactions are performed is unlikely to be either accurate or useful. In the second case,we would expand if the decision making were related to external actions, such aslooking up documentation or reading instruments, but not where the activity ispurely cognitive. A possible exception to this would be if we were planning to builda decision support system, in which case we may want to understand the way some-one thought about a problem in order to build tools to help. However, it is debatablewhether HTA is the appropriate technique in this case.
The task hierarchy can be represented diagrammatically as well as textually. Fig-ure 15.2 shows a task hierarchy for making a cup of tea. The main task, ‘make a cup of tea’, is decomposed into six subtasks. Of these only the first, ‘boil water’, is expanded further. The remaining tasks 2–6 and the subtasks of 1.1–1.4 are underlined showing that the analysis has been deliberately stopped at that point. This obviously denotes the same information as the textual form, but may be moreaccessible at a glance.

15.3 Task decomposition 515
Having produced a first stab at a task hierarchy, one would examine it for errorsor omissions. One way of approaching this would be to describe the steps in the taskhierarchy to a domain expert. This would quickly show that the plan for making tea has a significant error – it forgets to warm the pot. This has to be added betweentasks 2 and 3.
It is the nature of expert knowledge that obvious things get missed for a taskdescription. One way the analyst can search for such omissions is by examining theform of the subtasks. For example, 1.4 says ‘turn off gas’, but nowhere does it say to turn the gas on! Probably, this was implicit in ‘put kettle on hob’, but it should be added between tasks 1.2 and 1.3. At this point we might notice that the task hierarchy is a little unbalanced. This might be right, but we may have included toomany detailed tasks at the highest level. We choose to add a new top-level node‘make pot’ which would encompass the tasks 3 and 4 and also the new ‘warm pot’task.
The top-level tasks would now be
0. make a cup of tea1. boil water2. empty pot3. make pot4. wait 4 or 5 minutes5. pour tea
Figure 15.2 Hierarchical task analysis: making a cup of tea
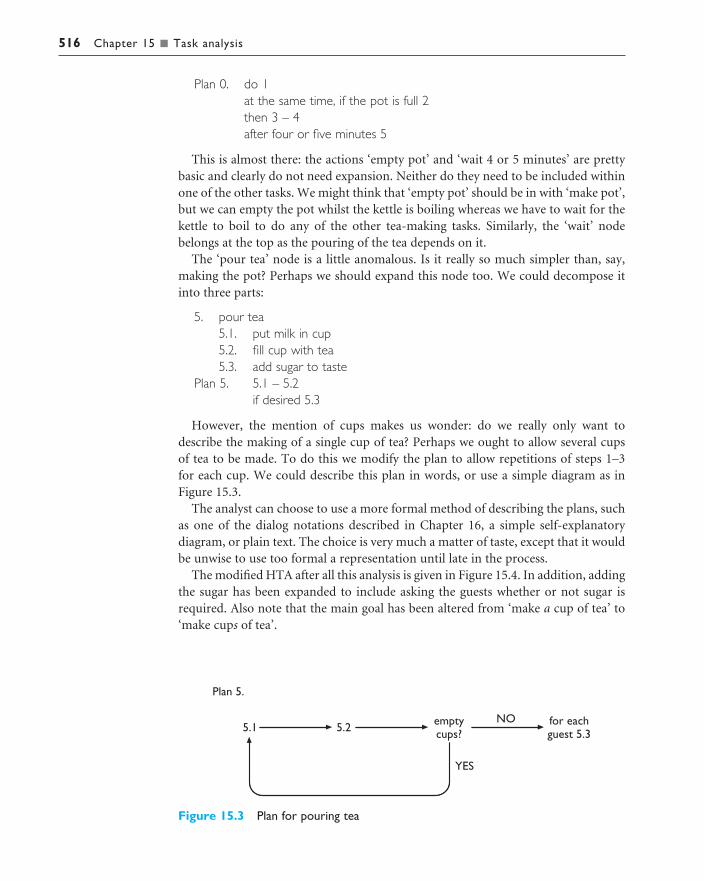
516 Chapter 15 n Task analysis
Plan 0. do 1at the same time, if the pot is full 2then 3 – 4after four or five minutes 5
This is almost there: the actions ‘empty pot’ and ‘wait 4 or 5 minutes’ are prettybasic and clearly do not need expansion. Neither do they need to be included withinone of the other tasks. We might think that ‘empty pot’ should be in with ‘make pot’,but we can empty the pot whilst the kettle is boiling whereas we have to wait for thekettle to boil to do any of the other tea-making tasks. Similarly, the ‘wait’ nodebelongs at the top as the pouring of the tea depends on it.
The ‘pour tea’ node is a little anomalous. Is it really so much simpler than, say,making the pot? Perhaps we should expand this node too. We could decompose itinto three parts:
5. pour tea5.1. put milk in cup5.2. fill cup with tea5.3. add sugar to taste
Plan 5. 5.1 – 5.2if desired 5.3
However, the mention of cups makes us wonder: do we really only want todescribe the making of a single cup of tea? Perhaps we ought to allow several cups of tea to be made. To do this we modify the plan to allow repetitions of steps 1–3 for each cup. We could describe this plan in words, or use a simple diagram as inFigure 15.3.
The analyst can choose to use a more formal method of describing the plans, suchas one of the dialog notations described in Chapter 16, a simple self-explanatory diagram, or plain text. The choice is very much a matter of taste, except that it wouldbe unwise to use too formal a representation until late in the process.
The modified HTA after all this analysis is given in Figure 15.4. In addition, addingthe sugar has been expanded to include asking the guests whether or not sugar isrequired. Also note that the main goal has been altered from ‘make a cup of tea’ to‘make cups of tea’.
Figure 15.3 Plan for pouring tea

15.3 Task decomposition 517
We have now seen all the types of plan that are commonly found, most of them inFigure 15.4:
Fixed sequence In plan 3, we always do the same sequence of subtasks.
Optional tasks In plan 0 ‘empty pot’ and in plan 5.3 ‘add sugar’ may or may notbe performed depending on circumstances. Sometimes, there will be a choicebetween several options.
Waiting for events In plan 1, we had to wait for the kettle to boil, and in plan 0 we waited 4 or 5 minutes. The latter, waiting a certain time, is probably morecommon in real-world tasks, such as process control or office procedures, than inthe use of computer software.
Figure 15.4 Modified task hierarchy for making lots of cups of tea

518 Chapter 15 n Task analysis
Cycles In plan 5, we repeatedly perform tasks 5.1 and 5.2 until a condition isreached (no more empty cups).
Time sharing Tasks 1 and 2 could be done at the same time (or at the very leastthey can be intermingled).
Discretionary For this we have to go back to the vacuum-cleaning example inFigure 15.1. The person is allowed to clean the rooms (plan 3), in any order andwhether or not they need it. Basically, you can keep your house as clean or as dirtyas you like!
Mixtures Most plans are a mixture of these elements. For instance, plan 1 for ‘boil-ing water’ is largely a fixed sequence but split by a wait.
As we can see, the process is far from straightforward. In common with other taskanalysis techniques, the quality and form of the final output depends very much onthe skill of the analyst. Furthermore, different analysts are likely to produce differentresults, especially as regards the level of detail. Remember also that there is no single‘right’ answer – the output of the task analysis should reflect the purpose to whichthe analysis will be put.
Waiting . . .
In the HTAs in Figures 15.2 and 15.4, there are tasks labeled ‘wait 4 or 5 minutes’, but alsoin the plan ‘after 4 or 5 minutes’. This is clearly repetitive. The explicit subtask was added becausethe waiting during tea making is often a ‘busy wait’, perhaps chatting while the tea brews. If the taskhad been more like sending an email and waiting for the reply, we would not have included thewaiting as an explict subtask and only had ‘when reply arrives’ in the plan. Arguably for the teamaking we could have left the ‘wait 4 or 5 minutes’ out of the plan. However, the issue of the timing seems critical for the task sequence, hence belonged also in the plan – task analysis is notan exact science! The fact that tasks often have gaps in them is something we will return to inChapter 19.
Worked exercise Produce a high-level hierarchical task analysis showing how you would find information on awebsite. Assume the site has a search facility as well as normal links.
Answer This HTA just shows the main stages. Subtask 1.1 only works if the page needed is onelevel below the top page. Really, one would like to add a task 1.1.3 to say somethinglike ‘if the information required is not on the new page found through the link thenrepeat the steps of 1.1 on the current page’.

15.4 Knowledge-based analysis 519
Can you fix this? See our solution on the web at /e3/exercises/ch15/
KNOWLEDGE-BASED ANALYSIS
Knowledge-based task analysis begins by listing all the objects and actions involvedin the task, and then building taxonomies of them. Taxonomies are similar to thesort of hierarchical descriptions we often find in biology: animals are invertebratesor vertebrates, vertebrates are fish, birds, reptiles, amphibians or mammals, etc. The aim is to understand the knowledge needed to perform a task and thus to helpin the production of teaching materials and in assessing the amount of commonknowledge between different tasks.
We will begin by looking at simple hierarchies of objects. Consider first the con-trols in a (non-automatic) motor car. An example taxonomic structure is given inFigure 15.5; every control has exactly one place in the hierarchy.
Look at the figure for a moment: do you think it is a good one? We will discussthis shortly. Consider how we might have produced such a hierarchy, and how to useit. The car controls are particularly simple, as we can simply get in and look for themall. If we extended our analysis to driving a car in general, we would have to considermore objects: the instruments (speedometer, etc.), the car keys, seat-belts, road signs,
15.4
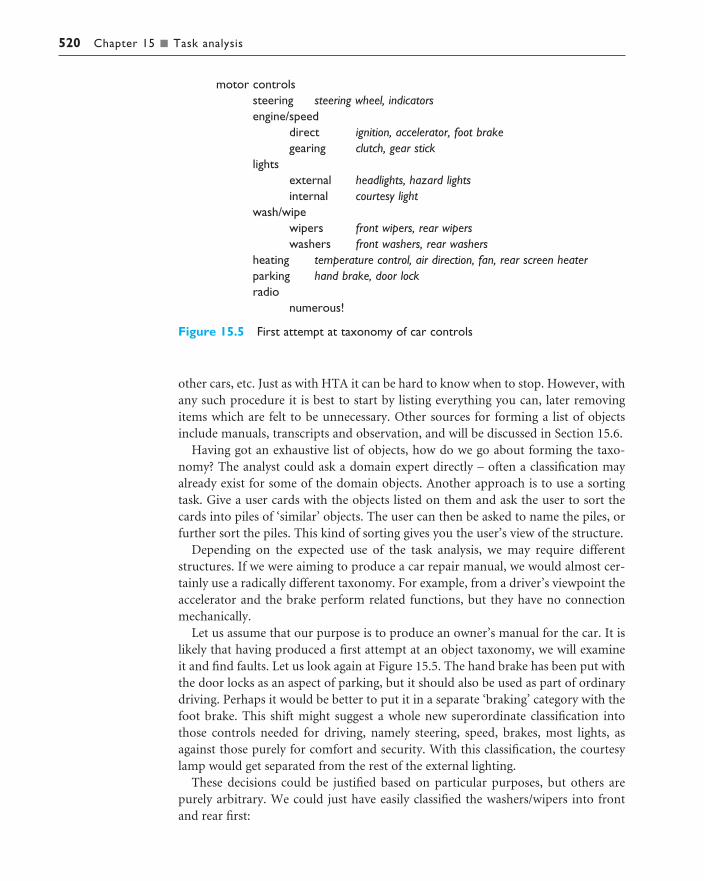
520 Chapter 15 n Task analysis
other cars, etc. Just as with HTA it can be hard to know when to stop. However, withany such procedure it is best to start by listing everything you can, later removingitems which are felt to be unnecessary. Other sources for forming a list of objectsinclude manuals, transcripts and observation, and will be discussed in Section 15.6.
Having got an exhaustive list of objects, how do we go about forming the taxo-nomy? The analyst could ask a domain expert directly – often a classification mayalready exist for some of the domain objects. Another approach is to use a sortingtask. Give a user cards with the objects listed on them and ask the user to sort thecards into piles of ‘similar’ objects. The user can then be asked to name the piles, orfurther sort the piles. This kind of sorting gives you the user’s view of the structure.
Depending on the expected use of the task analysis, we may require differentstructures. If we were aiming to produce a car repair manual, we would almost cer-tainly use a radically different taxonomy. For example, from a driver’s viewpoint theaccelerator and the brake perform related functions, but they have no connectionmechanically.
Let us assume that our purpose is to produce an owner’s manual for the car. It islikely that having produced a first attempt at an object taxonomy, we will examine it and find faults. Let us look again at Figure 15.5. The hand brake has been put withthe door locks as an aspect of parking, but it should also be used as part of ordinarydriving. Perhaps it would be better to put it in a separate ‘braking’ category with thefoot brake. This shift might suggest a whole new superordinate classification intothose controls needed for driving, namely steering, speed, brakes, most lights, asagainst those purely for comfort and security. With this classification, the courtesylamp would get separated from the rest of the external lighting.
These decisions could be justified based on particular purposes, but others arepurely arbitrary. We could just have easily classified the washers/wipers into frontand rear first:
motor controlssteering steering wheel, indicatorsengine/speed
direct ignition, accelerator, foot brakegearing clutch, gear stick
lightsexternal headlights, hazard lightsinternal courtesy light
wash/wipewipers front wipers, rear wiperswashers front washers, rear washers
heating temperature control, air direction, fan, rear screen heaterparking hand brake, door lockradio
numerous!
Figure 15.5 First attempt at taxonomy of car controls
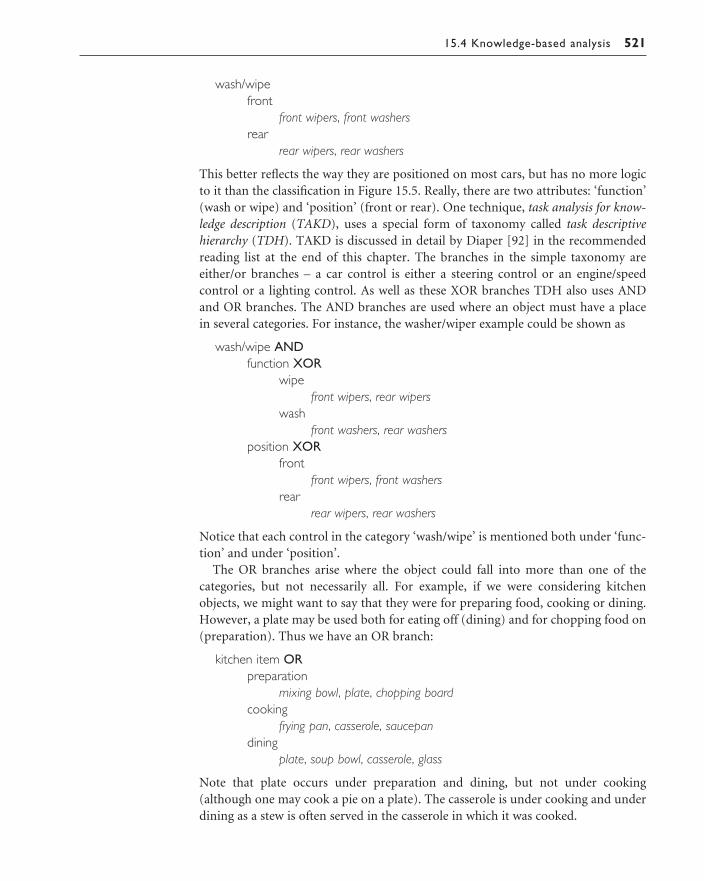
15.4 Knowledge-based analysis 521
wash/wipefront
front wipers, front washersrear
rear wipers, rear washers
This better reflects the way they are positioned on most cars, but has no more logicto it than the classification in Figure 15.5. Really, there are two attributes: ‘function’(wash or wipe) and ‘position’ (front or rear). One technique, task analysis for know-ledge description (TAKD), uses a special form of taxonomy called task descriptive hierarchy (TDH). TAKD is discussed in detail by Diaper [92] in the recommendedreading list at the end of this chapter. The branches in the simple taxonomy areeither/or branches – a car control is either a steering control or an engine/speed control or a lighting control. As well as these XOR branches TDH also uses AND and OR branches. The AND branches are used where an object must have a place in several categories. For instance, the washer/wiper example could be shown as
wash/wipe ANDfunction XOR
wipefront wipers, rear wipers
washfront washers, rear washers
position XORfront
front wipers, front washersrear
rear wipers, rear washers
Notice that each control in the category ‘wash/wipe’ is mentioned both under ‘func-tion’ and under ‘position’.
The OR branches arise where the object could fall into more than one of the categories, but not necessarily all. For example, if we were considering kitchenobjects, we might want to say that they were for preparing food, cooking or dining.However, a plate may be used both for eating off (dining) and for chopping food on(preparation). Thus we have an OR branch:
kitchen item ORpreparation
mixing bowl, plate, chopping boardcooking
frying pan, casserole, saucepandining
plate, soup bowl, casserole, glass
Note that plate occurs under preparation and dining, but not under cooking(although one may cook a pie on a plate). The casserole is under cooking and underdining as a stew is often served in the casserole in which it was cooked.

522 Chapter 15 n Task analysis
TAKD has a uniqueness rule, which demands that a completed TDH can dis-tinguish any two specific objects. The kitchen hierarchy above fails this test. We candistinguish, say, the plate from the soup bowl, because the plate is in categoriespreparation and dining, whereas the bowl is only under dining. However, we cannotdistinguish the soup bowl from the glass. TAKD would demand that we furtherrefine this hierarchy until all pairs can be distinguished from one another:
kitchen item AND/___ shape XOR/ |___ dished/ | mixing bowl, casserole, saucepan, soup bowl, glass/ |___ flat/ plate, chopping board, frying pan/___ function OR
{___ preparation{ mixing bowl, plate, chopping board{___ cooking{ frying pan, casserole, saucepan{___ dining XOR
|___ for food| plate, soup bowl, casserole|___ for drink
glass
Notice that the tree has been drawn using the characters: ‘/|{’. These are a character-istic of TDH and represent AND, XOR and OR branches respectively. The explicitlabels AND, etc., are not used in a normal TDH as these are implied by the way thetree is drawn.
At this point, each object can be represented by a unique path(s) in the hier-archy and thus by a term in the knowledge representation grammar (KRG). The KRGterm is built up using ‘/’ for AND branches, ‘()’ for XOR branches and ‘{}’ for ORbranches, similar to the diagram. For example, we could refer to the plate as
kitchen item/shape(flat)/function{preparation,dining(for food)}/
Translating, this says: a kitchen item whose shape is flat AND its function is prepara-tion OR dining for food.
Strict application of the uniqueness rule is not always necessary. Other similartechniques cope quite happily without it, but they normally adopt simple hier-archies, rather than the more complex AND/OR/XOR TDH trees.
The test is perhaps most important when a tree has a lot of AND or OR branchesrather than for simple hierarchies. In these cases, it is often difficult to see whetherthe classification scheme is suitably precise. Finding two simple objects which are notdifferentiated can be a good way of generating new classifiers. The lack of distinctionbetween glasses and soup bowls in the original kitchen item classification is a case in point. These are so clearly different, and one can ask the question ‘how can I tell the difference between a soup bowl and a glass?’ yielding the obvious food/drinkdistinction.

15.4 Knowledge-based analysis 523
However, there are other examples where attempting to follow the rule is less useful. In a more extensive list of items, with a more complex classification tree, itwas found that a corkscrew and a tin opener were not distinguished. Although it is possible to distinguish these, the categories introduced were not of ‘general’ use,that is they did not help one to differentiate anything else. In general, then, theuniqueness rule is perhaps best viewed as an informative check, rather than adoptedslavishly.
The production of a simple taxonomy, or a TDH, for actions is similar to that for objects. Imagine we have a list of specific actions which may occur in a kitchen:beating, mixing, pouring, frying, boiling, baking, eating and drinking. We may lookat these and start to build a hierarchy. For example, we may use the same classes:preparation, cooking and dining as we did for the objects:
kitchen job OR|___ preparation| beating, mixing|___ cooking| frying, boiling, baking|___ dining
pouring, eating, drinking
We may subject this to the same analysis that we used for objects. For example,pouring has been put under dining, for instance pouring wine. However, we mightalso pour milk into a bowl to beat with eggs for an omelette. This would meanputting pouring into both categories, or possibly a second look at the specific actionscalled pouring. Perhaps we should distinguish those of pouring drinks and pouringingredients?
Note the difference between this taxonomy of actions and that in HTA. The hierarchy above is one of genericity, whereas that in HTA was a ‘how to do it’ decom-position. HTA is about the sequencing of simple tasks to perform a single high-leveltask, whereas a taxonomy is about the similarity of simple tasks to one another.However, there will often be a relationship between the taxonomy of actions and the HTA descriptions of tasks. For example, having an omelette would consist ofbeating, frying and then eating, or having a cake would consist of mixing, baking and eating. In general, these tasks consist of one or more preparation and/or cook-ing actions followed by dining actions. It is precisely when we can begin to makethese general task statements that the power and usefulness of object and action taxonomies becomes apparent.
Looking back and forth between the objects and the actions will suggest omissionsor restructuring on one side or another: What action do we do with a choppingboard? Clearly we should add chopping as an action. The action of baking may suggest that we include baking trays and bread tins under the objects. This cross-checking is particularly important for capturing all actions as it is often easier to see what people are using for their job than to work out what they are doing.Furthermore objects are often grouped naturally under their function, so the objectgroupings may suggest action groupings and vice versa. In addition, we can apply theTAKD uniqueness rule to the action TDH, which would mean performing some

524 Chapter 15 n Task analysis
more subdivisions, perhaps adding distinctions between those actions concernedwith liquids and those with solids.
Having produced object and action taxonomies, we can use these in order to produce generic descriptions of simple tasks. For an example, we are consideringparticular kitchen tasks, and we shall assume that we have extended the object taxonomy to include foods. Consider the task of eating a fried egg off a plate. Thiscan be regarded as doing a ‘kitchen job(dining)’ using a ‘kitchen item/shape(flat)/function{dining,preparation}/’ to a ‘food(dairy)’. If we observed a kitchen for a day,we could describe each simple task as it is performed using similar terms. In TAKDthis is called a sentence in KRG.
Notice that the KRG terms do not use the complete KRG description of eachaction and object, but instead opt for a generic description. Choosing the appropri-ate generic description is an art, but there are guidelines to help. One way is to takethe TDH tree and to annotate it with the number of times each object or action ismentioned by an expert, or used or performed during our day’s observation. If thenumber of occurrences of objects below a node is small then one does not bother touse the lower-level distinctions. So, for example, in the above we have not botheredwith the ‘for food/for drink’ distinction among dining items. This process is calledgenerification.
The choice of an appropriate level to ‘cut’ the tree is also influenced by the num-ber of different KRG sentences we get for simple tasks. If there are an unmanageablenumber of different sentences, then it suggests that more generification is required.If, on the other hand, we found that all the observed tasks were represented by onlytwo or three sentences, then this would suggest that the level of abstraction is toogreat. Of course, what constitutes an appropriate number of different sentencesdepends on the circumstances, the complexity of the job we are analyzing and(again) the purpose of the analysis.
In addition, the appropriate generic categories chosen for actions and objects arelinked. If we consider the task of beating an egg in a mixing bowl (to make anomelette?), we could describe it as
kitchen job(preparation)using a kitchen item/shape(dished)/function{preparation}/
However, the levels of detail of the action and object are not well matched. The detail about the mixing bowl – that it is dished – is needed for beating, but not forpreparation in general. We should either be more specific about the action
kitchen job(preparation(beating))using a kitchen item/shape(dished)/function{preparation}/
or more generic in the description of the object:
kitchen job(preparation)using a kitchen item/function{preparation}/
Possibly, if we observe the cook beating eggs in a soup bowl, we might generalizein a different direction to

15.5 Entity–relationship-based techniques 525
kitchen job(preparation(beating))using a kitchen item/shape(dished)/
It is possible to go further, looking at generic task sequences; that is, looking at frequently occurring sequences of simple tasks and their representation in KRG sentences. The sequences may be derived from independent observations or from anHTA type of analysis. We have already had an example of this when we described ageneral kitchen task as consisting of one or more preparation and/or cooking actionsfollowed by a dining action.
The utility of both KRG sentences and sequences is not proven, but they add to our tools for analysis. However, even when the more complex parts of TAKD are inappropriate, the process of producing taxonomies and generification can beemployed. In particular, they are especially useful for teaching purposes, where thetaxonomy can be used to structure the presentation and description of the objectsand actions to the student.
ENTITY–RELATIONSHIP-BASED TECHNIQUES
Entity–relationship modeling is an analysis technique usually associated with data-base design and more recently object-oriented programming. When adopted for task analysis the major differences are in the kinds of entities modeled. In databaseand object-oriented design, the entities chosen for analysis will be those which areexpected to be represented in the resulting computer system. However, in task ana-lysis, we are interested in a wide range of non-computer entities including physicalobjects, the actions performed on them and the people who perform them.
Like knowledge-based approaches, the cataloging and examination of objects andactions is central to the analysis, but the emphasis is on the relationships between actionsand objects, rather than on the similarity between different objects and the resultingtaxonomic structure. For example, we might look at the three objects ‘gardener’, ‘soil’and ‘spade’, and the action ‘dig’ and see how they are related. We would record thatit is the gardener who performs the digging acting upon the soil using the spade. Par-ticular importance is attached to the linking of actions with the objects which performthem, and thus the technique can rightly be seen as an object-based methodology.
As an example, we will consider a task analysis of the market gardening firm‘Vera’s Veggies’. Imagine we have talked to Vera Bradshaw, the owner/manager ofVera’s Veggies, and have walked around the premises.
We begin by listing all the objects in the domain of interest. In the tool shed, we see a spade, a garden fork, a hoe and a small Ferguson tractor (called ‘Fergie’)with implements, plough and spring-tine harrow. There are two employees, SamGummage and Tony Peagreen, and Vera herself works the land as well as acting asmanager. From our conversation with her, we have found that there are two maingrowing fields, ‘One Hundred Acre’ and ‘Parker’s Patch’, and also a large glasshouse.She also, rather proudly, demonstrated the new computer-controlled irrigation
15.5

526 Chapter 15 n Task analysis
system she has just had installed; this has pumps for each field and the glasshouse,and, in addition, has a humidity sensor in the glasshouse. During the interview, wenotice that Vera often refers to ‘the kit’, meaning all contents of the tool shed, and‘the men’, meaning Sam and Tony. However, Vera has recently been on a manage-ment training course and so (when she remembers) she also uses the term ‘the team’referring to the complete staff including herself.
We can classify the objects into three basic types: concrete objects, actors and com-posite objects. First of all there are simple concrete objects such as the spade, ploughand glasshouse, that is all the ‘things’. The human actors are obvious, Vera, Sam andTony, but we may need to exercise some caution where things, such as Fergie, havebeen given names. One frequently finds that computers, cars and vegetable varietiesare named after people. On the other hand, human actors may be named imperson-ally, indirectly or not at all, for example ‘the seed merchant’, ‘the contractor’s digger’or ‘we sell a lot at the farm shop’ (to whom?).
We may also want to discuss non-human actors, concrete objects which in somesense act autonomously, which can ‘do’ something. In the case of Vera’s Veggies, wewould place the irrigation computer in this category. It may not be clear whether or not to regard an object as an actor; we will see that consideration of the actions(below) helps to make this distinction clear.
Finally, we have composite objects such as ‘the team’, which consists of three other objects (Sam, Tony and Vera), and ‘the kit’. These are both examples of a ‘set ’composite object; we may also come across ‘tuple’ composite objects. For example,during the interview, we may notice that a lot of times when ‘the tractor’ is mentioned Vera does not mean Fergie alone, but Fergie together with one or otherimplement, that is <Fergie, plough> or <Fergie, harrow>.
Composite objects need not always be named; for example, Vera may often saysimply ‘Sam and Tony’ rather than ‘the men’. Furthermore, it may sometimes beuseful to regard an entity such as ‘the team’ as an abstract object in its own right, andlink it to the (unnamed) composite object {Vera, Sam, Tony} by a relationship suchas consists_of (‘the team’, {Vera, Sam, Tony}).
We may wish to list some of the attributes of each object, for instance
Object Pump3 simple – irrigation pumpAttributes:
status: on/off/faultycapacity: 100 litres/minute
We need not strive to be as complete in the listing of attributes as we would forobject-oriented programming. Remember, the intention is not to produce machinerepresentations of the objects, but to describe their participation in human and com-puter tasks. For example, it is likely we will want to discuss the turning on and off ofirrigation pumps, so it is natural to record the status as an attribute. The relevance of the pump’s capacity is less obvious, and we may decide to drop it as we proceedwith the analysis. As with all the task analysis techniques, it is often best to be slightlyoverinclusive during early phases, as it is easier to drop unwanted items than to addthem later.
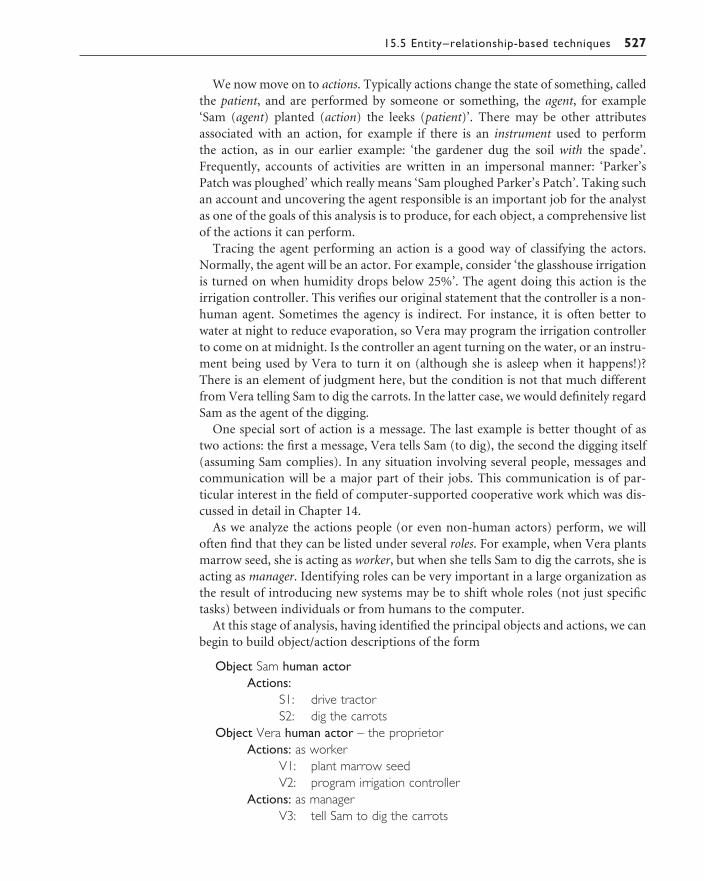
15.5 Entity–relationship-based techniques 527
We now move on to actions. Typically actions change the state of something, calledthe patient, and are performed by someone or something, the agent, for example‘Sam (agent) planted (action) the leeks (patient)’. There may be other attributes associated with an action, for example if there is an instrument used to perform the action, as in our earlier example: ‘the gardener dug the soil with the spade’.Frequently, accounts of activities are written in an impersonal manner: ‘Parker’sPatch was ploughed’ which really means ‘Sam ploughed Parker’s Patch’. Taking suchan account and uncovering the agent responsible is an important job for the analystas one of the goals of this analysis is to produce, for each object, a comprehensive listof the actions it can perform.
Tracing the agent performing an action is a good way of classifying the actors.Normally, the agent will be an actor. For example, consider ‘the glasshouse irrigationis turned on when humidity drops below 25%’. The agent doing this action is theirrigation controller. This verifies our original statement that the controller is a non-human agent. Sometimes the agency is indirect. For instance, it is often better towater at night to reduce evaporation, so Vera may program the irrigation controllerto come on at midnight. Is the controller an agent turning on the water, or an instru-ment being used by Vera to turn it on (although she is asleep when it happens!)?There is an element of judgment here, but the condition is not that much differentfrom Vera telling Sam to dig the carrots. In the latter case, we would definitely regardSam as the agent of the digging.
One special sort of action is a message. The last example is better thought of as two actions: the first a message, Vera tells Sam (to dig), the second the digging itself(assuming Sam complies). In any situation involving several people, messages andcommunication will be a major part of their jobs. This communication is of par-ticular interest in the field of computer-supported cooperative work which was dis-cussed in detail in Chapter 14.
As we analyze the actions people (or even non-human actors) perform, we willoften find that they can be listed under several roles. For example, when Vera plantsmarrow seed, she is acting as worker, but when she tells Sam to dig the carrots, she isacting as manager. Identifying roles can be very important in a large organization asthe result of introducing new systems may be to shift whole roles (not just specifictasks) between individuals or from humans to the computer.
At this stage of analysis, having identified the principal objects and actions, we canbegin to build object/action descriptions of the form
Object Sam human actorActions:
S1: drive tractorS2: dig the carrots
Object Vera human actor – the proprietorActions: as worker
V1: plant marrow seedV2: program irrigation controller
Actions: as managerV3: tell Sam to dig the carrots

528 Chapter 15 n Task analysis
Object the men compositeComprises: {Sam, Tony}
Object glasshouse simpleAttribute:
humidity: 0–100%Object Irrigation Controller non-human actor
Actions:IC1: turn on Pump1IC2: turn on Pump2IC3: turn on Pump3
Closely allied to actions is the idea of an event. Events are anything which happens.The performing of an action is an event, but we may also encounter spontaneousevents such as the germination of a marrow seed. There is no agent performing thegermination and it should be listed as a spontaneous action of the marrow itself, butnot implying that the marrow is in any sense an actor. Some spontaneous events,such as ‘the humidity drops below 25%’, have no associated object at all. A third typeof event is timed, such as ‘at midnight’.
Finally, we consider the relationships between objects, actions and events. The simplest relationships are object–object ones, such as the fact that Sam is sub-ordinate to Vera, or that irrigation pump 3 is situated in the glasshouse. There arealso action–object relationships. The relationship between the agent performing anaction and the action itself is implicit, as the actions are listed under the objectresponsible. However, we may want to record explicitly the patient and instrumentof an action. In addition, we may want to record relationships between actions andevents, such as temporal order and causality:
Object Marrow simpleActions:
M1: germinateM2: grow
EventsEv1: humidity drops below 25%Ev2: midnight
Relations: object–objectlocation (Pump3, glasshouse)location (Pump1, Parker’s Patch)
Relations: action–objectpatient (V3, Sam)
– Vera tells Sam to digpatient (S2, the carrots)
– Sam digs the carrots . . .instrument (S2, spade)
– . . . with the spadeRelations: action–event
before (V1, M1)– the marrow must be sown before it can germinate

15.5 Entity–relationship-based techniques 529
before (M1, M2)– the marrow must germinate before it can grow
triggers (Ev1, IC3)– when humidity drops below 25%,
the controller turns on pump 3triggers (Ev2, IC1)
– when it is midnight, the controller turns on pump 1causes (V2, IC1)
– the controller turns on the pumpbecause Vera programmed it
causes (V3, S2)– Sam digs the carrots because Vera told him to
Rather than express all the ordering of events and actions using relationships, this form of analysis would normally be combined with some representation of the sequence between actions. For example, the ATOM method (Analysis for TaskObject Modeling method) [360], upon which much of the above description is based,uses JSD diagrams to represent this (JSD diagrams are described in Chapter 16).Alternatively, one might use HTA diagrams, or one of the other dialog notations inChapter 16.
This form of analysis can be applied in two ways. For a specific task, say growingmarrows, we may analyze the order of subtasks and actions annotated by the objectsinvolved. Using HTA we might have
0. in order to grow marrows1. Vera sows the marrow seed2. marrow germinates3. Vera programs controller4. controller waters field5. marrow grows6. Sam hoes7. Tony harvests marrows
Plan 0: 1 – 2 – 5 – when crop is mature 7when rainfall is low 3 – 4when weeds grow 6
Notice that even though this task is centered on the marrow, there are several actions(for example, 3) which do not include the marrow, in any capacity.
Alternatively, we can produce for any particular object a ‘life cycle’ diagram representing all the actions in which it participates. Typically, this would cross over several tasks. For example, the irrigation controller would water the fields andglasshouse in any order determined by its program and humidity. This is obviouslymore in keeping with an object-based approach, but both types of action sequenceare important. Figure 15.6 shows an HTA diagram for the actions in which the tractor is involved. One is perhaps typically more interested in the life cycles of theagents, but in this example they are rather unstructured.

530 Chapter 15 n Task analysis
This form of analysis also fits very well with the sort of taxonomic analysis dis-cussed previously – object-oriented methods usually include some notion of class orinheritance hierarchy. Indeed, looking at the commonality of actions and relation-ships can help us to find useful generic categories. For example, we may see that thetwo fields are treated very similarly, or that Sam, Tony and Vera perform many tasksin common.
Worked exercise Consider the activity of making a telephone call. Record the actions in an HTA diagram or tex-tually. Start off simply, assuming you know the number to dial, but then add more complicatedsituations: finding the number in an address book, or what to do when the number is engaged.
Answer As with most of these exercises, this is an open-ended question. Here is a simple ver-sion with some expansion, but one can look at alternatives such as public payphones.
0. make phone call1. pick up receiver2. dial number3. wait for reply4. talk5. replace receiver
Figure 15.6 Life cycle of tractor

15.5 Entity–relationship-based techniques 531
Plan 0: 1 – 2 – 3when answered – 4when finished – 5
We now add looking up the number. The form this takes depends on whether we find the number in an address book or a telephone directory. If both fail, say if the callis long distance to someone not in a local directory, the telephone operator must beconsulted. Note that contacting the telephone operator involves making a phone call,but the steps for this are not repeated in full!
0. make phone call1. find number
1.1. look in address book1.2. look in phone directory1.3. ask operator
1.3.1. pick up receiver. . .
2. actually call2.1. pick up receiver2.2. dial number2.3. wait for reply2.4. talk2.5. replace receiver
Plan 0: if number unknown – 1when number found – 2
Plan 1: if phoning friend – 1.1if local call – 1.2if 1.1 or 1.2 fail – 1.3
Plan 2: 2.1 – 2.2 – 2.3when answered – 2.4when finished – 2.5
Finally, we add the case when the phone is engaged. The simplest way to do this is sim-ply to change Plan 2.
Plan 2: 2.1 – 2.2 – 2.3if answered – 2.4 then when finished 2.5if engaged – 2.5
However, looking at the second line it might suggest that we modify 2.4 to have twoparts:
0. make phone call. . .
2. actually call. . .
2.4. successful call2.4.1. talk2.4.2. replace receiver

532 Chapter 15 n Task analysis
2.5. failed call2.5.1. replace receiver
Plan 2: 2.1 – 2.2 – 2.3if answered – 2.4if engaged – 2.5
Plan 2.4: 2.4 then when finished 2.5
SOURCES OF INFORMATION AND DATA COLLECTION
The different task analysis methods allow you to structure data about tasks.However, the resulting task analysis can only be as good as the original data.
The process of task analysis is not a simple one of collect data, analyze and organ-ize and present results. Instead, the process of analysis will often throw you back to your original sources with new questions and insights. Ideally, the process thenshould be iterative with periods of data collection interspersed with analysis. In prac-tice, limitations of time and cost will cut this short, so the skill of the analyst lies inforeseeing possible problems in analysis and obtaining relevant data as quickly andeconomically as possible. The extreme cost of direct observation suggests that, wherepossible, the analyst ought to make maximum use of cheap sources of informationsuch as manuals or pilot studies before embarking on more costly collection exercises.
15.6.1 Documentation
The easiest source of data for the analyst is the existing manuals, instruction book-lets, training materials, etc., for the task. These are most likely to be focussed onspecific items of equipment or computer software, but this is often the focus anyway.Furthermore, there may be corporate rule books and job descriptions which may beused to obtain information about tasks in a wider context. It should be rememberedthat these sources typically tell you how people are supposed to perform tasks, notwhat they actually do. In addition, equipment-specific manuals are likely to tell youabout the functions of the device rather than the way it is used to perform a specifictask. For example, a word processor may describe a centering menu option, but thiswould be used as part of specific tasks such as writing a chapter title or producing afigure caption.
Although the structure of material in these sources may be misleading, they areuseful for providing basic actions and objects involved in a task. These lists may be incomplete, as they will often ignore non-device actions. For example, the word-processor manual may not mention the use of physical filing cabinets. However,manuals form a starting point for future analysis, and may be used to structureexperimental studies, or interviews; one can ask questions such as ‘when do you usethe centering option?’ Also the lists obtained from manuals may be compared withthose of direct observation – unused facilities or objects may indicate either that the
15.6

15.6 Sources of information and data collection 533
facility is redundant, or that it is part of a rare procedure. It is, of course, just theserare procedures which may be missed entirely by direct observation.
Rule books and job descriptions can be used as part of an interviewing process –‘your job description says . . . is that right?’, or may be compared against observationand then reflected back to the subject – ‘according to the instructions you do . . . butactually you did . . .’. Of course, for such questions to be useful it is essential that thesubjects are not put on the defensive or believe that their bending of the rules will bereported back to management. This sort of issue is central to analyses for computer-supported cooperative work as we saw in Chapter 14.
15.6.2 Observation
Some form of direct observation, whether formal or informal, is essential if the ana-lyst is to get an understanding of the task situation. At the simplest level, the analystcan simply spend time watching people and chatting, just to get the ‘feel’ of the task.Together with the reading of existing documentation, this can form a good first stagebefore going on to more extensive and formal observation.
Formal observation can occur in the field or in the laboratory. The advantages and disadvantages of each approach were discussed in detail in Chapter 9. Arguably,observation in the field is the ideal as this is the ‘real’ task. However, there may bebetter recording facilities in the laboratory (video, two-way mirrors, and so on) and we may want more control of the environment. Our observation can be passive(simply listening and watching) or active (asking questions). Especially where theobservation is passive, we may want to perform a post-task walkthrough; that is, discuss the observations with the subject. This allows us to find out the reasons whythe subject performed certain actions. We discussed different recording methods andpost-task walkthroughs in Chapter 9.
Worked exercise The act of searching is quite complicated. Look up a person in an address book or telephonedirectory. Get several friends to look up words in a dictionary. Observe their methods closely.You will probably have to develop shorthand notations to keep track of what pages they visit.Compare the strategies used by the different people. If they differ, try to abstract out the common parts of the task and the variable parts. If you have a computing background, try toclassify their methods in relation to known search algorithms: binary chop, linear search, etc.
Answer In order to see the range of possible search strategies, the authors asked two subjectsto look up words in a dictionary. One was a literate, but young, child and the other anerudite English graduate.
To obtain any sort of useful record, the subjects had to be asked to work slowly andeven then keeping track of the search was difficult. We noted down the page numbersthey paused at, but often searches included thumbing through a sequence of pages, atwhich point some form of specific notation would be useful. As an alternative to notingdown the page numbers, noting the words at the top of the page could be used.
The English graduate was also asked to talk aloud through the exercise. We discussedin Chapter 9 the possible effects this might have on the user’s performance, but it is

534 Chapter 15 n Task analysis
extremely difficult to keep track of the reader’s focus on the page otherwise. The notesin the tables have been tidied up considerably from our original handwritten scrawl andthe notes in italics were added afterwards. Unfortunately, in typesetting the notes, someof the spatial layout is lost. They do, however, retain the scrappiness of the originalobservations. Use of video can of course allow one to replay tasks at a slower rate andthus improve the detail of note taking.
The English graduate was asked to find unfamiliar words: ‘daltonism’ (Table 15.1) and‘parclose’ (Table 15.2). The child was asked to look up simpler words: ‘dig’ (Table 15.3)and ‘orange’ (Table 15.4). The transcripts do not include timings – the whole processtook no more than 30 seconds. To give an idea of relative timings: whereas the Englishgraduate homed quickly onto the correct page, this took the child somewhat longer,but, once they were on the right page, both were so quick that it is hard to give judg-ment on relative speed.
Table 15.1 Adult looking up the word ‘daltonism’
???? note illegible, intended to convey that she turned the dictionary on its side and then opened it
283 dog said that first cut was based on the position of ‘d’ in the alphabetflick backwardovershoot to ‘C’forward one page to ‘daltonism’ on this page
beginning of ‘D’quick skim over pageplaces finger on word
Table 15.2 Adult looking up the word ‘parclose’
right of center comment by subject on position of ‘p’ in dictionary729 O gets to page in the middle of ‘O’ sectionturn over forward741 page begins with ‘para’ words? C or K subject says unsure whether spelt with c or k
says she’ll look for ‘c’ firstscan with fingersequential she explains that the presence of the ‘para’ words made the task confusing
Table 15.3 Child looking up the word ‘dig’
525 near middle of book429 these first pages were quite rapid297 page headed ‘dualism’266 correct page – luck!scan down and up sequential search item by item

15.6 Sources of information and data collection 535
Table 15.4 Child looking up the word ‘orange’
236 last page of ‘c’266flick forward too fast to note pages800 overshootflick back700, 690, 699 start of ‘O’sequential pages703flick forward page by page717 right pagesequential search through page
From this evidence, about the best general description we could have is
0. look up word in dictionary1. find right page2. find word on page
Plan 0: 1 – 2
The performance of subtask 1 was far more efficient for the adult as she used a heur-istic to find the approximate position based on her knowledge of the alphabet. The child knew the relative position of words in the alphabet, but not enough to be able tosay ‘o’ is just after the middle, in the way the adult did with ‘p’. The difference in sub-task 2 was less marked, but mainly because it was too rapid to annotate. There wassome evidence that the adult used a more direct method than the child who simply (but quickly) scanned the page entry by entry.
If you carry out this observation with more subjects, or pool observations and comparenotes, you may be able to abstract more specific, but still general, search strategies. Forexample, you may see something akin to binary chop. You should not look for a singlestrategy used by all people, but instead look for a small set of strategies, and then lookfor ways of telling how people choose one strategy or another.
Really, two observations, as described above, are only sufficient for a pilot study in orderto sharpen up thinking. Looking at the notes may suggest shorthands, for instance arrowsto represent different kinds of scanning. It also prompts one to ask questions. Whathappens if, when they scan the page at step 2, the subjects discover that they are stillon the wrong page? Presumably this leads to a new ‘find the right page’ step. However,this subtask, essentially a fine correction, will be very different from the original search.
0. look up word in dictionary1. find right page2. find word on page3. adjust page
Plan 0: 1 – 2if still wrong page 3 – 2

536 Chapter 15 n Task analysis
Unlike the first HTA, this one is not based on observation, but on the authors’ imagina-tion, however. Given such refined expectations, you must return to observation inorder to explore further. Perhaps you could deliberately choose words close to pageboundaries in order to confuse the subjects. Alternatively, you could ask your subjects‘What would you do if you’d got the wrong page?’ Note that there is a differencebetween a psychological experiment in problem solving and a task analysis observation.For the former, we would be simply trying to verify our guess/theory. For the latter,we might have an idea, but our observations should be open ended as we want to findout what really happens, whether or not it agrees with our theories.
Although the question is clearly oriented toward procedural analysis, one could also do some form of knowledge-based analysis. Clearly concepts such as ‘position in thealphabet’ and ‘word at the top of the page’ are important. Indeed, if we were designingan electronic dictionary such concepts may be more useful than emulating paper.
Indeed, one could extend this question into a design exercise – how to design the electronic dictionary. Assuming that we are not interested in totally automatic lookup,how would we design the interaction? Whereas in a book, one’s normal action is toturn over one page backwards or forwards, in dictionary lookup one jumps into themiddle, turns over several pages at a time and flicks through pages at high speed. Thiscan emphasize that a question like ‘how do we design an electronic book?’ cannot beanswered until we know for what purposes that book is to be used.
15.6.3 Interviews
Questioning domain experts is often a direct and quick way to get information abouta task. Remember that the expert is not necessarily the manager or supervisor whoknows about the job, but the worker who actually does it – although there may be advantages to interviewing both sorts of expert, as the views of the manager orprofessional instructor are based on years of experience even if they are likely to be‘idealized’ versions of the task.
It may be particularly appropriate to interview the ‘professional’ experts afterdoing some formal or informal direct observation. It is then possible to ask them toreflect on the various expected and unexpected behaviors; this can become a form ofthird-party walkthrough.
More normally, one would begin with a general set of questions, possibly askingthe expert to describe a typical day, or task. This can then be followed with moreleading questions such as ‘Why do you do that?’ or ‘What if this develops a fault?’The aim is both to uncover detail and to increase the range of behavior discussed.
Where appropriate, the expert can be asked to produce lists of objects/actionsassociated with the task, although it may be unwise to demand too structured infor-mation during a first interview, as this may limit the range of material discussed. The exception to this would be HTA where one often starts with a top-down decom-position. In this case one can begin by asking the expert ‘What do you do to make acup of tea?’ and then successively expand the explanation.

15.6 Sources of information and data collection 537
15.6.4 Initial analysis
We assume we have got some sort of written transcript, whether from manuals,observation or interviews. The detailed analysis, of course, depends on the analysismethod employed, but most start by trying to build up lists of elementary objectsand actions. A simple device is to go through the transcript highlighting the nouns(which will be objects) and the verbs (which will be associated with actions). If thetranscript is online this process can even be automated with the help of an onlinedictionary.
However, this simple association is rarely enough on its own. Some words may beeither a verb or a noun, for instance in chess ‘castle’ is both a noun (the piece) andalso a verb (a particular move). Technical language is often full of ‘verbed’ nouns andeven ‘nouned’ verbs, although the latter are often names for processes, so are not asgreat a problem. In addition, the objects or actions may be implicit. This problemmay be better dealt with by checking consistency between lists, within the particulartask analysis method employed.
Context is often important in interpreting words. For instance, we may have thetwo verb phrases
‘beat the eggs in the bowl ’‘ate the porridge from the bowl ’
It is only by looking at the context that we see the former is a mixing bowl and thelatter is a soup bowl. Similar problems arise with verbs:
‘the rain poured’‘she poured the mixture into the pan’‘I poured the tea’
The first is clearly a different sort of pouring from the rest. Also, the second sort ofpouring may well be considered different from the last, as the pouring of the mixtureis an action during the preparation of food. Clearly, this second distinction is some-what debatable and hence one should attempt to leave such decisions till later in theanalysis process. To do this the object and action lists can be annotated, for example‘pour (the tea)’.
15.6.5 Sorting and classification
Several of the techniques include the production of hierarchies and sorting of entriesby various attributes. Some of this is carried out by the analyst, but some requiressubjective assessments by domain experts.
Several techniques can be used to obtain the relevant information. This has beendiscussed briefly before in Section 15.4.
One way is to take the list of, say, task objects, and write each one on a slip of paperor card. The expert is then asked to sort them into piles of similar objects. Dependingon the size of the piles the expert can be asked to subdivide the piles further, or togroup the piles into larger ones. If desired, the piles and groups of piles can be tied

538 Chapter 15 n Task analysis
together with elastic bands or put in envelopes and labeled by the expert by the com-mon characteristic. This process can be repeated several times, each time asking theexpert to perform a different grouping. Also, different experts can be asked and theirgroupings compared.
Alternatively, one can ask the expert to arrange the cards on a tabletop. This allowsthe expert to cluster the cards (showing similarity) and to use the spatial arrange-ment in order to give a classification by two attributes. Again, the expert can be ques-tioned after the event as to why the particular arrangement was used.
A range of similar techniques can be used to elicit the user’s or expert’s knowledgeabout a task. Each object/action can be ranked against each task depending on howimportant the expert thinks they are for that task. Perhaps on a scale 0 (never used) to10 (essential). So, for example, if the task were ‘making an omelette’ eggs would bescored 10, but the fork to beat the eggs may only be scored 5. Alternatively, the expert cansimply be asked to rank the objects, as this may be easier than an absolute judgment.
However the classification and production of hierarchies is performed, the job ofproducing possibly large taxonomies and hierarchy diagrams is not trivial. This canbe done by hand on paper or using a standard word processor, but is easier if an out-liner is used. There are several commercial outlining tools, and most word proces-sors and many spreadsheets have outlining facilities. These outliners make it easy toshift partially sorted groups as we refine the classification. They also allow us to hideunwanted information, say when we want to look at the top levels of decompositionof a task hierarchy, or if we want to ‘cut’ a TDH taxonomy to look at generic objectsor actions.
USES OF TASK ANALYSIS
The output of task analysis is some breakdown of the tasks people perform and,depending on the techniques chosen, the things that are employed and the plans andsequences of actions used to perform the tasks. The way this information is utilizeddepends very much on the use to which it is put. Three such uses will be describedbriefly: the production of manuals and tuition material; requirements capture andhigh-level systems design; and detailed interface design. Of these uses, only the firstis aimed at the actual system analyzed; the latter two use the analysis of the existingsystem in order to suggest the design of a new one.
15.7.1 Manuals and tuition
Some of the earliest techniques in task analysis were aimed at teaching novices how to perform a task. In particular, this was important for military training, forexample how to disassemble and clean a rifle. Training had to be quick and efficientas conscripts in peacetime may only serve a few years before returning to civilian life,or in wartime may only survive a few months.
15.7
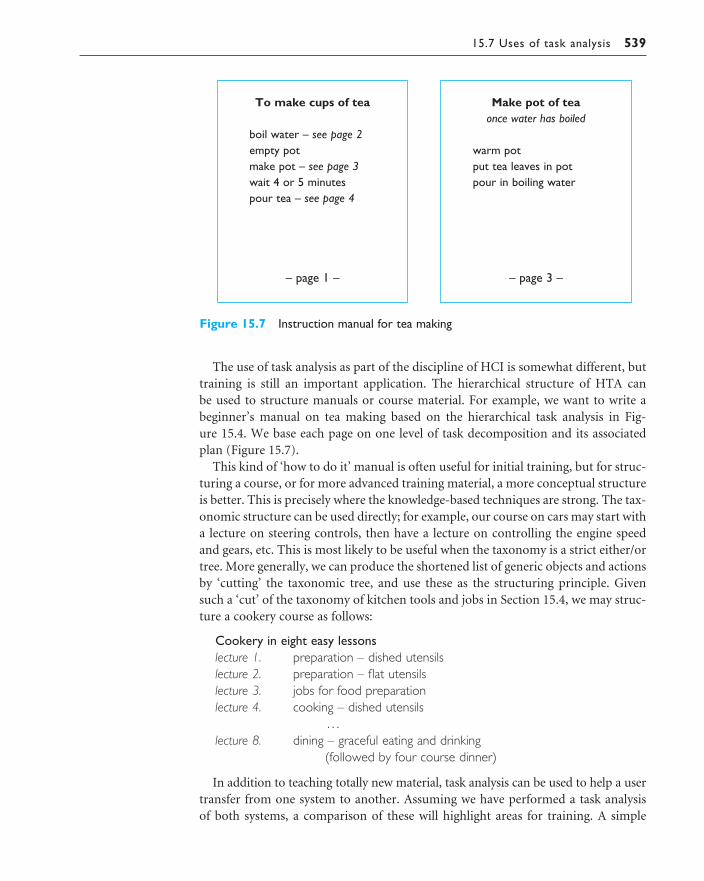
15.7 Uses of task analysis 539
The use of task analysis as part of the discipline of HCI is somewhat different, buttraining is still an important application. The hierarchical structure of HTA can be used to structure manuals or course material. For example, we want to write abeginner’s manual on tea making based on the hierarchical task analysis in Fig-ure 15.4. We base each page on one level of task decomposition and its associatedplan (Figure 15.7).
This kind of ‘how to do it’ manual is often useful for initial training, but for struc-turing a course, or for more advanced training material, a more conceptual structureis better. This is precisely where the knowledge-based techniques are strong. The tax-onomic structure can be used directly; for example, our course on cars may start witha lecture on steering controls, then have a lecture on controlling the engine speedand gears, etc. This is most likely to be useful when the taxonomy is a strict either/ortree. More generally, we can produce the shortened list of generic objects and actionsby ‘cutting’ the taxonomic tree, and use these as the structuring principle. Givensuch a ‘cut’ of the taxonomy of kitchen tools and jobs in Section 15.4, we may struc-ture a cookery course as follows:
Cookery in eight easy lessonslecture 1. preparation – dished utensilslecture 2. preparation – flat utensilslecture 3. jobs for food preparationlecture 4. cooking – dished utensils
. . .lecture 8. dining – graceful eating and drinking
(followed by four course dinner)
In addition to teaching totally new material, task analysis can be used to help a usertransfer from one system to another. Assuming we have performed a task analysis of both systems, a comparison of these will highlight areas for training. A simple
Figure 15.7 Instruction manual for tea making
To make cups of tea
boil water – see page 2empty potmake pot – see page 3wait 4 or 5 minutespour tea – see page 4
– page 1 –
Make pot of teaonce water has boiled
warm potput tea leaves in potpour in boiling water
– page 3 –

540 Chapter 15 n Task analysis
comparison of functionality is not sufficient as the crucial differences may be in pro-cedures. On the other hand, two systems may seem completely different in terms ofdetailed commands and presentation, but have similar high-level concepts or sim-ilar patterns of use. These common features should be brought out and can be usedto help the user transfer knowledge from one system to another.
15.7.2 Requirements capture and systems design
Task analysis can be used to guide the design of new (although possibly not novel)systems. Recall (from Chapter 6) that requirements capture is the process of elicitingwhat a new system should do. Task analysis in itself is not a form of requirementscapture as it refers to the existing system, not the planned system, and it includesmany elements which are not part of the system. However, it makes a strong contribu-tion toward the complete statement of requirements. Typically, the original state-ment of requirements given by a client will mention the new elements required andpossibly refer to the existing system and its functionality. Further information elicitedby a system developer may well concentrate on what the system should do but mayforget how it will be used.
The task analysis of an existing system can help in two ways. First, the analyst canask ‘Which of the existing objects, tasks, etc., should be in the new system?’. Secondly,the formalized presentation of the existing state of affairs may help the client to clarify what the novel features are to be. It may be decided to automate whole tasksor roles, or simply specific subtasks.
As the high-level design of the system progresses, task analysis continues to play a role. The structuring provided by, for instance, TDH taxonomies can help thedesigner to choose an internal model for the system which matches the existingexpectations of the users. This may, of course, be modified to accommodate novelfeatures, but gives a reasonable first structure.
We may also make some predictions about the use of the new system. Given theparts that are to be included and the planned behavior of the system, we may see howthis will interact with existing procedures, including how information will move in and out of the new system. Some of the procedures may be able to continue as before, especially if the system has been designed to mimic the old, possibly non-automated, system, but some may need to be retaught completely.
15.7.3 Detailed interface design
In a similar manner to the manual design, taxonomies of tasks or objects may beused in the design of menus. The TDH trees are obviously most useful in this respect.Top-level menus can be labeled after the top-level decomposition, and submenusafter the next level, etc. For this, the tree may be first reduced to a simple either/ortree, thus guaranteeing that each object/action is under exactly one menu. Altern-atively, more complex trees allowing AND and OR as well as XOR branches can beused. In this case, an object/action may be found by several paths through the menus.

15.8 Summary 541
An alternative menu layout could be based around roles and then tasks in roles.Again, for such a layout, it is likely that a particular action is found under severalroles/tasks. There is a tendency for users to find new tasks to perform with new sys-tems, and, for such a new task, the required actions on the system may be difficult to find and be widely dispersed. So this sort of layout is only sensible if the possibleset of tasks is very well defined, but where this is true, such a layout and systemdesign can be highly efficient.
If an object-oriented paradigm is being used in the interface, then the associationof objects with actions may be particularly useful. For each object, a menu of pos-sible actions, based on those for which it is the agent or patient, can be displayed.Default actions for each object may be chosen based on the frequency of actions (for efficiency) but informed by the generic classification scheme (for learnability).In most systems, the generic action associated with a double click is to ‘open’ theobject for editing. However, in specialist domains a different choice may be moreappropriate.
Task sequences obtained from a task decomposition can be used when designingthe system’s dialog (see Chapter 16). The order in which subtasks are performed inthe system can be made to mirror that of the original job. Even where the interfacestyle is more user directed, and hence the dialog sequence is not defined by thedesigner, the task decomposition and plans are useful. If we know that a certain taskis frequently performed, then we want it to be easy for the user to perform the sub-tasks in the appropriate order. If, for example, it involves constantly swappingmodes, or moving between widely different parts of a menu-based interface, thiswould be unacceptable.
Task analysis is never complete and hence it should not be the sole arbiter of thestyle and structure of an interface. However, the insights from a well-executed taskanalysis can make an interface that easily supports the way people want to work.
SUMMARY
We have seen several task analysis methods. Hierarchical task analysis decomposes a task into subtasks. These can be recorded either in a textual outline format or in a tree diagram. Knowledge-based techniques build taxonomies of the objects usedduring a task and the actions performed upon them. Cutting the taxonomy at somelevel gives us a set of generic objects and actions. Finally, we can again look at objects and actions, but concentrate on different kinds of object: passive object andactive human and non-human agents, and the relationships between the objects andactions.
Information for task analysis can be drawn from existing documentation, obser-vation of workers doing the tasks, or from interviews with workers and domainexperts. Observations can be recorded in a variety of forms, from handwritten notes to video recording and computer logging. The early analysis may involve the
15.8
542 Chapter 15 n Task analysis
subjects, asking them to ‘relive’ the task in a post-task walkthrough, or sort lists oftask objects and actions for knowledge elicitation.
Analysis can be used to structure manuals and training courses. In this case, thesystem studied will be the ‘target’ system for the documentation. Alternatively, anexisting system (or systems) can be studied and the task analysis used to structure anew design. This can guide the choice of functionality and the objects and actionsimplemented within the system. It can also be used to guide the detailed design ofdialog so that frequent tasks are easy to perform.
EXERCISES
15.1 The following is a list of objects found in one of the authors’ kitchens:
teapot, mug, soup bowl, plate, spoon, table knife, cook’s knife, fork, saucepan, frying pan, kettle, casserole, fish slice, tin opener, baking tray, scales, mixing bowl, glasses, jugs, corkscrew,rolling pin, ladle, egg cup, chopping board
Produce a taxonomy using the TDH notation of these objects. Does it obey the TAKD unique-ness rule? Compare your answer with someone else’s. (Note: the authors had great difficulty with items like the corkscrew, which did not fit easily into any generic category – perhaps you didbetter.)
15.2 Complete the tea-making manual in Figure 15.7. Do you think it would be useful? Think of situ-ations where such a manual would be helpful and where a more conceptual manual would be better.
15.3 Figure 15.1 shows a textual representation of an HTA description of vacuum cleaning. Present thesame information in a diagrammatic form.
15.4 (Converse to above) Figure 15.6 uses an HTA diagram to show the actions in which a tractor isinvolved; show the same information textually.
15.5 Observe an office, note the actions performed and the objects used depending on the availableequipment; use different recording techniques as described in Chapter 9. Then use the differenttask analysis techniques to structure your findings. (Note: this could be a group project.)
15.6 This exercise is based on the mobile phone scenario on the book website at: /e3/scenario/phone/
A user interface designer analyzes Andy’s behavior with his original phone and realizes that bothscenarios A and B are part of a general pattern, as shown in the hierarchical task analysis (HTA)in Figure 15.8.
(i) Complete the HTA for phoning using the original phone taking into account scenarios A andB only and briefly describe your solution.
(ii) Do a complete HTA for phoning using the new phone based on scenario C only.
You will find that scenario C (and hence your solution to part (ii)) does not quite fit into the gen-eral pattern in Figure 15.8. Discuss whether the solutions to (i) and (ii) can be modified to emphas-ize their common features and whether this would clarify the overall task description.

RECOMMENDED READING
D. Diaper and N. Stanton, editors, The Handbook of Task Analysis for Human–Computer Interaction, Lawrence Erlbaum, 2003.This long-awaited collection fills the gap left for many years since Diaper’s previous collection (below) went out of print. It has chapters by experts in a widevariety of methods and case studies of real applications.
D. Diaper, editor, Task Analysis for Human–Computer Interaction, Ellis Horwood,1989.If you can find a copy, a classic collection.
P. Johnson, Human–Computer Interaction: Psychology, Task Analysis and SoftwareEngineering, McGraw-Hill, 1992.This is a short introductory HCI text, oriented toward task analysis and in particu-lar Johnson’s own KAT (knowledge analysis for tasks) methodology.
J. T. Hackos and J. C. Redish, User and Task Analysis for Interface Design, John Wiley,1998.Very detailed discussion of the processes and techniques for conducting a taskanalysis and applying it to interface design.
A. Shepherd, Hierarchical Task Analysis, Taylor and Francis, 2000.A detailed exposition of HTA and its uses.
Figure 15.8 Rough HTA
Recommended reading 543
DIALOG NOTATIONS
AND DESIGN
OV E RV I E W
Dialog is the syntactic level of human–computerinteraction; it is rather like the script of a play, except theuser, and sometimes the computer, has more choices.
n Notations used for dialog description can be:– diagrammatic: easy to read at a glance– textual: easier for formal analysis.
n The dialog is linked:– to the semantics of the system, what it does– to the presentation of the system, how it looks.
n Formal descriptions can be analyzed:– for inconsistent actions– for difficult to reverse actions– for missing items– for potential miskeying errors.
16
16.1 What is dialog? 545
WHAT IS DIALOG?
Dialog, as opposed to a monolog, is a conversation between two or more parties. It has also come to imply a level of cooperation or at least intent to resolve conflict.In the design of user interfaces, the dialog has a more specific meaning, namely thestructure of the conversation between the user and the computer system.
We can look at computer language at three levels:
Lexical The lowest level: the shape of icons on the screen and the actual keyspressed. In human language, the sounds and spellings of words.
Syntactic The order and structure of inputs and outputs. In human language, thegrammar of sentence construction.
Semantic The meaning of the conversation in terms of its effect on the computer’sinternal data structures and/or the external world. In human language, the mean-ing ascribed by the different participants to the conversation.
In user interfaces, the term dialog is often taken to be almost synonymous with thesyntactic level. However, the lexical/syntactic barrier is somewhat fuzzy and actualuse of dialog description often includes some lexical features.
In Sections 16.2–16.4 we will see why specific notations are required for dialogdesign, and review a range of diagrammatic and textual dialog notations. Having gota formal representation of the dialog, what do we do with it? Section 16.5 discussesthe links between these dialog notations acting at the syntactic level and the detailedsemantics of the system. Finally, in Section 16.6, we will see how a description of thedialog can be analyzed to discover potential faults and problems.
In the rest of this section, we will look at structured human–human dialogs whichwill demonstrate several features which we will later see in human–computer dialog.
16.1.1 Structured human dialogs
In contrast to most human conversation, dialog with computers is relatively struc-tured and constrained. It is only on Star Trek that one can freely chat to the computer and expect a response (although not as far from the truth as all that, see Chapter 10). So, whereas in human conversation the grammar rules often stoponce we get to the level of a sentence (and allow a lot of latitude even in sentence con-struction), those for computer dialogs may encompass the whole of the interaction.
There are, of course, more structured forms of human conversation. Consider thefollowing fragment from a marriage service:
Minister: Do you man’s name, take this woman . . .Man: I do.Minister: Do you woman’s name, take this man . . .Woman: I do.Man: With this ring, I thee wed . . . (places ring on woman’s finger)
16.1

546 Chapter 16 n Dialog notations and design
Woman: With this ring, I thee wed . . . (places ring on man’s finger)Minister: I now pronounce you husband and wife.
This is a sort of script for the three participants to follow. It demonstrates severalimportant features which we will see in computer dialogs. The participants must say certain things in a specific order. Some of their contributions are entirely pre-determined, for instance the phrase ‘I do’. However, the minister must vary somewords, substituting in the names of the husband- and wife-to-be. The instructionsconcerning the ring can be regarded as an annotation to the dialog, or part of the dialog. Different notations for describing computer dialog will similarly differ onprecisely what actions are considered part of the dialog. Assuming the placing of thering is included, we note that this happens at the same time as the marriage partnersspeak the words ‘with this ring’. That is, parts of the dialog are performed concur-rently. Again we shall see later that different notations differ in their ability to handleconcurrent dialog.
Although the minister must substitute the man’s name and the woman’s name,this has no effect on the rest of the service. This dialog description makes no provi-sion for alternative responses – ‘I don’t’!
However, typically, the future course of a dialog does depend on the responses ofthe participants, for example in a criminal trial:
Judge: How do you plead, guilty or not guilty?Defendant: either Guilty or Not guilty.
If the defendant pleads not guilty then the trial will proceed with evidence and cross-examination. If, on the other hand, the defendant pleads guilty, the trial will movedirectly to the sentencing. Because of the formalized nature of judicial processes, wecould develop these court scripts further. But they would still be normative; there isalways the chance that the judge may address the court with a chorus of ‘Somewhereover the rainbow’, or, like the Queen of Hearts, ‘Off with her head!’. The verdict ofsuch an improper trial is likely to be overturned by a higher court, but is not ruledout because the human participants do not always behave as expected. Similarly,descriptions of computer dialogs may not cover all eventualities. Hitting the saveoption on a word processor’s menu is expected to save the file and then give controlback to the user. Occasionally, the computer may instead respond with a ‘coredumped’ or ‘unrecoverable application error’ message. Should the dialog descriptioninclude such improper system responses? The answer is unclear and depends verymuch on the intended use.
Returning to the marriage service, the script given refers only to the words spoken.It does not directly address the meaning of those words: the legal nature of the cere-mony, the fidelity of the partners or even whether the minister gets the partners’names right! We have noted that computer dialog descriptions are usually aimed atthe syntactic level of language, not the semantics (meaning). Similarly, the marriageceremony does not directly address the semantics of marriage; for instance, the mar-riage may be acted out as part of a television program, and the actor and actresswould not expect to be really married at the end of it. However, an important issue
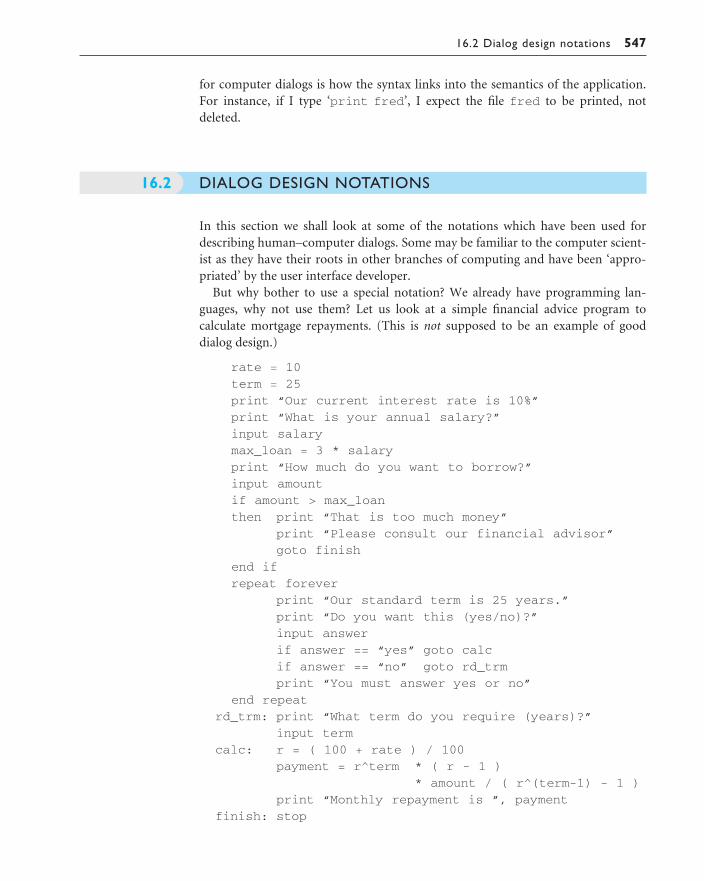
16.2 Dialog design notations 547
for computer dialogs is how the syntax links into the semantics of the application.For instance, if I type ‘print fred’, I expect the file fred to be printed, notdeleted.
DIALOG DESIGN NOTATIONS
In this section we shall look at some of the notations which have been used fordescribing human–computer dialogs. Some may be familiar to the computer scient-ist as they have their roots in other branches of computing and have been ‘appro-priated’ by the user interface developer.
But why bother to use a special notation? We already have programming lan-guages, why not use them? Let us look at a simple financial advice program to calculate mortgage repayments. (This is not supposed to be an example of good dialog design.)
rate = 10
term = 25
print “Our current interest rate is 10%”
print “What is your annual salary?”
input salary
max_loan = 3 * salary
print “How much do you want to borrow?”
input amount
if amount > max_loan
then print “That is too much money”
print “Please consult our financial advisor”
goto finish
end if
repeat forever
print “Our standard term is 25 years.”
print “Do you want this (yes/no)?”
input answer
if answer == “yes” goto calc
if answer == “no” goto rd_trm
print “You must answer yes or no”
end repeat
rd_trm: print “What term do you require (years)?”
input term
calc: r = ( 100 + rate ) / 100
payment = r^term * ( r - 1 )
* amount / ( r^(term-1) - 1 )
print “Monthly repayment is ”, payment
finish: stop
16.2

548 Chapter 16 n Dialog notations and design
Notice how the dialog with the user is mixed up with the rest of the program; calculations are interspersed with input–output. Some of the if then statementsrepresent the system’s choices (amount > max_loan), others represent choices ofthe user (answer == “yes”). If you are a programmer, you will also have noticedthe poor program structure and the use of goto. This is not because the authors arebad programmers. It would be possible to rewrite the program using only structuredprogramming constructs. However, the resulting program would be equally obtuse,and, in general, programs which have to parse are full of nasty structures. In this program, the biggest complication is the check that the answer is either ‘yes’ or ‘no’.Error checking and correction often dominate interactive programs.
Imagine now you have been asked to analyze the dialog in some way: for instance,to list all the possible sequences of user inputs and system responses, or to tell the userhow to get the repayments on a 15-year loan. The mixing of user and system choicesand the convoluted nature of the program structure make this surprisingly difficult.
Alternatively, you may be asked to change the interface style or fit the programwith a mouse- and window-based interface – is this difficult? Remember, this is ashort program which is almost all interaction with the user and should be relativelyeasy. Imagine a program of 10,000 or 100,000 lines. Various commercial applica-tions began their life on traditional text-based terminals, but are now available onWindows or Macintosh platforms. The ancestry of such programs is often all tooobvious – not really surprising.
This gives us two reasons for using a separate dialog description notation: ease of analysis and separation of the interface elements of the program from the actualcalculations (semantics). These reasons both presuppose the program exists already– a third reason for using a special notation is to write down the dialog before a program is written. This allows the designer to analyze the proposed structure, orperhaps use a prototyping tool to execute the dialog. A dialog notation is also a wayfor members of a design team to talk about the design and eventually for the designerto pass on the intended dialog to the programmer of the actual application. Thus dialog notations often form an integral part of prototyping methodologies and tools(which were discussed in Chapter 6).
DIAGRAMMATIC NOTATIONS
Diagrammatic notations are heavily used in dialog design. At their best they allowthe designer to see at a glance the structure of the dialog. However, they often havetrouble coping with more extensive or complex dialog structures. Sections 16.3.1–16.3.4 describe variants of state transition networks, which are the most heavily useddiagrammatic notation. As part of this description, several issues will be discussedwhich are shared by other diagrammatic and textual notations, in particular thetreatment of concurrent dialogs and pre-emptive features. Sections 16.3.5–16.3.8describe other diagrammatic notations: Petri nets, Harel’s state charts, traditionalflow diagrams and JSD diagrams.
16.3

16.3 Diagrammatic notations 549
16.3.1 State transition networks
State transition networks (STNs) have long been used for dialog description, the firstuses for specification dating back to the late 1960s [258, 279] with executable toolsdeveloped from the late 1970s on [366, 367].
Consider a simple mouse-based drawing tool. It has a menu with two options,‘circle’ and ‘line’, and a drawing surface. If you select circle you are allowed to clickon two further points on the drawing surface. The first of these is the circle’s centerand the second any point on the circumference. After the first point is selected, the system draws a ‘rubber band’ line between the center and the current mouseposition. After the second point is chosen, the circle is drawn.
The ‘line’ option in the menu is to draw a polyline. That is, the user can select anynumber of points on the drawing surface which the system connects with straightlines. The last point is denoted by a double click on the mouse. Again the system‘rubber bands’ between successive mouse positions.
Figure 16.1 shows an STN describing the tool. Each circle denotes a ‘state’ the sys-tem can be in. For example, Menu is the state where the system is waiting for the userto select either ‘circle’ or ‘line’ from the menu, and Circle 2 is the state after the userhas entered the circle center and is waiting for the point on the circumference.
Between the states are arrows, the transitions. These are labeled with the useractions that triggered the particular transition and the response the system makes.For instance, state Circle 1 is where the system is waiting for the user to select the circle’s center. If the user clicks on a point, the system moves into state Circle 2 andresponds by drawing the rubber band between the point and the current mouse posi-tion. From this state, the user can click on another point, upon which the systemdraws the circle and then moves into the special Finish state. We can see from thisthat the STN is able to represent a sequence of user actions and system responses.
When in state Circle 1, the user has no other options: there is only one arc comingfrom it, corresponding to selecting a point. In other states, the user has severaloptions. For example, from state Menu the user can select ‘circle’ from the menu,upon which the system moves into state Circle 1 and highlights the ‘circle’ option on
Figure 16.1 State transition network for menu-driven drawing tool

550 Chapter 16 n Dialog notations and design
the menu, or alternatively, the user can select ‘line’ from where the system movesinto state Line 1. That is, the STN is able to describe user choice.
There is a choice from state Line 2 also: the user can double click on a point andfinish the polyline, moving to the Finish state, or he can single click, which adds a new point to the polyline. In the latter case, the transition points back into stateLine 2. This represents iteration – the system stays in state Line 2 accepting any number of points on the polyline, until the user double clicks on a point.
Iterations need not involve just one state. The dialog as it stands only allows youto draw one circle. You presumably have to go through the menu selection again for each circle drawn. We could imagine altering the dialog to allow any number ofcircles to be drawn. To do this, we would make the arc from state Circle 2 loop backto state Circle 1. This is shown in Figure 16.2. There are some problems with thisarrangement as it stands which we will discuss later. However, note that already weare using the STN to discuss different dialog options.
16.3.2 Hierarchical state transition nets
The Start and Finish states are not real states, but are there merely to let us glue this bit of dialog into a bigger dialog. For example, the drawing tool may have a main menu, from which we can select one of three submenus: a graphics menu (asdescribed for circles and lines), a text menu (for adding labels) and a paint menu (forfreehand drawing). We could describe this complete system using the hierarchicalSTN in Figure 16.3. This is like the previous STNs, but has additional compositestates represented as rectangles with a picture of a little STN in them. Each of theserectangles denotes the whole STN for the relevant submenu. We assume that theSTN in Figure 16.1 is the Graphics submenu. In a large specification this may be represented by a caption for the STN or by putting the label Graphics submenu in theStart state.
To read this diagram, we start in state Main menu and follow the relevant transi-tion from it as before. Imagine the user has selected ‘graphics’ from the main menu.The system responds by ‘popping’ the graphics submenu and then going into stateGraphics submenu. However, this is not really a single state, but corresponds to theSTN described in Figure 16.1. We therefore enter this subdialog at the state pointed to
Figure 16.2 Portion of STN allowing multiple circles to be drawn

16.3 Diagrammatic notations 551
DESIGN FOCUS
Using STNs in prototyping
Producing a state transition network can be a good start for prototyping. In the simplest case you can use paper-based prototypes. For each state in the chart, draw and label a representative screen on paper, either by hand or printed from a computer drawing package. You can then run through example scenarios with a potential user or client. If the user asks what happens if a particular buttonor key is pressed, you can simply consult the STN, look up the current state on the chart, see whatthe next state ought to be and then show the relevant piece of paper.
Figure 16.3 Hierarchical STN for complete drawing tool
by its special Start state, that is the Menu state. We then follow through the graphicsmenu STN, drawing either a circle or a polyline. When we get to a Finish state werevert to the main diagram in Figure 16.3 and follow the (single) arrow from theGraphics submenu state which leads us back to the Main menu.
The use of hierarchical elements does not change the power of the basic notationas one can simply imagine gluing the subdiagrams into the main diagram. However,it makes it far simpler to specify large systems; it would not be unreasonable to spe-cify a whole system dialog in this fashion, from the highest level down to individualkeystrokes and mouse clicks.

There are other ways of making STNs hierarchical. Each variant has its own rules for tying the high-level STN with the detailed STNs. In addition, the conditionswhich enable a transition and the system’s responses may be attached to a low-levelSTN. Generalized transition networks are probably the most well known of such variants as they are used to describe the computer system’s behavior in CCT(Chapter 12, Section 12.2.2).
Alternatively, you can get the computer to do the work for you! Using a multimedia authoring tool orprototyping tool such as HyperCard or Macromedia Director draw each state as a separate screen, butleave a blank area for annotation and additional controls (see Figure 16.4). Name the screens using thesame labels that you used in the STN. Now add buttons or active areas to each screen correspondingto the buttons on the intended final system and simply link them to the corresponding screen. (This isparticularly easy to do in HyperCard.) Some user actions do not correspond to clicking areas of thescreen. For these add extra buttons on the blank area and label them suitably, for example ‘user typessome text’.
Now you give this to your prospective users; they can click on buttons and see for themselves whatwill happen. Remember to warn them that this is a series of fixed screens not a functioning prototype.In particular, if you return to the same point in the dialog, the screen will be the same as the first timeyou were there.
Figure 16.4 shows an example of this sort of prototype based on the STN in Figure 16.1. It is built usingHyperCard and can be downloaded from our website.
Figure 16.4 Prototyping using STNs – notice there are two mouse pointers: the hand is the realpointer, the arrow is a simulated one drawn onto the prototype
552 Chapter 16 n Dialog notations and design

16.3 Diagrammatic notations 553
16.3.3 Concurrent dialogs and combinatorial explosion of states
We have seen that STNs can be very good at representing the sequential, choice anditerative parts of a dialog. Where they fail, quite dismally, is in describing a dialogconsisting of several concurrent parts. Take, for example, a simple dialog box fordescribing text style as one might find in a word processor (Figure 16.5). The boxcontains three toggles, one each for bold, italic and underline styles. A piece of textcan be emboldened, italicized, underlined or any combination of these three. Toselect, say, emboldening, the user clicks over the bold toggle. To deselect it, the usersimply clicks again.
If we look at each toggle individually, we have simple two-state STNs as in Figure 16.6. The arrows have been drawn with two heads, as the same user actionmoves you in either direction between the states. We have also omitted the systemresponses, which would be to invert the highlighting of the toggle, and possibly tochange the style of any currently selected text in the document.
Figure 16.5 Simple dialog box with three toggles
Figure 16.6 Individual bold, italic and underline state transition diagrams

554 Chapter 16 n Dialog notations and design
However, this does not tell us what happens if, say, the user clicks over the italictoggle and then the bold one. To do this we need to combine the diagrams. We’ll dothis first for just the bold and italic options. This is shown in Figure 16.7. This hasfour states: one with neither style selected, one for bold only, one for italic only andone for both. You can verify that each user action performs as expected: for example,clicking over ‘italic’ whilst in Bold Italic would get you to the Bold Only state.
Finally, we add in the underline style in Figure 16.8. This time we have written the user actions simply as ‘B’ for ‘click over “bold”’, and so on, as the diagram has
Figure 16.7 Combined bold and italic state transition diagram
Figure 16.8 Combined bold, italic and underline state transition diagram
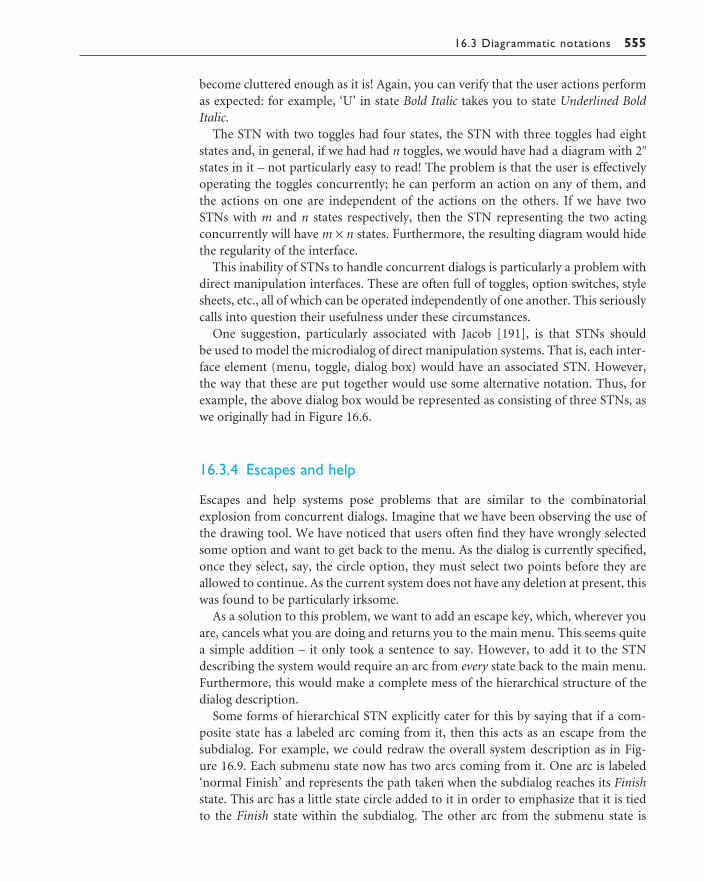
16.3 Diagrammatic notations 555
become cluttered enough as it is! Again, you can verify that the user actions performas expected: for example, ‘U’ in state Bold Italic takes you to state Underlined BoldItalic.
The STN with two toggles had four states, the STN with three toggles had eightstates and, in general, if we had had n toggles, we would have had a diagram with 2n
states in it – not particularly easy to read! The problem is that the user is effectivelyoperating the toggles concurrently; he can perform an action on any of them, and the actions on one are independent of the actions on the others. If we have two STNs with m and n states respectively, then the STN representing the two acting concurrently will have m × n states. Furthermore, the resulting diagram would hidethe regularity of the interface.
This inability of STNs to handle concurrent dialogs is particularly a problem withdirect manipulation interfaces. These are often full of toggles, option switches, stylesheets, etc., all of which can be operated independently of one another. This seriouslycalls into question their usefulness under these circumstances.
One suggestion, particularly associated with Jacob [191], is that STNs should be used to model the microdialog of direct manipulation systems. That is, each inter-face element (menu, toggle, dialog box) would have an associated STN. However, the way that these are put together would use some alternative notation. Thus, forexample, the above dialog box would be represented as consisting of three STNs, aswe originally had in Figure 16.6.
16.3.4 Escapes and help
Escapes and help systems pose problems that are similar to the combinatorial explosion from concurrent dialogs. Imagine that we have been observing the use ofthe drawing tool. We have noticed that users often find they have wrongly selectedsome option and want to get back to the menu. As the dialog is currently specified,once they select, say, the circle option, they must select two points before they areallowed to continue. As the current system does not have any deletion at present, thiswas found to be particularly irksome.
As a solution to this problem, we want to add an escape key, which, wherever youare, cancels what you are doing and returns you to the main menu. This seems quitea simple addition – it only took a sentence to say. However, to add it to the STNdescribing the system would require an arc from every state back to the main menu.Furthermore, this would make a complete mess of the hierarchical structure of thedialog description.
Some forms of hierarchical STN explicitly cater for this by saying that if a com-posite state has a labeled arc coming from it, then this acts as an escape from the subdialog. For example, we could redraw the overall system description as in Fig-ure 16.9. Each submenu state now has two arcs coming from it. One arc is labeled‘normal Finish’ and represents the path taken when the subdialog reaches its Finishstate. This arc has a little state circle added to it in order to emphasize that it is tiedto the Finish state within the subdialog. The other arc from the submenu state is

556 Chapter 16 n Dialog notations and design
labeled ‘ESC’ and this represents the user hitting the escape key. The difference is that this arc is ‘active’ at all times during the subdialog. Even when the user is in themiddle of drawing a circle or a line, if the escape key is pressed, the subdialog isimmediately aborted and the arc labeled ‘ESC’ is taken. In this case, both the ‘ESC’and the ‘normal Finish’ arcs go to the same place. In general, this need not be so, andone may have several escapes activated by different user actions.
Help systems are similar to escapes in some ways, in that they may be invoked atany stage during the dialog. However, unlike escapes, when you have finished usingthe help system, you expect to return to the same point in the dialog that you left.That is, you can think of the help system as being a little subdialog hanging off everystate in the network. Figure 16.10 shows this for two states of the dialog: as you canimagine, it would get a little tedious for the whole thing!
The case of a help system is very similar to concurrent dialogs (in fact, it is anembedded dialog), and the total number of states in the full diagram is again the pro-duct of the number of states in the help system times the number in the original system.
16.3.5 Petri nets
One of the oldest formalisms in computing science is the Petri net. It is a graphicalformalism designed for reasoning about concurrent activities. In recent years it hasbeen used by several researchers to specify aspects of single-user [276] and multi-user systems [277]. In an STN the system is always at exactly one state. Indeed, you
Figure 16.9 STN for drawing tool with escapes

16.3 Diagrammatic notations 557
can simulate the behavior of the system by moving a counter around the STN fol-lowing arcs. A Petri net is similar except that the system has several ‘states’ at once.These are depicted as several black counters in Figure 16.11.
The figure shows a Petri net for a system having two near independent bold/italictoggles. The circles are called places (like states) and the thin rectangles are calledtransitions. There are three counters: one in the ‘Bold On’ place, showing that thebold toggle is currently on; one in the ‘Italic Off ’ place showing that the italic toggleis currently off; and one in the slightly elliptic ‘user presses Bold’ place showing thatthe user has just pressed the bold toggle. The slightly elliptic places represent thosewhere user input can occur. The rule is that if all the places with arcs going into atransition have a counter then the transition can fire and all the counters from theinput places are removed and new counters placed on the outputs of the transition.So, in Figure 16.11, there are counters in both the input places of transition ‘T1’which will therefore fire leaving a single counter in place ‘Bold Off ’.
The italic side is similar except it has an extra arc coming from the ‘Bold On’ placeto the transition ‘T3’, but with a small circle rather than an arrowhead. This is aninhibition arc and means that the transition ‘T3’ cannot fire if there is a counter in
Figure 16.10 Portion of STN with help system
Figure 16.11 Petri net for Bold/Italic selection

558 Chapter 16 n Dialog notations and design
place ‘Bold On’. This corresponds to a dialog where if the italic toggle is on it cannotbe turned off while bold is on. More useful conditions can be represented, for examplePetri nets can be used to describe the interactions of users with web-based systems.
An object-oriented variant of Petri nets called Interactive Cooperative Objects(ICO) has been used extensively by the HCI Group at the University of Toulouse[276]. The group has focussed especially on safety critical applications and in par-ticular air traffic control. A tool, the PetShop development environment, has beendeveloped to aid in the verification and prototyping of ICO specifications [253].
16.3.6 State charts
Harel’s state charts can be seen as a form of STN. They were developed as a way of visually specifying complex reactive systems and address many of the problemsdescribed above, for example concurrency and escapes, while still retaining a dia-grammatic representation. They are characterized by a hierarchical structure, but notused as we have seen before to split a diagram up. The hierarchy in state charts isused within a single diagram to add structure, and to show which parts representalternative states (like simple STNs) and which represent concurrent activity.
Figure 16.12 is a state chart of a television control panel. The controller has fivebuttons labeled ‘ON’, ‘OFF’, ‘MUTE’, ‘SEL’ and ‘RESET’. The television can either
Figure 16.12 State chart for television control panel
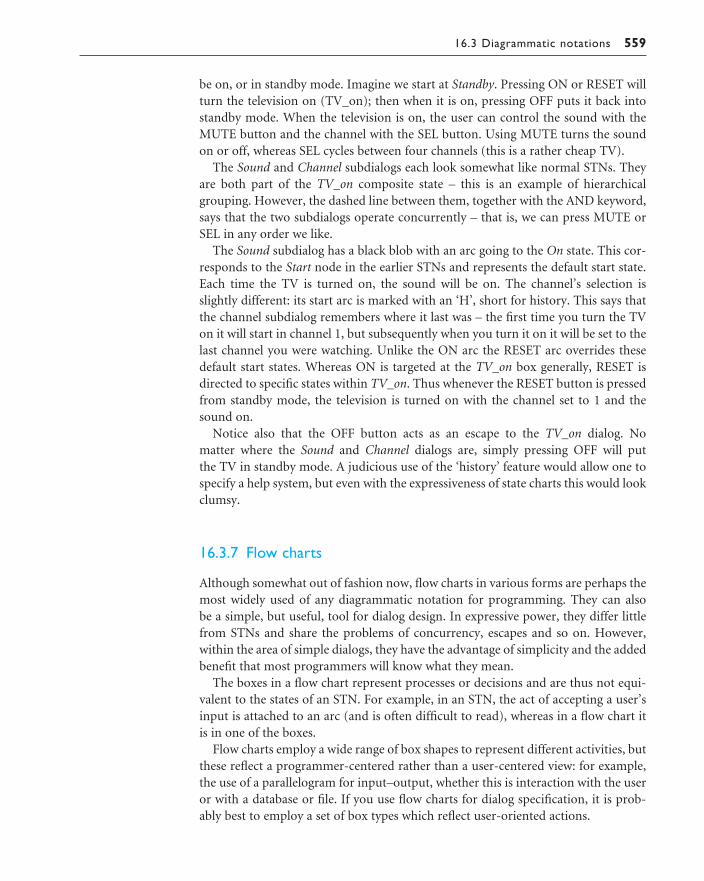
16.3 Diagrammatic notations 559
be on, or in standby mode. Imagine we start at Standby. Pressing ON or RESET willturn the television on (TV_on); then when it is on, pressing OFF puts it back intostandby mode. When the television is on, the user can control the sound with theMUTE button and the channel with the SEL button. Using MUTE turns the soundon or off, whereas SEL cycles between four channels (this is a rather cheap TV).
The Sound and Channel subdialogs each look somewhat like normal STNs. Theyare both part of the TV_on composite state – this is an example of hierarchicalgrouping. However, the dashed line between them, together with the AND keyword,says that the two subdialogs operate concurrently – that is, we can press MUTE orSEL in any order we like.
The Sound subdialog has a black blob with an arc going to the On state. This cor-responds to the Start node in the earlier STNs and represents the default start state.Each time the TV is turned on, the sound will be on. The channel’s selection isslightly different: its start arc is marked with an ‘H’, short for history. This says thatthe channel subdialog remembers where it last was – the first time you turn the TVon it will start in channel 1, but subsequently when you turn it on it will be set to thelast channel you were watching. Unlike the ON arc the RESET arc overrides thesedefault start states. Whereas ON is targeted at the TV_on box generally, RESET isdirected to specific states within TV_on. Thus whenever the RESET button is pressedfrom standby mode, the television is turned on with the channel set to 1 and thesound on.
Notice also that the OFF button acts as an escape to the TV_on dialog. No matter where the Sound and Channel dialogs are, simply pressing OFF will put the TV in standby mode. A judicious use of the ‘history’ feature would allow one tospecify a help system, but even with the expressiveness of state charts this would lookclumsy.
16.3.7 Flow charts
Although somewhat out of fashion now, flow charts in various forms are perhaps themost widely used of any diagrammatic notation for programming. They can also be a simple, but useful, tool for dialog design. In expressive power, they differ littlefrom STNs and share the problems of concurrency, escapes and so on. However,within the area of simple dialogs, they have the advantage of simplicity and the addedbenefit that most programmers will know what they mean.
The boxes in a flow chart represent processes or decisions and are thus not equi-valent to the states of an STN. For example, in an STN, the act of accepting a user’sinput is attached to an arc (and is often difficult to read), whereas in a flow chart itis in one of the boxes.
Flow charts employ a wide range of box shapes to represent different activities, butthese reflect a programmer-centered rather than a user-centered view: for example,the use of a parallelogram for input–output, whether this is interaction with the useror with a database or file. If you use flow charts for dialog specification, it is prob-ably best to employ a set of box types which reflect user-oriented actions.

560 Chapter 16 n Dialog notations and design
Figure 16.13 shows a flow chart as used by one of the authors, some years ago, forspecifying dialogs for forms-based COBOL programs. The dialog shown is a portionof a personnel database update system and is the subdialog for deletion of records.The chart employs two main types of boxes: the rectangular boxes are ‘screen images’of the forms used to communicate with the user. The angular boxes are the processesand decisions made by the system. In addition, there is an elliptical ‘finish’ box,where the user is returned to the main menu, and little ‘tape’ symbols which repre-sent where the system reads or updates the database.
The dialog starts with a form D1, which asks the user for an employee number.When this has been given the system reads in the relevant record, and displays it to the user for confirmation (form D2). If the user responds ‘Y’ to the question
Figure 16.13 Flow chart of deletion subdialog

16.3 Diagrammatic notations 561
‘delete? (Y/N)’ the record is deleted. If the user does not answer ‘Y’ or ‘N’, therecord is redisplayed (form D3) with the error message ‘Please enter Y or N’. Of course, in a real system there would be a similar loop around form D1 if the user entered a non-existent employee number.
The big difference between using a flow chart for dialog design and using it forprogram design is the level of detail on the program side. If, for example, reading theemployee record involved a sequential search through the file to find the relevantrecord, a program flow chart would include this loop. For the dialog, this would nei-ther be necessary, nor appropriate. That is, the actual program flow chart would looknothing like this dialog flow chart.
It works!
Formal notations are often criticized for the amount of work required. However, theauthors’ own experience counters this. Flow diagrams such as in Figure 16.13 were used to specify dialogs within a transaction-processing environment. For various technical reasons the actualprograms in such environments are very complex, being, like most windowing environments, eventdriven. Simple systems developed in this environment typically took many person-months to complete.
However, starting with these flow diagrams the same process could be completed in days, withchanges accomplished within hours (no mean feat within such an environment!). This is becausediagrams were converted by hand, but in a mechanical fashion, into COBOL programs. The com-plex structures needed to work under the transaction-processing environment were constructedautomatically. Furthermore, the flow diagrams allowed systematic testing and also were a usefulaid in talking through design alternatives with end-users.
The productivity improvement over ad hoc design in this context was well over 1000%. Althoughit might be nice to think this was due to the authors’ superior programming skills(!), this could inno way account for an order of magnitude difference in productivity. That is, the adoption of a for-mal notation did not waste valuable time, but on the contrary made phenomenal time savings.
16.3.8 JSD diagrams
Of course, virtually any diagrammatic (or textual) notation employed in pro-gramming or system design can be recruited for dialog design. Jackson structureddesign (JSD), while not as old as flow charts, has been around for many years. Duringthis time it has developed significantly; however, it is one of the older parts of this methodology, the JSD diagram, which has been used for various aspects of taskanalysis and dialog design. As with flow charts, there may be an advantage to usingJSD diagrams if they are already familiar to the programmers who will implementthe dialog.
Figure 16.14 shows a JSD diagram for the top-level structure of an employee per-sonnel system. The system allows the user to update the personnel record in various
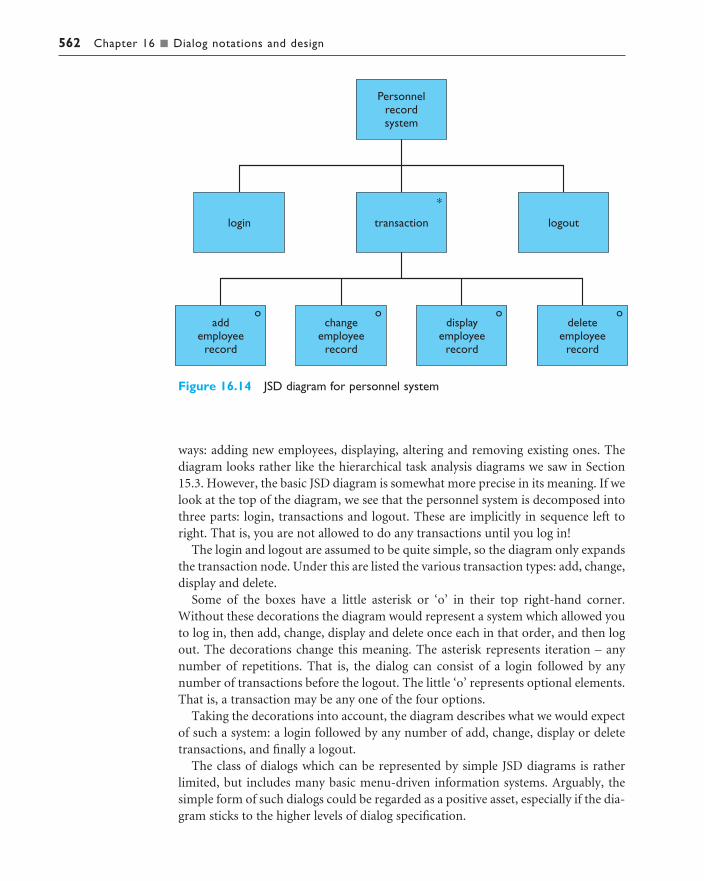
562 Chapter 16 n Dialog notations and design
ways: adding new employees, displaying, altering and removing existing ones. Thediagram looks rather like the hierarchical task analysis diagrams we saw in Section15.3. However, the basic JSD diagram is somewhat more precise in its meaning. If welook at the top of the diagram, we see that the personnel system is decomposed intothree parts: login, transactions and logout. These are implicitly in sequence left toright. That is, you are not allowed to do any transactions until you log in!
The login and logout are assumed to be quite simple, so the diagram only expandsthe transaction node. Under this are listed the various transaction types: add, change,display and delete.
Some of the boxes have a little asterisk or ‘o’ in their top right-hand corner.Without these decorations the diagram would represent a system which allowed youto log in, then add, change, display and delete once each in that order, and then logout. The decorations change this meaning. The asterisk represents iteration – anynumber of repetitions. That is, the dialog can consist of a login followed by any number of transactions before the logout. The little ‘o’ represents optional elements.That is, a transaction may be any one of the four options.
Taking the decorations into account, the diagram describes what we would expectof such a system: a login followed by any number of add, change, display or deletetransactions, and finally a logout.
The class of dialogs which can be represented by simple JSD diagrams is ratherlimited, but includes many basic menu-driven information systems. Arguably, thesimple form of such dialogs could be regarded as a positive asset, especially if the dia-gram sticks to the higher levels of dialog specification.
Figure 16.14 JSD diagram for personnel system

16.3 Diagrammatic notations 563
DESIGN FOCUS
Digital watch – documentation and analysis
Some diagrammatic notations may be clear enough to be used in user documentation as well as indesign. Figure 16.15 shows a state transition diagram for the major modes of a digital watch, taken fromthe instruction booklet. The booklet goes on to use some similar diagrams and some tabular descrip-tions of each of the modes (using the other two buttons).
The watch has only three buttons, and only one of these, button A, is used to move between modes.As the diagram is being used in documentation, the states are denoted by representations of the watchin the appropriate mode. This is a useful approach for any stage in the design process, and is similar tothe use of screen images in the flow diagram in Figure 16.13.
There are four modes, and pressing the button A moves between them. The most common modes arethe time display and stop watch. So the dialog is designed to make it easy to switch between thesemodes and difficult to slip accidentally into the time- or alarm-setting modes. To achieve this aim, press-ing ‘A’ usually toggles between the two main modes. However, the watch’s owner will want to set thetime eventually, and the designer does not want another button to be used (buttons cost money andthe watch only costs £2). Therefore, the setting modes are achieved by holding the button down fortwo seconds or more. So, a quick press does one thing, whereas a long one does something else. Thesemi-formal nature of a state transition diagram makes this real-time behavior easy to denote. It ismerely added as textual commentary.
But this documentation diagram does not have all the information one would require for design pur-poses. If you are in the time-setting mode and press ‘A’, what happens? Do you go to the time displayor to the stop watch? Also, when going from time display to alarm setting, what do you see during thetwo seconds you hold down button A?
A
A ADepress button A for 2 seconds
A
Time setting Alarm setting
Time display Stop watch
SET
S M T W T F S
ALM
S M T W T F S
AM
S M T W T F S
STP
S M T W T F S
Figure 16.15 Instructions for digital watch

After a little experimentation, one can generate the complete diagram, suitable for giving to the imple-mentor of the watch electronics (Figure 16.16).
Notice that in order to deal adequately with the real-time behavior, it is necessary to separate thedepress and release events on button A. This shows us that the toggle between time display and stopwatch happens when the button is pressed down, but that each of these modes corresponds to twostates, as the behavior differs depending on the state of the button. From the diagram you can see thatif you are in the time-setting mode, then pressing ‘A’ will get you back to the time display, not to thestop watch. However, unexpectedly, if you do not release the button soon enough, you get back intothe alarm-setting mode.
Is this getting a little complicated? In fact it only represents about 10% of the instructions. This kind oftime-dependent behavior is rare in computer software, but common in interfaces to consumer goods(watches, video controllers, control panels on white goods). This is because the number of buttonstends to be small compared with the number of functions. As we can see, in the presence of real-timebehavior even simple dialogs become complex. That is all the more reason for such dialogs to beplanned. It is probably the case that the detailed design decisions above were taken as the watch wasbeing programmed, not by the watch’s designer. It is not surprising that many people cannot set thealarms or even change the time on their watches.
Figure 16.16 Design diagram for digital watch
564 Chapter 16 n Dialog notations and design

16.4 Textual dialog notations 565
TEXTUAL DIALOG NOTATIONS
16.4.1 Grammars
As the images used for computer dialog are linguistic, it is not surprising that formalgrammars have been used as a dialog notation.
BNF (Backus–Naur Form) is widely used to describe programming language syntaxand we have already seen in Chapter 12 how descriptions of an interface can be usedto measure its difficulty. The same description can be used to describe the dialog forother purposes. In particular, there are several parser generators based upon BNF,such as the UNIX ‘yacc’ tool, which are suitable for producing crude prototypes.
As the BNF notation has been described in detail in Chapter 12, we will not repeat the description here. But in order to compare it with other dialog descriptionnotations, we recall that BNF has two connectives to denote sequence and choice.Note that the use of ‘+’ as a symbol for sequence in Chapter 12 is not standard –sequence is often simply represented by juxtaposition, and this convention will befollowed in the examples below.
The definitions of named non-terminals gave a natural structure to the interfacedescription. In addition, recursive definitions of non-terminals allowed the dialog torepresent iteration. However, BNF has no way of representing concurrent dialogs,nor can it easily deal with pervasive commands like escapes or help systems. Note,however, that both BNF and regular expressions (described below) are focussed uponthe user’s actions, as opposed to the concentration upon the state in STNs.
Regular expressions are heavily used in editors to describe complex textual searchcriteria, and also in the lexical analysis of programming languages. They are similarto BNF but are slightly less powerful. However, their terseness and more easily com-puted behavior make them very suitable for the above purposes. Unfortunately, thenotation used within regular expressions differs from that used for similar conceptsin BNF, and, to make matters worse, there are many different types of regular expres-sion with many different notations. For example, when using the tools supplied withthe UNIX operating system, there are at least three different notations. This may beparticularly confusing, if, say, you are used to a particular editor’s regular expressionsyntax, and then find a different syntax.
In text editors and lexical analyzers, the basic unit is the character. Often choice isonly available at this level (for example, [+-*/] represents any single arithmeticoperator), and the whole notation is geared to rapid (for the expert), terse expressionof relatively simple patterns. For example, ‘Fred[.!?]’ finds the name Fred whenused at the end of a sentence. However, where regular expressions have been used indialog design, different criteria apply. The notation is less terse and tends to employnamed subexpressions (like non-terminals in BNF) for clarity. Unfortunately, thisnotation is slightly different again from both BNF and from other regular expressions.
As an example, we consider again the polyline drawing from Figure 16.1. This canbe represented by the regular expression
select-line click click* double-click
16.4

566 Chapter 16 n Dialog notations and design
This says that you must select the line option from the menu, click somewhere withthe mouse, then click as many times as you like on intermediate points, and finallydouble click. It is assumed that the low-level terms select-line, click anddouble-click either are primitives, or have been defined elsewhere. The onlyother two notational forms that are used are sequencing, denoted by juxtaposition,and iteration, denoted by the Kleene star operator ‘*’. The former is similar tosequencing in BNF; it is the Kleene star operator which is characteristic of regularexpressions.
In general, a regular expression of the form ‘thing*’ means any number of thing,including none at all. To obtain the same effect in BNF, one would have to write
some-things ::= thing + some-things
That is, BNF obtains the effect of iteration by using recursion. In regular expressions,iteration is primitive. However, this is the only way it can be obtained; even whereregular expression-based notations allow named non-terminals, these are not allowedto be recursively defined. This means that there are some forms of pattern which it ispossible to represent in BNF, but not in regular expressions, for instance bracketing:
sentence ::= empty
| word sentence
| ‘(‘ sentence ’)’ sentence
No regular expression using Kleene star can express that the brackets must match. The best that you can do is say that the sentence is any number of words,open brackets or close brackets. In fact, regular expressions are as powerful in whatthey can express as STNs, it is just that BNF is more expressive. Whether that matters or not depends on whether the dialogs you want to represent include complex recursive elements such as bracket matching. Like STNs, neither BNF norregular expressions can handle concurrent dialogs or escapes.
Where regular expressions have been used as a dialog notation, they are confinedto low levels of the dialog, either the parsing of single lines of textual input, or thedescription of individual interface widgets. This is similar to the reflection that STNs are best used at this low level with different notation being used for high-leveldescription.
One advantage of using BNF or regular expressions is that they are readily exec-uted using existing tools. We have already mentioned the UNIX ‘yacc’ tool for BNF;there is also a tool ‘lex’ for compiling regular expressions. These tools are now also readily available on PCs. The tools are probably more suitable for parsing textcommands than for graphical input. However, the execution techniques are so wellunderstood that it is easy to write a prototyping tool if required.
16.4.2 Production rules
We have already encountered production rules as part of CCT in Chapter 12. Theyhave also been used extensively to describe the dialog component of UIMS (seeChapter 8). Recall that production rules are of the general form
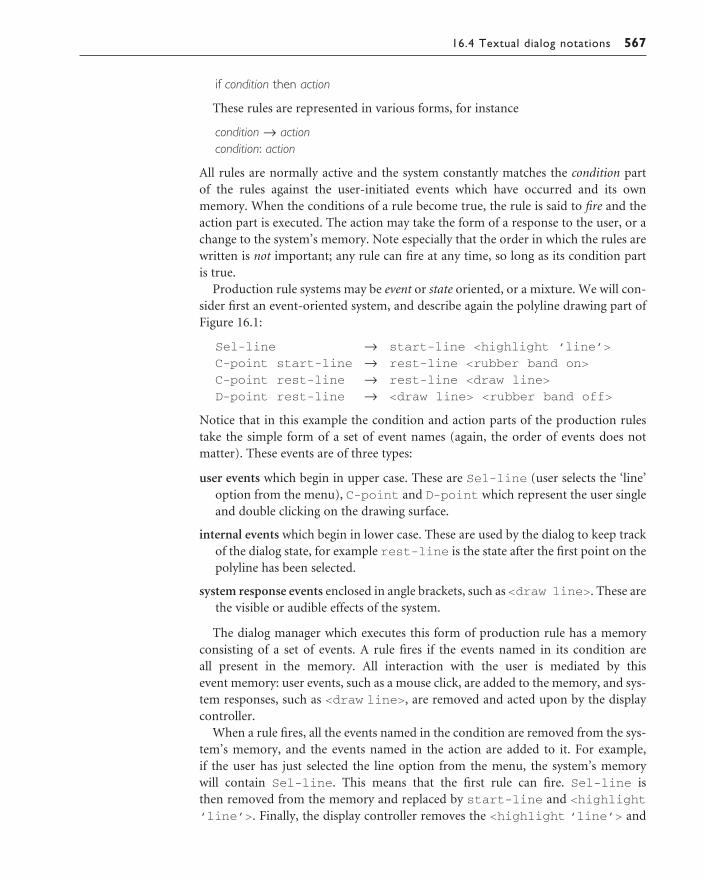
16.4 Textual dialog notations 567
if condition then action
These rules are represented in various forms, for instance
condition → actioncondition: action
All rules are normally active and the system constantly matches the condition part of the rules against the user-initiated events which have occurred and its own memory. When the conditions of a rule become true, the rule is said to fire and theaction part is executed. The action may take the form of a response to the user, or achange to the system’s memory. Note especially that the order in which the rules arewritten is not important; any rule can fire at any time, so long as its condition part is true.
Production rule systems may be event or state oriented, or a mixture. We will con-sider first an event-oriented system, and describe again the polyline drawing part ofFigure 16.1:
Sel-line → start-line <highlight ‘line’>
C-point start-line → rest-line <rubber band on>
C-point rest-line → rest-line <draw line>
D-point rest-line → <draw line> <rubber band off>
Notice that in this example the condition and action parts of the production rulestake the simple form of a set of event names (again, the order of events does not matter). These events are of three types:
user events which begin in upper case. These are Sel-line (user selects the ‘line’option from the menu), C-point and D-point which represent the user singleand double clicking on the drawing surface.
internal events which begin in lower case. These are used by the dialog to keep trackof the dialog state, for example rest-line is the state after the first point on thepolyline has been selected.
system response events enclosed in angle brackets, such as <draw line>. These arethe visible or audible effects of the system.
The dialog manager which executes this form of production rule has a memoryconsisting of a set of events. A rule fires if the events named in its condition are all present in the memory. All interaction with the user is mediated by this event memory: user events, such as a mouse click, are added to the memory, and sys-tem responses, such as <draw line>, are removed and acted upon by the displaycontroller.
When a rule fires, all the events named in the condition are removed from the sys-tem’s memory, and the events named in the action are added to it. For example, if the user has just selected the line option from the menu, the system’s memory will contain Sel-line. This means that the first rule can fire. Sel-line is then removed from the memory and replaced by start-line and <highlight‘line’>. Finally, the display controller removes the <highlight ‘line’> and

568 Chapter 16 n Dialog notations and design
performs the action. This leaves the system memory with only start-line in it,and so no more rules can fire until the user does something more.
The event-oriented nature of these production rules is evident in the way thatevents are removed from memory if they are used in the condition of a rule. Theevent has been ‘dealt with’ and can therefore be forgotten. This makes permanentstatus information difficult to represent. Notice in the third rule how the eventrest-line is mentioned in both condition and action. It represents the state whereadditional points on the line are being selected after the first point. The rule is firedby a single click, which means that more points remain to be selected. The systemmust therefore continue in the same state. However, because the rest-line eventhas been mentioned in the condition it will be removed and therefore it must be re-established in the action part.
State-oriented production rules have a very different behavior. The system’s memory is again a set of named values, but these are not removed by default when a rule is fired; instead they must be removed explicitly by the action part of a rule.The production rules in CCT operate in this fashion, as evidenced by actions such as(DELETE-GOAL insert space). A specific example of a state-oriented produc-tion system, slightly different from CCT rules, is Olsen’s propositional production system (PPS) [272]. In PPS, the system’s state is divided into a finite set of attributes,each of which can take one of a set of values. Some of the attributes are set as theresult of user actions, and others have an effect on the system’s display.
In the polyline drawing example we could have five attributes:
Mouse: { mouse-off, select-line, click-point, double-click }Line-state: { menu, start-line, rest-line }Rubber-band: { rubber-band-off, rubber-band-on }Menu: { highlight-off, highlight-line, highlight-circle }Draw: { draw-nothing, draw-line }
The first attribute, Mouse, is set automatically whenever the user performs the relevant action; the second attribute is used by the dialog to keep track of its state,and the last three are for controlling system responses. Again, we assume a displaycontroller which acts appropriately upon these.
The PPS rules for polyline are somewhat similar to the previous event-based rules:
select-line → mouse-off start-line highlight-lineclick-point start-line → mouse-off rest-line rubber-band-onclick-point rest-line → mouse-off draw-linedouble-click rest-line → mouse-off menu draw-line rubber-band-off
The rules are executed again, when the condition matches the state, but, this time,the attributes are not changed by this alone. Only when a new value is set for a particular attribute is the old value lost. For example, in the second rule, the action‘rest-line’ sets the Line-state attribute, thus removing the previous value of ‘start-line’. Notice, that in the third rule, the value ‘rest-line’ of the attribute Line-stateneed not be mentioned in the action as it was in the event-based rules. This isbecause it persists by default.
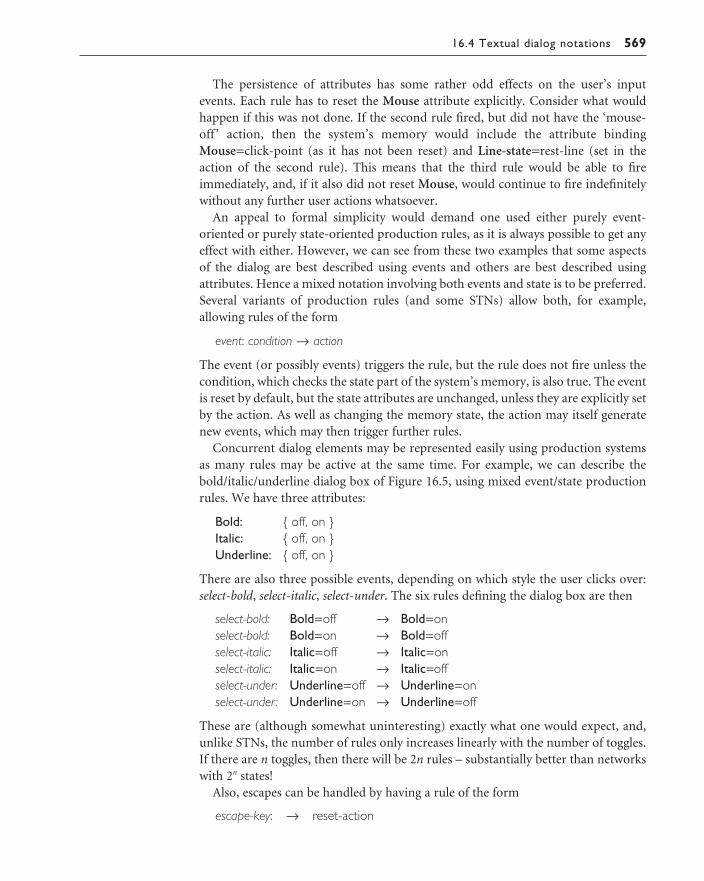
16.4 Textual dialog notations 569
The persistence of attributes has some rather odd effects on the user’s inputevents. Each rule has to reset the Mouse attribute explicitly. Consider what wouldhappen if this was not done. If the second rule fired, but did not have the ‘mouse-off ’ action, then the system’s memory would include the attribute bindingMouse=click-point (as it has not been reset) and Line-state=rest-line (set in theaction of the second rule). This means that the third rule would be able to fire immediately, and, if it also did not reset Mouse, would continue to fire indefinitelywithout any further user actions whatsoever.
An appeal to formal simplicity would demand one used either purely event-oriented or purely state-oriented production rules, as it is always possible to get anyeffect with either. However, we can see from these two examples that some aspectsof the dialog are best described using events and others are best described usingattributes. Hence a mixed notation involving both events and state is to be preferred.Several variants of production rules (and some STNs) allow both, for example,allowing rules of the form
event: condition → action
The event (or possibly events) triggers the rule, but the rule does not fire unless thecondition, which checks the state part of the system’s memory, is also true. The eventis reset by default, but the state attributes are unchanged, unless they are explicitly setby the action. As well as changing the memory state, the action may itself generatenew events, which may then trigger further rules.
Concurrent dialog elements may be represented easily using production systemsas many rules may be active at the same time. For example, we can describe thebold/italic/underline dialog box of Figure 16.5, using mixed event/state productionrules. We have three attributes:
Bold: { off, on }Italic: { off, on }Underline: { off, on }
There are also three possible events, depending on which style the user clicks over:select-bold, select-italic, select-under. The six rules defining the dialog box are then
select-bold: Bold=off → Bold=onselect-bold: Bold=on → Bold=offselect-italic: Italic=off → Italic=onselect-italic: Italic=on → Italic=offselect-under: Underline=off → Underline=onselect-under: Underline=on → Underline=off
These are (although somewhat uninteresting) exactly what one would expect, and,unlike STNs, the number of rules only increases linearly with the number of toggles.If there are n toggles, then there will be 2n rules – substantially better than networkswith 2n states!
Also, escapes can be handled by having a rule of the form
escape-key: → reset-action
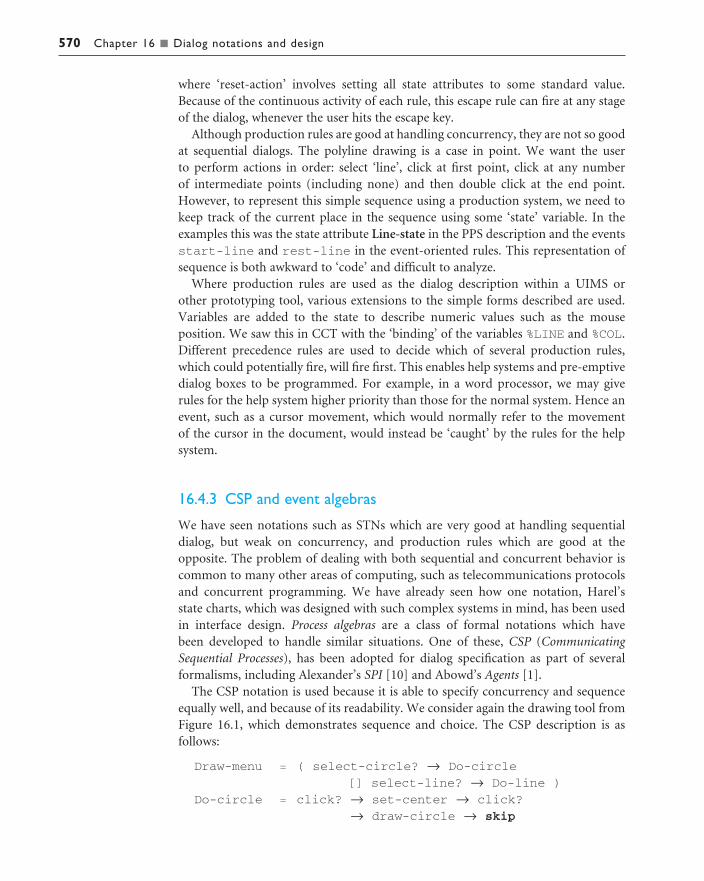
570 Chapter 16 n Dialog notations and design
where ‘reset-action’ involves setting all state attributes to some standard value.Because of the continuous activity of each rule, this escape rule can fire at any stageof the dialog, whenever the user hits the escape key.
Although production rules are good at handling concurrency, they are not so goodat sequential dialogs. The polyline drawing is a case in point. We want the user to perform actions in order: select ‘line’, click at first point, click at any number of intermediate points (including none) and then double click at the end point.However, to represent this simple sequence using a production system, we need tokeep track of the current place in the sequence using some ‘state’ variable. In theexamples this was the state attribute Line-state in the PPS description and the eventsstart-line and rest-line in the event-oriented rules. This representation ofsequence is both awkward to ‘code’ and difficult to analyze.
Where production rules are used as the dialog description within a UIMS or other prototyping tool, various extensions to the simple forms described are used.Variables are added to the state to describe numeric values such as the mouse position. We saw this in CCT with the ‘binding’ of the variables %LINE and %COL.Different precedence rules are used to decide which of several production rules,which could potentially fire, will fire first. This enables help systems and pre-emptivedialog boxes to be programmed. For example, in a word processor, we may give rules for the help system higher priority than those for the normal system. Hence anevent, such as a cursor movement, which would normally refer to the movement of the cursor in the document, would instead be ‘caught’ by the rules for the help system.
16.4.3 CSP and event algebras
We have seen notations such as STNs which are very good at handling sequentialdialog, but weak on concurrency, and production rules which are good at the opposite. The problem of dealing with both sequential and concurrent behavior iscommon to many other areas of computing, such as telecommunications protocolsand concurrent programming. We have already seen how one notation, Harel’s state charts, which was designed with such complex systems in mind, has been used in interface design. Process algebras are a class of formal notations which have been developed to handle similar situations. One of these, CSP (CommunicatingSequential Processes), has been adopted for dialog specification as part of several formalisms, including Alexander’s SPI [10] and Abowd’s Agents [1].
The CSP notation is used because it is able to specify concurrency and sequenceequally well, and because of its readability. We consider again the drawing tool fromFigure 16.1, which demonstrates sequence and choice. The CSP description is as follows:
Draw-menu = ( select-circle? → Do-circle
[] select-line? → Do-line )
Do-circle = click? → set-center → click?
→ draw-circle → skip
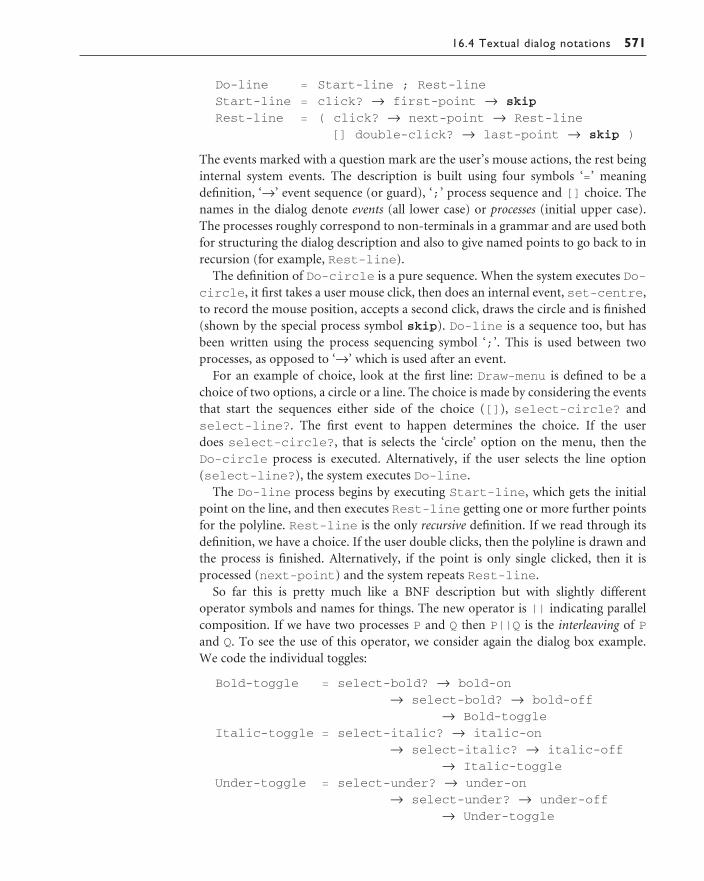
16.4 Textual dialog notations 571
Do-line = Start-line ; Rest-line
Start-line = click? → first-point → skip
Rest-line = ( click? → next-point → Rest-line
[] double-click? → last-point → skip )
The events marked with a question mark are the user’s mouse actions, the rest beinginternal system events. The description is built using four symbols ‘=’ meaningdefinition, ‘→’ event sequence (or guard), ‘;’ process sequence and [] choice. Thenames in the dialog denote events (all lower case) or processes (initial upper case).The processes roughly correspond to non-terminals in a grammar and are used bothfor structuring the dialog description and also to give named points to go back to inrecursion (for example, Rest-line).
The definition of Do-circle is a pure sequence. When the system executes Do-circle, it first takes a user mouse click, then does an internal event, set-centre,to record the mouse position, accepts a second click, draws the circle and is finished(shown by the special process symbol skip). Do-line is a sequence too, but hasbeen written using the process sequencing symbol ‘;’. This is used between two processes, as opposed to ‘→’ which is used after an event.
For an example of choice, look at the first line: Draw-menu is defined to be achoice of two options, a circle or a line. The choice is made by considering the eventsthat start the sequences either side of the choice ([]), select-circle? andselect-line?. The first event to happen determines the choice. If the user does select-circle?, that is selects the ‘circle’ option on the menu, then the Do-circle process is executed. Alternatively, if the user selects the line option(select-line?), the system executes Do-line.
The Do-line process begins by executing Start-line, which gets the initialpoint on the line, and then executes Rest-line getting one or more further points for the polyline. Rest-line is the only recursive definition. If we read through itsdefinition, we have a choice. If the user double clicks, then the polyline is drawn andthe process is finished. Alternatively, if the point is only single clicked, then it is processed (next-point) and the system repeats Rest-line.
So far this is pretty much like a BNF description but with slightly different operator symbols and names for things. The new operator is || indicating parallelcomposition. If we have two processes P and Q then P||Q is the interleaving of Pand Q. To see the use of this operator, we consider again the dialog box example. We code the individual toggles:
Bold-toggle = select-bold? → bold-on
→ select-bold? → bold-off
→ Bold-toggle
Italic-toggle = select-italic? → italic-on
→ select-italic? → italic-off
→ Italic-toggle
Under-toggle = select-under? → under-on
→ select-under? → under-off
→ Under-toggle

572 Chapter 16 n Dialog notations and design
The event select-bold? represents the user selecting the bold toggle with a mouse.So, the process Bold-toggle then turns the bold style on and off with alternateselections. The italic and underline options behave similarly. The dialog box as awhole can then be represented as the parallel composition of the individual toggles:
Dialog-box
= Bold-toggle || Italic-toggle || Under-toggle
Concurrent processes can also be used as a way of organizing the internal struc-ture of the interface. For example, returning to the drawing tool, we may decide that we would like to allow keyboard shortcuts activated by the Alt key. As the line andcircle options can be operated by the mouse or by the keyboard, we have a processfor each. The mouse process simply waits for the user to select one or other menuoption, and then performs an internal event depending on the choice. The keyboardprocess monitors the Alt key, and performs the same internal events depending onwhether the user enters ‘Alt-C’ or ‘Alt-L’:
Mouse = ( select-circle? → int-sel-circle → Mouse
[] select-line? → int-sel-line → Mouse )
Keyboard = alt-key-down? → ( Alt ; Keyboard )
Alt = ( alt-key-up? → skip
[] c-key? → int-sel-circle → Alt
[] l-key? → int-sel-line → Alt )
So an int-sel-circle event may occur either because the circle option isselected from the menu or because the user typed Alt-C. The existing definition ofDraw-menu expects to be activated by the user’s mouse selections directly, so thismust be modified to accept these new internal events:
Draw-menu = ( int-sel-circle → Do-circle
[] int-sel-line → Do-line )
The three processes can now be run in parallel:
Mouse || Keyboard || Draw-menu
Note that the events int-sel-circle and int-sel-line are used to com-municate, sending messages from the Mouse and Keyboard processes to the Draw-menu process. However, although this direction of causality is obvious fromthe context, it is not immediately apparent from the notation. The only clue is thatthe events form the guards of the choice operator in the Draw-menu process, butthat is not an infallible indication. The reason for this ambiguity is that CSP does not recognize causality; events are simply synchronization points. There are timeswhen such an interpretation is useful, but in most dialog descriptions the causality isimportant. One way to avoid this problem is to match events in pairs, as is done insome other process algebras writing, for instance, int-sel-line! for the sendingof an event and int-sel-line? for the receiving of it. This loses us the specialdecoration for direct user input, but these may be listed separately. Alternatively, ifthe notation is to be typeset rather than in straight ASCII, one can use other pairs,such as x ↑ and x ↓ for send and receive.

16.5 Dialog semantics 573
16.4.4 Parametrized and dynamic interleaved dialog structure
In many interfaces, the possible screen displays can be easily enumerated. The orderin which such screens are produced and the detailed contents of fields may differ, but the basic screen designs are finite. Other systems are more anarchic, especiallymulti-windowed interfaces where user interaction may dynamically cause the cre-ation of new windows. Thus there is a clear difference between static and dynamicscreen presentations.
A similar and related issue arises at the level of the dialog structure. Some dialogscan be described by a finite set of dialog states between which the user may move,whereas others are far more complex. Clearly, multi-windowed systems will have acorrespondingly dynamic dialog structure. Perhaps the dialogs within each windowhave a fairly static structure, but the number of such interleaved dialogs varies at run time.
The notations we have discussed can only address structurally static dialogs. Such notations would not (without modification) allow the expression of generalmulti-windowed dialogs. However, many WIMP-based systems do not require thislevel of generality. In addition, many run-time systems may only allow essentiallystatic structures, for instance prototypes programmed in HyperCard (except for very complex scripts) or under most forms-based systems.
This issue of dynamic dialog structure is often linked with that of parametrization.An instantiation of a parametrized dialog often involves the creation of new screenresources. For example, we could imagine extending CSP to allow
Multi-window-editor
= new-name(name) →( Edit-window(name) [] Multi-window-editor )
The instantiation of Edit_window(name) implies that a new window and dialogwithin that window would be initiated.
Both parametrization and dynamic dialog structures make it more difficult to analyze the dialog. A static notation has a sparser (and fundamentally less expressive)domain of application but allows a far greater degree of automatic or manual manipulation.
Thus, even where a notation allows parametrized or dynamic dialogs, they shouldbe used sparingly. If there is a choice, the dialog should be encoded using the morestatic forms of representation.
DIALOG SEMANTICS
If the purpose of a dialog description is simply to communicate between designers,or as a ‘tool for thought’ early in design, it may be sufficient to annotate the formaldialog with the intended meaning of the actions, or to leave it to the reader to inferthe semantics. However, if the dialog description is to serve as a formal specification,
16.5

574 Chapter 16 n Dialog notations and design
perhaps part of a contract, or for running as a prototype, there must be some way todescribe formally the semantics of the dialog. The dialog notations we have seenmore or less clearly describe the structure of the dialog. We must now move on tomeaning.
There are two aspects to the dialog semantics, inward toward the application, and outward toward the presentation. The semantic part of the dialog should serveas a link between the two, performing as little as possible itself. Look back throughthe examples in this chapter and ask yourself how one knows that, for example, the lines drawn by the drawing tool are at the points indicated by the user’s mouselocation.
We will discuss three different approaches to linking dialog and semantics:
notation-specific semantics – special-purpose semantic forms designed as part of adialog notation;
links to programming languages – attaching pieces of programming language codeto the dialog;
links to specification notations – similar, but where a formal specification notationis used.
We will also discuss some issues which arise concerning the link between dialog andsemantics.
16.5.1 Notation-specific semantics
Augmented transition networks (ATNs) are a form of state transition network (seeSection 16.3.1). In the ATN, the system is assumed to hold a set of registers, storagelocations which the transition network can set and test. Recall that the arcs in an STNmay be labeled with the event that causes the transition and the system response. Inan ATN this is extended. The arcs have a condition as well as the event; the condi-tion can refer to the system’s registers and the arc is only followed if the condition istrue and the event occurs. The system response is augmented to include not onlyfeedback and display, but also the setting of registers. These registers can be usedsimply to describe more complex dialogs, for example a cash dispenser which retainsyour card after three wrong numbers. They may also be used to communicate withthe application and to hold values from the mouse.
Production rules come in many variants and the link to the semantics is equallyvaried. Often the system’s memory contains variables which can be used by the system to store input values such as the mouse position, and can then be examinedby the conditions and actions of the rules. These variables may also be used to com-municate with the underlying application, or the functions of this may be invokeddirectly by special forms of action. For instance, the following is a production rulewhich, when the user clicks within a target region, puts a dot at the mouse locationand invokes the application routine ‘another_point’:
click_at(x,y) → dot_at(x,y), call another_point(x,y)

16.5 Dialog semantics 575
16.5.2 Links to programming languages
Often dialog notations are ‘attached’ to a conventional programming language. For example, input tools, a regular expression-based notation, uses C to express thedialog semantics [355]. The input tool description consists of ‘tool’ definitions,including regular expressions intermingled with normal C code. For example, thetool to read a number (from Plasmeijer [292]) begins as follows:
tool number
{ char buf[80];
int index;
int positive;
input { ( digit* + sign; digit; digit* ) ; return }
tool digit
{ input { key:| key_c>=‘0’ && key_c<=‘9’ | }
if ( index < 79 ) /* append character to string */
{ buf[index] = key_c;
index = index + 1;
echo(key_c);
}
}
tool sign
...
tool return
{ input { key:| key_c == ‘\n’ | }
...
}
...
}
Input tools uses its own regular expression syntax and has additional operators.Sequencing is denoted by semi-colon ‘;’ rather than simple juxtaposition, and the‘+’ symbol is used for choice (like ‘|’ in BNF). The expression ‘key:|condition|’ isa postfix guard: the expression only matches if the condition is true.
The specific input tools’ expressions are as follows. The keyword tool introducesa new tool, which is similar to a non-terminal in a BNF grammar, and the regularexpression which it denotes is enclosed in the input statement. The tools arearranged in a scoped hierarchy, so that the digit, sign and return tools are pri-vate to the number tool. The call to echo simply echoes the character back to theuser. Finally, key is a primitive tool which matches a single character read from thekeyboard; the actual character read is stored in the global variable key_c.
Notice how the subtool digit communicates its results back to the main toolusing shared variable buf. This and the way it accepts values from the key tool are rather untidy. Such messiness is not just an aspect of this particular notation:alternative regular expression-based notations are even worse!

576 Chapter 16 n Dialog notations and design
16.5.3 Links to formal specification
Alexander’s executable specification/prototyping language SPI (Specifying andPrototyping Interaction) is divided into two parts: eventCSP, a dialog notation basedclosely on CSP, and eventISL, which describes the dialog semantics. The CSP part isas described in Section 16.4.3, but for each event there is a corresponding eventdefinition in eventISL. EventISL is partly standardized and partly dependent on the‘host’ language chosen. The first host language was me-too, a formal specificationnotation based on VDM, but a C variant is also available. The part which is inde-pendent of the host language consists of several elements: a clause giving the globalvariables used and updated by the event, a precondition expressing when the eventcan occur, and output and input parts. The host language part simply describes theupdates and the precise outputs.
Consider the following eventCSP description of a login sequence:
Login = login-mess → get-name → PasswdPasswd = passwd-mess → ( invalid → Login
[ ] valid → Session)Session = ( logout → Login
[ ] command → execute → Session )
A typical unsuccessful login sequence might be
login: fred
passwd: b9fGk (invisible)Sorry bad user-id/password
We will not consider the detailed semantics for the commands during the session,but will give the eventISL descriptions of the other events. The two events login-messand get-name handle the first line of the above dialog:
event: login-mess =prompt: trueout: “login:”
event: get-name =uses: input
set: user-id = input
The first event prints the prompt ‘login:’ (the out: clause) and says that user input isrequired (the prompt: clause). This user input is stored in a special variable called‘input’. The second event uses the input (which will be set to the name the userenters) and merely sets the variable ‘user-id’ to it. Note that ‘user-id’ is set to a newvalue by the event, but any previous value is not used.
The sequence for getting the password is similar except that there are two optionsdepending on whether the user has typed a valid password or not:
event: passwd-mess =prompt: invisout: “passwd:”

16.5 Dialog semantics 577
event: valid =uses: input, user-id, passwd-db
when: passwd-id = passwd-db(user-id)event: invalid =uses: input, user-id, passwd-db
when: passwd-id ≠ passwd-db(user-id)out: “Sorry bad user-id/password”
The password prompt is identical to the login prompt except that no echoing isrequired. However, the last two events demonstrate two additional features. As wellas the user input variable, they also use the variable ‘user-id’, which was set by theget-name event, and the variable ‘passwd-db’. This is assumed to be a database ofpasswords, so that ‘passwd-db(user-id)’ is the correct password for the user. The twoevents also have a ‘when’ clause. This is a precondition, which specifies what must be true for the event to occur. So the ‘valid’ event can only occur when the user hastyped a correct password and ‘invalid’ only occurs when it is incorrect.
Notice that, like input tools, eventISL is heavily dependent on the use of globalvariables to pass information between events. This reliance on global variables inmany dialog notations strikes against all good software engineering practice. At leastin SPI the globals used and updated are made explicit and make tracing the effects of events somewhat easier, but still not straightforward. Dialog notations ofteninclude effective structuring mechanisms (hierarchical networks, non-terminals ingrammars, processes in CSP); it is a pity that these are not mirrored in their semanticeffects.
Worked exercise Using CSP, construct a dialog for one user with an application in one window of a multi-windowsystem. Using this first general CSP description, provide a CSP description for a multi-windowinteraction using the parallel operator (||). How does this approach handle interference andinformation sharing between windows?
Answer The intention of this exercise is not so much to produce a clean description, but toshow how complex the business of talking about multi-window applications is. Mostinterface designers and programmers do not have to worry about designing the win-dowing system itself. However, it does help one to appreciate why areas like cut–pastebuffers can behave oddly.
First of all, we will give two simple applications, a calculator and a database, and thenwe will look at putting them together.
CalculatorIn fact, calculator is a bit pretentious – this is really an adder! The user types in either‘quit’ which exits the application, ‘zero’ which resets the adder to zero or a numberwhich is added to the running total.
Adder = add-prompt → ( quit? → skip[ ] zero? → show-sum → Adder[ ] number? → show-sum → Adder )

578 Chapter 16 n Dialog notations and design
The semantic description is given in eventISL (Section 16.5.3).
event: add-prompt =prompt: trueout: “next number”
event: quit? =uses: input
when: input = “quit”event: zero? =uses: input
when: input = “zero”set: sum = 0out: “reset”
event: number? =uses: input, sum
when: is-number(input)set: sum = sum + input
event: show-sum =uses: sum
out: sum
DatabaseAnother simple application could be a database, where the user actions are either ‘quit’,‘set key value’, or ‘find key’.
Database = db-prompt → ( quit? → skip[ ] set? → Get-key; Get-val[ ] get? → Get-key; print-val )
Get-key = set-key-prompt → get-key?Get-val = set-val-prompt → get-val?
We will not bother with the semantic descriptions of the prompt events, or quit whichis the same as for the adder. The descriptions of ‘set?’ and ‘get?’ are also similar to thosefor ‘quit?’, so are omitted.
event: get-key? =uses: input
set: key = inputevent: get-val? =uses: input, dbase, key
set: dbase = db-update(dbase,key,input)event: print-val =uses: dbase, key
out: db-lookup(dbase,key)
The functions ‘db-update’ and ‘db-lookup’ are assumed to add a new key-value pair andto look up the value associated with a particular key, respectively.
Multiple windowsHaving got these two descriptions, putting them together is quite simple:
Window-system = Adder || Database
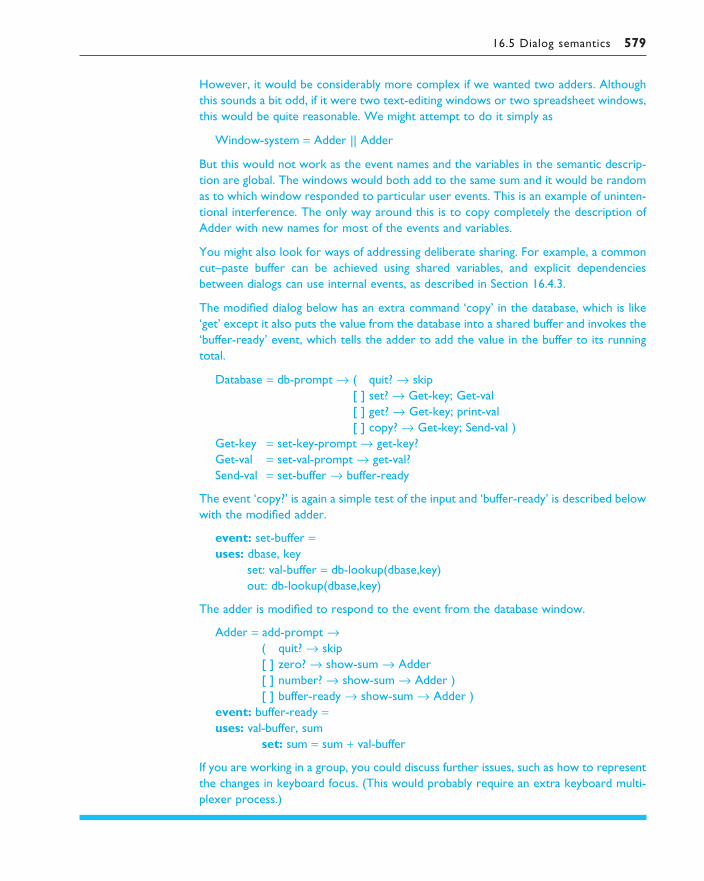
16.5 Dialog semantics 579
However, it would be considerably more complex if we wanted two adders. Althoughthis sounds a bit odd, if it were two text-editing windows or two spreadsheet windows,this would be quite reasonable. We might attempt to do it simply as
Window-system = Adder || Adder
But this would not work as the event names and the variables in the semantic descrip-tion are global. The windows would both add to the same sum and it would be randomas to which window responded to particular user events. This is an example of uninten-tional interference. The only way around this is to copy completely the description ofAdder with new names for most of the events and variables.
You might also look for ways of addressing deliberate sharing. For example, a commoncut–paste buffer can be achieved using shared variables, and explicit dependenciesbetween dialogs can use internal events, as described in Section 16.4.3.
The modified dialog below has an extra command ‘copy’ in the database, which is like‘get’ except it also puts the value from the database into a shared buffer and invokes the‘buffer-ready’ event, which tells the adder to add the value in the buffer to its runningtotal.
Database = db-prompt → ( quit? → skip[ ] set? → Get-key; Get-val[ ] get? → Get-key; print-val[ ] copy? → Get-key; Send-val )
Get-key = set-key-prompt → get-key?Get-val = set-val-prompt → get-val?Send-val = set-buffer → buffer-ready
The event ‘copy?’ is again a simple test of the input and ‘buffer-ready’ is described belowwith the modified adder.
event: set-buffer =uses: dbase, key
set: val-buffer = db-lookup(dbase,key)out: db-lookup(dbase,key)
The adder is modified to respond to the event from the database window.
Adder = add-prompt →( quit? → skip[ ] zero? → show-sum → Adder[ ] number? → show-sum → Adder )[ ] buffer-ready → show-sum → Adder )
event: buffer-ready =uses: val-buffer, sum
set: sum = sum + val-buffer
If you are working in a group, you could discuss further issues, such as how to representthe changes in keyboard focus. (This would probably require an extra keyboard multi-plexer process.)

580 Chapter 16 n Dialog notations and design
16.5.4 Distributed and centralized dialog description
If the dialog is described by a pure grammar, with no semantic element, then it is easyto look at the dialog syntax in isolation, and understand and evaluate it. At the otherextreme, if we take a typical interactive program, aspects of the dialog will be distri-buted throughout the code, making it difficult to trace the course of a typical interaction.
A notation that wishes to describe the semantics of dialog as well as its syntax can try to retain the advantages of a simple syntactic description, by separating thesemantic and syntactic parts, allowing the dialog designer to examine the dialog syn-tax in isolation. This is a centralized dialog description. Alexander’s SPI is exemplaryof this approach to the extent that it has separate sublanguages for the two parts. This also demonstrates another advantage of this approach. The same form of thesyntactic dialog description may often be suitable both for high-level analysis and automatic coding (or run-time interpretation). The semantic description, on theother hand, is likely to have a different form when generated for specification or prototyping than for inclusion in a production system. Separating the two allowsreuse of the dialog description with different semantic parts, reflecting differing usesof the specification.
Alternatively, the notation can choose to put associated parts of the syntax andsemantics together, as in input-tools. This has the advantage that parts of the inter-action can be examined in detail, allowing the evaluation of the syntax and seman-tics in tandem. It also has advantages of abstraction: associated semantics and syntaxcan be packaged together. Its disadvantage is that, like the typical program, it has adistributed dialog description. One has to examine diverse pieces of the specificationin order to obtain an understanding of the large-scale flow of the interaction.
The two approaches are not fundamentally incompatible. Given a notation of theformer type, it would be quite easy to separate parts of the dialog syntax and presentthem with the associated parts of the semantic description. Similarly, with some distributed notations it is possible to go through extracting the parts specifying thedialog syntax and look at these together. For instance, with input-tools one couldextract all the input clauses which contain the regular expression subtool syntax.These would then form the centralized dialog for analysis.
16.5.5 Maximizing syntactic description
Extracting the dialog structure is only possible with some notations. The reason why it is not always possible, and is not usually possible for general interactive pro-grams, is itself an important issue. Usually it is possible to isolate the parts that areresponsible for input and output (identifiable by print, read, etc.). However, how these fit together into a dialog is masked by the surrounding code. In particu-lar, what would be syntactic in a dedicated dialog grammar description may be codedsemantically. For instance, in eventCSP, one could write
Text-editor = mouse-press → set-selection
[] key-press → add-char-to-text

16.5 Dialog semantics 581
In a programming language one might have
ev = read_event();
if ( ev.type == EV_mouse_press )
set_selection(ev.pos);
else add_char_to_text(ev.char);
In the second version an analyzer would have to recognize that the boolean expres-sion ev.type == EV_mouse_press corresponded to a simple dialog decisionrather than a deep semantic decision in the application.
Even more problems may arise in production systems, window managers orUIMS with external control, that is where the application is invoked on each eventfrom the user (see Chapter 8). In these systems, the most obvious form of dialog is completely user controlled. If the designer wishes to provide any control over the input syntax then a ‘program counter’ must be explicitly coded. So, for instance, if we were operating under a window manager that calls a user routine process_event, we might have the following code for text editor selection (writ-ten in C):
enum { normal, selected } mode;
process_event( event ev )
{
switch ( ev.type ) {
case button_down:
...
if ( in_text ( ev.pos ) ) {
mode = selecting;
mark_selection_start(ev.pos);
}
...
case button_up:
...
if ( in_text ( ev.pos ) && mode == selecting ) {
mode = normal;
mark_selection_end(ev.pos);
}
...
case mouse_move:
...
if ( mode == selecting ) {
extend_selection(ev.pos);
}
...
} /* end of switch */
} /* end of process_event */

582 Chapter 16 n Dialog notations and design
The dialog for the selection is distributed widely over the event loop, and further itis only by keeping track of the mode variable that we can see that they are linked atall. The code is for a mythical but quite typical window manager.
In each case, the problem is that elements of the dialog can be given either a syntactic or a semantic form. Obviously, more complex elements of the dialog will require complex computed decisions, but where possible, the more syntactic thedialog description, the easier it will be to analyze. This concept underlies much ofdatabase normalization procedures which try to move the decision as to whether anupdate is acceptable from the semantic realm to the syntactic.
DIALOG ANALYSIS AND DESIGN
In this section, we will look at several ways in which dialogs can be analyzed in order to discover potential usability problems, considering principles such as thosedescribed in Chapter 7. We will discuss these dialog properties under three headings.The first focusses on user actions and whether they are adequately specified and con-sistent. The second concerns the dialog states, including those you want to get to and those you do not. Finally, we will look at presentation and lexical issues, whatthings look like and what keys do what. Some of these properties have equivalents inChapters 17 and 18, where we discuss models of interactive systems that includesemantics.
16.6.1 Action properties
Look back to the STNs describing a graphics program (Figures 16.1–16.3) at thebeginning of Section 16.3. There are four types of user action in these diagrams:selecting from the main menu (graphics, text or paint), selecting a pop-up menuchoice (circle or line), clicking on a point on the drawing surface and double clicking a point on the drawing surface.
If we look at the different dialog states, we see that for any state only one or twoactions are mentioned. Sometimes this is because some actions are impossible. For example, the pop-up menu choices can only happen while a pop-up menu is displayed. So, we do not need to worry about the user doing ‘select “line”’ from theMain menu or while in state Line 1. But what happens if we click on the drawing surface whilst at the Main menu, or try to select something from the main menuwhilst in the middle of the drawing a circle, say in state Circle 2? The dialog descrip-tion is not complete.
If you take an actual system and try such odd combinations it is likely that the dialog description starts to explode in complexity, just as in the example of the digital watch. It was reasonable to have a partial description for the purposes ofinstruction, and for discussing the general dialog structure. But we need to make surethat these odd chains of events do not have disastrous consequences. Unfortunately,
16.6
16.6 Dialog analysis and design 583
in practice, it is at best the implementor and, at worst, the user who discovers suchbehavior. This is wrong. It is the responsibility of the designer to foresee just how thesystem behaves in unforeseen circumstances.
Surely it is a contradiction in terms to design for behavior under unforeseencircumstances? Yes, but the presence of a dialog description can make previouslyunforeseen events become apparent. Just as with the graphics STNs, we can, in general, list all the possible actions and then at each dialog state look for ‘forgottenevents’. This can be done with any notation, but some are easier than others. In par-ticular, it may be extremely difficult to perform such an analysis of a production rulesystem without automatic help. Furthermore, the structure of production rules maymean that you accidentally specify behavior – what you say may not be what you mean.
For each unforeseen state/action pair, the designer ought to decide (or at leastcheck during testing) what the behavior will be. The simplest rule is to decide that allunspecified behavior will have no effect (except possibly a warning) – ‘when in doubtdo nowt’. If this rule is not followed, more care is required. Imagine the user is drawing a polyline, but, before double clicking on the last point, selects a new optionfrom the main menu. One option is to discard the partially completed line. If theuser had clicked on only one point, this would be the only sensible option. However,if he had just carefully selected 20 points and simply forgotten to double click on thelast one, tempers may get frayed. A better option would be to treat the new selectionas confirming the partially completed shape whenever this is at all sensible.
As well as finding that some states have forgotten actions, we may discover thatsome states have several arcs labeled with the same action. That is, the specificationis not deterministic for that action. This can happen in several ways. It may be anaccident. For example, if we are using a hierarchical STN with escapes, as in Figure16.9, we may find that we have used an action as an escape at a high level, and forsome other purpose at a lower level. Similarly, when using production rules, one mayaccidentally find that two rules are active at the same time triggered by the sameevent. The formalism may have default rules to deal with such eventualities. Forexample, both production rules may fire, or there may be a precedence betweenrules, the one with the highest precedence being chosen. Similarly, the STN may takethe innermost arc. However, this is precisely where you should check that this defaultbehavior is what you want.
Sometimes, this non-determinism reflects semantic decisions in the system. Forexample, a grammar for a bank automated teller machine (ATM) might look like
atm ::= put-in-card get-number
get-number ::= digit digit digit digit
get-money return-card atm
| digit digit digit digit return-card atm
| digit digit digit digit atm
digit ::= 0 | 1 | 2 | 3 | 4 | 5 | 6 | 7 | 8 | 9
get-money ::= ...
The two different options depend on whether the digits entered are the correct PIN. In the first case they are and the user gets some money out. In the second, the
584 Chapter 16 n Dialog notations and design
number is wrong and the card is returned. In the last case, too many wrong numbers have been used and the card is retained. Deciding which of the branches to take is asemantic issue, not one of dialog structure.
Both completeness and determinism can be automatically checked in a dialogdescription. However, the designer must go through the warnings thrown up by suchan analysis and decide whether they represent a problem or are deliberate.
A third property, which cannot be automatically checked as easily, is consistency.We expect the same action in different circumstances to do roughly the same thing.For example, a user may get used to the ‘tab’ key moving the cursor eight spaces to the right. However, in a text entry area of a dialog box, most text-editing keys may behave as normal, but ‘tab’ may move to the next dialog box entry. Such ex-amples of inconsistency can cause obvious problems for the user. It is not possible to automate checks for consistency on a dialog description. First, this is because consistency also involves the semantics: similar actions should do similar things.Secondly, the interpretation of similar involves an understanding of what the userregards as similar.
However, by listing all dialog states and actions, a dialog description can help theanalyst to go through the various combinations. In particular, the analyst can dividethe states into major modes where actions may have different effects or be inactive.For example, in a word processor, the search/replace key may not be active in the‘print’ dialog box.
16.6.2 State properties
The states in a dialog represent points where the user has obtained information orwhere the system has done something useful. So, the user wants at least to be able toget to a desired dialog state and ideally to be able to get there easily. In general, wecan think of properties of this sort as reachability.
A basic check of any dialog is whether it is fully connected. That is, for any twostates is there a sequence of actions which will take the user from the first state to thesecond? Looking once more at Figures 16.1 and 16.3, we can see that, in so far as itis defined, the dialog is connected. For example, suppose we were in state Circle 1,but wished we were back at the graphics submenu (state Menu). We can click andthen double click anywhere on the drawing surface, taking us to the end of thegraphics submenu STN and back to the Main menu. From here, we can select the‘graphics’ option and get to where we want.
However, one suggested ‘improvement’ was to alter the circle drawing to allowmultiple circles. The amendment was shown in Figure 16.2. Unfortunately, thisdestroys the connectivity of the dialog. There is no way out of the circle dialog; onecan only fill up the screen with zillions of circles. This is a fairly obvious problem, butit is easy for more complex cases to slip through. For example, one of the authors wasonce shown a form-based financial planning system. Some inconsistent informationwas entered on one page of the form, which was allowed by the system. But, becauseof this, a later page was repeatedly rejected. There was no valid user input for that

16.6 Dialog analysis and design 585
page, but the system would not allow you to return to the incorrectly filled page untilthe later one was accepted – impasse.
Reachability checking can be entirely automatic, but care must be taken to distin-guish which choices are user controlled and which are system controlled. This is onereason why we emphasized the importance of maximizing syntactic description in a dialog notation. In general, we cannot assume that the system will take the pathsthat we wish. So, for example, given the ATM dialog, we cannot assume that the usercan get from the atm state to the get-money state, as this depends on the systemaccepting the PIN. An automatic tool can show where such unreachable points are,but the designer must say whether or not these are acceptable.
A special case of reachability is reversability, a form of undo. That is, the user wants to get to the previous state. For various reasons, some evident in Chapter 17,a dedicated ‘undo’ button or command is probably best dealt with as a meta-dialogfeature. However, we can analyze the existing commands to see how easy it is torecover one’s position in the dialog using standard commands. In effect, this is what we described at the beginning of this subsection. We were on the Circle 1 stateof Figure 16.1, and wanted to get back to the graphics pop-up menu. Indeed, this waspossible, but rather long winded. Any fully reachable dialog will be able to reverseactions, but it may not be easy to do so. One form of reversability analysis is to takeeach action and label it with the number of arcs that must be traversed in order to get back. Actions with large reversing costs are worthy of closer scrutiny: perhapsthe dialog ought to be redesigned to allow easier return paths, or possibly we mayrely on a generic undo mechanism.
Note that this dialog-level reversability is not a true undo. For example, when theuser goes from the Circle 1 state back to the graphics menu, this leaves a circle behindon the screen. Thus the dialog state has been undone, but the full system state hasnot. Reasoning about undo at this level requires a model of the system, and will bediscussed in Chapter 17. There is also a corresponding more complete form of reach-ability in this setting.
So, there are some states that the user wants to be in, movement to which the dialog ought to make easy. But there are other states, such as that where the hard diskis being formatted, which should be deliberately difficult to reach. Again, knowingwhich states are ‘dangerous’ cannot be determined automatically; it depends on thesystem semantics and the designer’s judgment. However, having labeled the danger-ous states (colored them red), we can perform analyses on the dialog to determinehow easy it is to get to these dangerous states. This labeling process may involveduplicating states which otherwise appear similar at the dialog level.
If we discover that a dangerous state is too easily reached, then we can attempt to prevent accidents. To do this, many systems initiate a dialog with the user when alot of information may be lost, for example
C>del test\*.*
Are you sure (Y/N)?
This in itself is not enough to prevent mistakes as frequent requests for confirmationmay make the user habitually type ‘Y’ after every command. The moves to dangerous
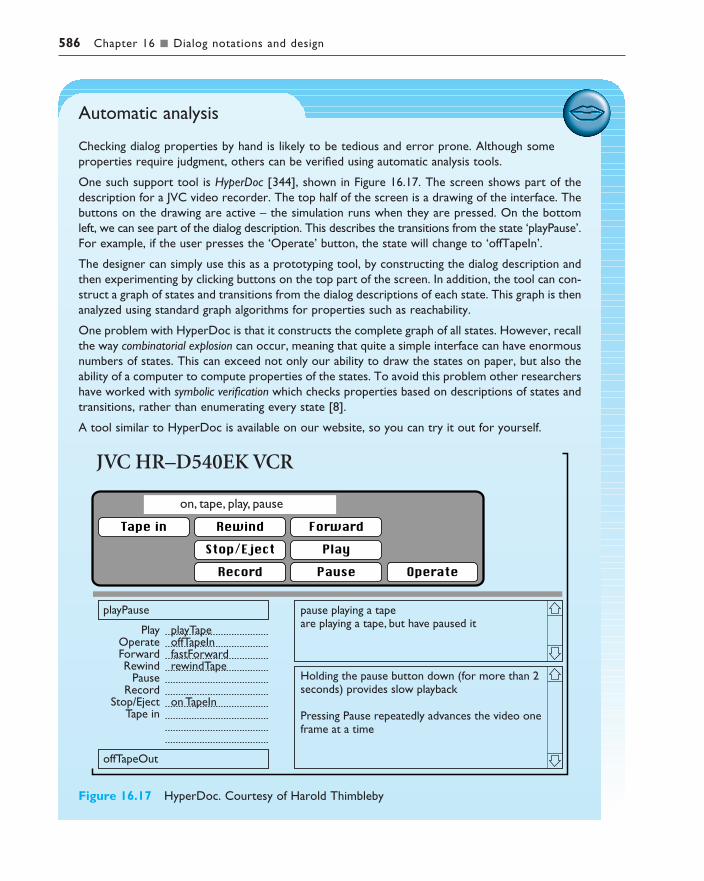
586 Chapter 16 n Dialog notations and design
Automatic analysis
Checking dialog properties by hand is likely to be tedious and error prone. Although someproperties require judgment, others can be verified using automatic analysis tools.
One such support tool is HyperDoc [344], shown in Figure 16.17. The screen shows part of thedescription for a JVC video recorder. The top half of the screen is a drawing of the interface. Thebuttons on the drawing are active – the simulation runs when they are pressed. On the bottomleft, we can see part of the dialog description. This describes the transitions from the state ‘playPause’.For example, if the user presses the ‘Operate’ button, the state will change to ‘offTapeIn’.
The designer can simply use this as a prototyping tool, by constructing the dialog description andthen experimenting by clicking buttons on the top part of the screen. In addition, the tool can con-struct a graph of states and transitions from the dialog descriptions of each state. This graph is thenanalyzed using standard graph algorithms for properties such as reachability.
One problem with HyperDoc is that it constructs the complete graph of all states. However, recallthe way combinatorial explosion can occur, meaning that quite a simple interface can have enormousnumbers of states. This can exceed not only our ability to draw the states on paper, but also theability of a computer to compute properties of the states. To avoid this problem other researchershave worked with symbolic verification which checks properties based on descriptions of states andtransitions, rather than enumerating every state [8].
A tool similar to HyperDoc is available on our website, so you can try it out for yourself.
Figure 16.17 HyperDoc. Courtesy of Harold Thimbleby

16.6 Dialog analysis and design 587
states must be different from other sequences – that is, not consistent! The movesbetween safe states and dangerous states really need detailed examination by the analyst, as one must decide whether a particular path can easily be taken by accidentor not. We will see in the remaining discussion that this is intimately connected tothe presentation and lexical design of the system.
16.6.3 Presentation and lexical properties
It is often claimed that dialog design should be independent of the detailed design of the presentation and lexical details of the interface. That is, one begins by decid-ing on the functionality of the system, and then, possibly making use of cognitivemodels or task analysis, one designs the dialog to perform those functions. Finally, one designs the visual presentation of the system and the lexical bindings betweenkeypresses and mouse movement and the more abstract dialog actions.
In fact, the dialogs described in this chapter have often involved detailed key bindings on their labels. For example, the STN for the graphics system in Figure 16.1has arcs with labels such as ‘click on point’ or ‘double click’. It could be argued thatthis is a fault in these descriptions. They should instead say things like ‘enter a point’,‘enter last point’. These actions could then be achieved with mouse clicks, or by typing coordinates.
For higher-level descriptions, such as the JSD diagram in Figure 16.14, this formof argument is valid; it would be inappropriate, at least in early design, to decidewhat keys or menu selections will move you to the ‘add employee record’ subdialog.However, later in design, and when we consider detailed dialog, such a positionbecomes less tenable.
In Section 16.6.1, we discussed the labeling of modes in which user actions mayhave different interpretations. It is generally regarded as good practice to minimizethe number of modes. However, where modes are used they should be visually dis-tinct. That is, one ought to be able to tell which mode one is in from the computerdisplay. So, the visual presentation and the form of the dialog are intimately con-nected. As well as major modes, one can compare any two dialog states, and askwhether they can be distinguished from the display. If not, this may indicate a poten-tial trouble-spot where the user can get confused. These are both visibility require-ments, and similar issues of observability and predictability will arise in Chapter 17.
The visibility issues are, in principle, one way the dialog can be designed indepen-dently of the presentation, but can constrain the form of it. In practice, the two aremore intermingled. However, there are further areas where the dialog is even moreintimately tied to presentation.
Different types of interfaces have very different dialog styles. The normal dialogform of a command-based interface is verb–object, for example ‘print fred’. How-ever, mouse-based systems often have an object–verb syntax, for example select a fileicon and then select ‘print’ from a menu. Although it is possible to mingle thesestyles, it is inadvisable as users expect to find a certain interface style with a particu-lar medium. So, detailed dialog design must be dependent on the type of interface.

588 Chapter 16 n Dialog notations and design
Furthermore, physical limitations may prohibit certain dialog structures. Forexample, the dialog for the digital watch (Figures 16.15 and 16.16) is designed withthe restriction of only three buttons. A similar design for an on-screen alarm clockcould make use of a full keyboard and thus have a completely different dialog.Similarly, the range of outputs, visual and aural, will restrict the dialog. If modes andstates should be visually distinct, then the device’s display must be able to distinguishthese modes. Unfortunately, restricted input leads to a highly moded dialog. Forexample, for three buttons to control all the functions of a digital watch with alarmand stop watch requires many modes, of which the four major modes are only thebeginning. But it is precisely those interfaces which have a limited input set whichalso have limited output, in particular consumer goods. It is thus no wonder thatusers often have trouble knowing what mode their video controller is in.
Dangerous states and key layout
The text editor being used for this passage has two main modes: an editing screen whereyou type and edit the document, and a menu screen, obtained by pressing the F1 function key. TheSTN for these modes is shown in Figure 16.18. The menu screen has several options including F2to exit (and save), and F1 to return to the editing screen. Exiting will automatically save the text ifit has been changed. However, this can be overriden by pressing the escape key in the main menu.This makes the system pretend that the text has not been changed until the next alteration.
Pressing the escape key in the main menu has no effect on the dialog, but the state of the systemafter this point can be thought of as dangerous. If the key has been pressed deliberately then all iswell, but if there is any mistake, the user may lose the updated text. Figure 16.19 shows an STNwith the dialog states duplicated to show the dangerous states (hatched). We want the dangerousstates to be reachable, but they should be difficult to get to by accident. In fact, the really danger-ous state is when we go to the hatched exit: if we return to the hatched edit state, then we are most likely to type a further editing command and the system becomes ‘safe’ again. Thereforewe can see that the particularly dangerous sequence is ‘F1–Esc–F2’. The question then is: can thisbe typed by accident? It is very similar to the standard exit and save sequence ‘F1–F2’, but usersare unlikely to hit the escape key by accident – or are they?
Even knowing that you have a full keyboard and standard screen is not sufficient to design the dialog. The precise positioning can affect the usability of a particular dialog style. The text editordescribed above (Figures 16.18 and 16.19) was originally used on a computer with a separate
Figure 16.18 Main modes of text editor

16.7 Summary 589
SUMMARY
We saw, by example, how the dialog of a user interface can become unmanageable,and impossible to analyze, if we do not have a separate description. We have lookedat two main classes of description: diagrammatic and textual. Diagrammatic nota-tions included various forms of state transition network, Petri nets, Harel statecharts, flow charts and JSD diagrams. Under textual notations, we considered gram-mars (regular expressions and BNF), production rules (event based and state based)and CSP.
16.7
function keypad on the left of the keyboard. No problems were encountered with the ‘dangerous’states of the system. However, the editor was later used on a system with a different keyboardlayout. The function keys are set out in a line along the top of the keyboard, as in Figure 16.20,with the escape key right next to function keys F1 and F2! As we saw, the dangerous mistake is tohit the sequence ‘F1–Esc–F2’, which is similar to the exit and save sequence ‘F1–F2’. With the orig-inal keyboard layout, this was an all but impossible mistake to make. However, on the new layoutit is possible to hit the escape with the edge of your finger as you press down the function key F1.If this happens as you type the sequence ‘F1–F2’, then disaster. This scenario is easily predictablefrom the dialog structure and the physical layout – and it can happen, as the authors know!
Figure 16.19 Revised STN with dangerous states
Figure 16.20 Dangerous function key layout

590 Chapter 16 n Dialog notations and design
We found that some very different notations were essentially equivalent: forexample, JSD diagrams and regular expressions can describe exactly the samedialogs. However, we also saw that there were major differences in expressive powerbetween different formalisms. For example, BNF grammars are able to deal withrecursively nested dialogs and are thus more powerful than regular expressions orstate transition networks.
One important difference in expressive power is whether or not the formalism canhandle concurrent dialogs. We found that some notations favor sequential dialogs(for example, STNs) and some concurrent (for example, production rules), but few could handle both (the exceptions being Harel state charts and CSP). However,increased expressive power is not always desirable as it may mean a more com-plex and less easily understood description. The important point is to match thenotation to the form of the desired dialog. Another important distinction wasbetween state-oriented and event-oriented descriptions. This will be picked up in thenext chapter.
Once we had a dialog description, we considered the connection between that dia-log description and the description of the system semantics. We looked at exampleswhere the dialog description is linked closely to a programming language and whereit is linked to a more formal description. Two issues arose in this discussion. One waswhether we want a centralized or a distributed dialog description; that is, should all the dialog be in one place and the semantics separate, or should the dialog bespread out with the associated semantics? The second issue concerned maximizingsyntactic description. Where there is a choice, we should put things into the dialogdescription, where they can be analyzed automatically, rather than in the semanticdescription.
Finally, we looked at properties of dialogs. Action properties focus on user actions,and under this heading we considered completeness – are there any missing actions?;determinism – do any actions appear twice?; and consistency – do similar actions dosimilar things? The first two of these are amenable to partial automatic checking.State properties concern the ability of the user to move between dialog states. Weconsidered reachability – whether we can reach any desired state – and reversability– a special case, whether we can get back to the last state. We noted that reversabil-ity at the dialog level is not undo as this involves the whole semantics of the system.Finally under state properties, we considered dangerous states, that is those we donot want to get into accidentally.
We found that presentation and lexical issues are not (as is commonly supposed)a separable issue from dialog design. We need to consider the visibility of modes andthe style of interaction. Even the layout of keys and menu items can influence thelikelihood of making serious errors.

Exercises 591
EXERCISES
16.1 Complete the drawing tool STN in Figures 16.1 and 16.3 by writing dialog descriptionsfor the text and paint submenus. For the text submenu assume that there are three options: centered, left and right justified. The text is entered by clicking at a location in the drawing surface and then typing. You may initially assume that typing a line of text can be regarded as asingle user action. But later try regarding each character typed as an action. The paint submenuhas two options: a pencil for freehand drawing and a paint pot for flood filling. The former is performed by holding the mouse button down whilst moving the mouse about to draw the line.The paint pot is activated by simply clicking the mouse over the area to be filled.
16.2 Repeat the above exercise using different notations, grammars, production rules, JSD or CSP. Youwill need to specify the whole system from the main menu to the individual submenu selectionssuch as circle drawing. Note the problems you have with each notation.
16.3 Develop the JSD diagram in Figure 16.14, expanding the various nodes until you get to basic operations such as ‘prompt “login”’ or ‘user types in password’. Expand the ‘delete employee’node using the dialog style as described in Figure 16.13, and use your imagination for the rest.
16.4 In the example of the digital watch in Section 16.3.8, what would be the dangerous states? Relatethe lexical issues of the buttons for a digital watch to these dangerous states and provide somedesign advice. Does your own digital watch satisfy these criteria?
16.5 This exercise is based on the nuclear reactor scenario on the book website at: /e3/scenario/nuclear/
(a) Looking only at the STN diagrams in Figures 16.21 and 16.22 (that is, ignoring for now themeaning of the various actions), identify missing elements from the STNs. Taking into accountthe meaning of the actions, suggest possible corrections.
Figure 16.21 STN for alarm state
Figure 16.22 STN for revised alarm state

RECOMMENDED READING
Probably the best recent additional reading for this subject are Paternó’s Model-Based Design and Evaluation of Interactive Applications and Dix’s ‘Upside down Asand algorithms – computational formalisms and theory’, referenced in the recom-mended reading lists in Chapters 18 and 17 respectively. In preparing the third edi-tion of this book, we have found it hard to find good recent reading in specificationand implementation chapters and some of the titles we suggest are hard to obtain,for example Alexander (below) is out of print and only available in some libraries. Asmulti-platform user interfaces begin to become more important we predict a growthin this area, so we hope that by the time we are writing a fourth edition there will bea greater choice.
(b) Taking into account now the meaning of the various states and actions, explain why youbelieve the consultant suggested the change from the behavior in Figure 16.21 to that in Figure 16.22.
16.6 This exercise is based on the mobile phone scenario on the book website at: /e3/scenario/phone/
Figure 16.23 shows an STN for the simple mobile phone described in scenarios A and B on the web.
(a) Identify any missing transitions and suggest possible behavior that would be sensible for theuser.
(b) Scenarios C and D demonstrate the additional behavior of the new phone. Update the STNin Figure 16.23 to add the new store and recall facilities of the new phone. Where there is not sufficient information in the scenarios choose suitable behavior. You can use ellipses ( . . . ) where you would expect major additional functionality (e.g. storing numbers); don’tattempt to fully specify such additional functions. List and briefly describe and justify any suchdesign decisions that are required or any other design issues that become apparent.
Figure 16.23 STN for original phone
592 Chapter 16 n Dialog notations and design
Recommended reading 593
H. Alexander, Formally-based Tools and Techniques for Human–Computer Dialogs,Ellis Horwood, 1987.This book is dedicated to the CSP-based notation, SPI (see Sections 16.4.3 and 16.5).
G. Cockton, Designing abstractions for communication control. In M. D. Harrisonand H. W. Thimbleby, editors, Formal Methods in Human–Computer Interaction,Chapter 10, Cambridge University Press, 1990.Describes generative transition networks, a form of state transition networkwhich has many features of an event-based production system. In particular, itattempts to solve some of the problems that STNs have with concurrent dialogs.
D. R. Olsen, Propositional production systems for dialog description. In J. C. Chewand J. Whiteside, editors, Empowering People – CHI’90 Conference Proceedings, pp. 57–63, Human Factors in Computing Systems, ACM Press, 1990.Original paper on propositional production systems, including examples andanalysis.
H. R. Hartson, A. C. Siochi and D. Hix, The UAN: a user-oriented representation for direct manipulation, ACM Transactions on Information Systems, Vol. 8, No. 3,pp. 181–203, July 1990.User Action Notation (UAN) is not a dialog notation as such, but operates at thedialog level. UAN is scenario based in the sense that it considers small snippets ofuser behavior, for example the deletion of a file. It describes the actions the usermust perform and the system feedback.
See also the reading list for Chapter 8 since the greatest use of dialog descriptionnotations has been as the dialog control portion of user interface managementsystems.
MODELS OF THE SYSTEM
OV E RV I E W
We need to know what a system does in order to assessits usability.
n Standard software engineering formalisms can be usedto specify an interactive system. These are of varioustypes:– model based, such as Z, which describe the system’s
state and operations– algebraic formalisms, which describe the effects of
sequences of actions– temporal and deontic logics, which describe when
things happen and who is responsible.
n Special interaction models are designed specifically todescribe usability properties, including:– predictability and observability – what you can tell
about the system from looking at it– reachability and undo – what you can do with it.
n Most formal models and notations focus on events andchanges that happen when they occur, but we needricher models to deal with:– interstitial behavior – the things that happen
between events such as dragging an icon– physical objects in ubiquitous computing or virtual
reality– the tension between precise time and more fuzzy
human ideas of time.
17
17.2 Standard formalisms 595
INTRODUCTION
In the previous chapter we looked at the specification of dialog. In this chapter wewill look at ways of modeling the semantics of an interactive system. The dialog justtells us about what user actions are legal at any point, but here we will be interestedin what the user’s actions do to the system.
There is some overlap. In the previous chapter we discussed some of the ways dia-log is linked to semantics. Also, definitions of system semantics tend to define theacceptable dialog. However, a system-oriented description will not describe the dia-log as well as a dedicated dialog notation, and a dialog notation may hardly definethe system at all.
In Section 17.2, we will describe how standard formalisms can be used to specifyinteractive systems. Such formalisms are becoming part of software engineeringpractice and can be a way for interface designers to articulate their ideas and com-municate them to system developers. These formal notations are used to specify thefunctionality and presentation of specific systems.
Section 17.3 looks at interaction models, formal models that describe general properties of systems. We will demonstrate how one such model, the PIE model, canbe used to investigate generic principles such as WYSIWYG and undo.
Finally, in Section 17.4, we will discuss ways to model phenomena that involvemore continuous interactions such as dragging an icon and also issues of time suchas what we mean by ‘let’s meet this afternoon’.
Each modeling technique takes the view that it is not enough to design the ‘interface’ as a thin layer between the user and the system. Usability is affected by thewhole system functionality: what is there, what can be done to it, and how it is presented at the interface.
STANDARD FORMALISMS
In this section we will discuss ‘off-the-shelf ’ formalisms which can be used to specifyinteractive systems. The purpose of a formal specification is twofold: communica-tion and analysis. Sections 17.2.1 and 17.2.2 will show how this influences their usefor interface design.
We will then look at three brands of formalism. First we will look at model-oriented notations, Z in particular. We will use a graphics program as an examplethroughout this subsection and also Section 17.2.5 on algebraic specification. Finally,Section 17.2.6 looks at temporal and other logics. Another major brand of notationis the process algebras, such as CSP. However, these are most suited to dialog designand have been discussed in Chapter 16.
17.2
17.1

596 Chapter 17 n Models of the system
17.2.1 Formal notations for communication
A specification can be used as a common language within a design team, or betweenthe designers and system developers. In the latter case it can also form a sort of contract between the parties. Ideas for screen layout can easily be visualized with thehelp of drawings or painting packages, but the dynamics and deeper behavior of the system are more difficult to communicate. It is easy to discuss ideas with otherdevelopers or with a programmer without ever being sure you are talking about thesame thing.
The claim is frequently made that a formal specification gets rid of ambiguitycompletely and provides a precise unambiguous description of the system. However,this claim is false. The symbols used and the manipulations of them have definedmeanings within the formal systems, but the interpretation of those symbols can stillvary from person to person. For example, if a specification of a screen defines thecolor of pixels at any position (x,y), then one designer may think the coordinateshave (0,0) at the bottom left and another may think that they start at the top left. The internal geometry of the screen is unambiguous, but the interpretation of onedesigner is upside down! These ambiguities tend to be of a different kind from thoseof the spoken and written word (and are often as silly as the above). This is why it iscrucial that any formal specification is accompanied by extensive commentary and aparallel written description.
In a small group, where a specification is developed in cooperation, the needs for extensive documentation are less strong. The group can build up a shared inter-pretation of the symbols used. In such a setting, formal statements can be a succinctand precise mode of communication. However familiar the formalisms become, the group must remember that they are using an esoteric language, which must beinterpreted to outsiders.
17.2.2 Formal notations for analysis
Formal specifications can be analyzed in a variety of ways. First, they can be checkedfor internal consistency; that is, to see if any statement made in one part of it con-tradicts another. For example, we shall see in Section 17.3.3 that some of the require-ments one might have for an undo command are, in fact, incompatible. It would, intheory and in practice, be impossible to build a system satisfying all the properties.
Secondly, a specification can be checked for external consistency with respect tothe eventual program. This task of verification, previously discussed in Chapter 6, is one of the chief benefits of a formal specification, from a software engineering perspective. However, this is not the primary benefit for HCI.
Finally, a specification can be checked for external consistency with respect torequirements. Some of these requirements will be nothing to do with HCI (althoughstill important), for example security properties. Other requirements will be aboutthe particular system: for example, that any function can be accessed within no morethan three keystrokes. In addition, there are generic usability requirements whichcover a range of systems, for example the usability principles discussed in Chapter 7.
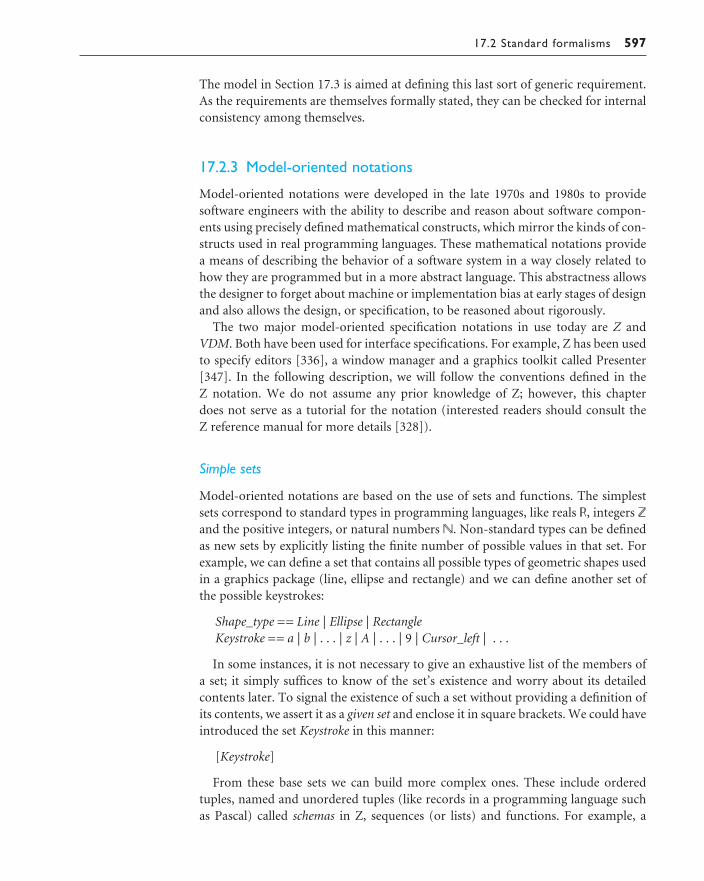
17.2 Standard formalisms 597
The model in Section 17.3 is aimed at defining this last sort of generic requirement.As the requirements are themselves formally stated, they can be checked for internalconsistency among themselves.
17.2.3 Model-oriented notations
Model-oriented notations were developed in the late 1970s and 1980s to providesoftware engineers with the ability to describe and reason about software compon-ents using precisely defined mathematical constructs, which mirror the kinds of con-structs used in real programming languages. These mathematical notations providea means of describing the behavior of a software system in a way closely related tohow they are programmed but in a more abstract language. This abstractness allowsthe designer to forget about machine or implementation bias at early stages of designand also allows the design, or specification, to be reasoned about rigorously.
The two major model-oriented specification notations in use today are Z andVDM. Both have been used for interface specifications. For example, Z has been usedto specify editors [336], a window manager and a graphics toolkit called Presenter[347]. In the following description, we will follow the conventions defined in the Z notation. We do not assume any prior knowledge of Z; however, this chapter does not serve as a tutorial for the notation (interested readers should consult the Z reference manual for more details [328]).
Simple sets
Model-oriented notations are based on the use of sets and functions. The simplestsets correspond to standard types in programming languages, like reals R, integers Zand the positive integers, or natural numbers N. Non-standard types can be definedas new sets by explicitly listing the finite number of possible values in that set. Forexample, we can define a set that contains all possible types of geometric shapes usedin a graphics package (line, ellipse and rectangle) and we can define another set ofthe possible keystrokes:
Shape_type == Line | Ellipse | RectangleKeystroke == a | b | . . . | z | A | . . . | 9 | Cursor_left | . . .
In some instances, it is not necessary to give an exhaustive list of the members ofa set; it simply suffices to know of the set’s existence and worry about its detailedcontents later. To signal the existence of such a set without providing a definition ofits contents, we assert it as a given set and enclose it in square brackets. We could haveintroduced the set Keystroke in this manner:
[Keystroke]
From these base sets we can build more complex ones. These include orderedtuples, named and unordered tuples (like records in a programming language suchas Pascal) called schemas in Z, sequences (or lists) and functions. For example, a
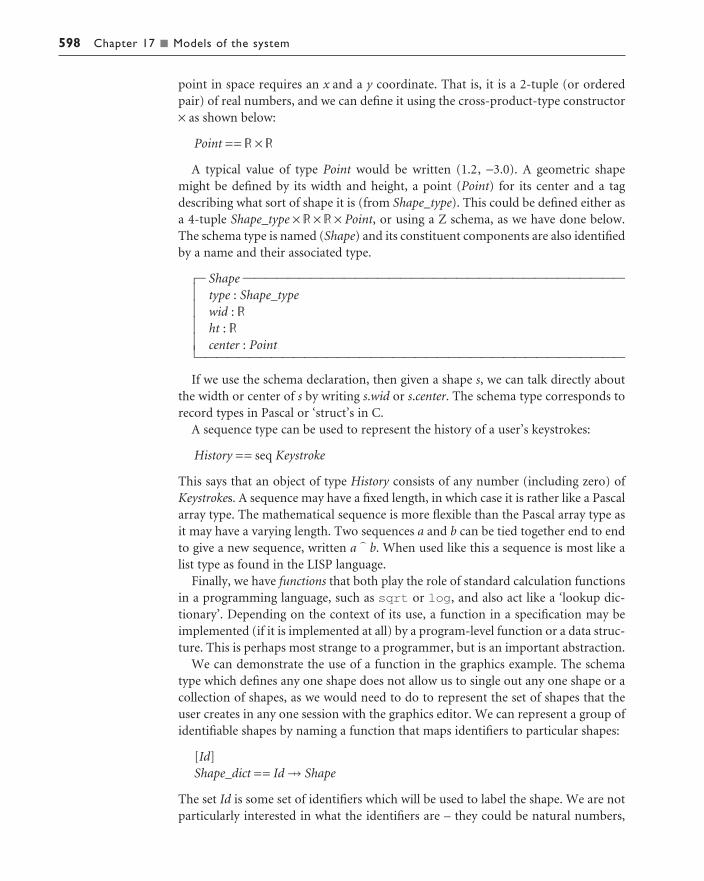
598 Chapter 17 n Models of the system
point in space requires an x and a y coordinate. That is, it is a 2-tuple (or orderedpair) of real numbers, and we can define it using the cross-product-type constructor× as shown below:
Point == R × R
A typical value of type Point would be written (1.2, −3.0). A geometric shapemight be defined by its width and height, a point (Point) for its center and a tagdescribing what sort of shape it is (from Shape_type). This could be defined either asa 4-tuple Shape_type × R × R × Point, or using a Z schema, as we have done below.The schema type is named (Shape) and its constituent components are also identifiedby a name and their associated type.
» Shape __________________________________Æ type : Shape_typeÆ wid : RÆ ht : RÆ center : Point–______________________________________
If we use the schema declaration, then given a shape s, we can talk directly aboutthe width or center of s by writing s.wid or s.center. The schema type corresponds torecord types in Pascal or ‘struct’s in C.
A sequence type can be used to represent the history of a user’s keystrokes:
History == seq Keystroke
This says that an object of type History consists of any number (including zero) ofKeystrokes. A sequence may have a fixed length, in which case it is rather like a Pascalarray type. The mathematical sequence is more flexible than the Pascal array type asit may have a varying length. Two sequences a and b can be tied together end to endto give a new sequence, written a ^ b. When used like this a sequence is most like alist type as found in the LISP language.
Finally, we have functions that both play the role of standard calculation functionsin a programming language, such as sqrt or log, and also act like a ‘lookup dic-tionary’. Depending on the context of its use, a function in a specification may beimplemented (if it is implemented at all) by a program-level function or a data struc-ture. This is perhaps most strange to a programmer, but is an important abstraction.
We can demonstrate the use of a function in the graphics example. The schematype which defines any one shape does not allow us to single out any one shape or acollection of shapes, as we would need to do to represent the set of shapes that theuser creates in any one session with the graphics editor. We can represent a group ofidentifiable shapes by naming a function that maps identifiers to particular shapes:
[Id]Shape_dict == Id ß Shape
The set Id is some set of identifiers which will be used to label the shape. We are notparticularly interested in what the identifiers are – they could be natural numbers,

17.2 Standard formalisms 599
for instance – so we just assert Id as a given set for the moment. An object shapes oftype Shape_dict is a function mapping labels to shapes. If id were a particular label,then the shape dictionary shapes might map it to a rectangle with width 2.3, height1.4 and center (1.2, −3). We could write this formally as
shapes(id).type = Rectangleshapes(id).wid = 2.3shapes(id).height = 1.4shapes(id).center = (1.2, −3)
Shape_dict is only defined to be a set of partial functions. Functions map elementsin one set to elements in another set. A partial function does not have to map everypossible element in the source set to an element in the destination set. Therefore, not everything in Id is a valid argument for shapes. The set of values that are valid iscalled the domain of shapes and is written ‘dom shapes’. For example, we might have
dom shapes = { 5, 1, 7, 4 }
So shapes(5), shapes(1), shapes(7) and shapes(4) would all be valid, but nothing else.
Zdraw – the state and invariants
Although it is not necessarily the case, model-oriented specifications tend to be writ-ten in an imperative fashion. One defines the state of the system, and then definesoperators in terms of their effect on the state. In Z, this state and the operators arewritten using the schema notation. For example, the state of a simple graphics sys-tem, called Zdraw and depicted in Figure 17.1, would include a dictionary of shapeswhich have been created by the user and an indication of the currently selectedshapes. The schema State below gives this definition:
» State ___________________________________Æ shapes : Shape_dictÆ selection : P Id«________Æ selection z dom shapes–______________________________________
Figure 17.1 Zdraw – ellipse option has just been selected

600 Chapter 17 n Models of the system
The schema State is divided into two parts, above and below the middle line. Above the line we have the definition of components of the state of the graphics system. This part is similar to the component identification used to define the setShape. Below the line is the state invariant, a condition which must always besatisfied by the components of the state. Predicates on separate lines are assumed to be joined by logical ‘and’ unless otherwise indicated. It says that the set of cur-rently selected objects must always be contained in the set of created objects in thesystem. We will not allow a selected object to be one that has not been created by the user. Any operator which changes the state must ensure that it maintains thisinvariant.
What is the start state of the geometric modeling system? A reasonable assump-tion would be the state without any created or selected shapes. The initial state isdefined by the schema Init:
» Init ___________________________________Æ State«________Æ dom shapes = { }Æ selection = { }–______________________________________
Above the line we have included the previously defined schema State. Schema inclu-sion in Z is a mechanism to assist the gradual definition of a complex system in aseries of simpler steps. Including the schema State above includes the declaration of all of its components (above the line in its original definition) and invariants(below the line). The additional invariants added in this initialization schema furtherrestrict the initialized state, stipulating that the shape dictionary has no elements inits domain (there are no created shapes) and no currently selected shapes. The lastpredicate about the selected shapes was unnecessary, since it is already guaranteed bythe invariant of State; that is, that the set of selected shapes is a subset of the createdones. So an equivalent definition of the start state would remove that predicate andleave it to the reader to deduce from the state invariant.
» Init ___________________________________Æ State«________Æ dom shapes = { }–______________________________________
Defining operations
Finally, we shall define two operations. The system is going to operate as follows. To create a new shape, say a circle, the user goes to the menu option ‘Ellipse’ andselects it. A fixed-size circle appears in the middle of the screen. The user is then free to move and resize this to the desired position and shape. Figure 17.1 shows a representation of the screen just after the user has selected the ellipse option. The details of the menu are not presented here, but the basic functionality of theNewEllipse and Unselect operation is defined as schemas below.

17.2 Standard formalisms 601
To define an operation, we need to describe the state of the graphics system beforeand after the operation is invoked. To do this in the schema language, we include twocopies of the state description, called State (the ‘before’ copy) and State′ (the ‘after’copy). If an operation requires input or provides output, these are marked with aquestion mark for input (?) and an exclamation point for output (!). The NewEllipseoperation is defined next:
» NewEllipse ________________________________Æ StateÆ State ′Æ newid ? : IdÆ newshape ? : Shape«_________Æ newid ? ‰ dom shapesÆ newshape ?.type = EllipseÆ newshape ?.wid = 1Æ newshape ?.ht = 1Æ newshape ?.center = (0,0)Æ shapes ′ = shapes U { newid ? → newshape ? }Æ selection ′ = { newid ? }–______________________________________
This operation results in the creation of a new ellipse of a fixed size in the centerof the coordinate space (assumed to be the point (0,0)). The result of the operationis that the shape dictionary is updated to include a mapping from some ‘fresh’identifier (one that is not already used to point to an existing shape) to the newellipse shape defined by newshape?. We do not indicate how this fresh identifier isprovided to the operation – that is left as an issue for the implementor to settle. Inaddition, we have stipulated that the new object becomes the only selected object.
Note that the last part of the specification is quite an important interface choiceand would not appear in a dialog specification. We could just as easily have left the selection as it was (selection ′ = selection). Possibly, we have made our choicebecause a (trivial) task analysis shows that users will normally want to move or resize a new object. This design decision may be wrong, but it is explicit and thusopen to challenge. In an implementation such a decision would be deeply buried in the code.
The Unselect operation makes the set of currently selected objects empty. Fromthis natural language description, we can derive an explicit formal description below:
» Unselect _________________________________Æ StateÆ State ′«________Æ selection ′ = { }Æ shapes ′ = shapes–______________________________________
Notice that we chose to make explicit that the dictionary of shapes remained the sameafter the operation. This may seem obvious, but if the last predicate were removed
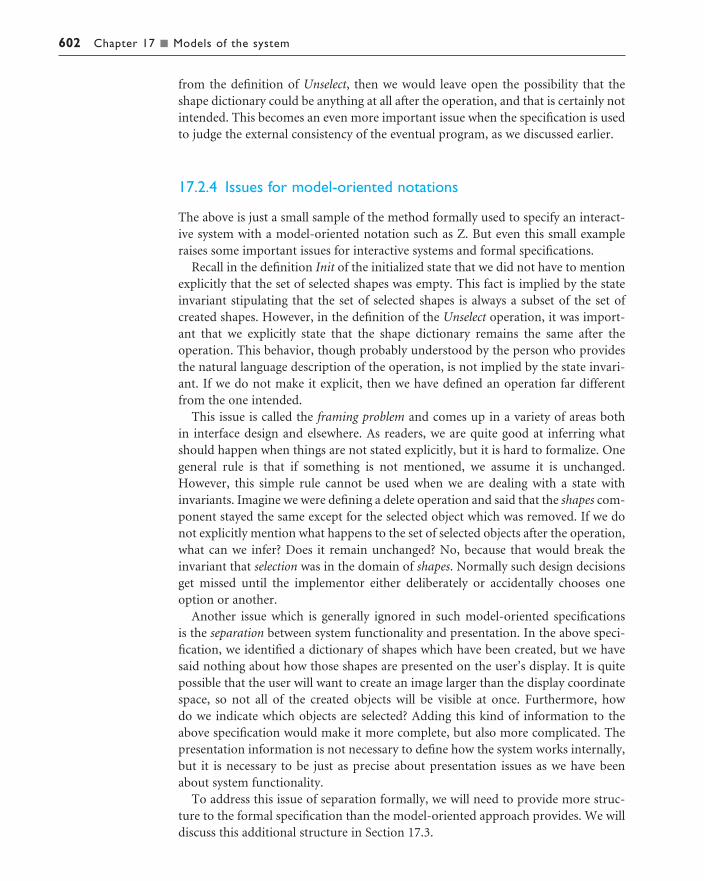
602 Chapter 17 n Models of the system
from the definition of Unselect, then we would leave open the possibility that theshape dictionary could be anything at all after the operation, and that is certainly notintended. This becomes an even more important issue when the specification is usedto judge the external consistency of the eventual program, as we discussed earlier.
17.2.4 Issues for model-oriented notations
The above is just a small sample of the method formally used to specify an interact-ive system with a model-oriented notation such as Z. But even this small exampleraises some important issues for interactive systems and formal specifications.
Recall in the definition Init of the initialized state that we did not have to mentionexplicitly that the set of selected shapes was empty. This fact is implied by the stateinvariant stipulating that the set of selected shapes is always a subset of the set of created shapes. However, in the definition of the Unselect operation, it was import-ant that we explicitly state that the shape dictionary remains the same after the operation. This behavior, though probably understood by the person who providesthe natural language description of the operation, is not implied by the state invari-ant. If we do not make it explicit, then we have defined an operation far differentfrom the one intended.
This issue is called the framing problem and comes up in a variety of areas both in interface design and elsewhere. As readers, we are quite good at inferring whatshould happen when things are not stated explicitly, but it is hard to formalize. Onegeneral rule is that if something is not mentioned, we assume it is unchanged.However, this simple rule cannot be used when we are dealing with a state withinvariants. Imagine we were defining a delete operation and said that the shapes com-ponent stayed the same except for the selected object which was removed. If we donot explicitly mention what happens to the set of selected objects after the operation,what can we infer? Does it remain unchanged? No, because that would break theinvariant that selection was in the domain of shapes. Normally such design decisionsget missed until the implementor either deliberately or accidentally chooses oneoption or another.
Another issue which is generally ignored in such model-oriented specifications is the separation between system functionality and presentation. In the above speci-fication, we identified a dictionary of shapes which have been created, but we havesaid nothing about how those shapes are presented on the user’s display. It is quitepossible that the user will want to create an image larger than the display coordinatespace, so not all of the created objects will be visible at once. Furthermore, how do we indicate which objects are selected? Adding this kind of information to theabove specification would make it more complete, but also more complicated. Thepresentation information is not necessary to define how the system works internally,but it is necessary to be just as precise about presentation issues as we have beenabout system functionality.
To address this issue of separation formally, we will need to provide more struc-ture to the formal specification than the model-oriented approach provides. We willdiscuss this additional structure in Section 17.3.

17.2 Standard formalisms 603
17.2.5 Algebraic notations
There are a wide number of algebraic specification notations including OBJ, Larchand ACT-ONE. In particular, ACT-ONE has been used as the functional part of theISO standard language LOTOS.
In principle, an algebraic specification does not try to build up a picture of thecomponents of an object, but merely describes what the object is like from the outside. For an interface specification this sounds like a good thing, as we want to talkabout the behavior of a system from the user’s viewpoint, not the way it is built.However, algebraic notations are more difficult to ‘get into’. They have a specificmindset which, once understood, is very clear, but takes some getting used to.
An algebraic version of Zdraw
If we continue the graphics example, we could imagine in Z having gone on to definethe actions of resizing an object, and deleting it. In addition, we have an operationselect which, given a point, makes the nearest object to it the current selection, andan operation unselect which clears the current selection. We will instead define theseoperations algebraically. As we have mentioned, an algebraic specification does notprovide an explicit representation (or model) of the system. Rather, the types ofinterest in the state are declared along with the set of operations which manipulatethose types. A set of axioms then implicitly defines the system state. An algebraicspecification for the graphics system is given below:
Algebraic–draw =types
State, Ptoperations
init : → Statenew_ellipse, new_rectangle, new_line : Pt × State → Statemove, resize, select : Pt × State → Stateunselect : State → Statedelete : State → State
axiomsfor all st e State; p, p′ e Pt •1. delete(new_ellipse(st)) = unselect(st)2. delete(new_rectangle(st)) = unselect(st)3. delete(new_line(st)) = unselect(st)4. move(p, unselect(st)) = unselect(st)5. resize(p, unselect(st)) = unselect(st)6. move(p, move(p′, st)) = move(p, st)7. resize(p, resize(p′, st)) = resize(p, st)8. delete(delete(st)) = delete(st)
The specification is in a generic algebraic notation that captures the main features ofmost real notations. We first declare the types of interest in the specification – points,Pt, which will serve as arguments for some of the operations, and the overall graphics

604 Chapter 17 n Models of the system
system state, State. No further information is provided about the construction ofthese types. The operations are then listed and are defined in terms of their input and output. For example, the operation new_ellipse is defined to take a point and the current state as arguments and returns a new state. The operation init takes noargument and produces a state. The types and operations together form the signatureof the specification Algebraic–draw.
After the individual operations have been declared, the algebraic specificationdescribes the relationships between the various operations by means of axioms.Axioms indicate how the operations interact with one another. The first threeaxioms tell us that creating any object and then immediately deleting it has no neteffect other than unselecting the current object. This is an important safety propertyfor the user saying that there are no unexpected side-effects.
The next two axioms say that attempts to move or resize when there is no selectedobject do nothing at all. Axioms 6 and 7 say that both move and resize are ‘forgetful’in the sense that if you do two resizes in a row the second overrides the first as if the first had never happened. This forgetful behavior of the move operation is very different from the behavior defined in the model-oriented specification. In the model-oriented approach, it would be easier to specify that a move operation is cumulative – two successive moves are the same as doing one move equal to thesum of the two moves. Finally, the last axiom says that the action of delete is evenmore forgetful: it is idempotent – doing a second delete achieves nothing.
Reading time order in algebraic formulae
Note that the algebraic notation reads from the inside out. So the first thing done is in the middle of the expression. For example, if an axiom reads
resize(p, move (p′, new_rectangle(st)))
then this corresponds to doing first a new_rectangle, then a move and then a resize.This becomes more clear if we put in the temporary results:
st1 = new_rectangle(st)st2 = move(p′, st1)st3 = resize(p, st2)
Some algebraic notations are more imperative having an implicit state. In such anotation, the first and fifth axioms of Algebraic–draw would be written
new_ellipse ; delete = unselectunselect ; resize(p) = unselect
Such a format is easier to read as ‘time’ goes from left to right, but is less flexible.
Completeness and observation
If we look back at the full set of axioms, we see that they are nowhere near enough to specify the behavior of Algebraic–draw. That is, they are not complete. As far as the

17.2 Standard formalisms 605
axioms are concerned there is no difference between move and resize, or betweennew_ellipse and new_rectangle. Now we could add some more axioms, for instanceadding an axiom to say that a move, resize or unselect after a delete has no effect.
There is a more fundamental problem, however. We are told nothing about the internal structure of State or Point. Presumably Point is generated from themouse position, so we would really know something about it. We can put inputs into the system, but what do we get out? There are no observation operators. A sys-tem which cannot be observed can easily (and it is the simplest solution) do nothingat all. To be useful, this specification would have to be extended to include the presentation of a screen image or something similar. This screen image would bemore concrete than the abstract internal state, and would be related to State byobservation operators. This is a similar problem, concerning the relation betweenfunctionality and presentation, as was raised in the previous section with model-oriented notations.
17.2.6 Temporal and other logics
Many readers will be familiar with standard propositional logic, where letters areused to represent logical statements. For example, if one of the authors says
(p v q) ¶ r
where p = ‘my nose is green’q = ‘I’ve got ears like a donkey’r = ‘I’m called Alan’
then you can conclude that either the author in question is Alan, or he or she willstand out in a crowd.
In fact propositional logic and predicate logic (which allows parametrized log-ical formulae such as P(x) v Q(x)) are used as part of many other formalisms, forinstance in the model-oriented specification of the graphics drawing package.
However, propositional and predicate logic are only the simplest of vast familiesof logics developed as part of philosophy and mathematical logic. Of these special-ized logics, several have been adopted and developed within computer science andhave operators which are particularly useful for specifying properties of interactivesystems.
Temporal logic
Temporal logics augment predicate logics with operators to reason about time. Thereare many different brands of temporal logic, but most share the basic symbols pand , which are read as ‘always’ and ‘eventually’. These are the temporal equival-ents of the quantifiers A (universal quantification, read ‘for all’) and E (existentialquantification, read ‘there exists’). So the statement
p (rains on Tuesday)

606 Chapter 17 n Models of the system
says that it ‘always rains on Tuesday.’ The statement p(!p) says that it is always nottrue that p. In other words, p never happens. So we can always read the combinationp! as ‘never’:
p! (computer explodes)
We can see that temporal operators are useful at specifying safety properties. Morecomplex properties can also be given, for example
p (user types ‘print fred’ fi the laser printer prints the file ‘fred’)
This statement says that at all times, if the user types the command ‘print fred’, theneventually the file ‘fred’ will be printed on the laser printer. Whereas it is easy with amodel-oriented specification like Z to say what will happen immediately after a useraction, this sort of delayed response property is very difficult indeed.
Further temporal operators
In fact, the above statement was quite weak; ‘eventually’ could mean in a thousandyears’ time. To cope with this, temporal logics introduce additional operators. Thesevary a bit more from logic to logic. Some reason over bounded time intervals, so that the meaning of ‘eventually’ becomes ‘before the end of this interval’. A morepopular approach is to use operators such as until and before.
p until q – p must remain true until q becomes truep before q – p must be true at some time before q becomes true
We can think of until and before as bounded versions of p and respectively, wherethe second argument q marks the end of the interval over which they act. Note thatp until q is weaker than pp as the latter demands that p remain true for ever, whereasthe former only until q becomes true. On the other hand, p before q is stronger thanp as the former guarantees a timescale in which p must occur.
As well as being used to specify systems in abstract, temporal and similar logicshave been used to prototype interactive systems. To do this, special executable formshave to be used, as in general a temporal logic formula can look arbitrarily far intothe future. Consider, for example,
( user types ‘print fred’) fi the laser printer prints the file ‘fred’
This formula says that if at any time in the future the user types ‘print fred’, then the system ought to print the file ‘fred’ now. Such clairvoyant systems are hard toproduce, and thus the executable forms have to restrict the types of specification theuser can enter.
Unfortunately, restricting oneself to executable formulae can also prevent the expres-sion of useful requirements. Obviously all requirements should be consistent with beingexecuted (we want to produce a system eventually), but they need not be sufficientlyprecise to be executable. This tension between executability and expressiveness is evident throughout the use of formal methods in computer science, but is especiallypertinent to user interface design with its focus on a rapid prototyping cycle.

17.2 Standard formalisms 607
Real time
Temporal logics only deal with time in the sense that they represent the successionof events – one thing happens before another. They do not represent actual dura-tions and times in hours, minutes and seconds. Clearly, there are important userinterface aspects which require a real-time statement such as the following:
When the ellipse option is selected it must be highlighted within 100 ms and thenew object must appear on the screen within 1 second
Programming, specifying and reasoning about real-time behavior is a very activeresearch area, and a variety of notations have been developed, such as real-time logicand timed versions of the process algebras (CSP and CCS). However, as yet, none hasbeen extensively used within HCI. One barrier to effective use is that general prop-erties are difficult to state exactly – we usually want a response time of ‘around’ 100milliseconds. Also, the real-time notations have often been developed with time-critical applications in mind, whereas, for many human response time issues, thereis a gradual degradation in performance as the time increases, rather than a critical timeafter which the system might as well not bother. On the other hand, there are sometiming issues where critical bounds do occur: for example, in hand–eye coordinationtasks, delays of even a few hundred milliseconds can destroy performance totally.
Whether or not we use a formalism to describe real-time properties of a design,we must always remember that these issues are important, and we are not using an‘infinitely fast machine’ (see Chapter 2 and [93]).
Deontics – responsibility and freedom
Specifications say what the designer thinks should happen. Specifications of the system say what it should do, but real requirements are often about the world – ‘thesystem should have a secure backup every week’. One could write a formal versionof this statement using some form of temporal logic, but when we come to design asystem to satisfy it we have trouble. We can design a ‘backup’ program which putsall the data onto tape, and which uses sophisticated error checking and redundancyto make sure the saved data are secure. We can even design a user interface which isresilient to mistakes on the operator’s part, but which is so clear that such mistakesnever happen. But all this is to no avail if the operator does not put the backup tapeinto the system! Traditional specifications say what happens, but do not mentionwho is responsible for making it happen.
Consider the following statements:
Hotel rules: the guests are to be in the hotel by midnightPrison rules: the inmates are to be locked in their cells from 9pm to 6am
The two statements are similar in form, and their propositional meanings are almostidentical. If we swap a few words they transform into one another. However, fromcontext we know that the first statement expresses a requirement on the hotel guests,whereas the second expresses a requirement on the prison warders.

608 Chapter 17 n Models of the system
Deontic logics address these issues by including the concept of responsible agents(human, corporate and computer) and the mutual responsibilities between them.The most common deontic operators are permission (per) and obligation (obl).These both take two arguments: the first is who has the permission or obligation, andthe second what it is they are permitted or obliged to make true. For example, we canrefine the temporal logic statement about printing including these operators. Theagents are the user ‘Jane’ and the laser printer ‘lp3’:
owns(Jane, file ‘fred’) fi per(Jane, request(Jane, ‘print fred’))request(Jane, ‘print fred’) fi obl(lp3, prints the file ‘fred’)
The first formula says that if Jane owns the file ‘fred’ then she is permitted to requestthe command ‘print fred’. The second says that if she requests the command, then theprinter is obliged to print ‘fred’. The first statement is a little clumsy because it hasto be phrased in terms of the proposition request(Jane, ‘print fred’). If we also includethe idea of actions, such as request(‘print fred’), which can be performed (performs) byagents, then the requirements can be rephrased using a modified obligation operator:
owns(Jane, file ‘fred’) fi per(Jane, request(‘print fred’))performs(Jane, request(‘print fred’)) fi obl(lp3, print (the file ‘fred’))
Such a statement is not far different from the statement of the requirements inEnglish, and makes quite clear the balance of responsibility.
Deontic logics are becoming popular in requirements engineering. It is thus pos-sible that as an interface designer, you may be asked to produce a system whichsatisfies some (suitably explained) deontic specification. Even if this is not the case,it is worth noting, formally or informally, exactly what expectations you have of yourusers. In practice, one ought to work with several levels of expectation. For example,if you are designing an automatic bank teller, it may be true that customers areobliged to use only their own cards, and to use them in a particular fashion.However, you do not want the system to crash too terribly if a customer does notbehave in this fashion. As interactive systems begin to involve more than a single user (see Chapters 14 and 19), it becomes more important to keep track of theseresponsibilities and freedoms, who must do what and who can do what. If the userof a single-user system does not behave in the ‘obliged’ fashion then the impact ispersonal (although not necessarily acceptable). However, in a multi-user system, wewant to restrict the bad effect on others – the system should still maintain its obliga-tions to them and allow them to perform those things they are permitted to do.
INTERACTION MODELS
Interactive systems ought to be ‘what you see is what you get’ (WYSIWYG), consistent,have a universal undo facility . . . the list goes on. But, if a supplier says that its wordprocessor ‘Sludge-Word’ is WYSIWYG, how do we test this? The screen fonts lookvery impressive, but are they the same as on the page? Perhaps the system appears
17.3

17.3 Interaction models 609
WYSIWYG for simple jobs but this breaks down when things become more com-plex. What does WYSIWYG really mean?
It was to address these issues that the methodology described in this section wasdeveloped. Whereas the formal notations described in Section 17.2 describe specificsystems, the aim in this section is to define interaction models, which are generic, formal models of interactive systems. Using such a generic model, one can defineprinciples in a formal way which are then applicable to a range of systems. In particu-lar, by regarding Sludge-Word as an instance of the general model we can verify (or refute) some of its supplier’s claims.
The particular model we will describe, the PIE model, was designed to attackWYSIWYG-like properties. It would be nice to say that after reading this section, youwill know exactly what WYSIWYG means. Unfortunately, it is too wide and varied aterm to be formalized. However, we will describe several principles from Chapter 7,more limited in scope, which can be formalized. Of these some cover areas within thegeneral area of WYSIWYG, namely observability – what you can tell about the cur-rent state of the system from the display – and predictability – what you can tell aboutits future behavior. In addition, we will define principles concerning the control ofthe system by the user, such as reachability – you can get anywhere from anywhere –and undo – the ability to perform backwards error recovery.
As we mentioned in Chapter 7, we certainly cannot define ‘usability’ totally; wecannot say that if a system obeys a set of formal principles then it will be usable.Nevertheless, some of the formal principles are necessary for usability: any systemwhich breaks them is bound to have problems. The formal principles form a ‘safetynet’ to prevent some of the worst mistakes in an interactive system, but do not ensurea good design. That depends on a good designer.
This ‘safety net’, although valuable, is not the principal benefit of using interactionmodels. Their chief value lies in the insights gained by considering properties ofinteraction, away from the surface clutter of real or imagined systems. These insightsbecome part of the background with which you approach new areas, whether or nota formal approach is explicitly taken there. Furthermore, some of these insights canbe abstracted into informal principles, which, though derived by formal analyses,can, once stated, be justified in their own right. It is a strange paradox that some ofthe informal concepts, which are obtained by such formal analysis, are not them-selves fully formalizable.
17.3.1 The PIE model
The PIE model is a black-box model. It does not try to represent the internal archi-tecture and construction of a computer system, but instead describes it purely in terms of its inputs from the user and outputs to the user. For a simple single-usersystem, typical inputs would be from the keyboard and mouse, and outputs wouldbe the computer’s display screen and the eventual printed output (Figure 17.2).
The difference between the ephemeral display of a system and the permanentresult is central to the PIE model. We will call the set of possible displays D and the

610 Chapter 17 n Models of the system
set of possible results R. In order to express principles of observability, we will wantto talk about the relation between display and result. Basically, can we determine theresult (what you will get) from the display (what you see)?
For a formal statement of predictability it helps (but is not essential) to talk aboutthe internal state of the system. This does not counter our claim to have a black-boxmodel. First, the state we define will be opaque; we will not look at its structure,merely postulate it is there. Secondly, the state we will be discussing is not the actualstate of the system, but an idealization of it. It will be the minimal state required toaccount for the future external behavior. We will call this the effect (E). Functions dis-play and result obtain the current outputs from this minimal state:
display : E → Dresult : E → R
The current display will be literally what is now visible. The current result is actuallynot what is available, but what the result would be if the interaction were finished.For example, with a word processor, it is the pages that would be obtained if oneprinted the current state of the document.
A single-user action we will call a command (from a set C). The history of all theuser’s commands is called the program (P = seq C), and the current effect can be calculated from this history using an interpretation function:
I : P → E
Arguably the input history would be better labeled H, but then the PIE model wouldlose its acronym! If we put together all the bits, we obtain a diagram of sets and functions (Figure 17.3), which looks rather like the original illustration.
In principle, one can express all the properties one wants in terms of the inter-pretation function, I. However, this often means expressing properties quantifiedover all possible past histories. To make some of the properties easier to express, wewill also use a state transition function doit :
doit : E × P → E
Figure 17.2 Inputs and outputs of a single-user system
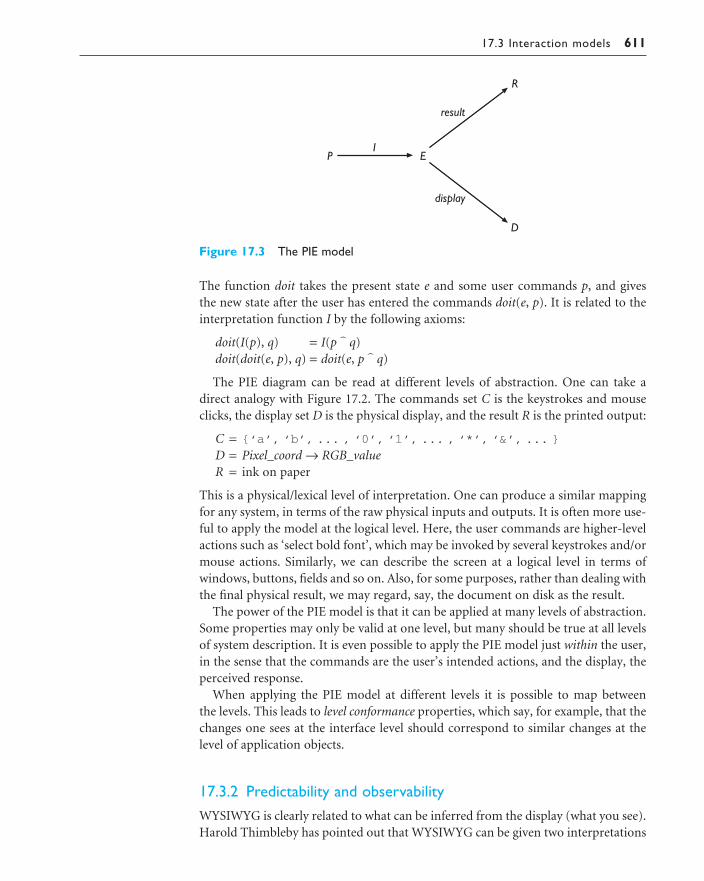
17.3 Interaction models 611
The function doit takes the present state e and some user commands p, and gives the new state after the user has entered the commands doit(e, p). It is related to theinterpretation function I by the following axioms:
doit(I(p), q) = I(p ^ q)doit(doit(e, p), q) = doit(e, p ^ q)
The PIE diagram can be read at different levels of abstraction. One can take adirect analogy with Figure 17.2. The commands set C is the keystrokes and mouseclicks, the display set D is the physical display, and the result R is the printed output:
C = {‘a’, ‘b’, ... , ‘0’, ‘1’, ... , ‘*’, ‘&’, ... }
D = Pixel_coord → RGB_valueR = ink on paper
This is a physical/lexical level of interpretation. One can produce a similar mappingfor any system, in terms of the raw physical inputs and outputs. It is often more use-ful to apply the model at the logical level. Here, the user commands are higher-levelactions such as ‘select bold font’, which may be invoked by several keystrokes and/ormouse actions. Similarly, we can describe the screen at a logical level in terms of windows, buttons, fields and so on. Also, for some purposes, rather than dealing withthe final physical result, we may regard, say, the document on disk as the result.
The power of the PIE model is that it can be applied at many levels of abstraction.Some properties may only be valid at one level, but many should be true at all levelsof system description. It is even possible to apply the PIE model just within the user,in the sense that the commands are the user’s intended actions, and the display, theperceived response.
When applying the PIE model at different levels it is possible to map between the levels. This leads to level conformance properties, which say, for example, that thechanges one sees at the interface level should correspond to similar changes at thelevel of application objects.
17.3.2 Predictability and observability
WYSIWYG is clearly related to what can be inferred from the display (what you see).Harold Thimbleby has pointed out that WYSIWYG can be given two interpretations
Figure 17.3 The PIE model

612 Chapter 17 n Models of the system
[342]. One is what you see is what you will get at the printer. This corresponds tohow well you can determine the result from the display. The second interpretation iswhat you see is what you have got in the system. For this we will ask what the displaycan tell us about the effect. These can both be thought of as observability principles.
A related issue is predictability. Imagine you have been using a drawing packageand in the middle you get thirsty and go to get a cup of tea. On returning, you are facedwith the screen – do you know what to do next? If there are two shapes one on topof the other, the graphics package may interpret mouse clicks as operating on the ‘top’shape. However, there may be no visual indication of which is topmost. The screenimage does not tell you what the effect of your actions will be; you need to rememberhow you got there, your command history. This has been called the ‘gone away for acup of tea problem’. In fact, the state of the system determines the effects of any futurecommands, so if we have a system, which is observable in the sense that the displaydetermines the state, it is also predictable. Predictability is a special case of observability.
We will attempt to formalize these properties. To say that we can determine theresult from the display is to say that there exists a function transparentR from displaysto results:
E transparentR : D → R •A e e E • transparentR(display(e)) = result(e)
It is no good having any old function from the display to the result; the second halfof the above says that the function gives us exactly the result we would get from thesystem. We can call this property result transparency.
We can do a similar thing for the effect, that is the system state:
E transparentE : D → E •A e e E • transparentE(display(e)) = (e)
We can call this property simply transparency.What would it mean for a system to be transparent in one of these senses? If the
system were result transparent, when we come back from our cup of tea, we can lookat the display and then work out in our head (using transparentR) exactly what theprinted drawing would look like. Whether we could do this in our heads is anothermatter. For most drawing packages the function would be simply to ignore themenus and ‘photocopy’ the screen.
Simple transparency is stronger still. It would say that there is nothing in the stateof the system that cannot be inferred from the display. If there are any modes, thenthese must have a visual indication; if there are any differences in behavior betweenthe displayed shapes, then there must be some corresponding visual difference. Evenforgetting the formal principles, this is a strong and useful design heuristic.
Unfortunately, these principles are both rather too strong. If we imagine a wordprocessor rather than a drawing package, the contents of the display will be only a bitof the document. Clearly, we cannot infer the contents of the rest of the document(and hence the printed result) from the display. Similarly, to give a visual indicationof, say, object grouping within a complex drawing package might be impossible (andthis can cause the user problems).

17.3 Interaction models 613
When faced with a document on a word processor, the user can simply scroll thedisplay up and down to find out what is there. You cannot see from the current displayeverything about the system, but you can find out. The process by which the user ex-plores the current state of the system is called a strategy. The formalization of a strategyis quite complex, even ignoring cognitive limitations. These strategies will differ fromuser to user, but the documentation of a system should tell the user how to get at per-tinent information. For example, how to tell what objects in the drawing tools aregrouped. This will map out a set of effective strategies with which the user can work.
Ideally, a strategy for observing the system should not disrupt the state of theapplication objects, that is the strategy should be passive. For example, a strategy for looking at a document which involved deleting it would not be very useful. This seems almost too obvious, but consider again grouping in drawing tools. Oftenthe only way to find out how a grouped object is composed is to ungroup it piece by piece. You then have to remember how to put it back together. The advantage of a passive strategy becomes apparent.
Using such a strategy then gives one a wider view of the system than the display.This is called the observable effect (O). In a word processor this would be the com-plete view of the document obtained by scrolling plus any current mode indicatorsand a quick peek at the state of the cut/paste buffer. The observable effect containsstrictly more information than the display, and hence sits before it in a functionaldiagram (Figure 17.4).
We can now reformulate principles in terms of the observable effect. First of all thesystem is result observable if the result can be determined from the observable effect:
E predictR : O → R •A e e E • predictR(observe(e)) = result(e)
This says that the observable effect contains at least as much information as theresult. However, it will also contain additional information about the interactivestate of the system. For example, you will observe the current cursor position, butthis has no bearing on the printed document.
So you know what will happen if you hit the print button now. Refreshed from yourcup of tea, you return to work. You press a function key which, unknown to you, isbound to a macro intended for an entirely different application. The screen rolls, the
Figure 17.4 The observable effect
614 Chapter 17 n Models of the system
disk whirrs and, to your horror, your document and the entire disk contents aretrashed. You leave the computer and go for another drink . . . not necessarily of tea.
A stronger condition is that the system be fully predictable:
E transparentE : O → E •A e e E • predict(observe(e)) = (e)
This says that you can observe the complete state of the system. You can then (in theory) predict anything the system will do. If the system were fully predictable, you would be able to tell what the bindings of the function keys were and hence(again in theory) would have been able to avoid your disaster.
This is as far as this bit of the formal story goes in this book. However, there aremore sophisticated principles of observability and predictability which take intoaccount aspects of user attention, and issues like keyboard buffers. Formalisms suchas the PIE model have been used to portray other usability principles discussed inChapter 7. Principles of predictability do not stand on their own; even if you hadknown what was bound to the function key, you might still have hit it by accident,or simply forgotten. Other protective principles like commensurate effort need to beapplied. Also, although it is difficult to formalize completely, one prefers a systemthat behaves in most respects like the transparency principles, rather than requiringcomplicated searching to discover information. This is a sort of commensurate effortfor observation.
Worked exercise A two-function calculator has the following buttons: 0–9, +, − and =. These would comprisethe command set (C) of a PIE model of the calculator. The state (E) would consist of threecomponents: the two current numbers being entered, the last number (to be operated on) andthe pending operation (+ or −). The display (D) is simply a signed number. For this example,ignore the result.
Write down (semi-formally) the doit function updating the state for each user command andthe display function relating the state (E) to the current display (D). To check your definitions:what does the display have on it after the user has entered ‘2 + 3 +’? Most calculators wouldshow 5; does yours?
Consider the displays after the sequences ‘2 + 2’ and ‘2 +’ and the effect on each of the addi-tional user input of 3. Does the calculator satisfy the transparency property?
Answer The definition of the doit function could proceed as follows. We will use the Z notationin this sample answer. The character set is defined as
C == 0 | 1 | 2 | 3 | 4 | 5 | 6 | 7 | 8 | 9 | 0 | + | − | =
It will be useful to distinguish the digits and operations (+ and −):
ÆDigit : PCÆOp : PC«__________________ÆDigit = { 0, 1, 2, 3, 4, 5, 6, 7, 8, 9, 0 }ÆOp = { +, − }

17.3 Interaction models 615
The state is defined as an ordered 4-tuple, consisting of the current number beingentered, the last number (to be operated on) and the pending operation:
E == seq Digit × seq Digit × Op
The display is simply a projection of the current number being entered:
D == seq DigitÆdisplay : E → D«________________ ÆA (current,last,op) : E •Æ display(current,last,op) = current
The doit function is defined below by case exhaustion. The notation o(c, l ) means toapply operation o to the arguments c and l, so that 2 + 3 would be written + (2, 3), witho = +, c = 2 and l = 3.
Ædoit : E × C → E«__________________________ÆA c, l : seq Digit; d, d ′ : Digit; o, o′ : Op •Æ doit((c, l, o), =) = (o(c, l ), 0, o)Æ doit((c, l, o), d ) = (d, c, o) if lastkey e {+, −, =}Æ (10c + d, l, o) otherwiseÆ doit((c, l, o), o′) = (o(c, l ), c, o′)
The following table traces the execution of the calculator:
C E D
(0,0,+) 02 (2,0,+) 2+ (2,2,+) 23 (3,2,+) 3+ (5,3,+) 5
Compare the trace tables for the ‘programs’ 2 + 3 and 2 + 23:
Notice that the display after the program 2 + is the same as it is after the program 2 + 3,yet the behavior of the subsequent 3 command is different. Therefore, the calculator asdefined does not satisfy the transparency property. Can you do better?
C E D
(0,0,+) 02 (2,0,+) 2+ (2,2,+) 22 (2,2,+) 23 (23,2,+) 23
C E D
(0,0,+) 02 (2,0,+) 2+ (2,2,+) 23 (3,2,+) 3
616 Chapter 17 n Models of the system
17.3.3 Reachability and undo
In Chapter 16, we discussed connectivity issues for dialogs. We could check a dialogdescription to see if there were any blind alleys, which once you had chosen them,would never let you back to the rest of the dialog. Systems can have similar problemsat a semantic level.
In a commercial program debugger used by one of the authors, there is a windowlisting all the variables. If a variable is a complex structure, then hitting the ‘insert’key while the cursor is over the variable will expand the variable showing all its fields. If you only want a few of the fields to be displayed, you can move the cursorover the unwanted fields and press the ‘delete’ key and the field is removed. Theseoperations can be repeated over complex hierarchical structures. If you remove a field and then wish you had not, you can always press ‘insert’ again over the main variable and all the fields will be redisplayed. Even this breaks somewhat theprinciple of commensurate effort, but worse is to come. The ‘delete’ key also works for top-level variables, but once one of these is removed from the display there isnothing you can do to get it back, short of exiting the debugger and rerunning it from scratch.
A principle that stops this type of behavior is reachability. A system is reachable iffrom any state the system is in, you can get to any other state. The formal statementof this is as follows:
Ae, e′ e E • (E p e P • doit(e, p) = e′)
Unlike the predictability principles, there are no awkward caveats. The only pro-blem is that, if anything, it is too weak. For instance, a word processor could have a delete key, but no way to move the cursor about, so you always type at the end ofthe document. Now you can, of course, get from any document state to any other,you simply delete the whole text and retype what you want. However, if you had just typed in a whole letter and then noticed a mistake on the first line, you wouldnot be pleased! So, ideally, one wants an independent idea of ‘distance’ betweenstates and to make the difficulty of the path between them commensurate with thedistance – small changes should be easy. Despite this, the principle on its own wouldhave been strong enough to prevent the behavior of the debugger!
One special case of reachability is when the state you want to get to is the one youhave just been in, that is undo. We expect undo to be easy, and ideally have a singleundo button that will always undo the effect of the last command. We can state thisrequirement very easily:
Ac e C • doit(e, c ^ undo) = e
This says exactly what we wanted. We start in a state e. We then do any command c and follow it by the special command undo. The state is then the same as we began in.
Stop! Before patting ourselves on the back for so clearly defining undo, we shouldcheck that this requirement for undo is consistent. Indeed, it is consistent – so longas there are at most two states. That is, the above undo requirement is only possible

17.3 Interaction models 617
for systems which do virtually nothing! The reason for this is that undo is itself acommand and can undo itself. Take any state e and choose any command x. Let ex
be the state you get to after command x. That is ex = doit(e, x). Now we can apply theundo requirement to state ex:
doit(ex, undo) = doit(e, x ^ undo) = e
So, the undo command in state ex gets us back to e. That is as expected. But what doesundo do if we are in state e? Again we can employ the undo principle rememberingthat e = doit(ex, undo):
doit(e, undo) = doit(ex, undo ^ undo) = ex
This uses the undo principle when the command c is undo itself. However, ourchoice of command x was arbitrary, so if we had chosen another command, say y, we would have concluded that doit(e, undo) = ey . This means that ex = ey, and in general anything we do from state e gets us to the same state. So at most we have two states, a toggle, with all the commands flipping back and forth between them.The only alternative is that the system does nothing.
We will not go on to describe the details of better undo requirements, the inter-ested reader can find that elsewhere. The basis of most workable undo systems is thatundo is not just any old command, but is treated differently. The simplest fix to theabove undo principle is to restrict the commands to anything except undo!
The lesson from the above is clear. It is easy to say you want something whichsounds quite reasonable. A formal description of the requirement may well revealthat, as in the case of undo, it is inconsistent – that is, no system could be built whichsatisfies the requirement.
17.3.4 Other interaction models
The PIE model was the inspiration for a wide variety of different models. Some of these are similar, but take a slightly different standpoint. For example, one modelhas results only available at some states. This actually corresponds to the intuitionthat a printed document is only available when you invoke the print function, or that an updated file is only available in the file system when you ask the editor tosave. However, that model also only had the display available at some states – lessintuitive.
There is also a range of models focussed at specific domain areas. The PIE modelis a very general model of deterministic single-user systems. Other models addressareas including:
Windowed systems This model describes the interference properties between windows. The distinctive feature is that the user is effectively regarded as havingdifferent personae when interacting with different windows. This reflects theobservation that when swapping between tasks (associated with windows), theuser should not have to keep track of dependencies and is therefore acting likeseveral users.
618 Chapter 17 n Models of the system
Timing What happens when the system is not fast enough and the user’s actionsget ahead of the system’s responses? The formal model describes the relationshipbetween the steady state behavior – what would happen if the machine wasinfinitely fast and there were no delays – and the actual temporal behavior. This analysis has highlighted deficiencies in the input–output model of windowmanagers and operating systems.
Attention This looks at ways of describing which parts of the display and result areused during any particular task. It uses templates for both, which model the select-ive attention during the task. The designer states what the expected templates arefor any task, and then salience of the templates can be verified by experiment.These can then be tested using psychological experiments.
Non-determinism If you are ignorant of certain information in a system, it mayappear to behave non-deterministically. Many properties of different models, forexample the predictability of PIEs, map onto problems of non-determinism.Methods of handling this non-determinism from one domain can then suggestsimilar methods in what would otherwise appear disparate areas. The fact that supposedly deterministic interfaces often appear random suggests that,where it is helpful for other purposes, the interface can be made deliberately non-deterministic.
Dynamic pointers Interface objects often have special positions, such as the cursoror marked blocks. They may also have pointers into them, such as hypertext links.Dynamic pointers are a formalism that describes such positional information in auniform manner. In particular, they help to manage the changes in pointers as theunderlying object is updated. They also describe the mapping between positionalinformation at different levels, for example when mapping mouse positions onthe screen to their appropriate positions in application objects.
These are all principally single-user models. However, there has been some workin applying these formal models to group systems (such as those in Chapter 19). Inparticular, this has led to significant new insight into the meaning of undo in a groupcontext.
CONTINUOUS BEHAVIOR
Although many of the systems and interfaces studied in rich media and in novelinterfaces embody continuous real-time interaction, there are few models of this inthe HCI literature. Possibly this is because of the conceptual dominance of discretemodels. At a low level, computer systems are clearly discrete with step-by-step pro-grams and users’ actions being converted into streams of events. Even apparentlysmooth actions like dragging a mouse are treated as a series of individual ‘mouse hasmoved’ events.
17.4

17.4 Continuous behavior 619
There are two types of continuity:
continuous values – for example, the measurement of a weight;
continuous time – for example, a switch that could be sampled at any time.
Many sensors have both these properties: for example, the temperature of a room is both a continuous value and can be sampled at any time. It is the latter of thesethat we will consider in this section, as many standard notations such as Z deal withcontinuous values, whereas continuous time is less common.
In this section we will first look again at the PIE model and see how it can beextended to deal with mouse location.
17.4.1 Dealing with the mouse
The PIE model is very asymmetric between input and output. Some sorts of out-put are difficult to deal with, for example a beep used when something goes wrong.This is not clear in the formalism itself, but if we look at the principles, it is obviousthat the display is expected to be persistent. If you go away and have a cup of tea, thedisplay is still there when you get back. The beep is not. On the input side, mousemovement is not easy: one can regard each movement as being a command in C, but this is unnatural. Certainly, the user would not be conscious of each pixel movement!
A beep is similar to a keystroke: each is an event. The mouse’s position is similarto the screen: they both have an observable value at any moment – we say each ofthem is a status. The PIE model is then an event-in/status-out model: the user doesevents (from C) and the system responds with a status (display). This suggests vari-ations of the PIE model that have different combinations of event and status.
One version has events and status for its input, but still a purely status output(any-in/status-out). The (single command) state transition function then dependson both the command and the current mouse position (M):
doit : E × C × M → E
The display function is now not just a function of the state, but it too depends on themouse position:
display : E × M → D
This allows for the display to include the mouse cursor, which moves with the mouse(pretty obvious really) and also allows for the change in the display when the mousedrags an object.
This model only describes a special subclass of systems, those that are trajectoryindependent. The mouse position only has a permanent effect at the moment a command (keystroke or mouse button) happens; the intermediate positions are forgotten. For example, the model cannot describe freehand drawing. It is possibleto extend the model to include more general systems; however, the subclass is

620 Chapter 17 n Models of the system
interesting in itself. With the exception of drawing and similar tasks, such as ‘air-brush’ painting, most mouse-based systems are trajectory independent.Furthermore, the few that are not exhibit usability problems, suggesting that trajectory dependency is itself a general usability principle for all but exceptional situations.
17.4.2 Formal aspects of status–event analysis
Probably the earliest continuous time models in the formal user interface literatureare the variants of status–event analysis [94,102] of which the variant of the PIEmodel above is a simple example. Status–event analysis (S–E) distinguishes eventsthat occur at specific moments of time from status phenomena that have (typicallychanging) values over a period of time. Examples of events include keystrokes, beeps, and the stroke of midnight in the story of Cinderella. Examples of status phenomena include the current computer display, the location of the mouse pointer,the internal state of the computer and the weather. We will discuss status–event analysis in more detail in Chapter 18; here we will just look at the more formalaspects.
Perhaps one of the most significant features of S–E is its treatment of interstitialbehavior. Whereas discrete models focus solely on what happens at the momentswhen events occur, S–E puts equal emphasis on the more fluid interaction betweenevents. In many GUI systems this is what gives the ‘feel’ of interaction, for example,dragging, scrolling, etc., and in rich media this is likely to be the main purpose ofinteraction!
Status–event analysis is really a conceptual framework for viewing interaction, but does have several concrete models, both descriptive models (variants of the PIE)and specification notations. These all have the general form of a state-transition styledescription of events and a more continuous description of interstitial behavior:
action:user-event × (current/history of) input-status × state
→ response-event × (new) stateinterstitial behavior:
(current/history of) input-status × state → output-status
The treatment of the input status at events and during interstitial behavior distin-guishes interactions of markedly different kinds, for example, the trajectory depend-ency described above (Section 17.4.1).
Another crucial aspect of S–E, which is not apparent in discrete systems, is status-change events. These occur when a status phenomenon crosses some form of triggerthreshold. For example, when a temperature reaches some value, or the time (on theclock) is a certain time. The nature of these thresholds is application dependent andmay be dynamic. Furthermore, there are a whole range of issues about how status-change events become system-level events: polling, active sensors, etc. Typically, atan abstract level of specification one would just say ‘when this happens . . .’, but as

17.4 Continuous behavior 621
this becomes operationalized these issues of mechanism surface. We will see more ofhow these status-change events propagate in Chapter 18.
17.4.3 Making everything continuous
In engineering and physics, the idea of modeling continuous behavior being a special problem would seem strange. In those fields, and in real life, continuous phenomena are normal – discrete things are the exception. For example, you mayrecall, from high school physics, the equations of an object moving under gravity:
Objects in virtual worlds have to have similar behavior, and Wüthrich [384] has usedgeneral versions of this kind of equation from cybernetic systems theory to modelvirtual reality systems:
statet = φ ( t, t0, statet0, inputs during [t0,t) )outputt = η ( statet )
The difference between this and the S–E description is largely representational,although it should be noted that the state is different. In the S–E description the‘state’ attempts to ignore the ephemeral changes during the interstices, whereas the systems theory model incorporates this (for example, that the mouse is at a particular position now). Both forms of state seem appropriate depending on the circumstances and can be incorporated as alternative views or levels of description.
Notice that the systems theory definition treats events on a par with status phe-nomena; both are merely part of an ‘inputs at time t’ and there is no equivalent ofthe action description when an event occurs. However, when viewed as functions of time, event phenomena have values only at a few points of time and for most ofthe time have some sort of special ‘not happening now’ value. There is a history ofdealing with event phenomena in this way in applied mathematics where ‘impulse’events, such as a voltage spike or collision, are modeled using Dirac delta functions,functions that are infinitely large for an infinitesimally short time.
This ‘treat everything as continuous’ leads to more complicated and less clear ways of expressing things, just as solely event-based formalisms do. The natural wayof describing the world includes both status and event phenomena. In fact, whenapplying systems theory to a real example Wüthrich finds it more convenient todescribe event phenomena as timestamped values – that is, even if the model has noevents you are forced to invent them to deal with real examples!
17.4.4 Hybrid models
This problem of merging event-based and continuous status behavior arises in other areas of computing where control systems interact with real physical sys-tems such as industrial controllers or fly-by-wire aircraft. There is a whole range
d
d
d
d
x
tv
v
tg x vt gt = = − = −
1
22

622 Chapter 17 n Models of the system
of notations and methods for dealing with these ‘hybrid systems’ [158]. On thewhole, this community has a largely dualist model of the world, with discrete computer systems interfacing with a continuous environment defined by differentialequations.
This sort of model has been adopted by a few researchers in HCI. For example, the TACIT project [339] studied a variety of continuous-time interactive systemsand also considered modeling using hybrid high-level Petri nets [229]. As we saw inChapter 16, Petri nets allow us to express concurrent behavior, but have discretebehavior with tokens moving between places at transitions (event points). Thehybrid Petri nets include ‘continuous transitions’, which are effectively a form ofinterstitial behavior.
A similar variant of hybrid Petri nets has been used to develop component/interactor models (see Figure 17.5) intended to model objects in virtual environ-ments [379]. These interactors have both discrete and continuous output and inputand a threshold on discrete input, which produces status-change events. Less clearfrom the figure, but evident in the Petri net specifications, is that there can be directcontinuous connections between continuous input and output (status–status rela-tions) controlled by the enable/disable switch.
17.4.5 Broad issues: granularity and Gestalt
It is clear that time can be divided almost arbitrarily (at least to the Planck time of about 10− 43 of a second). However, we constantly divide it into discrete units:Monday, Tuesday, July, yesterday, today, next year. We talk about things happen-ing at a particular time (the clock struck at noon), but, of course, nothing happensinstantaneously (how long do the chimes last?). In day-to-day speech we managethese ambiguities, but as we formalize time, whether in computer tools or in formal notations, we have to try to make these precise.
Studies of the use of electronic calendar systems highlight this problem [283].Although users think in terms of ‘let’s meet in the afternoon’, the system forces
Figure 17.5 Continuous interactor from [379]. Source: © Springer-Verlag BerlinHeidelberg 2001

17.4 Continuous behavior 623
you to give meetings precise start and end times ‘3pm–4:30pm’. In addition, manycalendar systems regard time as being made of discrete days with continuous timeswithin. Try creating an agenda item for an overnight plane flight! There has beensome work on formalizing times like ‘I’ll do this today’ (in the next 24 hours, beforemidnight), but it is still in its infancy [204].
The issue of things happening at precise times means that we have to be constantlycareful when we talk about an interval of time such as 3pm to 4pm; do we mean to include both 3pm and 4pm, or do we mean from 3pm up to but not including4pm? In mathematics these are called closed (when the end point is included) or open (when the end point is not included) intervals. Note that in the systems theory equations in Section 17.4.3 the formulae included ‘inputs during [t0,t)’. Thesquare and round brackets are conventionally used to distinguish these boundarieswhere square brackets mean ‘including the end’ and round brackets mean ‘exclud-ing the end’. So the interval ‘[t0,t)’ means ‘all times including t0 and up to, but notincluding, t ’.
This precision is needed to ensure that when we describe things we do not acci-dentally ‘leave out’ the moment of time between two intervals, or accidentally haveintervals overlap by one moment when we mean them to be disjoint. For example,in Section 17.4.3, if the definition had been ‘inputs during [t0,t]’ it would have meantthat the state and output of a system at a particular moment depended on the inputsat that precise moment. This would have allowed a causal cycle if two such systemswere interacting where the output of one depended on the current output of theother and vice versa. The definition given cuts this potential knot by saying that thestate depends only on past inputs, but can take into account those arbitrarily recentlyin the past.
The ambiguity of end points is also problematic if we need to ‘parse’ continuousmedia, for example in speech interfaces, gesture recognition, or determination ofcontext in ubiquitous computing. In all these cases, we find that continuous mediaexhibit temporal Gestalt phenomena: the higher-level units such as words, or con-texts, only have meaning over time and do not have clear boundaries. Consider gesture recognition – the movement only has meaning once complete; music – themelody is only a melody whilst being played; even graphics get meaning throughmovement [19]. This is rather like the fact that the typed characters ‘d’, ‘i’, ‘r’, ‘carriage-return’ only mean ‘list directory’ when considered as a whole. The maindifference is that the boundaries are clearer in the case of discrete phenomena – thegesture has no definitive start or end, although an end point would be made concreteby actual recognition software.
One final thing to note about the notations and models for continuous interactionis how similar they are. This is perhaps because the physical world is largely continu-ous and so there are fewer ‘choices’ to be made in modeling it. However, at anotherlevel human discourse and language is discrete: we use a finite lexicon of words andsentences. So at some level the sorts of difficulties discussed above merely reflect thetension between the world of physical actions and the fundamental nature of humanlanguage.

624 Chapter 17 n Models of the system
SUMMARY
This chapter has focussed on modeling the deeper semantic behavior of an interac-tive system. To design a usable system one needs to know what it does!
We began by looking at different kinds of software engineering formalisms thatcan be used to specify the behavior of specific systems. These specifications can be used for communication between designer and implementor, and for analysis.Model-based specifications define the state of the system, the invariants, which must always be true, and the operations that change the state (usually as the result of user actions). Algebraic specifications describe the system in terms of the rela-tionships between operations. Both can suffer from incompleteness, where one hasnot specified enough to determine the behavior. In particular, it is as important to say what does not change as what does – the framing problem. Both of these concentrate on step-by-step changes that the user can perform on the system.Temporal logics allow you to specify properties such as ‘it is always possible to quit’,and deontic logics allow you to talk about permitted actions and other issues ofresponsibility.
In Section 17.3 we considered interaction models, in particular the PIE model.This type of model addresses classes of system rather than specific designs, allowingus to describe general properties such as predictability (the ‘gone away for a cup oftea problem’), observability (what can we tell about the state of the system from its display?) and reachability (whether there are any dead ends from which we cannever return). We looked at the issue of undo and how the PIE model allowed us todiscover that the apparently obvious meaning of undo was, in fact, inconsistent. Aswell as the very general PIE model, more specific interaction models address issuessuch as timing properties and user attention.
Finally, we looked at continuous time phenomena. This included a variant of thePIE model for dealing with dragging and similar mouse-based interactions. At amore general level, the formal concepts of status–event analysis show that bothmajor changes at events and the more continuous interstitial behavior betweenevents are important. Other models based on systems theory and hybrid systemseither have similar constructs, or are forced to create them when dealing with realproblems. We need to deal with the relationship between the ‘soft’ ideas of time inday-to-day life (‘let’s meet this afternoon’) and the hard-edged formal ideas of time(‘starting at 3pm and continuing until, but not including, 4:30pm’), but this is stilllargely an open problem.
17.5

Exercises 625
EXERCISES
17.1 Using the model-oriented approach with the example graphics program described inSection 17.2.3, specify the move operation as a schema which acts on the currently selectedobjects. Is the operation you have defined cumulative (two successive moves can be done as onemove which is the sum of the other two) or is it ‘forgetful’? Discuss the implications of the fram-ing problem in your definition.
17.2 Write a similar schema for Resize. It should have the following informal semantics. The width andheight attributes are of the shapes bounding box. The resize operation should make one cornerof the bounding box be at the current mouse position (supplied as the argument current_pos?).
Hint: The width of a box is twice the difference between the x coordinate of the center and thex coordinate of any corner:
wid = 2 × | center.x − corner.x |
17.3 In Section 17.2.5, we said that the specification Algebraic–draw could be extended to say that amove, resize or unselect after a delete has no effect. The axiom for unselect looks like this:
(9) unselect(delete(g)) = delete(g)
Write two more axioms (10) and (11) which say the same about move and resize. Now useaxioms (4) and (5) to show that (9) implies both your new axioms.
17.4 Imagine a normal calculator except that it displays A for 0, B for 1, up to J for 9. So the number372 would appear as DHC. Does this affect the formal transparency of the calculator? Should it?
17.5 To some extent undo is similar to the ‘back’ command or button found in many web browsers,help systems and hypertext systems. Is the ‘back’ button on a browser just like undo?
Hint: Consider scenarios where the pages are web forms updating a database.
17.6 Experiment with the ‘back’ button on different browsers, help systems, etc. Record systematicallythe behavior as you visit pages and use the ‘back’ button, and try to build a model (informal orformal) of the system. Pay particular attention to what happens if you revisit the same page duringthe same ‘drill down’ and the behavior in systems with multiple windows/frames. (Note that thisbehavior does differ dramatically even between different versions of the same web browser.)
17.7 Sections 17.2.1 and 17.2.2 give two reasons for using formal methods in HCI: communication andanalysis. These are focussed on the sort of mathematical models found in this chapter. However,there are other sorts of ‘formal’ modeling in HCI: dialog notations are formal models of the syntax of the human–computer conversation, hierarchical task analysis is a formalization of thetask structure, some cognitive models are effectively formal models of the user’s mind.
(a) Are communication and analysis reasons for using these other sorts of formalism?(b) Can you think of other reasons why you would or would not use formalisms?(c) Try to use these pros and cons to formulate issues in the choice of appropriate forms of
formal model and analysis.
17.8 This exercise is based on the mobile phone scenario on the book website at: /e3/scenario/phone/
List the main elements of the state of the phone (you can use programming language variable declarations for this) and then write down a step-by-step walkthrough of the state as the useraccesses a shortcut at position ‘3’ as in steps C.1–C.10 of scenario C.

626 Chapter 17 n Models of the system
17.9 This exercise is based on the nuclear reactor scenario on the book website at: /e3/scenario/nuclear/You will need to refer to this while completing the exercise.
The exercise is in four parts, but you will probably find it easier to work on them in parallel. Asyou try to define actions you will find state elements you have missed, and as you work throughthe scenarios you will probably find problems that you need to go back and change in the stateand actions.
(a) Complete the following partial description of the state of the nuclear control panel.»____________________________________________ÆÆAlarm_State: {Green, Amber, TempRed, Red}
ÆÆConfirm_Needed: Boolean [ that is true or false]
ÆÆTarget_Pressure: Nat [ that is { 0, 1, 2, ... } ]
ÆÆTarget_Temp: Nat
ÆÆTarget_Flow: Nat
ÆÆManual_Override_Value: NatÆÆ...–Æ____________________________________________
(b) Here is a description of the state change for two actions: when a digit is pressed on the key-pad and when the ‘−’ key is pressed. Note we have not written it in ‘proper’ Z, but in a formof pseudo code.
keypad_digit(d)»____________________________________________ÆÆadd d to the right-hand end of Manual_Override_Value–Æ____________________________________________
alarm_lower [minus key is pressed]»____________________________________________ÆÆif ( Alarm_State is Red or Alarm State is TempRed )ÆÆthen set Alarm_State to AmberÆÆif ( Alarm_State is Amber or Alarm_State is Green)ÆÆthen set Alarm_State to Green–Æ____________________________________________
Using these to guide you, complete the following two partial descriptions of the state changesfor the CONFIRM and CANCEL buttons on the Emergency Confirm control panel.
confirm»____________________________________________ÆÆset Confirm_Needed to falseÆÆif ( Alarm_State is TempRed )ÆÆthen set Alarm_State to RedÆÆ... something about emergency shutdown too
ÆÆ...–Æ____________________________________________
cancel»____________________________________________ÆÆset Confirm_Needed to falseÆÆif ( Alarm_State is TempRed )ÆÆthen set Alarm_State to AmberÆÆ... something about emergency shutdown too
ÆÆ...–Æ____________________________________________

RECOMMENDED READING
A. Dix, Upside down As and algorithms – computational formalisms and theory. In J. Carroll, editor, HCI Models, Theories, and Frameworks: Toward an Inter-disciplinary Science, Morgan Kaufmann, 2003.Both an introduction to formalism in HCI and an apologetic for why more for-mal techniques are both useful and ultimately unavoidable. Contains materialmotivating the underlying concepts of formalism in both this chapter andChapter 16, and a historical view of the development of formalism from Aristotleto the present day. Watch out, too, for a whole page about counting cockroaches.
M. D. Harrison and H. W. Thimbleby, editors, Formal Methods in Human–Computer Interaction, Cambridge University Press, 1990.A collected works with chapters covering a range of approaches: formal cognitivemodeling, PIE-like models of interaction and formal aspects of dialog description.Various notations are used: TAG (see Chapter 12), Z, functional programmingand standard mathematical set theory. The chapters on dialog description includeboth eventCSP and generative transition networks, a cross between a production
(c) Produce descriptions of the state change for the following actions:
(i) alarm_higher – the ‘+’ key is pressed on the Alarm Control panel;(ii) shutdown – the IMMEDIATE SHUTDOWN COMMENCE button has been pressed on
the Emergency Shutdown panel;(iii) select_target(targ) – the target pulldown has been used on the Manual Override
panel. targ is one of {Pressure, Temp, Flow};(iv) set_target_value – the SET button has been pressed on the Manual Override panel.
(d) Check your state and actions by running through the scenario and showing annotating eachaction with the current state. Use the following example of the first few steps as a guide tothe appropriate level of detail.
»___________________________________ÆInitial state: Alarm_State is Green
Æ Confirm_Needed is false
Æ etc. ...
ÆSteps 1, 2 no system actions
ÆStep 3 press ‘+’ twice
Æ alarm_higher:
Æ Alarm_State = Amber
Æ alarm_higher:
Æ Alarm_State = TempRed
Æ Confirm_Needed = True
ÆStep 4 button glows because Confirm_Needed = True
ÆStep 5 no system actionÆetc.
Recommended reading 627

628 Chapter 17 n Models of the system
system and a state transition network (see Chapter 16). There are also chaptersconcerning the software engineering issues of moving from formal descriptionsthrough to running programs.
A. J. Dix, Formal Methods for Interactive Systems, Academic Press, 1991.The PIE model is described in detail, together with other, more domain-specificformal models. Issues covered in this formal framework include windowing systems,real-time response, pointing devices and direct manipulation. A chapter on modelsof status and events is the theoretical background for status–event analysis. Inaddition, the problems of refining a formal interface description into a runningsystem are discussed.
P. Palanque and F. Paternó, editors, Formal Methods in Human–ComputerInteraction, Springer-Verlag, 1997.A more recent collection, which has its roots in a CHI’96 workshop. The chaptersin this book address the specification of a world wide web browser using a varietyof different notations and formal techniques. As each technique is wielded by anexpert, it is an excellent comparative account. Perhaps most interesting to note isthe way in which different techniques are suited for tackling specific parts of thegeneral problem.
H. W. Thimbleby, User Interface Design, ACM Press, Addison-Wesley, 1990.This is a general interface design book, but contains significant sections con-cerning formal aspects and models. As well as the explicitly mathematical parts, aformal approach to problems is often evident in the informal parts of the book.
J. M. Spivey, The Z Reference Manual, Prentice Hall International, 1989.This book provides the standard definition of the Z language and a tutorial intro-duction to Z specification for the interested reader. There are also many other reference books and tutorials for the Z and the VDM notation.
A. F. Monk and N. Gilbert, editors, Perspectives on HCI: Diverse Approaches, AcademicPress, 1995.A collection of articles introducing key areas of HCI, including formal models(Chapter 2) and formal specification (Chapter 3). Readable introductions fornewcomers to these topics.
C. Roast and J. Siddiqi, editors, FAHCI – Formal Aspects of the Human–ComputerInterface, Springer-Verlag, 1996.Report of a workshop of the same name held in 1996, principally containing articleson formal specification and modeling, but also includes some cognitive modeling.
There are several conferences that include more formal materials, most notably theannual conference on ‘Design, Specification and Verification of InteractiveSystems’ held under the auspices of Eurographics since 1994, and published bySpringer-Verlag, and the short-lived FAHCI (Formal Aspects of the HumanComputer Interface) series, also published by Springer. The triennial IFIP WG2.7/13.4 working conference Engineering Human–Computer Interaction is pub-lished by North-Holland (to EHCI’92), Chapman and Hall (EHCI’95) andKluwer (EHCI’98 and EHCI’01).

MODELING RICH
INTERACTION
OV E RV I E W
We operate within an ecology of people, physical artifactsand electronic systems, and this rich ecology has recentlybecome more complex as electronic devices invade theworkplace and our day-to-day lives. We need methods to deal with these rich interactions.
n Status–event analysis is a semi-formal, easy to applytechnique that:– classifies phenomena as event or status– embodies naïve psychology– highlights feedback problems in interfaces.
n Aspects of rich environments can be incorporated intomethods such as task analysis:– other people– information requirements– triggers for tasks– modeling artifacts– placeholders in task sequences.
n New sensor-based systems do not require explicitinteraction; this means:– new cognitive and interaction models– new design methods– new system architectures.
18

630 Chapter 18 n Modeling rich interaction
INTRODUCTION
The majority of more detailed models and theories in HCI are focussed on the ‘normal’ situation of a single user interacting with traditional applications using akeyboard and screen. The models focus predominantly on the effects of individualplanned user actions. In fact, this ‘normal’ situation is increasingly looking like theexception. As we noted in the last chapter (Section 17.4), much of interaction isabout more continuous phenomena both in the computer (e.g. mouse movement)and in more ubiquitous computing environments, such as smart homes, that sensemovement, temperature, etc. Even traditional computer systems are used not in isolation, but in office and other work settings that involve different people andphysical objects. Normal human–computer interaction usually includes looking atpieces of paper, walking around rooms, talking to people. Finally, the more ubiquit-ous environments deeply challenge the idea of intention behind human–computerinteraction: increasingly things simply happen to us.
In this chapter we look at several ways in which this ‘normal’ situation can bemodeled either by new methods or by adapting existing ones.
In Section 18.2, we will demonstrate how a semi-formal technique, status–eventanalysis, can be used to understand the interplay between more instantaneous eventsand more continuous status phenomena. The examples in this section will be mainlyfocussed on more traditional computer systems, but unlike the models in previouschapters, status–event analysis is used to describe a ‘slice’ of the system at all levels ofabstraction, rather than the whole system at a specific level. Also, by dealing withboth more ‘computer-ish’ events and more ‘world-ish’ status phenomena it lays the ground for thinking about these increasingly rich interactions as the chapter progresses.
Section 18.3 is still focussed on traditional computer systems, but where theemphasis is on the physical and social environment in which they are based. We will be considering how aspects of the rich workplace ecology can be captured inmore formal techniques, in particular task analysis. We will look at representing collaboration – who is doing what; information requirements – what do we need toknow when; triggers – what makes things happen when they do; artifacts – how tomodel their behavior; and placeholders – how we keep track of where we are in a task.
Finally, Section 18.4 will explode the traditional model completely! The types of systems discussed in ubiquitous computing, and now beginning to be deployed,often do not require explicit interaction. There is a range of levels of intention, fromfully intentional systems to those where the system observes and responds to actionsof the user performed possibly for some completely different purposes. We will findthat these incidental interactions require new ways of thinking about interaction,new ways to design systems and new ways to construct them.
The latter parts of this chapter, especially, involve areas where theory is strugglingto keep up with technology and where there is still little idea of where eventually thetechnology will be used in practice.
18.1

18.2 Status–event analysis 631
STATUS–EVENT ANALYSIS
In Chapter 16 we saw that some dialog notations were state oriented, whereas otherswere event oriented. Each type of notation had trouble describing some phenomena,but was good with others. Similarly, in Section 17.4 we found that formal models of interactive systems need to be able to deal with both status and event input andoutput.
Note that the word ‘status’ is chosen rather than ‘state’, as the term will be used to refer to any phenomenon with a persistent value. This includes the position of amouse on a table and the current screen contents, as well as the internal state of thesystem. The word ‘state’ has connotations of the complete state of the system, ratherthan the selective particular views meant here by status.
18.2
Note on pronunciation
Note that the plural of status is not statuses or even stati. Like salmon and sheep, the pluralof status is simply status. However, according to the Oxford English Dictionary these are pronounceddifferently: the ‘u’ in the singular is as the ‘u’ in datum, whereas the plural has an ‘u’ as in tune.
The distinction between status and event is between being and doing. Status phe-nomena always have a value one could consult. For example, you can ask the ques-tion ‘what was the position of the mouse on the tabletop at 3:27pm?’. An event, on the other hand, happens at a particular moment. Here the relevant question is ‘at what time did the user press the mouse button?’.
This section describes status–event analysis, an ‘engineering’-level technique whichmakes use of the status–event distinction. The label ‘engineering’ is used in a similarway to the way it is applied to the keystroke-level model (Chapter 12, Section 12.5.1).An engineering approach is built upon theoretical principles, but does not require adeep theoretical background on the part of the designer. Status–event analysis isbuilt upon two theoretical foundations. On the one side, it is derived from work onformal models of interaction (as described briefly in Section 17.3.4). However, adesigner using the method does not need to use, or even know about, these founda-tions. On the other side, status–event analysis makes use of fairly naïve psycholo-gical knowledge, to predict how particular interface features affect the user.
The strength of the method is that a single descriptive framework can be appliedat a range of levels from the application, through the interface, to the user’s per-ception. Indeed, the same descriptive framework can describe even the low-levelelectrical signals and logic in the microseconds from when a user hits a key to thatkey being ‘noticed’ by the system.
We will first consider an example of clocks and calendars, which demonstratessome of the important properties of events and status and how they interrelate. The
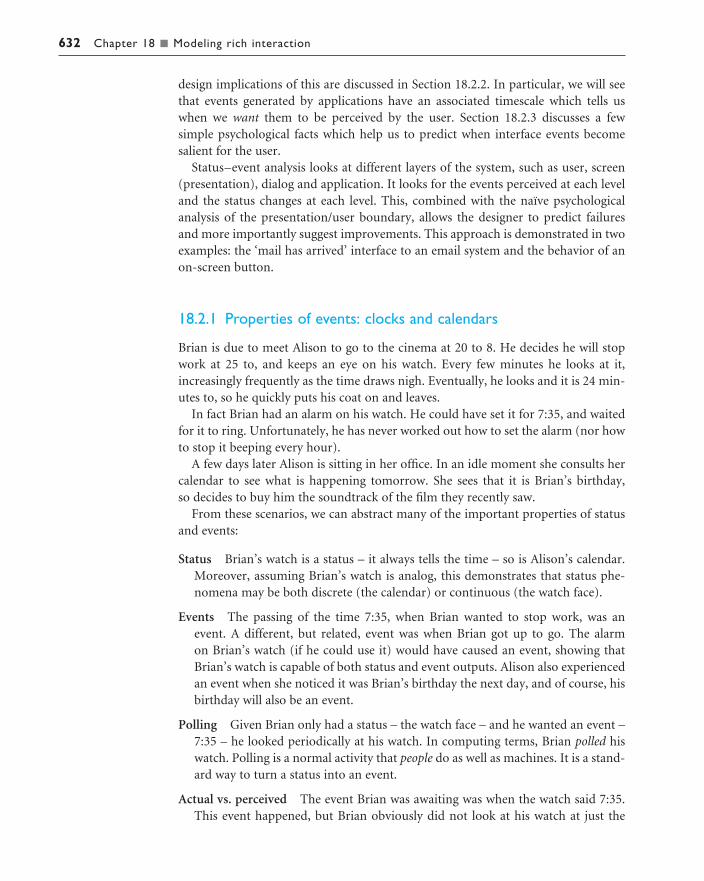
632 Chapter 18 n Modeling rich interaction
design implications of this are discussed in Section 18.2.2. In particular, we will seethat events generated by applications have an associated timescale which tells uswhen we want them to be perceived by the user. Section 18.2.3 discusses a few simple psychological facts which help us to predict when interface events becomesalient for the user.
Status–event analysis looks at different layers of the system, such as user, screen(presentation), dialog and application. It looks for the events perceived at each leveland the status changes at each level. This, combined with the naïve psychologicalanalysis of the presentation/user boundary, allows the designer to predict failuresand more importantly suggest improvements. This approach is demonstrated in twoexamples: the ‘mail has arrived’ interface to an email system and the behavior of anon-screen button.
18.2.1 Properties of events: clocks and calendars
Brian is due to meet Alison to go to the cinema at 20 to 8. He decides he will stopwork at 25 to, and keeps an eye on his watch. Every few minutes he looks at it,increasingly frequently as the time draws nigh. Eventually, he looks and it is 24 min-utes to, so he quickly puts his coat on and leaves.
In fact Brian had an alarm on his watch. He could have set it for 7:35, and waitedfor it to ring. Unfortunately, he has never worked out how to set the alarm (nor howto stop it beeping every hour).
A few days later Alison is sitting in her office. In an idle moment she consults hercalendar to see what is happening tomorrow. She sees that it is Brian’s birthday, so decides to buy him the soundtrack of the film they recently saw.
From these scenarios, we can abstract many of the important properties of statusand events:
Status Brian’s watch is a status – it always tells the time – so is Alison’s calendar.Moreover, assuming Brian’s watch is analog, this demonstrates that status phe-nomena may be both discrete (the calendar) or continuous (the watch face).
Events The passing of the time 7:35, when Brian wanted to stop work, was anevent. A different, but related, event was when Brian got up to go. The alarm on Brian’s watch (if he could use it) would have caused an event, showing thatBrian’s watch is capable of both status and event outputs. Alison also experiencedan event when she noticed it was Brian’s birthday the next day, and of course, hisbirthday will also be an event.
Polling Given Brian only had a status – the watch face – and he wanted an event –7:35 – he looked periodically at his watch. In computing terms, Brian polled hiswatch. Polling is a normal activity that people do as well as machines. It is a stand-ard way to turn a status into an event.
Actual vs. perceived The event Brian was awaiting was when the watch said 7:35.This event happened, but Brian obviously did not look at his watch at just the
18.2 Status–event analysis 633
right moment. Instead, this actual event became a perceived event for Brian aminute later when he next looked at his watch. If one looks at a fine enoughtimescale there are almost always gaps between actual and perceived events. Ofcourse, there can be similar lags between actual and perceived status too.
Granularity The watch showing 7:35 and Brian’s birthday are both events, but they operate at completely different timescales. The interpretation of events andstatus may differ depending on the timescale one uses. In particular, the idea ofimmediacy changes.
These same properties all emerge during the analysis of interactive systems.
18.2.2 Design implications
Applications want to cause events for users and use various presentation techniquesto do this. However, these techniques must be matched to the timescale of the desiredevent. For example, if a stock of 6 mm bolts is running low, this requires reorderingwithin days or weeks. On the other hand, a coolant failure in a nuclear power plantmay require action within seconds.
The presented form of the event for the user must match these timescales – bothcausing events too fast or too slow is wrong. It is fairly obvious that too slow an eventis wrong. An email message to the power plant operator would be ineffectual; theoperator and the computer would both be so much radioactive waste. However, the opposite fault can be equally damaging. Red flashing lights and alarm bells whenthe last box of 6 mm bolts is opened would be annoying, and could also distract theoperator from more important tasks, such as dealing with that coolant.
A less extreme example would be an electronic alarm and calendar. Imagine we have an online alarm function, which can be set to sound a buzzer and put a message in the middle of the screen at any time we like. This would obviously have been useful for Brian who could have set it to say ‘cinema with Alison’ at 7:35.However, if Alison wanted to remind herself of Brian’s birthday, she would be forced to set an alarm for a specific time, say noon on the day before. This wouldhave been disruptive when it rang, and not in keeping with the timescale of birthdays.
In order to cause a perceived event for the user at the appropriate timescale, wemust be able to predict the event timescale of various interface techniques. Simplypresenting information on the screen, or causing an event at the interface, is no guarantee that that event will become a perceived event for the user.
18.2.3 Naïve psychology
In order to predict the effect of interface techniques, we need to employ some naïvepsychology. This can tell us what sort of stimuli are salient and where the user’sattention will be focussed.
First, we can sometimes predict where the user will be looking:

634 Chapter 18 n Modeling rich interaction
Mouse When the user is positioning the mouse pointer over a target, his attentionwill be focussed on that target. This is guaranteed in all but a few situations by thefeedback requirements of hand–eye coordination. However, this attention maynot stay long after the target has been successfully ‘hit’.
Text insertion point While typing text, the user will intermittently look at the text just typed and hence the current insertion point. However, because of touch-typing, this is less certain than the mouse except when moving the insertion pointover large distances using cursor keys – another positioning task.
Screen It is reasonably safe to assume that the user will look at the screen inter-mittently. However, there is no guarantee that any particular message or icon onthe screen will be noticed, only that very large messages spread across a large partof the screen will probably be noticed.
If we know where the user is looking, then we can put information there (not in a status line at the top where no one ever looks). Also, changes at the user’s visualfocus will be salient and become a perceived event for the user. An example, wherethe mouse pointer itself is used for information, is the egg-timer or ticking watchicon used when a system is busy.
Secondly, immediate events can be caused even when we do not know where the useris looking. The most common are audible events: beeps, buzzers, bells and whistles.These cause perceived events even when the user is not looking at the screen. In addi-tion, our peripheral vision is good at detecting movement (see Chapter 1). Whereaswe might not notice a small change unless it is in our visual focus, we will noticesomething moving out of the corner of our eye. We will see an interesting exampleof this in the next section, but a common example of large change (rather than move-ment) is the use of a screen flash as a silent bell. Not only does this cause an eventwhen you are looking anywhere on the screen, but even if you are looking at the key-board or at a document beside the screen. The only proviso is that the duration ofthe flash must be timed suitably to avoid it being mistaken for normal screen flicker.
Finally, recall from Chapter 1 that when people complete some goal, they experi-ence closure. This means that they have a feeling of completeness and go on to thenext thing. Closure has implications both on perception and actions. It is why in themouse positioning task, the user’s eye may stray from the target as soon as the targetis perceived as ‘hit’. In addition, the user may begin some of the actions for the nexttask, while certain automatic actions terminating the last task are still going on. Forexample, it is easy to knock a glass from the table by beginning to turn round beforefully letting go of the glass.
We will see examples of each of these three effects in the succeeding subsections.
18.2.4 Example – email interface
Brian wants to thank Alison for his birthday present, which she left on his desk. Hesends her a message by email. Consider the stages the message goes through, fromwhen the message first arrives in Alison’s system until Alison realizes it is there.

18.2 Status–event analysis 635
To make life easy we will assume that Brian is on the same network as Alison.When he hits the ‘SEND’ button on his machine, the message is sent – this is anevent. The way that many systems handle internal mail is simply to append it to therecipient’s mailbox file, for example ‘/usr/spool/mail/Alison’. The event of receivingmail is therefore reflected in a change of status in the file system. You can see thisevent depicted as the first arrow in Figure 18.1. This figure shows timelines for vari-ous components in the interface, where time flows downwards. Events are denotedby arrows between the components’ timelines.
On Alison’s workstation runs a mailtool. When not in use, the mailtool is depictedby an ‘empty mailbox’ icon. The mailtool does not notice the change in the mailboxfile immediately, but periodically it checks the file to see if it has changed – that is, itpolls. So, after a while, the mailtool polls the file and sees that it has indeed changed.At this point the change in status of the file system has become a perceived event forthe mailtool. Notice that we are using the term perceived event of computer agentsas well as of the user. Obviously, the final perceived event for the user is what isimportant, but we are also interested in similar phenomena at different levels.
Having noticed the event, the mailtool now knows that mail has arrived, and musttry to make this event a perceived event for the user. To do this it changes its icon todenote a mailbox with a letter sticking out. That is, we again see an event giving riseto a change in status, this time on the screen.
Finally, we come to the user, Alison. She is sitting at her workstation busy on a report she must finish. She gets to the end of a difficult section and breaks in hertyping for a moment. During such breaks, her eyes wander over the screen, and inparticular she occasionally glances at the mailtool’s icon to see if any mail has arrived– she polls it. This time when she looks up, she sees that mail has indeed arrived – themail arrival has at last become a perceived event for Alison.
If we look at Figure 18.1, we see that a number of active agents (Brian, the mail-tool and Alison) cause events for one another mediated by status elements (thefilestore and screen). This is a very common scenario, especially if you look at fine
Figure 18.1 Inputs and outputs of a single-user system
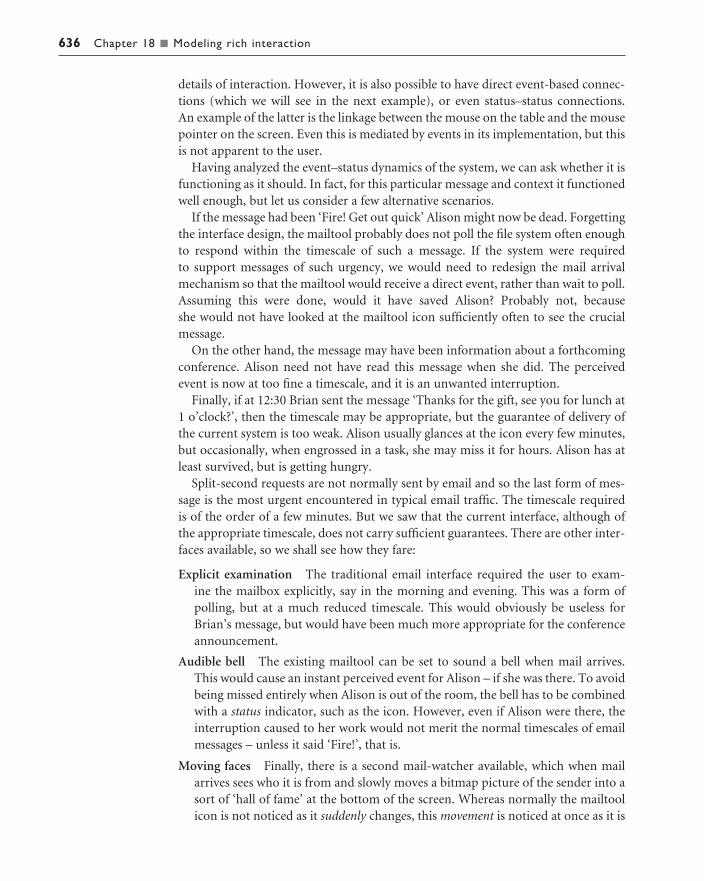
636 Chapter 18 n Modeling rich interaction
details of interaction. However, it is also possible to have direct event-based connec-tions (which we will see in the next example), or even status–status connections. An example of the latter is the linkage between the mouse on the table and the mousepointer on the screen. Even this is mediated by events in its implementation, but thisis not apparent to the user.
Having analyzed the event–status dynamics of the system, we can ask whether it isfunctioning as it should. In fact, for this particular message and context it functionedwell enough, but let us consider a few alternative scenarios.
If the message had been ‘Fire! Get out quick’ Alison might now be dead. Forgettingthe interface design, the mailtool probably does not poll the file system often enoughto respond within the timescale of such a message. If the system were required to support messages of such urgency, we would need to redesign the mail arrivalmechanism so that the mailtool would receive a direct event, rather than wait to poll.Assuming this were done, would it have saved Alison? Probably not, because she would not have looked at the mailtool icon sufficiently often to see the crucialmessage.
On the other hand, the message may have been information about a forthcomingconference. Alison need not have read this message when she did. The perceivedevent is now at too fine a timescale, and it is an unwanted interruption.
Finally, if at 12:30 Brian sent the message ‘Thanks for the gift, see you for lunch at1 o’clock?’, then the timescale may be appropriate, but the guarantee of delivery ofthe current system is too weak. Alison usually glances at the icon every few minutes,but occasionally, when engrossed in a task, she may miss it for hours. Alison has atleast survived, but is getting hungry.
Split-second requests are not normally sent by email and so the last form of mes-sage is the most urgent encountered in typical email traffic. The timescale requiredis of the order of a few minutes. But we saw that the current interface, although ofthe appropriate timescale, does not carry sufficient guarantees. There are other inter-faces available, so we shall see how they fare:
Explicit examination The traditional email interface required the user to exam-ine the mailbox explicitly, say in the morning and evening. This was a form ofpolling, but at a much reduced timescale. This would obviously be useless forBrian’s message, but would have been much more appropriate for the conferenceannouncement.
Audible bell The existing mailtool can be set to sound a bell when mail arrives.This would cause an instant perceived event for Alison – if she was there. To avoidbeing missed entirely when Alison is out of the room, the bell has to be combinedwith a status indicator, such as the icon. However, even if Alison were there, theinterruption caused to her work would not merit the normal timescales of emailmessages – unless it said ‘Fire!’, that is.
Moving faces Finally, there is a second mail-watcher available, which when mailarrives sees who it is from and slowly moves a bitmap picture of the sender into asort of ‘hall of fame’ at the bottom of the screen. Whereas normally the mailtoolicon is not noticed as it suddenly changes, this movement is noticed at once as it is

18.2 Status–event analysis 637
in Alison’s peripheral vision. Furthermore, it leaves a status indicator behind (thesender’s face). It thus does the job of the buzzer and icon combined. However, theguaranteed event is still too quick.
What is really wanted is a guaranteed event at a timescale of minutes. None of theavailable options supplies this. However, knowing what is wanted one can suggestdesigns to supply the need. For example, we could automatically notice gaps in typing, and notify the user (aurally or visually) during a gap on the assumption thatthis will be less obtrusive. Alternatively, we can use a non-guaranteed technique ofthe appropriate timescale, such as the existing mailtool icon, but if the mail is notexamined within a certain time we can use a more salient alarm.
Ideally, such mechanisms should be tuned to the particular timescale of the application and, if anything, email is one of the most difficult examples as the time-scale depends on the message. Other applications, particularly command and controltasks, will have more well-defined timescales making the matching job easier.
18.2.5 Example – screen button feedback
The last example used status–event analysis to suggest an improved interface toemail. However, email is, as we admitted, a complex example, so it is not surprisingthat improvements can be found. In the following example, we find that status–eventanalysis is even able to suggest improvements in something as simple and heavilyused as an on-screen button.
Screen buttons activated by clicking the mouse over them are a standard widget in any interface toolkit and are found in most modern application interfaces. Theapplication developer has little control over the detailed user interaction as this isfixed by the toolkit. So, the specific results of this example are most relevant to thetoolkit designer, but the general techniques are more widely applicable.
A common problem with many on-screen buttons is that the user thinks the button has been pressed, but in fact it has not been. As an example, imagine Alisonat work again on her word processor. The report is too long and so when she noticesa superfluous paragraph, she selects it and then moves her button up to the ‘delete’button. She clicks over the button and thinks it has had an effect, but actually as shelifted her finger from the button, the mouse slipped from the button and the clickwas ignored (the button is activated by the mouse up event). Unfortunately, she doesnot notice until having, with difficulty, pared the report down to 1000 words, shenotices that the unwanted paragraph remains.
We have two questions: why is this mistake so frequent, and why didn’t she notice?To answer these we use status–event analysis to look at two scenarios, the first whereshe successfully selects ‘delete’, and the one where she does not. There are four elements in the analysis: the application (word processor), the button’s dialog (in thetoolkit), the screen image and the user (Alison). Figures 18.2 and 18.3 depict the twoscenarios, the first when successful – a hit – and the second when not – a miss.
Consider first the successful case in Figure 18.2, the hit. The first significant eventis Alison’s depression of the mouse button over the on-screen ‘delete’ button. This
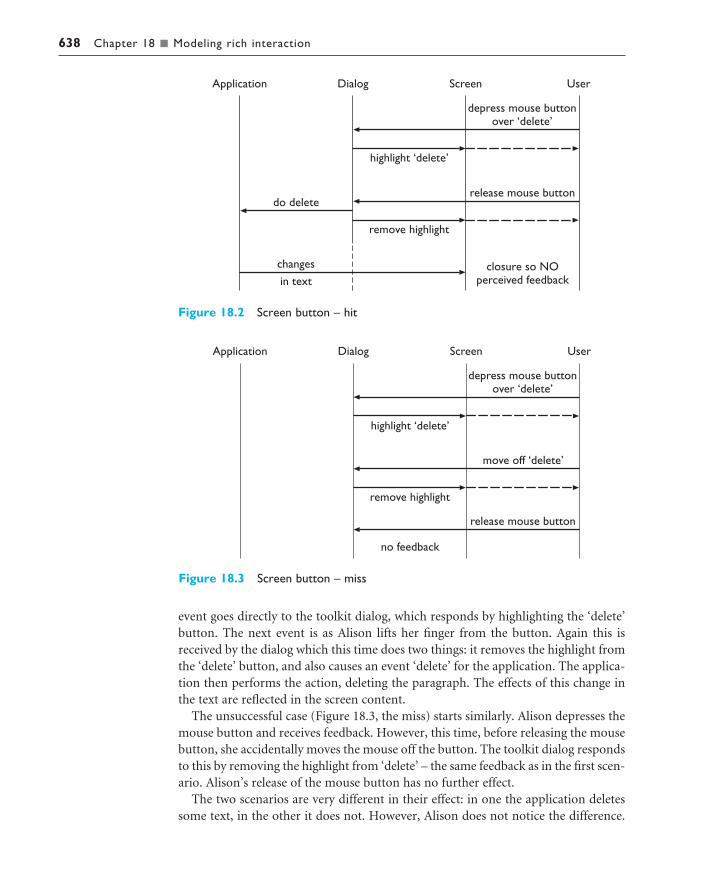
638 Chapter 18 n Modeling rich interaction
event goes directly to the toolkit dialog, which responds by highlighting the ‘delete’button. The next event is as Alison lifts her finger from the button. Again this isreceived by the dialog which this time does two things: it removes the highlight fromthe ‘delete’ button, and also causes an event ‘delete’ for the application. The applica-tion then performs the action, deleting the paragraph. The effects of this change inthe text are reflected in the screen content.
The unsuccessful case (Figure 18.3, the miss) starts similarly. Alison depresses themouse button and receives feedback. However, this time, before releasing the mousebutton, she accidentally moves the mouse off the button. The toolkit dialog respondsto this by removing the highlight from ‘delete’ – the same feedback as in the first scen-ario. Alison’s release of the mouse button has no further effect.
The two scenarios are very different in their effect: in one the application deletessome text, in the other it does not. However, Alison does not notice the difference.
Figure 18.2 Screen button – hit
Figure 18.3 Screen button – miss

18.3 Rich contexts 639
Her feedback from the toolkit dialog is identical. In theory, she could have seen thatthe text did not change as she expected. However, after hitting the ‘delete’ button,she reaches closure on that operation and moves on to the next task. Her attention isnot focussed on the text to be deleted and so there is no perceived event for the usercorresponding to the application event of the text being deleted.
Furthermore, this closure makes the mistake not just a possibility, but highlylikely. Consider the moment when Alison has just pressed down the mouse buttonand the on-screen ‘delete’ button has been highlighted. She has done what shewanted and attains closure, and the remaining release of the mouse button is initi-ated. She now starts to look for the next action and begins to move the mouse to thelocation of next interaction. However, the two actions, releasing the mouse andmoving it, are not synchronized with one another. There is no particular reason whyone should happen before the other. It is, of course, a particularly dangerous pointin a dialog where the order of two unsynchronized user actions makes a crucial difference to behavior.
It is quite difficult to see how to avoid the problem occurring. It is not that the current feedback is not salient; it is at the focus of the pointing task. However, all thefeedback concerns events at the dialog level. The most important event, the ‘delete’to the application, has no corresponding perceived event. The toolkit assumes thatthe user will see some feedback from the application and therefore does not supplyany feedback of its own. But, as we saw, the application’s feedback is very likely to bemissed.
The solution is fairly obvious: the dialog should itself supply an event, which willbe perceived by the user, corresponding to the application-level event. This could be visual, but would have to be very salient as the user’s eyes are beginning to movetoward the next task. Alternatively, it could be aural, either with a keyboard-like‘click’ as the button is successfully pressed, or with a beep if the mouse slips off. This improved feedback could be combined with some dynamic mechanism, such asmaking the screen button ‘magnetic’ and difficult to move out of.
It is interesting to note that, if Alison were a novice user, she would be more likelyto check her actions and thus notice the mistake – an unnoticed button miss is an expertslip. As all but the most extensive user testing of a new device must, by definition, bewith novices, there is no way this would be detected – which is perhaps why most on-screen buttons have this problem. We hope this demonstrates how, on occasions,semi-formal hand analysis may even be more effective than real user testing.
RICH CONTEXTS
Formalized methods such as task analysis adopt a systemized, almost Taylorist viewof the workplace – people working to achieve well-defined goals following regularprocedures.
However, even the earliest systems analysis texts took into account the richness ofthe work environment. One text, written in the late 1960s, described a printshop
18.3

640 Chapter 18 n Modeling rich interaction
where productivity was lower than predicted after the installation of new machinery.The analyst was asked to advise on automating the equipment. After observing theworkplace he asked for a small budget of a few hundred pounds and the productiv-ity dramatically rose. What did he do? He bought white overalls. The equipment wasoily and the operators, mostly young women, were reluctant to work too quickly forfear of damaging their own clothes. The overalls protected their clothes and obviatedthe need for a computer.
This is not a unique story. Again and again those studying real workplaces findthat they have a rich ecology involving different people, the structure of the spacesthey work in and the physical artifacts in the workplace. Observations of real photo-copier use led to the ideas of situated action (see also Chapter 13, Section 13.3.5)challenging simplistic models of pre-planned human action and proposing insteadthat real interaction is not pre-planned, but rather acted out in response to the actualwork situation [334]. Numerous ethnographic studies emphasize the incredible richness of human interaction and, often, the inability of formalized processes toincorporate it. For example, in a study of a printshop (yes, another) Bowers et al.[41] found that the operators constantly had to work around the job managementsoftware as it assumed linear patterns of work that did not reflect the contingent anddynamic re-planning necessary on the shopfloor.
In a philosophically different strand of work, the distributed cognition literaturehas challenged the model of cognition ‘in the head’ and instead suggests that realcognition happens in interaction with the environment and with each other (seeChapter 14, Section 14.5.3). One classic study showed how Polynesian sailors wereable to navigate without formal charts and without the requisite experience in anyone individual’s head [185].
One could say that the lessons of situated action and of distributed cognition areabout the parity in relationship between the ‘actor’ and the world. We do not just acton the world, but act with the world. We are driven by what we see and hear fromother people, from automated systems and from the physical objects in the world. In response, our actions, words and sometimes gestures and demeanour speak backinto that rich world.
In day-to-day life we understand about dialog with other people. In HCI we areused to thinking about dialog between users and the computer system. However, in a full ecological analysis we must also accept that users are in dialog with the physical environment. We use the information stored in artifacts and their physicaldisposition to trigger and guide our actions, and the physical properties of the worldlimit and constrain our actions on it.
In the rest of this section we will look at several phenomena of this dialog with theenvironment and see how they can be grafted onto more traditional methods.
18.3.1 Collaboration – doing it together
In Chapter 14, we discussed issues of communication and collaboration. However,you may notice that this is rarely mentioned in the other models in Part 3.
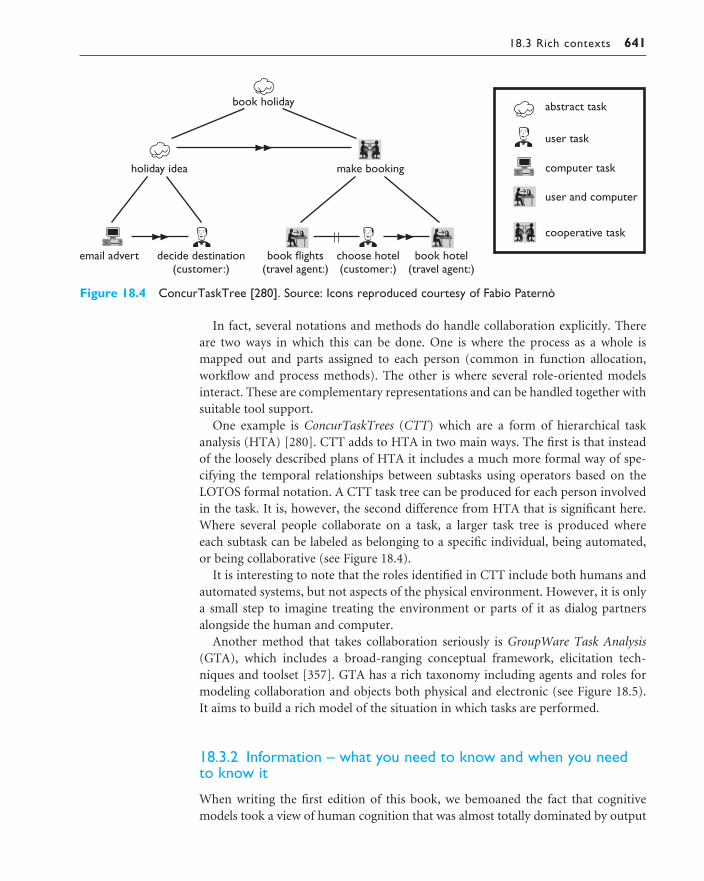
18.3 Rich contexts 641
In fact, several notations and methods do handle collaboration explicitly. Thereare two ways in which this can be done. One is where the process as a whole ismapped out and parts assigned to each person (common in function allocation,workflow and process methods). The other is where several role-oriented modelsinteract. These are complementary representations and can be handled together withsuitable tool support.
One example is ConcurTaskTrees (CTT) which are a form of hierarchical task analysis (HTA) [280]. CTT adds to HTA in two main ways. The first is that insteadof the loosely described plans of HTA it includes a much more formal way of spe-cifying the temporal relationships between subtasks using operators based on theLOTOS formal notation. A CTT task tree can be produced for each person involvedin the task. It is, however, the second difference from HTA that is significant here.Where several people collaborate on a task, a larger task tree is produced where each subtask can be labeled as belonging to a specific individual, being automated,or being collaborative (see Figure 18.4).
It is interesting to note that the roles identified in CTT include both humans andautomated systems, but not aspects of the physical environment. However, it is onlya small step to imagine treating the environment or parts of it as dialog partnersalongside the human and computer.
Another method that takes collaboration seriously is GroupWare Task Analysis(GTA), which includes a broad-ranging conceptual framework, elicitation tech-niques and toolset [357]. GTA has a rich taxonomy including agents and roles formodeling collaboration and objects both physical and electronic (see Figure 18.5). It aims to build a rich model of the situation in which tasks are performed.
18.3.2 Information – what you need to know and when you needto know it
When writing the first edition of this book, we bemoaned the fact that cognitivemodels took a view of human cognition that was almost totally dominated by output
Figure 18.4 ConcurTaskTree [280]. Source: Icons reproduced courtesy of Fabio Paternò
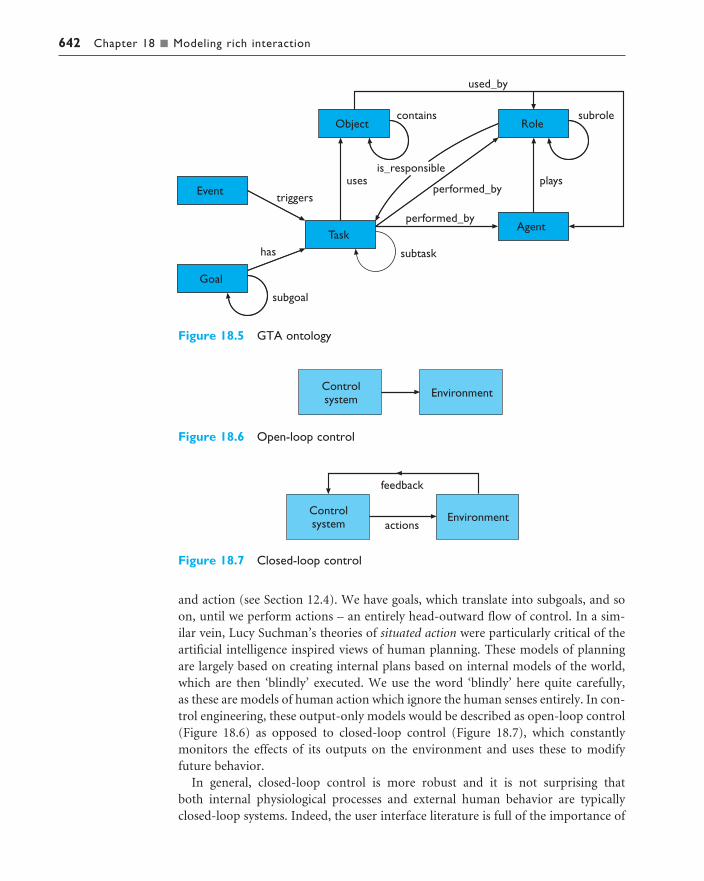
642 Chapter 18 n Modeling rich interaction
and action (see Section 12.4). We have goals, which translate into subgoals, and soon, until we perform actions – an entirely head-outward flow of control. In a sim-ilar vein, Lucy Suchman’s theories of situated action were particularly critical of theartificial intelligence inspired views of human planning. These models of planningare largely based on creating internal plans based on internal models of the world,which are then ‘blindly’ executed. We use the word ‘blindly’ here quite carefully, as these are models of human action which ignore the human senses entirely. In con-trol engineering, these output-only models would be described as open-loop control(Figure 18.6) as opposed to closed-loop control (Figure 18.7), which constantlymonitors the effects of its outputs on the environment and uses these to modifyfuture behavior.
In general, closed-loop control is more robust and it is not surprising that both internal physiological processes and external human behavior are typicallyclosed-loop systems. Indeed, the user interface literature is full of the importance of
Figure 18.5 GTA ontology
Figure 18.6 Open-loop control
Figure 18.7 Closed-loop control
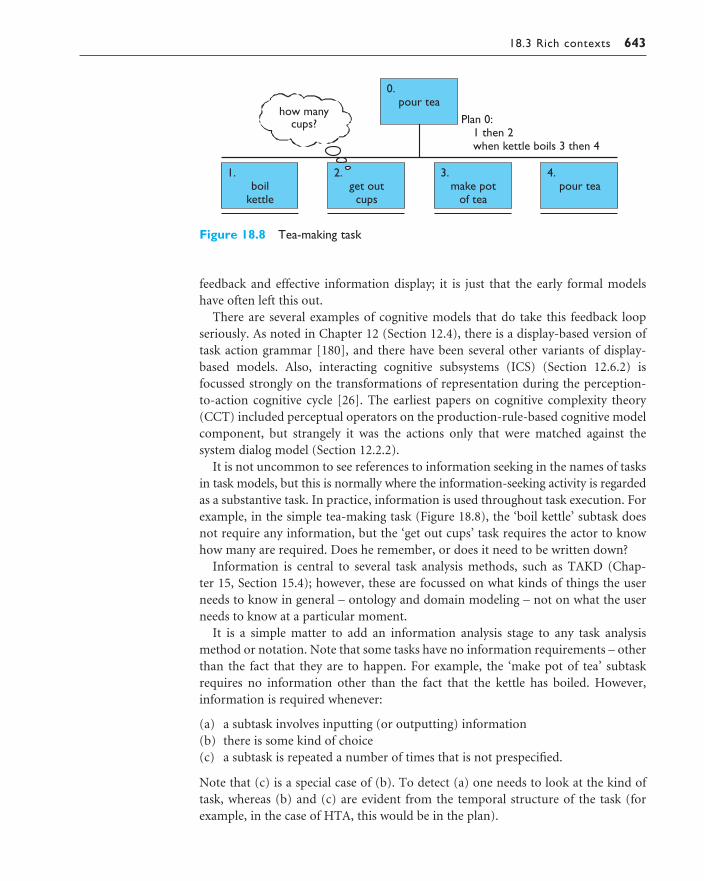
18.3 Rich contexts 643
feedback and effective information display; it is just that the early formal modelshave often left this out.
There are several examples of cognitive models that do take this feedback loopseriously. As noted in Chapter 12 (Section 12.4), there is a display-based version oftask action grammar [180], and there have been several other variants of display-based models. Also, interacting cognitive subsystems (ICS) (Section 12.6.2) isfocussed strongly on the transformations of representation during the perception-to-action cognitive cycle [26]. The earliest papers on cognitive complexity theory(CCT) included perceptual operators on the production-rule-based cognitive modelcomponent, but strangely it was the actions only that were matched against the system dialog model (Section 12.2.2).
It is not uncommon to see references to information seeking in the names of tasksin task models, but this is normally where the information-seeking activity is regardedas a substantive task. In practice, information is used throughout task execution. Forexample, in the simple tea-making task (Figure 18.8), the ‘boil kettle’ subtask doesnot require any information, but the ‘get out cups’ task requires the actor to knowhow many are required. Does he remember, or does it need to be written down?
Information is central to several task analysis methods, such as TAKD (Chap-ter 15, Section 15.4); however, these are focussed on what kinds of things the userneeds to know in general – ontology and domain modeling – not on what the userneeds to know at a particular moment.
It is a simple matter to add an information analysis stage to any task analysismethod or notation. Note that some tasks have no information requirements – otherthan the fact that they are to happen. For example, the ‘make pot of tea’ subtaskrequires no information other than the fact that the kettle has boiled. However,information is required whenever:
(a) a subtask involves inputting (or outputting) information(b) there is some kind of choice(c) a subtask is repeated a number of times that is not prespecified.
Note that (c) is a special case of (b). To detect (a) one needs to look at the kind oftask, whereas (b) and (c) are evident from the temporal structure of the task (forexample, in the case of HTA, this would be in the plan).
Figure 18.8 Tea-making task

644 Chapter 18 n Modeling rich interaction
Having discovered that information is required it may come from several sources:
(i) It is part of the task (e.g., in the case of a phone call, whom one is going tophone).
(ii) The user remembers it (e.g. remembering the number after ringing directoryenquiries).
(iii) It is on a computer/device display (e.g. using a PDA address book and then dial-ing the number).
(iv) It is in the environment: either pre-existing (e.g. number in phone directory),or created as part of the task (e.g. number written on piece of paper).
Reducing memory load is part of standard usability guidelines. Knowing what information is required during a task allows us to design or redesign the task so thatinformation is available when required. An infamous example of this is those all toocommon modal dialog boxes that ask you some question but hide the window con-taining the information you need to answer the question!
In most multi-windowed GUIs it has been possible for user interface designers tobe quite careless about information requirements. One can make so much informa-tion available and let the user arrange different windows to perform the task. In con-trast industrial control design is far more careful about knowing what is required, asthere are often very many possible values to display. Industrial operators may havevery little time to respond to an alarm and so cannot browse complex menu systemsto find information. As user interaction moves away from the computer screen todedicated devices, WAP phones, interactive television screens and smart appliances,these issues of careful information requirements analysis will become significant forall applications.
18.3.3 Triggers – why things happen when they happen
Workflows and process diagrams decompose processes into smaller activities andthen give the order between them. Similarly, plans in HTA give some specification ofthe order of subtasks and, as noted earlier, in CTT these temporal orders are mademore specific using operators derived from LOTOS.
Figure 18.9 shows a simple example, perhaps the normal pattern of activity for an office worker dealing with daily post. Notice the simple dependency that the postmust be collected from the pigeonhole before it can be brought to the desk andbefore it can be opened. However, look again at the activity ‘open post’ – when doesit actually happen? The work process says it doesn’t happen before the ‘bring post to desk’ activity is complete, but does it happen straightaway after this or some timelater?
Figure 18.9 Simple work process

18.3 Rich contexts 645
Trigger analysis [108] looks in detail at the triggers that cause activities to happenwhen they happen. In the case of opening post, this could easily be something like ‘at coffee time’ rather than straightaway. It identifies a number of common triggers:
immediate – straight after previous task;
temporal – at a particular time or after a particular delay;
sporadic – when someone thinks about it;
external event – some event occurs, such as a phone call;
environmental cue – something in the environment prompts action.
We can augment the work process with triggers for each activity (Figure 18.10).Notice how we have examples of different types of trigger: two temporal and oneenvironmental (letters in the office worker’s hand prompting her to carry them toher desk).
Triggers are important not only for understanding the temporal behavior of thetask, but also because they tell us about potential failure modes. If two environmentaltriggers are similar, one might do parts of the task out of sequence; if a trigger maynot occur, or may be missed (likely for sporadic triggers), activities may be omittedentirely. Triggers also help us assess the likelihood of problems caused by interrup-tions – for example, immediate ‘just after’ sequences are disrupted badly, whereasenvironmental cues tend to be robust (because they are still there).
Sometimes triggers are seen in the plans of HTAs, and sometimes ‘waiting’ sub-tasks are included for external events, but these are both exceptions; the normalassumption is that tasks are uninterrupted. However, it is straightforward to add atrigger analysis stage to most task analysis methods.
In addition, you may have noticed that the ontology of GTA in Figure 18.5includes events and triggers. However, the word ‘trigger’ in GTA is usually used onlyfor events that originally set a task in motion (e.g. a customer making an order) andevents that make major changes (e.g. the customer ringing to cancel the order).
In terms of the ecology of interaction, triggers remind us that tasks are not typically performed uninterrupted and continuously from start to finish. In practice, tasks are interleaved with other unrelated tasks or, potentially more confusingly,with different instances of the same tasks, and may be interrupted and disrupted byother activities and events. Furthermore, the performance of the tasks is dependentboth on a host of interactions with the environment – and these may be fragile – andon apparently unconnected events.
Figure 18.10 Triggers for activities

646 Chapter 18 n Modeling rich interaction
18.3.4 Artifacts – things we act on and act with
Notice that one of the trigger types is environmental cues – things in the environ-ment that prompt us to action. Some years ago one of the authors got a telephonecall reminding him to respond to a letter. He couldn’t recall having received it at all,but searching through a pile on his desk he found it, and several other letters from aperiod of several weeks unopened and unread. What had happened? His practice wasto bring the post upstairs to his desk, but not always to read it straightaway. Notbeing a coffee drinker, it was not coffee time that prompted him to open the post but just the fact that there was unopened post lying on his desk. This process hadworked perfectly well until there was a new office cleaner. The new cleaner didn’tmove things around on his desk, but did ‘tidy’: straightening up higgledy-piggledypiles of paper. However, he had unconsciously been using the fact that the bundle ofunopened post was not straight as a reminder that it needed dealing with. But sincethe arrival of the new cleaner post that for some reason was not opened one daywould look the next morning as if it was tidily ‘filed’ in a pile on his desk.
This story is not unique. The ethnographic literature is full of accounts of artifactsbeing used to manage personal work and mediating collaborative work. Some of that purpose is to do with the content of the artifacts – what is written on the paper– but much of it uses the physical disposition: by orienting a piece of paper towarda colleague you say ‘please read it’. In the case of the author’s desk, the cue that said ‘post needs to be opened’ was purely in the physical orientation (not even theposition).
Of course, artifacts also carry information, and are often the inputs or products ofintellectual work. Furthermore, in physical processes the transformation of artifactsis the purpose of work.
One example that has been studied in detail in the ethnographic literature is airtraffic control, in which all these uses of artifacts are apparent [183]. Flight strips arecentral (Figure 18.11) – small slips of card for each aircraft recording informationabout the aircraft (flight number, current height, heading, etc.). This information isimportant both for the controller managing the aircraft, and also as an at-a-glancerepresentation of the state of the airspace for other controllers. However, the con-trollers also slightly pull out those strips corresponding to aircraft that have someissue or problem. This acts partly as a reminder and partly as an implicit communica-tion with nearby controllers. Finally, the strips in some way represent the aircraft forthe controllers, but, of course, the real purpose of the process is the movement of the aircraft themselves.
Figure 18.11 Air traffic control flight strip

18.3 Rich contexts 647
Task models often talk about objects, either implicitly in the description of subtasks or explicitly in the task model. However, the objects are always ‘secondclass’ – users act on them, but they are not ‘part of ’ the task. CTT and most work process notations do talk about automated tasks, but not about the artifacts, whether electronic or physical, included within the interaction.
In object-oriented design methods it is common to give life-cycle descriptions of‘objects’; however, this is usually because we are intending to store and automate theobject electronically. And though workflow analysts do study document life cycles,this again is largely because of the intention to automate.
The entity–relationship style task analysis in Chapter 15 (Section 15.5), basedlargely on the ATOM method [360], does treat physical objects as ‘first class’, but thistype of method has not gained widespread acceptance.
There is no reason why most task analysis methods should not adopt some formof artifact tracking. This may be as simple as recording which artifacts are triggersfor, used by, modified by, or produced by any particular subtask. For tasks whereartifacts are particularly central, more sophisticated artifact life cycles could sitalongside the task description. These life cycles may be mundane (letter closed – let-ter open), but this is the point; users recruit their everyday knowledge and physicalproperties of the world to coordinate their activity.
18.3.5 Placeholders – knowing what happens next
It is half past five in the evening. The busy office building is beginning to quiet aspeople pack up to go home. One or two work late in their offices, but as the eveningwears on they too go home. Soon there is only the hum of vacuum cleaners and the clatter of wastebins as the office cleaners do their work, until eventually, the lastlight goes out and the building sleeps. A few have taken papers and laptops home andcontinue to work, but eventually they too put aside their work and sleep.
It is three o’clock in the morning. In the darkness and silence of the office and thedeep sleep of all the employees, where is the memory of the organization? The nextmorning at nine o’clock the office is a flurry of activity; it has not forgotten and hasrestarted its activities, but how?
We have already discussed two aspects of this memory: information required to perform tasks, and triggers that remind us that something needs to happen.However, there is one last piece of this puzzle that we have hinted at several timesalready. As well as knowing that we need to do something, we need to know whatto do next. In the complex web of tasks and subtasks that comprise our job – whereare we?
In fact, in looking at triggers we have already seen examples of this. The untidypost on the author’s desk said ‘something needs to happen’, but the fact that it wasalso unopened said, ‘it needs to be opened’. We already noted that similar triggersmay cause subtasks to be performed out of sequence. If we have only a small num-ber of dissimilar tasks this is unlikely to happen, since we can remember where we are in each task. However, as the number of tasks increases, especially if we are

648 Chapter 18 n Modeling rich interaction
performing the same task on different things, it becomes harder to remember wherewe are.
Let’s look again at air traffic control. One of the controller’s tasks is to manage theflight level of aircraft. A much-simplified model of this activity is shown in Figure18.12. Because this is a shared task between the controller and the pilot, each box is labeled with the main actor (although tasks 2 and 3 are both communications).Recalling earlier parts of this section, we might ask what information is required ateach stage; for example, task 1 would depend on radar, locations of other planes,planned take-off and landings, and new planes expected to enter the airspace.
Note that box 5 is not really a task, more a ‘state of the world’ that signifies taskcompletion; however, it is important, as the controller will need to take alternativeactions if it doesn’t happen. Of course, without appropriate placeholders the con-troller might forget that a plane has not achieved its target level, causing problemslater because the old level is still occupied and allowing potential conflicts betweenaircraft.
In fact, the flight strips encode just such a placeholder (see Figure 18.13). Whenthe controller informs the pilot of the new height he writes the new level on the flightstrip (i). When the pilot confirms she has understood the request the controller
Figure 18.12 Flight level management task
Figure 18.13 Flight strip annotated during task
18.4 Low intention and sensor-based interaction 649
crosses out the old level (ii). Finally when the new level has actually been reached thenew level is ticked (iii).
Virtually all task-modeling notations treat the placeholder as implicit. Thesequence of actions is recorded, but not why the user should do things in the wayproposed. Of course, one purpose of task analysis has been to produce training – thatis, to help people learn what the appropriate processes are, but this doesn’t help themactually to remember where they are in the process.
Just like other forms of information, placeholders may be stored in different ways:
(a) in people’s heads – remembering what to do next(b) explicitly in the environment – to-do lists, planning charts, flight strips,
workflow systems(c) implicitly in the environment – is the letter open yet?
Although often forgotten, placeholders are crucial in ensuring that tasks are carriedout effectively and in full. At a fine scale it is rare to find explicit records because theoverhead would be too high. Instead (a) and (c) predominate. As users’ memoriesmay be unreliable when faced with multiple tasks and interruptions, it is not sur-prising to find that various forms of environmental cue are common in the workplace.However, electronic environments do not have the same affordances to allow informalannotations or fine ‘tweaking’ of the disposition of artifacts.
LOW INTENTION AND SENSOR-BASED INTERACTION
In traditional computer applications a user was expected to approach the systemwith a clear intention to perform some activity or achieve some goal. The actionswere purposeful and direct and the results were explicitly attended to and evaluated.The design emphasis is on making the affordances of interaction unambiguous andavailable and ensuring that system feedback and state are clearly visible.
However, in many areas of human–computer interaction we have seen a growingnumber of systems and interaction paradigms where user attention and intention is lower. In CSCW the concept of awareness has been central for many years, and,similarly, ambient interfaces emphasize low salience displays of background infor-mation. A number of terms have been used to refer to interfaces that include lessexplicit interactions: calm interfaces, tacit and implicit interaction. All emphasizeoutput that is non-intrusive, and ecologically natural forms of input/control.
Whereas the traditional interface was based around controls and input devices,these low attention and natural input paradigms are more closely related to sensingtechnologies and contextual interpretations. Furthermore, human physiology maybe sensed to influence interaction; for example the 2002 Commonwealth Gamesbaton had an electronic ‘flame’ that flashed depending on the bearer’s heart rate.
At the extreme end of the spectrum are incidental interactions, where an actor(user) performs an action for some purpose (say opening a door to enter a room),
18.4
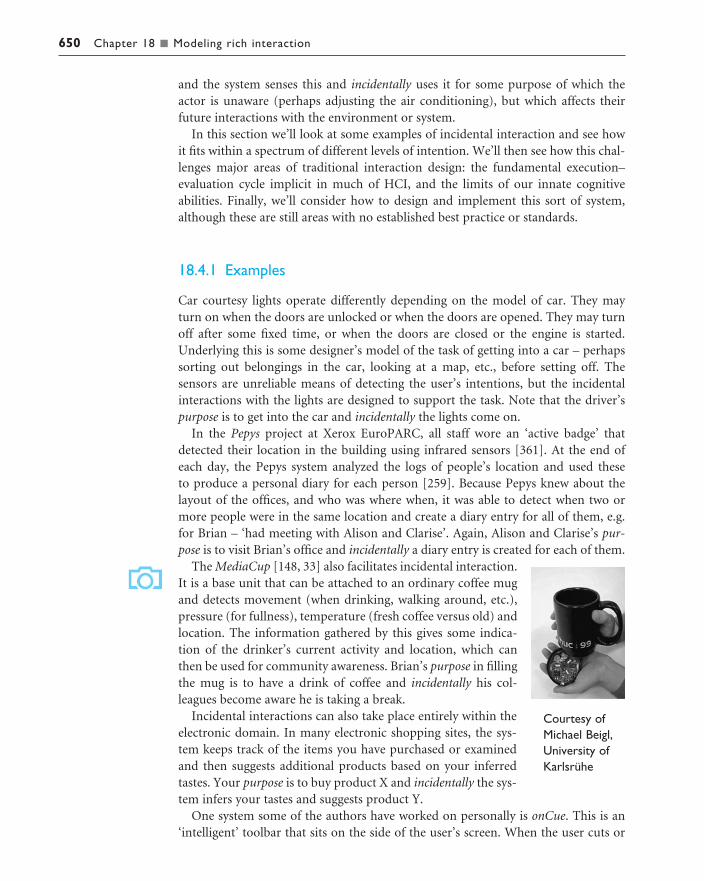
650 Chapter 18 n Modeling rich interaction
and the system senses this and incidentally uses it for some purpose of which theactor is unaware (perhaps adjusting the air conditioning), but which affects theirfuture interactions with the environment or system.
In this section we’ll look at some examples of incidental interaction and see howit fits within a spectrum of different levels of intention. We’ll then see how this chal-lenges major areas of traditional interaction design: the fundamental execution–evaluation cycle implicit in much of HCI, and the limits of our innate cognitive abilities. Finally, we’ll consider how to design and implement this sort of system,although these are still areas with no established best practice or standards.
18.4.1 Examples
Car courtesy lights operate differently depending on the model of car. They may turn on when the doors are unlocked or when the doors are opened. They may turnoff after some fixed time, or when the doors are closed or the engine is started.Underlying this is some designer’s model of the task of getting into a car – perhapssorting out belongings in the car, looking at a map, etc., before setting off. The sensors are unreliable means of detecting the user’s intentions, but the incidentalinteractions with the lights are designed to support the task. Note that the driver’spurpose is to get into the car and incidentally the lights come on.
In the Pepys project at Xerox EuroPARC, all staff wore an ‘active badge’ thatdetected their location in the building using infrared sensors [361]. At the end ofeach day, the Pepys system analyzed the logs of people’s location and used these to produce a personal diary for each person [259]. Because Pepys knew about thelayout of the offices, and who was where when, it was able to detect when two ormore people were in the same location and create a diary entry for all of them, e.g.for Brian – ‘had meeting with Alison and Clarise’. Again, Alison and Clarise’s pur-pose is to visit Brian’s office and incidentally a diary entry is created for each of them.
The MediaCup [148, 33] also facilitates incidental interaction.It is a base unit that can be attached to an ordinary coffee mugand detects movement (when drinking, walking around, etc.),pressure (for fullness), temperature (fresh coffee versus old) andlocation. The information gathered by this gives some indica-tion of the drinker’s current activity and location, which canthen be used for community awareness. Brian’s purpose in fillingthe mug is to have a drink of coffee and incidentally his col-leagues become aware he is taking a break.
Incidental interactions can also take place entirely within theelectronic domain. In many electronic shopping sites, the sys-tem keeps track of the items you have purchased or examinedand then suggests additional products based on your inferredtastes. Your purpose is to buy product X and incidentally the sys-tem infers your tastes and suggests product Y.
One system some of the authors have worked on personally is onCue. This is an‘intelligent’ toolbar that sits on the side of the user’s screen. When the user cuts or
Courtesy ofMichael Beigl,University ofKarlsrühe

18.4 Low intention and sensor-based interaction 651
copies any text, onCue examines the clipboard. It analyzes thecontent and, depending on the type of material, changes the toolitems to reflect it. If the copied text is a postcode, onCue sug-gests internet mapping services; if it looks like a name (initialcapitals, etc.), onCue suggests internet directory services; if thetext is a list or table of numbers, onCue suggests spreadsheet or graphing applications. As well as the triggering event beingimplicit, the ‘suggestion’ is deliberately low salience; the cur-rently suggested services slowly fade in as small icons in the tool-bar. Note again, the user’s purpose is to copy the text somewhereelse and incidentally potential useful services are offered. (Seethe onCue case study at /e3/casestudy/onCue/)
18.4.2 The intentional spectrum
If we look back at these examples and think of related ones, we can see that they dif-fer in just how ‘incidental’ the results are. If you get into the car and the courtesy lightdoes not come on you may notice. Even though you didn’t explicitly ask for the lightsto turn on, you still expect them to do so.
In fact, there is a continuum of intentionality (Figure 18.14). At one extreme are‘normal’ intentional interactions such as pressing the computer key or pressing alight switch and expecting the light to come on. This would also include, for example,a gesture recognition system. Imagine a complex image recognition system thatwatches your hand movements so that you can point at a particular light bulb andsay ‘light on’ or ‘light off ’. Although this would be far from a traditional computersystem, it is clearly intentional – the user wants the light on and deliberately doessomething that will have the desired effect.
The automatic lights that are found in some public toilets fit somewhere inbetween. They are based on infrared or ultrasonic sensors that detect movement. If there is movement they come on; if not they turn off. These are more like the carcourtesy light. When you walk in you expect the light to go on and would beunhappy if, as the door closed behind you, you found yourself in darkness.
Figure 18.14 The continuum of intentionality
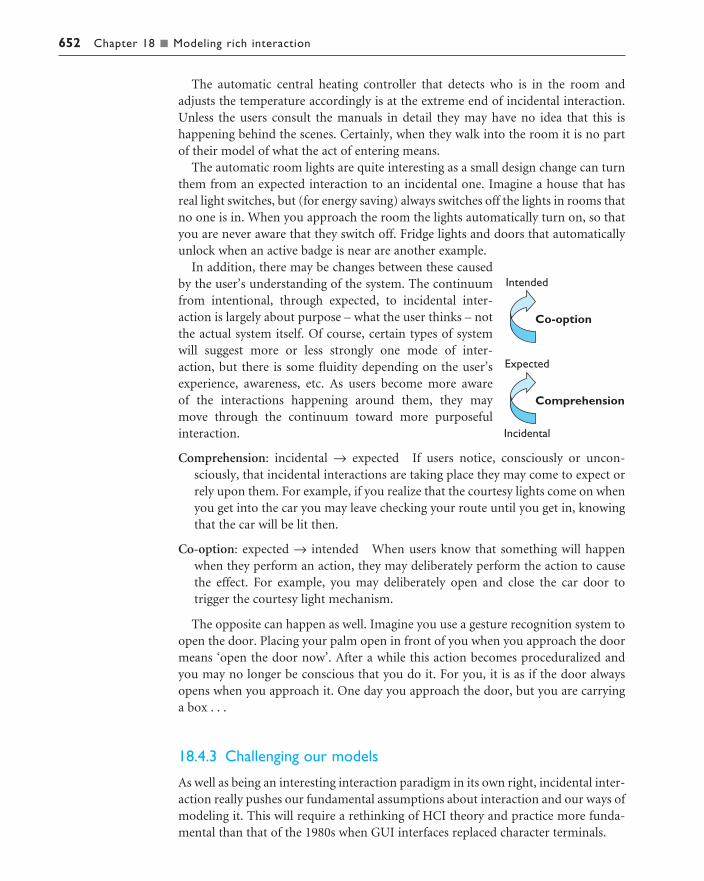
652 Chapter 18 n Modeling rich interaction
The automatic central heating controller that detects who is in the room andadjusts the temperature accordingly is at the extreme end of incidental interaction.Unless the users consult the manuals in detail they may have no idea that this is happening behind the scenes. Certainly, when they walk into the room it is no partof their model of what the act of entering means.
The automatic room lights are quite interesting as a small design change can turnthem from an expected interaction to an incidental one. Imagine a house that hasreal light switches, but (for energy saving) always switches off the lights in rooms thatno one is in. When you approach the room the lights automatically turn on, so thatyou are never aware that they switch off. Fridge lights and doors that automaticallyunlock when an active badge is near are another example.
In addition, there may be changes between these causedby the user’s understanding of the system. The continuumfrom intentional, through expected, to incidental inter-action is largely about purpose – what the user thinks – notthe actual system itself. Of course, certain types of systemwill suggest more or less strongly one mode of inter-action, but there is some fluidity depending on the user’sexperience, awareness, etc. As users become more aware of the interactions happening around them, they may move through the continuum toward more purposefulinteraction.
Comprehension: incidental → expected If users notice, consciously or uncon-sciously, that incidental interactions are taking place they may come to expect orrely upon them. For example, if you realize that the courtesy lights come on whenyou get into the car you may leave checking your route until you get in, knowingthat the car will be lit then.
Co-option: expected → intended When users know that something will happenwhen they perform an action, they may deliberately perform the action to causethe effect. For example, you may deliberately open and close the car door to trigger the courtesy light mechanism.
The opposite can happen as well. Imagine you use a gesture recognition system toopen the door. Placing your palm open in front of you when you approach the doormeans ‘open the door now’. After a while this action becomes proceduralized andyou may no longer be conscious that you do it. For you, it is as if the door alwaysopens when you approach it. One day you approach the door, but you are carryinga box . . .
18.4.3 Challenging our models
As well as being an interesting interaction paradigm in its own right, incidental inter-action really pushes our fundamental assumptions about interaction and our ways ofmodeling it. This will require a rethinking of HCI theory and practice more funda-mental than that of the 1980s when GUI interfaces replaced character terminals.
18.4 Low intention and sensor-based interaction 653
Interaction models
The explicit or implicit model behind nearly all interaction is some form of inten-tional cycle such as the Norman execution–evaluation loop [266]. The user has somegoal (intention), formulates some action that he believes will act toward that goal,performs the action and then reformulates future actions based on the feedback.
In traditional cognitive modeling, this is seen as very plan-driven, with goal stacks,hierarchies, etc. In these accounts, the intentional cycle is seen as starting with theuser, even to the point that the effects of feedback are often ignored. In more con-textual accounts of interaction, such as situated action [334] or distributed cognition[185], the goals or intentions are more at the level of overall motivations or end-stateaspirations. The focus tends to shift to a cycle of activity starting with the state of theworld and recent system ‘responses’, with the user acting on the world in response tothe current state. However, this is still clearly purposeful activity.
Incidental interaction and, to a lesser extent, expected interactions do not fit thispicture. The user and system share the experience of the user’s actions, but the pur-poseful activity of the user is distinct from the intended outcomes of the system.
This is not just a theoretical issue: it is an underlying assumption that cuts throughnearly every usability guideline, principle and method. For example, the importanceof rapid and visible feedback is based on the assumption that users need to under-stand fully the effect of their actions. In incidental interaction and low awarenessapplications the opposite is often true; feedback may be unobtrusive (and not expli-citly noticed) or delayed (e.g. the heating level slowly changing). Even expected inter-actions are more likely to be noticed when they don’t happen than when they do.
Cognition
Natural inanimate physical things have a set of properties intrinsic to their physicality:
Directness of effect You push something a little and it moves a little, you push hardand it moves a lot.
Locality of effect Effects are here and now. If you pushed a rock and then two sec-onds later it moved you would be disturbed.
Visibility of state Solid objects have a small number of relevant parameters thatdefine their dynamic state: location, orientation. We have some difficulty withinvisible properties such as velocity and even more when physical things have hid-den states, for example the joke balls that have a ball bearing inside and so do notmove in a straight line. Of course, this example is not natural but constructed.
We have evolved as creatures to cope with physical things and other creatures, nottechnological devices. Although we have higher-level reasoning that enables us tocope – the same reasoning that enables us to create technology – this is only signific-ant when we ‘think about’ things; our more innate cognitive abilities are shaped bythe natural.
Computer systems (and other complex technology such as electrical and pneumaticsystems) break these intrinsic properties of physical objects. Computation createscomplexity of effect, networks introduce non-locality in space, memory non-locality

654 Chapter 18 n Modeling rich interaction
in time, and a computer has a vast number of invisible variables in its hidden internal state.
We cope (just) with this, because either we rationalize and use higher-level think-ing to make sense and to make models of these complex non-physical interactions,or we treat the computer as animate. In addition, one of the reasons for the develop-ment of the GUI interface style is that it makes the electronic world more like real(inanimate) things.
In incidental, expected and low awareness interactions the design is such that theuser is not paying attention to, or is unaware of, the system’s activities. That is, weare not able to bring our higher cognitive abilities to bear and are dependent on ourmore innate intelligences, which are, of course, ill prepared for unphysicality. Tomake matters worse, the system activities are often triggered by physical actions andmovements of the user and are manifest in the physical world. In a computer systemwe are able to re-frame ourselves to expect odd or apparently magical actions tooccur. In the real world these are deeply disturbing.
18.4.4 Designing for incidental interaction
Traditional task analysis is also highly purposeful, although debatably less wedded tothis than cognitive models. Certainly, to cope with more contextual interactions taskanalysis methods need to evolve to include or link to representations that are moreabout the physical world and the rich ecology of lived work or domestic life. In theprevious section we examined some of the potential issues and extensions that maybe necessary for this.
However, incidental interaction poses a more fundamental question – what task dowe need to model? In incidental interaction, we have two ‘tasks’ that are occurring:
1. The user’s primary task – their purposeful activity.2. The task that the incidental interaction is attempting to support or achieve.
Often, as in the case of the courtesy light, the two are the same task, but it is used indifferent ways. The user’s purposeful activity is assumed to occur, to a large extent,independently of the system’s actions. We need to model it in order to computa-tionally interpret the user’s actions as activity. In contrast, we need to model (2) inorder to understand how to facilitate or progress it.
In addition, low intention and sensor-based systems often include uncertain inferences. In traditional interfaces there is intended to be no ambiguity – the userpresses the ‘x’ key and an ‘x’ appears in the document. Of course, the user may havemistyped, or may not realize the system is in a mode where ‘x’ means ‘exit’, but theseare ‘errors’ or misdesigns; if all is going well there is no ambiguity. In contrast, a sensor-based system may ‘think’ that you are resting because you are not movingabout much and turn down the music volume, but you may simply be sitting still listening to the strident sounds of Beethoven’s Fifth Symphony. Happily, the thingscontrolled or intended to be controlled by these interactions are often less critical.You might like the heating a little warmer or colder, but it is not absolutely essentialwhether the system gets it right.

18.4 Low intention and sensor-based interaction 655
At the time of writing, there are no developed methods for dealing with these lowintention interactions, although there are some proposals [111, 319]. However, wecan begin to see how more traditional methods may change to accommodate thesenew interaction styles.
Clearly any design for low attention must identify two things:
input – what is going to be sensed (e.g. body heat, pressure pad)
output – what is going to be controlled (e.g. light, heating).
Once we know these we can look at scenarios or task models and label them to seewhat we would like to happen at each step. In some cases there will be a definiterequirement (e.g., the car courtesy lights must not be on when the car is moving), in
DESIGN FOCUS
Designing a car courtesy light
The first step in designing a sensor-based system is to work out what you would like to control. In thiscase the car’s interior light. Next we look through some scenarios and label the steps. At each stagewe note whether the lights should be on (more pluses) or off (more minuses). Here is one such scenario:
1. deactivate alarm 02. walk up to car M is this safe?, advertises presence3. key in door −4. open door and remove key +5. get in + +6. close door 07. adjust seat +8. find road atlas + +9. look up route + + +
10. find right key +11. key in ignition −12. start car 013. seat belt light flashes 014. fasten seat belt +15. drive off – – – – illegal !
Step 2 is interesting, if you ask different people you get different responses. Some like to see the lightsgo on when the alarm is disarmed. However, others fear it advertises their presence and leaves themvulnerable to attack.
Note, too, that we have assumed the alarm remote control does not actually unlock the car. This waspartly so that we could have step 3 where the lighted interior makes it slightly more difficult to put thekey in the car door.
At this stage, we can either work a full task analysis and mark this up similarly so that each task andsubtask has a desired lighting attached. Alternatively we could move forward to a more detailed design.
See the book website for the full case study: /e3/casestudy/car-lights/

656 Chapter 18 n Modeling rich interaction
others there may be simply a desire (e.g., it would be good for the light to be on toput the key in the ignition). Of course, the steps in the task or scenario may involveuser intentions or other aspects of context not immediately available to the computersystem – that is why we need to be able to infer this context. To do this, we can lookat the available sensors and see how certain we can be of the current context basedon their data. This can then be used both to verify whether we can be certain of thecontext at points at which there is a definite requirement (and add explicit controlsif not), and also to be able to control the output at other times so that the users usu-ally (but not always) get what they want.
18.4.5 Implementing sensor-based systemsIn incidental interactions it is very likely that sensors are not used solely for theiroriginal purpose. This suggests the need for quite open architectures. For example,onCue uses a very open blackboard-style architecture for exchanging informationbetween self-discovering and self-configuring components [106]. Unfortunately, at the level of individual applications it is far harder to get contextual informationwithout writing special code for each potential application. This is one of the reasonsfor using copy/cut to the clipboard as the main trigger – it is one of the few cross-application standards.
Furthermore, many of the contextual interactions envisaged in this area occur indomestic or other private environments. If we are not careful, architectural opennesscould violate privacy – imagine if the can of beans (with intelligent food label) youjust bought communicated back to the manufacturer the contents of your food cupboard.
Highly contextual interactions must also take on board the fact that many of the most important phenomena are not events (things that happen at specificmoments), but status (things that always have some measurable value). Status–eventanalysis highlights common phenomena that can be used to understand such systems, but this also impacts on the underlying system architectures [94, 102].
Although there are many research and commercial systems being produced usingsensors, there are no clear ‘standard’ architectures like the Seeheim model or MVC(see Section 8.5.1) developed for traditional interfaces. However, there are some fea-tures that are likely to be present in many systems (see Figure 18.15).
Some sensor-based systems may employ quite simple sensors, for example thedoor open/closed sensor for car courtesy lights. However, where the raw sensors are capturing richer data it may well be that there is too much data to process fully.In these cases, the sensors may have to somehow filter or pre-process their outputsbefore passing on their data. For example, the MediaCup senses the temperature ofthe cup and pressure on the bottom of the cup, and has ball bearing sensors to giveapproximate tip in two x–y directions, all of which could be sensed many times persecond and at high resolution. However, only a small bit-mask with indicators suchas hot/cold, moving/still is sent via the infrared link to the network.
Often the results from several sensors may need to be processed together to give a usable output. For example, several heat sensors may be averaged. This is a form of data fusion – bringing together multiple data sources to build a more accurate

18.5 Summary 657
picture. This data fusion stage may also reduce the information; for example, the single average from 10 individual temperature readings.
These processed sensor readings are then used to drive some form of inference.This may be a few hand-coded rules: ‘when Alison’s MediaCup is moving she is inthe office’; more sophisticated rule-based systems; or some form of neural network.This inference will typically interact with some form of model of the users’ contextbuilt up over time. For example, if in the past the ultrasound sensors have detectedmovement in a room and the pressure sensors under the doormat have not beentriggered, then the system ‘knows’ there is likely to be someone there, even thoughthe ultrasound sensors currently detect no movement.
Finally, this contextual information has to be used. It may be used directly to drive some controlled output, for example, the lights in the car or room heater.Alternatively, it may be used to modify the effects of users’ actions based on theinferred context. For example, depending on who is believed to be in the house andthe time of day, the TV may default to different channels when it is turned on.
SUMMARY
Real interaction is not simply pressing a button and seeing something happen onscreen. In this chapter we have looked at some of the ways to model and understandrich aspects of interaction.
We looked at status–event analysis, an ‘engineering’-level technique that encom-passes formal methods, semi-formal analysis and naïve psychology, allowing us toconsider issues that bridge system and user behavior. Whereas most formal notationsfocus on the state changes occurring at particular moments (events), status–eventanalysis puts equal weight on status phenomena, such as computer screens, whichalways have a value. Important properties of status–event descriptions include the
18.5
Figure 18.15 Potential architecture of sensor-based system

658 Chapter 18 n Modeling rich interaction
difference between actual and perceived events, polling to discover status change andthe granularity of time. Timeline diagrams showing events and status in human–computer interaction allowed us to examine the delays in notification of emailarrival and errors using on-screen buttons.
In Section 18.3 we looked at the way existing task models could be extended toencompass rich contexts including other people and physical artifacts. Several exist-ing techniques including CTT and GTA already include ways to allocate subtasks fordifferent human and machine roles. In contrast, few methods deal well with theinformation required at each stage, although this is not difficult to add. In order to keep tasks operating in the right order at the right time, we saw that physical arti-facts as well as other external events act as triggers that make things happen whenthey happen, and placeholders implicitly record where people are in a process.
Finally, we looked at the way that some recent ubiquitous computing applicationshave radically new modes of interaction. We considered a continuum based on thelevel of intentionality. At one extreme were traditional intentional acts. At the otherextreme was incidental interaction where the user acts for one purpose and incident-ally the system interprets the action to aid or help the user. In between is behaviorthat the user does not explicitly request, but which is expected to occur. These low intention interactions cannot easily be understood within standard models ofinteraction. As yet there are no established design techniques or implementationarchitectures, but we saw that there are promising early methods.
EXERCISES
18.1 Can you suggest any improvements to the screen button feedback problem discussedin Section 18.2.5 that would distinguish at the interface between the two cases of hitting or miss-ing the button? Is there any guarantee with your solution that the user will notice the distinction?
18.2 Brian wants to make a dinner date with Alison. He knows she will not be able to read email, asshe is away for a few days, and he doesn’t have her hotel number. He types and prints a letter,which he puts in her pigeonhole. Alison’s secretary always checks the pigeonhole several times aday, and when she finds the letter she reads it and rings Alison and tells her.
Analyze this story using a status–event description.
18.3 Look again at the tea-making task analysis in Chapter 15 (Figure 15.4). Go through this and lookfor triggers and placeholders. You will need to make assumptions (e.g. is the kettle the kind thatwhistles when it boils?) so document these.
18.4 Rank the following in terms of levels of intention or consciousness:
automatic doors into hotel, automatic water taps in washbasin, reversing lights in a car, ultra-sonic burglar alarm, auto-numbering lists in a word processor, web page counter, font menuin word processor that shows recent fonts at the top of the list
If you are working in a group, you could each rank them separately and then discuss your answers.
Why are some more consciously considered than others?
Think of more examples.

Recommended reading 659
RECOMMENDED READING
P. Dourish, Where the Action Is: The Foundations of Embodied Interaction, MIT Press,2001.Philosophical and practical discussion of what Dourish calls ‘embodied inter-action’, that is interaction taking place in a real physical and social context.
F. Paternó, Model-Based Design and Evaluation of Interactive Applications, Springer-Verlag, 2000.A full design methodology and approach focussed on the use ofConcurTaskTrees. Note that the collaborative aspects of CTT were developedafter this book.
A. Dix, D. Ramduny-Ellis, J. Wilkinson, Trigger analysis – understanding brokentasks. In D. Diaper and N. Stanton, editors, The Handbook of Task Analysis forHuman–Computer Interaction, Lawrence Erlbaum, 2003 (in press).Detailed treatment of the triggers and placeholders discussed in Section 18.3.
B. Nardi and V. O’Day, Information Ecologies – Using Technology with Heart, MITPress, 1999.A beautiful book probing the rich interactions between people and technology. It seeks to find a middle way between those who abhor technology and those who adore it. The majority of the material in the book is structured around realcase studies of systems in different settings from schools to hospitals, libraries tooffices. It is full of vignettes like the researcher who, failing to make conversationwith a group of schoolchildren, sits down at a terminal near them and instantlybecomes accepted within their online community.


OUTSIDE THE BOX
In this part, we look in more detail at interactive applicationsthat go beyond a single user with a desk-based computer. InChapter 19 we revisit group interaction, this time focussingon groupware technology itself: what it can support, how it can be classified, and what particular implementation challenges it presents. In Chapter 20 we look at systemsthat link the real world with electronic worlds, examining ubiquitous and context-aware computing and virtual reality,including its use in information visualization. Chapter 21looks at the design and use of hypertext and multimediasystems. In particular, it examines the role of the worldwide web in popularizing hypertext and examines somespecific design issues for the web.
P A R T
4


GROUPWARE
OV E RV I E W
Groupware is a term for applications written to supportthe collaboration of several users.
n Groupware can support different activities:– direct interpersonal communication– ideas generation and decision making– sharing computer objects.
n It can be classified in several ways:– by where and when it happens– by the sort of information shared– by the aspects of cooperations supported.
n Implementing groupware is more difficult than single-user applications:– because of network delays– because there are so many components to go wrong– because graphical toolkits assume a single user.
19

664 Chapter 19 n Groupware
INTRODUCTION
Much of the discussion in this book concerns a single user with a computer.However, in Chapter 14 we met computer-supported cooperative work (CSCW ),which is about groups of users – how to design systems to support their work as agroup and how to understand the effect of technology on their work patterns. BothHCI and CSCW draw on knowledge from a wide range of disciplines, but whereasthe principal axis in HCI is psychology–computing, the equivalent axis in CSCW issociology–computing. If we allow the human in HCI to be plural, we can regardCSCW to be within the general sphere of HCI, which is why it is present in this book and in conferences and journals on HCI. However, CSCW is now a field initself, and would require a book of its own to do it justice. We looked at models of collaboration in Chapter 14; here we turn our attention to the technology thatsupports group working.
One major area within CSCW is the provision of computer systems to supportgroup working. These products are often called groupware. As the reader may nothave come across any but the most common of such systems, this chapter describesthe range of such groupware systems and the associated architectural and imple-mentation issues. In addition, we shall discuss frameworks that classify groupwaresystems and that describe how they fit into the wider area of cooperative working.Many of these applications are research systems; however, the number of commer-cial systems with a groupware component has risen significantly over recent years.
Any computer system, whether or not it is specifically groupware, will have aneffect on the work-groups within an organization and upon the organization as awhole. It is not possible to cover the full sociological and anthropological back-ground that is being brought to bear on these issues, but it is important that thereader is aware of these knock-on effects of even individual computer systems. In Chapter 14, we described some of the theory of human communication and thegroup and organizational factors that influence the design of groupware.
GROUPWARE SYSTEMS
In this chapter, Sections 19.3–19.5 describe a range of groupware systems, fromemail and video conferencing to shared editors and co-authoring systems. Section19.6 uses several frameworks that help us to analyze groupware systems, and whichwill give some structure to the issues that arise during the previous three sections.Section 19.7 discusses some of the implementation problems facing a groupwaredeveloper.
Groupware can be classified in several ways. One of these is by where and when theparticipants are performing the cooperative work. This is summarized in a time/spacematrix. Another classification is by the function of the system, for example meeting
19.2
19.1

19.2 Groupware systems 665
support or group authoring. The subsections on specific areas of groupware followthis functional classification. However, there are at least 10 such categories here and the list could extend as fast as one could think up new application areas. To give abroader categorization for the sections, we follow a framework that classifies group-ware by the aspect of cooperative work which it supports.
The rest of this section describes briefly the time/space matrix and cooperativework framework, both in terms of non-computerized ‘real-world’ examples. We willreturn to these and other frameworks in Section 19.6, once the reader is familiar withthe range of groupware systems currently available. As with analysis techniques for single-user systems, these frameworks can help to structure the design of new systems, or to suggest possible application areas.
The time/space matrix is a very useful shorthand to refer to the particular circum-stances a groupware system aims to address. Basically, we look at the participantsand ask whether they are in the same place or not, and whether they are operating atthe same time or not. Figure 19.1 shows how various non-computer communicationtechnologies fit into the time/space matrix.
The axes are given different names by different authors. The space dimension isalso called the geographical dimension and is divided into co-located (same place)and remote (different place). Many of the earliest groupware systems were aimed at overcoming the barriers of distance, for example email and video conferencing.More recently, systems have arisen which aim to augment face-to-face meetings andother co-located cooperation.
The time axis is often divided into synchronous and asynchronous systems; so wewould refer to a telephone as a synchronous remote communication mechanism,whereas sticky notes are asynchronous co-located. These terms are used heavily in the CSCW literature; often the intended geographical location is obvious fromcontext, or the application domain, and thus synchronous/asynchronous becomesthe principal distinction. However, there are some problems with this simple
Figure 19.1 Time/space matrix
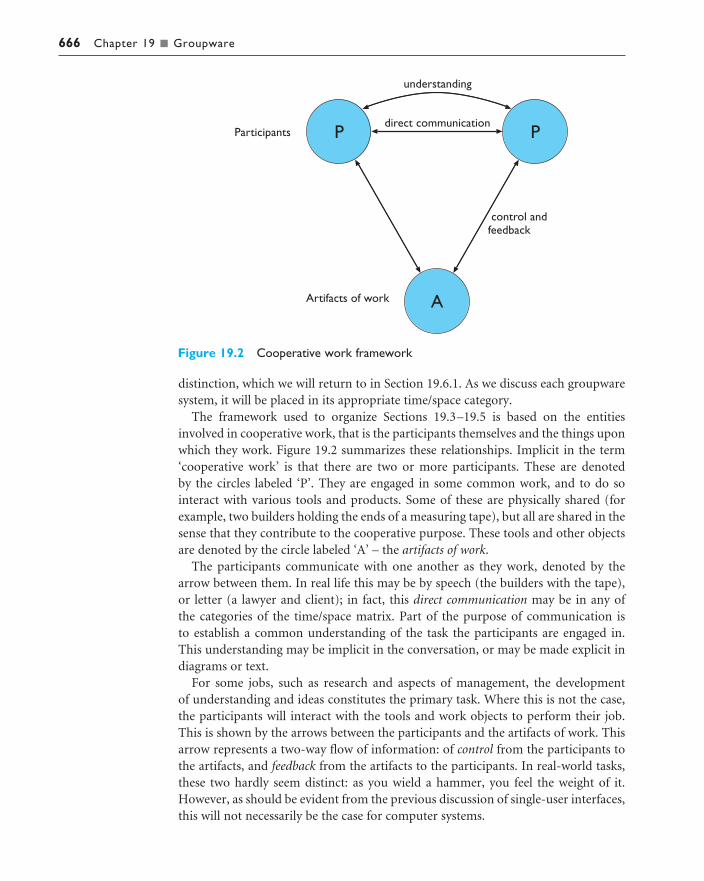
666 Chapter 19 n Groupware
distinction, which we will return to in Section 19.6.1. As we discuss each groupware system, it will be placed in its appropriate time/space category.
The framework used to organize Sections 19.3–19.5 is based on the entitiesinvolved in cooperative work, that is the participants themselves and the things uponwhich they work. Figure 19.2 summarizes these relationships. Implicit in the term‘cooperative work’ is that there are two or more participants. These are denoted by the circles labeled ‘P’. They are engaged in some common work, and to do sointeract with various tools and products. Some of these are physically shared (forexample, two builders holding the ends of a measuring tape), but all are shared in thesense that they contribute to the cooperative purpose. These tools and other objectsare denoted by the circle labeled ‘A’ – the artifacts of work.
The participants communicate with one another as they work, denoted by thearrow between them. In real life this may be by speech (the builders with the tape),or letter (a lawyer and client); in fact, this direct communication may be in any of the categories of the time/space matrix. Part of the purpose of communication is to establish a common understanding of the task the participants are engaged in.This understanding may be implicit in the conversation, or may be made explicit indiagrams or text.
For some jobs, such as research and aspects of management, the development of understanding and ideas constitutes the primary task. Where this is not the case,the participants will interact with the tools and work objects to perform their job.This is shown by the arrows between the participants and the artifacts of work. Thisarrow represents a two-way flow of information: of control from the participants tothe artifacts, and feedback from the artifacts to the participants. In real-world tasks,these two hardly seem distinct: as you wield a hammer, you feel the weight of it.However, as should be evident from the previous discussion of single-user interfaces,this will not necessarily be the case for computer systems.
Figure 19.2 Cooperative work framework

19.3 Computer-mediated communication 667
We will classify groupware systems by the function in this framework which theyprimarily support:
computer-mediated communication supporting the direct communication betweenparticipants;
meeting and decision support systems capturing common understanding;
shared applications and artifacts supporting the participants’ interaction withshared work objects – the artifacts of work.
Of course, many systems may support more than one of these functions, and indeedthis can be seen as a sign of good groupware. Furthermore, there are some furtherrelationships between these functions. Both these aspects will be developed inSection 19.6.3.
COMPUTER-MEDIATED COMMUNICATION
Implicit in the terms groupware and CSCW is that we have two or more participantsand that they are communicating with one another. We begin by looking at systemswhich support this direct communication. This is called computer-mediated commun-ication (CMC), and is an important part of CSCW. However, good communicationis not sufficient – the participants must be able to cooperate about their work.Improving communications may help this, but not necessarily.
Under the heading of computer-mediated communication we will look at emailand bulletin boards, well-established, largely text-based means of asynchronous remotecommunication, structured message systems, developed from simple email, instantmessaging and SMS, and various video-based systems, which support synchronousremote communication.
19.3.1 Email and bulletin boards
Most readers of this book will have used some form of email system. Many will alsohave used some form of bulletin board or electronic conferencing system such asUsenet News or Yahoo! Groups. Although among the simplest groupware systems,they are most certainly the most popular and successful.
Consider the stages during the sending of a simple email message:
1. Preparation You type a message at your computer, possibly adding a subjectheader.
2. Dispatch You then instruct the email program to send it to the recipient.3. Delivery At some time later, anything from a few seconds (for LAN-based email)
to hours (for some international email via slow gateways) it will arrive at therecipient’s computer.
19.3

668 Chapter 19 n Groupware
4. Notification If the recipient is using the computer a message may be displayed,saying that mail has arrived, or the terminal may beep.
5. Receipt The recipient reads the message using an email program, possibly differ-ent from that of the sender.
These stages differ slightly from tool to tool, but are essentially similar. For example,preparation may take place within the mail tool itself, or the tool may import anexternally prepared document. Although email systems are so well known and simple,they have been the springboard for several more advanced groupware applications.
In theory, from the user’s perspective we need not worry about the exact deliverymechanism – it should be hidden – just as we do not worry about the details of telephone exchanges. However, with email these mechanisms become only tooapparent, most obviously in the varying delays we may experience and in the reli-ability of different channels. These factors are not always predictable as they maydepend on faults and loadings of computers used to relay the message. Furthermore,error messages and even the forms of addressing relate directly to the path fromcomputer to computer which the message takes.
In the simple email example, there was just one recipient. However, most emailsystems also allow a set of recipients to be named, all of whom receive the message(see Figure 19.3). Like letters, these recipients may be divided into the direct recipi-ents (often denoted by a To: field) and those who receive copies (Cc:). These twotypes of recipient are treated no differently by the computer systems – the distinctionserves a social purpose for the participants. This is a frequent observation about anygroupware system – the system should support people in their cooperation.
Often users will be able to set up distribution lists, named groups of other users to whom mail is often sent. There is only a small difference between the use of suchlists and fully fledged bulletin boards or electronic conferencing systems. In thesesystems you address your message (or contribution) to a particular conference ornewsgroup, and then anyone who has subscribed to that newsgroup receives themessage.
It is to be expected that the differences between email and electronic conferencing,especially within the interface, will blur over time. However, there are important differences for the participants. First, they vary in terms of who controls the
Figure 19.3 Simple email message
To: janet, abowdFrom: alanSubject: HCI bookCc: [email protected]
How are your chapters getting on?Could one of you meet me over lunch?I’m having trouble using the minipageenvironment doing illustrations of email messages.

19.3 Computer-mediated communication 669
distribution list. Some email distribution lists are private to the sender, that is thesender can vary the list at will, and knows exactly who is on it. Alternatively, a distribu-tion list may be shared, in which case it is often added to and updated by the systemadministrator. Finally, in a bulletin board or news systems, it is the recipient whodecides which newsgroups to subscribe to. For example, Usenet News sends all newsitems to all connected computers. Users may well read contributions posted beforethey subscribed, and certainly the sender will have no idea as to who will read thecontribution. We can see this progression in two ways. One is control which movesfrom the sender, to the administrator and then to the recipient. The second is thenature of the recipient, from specific individuals in email, through organizational orsocial groups, to topic areas. Again these different emphases have important socialimplications – communication is about people, not systems.
Although email between sites takes from several minutes to hours to arrive, LAN-based email within a single site will often arrive within seconds. It is thus possible to have email ‘conversations’. Typically email interfaces are not designed to deal withthis form of exchange, but it is relatively easy to have a sequence of exchanges, sayevery minute or so. Many computer systems also allow a form of synchronous text-based communication, whereby two (or more) participants can instantly see eachother’s contributions. Examples of this are the UNIX ‘talk’ program or VAX ‘phone’.In these, the participants’ screens are divided into two and while your typing goes tothe bottom half, your colleague’s goes into the top. The typing is usually echoedcharacter by character, so you can see your colleague’s half-typed phrases, deletions,etc. A variant of this concept, used as part of several groupware systems, is to have asingle transcript. The participants have a separate composition area and when theyhit the return key (or click on a special button), their contribution is added to theend of the transcript. Notice the difference in granularity : the ‘talk’ program workswith a grain size of characters, whereas the transcript acts on contributions (often a single line, or at most a short paragraph). The granularity of standard email andbulletin boards tends to be greater again, as people may send quite large messages(although some interfaces discourage this).
The ether never sleeps
One advantage of asynchronous messages is that they do not interrupt your work and allowyou to pursue tasks in your own way, giving you greater autonomy and personal control.
Because of the ubiquity of internet mail and personal access via modems, it is increasingly the casethat people (especially in the US) assume that you read email every day, either at the office or athome – including weekends and when you are on holiday! You may arrive back after a weekendor week away at a conference and find messages which expect you to have done something yes-terday . . . autonomy and personal control?
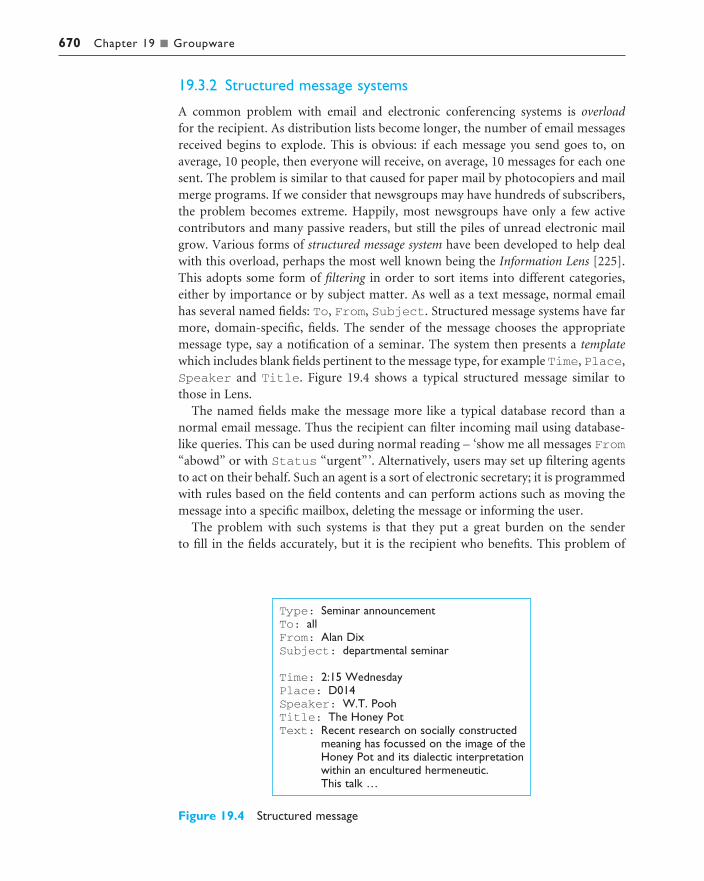
670 Chapter 19 n Groupware
19.3.2 Structured message systems
A common problem with email and electronic conferencing systems is overloadfor the recipient. As distribution lists become longer, the number of email messagesreceived begins to explode. This is obvious: if each message you send goes to, onaverage, 10 people, then everyone will receive, on average, 10 messages for each onesent. The problem is similar to that caused for paper mail by photocopiers and mailmerge programs. If we consider that newsgroups may have hundreds of subscribers,the problem becomes extreme. Happily, most newsgroups have only a few activecontributors and many passive readers, but still the piles of unread electronic mailgrow. Various forms of structured message system have been developed to help dealwith this overload, perhaps the most well known being the Information Lens [225].This adopts some form of filtering in order to sort items into different categories,either by importance or by subject matter. As well as a text message, normal emailhas several named fields: To, From, Subject. Structured message systems have farmore, domain-specific, fields. The sender of the message chooses the appropriatemessage type, say a notification of a seminar. The system then presents a templatewhich includes blank fields pertinent to the message type, for example Time, Place,Speaker and Title. Figure 19.4 shows a typical structured message similar tothose in Lens.
The named fields make the message more like a typical database record than a normal email message. Thus the recipient can filter incoming mail using database-like queries. This can be used during normal reading – ‘show me all messages From“abowd” or with Status “urgent”’. Alternatively, users may set up filtering agentsto act on their behalf. Such an agent is a sort of electronic secretary; it is programmedwith rules based on the field contents and can perform actions such as moving themessage into a specific mailbox, deleting the message or informing the user.
The problem with such systems is that they put a great burden on the sender to fill in the fields accurately, but it is the recipient who benefits. This problem of
Figure 19.4 Structured message
Type: Seminar announcementTo: allFrom: Alan DixSubject: departmental seminar
Time: 2:15 WednesdayPlace: D014Speaker: W.T. PoohTitle: The Honey PotText: Recent research on socially constructed
meaning has focussed on the image of theHoney Pot and its dialectic interpretationwithin an encultured hermeneutic. This talk …

19.3 Computer-mediated communication 671
disproportionate benefit recurs throughout CSCW. In order to make the job of thesender as easy as possible, message types will often be created with easy defaults forfields, and perhaps menus of alternatives. Also, in order to make finding appropriatemessage templates easier, they may be arranged in a type hierarchy.
Until recently these structured message systems were only found in academic andresearch centers, but simpler forms are now available in commercial PC-based emailproducts.
More complex structured message systems are based on models of conversation.So, for example, if I am sent a message of type ‘request for information’, I am obligedto return either a message of type ‘informative reply’ or of type ‘don’t know’. Thereis a variety of such systems differing in the models used and the rigidity with whichthey are applied. In the most rigid, you are only allowed one of the pre-programmedreplies, whereas more flexible systems merely suggest possibilities. We discussed onesuch system, Coordinator, in Chapter 14 (Section 14.3.6), in the context of models ofconversation.
There is, in fact, considerable debate between those who feel that messaging systems should impose conversational structures and constraints, and those whobelieve they should supply systems within which the participants can develop theirown structures. It is argued that such user-defined structures are more likely to meetusers’ needs, and the systems will be more flexible to accommodate changes in groupworking. The message systems based upon conversational models are the most con-strained. Those offering structured messages, as we have described above, are towardthe middle of the spectrum. The original email and bulletin board systems were atthe other, unstructured, extreme, but lack sufficient features for the users to definetheir own structure. More modern systems from the ‘user-structured’ arena aredeveloped from the bulletin board concept, but are more like a shared hypertext. Thestructure allowed by links and cross-references allows users to have subconferencesand digressions, to annotate each other’s messages and to post follow-on messages.An example of such a system is the Amsterdam Conversation Environment [113].
This conflict between global structuring by the designers and local structuring bythe participants in their own situation arises within many areas of CSCW and hassimilarities to issues of user control in HCI in general (see Chapter 7).
19.3.3 txt is gr8
While groupware developers produce more and more complex structured messagesystems, in the wider world people have voted with their fingers and adoptedunstructured informal text messaging systems: instant messaging while online andSMS or paging through mobile phones.
In November 1996 a small Israeli start-up company, Mirabilis, launched a program,ICQ, that allowed registered users to send short text messages to one another. By2003 this had grown to over 100 million users. Other large internet companies soonnoticed this rapidly growing phenomenon, including AOL and Yahoo! who launchedtheir own, incompatible, messaging systems based on their existing user groups.

672 Chapter 19 n Groupware
Many readers will have accounts with one or more of the instant messaging (IM) clients. Compared with email, messaging is more lightweight and instant. Userscan send a message, usually a single line of text, to any other registered user of thesystem. If the other user is currently logged into the system they receive an instantnotification of the message and can start a chat-style session. If the other user is notlogged in, the central system remembers the messages and when the user next logson they receive any messages stored for them. So IM systems are unusual in that theyallow a fluid movement between asynchronous and synchronous use.
Whereas email is more like an exchange of letters, IM is more like conversationwith short exchanges, often not even complete sentences.
Hi, u thereyeh, had a good night last night?uhuwant to meet later
Because of the conversational style there is extensive use of emoticons or smilies (seeSection 14.4.1). Whereas in traditional email these were simply a text conventionsuch as ‘:-)’, messaging systems (and now many email systems too) substitute smallicons (like the face above) and allow easy insertions of faces using drop-down lists.
SMS stands for Short Message Systems, but few users know this or care – they simply send an ‘SMS’ or ‘text’ a friend. The SMS phenomenon is a salutary lesson to any of us who believe we can design the future. It was originally an ‘extra’ service,making use of a technical fix that allowed mobile phone companies to send messagesto mobile phones to inform of voicemail or update internal settings. However, inmany countries SMS has overtaken voice calls in its use of airtime.
Like IM, SMS messages are short plain text messages – limited to 160 characters inthe original system. However, the potential recipient is anyone with a mobile phone.SMS was able to break the critical mass problem (see Chapter 13) because even whenonly a few phones were able to send SMS messages, many existing phones were ableto receive them. The real surprise of SMS was not just that it grew, but that the groupwho adopted it as their own were not business people wanting the latest stockupdate, or sales representatives sending an order, but teenagers. From being an add-on service, text messaging became the reason people bought mobile phones andpricing plans are often focussed on the number of free text messages per month.
Perhaps the defining feature of SMS text messages is the fact that they are entered via a telephone keypad. To type ‘hello’ you typically need to type‘4433555pause555666’ using multiple number keys to produce the letters. SMS userssoon ‘lrnt 2 txt usng shrt wds’, both to reduce the effort of typing so many letters andalso to allow longer messages within the same 160 character limit. Belatedly, tech-nology caught up and text entry was made easier using the T9 algorithm (T9 is atrademark of Tegic Communications), which matches single number strokes againsta dictionary: so ‘43556’ becomes ‘hello’, as other matches to the digits such as ‘gfjkn’are not proper words. Paradoxically, many experienced txt-ers turn this off as itmakes the messages longer (and so fits less into 160 characters) and also looks less cool!
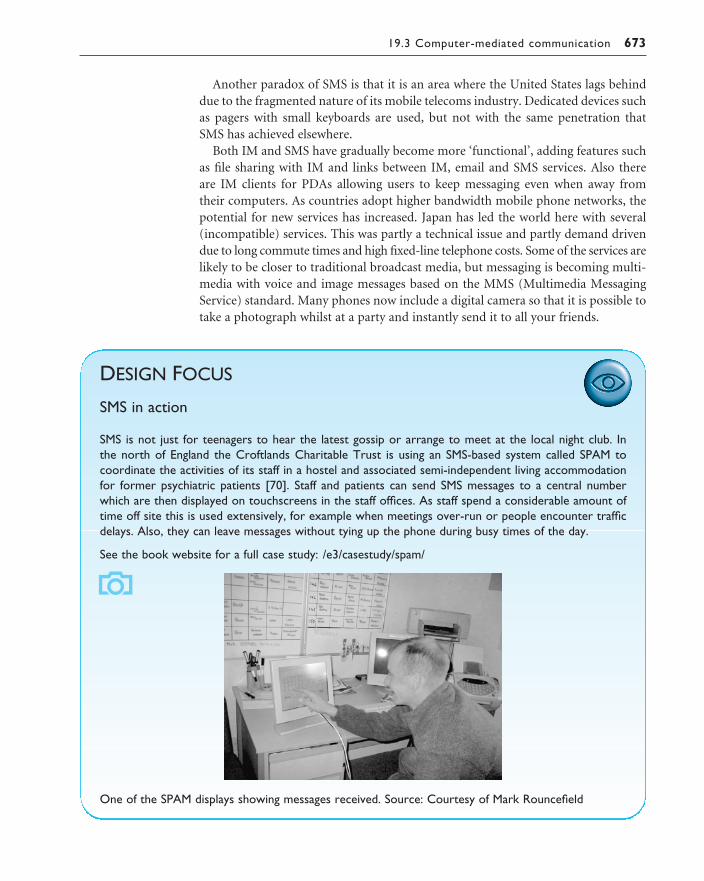
19.3 Computer-mediated communication 673
Another paradox of SMS is that it is an area where the United States lags behinddue to the fragmented nature of its mobile telecoms industry. Dedicated devices suchas pagers with small keyboards are used, but not with the same penetration that SMS has achieved elsewhere.
Both IM and SMS have gradually become more ‘functional’, adding features suchas file sharing with IM and links between IM, email and SMS services. Also there are IM clients for PDAs allowing users to keep messaging even when away from their computers. As countries adopt higher bandwidth mobile phone networks, thepotential for new services has increased. Japan has led the world here with several(incompatible) services. This was partly a technical issue and partly demand drivendue to long commute times and high fixed-line telephone costs. Some of the services arelikely to be closer to traditional broadcast media, but messaging is becoming multi-media with voice and image messages based on the MMS (Multimedia MessagingService) standard. Many phones now include a digital camera so that it is possible totake a photograph whilst at a party and instantly send it to all your friends.
DESIGN FOCUS
SMS in action
SMS is not just for teenagers to hear the latest gossip or arrange to meet at the local night club. In the north of England the Croftlands Charitable Trust is using an SMS-based system called SPAM tocoordinate the activities of its staff in a hostel and associated semi-independent living accommodationfor former psychiatric patients [70]. Staff and patients can send SMS messages to a central numberwhich are then displayed on touchscreens in the staff offices. As staff spend a considerable amount oftime off site this is used extensively, for example when meetings over-run or people encounter trafficdelays. Also, they can leave messages without tying up the phone during busy times of the day.
See the book website for a full case study: /e3/casestudy/spam/
One of the SPAM displays showing messages received. Source: Courtesy of Mark Rouncefield

674 Chapter 19 n Groupware
In contrast with email, IM grew as an informal communication medium. Therehas been some concern in the business community that it would add to internetsurfing and private email as a drain on employees’ time. However, several studiesseem to indicate that the opposite is true and that IM is being used to facilitate group working and business contacts. SMS, too, is being used for ‘serious’ uses, frompaying for goods at vending machines to coordinating staff activity in a residentialfacility for former psychiatric patients.
19.3.4 Video conferences and communication
The idea of video phones has been around for a long time, from Flash Gordon’s days onwards, and early video phones have been available for at least 20 years. Untilrecently, pervasive person-to-person video has been impossible without special andvery expensive cabling. However, the introduction of ISDN changes this dramatically.ISDN (integrated services digital network) is a form of moderately high-bandwidth (64 kbaud) digital telephone connection. It is available in major cities across theworld and enables, amongst other things, LAN-type connections between com-puters and real-time video connections. The need for this becomes apparent if youcalculate the bandwidth required for a typical video image. If we consider an 8 bit600 × 400 pixel image being sent at 25 frames a second, this amounts to 24 millionbits per second. This is not high video quality and yet requires a vast bandwidth farin excess of a normal telephone line. It is also far greater than the capacity of ISDNlines. However, recent (and expensive) video compression techniques can reduce therequired capacity to a level within the range of ISDN. Pervasive video communica-tion is clearly a technology coming of age.
As these hardware developments are quite recent, most experimental and com-mercial video systems use existing technology and lots of wire. There are three broaduses of video: video conferences, pervasive video for enhancing social communicationand video integrated with another shared application. These are all synchronousremote facilities.
Video conferences sit rather oddly in CSCW in that they typically do not use computers at all! However, computers and telecommunications are becoming so interlinked that it is widely considered an appropriate area of CSCW. Video con-ference facilities are readily available commercially using dedicated telecommunica-tions lines and satellites for transcontinental conferences. The quality of a videoconference compared with a face-to-face meeting is appalling, but, when faced withthe costs of, say, flying executives across an ocean or even across the American con-tinent, the inconveniences are often accepted.
One set of problems is connected with the small field of view of a television cam-era, and the size and quality of the resulting images. Even with a one-to-one videoconversation, we need to decide whether to take a simple head and shoulders shot,the whole torso, or head to foot. If there is a group at either end, even just two orthree people, the problems magnify enormously. If you view all three people at once,then the image of the speaker may become so small that it is hard to see the body

19.3 Computer-mediated communication 675
CuSeeMe
Special-purpose video conferencing is still relatively expensive, but low-fidelity desktopvideo conferencing is now within the reach of many users of desktop computers. Digital video cameras are now inexpensive and easily obtainable. They often come with pre-packaged videophone or video conferencing software. However, the system which has really popularized video conferencing is a web-based tool. CuSeeMe works over the internet allowing participantsacross the world owning only a basic digital video camera to see and talk to one another. The soft-ware is usually public domain (although there are commercial versions) and the services allowingconnection are often free. The limited bandwidth available over long-distance internet links meansthat video quality and frame rates are low and periodic image break-up may occur. In fact, it issound break-up which is more problematic. After all, we can talk to one another quite easily with-out seeing one another, but find it very difficult over a noisy phone line. Often participants maysee one another’s video image, but actually discuss using a synchronous text-based ‘talk’ program.
CuSeeMe – video conferencing on the internet. Source: Courtesy of Geoff Ellis

676 Chapter 19 n Groupware
gestures. These gestures are one of the big advantages of video conferences over themuch cheaper telephone conference. However, you need a skilled camera technicianto follow the speaker, zooming in and out as necessary. Furthermore, zooming in to the speaker runs the risk of losing the sense of presence. The participants at the far end do not know whether the speaker’s colleagues are nodding in agreement or falling asleep!
Video conferences support specific planned meetings. However, one of the lossesof working in a different site from a colleague is the chance meetings whilst walkingdown a corridor or drinking tea. Several experimental systems aim to counter this,giving a sense of social presence at a distance. One solution is the video window orvideo wall, a very large television screen set into the wall of common rooms at different sites [134]. The idea is that as people wander about the common room at one site they can see and talk to people at the other site – the video wall is almostlike a window or doorway between the sites.
The problems of camera positioning and focussing are, if anything, worse for thevideo wall than for the simple video conference. At least in a video conference theparticipants stay relatively still, probably seated at a table, whereas in a commonroom the participants are likely to wander about. It is quite easy to move out of therange of the camera, whilst still being able to see your colleague. That is, there is alack of reciprocity compared with normal face-to-face conversation. In addition,positioning the camera is a nightmare. To give the ‘window’ illusion, the cameramust be positioned very close to the video wall and must be focussed to get a full-depth shot of the conversants. Even then, because of the camera’s restricted field ofview, you must not stand too close or your colleague will get a 6 foot (1.8 m) highview of your navel!
A stereo audio channel for the video wall, and indeed for any video connection,can help the participants orient to the speaker and also filter out unwanted noises(see Chapter 1 for a discussion of selective attention to sound). However, a problemwith communicating using loudspeakers in a common room is a lack of privacy.Normally, people just move closer and lower their voice, but this is not effective withthe video wall.
Similar facilities have been made available within individual offices at severalresearch sites. For example, at Xerox EuroParc in Cambridge, UK, every office iswired up with video cameras and monitors. Typically, one has a camera strapped tothe top of one’s monitor, or on an angle-poise-like arm, and an image on a separatemonitor, or even in a window on the computer screen. Participants may have two-way or multi-way video conversations, or set up virtual rooms – a constantvideo connection.
Even with the camera strapped just above a monitor, it is very difficult for the participants to get eye contact. In normal face-to-face conversation, participants periodically look one another straight in the eye. If the camera is just above the monitor, your partner will always see you looking slightly downwards, and viceversa. For strictly one-to-one conversation, a technique called the video tunnel can be used (Figure 19.5). A half-silvered mirror is used so that the camera can view theuser as if it were in the middle of the screen. The feeling of engagement between theparticipants is reported to be far greater than more standard video arrangements
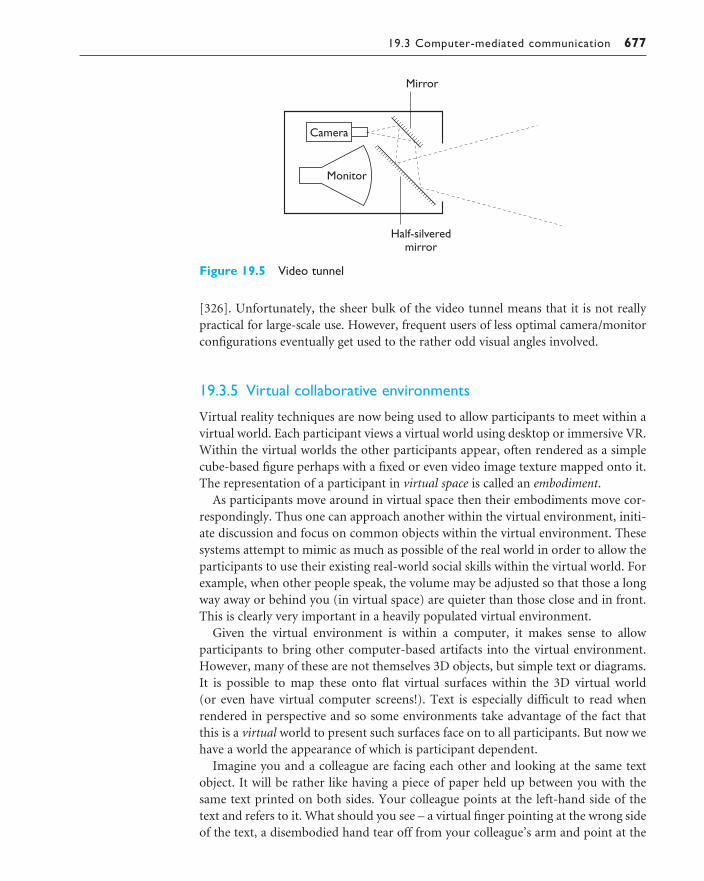
19.3 Computer-mediated communication 677
[326]. Unfortunately, the sheer bulk of the video tunnel means that it is not reallypractical for large-scale use. However, frequent users of less optimal camera/monitorconfigurations eventually get used to the rather odd visual angles involved.
19.3.5 Virtual collaborative environments
Virtual reality techniques are now being used to allow participants to meet within avirtual world. Each participant views a virtual world using desktop or immersive VR.Within the virtual worlds the other participants appear, often rendered as a simplecube-based figure perhaps with a fixed or even video image texture mapped onto it.The representation of a participant in virtual space is called an embodiment.
As participants move around in virtual space then their embodiments move cor-respondingly. Thus one can approach another within the virtual environment, initi-ate discussion and focus on common objects within the virtual environment. Thesesystems attempt to mimic as much as possible of the real world in order to allow theparticipants to use their existing real-world social skills within the virtual world. Forexample, when other people speak, the volume may be adjusted so that those a longway away or behind you (in virtual space) are quieter than those close and in front.This is clearly very important in a heavily populated virtual environment.
Given the virtual environment is within a computer, it makes sense to allow participants to bring other computer-based artifacts into the virtual environment.However, many of these are not themselves 3D objects, but simple text or diagrams.It is possible to map these onto flat virtual surfaces within the 3D virtual world (or even have virtual computer screens!). Text is especially difficult to read whenrendered in perspective and so some environments take advantage of the fact thatthis is a virtual world to present such surfaces face on to all participants. But now wehave a world the appearance of which is participant dependent.
Imagine you and a colleague are facing each other and looking at the same textobject. It will be rather like having a piece of paper held up between you with thesame text printed on both sides. Your colleague points at the left-hand side of thetext and refers to it. What should you see – a virtual finger pointing at the wrong sideof the text, a disembodied hand tear off from your colleague’s arm and point at the
Figure 19.5 Video tunnel

678 Chapter 19 n Groupware
correct place on your side of the paper? This is similar to the problems of sharedfocus which we shall discuss in the next section, but perhaps worse in this context as the users are lulled into a false sense that the world they are dealing with is trulylike the normal real world.
Although collaborative virtual environments are still mainly research systems, it is possible to sample some of the features by visiting ‘virtual places’ on the web [84],also known as MUDs (Multi-User Domains). When you visit the page, you areallowed to specify an icon or image which becomes your embodiment or avatarwithin the pages. Your own avatar and those of other visitors appear within the page.Although these are 2D worlds, many of the same possibilities arise. You can bumpinto people within the virtual world, who, as they are visiting the same place as you,may share common interests and you can also usually initiate text-based or evenaudio conversations.
Real and virtual worlds meet
The video wall allows people from remote locations to meet. In a sense it extends the nor-mal physical space of the participants as they can see the remote room, but the image rendered isa real physical space, albeit on a video screen.
Virtual collaborative environments also allow remote participants to meet one another, this timewithin a purely virtual space.
The Nottingham Internet Foyer merges these two worlds. In a real physical foyer at NottinghamUniversity there is a large video screen. However, what you see when you look at it is not a roomin a remote building (as with a video wall), but a fixed view of a virtual space. The virtual space thatis seen is itself a collaborative virtual environment, a sort of virtual foyer, which participants canenter over the internet using either desktop or immersive VR systems. The embodiments of theelectronic participants are visible to those at the real foyer. In addition, the video image of the realfoyer is also projected onto a surface in the virtual foyer. Thus the physical foyer and the virtualfoyer are linked by a virtual video wall!
The real foyer and the electronic foyer. Source: Courtesy of Steve Benford, The Mixed RealityLaboratory, The University of Nottingham
19.4 Meeting and decision support systems 679
MEETING AND DECISION SUPPORT SYSTEMS
In any conversation, the participants must establish a common understanding aboutthe task they are to perform, and generate ideas. In some areas this is a second-ary activity: you are discussing the job you are doing, the ideas support that job.However, there is a class of activities where the job is itself generating ideas andunderstanding. This is typically the case in a research environment, in design tasks,in management meetings and brainstorming sessions.
We will discuss three types of system where the generation and recording of ideasand decisions is the primary focus.
Argumentation tools which record the arguments used to arrive at a decision andsupport principally asynchronous co-located design teams.
Meeting rooms which support face-to-face groups (synchronous co-located) in brain-storming and management meetings.
Shared drawing surfaces which can be used for synchronous remote design meetings.
19.4.1 Argumentation tools
In Chapter 6, we discussed design rationale, methods of recording decisions and thearguments that lead to those decisions. We saw that design rationale could fulfill tworoles: recording design decisions for future references and clarifying the availableoptions during design. Both of these have a potential CSCW impact. One reason to record your design decisions is so that a future designer can understand why you made the decisions you did and hence be in a better position to modify or learnfrom your design. That is, you are communicating with someone possibly years inadvance. However, the one-way nature of the communication makes it informationpassing rather than collaboration.
More important from a CSCW viewpoint is when the design argument is used to communicate decisions between a group of designers. Here the communication is two way – the designers may both add to the design argument and look at eachother’s contributions. Argumentation support tools often have a hypertext-likestructure, and may easily be used to support design teams as well as individuals. Atthe simplest level, the designers can use the tool one at a time, rather like writing aco-authored document by taking turns to use the word processor. As the detaileddesign of, say, a piece of software may take many months it is unlikely that two people will want to use the tool at exactly the same moment, and if they do . . . wellit is a chance for an impromptu design meeting!
Sophisticated tools also have facilities to allow several designers to use the systemsimultaneously. To allow this, the tool must have mechanisms to stop the differentdesigners’ work interfering with that of another. This problem is called concurrencycontrol. Happily, this is particularly easy with hypertext – so long as people work ondifferent nodes, there is no conflict. To ensure this, a node must be locked; that is,when one participant starts to edit the node, no other participant is allowed to edit
19.4

680 Chapter 19 n Groupware
or update the same node. Given that there are typically hundreds of nodes in a designrationale, with only a short text description in each, the chances of two participantswanting to work on the same node are small. However, if they do, the system willrefuse permission to one or the other. In addition to these locking mechanisms, thesystems have notification mechanisms to let the participants know which nodes havebeen edited. For example, changed nodes may be highlighted until the participanthas examined them or marked them as read. This highlighting must, of course, be on a per user basis – if Jane edits a node and Sam marks it as read, then when Marycomes to the system she should still see the node highlighted.
A good example of argumentation tools is the family of tools developed to sup-port the argumentation model called issue-based information system (IBIS), the bestknown being gIBIS [76] (which we met in Chapter 6). This system has node typesincluding ‘issues’, ‘positions’ and ‘arguments’, and these are linked together by rela-tionships such as ‘argument supports position’.
Notice that argumentation tools may allow a range of interaction styles from asynchronous, when the designers use it one at a time, to fully synchronous, whenseveral use it at once. Although there is no reason why the systems should not be used for distant collaboration they are typically used by groups within the sameoffice, and in the case of one-at-a-time use, on one machine. They are thus largely,but not solely, asynchronous co-located groupware systems.
19.4.2 Meeting rooms
The advantages of email, bulletin boards and video conferences are obvious – if youare a long way apart, you cannot have a face-to-face meeting. Similarly, it is obviouswhy one should want to record decisions during a long-lived design process. Theneed for meeting rooms is less obvious. These are specially constructed rooms, withextensive computer equipment designed to support face-to-face meetings. Givenface-to-face meetings work reasonably well to start with, such rooms must be verywell designed if the equipment is to enhance rather than disrupt the meeting.
Early examples of such rooms, catering for groups of between four and 30 particip-ants, included Xerox PARC’s CoLab [329], Project Nick [32] and Capture Lab [226].The general layout consists of a large screen, regarded as an electronic whiteboard, at one end of the room, with chairs and tables arranged so that all the participantscan see the screen. This leads to a U- or C-shaped arrangement around the screen,and in the biggest room even several tiers of seating. In addition, all the participantshave their own terminals, which may be recessed into the tabletop to reduce theirvisual effect. Figure 19.6 shows a computer-supported meeting using NLS, a veryearly groupware system [125]. Obviously, changes in display technology have madethe displays less obtrusive, but the basic principle remains.
Such systems will support various forms of working, including private use of theterminals and subgroup working on a teleconferencing or email basis. However, thecharacteristic mode of operation is where all the participants’ screens and the centralscreen show the same image. This is termed WYSIWIS (‘what you see is what I see’).

19.4 Meeting and decision support systems 681
The screen then takes the form of an electronic whiteboard, similar to a simplegraphics drawing package, on which the participants can all write. One advantage of such an arrangement over a normal whiteboard is the ease with which data can be moved to and from the participants’ normal computer files. As more work is prepared online this will increase in importance. Also, the electronic whiteboard has some advantages over the real thing. Whereas on a real whiteboard you can onlywrite and rub out, on the electronic version you can move items around just as youwould with a drawing tool, and, of course, you can get a printout of the results ratherthan just hoping the cleaners do not wipe it all off.
There are potential problems if several participants decide to write at the sametime, so different systems adopt different floor control policies to determine whichparticipant can write at any moment.
The simplest policy to implement is to use locking, similar to that described previ-ously. When a participant, say Jane, wants to write to the screen she presses a key, or clicks on an on-screen button to request the floor. If no one else has the floor, she may go ahead and type on the screen, or if it supports graphics draw a diagram.When she has finished, she relinquishes the floor, using some other key or mouseselection. However, if some other participant, say Sam, already has the floor whenJane requests it, she must wait until Sam relinquishes the floor. There will be somesort of status indicator to say who has the floor at any moment, so Jane can ask Samto relinquish, just as you might ask for the pen to write on a whiteboard.
In practice, such meetings tend to be punctuated with far too many requests such as ‘Sam have you finished yet?’, as often a participant will forget to relinquishthe floor after writing. Also, it can be a pain to request the floor explicitly from thesystem – with a whiteboard you simply pick up your pen and write. Various more
Figure 19.6 A computer-supported meeting. Photograph courtesy of Douglas Engelbart and Bootstrap Institute

682 Chapter 19 n Groupware
lenient locking mechanisms are used to reduce these problems. A lock may be implicitly requested when you begin to type or draw. If no one else has the floor, then the floor is implicitly granted. If someone else has the floor, then your writingwill be blocked. There is also implicit relinquishing: the lock may be automaticallyreleased after several seconds of inactivity. This may, of course, happen during apause, rather than when the floor holder has finished, but the ease with which thefloor can be regained does not make it a nuisance.
A conceptually simpler idea is to let everyone write to the screen at the same time– just as people may use several pens to write on a whiteboard at the same time. Thissounds like a recipe for chaos, with people forever writing on top of one another.However, with reasonably small groups there is little problem. Try going to thewhiteboard as someone is writing on it, and writing on top of what they write. It ispossible, but it does not make you many friends. Similarly in the electronic version,as soon as two people begin to write on the same part of the screen they say ‘oops!’and start to write elsewhere.
The various forms of locking constitute a software protocol for floor control. The way that people negotiate for screen space in the free-for-all situation is a socialprotocol. The reason that this is possible is because the participants are in the sameroom and are able to talk to one another.
If there is only one floor holder, then the screens can all show the floor holder’scursor. However, as soon as several participants are active at once, it is less clear whatto do. One option is to display all the users’ cursors. These may be accompanied bythe user’s name so that you can tell who is entering what. With large numbers of par-ticipants this can become distracting, and it is costly in terms of network traffic. Thealternative is to show none of the cursors. If the participants are talking as they write,it is usually obvious who is writing what. In addition, during brainstorming phases,anonymity is an advantage – people are more likely to put up an ‘off-the-wall’ sug-gestion, thus stimulating more ideas and discussion.
If you are using a real whiteboard, you may go up to a diagram on the board andsay ‘I think that should go there’. As you say the words ‘that’ and ‘there’, you point at the relevant parts of the diagram. This is called deictic reference or simply deixis. Ifthe participants’ cursors are invisible to one another, then this form of pointing isimpossible. Indeed, in such a meeting, even where the cursors are visible, the particip-ants may momentarily forget and point at their own screen. Obviously, the particip-ant can get up and point at the shared screen as you would at a whiteboard, but that is rather intrusive and precludes writing at the same time. To allow this deicticreference a group pointer may be supplied. This is an icon visible on all the screens,perhaps in the form of a pointing finger. Any participant can pick it up with his own mouse and use it to gesture on the screen. The control of the group pointerposes similar problems to those of floor control. However, the most lenient lockingpolicies work well since the use of the pointer is usually synchronized with speaking,and thus it is easy to avoid and resolve conflicts.
The design and building of meeting rooms is both expensive and time consum-ing, but less sophisticated facilities are more widely available. The simplest is thehardcopy whiteboard, which has some of the advantages of an electronic whiteboard

19.4 Meeting and decision support systems 683
(and with greater resolution). If these were more closely coupled to a computer sys-tem, they would have even more scope. LCD projectors or transparent LCD screensfor putting on top of an overhead projector can give any computer a vast screenimage. In the simplest case this can just be manipulated by one person, but if severalcomputers are networked together and use commercial shared screen software (seebelow in Section 19.5.1), one can obtain a similar effect to that of the more expensiveconferencing facilities (Figure 19.7). However, experience of the various meetingroom projects has shown that the social dynamics are very fragile and the differencebetween a successful meeting environment and a complete disaster is narrow.
These lower cost and more readily available technologies have made it possible tocapture the results of ordinary meetings (see also Chapter 20). A number of devicesare available commercially to turn an ordinary whiteboard into an electronic surface.Ordinary pens are placed in some sort of holder so that fixed detectors around theboard can track the location of the pen on the whiteboard. This can then be used torecord the strokes produced on the whiteboard and so keep an electronic copy. Ifinstead an LCD projector is used to project a computer screen onto the whiteboard,then inkless pens can be used to act as a mouse pointer and so allow interaction withapplications. Both of these can be combined with audio recording to allow rich cap-ture of meetings for future review, aiding minute making and so on.
19.4.3 Shared work surfaces
The idea of a shared screen forming an electronic whiteboard is not confined to face-to-face meetings. One can easily imagine using the same software which runs in
Figure 19.7 Meeting capture at the whiteboard
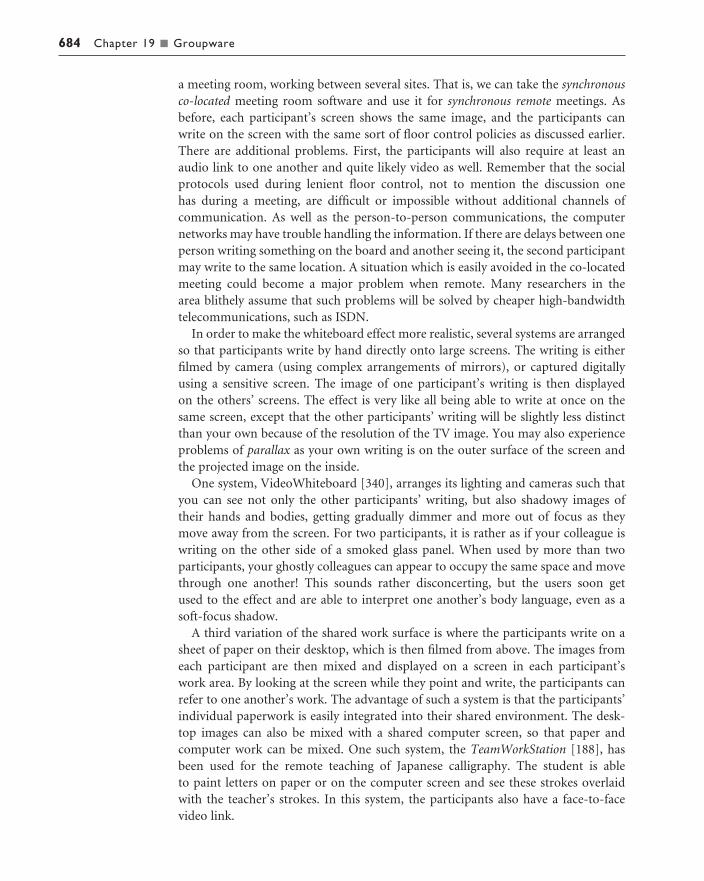
684 Chapter 19 n Groupware
a meeting room, working between several sites. That is, we can take the synchronousco-located meeting room software and use it for synchronous remote meetings. Asbefore, each participant’s screen shows the same image, and the participants canwrite on the screen with the same sort of floor control policies as discussed earlier.There are additional problems. First, the participants will also require at least anaudio link to one another and quite likely video as well. Remember that the socialprotocols used during lenient floor control, not to mention the discussion one has during a meeting, are difficult or impossible without additional channels ofcommunication. As well as the person-to-person communications, the computernetworks may have trouble handling the information. If there are delays between oneperson writing something on the board and another seeing it, the second participantmay write to the same location. A situation which is easily avoided in the co-locatedmeeting could become a major problem when remote. Many researchers in the area blithely assume that such problems will be solved by cheaper high-bandwidthtelecommunications, such as ISDN.
In order to make the whiteboard effect more realistic, several systems are arrangedso that participants write by hand directly onto large screens. The writing is eitherfilmed by camera (using complex arrangements of mirrors), or captured digitallyusing a sensitive screen. The image of one participant’s writing is then displayed on the others’ screens. The effect is very like all being able to write at once on thesame screen, except that the other participants’ writing will be slightly less distinctthan your own because of the resolution of the TV image. You may also experienceproblems of parallax as your own writing is on the outer surface of the screen andthe projected image on the inside.
One system, VideoWhiteboard [340], arranges its lighting and cameras such thatyou can see not only the other participants’ writing, but also shadowy images of their hands and bodies, getting gradually dimmer and more out of focus as theymove away from the screen. For two participants, it is rather as if your colleague iswriting on the other side of a smoked glass panel. When used by more than two participants, your ghostly colleagues can appear to occupy the same space and movethrough one another! This sounds rather disconcerting, but the users soon get used to the effect and are able to interpret one another’s body language, even as asoft-focus shadow.
A third variation of the shared work surface is where the participants write on asheet of paper on their desktop, which is then filmed from above. The images fromeach participant are then mixed and displayed on a screen in each participant’s work area. By looking at the screen while they point and write, the participants canrefer to one another’s work. The advantage of such a system is that the participants’individual paperwork is easily integrated into their shared environment. The desk-top images can also be mixed with a shared computer screen, so that paper and computer work can be mixed. One such system, the TeamWorkStation [188], hasbeen used for the remote teaching of Japanese calligraphy. The student is able to paint letters on paper or on the computer screen and see these strokes overlaidwith the teacher’s strokes. In this system, the participants also have a face-to-facevideo link.

19.5 Shared applications and artifacts 685
SHARED APPLICATIONS AND ARTIFACTS
The things that were being shared in the previous section were ephemera; they werethere to support the meeting or design process, but were not the end purpose. In thissection we will look at systems where the focus of sharing is the participants’ workdomain itself. These include the computers people are using, applications on thosecomputers, and the documents they are working with. Some of these systems aresimilar in technology to the various shared work surfaces above, but the focus in thissection is on work.
19.5.1 Shared PCs and shared window systems
Most of the groupware tools we have discussed require special collaboration-awareapplications to be written. However, shared PCs and shared window systems allowordinary applications to be the focus of cooperative work. Of course, you can co-operate simply by sitting together at the same computer, passing the keyboard andmouse between you and your colleague. The idea of a shared PC is that you have two (or more) computers which function as if they were one. What is typed on oneappears on all the rest. This sounds at first just like a meeting room without the largeshared screen. The difference is that the meeting rooms have special shared drawingtools, but the shared PC is just running your ordinary program. The sharing softwaremonitors your keystrokes and mouse movements and sends them to all the othercomputers, so that their systems behave exactly like yours. Their keystrokes andmovements are similarly relayed to you. As far as the application is concerned thereis one keyboard and one mouse.
Imagine two users type at once. As the application does not know about the multiple users it will merely interleave the keystrokes, or should we say ‘inkeytersltreaokevetshe’? Interleaved mouse movements are, if anything, moremeaningless. The sharing software therefore imposes some form of lenient locking.For the mouse, this will be an automatic lock while the mouse is being moved, withthe lock being relinquished after a very short period of inactivity. The keyboard lockwill have a longer period as natural gaps in typing are greater than gaps in mousing.Alternatively, the keyboard may have no lock, the users being left to sort out the control with their own social protocol.
A shared window system is similar except, rather than the whole screen, it is individual windows which are shared. While the user works with unshared windows,the system behaves as normal, but when the user selects a shared window the sharedwindowing system intervenes. As with the shared PC, all the user’s keystrokes andmouse movements within the window are broadcast to the other computers sharingthe window.
These facilities may be used within the same room, as originally suggested, inwhich case we have a synchronous co-located system. Alternatively, they may be usedin conjunction with telephone or video connections at a distance, that is synchronous
19.5

686 Chapter 19 n Groupware
remote. The extra audio or video channel is necessary when used remotely as the systems in themselves offer no direct communication. It is just possible to use suchsystems, without additional channels, by writing messages in the application’s work-space (document, drawing surface, etc.). However, the social protocols needed tomediate the mouse and keyboard cannot be achieved by this channel.
Shared PCs and window systems have two main uses. One is where the focus is onthe documents being processed, for example if the participants are using a spread-sheet together to solve a financial problem. The other is technical support: if youhave a problem with an application, you can ring up your local (or even remote)technical guru, who will connect to your computer, examine where you are and offer advice. Compare this scenario with trying to explain over the phone why yourcolumn is not formatting as you want.
19.5.2 Shared editors
A shared editor is an editor (for text or graphics) which is collaboration aware, that is it knows that it is being shared. It can thus provide several insertion points or locking protocols more tuned to the editor’s behavior. The software used in meetingrooms can be thought of as a form of shared editor and many of the issues are thesame, but the purpose of a shared editor is to collaborate over normal documents.Just as with shared PCs and windows, the users are expected to have some additionalmeans of communication, such as face-to-face (co-located), audio or video channels,or at the very least textual communications.
Shared editors may be text based or include graphics. For simplicity, we shall justconsider text. Even so, there are a wide range of design options. Should you have asingle insertion point with some form of floor control to avoid interleaving, or shouldyou have one insertion point per participant? Assuming you have several insertionpoints, do you just see your own, or do you see your colleagues’ insertion points as well, and if you can see them should they be identified by the user’s name or beanonymous? In addition to the insertion point options, there is the issue about whatyou should see. Do all the participants see the same part of the screen, so if one participant scrolls, so do all the rest? Or do we allow different views on the documentso that one participant can edit the beginning of the document while another editsthe end?
There is not a right answer to these questions; different policies are useful for dif-ferent purposes – close cooperation on a single sentence, or writing separate sections.Even within a single editing session the appropriate policy will vary. Unfortunately,in the past, these policy decisions were usually enshrined in the various shared editors,rather than being configured by the users. However, there is a growing recognitionthat more adaptable systems are needed to allow for the wide variation betweengroups, and within the same group over time. We will look at some of the optionsand how they affect the style of cooperation.
Thinking about the shared view versus different view options, it at first seemsobvious that we should allow people to edit different parts of a document. This is
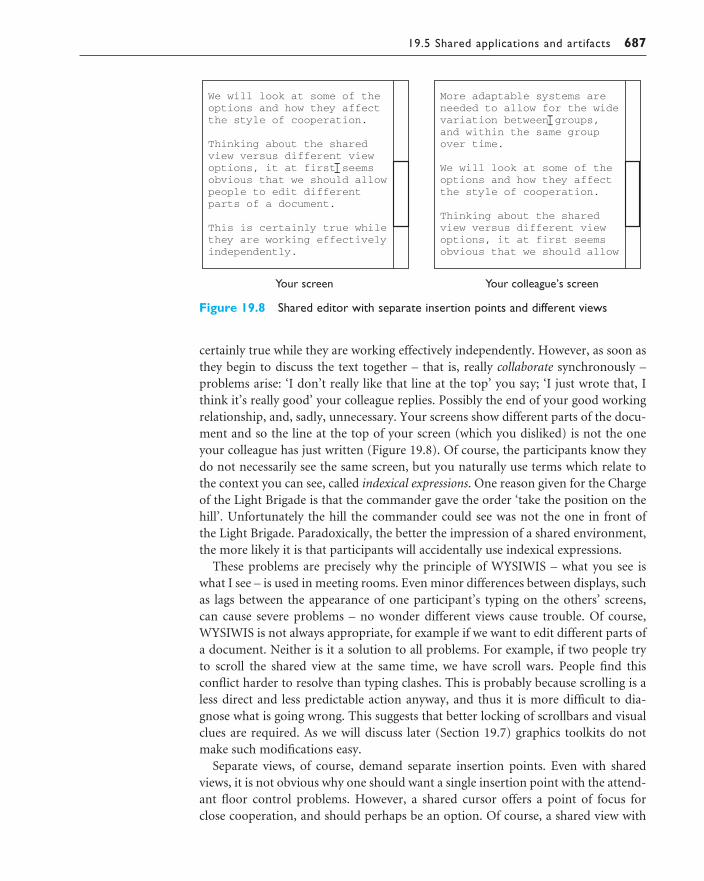
19.5 Shared applications and artifacts 687
certainly true while they are working effectively independently. However, as soon asthey begin to discuss the text together – that is, really collaborate synchronously –problems arise: ‘I don’t really like that line at the top’ you say; ‘I just wrote that, Ithink it’s really good’ your colleague replies. Possibly the end of your good workingrelationship, and, sadly, unnecessary. Your screens show different parts of the docu-ment and so the line at the top of your screen (which you disliked) is not the oneyour colleague has just written (Figure 19.8). Of course, the participants know theydo not necessarily see the same screen, but you naturally use terms which relate tothe context you can see, called indexical expressions. One reason given for the Chargeof the Light Brigade is that the commander gave the order ‘take the position on thehill’. Unfortunately the hill the commander could see was not the one in front of the Light Brigade. Paradoxically, the better the impression of a shared environment,the more likely it is that participants will accidentally use indexical expressions.
These problems are precisely why the principle of WYSIWIS – what you see iswhat I see – is used in meeting rooms. Even minor differences between displays, suchas lags between the appearance of one participant’s typing on the others’ screens, can cause severe problems – no wonder different views cause trouble. Of course,WYSIWIS is not always appropriate, for example if we want to edit different parts ofa document. Neither is it a solution to all problems. For example, if two people tryto scroll the shared view at the same time, we have scroll wars. People find thisconflict harder to resolve than typing clashes. This is probably because scrolling is aless direct and less predictable action anyway, and thus it is more difficult to dia-gnose what is going wrong. This suggests that better locking of scrollbars and visualclues are required. As we will discuss later (Section 19.7) graphics toolkits do notmake such modifications easy.
Separate views, of course, demand separate insertion points. Even with sharedviews, it is not obvious why one should want a single insertion point with the attend-ant floor control problems. However, a shared cursor offers a point of focus for close cooperation, and should perhaps be an option. Of course, a shared view with
Figure 19.8 Shared editor with separate insertion points and different views

688 Chapter 19 n Groupware
shared cursor is almost identical to a single-user editor in a shared window. Wherethere is no shared cursor, a group pointer can be used to focus discussion. Indeed, onecould imagine using a group pointer with different views, but there are no extant systems which allow this.
As we have indicated, the differences between groups mean that some configura-tion by the group is essential. That is, shared editors require some form of local struc-turing. However, that does not mean that there will be no problems. Participants willpoint at the screen with their fingers when in different rooms, and use indexicalexpressions when they are in separate screen mode. The more their sense of engage-ment, that is the more they feel as if they are working together, the more likely theyare to revert to natural forms of expression. We cannot prevent this entirely; as wesaw, mistakes can happen in ‘real life’ too.
19.5.3 Co-authoring systems
Shared text editing is a short-term activity, occurring over a timescale of, at most, a few hours. Co-authoring is much longer term, taking weeks or months. Whereasshared editing is synchronous, co-authoring is largely asynchronous, with occasionalperiods of synchronous work. This may involve shared editing, but even if it doesthis is only one of the activities. Authors may work out some sort of plan together,apportion work between them, and then exchange drafts commenting on one another’s work. In fact, this is only one scenario and if there is one consistent resultfrom numerous studies of individual and collaborative writing, it is this: everyoneand every group is different.
Fortunately, even though the details of writing differ, especially in the process,there are enough similarities to produce systems which support co-authoring. Themajority of these are built around a hypertext model. The text itself is the basis andcomments and discussion of these comments are linked into this basic structure.Although a general-purpose shared hypertext can be used, specific co-authoring systems are tuned to the writing task. The shape of the hypertext may be limited to a tree rather than the arbitrary graph of a hypertext. The document itself may be flat,a linear list of sections or may be grouped into a hierarchical section–subsection tree. Comment nodes are then attached to the document nodes, and other follow-onremarks attached to the comments. These are intended to emulate the scribblings on paper drafts during normal collaborative writing. Special facilities may be addedto inform one writer of another’s comments or additions.
As in previous systems, co-authoring systems must have some sort of concurrencycontrol to cater for times when two participants attempt to edit the same text at thesame time. This may take the form of locking, as described previously, or the systemmay allow the users to enter into periods of synchronous activity. That is, the nodeeditor acts as a shared editor. However, this is not the dominant form of working andmost often co-authors will have divided up the work amongst themselves, so that a section will have only one principal author, and thus social protocols ensure thatwriting clashes do not occur.

19.5 Shared applications and artifacts 689
These social protocols may be supported or enforced by the co-authoring system.For example, in one system, Quilt [210], users are assigned roles, such as author,commentator, reader, with respect to each document node. An author is allowed toedit the text and add comments, a commentator is only allowed to add comments,and a reader cannot alter it at all. These roles resemble access rights in a normalfilestore or database. However, both their naming and their particular semantics areaimed at supporting the types of role which occur in co-authoring situations. Ofcourse, we are again into the territory of local versus global structuring. Who decideson the roles and the associated access rights, and can they be changed during use?These questions are not too much of a problem for Quilt, where the roles are on aper node basis, but some systems have roles which apply to the whole document. It is often the case that a person who gives extensive constructive comments is asked to co-author a paper, or someone who originally was to be an author cannot findsufficient time. Roles in real life have a degree of flexibility; those in groupware musttry to keep suit.
19.5.4 Shared diaries
We want to find a time for a meeting to discuss the book we are writing: when shouldit be? Four diaries come out and we search for a mutually acceptable slot. We even-tually find a free slot, but decide we had better double check with our desk diariesand the departmental seminar program. This sort of scenario is repeated time andagain in offices across the world. The idea of a shared diary or shared calendar is simple. Each person uses a shared electronic diary, similar to that often found on PCsand pocket organizers. When you want to arrange a meeting, the system searcheseveryone’s diaries for one or more free slots.
There are technical problems, such as what to do if no slots are free (often thenorm). The system can return a set of slots with the least other arrangements, which can then form a basis for negotiation. Alternatively, the participants can marktheir appointments with levels of importance. The system can then assign costs tobreaking the appointments, and find slots with least cost. Mind you, someone mayregard all their appointments as critical.
This reminds us that whatever the technical sophistication, it is people who usethese systems and people who must cooperate. There are varying reports of successand failure with shared diaries. Where they have failed it is invariably because theyhave ignored the social needs and behavior of their users.
One such area is privacy. Are people allowed to look at your diary to find freeslots? If so, do they just see ‘busy’ or can they see exactly what you are doing? Youwould be extremely annoyed if someone looked in your personal paper diary; is theelectronic one any different? There is a trade-off between privacy and cooperation.In an office situation, one has a succession of diaries and calendars for specific pur-poses: a private diary with personal information, a desk diary and possibly a paralleldesk diary with your secretary, and various forms of wall calendar showing periodson vacation and similar major meetings. These vary in their visibility to other
690 Chapter 19 n Groupware
members of the organization: your secretary can consult her copy of your diary but not your personal diary; anyone can look at the wall calendar. You choose yourlevel of privacy by where you put information. Of course, the problems of keepingsuch diaries up to date with one another is one reason why electronic diaries are produced, but they must supply similar forms of privacy control or people will simply not use them. This is precisely what happens.
There are similar problems with the update of diaries. If someone wants to booka meeting with you, can they fill in a slot, or must they ask you? Again you may wantto vary these rights according to who it is and the sort of appointment. Many systemsallow other users to ‘pencil in’ appointments, but require them to be confirmed bythe diary’s owner.
Many people use private electronic diaries and time management software. It is reasonable to expect that groupware versions of these will become commonlyavailable in the near future. The extent to which they work will be largely the extentto which the design takes note of personal and social factors.
19.5.5 Communication through the artifact
In each of the last four systems – shared PCs and windows, shared editors, co-authoring systems and shared diaries – the focus has been upon the artifacts onwhich the participants are working. They act upon the artifacts and communicatewith one another about the artifacts. However, as well as observing their own actionson the artifacts, the participants are aware of one another’s actions. This awarenessof one another’s actions is a form of communication through the artifact.
This can happen even where the shared artifact is not ‘real’ groupware. Forinstance, shared files and databases can be a locus for cooperation. Sales figures maybe entered into the company database by a person in one department and then usedas part of a query by another employee. At a loose level, the two are cooperating injobs, but the database, and the information in it, may be their only means of com-munication. Such communication is one-way, and is thus a weak form of collabora-tion, but often important. For example, casework files are a central mechanism for communication and cooperation in many areas from taxation to social work.However, the facilities for cooperation in a typical shared file store or database arelimited to locking, and even that may be rudimentary.
People may also explicitly pass documents, produced by single-user systems,between themselves. For example, the cooperative use of spreadsheets has been studied. Some of this involves close working between the participants, but someusers simply pass the spreadsheet data between them with little, if any, comment. If you change a formula, then the intent is obvious – you thought it was wrong.
Of course, in most situations, direct communication is necessary as well, especiallywhere there is some conflict (your colleague thinks the original formula was right).The lesson from these more extreme examples is that cooperation does not neces-sarily involve direct communication and, even where it does, the indirect channelthrough the artifact may be central to effective working.

19.6 Frameworks for groupware 691
One shared database which is explicitly designed to promote cooperation isLiveware [383]. This is a card-index-type database implemented over HyperCard,designed to be updated by users at many sites, and spreading the information byfloppy disk as people meet during normal social contact. When different versions ofthe Liveware database ‘meet’, they choose the newest version of each record. Eachrecord has a single owner, so problems of conflicting updates are avoided.
Lotus Notes
The most widely used groupware application, excepting email, is Lotus Notes. Notes hasaspects of a structured message system, a bulletin board and a shared database. At its simplest aNotes database consists of a collection of items. Each item belongs to a particular type and depend-ing on the type has different named fields – just like a structured message system. In addition, eachitem may have responses and responses to responses, very like a bulletin board. The distinguish-ing feature, however, is its ability to replicate and reconcile replicas. There may be several copiesof a single Notes database lodged on different servers. Users may connect to different servers andadd or edit items and responses. Later, when the servers connect via network or modem, theyupdate each other taking the most up-to-date version of each item just like Liveware. This has madeit particularly popular with users of portable computers working away from their central office.
Although Lotus Notes has been very successful, much of its use has been simply for email. How-ever, it is also customizable and programmable so many bespoke applications have been producedusing it as a base platform. In particular, it can be used to implement or support workflow systems.
Notes’ key market is in corporate information and messaging systems. However, it is being challenged in this market by web-based intranet solutions, where the web’s cross-platform andcross-vendor compatibility makes it an ideal candidate. Clearly aware of this threat, Lotus (nowpart of IBM) has added web publishing features to Notes.
FRAMEWORKS FOR GROUPWARE
In this section we will discuss several frameworks for understanding the role ofgroupware. One use for these is as a classification mechanism, which can help us discuss groupware issues. In addition, they both suggest new application areas andcan help structure the design of new systems.
19.6.1 Time/space matrix and asynchronous working
First of all we will look again at the time/space matrix. At the beginning of Sec-tion 19.2, we placed familiar technologies in the matrix. Figure 19.9 shows the samematrix, but populated with the groupware systems we have discussed.
19.6
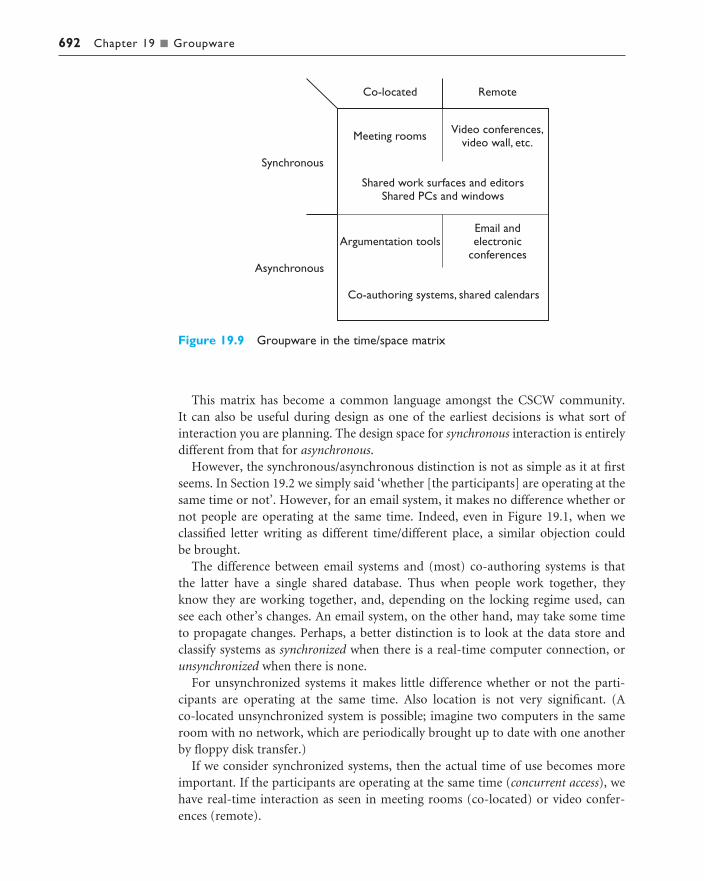
692 Chapter 19 n Groupware
This matrix has become a common language amongst the CSCW community. It can also be useful during design as one of the earliest decisions is what sort of interaction you are planning. The design space for synchronous interaction is entirelydifferent from that for asynchronous.
However, the synchronous/asynchronous distinction is not as simple as it at firstseems. In Section 19.2 we simply said ‘whether [the participants] are operating at thesame time or not’. However, for an email system, it makes no difference whether ornot people are operating at the same time. Indeed, even in Figure 19.1, when weclassified letter writing as different time/different place, a similar objection could be brought.
The difference between email systems and (most) co-authoring systems is that the latter have a single shared database. Thus when people work together, they know they are working together, and, depending on the locking regime used, can see each other’s changes. An email system, on the other hand, may take some time to propagate changes. Perhaps, a better distinction is to look at the data store andclassify systems as synchronized when there is a real-time computer connection, orunsynchronized when there is none.
For unsynchronized systems it makes little difference whether or not the parti-cipants are operating at the same time. Also location is not very significant. (A co-located unsynchronized system is possible; imagine two computers in the sameroom with no network, which are periodically brought up to date with one anotherby floppy disk transfer.)
If we consider synchronized systems, then the actual time of use becomes moreimportant. If the participants are operating at the same time (concurrent access), wehave real-time interaction as seen in meeting rooms (co-located) or video confer-ences (remote).
Figure 19.9 Groupware in the time/space matrix
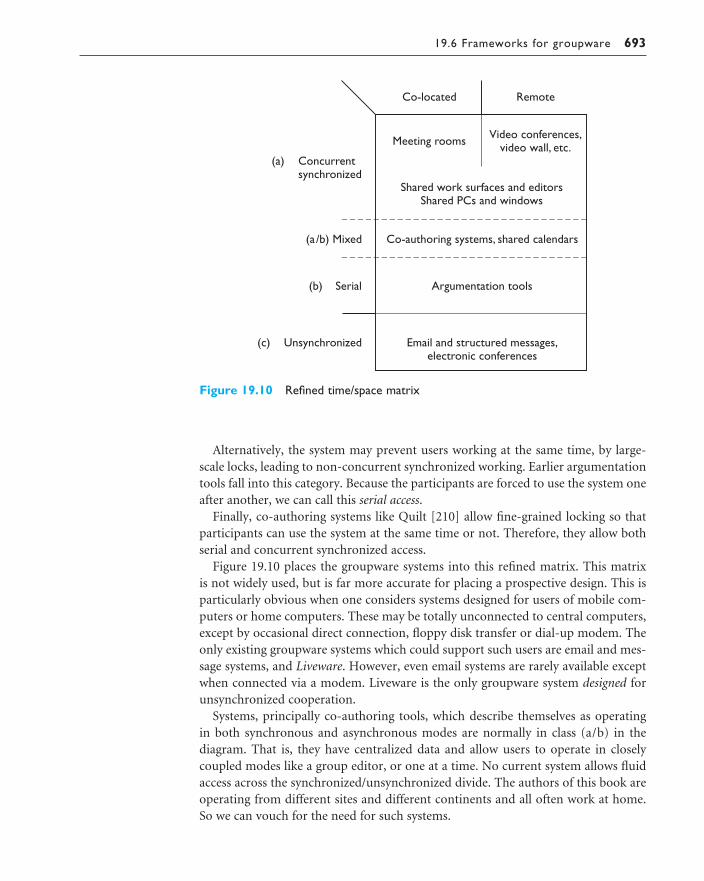
19.6 Frameworks for groupware 693
Alternatively, the system may prevent users working at the same time, by large-scale locks, leading to non-concurrent synchronized working. Earlier argumentationtools fall into this category. Because the participants are forced to use the system oneafter another, we can call this serial access.
Finally, co-authoring systems like Quilt [210] allow fine-grained locking so thatparticipants can use the system at the same time or not. Therefore, they allow bothserial and concurrent synchronized access.
Figure 19.10 places the groupware systems into this refined matrix. This matrix is not widely used, but is far more accurate for placing a prospective design. This isparticularly obvious when one considers systems designed for users of mobile com-puters or home computers. These may be totally unconnected to central computers,except by occasional direct connection, floppy disk transfer or dial-up modem. Theonly existing groupware systems which could support such users are email and mes-sage systems, and Liveware. However, even email systems are rarely available exceptwhen connected via a modem. Liveware is the only groupware system designed forunsynchronized cooperation.
Systems, principally co-authoring tools, which describe themselves as operating in both synchronous and asynchronous modes are normally in class (a/b) in the diagram. That is, they have centralized data and allow users to operate in closely coupled modes like a group editor, or one at a time. No current system allows fluidaccess across the synchronized/unsynchronized divide. The authors of this book areoperating from different sites and different continents and all often work at home.So we can vouch for the need for such systems.
Figure 19.10 Refined time/space matrix
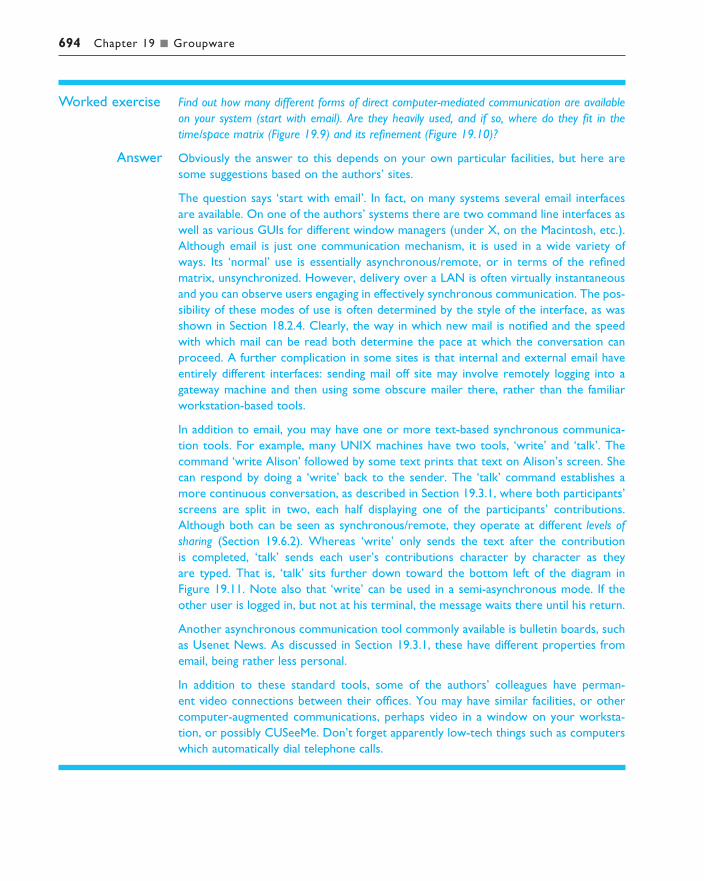
694 Chapter 19 n Groupware
Worked exercise Find out how many different forms of direct computer-mediated communication are availableon your system (start with email). Are they heavily used, and if so, where do they fit in thetime/space matrix (Figure 19.9) and its refinement (Figure 19.10)?
Answer Obviously the answer to this depends on your own particular facilities, but here aresome suggestions based on the authors’ sites.
The question says ‘start with email’. In fact, on many systems several email interfacesare available. On one of the authors’ systems there are two command line interfaces aswell as various GUIs for different window managers (under X, on the Macintosh, etc.).Although email is just one communication mechanism, it is used in a wide variety ofways. Its ‘normal’ use is essentially asynchronous/remote, or in terms of the refinedmatrix, unsynchronized. However, delivery over a LAN is often virtually instantaneousand you can observe users engaging in effectively synchronous communication. The pos-sibility of these modes of use is often determined by the style of the interface, as wasshown in Section 18.2.4. Clearly, the way in which new mail is notified and the speedwith which mail can be read both determine the pace at which the conversation canproceed. A further complication in some sites is that internal and external email haveentirely different interfaces: sending mail off site may involve remotely logging into agateway machine and then using some obscure mailer there, rather than the familiarworkstation-based tools.
In addition to email, you may have one or more text-based synchronous communica-tion tools. For example, many UNIX machines have two tools, ‘write’ and ‘talk’. Thecommand ‘write Alison’ followed by some text prints that text on Alison’s screen. Shecan respond by doing a ‘write’ back to the sender. The ‘talk’ command establishes amore continuous conversation, as described in Section 19.3.1, where both participants’screens are split in two, each half displaying one of the participants’ contributions.Although both can be seen as synchronous/remote, they operate at different levels ofsharing (Section 19.6.2). Whereas ‘write’ only sends the text after the contribution is completed, ‘talk’ sends each user’s contributions character by character as they are typed. That is, ‘talk’ sits further down toward the bottom left of the diagram inFigure 19.11. Note also that ‘write’ can be used in a semi-asynchronous mode. If theother user is logged in, but not at his terminal, the message waits there until his return.
Another asynchronous communication tool commonly available is bulletin boards, suchas Usenet News. As discussed in Section 19.3.1, these have different properties fromemail, being rather less personal.
In addition to these standard tools, some of the authors’ colleagues have perman-ent video connections between their offices. You may have similar facilities, or othercomputer-augmented communications, perhaps video in a window on your worksta-tion, or possibly CUSeeMe. Don’t forget apparently low-tech things such as computerswhich automatically dial telephone calls.
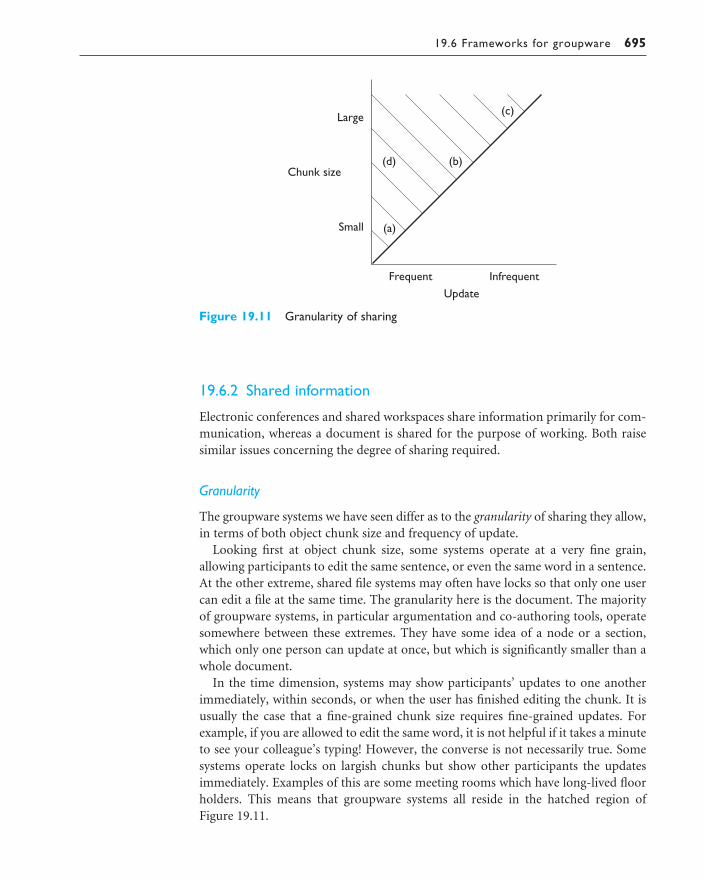
19.6 Frameworks for groupware 695
19.6.2 Shared information
Electronic conferences and shared workspaces share information primarily for com-munication, whereas a document is shared for the purpose of working. Both raisesimilar issues concerning the degree of sharing required.
Granularity
The groupware systems we have seen differ as to the granularity of sharing they allow,in terms of both object chunk size and frequency of update.
Looking first at object chunk size, some systems operate at a very fine grain, allowing participants to edit the same sentence, or even the same word in a sentence.At the other extreme, shared file systems may often have locks so that only one usercan edit a file at the same time. The granularity here is the document. The majorityof groupware systems, in particular argumentation and co-authoring tools, operatesomewhere between these extremes. They have some idea of a node or a section,which only one person can update at once, but which is significantly smaller than awhole document.
In the time dimension, systems may show participants’ updates to one anotherimmediately, within seconds, or when the user has finished editing the chunk. It isusually the case that a fine-grained chunk size requires fine-grained updates. Forexample, if you are allowed to edit the same word, it is not helpful if it takes a minuteto see your colleague’s typing! However, the converse is not necessarily true. Somesystems operate locks on largish chunks but show other participants the updatesimmediately. Examples of this are some meeting rooms which have long-lived floorholders. This means that groupware systems all reside in the hatched region of Figure 19.11.
Figure 19.11 Granularity of sharing

696 Chapter 19 n Groupware
In the figure, four points are plotted representing different grain size choices, astypified by the examples we have discussed:
(a) shared editors(b) co-authoring systems like Quilt(c) network file systems with locking(d) meeting system with floor holder.
Levels of sharing
As well as varying in terms of how much is shared, systems vary as to what is shared.At one extreme are WYSIWIS systems, such as shared window systems and manymeeting rooms. In these, the participants all see exactly the same presentation of thedata. However, in other shared editors, such as Grove [121, 122], the participants canedit different parts of the document at once. That is, they share the object, but notthe presentation.
There is an interesting middle ground which is rare in explicit groupware, butcommon in the use of shared databases. That is, sharing a view, but not the pre-sentation of that view. For example, two people may be viewing the same part of adatabase, but one person sees it presented as a graph, and the other in tabular form.We thus have three levels, as depicted in Figure 19.12.
100
50
Population
50Houses
Presentation
View
Object
Houses Population
72351
1579
123
Village
BurtonMarleighWestfieldThornby
Houses
23339
751
Population
7967115
123
VILLAGE_STATS
select houses, population from VILLAGE_STATSwhere population < 200sort by houses ascending
Figure 19.12 Levels of sharing

19.6 Frameworks for groupware 697
In addition to this output-oriented sharing, we can also look at input. On the one hand there are those systems which have a single shared virtual keyboard, forexample the shared window systems. On the other, we have the majority where theparticipants can input at different places. This can be characterized as single versusmultiple insertion points. There is no real middle ground here, but for those withseparate insertion points we have the issue of visibility: whether or not the particip-ants can see each other’s insertion points or mouse pointers. Furthermore, if theother participants’ cursors are not visible, we may have a group pointer, as discussedin Section 19.4.2. This gives us four levels of input sharing:
single insertion point n shared virtual keyboardmultiple insertion points n other participants visible
n group pointern no visibility
Again, there are loose connections between the two levels of sharing. For example,it makes little sense to have a single insertion point but different views. However, onedocument annotation system has separate insertion points but a shared view. Anyuser can choose to scroll the view of the document, but it then scrolls for all users.To make matters worse, the other users’ insertion points stay at the same point onthe screen as the document moves. So if they are typing when the screen is scrolled,their characters appear all over the document! It is a testimony to the power of socialprotocols that this system is not only used successfully, but also enjoyed.
Types of object
The kind of object or data we are cooperating over obviously affects the way we sharethem. This is particularly important in the unsynchronized case or where there is adanger of race conditions. That is, where two participants perform updates simultan-eously and there is confusion as to which comes first.
Consider first the text of a shared editor. Participants can add, edit or delete textanywhere in the document. We thus have to worry about them interfering with oneanother, for example one participant deleting the text that another participant is inthe middle of editing. Contrast this with a linear text transcript, as produced by someelectronic conferencing systems. The transcript is monotonic, that is one can only addto it, never take away, and appending contributions are always added to the end. Thismakes the job of handling updates much easier. Every time a participant completesa contribution, it is simply added to the end.
However, the text transcript is inherently sequenced. This makes it best suited tosynchronized groupware. If we imagine two distant sites, with no fast communica-tions, it is difficult to keep the transcripts similar. If each site adds any new items tothe end, the sites will show different transcripts. Imagine we have a user, Alison, atsite A, and a user, Brian, at site B. The transcript has two contributions ‘a1 b1’. Alisonand Brian both make a contribution at the same time, say ‘a2’ and ‘b2’ respectively.So site A sees ‘a2’ first and site B sees ‘b2’ first. After a while the contributions aretransmitted from site to site, leaving at site A the transcript ‘a1 b1 a2 b2’ and at

698 Chapter 19 n Groupware
site B the transcript ‘a1 b1 b2 a2’. The alternative is for the contributions to be timestamped, and to be ordered by time. However, this would mean that when a site received a contribution before the current time, it would have to insert it into theconversation. That is, the transcript ceases to be appending. We saw in Chapter 14some of the effects this has on the participants’ conversation.
Now, consider a shared hypertext, with no editing and deleting, just adding newnodes. It is not only monotonic, but also unsequenced: the order in which contribu-tions are added does not matter. They are structured explicitly by the links betweennodes, not by the order in which they occurred. It has a weaker appending propertyin that all new contributions are toward the leaves of the hypertext, but there are ofcourse many leaves. A monotonic unsequenced data structure is ideally suited tounsynchronized groupware; indeed several electronic conferencing systems adoptjust such a structure.
A shared whiteboard, again without an eraser, is also monotonic and unsequenced,but the limited size of the display does not make it feasible for large-scale conferen-cing. However, the properties are useful when implementing such a system. Basically,one only needs to worry about synchronizing the participants’ systems when one of them is using an eraser. Another advantage of such spatially organized data is that the participants can use proximity to denote relationships and set aside areas for different purposes. The participants can create their own structure, rather thanuse predefined structures.
Finally, imagine a complex structured object, such as a hypertext, or a shared filesystem. What happens if someone moves a portion of the hypertext tree while youare editing a node in it? This is similar to the problems of shared text, but the natureof text makes it easier for social protocols to operate. Furthermore, it is even harderto make sense of multiple structural updates than textual ones.
19.6.3 Integrating communication and work
In Section 19.2, we described the framework for cooperative work used to structureSections 19.3–19.5. Figure 19.13 shows the framework diagram, but with two extraarcs added. Recall first the arcs that were in the original diagram in Section 19.2. Eachof the sections dealt with the computer support of one of these arcs:
direct communication supported by email, electronic conferences and video connections;
common understanding supported by argumentation tools, meeting rooms andshared work surfaces;
control and feedback from shared artifacts supported by shared PCs and windows,shared editors, co-authoring systems and shared diaries.
The first new arc represents deixis. Recall that we encountered deictic reference in thecontext of meeting room software (Section 19.4.2). The participants needed to referto items on the shared screen, but could not use their fingers to point. In general,direct communication about a task will refer to the artifacts used as part of that task.

19.6 Frameworks for groupware 699
The other new arc runs between the participants, but through the artifact. Thisreflects the feedthrough where one participant’s manipulation of shared objects can be observed by the other participants. As we discussed in Section 19.5.5, thiscommunication through the artifact can be as important as direct communicationbetween the participants.
Although systems have been classified by the arc which they most directly support,many support several of these aspects of cooperative work. In particular, if the participants are not co-located, many systems will supply some alternative means of direct communication. For example, shared window systems are often used inconjunction with audio or video communications. However, these channels are very obviously separate, compared with, say, the TeamWorkStation where the sharedwork surface video images of hands are overlaid (see Section 19.4.3). In particular,this close association of direct communication with the artifacts makes deixis morefluid – the participants can simply point and gesture as normal.
In general, a test of a groupware product is how well it supports the whole of cooperative work. Another example of a system which does closely integrate directcommunication and shared artifacts is the co-authoring system Quilt. In Section19.5.3, we emphasized the structure of the artifact, but this is integrated with com-munication in two ways. First of all (and common to many similar systems), thecomments which are attached to the text are themselves a form of direct communica-tion – embedded within the context of work. This embedding makes deixis particu-larly easy. The comment itself may be attached to a particular point in the text, and also indexical terms like ‘the last sentence’ are easily interpreted. In addition,directed messages can contain references to Quilt objects, aiding deictic reference inthat medium also.
Figure 19.13 Cooperative work framework
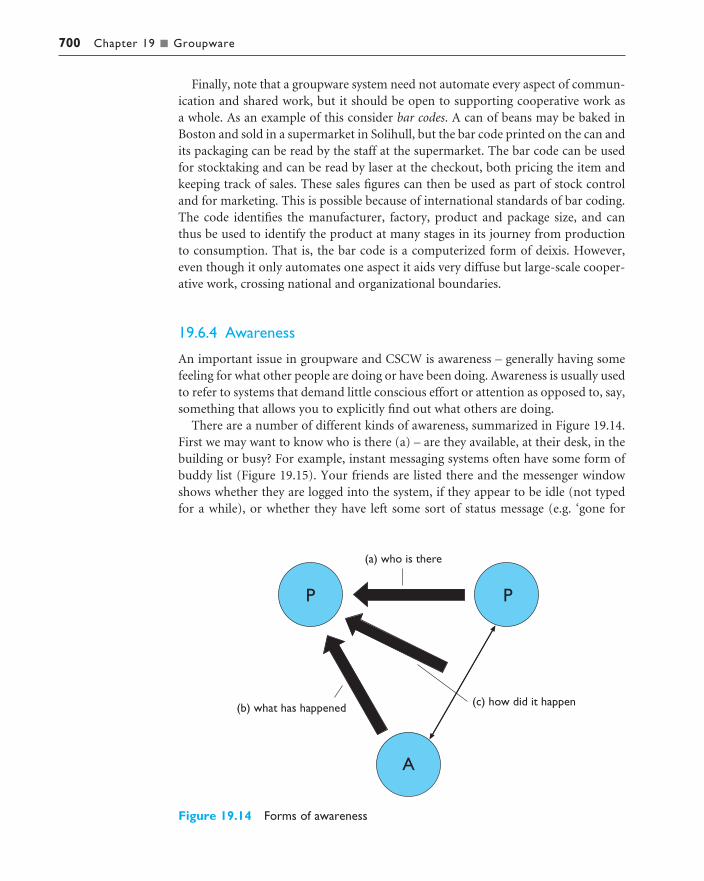
700 Chapter 19 n Groupware
Finally, note that a groupware system need not automate every aspect of commun-ication and shared work, but it should be open to supporting cooperative work as a whole. As an example of this consider bar codes. A can of beans may be baked inBoston and sold in a supermarket in Solihull, but the bar code printed on the can andits packaging can be read by the staff at the supermarket. The bar code can be usedfor stocktaking and can be read by laser at the checkout, both pricing the item andkeeping track of sales. These sales figures can then be used as part of stock controland for marketing. This is possible because of international standards of bar coding.The code identifies the manufacturer, factory, product and package size, and canthus be used to identify the product at many stages in its journey from productionto consumption. That is, the bar code is a computerized form of deixis. However,even though it only automates one aspect it aids very diffuse but large-scale cooper-ative work, crossing national and organizational boundaries.
19.6.4 Awareness
An important issue in groupware and CSCW is awareness – generally having somefeeling for what other people are doing or have been doing. Awareness is usually usedto refer to systems that demand little conscious effort or attention as opposed to, say,something that allows you to explicitly find out what others are doing.
There are a number of different kinds of awareness, summarized in Figure 19.14.First we may want to know who is there (a) – are they available, at their desk, in thebuilding or busy? For example, instant messaging systems often have some form ofbuddy list (Figure 19.15). Your friends are listed there and the messenger windowshows whether they are logged into the system, if they appear to be idle (not typedfor a while), or whether they have left some sort of status message (e.g. ‘gone for
Figure 19.14 Forms of awareness

19.6 Frameworks for groupware 701
Figure 19.15 Awareness in Yahoo! Messenger
DESIGN FOCUS
TOWER – workspace awareness
Alison is sitting at her desk working on a spreadsheet. She has just finished a complicated formula andas she sits back for a moment her eye drifts down the screen to a small window. It shows an electroniclandscape in which there are small avatars. She reaches for the phone. ‘Hi Brian’, she says. ‘Didn’t realize you were in’, ‘Just noticed you were looking at the year-end report. Don’t be alarmed if it looksa little rough, still finalizing it’.
Alison and Brian are using TOWER (Theatre of Work Enabling Relationships), an architecture and set of components that allow workspace awareness. The system has a number of sensor modules for
lunch’). Always-on video or audio connections also give a sense of being ‘around’your remote colleagues and effortlessly having a feeling for what they are doing,whether they are busy or in a meeting.
You may also want to be aware of what is happening to shared objects (b). Forexample, you might request that the system informs you when shared objects areupdated. Although knowing what has changed is important, ideally we would like to know why it has changed. Of course we could ask, but if we know how the changehappened (c), then we may be in a better position to infer the reasons for the change.Actually, very few systems do this except in so far as they allow users to add annotationsto explain changes. These two together (b and c) are called workplace awareness.
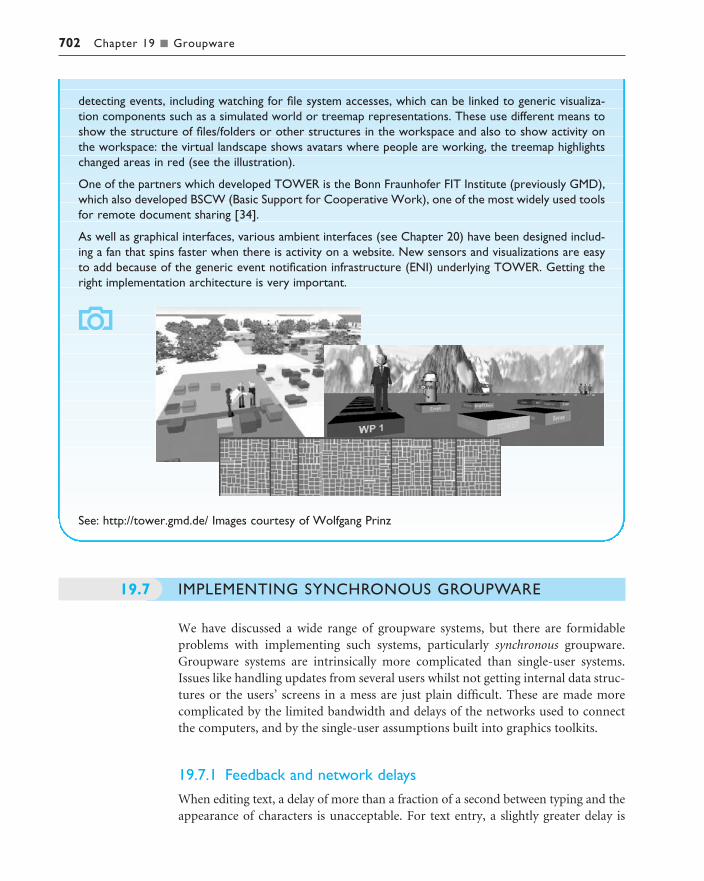
IMPLEMENTING SYNCHRONOUS GROUPWARE
We have discussed a wide range of groupware systems, but there are formidableproblems with implementing such systems, particularly synchronous groupware.Groupware systems are intrinsically more complicated than single-user systems.Issues like handling updates from several users whilst not getting internal data struc-tures or the users’ screens in a mess are just plain difficult. These are made morecomplicated by the limited bandwidth and delays of the networks used to connectthe computers, and by the single-user assumptions built into graphics toolkits.
19.7.1 Feedback and network delays
When editing text, a delay of more than a fraction of a second between typing and theappearance of characters is unacceptable. For text entry, a slightly greater delay is
19.7
detecting events, including watching for file system accesses, which can be linked to generic visualiza-tion components such as a simulated world or treemap representations. These use different means toshow the structure of files/folders or other structures in the workspace and also to show activity onthe workspace: the virtual landscape shows avatars where people are working, the treemap highlightschanged areas in red (see the illustration).
One of the partners which developed TOWER is the Bonn Fraunhofer FIT Institute (previously GMD),which also developed BSCW (Basic Support for Cooperative Work), one of the most widely used toolsfor remote document sharing [34].
As well as graphical interfaces, various ambient interfaces (see Chapter 20) have been designed includ-ing a fan that spins faster when there is activity on a website. New sensors and visualizations are easyto add because of the generic event notification infrastructure (ENI) underlying TOWER. Getting theright implementation architecture is very important.
See: http://tower.gmd.de/ Images courtesy of Wolfgang Prinz
702 Chapter 19 n Groupware

19.7 Implementing synchronous groupware 703
acceptable as you are able to type ahead without feedback from the screen. Drawing,on the other hand, demands even faster feedback than text editing. Groupware sys-tems usually involve several computers connected by a network. If the feedback loopincludes transmission over the network, it may be hard to achieve acceptableresponse times. To see why, consider what happens when the user types a character:
1. The user’s application gets an event from the window manager.2. It calls the operating system . . .3. which sends a message over the network, often through several levels of
protocol.4. The message is received by the operating system at the remote machine,5. which gives it to the remote application to process.6–8. the reply returns (as steps 2–4)9. and the feedback is given on the user’s screen.
This process requires two network messages and four context switches between oper-ating system and application programs in addition to the normal communicationbetween window manager and application. However, even this is just a minimumtime and other factors can make the eventual figure far worse. Network protocolswith handshaking can increase the number of network messages to at least four (two messages plus handshakes). If the application is running on a multi-taskingmachine, it may need to wait for a time slice or even be swapped out! Furthermore,the network traffic is unlikely to be just between two computers: in meeting roomswe may have dozens of workstations. Clearly, any architectural design for cooperat-ive systems must take the potential for network delays very seriously.
19.7.2 Architectures for groupware
There are two major architectural alternatives for groupware, centralized and replic-ated, with variations upon them both. In a centralized or client–server architectureeach participant’s workstation has a minimal program (the client) which handles the screen and accepts the participant’s inputs. The real work of the application isperformed by the server, which runs on a central computer and holds all the applica-tion’s data (Figure 19.16). Client–server architectures are probably the simplest toimplement as we have essentially one program, with several front ends. Furthermore,if you use X Windows then there are standard facilities for one program to accessseveral screens1 (see also Chapter 8).
As a special case, the server may run on one of the users’ workstations and sub-sume the client there. Typically, this would be the user who first invoked the sharedapplication. This arrangement is a master–slave architecture, the master being themerged server–client and the slaves the remainder of the clients. The user of the master will have a particularly fast response compared with the other users.
1 But beware, X uses the terms client and server in the opposite sense. The X server is on the workstationand the X client is the application program.

704 Chapter 19 n Groupware
The second major architecture is replicated. Each user’s workstation runs its owncopy of the application. These copies communicate with one another and attempt tokeep their data structures consistent with one another. Each replicate handles its ownuser’s feedback, and must also update the screen in response to messages from otherreplicates. The intention is often to give the impression of a centralized application,but to obtain the performance advantages of distribution.
Compared with a client–server architecture, the replicated architecture is difficultto program. In the last paragraph we deliberately wrote ‘attempt to keep their datastructures consistent’ as this is a major problem. If two users, say Jane and Sam, hit a key almost simultaneously, then Jane’s workstation will process Jane’s keystrokefirst, and Sam’s second, but Sam’s workstation will process them the other wayround, and yet they must give the same result – help!
This race condition is a common problem in distributed computing. A standardsolution there is to roll back one or other replicate and re-execute the commands.However, if the results have already been displayed on the user’s screen this is notacceptable – standard computing algorithms often fail for groupware. Happily, manyof the concurrency control mechanisms, such as locking or floor holders, mean thatsuch races do not occur, or at worst occur only when users obtain locks or other large-scale events. So, when rapid feedback is not required, standard mechanisms may beapplied, but, for real synchronous update, special-purpose algorithms are required.
The main advantage of a replicated architecture over the client–server is in thelocal feedback. However, the clients are often not completely dumb and are able tohandle a certain amount of feedback themselves. Indeed, the server often becomesmerely a central repository for shared data with the clients having most of the applica-tion’s functionality. On the other hand, a replicated architecture will rarely treat allthe replicates identically. If a user tries to load or save a document, that action doesnot want to be replicated. Either one of the replicates is special, or there is a minimalserver handling movement of data in and out of the system. So we see that there is acontinuum between the client–server and the replicated architecture.
Figure 19.16 Client–server architecture

19.7 Implementing synchronous groupware 705
Figure 19.17 Single-user application
19.7.3 Shared window architectures
Shared window systems have some similarities with general groupware architectures,but also some special features. Recall that there is a single-user application which isbeing shared by several participants on different workstations. The single-user applica-tion normally interacts with the user via a window manager, say X (Figure 19.17).The shared window manager works by intercepting the calls between the applicationand X.
Where the application would normally send graphics calls to X, these are insteadrouted to a special application stub. This then passes the graphics calls from the Xlibrary (Xlib) on to a user stub on each participant’s workstation. A copy of X is running on each workstation and the user stub passes the graphics calls to the localcopy of X. Similarly the users’ keystrokes and other actions cause X events which arepassed to the user stub and thence through the application stub to the application(Figure 19.18). In fact, the nature of X’s own client–server approach can make theuser stub unnecessary, the application stub talking directly to an X ‘server’ on eachworkstation.
The input side has to include some form of floor control, especially for the mouse.This can be handled by the application stub which determines how the users’ separ-ate event streams are merged. For example, it can ignore any events other than thoseof the floor holder, or can simply allow users’ keystrokes to intermingle. If key com-binations are used to request and relinquish the floor, then the application stub can simply monitor the event streams for the appropriate sequences. Alternatively,the user stub may add its own elements to the interface: a floor request button andan indication of other participants’ activities, including the current floor holder.
The problem with a client–server-based shared window system is that graphicscalls may involve very large data structures and corresponding network delays. Onecan have replicated versions where a copy of the application sits on each workstationand stubs communicate between one another. But, because the application is not collaboration aware, problems such as race conditions and reading and saving filesbecome virtually intractable. For this reason, most shared window systems take amaster–slave approach where the application runs on the first user’s workstation and

706 Chapter 19 n Groupware
subsequent users get slave processes. The delays for other users are most noticeablewhen starting up the application.
19.7.4 Feedthrough and network traffic
We have discussed the necessity of rapid feedback to the user who performs anaction, and we have seen how replication or partial replication can solve this.However, we must also worry about feedthrough, the reflection of one user’s actionson the other users’ screens. The requirements for feedthrough are not quite so strin-gent as for feedback, and this can be used to reduce the amount of network traffic.There is little difference in this respect between client–server and replicated archi-tectures, so, for the sake of argument, we will assume a client–server architecture.
Figure 19.18 Shared window architecture

19.7 Implementing synchronous groupware 707
Imagine a user has just typed a character. The character appears on the user’sscreen, either through local feedback or after an exchange with the server. However,all the other clients need to be informed also. That is, with n participants, each user action causes a minimum of n − 1 network messages. If this is repeated for eachcharacter, the network will grind to a halt with the number of messages. Just think of the effect if we wanted to send out updates for each mouse movement!
There are several ways out of this, the common thread being to reduce the number of messages. In principle, one could send a single broadcast message to all the other clients, as the information is the same for all of them. Unfortunately, inpractice, many network protocols only support point-to-point messages. A moresuccessful approach is to increase the granularity of the messages. The rapid feedbackto the user who initiated an action is necessary, but the feedthrough to other usersmay be able to cope with less frequent updates. The server can save up several char-acters’ worth of updates and send a single message. We thus only need to send the n − 1 messages to the clients on each chunk.
The choice of this chunk size can be crucial to the success of the system. If the participants can talk to each other (either co-located or with audio/video channels)they will refer to the contents of their screens. In such cases, lags of more than a fewseconds can be disastrous. However, even if the computer is the only communica-tions medium, the chunk size has an effect as the gradual appearance of text is anindication of other people’s activity.
19.7.5 Graphical toolkits
We discussed in Chapter 8 some of the widgets one finds in a typical graphics toolkitor window manager, such as menus, buttons, dialog boxes and text and graphicsregions. These are useful for creating single-user interfaces, and one would like to usethe same components to build a groupware system. Unfortunately, the single-userassumptions built into such toolkits can make this very difficult.
Some widgets may take control away from the application. For instance, a pop-upmenu may be invoked by a call such as
sel = do_pop_up(“new”,“open”,“save”,“exit”,0);
The call to do_pop_up_menu constructs the pop-up menu, waits for the user to entera selection, and then returns a code indicating which choice the user made (1 for‘new’, 2 for ‘open’, etc.). Of course, during this time the application cannot monitorthe network. This can be got round, by careful programming, but is awkward.
More fundamentally, the functionality of toolkit widgets may be insufficient forgroupware. This is particularly obvious for text areas. The toolkit often takes over alot of the tedium of handling an editable text region: the user can type and delete, docursor movement and even cut and paste, all without the application’s intervention.However, the groupware developer may want to have multiple cursors, or to ensurethat all the participants can see the same portion of a document. Unfortunately, eveninformation such as what portion of the document is in view, or where a particular

708 Chapter 19 n Groupware
logical character is displayed on the screen is difficult to come by, as is control overa scrollbar if this is to be shared. One is often forced to design the application roundthe limited capabilities of the text widget, or to use bitmap operations to paint thetext oneself.
Despite the difficulties of toolkits, some have facilities which are a positive help.For example, the SunView toolkit and its X version, XView, are both notificationbased (see Chapter 8). As well as notifications of user events, they can be asked to tellyou when a network channel is ready for reading or writing. Thus, the interface andthe network can be programmed in a similar style.
19.7.6 Robustness and scaleability
If you are producing a shared application to test an idea, or for use in an experiment,then you can make a wide range of assumptions, for instance a fixed number of par-ticipants. Also, the occasional crash, although annoying, is not disastrous. However,if you expect a system to be used for protracted tests or for commercial productionthen the standards of engineering must be correspondingly higher. Four potentialsources of problems are:
1. Failures in the network, workstations or operating systems.2. Errors in programming the shared application.3. Unforeseen sequences of events, such as race conditions.4. The system does not scale as the number of users or rate of activity increases.
A full description of these problems and their solutions is, of course, beyond thisbook. For this, the reader should turn to texts on software engineering, real-time anddistributed programming. Furthermore, the details will differ between networkingsoftware, operating systems and other software support. However, there are a fewgeneral remarks and specific issues which we will discuss.
To some extent, the above problems are common to single-user systems: hardwareproblems, bad programming and the like. Indeed, most commercial software theauthors have used suffers the occasional (or frequent) crash. However, there are factors which make multi-user systems more fragile. The large number of differenthardware and software components of a multi-user system means that a fault of type 1 is more likely to occur. Also, the complexity of the algorithms used in group-ware makes a fault of type 2 more likely. In both cases there is a danger that the consequences of the failure will propagate throughout the system. If a single failurecrashes the whole system, it probably will not be used twice! Interleaving of differentusers’ actions and the unpredictable effects of network delays increases the chance of errors of type 3. Finally, system development and testing may involve only two or three people, and thus hidden assumptions about the number and activity of users may not become apparent until the system ‘goes live’. So, faults are more likelyand the effects are far worse – instead of losing one user’s document or datafile (sad though that might be), a groupware crash can destroy the work of a whole teamof people.

19.7 Implementing synchronous groupware 709
Server faults
The most obviously disastrous problem in a client–server-based system is a servercrash, whether hardware or software. Fortunately, this is most amenable to stand-ard solutions. Most large commercial databases have facilities (such as transactionlogging) to recover all but the most recent changes. If the groupware system is not built using such a system then similar solutions can be applied; for example, you canperiodically save the current state using two or three files in rotation. The last entry2
in each file is the date of writing and the system uses the most recent file when it restarts, ignoring any partially written file. Remember, though, that this mightmean your server going ‘silent’ for a few seconds each time it saves the file – can yourclients handle this? In really critical situations one can have multiple servers andcopies of the data, so that a backup server can take over after a crash of the primaryserver.
Workstation faults
More often, individual workstations, or the programs running on them, will crash.This is partly because there are more of them, and partly because their code is morecomplex. In particular, these programs are handling all the user’s interactions andare built upon complex (and frequently flaky) graphical toolkits. Of course, one triesto program carefully and avoid these errors, but experience shows that they will con-tinue to occur. The aim is to confine the fault to the particular user concerned andto recover from the fault as quickly as possible. When thinking about a client–serverarchitecture, there are three ‘R’s for the server:
Robust A client failure should not destroy or ‘hang’ the server. In particular, never have the server wait for a response from the client – it may never come. Theserver should either be event driven or poll the clients using non-blocking networkoperations.
Reconfigure The server must detect that the client has failed and reconfigure therest of the system accordingly. The client’s failure can be detected by standard network failure codes, or by timing out the client if it is silent for too long.Reconfiguring will involve resetting internal data structures, and informing otherparticipants that one of them is unavailable and why. Do not let them think theircolleague is just being rude and not replying!
Resynchronize When the workstation/client recovers, the server must sendsufficient information for it to catch up. A server may normally broadcast incremental information (new messages, etc.), so make sure that the server keepstrack of all the information needed to send to the recovered client. This is verysimilar to the case of a new participant joining the groupware session.
2 A crash might happen in the middle of the save.
710 Chapter 19 n Groupware
Replicated architectures have similar issues. Imagine we have three replicates A, Band C. Replicate A has crashed, so both B and C must detect this and correct theirinternal data structures accordingly. An additional problem is that one replicate, sayB, may detect the failure before the other. So, C may send B a message which refersto A in some way – B must deal with this situation gracefully.
Algorithm faults
Some application failures do not crash the application and may therefore be more difficult to detect. For instance, data structures between replicates or betweenclient and server may become inconsistent. Obviously this should not happen, if thealgorithms are correct. Indeed, such critical algorithms should be given the closestscrutiny and perhaps proved correct using formal methods (see Chapter 17).However, one should be prepared for errors and, where possible, include sufficientredundancy and sanity checks in the code so that inconsistencies are at least detectedand, ideally, corrected.
Such defensive programming mechanisms, against hardware and software errors,may be very expensive in programming effort and execution time. For experimentalsystems they may be excessive. A minimum requirement for all but toy systems issome form of reset, which forces the system to resynchronize all its data structuresbetween clients and server or between replicates; hopefully, losing none but the mostrecent updates in the process.
Unforeseen sequences of events
Distributed programming has many problems of which possibly the most wellknown is deadlock. This is when two (or more) processes are each waiting for theother to do something. A common scenario is where process A is trying to send amessage to B and B is trying to send one to A. Because A is busy trying to send, it does not want to receive a message from B, and vice versa. The possibility of deadlock can often go undetected during testing because of operating system andnetwork buffers. A’s message to B is stored in the operating system’s buffer, so A canthen read B’s message. Unfortunately, as load increases, one day the buffer is full anddeadlock can no longer be avoided – this may only happen after the system has beenreleased.
The first rule to avoid deadlock is never to use blocking input or output. That is,always use network calls which time out, or return immediately if the operation cannot continue. Use of an event-driven programming style can also help, as doesthe use of constructs such as the UNIX ‘select’ system call, which monitors severalcommunication channels simultaneously.
At a higher level, one should also avoid making assumptions about the orderingof incoming events. This is also important to avoid problems with race conditions.For example, if a client process has sent a message to a server requesting information,it should not assume that the next message from the server will answer the query.

19.7 Implementing synchronous groupware 711
A common assumption in groupware programs is that messages sent from onecomputer arrive in the same form at another. This depends very much on the particular protocols used. Consider UNIX stream-based sockets, commonly used inexperimental groupware applications. The communication paradigm is not packetbased, but of a character stream. Imagine a client sends two messages to the server.The first is 26 characters long, ‘abcd . . . xyz’, the second is 10 characters long,‘0123456789’. When testing such a system it is very likely that the server will read twomessages of 26 and 10 characters, exactly as sent, but this is not guaranteed. It is perfectly possible to get one message of 36 characters, ‘abc . . . xyz01 . . . 89’, or evenone of 10 and one of 26, ‘abcdefghij’ and ‘klm . . . xyz01 . . . 89’. The solution is easy:one always uses fixed-length messages, or alternatively you code the message lengthinto the message header. The recipient can then reconstruct the messages from thebyte stream. The difficulty is that the problem can go undetected for a long time and then cause a major disaster. Read your network manual very carefully and assumenothing.
Scaling up
In general, the most certain way to avoid algorithmic errors is to use simple algorithms: tables rather than complicated data structures, fixed-length fields fornames and messages. These all go toward reducing the likelihood of some of thefaults described earlier, and are the recommended techniques for prototyping anapplication. Unfortunately, these are precisely the programming techniques whichfrustrate the scaling up of the system to larger numbers of users, or greater loads.
As the system develops, the initial algorithms and data structures will need toevolve. This will be easier if the future scaling of the system is taken into account atthe beginning. Good software engineering practice helps. For example, if the messagepassing is in a separate module then an initial design can use fixed-length and textu-ally coded messages (for ease of debugging). But, when the throughput of the systemincreases, the message passing can be easily changed to variable length messages, perhaps buffering several messages together (to reduce network traffic) and binarycoding of the messages (for efficiency).
Where fixed-size assumptions are made in early versions, these should be docu-mented: ‘the present design only caters for up to six users’. Even more important, the system ought to detect when these bounds are broken and behave sensibly. In programming terms, this tends to mean checking array bounds, rather than scribbling randomly over memory! Sometimes these bounds are known in advance,but always try to encapsulate these decisions so that if the bounds do need to changeyou know where in the code to find them.
A particular problem for the server is that the operating system may limit thenumber of open files/network connections at any time. For example, let us supposethe limit is 16 files and suppose the server is using one for the application datafile andone for logging. This means that at most 14 clients can be connected at once. Evenworse, say the server periodically opens the datafile to save data, but closes it between
712 Chapter 19 n Groupware
times. Unless the server itself keeps the number of clients below 14, it may be that 15clients get connected, which, including the logging file, saturates the server’s allowablefiles. Now, when the server comes to save the data, it cannot open the datafile.Obviously, the groupware writer must at least be aware of these limits in order toprevent such a disaster.
There are a few solutions to this problem. The operating system limit can bealtered; for example, in MS-DOS this involves changing the ‘FILES=’ line in the file ‘CONFIG.SYS’. However, this is more difficult under UNIX, and in general the limits and how to alter them are very system dependent. The server can avoid theuse of permanent network connections and instead use datagram protocols, wherethe client and the server are only connected while a message is being exchanged.Finally, there may be more system-dependent ‘tricks’, for example forking extraservers under UNIX.
Testing for robustness
Often the functionality of an application is tested by having several windows on thesame workstation, each acting as a different ‘user’. Unfortunately, this is unlikely tocatch the sort of problems discussed above as it is impossible to type simultaneouslyinto two windows. A more violent approach is required; in fact, the general rule is . . . mistreat it.
Crashes and major faults can be simulated. Try rebooting a workstation or pullingout a network connector.3 To be slightly more gentle, you could simply kill a clientprocess and see the effect on the server (or on replicates).
Similarly, you can simulate race conditions and odd sequences by running the system between two workstations and then hitting keys on them simultaneously. A little bit of knowledge of the system will suggest the best combination.
Random input may crash your system. Push it hard at several levels. Have a groupof colleagues on different workstations type and hit mouse buttons as fast as they can – but log the keystrokes as you may want to recreate the resulting situations forlater debugging. Create a rogue client/replicate, which sends random, but correctlyformed, messages to the server or other replicates. Alternatively, this can be arrangedwithout network communications by building a test harness round a single process.A similar, possibly less fair, approach is to send random data down the network at a process.
Finally, the real acid test. Offer a group of computer science undergraduates adrink each if they can break the system – you will lose your money, of course.
Unfortunately, discovering you have a fault is only the first step – correcting it ismore difficult still. Modular and defensive programming and logging of communica-tions so that errors can be recreated are a good beginning, but experience and hardwork are the final answer.
3 But beware, check with other users and your system administrator first – this may crash some operat-ing systems.

19.8 Summary 713
SUMMARY
We discussed groupware under three headings: computer-mediated communica-tion, meeting and decision support systems, and shared applications and artifacts.Computer-mediated communication supports direct interpersonal contact. SomeCMC systems are asynchronous, including traditional email and structured messag-ing systems. Various forms of video communication support synchronous commun-ication, such as video conferences, direct person-to-person video or social contact.
Meeting and decision support systems are aimed at helping users to generate andrecord new ideas and reach decisions. Meeting rooms use large shared screens tosupport synchronous co-located collaboration. Participants’ own terminals are oftenWYSIWIS and they may use group pointers to support deictic reference. When theparticipants are remote, various forms of work surface can be used instead. Finally,for asynchronous working, systems like gIBIS help designers to record their decisionsand why they came by them.
Shared window systems and PCs allow non-collaboration-aware applications to be used by a group. However, collaboration-aware applications such as sharededitors, diaries and co-authoring systems can better support the use of sharedobjects. Shared objects may even be the sole means of communication. Whether ornot there is additional direct communication, we must always recall the importanceof communication through the artifact.
Several frameworks for classifying groupware were discussed. The time/spacematrix classifies systems by where and when the participants are working. However,we saw that the term ‘asynchronous’ is rather ambiguous. Shared information maybe shared at different granularities, and at different levels of detail. Also, differentdata structures are better suited to different situations. Finally, we discussed theframework used to structure the discussion in this chapter. This looks at the dif-ferent paths of communication between the participants and the artifacts of workand at which aspects are automated: direct communication, shared understanding, deictic reference, control of and feedback from the object. A good groupware systemwill not just automate one path, but do so in a way which supports the whole processof cooperation. As an example, bar codes merely automate deixis, but are important in facilitating transnational collaboration.
Groupware systems are more complex than single-user ones. We consideredarchitectures for synchronous groupware, client–server and replicated, and forshared windowed systems. The choice of architecture combined with network delaysinfluences the sort of feedback participants receive of their own actions. As import-ant, it also influences the feedthrough they experience of other participants’ actions.The widgets supplied by graphical toolkits are designed with single-user applicationsin mind, and so the groupware designer must either fit around these limitations orprogram group widgets from scratch. Finally, it is very important that groupware is robust. Problems are more likely to occur owing to the increased complexity, butare more damaging, because of the large number of people affected.
19.8

714 Chapter 19 n Groupware
EXERCISES
19.1 We discussed the use of a group pointer in a shared editor with a shared view.Consider the advantages and problems of using a group pointer when participants have differ-ent views. How do you show the pointer if it is outside part of the document you are workingon? Think also about the issues when the system is a hypertext-based co-authoring system. Isthere any use for a group pointer in this case?
19.2 Repeat the worked exercise in Section 19.6.1, but this time look for shared data on your system.Is the data updated by one person and viewed by many, or have you got files or databases whichare updated by several people? If the latter, find out what methods are used to prevent twousers changing the same data at the same time. There may be no mechanism at all, a computer-ized one (for example, locking) or a social protocol (for example, a floppy disk is passed around).
19.3 (a) Consider the widespread use of email. What explanations are there for its success and what lessons can be learned from its development to assist the design of other computer-mediated communication systems?
(b) What are the main issues that need to be addressed to ensure the success of email in an organization?
19.4 How do you think groupware is likely to affect our lives in the future? Justify your answer withexamples.
19.5 (a) Low bandwidths and single media groupware systems reduce the transmission of back channels. How does this affect communication?
(b) Emoticons are used in text-based communication to provide information about the moodof the sender. Is there any need for such augmentation in audio or video conferencing?Justify your answer.
19.6 How effective is the time/space matrix as a tool for classifying and analyzing groupware?
19.7 What is meant by the terms control and feedback and feedthrough in the classification by functionframework?
19.8 Distinguish between direct and indirect communication. How can each be supported in groupware?
19.9 Identify three types of shared application. What are the main issues that need to be addressedin the design of these applications?
19.10 How far do technological factors limit what groupware can achieve at present? Suggest an example of groupware that is limited by factors other than technology.
19.11 What are the two main architectures used for groupware systems? Identify the strengths andlimitations of each and suggest how they can be resolved.
19.12 A company has offices in New York and London. They are considering using some form of videoto supplement their existing email, fax and telephone communications.
(a) Discuss the options available and potential advantages and problems they may encounter.(b) How would your advice be changed if the two offices were in London and Sydney Australia?(c) Email and video are ‘just’ electronic substitutes for face-to-face conversation. What radically
different forms of groupware might the company consider? Justify your answer using exam-ples and appropriate theoretical frameworks.

Recommended reading 715
RECOMMENDED READING
G. Olson and J. Olson, Groupware and computer supported cooperative work. In J. J. Jacko and A. Sears, editors, Handbook of Human–Computer Interaction, pp. 583–95, Lawrence Erlbaum, 2003.A detailed overview of different kinds of groupware.
T. Rodden, A survey of CSCW systems, Interacting with Computers, Vol. 3, No. 3, 1991.
J. S. Olson, G. M. Olson, L. A. Mack and P. Wellner, Concurrent editing: the group’sinterface. In Human–Computer Interaction – INTERACT’90, pp. 835–9, North-Holland, 1990.
C. Ellis, S. J. Gibbs and G. L. Rein, Groupware: some issues and experience,Communications of the ACM, Vol. 34, No. 1, pp. 38–58, January 1991.Overview and survey articles on groupware systems. The last article also includesa description of the Grove system.
Tutorials on building groupware. In previous editions we have suggested readingtutorial notes and attending tutorials on building groupware. The ones we usedin the past are looking rather dated, but it is much harder now to find places tofind out about groupware construction. This is perhaps partly because a lot ofexperimental groupware is built over web platforms (see also Chapter 21 for this).We will include what links and information we can on the book web pages for thischapter: /e3/chaps/ch19/
A. Schill, Cooperative Office Systems, Prentice Hall, 1995.Describes international standards in distributed computing, databases and docu-ment description. Aimed principally, but not solely, at asynchronous groupware.
The ACM CSCW conference has run biennially in even years from 1986. The pro-ceedings from CSCW’86 on are all ACM publications. It is now hard to get holdof earlier proceedings, but more recent proceedings are available.
The European CSCW conference runs in the odd years, since 1989, and proceedingsare available. The proceedings of the first conference ECSCW’89 are also availableas a book (see below).
J. M. Bowers and S. D. Benford, editors, Studies in Computer-supported CooperativeWork: Theory, Practice and Design, North-Holland, 1991.Selected papers from ECSCW’89.
See also references in the text to papers describing particular groupware systems.

UBIQUITOUS COMPUTING
AND AUGMENTED REALITIES
OV E RV I E W
n The traditional computer is a glass box – all you can dois press buttons and see the effect.
n Ubiquitous computing and augmented reality systemsbreak this glass box by linking the real world with theelectronic worlds.
n Applications include:– ubiquitous computing– virtual reality– augmented reality– information visualization.
20
This chapter is based on ‘The human experience’ by Gregory Abowd,Elizabeth Mynatt and Tom Rodden, which appeared in IEEE PervasiveComputing Magazine, Special Inaugural Issue on Reaching for Weiser’sVision, Vol. 1, Issue 1, pp. 48–58, Jan–March 2002, © 2002 IEEE.

20.2 Ubiquitous computing applications research 717
INTRODUCTION
There are several ways in which the earliest assumptions of HCI are challenged. Forexample, we no longer assume there is a single user; rather, we consider groups and larger organizational concerns when discussing interactions. In this chapter, we challenge another assumption concerning the form factor of the computingdevice. Traditionally, we think of computers as a glass box, a workstation with key-board, mouse and monitor sitting on a desk that we seek out when we want to dosome work. Since the late 1980s, this traditional form factor has been expanded toinclude a variety of more mobile devices and computing services that are distributedthroughout the physical world and more tightly integrated with it. The trend istowards a ubiquitous or pervasive computing experience, in which computingdevices become so commonplace that we do not distinguish them from the ‘normal’physical surroundings. Improved display technologies give us the ability to augmentthe physical world with electronic information through head-mounted displays orsteerable projection surfaces. We have also seen display technologies that providecomplete virtual replacements of the physical world, creating a so-called virtual reality.
In this chapter, we will review the progress and challenges in the areas of ubiquit-ous computing, augmented reality, virtual reality and visualization.
UBIQUITOUS COMPUTING APPLICATIONS RESEARCH
We first introduced the notion of ubiquitous computing (or pervasive computing) inChapter 4. The interest in ubiquitous computing has surged over the past few years,thanks to some influential writings and plenty of experimental work. The defin-ing characteristic of ubiquitous computing is the attempt to break away from the traditional desktop interaction paradigm and move computational power into theenvironment that surrounds the user. Rather than force the user to search out andfind the computer’s interface, ubiquitous computing suggests that the interface itselfcan take on the responsibility of locating and serving the user.
Mark Weiser is credited with coining the phrase ubiquitous computing (or ubicomp) when he put forth a vision of people and environments augmented with computational resources that provide information and services when and wheredesired [369]. Though his vision has excited many technologists, it is important torealize that the main motivation behind Weiser’s vision was centered on the impactubicomp would have on the human experience:
Machines that fit the human environment instead of forcing humans to enter theirswill make using a computer as refreshing as a walk in the woods.
(Weiser, 1991)
20.2
20.1

718 Chapter 20 n Ubiquitous computing and augmented realities
We wanted to put computing back in its place, to reposition it into the environmentalbackground, to concentrate on human-to-human interfaces and less on human-to-computer ones.
(Weiser et al., 1999)
Inspired by the social scientists, philosophers, and anthropologists at PARC, we havebeen trying to take a radical look at what computing and networking ought to be like. We believe that people live through their practices and tacit knowledge so that themost powerful things are those that are effectively invisible in use. This is a challengethat affects all of computer science. Our preliminary approach: Activate the world.Provide hundreds of wireless computing devices per person per office, of all scales(from 1″ displays to wall sized). This has required new work in operating systems, user interfaces, networks, wireless, displays, and many other areas. We call our work‘ubiquitous computing’. This is different from PDAs, dynabooks, or information atyour fingertips. It is invisible, everywhere computing that does not live on a personaldevice of any sort, but is in the woodwork everywhere.
(Weiser, 1994)
What is ubiquitous computing technology? Our general working definition is any computing technology that permits human interaction away from a single workstation. This includes pen-based technology, handheld or portable devices,large-scale interactive screens, wireless networking infrastructure, and voice orvision technology. Realizing the human-centered vision of ubicomp with these technologies presents many challenges. Here we will focus on three:
n defining the appropriate physical interaction experience;n discovering general application features;n theories for designing and evaluating the human experience within ubicomp.
20.2.1 Defining the appropriate physical interaction experience
Ubiquitous computing inspires application development that is ‘off the desktop’. Inaddition to suggesting a freedom from a small number of well-defined interactionlocales (the desktop), this vision assumes that physical interaction between humansand computation will be less like the current desktop keyboard/mouse/displayparadigm and more like the way humans interact with the physical world. Humansspeak, gesture and use writing implements to communicate with other humans andalter physical artifacts. The drive for a ubiquitous computing experience has resultedin a variety of important changes to the input, output and interactions that definethe human experience with computing. We describe three of those changes in thissection.
Toward implicit input
Input has moved beyond the explicit nature of textual input from keyboards andselection from pointing devices to a greater variety of data types. As we will show,this has resulted in not only a greater variety of input technologies, but also a

20.2 Ubiquitous computing applications research 719
shift from explicit means of human input to more implicit forms of input [315]. Byimplicit input we mean that our natural interactions with the physical environmentprovide sufficient input to a variety of attendant services, without any further userintervention. Recall the discussion of levels of intention in Chapter 18 (Section 18.4),some implicit interaction is intentional, for example tipping a PDA to move betweenpages. However, implicit interaction is most radical when it allows low intention and incidental interaction. For example, walking into a space is enough to announceone’s presence and identity in that location.
Computer interfaces that support more natural human forms of communication(e.g. handwriting, speech and gestures) are beginning to supplement or replace elements of the graphical user interface interaction paradigm. The emerging area of perceptual interfaces is being driven by long-standing research communities incomputer vision and multi-modal recognition technologies (mainly handwritingand speech). Pen-based interaction, unsuccessfully rushed to the market in the early1990s, is also experiencing resurgence. Large-scale touch-interactive surfaces, usingtechnologies such as capacitive coupling have made it possible to create multi-person interactive surfaces on tables and walls (see Figure 20.1). Recognition of free-hand writing is improving, but more significantly, mass adoption has followed theintroduction of less sophisticated and more robust recognition technologies, such asGrafiti. We have even seen compelling examples of how voice and pen input can beused effectively in applications without requiring any recognition at all (e.g. [174]).
Figure 20.1 The DiamondTouch input technology from Mitsubishi Electric Research Lab (MERL) usescapacitive coupling through humans to provide a large-scale input surface for multiple simultaneous users.See www.merl.com/projects/DiamondTouch/ for more details. Source: Courtesy of Mitsubishi ElectricResearch Laboratories, Inc.
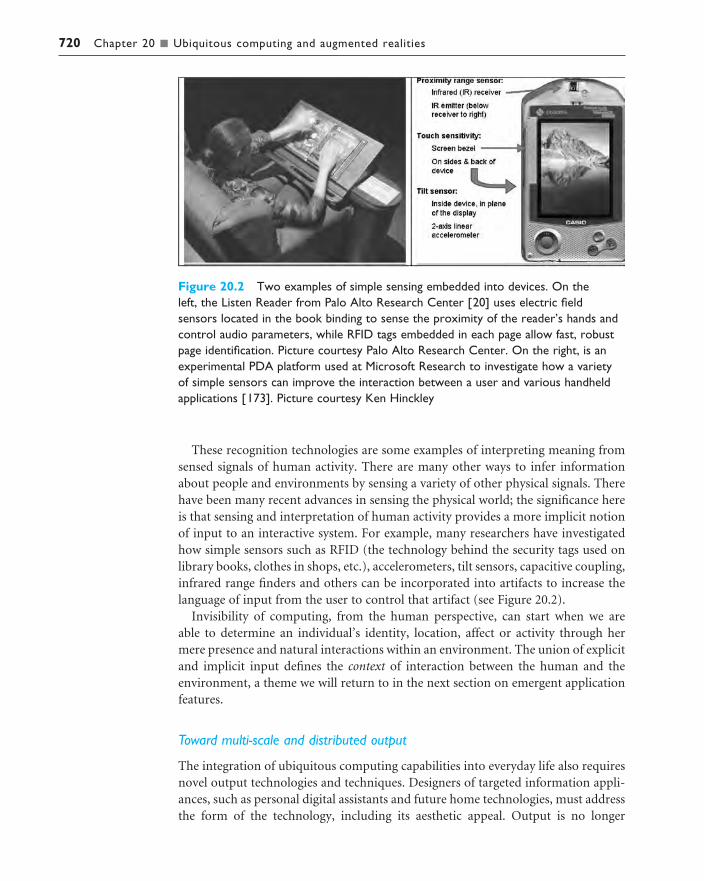
720 Chapter 20 n Ubiquitous computing and augmented realities
These recognition technologies are some examples of interpreting meaning fromsensed signals of human activity. There are many other ways to infer informationabout people and environments by sensing a variety of other physical signals. Therehave been many recent advances in sensing the physical world; the significance hereis that sensing and interpretation of human activity provides a more implicit notionof input to an interactive system. For example, many researchers have investigatedhow simple sensors such as RFID (the technology behind the security tags used onlibrary books, clothes in shops, etc.), accelerometers, tilt sensors, capacitive coupling,infrared range finders and others can be incorporated into artifacts to increase thelanguage of input from the user to control that artifact (see Figure 20.2).
Invisibility of computing, from the human perspective, can start when we are able to determine an individual’s identity, location, affect or activity through hermere presence and natural interactions within an environment. The union of explicitand implicit input defines the context of interaction between the human and theenvironment, a theme we will return to in the next section on emergent applicationfeatures.
Toward multi-scale and distributed output
The integration of ubiquitous computing capabilities into everyday life also requiresnovel output technologies and techniques. Designers of targeted information appli-ances, such as personal digital assistants and future home technologies, must addressthe form of the technology, including its aesthetic appeal. Output is no longer
Figure 20.2 Two examples of simple sensing embedded into devices. On the left, the Listen Reader from Palo Alto Research Center [20] uses electric fieldsensors located in the book binding to sense the proximity of the reader’s hands andcontrol audio parameters, while RFID tags embedded in each page allow fast, robustpage identification. Picture courtesy Palo Alto Research Center. On the right, is anexperimental PDA platform used at Microsoft Research to investigate how a varietyof simple sensors can improve the interaction between a user and various handheldapplications [173]. Picture courtesy Ken Hinckley
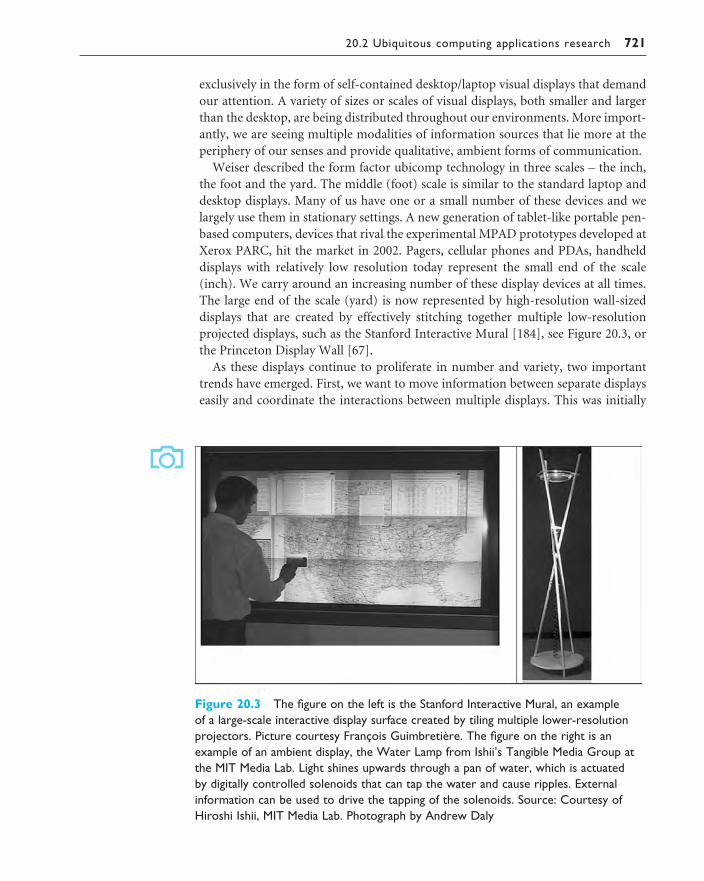
20.2 Ubiquitous computing applications research 721
exclusively in the form of self-contained desktop/laptop visual displays that demandour attention. A variety of sizes or scales of visual displays, both smaller and largerthan the desktop, are being distributed throughout our environments. More import-antly, we are seeing multiple modalities of information sources that lie more at theperiphery of our senses and provide qualitative, ambient forms of communication.
Weiser described the form factor ubicomp technology in three scales – the inch,the foot and the yard. The middle (foot) scale is similar to the standard laptop anddesktop displays. Many of us have one or a small number of these devices and welargely use them in stationary settings. A new generation of tablet-like portable pen-based computers, devices that rival the experimental MPAD prototypes developed atXerox PARC, hit the market in 2002. Pagers, cellular phones and PDAs, handhelddisplays with relatively low resolution today represent the small end of the scale(inch). We carry around an increasing number of these display devices at all times.The large end of the scale (yard) is now represented by high-resolution wall-sizeddisplays that are created by effectively stitching together multiple low-resolutionprojected displays, such as the Stanford Interactive Mural [184], see Figure 20.3, orthe Princeton Display Wall [67].
As these displays continue to proliferate in number and variety, two importanttrends have emerged. First, we want to move information between separate displayseasily and coordinate the interactions between multiple displays. This was initially
Figure 20.3 The figure on the left is the Stanford Interactive Mural, an example of a large-scale interactive display surface created by tiling multiple lower-resolutionprojectors. Picture courtesy François Guimbretière. The figure on the right is anexample of an ambient display, the Water Lamp from Ishii’s Tangible Media Group atthe MIT Media Lab. Light shines upwards through a pan of water, which is actuated by digitally controlled solenoids that can tap the water and cause ripples. Externalinformation can be used to drive the tapping of the solenoids. Source: Courtesy ofHiroshi Ishii, MIT Media Lab. Photograph by Andrew Daly

722 Chapter 20 n Ubiquitous computing and augmented realities
explored by Rekimoto’s ‘pick-and-drop’ demonstration [302], and further developedin the Stanford Interactive Room [139]. Secondly, as displays proliferate, we desirethem to be less demanding of our attention. Weiserian invisibility comes throughdesign of output that provides for peripheral awareness of information out of theforeground of our conscious attention.
The trend toward peripheral output has been explored for a particular class of displays, called ambient. Ambient displays require minimal attention and cognitiveeffort, and are thus more easily integrated into a persistent physical space. One of the first ambient displays, the Dangling String [372], was invented at Xerox PARC by the artist Natalie Jeremijenko. Using analog sensing of network traffic from the cabling in the ceiling, a motor drove the spin of a long string. The more traffic,the faster the rotation. During high traffic periods, the whir of the string was faintlyaudible as well.
The Dangling String shares many features with subsequent efforts in ambient displays. A data source drives the abstract representation such that the output can be monitored by the user’s peripheral perception. The data source is generally infor-mation that is of medium to low priority, but beneficial for the user to be aware of,perhaps for some opportunistic action. As these displays are meant to be persistentlyavailable in the environment, they are often designed to be aesthetically appealingand novel (for example, the Water Lamp in Figure 20.3). Other examples of ambientdisplays include ambientROOM, which projects information about colleagues aspinpoints of light on the wall [190], Audio Aura, which encodes the arrival of incom-ing email as auditory cues in a mobile device [249], and Kandinsky, which assemblesimages triggered from keywords in information bulletins into an aesthetically pleas-ing and intriguing collage [138].
Though our experience with computing output is dominated by the use of thevisual channel, examples such as Audio Aura demonstrate how other modes of out-put can be effective at communicating ambient information. Other forms of outputinclude actuation of small devices. With the introduction of simple programmingtools for dealing with motors and other actuators, such as Phidgets [156], mechan-ical actuation to drive distributed output devices will increase.
Seamless integration of physical and virtual worlds
An important feature of ubicomp technology is that it attempts to merge computa-tional artifacts smoothly with the world of physical artifacts. There have been plentyof examples demonstrating how electronic information can be overlaid upon the realworld, thus producing an augmented reality [130]. An example of such augmentedreality is NaviCam, a portable camera/TV that recognizes 2D glyphs placed onobjects and can then superimpose relevant information over the object for display on the TV screen (Figure 20.4 shows a shot of what the portable TV shows the user). This form of augmented reality only affects the output. When both input and output between are intermixed, as with the DigitalDesk [374], see Figure 20.4,we begin to approach the seamless integration of the physical and virtual worlds.Researchers have suggested techniques for using objects in the physical world to
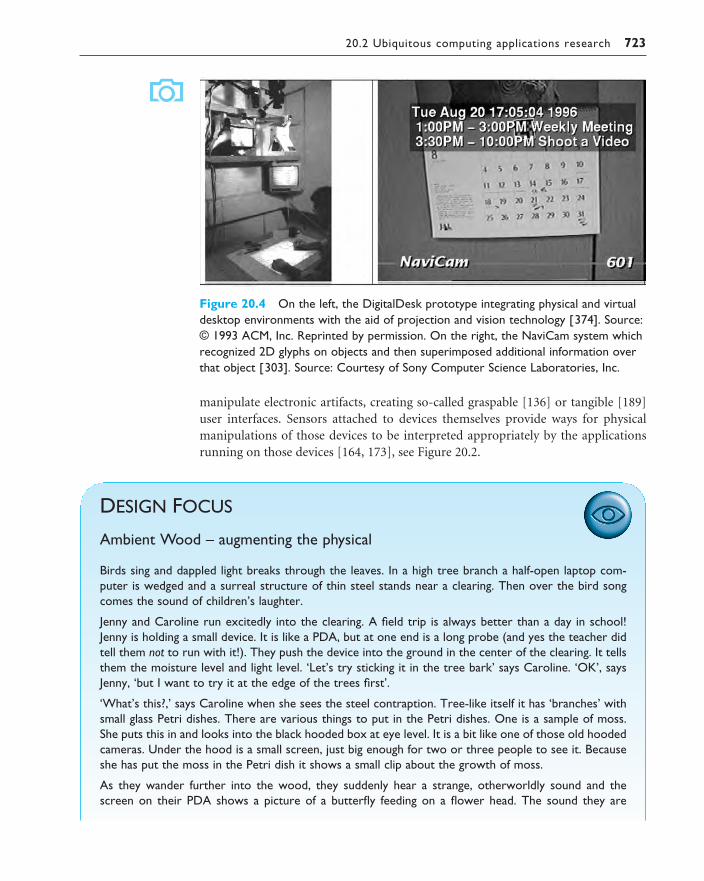
20.2 Ubiquitous computing applications research 723
DESIGN FOCUS
Ambient Wood – augmenting the physical
Birds sing and dappled light breaks through the leaves. In a high tree branch a half-open laptop com-puter is wedged and a surreal structure of thin steel stands near a clearing. Then over the bird songcomes the sound of children’s laughter.
Jenny and Caroline run excitedly into the clearing. A field trip is always better than a day in school!Jenny is holding a small device. It is like a PDA, but at one end is a long probe (and yes the teacher didtell them not to run with it!). They push the device into the ground in the center of the clearing. It tellsthem the moisture level and light level. ‘Let’s try sticking it in the tree bark’ says Caroline. ‘OK’, saysJenny, ‘but I want to try it at the edge of the trees first’.
‘What’s this?,’ says Caroline when she sees the steel contraption. Tree-like itself it has ‘branches’ withsmall glass Petri dishes. There are various things to put in the Petri dishes. One is a sample of moss.She puts this in and looks into the black hooded box at eye level. It is a bit like one of those old hoodedcameras. Under the hood is a small screen, just big enough for two or three people to see it. Becauseshe has put the moss in the Petri dish it shows a small clip about the growth of moss.
As they wander further into the wood, they suddenly hear a strange, otherworldly sound and thescreen on their PDA shows a picture of a butterfly feeding on a flower head. The sound they are
manipulate electronic artifacts, creating so-called graspable [136] or tangible [189]user interfaces. Sensors attached to devices themselves provide ways for physicalmanipulations of those devices to be interpreted appropriately by the applicationsrunning on those devices [164, 173], see Figure 20.2.
Figure 20.4 On the left, the DigitalDesk prototype integrating physical and virtualdesktop environments with the aid of projection and vision technology [374]. Source:© 1993 ACM, Inc. Reprinted by permission. On the right, the NaviCam system whichrecognized 2D glyphs on objects and then superimposed additional information overthat object [303]. Source: Courtesy of Sony Computer Science Laboratories, Inc.

20.2.2 Application themes for ubicomp
Many applications-focussed researchers in HCI seek the holy grail of ubicomp, the killerapp that will cause significant investment in the infrastructure that will then enablea wide variety of ubicomp applications to flourish. It could be argued that person–person communication is such a killer app for ubicomp, as it has caused a largeinvestment in environmental and personal infrastructure that has moved us close(though not entirely) to a completely connected existence. Whether or not personalcommunication is the killer app, the vision of ubicomp from the human perspectiveis much more holistic. It is not the value of any single service that will make com-puting a disappearing technology. Rather, it is the combination of a large range ofservices, all of which are available when and as needed and all of which work as desiredwithout extraordinary human intervention. A major challenge for applicationsresearch is discovering an evolutionary path toward this idyllic interactive experience.
The brief history of ubicomp demonstrates some emergent features that appearacross many applications. One feature is the ability to use implicitly sensed contextfrom the physical and electronic environment to determine the correct behavior
hearing is an amplified recording of nectar being sucked through the butterfly’s proboscis – like a giantdrinking straw!
This rich educational experience is supported by technology. The laptop wedged in the tree is actingas a wireless network repeater carrying the moisture and temperature readings to the resource tentwhere they will discuss their findings as a class later. The location of each reading is captured using aGPS receiver on each PDA. The steel contraption, the ‘periscope’, knows which images to show thechildren as each object is RFID tagged and the butterfly sound is triggered when their PDA comes closeenough to a small beacon buried in the leaves.
The Ambient Wood is an experience project of the Equator project.
See the book website for an extended case study: /e3/casestudy/ambient-wood/
724 Chapter 20 n Ubiquitous computing and augmented realities
Photographs courtesy of Yvonne Rogers
20.2 Ubiquitous computing applications research 725
of any given service. Context-aware computing demonstrates promise for makingour interactions with services more seamless and less distracting from our everydayactivities. Applications can be made to just work right when they are informed aboutthe context of their use. Another feature of many ubicomp applications is the abilityto easily capture and store memories of live experiences and serve them up for lateruse. The trajectory of these two applications themes coupled with the increasingexploration of ubiquitous computing into novel, non-work environments, points tothe changing relationship between people and computing, and thus the changingpurpose of ubicomp applications. We describe this newer trajectory, coined everydaycomputing, following a discussion of the two more established themes.
Context-aware computing
Two compelling early demonstrations of ubicomp were the Olivetti Research Lab’sActive Badge [361] and the Xerox PARCTab [362], both location-aware appliances.These devices leverage a simple piece of context, user location, and provide valuableservices (automatic call forwarding for a phone system, automatically updated mapsof user locations in an office). This technology was also the basis for the Pepys auto-matic diary system described in Chapter 18 (Section 18.4.1). These simple location-aware appliances are perhaps the first demonstration of linking implicit humanactivity with computational services that serve to augment general human activity.
Location of identifiable entities (usually people) is a very common piece of con-text used in ubicomp application development. The most widespread applicationshave been GPS-based car navigation systems and handheld ‘tour guide’ systems thatvary the content displayed (video or audio) by a handheld unit given the user’s phys-ical location in an exhibit area [6, 68]. For example, The Sentient Computing Projectuses a 3-D ultrasonic indoor location system to track each worker in a building andso maintain a map of office worker locations that helps coworkers find each otherand talk by phone.
Of course, there is more to context than position (where) and identity (who).Although a complete definition of context remains an elusive research challenge, it is clear that in addition to who and where, context awareness involves:
When With the exception of using time as an index into a captured record or sum-marizing how long a person has been at a particular location, most context-drivenapplications are unaware of the passage of time. Of particular interest are the rel-ative changes in time as an aid for interpreting human activity. For example, briefvisits at an exhibit could be indicative of a general lack of interest. Additionally,when a baseline of behavior can be established, action that violates a perceivedpattern would be of particular interest. For example, a context-aware home mightnotice when an elderly person deviated from a typically active morning routine.
What The interaction in current systems either assumes what the user is doing orleaves the question open. Perceiving and interpreting human activity is a diffi-cult problem. Nevertheless, interaction with continuously worn, context-drivendevices will probably need to incorporate interpretations of human activity to beable to provide useful information. One strategy is to incorporate information
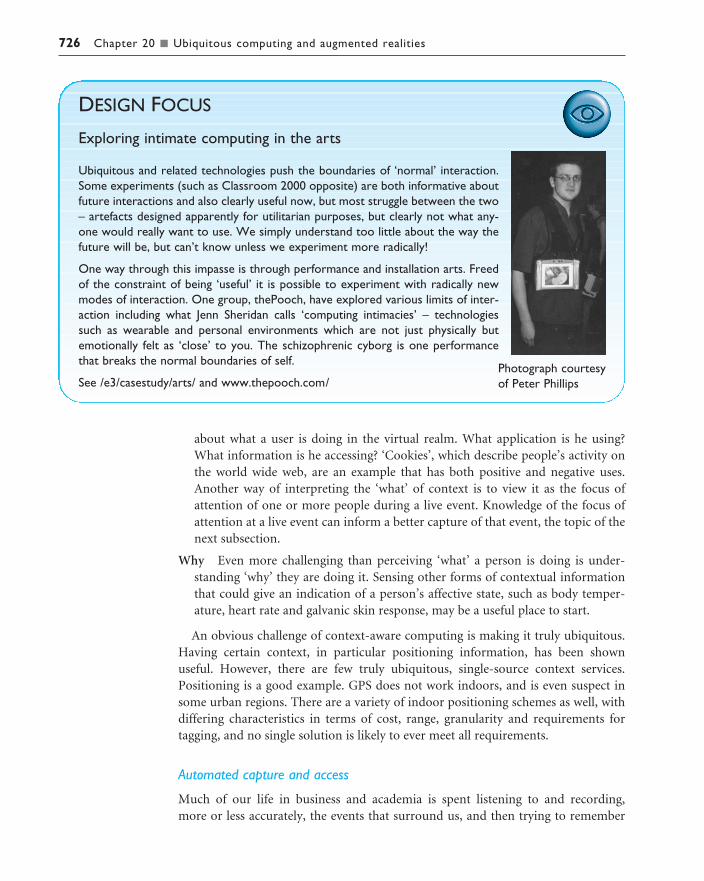
726 Chapter 20 n Ubiquitous computing and augmented realities
about what a user is doing in the virtual realm. What application is he using?What information is he accessing? ‘Cookies’, which describe people’s activity onthe world wide web, are an example that has both positive and negative uses.Another way of interpreting the ‘what’ of context is to view it as the focus of attention of one or more people during a live event. Knowledge of the focus ofattention at a live event can inform a better capture of that event, the topic of thenext subsection.
Why Even more challenging than perceiving ‘what’ a person is doing is under-standing ‘why’ they are doing it. Sensing other forms of contextual informationthat could give an indication of a person’s affective state, such as body temper-ature, heart rate and galvanic skin response, may be a useful place to start.
An obvious challenge of context-aware computing is making it truly ubiquitous.Having certain context, in particular positioning information, has been shown useful. However, there are few truly ubiquitous, single-source context services.Positioning is a good example. GPS does not work indoors, and is even suspect insome urban regions. There are a variety of indoor positioning schemes as well, withdiffering characteristics in terms of cost, range, granularity and requirements for tagging, and no single solution is likely to ever meet all requirements.
Automated capture and access
Much of our life in business and academia is spent listening to and recording, more or less accurately, the events that surround us, and then trying to remember
DESIGN FOCUS
Exploring intimate computing in the arts
Ubiquitous and related technologies push the boundaries of ‘normal’ interaction.Some experiments (such as Classroom 2000 opposite) are both informative aboutfuture interactions and also clearly useful now, but most struggle between the two– artefacts designed apparently for utilitarian purposes, but clearly not what any-one would really want to use. We simply understand too little about the way thefuture will be, but can’t know unless we experiment more radically!
One way through this impasse is through performance and installation arts. Freedof the constraint of being ‘useful’ it is possible to experiment with radically newmodes of interaction. One group, thePooch, have explored various limits of inter-action including what Jenn Sheridan calls ‘computing intimacies’ – technologiessuch as wearable and personal environments which are not just physically butemotionally felt as ‘close’ to you. The schizophrenic cyborg is one performancethat breaks the normal boundaries of self.
See /e3/casestudy/arts/ and www.thepooch.com/Photograph courtesyof Peter Phillips

20.2 Ubiquitous computing applications research 727
the important pieces of information from those events. There is clear value, andpotential danger, in using computational resources to augment the inefficiency ofhuman record taking, especially when there are multiple streams of related informa-tion that are virtually impossible to capture as a whole manually. Tools to supportautomated capture of and access to live experiences can remove the burden of doingsomething humans are not good at (i.e. recording) so that they can focus attention
DESIGN FOCUS
Classroom 2000/eClass – deploying and evaluating ubicomp
An influential case study in deployment and evaluation of a ubicomp application is the Classroom 2000system, developed at Georgia Tech [2]. The project began in July 1995 with the intent of producing asystem that would capture as much of the classroom experience as possible to facilitate later reviewby both students and teachers. In many lectures, students have their heads down, furiously writingdown what they hear and see as a future reference. While some of this writing activity is useful as aprocessing cue for the student, it was desirable from the student and teacher perspective to afford theopportunity for students to lift their heads occasionally and engage in the lecture experience. The cap-ture system was seen as a way to relieve some of the note-taking burden. (See also Figures 21.5 and21.6 and a description of the e-learning issues of Classroom 2000/eClass in Chapter 21.)
To test the feasibility of this hypothesis quickly, an environment for capture was implemented withinsix months and used to support the capture of an entire course to observe whether the initial hypo-thesis was worth testing more vigorously. Some very valuable lessons were learned during this firstextended experience. The initial experiments included student note-taking devices that were clear dis-tractions to the students. Support for private student note taking was abandoned, only to be resumedtwo years later when the technology had caught up.
To understand the impact of this capture system on teaching and learning, it would have to be used bymany more students and teachers in a wider variety of courses. This required significant engineeringeffort to create a robust and reliable capture system that by early 1997 was able to support multipleclasses simultaneously. During a three-year experimental period ending in mid-2000, over 100 courseswere supported for 30 different instructors.
This extended deployment made possible an extensive quantitative analysis that revealed how such anautomated capture and access system impacts the educational experience once it has been incorporatedinto the everyday experience [48]. As a direct result of these deeper evaluations, we know that the sys-tem encourages 60% of its users to modify their in-class note-taking behavior. We also know that notall of this modified behavior is for the better. Taking no notes, for example, is not a good learning prac-tice to reinforce. We know that it is time to reintroduce student note-taking units that can personal-ize the capture experience and also encourage better note-taking practices. We also know to facilitatemore content-based retrieval and synchronized playback of the lecture experience. These insights havemotivated further research efforts and established a long-term research project, eClass.
The Classroom 2000/eClass experience demonstrates the importance of substantial deployment inorder to be able to evaluate ubicomp systems effectively. It is only when these systems become part ofeveryday life that we see the ways in which they are really used.

728 Chapter 20 n Ubiquitous computing and augmented realities
on activities they are good at (i.e. indicating relationships, summarizing and interpreting).
We define capture and access as the task of preserving a record of some live experi-ence that is then reviewed at some point in the future. Vannevar Bush was perhapsthe first to write about the benefits of a generalized capture and access system whenhe introduced the concept of the memex [51]. The memex was intended to store theartifacts that we come in contact with in our everyday lives and the associations thatwe create between them. Over the years, many researchers have worked toward thisvision. As a result, many systems have been built to capture and access experiencesin classrooms, meetings and other live experiences.
The earliest work on automated capture was explored at Xerox PARC to supportmeeting capture, building on their experience in collaborative meeting support sys-tems (see Chapter 19, Section 19.4.2). Since then a number of capture applicationshave been explored in a variety of environments including education and projectmanagement in support of individuals or groups [349].
Toward continuous interaction
Providing continuous interaction moves computing from a localized tool to a con-stant presence. A new thread of ubicomp research, everyday computing, promotesinformal and unstructured activities typical of much of our everyday lives. Familiarexamples are orchestrating daily routines, communicating with family and friends,and managing information.
The focus on activities as opposed to tasks is a crucial departure from traditionalHCI design. The majority of computer applications support well-defined tasks thathave a marked beginning and end with multiple subtasks in-between. Take wordprocessing as an example. Word processing features are tuned for starting with ablank document (or a template), entering text, formatting, printing and saving.These applications are not well suited to the more general activity of writing, encom-passing multiple versions of documents where text is reused and content evolvesover time.
The emphasis on designing for continuously available interaction requiresaddressing these features of informal, daily activities:
n They rarely have a clear beginning or end so the design cannot assume a commonstarting point or closure requiring greater flexibility and simplicity.
n Interruption is expected as users switch attention between competing concerns.n Multiple activities operate concurrently and may need to be loosely coordinated.n Time is an important discriminator in characterizing the ongoing relationship
between people and computers.n Associative models of information are needed, as information is reused from
multiple perspectives.
Of course, activities and tasks are not unrelated to each other. Often an activitywill consist of a number of tasks, but the activity itself is more than these componentparts for the reasons listed above. For example, communication activities contain

20.2 Ubiquitous computing applications research 729
well-defined tasks such as reading a message or composing a reply. The interactionfalters when the task refers to the larger activity: how does this new message relate to previous messages from this person? What other issues should be included in the reply? The challenge in designing for activities is encompassing these tasks in anenvironment that supports continuous interaction.
20.2.3 Understanding interaction in ubicomp
The shift in focus inherent within ubicomp from the desktop to the surroundingenvironment mirrors previous work in HCI and CSCW. As the computer hasincreasingly ‘reached out’ in the organization, researchers have needed to shift theirfocus from a single machine engaging with an individual to a broader set of organ-izational and social arrangements and the cooperative interaction inherent in thesearrangements.
We have seen aspects of this change in Chapters 13 and 14 looking at organiza-tional, social and collaborative aspects, and also in Chapter 18 where we have alreadyconsidered aspects of the physical environment and in particular the extreme end oflow-intention, incidental interaction.
Many of these models and methods are applicable to ubicomp with its emphasison integrating numerous devices in one setting.
Knowledge in the world
Traditionally, research and evaluation efforts in HCI have been informed by theModel Human Processor theory of human cognition and behavior [56]. This modelfocusses on internal cognition driven by the cooperation of three independent unitsof sensory, cognitive and motor activity where each unit maintains its own workingstore of information. As the application of computers has broadened, designers haveturned to models that consider the nature of the relationship between the internalcognitive processes and the outside world. Designing for a balance between ‘know-ledge in the world’ versus ‘knowledge in the head’ is now a common maxim in thedesign community [186, 266].
Three main theories that focus on the ‘in the world’ nature of knowledge are beingexplored within the ubicomp community as guides for future design and evaluation:activity theory, situated action and distributed cognition.
Activity theory
Activity theory is the oldest of the three, building on work by Vygotsky [358]. The closest to traditional theories, activity theory recognizes concepts such as goals (‘objects’), actions and operations. However, both goals and actions are fluidbased on the changing physical state of the world instead of more fixed, a prioriplans. Additionally, although operations require little to no explicit attention, suchas an expert driver motoring home, the operation can shift to an action based on

730 Chapter 20 n Ubiquitous computing and augmented realities
changing circumstances such as difficult traffic and weather conditions. Activity theory also emphasizes the transformational properties of artifacts that implicitlycarry knowledge and traditions, such as musical instruments, cars and other tools.The behavior of the user is shaped by the capabilities implicit in the tool itself [252].Ubiquitous computing efforts informed by activity theory, therefore, focus on the transformational properties of artifacts and the fluid execution of actions andoperations.
Situated action and distributed cognition
Theories of situated action have already featured several times in Chapters 13 and 14,and distributed cognition is discussed in detail in Section 14.5.3. Recall that bothreject the ‘pre-planned goals giving rise to actions’ model inherent in MHP.
Situated action [334] emphasizes the improvisational aspects of human behaviorand de-emphasizes a priori plans that are simply executed by the person. In thismodel, knowledge in the world continually shapes the ongoing interpretation andexecution of a task. Ubiquitous computing efforts informed by situated action alsoemphasize improvisational behavior and would not require, nor anticipate, the userto follow a predefined script. The system would aim to add knowledge to the worldthat could effectively assist in shaping the user’s action, hence an emphasis on con-tinuously updated peripheral displays. Additionally, evaluation of this system wouldrequire watching authentic human behavior and would discount post-task inter-views as rationalizations of behavior that is not necessarily rational.
Distributed cognition also de-emphasizes internal human cognition, but in thiscase, it turns to a systems perspective where humans are just part of a larger system.Of all three theories, distributed cognition plays the greatest attention to knowledgein the world, as much of the information needed to accomplish a system’s goal isencoded in the individual objects. For example, in Chapter 18 (Section 18.3), we sawhow objects act as triggers prompting users to do things and also how they act asplaceholders keeping track of where they are in a task. Ubiquitous computing effortsinformed by distributed cognition, focus on designing for a larger system goal, incontrast to the use of an individual appliance and emphasize how information isencoded in objects and how that information is translated, and perhaps transmitted,by different users.
Understanding human practice: ethnography and cultural probes
Any form of model or theory by its nature is limited and the above theories allemphasize the very rich interactions between people and their environments that arehard to capture in neat formulae and frameworks. Office procedures and more formal work domains can be modeled using more rigid methods such as traditionaltask analysis, but as we saw in Chapter 18, even these have rich aspects that needadditional modeling. When one looks more closely at how people actually workthere is a great complexity in everyday practices that depends finely on particular settings and contexts.

20.2 Ubiquitous computing applications research 731
Weiser also emphasized the importance of understanding these everyday practicesto inform ubicomp research:
We believe that people live through their practices and tacit knowledge so that the mostpowerful things are those that are effectively invisible in use. [our emphasis]
(Weiser, 1994)
The challenge for ubicomp designers is to uncover the very practices through whichpeople live, and to make these invisible practices visible and available to the developersof ubiquitous computing environments. Ethnography (see Chapter 13, Section 13.3.4)has emerged as a primary approach to address the need to gain rich understandingsof a particular setting and the everyday practices that encompass these settings.
In the context of ubicomp, the goal of an ethnographic investigation is to providethese descriptions and analysis of everyday life to the IT designers and developers so that ubicomp environments seamlessly mesh with the everyday practices thatenscapsulate the goals, attitudes, social relationships, knowledge and language of the intended setting. These techniques have been applied to inform design of socialcommunications devices for the home [175] and to enhance the social connectionbetween older people and their extended families [251].
Perhaps a more intriguing method of conveying the nature of settings to develop-ers of future technologies has emerged from an art and design tradition. The work of Gaver et al. [144] has explored the use of cultural probes (see Design Focus in Chapter 5, Section 5.4) to collect information from settings in order to inspirethe development of new digital devices. Unlike ethnography which focusses on theeveryday and routine nature of the setting, cultural probes seek to uncover the emotional, the unusual and even the spiritual in order to inspire designers.
20.2.4 Evaluation challenges for ubicomp
We must also assess the utility of ubicomp solutions. Researchers have only recentlybegun to address the development of assessment and evaluation techniques thatmeet the demands of ubicomp. One reason for the relatively slow development ofthese techniques is the gradual evolution of the vision of ubiquitous use of techno-logy. In order to understand the impact of ubicomp on everyday life, we navigate a delicate balance between prediction of how novel technologies will serve a realhuman need and observation of authentic use and subsequent co-evolution ofhuman activities and novel technologies.
Formative and summative evaluation of ubicomp systems is difficult and repre-sents a real challenge for the ubicomp community. With the notable exception of thework at Xerox PARC on the use of the Tivoli capture system and at Georgia Techwith the Classroom 2000/eClass system (see Design Focus earlier in the chapter),there has been surprisingly little research published from an evaluation or end-userperspective in the ubicomp community. A number of significant challenges need tobe addressed in order to develop appropriate assessment methods and techniques.
The shift away from the desktop inherent within the ubicomp vision also repres-ents a shift away from the office and the managed structuring of work inherent

732 Chapter 20 n Ubiquitous computing and augmented realities
within these environments. Much of our understanding of work has developed fromFordist and Taylorist principles on the structuring of activities and tasks. Evaluationwithin HCI reflects these roots and is often predicated on notions of task and themeasurement of performance and efficiency in meeting these goals and tasks.
However, it is not clear that these measures can apply universally across activitieswhen we move away from structured and paid work to other activities. For example,
DESIGN FOCUS
Shared experience
You are in the Mackintosh Interpretation Centre in an arts center in Glasgow, Scotland. You notice aman wearing black wandering around looking at the exhibits and then occasionally at a small PDA he isholding. As you get closer he appears to be talking to himself, but then you realize he is simply talkinginto a head-mounted microphone. ‘Some people can never stop using their mobile phone’, you think.As you are looking at one exhibit, he comes across and suddenly cranes forward to look more closely,getting right in front of you. ‘How rude’, you think.
The visitor is taking part in the City project – a mixed-reality experience. He is talking to two otherpeople at remote sites, one who has a desktop VR view of the exhibition and the other just a website.However, they can all see representations of each other. The visitor is being tracked by ultrasound andhe appears in the VR world. Also, the web user’s current page locates her in a particular part of thevirtual exhibition. All of the users see a map of the exhibition showing where they all are.
You might think that in such an experiment the person actually in the museum would take the lead, butin fact real groups using this system seemed to have equal roles and really had a sense of shared experi-ence despite their very different means of seeing the exhibition.
See the book website for a full case study: /e3/casestudy/city/
City project: physical presence, VR interfaces and web interface. Source: Courtesy of Matthew Chalmers. Note: City is an Equator project

20.3 Virtual and augmented reality 733
it is unclear how we may assess the domestic devices suggested by the Royal Collegeof Art [143] or the broad range of devices to emerge from Philips’ Vision of theFuture [286]. This shift away from the world of work means that there is still thequestion of how to apply qualitative or quantitative evaluation methods. Answer-ing this question requires researchers to consider new representations of humanactivity and to consider how to undertake assessment that broadens from existingtask-oriented approaches. Although many researchers have investigated the use ofobservational, and semi-structured interviews, the lack of deployment of ubiquitousenvironments has hampered many of these activities.
The technology used to create ubicomp systems is often on the cutting edge and it is difficult to create reliable and robust systems that support some activity on acontinuous basis. Consequently, a good portion of reported ubicomp applicationswork remains at this level of demonstrational prototypes that are not designed to be robust, although there are notable exceptions, for example the SPAM systemdescribed in Chapter 19 (Section 19.3.3). Deeper empirical evaluation results cannotbe obtained through controlled studies in a traditional, contained usability laborat-ory. Rather, the requirement is for real use of a system, deployed in an authentic set-ting. A number of researchers are seeking to roll out ubiquitous devices into a rangeof settings, such as museums, outdoor city centers and the home. These researchersare creating ‘living laboratories’ for ubicomp research by creating testbeds that support advanced research and development as well as use by a targeted user.
VIRTUAL AND AUGMENTED REALITY
Virtual reality (VR) refers to the computer-generated simulation of a world, or a subset of it, in which the user is immersed. It represents the state of the art in multimedia systems, but concentrates on the visual senses. VR allows the user toexperience situations that are too dangerous or expensive to enter ‘in the flesh’. Usersmay explore the real world at a different scale and with hidden features made visible.Alternatively, the virtual worlds that are generated may be entirely synthesized: realistic within themselves, but purely a manifestation of electronic structures.
The term ‘virtual reality’ conjures up an image of a user weighed down with a helmet or goggles, grasping, apparently blindly, into empty space. The user, isolatedwithin his virtual environment, moves through a simulated landscape, picking upobjects on the way. This is fully immersive VR. However, it is only one part of thespectrum of VR, which also includes desktop VR, command and control situations,and augmented reality, where virtuality and reality meet.
20.3.1 VR technology
The technology involved in VR is quite elaborate. The individual devices have beendiscussed in Chapter 2, but now we shall see how they work together.
20.3

734 Chapter 20 n Ubiquitous computing and augmented realities
Since the user has to ‘see’ a new environment, a headset is usually used in a VRsetup. With independent screens for each eye, in order to give a 3D image, the head-set is often a large, relatively cumbersome piece of head-mounted gear. However,smaller, lighter VR goggles are now available and may soon become only slightlyoversized spectacles.
Having to produce and render realistic images in real time requires vast amountsof computing power, and the resources for full realism are rarely available; they maynot even exist as yet. This means that the world inhabited by the user tends to be‘blocky’, with little variation in texture, and flat lighting. This makes the calculationsmuch simpler and more achievable. As far as input to VR systems is concerned, adataglove that captures gestural information is often used. Feedback can be incorp-orated into the glove, so that resistance is felt when grasping a virtual object. Speechrecognition systems can also be incorporated, and, in general, audio feedback is utilized in some form or another. Stereo headphones are a simple piece of VR kit, but at the other extreme a full-body version of the dataglove is available too!
20.3.2 Immersive VR
Virtual reality can be used to produce environments that mimic our everyday world.Architects have always used models and sketches to show clients how a building willappear. Now they can use VR to take clients through a virtual tour of the build-ing, fly over it from above, look at it from the streets outside, enter the doors andwalk through the corridors. Similar techniques are used to plan kitchens and evengardens.
However, there are also many things that we cannot see, either because they areinvisible to the naked eye (heat, magnetism, gravity) or because they are too small or too large. Scientific and data visualization systems make use of VR technology toexpose and explore these features. In Section 20.4 we will see one example of this inthe virtual wind tunnel, which makes the airflows around an aircraft wing visibleusing virtual bubble trails (see Figure 20.6). Another example is in the field of pro-tein chemistry, where individual molecules are, of course, too small to see except by electron microscope.
Proteins are complex chemicals, made up of convoluted folded chains of simplercomponents known as amino acids. The particular acids involved, their order in the chain and the nature of the folding all contribute to the particular behavior andfunction of the protein. In trying to understand the behavior of particular proteins,scientists have turned to VR techniques to help them probe the secrets of these vitalcomponents of life. Work by Hubbard [181] has produced a VR system using aheadset and dataglove. The user dons the headset, and is immersed in a 3D worldwhere atomic dimensions become tangible distances and the protein exists like a ballof hairy twine. Using the dataglove, the user can reach out into the space and grabhold of the molecule, twisting it this way and that to appreciate its complex structurebetter. The chain of amino acids can be followed from one end to the other, wind-ing around and almost back on itself as the complex chemistry is created. A betterknowledge of the structure has allowed the scientists to understand how some very
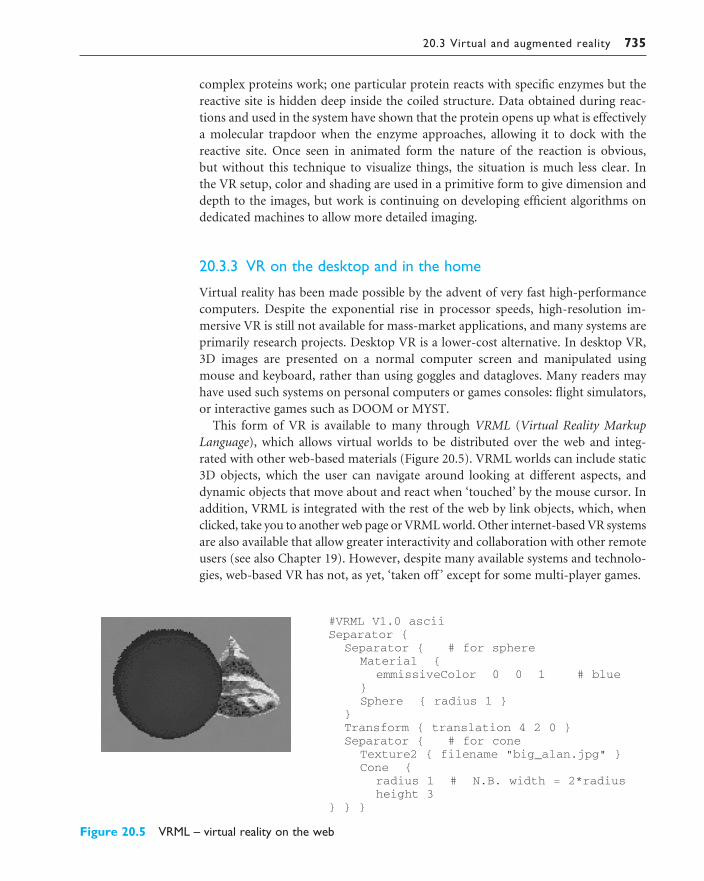
20.3 Virtual and augmented reality 735
complex proteins work; one particular protein reacts with specific enzymes but thereactive site is hidden deep inside the coiled structure. Data obtained during reac-tions and used in the system have shown that the protein opens up what is effectivelya molecular trapdoor when the enzyme approaches, allowing it to dock with thereactive site. Once seen in animated form the nature of the reaction is obvious, but without this technique to visualize things, the situation is much less clear. In the VR setup, color and shading are used in a primitive form to give dimension anddepth to the images, but work is continuing on developing efficient algorithms ondedicated machines to allow more detailed imaging.
20.3.3 VR on the desktop and in the home
Virtual reality has been made possible by the advent of very fast high-performancecomputers. Despite the exponential rise in processor speeds, high-resolution im-mersive VR is still not available for mass-market applications, and many systems areprimarily research projects. Desktop VR is a lower-cost alternative. In desktop VR,3D images are presented on a normal computer screen and manipulated usingmouse and keyboard, rather than using goggles and datagloves. Many readers mayhave used such systems on personal computers or games consoles: flight simulators,or interactive games such as DOOM or MYST.
This form of VR is available to many through VRML (Virtual Reality MarkupLanguage), which allows virtual worlds to be distributed over the web and integ-rated with other web-based materials (Figure 20.5). VRML worlds can include static3D objects, which the user can navigate around looking at different aspects, anddynamic objects that move about and react when ‘touched’ by the mouse cursor. Inaddition, VRML is integrated with the rest of the web by link objects, which, whenclicked, take you to another web page or VRML world. Other internet-based VR systemsare also available that allow greater interactivity and collaboration with other remoteusers (see also Chapter 19). However, despite many available systems and technolo-gies, web-based VR has not, as yet, ‘taken off ’ except for some multi-player games.
Figure 20.5 VRML – virtual reality on the web
#VRML V1.0 asciiSeparator {
Separator { # for sphereMaterial {
emmissiveColor 0 0 1 # blue}Sphere { radius 1 }
}Transform { translation 4 2 0 }Separator { # for cone
Texture2 { filename "big_alan.jpg" }Cone {
radius 1 # N.B. width = 2*radiusheight 3
} } }

736 Chapter 20 n Ubiquitous computing and augmented realities
20.3.4 Command and control
In many command and control situations, real users are at one remove from thephysical world, seeing it through windows, or cameras. The windows or videoscreens can be replaced by synthesized pictures. The user operates within an im-mediate physical environment, with real controls and instruments, but the worldoutside is virtual.
One such interactive VR application in widespread use is the flight simulator. A full cockpit system is placed in a hydraulically supported container, with largescreens replacing the cockpit windows. Images are generated and projected onto thescreens, whilst the box can be moved rapidly in any direction by the hydraulic rams.The visual information and physical motion simulate accurately the conditionsencountered by aircraft. Flight simulators are used extensively in pilot training pro-grams. Landings can be practiced, with the system responding to the commands of the pilot; descending too fast and off to one side, the pilot will have to correct thesituation if she wishes to avoid a crash. Emergency situations can also be created, inwhich aircraft system malfunctions can be artificially created in order to train the pilotto take the correct course of corrective or life-preserving action. With VR, entertain-ment is never far behind and this kind of system can also be found in many fun fairs!
The military is heavily involved in VR, allowing war scenarios to be fought outwith great realism, or training to be given about particular territories that are to beinfiltrated. The increased realism at this stage is designed to save lives later on, when,by being better prepared, people are more able to cope with whatever arises. It is insuch application areas that VR has been most used since the cost of the necessaryequipment is negligible compared with the savings that can be made in terms ofhuman life and expensive military hardware.
20.3.5 Augmented reality
In augmented reality systems electronic images are projected over the real world – virtuality and reality meet. The head-up displays in many aircraft and even someautomobiles can be regarded as an example of this, but the data in such displays arenot typically connected to the objects seen through them and, hence, the blendbetween virtuality and reality is quite weak.
A stronger sense of connection can be obtained using semi-transparent goggles.Users can move around in the real world and see real objects, but computer imagesare reflected off the inside of the glass and overlay the physical objects. Again, thiscan be used to show unrelated information; for example, some wearable computersallow users to read their email whilst walking around. However, the real sense of two worlds meeting comes when the projected image in some way links or refers tothe object it overlays. For example, one experimental system has virtual balls, whichcan be picked up and thrown by the user [11]. When the virtual ball ‘hits’ the realwall it bounces off. The balls can even bounce down a real staircase.
The great difficulty with such systems is in ensuring that the physical and virtualworld are correctly aligned, a problem called registration. If not properly registered,

20.3 Virtual and augmented reality 737
the virtual ball would either bounce short of the real wall or else appear to go throughthe wall and then bounce back from the other side! Most experiments have been invery controlled environments where the positions of real objects are known and theuser’s position and direction of gaze are detected. To be useful in practice, image-processing techniques will often be needed. A digital camera monitors what the useris seeing, uses image recognition to determine what each object is, and then uses thisto generate the appropriate electronic image to overlay.
One class of augmented reality system finesses this problem by projecting imagesonto the real world itself. For example, video images may be projected onto a paperdesktop. So long as the desktop and camera are fixed, the system can be calibratedand, thereafter, registration guaranteed (see Figure 20.4, left).
20.3.6 Current and future applications of VR
To date, the most extensive use of VR has been for military simulations and milit-aristic games. More esoteric and less violent uses of VR have been proposed; theimagination is the limit! Since worlds with arbitrary physics and behaviors can becreated, anything is possible within VR. One interesting suggestion is the idea of VRholidays – by walking into a VR environment, you can go on holiday to the tropicalrainforest, go on safari, walk on the moon, fly over the cities of the world, sunbatheon a beach or ski in the mountains, all without moving from the room!
DESIGN FOCUS
Applications of augmented reality
Augmented reality techniques hold great promise, and have been investigated especially in situationsinvolving the maintenance or assembly of complex equipment. One example is the maintenance of photocopiers. There are many different photocopier models, and field engineers have to look up ser-vice details in large manuals and then attempt to relate the photographs and diagrams to the actualequipment before them. With augmented reality, instructions can be shown in front of their eyesincluding labeling of all parts. Another example is in the electronics of large aircraft. The wiring loomsthat run from end to end may include dozens of colored wires, each of which has to be routed to theright place. With augmented reality, the schematic wiring diagrams can be overlaid onto the physicalwiring, helping the engineer to correctly identify and route each wire.
Note that, in both cases, accurate registration between the real and electronic data is essential. How-ever, in both cases the degree of image analysis needed is limited. In the case of the photocopier, thesystem can be told what photocopier is being repaired and then all it needs to do is work out wherethe copier is and what its orientation is (and possibly also whether doors are open, etc.). Given that thesystem can hold schematics and photographs, this is not beyond current image-processing capabilities.The case of the wiring loom is more difficult, as the individual wires may be too small for the resolutionof digital cameras. In this case, it may be better simply to color-code the schematic accurately and rely onthe engineer’s eyesight – the best interfaces make appropriate use of human and computer capabilities.

738 Chapter 20 n Ubiquitous computing and augmented realities
A more serious application is a medical one, in which a virtual operation can becarried out on the actual patient: the patient’s scans provide data for a computermodel of the body, which can then be operated on by a surgeon until he perfects the technique for that particular person. Once correct, the actual operation can beperformed. The best such simulations include force feedback where the surgeon canfeel resistance as the scalpel is drawn through the virtual body.
VR is also being used in experimental treatments for phobias [178]. Vivid imageryis often used as part of the treatment for conditions such as arachnophobia, agora-phobia or acrophobia. For example, a patient afraid of heights can ascend in a vir-tual glass lift. Knowing that the experience is simulated does not remove the fear.However, the anxiety is reduced by the combination of unrealness and the ability to control and, if necessary, quickly escape the virtual environment. By increasingthe height and duration of the lift journey, patients can gradually conquer their fearsin readiness for real-world experiences.
INFORMATION AND DATA VISUALIZATION
Virtual reality and 3D displays can be used to visualize scientific data and other complex information. Whether or not 3D representations are used, animation techniques, especially when under interactive user control, can give a sense ofengagement with data, and encourage discovery and pattern formation.
20.4.1 Scientific and technical data
Three-dimensional representations of scientific and technical data can be classifiedby the number of dimensions in the virtual world that correspond to physical spatialdimensions, as opposed to those that correspond to more abstract parameters.
Perhaps the most engaging images are where all three dimensions have some phys-ical validity. An example of this is the virtual wind tunnel [50]. In a physical windtunnel, an accurate model of an aircraft is constructed and then subjected to windsthat, when appropriately scaled, correspond to realistic situations. The intention isto investigate patterns of air movement and pressure, for example to discover thoseplaces where turbulence forms. Of course, air is invisible, so small pieces of ribbonmay be attached to the aircraft surface, small bubbles released into the chamber orpolarized light used to expose the hidden airflows. In the virtual wind tunnel, airmovements are calculated using the equations of fluid dynamics. An engineer canthen see the simulated aircraft using VR goggles and can move around a (virtual)baton from which stream (virtual) bubbles (Figure 20.6). By moving the baton todifferent parts of the aircraft, areas of interest can be investigated.
Model making can be very expensive and time consuming, so the virtual windtunnel can save money and increase the rate at which changes can be made and
20.4

20.4 Information and data visualization 739
evaluated. However, there are also ways in which the virtual wind tunnel is moreeffective than a real wind tunnel. In the virtual wind tunnel, engineers can get asclose as they like to the simulated aircraft in order to investigate particular details. Inthe real tunnel this would involve stepping inside the tunnel, which would disruptthe airflow, making any measurements valueless.
The next step away for 3D reality is when two of the dimensions represent a phys-ical plane and the third is used to represent some data for each point. For example,a relief map can be drawn where the height at any point represents average annualrainfall (as opposed to the height of the terrain). In any such representation it is hardto choose a viewing point, as it is likely that tall structures in the foreground will hideimportant features in the background. This is probably why such representations arequite rare in static paper publications.
Finally, we have the case where only one or none of the dimensions represents a spatial dimension. For example, most spreadsheet packages support a range of 3Dgraph options that allow you to regard two columns as x and y coordinates, while athird column is used as the height. In this case, none of the 2D or 3D patterns in theimage corresponds to real-world features. However, we can use our ability to discern3D features to help us understand and appreciate this more abstract data.
Figure 20.6 Virtual wind tunnel. Reprinted from Animation and Scientific Visualisation,R. A. Earnshaw and D. Watson (eds), 1993

740 Chapter 20 n Ubiquitous computing and augmented realities
20.4.2 Structured information
Scientific data are typically numeric, so can easily be mapped onto a dimension invirtual space. In contrast, the data sets that arise in information systems typicallyhave many discrete attributes and structures: hierarchies, networks and, most com-plex of all, free text. Examples of hierarchies include file trees and organizationcharts. Examples of networks include program flow charts and hypertext structures.
One common approach is to convert the discrete structure into some measure of similarity. For a hypertext network this might be the number of links that need to be traversed between two nodes; for free text the similarity of two documents maybe the proportion of words they have in common. A range of techniques can then beapplied to map the data points into two or three dimensions, preserving as well aspossible the similarity measures (similar points are closer). These techniques include
DESIGN FOCUS
Getting the size right
When faced with a 2D histogram it is the area that we perceive as being the size of a bar, not the height.Survey data of family groups at a fun fair have shown that 25% had only one child, 50% had two children,10% had three children and the remaining 15% of families had between four and six children.
If we display the height of the 4–6 group proportional to the percentage of families it makes it look asif this is much more than 15% of the data. This is because the column is three times wider than therest. We actually perceive the data to be in the ratio 25:50:10:45. The right thing to do is to draw thearea of the columns proportional to the number of families, which makes the data look right.
Similar problems arise in 3D representations. If we draw a map with 3D columns proportional to the population rising from each country, we will probably not be able to see anything except a singleenormous block for China! We should display the heights of the blocks proportional to the populationdensity. Of course, if we start with density data, we can simply use height to start with.
If data ranges are extremely large, we may use non-linear (for example, logarithmic) scales. Users clearlyneed to be aware of this, but at least if density data are used, bigger areas/volumes represent biggerdata.
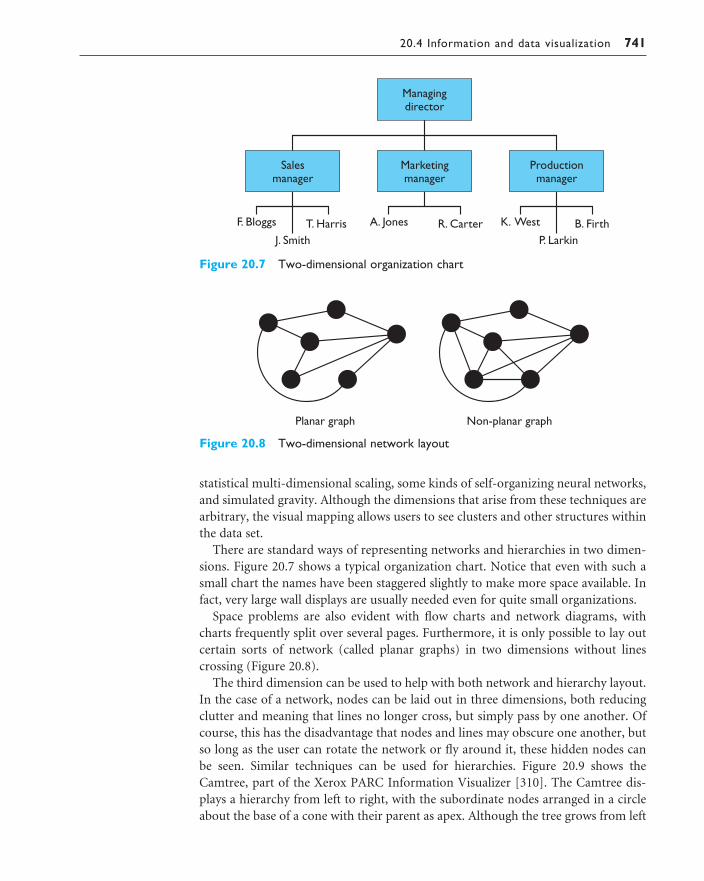
20.4 Information and data visualization 741
statistical multi-dimensional scaling, some kinds of self-organizing neural networks,and simulated gravity. Although the dimensions that arise from these techniques arearbitrary, the visual mapping allows users to see clusters and other structures withinthe data set.
There are standard ways of representing networks and hierarchies in two dimen-sions. Figure 20.7 shows a typical organization chart. Notice that even with such asmall chart the names have been staggered slightly to make more space available. Infact, very large wall displays are usually needed even for quite small organizations.
Space problems are also evident with flow charts and network diagrams, withcharts frequently split over several pages. Furthermore, it is only possible to lay outcertain sorts of network (called planar graphs) in two dimensions without linescrossing (Figure 20.8).
The third dimension can be used to help with both network and hierarchy layout.In the case of a network, nodes can be laid out in three dimensions, both reducingclutter and meaning that lines no longer cross, but simply pass by one another. Ofcourse, this has the disadvantage that nodes and lines may obscure one another, butso long as the user can rotate the network or fly around it, these hidden nodes can be seen. Similar techniques can be used for hierarchies. Figure 20.9 shows theCamtree, part of the Xerox PARC Information Visualizer [310]. The Camtree dis-plays a hierarchy from left to right, with the subordinate nodes arranged in a circleabout the base of a cone with their parent as apex. Although the tree grows from left
Figure 20.7 Two-dimensional organization chart
Figure 20.8 Two-dimensional network layout

742 Chapter 20 n Ubiquitous computing and augmented realities
to right, this growth is far less than the corresponding 2D representation. When anode is selected within the tree, the system rotates the cones so that the node and itsparents are closest to you. Thus, although some nodes are hidden at any particularmoment, it is possible to view the entire tree. Also notice how the shadows bothenhance the impression of three-dimensionality and give additional informationabout the hidden parts of the tree. A second hierarchy visualization, the Conetree, issimilar to the Camtree but displays the hierarchy from top to bottom as in the organ-ization chart. Although these two representations are very similar, it is far easier to display names for each node in the Camtree. This is because most hierarchies arerelatively broader than they are deep. Hierarchies with up to 10,000 nodes have beenvisualized with the Camtree and Conetree.
20.4.3 Time and interactivity
We can consider time and visualization from two sides. On the one hand, many datasets include temporal values (dates, periods, etc.) that we wish to visualize. On theother hand, the passage of time can itself be used in order to visualize other types ofdata. In 2D graphs, time is often mapped onto one spatial dimension; for example,showing the monthly sales figures of a company. Where the time-varying data arethemselves 2D images, multiple snapshots can be used. Both comic books and technical manuals use successive images to show movement and changes, often augmented by arrows, streamlines or blurring to give an impression of direction andspeed. Another type of temporal data is where events occur at irregular intervals.Timelines are often used for this sort of data, where one dimension is used to repres-ent time and the second axis is used to represent the type of activity. Events and periods are marked as icons or bars on the time axis along the line of their respectivetype. One of the most common examples of this is the Gantt chart for representingactivity on tasks within a project. This sort of technique can also be used in computer
Figure 20.9 Camtree – visualizing hierarchies [310]. Copyright © 1991 ACM, Inc.Reprinted by permission

20.4 Information and data visualization 743
visualization; for example, Lifelines [291] uses a Gantt-chart-like representation tovisualize medical and court records (Figure 20.10).
The passage of time can also be used to aid visualization. The simplest case iswhere time in the data is mapped directly onto time at the interface. That is, thetime-varying data are simply replayed. The rate of replay need not be in real time: ayear’s worth of weekly sales figures could be replayed in less than a minute at a weekper second. Standard video controls can be used in the interface to such a visualiza-tion. Alternatively, a spatial dimension (or other parameter) may be mapped ontothe passage of time at the interface. Consider a static but solid 3D object. Looking at a few 3D rendered images, one can gain a good understanding of the outside of the object. However, it is very hard to see what it is like inside. Several slices of theobject can be displayed simultaneously, but obviously the number of these and thesize of each are limited. One solution to this is to show successive cross-sections as an animation, gradually moving the ‘cutting’ plane, mapping distance through theobject onto time. An example of this is the Visible Human Project. It is only possible
Figure 20.10 Lifelines – visualizing personal histories [291]. Copyright © 1996 ACM, Inc. Reprinted bypermission

744 Chapter 20 n Ubiquitous computing and augmented realities
to see a few slices simultaneously (even at low resolution), but one can watch a movieshowing slices from the head down through the torso to the feet. From the movie onecan clearly see the bones and internal organs (artificially colored).
Perhaps the most powerful use of time is when changes are under user control –interactivity. This is central even to our perception of three dimensions. Stereovision, shadows and lighting all give an impression of depth, but it is the ability tomove around an object, to view it at different angles, which gives a true sense of a real 3D object. Interactivity is also a key factor in the virtual wind tunnel. A movie ofthe wind tunnel would be useful, but the real power comes because the engineer canmove about inside the tunnel, using bubble tracers to investigate particular areas ofinterest. Another example of the use of interaction is the interface in Figure 20.11 forviewing the Visible Human [271]. A slider is used to control the position of theviewed slice in the body. In this case the slider corresponds to spatial dimension. Inother systems sliders are used to select values or ranges for parameters. One system,Homefinder, uses max–min sliders to select price ranges, number of rooms, etc.,while in real time a map shows the locations of all houses satisfying the criteria. Even more complex data are visualized using the Influence Explorer [353], which
Figure 20.11 Interactive browser for the Visible Human. [271]. Copyright © 1996ACM, Inc. Reprinted by permission
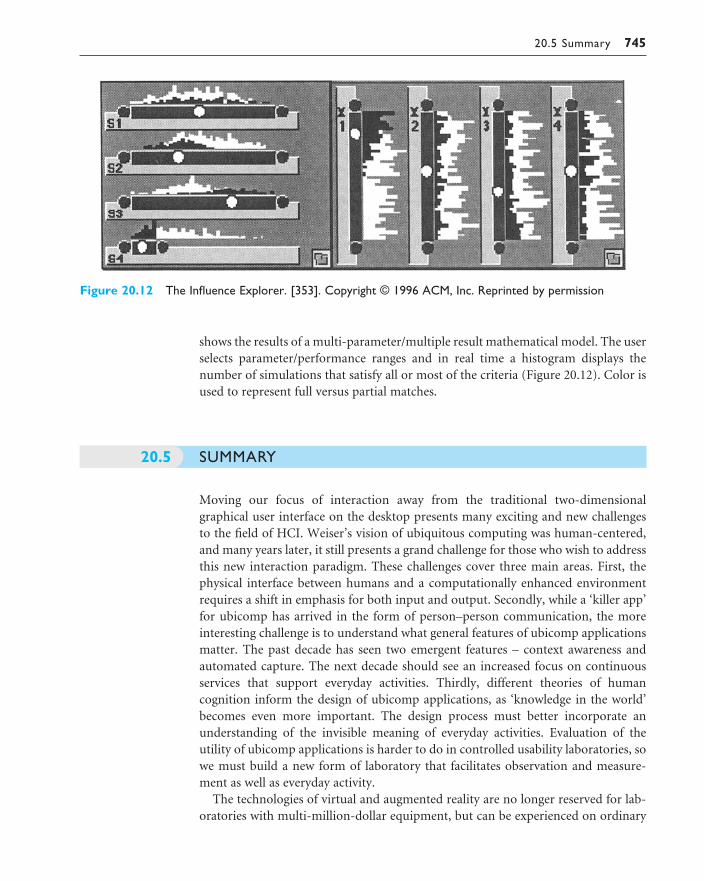
20.5 Summary 745
shows the results of a multi-parameter/multiple result mathematical model. The userselects parameter/performance ranges and in real time a histogram displays thenumber of simulations that satisfy all or most of the criteria (Figure 20.12). Color isused to represent full versus partial matches.
SUMMARY
Moving our focus of interaction away from the traditional two-dimensional graphical user interface on the desktop presents many exciting and new challenges to the field of HCI. Weiser’s vision of ubiquitous computing was human-centered,and many years later, it still presents a grand challenge for those who wish to address this new interaction paradigm. These challenges cover three main areas. First, thephysical interface between humans and a computationally enhanced environmentrequires a shift in emphasis for both input and output. Secondly, while a ‘killer app’for ubicomp has arrived in the form of person–person communication, the moreinteresting challenge is to understand what general features of ubicomp applicationsmatter. The past decade has seen two emergent features – context awareness andautomated capture. The next decade should see an increased focus on continuousservices that support everyday activities. Thirdly, different theories of human cognition inform the design of ubicomp applications, as ‘knowledge in the world’becomes even more important. The design process must better incorporate anunderstanding of the invisible meaning of everyday activities. Evaluation of the utility of ubicomp applications is harder to do in controlled usability laboratories, sowe must build a new form of laboratory that facilitates observation and measure-ment as well as everyday activity.
The technologies of virtual and augmented reality are no longer reserved for lab-oratories with multi-million-dollar equipment, but can be experienced on ordinary
20.5
Figure 20.12 The Influence Explorer. [353]. Copyright © 1996 ACM, Inc. Reprinted by permission

746 Chapter 20 n Ubiquitous computing and augmented realities
machines and over the internet. Early applications of virtual and augmented realitywere often for military training, and for ubicomp it was the office place. Now, muchof this technology is showing its promise in the entertainment and leisure domains.Many advances of VR and other forms of 3D graphics are an important resource inthe visualization of scientific data and other complex information. In particular, byinteracting with the visualization, the user may obtain a deeper understanding of thedata and discover features that would be impossible with static representations.
Since the first edition of this book, virtual reality and interactive visualization have moved from being interesting blue-skies research areas to accepted commercialtechnologies. We expect that in future editions we will see ubicomp move from beingan exciting, but not yet practical, research area into being simply part of day-to-daylife.
EXERCISES
20.1 Many researchers are beginning to explore the potential of ubiquitous computingtechnologies and applications in the home environment. Discuss how the application themes ofcontext awareness, automated capture and the continuous interaction of everyday computing arerelevant to domestic life. Focus your answer on the challenges of family life or life for an agingpopulation.
20.2 Virtual reality has found a number of applications in the games market. Is this a suitable use of such technology? Discuss the possible benefits and disadvantages of exploiting leading edgetechnology in a leisure market.
20.3 Data visualization techniques have often increased our comprehension of phenomena: considerthe effect that 3D graphics has had on looking at complex models such as those of the atmosphereor the ocean, or in understanding the structure of molecules. What do you consider to be theareas that may benefit most from virtual reality visualization techniques?
RECOMMENDED READING
G. D. Abowd, E. D. Mynatt, Charting past, present and future research in ubiquitouscomputing, ACM Transactions in Human–Computer Interaction, special issue onHCI research in the new millennium, Vol. 7, No. 1, pp. 29–58, March 2000.This paper provides an excellent overview of the advances of ubiquitous com-puting from an HCI perspective and expands on many of the ubicomp issuesintroduced in this chapter. Another version of this work, by Abowd, Mynatt andRodden, appeared in the inaugural issue of IEEE Pervasive Computing.
R. Pausch, Virtual reality on five dollars a day. In Proceedings of ACM CHI’91, pp. 265–70, ACM Press, 1991.

Recommended reading 747
A classic paper which not only showed that virtual reality could be available at amuch lower cost than previously assumed, but also exposed the critical factors fora sense of engagement.
R. A. Earnshaw and D. Watson, editors, Animation and Scientific Visualisation,Academic Press, 1993.A collection with examples of applications, techniques and theory of scientificvisualization and containing over 100 color plates of various kinds of visualization.
S. K. Card, J. D. Mackinlay and B. Shneiderman, editors, Readings in InformationVisualization. Using Vision to Think. Morgan Kaufmann, 1999.A wonderful resource, 47 key papers on all aspects of information visualization.
R. Spence, Information Visualization. ACM Press/Addison-Wesley, 2001. A more personal overview and introduction to information visualization, includ-ing a structured view of the subject and detailed analysis of selected techniques.
HYPERTEXT, MULTIMEDIA
AND THE WORLD WIDE WEB
OV E RV I E W
n Hypertext allows documents to be linked in a non-linear fashion.
n Multimedia incorporates different media: sound, images,video.
n The world wide web is a global hypermedia system.
n Animation and video can show information that isdifficult to convey statically.
n Applications of hypermedia include online help,education and e-commerce.
n Design for the world wide web illustrates generalhypermedia design, but also has its own specialproblems.
n Dynamic web content can be used for simple onlinedemonstration or for complete web-based businessapplications.
21

21.2 Understanding hypertext 749
INTRODUCTION
Increases in desktop computing power have enabled the rapid growth of the multi-media industry. CD-ROMs, stereo sound and often video input/output are now partof the specification of standard personal computers. Furthermore, the dreams ofVannevar Bush and Ted Nelson (see Chapter 4) have now become reality in theworld wide web, which links computers, information and ultimately people acrossthe world.
In this chapter we look at the distinctive features of hypertext and multimedia,where they are used and their potential problems. The world wide web is just oneexample, albeit an important one, of a hypertext system. We will first consider someof the common features of hypermedia including different types of content andapplication areas. Diagrams and photographs can enliven text, but some of the mostexciting effects are seen when the computational power of the computer is used toallow animation, video and interactive features. We will also consider in Section 21.3the ‘lost in hyperspace’ problem, how to design hypertext that is easy to understandand to navigate and how features such as bookmarks, the back button and search canmake hypertext and the web accessible. The chapter then focusses on the web. We willlook at the technology that underlies the web and how issues of networking influenceusability. We will then consider static web content including graphics and streamedmedia. Finally, we will review ways in which web pages can be made dynamic throughinteractive content and through server-side generation of web pages from databases.
UNDERSTANDING HYPERTEXT
21.2.1 Hypertext definition – text, hypertext and multimedia
Although pictures and sculpture came first, it is text – the written word – that is commonly seen as the defining point of civilization; pre-literate and oral societies are often regarded as pre-history simply because they have no extant story. Hiero-glyphics, Babylonian mud tablets, the Book of Kells, the Caxton press: these are thestepping-stones toward our current information-centric society.
All these traditional texts share a common linear nature. Aristotle in his Poeticssaid that a story must have a beginning, a middle and an end, and even postmodernnon-linear narrative is actually written in a linear fashion even though the eventsmay not be causally connected.
This linearity is partly because of the nature of the media used – papyrus scroll,painted frieze or paper book – but perhaps more significantly because we are crea-tures in linear time. We are natural story-tellers and natural story-hearers. This iswhy, in Chapter 5, we found that scenarios were so powerful. The skill of the authoris in producing an experience for the reader that introduces new events and new concepts so that they fit meaningfully into what has gone before.
21.2
21.1
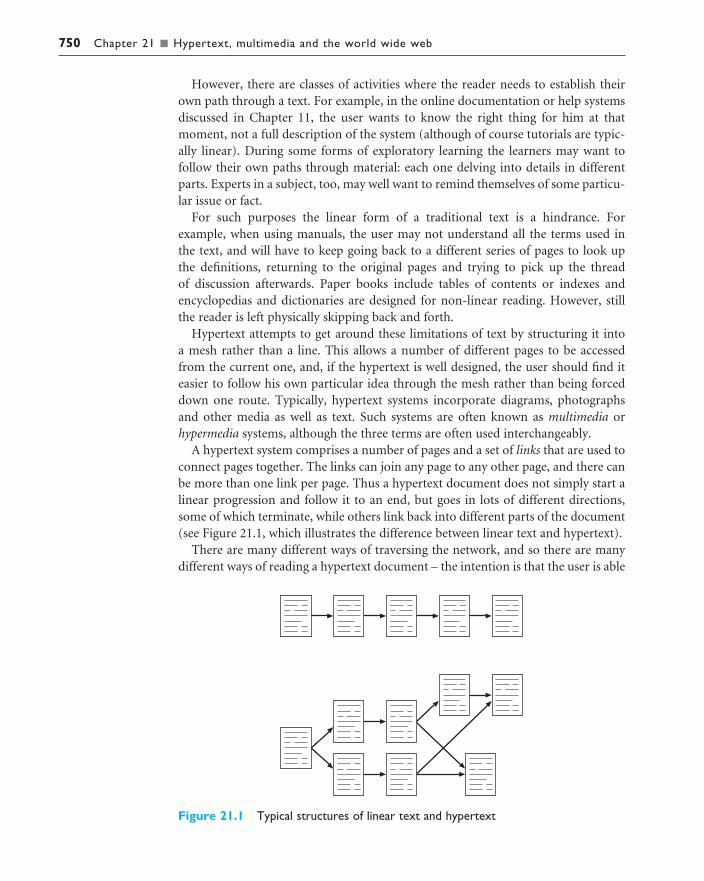
750 Chapter 21 n Hypertext, multimedia and the world wide web
However, there are classes of activities where the reader needs to establish theirown path through a text. For example, in the online documentation or help systemsdiscussed in Chapter 11, the user wants to know the right thing for him at thatmoment, not a full description of the system (although of course tutorials are typic-ally linear). During some forms of exploratory learning the learners may want to follow their own paths through material: each one delving into details in differentparts. Experts in a subject, too, may well want to remind themselves of some particu-lar issue or fact.
For such purposes the linear form of a traditional text is a hindrance. For example, when using manuals, the user may not understand all the terms used in the text, and will have to keep going back to a different series of pages to look up the definitions, returning to the original pages and trying to pick up the thread of discussion afterwards. Paper books include tables of contents or indexes and encyclopedias and dictionaries are designed for non-linear reading. However, stillthe reader is left physically skipping back and forth.
Hypertext attempts to get around these limitations of text by structuring it into a mesh rather than a line. This allows a number of different pages to be accessed from the current one, and, if the hypertext is well designed, the user should find iteasier to follow his own particular idea through the mesh rather than being forceddown one route. Typically, hypertext systems incorporate diagrams, photographsand other media as well as text. Such systems are often known as multimedia orhypermedia systems, although the three terms are often used interchangeably.
A hypertext system comprises a number of pages and a set of links that are used toconnect pages together. The links can join any page to any other page, and there canbe more than one link per page. Thus a hypertext document does not simply start alinear progression and follow it to an end, but goes in lots of different directions,some of which terminate, while others link back into different parts of the document(see Figure 21.1, which illustrates the difference between linear text and hypertext).
There are many different ways of traversing the network, and so there are manydifferent ways of reading a hypertext document – the intention is that the user is able
Figure 21.1 Typical structures of linear text and hypertext
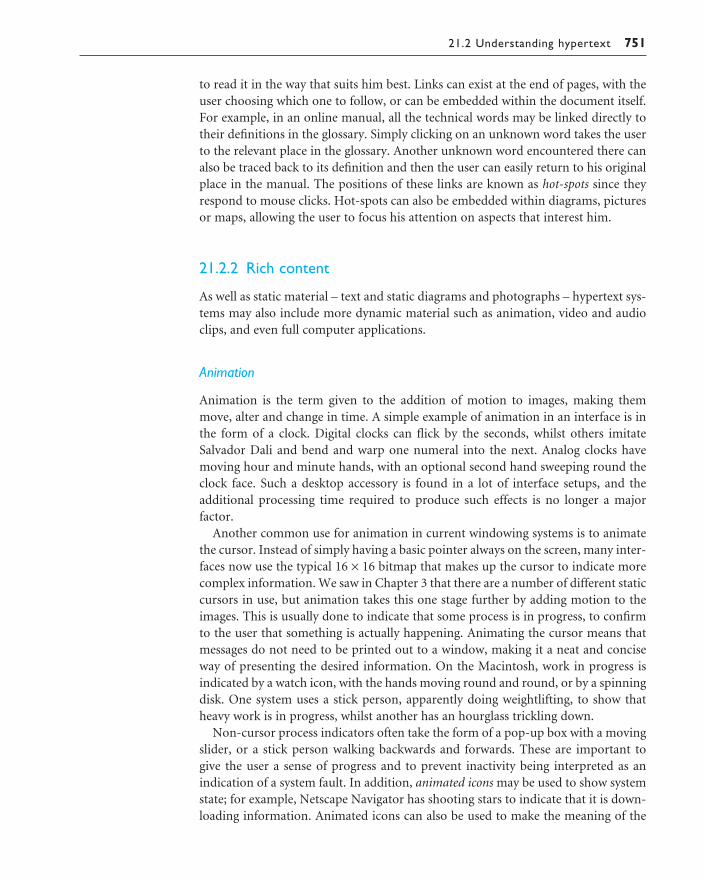
21.2 Understanding hypertext 751
to read it in the way that suits him best. Links can exist at the end of pages, with theuser choosing which one to follow, or can be embedded within the document itself.For example, in an online manual, all the technical words may be linked directly totheir definitions in the glossary. Simply clicking on an unknown word takes the userto the relevant place in the glossary. Another unknown word encountered there canalso be traced back to its definition and then the user can easily return to his originalplace in the manual. The positions of these links are known as hot-spots since theyrespond to mouse clicks. Hot-spots can also be embedded within diagrams, picturesor maps, allowing the user to focus his attention on aspects that interest him.
21.2.2 Rich content
As well as static material – text and static diagrams and photographs – hypertext sys-tems may also include more dynamic material such as animation, video and audioclips, and even full computer applications.
Animation
Animation is the term given to the addition of motion to images, making themmove, alter and change in time. A simple example of animation in an interface is inthe form of a clock. Digital clocks can flick by the seconds, whilst others imitateSalvador Dali and bend and warp one numeral into the next. Analog clocks havemoving hour and minute hands, with an optional second hand sweeping round theclock face. Such a desktop accessory is found in a lot of interface setups, and theadditional processing time required to produce such effects is no longer a major factor.
Another common use for animation in current windowing systems is to animatethe cursor. Instead of simply having a basic pointer always on the screen, many inter-faces now use the typical 16 × 16 bitmap that makes up the cursor to indicate morecomplex information. We saw in Chapter 3 that there are a number of different staticcursors in use, but animation takes this one stage further by adding motion to theimages. This is usually done to indicate that some process is in progress, to confirmto the user that something is actually happening. Animating the cursor means thatmessages do not need to be printed out to a window, making it a neat and conciseway of presenting the desired information. On the Macintosh, work in progress isindicated by a watch icon, with the hands moving round and round, or by a spinningdisk. One system uses a stick person, apparently doing weightlifting, to show thatheavy work is in progress, whilst another has an hourglass trickling down.
Non-cursor process indicators often take the form of a pop-up box with a movingslider, or a stick person walking backwards and forwards. These are important to give the user a sense of progress and to prevent inactivity being interpreted as anindication of a system fault. In addition, animated icons may be used to show systemstate; for example, Netscape Navigator has shooting stars to indicate that it is down-loading information. Animated icons can also be used to make the meaning of the

752 Chapter 21 n Hypertext, multimedia and the world wide web
icon clearer. This is especially useful for icons representing actions that are not wellrepresented by static images. However, such animation must be used sparingly toavoid distraction!
Animation can be used to great effect to show changes in data sets, where slowfluctuations can be visualized with the help of rippling three-dimensional coloredsurfaces, or abrupt changes shown by sudden discontinuities in an otherwise regularmotion.
Animation is also used in a cartoon-like way, where animated objects are used toperform particular functions for the user. For example, in an animated help system,a character can appear on the screen and interact with the user, guiding him througha number of stages of help before being dismissed. Such a guide can be endowed witha certain character, making the interaction less impersonal and more interesting forthe user, who becomes more involved with the system and is happy to learn moreabout it.
Talking heads
One use of animation is to produce talking heads [359]. These are images of human faceseither completely computer generated or derived from photographs of real people. They arebased on models of human anatomy so that realistic lip movement can be synchronized with gen-erated speech. Surprisingly, this is not just a fun activity but is actually useful! One important useis for deaf or partially deaf users who can lip read the image. Another application is to synchronizethe lips with telephone speech allowing a form of video phone over low-bandwidth telephone lines.
These faces can also express emotion. Users have imputed personality to computers since theyonly had flashing lights. By simulating human expressions the designer can express intended affect-ive states rather than leaving this to the user. For example, this could be useful in a learning envir-onment where the students might naturally view the computer as a harsh, unforgiving teacher, but by means of a suitable face and expressions could be induced to regard it as a colleague orfacilitator in learning.
Video and audio
In a media dominated world, there are strong arguments for using video or audiomaterial as part of hypertext systems whether for education, entertainment or refer-ence. Both audio and video material are expensive and time consuming to produce,but increasingly even home-PC systems include video and audio editing as standard.For example, the iMac includes a suite for editing video and burning DVDs.Combined with digital video cameras these bring the production of audio/videomaterial into the reach of many. Furthermore, standard formats such as QuickTimeallow this material to be embedded in web pages for easy distribution. Of course,quality video production requires extensive experience, but then so does text!

21.2 Understanding hypertext 753
Perhaps the biggest problem with audio and video is still the memory requirements.As we saw in Chapter 2, this is becoming more manageable as memory capacitiesincrease, but it will probably continue to be a major problem, especially for web-based material, for some time to come.
The most common use of video is as a clip to be embedded within a text or graphical document or web page. For example, Figure 21.2 shows an example of a prototype website produced by Glasgow University for the Hunterian Museum[194] including video clips. (Notice, too, the use of the still picture for each video clip and the indication of the length of the clip.)
Longer video sequences are, of course, more linear than plain text. This may be acceptable if the hypertext is acting effectively as an index for video material. For example, one might have a collection of silent movies online and access themthrough a website. However, if the video is regarded as an integrated part of the hyper-media experience it needs to be active in some way as well. It is possible to have hot-spots in video images just as in graphics; however, clicking on a gymnastics star to getinformation on her recent performance may be difficult if she is in the middle of anexercise on the asymmetric bars. Interactive television manages this by having a smallernumber of context sensitive options, or images may be frozen to enable exploration.
Figure 21.2 Hunterian Museum – learning about the Romans. Source [194a]reprinted with permission of Springer-Verlag; Netscape browser window © 2002Netscape Communications Corporation, used by permission
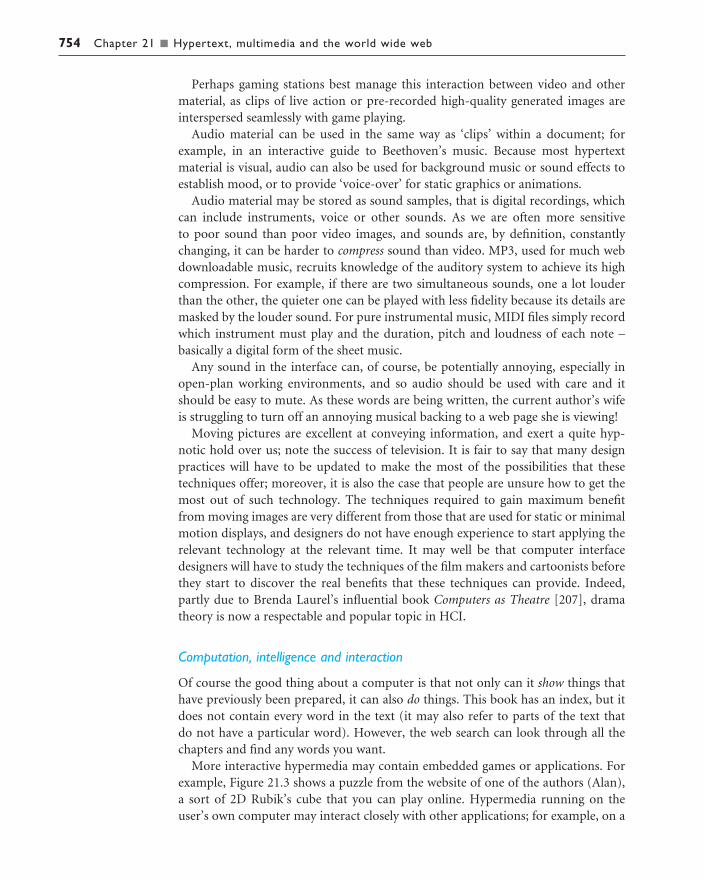
754 Chapter 21 n Hypertext, multimedia and the world wide web
Perhaps gaming stations best manage this interaction between video and othermaterial, as clips of live action or pre-recorded high-quality generated images areinterspersed seamlessly with game playing.
Audio material can be used in the same way as ‘clips’ within a document; forexample, in an interactive guide to Beethoven’s music. Because most hypertext material is visual, audio can also be used for background music or sound effects toestablish mood, or to provide ‘voice-over’ for static graphics or animations.
Audio material may be stored as sound samples, that is digital recordings, whichcan include instruments, voice or other sounds. As we are often more sensitive to poor sound than poor video images, and sounds are, by definition, constantlychanging, it can be harder to compress sound than video. MP3, used for much webdownloadable music, recruits knowledge of the auditory system to achieve its highcompression. For example, if there are two simultaneous sounds, one a lot louderthan the other, the quieter one can be played with less fidelity because its details aremasked by the louder sound. For pure instrumental music, MIDI files simply recordwhich instrument must play and the duration, pitch and loudness of each note –basically a digital form of the sheet music.
Any sound in the interface can, of course, be potentially annoying, especially inopen-plan working environments, and so audio should be used with care and itshould be easy to mute. As these words are being written, the current author’s wifeis struggling to turn off an annoying musical backing to a web page she is viewing!
Moving pictures are excellent at conveying information, and exert a quite hyp-notic hold over us; note the success of television. It is fair to say that many designpractices will have to be updated to make the most of the possibilities that these techniques offer; moreover, it is also the case that people are unsure how to get themost out of such technology. The techniques required to gain maximum benefitfrom moving images are very different from those that are used for static or minimalmotion displays, and designers do not have enough experience to start applying therelevant technology at the relevant time. It may well be that computer interfacedesigners will have to study the techniques of the film makers and cartoonists beforethey start to discover the real benefits that these techniques can provide. Indeed,partly due to Brenda Laurel’s influential book Computers as Theatre [207], dramatheory is now a respectable and popular topic in HCI.
Computation, intelligence and interaction
Of course the good thing about a computer is that not only can it show things thathave previously been prepared, it can also do things. This book has an index, but itdoes not contain every word in the text (it may also refer to parts of the text that do not have a particular word). However, the web search can look through all thechapters and find any words you want.
More interactive hypermedia may contain embedded games or applications. Forexample, Figure 21.3 shows a puzzle from the website of one of the authors (Alan),a sort of 2D Rubik’s cube that you can play online. Hypermedia running on theuser’s own computer may interact closely with other applications; for example, on a
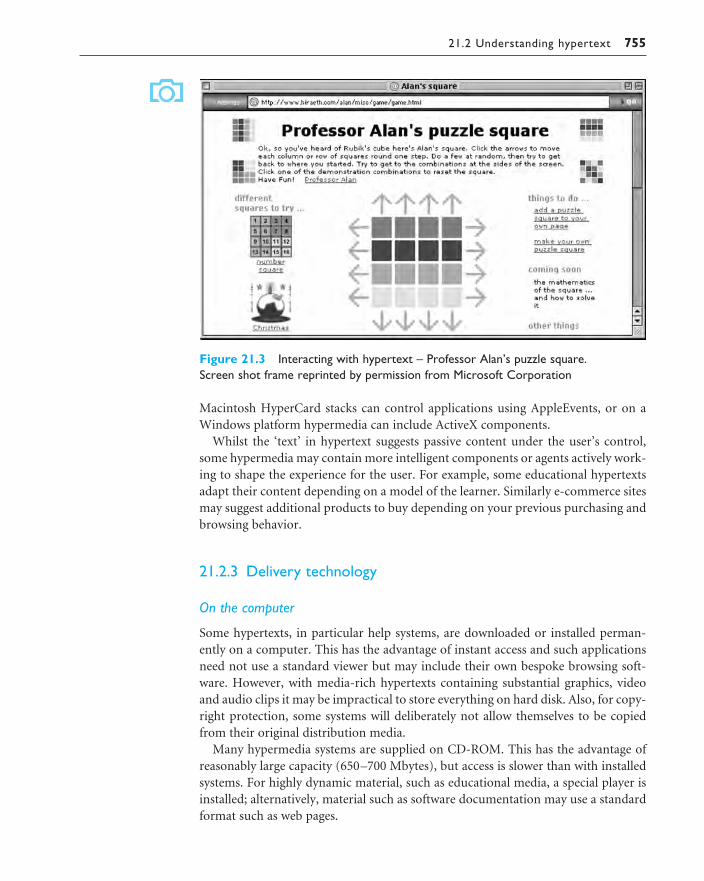
21.2 Understanding hypertext 755
Macintosh HyperCard stacks can control applications using AppleEvents, or on aWindows platform hypermedia can include ActiveX components.
Whilst the ‘text’ in hypertext suggests passive content under the user’s control,some hypermedia may contain more intelligent components or agents actively work-ing to shape the experience for the user. For example, some educational hypertextsadapt their content depending on a model of the learner. Similarly e-commerce sitesmay suggest additional products to buy depending on your previous purchasing andbrowsing behavior.
21.2.3 Delivery technology
On the computer
Some hypertexts, in particular help systems, are downloaded or installed perman-ently on a computer. This has the advantage of instant access and such applicationsneed not use a standard viewer but may include their own bespoke browsing soft-ware. However, with media-rich hypertexts containing substantial graphics, videoand audio clips it may be impractical to store everything on hard disk. Also, for copy-right protection, some systems will deliberately not allow themselves to be copiedfrom their original distribution media.
Many hypermedia systems are supplied on CD-ROM. This has the advantage ofreasonably large capacity (650–700 Mbytes), but access is slower than with installedsystems. For highly dynamic material, such as educational media, a special player isinstalled; alternatively, material such as software documentation may use a standardformat such as web pages.
Figure 21.3 Interacting with hypertext – Professor Alan’s puzzle square. Screen shot frame reprinted by permission from Microsoft Corporation
756 Chapter 21 n Hypertext, multimedia and the world wide web
DVD delivered material is interesting as it is not text enriched with video, butinstead a movie that has been ‘made interactive’. As older computers tend to haveonly CD-ROM drives, it is not possible yet to supply, for example, tutorial materialon DVD and know that it could be used on any machine.
On the web
Of course, the world wide web is the best-known multimedia hypertext system of all.The world wide web offers a rich environment for the presentation of information.Documents can be constructed that are very different from paper versions; basic textcan be augmented through the use of hypertext links to other documents, whilegraphics can easily be incorporated as pictures, photographs, icons, page dividingbars, or backgrounds. Pages can also have hypertext links embedded into differentregions, which take the user to a different page or graphic if they are clicked on; these are known as active image maps. These features allow web pages to becomeinteractive, acting as the interface to the information as well as its holder. Dynamicmaterial in the form of movies and sounds is also available to the designer; all thesefeatures push web page design well away from the conventional paper-based kind.
However, the fact that the web has many more technological features than a bookdoesn’t mean that web pages are necessarily better than their paper counterparts.Also, the fact that a web page is packed full of features doesn’t imply that it gets itsmessage across effectively. Designing web pages is a developing art, and should beviewed in much the same way as designing any other interactive system. Good pageshave been developed with the reader as the focus, and act as effective interactiontools or presentation tools to allow the user to obtain the information he is lookingfor most effectively.
The web is an example of the usability of the medium being paramount ratherthan the technological supremacy of certain aspects of it. For any single aspect of theweb, there are custom multimedia systems that are far superior in terms of quality,usability, speed and so on. However, the common availability of web browsers onmultiple platforms and the low-tech and usable nature of the system have ensuredthe web’s popularity and made it ubiquitous.
The web allows the user to browse documents and follow links transparently, withthe underlying system taking care of the details of fetching the data from differentparts of the world. Theoretically, as far as the user is concerned, any page can bereached as easily as any other; geographical location ceases to become important,whereas linking by content is crucial. The ability for anyone to publish informationon the web is one factor in its success as a multimedia system, but the fact that any-one can create a page and, by linking it to others already in existence, immediatelyintegrate their opinions seamlessly into the information space is another.
On the move
Mobile phones, PDAs (personal digital assistants), and notebook computers have all increased the demand to have hypermedia available on the move. Furthermore,

21.2 Understanding hypertext 757
across many countries governments have sold franchises for high-bandwidth mobileservices. After spending billions on these franchises the telecommunications giantsreally want people to use new mobile services!
Notebook computers can use just the same mechanisms as desktop computers,using CD-ROM or DVD for standalone material, or connecting to the web throughwireless access points or through modems linked to mobile phone networks.However, the fact that the computer is mobile means that location can be used as a key into context-aware hypermedia showing different content depending on location. The ‘stick e note’ system developed by the University of Kent uses a stickynote metaphor with notes stuck to particular locations [49]. Only when you visit thelocation does the note become visible. This is a bit like an image map on a web page,but rather than clicking a mouse over an image to link to information, here you needto physically move to a location! Another example is the GUIDE system, which usesvarious means to detect location (closest network access point or GPS) and thendelivers appropriate tourist information [69].
PDA access poses different problems. They often have standard web browsers, butof course on a substantially smaller screen. This may mean designing special pages or being especially careful to design ones that resize well. Because PDAs are often not network connected there are also systems to allow access to information whendisconnected. For example, AvantGo (www.avantgo.com) allows users to select‘channels’ of interest and then, when the PDA is docked, downloads any pages thathave changed, so that users always have the most up-to-date information possible.
By nature, mobile phones are (nearly) always connected to a network. However,memory and screen size are even more constrained. Some phones allow download-able applets so that small dynamic applications can be used. More web-like contentcan be accessed via WAP (wireless application protocol), which, like HTTP (hyper-text transfer protocol) for the web, gives access to remote servers. WAP content canbe produced as static or dynamic content using a mark-up language called WML,which is a simplified version of HTML (hypertext markup language). This allowshyperlinks like the web and even simple images, but due to the small screen size mostpages consist mainly of small amounts of information or simple lists of links. See thebook WAP site at /e3/wap.wml
21.2.4 Application areas
There are many applications of hypermedia, too many to describe in detail here.However, it is worth noting the type of domains in which hypermedia systems haveproved successful, looking briefly at some example systems.
Rapid prototyping
Although now lacking the wealth of features expected of a hypermedia system,HyperCard on Macintosh computers has been very influential as a basis for experi-mental hypertext systems. HyperCard uses the metaphor of a card index, aroundwhich the user can navigate. Each card can hold text, diagrams, photographs,

758 Chapter 21 n Hypertext, multimedia and the world wide web
bitmaps and so on, and hot-spots on the cards allow movement between cards.Cards may also contain forward and backward buttons and a home icon, to allow theuser to move sequentially and start from scratch respectively. HyperCard can be usedfor a range of applications including information management and teaching.
However, HyperCard’s simple scripting language and easy to produce graphicalinterfaces meant it was also used extensively as a rapid prototyping tool for generat-ing interactive systems. In fact, HyperCard stacks for both single-user and networkedapplications are available from the book website.
For similar reasons, other hypermedia tools such as Macromedia Flash andDirector are often used to produce dynamic interface mock-ups or even fully func-tioning systems. The web, too, is used like this, both to deliver applications and alsoas a way of mocking up an application interface as a series of storyboard web pages.
Help and documentation
Hypermedia systems are ideally suited to online manuals and other help systemapplications (see Chapter 10). They allow user-oriented access to the information,and support browsing. In addition the information can be organized hierarchically,with successive selections providing more detailed information. This supports thevarying needs that users have, such as quick reference, usage information, full detailsand so on. Many commercial help systems use hypermedia-style help. Good examplesare the Sun Guide system, HyperCard help and Microsoft Windows help (used bymany Windows applications).
Educational systems are another common application. Hypermedia provides anenvironment for the learner to explore, in her own time and at her own pace. Theinclusion of animation and graphics can allow the user to see things happen as wellas read about them. So, for example, animation can be used to simulate an experi-ment. Educational applications are discussed in more detail in Section 21.6.
Education and e-learning
Hypertext and hypermedia are used extensively in educational settings, as they allowvaried subjects to be related to each other in numerous ways so that the learner caninvestigate the links between different areas. In contrast to computer-aided learning(CAL) packages, hypermedia allows a student-controlled learning process.
An early example of a hypermedia learning environment that inspired many sub-sequent systems was Intermedia [385]. This is a hypermedia system built and used at Brown University to support teaching in subjects as varied as English literatureand biology. The system includes text, diagrams, photos and so on. Both learners andteachers can add information and links, giving students access to each other’s opinionsas well as those of their tutors. A map provides an overall view of the information fordirect access and navigation, with links providing browsing facilities in the normalway. Intermedia has been successfully used for university-level teaching, and can beseen as a forerunner of the educational resources now facilitated by the web.
Microcosm is an open hypermedia system, developed in the Electronics andComputer Science Department at the University of Southampton and shown in

21.2 Understanding hypertext 759
Figure 21.4; it allows users to browse through large amounts of multimedia infor-mation by following links. Microcosm does not contain links explicitly hardwiredinto its structure, but instead holds a database of link sources and destinations. Notonly does this allow processes to examine the links divorced from their surroundinginformation, but it allows links to be made to read-only media such as CD-ROM,video discs and external web pages. Microcosm is able to integrate many differenttypes of media, including other applications, and provides a set of viewing tools tolook at text, bitmaps, video, audio and other component information media.
Outside organized educational settings, the increasing availability of multimediaPCs has made the home an attractive marketplace for CD-ROM-based educationalsoftware. One example of this is Dorling Kindersley’s series of CD-ROMs based ontheir popular large-format book series.
As in other areas, the web has come to dominate most educational uses of technology. The term e-learning is sometimes used to refer to all forms of electroniclearning, but is most often used for learning delivered via the web. This may be distance learning or it may be augmenting classroom teaching using the web.
The eClass project (previously called Classroom 2000) is an example of the latter [4].It records pen strokes on an electronic whiteboard during a lesson (Figure 21.5)along with audio and video, and then allows students to review the material later
Figure 21.4 Microcosm: an open hypermedia environment shown running a teaching application entitled‘The civil war in Yugoslavia 1941–45’ (developed by the Departments of Electronics and Computer Scienceand History at the University of Southampton and used by permission)

760 Chapter 21 n Hypertext, multimedia and the world wide web
using a web interface (Figure 21.6). Each slide presentation and pen stroke is time-stamped so that students can click on a particular pen mark on the web interface andthe audio or video is replayed from that point in the lecture.
Collaboration and community
Although strictly not hypertext, the web has become a central platform for collabor-ative applications and community. These use the hypertext structure of the web to structure and access shared resources and message areas. For example Yahoo!Groups (groups.yahoo.com) allows mailing lists, shared images (such as family photoalbums), web archives of the mailing list and chat, all accessed through a web interface.
Figure 21.5 eClass – recording a lecture
Figure 21.6 eClass – indexed playback on student’s web browser. Source: Netscape browser window © 2002 Netscape Communications Corporation, used by permission

21.3 Finding things 761
Establishing a sense of community can be very important on websites as it is oneway to ensure loyalty and get visitors to return. This may involve explicit communityfeatures such as chat areas, or may simply be a matter of using a design, language andimage that suggests a site which is open and listening to ‘readers’ [214].
E-commerce
For some companies the web is simply another sales opportunity. Many readers willhave used online stores such as Amazon or bought from an auction site such as eBay.Hypertext’s use of hierarchies, links, images and so on, makes it ideal for displayingcertain kinds of product. Actual buying and selling requires not only security at thelevel of the networks, websites, etc., but also trust. When you walk into a shop youcan see the person you are dealing with, and the fact that it is physically there today givesyou confidence that it will be there tomorrow if anything goes wrong. How to buildand ensure this trust is an active area in HCI research (see, for example [307]).
FINDING THINGS
21.3.1 Lost in hyperspace
Although the non-linear structure of hypertext is very powerful, it can also be con-fusing. It is easy to lose track of where you are, a problem that has been called ‘lostin hyperspace’. There are two elements to this feeling of ‘lostness’.
The first is cognitive and related to content. In a linear text, when a topic is beingdescribed, the writer knows what the reader has already seen. In a hypertext, thereader can browse the text in any order. Each page or node has to be written virtu-ally independently, but, of course, in reality it cannot be written entirely without anyassumption of prior knowledge. As the reader encounters fragmentary information,it cannot be properly integrated, leading to confusion about the topic.
The second is related to navigation and structure. Although the hypertext mayhave a hierarchical or other structure, the user may navigate by hyperlinks that moveacross this main structure. It is easy to lose track of where you are and where youhave been.
The solution to the former issue is to design the information better. The solution tothe latter is to give users better ways of understanding where they are and of navigat-ing in the hypertext. To say ‘the solution’ is disingenuous – there is no simple ‘solu-tion’. If we want to provide information that allows complex, unplanned, non-linearaccess, there will probably always be problems. However, good design can help!
21.3.2 Designing structure
We discussed the importance of good structural design in Chapter 5. Some of the taskanalysis techniques presented in Chapter 15 may be useful in giving a task-oriented
21.3

762 Chapter 21 n Hypertext, multimedia and the world wide web
or knowledge-orientated breakdown of a hypertext. In some areas there may be pre-existing understood structures to mirror; for example, the faculty and departmentalstructure of a university, or the main disciplines (circulatory, neurological, etc.)within medicine.
In a paper format one is stuck with a single structure, which can lead to tensions:for example, the fact that in this book structural design is discussed in several places.As another example, imagine a car mechanic using a manual. She might want to use the classical breakdown into transmission, fuel system, etc., while fault finding,but if she were dismantling the engine it might be more useful to look at the car components in terms of physical location.
If multiple structures are used, you have to consider what to do about the com-mon material. For example, if we examine a car hypermedia text under ‘engine compartment’ and get to the fuel pump, this would also appear in the functionalview under ‘fuel system’. Such common elements may be replicated. This has theadvantage that the material can be presented in ways that make sense given theircontext, but it can also lead to inconsistencies.
Alternatively we may make links across the hierarchy at some level; for example,the engine compartment may have a diagram of the engine with a labeled arrow saying ‘fuel pump (fuel system)’, which takes you to the description of the pump inthe fuel system part of the hypertext. Notice, too, the importance of making linksthat go to different parts of the hypertext very clear, following the ‘knowing whereyou are going’ principle from Chapter 5 (Section 5.6.1).
An in-between solution would be to have a small dedicated description of the fuel pump in the context of the engine compartment: perhaps describing how it isphysically connected to the engine block and how the piping is routed. This couldthen be linked to a more extensive explanation of its function in the fuel system section, using a ‘see also’ link.
In all cases it is important that the structure and the naming of parts is meaning-ful for the user. In a more detailed and theoretical approach to the ‘knowing whereyou are going’ principle, Pirolli and others have developed information foraging theory [289]. This uses an analogy with foraging animals searching for patches of food and trying to make decisions about when to move to a different area or staywith the food available, and, if they move, where to go. This is likened to the way aninformation seeker browses, making decisions about whether to stick with the infor-mation available or spend time looking for more, and, if more is needed, decidingwhere to seek it. For animals, the scent of food is very important in deciding whereto go, and information foraging theory suggests that it is crucial that our structures,access methods and detailed page designs give users some sort of scent – hints aboutwhat they may find – to allow them to make good browsing decisions.
21.3.3 Making navigation easier
No matter how well designed the site structure is, there will still be problems: becausethe user does not understand the structure; or because the user has individual needs

21.3 Finding things 763
that the designer has not foreseen; or because even a good structure is not perfect.However, there are various things that can make it easier for users.
One solution is to provide a map of the hypertext document, identifying the current position of the reader within it. Links to home or end points can then beidentified and the user is less likely to get lost. This may be a separate part of thehypertext; for example, some websites have a site map link leading to a special page,and many help systems have a table of contents view. Alternatively, the site map canbe woven into the layout of the document; for example, some sites have an outliner-style sidebar listing the main sections and drilling down to the current location. This acts both as an indication of where you are in the site (like the breadcrumbs discussed in Chapter 5) and as a constant reminder of the overall site structure.
One way to deal with the differing uses that are envisaged for a hypertext is to pro-vide the user with ‘recommended routes’ through hypertext documents. If these aretoo strongly defined they defeat the objectives of the system. However, successfulapplications have been developed that have a guided tour or bus tour metaphor [13].Users can follow the tour, which takes them through one or more selected routes,but can deviate from it at interesting points whenever they wish. Users can thenreturn to the ‘bus stop’ to continue the tour when they have satisfied their interest.
Another type of hypertext takes the form of ‘levels of access’ to a document.Different levels of access privilege ‘see’ different amounts of information. A docu-ment structured in this way may provide one level of access that gives only a briefoverview of the topic. The next level of access presents a fuller description of the system, while the next level may also include information regarding the precisemeaning of technical terms used in the system. The final level of access may add historical information and suchlike. The user can choose at which level he wants toread the document, cutting out irrelevant information while obtaining all the neces-sary details. Such a document tends to be linear in nature, which makes navigatingand printing it easier, but removes the user’s choice in structuring his progressthrough it.
Once information has been retrieved, a paper version is often needed. Printing adocument requires the pages to be in a particular order, but hypertext does not support the concept of one single order. This is against the ethos of hypertext, which intends the user to structure the information in the way that suits him best. It can therefore be difficult to get a hard copy of the information that is required.
Although there is no simple way to linearize a hypertext, one can at least make itpossible to print individual linear parts, whether single pages or groups of linearlylinked pages. In general, you should not rely on the print facility of a browser as thisis printing a page designed for on-screen viewing. You may notice websites offeringprinter friendly pages. These may be in a different format such as PDF, or may simply be web pages without sidebar navigation aids, etc.
For both web and non-web hypertext, remember that once the page is printedsomeone who hasn’t seen the full hypertext may read it. If they like what they read,can they find the source? If a web page is likely to be printed, do include the full URL on the page, perhaps in the footer. On pages from a CD-ROM or similar hyper-text, include perhaps a copyright notice with details of the original.

764 Chapter 21 n Hypertext, multimedia and the world wide web
21.3.4 History, bookmarks and external links
Hypertext viewers and web browsers usually have some sort of history mechanism to allow you to see where you have been, and a more stack-based system using the‘back’ button that allows you to backtrack through previously visited pages. The backbutton may be used where a user has followed a hyperlink and then decided it wasto the wrong place, or alternatively, when browsing back and forth from a centralpage that contains lots of links. The latter is called hub and spoke browsing. In fact,in studies of web browsing the back button accounted for 30% of all navigationactions [63]. Other studies have shown frequent revisiting of pages during a singlebrowsing session [341].
Although the back button is used extensively, it is used relatively little to go backmore then one step. For error correction this makes sense, but for general revisitingone might think that moving back several steps would be common. Possibly, onereason for this is confusion about the meaning of the back button; indeed a formalcomparison of back and history mechanisms in four different hypertext and webbrowsers found that the operation of back and history were subtly different in each [104].
For longer-term revisiting, browsers typically support some form of bookmarkingof favorite pages. Both this and, on the web, external links from other people’s sites mean that users may enter your hypertext at locations other than the top levelor home page. On the web this is called deep linking. Many websites rely on the userremembering where they have come from to make sense of a page. If a page does not adequately show where it fits, then a user coming to it from outside may have noidea what site it is from, or why they are reading the material. Furthermore, if theoriginal site depended on the user pressing ‘back’ to return to higher levels of the site hierarchy it may be impossible for a visitor to find the rest of your site at all!
All pages should therefore make clear where they belong and have links into thefull site structure. For example, the breadcrumbs along the top of a web page func-tion both to make the context clear and, if they are ‘live’, as navigation back into thesite hierarchy (see Chapter 5, Section 5.6.1).
Framed websites are particularly difficult. The material you want to bookmark orlink to may be one of the frame content pages, but the URL you can see or bookmarkis that of the overall frameset. This may either discourage linking to the site or, if circumvented, it may mean linking directly to the content of one of the frames,which is then very likely to lack sufficient context, being designed to be seen withinthe frameset. Search engines, too, may generate links to individual frames in a frame-set. Many web style guides heavily discourage the use of frames for this reason. If thesite is designed using a development tool that supports page templates, or is beingdynamically generated, there is rarely any need for frames as most of the effects canbe obtained using other page formatting.
Very occasionally you may want to discourage deep linking; for example, if theframed page is more of an interactive application or you know the inner structure is unlikely to stay constant. In such cases you can include a small piece of script in

21.3 Finding things 765
the inner framed pages that makes them redirect to the outer frame if they are everopened ‘bare’ in a window. This means that if a site or a search engine does link intothe inner frames, following the link takes the user to the full, framed site.
For more on usability issues of frames see /e3/online/frames/
21.3.5 Indices, directories and search
As well as a hierarchical table of contents structure, many help systems, hypertexts,and for that matter paper books, have some kind of index. Note that an index is nota complete list of all words in a document. If this were the case then the index for thisbook would be as big as the rest of the book! The words in an index are chosenbecause they are significant key phrases or words with a domain meaning, and notevery occurrence of a word is indexed, only those deemed in some way important.The main difference between an electronic index and a paper one is that with thepaper index you have to physically look up the page after finding the word in theindex, whereas in an electronic index the links are ‘live’ so you can simply click to the content.
On the web an index would be very big (!); however, directory services such asYahoo! (www.yahoo.com) or the Open Directory Project (ODP) (www.dmoz.org)can be seen as a form of index. The main difference is that while an index is simplyan alphabetical list of keywords, web directories give a hierarchical categorization tosites. The categorization is done either by self-submission, or, in the case of qualitydirectories such as ODP or Yahoo!, by experts in the relevant field.
For exhaustive searching by keywords, some kind of automated search is required.In the case of a standalone hypertext, the viewer application may do this either byusing a pre-computed electronic index of all word occurrences used by the hypertext,or by scanning it on demand. The latter will take longer for each search, but may bemore effective if the hypertext is not too big or the material is rapidly changing.Where the hypertext is generated from a database, the search may be performed onthe underlying data rather than the generated pages.
In the case of the web the content is dynamically changing, but it would be imposs-ible to scan the whole web every time you wanted to find anything! Search enginessuch as Google or AltaVista use web crawling. Starting from an initial collection of pages they look for all links from these pages. These links are followed and the new pages reached are scanned, and so on. As pages are visited, an index is built ofwhich words occur in which pages. The search engines typically do not keep a copyof every page visited, but may just keep the title and the first hundred or so words oneach page. Even the index is vast and so the most common words are usually notindexed; these are called stop words. When you do a search, the search engine usesthe index and the summary information to construct the results page with links tothe actual pages. Because it is using the page summaries and not looking at the pagesthemselves, it is possible that a page may have been removed or changed since theindex was constructed.

766 Chapter 21 n Hypertext, multimedia and the world wide web
The web is enormous and so the number of pages containing a given word is enormous. Web search engines allow you to search for several words at once or forexact phrases, or, with Boolean searches, to specify using logical and/or options whatis required: for example, ‘engine AND NOT car’.
Even when looking for multiple words or Boolean queries, the number of resultsmay be in the tens or hundreds of thousands. So search engines need some way torank pages. Some use simple, content-based measures such as the number of timesthe requested words occur, whether they occur in the title or body, whether theyoccur near the beginning or end of the page. Some search engines keep track of how many times users click through for specific pages and so can build up a modelof popularity. In addition, some search engines sell the right to be top, based on keywords, or have a special advertisers or sponsors links section.
Google gained its reputation for quality based on the way it ranks pages, and seems almost magically to get just what you want in the first page or so of results, and often as the very top ranked result. It does this by using the structure of links. Ituses heuristics such as: if a page is linked from lots of places it is likely to be good,especially if the pages linking to it are already known to be good; and also the opposite: if a page links to lots of good pages then it is a good page.
Some specialist searches, for example for video, books, etc., and even some moregeneral-purpose search engines, allow you to rate pages you have visited. Ratings are then used to rank the more popular pages for future visitors. These are called recommender systems [304]. As well as explicit recommendations, e-commerce sitesoften track your browsing on the site and use this to build a profile of which usersare similar to you. The books or goods they purchased may then be suggested to you.
When designing web pages, it is possible to make them more ‘search enginefriendly’ by adding ‘META’ tags in the head section of the web page, in particularkeywords and description, as well as a relevant ‘TITLE’ tag. In the early days, peopletried to fool search engines by including invisible lines with lots of popular keywordsat the top of their document. Now most search engines are able to detect such sub-terfuge and discard such pages – so be honest! However, it is worth making sure thatsomething near the top of your page says what it is about!
Search engines have trouble scanning sites with many generated pages, especiallyif they are accessed through a search box only, for example a dictionary or thesaurus.There are many large data sets available on the web, often public domain or freelyaccessible, which contain high-quality information – often better quality than anyold web page – but are not easy to find unless you know the site. This has been called the hidden web and some estimates say that it is an order of magnitude larger than the visible web. Currently, there are no accepted ways to link such mater-ial into broader web searches although some products, such as onCue described in Chapter 18 (Section 18.4.1) attempt to link into these publicly accessible datasources.

21.3 Finding things 767
Searching for research literature
When you are asked to do a project or a literature review you will probably reach straightfor Google! You will get many pages that are not relevant and many that appear to be, but howdo you know which are worth reading? Unless, of course, you just assume that Google knows best!
Part of the process by which papers are accepted into a conference or journal is peer review – thepapers are read and judged by other workers in the field. On the web, it is hard to judge the qual-ity of information you find.
There are some heuristics you can use. Is the online page an electronic version of an article pub-lished in a refereed paper publication? Where is the page: in a major corporation or university, or a free home page? This doesn’t mean that you can’t find good pages by unknown people, butexisting position is a heuristic. If the author has a publications page, are other articles published in good venues? Do other pages that you have judged to be of good quality reference an onlinearticle? And, of course, not to be forgotten . . . does it make sense? No matter who wrote it, if itis not well argued then don’t believe it!
If you are looking for articles in computing you can also use citeseer (citeseer.jn.nec.com). This isa search engine for online copies of papers, hosted by NEC Corporation. Unlike standard websearch engines, this only searches for articles, and in particular is able to scan PDF, PostScript andother electronic formats. Not only does citeseer search by title, author, etc., it is also a citationindex. For each paper, it scans it to find the bibliography at the end. When you look at the entryfor a paper, it shows you what other papers it references (looking back in time) and also whichfurther papers have cited it (looking forward), as the diagram shows.

768 Chapter 21 n Hypertext, multimedia and the world wide web
WEB TECHNOLOGY AND ISSUES
The web has featured strongly already in this chapter and for the remainder of thechapter we will focus exclusively on it.
21.4.1 Basics
The web consists of a set of protocols built on top of the internet that, in theory, allowmultimedia documents to be created and read from any connected computer in theworld. The web supports hypertext, graphics, sound and movies, and, to structureand describe the information, uses a language called HTML (hypertext markup language) or in some cases, XML (extensible markup language). HTML is a markuplanguage that allows hypertext links, images, sounds and movies to be embeddedinto text, and it provides some facilities for describing how these components arelaid out. HTML documents are interpreted by a viewer, known as a browser; there aremany browsers, and each can interpret HTML in subtly different ways, or supportdifferent levels of functionality, which means that a web page viewed through onebrowser can look very different from the same page viewed through another. Theweb requires no particular multimedia capabilities from the machines that run the browsers; for example, if sound is unavailable on a particular machine, thenobviously no sound is heard but the browser still displays the text happily.
The web owes its success to many factors, including the robustness and (relative)ease of use offered by popular browsers from the very first graphical browser Mosaic,and continued in commercial browsers such as Netscape Navigator, MicrosoftInternet Explorer and Opera. These offer a graphical interface to the document, con-trolled by the mouse. Hypertext links are shown by highlighting the text that acts asthe link in an alternative color, and are activated by clicking on the link. A furthercolor is used to indicate a link that has already been visited. Hypertext links can alsobe embedded into regions within an image.
Although the browser contains most of the functionality required to view a webdocument, supporting text and graphics in an integrated package, special file formatsand media, including some movie formats, may require additional plug-ins or helperapplications.
As well as publishing personal, corporate and governmental information, the webis used as a source of entertainment, an advertising medium, a communication envir-onment, and more. The vast and ever-increasing quantity of information availableon the web certainly exacerbates the user’s ‘lost in hyperspace’ problems (Section21.3.1). But increased familiarity with hypertext, and better web page design, are aid-ing the situation at least as much as technological efforts to create maps and indexesof the data. Another problem is that of information overload: multimedia images,gigabytes of graphics and mountains of text swamp the reader in a glitzy but unmod-erated world, in which the fact that almost anyone can make anything available leadsto the gemstones often being lost amongst the slag.
21.4
21.4 Web technology and issues 769
As well as static web content such as text and images, many pages are dynamic: forexample, they may be generated from data held in databases, respond to individualinformation entered into forms, or include dynamic elements such as Java applets.We will discuss this dynamic content further in Section 21.6.
21.4.2 Web servers and web clients
Whereas a conventional PC program runs and is displayed on one computer, theweb is distributed. Different parts of it run on different computers, often in differentcountries of the world. They are linked, of course, by the internet, an enormousglobal computer network (see also Chapter 2, Section 2.9.3).
The pages are stored on web servers that may be on a company’s own premises or in special data centers. Because they are networked, the webmaster for a site canupload pages to the server from wherever she is. For example, the web pages forwww.hcibook.com are stored in a data center several thousand miles from where anyof the authors live!
Your machine, the PC running the web browser, is called a client because it wantsthe pages from the servers. When you click on a link your web browser works out the full URL of the page it needs: say ‘http://www.hcibook.com/e3/authors.html’. Itsplits this into parts. The first part is the protocol ‘http’ which says how it talks to theserver (other alternatives include ‘ftp’). The second part ‘www.hcibook.com’ is thehost name, that is the name of the web server containing the requested page. The lastpart ‘/e3/authors.html’ gives the particular file on the site. The browser then estab-lishes a connection to the required web server (in this case ‘www.hcibook.com’), and sends a message, formatted using the HTTP protocol, to the web server, whichthen finds the requested html file (or image, or other file type) and returns it to thebrowser, which then displays it to you.
If the page contains images the same process is repeated for each image, and if thepage is a framed one for each frame within the page.
21.4.3 Network issues
The fact that the web is networked raises a series of issues that can impact on usability.
Network capacity is called bandwidth. This is a measure of the amount of information that can pass down the channel in a given time. For example, a typicalmodem speed is 56 kbs – that is 56 kilobits per second. This equates to about 6000 characters per second. This sounds fine until you realize that images may takemany tens or hundreds of characters (bytes) to encode . . . this is why many haverenamed the web the ‘world wide wait’!
However, bandwidth is not the only important measure. There is also the time ittakes for a message to get across the network from your machine to the web serverand back. This delay is called latency. Latency is caused by several factors – the finitespeed of electrical or optical signals (no faster than the speed of light), and delays

770 Chapter 21 n Hypertext, multimedia and the world wide web
at routers along the way that take messages from one computer network and passthem on. This latency may not always be the same, varying with the exact routethrough the network traveled by a message, the current load on the different routers,etc. Variability in the latency is called jitter (see Figure 21.7).
As well as the underlying latency and jitter of the network, each layer of networksoftware adds its own. The underlying internet protocols are lossy, that is messagescan be lost. When this happens, higher level software (the TCP – transmission con-trol protocol – layer) notices and resends messages to give reliable communication.These losses mean that the average delays increase, but also that the jitter increases –a lost and resent message takes more time than one that gets there first time.
There may also be an appreciable amount of time setting up a new connection,which may outweigh the time taken to actually send data. This is particularly a prob-lem with sites containing many small images.
Web usability guides will give plenty of advice on ways to minimize web page size,but one recommendation, which sadly we promulgated too in earlier editions of thisbook, should be taken with a pinch of salt. Virtually every guide suggests keepingpages short – enough to fit within a single screen of a typical web browser. Now thereare arguments for this – some users may not realize there is more content off the bottom of the screen, the material lower down may be ignored, search engines arebetter able to index multiple small pages. However, the reason that is often given,namely download time, is not a good one. Of course, an enormous page takes a longtime to load, but on the whole interaction is faster if a larger page is downloaded andthen scrolled through than if the user has to click links on many small pages and waitfor each.
This latter point is an example of a broader issue. In general, if you want rapidfeedback, try to make the interaction happen at the web browser end. Feedback that involves a cycle to the web server and back, except for intranets on fast networks,will take several seconds, which is too slow for fluid interaction. Unfortunately, forcollaborative applications there is no way to prevent at least some network delays forfeedthrough (see Chapter 19, Section 19.6.3), but even then it is important to preventtoo many cycles of network messages.
Figure 21.7 Bandwidth, latency and jitter

21.5 Static web content 771
STATIC WEB CONTENT
21.5.1 The message and the medium
One thing is often forgotten when web pages are created. It is of vital importance,and hence will be discussed first.
It is content.Many people assume that because they can make information available on the
web, they should. Unfortunately, because it is very easy to publish information,much less care is taken with the actual content. Material may be nonsense, it may beincorrect, it may not read well, or be incomplete, or inane.
Excellent page design can make useless material look attractive, but it still remainsuseless material. On the other hand, poor design can mean that excellent material is never seen by potential readers, as they have become bored, or intolerant of themedium, or confused, or for a host of other reasons have aborted their attempts todownload and view the information. Pages do have to look immediately interestingand attractive if people are to spend time, effort and, because of the communicationcosts, money, in viewing them; the user-centered nature of the medium makes thisimperative. This is in marked contrast to television or cinema or other dynamicmedia, which are not under any direct user control, where information is presentedto a passive audience. With web documents, people have actually to want to see theinformation, and make an effort to retrieve it, which clearly must have an influenceon design.
Whatever is being presented, underlying all the comments made on good and bad design, the fundamental message is that, for the user group or groups who aretargeted, the content should be worth reading.
When it is likely that a user will require a paper copy of the information madeavailable over the web, ideally they should be able to download it in one go as a
21.5
Delivering WAP content – balancing usability and feedback
Because of the tiny screens on phones it is difficult to scroll through a long WAP page. However,if every link involved going back to the WAP server the feedback would be very slow. For this reason WML divides WAP content into stacks of notes. For the user browsing the content, thenote is the parallel of the normal web page. A link may be to a note in the same stack or one in adifferent stack; the user is largely unaware of which it is. However, when you request a note in astack the whole stack is downloaded to the WAP browser on your phone. This means that links to notes in the same stack have much faster feedback. By carefully arranging content within stacksand notes, the overall user experience can be improved.

772 Chapter 21 n Hypertext, multimedia and the world wide web
single complete file, with the same information content but possibly a different layout. Paper does not have the same inbuilt hypertextual and active capabilities asthe web page, and will be accessed in a predominantly linear fashion.
21.5.2 Text
Because web pages are displayed on many different machines, there are only a small set of fonts that can be guaranteed to be available: a standard font and a type-writer font (e.g. courier) with bold and italic versions in different sizes. However, it is possible to specify preferred fonts and many of these such as Arial, Verdana orComic Sans are available on most web platforms. The difficult thing is to balance fine tuning the appearance of the text on one platform with making it readable on all.
The various structured styles such as headings allow the web designer to creatematerial that will lay out passably on all platforms. But these offer a fairly coarse levelof control. The size and boldness of the heading should be chosen carefully; forexample, huge dark fonts on a page can look loud and brash.
There is an increasing desire to have fine control. Cascading style sheets (CSS)allow you to specify fonts, line spacing, size, etc., in a similar way to styles in a wordprocessor or DTP package. However, care must be taken. For example, many pagesspecify fixed point sizes that may not display well on different platforms and cancause problems for people with visual impairments.
The use of color is of great importance for web pages, but it is often abused. First,it should be remembered that a significant proportion of the potential viewers of the page will have problems with color, either because they are using older machineswith a limited color palette, or because they have some form of color blindness.Color, when used, should not be the only cue available. Users also bring a deep-rooted emotional interpretation to colors; as we have seen, in some cultures, red isassociated with danger and anger, whilst green is regarded as go, or safe. Blue can bea cool color, orange a warm one, and so on.
Links usually change color once they have been accessed, providing cues to theuser about what material they have already explored. This means that two distinctbut still suitable colors need to be associated with each link, so that the system isacceptable whether or not the links have been activated. Note, too, that consistentuse of color can help the user understand the role of particular elements more intuit-ively, whereas color used for no clear purpose is often distracting.
One common mistake is to put colored text onto a similar colored background so that it becomes nearly invisible. One of the authors had a student who designed abeautifully laid out page of text, and decided to add a background to the page justbefore demonstrating it to the rest of the group. It was only at the demonstration that he realized that the cool black background he had added made the black textimpossible to see!
There are only a limited number of text-placing options: text can be left or rightjustified, or centered. There are a few predefined formatting styles such as ordered

21.5 Static web content 773
and unordered lists that have additional structure, in the form of indentation fromthe left margin, with numbering in the case of ordered lists. Vertical positioning iseven more limited, but tables and (cautious use of) frames allow a greater degree ofhorizontal and vertical placement. More precise positioning still can be obtainedusing ‘dynamic HTML’ (DHTML), which allows parts of an HTML document(called layers or ‘div’ sections) to be positioned as if they were separate mini-pageswithin the browser window. The word ‘dynamic’ is used because these can then becontrolled using JavaScript to produce various animated effects (those pages wherelittle stars follow your mouse!).
Remember that monitors are different sizes and that some people use full-screenwindows and others smaller ones. To prevent very long lines, many designers lay outpages within tables that put maximum widths (in pixels) for columns based on typ-ical minimum expected monitor sizes (perhaps 800 × 600 or even 640 × 480). If fixedlayouts or large graphics are used then they may either display strangely on smallerwindows or force the user to scroll horizontally, which many users find confusing.And don’t forget people viewing the page on PDAs!
The lack of explicit textual positioning makes it very difficult to produce com-plex mathematical equations, and the font set available is not rich enough to providea suitable approximation. Developments in the specification are addressing this,though the intrinsic complexity of typesetting mathematics suggests that it may be a while before a simple, usable solution is found that is acceptable to readers, pagedesigners, and implementors of web browsers alike.
21.5.3 Graphics
Obtaining graphics
There are a number of sites on the web that contain archives of graphical images,icons, backgrounds and so on. There are also paint and image manipulation pack-ages available on almost all computer systems, and scanners and digital cameras,where available, enable the input of photographs and diagrams.
Using graphics
While graphics and icons tend to play a significant role in web page design, their useshould be carefully thought out. Graphical images take longer to load than text, andthis may become a problem. Text uses 8 bits to represent a character: some roughcalculations show that approximately 2000 characters represent about a screenful ofinformation, and so 16,000 bits (2 K) are required. For graphics, one pixel may use8 bits to represent its color: a page-sized image will be at least 600 by 400 pixels,which will take 1,920,000 bits (240 K), or 120 times as long to load. Put another way,while a picture may tell a thousand words, it takes approximately 50 times as long toappear! Users become bored with operations that take a long time to complete, andare unlikely to wait for ages while a page appears.

774 Chapter 21 n Hypertext, multimedia and the world wide web
Complex backgrounds are the worst offenders in this area; they offer little in theway of added value to the information presented on the page, and cause great frustration for the poor reader. They tend to be designed and tested only on localmachines, with high-bandwidth connections between them, which means that thetime factor is negligible for the designer/user. However, this disregards the fact that many people accessing the page will be using congested, slow networks, with atransfer rate sometimes down to a few kilobits per second, rather than fast megabitlinks. Fussy backgrounds also have the unfortunate ability to obscure text, making itvery difficult or impossible to read.
Different browsers support different types of functionality, with more recent versions having features that try to alleviate the usability problems introduced by thedelay involved in downloading graphics. Most browsers support caching, in whichgraphics are downloaded once and temporarily stored on the user’s local machine. Ifthe same image is reused, it is fetched from the local store far more rapidly than if it were retrieved from the remote site. This clearly has implications for page design:if graphics are to be used, then their reuse wherever possible speeds up the wholeprocess of drawing the page. Complex graphics can sometimes be broken down intoa set of items, many of which can be reused and assembled in different ways to addvisual impact to the page without causing large delays. Most browsers also offer theoption of turning off automatic image loading, so that only the text is downloaded.If a page then appears to be of interest, the graphics can be explicitly requested. It issometimes possible to set out a page so that it still looks attractive even without thegraphics, which is necessary if the user has turned off image loading. There are otherbrowsers that are purely text based and do not support graphics of any sort, and forthese HTML offers an additional image attribute that allows a textual description of the image to be used as an alternative. The need to support these different userpreferences and browser capabilities provides a great challenge in designing pagesthat are acceptable to all.
Some browsers have additional features related to image handling as a techno-logical response to the problem of page usability. If the designer specifies the size of the image in advance, the browser can lay out the text on the page first, leavingspaces for the images. This allows the user to continue to read the page contentswhilst the images are being downloaded into their respective slots. This capabil-ity improves the usability of the page, and so should be supported by the pagedesigner whenever possible, by incorporating the necessary information into theimage reference.
Both GIF (graphics interchange format) and JPEG (Joint Photographic ExpertsGroup), the most widely used web graphic image formats, can be saved in forms that allow them to be progressively transmitted. This means that images appear as a whole, but very blurred, version that becomes gradually sharper, rather thanappearing in perfect resolution a line at a time. An overall impression of the page and the graphic information appearing is thus given to the user, who is then betterinformed about whether or not to continue the download.
The JPEG format is optimized for photographic images and makes use of theirproperties to offer a higher compression ratio and hence faster loading. However,

21.5 Static web content 775
its compression is lossy, that is the image reproduced is slightly different from theoriginal, losing certain kinds of visually indistinguishable colors and, more import-antly, losing high-frequency change. The latter is because photographs tend to haveslowly varying changes with few sharp edges. If sharp-edged images such as diagramsor text labels are stored as JPEGs, small artifacts are produced such as ripples appear-ing around letters and lines. In contrast GIF uses a lossless compression so that theimage appears exactly as it started. Although GIFs can be used for photographicimages, the compression is very poor.
The GIF format also allows animated GIFs. These are a sort of mini-slide show or movie where several images are stored in the same file and play one after another.These can be used to produce simple and effective animations, but when overusedcan lead to very ‘noisy’ pages.
Active image maps are pictures with defined ‘hot’ areas, which, when clicked, exec-ute a particular script, usually calling another web page or graphic. The careful useof such maps can transform an interface, but there is an overhead to pay in loadingthe map and calling and running the script, and this should be considered carefullyby a page designer. Another characteristic of image maps is that there is rarely anyindication of which areas are active and which are not, and it can be difficult for usersto ensure that they have visited all the active regions. For accessing spatially organ-ized information, image maps are very suitable (for example, in a tourist informa-tion system, the area about which information is available can be represented well),but for information that does not have any clear spatial analog, their use is morequestionable.
Icons
Icons often appear on web pages, and while there are many available to choose from,they should be used with care. On web pages, icons are typically used in one of twoways. They are either visual cues, associating some small picture with different partsof the text (for example, some pages have icon-sized characters that appear next to instructions). Alternatively, they are used in much the same way as in a standardWIMP interface to represent aspects of the functionality of the underlying pages. In this latter case, they must represent their associated functionality in either a con-crete or an abstract form. This means that the design of the individual icon has to becarefully thought out, as a lot of information may have to be represented in a smallarea of screen estate. However, icons are rarely seen on their own, and when placednext to their neighbors, the whole effect has to be pleasing rather than disruptive and garish. Therefore, the group of icons has to be designed together, with a coher-ent and recognizable style. The picture is broader than this, however: other applica-tions also use icons, which has its advantages and disadvantages. One advantage isthat certain icons are already associated with specific functionality (for example, a picture of a floppy disk to represent ‘save’). Disadvantages are that it restricts the individuality and style icon sets can show, and may mean that icons designed for one purpose are misunderstood by users because they have seen something similar in another context. It is therefore vital that time is spent in examining the way

776 Chapter 21 n Hypertext, multimedia and the world wide web
icons are used in other systems, before importing them into web pages or designingnew ones.
Icons sometimes appear for no apparent reason at all, when the page creator has decided that as graphics are supported, a few shouldbe used. One interesting example is the icon that is a copy of the roadworks sign, used in conjunction with text saying something like‘This page still under construction!’.
This is an interesting social effect brought on by the ease of web publishing –incomplete (sometimes even non-existent!) information can be made immediatelyavailable. It’s like buying a map of the world nowadays and finding ‘here be dragons’around the edges because the geographer could not be bothered to draw all the countries in. Most pages can be designed properly before they are made available,structured and presented in a complete and coherent way, allowing for extensionsand updates from the beginning.
There are times when the disclaimer ‘under construction’ has its uses: when critic-ally important information becomes available, publishing it may well be moreimportant than presenting it (much like older maps with their dragons – if maps hadonly been printed once the whole world had been explored, civilization would bevery different today). There is, too, a sense in which web pages can be continually‘under construction’, changing, evolving and growing, because of their dynamicnature and the ease with which they can be updated, but this does not obviate thedesigner’s responsibility to create pages that have both form and content.
Graphics and color
Using many different colors within graphics may well result in the browsers for oldermachines running out of entries in the colormap, with unpredictable consequences.This is often problematical as the browser may be running in tandem with othercolor applications, and only has a restricted range of colors to begin with.
For many consumer markets, for example in the UK and the US, this is unlikelyto be a problem as home machines are often relatively recent. However, many businesses continue to use older PCs so long as they ‘do the job’ and PDAs may nothave a full color palette. Furthermore, in economically deprived areas, where there iscomputer access it may well be through older or second-hand machines.
If universal access is required it is therefore still wise, where possible, to restrictimages to a limited number of colors, taken from the standard 216 color web palette,and to reduce complex color images to simpler approximations. Reducing the number of colors used also allows the depth of the images to be reduced; a changefrom a default of 8 bits to, say, 4 bits will produce a twofold speedup in image load-ing. The earlier comments on the use of color obviously apply as much to graphicsas they do to text.
One further point should be made about graphics: computer screens are typicallylimited to a resolution of around 72 dpi (dots per inch), and so either high-resolutionimages will have to be displayed much larger than actual size, or the increased resolu-tion will be forfeited.
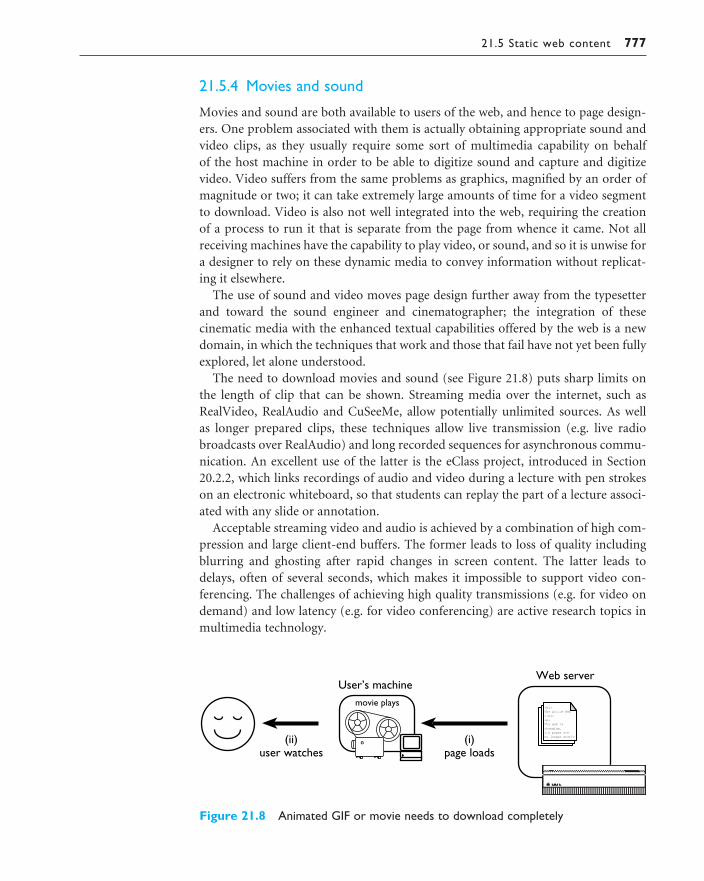
21.5 Static web content 777
21.5.4 Movies and sound
Movies and sound are both available to users of the web, and hence to page design-ers. One problem associated with them is actually obtaining appropriate sound andvideo clips, as they usually require some sort of multimedia capability on behalf of the host machine in order to be able to digitize sound and capture and digitizevideo. Video suffers from the same problems as graphics, magnified by an order ofmagnitude or two; it can take extremely large amounts of time for a video segmentto download. Video is also not well integrated into the web, requiring the creation of a process to run it that is separate from the page from whence it came. Not allreceiving machines have the capability to play video, or sound, and so it is unwise fora designer to rely on these dynamic media to convey information without replicat-ing it elsewhere.
The use of sound and video moves page design further away from the typesetterand toward the sound engineer and cinematographer; the integration of these cinematic media with the enhanced textual capabilities offered by the web is a newdomain, in which the techniques that work and those that fail have not yet been fullyexplored, let alone understood.
The need to download movies and sound (see Figure 21.8) puts sharp limits onthe length of clip that can be shown. Streaming media over the internet, such asRealVideo, RealAudio and CuSeeMe, allow potentially unlimited sources. As well as longer prepared clips, these techniques allow live transmission (e.g. live radiobroadcasts over RealAudio) and long recorded sequences for asynchronous commu-nication. An excellent use of the latter is the eClass project, introduced in Section20.2.2, which links recordings of audio and video during a lecture with pen strokeson an electronic whiteboard, so that students can replay the part of a lecture associ-ated with any slide or annotation.
Acceptable streaming video and audio is achieved by a combination of high com-pression and large client-end buffers. The former leads to loss of quality includingblurring and ghosting after rapid changes in screen content. The latter leads todelays, often of several seconds, which makes it impossible to support video con-ferencing. The challenges of achieving high quality transmissions (e.g. for video ondemand) and low latency (e.g. for video conferencing) are active research topics inmultimedia technology.
Figure 21.8 Animated GIF or movie needs to download completely
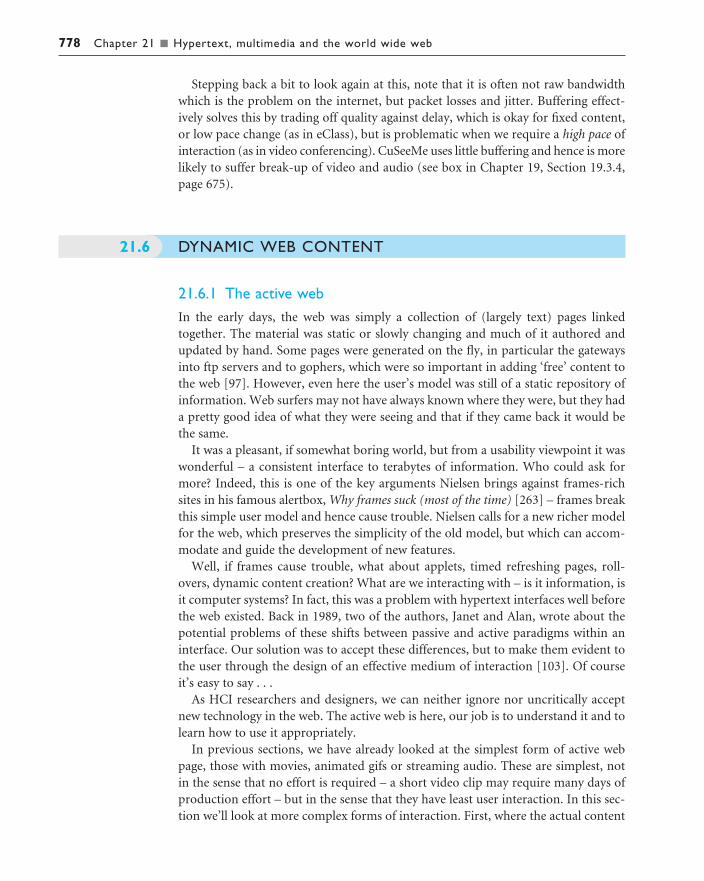
778 Chapter 21 n Hypertext, multimedia and the world wide web
Stepping back a bit to look again at this, note that it is often not raw bandwidthwhich is the problem on the internet, but packet losses and jitter. Buffering effect-ively solves this by trading off quality against delay, which is okay for fixed content,or low pace change (as in eClass), but is problematic when we require a high pace ofinteraction (as in video conferencing). CuSeeMe uses little buffering and hence is morelikely to suffer break-up of video and audio (see box in Chapter 19, Section 19.3.4,page 675).
DYNAMIC WEB CONTENT
21.6.1 The active webIn the early days, the web was simply a collection of (largely text) pages linkedtogether. The material was static or slowly changing and much of it authored andupdated by hand. Some pages were generated on the fly, in particular the gatewaysinto ftp servers and to gophers, which were so important in adding ‘free’ content tothe web [97]. However, even here the user’s model was still of a static repository ofinformation. Web surfers may not have always known where they were, but they hada pretty good idea of what they were seeing and that if they came back it would bethe same.
It was a pleasant, if somewhat boring world, but from a usability viewpoint it waswonderful – a consistent interface to terabytes of information. Who could ask formore? Indeed, this is one of the key arguments Nielsen brings against frames-richsites in his famous alertbox, Why frames suck (most of the time) [263] – frames breakthis simple user model and hence cause trouble. Nielsen calls for a new richer modelfor the web, which preserves the simplicity of the old model, but which can accom-modate and guide the development of new features.
Well, if frames cause trouble, what about applets, timed refreshing pages, roll-overs, dynamic content creation? What are we interacting with – is it information, isit computer systems? In fact, this was a problem with hypertext interfaces well beforethe web existed. Back in 1989, two of the authors, Janet and Alan, wrote about thepotential problems of these shifts between passive and active paradigms within aninterface. Our solution was to accept these differences, but to make them evident tothe user through the design of an effective medium of interaction [103]. Of courseit’s easy to say . . .
As HCI researchers and designers, we can neither ignore nor uncritically acceptnew technology in the web. The active web is here, our job is to understand it and tolearn how to use it appropriately.
In previous sections, we have already looked at the simplest form of active webpage, those with movies, animated gifs or streaming audio. These are simplest, notin the sense that no effort is required – a short video clip may require many days ofproduction effort – but in the sense that they have least user interaction. In this sec-tion we’ll look at more complex forms of interaction. First, where the actual content
21.6

21.6 Dynamic web content 779
is fixed, but the user can change the form of presentation; secondly, at the generationof pages from database content; and finally at the update of database informationthrough the web.
21.6.2 What happens where
When considering dynamic material on the web we need to take the external, user’sviewpoint and ask what is changing: media, presentation or actual data; by whom: bythe computer automatically, by the author, by the end-user or by another user; andhow often, the pace of change: seconds, days or months? From a technical standpoint,we also need to know where ‘computation’ is happening: in the user’s web-browsingclient, in the server, in some other machine or in the human system surrounding it?The ‘what happens where’ question is the heart of architectural design. It has a majorimpact on the pace of interaction, both feedback, how fast users see the effects of theirown actions, and feedthrough, how fast they see the effects of others’ actions. Also,where the computation happens influences where data has to be moved to with cor-responding effects on download times and on the security of the data.
The user view
One set of issues is based on what the end-user sees, the end-user here being the webviewer.
What changes? This may be a media stream (video, audio or animation) which ischanging simply because it is the fundamental nature of the medium. It may bethe presentation or view the user has of the underlying content; for example, sort-ing by different categories or choosing text-only views for blind users. A specialform of presentation change is when only a selection of the full data set is shown,and that selection changes. The deepest form of change is when the actual contentchanges.
By whom? Who effects the changes? In the case of a media stream or animation,the changes are largely automatic – made by the computer. The other principalsources of change are the site author and the user. However, in complex sites usersmay see each other’s changes – feedthrough.
How often? Finally, what is the pace of change? Months, days, or while you watch?
We’ll use the ‘what changes?’ categories as we examine alternatives and trade-offs inmore detail below. But first we also need to look at the technological constraints.
Technology and security
The fundamental question here is where ‘computation’ is happening. If pages arechanging, there must be some form of ‘computation’ of those changes. Where doesit happen?

780 Chapter 21 n Hypertext, multimedia and the world wide web
Client One answer is in the user’s web-browsing client enabled by Java applets,various plug-ins such as Flash, scripting using JavaScript or VBScript withdynamic HTML layers, CSS and DOM (Domain Object Model).
Server A second possibility is at the web server using CGI scripts (written in Perl,C, UNIX shell, Java or whatever you like!), Java Servlets, Active Server Pages orone of the other server-specific scripting languages such as PHP. In addition,client-side Java applets are only allowed to connect to networked resources on thesame machine as they came from. This means that databases accessed from client-side JDBC (Java database connectivity) must run on the web server (see below).
Another machine Although the pages are delivered from the web server, they maybe constructed elsewhere. For hand-produced pages, this will usually be on thepage author’s desktop PC. For generated pages, this may be a PC or a centraldatabase server.
People Of course, as noted earlier, the process of production and update may eveninvolve people!
It is easy to roll out maxims such as ‘users first’, but, in reality, the choice betweenthese options is not solely a matter of matching the end-user requirements. The bestchoice also depends on the expertise of the web developer and external limitations.If the server runs on a UNIX machine, you can’t expect to use Microsoft ActiveServer Pages. On the other hand, if you are designing for an intranet you may evenget to influence the choice of client software and so make it easier to use more complex client-end solutions.
The choice of technological solution is also heavily influenced by issues of security. When we do any computation on data the computation and the data mustbe in the same place [299]. This apparently simple factor means that if we want tokeep data secure (read ‘on well-protected servers’) then we must also perform thecritical computation on the same servers. For example, imagine a password check. It would be foolish to send the correct password to a Java applet to check!
21.6.3 Fixed content – local interaction and changing views
Probably the most hyped aspect of the web in recent years has been Java. In fact, Javacan be used to write server-end software and platform independent standalone pro-grams (not to mention the embedded systems for which it was originally designed!),but the aspect that most people think of is Java applets.
Applets are just one of the techniques that can be added to give client-end inter-action (and about the least well integrated into the rest of the page). The most common alternatives are JavaScript, Flash and if you are prepared to limit yourself to Windows platforms, ActiveX plug-ins. These techniques share the characteristicthat they are downloaded to the user’s own machine (see Figure 21.9) and thereafterall interaction happens on the PC, not across the network (with caveats – see below).
The simplest use of this is to add interaction widgets such as roll-over buttons(usually using JavaScript). More complex pages may add the equivalent of an

21.6 Dynamic web content 781
interactive application on the page. For examples, see Alan’s pages on coin tossingexperiments (Figure 21.10), which use JavaScript to emulate real and biased coins,and dancing histograms (Figure 21.11), which use a Java applet. See Sun andJavaSoft’s own sites for many more examples. The addition of DHTML gives evenmore opportunities for dynamic pages where parts of the page can move, changesize, or change content all without any interaction with the web server.
Notice how this local interaction confuses the static model of the web. Whatshould happen when you go back to a previously visited page, or reload it? Do you get the original state or the last state of your interaction? What happens if youlaunch a second window on the same page? The actual behavior tends to be browserspecific and not always what you would expect! In particular, some browsers do not re-initialize applets on a reload and so if you edit the applet’s parameters andthen reload you may not see the effects of your changes. More of a problem for webdevelopers than end-users, but very confusing.
Figure 21.10 Simulated coin tossing using JavaScript. Screen shot frame reprintedby permission from Microsoft Corporation
Figure 21.9 Java applet or JavaScript running locally

782 Chapter 21 n Hypertext, multimedia and the world wide web
21.6.4 Search
Some user-driven interaction can be accommodated at the client end, but not all.Consider search engines. It would be foolish to download several megabytes of information so that a Java applet can search it online! Instead, all common websearch pages work by submitting forms to the server where CGI programs performthe searches and return results. An additional reason for this approach is that most browsers support forms, but some still do not support Java or scripting in aconsistent manner. The web search engine for this book works in this way. The user’skeywords are submitted to the server using an HTML form, they are comparedagainst pre-prepared indexes at the server and all matching paragraphs in the bookare returned (Figure 21.12). This also reminds us of another reason for not down-loading all the text to the user’s machine – security; we don’t want to distribute thefull electronic text for free!
Notice that, in all the above, the underlying content does not change; the variablefactor is the user’s input. The computation (working out what to show) needs boththe data supplied by the web author (pages, databases, indexes, etc.) and the user’sinput. The result must end up on the user’s screen. Either the data must come to theuser’s machine (as in Alan’s dancing histograms where the histogram data are inapplet parameters); or the user’s input must go to the server (as with the search). Wecan see from the examples that the choice between these depends on the required paceof interaction, the size of the data set required, security and available technology.
Figure 21.11 Dancing histograms using Java applet. Screen shot frame reprinted bypermission from Microsoft Corporation

21.6 Dynamic web content 783
21.6.5 Automatic generation
It was evident in the earliest days of the web that a key problem for the future wouldbe maintenance. In the first rush of enthusiasm, individuals and organizations produced extensive and fascinating sites built largely of hand-crafted HTML. Notsurprisingly, vast areas of the web are not just static but in perpetual stasis. Websurfing sometimes seems not so much a watersport, but an exercise in archaeology.
From the beginning it was clear that websites would eventually need to be createdfrom databases of content combined with some form of templates or layout descrip-tion. However, at that stage there were no tools available and those who saw thedatabase future used a variety of ad hoc methods.
Happily, there are now a (sometimes bewildering) array of products for auto-mating web production from existing and bespoke databases. These include vendor-specific products such as Oracle Web Server and Domino (for publishingLotus Notes), and also more general techniques such as using SQL (structured querylanguage) or JDBC to access databases from CGI scripts or even from running Javaapplets.
Database-generated websites have many advantages. They make use of existingdata sources. They guarantee consistency of different views of the data within the siteand between the site and the corporate data. They allow easy generation of tables ofcontents, indices, and inter-page links. They separate content and layout.
The most dynamic way to get database content on the web is by accessing adatabase directly from a running applet. The interface can then have any look-and-feel that can be programmed in Java and can allow very rapid interaction with the user. The Java applet can establish an internet connection back to the webserver to access data files using HTTP (as if they were web pages), it can connect to a bespoke server (e.g. for chat type applications) or it can use standard data-base access methods. The latter would normally use JDBC, the Java database accesspackage. Using JDBC the applet can issue complex SQL queries back to the databasemeaning that some of the most complex work happens there (Figure 21.13).
In all cases, the Java security model built into most web browsers means that theapplet can only connect back to the machine from which it came. This means thatthe database server must run on the same machine as the web server. Think about
Figure 21.12 HCI book search

784 Chapter 21 n Hypertext, multimedia and the world wide web
this. The most insecure part of any system is usually the web server, both because itis easy to leave loopholes in the many file access permissions and also because it oftensits outside the most secure part of a corporate firewall.
The more common solution is where the user uses a web forms interface (or special URL) and then a CGI script runs at the server end accessing the database(Figure 21.14). The CGI script generates a web page, which is then returned to theuser. Some of the vendor-specific solutions use essentially this approach but bypassthe web-server/CGI step by having their own special web server which accesses thedatabase directly using their own scripting language or templates.
The user interface of such systems is limited to standard HTML features. This is alimitation, but is at least consistent and means that it will work with virtually anybrowser. Java applets can offer more rapid surface interaction, but both have to waitfor the actual data to move between server and client. Of course, the pages generatedby a CGI script can themselves contain JavaScript or Java applets for local inter-action, so the difference between the two solutions is not so radical as first appears.
From a security angle, the database accessed from the CGI script can run on a sep-arate machine (using standard database remote access methods or even a Java/JDBCCGI program), thus making the system more secure. However, the database cannotbe entirely secure – if the web-server machine is compromised the CGI scripts canbe altered to corrupt or modify the database! The special vendor-specific web serversare probably more secure as they don’t require a standard web server to be running.
Figure 21.13 Java applet accesses database using JDBC
Figure 21.14 CGI script accesses database

21.6 Dynamic web content 785
21.6.6 Batch generation
A low-tech but very secure solution is to generate pages offline from a database and then upload them to the web server (Figure 21.15). Many of Alan’s earliest webpages were generated in this way from HyperCard stacks.
This is certainly a simple solution as it separates out the task of page generationfrom that of page delivery. Pages can be generated directly using many standarddatabase packages such as Access or HyperCard. Alternatively, standalone programsin languages such as Visual Basic, Java or C can access a database and output HTMLpages. These programs can run on a central computer, or on your own PC. The generating program simply produces a set of HTML pages on your own disk that canbe checked locally and then copied onto the web server using ftp or shared networkdisks. Many people think that this will be difficult, but in reality it is remarkably easy, as you can use the tools you are used to – if you can create a text file you cancreate HTML. In fact, the snippet of Visual Basic in Figure 21.16 is a trivial but fullyfunctioning HTML generator!
Figure 21.15 Batch pre-generation of web pages
Figure 21.16 Visual Basic code to generate a web page
Set db = openDatabase("C:\test.mdb");sql = "select Name, Address fromPersonnel;"Set query = db.OpenRecordset(sql)Open "out.html" For Output As #1
Print #1, "<h1>Address List</h1>"query.MoveFirstWhile Not query.EOFPrint #1, "<p>" & query("Name") & " ";
query("Address")query.MoveNext
Wend
Close #1query.Close

786 Chapter 21 n Hypertext, multimedia and the world wide web
Some web scripting languages can be used in this mode too. For example PHPallows you to send the page being generated into a buffer, which can then be savedto a file. This can be run on a separate machine, or on the web server itself. The latter sounds unnecessary; however, web servers are more efficient at delivering staticmaterial so this sort of batch generation can be used simply to improve efficiency.
As well as the ease of programming, the offline generation of web pages means thatthere is no need for an online connection between the web server and the database,so a breach in the security of the web server doesn’t compromise your database. Inaddition, it may mean that the web server can be configured without CGI scriptingenabled at all, which considerably increases its security.
The downside is that you can only show the indices and pages that you can pre-compute. So, you could use a product database to produce a pro-forma page for eachstock item, plus alphabetic and categorized lists, but you could not produce a speciallist based on a user’s own search criteria.
This low-tech solution is appropriate in many circumstances – whenever the paceof change is low (e.g. overnight or when periodic updates are acceptable), the vol-ume of data is not too large and no online searching is required. Even when some ofthese conditions don’t hold, it is possible to use the general approach. For example,searching can often be arranged by having a much cut-down database or index onthe web server with most pages pre-computed.
21.6.7 Dynamic content
The mechanisms we have been discussing manage the feedthrough when the databaseis updated by some non-web means. Perhaps the most ‘active’ web pages are thosewhere the content of the pages reacts to and is updateable by the web user.
If pages are generated from database content using either the Java-applet/JDBCmethod or the CGI method, the same mechanisms can as easily be used to update as to access the database. The feedback of changes to the user is thus effectivelyinstantaneous – you check for seat availability on the theatre web page, select a seat,enter your credit card details and not only is the seat booked, but you can see itchange from free to booked on the web page.
This sort of web application opens up many additional problems. You may needto add some form of login or authentication. If credit card numbers are supplied youneed to ensure that the web server is secure. Also, without care it is easy to designsolutions that accidentally book multiple seats if the user presses the back button andends up on what appears to be a simple confirmation screen.
If we consider an estate agent’s web page, with houses for sale and potential buyers, the situation is rather different. The pace of change is slow; house purchasestake place over days, weeks and months. A solution that automatically marked ahouse as sold would neither be necessary nor desirable! In this case a socio-technicalsolution using low-tech database generation would probably be sufficient. The webpage can have a contact telephone number, email address or message form. Queriesvia these channels (as well as non-web-based queries) come to the estate agent who
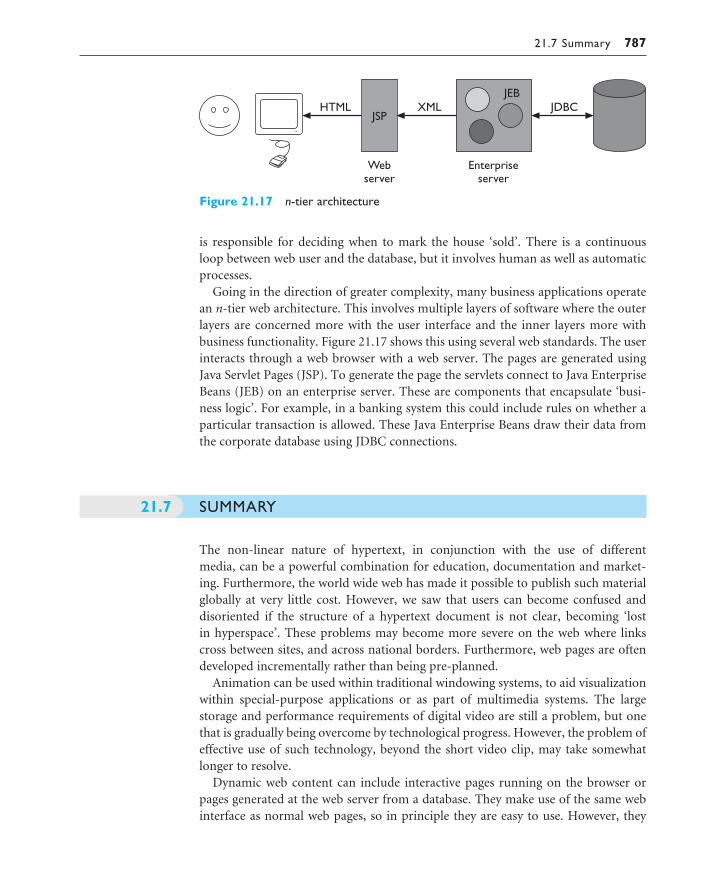
21.7 Summary 787
is responsible for deciding when to mark the house ‘sold’. There is a continuous loop between web user and the database, but it involves human as well as automaticprocesses.
Going in the direction of greater complexity, many business applications operatean n-tier web architecture. This involves multiple layers of software where the outerlayers are concerned more with the user interface and the inner layers more withbusiness functionality. Figure 21.17 shows this using several web standards. The userinteracts through a web browser with a web server. The pages are generated usingJava Servlet Pages (JSP). To generate the page the servlets connect to Java EnterpriseBeans (JEB) on an enterprise server. These are components that encapsulate ‘busi-ness logic’. For example, in a banking system this could include rules on whether aparticular transaction is allowed. These Java Enterprise Beans draw their data fromthe corporate database using JDBC connections.
SUMMARY
The non-linear nature of hypertext, in conjunction with the use of different media, can be a powerful combination for education, documentation and market-ing. Furthermore, the world wide web has made it possible to publish such material globally at very little cost. However, we saw that users can become confused and disoriented if the structure of a hypertext document is not clear, becoming ‘lost in hyperspace’. These problems may become more severe on the web where linkscross between sites, and across national borders. Furthermore, web pages are oftendeveloped incrementally rather than being pre-planned.
Animation can be used within traditional windowing systems, to aid visualizationwithin special-purpose applications or as part of multimedia systems. The large storage and performance requirements of digital video are still a problem, but onethat is gradually being overcome by technological progress. However, the problem ofeffective use of such technology, beyond the short video clip, may take somewhatlonger to resolve.
Dynamic web content can include interactive pages running on the browser orpages generated at the web server from a database. They make use of the same webinterface as normal web pages, so in principle they are easy to use. However, they
21.7
Figure 21.17 n-tier architecture
788 Chapter 21 n Hypertext, multimedia and the world wide web
pose additional usability challenges as the user has to understand what is static andwhat is changing content. Also, it is important to choose carefully where change ishappening, whether at the client PC or the web server, as this has a major impact on the nature of interaction, especially the pace of feedback.
The production of multimedia in the form of web pages is now feasible for mostcomputer users and is a good way of making demonstrations and prototypes pub-licly available. Have a go!
EXERCISES
21.1 Experiment with HyperCard or another hypertext system if you have access to one. Asyou work through the system, draw a map of the links and connections. Is it clear where you areand where you can get to at any point? If not, how could this be improved?
21.2 Do the same for this book’s website and tell us what you think!
21.3 What factors are likely to delay the widespread use of video in interfaces? What applications couldbenefit most from its use?
21.4 Using a graphics package such as Adobe Photoshop or Macromedia Fireworks save different typesof image (photographs, line drawings, text) in different formats (GIF, JPEG, PNG). Compare thefile sizes of the different formats, experimenting with different compression ratios (where appli-cable), numbers of colors, etc.
RECOMMENDED READING
E. J. Conklin, Hypertext: an introduction and survey, IEEE Computer, Vol. 20, No. 9, pp. 17–41, September 1987.A classic review of hypertext.
R. Bentley, U. Busbach, D. Kerr and K. Sikkel, editors, Groupware and the WorldWide Web, Kluwer, 1997.The web has become perhaps the most common platform for groupware systems.This collection includes seminal work in this area and covers most of the issuesthat are still current.
T. Boyle, Design for Multimedia Learning, Prentice Hall, 1997.Covers both educational aspects and multimedia design.
P. Greenspun, Philip and Alex’s Guide to Web Publishing, Morgan Kaufmann, 1999.Lovely photos and a strong focus on database-driven web publishing. (Alex prob-ably does his web searching using Lycos.)
J. Niederst, Learning Web Design: A Beginner’s Guide to HTML, Graphics, andBeyond, O’Reilly, 2001.

Reconmmended reading 789
J. Niederst, Web Design in a Nutshell, O’Reilly, 1998.Technically oriented introduction and reference guide for web page design.
A. Badre, Shaping Web Usability: Interaction Design in Context, Addison-Wesley,2002.
J. Nielsen, Designing Web Usability: The Practice of Simplicity, New Riders, 2000.
J. Spool, T. Scanlon, W. Schroeder, C. Snyder and T. DeAngelo, Web Site Usability:A Designer’s Guide, Morgan Kaufmann, 1999.Three different approaches to web usability. Badre takes a more traditional HCIand interaction design focus. Nielsen also comes from this angle, but with a moreutilitarian view. Spool is the ‘other’ web usability guru, but doesn’t like beingcalled one.
Recommendations for web design are rapidly changing, reflecting developing tech-nology and growing experience. This book’s web pages contain links to up-to-date online web style guides.


References
[1] G. Abowd. Agents: recognition and interaction models. In D. Diaper, D. Gilmore, G. Cockton and B. Shackel, editors, Human–Computer Interaction –Proceedings INTERACT’90, pages 143–6. North-Holland, Amsterdam, 1990.
[2] G. D. Abowd. Classroom 2000: an experiment with the instrumentation of aliving educational environment. IBM Systems Journal, 38(4):508–30, Special issue onHuman–Computer Interaction: a focus on pervasive computing, 1999.
[3] G. D. Abowd and R. Beale. Users, systems and interfaces: a unifying frame-work for interaction. In D. Diaper and N. Hammond, editors, HCI’91: People andComputers VI, pages 73–87. Cambridge University Press, Cambridge, 1991.
[4] G. D. Abowd, C. G. Atkeson, J. Brotherton, T. Enqvist, P. Gulley and J. LeMon.Investigating the capture, integration and access problem of ubiquitous computingin an educational setting. CHI’98 Conference Proceedings, pages 440–7, Los Angeles,ACM Press, 1998.
[5] G. D. Abowd, C. G. Atkeson, A. Feinstein, C. Hmelo, R. Kooper, S. Long, N.Sawhney and M. Tan. Teaching and learning as multimedia authoring: the classroom2000 project. In Proceedings of the ACM Conference on Multimedia – Multimedia’96,1996.
[6] G. D. Abowd, C. G. Atkeson, J. Hong, S. Long, R. Kooper and M. Pinkerton.Cyberguide: a mobile context-aware tour guide. ACM Wireless Networks, 3:421–33,1997.
[7] G. D. Abowd, A. Dey, R. Orr and J. Brotherton. Context-awareness in wear-able and ubiquitous computing. Technical Report GIT-GVU-97-11, GVU Center,Georgia Institute of Technology, June 1997.
[8] G. Abowd, H. Wang and A. Monk. A formal technique for automated dialoguedevelopment. In Proceedings of Designing Interactive Systems – DIS’95, pages 219–26.ACM Press, New York, 1995.
[9] ACM Special Interest Group on Computer–Human Interaction CurriculumDevelopment Group. ACM SIGCHI curricula for human–computer interaction.Technical report, ACM, New York, 1992.
[9a] C. Alexander, S. Ishikawa and M. Silverstein. A Pattern Language. OUP, NewYork, 1977.
792 References
[10] H. Alexander. Formally-based Tools and Techniques for Human–ComputerDialogues. Ellis Horwood, Chichester, 1987.
[11] D. G. Aliaga. Virtual objects in the real world. Communications of the ACM,40(3):49–54, 1997.
[12] J. Allanson. Electrophysiological interactive computer systems. IEEE Com-puter, pages 60–5, March 2002.
[13] L. Allinson and N. Hammond. A learning support environment: the hitch-hiker’s guide. In R. McAleese, editor, Hypertext: Theory into Practice. Intellect, 1993.
[14] J. R. Anderson. The Architecture of Cognition. Harvard University Press,Cambridge, MA, 1983.
[15] J. Annett and K. D. Duncan. Task analysis and training design. OccupationalPsychology, 41:211–21, 1967.
[16] Apple Research Laboratories. Apple data detectors homepage. Available athttp://www.research.apple.com/research/tech/AppleData Detectors/, 1997.
[17] A. Asthana, M. Cravatts and P. Krzyzanouski. An indoor wireless system for personalized shopping assistance. In L. Cabrera and M. Sattyanarayanan, editors,Workshop on Mobile Computing Systems and Applications, pages 69–74. IEEE Com-puter Society Press, December 1994.
[18] AT&T Laboratories. Sentient Computing Project Home Page, Cambridge,2002. http://www.uk.research.att.com/spirit/
[19] M. Bacigalupi. Designing movement in interactive multimedia: making itmeaningful. Interfaces, 44:12–15, autumn 2000.
[20] M. Back, J. Cohen, R. Gold, S. Harrison and S. Minneman. Listen reader: an electronically augmented paper-based book. In Proceedings of the 2001 ACMConference on Human Factors in Computing Systems – CHI 2001, pages 23–9, 2001.
[21] A. D. Baddeley. Human Memory: Theory and Practice, p. 68ff. LawrenceErlbaum Associates, Hove, 1990.
[22] A. D. Baddeley and D. J. A. Longman. The influence of length and frequencyof training sessions on rate of learning to type. Ergonomics, 21:627–35, 1978.
[23] R. W. Bailey. Human Performance Engineering: A Guide for System Designers.Prentice Hall, Englewood Cliffs, NJ, 1982.
[24] P. Barnard. Interacting cognitive subsystems: a psycholinguistic approach to short-term memory. In A. Ellis, editor, Progress in the Psychology of Language, volume 2, chapter 6. Lawrence Erlbaum Associates, Hove, 1985.
[25] P. Barnard. Cognitive resources and the learning of human–computerdialogs. In J. M. Carroll, editor, Interfacing Thought: Cognitive Aspects ofHuman–Computer Interaction, pages 112–58. MIT Press, Cambridge, MA, 1987.
[26] P. Barnard and J. May. Interactions with advanced graphical interfaces andthe deployment of latent human knowledge. In F. Paternó, editor, Proc. of Design,Specification and Verification of Interactive Systems, DSVIS’94. Springer-Verlag, 1995.
[27] P. Barnard, M. Wilson and A. MacLean. Approximate modelling of cognitiveactivity with an expert system: a theory-based strategy for developing an interactivedesign tool. The Computer Journal, 31(5):445–56, 1988.
References 793
[28] F. C. Bartlett. Remembering. Cambridge University Press, Cambridge, 1932.
[29] L. Bass and J. Coutaz. Developing Software for the User Interface. Addison-Wesley, New York, 1991.
[30] D. Bauer and C. R. Cavonius. Improving the legibility of visual display unitsthrough contrast reversal. In E. Grandjean and E. Vigliani, editors, Ergonomic Aspectsof Visual Display Units. Taylor and Francis, London, 1980.
[31] R. Beale and J. Finlay, editors, Neural Networks and Pattern Recognition inHuman–Computer Interaction. Ellis Horwood, Chichester, 1992.
[32] M. Begeman, P. Cook, C. Ellis, M. Graf, G. Rein and T. Smith. Project Nick:meetings augmentation and analysis. In D. Peterson, editor, CSCW’86: Conferenceon Computer Supported Cooperative Work, MCC Software Technology Program,Austin, Texas, 1986. ACM Press, New York.
[33] M. Beigl, H.-W. Gellersen and A. Schmidt. MediaCups: experience withdesign and use of computer-augmented everyday objects. Computer Networks,35(4):401–9, Special issue on Pervasive Computing, Elsevier, March 2001.
[34] R. Bentley, W. Appelt, U. Busbach, E. Hinrichs, D. Kerr, S. Sikkel, J. Trevorand G. Woetzel. Basic support for cooperative work on the world wide web.International Journal of Human–Computer Studies, 46(6):827–46, Special issue onInnovative Applications of the World Wide Web, Academic Press, June 1997.
[35] H. Beyer and K. Holtzblatt. Contextual Design: Defining Customer CenteredSystems, Morgan Kaufmann, 1998.
[36] M. Blattner, D. Sumikawa and R. Greenberg. Earcons and icons: their struc-ture and common design principles. Human–Computer Interaction, 4(1):11–44,1989.
[36a] B. W. Boehm. Verifying and validating software requirements and designspecifications. IEEE Software, January: 75–88, 1984.
[37] J. Borchers. A Pattern Approach to Interaction Design. John Wiley, Chichester,2001.
[38] W. A. Bousfield. The occurrence of clustering in recall of randomly arrangedassociates. Journal of General Psychology, 49:229–40, 1953.
[39] S. Bovair, D. E. Kieras and P. G. Polson. The acquisition and performance oftext-editing skill: a cognitive complexity analysis. Human–Computer Interaction,5(1):1–48, 1990.
[40] J. M. Bowers and S. D. Benford, editors, Studies in Computer SupportedCooperative Work. North-Holland, Amsterdam, 1991.
[41] J. Bowers, G. Button and W. Sharrock. Workflow from within and without:technology and cooperative work on the print industry shop floor. In Proc. ofECSCW’95, pages 51–66, Kluwer, 1995.
[42] J. Bowers and J. Churcher. Local and global structuring of computer medi-ated communication: developing linguistic perspectives on CSCW in COSMOS. InCSCW’88: Proceedings of the Conference on Computer-Supported Cooperative Work,pages 125–39, Portland, OR, 26–28 September 1988. ACM SIGCHI and SIGOIS,ACM, New York.

794 References
[43] T. Boyle. Design for Multimedia Learning. Prentice Hall, 1997.
[44] J. Breuker. EUROHELP. CEC, Brussels, 1991.
[45] S. A. Brewster. Non-speech auditory output. In J. Jacko and A. Sears, editors,The Human–Computer Interaction Handbook, chapter 12, pages 220–39. LawrenceErlbaum Associates, USA, 2002.
[46] S. Brewster and M. Zajicek. A new research agenda for older adults.Workshop held at HCI2002, South Bank University. 2002. Papers available at:http://www.dcs.gla.ac.uk/~stephen/workshops/utopia/index.shtml (last accessedMarch 2003).
[47] S. A. Brewster, P. C. Wright and A. D. N. Edwards. A detailed investigationinto the effectiveness of earcons. In G. Kramer, editor, Auditory Display, Sonification,Audification and Auditory Interfaces. Proceedings of the First International Conferenceon Auditory Display, pages 471–98. Santa Fe Institute, Santa Fe, NM, Addison-Wesley, 1992.
[48] J. A. Brotherton. eClass – Building, observing, and understanding the impactof capture and access in an educational domain. PhD thesis. College of Com-puting and GVU Center, Georgia Institute of Technology. 2001. Available at:http://www.jasonbrotherton.com/brothert/thesis/Thesis.pdf
[49] P. J. Brown. Triggering information by context. Personal Technologies,2(1):1–9, 1998.
[50] S. Bryson. Virtual environments in scientific visualisation. In R. A. Earnshawand D. Watson, editors, Animation and Scientific Visualisation, pages 113–22.Academic Press, London, 1993.
[51] V. Bush. As we may think. Atlantic Monthly, 176(1):101–8, 1945.
[52] W. Buxton. There’s more to interaction than meets the eye: some issues in manual input. In R. M. Baecker and W. A. S. Buxton, editors, Readings inHuman–Computer Interaction: A Multidisciplinary Approach. Morgan Kaufmann,San Francisco, 1987.
[53] W. Buxton. A three-state model of graphical input. In D. Diaper, D. Gilmore,G. Cockton and B. Shackel, editors, Human–Computer Interaction – INTERACT’90,pages 449–56. North-Holland, Amsterdam, 1990.
[54] J. Callahan, D. Hopkins, M. Weiser and B. Shneiderman. An empirical com-parison of pie vs. linear menus. In Proceedings of CHI’88, pages 95–100. ACM Press,New York, 1988.
[54a] W. B. Cannon. The James–Lange theory of emotions: A critical examinationand an alternative theory. American Journal of Psychology, 39: 106–24, 1927.
[55] S. K. Card, T. P. Moran and A. Newell. The keystroke-level model for userperformance with interactive systems. Communications of the ACM, 23:396–410,1980.
[56] S. K. Card, T. P. Moran and A. Newell. The Psychology of Human–ComputerInteraction. Lawrence Erlbaum Associates, Hillsdale, NJ, 1983.
[57] S. K. Card, G. G. Robertson and W. York. The WebBook and the WebForager: an information workspace for the world-wide web. In Proceedings ofCHI’96, pages 111–17. ACM Press, New York, 1996.

References 795
[58] J. M. Carroll. Minimalist design for active users. In B. Shackel, editor,Proceedings of IFIP Conference, Interact’84, pages 39–45. North-Holland,Amsterdam, 1984.
[59] J. M. Carroll. Infinite detail and emulation in an ontologically minimizedHCI. In J. C. Chew and J. Whiteside, editors, Empowering People – CHI’90 ConferenceProceedings, pages 321–7. ACM Press, New York, 1990.
[60] J. M. Carroll and C. Carrithers. Blocking learner errors in a training wheelssystem. Human Factors, 26:377–89, 1984.
[61] J. M. Carroll and T. P. Moran, editors, Human–Computer Interaction, 6(3 & 4)1991. Special journal double issue on design rationale.
[62] J. M. Carroll and M. B. Rosson. Deliberated evolution: stalking the viewmatcher in design space. Human–Computer Interaction, 6(3 & 4):281–318, 1991.
[63] L. Catledge and J. Pitkow. Characterising browsing strategies in the world-wide web. In Proceedings of the 3rd International World Wide Web Conference,Darmstadt, Germany. Published in Computer Networks and ISDN, 27, 1065–1073,Elsevier Science, 1995. Available at: http://www.igd.fhg.de/www/www95/papers/
[64] W. G. Chase and H. A. Simon. The mind’s eye in chess. In W. G. Chase, edi-tor, Visual Information Processing. Academic Press, New York, 1973.
[65] W. G. Chase and H. A. Simon. Perception in chess. Cognitive Psychology,4:55–81, 1973.
[66] P. B. Checkland. Systems Thinking, Systems Practice. John Wiley, Chichester,1981.
[67] Y. Chen, D. W. Clark, P. Cook, S. Damianakis, G. Essl, A. Finkelstein, T. Funkhouser, A. Klein, Z. Liu, E. Praun, R. Samanta, B. Shedd, J. P. Singh, G. Tzanetakis, K. Li, H. Chen and J. Zheng. Early experiences and challenges inbuilding and using a scalable display wall system. IEEE Computer Graphics andApplications, 20(4):671–80, 2000.
[68] K. Cheverst, K. Mitchell and N. Davies. Design of an object model for a context sensitive tourist guide. In Proceedings of Interactive Applications of MobileComputing – IMC’98, Rostock, Germany, November 1998. Available at:http://www.egd.igd.fhg.de/~imc98/proceedings.html
[69] K. Cheverst, N. Davies and K. Mitchell. The role of adaptive hypermediawithin a context-aware tourist guide. Communications of the ACM, Special issue onadaptive web-based systems and adaptive hypermedia, May 2002.
[70] K. Cheverst, D. Fitton and A. Dix. Exploring the evolution of office door dis-plays. In K. O’Hara, M. Perry, E. Churchill and D. Russell, editors, Public andSituated Displays: Social and Interactional Aspects of Shared Display Technologies,Kluwer, 2004.
[71] H. H. Clark and S. E. Brennan. Grounding in communication. In L. B.Resnick, J. Levine and S. D. Behreno, editors, Socially Shared Cognition. AmericanPsychological Association, Washington DC, 1991.
[72] H. H. Clark and E. F. Schaefer. Contributing to discourse. Cognitive Science,13:259–94, 1989.

796 References
[73] G. Cockton. Designing abstractions for communication control. In M.Harrison and H. Thimbleby, editors, Formal Methods in Human–ComputerInteraction, chapter 10. Cambridge University Press, Cambridge, 1990.
[74] A. M. Collins and M. R. Quillian. Retrieval time from semantic memory.Journal of Verbal Learning and Verbal Behaviour, 8:240–7, 1969.
[75] J. Conklin. Hypertext: an introduction and survey. Computer, pages 17–41,September, 1987.
[76] J. Conklin and M. L. Begeman. gIBIS: A tool for all reasons. Journal of theAmerican Society for Information Science, March, 1989.
[77] J. E. Conklin and K. C. Burgess Yakemovic. A process-oriented approach todesign rationale. Human–Computer Interaction, 6(3 & 4):357–91, 1991.
[78] G. F. Coulouris and H. W. Thimbleby. HyperProgramming. Addison-Wesley,Wokingham, 1993.
[79] J. Coutaz. Pac, an object oriented model for dialog design. In H. J. Bullingerand B. Shackel, editors, Human–Computer Interaction – INTERACT’87, pages 431–6. North-Holland, Amsterdam, 1987.
[80] J. Coutaz. Architectural design for user interfaces. In Proceedings of the 3rdEuropean Conference of Software Engineering, ESEC’91, 1991.
[81] L. Cowen, L. J. Ball and J. Delin. An eye-movement analysis of web-pageusability. In X. Faulkner, J. Finlay and F. Détienne, editors, People and ComputersXVI – Memorable Yet Invisible: Proceedings of HCI 2002. Springer-Verlag, London,2002.
[82] Csikszentimihalyi. Flow: The Psychology of Optimal Experience. Harper andRow, New York, 1990.
[83] A. Cypher. Eager: Programming repetitive tasks by example. In Reachingthrough Technology – CHI’91 Conference Proceedings, pages 33–9. ACM Press, NewYork, 1991.
[84] B. Damer, C. Kekenes and T. Hoffman. Inhabited digital spaces. In CommonGround – CHI’96 Conference Companion, pages 9–10. ACM Press, New York, 1996.
[85] C. Davenport and G. Weir. Plan recognition for intelligent advice and mon-itoring. In M. D. Harrison and A. F. Monk, editors, HCI’86: People and Computers II,pages 296–315. Cambridge University Press, Cambridge, 1986.
[86] A. Dearden, M. Harrison and P. Wright. Allocation of function: scenarios,context and the economics of effort. Int. J. of Human–Computer Studies,52(2):289–318, 2000.
[87] L. Degen, R. Mander and G. Salomon. Working with audio: integrating personal tape recorders and desktop computers. In Proceedings of ACM CHI’92Conference, pages 413–18, May 1992.
[88] A. D. DeGroot. Thought and Choice in Chess. Mouton, The Hague, 1965.
[89] A. D. DeGroot. Perception and memory versus thought. In B. Kleinmuntz,editor, Problem Solving. John Wiley, New York, 1966.
[90] A. Dey, G. D. Abowd, M. Pinkerton and A. Wood. Cyberdesk: a frameworkfor providing self-integrating ubiquitous software services. Technical Report GIT-GVU-97-10, GVU Center, Georgia Institute of Technology, June 1997.
References 797
[91] D. Diaper, editor, Task Analysis for Human–Computer Interaction. EllisHorwood, Chichester, 1989.
[92] D. Diaper. Task Analysis for Knowledge Descriptions (TAKD): the methodand an example. In D. Diaper, editor, Task Analysis for Human–Computer Inter-action, chapter 4, pages 108–59. Ellis Horwood, Chichester, 1989.
[93] A. J. Dix. Formal Methods for Interactive Systems, chapter 10. Academic Press,London, 1991.
[94] A. J. Dix. Status and events: static and dynamic properties of interactive sys-tems. In D. A. Duce, editor, Proceedings of the Eurographics Seminar: Formal Methodsin Computer Graphics, Marina di Carrara, Italy, 1991.
[95] A. Dix. Accelerators and toolbars: learning from the menu. In AdjunctProceedings of HCI’95, 1995.
[96] A. J. Dix. Closing the loop: modelling action, perception and information. InT. Catarci, M. F. Costabile, S. Levialdi and G. Santucci, editors, AVI’96 – AdvancedVisual Interfaces, pages 20–8. ACM Press, New York, 1996.
[97] A. Dix. Challenges for cooperative work on the web: an analytical approach.Computer-Supported Cooperative Work: The Journal of Collaborative Computing,6:135–56, 1997. Reprinted in R. Bentley, U. Busbach, D. Kerr and K. Sikkel, editors,Groupware and the World Wide Web. Kluwer, 1997.
[98] A. Dix. Welsh mathematician walks in cyberspace (the cartography ofcyberspace). (keynote). Proceedings of the Third International Conference onCollaborative Virtual Environments – CVE2000, pages 3–7, ACM Press.http://www.hcibook.com/alan/papers/CVE2000/
[99] A. Dix. Incidental interaction. 2002. Available online:http://www.hcibook.com/alan/topics/incidental/
[100] A. Dix. Managing the ecology of interaction. Proceedings of Tamodia 2002 –First International Workshop on Task Models and User Interface Design, Bucharest,Romania, 18–19 July 2002.
[101] A. Dix. Deconstructing experience – pulling crackers apart. In M. Blythe, A.Monk, K. Overbeeke and P. Wright, editors, Funology: From Usability to Enjoyment.Kluwer, 2003.
[102] A. Dix and G. Abowd. Modelling status and event behaviour of interactivesystems. Software Engineering Journal, 11(6):334–46, 1996.
[103] A. J. Dix and J. E. Finlay. AMO – the interface as medium. Poster sessions,HCI International’89, page 22, Boston, 1989. Available at: http://www.hcibook.com/alan/papers/amo89/
[104] A. Dix and R. Mancini. Specifying history and backtracking mechanisms. InP. Palanque and F. Paternó, editors, Formal Methods in Human–ComputerInteraction, pages 1–24. Springer-Verlag, London, 1997. Available at: http://www.hcibook.com/alan/papers/histchap97/
[105] A. Dix and D. Ramduny. Building and prototyping groupware. HCI’95Tutorial Notes, 1995.
[106] A. Dix, R. Beale and A. Wood. Architectures to make simple visualisationsusing simple systems. Proceedings of Advanced Visual Interfaces – AVI2000, pages51–60, ACM Press, 2000.
798 References
[107] A. Dix, J. Finlay and J. Hassell. Environments for cooperating agents:Designing the interface as medium. In J. Connolly and E. Edmonds, editors, CSCWand Artificial Intelligence, pages 23–37. Springer-Verlag, London, 1994.
[108] A. Dix, D. Ramduny-Ellis and J. Wilkinson. Trigger analysis – understand-ing broken tasks. In D. Diaper and N. Stanton, editors, The Handbook of Task Analysisfor Human–Computer Interaction. Lawrence Erlbaum Associates, 2003 (in press).
[109] P. Dourish. Where the Action Is: The Foundations of Embodied Interaction.MIT Press, 2001.
[110] A. Druin. Cooperative inquiry: developing new technologies for childrenwith children. Proceedings of CHI’99, pages 592–9, Pittsburgh, PA, 15–20 May, ACM,New York, 1999.
[111] E. Dubois, P. Gray and L. Nigay. ASUR++: a design notation for mobilemixed systems. In F. Paternó, editor, Proceedings of the 4th International Symposium,Mobile HCI 2002, pages 123–39, LNCS 2411, Springer-Verlag, 2002.
[112] A. T. Duchowski. Eye Tracking Methodology: Theory and Practice, Springer-Verlag, London, 2003.
[113] E. A. Dykstra and R. P. Carasik. Structure and support in cooperative environments: the Amsterdam conversation environment. International Journal ofMan-Machine Studies, 34:419–34, 1991.
[114] R. A. Earnshaw and D. Watson, editors, Animation and ScientificVisualisation. Academic Press, London, 1993.
[115] K. D. Eason. Information Technology and Organizational Change. Taylor andFrancis, London, 1988.
[116] K. D. Eason and S. Harker. An open systems approach to task analysis.Internal report, HUSAT Research Centre, Loughborough University of Technology,1989.
[117] H. Ebbinghaus. Uber das Gedactnis. Dunker, 1885. Translated by H. Ruyerand C. E. Bussenius, 1913, Memory, Teacher’s College, Columbia University.
[118] A. Edwards. Soundtrack: an auditory interface for blind users. Human–Computer Interaction, 4(1):45–66, 1989.
[119] A. D. N. Edwards, editor, Extra-ordinary Human–Computer Interaction.Cambridge University Press, Cambridge, 1993.
[120] A. D. N. Edwards and S. Holland, editors, Multimedia Interface Design inEducation. Springer-Verlag, Berlin, 1993.
[121] C. A. Ellis, S. J. Gibbs and G. L. Rein. Design and use of a group editor. In G. Cockton, editor, Proceedings of the IFIP Engineering for Human–ComputerInteraction Conference, pages 13–25. North-Holland, Amsterdam, 1990.
[122] C. A. Ellis, S. J. Gibbs and G. L. Rein. Groupware: some issues and experi-ences. Communications of the ACM, 34(1):38–58, January 1991.
[123] S. Elrod, R. Bruce, R. Gold, D. Goldberg, F. Halasz, W. Janssen, D. Lee, K. McCall, E. Pedersen, K. Pier, J. Tang and B. Welch. Liveboard: a large interactivedisplay supporting group meetings, presentations and remote collaboration. InProceedings of ACM CHI’92 Conference, pages 599–607, May 1992.

References 799
[124] D. C. Engelbart. A conceptual framework for the augmentation of man’sintellect. In P. W. Howerton and D. C. Weeks, editors, Vistas in InformationHandling, volume 1, pages 1–29. Spartan Books, Washington, DC, 1963.
[125] D. C. Engelbart and W. K. English. A research centre for augmenting humanintellect. In Proceedings Fall Joint Computing Conference, pages 395–410. Thompson,Washington, DC, December, 1968.
[126] J. Erlandson and J. Holm. Intelligent help systems. Information and SoftwareTechnology, 29(3):115–21, 1987.
[127] I. Essa and A. Pentland. A vision system for observing and extracting facialaction parameters, pages 76–83. IEEE Computer Society, 1994.
[128] I. Essa and A. Pentland. Facial expression recognition using a dynamicmodel and motion energy, pages 360–7. IEEE Computer Society, Cambridge, MA,1995.
[129] M. W. Eysenck and M. T. Keane. Cognitive Psychology: A Student’sHandbook. Lawrence Erlbaum Associates, Hillsdale, NJ, 1990.
[130] S. Feiner, B. MacIntyre and D. Seligmann. Knowledge-based augmentedreality. In Communications of the ACM, 36(7): 53–62, 1993.
[131] S. S. Fels and G. E. Hinton. Building adaptive interfaces with neural net-works: the glove-talk pilot study. In D. Diaper, D. Gilmore, G. Cockton and B. Shackel, editors, Proceedings of Interact’90, pages 683–7. North-Holland,Amsterdam, 1990.
[132] S. A. Fincher. The Pattern Gallery. 2000. Available at: http://www.cs.ukc.ac.uk/people/staff/saf/patterns/gallery.html (last accessed March 2003)
[133] G. Fischer, A. Lemke and T. Schwab. Knowledge-based help systems. InHuman Factors in Computing Systems CHI’85 Proceedings, pages 161–7, 1985.
[134] R. S. Fish, R. E. Kraut and B. L. Chalfonte. The VideoWindow system ininformal communications. In CSCW’90: Proceedings of the Conference on Computer-Supported Cooperative Work, pages 1–11, Los Angeles, October, 1990. ACM SIGCHIand SIGOIS, ACM Press, New York.
[135] P. M. Fitts and M. I. Posner. Human Performance. Wadsworth, Wokingham,1967.
[136] G. W. Fitzmaurice, H. Ishii and W. Buxton. Bricks: laying the foundationsfor graspable user interfaces. In Proceedings of the 1995 ACM Conference on HumanFactors in Computing Systems – CHI’95, pages 442–9, 1995.
[137] G. W. Fitzmaurice, S. Zhai and S. H. Chignell. Virtual reality for palmtopcomputers, Special issue on virtual worlds. ACM Transactions on InformationSystems, 11(3):197, 1993.
[138] J. Fogarty, J. Forlizzi and S. E. Hudson. Aesthetic information collages: generating decorative displays that contain information. In Proceedings of the 14thAnnual ACM Symposium on User Interface Software and Technology – UIST 2001,2001.
[139] A. Fox, B. Johanson, P. Hanrahan and T. Winograd. Integrating informationappliances into an interactive workspace. IEEE Computer Graphics and Applications,20(3), 2000.
800 References
[140] M. M. Gardiner and B. Christie, editors, Applying Cognitive Psychology toUser–Interface Design. John Wiley, Chichester, 1987.
[141] W. Gaver. Auditory icons: using sound in computer interfaces. Human–Computer Interaction, 2(2):167–77, 1986.
[142] W. Gaver. The sonicfinder: an interface that uses auditory icons. Human–Computer Interaction, 4(1):67–94, 1989.
[143] W. Gaver and A. Dunne. Projected realities: conceptual design for culturaleffect. In Proceedings of the 1999 ACM Conference on Human Factors in ComputingSystems – CHI’99, pages 600–7, Pittsburgh, PA, 1999.
[144] W. Gaver, A. Dunne and E. Pacenti. Design: cultural probes. In Interactions:New Visions of Human–Computer Interaction. ACM Inc., Danvers, MA, 1999.
[145] W. Gaver and R. Smith. Auditory icons in large-scale collaborative environ-ments. In D. Diaper, D. Gilmore, G. Cockton and B. Shackel, editors, Proceedings ofInteract’90, pages 735–40. North-Holland, Amsterdam, 1990.
[146] B. Gaver, T. Dunne and E. Pacenti. Design: cultural probes. Interactions,6(1):21–9, ACM Press, 1999.
[147] W. W. Gaver, R. B. Smith and T. O’Shea. Effective sounds in complex situa-tions: the ARKola simulation. In S. P. Robertson, G. M. Olson and J. S. Olson, edi-tors, Reaching Through Technology – CHI’91 Conference Proceedings, pages 85–90.Human Factors in Computing Systems, ACM Press, New York, April, 1991.
[148] H.-W. Gellersen, M. Beigl and H. Krull. The MediaCup: awareness technol-ogy embedded in an everyday object. Int. Sym. Handheld and Ubiquitous Computing– HUC99, Karlsruhe, Germany, 1999.
[149] M. L. Gick and K. J. Holyoak. Analogical problem solving. CognitivePsychology, 12:306–55, 1980.
[150] J. H. Goldberg and X. P. Kotval. Computer interface evaluation using eyemovements: methods and constructs. International Journal of Industrial Ergonomics,24:631–45, 1999.
[151] E. B. Goldstein. Sensation and Perception, 3rd edition. Wadsworth,Wokingham, 1989.
[152] J. D. Gould, S. J. Boies, S. Levy, J. T. Richards and J. Schoonard. The 1984Olympic message system: a test of behavioural principles of system design. In J. Preece and L. Keller, editors, Human–Computer Interaction, chapter 12. PrenticeHall, Hemel Hempstead, 1990.
[153] C. Gram and G. Cockton, editors, Design Principles for Interactive Software.Chapman and Hall, London, 1996.
[154] W. D. Gray, B. E. John and M. E. Atwood. The precis of Project Ernestine oran overview of a validation of GOMS. In P. Bauersfeld, J. Bennett and G. Lynch, edi-tors, Striking a Balance, Proceedings of the CHI’92 Conference on Human Factors inComputing Systems, pages 307–12. ACM Press, 1992.
[155] S. Greenberg, editor, Computer-Supported Cooperative Work and Groupware.Academic Press, New York, 1991.
[156] S. Greenberg and C. Fitchett. Phidgets: easy development of physical inter-faces through physical widgets. Proceedings of the 14th Annual ACM Symposium on

References 801
User Interface Software and Technology – UIST’01, pages 209–18, ACM Press, NewYork, 2001.
[157] S. Greenberg, J. Darragh, D. Maulsby and I. H. Witten. Predictive interfaces:What will they think of next? In A. D. N. Edwards, editor, Extra-ordinaryHuman–Computer Interaction. Cambridge University Press, Cambridge, 1993.
[158] R. L. Grossman, et al., editors, Hybrid Systems. LNCS 736, Springer-Verlag,1993.
[159] J. Grudin. Why CSCW application fail: problems in the design and evalua-tion of organizational interfaces. In CSCW’88: Proceedings of the Conference onComputer Supported Cooperative Work, pages 85–94, Portland, OR, 26–28September 1988. ACM SIGCHI and SIGOIS, ACM, New York.
[160] J. Grudin. The case against user interface consistency. Communications of theACM, 4(3):245–64, 1989.
[161] K. Hamnes. Smelly interfaces. A brief review of the application of smell inuser interfaces. Internal report, Future Media Group, Telenor R&D, Fornebu,Norway, 20 February 2002. www.telenor.no/fou/KH_olfactory_displays_200202.pdf
[162] W. J. Hansen. User engineering principles for interactive systems. In AFIPSConference Proceedings 39, pages 523–32, AFIPS Press, 1971. Reprinted in W. J.Hansen. User engineering principles for interactive systems. In D. R. Barstow, H. E.Shrobe and E. Sandewall, editors, Interactive Programming Environments, pages217–31. McGraw-Hill, New York, 1984.
[163] M. Harrison and H. Thimbleby, editors, Formal Methods in Human–Computer Interaction. Cambridge University Press, Cambridge, 1990.
[164] B. J. Harrison, K. P. Fishkin, A. Gujar, C. Mochon and R. Want. Squeeze me,hold me, tilt me! An exploration of manipulative user interfaces. Proceedings of the1998 ACM Conference on Human Factors in Computing Systems – CHI’98, pages17–24, May 1998.
[165] H. R. Hartson, A. C. Siochi and D. Hix. The UAN: a user-oriented represen-tation for direct manipulation. ACM Transactions on Information Systems,8(3):181–203, July 1990.
[166] The HCI Service, Department of Trade and Industry, UK. HCI Tools &Methods Handbook, 1991.
[167] M. Helander, editor, Handbook of Human–Computer Interaction. Part II:User Interface Design. North-Holland, Amsterdam, 1988.
[168] M. Helander, editor, Handbook of Human–Computer Interaction. Part V:Tools for Design and Evaluation. North-Holland, Amsterdam, 1988.
[169] D. Heller. XView Programming Manual, volume 7 of The X Window System.O’Reilly and Associates, Inc., Sebastopol, CA, 1990.
[170] T. Hemmings, A. Crabtree, T. Rodden, K. Clarke and M. Rouncefield.Domestic probes and the design process. Proceedings of the 11th European Conferenceon Cognitive Ergonomics, pages 187–93, Catania, Italy, European Association ofCognitive Ergonomics, 2002.
[171] B. Hewitt, N. Gilbert, M. Jirotka and S. Wilbur. Theories of multi-partyinteraction. Technical report, Social and Computer Sciences Research Group,

802 References
University of Surrey and Queen Mary and Westfield Colleges, University of London,1990.
[172] R. D. Hill, T. Brinck, S. L. Rohall, J. F. Patterson and W. Wilner. The ren-dezvous architecture and language for constructing multi-user applications. ACMTransactions on Computer–Human Interaction, 1(2):81–125, 1994.
[173] K. Hinckley, J. Pierce, M. Sinclair and E. Horvitz. Sensing techniques formobile interaction. In Proceedings of the 13th Annual ACM Symposium on UserInterface Software and Technology – UIST 2000, pages 91–100, 2000.
[174] D. Hindus and C. Schmandt. Ubiquitous audio: capturing spontaneous collaboration. In Proceedings of ACM CSCW’92 Conference, pages 210–17, 1992.
[175] D. Hindus, S. D. Mainwaring, A. E. Hagstrom, N. Leduc and O. Bayley.Casablanca: designing social communications devices for the home. In Proceedings ofthe 2001 ACM Conference on Human Factors in Computing Systems – CHI 2001, pages325–32, April 2001.
[176] D. Hix. Generations of user-interface management systems. IEEE Software,7(5):77–87, September 1990.
[177] D. Hobbs and D. Moore. Human–Computer Interaction, Pitman, 1998.
[178] L. F. Hodges, B. O. Rothbaum, R. Kooper, D. Opdyke, T. Meyer, M. North,J. J. de Graaff and J. Williford. Virtual environments for treating the fear of heights.IEEE Computer, 28(7):27–34, 1995.
[179] R. C. Houghton. On-line help systems: a conspectus. Communications of theACM, 27, 2, 1984.
[180] A. Howes and S. Payne. Display-based competence: towards user models formenu-driven interfaces. Int. J. of Man–Machine Studies, 33:637–55, 1990.
[181] R. E. Hubbard. Molecular graphics: from pen plotter to virtual reality. In A.Monk, D. Diaper and M. D. Harrison, editors, HCI’92: People and Computers VII,pages 21–7. Cambridge University Press, Cambridge, 1992.
[182] D. A. Huffman. A method for the construction of minimum-redundancycodes. Proceedings of the IRE, 40, 1952.
[183] J. Hughes, J. O’Brien, M. Rouncefield, I. Sommerville and T. Rodden.Presenting ethnography in the requirements process. In Proc. IEEE Conf. on Require-ments Engineering, RE’95. pages 27–34, IEEE Press, 1995.
[184] G. Humphreys and P. Hanrahan. A distributed graphics system for largetiled displays. In Proceedings of IEEE Visualization, 1999.
[185] E. Hutchins. The technology of team navigation. In J. Gallagher, R. Krautand C. Egido, editors, Intellectual Teamwork: Social and Technical Bases ofCollaborative Work. Lawrence Erlbaum Associates, Hillsdale, NJ, 1990.
[186] E. Hutchins. Cognition in the Wild. MIT Press, Cambridge, MA, 1995.
[187] E. L. Hutchins, J. D. Hollan and D. A. Norman. Direct manipulation inter-faces. In D. A. Norman and S. W. Draper, editors, User Centered System Design, pages87–124. Lawrence Erlbaum Associates, Hillsdale, NJ, January, 1986.
[188] H. Ishii and N. Miyake. Towards an open shared workspace: computer andvideo fusion approach of TeamWorkStation. Communications of the ACM,34(12):37–50, December 1991.

References 803
[189] H. Ishii and B. Ullmer. Tangible bits: towards seamless interfaces betweenpeople, bits and atoms. In Proceedings of CHI’97, pages 234–41, May 1997.
[190] H. Ishii, C. Wisneski, S. Brave, A. Dahley, M. Gorbet, B. Ullmer and P. Yarin.ambientROOM: integrating ambient media with architectural space. Short paper. InProceedings of the 1998 ACM Conference on Human Factors in Computing Systems –CHI’98, Companion Proceedings, pages 173–4, 1998.
[191] R. J. K. Jacob. Survey and examples of specification techniques for user–computer interfaces. Technical report, Naval Research Laboratory, Washington, DC, 1983.
[192] B. E. John. Extensions of GOMS analyses to expert performance requiringperception of dynamic visual and auditory information. In J. C. Chew and J.Whiteside, editors, Empowering People – Proceedings of CHI’90 Human Factors inComputer Systems, pages 107–15. ACM Press, 1990.
[193] P. Johnson. Human–Computer Interaction: Psychology, Task Analysis andSoftware Engineering. McGraw-Hill, London, 1992.
[194] C. W. Johnson. Ten golden rules for video over the web. In J. Ratner, E.Grosse and C. Forsythe, editors, Human Factors for World Wide Web Development,pages 207–24. Lawrence Erlbaum, 1997.
[194a] C. W. Johnson. The impact of utility and time on distributed informationretrieval. In H. Thimbleby, B. O’Conaill and P. Thomas, editors, People andComputers XII: Proceedings of HCI’97, pages 191–204. Springer-Verlag, 1997.
[195] W. Johnson, H. Jellinek, L. Klotz Jr, R. Rao and S. Card. Bridging the paperand electronic worlds: the paper user interface. In S. Ashlund, K. Mullet, A.Henderson, E. Hollnegel and T. White, editors, INTERCHI’93 ConferenceProceedings, pages 507–12. ACM Press, New York, 1993.
[196] P. W. Jordan, S. W. Draper, K. K. MacFarlane and S.-A. McNulty.Guessability, learnability and experienced user performance. In D. Diaper and N. Hammond, editors, HCI’91: People and Computers VI, pages 237–45. BritishComputer Society Special Interest Group on Human–Computer Interaction,Cambridge University Press, Cambridge, 1991.
[196a] D. J. Kasik. A user interface management system. Computer Graphics, 16(3),July, 1982.
[197] A. Kay and A. Goldberg. Personal dynamic media. IEEE Computer,10(3):31–42, March 1977.
[198] J. N. Kaye. Symbolic olfactory display. Unpublished Master of Science thesis,Massachusetts Institute of Technology, Cambridge, Boston, MA. Available:http://web.media.mit.edu/~jofish/thesis/
[199] D. E. Kieras and P. G. Polson. An approach to the formal analysis of usercomplexity. International Journal of Man-Machine Studies, 22:365–94, 1985.
[200] M. Kirby. Custom manual. Technical Report DPO/STD/1.0, HCI ResearchCentre, University of Huddersfield, 1991.
[201] C. Knowles. Can cognitive complexity theory (CCT) produce an adequatemeasure of system usability? In D. M. Jones and R. Winder, editors, HCI’88: Peopleand Computers IV, pages 291–307. Cambridge University Press, Cambridge, 1988.
[202] W. Kohler. The Mentality of Apes, 2nd edition. Harcourt Brace, New York,1927.
804 References
[203] G. E. Krasner and S. T. Pope. A cookbook for using the model-view-controller user interface paradigm in Smalltalk-80. JOOP, 1(3), August, 1988.
[204] M. Kutar, C. Britton and C. Nehaniv. Specifiying multiple time granularitiesin interactive systems. In P. Palanque and F. Paternó, editors, DSV-IS 2000Interactive Systems: Design, Specification and Verification. LNCS 1946, pages 169–90,Springer-Verlag, 2001.
[205] J. E. Laird, A. Newell and P. Rosenbloom. Soar: an architecture for generalintelligence. Artificial Intelligence, 33:1–64, 1987.
[206] K. Larson and M. Czerwinski. Web page design: implications of memory,structure and scent for information retrieval. In Proceedings of CHI 98, HumanFactors in Computing Systems, pages 25–32, Los Angeles, 21–23 April 1998, ACMPress.
[207] B. Laurel. Computers as Theatre. Addison-Wesley, Reading, MA, 1991.
[208] J. Lave. Cognition in Practice: Mind, Mathematics and Culture in EverydayLife. Cambridge University Press, Cambridge, 1988.
[209] J. Lee and K.-Y. Lai. What’s in a design rationale. Human–ComputerInteraction, 6(3 & 4):251–80, 1991.
[210] M. D. P. Leland, R. S. Fish and R. E. Kraut. Collaborative document pro-duction using Quilt. In CSCW’88: Proceedings of the Conference on ComputerSupported Cooperative Work, pages 206–15, Portland, OR, 26–28 September 1988.ACM SIGCHI and SIGOIS, ACM, New York.
[211] L. Lemay, J. M. Duff and J. C. Mohl. Laura Lemay’s Web Workshop: Graphicsand Web Page Design. Sams.net, 1997.
[212] S. Lewis. The Art and Science of Smalltalk. Hewlett-Packard ProfessionalBooks, Prentice Hall, Hemel Hempstead, 1995.
[213] C. Lewis and J. Rieman. Task-centered User Interface Design: A PracticalIntroduction. A shareware book published by the authors. Original files for the bookare available by FTP from ftp.cs.colorado.edu, 1993.
[214] A. Light. Interaction at the producer–user interface: an interdisciplinaryanalysis of communication and relationships through interactive components onwebsites for the purpose of improving design. PhD thesis, University of Sussex, UK,2000.
[215] Q. Limbourg, C. Pribeanu and J. Vanderdonckt. Towards uniformed taskmodels in a model-based approach. In Proc. DSV-IS 2001, pages 164–82, Springer-Verlag, 2001.
[216] S. Long, D. Aust, G. D. Abowd and C. G. Atkeson. Rapid prototyping ofmobile context-aware applications: the cyberguide case study. In Proceedings of the1996 Conference on Human Factors in Computing Systems – CHI’96, 1996. Short paper.
[217] S. Long, R. Kooper, G. D. Abowd and C. G. Atkeson. Rapid prototyping ofmobile context-aware applications: the cyberguide case study. In Proceedings of the2nd Annual International Conference on Mobile Computing and Networking,November 1996.
[218] A. C. Long, Jr, S. Narayanaswamy, A. Burstein, R. Han, K. Lutz, B. Richards,S. Sheng, R. W. Brodersen and J. Rabaey. A prototype user interface for a mobile

References 805
multimedia terminal. In Proceedings of the 1995 Conference on Human Factors inComputing Systems – CHI’95, 1995. Interactive experience demonstration.
[219] L. MacCaulay, C. Fowler, M. Kirby and A. Hutt. USTM: a new approach torequirements specification. Interacting with Computers, 2(1):92–108, 1990.
[220] W. E. Mackay. EVA: an experimental video annotator for symbolic analysisof video data. SIGCHI Bulletin: Special issue on video as a research and design tool,21(1):68–71, 1989.
[221] I. S. MacKenzie, A. Sellen and W. Buxton. A comparison of input devices in elemental pointing and dragging tasks. In S. P. Robertson, G. M. Olson and J. S. Olson, editors, Reaching through Technology – CHI’91 Conference Proceedings,pages 161–6. Human Factors in Computing Systems, ACM Press, New York, April1991.
[222] A. MacLean, R. M. Young, V. M. E. Bellotti and T. P. Moran. Questions,options, and criteria: elements of design space analysis. Human–ComputerInteraction, 6(3 & 4):201–50, 1991.
[223] M. Macleod and R. Rengger. The development of DRUM: a software tool for video assisted usability evaluation. In People and Computers VIII Proceedings ofHCI’93. Cambridge University Press, Cambridge, 1993.
[224] N. R. F. Maier. Reasoning in humans II: the solution of a problem and itsappearance in consciousness. Journal of Comparative Psychology, 12:181–94, 1931.
[225] T. W. Malone, K. R. Grant, K. Lai, R. Rao and D. Rosenblitt. Semistructuredmessages are surprisingly useful for computer supported coordination. ACMTransactions on Office Information Systems, 5(2):115–31, 1987.
[226] M. Mantei. Capturing the capture lab concepts: a case study in the design of computer supported meeting environments. In CSCW’88: Proceedings of theConference on Computer-Supported Cooperative Work, pages 257–70, Portland, OR,26–28 September 1988. ACM SIGCHI and SIGOIS, ACM, New York.
[227] A. Marcus. Graphic Design for Electronic Documents and User Interfaces.ACM Press Tutorial Series, New York, 1992.
[228] M. V. Mason. Adaptive command prompting in an on-line documentationsystem. International Journal of Man–Machine Studies, 25(1):33–51, 1986.
[229] M. Massink, D. Duke and S. Smith. Towards hybrid interface specificationfor virtual environments. In D. J. Duke and A. Puerta, editors, DSV-IS 1999 Design,Specification and Verification of Interactive Systems, pages 30–51, Springer-Verlag,1999.
[230] D. J. Mayhew. Principles and Guidelines in Software and User Interface Design.Prentice Hall, Englewood Cliffs, NJ, 1992.
[231] R. J. McCall. PHI: A conceptual foundation for design hypermedia. DesignStudies, 12(1):30–41, 1991.
[232] J. A. McDermid, editor, The Software Engineer’s Reference Book.Butterworth–Heinemann, Oxford, 1991.
[233] A. Mével and T. Guéguen. Smalltalk-80. Macmillan Education, Basingstoke,1987.

806 References
[234] G. A. Miller. The magical number seven, plus or minus two: some limits onour capacity to process information. Psychological Review, 63(2):81–97, 1956.
[235] S. Minneman, S. Harrison, B. Janseen, G. Kurtenbach, T. Moran, I. Smithand B. van Melle. A confederation of tools for capturing and accessing collaborativeactivity. In Proceedings of the ACM Conference on Multimedia – Multimedia’95,November 1995.
[236] A. Monk, editor, Fundamentals of Human–Computer Interaction. AcademicPress, London, 1985.
[237] A. F. Monk. Mode errors: a user-centred analysis and some preventativemeasures using keying contingent sound. International Journal of Man–MachineStudies, 24, 1986.
[238] A. F. Monk and N. Gilbert, editors, Perspectives on HCI: Diverse Approaches.Academic Press, London, 1995.
[239] A. F. Monk and S. Howard. The rich picture: a tool for reasoning about workcontext. ACM Interactions, 5(2), 21–30, 1998.
[240] A. Monk, P. Wright, J. Haber and L. Davenport. Improving your Human–Computer Interface: A Practical Approach. Prentice Hall International, HemelHempstead, 1993.
[241] T. Moran, P. Chiu, S. Harrison, G. Kurtenbach, S. Minneman and W. vanMelle. Evolutionary engagement in an ongoing collaborative work process: a casestudy. In Proceedings of ACM CSCW’96 Conference, November 1996.
[242] M. J. Muller. PICTIVE: an exploration in participatory design. Proceedings ofthe SIGCHI Conference on Human Factors in Computing Systems: Reaching throughTechnology, pages 225–31, 27 April–2 May, New Orleans, LA, 1991.
[243] E. Mumford. Designing Participatively. Manchester Business SchoolPublications, Manchester, 1983.
[244] P. Muter, S. A. Latremouille, W. C. Treurniet and P. Beam. Extended read-ing of continuous text on television screens. Human Factors, 24:501–8, 1982.
[245] B. A. Myers. Creating User Interfaces by Demonstration. Academic Press, NewYork, 1988.
[246] B. A. Myers. User-interface tools: Introduction and survey. IEEE Software,6(1):47–61, January 1989.
[247] B. A. Myers and M. B. Rosson. Survey on user interface programming. In P. Bauersfeld, J. Bennett and G. Lynch, editors, CHI’92 Conference Proceedings onHuman Factors in Computing Systems, pages 195–202. ACM Press, New York, 1992.
[248] E. D. Mynatt. The writing on the wall. In A. Sasse and C. Johnson, editors,Human–Computer Interaction – INTERACT’99, IFIP TC.13, IOS Press, 1999.
[249] E. D. Mynatt, M. Back, R. Want, M. Baer and J. Ellis. Designing audio aura.In Proceedings of the 1998 ACM Conference on Human Factors in Computing Systems– CHI’98, pages 566–73, Los Angeles, CA, 1998.
[250] E. D. Mynatt, T. Igarashi, W. K. Edwards and A. LaMarca. Flatland: newdimensions in office whiteboards. In Proceedings of the 1999 ACM Conference onHuman Factors in Computing Systems – CHI’99, 1999.

References 807
[251] E. D. Mynatt, J. Rowan, S. Craighill and A. Jacobs. Digital family portraits:providing peace of mind for extended family members. In Proceedings of the 2001ACM Conference on Human Factors in Computing Systems – CHI 2001, pages 333–40,April 2001.
[252] B. Nardi, editor, Context and Consciousness: Activity Theory and Human–Computer Interaction. MIT Press, Cambridge, MA, 1996.
[253] D. Navarre, P. Palanque, F. Paternó, C. Santoro and R. Bastide. A tool suitefor integrating task and system models through scenarios. In C. Johnson, editor,DSV-IS 2001 Interactive Systems: Design, Specification and Verification. LNCS 2220,pages 88–113, Springer-Verlag, 2001.
[254] C. M. Neuwirth, D. S. Kaufer, R. Chandhok and J. H. Morris. Issues in the design of computer support for co-authoring and commenting. In CSCW’90:Proceedings of the Conference on Computer-Supported Cooperative Work, pages 183–95, Los Angeles, October, 1990. ACM SIGCHI and SIGOIS, ACM, New York.
[255] A. Newell and H. Simon. Human Problem Solving. Prentice Hall, EnglewoodCliffs, NJ, 1972.
[256] A. F. Newell, J. L. Arnott, A. Y. Cairns, I. W. Ricketts and P. Gregor.Intelligent systems for speech and language impaired people: a portfolio of research.In A. D. N. Edwards, editor, Extra-ordinary Human–Computer Interaction. Cam-bridge University Press, Cambridge, 1993.
[257] A. Newell, G. Yost, J. E. Laird, P. S. Rosenbloom and E. Altmann.Formulating the problem-space computational model. In R. F. Rashid, editor, CMUComputer Science: a 25th Anniversary Commemorative, chapter 11. ACM Press, NewYork, 1991.
[258] W. M. Newman. A system for interactive graphical programming. InProceedings of the 1968 Spring Joint Computer Conference, pages 47–54. AmericanFederation of Information Processing Societies, 1969.
[259] W. Newman, M. Eldridge and M. Lamming. Pepys: generating autobiogra-phies by automatic tracking. In Proceedings of the Second European Conference onComputer Supported Cooperative Work – ECSCW’91, pages 175–88, 25–27September, Kluwer Academic Publishers, Amsterdam, 1991.
[260] J. Nielsen. Usability Engineering. Academic Press, New York, 1992.
[261] J. Nielsen. The usability engineering life cycle. IEEE Computer, 25(3):12–22,March 1992.
[262] J. Nielsen. Heuristic evaluation. In Usability Inspection Methods. John Wiley,New York, 1994.
[263] J. Nielsen. Why frames suck (most of the time). 1996. Available at:http://www.useit.com/alertbox/9612.html
[264] J. Nielsen and T. K. Landauer. A mathematical model of the finding ofusability problems. Proceedings of ACM INTERCHI’93 Conference, pages 206–13,Amsterdam, The Netherlands, 24–29 April 1993.
[265] D. A. Norman. The Psychology of Everyday Things. Basic Books, New York, 1988.
[266] D. Norman. The Design of Everyday Things. Doubleday, New York, 1990.

808 References
[267] D. A. Norman. Turn Signals are the Facial Expressions of Automobiles.Addison-Wesley, Reading, MA, 1992.
[268] D. A. Norman. Things That Make Us Smart. Addison-Wesley, Reading, MA,1993.
[269] D. Norman. The Invisible Computer. MIT Press, Cambridge, MA, 1998.
[270] D. A. Norman and S. W. Draper, editors, User-Centered System Design: NewPerspectives on Human–Computer Interaction. Lawrence Erlbaum Associates,Hillsdale, NJ, 1986.
[271] C. North and F. Korn. Browsing anatomical image databases: a case study ofthe Visible Human. In CHI’96 Conference Companion, pages 414–15. ACM Press,New York, 1996.
[272] D. R. Olsen. Propositional Production Systems for Dialog description. In J.C. Chew and J. Whiteside, editors, Empowering People – CHI’90 ConferenceProceedings, pages 57–63. Human Factors in Computing Systems, ACM Press, NewYork, 1990.
[273] D. Olsen. User Interface Management Systems: Models and Algorithms.Morgan Kaufmann, San Francisco, 1991.
[274] J. S. Olson, G. M. Olson, L. A. Mack and P. Wellner. Concurrent editing: thegroup’s interface. In D. Diaper, D. Gilmore, G. Cockton and B. Shackel, editors,Human–Computer Interaction – INTERACT’90, pages 835–40. North-Holland,Amsterdam, 1990.
[275] Open Software Foundation. OSF/Motif Style Guide. Prentice Hall, HemelHempstead, 1991.
[276] P. Palanque and R. Bastide. Petri net based design of user-driven interfacesusing the interactive cooperating objects formalism. In F. Paternó, editor, InteractiveSystems: Design, Specification and Verification (1st Eurographics Workshop, Bocca diMagra, Italy, June 1994), pages 215–28. Springer-Verlag, Berlin, 1995.
[277] P. Palanque and R. Bastide. Formal specification and verification of CSCW.In M. A. R. Kirby, A. J. Dix and J. E. Finlay, editors, People and Computers X –Proceedings of the HCI’95 Conference, pages 213–31. Cambridge University Press,Cambridge, 1996.
[278] M. Pandit and S. Kalbag. The selection recognition agent: instant access torelevant information and operations. In Proceedings of Intelligent User Interfaces’97.ACM Press, 1997.
[279] D. L. Parnas. On the use of transition diagrams in the design of a user inter-face for an interactive computer system. In Proceedings of the 1969 ACM NationalConference, pages 379–85, 1969.
[280] F. Paternó. Model-based Design and Evaluation of Interactive Applications.Springer-Verlag, 1999.
[281] F. Paternó and P. Palanque, editors, Formal Methods in Human–ComputerInteraction. Springer-Verlag, Berlin, 1997.
[282] R. Pausch. Virtual reality on five dollars a day. In Reaching throughTechnology – CHI’91 Conference Proceedings, pages 265–70. ACM Press, New York,1991.

References 809
[283] S. J. Payne. Understanding calendar use. Human–Computer Interaction,8(2):83–100, 1993.
[284] S. J. Payne and T. R. G. Green. Task-action grammars: a model of mentalrepresentation of task languages. Human–Computer Interaction, 2(2):93–133, 1986.
[285] G. Pfaff and P. J. W. ten Hagen, editors, Seeheim Workshop on User InterfaceManagement Systems. Springer-Verlag, Berlin, 1985.
[286] Philips Corporate Design. Vision of the future. 1996. Available at:http://www.design.philips.com/vof/
[287] R. Picard. Affective computing. Technical Report 321, MIT Media Lab,Perceptual Computing, November 1995. Available as MIT Media Lab PerceptualComputing Techreport #362 from http://vismod.www.media.mit.edu/vismod/
[288] R. W. Picard. Affective Computing. MIT Press, Cambridge, MA, 1997.
[289] P. Pirolli and S. K. Card. Information foraging. Psychological Review,106(4):643–75, 1999.
[290] I. Pitt and A. Edwards. Navigating the interface by sound for blind users. InD. Diaper and N. Hammond, editors, HCI’91: People and Computers VI, pages373–83. British Computer Society Special Interest Group on Human–ComputerInteraction, Cambridge University Press, Cambridge, 1991.
[291] C. Plaisant, B. Milash, A. Rose, S. Widoff and B. Shneiderman. Lifelines:visualising personal histories. In Proceedings of CHI’96, page 221–7. ACM Press, NewYork, 1996.
[292] M. J. Plasmeijer. Input tools – a language model for interaction and processcommunication. Technical report, Katholieke Universiteit Nijmegen, 1981.
[293] M. E. Pollack. Information sought and information provided: an empiricalstudy of user/expert dialogues. In L. Borman and B. Curtis, editors, Proceedings ofCHI’85, pages 155–60. ACM Press, New York, 1985.
[294] P. Polson, C. Lewis, J. Rieman and C. Wharton. Cognitive walkthroughs: A method for theory-based evaluation of user interfaces. International Journal ofMan–Machine Studies, 36:741–73, 1992.
[295] L. R. Posner, R. M. Baecker and M. M. Mantei. How people write together.Technical report, Computer Systems Research Institute and Department ofComputer Science, University of Toronto, 6 Kings College Road, Toronto, Ontario,M5S 1A1, Canada, 1991.
[296] L. Postman and L. W. Phillips. Short-term temporal changes in free recall.Quarterly Journal of Experimental Psychology, 17:132–8, 1965.
[297] C. Potts and G. Bruns. Recording the reasons for design decisions. InProceedings of 10th International Conference on Software Engineering, pages 418–27,1988.
[298] J. R. Quinlan. Discovering rules by induction from large collections of data.In D. Michie, editor, Expert Systems in the Micro-Electronic Age. EdinburghUniversity Press, Edinburgh, 1979.
[299] D. Ramduny and A. Dix. Why, what, where, when: architectures for co-operative work on the WWW. Proceedings of HCI’97, pages 283–301, Bristol,

810 References
UK, Springer-Verlag, 1997. Available at: http://www.hcibook.com/alan/papers/WWWW97/
[300] J. C. Read, S. J. MacFarlane and C. Casey. Measuring the usability of textinput methods for children. In Proceedings of HCI2001, pages 559–72, Lille, France,Springer-Verlag, 2001.
[301] P. Reisner. Formal grammar and human factors design of an interactivegraphics system. IEEE Transactions on Software Engineering, SE-7(2):229–40, 1981.
[302] J. Rekimoto. Pick-and-drop: a direct manipulation technique for multiplecomputer environments. In Proceedings of the ACM Symposium on User InterfaceSoftware and Technology – UIST’97, pages 31–9, 1997.
[303] J. Rekimoto and N. Katashi. The world through the computer: computeraugmented interaction with real world environments. Proceedings of the ACMSymposium on User Interface Software and Technology – UIST’95, pages 29–36, 1995.
[304] P. Resnick and H. R. Varian, guest editors, CACM, 40(3):56–89, Specialissue on Recommender Systems, 1997.
[305] H. Rheingold. Tools for Thought. Prentice Hall, Englewood Cliffs, NJ, 1985.
[306] E. Rich and K. Knight. Artificial Intelligence, 2nd edition. McGraw-Hill, NewYork, 1991.
[307] J. Riegelsberger and M. A. Sasse. Designing e-commerce applications forconsumer trust. In O. Petrovic, editor, Vertrauen in der vernetzten Wirtschaft/Trustin the Network Economy. Evolaris, Vol. 2, Springer-Verlag, April 2003.
[308] H. Rittel and W. Kunz. Issues as elements of information systems. Workingpaper #131, Institut für Grundlagen der Planung I.A., University of Stuttgart, 1970.
[309] C. Roast and J. Siddiqi, editors, FAHCI/Formal Aspects of the Human–Computer Interface. Springer-Verlag, London, 1996.
[310] G. G. Robertson, S. K. Card and J. D. Mackinlay. Cone trees: animated 3Dvisualisation of hierarchical information. In Proceedings of CHI’91 Conference ofHuman Factors in Computing Systems, pages 184–94. ACM Press, New York, 1991.
[311] C. Robson. Experiment, Design and Statistics in Psychology, 2nd edition.Penguin, Harmondsworth, 1985.
[312] T. Rodden. A survey of CSCW systems. Interacting with Computers,3(3):319–53, 1991.
[312a] S. Schacher and J. Singer. Cognitive, social and psychological determinantsof emotional state. Psychological Review, 69: 379–99, 1962.
[313] F. Schiele and T. Green. HCI formalisms and cognitive psychology: the caseof task-action grammars. In M. Harrison and H. Thimbleby, editors, FormalMethods in Human–Computer Interaction, chapter 2. Cambridge University Press,Cambridge, 1990.
[314] A. Schill. Cooperative Office Systems. Prentice Hall, 1995.
[315] A. Schmidt. Implicit Human–Computer Interaction Through Context.Personal Technologies, 4(2 & 3):191–99, June 2000.

References 811
[316] J. A. V. Serrano and U. Kirchhoff. A novel methodology for world-bestteamwork in hospitals. In B. Standford-Smith and P. T. Kidd, editors, E-business, KeyIssues, Applications and Technologies, IOS Press, ISBN 1 58603 089 2, 2000.
[317] K. Severinson Eklundh. Dialog processes in computer-mediated communi-cation: a study of letters in the com system. Technical report, Linkoping Studies inArts and Science, 1986.
[318] A. Shepherd. Analysis and training in information technology tasks. In D.Diaper, editor, Task Analysis for Human–Computer Interaction, chapter 1, pages15–55. Ellis Horwood, Chichester, 1989.
[319] J. G. Sheridan and J. Allanson. PICK – a scenario-based approach to sensorselection for interactive applications. Proceedings of the 10th International Conferenceon Human–Computer Interaction, 22–27 June, Crete, Greece, 2003.
[320] B. Shneiderman. The future of interactive systems and the emergence ofdirect manipulation. Behaviour and Information Technology, 1(3):237–56, 1982.
[321] B. Shneiderman. Designing the User Interface: Strategies for EffectiveHuman–Computer Interaction. Addison-Wesley, New York, 1987.
[322] SIGCHI Bulletin, Special issue on video as a research and design tool, 21(2),1989.
[323] T. Simon. Analysing the scope of cognitive models in human–computerinteraction: a trade-off approach. In D. M. Jones and R. Winder, editors, HCI’88:People and Computers IV, pages 79–93. Cambridge University Press, Cambridge,1988.
[324] R. B. Smith. The alternate reality kit – an animated environment for creatinginteractive simulations. In Proceedings of Workshop on Visual Languages, pages99–106, Dallas, TX, June, 1986. IEEE, New York.
[325] S. L. Smith and J. N. Mosier. Guidelines for designing user interface soft-ware. Mitre Corporation Report MTR-9420, Mitre Corporation, 1986.
[326] R. B. Smith, T. O’Shea, C. O’Malley, E. Scanlon and J. Taylor. Preliminaryexperiments with a distributed, multimedia, problem solving environment. In J. M.Bowers and S. D. Benford, editors, Studies in Computer Supported Cooperative Work,pages 31–48. North-Holland, Amsterdam, 1991.
[327] I. Sommerville. Software Engineering, 4th edition. Addison-Wesley,Wokingham, 1992.
[328] J. M. Spivey. The Z Notation: A Reference Manual. Prentice HallInternational, Hemel Hempstead, 1988.
[329] M. Stefik, D. G. Bobrow, G. Foster, S. Lanning and D. Tatar. WYSIWIS revisited: early experiences with multiuser interfaces. ACM Transactions on OfficeInformation Systems, 5(2):147–67, 1987.
[330] R. Stevens and A. Edwards. Analysis of audio approaches. MATHS project,Internal report number 6, Department of Computer Science, University of York, 1994.
[331] L. J. Stifelman. Augmenting real-world objects: a paper-based audio note-book. In Proceedings of ACM CHI’96 Conference, pages 199–200, April 1996. Shortpaper.

812 References
[332] L. J. Stifelman, B. Arons and C. Schmandt. The audio notebook: paper andpen interaction with structured speech. Proceedings of ACM CHI 2001 Conference onHuman Factors in Computing Systems, pages 182–9, 2001.
[333] M. F. Story, J. L. Mueller and R. L. Mace. The Universal Design File: design-ing for people of all ages and abilities. 1998. The Center for Universal Design, NorthCarolina State University. Available at: http://www.design.ncsu.edu/cud/pubs/cen-ter/books/ud_file/toc3b14.htm (last accessed March 2003).
[334] L. Suchman. Plans and Situated Actions: The Problem of Human–MachineInteraction. Cambridge University Press, Cambridge, 1987.
[335] L. A. Suchman and R. H. Trigg. A framework for studying research collabo-ration. In D. Peterson, editor, CSCW’86: Conference on Computer SupportedCooperative Work, pages 221–8, MCC Software Technology Program, Austin, TX,December 1986. ACM Press, New York.
[336] B. Sufrin. Formal specification of a display editor. Science of ComputerProgramming, 1:157–202, 1982.
[337] Sun Microsystems, Inc. OpenLook Graphical User Interface Application StyleGuidelines. Addison-Wesley, New York, 1990.
[338] J. A. Sutton and Ralph H. Sprague Jr. A study of display generation and man-agement in interactive business applications. Technical Report RJ2392, IBM, 1978.
[339] TACIT: Theory and Applications of Continuous Interaction Techniques, EU TMR Network ERB FMRX CT97 0133. Available at: http://kazan.cnuce.cnr.it/TACIT/TACIThome.html
[340] J. C. Tang and Scott L. Minneman. VideoWhiteboard: video shadows to sup-port remote collaboration. In S. P. Robertson, G. M. Olson and J. S. Olson, editors,Reaching Through Technology – CHI’91 Conference Proceedings, pages 315–22.Human Factors in Computing Systems, ACM Press, New York, April, 1991.
[341] L. Tauscher and S. Greenberg. How people revisit web pages: empiricalfindings and implications for the design of history systems. International Journal ofHuman Computer Studies, 47(1):97–138, 1997.
[342] H. W. Thimbleby. User Interface Design. Addison-Wesley, New York, 1990.
[343] H. Thimbleby. Design of interactive systems. In J. A. McDermid, editor, TheSoftware Engineer’s Reference Book, chapter 57. Butterworth–Heinemann, Oxford,1991.
[344] H. W. Thimbleby. HyperDoc: an interactive systems tool. In M. Kirby, J. Finlay and A. Dix, editors, HCI’95: People and Computers X, pages 95–106.Cambridge University Press, Cambridge, 1995.
[345] J. Tidwell. Common ground: a pattern language for human–computer inter-face design. 1999. Available at: http://www.mit.edu/~jtidwell/common_ground_onefile.html (last accessed March 2003).
[346] M. A. Tinker. Bases for Effective Reading. University of Minnesota Press,Milwaukee, 1965.
[347] R. Took. Surface interaction: a paradigm and model for separating applica-tion and interface. In J. C. Chew and J. Whiteside, editors, Empowering People –

References 813
CHI’90 Conference Proceedings, pages 35–42. Human Factors in ComputingSystems, ACM Press, New York, 1990.
[348] R. H. Trigg. Computer support for transcribing recorded activity. SIGCHIBulletin, Special issue on video as a research and design tool, 21(1):72–74, 1989.
[349] K. N. Truong, G. D. Abowd and J. A. Brotherton. Who, what, when, where,how: design issues of capture and access applications. In Proceedings of Ubicomp2001, Atlanta, GA, pages 209–24, 2001.
[350] W. Tsukahara and N. Ward. Responding to subtle, fleeting changes in theuser’s internal state. Proceedings of CHI 2001, pages 77–84, ACM Press.
[351] E. R. Tufte. Envisioning Information. Graphics Press, Cheshire, CT, 1990.
[352] C. Turk and J. Kirkham. Effective Writing, 2nd edition. E. and F. N. Spon,London, 1989.
[353] L. Tweedie, R. Spence, H. Dawkes and H. Su. Externalising abstract mathem-atical models. In Proceedings of CHI’96, pages 406–12. ACM Press, New York, 1996.
[354] The UIMS tool developers workshop: a metamodel for the runtime archi-tecture of an interactive system. SIGCHI Bulletin, 24(1):32–7, 1992.
[355] J. van de Bos and R. Plasmeijer. Input-output tools: a language facility for interactive and real time systems. IEEE Transactions on Software Engineering, SE-9(3):247–59, 1983.
[356] D. K. Van Duyne, J. A. Landay and J. I. Hong. The Design of Sites: Patterns,Principles and Processes for Crafting a Customer-Centred Web Experience. Addison-Wesley, Boston, MA, 2003.
[357] G. C. Van der Veer and M. Van Welie. Task based groupware design: puttingtheory into practice. In Proceedings of DIS 2000, New York, 2000.
[358] L. Vygotsky. The instrumental method in psychology. In J. Wertsch, editor,The Concept of Activity in Soviet Psychology. Sharpe, Armonk, NY, 1981.
[359] J. H. Walker, L. Sproull and R. Subramani. Using a human face in an inter-face. In Celebrating Interdependence – CHI’94 Conference Proceedings, pages 85–91.ACM Press, New York, 1994.
[360] P. Walsh. Analysis for task object modelling (ATOM): towards a method ofintegrating task analysis with Jackson system development for user interface soft-ware design. In D. Diaper, editor, Task Analysis for Human–Computer Interaction,pages 186–209. Ellis Horwood, Chichester, 1989.
[361] R. Want, A. Hopper, V. Falcao and J. Gibbons. The active badge location system. ACM Transactions on Information Systems, 10(1):91–102, January 1992.
[362] R. Want, B. Schilit, N. Adams, R. Gold, K. Petersen, J. Ellis, D. Goldberg and M. Weiser. The PARCTab ubiquitous computing experiment. Xerox Palo AltoResearch Center, Technical Report CSL-95-1, March 1995.
[363] R. D. Ward and P. H. Marsden. Physiological responses to different web-page designs. To appear in International Journal of Human–Computer Studies,special issue on Applications of Affective Computing in Human–ComputerInteraction, (in press).

814 References
[364] W. H. Warren and R. R. Verbrugge. Auditory perception of breaking andbouncing events: a case study in ecological acoustics. Journal of ExperimentalPsychology: Human Perception and Performance, 10:704–12, 1984.
[365] P. C. Wason. Reasoning. In B. M. Foss, editor, New Horizons in Psychology.Penguin, Harmondsworth, 1966.
[366] A. I. Wasserman. Extending state transition diagrams for the specification of human–computer interaction. IEEE Transactions on Software Engineering, SE-11(8):699–713, 1985.
[367] A. I. Wasserman, P. A. Pircher, D. T. Shewmake and M. L. Kersten.Developing interactive information systems with the user software engineeringmethodology. IEEE Transactions on Software Engineering, SE-12(2):326–45, 1986.
[368] K. Weber and A. Poon. Marquee: a tool for real-time video logging. InProceedings of ACM CHI’94 Conference, pages 58–64, April 1994.
[369] M. Weiser. The computer of the 21st century. Scientific American,265(3):66–75, September 1991.
[370] M. Weiser. Some computer science issues in ubiquitous computing.Communications of the ACM, 36(7):75–84, July 1993.
[371] M. Weiser. The world is not a desktop. ACM Interactions, pages 7–8, January1994.
[372] M. Weiser and J. S. Brown. Designing calm technology. In PowerGridJournal, http://www.ubiq.com/hypertext/weiser/calmtech/calmtech.htm, 1995.
[373] M. Weiser, R. Gold and J. S. Brown. The origins of ubiquitous computingresearch at PARC in the late 1980s. IBM Systems Journal, 38(4):693–6, Special issueon Human–Computer Interaction: a focus on pervasive computing, 1999.
[374] P. Wellner. Interacting with paper on the digital desk. In Communications ofthe ACM, 36(7):87–96, 1993.
[375] A. Wexelblat. Building collaborative interfaces. CHI’91 Tutorial No. 28,1991.
[376] C. Wharton, J. Rieman, C. Lewis and P. Polson. The cognitive walkthrough:a practitioner’s guide. In Usability Inspection Methods. John Wiley, New York, 1994.
[377] J. Whiteside, J. Bennett and K. Holtzblatt. Usability engineering: our experi-ence and evolution. In M. Helander, editor, Handbook of Human–ComputerInteraction. North-Holland, Amsterdam, 1988.
[378] S. Whittaker, P. Hyland and M. Wiley. Filochat: Handwritten notes provideaccess to recorded conversations. In Proceedings of ACM CHI’94 Conference, pages271–7, April 1994.
[379] J. S. Willans and M. D. Harrison. Verifying the behaviour of virtual worldobjects. In P. Palanque and F. Paternó, editors, DSV-IS 2000 Interactive Systems:Design, Specification and Verification. LNCS 1946, pages 65–77, Springer-Verlag,2001.
[380] T. Winograd. A language/action perspective on the design of cooperativework. In I. Greif, editor, Computer-Supported Cooperative Work: A Book of Readings,pages 623–51. Morgan Kaufmann, San Mateo, CA, 1988.

References 815
[381] T. Winograd and F. Flores. Understanding Computers and Cognition: A NewFoundation for Design. Addison-Wesley, New York, 1986.
[382] P. H. Winston and S. Narasimhan. On to Java. Addison-Wesley, Reading,MA, 1996.
[383] I. H. Witten, H. W. Thimbleby, G. Coulouris and S. Greenberg. Liveware: a new approach to sharing data in social networks. International Journal ofMan–Machine Studies, 34:337–48, 1991.
[384] C. A. Wüthrich. An analysis and model of 3D interaction methods anddevices for virtual reality. In D. J. Duke and A. Puerta, editors, DSV-IS 1999 Design,Specification and Verification of Interactive Systems. pages 18–29, Springer-Verlag,1999.
[385] N. Yankelovich, B. J. Haan, N. K. Meyrowitz and S. M. Drucker. Intermedia:the concept and construction of a seamless information environment. IEEEComputer, pages 81–96, January, 1988.
[386] R. M. Young and T. R. G. Green. Programmable user models for predictiveevaluation of interface designs. In K. Bice and C. Lewis, editors, Proceedings ofCHI’89: Human Factors in Computing Systems, pages 15–19. ACM Press, New York,1989.


Index
Aabductive reasoning, 42Abowd, G.D., 127, 570abstract terminal, 291Abstract Windowing Toolkit
(AWT), 304abstraction–link–view (ALV)
model, 312Access database, 785accuracy in user support, 397ACM SIGCHI Curriculum
Development Group, 130ACT* model, 47action properties of dialog, 582–4
events, 528roles, 527–8
Active Badge, 650, 725ActiveX, 755, 780activity theory, 729–30actors
in entity–relation-based analysis,526
in SSM, 465adaptability
in design rules, 269in user support, 405
adaptive help systems, 404–11effects of, 411initiative and control, 411knowledge representation see
knowledge representationscope of, 411
adaptivity in design rules, 269–70
adjacency pairs, 484, 499aesthetics in screen design, 218–19affective state in text-based
communication, 495–7affordances, 159, 217agent-based interfaces, 179–80agents
interface as, 175in task analysis, 527, 528
AI (artificial intelligence), 180, 444Alexander, H., 284, 570, 576, 580algebraic notation, 603–5
completeness and observation,604–5
reading time order, 604Zdraw, 603–4
algorithm faults in groupware, 710, 711
alignment in screen design, 213–15Allanson, J., 97allophones, 371alphanumeric keyboard, 63–6Alternate Reality Kit (ARK), 377ALV (abstraction–link–view) model,
312ambient displays, 93, 722Ambient Wood, 723–4ambientROOM, 722Amsterdam Conversation
Environment, 671analogy in problem solving, 45–6analysis for task object modeling
(ATOM), 529, 647
analysis of variance (ANOVA), 338–9
Anderson, J.R., 47Andreesen, Marc, 178animated GIFs, 775animation, 244
in hypertext, 751–2annotative utterances, 487ANOVA (analysis of variance),
338–9anti-aliasing, 80–1AOL, 671Apple Computers, 146
Human Interface Guidelines, 279iMac, 219, 752Macintosh, 145, 171, 246, 309,
376, 751Macintosh Finder, 263Macintosh Toolbox, 303Powerbook, 73
Apple Newton, 381–2AppleEvents, 755applets, 781–2application interface component of
UIMS, 308appropriate intelligence, 185Arch–Slinky model, 309architectural design of software,
228–9architectures for synchronous
groupware, 703–6argumentation tools, 505, 679–80ARK (Alternate Reality Kit), 377
Note: W/E denotes a worked exercise.

818 Index
ARKola, 341, 377ARPA (Advanced Research Projects
Agency), 166artifacts, 254
communication through, 690–1in groupware, 666and rich contexts, 646–7
artifacts in JPEG compression, 775artificial intelligence (AI), 180, 444ASCII, 112assistants for user support, 403–4asynchronous co-located
systems, 680asynchronous groupware, 495asynchronous remote communica-
tion, 667asynchronous working, 691–3ATOM (analysis for task object
modeling), 529, 647attributes, 304
of objects, 526in task analysis, 526
Audio Aura, 722audio in hypertext, 754auditory canal, 23auditory icons in universal design,
376–7augmented reality, 736–7
applications, 737augmented transition networks
(ATNs), 574autism, 389–90automated capture and access, 726–8automatic protocol analysis tools,
346–7Automated Teller Machines (ATMs),
30, 67, 154, 430, 583availability of user support, 397AvantGo, 757Avatars, 481awareness in groupware, 700–1AWT (Abstract Windowing
Toolkit), 304
Bback channels
face-to-face, 479–80text-based, 495–7
Backus–Naur Form (BNF) rules,431–2, 435
for dialog notation, 565, 571
backward error recovery, 272Baddeley, A.D., 28, 31, 36bandwidth, 769bar codes, 700Barnard, P., 446Bartlett, F.C., 36Bass, L., 292batch processing, 62Beale, R., 127beam penetration, 82Begeman, M.L., 504Bennett, J., 237, 239, 240Berners-Lee, Tim, 178between-subjects methods of
evaluation, 331binomial distribution, 339bio-sensing, 96–7bitmap displays, 78–81black-box model, 609Blattner, M., 378BNF see Backus–Naur Formbody language, 478–9Boehm, B.W., 230Boies, S.J., 245Bonn Fraunhofer FIT Institute,
702bookmarking, 764Bovair, S., 428Bowers, J., 503braille, 379–80brainstorming, 466–7breadcrumbs, 205, 764breakdown of conversation, 485,
486, 488, 500brightness, perceiving, 18British Standards Institution (BSI),
275browsability in design rules, 271browsing, hub and spoke, 764Bruns, G., 251BSCW (Basic Support for
Cooperative Work), 702BSI (British Standards Institution),
275bubble-jet printers, 98buffers, 115bulletin boards, 667–9, 671Bush, Vannevar, 175, 176, 728,
749business process re-engineering
(BPR), 456–7
buttons, 150design of, 206
Buxton, W., 441, 443
CC language, 575, 576, 598, 785CAD (computer-aided design), 71,
251callback, 297Camtree, 741–2Cannon, W.B., 51Capture Lab, 506, 680Card, S.K., 12, 143, 438, 441, 443Carroll, John, 236, 254, 401cascading style sheets, 772cascading windows, 146cathode ray tube (CRT), 80, 81–4
health hazards, 82CCT see cognitive complexity theorycentralized architecture for
groupware, 703centralized description, 580CfA (conversation for action), 491CGI (Common Gateway Interface),
783–4Chase, W.G., 47check boxes, 150children, design for, 391chord keyboards, 66–8Christie, B., 53Churcher, J., 503Clark, H.H., 489classes, 303
of objects, 530Classroom 2000, 727, 731, 760client–server architecture, 293–4, 704clients in SSM, 465clients on web, 769closed-loop control, 642co-articulation, 371co-authoring systems, 505, 688–9, 693co-option and low intention, 652cognition and rich interaction, 653–4cognitive architectures, 443–7
interacting cognitive subsystems(ICS), 446–7, 643
problem space model, 444–6cognitive complexity theory (CCT)
as cognitive model, 421goal and task hierarchies, 425–30in rich contexts, 643

Index 819
cognitive models, 420–1display-based systems, 434–6goal and task hierarchies, 421–30
cognitive complexity theory,425–30
GOMS model, 422–4problems and extensions, 430
linguistic models, 430–4BNF, 431–2task–action grammar, 432–4
physical and device models, 436–43
keystroke-level model, 436–41three-state model, 441–3
cognitive walkthrough, 321–4, 360CoLab, 505, 680collaboration
in communication, 502–3in hypertext, 760–1in rich contexts, 640–1
collaboration aware applications, 705collaboration aware editors, 686–7Collins, A.M., 33color
and cultural diversity, 136, 282, 392
in ergonomics of interaction, 135–6perceiving, 18in screen design, 219on web pages, 772, 776
colormap, 80combinatorial explosion of states,
553–5command assistance for user support,
399command line interface, 137command prompts for user support,
399commensurate effort principle, 272,
614, 616Common Gateway Interface (CGI),
783–4common ground in conversation,
489–90, 497common understanding, 698Communicating Sequential Processes
(CSP), 570–2, 576W/E, 577–9
communicationconversation, 483–94
breakdown of, 485, 486, 488, 500
context, 485–6repair, 488shared focus, 486–7shared understanding, 489–91speech act theory, 491–4structure, 483–4
face-to-face, 476–82back channels, 479–80eye contact and gaze, 478gestures, 478–9transfer effects, 477–8turn-taking, 479, 480–2
formal notation of, 596group working, 504–7
distributed cognition, 506–7dynamics of, 505–6physical layout, 506
text-based, 495–504affective state, 495–7back channels, 495–7context and deixis, 500–1grounding constants, 497–8pace and granularity, 501–4turn-taking, 499
compact disks (CDs), 109completeness
in algebraic notation, 604–5of dialog, 584in user support, 397
compound earcons, 378comprehension and low
intention, 652compression, 111computation in hypertext, 754–5computer-aided design (CAD),
71, 251computer-mediated communication,
667–78email and bulletin boards, 667–9structured message systems, 670–1texting, 671–4video conferencing, 674–7virtual collaborative environments,
677–8computer-supported cooperative
work (CSCW)decision support systems in, 679distributed groups in, 453–4and groupware, 664, 671
awareness in, 700and low intention, 649
as organizational issue, 451–2as paradigm, 177–8
computers, 4architecture, W/E, 114bio-sensing, 96–7display devices, 78–86
bitmap displays, 78–81cathode ray tube, 81–4digital paper, 86large and situated displays,
84–6input–output, W/E, 105–7memory, 107–14
access methods, 113compression, 111disks and long-term, 108–9RAM, 107–8speed and capacity, 109–11storage capacity, 110storage format and standards,
112W/E, 119–20
networks, 118–20paper, 97–107
fonts, 100–2optical character recognition, 104page description languages,
100–2printing, 98–100and scanners, 103–4and screens, 102–3
physical controls, 94–6positioning, pointing, drawing,
71–8cursor keys, 77–8digitizing tablet, 76–7eyegaze systems, 77, 388joystick, 75keyboard nipple, 75lightpen, 76mouse, 71–3stylus, 76thumbwheel, 74–5touchpad, 73–4touchscreens, 75–6trackball, 74–5
processor, 115–18limitations, 117–18speed, 115–17
sound output, 92special displays, 91–2

820 Index
computers (continued)systems, 61–2text entry devices, 63–71
handwriting, 69–70keyboards, 63–8phone pads, 68–9speech, 70–1T9 entry, 68–9
3D displays, 89–913D space, positioning in, 87–9touch, feel, smell, 92–4virtual reality devices, 87–91
concurrency control, 679, 688, 704concurrent diagrammatic notations,
553–5concurrent dialog, 546concurrent multi-threading, 267ConcurTaskTrees (CTT), 641, 644cones, 14Conetree, 742Conklin, J., 251, 504consensus participation, 469consistency
in design rules, 261, 264–5, 279–80of dialog, 584in user support, 398
constraints on implementation, 312–13consultative participation, 469context-aware computing, 184–5
in ubiquitous computing, 725–6context of communication
conversation, 485–6text-based, 500–1
context-sensitive help for user support, 400
contextual inquiry in interactivedesign, 471–2
continuous behaviour, 618–23granularity and Gestalt, 622–3hybrid models, 621–2modeling, 621mouse, 619–20status–event analysis, 620–1
continuous interaction in ubiquitouscomputing, 725–6
continuous variables, 332, 334contrast, 18conversation, 483–94
breakdown of, 485, 486, 488, 500context, 485–6coping strategies, 502–3
repair, 488shared focus, 486–7shared understanding, 489–91speech act theory, 491–4structure, 483–4
conversation for action (CfA), 491conversation for clarification, 492conversation for orientation, 493conversation for possibilities, 493cookies, 726cooperative evaluation, 343–4Cooperative Inquiry approach, 391Coordinator, 456, 493–4, 671core language, 125cornea, 14–15cotemporality in text-based
communication, 498Coutaz, J., 267, 292, 310–11critical mass, 179
developing, 455–6in SMS, 672
Croftlands Charitable Trust, 673CRT see cathode ray tubeCSCW see computer-supported
cooperative workCsikszentimihalyi, F., 156CSP see Communicating Sequential
Processescultural differences, design for, 391–2cultural probes, 200
in ubiquitous computing, 730–1cursor, 71cursor keys, 77–8cursor tracking, 115CuSeeMe, 675, 777, 778CUSTOM methodology, 458, 460–2customizability in design rules, 266,
269–70customization of applications, 307cycles in HTA, 518
DDangling String, 722DARPANET, 118data fusion, 656data and information visualization,
738–45scientific and technical data, 738–40structured information, 740–2time and interactivity, 742–5
dataglove, 88, 383, 734
datagram protocols, 712deadlock, 710decay of memory, 37Decision Representation Language
(DRL), 253decision support systems, 679–84
argumentation tools, 679–80meeting rooms, 680–3shared work surfaces, 683–4
declarative languages, 312decompression, 111decoration in screen design, 212–13deductive reasoning, 39–40Deep Blue, 46deep linking, 764defaults in design rules, 271DeGroot, A.D., 47deictic references, 479, 485, 500, 682deixis, 500–1, 682, 698delays in synchronous groupware,
702–3deontics, 607–8dependent variables in evaluation, 330depth, perceiving, 16–18design, 192
defined, 193evaluation of, 357–8golden rule of, 193–4and human nature, 194–5interactive, 447iteration and prototyping, 220–2navigation design, 203–11
global structure, 208–10local structure, 204–8
process, 195–7rules see design rulesscenarios, 201–3screens, 211–20
appearance, 217–20layout tools, 211–16user action/control, 216–17
of softwareactivities, 228–30design rationale, 248–56design space analysis, 252–3detailed design, 229iterative design, 234, 241–8process-oriented, 250–2psychological rationale, 254–5W/E, 255–6
and status–event analysis, 633

Index 821
task analysis for, 540–1user focus, 197–201
design notations, 547–8design rules, 259
flexibility, 266–70customizability, 269–70dialog initiative, 266–7multi-threading, 267–8substitutivity, 268–9task migratability, 268
golden rules, 282–3guidelines, 277–82
W/E, 281–2HCI patterns, 284–6heuristics, 282–4
principles for transforming tasks,283–4
learnability, 261–5consistency, 264–5familiarity, 263–4generalizability, 264predictability, 261–2synthesizability, 262–3
robustness, 270–3observability, 270–1recoverability, 272responsiveness, 272task conformance, 273
standards, 275–7supporting usability, 260–75W/E, 273–5
design space analysis, 252–3desktop metaphor, 170desktop publishing (DTP), 103–4desktop virtual reality, 87determinism of dialog, 584device driver, 291diagrammatic notations
concurrent, 553–5digital watch modes, 563–4escapes and help, 555–6flow charts, 559–61hierarchical state transition
networks, 550–2JSD diagrams, 561–2Petri nets, 556–8state charts, 558–9state transition networks, 549–50
dialoganalysis and design, 582–9
action properties, 582–4
presentation and lexical properties, 545, 587–9
state properties, 584–7defined, 545design notations, 547–8diagrammatic notations, 549–564semantics, 545, 573–82
distributed and centralizeddescription, 580
and formal specification, 576–9notation-specific, 574and programming languages,
575syntactic description, maximizing,
545, 580–2structured, 545–7textual notations, 565–73
CSP and event algebras, 570–2grammars, 565–6parameterized and dynamic
interleaved structure, 573production rules, 566–70
dialog boxes, 152dialog control component of UIMS,
307–8dialog focus in conversation, 486–7dialog initiative in design rules,
266–7dialog repair, 488DiamondTouch technology, 719Diaper, D., 521digital camera, 104digital paper, 86DigitalDesk, 722–3digitizing tablet, 76–7direct communication, 698direct manipulation, 133–4, 171–4
W/E, 173–4directed beam refresh, 84directories in hypertext, 765–6disability, design for, 384–90
autism, 389–90dyslexia, 389hearing impairment, 387physical impairment, 387–8speech impairment, 389visual impairment, 384–7
discount usability technique, 324discrete text-based communication,
495discrete variables, 332, 334
discretionary HTA, 518display-based systems, 434–6distributed cognition, 436
in group working, 506–7and rich interaction, 640, 653in ubiquitous computing, 730
distributed description, 580distributed output in ubiquitous
computing, 720–2distributed programming, 710–11distribution lists, 668–9distribution of practice effect, 36diversity, design for, 384–93
children, 391and cultural differences, 391–2disability, 384–90older people, 390–1
Dix, Alan, 778documentation
in hypertext, 758for task analysis, 532–3
domain, 125domain names, 178Domino, 783Dorling Kindersley, 759DOS help command, 399dot-based printers, 98, 99–100dot-matrix printers, 98Draper, S.W., 172DRL (Decision Representation
Language), 253Druin, A., 391DRUM, 347DVORAK keyboard, 65–6, 265Dynabook, 168dynamic HTML (DHTML),
773dyslexia, 389
Ee-commerce, 26, 761e-learning in hypertext, 758–60Eager, 180eagerness in conversation, 503–4earcons, 378–9Earnshaw, R.A., 739Ebbinghaus, H., 36, 37echoic memory, 28eClass project, 727, 731, 760, 778electronic paper, 382electronic publishing, 104

822 Index
email, 177critical mass for, 455–6culture of, 497groupware for, 667–9interfaces for, 634–7
embedded communication, 699embodiment
of agents, 180in virtual space, 677
emoticons, 496–7, 672emotion, 51–2Engelbart, Douglas C., 72, 167–9, 176ENI (eventual notification
infrastructure), 702entity–relation-based analysis, 511,
525–3as object-based methodology, 525
environment in SSM, 465environmental cue triggers, 645episodic memory, 32equal opportunity in design rules, 269equitable use principle, 367ergonomics, 3
of interaction, 131–6, 158arrangements, 132–4color, 135–6health issues, 135physical environment, 134
of keyboards, 65–6error tolerance principle, 367errors
and interactivity, 153–4in thinking, 49–51
ETHICS method, 467–70ethnographic methods in interactive
design, 470–2contextual inquiry, 471–2and rich contexts, 640, 646in ubiquitous computing, 730–1
Eurohelp, 408evaluation
definition, 319experimental evaluation, 329–43
experimental design, 331–2groups of users, 340–3hypotheses, 330icon designs, 335–9participants, 329statistical measures, 332–5variables, 330W/E, 339
expert analysis in, 320–7cognitive walkthrough, 321–4,
360heuristic evaluation, 324–6, 360model-based evaluation, 326, 360previous studies, 326–7
goals, 319–20method, choosing, 357–62
classification of techniques,360–2
distinguishing factors, 357–60observational techniques, 343–7
automatic protocol analysis tools,346–7
cooperative evaluation, 343–4post-task walkthroughs, 347, 361protocol analysis, 344–6, 361
physiological response evaluation,352–7
eye tracking, 353–4, 362measurements, 355–7, 362
query techniques, 347–52interviews, 347, 361questionnaires, 347–51, 361W/E, 351–2
in screen design, 220styles, 327–9
field studies, 328–9, 358laboratory studies, 327–8, 358
of ubiquitous computing, 731–3user participation in, 327–57
event algebras for textual dialog,570–2
event languages, 312eventISL, 576events
in entity–relation-based analysis,528
and mouse, 619properties, 632–3
eventual notification infrastructure(ENI), 702
eventual notification of change, 262everyday computing, 728evolutionary prototyping, 242example-based techniques in user
support, 410execution–evaluation cycle, 124,
125–7experimental evaluation, 329–43, 361
experimental design, 331–2
groups of users, 340–3hypotheses, 330icon designs, 335–9participants, 329statistical measures, 332–5variables, 330W/E, 339
Experimental Video Annotator(EVA), 346
eXtended Mark-up Language (XML),112, 768
external context of communication,485, 500
external event triggers, 645eye contact, 478, 767eye tracking, 353–4, 362eyegaze systems, 77, 388
Fface-to-face communication,
476–82back channels, 479–80eye contact and gaze, 478gestures, 478–9transfer effects, 477–8turn-taking, 479, 480–2
false memories, 49–50familiarity in design rules, 261,
263–4family earcons, 378feedback
from artifacts, 666rapid, 171in synchronous groupware, 702–3on Web, 770, 779
feedthroughof synchronous groupware, 699,
706–7on Web, 770, 779
filtering, 670Finlay, Janet E., 778Fitts’ law, 149, 437, 442–3fixation, 43fixed sequence HTA, 517flaming, 496–7Flash, 780flexibility
in design rules, 266–70customizability, 269–70dialog initiative, 266–7multi-threading, 267–8

Index 823
substitutivity, 268–9task migratability, 268
in use principle, 367in user support, 398
floor control policies, 681, 682, 686
Flores, F., 491flow charts, 559–61fonts, 100–2footmouse, 73force feedback in VR, 92–3, 738forgetting, 37form-fills, 139–40formalisms of interactive systems,
595–608notations, 596–7
algebraic, 603–5model-oriented, 597–602temporal, 605–8
formative evaluation, 220forward error recovery, 272fovea, 14–15fractal compression, 111frame-based techniques in user
support, 409–10framed websites, 764, 778frames, 34framing problem, 602free rider problem, 454–5frequency controls, 132full explanation assistance, 396functional controls, 132functional requirements, 229
Gganglion cells, 15Gardiner, M.M., 53gas plasma display, 84Gaver, W., 731gaze in face-to-face communication,
478General Problem Solver model, 44generalizability in design rules, 261,
264generalization, 48generalized transition networks, 425,
552generic task sequences, 525generification, 524Gestalt theory, 43– 4
and continuous behaviour, 622–3
gesture recognition, 70and cultural differences, 392in universal design, 383, 387
gestures in face-to-face communication, 478–9
Gick, M.L., 45GIF (Graphics Interchange Format),
774–5glyphs, 105goals, 125GOMS (goals, operators, methods and
selection), 326as cognitive model, 421goal and task hierarchies, 421–30W/E, 424–5
Google, 766, 767Gould, J.D., 245grammar notations, 312grammars for textual dialog, 565–6granularity
of cognitive models, 422of continuous behaviour, 622–3of shared information, 695–6, 707of text-based communication,
501–4graphical issue-based information
system (gIBIS), 251, 504, 680graphical kernel system (GKS), 291graphical specification of
implementation, 313graphical toolkits, 707–8graphical user interfaces (GUIs), 280Graphics Interchange Format (GIF),
774–5graphics on world wide web, 773–6
and color, 776icons, 775–6using, 773–5
grounding constraints, 497–8group pointer, 682, 688, 697group working, 504–7
distributed cognition, 506–7dynamics of, 505–6physical layout, 506
grouping in screen design, 212groupware, 178
computer-mediated communica-tion, 667–78
email and bulletin boards, 667–9structured message systems,
670–1
texting, 671–4video conferencing, 674–7virtual collaborative
environments, 677–8decision support systems, 679–84
argumentation tools, 679–80meeting rooms, 680–3shared work surfaces, 683–4
frameworks, 691–702asynchronous working, 691–3awareness, 700–1communication and work,
integrating, 698–700shared information, 695–8time/space matrix, 691–3W/E, 694–5
shared applications and artifacts,685–91
co-authoring systems, 688–9communication through, 690–1diaries, 689–90editors, 686–8PCs and window systems, 685–6
synchronous, implementing, 702–12architectures for, 703–6feedback and delays, 702–3feedthrough and traffic, 706–7graphical toolkits, 707–8robustness and scaleability,
708–12systems, 664–7
Grudin, J., 265GTA (GroupWare Task Analysis),
641, 645guessability, 264GUI (graphical user interface), 280GUIDE system, 757Guimbretière, François, 182gulfs of evaluation, 126gulfs of execution, 126
Hhandwriting recognition, 69–70
technology for, 381–2in universal design, 381–3
haptic devices, 93haptic feedback, 94haptic interaction, 379haptic memory, 28haptic perception, 25Harel’s state charts, 558–9

824 Index
HCI see human–computer interaction
headsets in VR, 89, 734health hazards of CRT, 82health issues, 135hearing
human ear, 23–4processing sound, 24
W/E, 24–5hearing impairment, 387Heller, D., 304help systems
adaptive for user support, 404–11effects of, 411initiative and control, 411scope of, 411
and diagrammatic notations, 555–6
display of, 412–13DOS command, 399effective presentation, 413in hypertext, 758requests for, 412UNIX man, 399, 405
Hermes, 86heuristic evaluation, 324–6, 360heuristics, 44
in design rules, 282–4principles for transforming tasks,
283–4Hewitt, B., 503hierarchical state transition networks,
550–2hierarchical task analysis (HTA), 513,
529and GOMS, 423in rich contexts, 641W/E, 518–19, 530–2
Hill, R.D., 312Hobbs, D., 402Hollan, Jim, 172, 273Holtzblatt, K., 237, 239, 240Holyoak, K.J., 45honesty, 262, 263hot spots, 148, 751HTA see hierarchical task analysisHTML (Hypertext Mark-up
Language), 178, 179, 768HTTP (Hypertext Transfer Protocol),
178hub and spoke browsing, 764
Hubbard, R.E., 734hue, 18Huffman encoding, 111human–computer interaction (HCI)
in curriculum, 6–7defined, 3–4theory and, 5–6
human error, 194–5humans
emotion, 51–2individual differences, 52–3input–output channels, 13–27
hearing, 23–5movement, 26–7touch, 25–6vision, 14–23
memory, 27–39long-term, 32–9, 506sensory, 28–9short-term, 29–32working, 506
psychology, 53–5thinking, 39–51
errors and mental models, 49–51
problem solving, 43–6reasoning, 39–42skill acquisition, 46–8
Hunterian Museum, 753Hutchins, Ed, 172, 273HyperCard, 246, 269, 311, 691
in hypertext, 755, 757, 758on web, 785
HyperDoc, 586hypermedia, 176, 178, 750HyperTalk, 246, 247, 269hypertext, 142, 749–61
applications, 757–61collaboration, 760–1e-learning, 758–60help and documentation, 758prototyping, 757–8
definition, 749–51delivery, 755–7navigation, 761–7
history mechanism, 764–5improving, 762–3indices and directories, 765–6structural design, 761–2
as paradigm, 175–6rich content, 751–5
animation, 751–2audio, 754computation, 754–5video, 752–4
structure, 501–2, 750for user support, 401–2
Hypertext Mark-up Language(HTML), 178, 179, 768
Hypertext Transfer Protocol (HTTP),178
IIBIS (issue-based information
system), 250–1, 680IBM, 181, 235, 245, 401ICCCM, 296ICO (Interactive Cooperative
Objects), 558icon wars, 116iconic memory, 28icons, 146
animated, 751auditory, 376–7designs, evaluating, 335–9on web, 775–6
ICQ, 671ICS (interacting cognitive
subsystems), 446–7, 643illocutionary force, 496illocutionary points, 491iMac, 219, 752imaging model, 291immediate notification of change,
262immediate triggers, 645immersive virtual reality, 734–5implicit input in ubiquitous
computing, 718–20incidental interaction, 649–52
designing for, 654–6incremental prototyping, 242independent variables in evaluation,
330indexes in hypertext, 765–6indexical expressions, 486, 687indirect manipulation, 133–4individual differences, 52–3inductive reasoning, 40–1industrial interfaces, 133–4infinitely fast machine, myth of, 116,
607

Index 825
Influence Explorer, 744–5information
access in memory, 37chunked, in memory, 30–1, 32, 47information and data visualization,
738–45scientific and technical data,
738–40structured information, 740–2time and interactivity, 742–5
presenting on screen, 217–18and rich contexts, 641–4
information retrieval, 38Information Visualizer, 741–2inheritance, 303
by objects, 530ink-jet printers, 98, 99, 100inner ear, 23input tools notation, 575instance attributes, 304instant messaging, 672instantiation, 303intensity of color, 18intentional spectrum, 651–2interacting cognitive subsystems
(ICS), 446–7interaction, 4, 136–44
context of, 154–5design see designergonomics, 131–6
arrangements, 132–4color, 135–6health issues, 135physical environment, 134
experience, 156–60designing, 157–8and engagement, 158–9and value, 159–60
interactivity, 152–4levels, 62models of, 124–30, 608–18
execution–evaluation cycle,125–7
PIE model, 609–11predictability and observability,
611–14reachability, 616–17undo, 616–17W/E, 614–15
programming support see supportfor implementation
styles, 136–44command line interface, 137form-fills, 139–40menus, 137–8natural language, 138–9point-and-click interface, 142query dialog, 139question/answer, 139spreadsheets, 140–1D interfaces, 142–4WIMP interface, 141–2
terms of, 125WIMP interface, 141–2, 145–52
buttons, 150dialog boxes, 152icons, 146menus, 148–50palettes, 152pointers, 147–8toolbars, 151windows, 145–6
interaction framework, 127–31assessing, 131
interaction objects, 172Interactive Cooperative Objects
(ICO), 558interactive performance
limitations on, 117–18interactive systems, design of,
234–7interactivity of conversation, 501–2interference
in memory, 31, 37–8intergenerational design team, 391interlacing, 81interleaved multi-threading, 267internal context of communication,
485, 500internationalization in screen design,
219–20internet, 118, 178, 768Internet Explorer, 768Internet Protocol (IP), 118, 178interviews
in evaluation, 347, 361for task analysis, 536
intrusiveness of evaluation, 359intuitive to use principle, 367IP (Internet Protocol), 118, 178ISDN (Integrated Service Digital
Network), 674
Ishii Tangible Media Group, 721ISO standards, 112, 230issue-based information system
(IBIS), 250–1, 680iterations in JSD, 562iterative design, 234, 241–8
drawbacks, 247–8for interaction, 220–2
JJää-Aro, Kai-Mikael, 49Jackson Structured Design (JSD),
561–2Jacob, R.J.K., 555James, William, 41Java, 304, 785Java Enterprise Beans (JEB), 787Java Servlet Pages (JSP), 787JavaScript, 780, 781JDBC, 783Jeremijenko, N., 722jitter, 770JPEG (Joint Photographic Experts
Group) format, 774–5Jordan, P.W., 264Jost’s law, 37joystick, 75
KKandinsky, 722Kasik, D.J., 308Kasparov, Gary, 46Kay, Alan, 168, 176keyboard accelerators, 150keyboard nipple, 75keyboards, 63–8
evolution of, 265layout problems, 588–9workings of, 64–5
keystroke-level model (KLM), 436–41
using, 439W/E, 440–1
Kieras, D.E., 425, 428kinesthesis, 26knowledge, frame-based
representation of, 34knowledge-based analysis, 511,
519–25knowledge representation grammar
(KRG), 522, 524

826 Index
knowledge representation in user support
advisory strategy modeling, 408–9domain and task modeling, 407–8problems with, 410–11techniques, 409–10
example-based, 410frame-based, 409–10network-based, 410rule-based, 409
user modeling, 405–7overlay models, 407quantification, 406stereotypes, 407
Kohler, W., 43
LLai, K.-Y., 250, 253Laird, J.E., 446Landauer, T.K., 329Lange, 51language of patterns, 285language paradigm, 174–5large displays, 84–6laser printers, 98, 99latency, 769Laurel, Brenda, 754layout tools, 211–16LCD (liquid crystal display), 80, 83learnability of design rules, 261–5
consistency, 264–5familiarity, 263–4generalizability, 264predictability, 261–2synthesizability, 262–3
Lee, J., 250, 253Lens, 454lens, eye, 14–15levels of access in hypertext, 763Levy, S., 245lexical analysis, 565lexical properties of dialog, 587–9Licklider, J.C.R., 166Lifelines, 743light-emitting diodes (LEDs), 91lightpen, 76
three-state model of, 441limited functionality simulations,
244–7linear text, structure, 750linear text-based communication, 495
linguistic models, 430–4BNF, 431–2task–action grammar, 432–4
links in hypertext, 750liquid crystal display (LCD), 80, 83Listen Reader (Xerox PARC), 720Liveware, 691, 693localization in screen design,
219–20locked nodes in groupware tools,
679–80, 681–2LOGO, 168, 169–70long-term memory, 32–9, 506
computer, 108–9process, 36–9structure, 32–5
look and feel of toolkits, 303lossless compression, 775lossy compression, 770, 775LOTOS, 644Lotus Notes, 457, 691, 783low physical effort principle, 367luminance, 18
MMcCall, R.J., 251Macintosh, 145, 171, 246, 309, 376,
751Macintosh Finder, 263Macintosh Toolbox, 303MacKenzie, J.S., 443MacLean, A., 252MacOS X, 102, 132, 141, 147, 149,
153Macromedia Dreamweaver, 402magnetic disks, 108magnetic tablet, 77Maier, N.R.F., 43man–machine interaction, 3Mandelbrot set, 111manuals, task analysis for, 538–40Mason, M.V., 406Massachusetts Institute of Technology
(MIT), 93, 166, 294, 383master–slave architecture for
groupware, 703Mathtalk system, 386Mayhew, D.J., 279means–ends analysis, 44mechanoceptors, 25Media Room, 383
MediaCup, 650, 656–7meeting rooms, 680–3memex, 176, 728memory
computer, 107–14access methods, 113compression, 111disks and long-term, 108–9RAM, 107–8speed and capacity, 109–11storage format and standards, 112W/E, 119–20
human, 27–39, 209forgetting, 37improving, 39information chunked in, 30–1,
32, 47long-term, 32–9, 506sensory, 28–9short-term, 29–32working, 506
mental models in thinking, 49–51menu bar, 149menu networks, 311menus, 137–8, 148–50messaging booths, 245metaphors for interaction, 169–70MHP (model human processor), 12,
443, 729Microcosm, 759Microsoft, 720
Active Server Pages, 780Excel, 146, 180Internet Explorer, 768Office, 146, 151Windows, 141, 149, 153, 758Word, 145, 146
middle ear, 23Miller, G.A., 29, 209minimal manual, 402Mirabilis, 671mistakes, 127MIT (Massachusetts Institute of
Technology), 93, 166, 294, 383Mitre Corporation, 278Mitsubishi Electric Research Lab, 719mobile phones, 68, 183, 756modal dialog boxes, 153, 301model-based evaluation, 326, 360model human processor (MHP), 12,
443, 729

Index 827
model-oriented notation, 597–602issues for, 602operations, 600–2simple sets, 597–9Zdraw, 599–600
model–view–controller (MVC)paradigm, 309–10
model-world metaphor, 172modes
in button design, 207in WIMP interface, 148, 152
modified hierarchical task analysis(HTA), 516–17
Molich, Rolf, 324monotonic transcripts, 697–8Moore, D., 402Moore, Gordon, 115Moore’s law, 115Moran, T.P., 12, 438, 441, 443morphemes, 371Mosaic, 768Mosier, J.N., 278–9Motif GUIs, 280, 303motives in sound, 378motor skills, 27mouse, 71–3
continuous behaviour of, 619–20psychology of, 634three-state model of, 441, 4433D, 87–8
movement, 26–7movies on world wide web,
777–8MPAD, 721multi-agent architecture, 310multi-modal interaction in design,
368–83gesture recognition, 383, 387handwriting recognition, 381–3
technology for, 381–2sound, 370–9
earcons, 378–9non-speech sound, 376–7speech, 370–5W/E, 377
touch, 379–81multi-modality, 176–7multi-scale output in ubiquitous
computing, 720–2multi-threading in design rules, 266,
267–8
Multi-User Domains (MUDs), 678multimedia, 176, 750multiple inheritance, 304multiple interfaces, 307multiplexing in conversation, 502–3Mumford, E., 469MUSiC, 347Muybridge, E., 199MVC (model–view–controller)
paradigm, 309–10Myers, B.A., 235Myers Garnet system, 313
Nnaïve psychology, 633–4natural language interaction, 138–9NaviCam, 722navigation design, 203–11
global structure, 208–10dialog, 209–10hierarchical organization,
208–9in hypertext, 761–7
history mechanism, 764–5improving, 762–3indices and directories, 765–6structural design, 761–2
local structure, 204–8NCSA (National Center for
Supercomputer Applications),178
Nelson, Ted, 176, 749Netscape Navigator, 751, 768network-based techniques in user
support, 410network diagrams, 210network traffic of synchronous
groupware, 706–7networks, 118–20
on web, 769–70Newell, A., 12, 43–4, 438, 441, 443,
445, 446Newman’s Reaction Handler, 308Next operating system, 102Nielsen, Jakob, 237, 283, 324, 325–6,
329, 778NLS (oNLine System), 167, 168nociceptors, 25non-functional requirements, 229non-linear text-based communica-
tion, 495
non-parametric tests, 333, 334, 335non-speech sounds in universal
design, 376–7non-terminals, 565normal distribution, 332–3Norman, D.A., 52, 125, 126, 127, 129,
172, 273, 283, 653notation-specific semantics, 574notations
algebraic, 603–5completeness and observation,
604–5reading time, 604Zdraw, 603–4
for analysis, 596–7for communication, 596model-oriented, 597–602
issues for, 602operations, 600–2simple sets, 597–9Zdraw, 599–600
temporal, 608deontics, 607–8real time, 607
temporal logic, 605–6temporal operators, 606
notification based paradigm, 297–301,303, 708
Nottingham Internet Foyer, 678numeric keypads, 67
Oobject-oriented programming, 303objective evaluation, 358objects
attributes, 526in entity–relation-based analysis,
525–6observability
in design rules, 270–1in dialog analysis, 587in models of interaction, 611–14in WYSIWYG models, 609
observationin algebraic notation, 604–5in task analysis, 533
observational techniques of evaluation, 343–7
automatic protocol analysis tools,346–7
cooperative evaluation, 343–4
828 Index
observational techniques of evaluation (continued)
post-task walkthroughs, 347, 361protocol analysis, 344–6, 361
Observer Pro, 346older people, design for, 390–1Olivetti Research, 725Olsen, D.R., 568onCue system, 650–1online documentation for user
support, 398, 401–2guidelines, 402
oNLine System (NLS), 167, 168online tutorials for user support,
400–1Open Directory Project (ODP), 765open-loop control, 642Open Software Foundation (OSF),
280, 303open system task analysis (OSTA), 462OpenLook, 280Opera, 768optical character recognition (OCR), 104optical disks, 108–9optical illusions, 20–2optical mice, 73optional tasks HTA, 517Oracle Web Server, 783order in screen design, 212organizational issues, 451–8
critical mass, developing, 455–6CSCW, 451–2distributed groups, 453–4distribution of benefits, 454evaluating benefits, 457–8free rider problem, 454–5power structures, changing, 452–3workflow and BPR, 456–7
OSF (Open Software Foundation),280, 303
ossicles, 23outer ear, 23outliers, 332overlay models in user support, 407owners in SSM, 465
PPAC (presentation–abstraction–
control) model, 310–11pace of text-based communication,
501–4
page description languages, 100–2paging in computer memory, 110palettes, 152paper, 97–107
fonts, 100–2interaction, 105optical character recognition, 104page description languages, 100–2printing, 98–100and scanners, 103–4and screens, 102–3
Papert, Seymour, 168, 169paradigms for interaction, 165–85
agent-based interfaces, 179–80context-aware interaction, 184–5CSCW, 177–8direct manipulation, 171–4
W/E, 173–4hypertext, 175–6language and action, 174–5metaphor, 169–70multi-modality, 176–7personal computing, 168programming toolkits, 167–8sensor-based, 184–5time sharing, 165–6ubiquitous computing, 180–4VDUs, 166–7on web, 178–9window systems, 169
parametric tests, 332, 334PARCTab (Xerox), 725partial functions, 599participatory design, 198
for interactive systems, 466–70ETHICS method, 467–70ethnography and, 471
Pascal, 598Pattern Gallery, 285patterns, 285–6pen and paper exercises, 467pendulum problem, 43Pepys project, 650, 725perceived events, 635, 639perceptible information principle, 367persistence in design rules, 271persona in design, 201personal computing, 168personal digital assistants (PDAs), 61,
76, 108, 182–3, 720, 756personal organizers, 182
personal space in communication,477–8
pervasive computing, 181, 717Petri nets, 556–8, 622PetShop, 558PHANTOM Premium, 380Phidgets, 722PHIGS (programmer’s hierarchical
interface to graphics), 291–2Philips, 733phone pads, 68–9phonemes, 371phonetic typewriter, 372photoreceptors, 14physical controls, 94–6physical impairment, 387–8physiological response evaluation,
352–7eye tracking, 353–4, 362measurements, 355–7, 362
PICTIVE, 467pie menus, 149PIE model, 609–11
W/E, 614–15pinna, 23Pirolli, P., 762pixels, 80, 291placeholders and rich contexts, 647–9places in Petri nets, 557Plasmeijer, M.J., 575point-and-click interaction, 104point-and-click interface, 142pointers, 147–8Polson, P.G., 321, 425, 428pop-up menus, 149portability of applications, 307post-task walkthroughs, 347, 533PostScript, 100, 102, 291–2Potts, C., 251power positions in group working, 506Powerbook, 73PPS (propositional production
system), 568pre-emption in interfaces, 153predictability
in design rules, 261–2in dialog analysis, 587in models of interaction, 612in WYSIWYG models, 609
presentation–abstraction–control(PAC) model, 310–11
Index 829
presentation component of UIMS, 308presentation control, 313presentation properties of dialog,
587–9printing, 98–100proactive inhibition, 37–8problem solving, 43–6
analogy in, 45–6Gestalt theory, 43–4problem space theory, 44–5
W/E, 45problem space model, 444–6problem space theory, 43, 44–5
W/E, 45problem states, 44Procedural Hierarchy of Issues (PHI),
251procedural knowledge, 35procedural utterances, 487proceduralization, 47–8
in CCT, 428, 429process algebras for textual dialog, 570process-oriented design, 250–2product opportunity, 460production rules
in CCT, 425for textual dialog, 566–70, 574
productive restructuring, 43programmable user models (PUMs),
446programming by example, 175programming toolkits, 167–8Project Nick, 680propositional meanings, 491propositional production system
(PPS), 568prosody, 371, 386proteins, manipulation in VR, 734–5protocol analysis, 344–6, 361prototyping, 220–2
in hypertext, 757–8in software life cycle, 241–7
approaches to, 241–2high-level support, 247limited functionality simulations,
244–7storyboards, 244techniques, 244–7
STNs in, 551–2psychological rationale for design,
254–5
psychology, 53–5design, support for, 54evaluation, 54guidelines, 53
PUMs (programmable user models),446
Qqualitative evaluation, 358–9quantitative evaluation, 358–9query dialog, 139query languages, 139query techniques in evaluation,
347–52interviews, 347, 361questionnaires, 347–51, 361W/E, 351–2
question/answer interaction, 139Questions, Options and Criteria
(QOC) notation, 252–3quick fixes, 7–8quick reference assistance, 396QuickTime, 752Quillian, M.R., 33Quilt system, 505, 689, 693, 699QWERTY keyboard, 63–6, 265
Rrace conditions, 697, 704radio buttons, 150random access memory (RAM),
107–8rapid feedback, 171rapidly adapting mechanoceptors, 25reachability
in design rules, 271in dialog analysis, 584–5in models of interaction, 616–17in WYSIWYG models, 609
Reaction Handler, 308Reactive keyboard, 388read-evaluation loop, 296–7reading, 22–3real time, 607RealAudio, 777RealVideo, 777reasoning, 39–42
abductive, 42deductive, 39– 40inductive, 40–1
reciprocity in video conferencing, 676
recoverability in design rules, 270, 272
redundancy in dialog, 488registration, 736–7regular expressions, 565Reisner, P., 431, 435Rekimoto, J., 722Renshaw, J.A., 353repeated measures methods of
evaluation, 331repetitive strain injury (RSI),
64–5, 74replicated architecture for groupware,
703–4representation multiplicity in design
rules, 268representations, mediating, 507representative participation, 469requirements capture, 458–72
ethnographic methods, 470–2open system task analysis, 462participatory design, 466–70socio-technical models, 460–2soft systems methodology, 462–6stakeholders, 458–9task analysis for, 540
requirements specification, 227–8,235
resistive tablet, 76–7resolution, 80, 103resources for evaluation, 359response time stability, 272responsiveness in design rules, 270,
272retina, 14–15retroactive interference, 37reusability of applications, 307reversability in dialog analysis, 585reviewability in text-based
conversation, 504RFID, 720Rheingold, Howard, 166rich content in hypertext, 751–5
animation, 751–2audio, 754computation, 754–5video, 752–4
rich contexts, 639–49artifacts, 646–7collaboration, 640–1information, 641–4

830 Index
rich contexts (continued)placeholders, 647–9triggers, 644–5
rich interaction, 630low intention, 649–57
challenges, 652–4incidental interaction, 654–6intentional spectrum, 651–2
and rich contexts, 639–49artifacts, 646–7collaboration, 640–1information, 641–4placeholders, 647–9triggers, 644–5
sensor-based, 649–57implementation, 656–7
status–event analysis, 631–9design implications, 633examples, 634–9naïve psychology, 633–4properties, 632–3
rich pictures, 463–5rich text format (RTF), 112Richards, J.T., 245richer interaction, 62Rittel, H., 250Robertson, G.G., 143robustness
in design rules, 270–3observability, 270–1recoverability, 272responsiveness, 272task conformance, 273
of synchronous groupware, 708–12testing for, 712
in user support, 398rods, 14roll back, 704root definitions in SSM, 465Rosenbloom, P., 446Rosson, M.B., 235, 254Royal College of Art, 733RSI (repetitive strain injury), 64–5, 74rule-based techniques in user support,
409run-length encoding, 111
Ssaccades, 22SAGE (Semi-Automatic Ground
Environment), 166
saturation of color, 18scaleability of synchronous
groupware, 708–12scanners, 103–4scenarios, 201–3, 255Schachter, S., 52Schaefer, E.F., 489Schneiderman, Ben, 171, 282–3Schoonard, J., 245screen readers, 374screens
button feedback, 637–9computer, 102–3design of, 211–20
appearance, 217–20layout tools, 211–16user action/control, 216–17
navigation of, 203psychology of, 634see also video display units
scripts, 34, 35, 246scroll wars, 687scrollbars, 146scrolling, W/E, 304–5search engines, 765–6, 782searching on web, 782–3Seeheim model, 308, 309, 311, 656Sellen, A., 443semantic feedback, 309semantic memory, 32semantic networks, 33–4
W/E, 54–5semantics, 545, 573–82
distributed and centralized description, 580
and formal specification, 576–9W/E, 577–9
of interactive system, 595notation-specific, 574and programming languages, 575syntactic description, maximizing,
545, 580–2sensor-based interaction, 184–5,
649–57designing, 655implementation of, 656–7
sensors, 96–7sensory buffers, 28sensory inputs, 369sensory memory, 28–9Sentient Computing Project, 725
separation in system, 602sequence in text-based
communication, 498sequenced transcripts, 697sequential controls, 132serial access, 693server faults in groupware, 709Severinson Eklundh, K., 503SGML (Standard Generalized
Mark-up Language), 112shadow mask, 82shared calendar, 689shared diaries, 689–90shared editors, 686–8shared experience, 732shared focus of conversation, 486–7shared information, 695–8
granularity, 695–6levels of, 696–7objects, 697–8
shared PCs, 685–6shared understanding, 489–91shared whiteboard, 682, 698shared window systems, 685–6shared work surfaces, 683–4SharedARK, 377Short Message Systems (SMS), 68,
672–4short-term memory, 29–32sight and universal design, 368signature authentication, 70Simon, H.A., 43–4, 47, 445Simon, T., 420simple sets, 597–9simple to use principle, 367simulators, 91simultaneity in text-based
communication, 498Singer, J., 52situated action, 436, 470, 642, 653
in ubiquitous computing, 730situated displays, 84–6size, perceiving, 16–18size constancy, law of, 17size for approach and use principle,
368Sketchpad program, 166–7skill acquisition, 46–8slips, 127slots, 34slowly adapting mechanoceptors, 25

Index 831
Smalltalk, 309–10Smart-Its, 96smell, 93, 368smilies, 496–7Smith, R.B., 275Smith, S.L., 278–9SMS (Short Message Systems), 68,
672–4Soar architecture, 445–6social protocols, 682, 688socio-technical models for interactive
systems, 460–2Software Development Kit for
Microsoft Windows, 303software engineering, 226software life cycle, 226–37
activities, 227–30architectural design, 228–9coding and unit testing, 229–30detailed design, 229integration and testing, 230maintenance, 230requirements specification,
227–8, 235contractual issues, 234design rationale, 248–56
design space analysis, 252–3process-oriented, 250–2psychological rationale, 254–5W/E, 255–6
interactive systems and, 234–7iterative design, 234, 241–8
drawbacks, 247–8management, 233–4prototyping, 241–7
approaches to, 241–2high-level support, 247limited functionality simulations,
244–7storyboards, 244techniques, 244–7
usability engineering, 237–41metrics for, 239, 240problems with, 240–1
validation and verification, 230–3see also design rules
Sommerville, I., 243sonic tablet, 77SonicFinder, 376sound
computer output, 92
in universal design, 368, 370–9earcons, 378–9non-speech sound, 376–7speech, 370–5W/E, 377
on web, 777–8sound waves, 23Soundtrack, 385space for approach and use principle,
368SPAM system, 673, 733spatial text-based communication,
495Specifying and Prototyping
Interaction (SPI), 576, 580speech act theory, 491–4speech impairment, 389speech in universal design, 370–5
right kind of, 375and speech impairment, 389and speech recognition, 70–1, 153,
371structure of, 370–1synthesis, 373–4uninterrupted, 374–5
speech recognition, 70–1, 153, 371SPI (Specifying and Prototyping
Interaction), 576, 580sporadic triggers, 645Sprague, R.H., 235spreadsheets, 140–1SQL (Structured Query Language),
783SSM (soft systems methodology),
462–6stakeholders
classifying, 459CUSTOM analysis, 461in design, 198identification of, 452–3and requirements capture, 458–9
Standard Generalized Mark-upLanguage (SGML), 112
Stanford Interactive Mural, 182,721–2
state charts, 558–9state properties of dialog, 584–7state transition diagrams, 312state transition networks (STNs),
549–50statistical evaluation, 332–5
status–event analysis, 620–1and rich interaction, 631–9
design implications, 633examples, 634–9naïve psychology, 633–4properties, 632–3
stereoscopic vision, 89–90stereotypes in user support, 407‘stick e note’, 757stop words, 765stopping rule, 514storyboards, 202
for interactive systems, 467in software life cycle, 244
structure in screen design, 212structured human dialog, 545–7structured information, visualization
of, 740–2structured message systems, 670–1Structured Query Language
(SQL), 783Student’s t test, 337–8style guides, 280stylus, 76subjective evaluation, 358substantive utterances, 487substitutivity in design rules, 266,
268–9Suchman, Lucy, 642summative evaluation, 220Sun Guide system, 758Sun Microsystems, 148SunView toolkit, 708support for implementation, 290
programming applications,296–301
toolkits, 302–6W/E, 305–6
user interface management system,306–13
as conceptual architecture,307–11
implementation considerations,311–13
windowing systems, 291–6architecture, 292–6roles, 293
Sutherland, I., 166–7Sutton, J.A., 235swapping in computer memory, 110symmetry of information, 454

832 Index
synchronous co-located systems, 684,685–6
synchronous groupware, implementing, 702–12
architectures for, 703–6feedback and delays, 702–3feedthrough and traffic, 706–7graphical toolkits, 707–8robustness and scaleability, 708–12
synchronous remote communication,667, 684
syntactic description, 545, 580–2synthesizability in design rules, 261,
262–3system in interaction framework,
127–9system pre-emptive dialog, 266
TT9 algorithm, 68–9, 672tablet computers, 181TACIT project, 622TAKD (task analysis for knowledge
description), 521–3, 643talking heads, 752task–action grammar (TAG)
cognitive model, 421, 435as linguistic model, 432–4
task analysis, 125, 511data collection in, 532–8
initial analysis, 537interviews for, 536sorting and classification, 537–8W/E, 533–6
documentation for, 532–3features, 511–12and GOMS, 423information sources in, 532–8uses, 538–41
interface design, 540–1manuals and tuition, 538–40requirements capture and
systems design, 540task analysis for knowledge
description (TAKD), 521–3,643
task–artifact cycle, 254task completeness in design rules, 273task conformance in design rules, 270,
273task decomposition, 511, 512–19
task descriptive hierarchy (TDH),521–3
task language, 125task migratability in design rules, 266,
268task-specific help, 396tasks, 125taste, 368TCP (Transmission Control
Protocol), 118, 178TeamWorkStation, 684, 699technological determinism, 460Tegic Communications, 672telnet, 137temporal logic, 605–6temporal notation, 608
deontics, 607–8real time, 607
temporal operators, 606temporal triggers, 645text
readability of, 101on web, 772–3
text-based communication, 495–504affective state, 495–7back channels, 495–7context and deixis, 500–1grounding constants, 497–8pace and granularity, 501–4turn-taking, 499
text entry devices, 63–71texting, 671–4textual notations, 565–73
CSP and event algebras, 570–2grammars, 565–6paramaterized and dynamic
interleaved structure, 573production rules, 566–70
texture, 93, 96theories of multi-party interaction, 503thermoceptors, 25Thimbleby, Harold, 248, 269, 611think aloud evaluation, 343, 361thinking, 39–51
errors and mental models, 49–51problem solving, 43–6reasoning, 39–42skill acquisition, 46–8
three-state model, 441–33D displays, 89–91
in screen design, 219
3D interfaces, 142–43D mouse, 87–83D space, positioning in, 87–9throw-away prototyping, 241thumbwheel, 74–5Tidwell, J., 285, 286tiling, 146, 295time and data visualization, 742–5time sharing, 165–6, 518time/space matrix in groupware,
664–5, 691–3W/E, 694–5
Tivoli capture system, 731toolbars, 151toolkits, 302–6
for interactivity, 168look and feel, 303W/E, 305–6
total time hypothesis, 36touch, 25–6
in universal design, 368, 379–81touchpad, 73–4touchscreens, 75–6
three-state model of, 441TOWER (Theatre of Work Enabling
Relationships), 701–2trackball, 74–5
three-state model of, 443Tracksys, 346Training Wheels, 401trajectory independent systems, 619transaction-processing environment,
561transformations in SSM, 465transitions in Petri nets, 557transparency in models of interaction,
612triggers and rich contexts, 644–5Tsukahara, W., 97Tufte, E.R., 217tuition, task analysis for, 538–40turn-taking
face-to-face, 479, 480–2text-based, 499
tutorial assistance, 396two-point threshold test, 25tympanic membrane, 23
Uubiquitous computing
applications research, 717–33

Index 833
evaluation, 731–3as paradigm, 180–4physical interaction, defining,
718–24themes, 724–9understanding interaction in,
729–31UIDS (user interface development
system), 307UIMS see user interface management
systemundo as interaction model, 616–17UNICODE, 112Uniform Resource Locator (URL),
178, 784uninterrupted speech in universal
design, 374–5unit task, 422, 429universal design, 366
and diversity, 384–93children, 391and cultural differences, 391–2disability, 384–90older people, 390–1
multi-modal interaction, 368–83gesture recognition, 383, 387handwriting, 381–3sound, 370–9touch, 379–81
principles, 366–8UNIX, 141–2, 269, 432, 566, 669, 711UNIX man help system, 399, 405unobtrusiveness in user support, 398–9unsequenced transcripts, 698URL (Uniform Resource Locator),
178, 784US Air Force, 166, 278usability engineering, 237–41
design rules supporting, 260–75metrics for, 239, 240problems with, 240–1
Usenet News, 667user
and design, 195in interaction framework, 127–9
user action/control in screen design,216–17
user-centered design, 237user focus of design, 197–201user interface development system
(UIDS), 307
user interface management system(UIMS), 247, 306–13
as conceptual architecture, 307–11components, 308implementation considerations,
311–13user participation in evaluation,
327–57experimental evaluation, 329–43observational techniques, 343–7,
361physiological response evaluation,
352–7, 362query techniques, 347–52, 361
user pre-emptive dialog, 266user support, 396–7
adaptive help systems, 404–11effects of, 411initiative and control, 411knowledge representation see
knowledge representationscope of, 411
approaches to, 399–404assistants, 403–4command assistance, 399command prompts, 399context-sensitive help, 400online documentation, 401–2online tutorials, 400–1wizards, 403
design of systems, 412–14implementation, 414presentation, 412–13
requirements for, 397–9types, 396
utility in screen design, 218–19utterances, 483, 487, 490
Vvalidation of software design,
230–3variables in evaluation, 330, 334VDM, 576, 597vector display, 84verification of software, 230–3, 596vi, 152video compression, 674video conferencing, 674–7video display units (VDUs)
health hazards, 82for interaction, 166–7
video in hypertext, 752–4video phones, 674video recorder, programming,
130video tunnel, 676video wall, 457, 676, 678video whiteboard, 683–4video window, 676virtual Christmas crackers, 157–8virtual collaborative environments,
677–8virtual controls in 3D, 87virtual reality, 25
applications, 737–8command and control, 736desktop VR, 735devices, 87–91force feedback in, 92–3immersive VR, 734–5as metaphor, 170motion sickness, 90–1technology for, 733–4
virtual reality caves, 91virtual reality headsets, 89, 734Virtual Reality Mark-up Language
(VRML), 735virtual space, 677virtual wind tunnel, 738–9, 744Visible Human Project, 743–4Visicalc, 254vision, 14–23
human eye, 14–15reading, 22–3visual perception, 15–18visual processing, 19–22
Vision of the Future (Philips), 733visual angle, 16Visual Basic, 785visual impairment, 384–7
and mathematics, 386von Neumann bottleneck, 110VRML (Virtual Reality Mark-up
Language), 735
Wwaiting for events HTA, 517WAP (Wide Area Protocol), 771Ward, N., 97Ward, Robert, 355, 356Wason, P.C., 41, 42Watchfire, 374
834 Index
waterfall model of software life cycle,228
Watson, D., 739wearable computers, 736Web Accessibility in Mind project, 374Web Accessibility Initiative (WAI), 374web server, 769WebBook, 143Weiser, Mark, 181, 184, 717–18,
721, 731Weltanschauung in SSM, 465what you see is what I see
(WYSIWIS), 500, 505, 681,687, 696
what you see is what you get(WYSIWYG), 102, 172, 611
white space in screen design, 215Whiteside, J., 237, 239, 240whole-body tracking, 89widgets, 145, 203, 707Wilcoxon test, 335WIMP interface, 141–2, 145–52
building, 291–6architecture, 292–6in client–server architecture,
293–4imaging models, 291toolkits, 302–6user interface management
system, 306–13buttons, 150dialog boxes, 152icons, 146menus, 148–50palettes, 152as paradigm for interaction, 169
pointers, 147–8toolbars, 151windows, 145–6
window manager, 295windows, 145–6
help system, 399as interaction model, 617navigation of, 203
Winograd, Terry, 491, 493within-subjects methods of
evaluation, 331, 337–8Wizard of Oz technique, 246, 327wizards, 403workflow systems, 456working memory, 506Workplace project, 346workshops for interactive
systems, 467workstation faults in groupware,
709–10world wide web
clients, 769dynamic content, 778–87
automatic web production, 783–4batch generation, 785–6search, 782–3
fixed content, 788–2network issues, 769–70as paradigm, 178–9servers, 769static content, 771–8
graphics, 773–6icons, 775–6movies and sound, 777–8text, 772–3
technology, 768–71
write-once-read-many (WORM)devices, 109
Wüthrich, C.A., 621WYSIWIS (what you see is what I see),
500, 505, 681, 687, 696WYSIWYG (what you see is what you
get), 102, 172, 611
XX protocol, 294X Windows, 141, 294–5, 303, 703Xanadu, 176Xerox Corporation, 169Xerox PARC, 105, 113, 168–9, 347,
650, 680in ubiquitous computing, 181–4,
720–2, 725, 728, 741XML (eXtended Mark-up Language),
112, 768XView toolkit, 303, 708
YYahoo!, 667, 671, 760, 765Yakemovic, K.C.B., 251York, W., 143York Conferencer system, 495–396Young, R.M., 446
ZZ system, 597Zdraw example
algebraic notation, 603–4model-oriented notation,
599–600zone of proximal development,
156