Howard County
330
OFFICIAL STATEMENT DATED APRIL 27, 2020 New Issues – Book-Entry Only In the opinion of Bond Counsel, (i) under existing statutes, regulations and decisions the Tax-Exempt Bonds, their transfer, the interest payable on them, and any income derived from the, including any profit realized in their sale or exchange, shall be exempt from taxation of any kind by the State of Maryland, any of its political subdivision, or any other public entity; no opinion is expressed as to estate or inheritance taxes, or any other taxes not levied or assessed directly on the Tax-Exempt Bonds or the interest thereon; (ii) under existing law, interest on the Taxable Bonds and profit realized from the sale or exchange of the Taxable Bonds will be exempt from State of Maryland income taxation; no opinion is expressed as to estate or inheritance taxes, or any other taxes not levied or assessed directly on the Taxable Bonds or the interest thereon; and (iii) assuming compliance with certain covenants described herein, under existing statutes, regulations and decisions, interest on the Tax-Exempt Bonds will be excludable from gross income for federal income tax purposes. Interest on the Taxable Bonds will be includable in gross income for federal income tax purposes. Under existing law, interest on the Tax-Exempt Bonds for federal income tax purposes is not includable in alternative minimum taxable income of individuals as an enumerated item of tax preference or other specific adjustment; and interest on the Tax-Exempt Bonds will be includable in the applicable tax base for the purpose of determining the branch profits tax imposed on certain foreign corporations engaged in a trade or business in the United States of America. See “Tax Matters.” $255,470,000 General Obligation Bonds $117,230,000 Consolidated Public Improvement Project Bonds, 2020 Series A (Tax-Exempt) $51,130,000 Metropolitan District Project Bonds, 2020 Series B (Tax-Exempt) $63,050,000 Consolidated Public Improvement Project and Refunding Bonds, 2020 Series C (Taxable) $24,060,000 Metropolitan District Refunding Bonds, 2020 Series D (Taxable) Dated: Date of Delivery Due: August 15, as shown herein Payable: Interest on and principal of the Bonds will be paid by the County to The Depository Trust Company (“DTC”), New York, New York, as securities depository. Disbursement of such payments will be made by DTC to its Participants which in turn will provide for payment to the Beneficial Owners of the Bonds, all as described herein. Beneficial Owners will not receive certificates evidencing their interests in Bonds purchased. Redemption: The Bonds maturing on and after August 15, 2031 are subject to optional redemption on or any time after August 15, 2030 at the redemption prices as set forth herein. Purpose: Proceeds of the Bonds are being used to (1) pay or reimburse the County for the cost of certain public improvements, (2) repay all or a portion of the County’s outstanding general obligation bond anticipation notes, (3) provide funds, together with investment earnings thereon, that will be sufficient to refund certain general obligation bonds as described herein, and (4) pay costs of issuance related to the Bonds. Security: The Bonds are general obligations of the County, and its full faith and credit and unlimited taxing power are irrevocably pledged to the punctual payment of principal of and interest on the Bonds when due. Denomination: Integral multiples of $5,000 Interest Payable: August 15 and February 15 First Interest Payment Due: August 15, 2020 _____________________________________________________________ FOR MATURITY SCHEDULES SEE INSIDE COVER This cover page contains information for quick reference only. It is not a summary of the Bonds. Investors must read the entire Official Statement to obtain information essential to making an informed investment decision. The Bonds are offered for delivery when, as and if issued, subject to the approving opinions of McKennon Shelton & Henn LLP, Baltimore, Maryland, Bond Counsel, the approval of certain legal matters by McGuireWoods LLP, Baltimore, Maryland, counsel to the Underwriters, and certain other conditions. Davenport & Company, Towson, Maryland, served as financial advisor to the County in connection with the issuance of the Bonds. The Bonds in definitive form will be available for delivery through the facilities of DTC on or about May 7, 2020. Citigroup Barclays M&T Securities, Inc. Siebert Williams Shank & Co., LLC RATINGS: (See the section “RATINGS”) Fitch Ratings…………...………………AAA Moody’s………………………………....Aaa S&P Global Ratings.……......…………. AAA
-
Upload
khangminh22 -
Category
Documents
-
view
2 -
download
0
Transcript of Howard County

OFFICIAL STATEMENT DATED APRIL 27, 2020 New Issues – Book-Entry Only In the opinion of Bond Counsel, (i) under existing statutes, regulations and decisions the Tax-Exempt Bonds, their transfer, the interest payable on them, and any income derived from the, including any profit realized in their sale or exchange, shall be exempt from taxation of any kind by the State of Maryland, any of its political subdivision, or any other public entity; no opinion is expressed as to estate or inheritance taxes, or any other taxes not levied or assessed directly on the Tax-Exempt Bonds or the interest thereon; (ii) under existing law, interest on the Taxable Bonds and profit realized from the sale or exchange of the Taxable Bonds will be exempt from State of Maryland income taxation; no opinion is expressed as to estate or inheritance taxes, or any other taxes not levied or assessed directly on the Taxable Bonds or the interest thereon; and (iii) assuming compliance with certain covenants described herein, under existing statutes, regulations and decisions, interest on the Tax-Exempt Bonds will be excludable from gross income for federal income tax purposes. Interest on the Taxable Bonds will be includable in gross income for federal income tax purposes. Under existing law, interest on the Tax-Exempt Bonds for federal income tax purposes is not includable in alternative minimum taxable income of individuals as an enumerated item of tax preference or other specific adjustment; and interest on the Tax-Exempt Bonds will be includable in the applicable tax base for the purpose of determining the branch profits tax imposed on certain foreign corporations engaged in a trade or business in the United States of America. See “Tax Matters.”
$255,470,000 General Obligation Bonds
$117,230,000 Consolidated Public Improvement Project Bonds, 2020 Series A (Tax-Exempt)
$51,130,000 Metropolitan District Project Bonds, 2020 Series B (Tax-Exempt) $63,050,000 Consolidated Public Improvement Project and Refunding Bonds, 2020 Series C (Taxable)
$24,060,000 Metropolitan District Refunding Bonds, 2020 Series D (Taxable)
Dated: Date of Delivery Due: August 15, as shown herein Payable: Interest on and principal of the Bonds will be paid by the County to The Depository Trust
Company (“DTC”), New York, New York, as securities depository. Disbursement of such payments will be made by DTC to its Participants which in turn will provide for payment to the Beneficial Owners of the Bonds, all as described herein. Beneficial Owners will not receive certificates evidencing their interests in Bonds purchased.
Redemption: The Bonds maturing on and after August 15, 2031 are subject to optional redemption on
or any time after August 15, 2030 at the redemption prices as set forth herein. Purpose: Proceeds of the Bonds are being used to (1) pay or reimburse the County for the cost of
certain public improvements, (2) repay all or a portion of the County’s outstanding general obligation bond anticipation notes, (3) provide funds, together with investment earnings thereon, that will be sufficient to refund certain general obligation bonds as described herein, and (4) pay costs of issuance related to the Bonds.
Security: The Bonds are general obligations of the County, and its full faith and credit and unlimited
taxing power are irrevocably pledged to the punctual payment of principal of and interest on the Bonds when due.
Denomination: Integral multiples of $5,000 Interest Payable: August 15 and February 15 First Interest Payment Due: August 15, 2020
_____________________________________________________________ FOR MATURITY SCHEDULES SEE INSIDE COVER
This cover page contains information for quick reference only. It is not a summary of the Bonds. Investors must read the entire Official Statement to obtain information essential to making an informed investment decision. The Bonds are offered for delivery when, as and if issued, subject to the approving opinions of McKennon Shelton & Henn LLP, Baltimore, Maryland, Bond Counsel, the approval of certain legal matters by McGuireWoods LLP, Baltimore, Maryland, counsel to the Underwriters, and certain other conditions. Davenport & Company, Towson, Maryland, served as financial advisor to the County in connection with the issuance of the Bonds. The Bonds in definitive form will be available for delivery through the facilities of DTC on or about May 7, 2020.
Citigroup Barclays M&T Securities, Inc. Siebert Williams Shank & Co., LLC
RATINGS: (See the section “RATINGS”) Fitch Ratings…………...………………AAA Moody’s………………………………....Aaa S&P Global Ratings.……......………….AAA

Maturity Schedules
* Yield to August 15, 2030, the first optional call date.
** CUSIP numbers are copyrighted by the American Bankers Association. CUSIP data is provided by CUSIP Global Services. The
CUSIP data listed above are being provided solely for the convenience of Bondholders only at the time of issuance of the Bonds and
the County makes no representation with respect to such CUSIP data nor undertakes any responsibility for its accuracy now or at any
time in the future. The CUSIP numbers are subject to being changed after the issuance of the Bonds as a result of various subsequent
actions including, but not limited to, a refunding in whole or in part of the Bonds. This information is not intended to create a database
and does not serve in any way as a substitute for the CUSIP Global Services database.
Due Principal Interest Due Principal Interest
Aug. 15 Amount CUSIP** Rate Aug. 15 Amount CUSIP** Rate
2020 4,705,000$ 44256PVL4 5.000 % 0.820 % 2030 5,780,000$ 44256PVW0 5.000 % 1.500 %
2021 3,685,000 44256PVM2 5.000 0.870 2031 6,080,000 44256PVX8 5.000 1.590 *
2022 3,875,000 44256PVN0 5.000 0.970 2032 6,390,000 44256PVY6 5.000 1.690 *
2023 4,075,000 44256PVP5 5.000 1.050 2033 6,715,000 44256PVZ3 5.000 1.790 *
2024 4,285,000 44256PVQ3 5.000 1.090 2034 7,025,000 44256PWA7 4.000 2.030 *
2025 4,505,000 44256PVR1 5.000 1.140 2035 7,315,000 44256PWB5 4.000 2.130 *
2026 4,735,000 44256PVS9 5.000 1.200 2036 7,610,000 44256PWC3 4.000 2.220 *
2027 4,975,000 44256PVT7 5.000 1.270 2037 7,920,000 44256PWD1 4.000 2.280 *
2028 5,230,000 44256PVU4 5.000 1.360 2038 8,245,000 44256PWE9 4.000 2.320 *
2029 5,500,000 44256PVV2 5.000 1.440 2039 8,580,000 44256PWF6 4.000 2.360 *
Due Principal Interest Due Principal Interest
Aug. 15 Amount CUSIP** Rate Aug. 15 Amount CUSIP** Rate
2020 1,260,000$ 44256PWG4 5.000 % 0.820 % 2031 1,435,000$ 44256PWT6 5.000 % 1.590 %*
2021 870,000 44256PWH2 5.000 0.870 2032 1,510,000 44256PWU3 5.000 1.690 *
2022 915,000 44256PWJ8 5.000 0.970 2033 1,585,000 44256PWV1 5.000 1.790 *
2023 960,000 44256PWK5 5.000 1.050 2034 1,665,000 44256PWW9 5.000 1.830 *
2024 1,010,000 44256PWL3 5.000 1.090 2035 1,735,000 44256PWX7 3.000 2.480 *
2025 1,060,000 44256PWM1 5.000 1.140 2036 1,785,000 44256PWY5 3.000 2.540 *
2026 1,115,000 44256PWN9 5.000 1.200 2037 1,840,000 44256PWZ2 3.000 2.600 *
2027 1,175,000 44256PWP4 5.000 1.270 2038 1,895,000 44256PXA6 3.000 2.640 *
2028 1,235,000 44256PWQ2 5.000 1.360 2039 1,955,000 44256PXB4 3.000 2.710 *
2029 1,300,000 44256PWR0 5.000 1.440 2040 2,015,000 44256PXC2 3.000 2.770 *
2030 1,365,000 44256PWS8 5.000 1.500
$4,500,000 Term Bond due August 15, 2045; CUSIP** 44256PXD0; Interest Rate: 4.000%; Yield: 2.580%*
$16,945,000 Term Bond due August 15, 2049; CUSIP** 44256PXE8; Interest Rate: 3.000%; Yield: 3.050%
$117,230,000 Consolidated Public Improvement Project Bonds, 2020 Series A (Tax-Exempt)
Yield Yield
$51,130,000 Metropolitan District Project Bonds, 2020 Series B (Tax-Exempt)
Yield Yield

Maturity Schedules
* CUSIP numbers are copyrighted by the American Bankers Association. CUSIP data is provided by CUSIP Global Services. The
CUSIP data listed above are being provided solely for the convenience of Bondholders only at the time of issuance of the Bonds and
the County makes no representation with respect to such CUSIP data nor undertakes any responsibility for its accuracy now or at any
time in the future. The CUSIP numbers are subject to being changed after the issuance of the Bonds as a result of various subsequent
actions including, but not limited to, a refunding in whole or in part of the Bonds. This information is not intended to create a database
and does not serve in any way as a substitute for the CUSIP Global Services database.
Due Principal Interest Due Principal Interest
Aug. 15 Amount CUSIP* Rate Aug. 15 Amount CUSIP* Rate
2023 13,070,000$ 44256PXG3 1.337 % 1.337 % 2030 3,345,000$ 44256PXP3 2.060 % 2.060 %
2024 10,540,000 44256PXH1 1.454 1.454 2031 3,415,000 44256PXQ1 2.160 2.160
2025 6,810,000 44256PXJ7 1.554 1.554 2032 240,000 44256PXR9 2.310 2.310
2026 3,090,000 44256PXK4 1.763 1.763 2033 245,000 44256PXS7 2.410 2.410
2027 3,150,000 44256PXL2 1.913 1.913 2034 250,000 44256PXT5 2.510 2.510
2028 3,215,000 44256PXM0 1.960 1.960 2035 260,000 44256PXU2 2.590 2.590
2029 3,275,000 44256PXN8 1.990 1.990
Due Principal Interest Due Principal Interest
Aug. 15 Amount CUSIP* Rate Aug. 15 Amount CUSIP* Rate
2023 1,075,000$ 44256PXX6 1.337 % 1.337 % 2030 1,495,000$ 44256PYE7 2.060 % 2.060 %
2024 950,000 44256PXY4 1.454 1.454 2031 1,530,000 44256PYF4 2.160 2.160
2025 970,000 44256PXZ1 1.554 1.554 2032 1,390,000 44256PYG2 2.310 2.310
2026 960,000 44256PYA5 1.763 1.763 2033 2,705,000 44256PYH0 2.410 2.410
2027 740,000 44256PYB3 1.913 1.913 2034 2,615,000 44256PYJ6 2.510 2.510
2028 670,000 44256PYC1 1.960 1.960 2035 2,685,000 44256PYK3 2.590 2.590
2029 1,375,000 44256PYD9 1.990 1.990
$3,310,000 Term Bond due August 15, 2041; CUSIP* 44256PYL1; Interest Rate: 3.158%; Yield: 3.158%
$63,050,000 Consolidated Public Improvement Project and Refunding Bonds, 2020 Series C (Taxable)
Yield Yield
$11,035,000 Term Bond due August 15, 2022; CUSIP* 44256PXF5; Interest Rate: 1.224%; Yield: 1.224%
$24,060,000 Metropolitan District Refunding Bonds, 2020 Series D (Taxable)
$1,110,000 Term Bond due August 15, 2039; CUSIP* 44256PXV0; Interest Rate: 3.108%; Yield: 3.108%
Yield Yield
$1,590,000 Term Bond due August 15, 2022; CUSIP* 44256PXW8; Interest Rate: 1.224%; Yield: 1.224%

Howard County, Maryland
3430 Court House Drive
Ellicott City, Maryland 21043
Telephone (410) 313-2195
Fax (410) 313-4433
County Executive
Calvin Ball
County Council
Deb Jung, Chairperson
Liz Walsh, Vice Chairperson
Opel Jones, Council Member
Christiana Rigby, Council Member
David Yungmann, Council Member
Certain Appointed Officials
Janet R. Irvin, Director of Finance
Gary Kuc, County Solicitor
Lonnie R. Robbins, Chief Administrative Officer
Diane Jones, Administrator to the County Council
Dr. Holly Sun, Budget Administrator Financial Advisor
Davenport & Company LLC
8600 LaSalle Road, Suite 618
Towson, MD 21286
Telephone (410) 296-9426
Fax (866) 932-6660
Bond Counsel
McKennon Shelton & Henn LLP
401 East Pratt Street, Suite 2600
Baltimore, Maryland 21202
Telephone (410) 843-3500
Fax (410) 843-3501
Independent Auditor
CliftonLarsonAllen LLP
1966 Greenspring Drive, Suite 300
Timonium, Maryland 21093
Telephone (410) 453-0900
Fax (410) 453-0914
Escrow Agent and Bond Registrar
Manufacturers and Traders Trust Co.
25 S. Charles Street
Baltimore, Maryland 21201
Telephone (410) 244-3712
Fax (410) 244-3725
Verification Agent
Bingham Arbitrage Rebate Services, Inc.
1506 West Main Street
Richmond, VA 23220
Telephone (804) 864-9567
Fax (804) 288-5020
No dealer, broker, salesman or other person has been authorized by the County to give any information or to make any representations with
respect to the County or the Bonds, other than those contained in this
Official Statement. If given or made, such other information or representations must not be relied upon as having been authorized by
any of the foregoing. This Official Statement does not constitute an offer
to sell or the solicitation of any offer to buy, nor shall there be any sale of, the Bonds described herein by any person in any jurisdiction in which
it is unlawful for such person to make such offer, solicitation or sale.
All quotations from and summaries and explanations of provisions of
laws and documents herein do not purport to be complete and reference is made to such laws and documents for full and complete statements of
their provisions. The County believes that the information contained in
this Official Statement is complete and accurate and that information obtained from other sources is reliable. However, the County does not
guarantee the accuracy or completeness of information obtained from
other sources and such information should not be considered to be a representation of the County. Any statements made in this Official
Statement involving estimates or matters of opinion, whether or not
expressly so stated, are intended merely as estimates or opinion and not as representations of fact. The information and expressions of opinion
contained herein are subject to change without notice. Neither the
delivery of this Official Statement nor any sale of the Bonds shall under any circumstances create any implication that there has been no change
in the affairs of the County since the respective dates as of which such
information is given herein. This Official Statement is not to be construed as a contract or agreement between the County and the
purchasers or holders of any of the Bonds. Furthermore, this Official
Statement does not contain any investment advice for purchasers or holders of any of the Bonds. Such persons should consult their own
financial advisors regarding possible financial consequences of
ownership of the Bonds.
The cover page hereof, the list of officials, this page and the appendices
attached hereto are part of this Official Statement. The order and placement of materials in this Official Statement, including the
appendices, are not to be deemed a determination of relevance,
materiality or importance, and this Official Statement, including the appendices, must be considered in its entirety. The captions and
headings in this Official Statement are for convenience only and in no
way define, limit or describe the scope or intent, or affect the meaning or construction, of any provisions or sections of this Official Statement.
The offering of the Bonds is made only by means of this entire Official
Statement.
In connection with the offering of the Bonds, the Underwriters may
over-allot or effect transactions that stabilize or maintain the market price of the Bonds at levels above that which might otherwise prevail in
the open market. Such stabilizing, if commenced, may be discontinued
at any time.
The Underwriters have reviewed the information in this Official
Statement in accordance with and as part of their responsibility to investors under federal securities laws as applied to the facts and
circumstances of this transaction, but the Underwriters do not guarantee
the accuracy or completeness of such information.
CUSIP is a registered trademark of the American Bankers Association.
CUSIP data herein are provided by CUSIP Global Services, which is managed on behalf of the American Bankers Association by S&P Global
Market Intelligence and the County takes no responsibility for the accuracy thereof. These data are not intended to create a database and
do not serve in any way as a substitute for CUSIP Global Services. No registration statement relating to the Bonds has been filed with the
United States Securities and Exchange Commission (the “SEC”) or with any state security agency. The Bonds have not been approved or
disapproved by the SEC or any state securities agency nor has the SEC
or any state securities agency passed upon the accuracy or adequacy of this Official Statement. Any representation to the contrary may be a
criminal offense.
i

INFORMATION CONCERNING OFFERING RESTRICTIONS IN CERTAIN
JURISDICTIONS OUTSIDE THE UNITED STATES
REFERENCES UNDER THIS CAPTION TO THE “ISSUER” MEAN HOWARD COUNTY,
MARYLAND AND REFERENCES TO “BONDS” OR “SECURITIES” MEAN THE BONDS, AS
DEFINED HEREIN AND OFFERED HEREBY.
THE UNDERWRITERS HAVE PROVIDED THE INFORMATION SET FORTH ON THIS AND
THE FOLLOWING THREE PAGES FOR INCLUSION IN THIS OFFICIAL STATEMENT.
NOTICE TO INVESTORS IN THE EUROPEAN ECONOMIC AREA (“EEA”)
THIS OFFICIAL STATEMENT IS NOT A PROSPECTUS FOR THE PURPOSES OF EUROPEAN
COMMISSION REGULATION 809/2004 OR EUROPEAN COMMISSION DIRECTIVE 2003/71/EC
(AS AMENDED, INCLUDING BY EUROPEAN COMMISSION DIRECTIVE 2010/73/EU, AS
APPLICABLE) (THE “PROSPECTUS DIRECTIVE”). IT HAS BEEN PREPARED ON THE BASIS
THAT ALL OFFERS OF THE BONDS WILL BE MADE PURSUANT TO AN EXEMPTION
UNDER ARTICLE 3 OF THE PROSPECTUS DIRECTIVE, AS IMPLEMENTED IN MEMBER
STATES OF THE EEA, FROM THE REQUIREMENT TO PRODUCE A PROSPECTUS FOR SUCH
OFFERS. THIS OFFICIAL STATEMENT IS ONLY ADDRESSED TO AND DIRECTED AT
PERSONS IN MEMBER STATES OF THE EEA WHO ARE “QUALIFIED INVESTORS” WITHIN
THE MEANING OF ARTICLE 2(1)(E) OF THE PROSPECTUS DIRECTIVE AND ANY
RELEVANT IMPLEMENTING MEASURE IN EACH MEMBER STATE OF THE EEA
(“QUALIFIED INVESTORS”). THIS OFFICIAL STATEMENT MUST NOT BE ACTED ON OR
RELIED ON IN ANY SUCH MEMBER STATE OF THE EEA BY PERSONS WHO ARE NOT
QUALIFIED INVESTORS. ANY INVESTMENT OR INVESTMENT ACTIVITY TO WHICH THIS
OFFICIAL STATEMENT RELATES IS AVAILABLE ONLY TO QUALIFIED INVESTORS IN
ANY MEMBER STATE OF THE EEA AND WILL NOT BE ENGAGED IN WITH ANY OTHER
PERSONS.
NOTICE TO PROSPECTIVE INVESTORS IN THE UNITED KINGDOM
THIS OFFICIAL STATEMENT HAS NOT BEEN APPROVED FOR THE PURPOSES OF SECTION
21 OF THE FINANCIAL SERVICES AND MARKETS ACT 2000 (“FSMA”) AND DOES NOT
CONSTITUTE AN OFFER TO THE PUBLIC IN ACCORDANCE WITH THE PROVISIONS OF
SECTION 85 OF THE FSMA. THIS OFFICIAL STATEMENT IS FOR DISTRIBUTION ONLY TO,
AND IS DIRECTED SOLELY AT, PERSONS IN THE UNITED KINGDOM THAT ARE
QUALIFIED INVESTORS WITHIN THE MEANING OF ARTICLE 2(1)(E) OF THE PROSPECTUS
DIRECTIVE WHO ARE ALSO (I) INVESTMENT PROFESSIONALS, AS SUCH TERM IS
DEFINED IN ARTICLE 19(5) OF THE FINANCIAL SERVICES AND MARKETS ACT 2000
(FINANCIAL PROMOTION) ORDER 2005, AS AMENDED (THE “FINANCIAL PROMOTION
ORDER”) OR (I) HIGH NET WORTH ENTITIES, AND OTHER PERSONS TO WHOM IT MAY
LAWFULLY BE COMMUNICATED, FALLING WITHIN ARTICLE 49(2)(A) TO (D) OF THE
FINANCIAL PROMOTION ORDER (ALL SUCH PERSONS TOGETHER BEING REFERRED TO
AS “RELEVANT PERSONS”). THIS OFFICIAL STATEMENT IS DIRECTED ONLY AT
RELEVANT PERSONS AND MUST NOT BE ACTED ON OR RELIED ON BY PERSONS WHO
ARE NOT RELEVANT PERSONS, INCLUDING IN CIRCUMSTANCES IN WHICH SECTION
21(1) OF THE FSMA APPLIES TO THE ISSUER. THIS OFFICIAL STATEMENT AND ITS
CONTENTS ARE CONFIDENTIAL AND SHOULD NOT BE DISTRIBUTED, PUBLISHED OR
REPRODUCED (IN WHOLE OR IN PART) OR DISCLOSED BY RECIPIENTS TO ANY OTHER
PERSONS IN THE UNITED KINGDOM. IN THE UNITED KINGDOM, ANY INVESTMENT OR
INVESTMENT ACTIVITY TO WHICH THIS OFFICIAL STATEMENT RELATES IS AVAILABLE
ii

ONLY TO RELEVANT PERSONS AND WILL BE ENGAGED IN ONLY WITH RELEVANT
PERSONS. ANY PERSON WHO IS NOT A RELEVANT PERSON SHOULD NOT ACT OR RELY
ON THIS OFFICIAL STATEMENT OR ANY OF ITS CONTENTS.
NOTICE TO PROSPECTIVE INVESTORS IN HONG KONG
THE BONDS (EXCEPT FOR BONDS WHICH ARE A “STRUCTURED PRODUCT” AS DEFINED
IN THE SECURITIES AND FUTURES ORDINANCE (CAP. 571 OF THE LAWS OF HONG KONG)
(“SECURITIES AND FUTURES ORDINANCE”)) MAY NOT BE OFFERED OR SOLD IN HONG
KONG BY MEANS OF ANY DOCUMENT OTHER THAN (I) IN CIRCUMSTANCES WHICH DO
NOT CONSTITUTE AN OFFER TO THE PUBLIC WITHIN THE MEANING OF THE COMPANIES
(WINDING UP AND MISCELLANEOUS PROVISIONS) ORDINANCE (CAP. 32 OF THE LAWS
OF HONG KONG) (“COMPANIES (WINDING UP AND MISCELLANEOUS PROVISIONS)
ORDINANCE”) OR (II) TO “PROFESSIONAL INVESTORS” AS DEFINED IN THE SECURITIES
AND FUTURES ORDINANCE AND ANY RULES MADE THEREUNDER, OR (III) IN OTHER
CIRCUMSTANCES WHICH DO NOT RESULT IN THE DOCUMENT BEING A “PROSPECTUS”
AS DEFINED IN THE COMPANIES (WINDING UP AND MISCELLANEOUS PROVISIONS)
ORDINANCE, AND NO ADVERTISEMENT, INVITATION OR DOCUMENT RELATING TO
THE BONDS MAY BE ISSUED OR MAY BE IN THE POSSESSION OF ANY PERSON FOR THE
PURPOSE OF ISSUE (IN EACH CASE WHETHER IN HONG KONG OR ELSEWHERE), WHICH
IS DIRECTED AT, OR THE CONTENTS OF WHICH ARE LIKELY TO BE ACCESSED OR READ
BY, THE PUBLIC OF HONG KONG (EXCEPT IF PERMITTED TO DO SO UNDER THE
SECURITIES LAWS OF HONG KONG) OTHER THAN WITH RESPECT TO BONDS WHICH
ARE OR ARE INTENDED TO BE DISPOSED OF ONLY TO PERSONS OUTSIDE HONG KONG
OR ONLY TO “PROFESSIONAL INVESTORS” AS DEFINED IN THE SECURITIES AND
FUTURES ORDINANCE AND ANY RULES MADE THEREUNDER.
NOTICE TO INVESTORS IN SWITZERLAND
THE BONDS MAY NOT BE PUBLICLY OFFERED IN SWITZERLAND AND WILL NOT BE
LISTED ON THE SIX SWISS EXCHANGE (“SIX”) OR ON ANY OTHER STOCK EXCHANGE
OR REGULATED TRADING FACILITY IN SWITZERLAND. THIS OFFICIAL STATEMENT HAS
BEEN PREPARED WITHOUT REGARD TO THE DISCLOSURE STANDARDS FOR ISSUANCE
PROSPECTUSES UNDER ART. 652A OR ART. 1156 OF THE SWISS CODE OF OBLIGATIONS
OR THE DISCLOSURE STANDARDS FOR LISTING PROSPECTUSES UNDER ART. 27 FF. OF
THE SIX LISTING RULES OR THE LISTING RULES OF ANY OTHER STOCK EXCHANGE OR
REGULATED TRADING FACILITY IN SWITZERLAND. NEITHER THIS OFFICIAL
STATEMENT NOR ANY OTHER OFFERING OR MARKETING MATERIAL RELATING TO THE
BONDS OR THE OFFERING MAY BE PUBLICLY DISTRIBUTED OR OTHERWISE MADE
PUBLICLY AVAILABLE IN SWITZERLAND.
NONE OF THIS OFFICIAL STATEMENT OR ANY OTHER OFFERING OR MARKETING
MATERIAL RELATING TO THE OFFERING, THE ISSUER OR THE BONDS HAVE BEEN OR
WILL BE FILED WITH OR APPROVED BY ANY SWISS REGULATORY AUTHORITY. IN
PARTICULAR, THIS OFFICIAL STATEMENT WILL NOT BE FILED WITH, AND THE OFFER
OF THE BONDS WILL NOT BE SUPERVISED BY, THE SWISS FINANCIAL MARKET
SUPERVISORY AUTHORITY (“FINMA”), AND THE OFFER OF BONDS HAS NOT BEEN AND
WILL NOT BE AUTHORIZED UNDER THE SWISS FEDERAL ACT ON COLLECTIVE
INVESTMENT SCHEMES (“CISA”). ACCORDINGLY, INVESTORS DO NOT HAVE THE
BENEFIT OF THE SPECIFIC INVESTOR PROTECTION PROVIDED UNDER THE CISA.
iii

NOTICE TO INVESTORS IN SINGAPORE
THIS OFFICIAL STATEMENT HAS NOT BEEN AND WILL NOT BE REGISTERED AS A
PROSPECTUS WITH THE MONETARY AUTHORITY OF SINGAPORE. ACCORDINGLY, THIS
OFFICIAL STATEMENT AND ANY OTHER DOCUMENT OR MATERIAL USED IN
CONNECTION WITH THE OFFER OR SALE, OR INVITATION FOR SUBSCRIPTION OR
PURCHASE, OF THE BONDS MAY NOT BE CIRCULATED OR DISTRIBUTED, NOR MAY THE
BONDS BE OFFERED OR SOLD, OR BE MADE THE SUBJECT OF AN INVITATION FOR
SUBSCRIPTION OR PURCHASE, WHETHER DIRECTLY OR INDIRECTLY, TO PERSONS IN
SINGAPORE OTHER THAN (I) TO AN INSTITUTIONAL INVESTOR AS DEFINED IN SECTION
4A OF THE SECURITIES AND FUTURES ACT (CHAPTER 289) OF SINGAPORE, AS MODIFIED
OR AMENDED FROM TIME TO TIME (THE “SFA”) PURSUANT TO SECTION 274 OF THE SFA,
(II) TO A RELEVANT PERSON PURSUANT (AS DEFINED IN SECTION 275(2) OF THE SFA)
TO SECTION 275(1), OR ANY PERSON PURSUANT TO SECTION 275(1A), AND IN
ACCORDANCE WITH THE CONDITIONS SPECIFIED IN SECTION 275, OF THE SFA; OR (III)
OTHERWISE PURSUANT TO, AND IN ACCORDANCE WITH THE CONDITIONS OF, ANY
OTHER APPLICABLE PROVISION OF THE SFA. WHERE THE BONDS ARE SUBSCRIBED OR
PURCHASED UNDER SECTION 275 OF THE SFA BY A RELEVANT PERSON THAT IS: (A) A
CORPORATION (WHICH IS NOT AN ACCREDITED INVESTOR (AS DEFINED IN SECTION 4A
OF THE SFA)) THE SOLE BUSINESS OF WHICH IS TO HOLD INVESTMENTS AND THE
ENTIRE SHARE CAPITAL OF WHICH IS OWNED BY ONE OR MORE INDIVIDUALS, EACH
OF WHOM IS AN ACCREDITED INVESTOR; OR (B) A TRUST (WHERE THE TRUSTEE IS NOT
AN ACCREDITED INVESTOR) WHOSE SOLE PURPOSE IS TO HOLD INVESTMENTS AND
EACH BENEFICIARY OF THE TRUST IS AN INDIVIDUAL WHO IS AN ACCREDITED
INVESTOR, SECURITIES OR SECURITIES-BASED DERIVATIVES CONTRACTS (EACH AS
DEFINED IN SECTION 2(1) OF THE SFA) OF THAT CORPORATION OR THE BENEFICIARIES’
RIGHTS AND INTEREST (HOWSOEVER DESCRIBED) IN THAT TRUST SHALL NOT BE
TRANSFERRED WITHIN 6 MONTHS AFTER THAT CORPORATION OR THAT TRUST HAS
ACQUIRED THE BONDS PURSUANT TO AN OFFER MADE UNDER SECTION 275 OF THE
SFA EXCEPT: (I) TO AN INSTITUTIONAL INVESTOR OR TO A RELEVANT PERSON, OR TO
ANY PERSON ARISING FROM AN OFFER REFERRED TO IN SECTION 275(1A) OR SECTION
276(4)(I)(B) OF THE SFA; (II) WHERE NO CONSIDERATION IS OR WILL BE GIVEN FOR THE
TRANSFER; (III) WHERE THE TRANSFER IS BY OPERATION OF LAW; (IV) AS SPECIFIED
IN SECTION 276(7) OF THE SFA; OR (V) AS SPECIFIED IN REGULATION 37A OF THE
SECURITIES AND FUTURES (OFFERS OF INVESTMENTS) (SECURITIES AND SECURITIES-
BASED DERIVATIVE CONTRACTS) REGULATIONS 2018 OF SINGAPORE.
Notification under Section 309B(1)(C) of the SFA
IN CONNECTION WITH SECTION 309B OF THE SFA AND THE SECURITIES AND FUTURES (CAPITAL
MARKETS PRODUCTS) REGULATIONS 2018 OF SINGAPORE (THE “CMP REGULATIONS 2018”), THE ISSUER
HAS DETERMINED, AND HEREBY NOTIFIES ALL RELEVANT PERSONS (AS DEFINED IN SECTION 309A(1)
OF THE SFA), THAT THE BONDS ARE “PRESCRIBED CAPITAL MARKETS PRODUCTS” (AS DEFINED IN THE
CMP REGULATIONS 2018) AND ARE EXCLUDED INVESTMENT PRODUCTS (AS DEFINED IN MAS NOTICE
SFA 04-N12: NOTICE ON THE SALE OF INVESTMENT PRODUCTS AND MAS NOTICE FAA-N16: NOTICE ON
RECOMMENDATIONS ON INVESTMENT PRODUCTS).
iv

NOTICE TO PROSPECTIVE INVESTORS IN TAIWAN
THE OFFER OF THE BONDS HAS NOT BEEN AND WILL NOT BE REGISTERED OR FILED
WITH, OR APPROVED BY, THE FINANCIAL SUPERVISORY COMMISSION OF TAIWAN
AND/OR OTHER REGULATORY AUTHORITY OF TAIWAN PURSUANT TO RELEVANT
SECURITIES LAWS AND REGULATIONS, AND THE BONDS MAY NOT BE OFFERED,
ISSUED OR SOLD IN TAIWAN THROUGH A PUBLIC OFFERING OR IN CIRCUMSTANCES
WHICH CONSTITUTE AN OFFER WITHIN THE MEANING OF THE SECURITIES AND
EXCHANGE ACT OF TAIWAN THAT REQUIRES THE REGISTRATION OR FILING WITH OR
APPROVAL OF THE FINANCIAL SUPERVISORY COMMISSION OF TAIWAN. THE BONDS
MAY BE MADE AVAILABLE OUTSIDE TAIWAN FOR PURCHASE BY INVESTORS RESIDING
IN TAIWAN (EITHER DIRECTLY OR THROUGH PROPERLY LICENSED TAIWAN
INTERMEDIARIES), BUT MAY NOT BE OFFERED OR SOLD IN TAIWAN EXCEPT TO
QUALIFIED INVESTORS VIA A TAIWAN LICENSED INTERMEDIARY. ANY
SUBSCRIPTIONS OF BONDS SHALL ONLY BECOME EFFECTIVE UPON ACCEPTANCE BY
THE ISSUER OR THE RELEVANT DEALER OUTSIDE TAIWAN AND SHALL BE DEEMED A
CONTRACT ENTERED INTO IN THE JURISDICTION OF INCORPORATION OF THE ISSUER
OR RELEVANT DEALER, AS THE CASE MAY BE, UNLESS OTHERWISE SPECIFIED IN THE
SUBSCRIPTION DOCUMENTS RELATING TO THE BONDS SIGNED BY THE INVESTORS.
NOTICE TO INVESTORS JAPAN
THE BONDS HAVE NOT BEEN AND WILL NOT BE REGISTERED UNDER THE FINANCIAL
INSTRUMENTS AND EXCHANGE ACT OF JAPAN (NO. 25 OF 1948, AS AMENDED, THE
“FIEA”). NEITHER THE BONDS NOR ANY INTEREST THEREIN MAY BE OFFERED OR SOLD,
DIRECTLY OR INDIRECTLY, IN JAPAN OR TO, OR FOR THE BENEFIT OF, ANY “RESIDENT”
OF JAPAN (AS DEFINED UNDER ITEM 5, PARAGRAPH 1, ARTICLE G OF THE FOREIGN
EXCHANGE AND FOREIGN TRADE ACT (ACT NO. 228 OF 1949, AS AMENDED)), OR TO
OTHERS FOR RE-OFFERING OR RESALE, DIRECTLY OR INDIRECTLY, IN JAPAN OR TO,
OR FOR THE BENEFIT OF, ANY RESIDENT OF JAPAN, EXCEPT PURSUANT TO AN
EXEMPTION FROM THE REGISTRATION REQUIREMENTS OF, AND OTHERWISE IN
COMPLIANCE WITH, THE FIEA AND ANY OTHER APPLICABLE LAWS, REGULATIONS
AND MINISTERIAL GUIDELINES OF JAPAN.
THE PRIMARY OFFERING OF THE BONDS AND THE SOLICITATION OF AN OFFER FOR
ACQUISITION THEREOF HAVE NOT BEEN AND WILL NOT BE REGISTERED UNDER
PARAGRAPH 1, ARTICLE 4 OF THE FIEA. AS IT IS A PRIMARY OFFERING, IN JAPAN, THE
BONDS MAY ONLY BE OFFERED, SOLD, RESOLD OR OTHERWISE TRANSFERRED,
DIRECTLY OR INDIRECTLY TO, OR FOR THE BENEFIT OF CERTAIN QUALIFIED
INSTITUTIONAL INVESTORS AS DEFINED IN THE FIEA (“QIIS”). A QII WHO PURCHASED
OR OTHERWISE OBTAINED THE BONDS CANNOT RESELL OR OTHERWISE TRANSFER
THE BONDS IN JAPAN TO ANY PERSON EXCEPT ANOTHER QII.
v

[This Page Intentionally Left Blank]

Table of Contents
The Bonds
Purpose of Official Statement 1
The County 1
Authorization 1
Description 2
Registration, Payment and Transfer 2
Redemption 4
Security and Sources of Payment 6
Purpose of Financing 6
COVID-19 Outlook 8
Continuing Disclosure 9
Deposits to Escrow Deposit Account 9
Additional Information 9
Financial Information
Financial Reporting 10
Overview of Revenues and Expenditures 12
Sources of Revenue 17
Local Income, Transfer and Other County Taxes 20
Water and Sewer Enterprise Fund 23
Special Recreation Facility Enterprise Fund 25
Broadband Enterprise Fund 26
Watershed Protection and Restoration Enterprise
Fund 27
Retirement and Pension Programs 28
Other Post Employment Benefits 29
Accounting for Annual and Disability Leave 31
Insurance and Risk Management 31
Investment Policy 32
Capital Requirements and Debt Management
Capital Projects Funds 33
Board of Education Capital Projects 34
Composition of Debt 34
Capital Budget and Program 35
Debt Management Policy 35
Debt Capacity 35
Description of Debt 36
Overlapping Debt 38
Tax Increment Financing 38
Conduit Debt 39
Public Private Partnership (P3) Agreement 39
Outstanding Long-Term Debt 40
Future Financing Plans 45
Government and Infrastructure
General 46
Government Organizational Chart 47
Executive, Administrative,
Legislative and Education Officials 48
Responsibilities and Services 51
Economy and Demography
Size and Land Use 59
Population 59
Education 60
Income 61
Housing 63
Economy 64
Columbia 67
Legal and Miscellaneous
Approval of Legal Proceedings 68
Tax Matters 68
Ratings 75
Litigation 75
Independent Auditors 75
Financial Advisor 75
Underwriting 75
Certain Relationships 76
Verification of Mathematical Computations 76
Certificate of County Officials 76
Miscellaneous 77
Appendix A
Audited Financial Statements of the County for the
fiscal year ended June 30, 2019 A-1
Appendix B
Forms of Bond Counsel Opinions B-1
Appendix C
Continuing Disclosure Agreement C-1
Appendix D
Bond Amortization Tables D-1


[This Page Intentionally Left Blank]

The Bonds 1
The Bonds
Purpose of Official Statement
This Official Statement provides information regarding Howard County, Maryland (the “County”) and the offering of
its $255,470,000 general obligation bonds (the “Bonds”). The Bonds consist of the following:
• $117,230,000 Consolidated Public Improvement Project Bonds, 2020 Series A (Tax-Exempt) (the “Public
Improvement Bonds”);
• $51,130,000 Metropolitan District Project Bonds, 2020 Series B (Tax-Exempt) (the “Metropolitan District
Bonds” and together with the Public Improvement Bonds, the “Tax-Exempt Bonds”);
• $63,050,000 Consolidated Public Improvement Project and Refunding Bonds, 2020 Series C (Taxable) (the “CPI
Taxable Bonds”); and
• $24,060,000 Metropolitan District Refunding Bonds, 2020 Series D (Taxable) (the “MD Taxable Bonds” and
together with the CPI Taxable Bonds, the “Taxable Bonds”).
The County
The County is 251 square miles in area and is home to approximately 326,286 residents. The County is located in the
State of Maryland (the “State”) between Baltimore, Maryland and Washington, D.C., and at its closest point is less than
four miles from the former and 13 miles from the latter. The County was formed in 1851 and bears the name of Colonel
John Eager Howard, the fifth Governor of Maryland. The County was predominately agricultural until 1966, when
construction began on the master-planned community of Columbia. The County’s population has grown an average of
1.67 percent annually since 2000, and is the third wealthiest in the nation. Under a home rule charter since 1968, the
County is governed by an elected county executive (the “County Executive”) and five-member council (the “Council”).
Authorization
The Public Improvement Bonds are being issued pursuant to the authority of Section 10-203 of the Local Government
Article of the Annotated Code of Maryland (2013 Replacement Volume, 2019 Supplement) (“Section 10-203”), Section
19-101 of the Local Government Article of the Annotated Code of Maryland (2013 Replacement Volume, 2019
Supplement) (“Section 19-101”), the Howard County Charter (the “Charter”), certain bond enabling bills of the County
Council of Howard County, Maryland (the “Council”), and in accordance with Council Bill No. 44-2019 enacted during
the 2019 Legislative Session (the “Bond Ordinance”).
The Metropolitan District Bonds are being issued pursuant to the authority of Section 10-203, the Charter, Chapter 991
of the Acts of the General Assembly of Maryland 1943, as amended, Chapter 609 of the Acts of the General Assembly
of Maryland of 1945, as amended, Chapter 369 of the Acts of the General Assembly of Maryland of 1963, as amended
and Chapter 356 of the Acts of the General Assembly of Maryland of 1965, as amended (collectively, the “Acts”),
certain bond enabling bills of the Council, and in accordance with the Bond Ordinance.
The CPI Taxable Bonds are being issued pursuant to the authority of Section 10-203, Section 19-207 of the Local
Government Article of the Annotated Code of Maryland (2013 Replacement Volume and 2019 Supplement) (“Section
19-207”), Section 19-101, the Charter, certain bond enabling bills of the Council, and in accordance with the Bond
Ordinance and Council Bill No. 45-2019 enacted during the 2019 Legislative Session (the “Refunding Ordinance”).
The MD Taxable Bonds are being issued pursuant to the authority of Section 10-203, Section 19-207, the Charter, the
Acts, certain bond enabling bills of the Council, and in accordance with the Refunding Ordinance.

2 The Bonds
Description
The Bonds are dated and bear interest from their date of delivery (the “Closing Date”), and pay interest on February 15
and August 15 of each year, beginning August 15, 2020, at the interest rates set forth on the inside cover page of this
Official Statement. Interest is calculated on the basis of a 360-day year consisting of twelve 30-day months. The Bonds
are issued as fully-registered bonds without coupons, book-entry form only, and are denominated in integral multiples
of $5,000. The Bonds mature, subject to prior redemption as described herein, on the dates and in the amounts set forth
on the inside cover page of this Official Statement.
Registration, Payment and Transfer
Registration through Securities Depository
The information contained in the following paragraphs of this subsection “Book-Entry Only System” has been extracted
from a schedule prepared by The Depository Trust Company (“DTC”) entitled “SAMPLE OFFERING DOCUMENT
LANGUAGE DESCRIBING BOOK-ENTRY ONLY ISSUANCE.” The County makes no representation as to the
completeness or the accuracy of such information or as to the absence of material adverse changes in such information
subsequent to the date hereof.
DTC will act as securities depository for the Bonds. The Bonds will be issued as fully-registered securities registered in
the name of Cede & Co. (DTC’s partnership nominee) or such other name as may be requested by an authorized
representative of DTC. One fully-registered Bond will be issued for each maturity of the Bonds in principal amount
equal to the aggregate principal amount of the Bonds of such maturity, and will be deposited with DTC.
DTC, the world’s largest securities depository, is a limited-purpose trust company organized under the New York
Banking Law, a “banking organization” within the meaning of the New York Banking Law, a member of the Federal
Reserve System, a “clearing corporation” within the meaning of the New York Uniform Commercial Code, and a
“clearing agency” registered pursuant to the provisions of Section 17A of the Securities Exchange Act of 1934. DTC
holds and provides asset servicing for over 3.5 million issues of U.S. and non-U.S. equity issues, corporate and municipal
debt issues, and money market instruments (from over 100 countries) that DTC’s participants (“Direct Participants”)
deposit with DTC. DTC also facilitates the post-trade settlement among Direct Participants of sales and other securities
transactions in deposited securities, through electronic computerized book-entry transfers and pledges between Direct
Participants’ accounts. This eliminates the need for physical movement of securities certificates. Direct Participants
include both U.S. and non-U.S. securities brokers and dealers, banks, trust companies, clearing corporations, and certain
other organizations. DTC is a wholly-owned subsidiary of The Depository Trust & Clearing Corporation (“DTCC”).
DTCC is the holding company for DTC, National Securities Clearing Corporation and Fixed Income Clearing
Corporation, all of which are registered clearing agencies. DTCC is owned by the users of its regulated subsidiaries.
Access to the DTC system is also available to others such as both U.S. and non-U.S. securities brokers and dealers,
banks, trust companies, and clearing corporations that clear through or maintain a custodial relationship with a Direct
Participant, either directly or indirectly (“Indirect Participants”). DTC has a Standard & Poor’s rating of AA+. The DTC
Rules applicable to its Participants are on file with the Securities and Exchange Commission. More information about
DTC can be found at www.dtcc.com .
Purchases of Bonds under the DTC system must be made by or through Direct Participants, which will receive a credit
for the Bonds on DTC’s records. The ownership interest of each actual purchaser of each Bond (“Beneficial Owner”) is
in turn to be recorded on the Direct and Indirect Participants’ records. Beneficial Owners will not receive written
confirmation from DTC of their purchase. Beneficial Owners are, however, expected to receive written confirmations
providing details of the transaction, as well as periodic statements of their holdings, from the Direct or Indirect
Participant through which the Beneficial Owner entered into the transaction. Transfers of ownership interests in the
Bonds are to be accomplished by entries made on the books of Direct and Indirect Participants acting on behalf of
Beneficial Owners. Beneficial Owners will not receive certificates representing their ownership interests in the Bonds,
except in the event that use of the book-entry system for the Bonds is discontinued.
To facilitate subsequent transfers, all Bonds deposited by Direct Participants with DTC are registered in the name of
DTC’s partnership nominee, Cede & Co., or such other name as may be requested by an authorized representative of
DTC. The deposit of Bonds with DTC and their registration in the name of Cede & Co. or such other DTC nominee do
not affect any change in beneficial ownership. DTC has no knowledge of the actual Beneficial Owners of the Bonds;
DTC’s records reflect only the identity of the Direct Participants to whose accounts such Bonds are credited, which may

The Bonds 3
or may not be the Beneficial Owners. The Direct and Indirect Participants will remain responsible for keeping account
of their holdings on behalf of their customers.
Conveyance of notices and other communications by DTC to Direct Participants, by Direct Participants to Indirect
Participants, and by Direct Participants and Indirect Participants to Beneficial Owners will be governed by arrangements
among them, subject to any statutory or regulatory requirements as may be in effect from time to time.
Redemption notices shall be sent to DTC. If less than all of the Bonds within an issue are being redeemed, DTC’s
practice is to determine by lot the amount of the interest of each Direct Participant in such issue to be redeemed.
Neither DTC nor Cede & Co. (nor any other DTC nominee) will consent or vote with respect to the Bonds unless
authorized by a Direct Participant in accordance with DTC’s MMI Procedures. Under its usual procedures, DTC mails
an Omnibus Proxy to the County as soon as possible after the record date. The Omnibus Proxy assigns Cede & Co.’s
consenting or voting rights to those Direct Participants to whose accounts Bonds are credited on the record date
(identified in a listing attached to the Omnibus Proxy).
Principal and interest payments and any premium on the Bonds will be made to Cede & Co., or such other nominee as
may be requested by an authorized representative of DTC. DTC’s practice is to credit Direct Participants’ accounts upon
DTC’s receipt of funds and corresponding detail information from the County or the Paying Agent, on payable date in
accordance with their respective holdings shown on DTC’s records. Payments by Direct and Indirect Participants to
Beneficial Owners will be governed by standing instructions and customary practices, as is the case with securities held
for the accounts of customers in bearer form or registered in “street name,” and will be the responsibility of such Direct
or Indirect Participant and not of DTC, DTC’s nominee, the Paying Agent or the County, subject to any statutory or
regulatory requirements as may be in effect from time to time. Payment of principal and interest or premium to Cede &
Co. (or such other nominee as may be requested by an authorized representative of DTC) is the responsibility of the
County or its Paying Agent, disbursement of such payments to Direct Participants shall be the responsibility of DTC,
and disbursement of such payments to the Beneficial Owners shall be the responsibility of Direct and Indirect
Participants.
THE COUNTY CANNOT AND DOES NOT GIVE ANY ASSURANCES THAT DTC, DIRECT PARTICIPANTS
OR INDIRECT PARTICIPANTS OF DTC WILL DISTRIBUTE TO BENEFICIAL OWNERS OF THE BONDS (1)
PAYMENTS OF PRINCIPAL OF OR INTEREST OR REDEMPTION PREMIUM ON THE BONDS; (2)
CONFIRMATIONS OF THEIR OWNERSHIP INTERESTS IN THE BONDS; OR (3) OTHER NOTICIES SENT TO
DTC OR CEDE & CO., ITS PARTNERSHIP NOMINEE, AS THE REGISTERED OWNER OF THE BONDS OR
THAT THEY WILL DO SO ON A TIMELY BASIS, OR THAT DTC, DIRECT PARTICIPANTS OR INDIRECT
PARTICIPANTS WILL SERVE AND ACT IN THE MANNER DESCRIBED IN THIS OFFICIAL STATEMENT OR
ANY RULES AND PROCEDURES OF DTC.
Neither the County nor its agents will have any responsibility or obligation to Direct or Indirect Participants or
to any Beneficial Owner with respect to 1) the accuracy of any records maintained by DTC or any Direct or
Indirect Participant; 2) the payment by DTC or any Direct or Indirect Participant of any amount with respect to
the principal of, premium, if any, or interest on the bonds; 3) any notice which is permitted or required to be
given to Beneficial Owners; 4) any consent given by DTC or other action taken by DTC as bondholder; or 5) the
selection by DTC or any Direct or Indirect Participant of any Beneficial Owner to receive payment in the event
of a partial redemption of Bonds.
Termination of Book-Entry System
DTC may discontinue providing its services with respect to the Bonds at any time by giving reasonable notice to the
County and Manufacturers and Traders Trust Company (the “Bond Registrar”). In addition, the County Executive may
discontinue the book-entry system with DTC. If the County Executive fails to identify another qualified securities
depository to replace DTC, the County will deliver replacement Bonds in the form of fully registered certificates, and
payments of principal of and interest on such replacement Bonds will be paid in accordance with the terms of the Bond
Ordinance and the Refunding Ordinance. Each Beneficial Owner, upon registration of certificates held in such
Beneficial Owner’s name, will become a Bondholder. Subject to the further conditions contained in the Bond Ordinance
and the Refunding Ordinance, the Bonds may be transferred or exchanged for one or more Bonds in different authorized
denominations upon surrender thereof by the registered owners or their duly authorized representatives. For every
transfer and exchange of the Bonds, the registered owner may be charged a sum sufficient to cover any tax or other
governmental charge required to be paid in connection with such exchange or transfer.
4 The Bonds
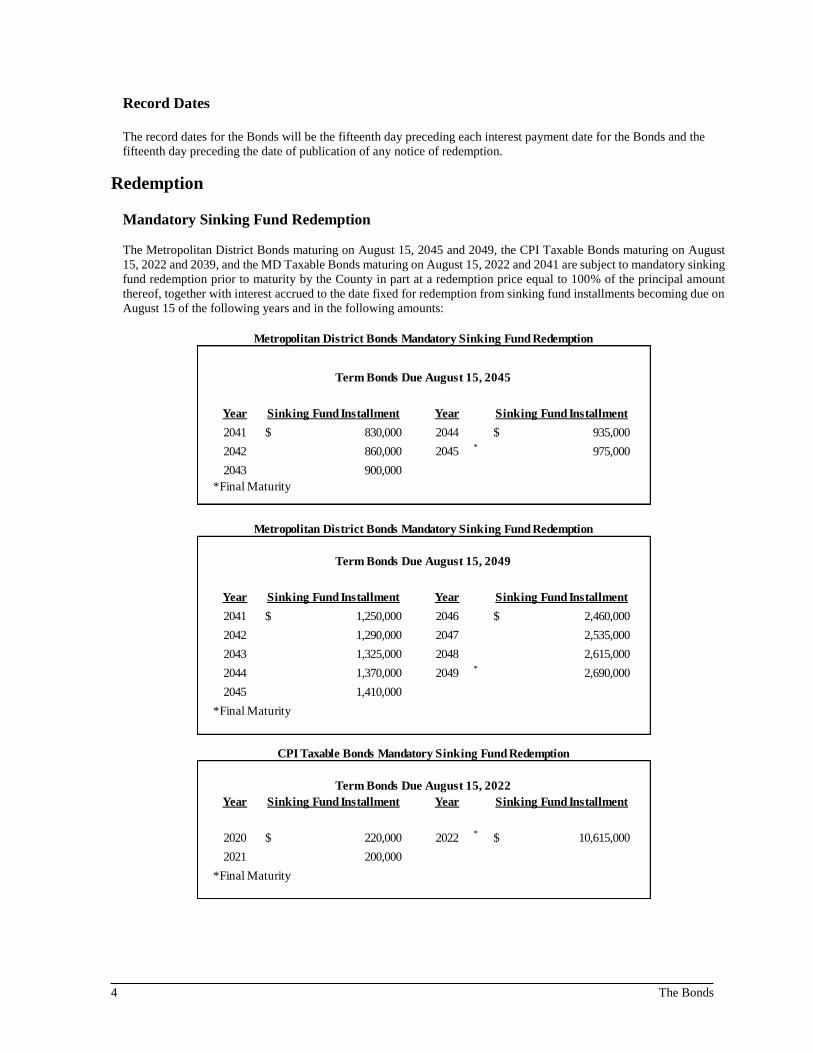
Record Dates
The record dates for the Bonds will be the fifteenth day preceding each interest payment date for the Bonds and the
fifteenth day preceding the date of publication of any notice of redemption.
Redemption
Mandatory Sinking Fund Redemption
The Metropolitan District Bonds maturing on August 15, 2045 and 2049, the CPI Taxable Bonds maturing on August
15, 2022 and 2039, and the MD Taxable Bonds maturing on August 15, 2022 and 2041 are subject to mandatory sinking
fund redemption prior to maturity by the County in part at a redemption price equal to 100% of the principal amount
thereof, together with interest accrued to the date fixed for redemption from sinking fund installments becoming due on
August 15 of the following years and in the following amounts:
Metropolitan District Bonds Mandatory Sinking Fund Redemption
Term Bonds Due August 15, 2045
Year Sinking Fund Installment Year Sinking Fund Installment
2041 830,000$ 2044 935,000$
2042 860,000 2045*
975,000
2043 900,000
*Final Maturity
Metropolitan District Bonds Mandatory Sinking Fund Redemption
Term Bonds Due August 15, 2049
Year Sinking Fund Installment Year Sinking Fund Installment
2041 1,250,000$ 2046 2,460,000$
2042 1,290,000 2047 2,535,000
2043 1,325,000 2048 2,615,000
2044 1,370,000 2049*
2,690,000
2045 1,410,000
*Final Maturity
CPI Taxable Bonds Mandatory Sinking Fund Redemption
Term Bonds Due August 15, 2022
Year Sinking Fund Installment Year Sinking Fund Installment
2020 220,000$ 2022*
10,615,000$
2021 200,000
*Final Maturity

The Bonds 5
Optional Redemption
Bonds maturing on or before August 15, 2030 are not redeemable prior to their stated maturities. Bonds maturing on
and after August 15, 2031 are subject to redemption prior to their respective maturities, at the option of the County, on
or at any time after August 15, 2030, in whole or in part, at a redemption price of 100% of the principal amount thereof,
together with interest accrued to the redemption date.
If less than all of the outstanding Bonds of any series are called for optional redemption, the County will choose the
maturities to be redeemed and the principal amount of each such maturity to be redeemed, in its sole discretion. If less
than all of such Bonds of any one maturity are called for redemption, then the particular Bonds of such maturity or
portions of such Bonds to be redeemed will be chosen by DTC in accordance with its normal and customary procedures
(so long as the Bonds are in book-entry form), or by the Bond Registrar, by lot (if the book-entry system has been
discontinued). For an optional redemption of term Bonds, the County will choose the mandatory sinking fund
redemption installments of such term Bonds to be reduced and the amount of each such reduction, in its sole discretion.
The Bonds are redeemable only in integral multiples of $5,000.
Notice of Redemption
A notice calling for redemption of any Bonds will be delivered to DTC not less than 20 days prior to the date fixed for
redemption (the “Redemption Date”), and otherwise as provided in the Bond Ordinance. If the book-entry system has
been discontinued for the Bonds, a notice calling for redemption of any Bonds will be mailed, not less than 20 days prior
to the Redemption Date, to all registered owners of the Bonds to be redeemed (in whole or in part), at their last addresses
appearing on the registration books kept by the Bond Registrar, by first-class mail, postage prepaid. Failure to mail or
deliver any such notice or any defect in the notice or its mailing or delivery will not affect the validity of any redemption
CPI Taxable Bonds Mandatory Sinking Fund Redemption
Term Bonds Due August 15, 2039
Year Sinking Fund Installment Year Sinking Fund Installment
2036 265,000$ 2038 280,000$
2037 275,000 2039*
290,000
*Final Maturity
MD Taxable Bonds Mandatory Sinking Fund Redemption
Term Bonds Due August 15, 2022
Year Sinking Fund Installment Year Sinking Fund Installment
2020 275,000$ 2022*
735,000$
2021 580,000
*Final Maturity
MD Taxable Bonds Mandatory Sinking Fund Redemption
Term Bonds Due August 15, 2041
Year Sinking Fund Installment Year Sinking Fund Installment
2036 510,000$ 2039 560,000$
2037 525,000 2040 580,000
2038 540,000 2041*
595,000
*Final Maturity

6 The Bonds
proceedings. Any redemption notice will specify the series, CUSIP numbers, maturities and interest rates of any Bonds
to be redeemed, the date of the notice, the Redemption Date, the redemption price, the name, address and telephone
number of the Bond Registrar, and, for a partial redemption, the principal amount of each maturity of the Bonds to be
redeemed. Such notice will further state that, on the Redemption Date, the Bonds called for redemption will be due and
become payable, if sufficient funds are available, at the office of the Bond Registrar, and that, from and after the
Redemption Date, interest thereon shall cease to accrue.
On the Redemption Date, if sufficient money to pay the redemption price of Bonds called for redemption and accrued
interest on the Bonds are held by the Bond Registrar, such Bonds called for redemption will become due and payable,
interest on such Bonds will cease to accrue and the registered owners of such Bonds will have no rights in respect thereof
except to receive payment of the redemption price thereof, plus accrued interest thereon to the Redemption Date.
Security and Sources of Payment
General Obligation The Bonds are general obligations of the County, and the County’s full faith and credit and unlimited taxing power are
irrevocably pledged to the punctual payment of principal and interest on such Bonds when due and payable.
Public Improvement Bonds and CPI Taxable Bonds In each and every fiscal year during which any of the Public Improvement Bonds or the CPI Taxable Bonds are
outstanding, the County will levy or cause to be levied ad valorem taxes on real and tangible personal property and on
intangible property subject to taxation by the County in an amount sufficient, together with other available funds, to pay
the annual interest on the outstanding Public Improvement Bonds and the outstanding CPI Taxable Bonds and to pay
the principal of the Public Improvement Bonds and the CPI Taxable Bonds due and payable during the succeeding fiscal
year. Without limiting the foregoing, portions of the Public Improvement Bonds and the CPI Taxable Bonds are
expected to be paid from transfer tax and fire tax revenues, school facilities surcharges, building excise taxes on new
construction, broadband fees and environmental service charges.
Metropolitan District Bonds and MD Taxable Bonds The principal of and the interest on the Metropolitan District Bonds and the MD Taxable Bonds are payable from
revenues obtained from: (1) special front foot benefit assessments collected by the County on all property in the
Metropolitan District (described in more detail under “Government and Infrastructure, Water and Sewer System” herein)
directly benefited by water and sewer facilities, (2) special annual ad valorem taxes levied by the County upon assessable
property within the Metropolitan District, (3) water and sewer service charges for the use of utilities and charges for the
upkeep of water and sewer systems that have a connection with water mains or sewers and (4) water and sewer
connection charges. However, in the event such revenues in any fiscal year are insufficient to pay the annual interest on
the outstanding Metropolitan District Bonds and the outstanding MD Taxable Bonds and to pay the principal of the
Metropolitan District Bonds and the MD Taxable Bonds due and payable, the County will levy ad valorem taxes on real
and tangible personal property and on intangible property subject to taxation by the County in an amount sufficient,
together with other available funds, to pay such annual interest and to pay the principal of such Metropolitan District
Bonds and MD Taxable Bonds. The County has never had to levy ad valorem taxes to pay the interest or principal due
on any other Metropolitan District bonds.
Purpose of Financing
Public Improvement Bonds
The County is issuing the Public Improvement Bonds to repay all or a portion of the County’s outstanding Consolidated
General Obligation Bond Anticipation Tax-Exempt Note, Series 2017, to reimburse the County for the cost of Public
Improvement projects and to pay costs of issuance related to the Public Improvement Bonds.

The Bonds 7
CPI Taxable Bonds
The County is issuing the CPI Taxable Bonds to reimburse the County for the cost of Public Improvement projects, to
provide funds that, together with investment earnings thereon will be sufficient to refund certain of the County’s
outstanding general obligation bonds described below (the “Refunded Public Improvement Bonds”) at their respective
maturities or optional redemption dates and to pay costs of issuance related to the CPI Taxable Bonds.
Metropolitan District Bonds
The County is issuing the Metropolitan District Bonds to repay all or a portion of the County’s outstanding General
Obligation Bond Anticipation Tax-Exempt Note, Series 2017, to reimburse the County for the cost of Water and Sewer
projects and to pay costs of issuance related to the Metropolitan District Bonds.
MD Taxable Bonds
The County is issuing the MD Taxable Bonds to provide funds that, together with investment earnings thereon will be
sufficient to refund certain of the County’s outstanding general obligation bonds described below (the “Refunded
Metropolitan District Bonds”) at their respective maturities or optional redemption dates and to pay costs of issuance
related to the MD Taxable Bonds.
Refunded Public Improvement Bonds
Maturities Optional
Dated Principal Amount Principal Amount Being Redemption Redemption
Date Outstanding Being Refinanced Refinanced Date Price (% )
11/17/2011 $83,405,000 $54,590,000 8/15/2022 - 8/15/2031 8/15/2021 100
Refunded Metropolitan District Bonds
Maturities Optional
Dated Principal Amount Principal Amount Being Redemption Redemption
Date Outstanding Refinanced Refinanced Date Price (%)
11/17/2011 $12,915,000 $10,525,000
8/15/2023 - 8/15/2036,
8/15/2041 8/15/2021 100
4/4/2013 $13,505,000 $8,340,000
2/15/2022 - 2/15/2033,
2/15/2035, 2/15/2038* 2/15/2021 100
4/3/2014 $23,395,000 $3,990,000 2/15/2030 - 2/15/2036 2/15/2022 100
*Only a portion of the 2013 Series A 2038 Term Bond is being refunded.

8 The Bonds
Sources and Uses
The following table identifies the sources and uses of funds in this financing.
(1)Issuance costs include Rating Agency Fees, Underwriters’ Discount and Expenses, Financial Advisor Fees, Bond Counsel Fees,
Underwriters’ Counsel Fees, and other costs of issuance. Table may not add due to rounding.
COVID-19 Outlook
The World Health Organization has declared a pandemic following the outbreak of COVID-19, a respiratory disease
caused by a new strain of the coronavirus (the “Pandemic”), which is currently affecting many parts of the world,
including the United States and Maryland. The Governor of the State of Maryland proclaimed a state of emergency and
catastrophic health emergency on March 5, 2020 and renewed it on March 17, 2020. Since the initial and renewed
proclamation, the Governor of Maryland has issued a series of executive orders, among other things, prohibiting large
gatherings and events, requiring residents to remain at home except to conduct and participate in essential and certain
other activities, requiring closure of nonessential and certain other businesses and authorizing emergency healthcare
delivery. On March 15, 2020, the County Executive issued an executive order proclaiming a state of emergency and
requiring the closure of certain businesses in the County, which has been extended by the County Council Resolution
No. 41-2020.
As a result of the Pandemic and the measures taken to prevent or reduce the spread of COVID-19, the financial condition
and performance of local, state national and global economic activities are anticipated to be adversely impacted. The
County has and will continue to experience an increase in expenses for emergency preparedness, public health and
personnel costs. Further, County businesses and citizens of the County may also be impacted. The U.S. Treasury
Department and the Internal Revenue Service have announced that the federal income tax filing and federal income tax
payment due date is automatically extended from April 15, 2020, to July 15, 2020. Similarly, the Maryland Comptroller
has extended the deadline for filing Maryland state tax returns and making payments for state income taxes from April
15, 2020, to July 15, 2020. This action by the Maryland Comptroller will delay the distribution of local income taxes
in the future.
The County has already incurred nearly $2 million in costs related to the response to COVID-19. The County has the
ability to adjust its spending on certain capital projects and other operating costs and maintains a reserve fund from
which the County may utilize funds to pay for increased expenses. The County has also paused all non-essential
procurement and instituted a hiring freeze for all employees except sworn positions. Further, Fiscal Year 2020 revenues
are expected to decline by approximately $35 million, but will be offset by income tax revenues in excess of budget
resulting from the Tax Cuts and Jobs Act of 2017. Moreover, according to the Maryland Department of Budget and
Management, the County could be reimbursed for qualifying expenses up to $56.8 million from the Coronavirus Relief
Fund (CRF) established under the CARES Act. The volatility in the financial markets has caused the County’s pension
plan portfolios to decrease by approximately 10% over the 3-month period, ending March 31, 2020. This preliminary
return ranks in the top quartile of Public Defined Benefit pension plans for the first quarter and can be attributed to
maintaining a diversified strategic allocation to withstand these uncertain times.
The County cannot predict the extent of decline or delay in revenues nor the extent of the expenses it will incur as a
result of the Pandemic. However, the County is proactively taking measures to maintain core services and support the
County’s priorities.
Sources
CPI 2020
Series A
Metro 2020
Series B
CPI 2020
Series C
Metro 2020
Series D Total
Par Amount……………………………. $117,230,000 $51,130,000 $63,050,000 $24,060,000 $255,470,000
Premium………………………………… 23,668,675 5,081,899 - - 28,750,574
Total $140,898,675 $56,211,899 $63,050,000 $24,060,000 284,220,574$
Uses
Project Fund Deposit…………………. $140,442,282 $56,001,557 $4,653,000 - $201,096,839
Escrow Fund Deposit…………………. - - 58,161,938 23,957,305 82,119,243
Issuance Costs(1)
……………………… 456,393 210,342 235,062 102,695 1,004,492
Total $140,898,675 $56,211,899 $63,050,000 $24,060,000 $284,220,574

The Bonds 9
Continuing Disclosure
In order to enable the Underwriters to comply with the requirements of paragraph (b)(5) of Securities and Exchange
Commission Rule 15c2-12 (“Rule 15c2-12”), the County will execute and deliver, on or before the date of issuance and
delivery of the Bonds, a Continuing Disclosure Agreement (the “Continuing Disclosure Agreement”). The form of this
agreement is included in Appendix C of this Official Statement. Certain of the events listed in Section 4(a) of the
Continuing Disclosure Agreement have been included for purposes of compliance with Rule 15c2-12 but are not relevant
for the Bonds. Those events relate to debt service reserves, credit enhancements and liquidity providers, and property
or other collateral. Except as otherwise disclosed herein, during the last five years, the County has not failed to comply
in any material respect with the terms and provisions of previous continuing disclosure agreements entered into in order
to comply with the requirements of Rule 15c2-12. Although the County has timely filed complete information required
by its continuing disclosure undertakings, in certain instances, the County may not have associated all filings with all
outstanding issues for which such filings may have been required. The County has subsequently filed such items.
Deposits to Escrow Deposit Account On the Closing Date, a portion of the proceeds of the CPI Taxable Bonds and the MD Taxable Bonds will be deposited
by the Director of Finance with Manufacturers and Traders Trust Company (the “Escrow Deposit Agent”) in a single
trust fund (the “Escrow Deposit Account”) to be established under an Escrow Deposit Agreement to be entered into
between the County and the Escrow Deposit Agent (the “Escrow Deposit Agreement”). The Escrow Deposit Agent will
apply all or part of the funds so deposited in the Escrow Deposit Account to purchase United States Treasury obligations
or obligations guaranteed by United States of America (hereinafter referred to as the “Government Obligations”). The Government Obligations on deposit in the Escrow Deposit Account will mature in stated fixed amounts as to
principal and interest at such times as will, together with cash on hand, be sufficient, without reinvestment to redeem
the Refunded Bonds on their respective optional redemption dates at the redemption prices set forth in the tables
captioned “Refunded Public Improvement Bonds” and “Refunded Metropolitan District Bonds” under “Purpose of
Financing” herein. Also see “Verification of Mathematical Computations” herein. The Government Obligations and
cash, if any, on deposit in the Escrow Deposit Account will be used for the payment of the principal of and interest on
the Refunded Bonds, and are not available for the payment of the principal of, redemption premium, if any, or interest
on the Bonds or any other obligations of the County.
Additional Information
This Official Statement speaks only as of the date appearing on the cover page, and the information contained herein is
subject to change. Questions regarding this Official Statement should be directed to the Director of Finance at the
address and telephone number listed on page i. The full text of the Bond Ordinance, the Refunding Ordinance and the
County’s latest budget are available from the Director of Finance for the cost of reproducing such material.

10 Financial Information
Financial Information
Financial Reporting
Basis of Accounting
The County’s audited basic financial statements for the fiscal year ended June 30, 2019 are included in Appendix A.
These statements were audited by CliftonLarsonAllen LLP, independent certified public accountants, and have been
included in reliance upon the qualification of the firm to issue the report. The accounting and financial reporting policies
of the County conform to generally accepted accounting principles (“GAAP”) as applicable to governmental units.
The County’s accounts are organized on the basis of funds. Fund types include (1) the General Fund, which is the
general operating fund of the County, (2) Special Revenue Funds, which account for specific revenues that by law are
designated for particular activities, (3) Proprietary Funds, which include the enterprise funds that account for the
County’s water and sewer, broadband, storm water and golf course operations, (4) Capital Projects Funds, which account
for construction or acquisition of fixed assets, (5) Debt Service Funds, which account for the accumulation of resources
which have been restricted, committed or assigned, (6) Internal Service Funds used to account for goods and services
furnished by one County department to another, and (7) Trust and Agency Funds used to account for resources held in
a custodial capacity.
The financial data for the Board of Education of Howard County (the “Board of Education”), the Howard County Library
System (the “Library”), Howard Community College (the “Community College”) and the Howard County Housing
Commission (the “Housing Commission,” and collectively, the “Component Units”) are discretely presented in the
government-wide statements to emphasize their legal separation from the County. However, the County is responsible
for levying taxes and has budgetary control over the Component Units.
The County’s comprehensive annual financial report (“CAFR”) for the fiscal year ended June 30, 2018 was awarded the
Certificate of Achievement for Excellence in Financial Reporting by the Government Finance Officers Association of
the United States and Canada (“GFOA”). To receive this highest recognition from GFOA, a government unit’s CAFR
must be easily readable, efficiently organized and satisfy both GAAP and legal requirements. The County has received
this certificate for each fiscal year since 1976 and will submit its CAFR for the fiscal year ended June 30, 2019 to GFOA
for another certificate.
Budget The County’s budget includes an operating and a capital budget. The operating budget is derived from programs
detailing the nature, volume and cost of work to be performed by each of the County’s agencies. This element of the
budget includes revenues estimated to be received and expenditures authorized for the ensuing fiscal year, surpluses or
deficits estimated for the current fiscal year. The operating and capital budgets also project summaries of revenues and
expenditures for the ensuing five fiscal years.
The capital budget describes each capital project proposed in the ensuing fiscal year and receipts anticipated from all
borrowings and other sources for such projects. The capital budget also proposes capital projects to be undertaken in
the ensuing five fiscal years and the means of financing such projects. (See “Capital Requirements and Debt
Management, Capital Budget and Program” herein.)
The County’s budget for the fiscal year ended June 30, 2019 was awarded the Distinguished Budget Presentation Award
by GFOA. To receive this award, a government unit must publish a budget document that meets program criteria as a
policy document, operations guide, financial plan and communication device. The County has received this certificate
for each fiscal year since 1992.
The County Executive must submit a capital budget and an operating budget to the Council by April 1 and April 21,
respectively. The Council may decrease or delete any budgetary item, except those mandated by State law and
provisions to pay outstanding debt service or eliminate cash deficits. The Council has no power to alter revenue
estimates or increase any recommended expenditures, except as expressly provided in State law. After enacting the

Financial Information 11
operating budget and adopting the capital budget, the Council must then levy taxes required to balance budget revenues
and expenditures. If a new operating budget is not enacted by the Council before June 2 in any fiscal year, the operating
budget proposed by the County Executive stands adopted and funds for expenditures stand appropriated.
No agency of the County may incur any liability in excess of the amounts appropriated for the same general classification
of expenditure in the budget. Any such liability incurred, except for small purchases, must first have funds for the
designated purpose certified as available by the Director of Finance. The Council, upon the request of the County
Executive, may approve transfers between projects in the capital budget and supplemental operating budgets funded
from the contingency reserve and from unappropriated funds in emergencies. After April 1 of each year, the Council,
upon the request of the County Executive, may approve transfers between departments in the operating budget; the
County Executive has authority to make operating budget transfers within a department at any time without approval of
the Council.
Surplus revenues in any fiscal year must be appropriated into the budget stabilization account, also known as the Rainy
Day Fund, until its balance equals seven percent of the audited General Fund expenditures for the prior fiscal year.
Money in the fund may be used only for emergencies or to cover significant revenue shortfalls during a fiscal year that
the County Executive determines cannot be offset by reducing expenditures. Surplus revenues not required for the Rainy
Day Fund must be used to fund capital projects, reduce existing County debt or fund appropriations for non-recurring
expenses, unless otherwise determined by a vote of two-thirds of the members of the Council.
To finance capital projects from borrowing, the Council adopts a bond issue authorization ordinance pursuant to enabling
laws. Such ordinances are not subject to referendum, nor to executive veto. Any contract, lease or other obligation
providing for payment of funds after the end of the fiscal year in which such obligation is made must be approved by
ordinance. No contract for the purchase of real or leasehold property may be entered into unless funds therefor are
included in the capital budget. No obligations of the County may be authorized in any fiscal year for any capital project
not included in the capital budget.
Government-Wide Full Accrual Reporting
The positive total net position shown below as of June 30, 2019, reflects the County’s commitment to maintaining
infrastructure assets and its tradition of providing substantial pay-go funding for capital outlays.
It is important to note that although counties in the State of Maryland issue debt for the construction of schools, the
school buildings are owned by each county’s Public School System. The County also funds projects for Howard
Community College and for intersection improvements to State-owned roads. As of June 30, 2019, the outstanding debt
for public school buildings was $474.5 million and $117.0 million for community college buildings. The negative
unrestricted net position for governmental activities reflects the imbalance of liabilities, without corresponding assets,
as well as the governmental activities’ net OPEB liability of $353.2 million and net pension liability of $150.7 million.
Ownership of school buildings no longer needed for educational purposes reverts to the County. The net value of
buildings, improvements and construction in progress owned by the Board of Education was $1.2 billion and $275
million for those owned by Howard Community College.
Summary of Net Position
Governmental Business-type
Activities Activities Total
NET POSITION
Invested in capital assets, $841,929,843 $456,887,408 $1,298,817,251
net of related debt
Restricted 142,249,607 21,823,966 164,073,573
Unrestricted (997,456,851) 146,526,725 (850,930,126)
Total net position ($13,277,401) $625,238,099 $611,960,698

12 Financial Information
The schedule below shows the value of net assets resulting from operations in fiscal year 2019 for governmental and
business activities combined.
Overview of Revenues and Expenditures
The largest fund in the County’s basic financial statements, the General Fund, records receipt of taxes and other revenues
not directed by law into other funds and payment of all operating costs of County government and services. Transfers
from the General Fund and revenues from other government agencies (particularly the State) provide most of the
revenues for the County’s Board of Education, Library, Community College and Housing Commission, each of which
is a Component Unit.
Special Revenue Funds account for specific revenues that by law are designated for particular functions or activities.
The County uses Special Revenue Funds as a way of linking fees or taxes paid by residents with benefits or services
received by them. Special Revenue Funds deal with management and construction of public housing, preservation of
agricultural land, account for fire district activities, record categorical grants received from federal, State and local
sources, support user-funded recreation and parks programs, account for speed enforcement programs, watershed
protection and restoration projects, and provide for the collection and disposal of solid waste, including the County
landfill.
The following charts present the composition of services funded from all Funds budgeted in fiscal year 2020, and the
sources of funding for such services.
Services Funded from All Funds
Changes in Net Position
Governmental Business-type
Activities Activities Total
Revenues $1,430,390,769 $160,096,108 $1,590,486,877
Expenses 1,428,846,896 120,220,555 1,549,067,451
Increase in net position before transfers 1,543,873 39,875,553 41,419,426
Transfers 9,412,543 (9,412,543) -
Increase in net position after transfers 10,956,416 30,463,010 41,419,426
Net Position - July 1, 2018 (24,233,817) 594,775,089 570,541,272
Net Position - June 30, 2019 ($13,277,401) $625,238,099 $611,960,698

Financial Information 13
Sources of Revenue for All Funds
The revenues collected by the County each month are determined by the tax rates and fee levels established at the beginning
of the fiscal year and the value of the bases during the year on which taxes and fees are collected. Property taxes are
collected primarily during the County’s first and second quarters; income taxes are received from the State following the
end of each quarter. The chart below presents General Fund revenues received for the past three fiscal years and as
budgeted for fiscal year 2020.
Cumulative Collection of General Fund Revenues ($millions)

14 Financial Information
The following table presents the activity in the General Fund for fiscal years 2015 through 2019 on a budgetary basis,
along with the annual budget adopted for fiscal year 2020.
Statement of General Fund Revenues and Expenditures (Budgetary Basis) (000) (1)
Budget
2015 2016 2017 2018 2019 2020
Tax Revenues
Local property taxes $476,160 $499,903 $517,898 $533,672 $552,099 $568,484
Local income taxes 394,985 433,404 435,233 444,453 462,445 465,244
Other local taxes 30,423 33,272 34,421 32,941 31,696 29,554
State shared taxes 1,532 2,078 1,818 1,596 1,673 3,544
Total Taxes $903,100 $968,656 $989,370 $1,012,662 $1,047,913 $1,066,825
Other Revenues
State grants 6,513 6,502 8,939 8,178 9,667 6,882
Charges for services 13,616 14,698 14,395 15,060 13,776 12,449
Interest on investments 602 1,292 704 3,487 7,262 4,000
Licenses and permits 6,586 7,200 7,091 6,874 6,663 8,940
Interfund reimbursements 36,884 44,249 48,242 47,228 50,439 48,465
Fines and forfeitures 3,078 3,237 3,011 3,129 3,018 4,009
Appropriation from fund balance 39,770 - 1,402 2,888 1,128 9,297
Return of funding from component units 351 2,588 2,077 2,095 1,546 -
Miscellaneous revenues 2,565 9,817 3,467 2,320 2,294 2,308
Total Revenues $1,013,065 $1,058,240 $1,078,697 $1,103,920 $1,143,706 $1,163,176
Expenditures
General government 42,745 27,782 26,968 27,201 28,080 29,814
Legislative and judicial 23,892 25,220 25,690 26,912 27,945 29,838
Public works 71,939 71,449 69,819 73,235 72,775 74,913
Public safety 114,602 120,846 128,141 133,557 135,696 142,300
Recreation and parks 19,005 19,603 21,921 24,227 24,547 25,017
Health 7,784 8,181 10,925 10,775 11,931 11,380
Community services 21,575 32,160 32,515 34,508 36,026 38,137
Education 561,440 575,145 594,485 606,837 635,040 643,043
Libraries 18,842 18,842 19,544 20,309 20,938 21,451
Debt service:
Principal payment on debt 58,735 65,702 65,452 60,617 65,121 70,863
Interest payment on debt 40,157 39,911 40,821 39,057 46,853 47,396
Capital improvements 17,351 4,779 5,304 4,752 3,679 16,023
OPEB funding (2) 15,000 10,000 13,000 16,000 15,724 13,000
Total Expenditures $1,013,065 $1,019,618 $1,054,585 $1,077,987 $1,124,354 $1,163,176
Excess Revenues over Expenditures - 38,623 24,112 25,933 19,352 -
Transfers In/(Out) - - (24,112) (26,250) (20,145) -
Plus Lapsed Encumbrances 1,522 2,019 2,406 2,620 2,511 -
Capital Related Debt Issued - - - - 793 -
Less Appropriation from Fund Balance (39,770) - (1,402) (2,888) (1,128) (9,297)
Beginning Fund Balance 121,138 82,890 126,011 127,016 126,431 127,814
Adjustment to Beginning Balance - 2,479 - - - -
Ending Fund Balance $82,890 $126,011 $127,016 $126,431 $127,814 $118,517
(2) Funding was in addit ion to annual pay-go budget.
(1) The information in this table is presented in the same format as set forth in the County's Operat ing Budget and should be read in conjunct ion with the audited basic f inancial
statements set forth in Appendix A.
Fiscal Year Ended June 30

Financial Information 15
The following table presents the activity in all Special Revenue Funds for fiscal years 2015 through 2019 on a budgetary
basis, along with the annual budget adopted for fiscal year 2020.
Statement of Special Revenue Funds Revenues and Expenditures (Budgetary Basis)(000)(1)
Budget
2015 2016 2017 2018 2019 2020
$83,233 $87,382 $90,703 $96,463 $97,667 $135,488
11,774 11,944 14,339 15,478 16,513 11,400
14,724 16,967 22,359 15,461 18,571 110
42,039 41,982 44,461 44,577 46,564 56,234
2,235 3,626 (541) 172 3,192 2,223
112 - - - - -
8,374 7,438 5,972 8,033 7,003 2,775
$162,492 $169,340 $177,294 $180,184 $189,511 $208,229
8,442 171 472 5,474 590 4,969
Capital lease proceeds - - - - 2,223 -
Total Revenues and Other Sources of
Financial Resources $170,933 $169,511 $177,766 $185,659 $192,323 $213,198
91,456 88,453 97,586 104,076 107,997 111,140
17,463 18,425 19,345 19,900 20,079 20,381
11,719 - - - - -
30,562 29,239 32,515 32,336 33,638 27,100
18,780 19,304 13,844 16,784 17,235 11,238
664 357 601 327 104 -
2,451 2,783 9,295 5,543 4,298 17,150
5,439 5,473 5,480 6,228 6,087 10,818
$178,534 $164,034 $178,666 $185,194 $189,437 $197,827
1,953 3,459 3,779 3,909 3,096 32,646
Total Expenditures and Other Uses of
Financial Resources $180,487 $167,493 $182,445 $189,103 $192,532 $230,473
Excess Revenues and Other Sources of Financial
Resources over Expenditures and Encumbrances
and Other Uses of Financial Resources (9,554) 2,018 (4,679) (3,445) (209) (17,275)
127,308 117,754 119,772 115,093 111,648 111,439
$117,754 $119,772 $115,093 $111,648 $111,439 $94,164Ending Fund Balance
(1) The information in this table should be read in conjunction with the audited basic financial statements set forth in Appendix A.
(4) The recognition of $3,717,878 decrease in the fair value of investments of the Agricultural Land Preservation Fund resulted in negative Interest
Income in FY2017.
(3) The fee for residents receiving curbside trash, recycling and yard waste collection was increased by $100 in FY2020 .
(2) The real property and personal property tax rates for the dedicated Fire & Rescue Fund increased from $0.176 and $0.440 to $0.236 and $0.590
in FY2020.
Interest payment on debt
Total Expenditures and Encumbrances
Other Uses of Financial Resources
Operating transfers out
Beginning Fund Balance
Health (5)
Environmental
Community services and intergovernmental
Capital improvements
Principal payment on debt (6)
Other Sources of Financial Resources
Operating transfers in
Expenditures and Encumbrances
Public safety
Recreation and parks
(5) In FY2016, the Health Fund was no longer listed as a separate Governmental Fund and shown as part of the General Fund based on clarified
accounting rules.
(6) Principal payments increased due to the change to equal annual principal payments in Agricultural Land Preservation Program Installment
Purchase Agreements.
Miscellaneous revenues
Revenues
Property taxes (2)
Other local taxes
Revenues from other governmental agencies
Charges for services (3)
Interest on investments (4)
Rental of property
Fiscal Year Ended June 30
Debt service:
Total Revenues

16 Financial Information
The following table presents the Component Units’ activity for the last five fiscal years on a GAAP basis, which is not
comparable to General Fund and Special Revenue Funds statements prepared on a budgetary basis.
Statement of Component Units Revenues and Expenses (GAAP Basis)(000)(1)
2015 2016 2017 2018 2019
$482,346 $513,611 $542,820 $522,958 $518,636
67,204 68,787 68,218 85,399 81,341
536 84 2,071 2,620 3,534
14,007 11,793 10,926 15,749 23,835
$564,093 $594,275 $624,034 $626,726 $627,347
579,766 593,986 614,044 628,304 657,136
Total Revenues and Other Sources of Financial
Resources $1,143,859 $1,188,262 $1,238,079 $1,255,030 $1,284,482
1,039,195 1,070,800 1,094,610 1,185,253 1,206,642
22,275 22,707 23,932 25,379 25,851
39,890 39,240 41,736 48,150 49,078
$1,101,360 $1,132,746 $1,160,277 $1,258,782 $1,281,571
42,499 55,517 77,802 (3,752) 2,911
1,352,157 1,358,962 1,412,724 679,583 675,831
Adjustment to restate net assets (2)
(35,693) (1,755) (810,942) - (1,412)
$1,358,962 $1,412,724 $679,584 $675,831 $677,330
(1) Excludes the Internal Service Funds.
(2) FY2017 amounts have been restated for GASB 75.
Fiscal Year Ended June 30
Education
Libraries
Charges for services
Revenues:
Revenues from other agencies
Excess (Deficiency) of Revenues and Other Sources of
Financial Resources over Expenditures
Beginning Net Assets
Ending Net Assets, GAAP Basis
Total Expenditures
Housing
Interest on investments
Miscellaneous
Total Revenues
Other Sources of Financial Resources:
Operating transfers from primary government
Expenditures:

Financial Information 17
Sources of Revenue
Overview of Tax Revenues
The chart below presents the composition of the County’s budgeted tax revenues in all funds for fiscal year 2020.
Composition of Tax Revenues
Local Property Taxes
Assessments
The assessment of all real and tangible personal property for purposes of property taxation by the County is solely the
responsibility of the State Department of Assessment and Taxation, an independent State agency. Assessment records
and tax rolls are maintained in each county seat and in Baltimore City. Real property is valued at market value (“full
cash value”) and active farm property is assessed at $500 per acre. Personal property owned by a business is assessed
annually by the State based on returns filed by April 15 for property owned as of January 1 of that year .
Property Tax Credit Programs
Under State law, certain owners who occupy residential property receive tax credits against local property taxes. The
effect of the homestead property tax credit is to limit property tax increases payable as a result of increases in assessed
values. State law permits a maximum increase of 10 percent in assessed value annually, but the County has elected to
reduce that percentage to five percent. The County granted $2.3 million of such tax credits in fiscal year 2019 and
estimates $1.8 million will be granted in fiscal year 2020.
A State-mandated tax credit is granted to certain property owners with lower incomes. The credit is calculated using a
scale that establishes a maximum property tax liability for various income levels. The credit is reimbursed to the County
by the State; for fiscal year 2019, the County received $3,510,911. In fiscal year 2019, the County granted a
supplemental credit to certain property owners with lower incomes. This credit amounted to $29,387. The County also
grants a tax credit for homeowners 70 years of age and older who fall into certain income and asset categories. In the
fiscal year 2019, senior credits were issued in the amount of $588,956.

18 Financial Information
Assessed Value, Property Tax Rates and Property Tax Levies
The chart below presents the composition of the County’s assessable base of both real and personal property in fiscal
year 2019.
Composition of Assessed Property
The following table presents the assessed value of all taxable property in the County for the last five fiscal years, the
County tax rates and the tax levy in each of those years. The County has exempted manufacturers’ and warehousing
inventories and manufacturers’ machinery, tools and equipment from local property taxation. Assessed values of tax-
exempt properties owned by Federal, State and County governments, churches, charities, schools, fraternal
organizations, cemeteries, fire companies, disabled veterans and the blind, aggregating approximately $3.6 billion as of
June 30, 2019, are not included in the table below.
Assessed Values, Tax Rates and Tax Levies
2015 2016 2017 2018 2019
Assessed Value ($000)
Real property $44,112,719 $45,939,083 $47,976,024 $49,821,784 $51,679,563
Personal property 49,749 51,398 53,600 55,941 59,609
Railroads and public utilities 51,966 60,841 51,837 57,826 57,518
Corporations 1,516,731 1,590,292 1,545,347 1,582,455 1,615,926
Total Assessable Base $45,731,164 $47,641,613 $49,626,809 $51,518,005 $53,412,616
County Tax Rate:
Real Property 1.014 1.014 1.014 1.014 1.014
Personal Property 2.535 2.535 2.535 2.535 2.535
County Tax Levy ($000)(1)
$485,607 $506,793 $525,427 $545,280 $564,976
Fire District Tax Rate
Real property 0.176 0.176 0.176 0.176 0.176
Personal property0.440 0.440 0.440 0.440 0.440
Fire Tax Levy ($000) $84,285 $87,964 $91,207 $94,653 $98,063
(1)Excludes payments in lieu of taxes, addit ions and abatements, interest on taxes, discounts on taxes, various tax credits and tax levies on any tax-exempt property.
Fiscal Year Ended June 30

Financial Information 19
The fire district tax is levied on the assessable base within the County’s fire district. Proceeds of the tax are distributed
to the Fire Tax Reserve Fund, a Special Revenue Fund, to fund operations, equipment and buildings.
As presented in the following chart, the value of commercial/industrial property increased approximately 55.6% over
the last five fiscal years, agricultural property values increased approximately 10.5% and residential real property values
increased approximately 17.6%.
Value of Assessable Base by Type of Property
The County estimates that the assessed value of all taxable property in the County for the fiscal year ending June 30,
2020 will be approximately $53.4 billion. The County’s real property tax rate for fiscal year 2020 is $1.014 per $100
of full cash value for real property and $2.535 per $100 of assessed value for personal property owned by businesses.
In fiscal year 2020, the total property tax revenue budgeted for the General Fund is $568.5 million, or a 3.5 percent
increase from the amount budgeted in fiscal year 2019.
Property Tax Collection
County taxes are due and payable as of July 1 of each fiscal year, except that real property taxes on principal residences
and on small business properties are due and payable in two installments as of July 1 and December 1 of each fiscal
year. A discount of 0.5 percent is allowed on payments made in July. The County records property tax revenues as the
taxes are billed. Over the last five years, the County has collected virtually all of the property taxes levied.
When taxes become delinquent, combined interest and penalty at the rate of 1.5 percent per month are charged for each
month or fraction thereof that taxes due remain unpaid for the current year. Delinquent taxes are satisfied, after prior
notice of delinquency, at public auction conducted by the Director of Finance prior to the end of the fiscal year of billing.
The 2020 tax sale date has been changed to August 5, 2020. The net receivables uncollected 60 days after year-end are
recorded as deferred revenues. Personal property taxes receivable are charged off as uncollectible after all collection
means are exhausted.

20 Financial Information
The table below presents information with respect to the County’s tax levies and tax collections for fiscal years 2015
through 2019.
Major Property Taxpayers
The following table presents the ten largest property taxpayers on June 30, 2019, the total taxes paid by such taxpayers
during fiscal year 2019 and the assessed value of real and personal property owned by each taxpayer during fiscal year
2019.
Local Income, Transfer and Other County Taxes
Local Income Taxes
The State imposes an income tax on the adjusted income of individuals as determined for federal income tax purposes,
subject to certain adjustments. For tax year 2019, Maryland's personal tax rates begin at 2% on the first $1,000 of taxable
income and increase up to a maximum of 5.75% on incomes exceeding $250,000 (or $300,000 for taxpayers filing
jointly, heads of household, or qualifying widows/widowers). Nonresidents are subject to a special tax rate of 1.75%, in
addition to the state income tax rate. The deadline to file 2019 taxes has been extended to July 15, 2020.
Pursuant to State law, each county and Baltimore City may levy a local income tax at the rate of at least 1.75 percent,
but not more than 3.2 percent, of the State taxable income of individuals domiciled in their respective jurisdictions. With
a local income tax rate of 3.2 percent, the County is one of eight with local income tax rates set at the maximum.
Total Property Tax Levies and Collections ($000)
Fiscal Year Total Tax Delinquent As % of Current
Ended June 30 Levy (1) Taxes Year's Tax Levy
Amount % Amount % Amount
2019 $663,039 $656,951 99.08 $656,951 99.08 $6,087 0.92
2018 639,933 635,258 99.27 639,402 99.92 532 0.08
2017 616,634 612,695 99.36 616,028 99.90 605 0.10
2016 594,758 593,510 99.79 594,327 99.93 431 0.07
2015 569,892 568,112 99.69 569,540 99.94 353 0.06
(1) Total tax levy represents the original property tax levy, and excludes f ire district taxes levied, payments in lieu of taxes, addit ions and abatements,
interest on taxes, discount on taxes and various tax levies on any tax-exempt property.
Current Year's Taxes Taxes Collected
Collection Year of Levy (Current and Delinquent)
Ten Largest Property Taxpayers (1)
Total Taxes Taxable Assessed Percentage of Total
Name of Taxpayer Type of Business Paid ($000) Valuation Amount ($000) Assessed Valuation
Baltimore Gas & Electric Company Gas and Electric Utility $13,763 $458,256 0.86%
Mall in Columbia Business Trust Rental Real Estate 3,867 276,187 0.52
Howard Properties Howard Crossing Apartment Rentals 1,996 143,429 0.27
Verizon - Maryland Telephone Communicatons 3,750 128,384 0.24
9220 Old Lantern Way Owner LLC Apartment Rentals 1,789 124,848 0.23
Parcel D Property LLC Rental Real Estate 1,243 100,299 0.19
Home Properties Charleston Apartment Rentals 1,383 99,483 0.19
API Columbia Town Center LLC Rental Real Estate 1,144 80,161 0.15
Mariner Sherwood Apartment Rentals 1,156 79,115 0.15
Lutheran Village Rental Real Estate 1,014 73,930 0.14
Totals $31,105 $1,564,093 2.93%
(1) The information set forth above was compiled from tax rolls on which the names of owners are not always recorded in the same manner.

Financial Information 21
In the case of Comptroller v. Wynne, 135 S.Ct. 1787 (2015), the United States Supreme Court ruled in May 2015 that
Maryland’s personal income tax structure, which allowed counties to collect personal income taxes from residents on
income earned in other states where the income was subject to tax by that state, violates the Commerce Clause and that
Maryland residents who paid income taxes to another state on income earned in the other state are entitled to a credit
against the county portion of the Maryland income tax owed. The ruling means that each county in Maryland will
experience a reduction in income tax revenue, including the County. The total fiscal impact on the County is still being
assessed but the decision will have a direct impact on the County in both covering historical liabilities resulting from
refund claims by certain taxpayers and from a loss of revenues in the future. As of September 2017, the County has
incurred verified accumulative historical liabilities of approximately $9.1 million based on refund claims approved and
processed by the State Comptroller’s Office. This number will increase as more requests for refunds are processed by
the State Comptroller’s Office. For those historical liabilities, the State will initially provide the refunds to the taxpayers
and then the County has the option to either pay back the State the full amount in one lump sum or through nine quarterly
installments, commencing in May 2021 (fiscal year 2021). Litigation is currently pending challenging the interest rate
to be applied to the income tax refunds. If such claims or appeals are successful, the estimated amount of interest on
refunds owed by the County would increase.
As reflected in the FY2017 CAFR (for fiscal year closing on June 30, 2017), the County no longer assigned any amount
from its fund balance for refunds resulting from the Wynne case. The installment payments are spread over multiple
years and the County is able to incorporate estimated impact in its annual revenue forecasts rather than set aside a lump
sum in the fund balance to address such impact. The County estimates its loss in income revenues to be approximately
$1.0 million per year going forward.
The following table presents the total amount of income tax budgeted for the last six fiscal years and received for fiscal
years 2015 through 2019.
Local Transfer Taxes
The County levies and collects a transfer tax at the rate of one percent of the actual consideration paid for the conveyance
of title, which tax is imposed upon all transfers of real property within the County. Twenty-five percent of proceeds of
the transfer tax are distributed to an agency fund for school construction and site acquisition, 25 percent for Recreation
and Parks, 12.5 percent for Fire Service Buildings and Equipment Capital Project Funds, 25 percent for the Agricultural
Land Preservation Program, and 12.5 percent to the Community Renewal Special Revenue Funds. In fiscal year 2019,
the total amount of transfer tax collected was $31.4 million. The amount of transfer tax budgeted for fiscal year 2020 is
$30.0 million. Maryland House Bill 1454 was introduced in 2020 to authorize Howard County to increase the rate of
the transfer tax. The additional revenue would be split equally between schools, parks, housing and fire.
Building Excise Tax
The County levies and collects a building excise tax on all construction in the County. The tax is levied at the time a
building permit is issued and the amount of tax paid is determined by the square footage of the construction project. The
County uses this money to fund road construction projects as well as to pay debt service on general obligation bonds
whose proceeds fund such projects. The County has issued $141.6 million of these general obligation bonds since 2000.
In addition, $51.4 million of excise tax collected has been appropriated as pay-go funding on road construction projects
since fiscal year 1995. The total amount of excise taxes collected were $7.3 million in fiscal year 2019 and $8.9 million
is budgeted in fiscal year 2020.
Income Tax Revenues (000)
Fiscal Year Ended
June 30 Budget Actual
2020 $465,244 -
2019 454,296 $462,445
2018 444,292 444,453
2017 430,586 435,233
2016 407,367 433,404
2015 408,780 394,985

22 Financial Information
School Facilities Surcharge
The County levies and collects a surcharge on all residential construction in the County. The surcharge is levied at the
time a building permit is issued. The County uses this money to fund public school construction projects as well as to
pay debt service on general obligation bonds whose proceeds fund such projects. Prior capital budgets included $102
million of County general obligation bonds whose debt service will be paid from the surcharge. The County has issued
$101.8 million of these general obligation bonds. The total amount of school facilities surcharge collected in fiscal year
2019 was $5.7 million, and $7.3 million is budgeted in fiscal year 2020.
Maryland House Bill 1409, enacted in 2019, gave the County the authority to increase the School Surcharge rate effective
July 1, 2019. The school surcharge is paid when a building permit is applied for. All revenue raised from this surcharge
is dedicated to school construction for the Howard County Public School System.
On November 4, 2019, the Howard County Council voted unanimously to pass Council Bill 42-2019, which raised the
school facilities surcharge paid in Howard County to fund school construction effective January 6, 2020. The bill set
phased-in rates for the school facilities surcharge over the course of two years. Subject to inflation, the surcharge is set
at $4.75 per square foot through December 31, 2020, $6.25 per square foot through December 31, 2021, and $7.50 per
square foot for all years thereafter. The increased rates are projected to generate up to an additional $200 million in
revenues over the next 20 years.
Other County Taxes
The County levies and collects other miscellaneous taxes, the largest of which is the recordation tax on instruments
conveying title to property and securing debt. In fiscal year 2019, the total amount of other taxes collected was $30.4
million. Of this amount, $21.1 million was attributable to the recordation tax. The fiscal year 2020 recordation tax
budget is $21.5 million.
Local Charges for Services, Licenses and Permits, and Fines
The County and its Component Units collect charges for various services as well as fees for licenses and permits. The
largest of these constituting General Fund revenues are rental housing inspection fees, development-review fees, cable
television franchise fees and charges for boarding prisoners. In fiscal year 2019, the total amount of charges and fees
collected in the General Fund were $13.8 million. The fiscal year 2020 budget is $12.5 million.
The largest charges and fees credited to Special Revenue Funds are charges for use of recreational facilities and programs
and fees and charges for trash collection and use of the County landfill. The total amount of charges and fees collected
in Special Revenue Funds in fiscal year 2019 were $46.6 million and $55.0 million is budgeted in fiscal year 2020.
State-Shared Taxes
The State shares certain taxes collected in the County with the County. These taxes are primarily collected on gasoline
sales and used for construction and maintenance of highways. The State is not required to share such taxes and has
changed the amount that it shares from year to year. The total amount of State-shared taxes collected in fiscal year 2019
was $1.7 million, with $3.5 million budgeted for fiscal year 2020.
State and Federal Grant Assistance
The County receives and accrues grant revenues from the federal and State governments. The largest of these grants
constituting General Fund revenues is from the State for police protection. The total amount of grants received in the
General Fund in fiscal year 2019 was $9.7 million, with $7.5 million budgeted in fiscal year 2020.
Revenues in the Grants Special Revenue Fund are primarily categorical grants from the federal government funding
special programs, such as housing, senior services, transit and homeland security. The total amount of grant funds
received in the Grants Special Revenue Fund in fiscal year 2019 was $17.6 million.
The County’s Component Units receive and accrue grants from other government agencies, primarily the State, in
addition to operating transfers received from the County. In fiscal year 2019, the total amount of grants collected by the
Component Units was $176.8 million. Of that amount $175.5 million was used for operations by the Board of Education,

Financial Information 23
$0.5 million was used for operations by the Community College and $0.8 million funded the Howard County Housing
Commission.
Water and Sewer Enterprise Fund
The County provides water and sewer services primarily to areas of heavy residential and commercial demand in the
eastern part of the County (the “Metropolitan District”). The Metropolitan District and the County’s water and sewer
facilities are described in more detail under “Government and Infrastructure, Water and Sewer System” herein. Financial
accounting for the County’s water and sewer operations is consolidated in an enterprise fund.
Water and sewer service charges are recorded as revenues when they are billed. At each fiscal year-end, revenue is
accrued for the amount of unbilled water and sewage service provided. Other revenues are recorded as payments when
received, except at fiscal year-end, when all other revenues are also accrued. Unpaid water and sewer service charges
and assessments are a lien on the real property served and are collectible in the same manner as real property taxes at
tax sale.
The water and sewer enterprise fund’s largest source of operating revenues are water and sewer user charges. These
charges are based on the amount of water used. Commercial and residential properties connecting into the water and
sewer system also pay connection charges. The average quarterly bill for a family of four in fiscal year 2019 is
approximately $245.
Composition of Budgeted Water and Sewer Revenues
The chart above presents the costs related to provision of water and sewer services are financed primarily with ad
valorem, front-foot charges, and user fees. For fiscal year 2020, an ad valorem charge of $0.08 per $100 assessed value
was levied upon all property located within the Metropolitan District. Property abutting a road under which the County
has built a water or sewer main is charged a fixed amount annually for 30 years (front foot), with such amount established
in the year in which water or sewer service becomes available to each specific property. An in-aid-of-construction
charge is collected for each connection of an equivalent dwelling unit.
The County has entered into certain agreements with Baltimore City, Baltimore County and the Washington Suburban
Sanitary Commission for water supply services and/or sewage disposal services. Under the terms of such agreements,
the County is to reimburse these governmental units for their costs of providing water and sewer service. The County
provides for annual accrual of its liability under these agreements. Under the terms of several other agreements with
these governmental units as well as Anne Arundel County, the County is obligated to fund a portion of capital
improvements to certain existing and proposed water and sewer facilities. The County estimates that its remaining
commitment under these agreements over the next five fiscal years is $15.4 million and such obligation is included in
the County’s capital program.

24 Financial Information
The following table presents the revenues, expenses and changes in net position of the water and sewer enterprise fund
for fiscal years 2015 through 2019.
Water & Sewer Enterprise Fund Statement of Revenues, Expenses & Changes in Net Position (000)(1)
Operating Revenues: 2015 2016 2017 2018 2019
User charges $60,668 $62,204 $61,736 $60,634 $60,911
Miscellaneous sales and services 1,285 859 525 2,684 2,005
Total Operating Revenues $61,953 $63,063 $62,262 $63,318 $62,915
Operating Expenses:
Salaries and employee benefits 11,794 12,538 13,478 13,550 13,651
Contractual services 22,849 17,506 15,262 14,765 16,508
Supplies and materials 2,238 3,701 2,248 2,216 3,323
Business, travel and vehicle expenses 1,498 1,470 1,574 1,841 1,974
Purchased water and transmission charges 18,620 20,480 23,416 26,926 30,403
Sewage treatment charges 6,484 4,359 7,081 7,550 8,032
Share of county administrative expense 4,288 4,703 4,484 5,035 5,681
Other 717 435 1,173 730 1,220
Depreciation expense 19,701 21,609 22,360 22,714 23,015
Less: House connection and capitalized overhead
costs (66) (139) (91) (51) (9)
Total Operating Expenses $88,122 $86,661 $90,985 $95,274 $103,799
Operating Loss (26,169) (23,598) (28,723) (31,956) (40,884)
Nonoperating Revenues (Expenses):
Ad valorem charges 30,010 31,340 32,670 33,958 35,349
Water and sewer assessment charges 2,180 1,903 1,619 1,324 1,124
Interest on investments 235 760 824 2,201 5,341
Interest expense (9,234) (9,527) (10,880) (10,828) (9,039)
Gain (loss) on sale of capital assets (133) 396 - 53 (794)
Grant - - - - 1,299
Other revenue (expense) 11,086 3,331 881 (28) (32)
Total Nonoperating Revenues (Expenses) $34,144 $28,202 $25,114 $26,680 $33,248
Net Income before Contributions and Transfers 7,975 4,604 (3,609) (5,276) (7,636)
Capital contributions 27,513 14,729 7,606 11,433 11,481
Operating transfers in (out) (500) - - - -
Change in Net Position $34,988 $19,333 $3,997 $6,157 $3,845
Net Position at Beginning of Period 505,653 538,689 558,022 562,020 557,229
Adjustment to Beginning Net Position (1,952) - - (10,948) -
Net Position at End of Period $538,689 $558,022 $562,020 $557,229 $561,074
(1) This information should be read in conjunction with the audited basic financial statements set forth in Appendix A.
Fiscal Year Ended June 30

Financial Information 25
Special Recreation Facility Enterprise Fund
The County owns an 18-hole public golf course, opened in 1996, whose construction and equipping were financed with
proceeds of revenue bonds issued in 1995 and subsequently refunded in 2003. In May 2012, the 2003 bonds were
redeemed by the Taxable Golf Course Refunding Revenue Note (Timbers at Troy Golf Course), Series 2012, which was
privately negotiated with a financial institution. The County accounts for the operations of the golf course in an
enterprise fund. The County has a multi-year contract through December 31, 2027 with a management company to
operate the course.
The following table presents the revenues, expenses and changes in net assets of the special recreation facility enterprise
fund for fiscal years 2015 through 2019.
Special Recreation Facility Enterprise Fund Statement of Revenues, Expenses & Changes in Net Position (000)(1)
Operating Revenues: 2015 2016 2017 2018 2019
Greens & cart fees (2)
$1,326 $1,272 $860 $687 -
Range fees 109 114 81 51 -
Merchandise sales & services 125 117 85 74 -
Food & beverage 307 309 213 161 -
Miscellaneous sales & services 27 27 22 116 $300
Total Operating Revenues $1,893 $1,840 $1,261 $1,089 $300
Operating Expenses:
Contractual services $1,459 $1,557 $2,729 $935 $826
Supplies and Materials - - - 10 -
Depreciation expense 40 39 48 151 147
Total Operating Expenses $1,499 $1,595 $2,777 $1,096 $973
Operating Income/(Loss) $394 $245 ($1,516) ($7) ($673)
Nonoperating Expenses: (204) (169) (138) (124) (134)
Income before contributions & transfers 191 76 (1,653) (131) (806)
Operating transfers in (out) 120 0 2,216 (4) 2
Change in Net Position $311 $76 $563 ($135) ($805)
Net Position at Beginning of Period 5,694 6,005 6,081 6,644 6,508
Total Net Position $6,005 $6,081 $6,644 $6,508 $5,703
(1) The info rmatio n in this table s ho uld be read in co njunctio n with the audited bas ic financia l s ta tements s e t fo rth in Appendix A.
(2) The co urs e is no w leas ed as o f J anuary 1, 2018. Leas e revenue is no w rece ived ins tead o f greens and cart fees .
Fiscal Year Ended June 30

26 Financial Information
Broadband Enterprise Fund
The Broadband Fund accounts for broadband services to private sector businesses as well as non-County government
agencies and County departments and component units.
The following table presents the revenues, expenses and changes in net position of the broadband enterprise fund for
fiscal years 2015 through 2019.
Operating Revenues: 2015 2016 2017 2018 2019
User charges $1,101,330 $1,322,575 $1,582,113 $1,786,773 $1,741,432
Miscellaneous sales & services - - 13,959 - 2,385
Total Operating Revenues $1,101,330 $1,322,575 $1,596,072 $1,786,773 $1,743,817
Operating Expenses:
Salaries and employee benefits 371,432 475,633 581,301 661,223 496,654
Contractual services 554,567 535,192 161,864 40,735 415,418
Supplies and materials 684 357,314 34,364 220 350,792
Business, travel and vehicle expenses 734 2,323 2,120 417 105
Depreciation expense 720,961 671,625 681,729 707,145 876,907
Total Operating Expenses $1,648,378 $2,042,087 $1,461,378 $1,409,740 $2,139,876
Operating Income/(Loss) ($547,048) ($719,512) $134,694 $377,033 ($396,059)
Nonoperating Revenues (Expenses):
Interest on investments (94) 3,478 5,707 44,511 131,891
Interest expense - - (10,935) (59,968)
Gain (loss) on sale of capital assets 23,318 14,629 - - -
Total Nonoperating Revenues (Expenses) $23,224 $18,107 $5,707 $33,576 $71,923
Net Income before Contributions and Transfers ($523,824) ($701,405) $140,401 $410,609 ($324,136)
Capital contributions 13,340,837 - 435,147 543,859 18,052
Operating transfers in (out) 52,940 489,909 563,072 (1,259,040) 555,170
Change in Net Position $12,869,953 ($211,496) $1,138,620 ($304,572) $249,086
Net Position at Beginning of Period - 12,869,953 $12,658,457 $13,797,077 $13,492,505
Net Position at End of Period $12,869,953 $12,658,457 $13,797,077 $13,492,505 $13,741,591
(1) This information should be read in conjunction with the audited basic financial statements set forth in Appendix A.
Broadband Enterprise Fund Statement of Revenues, Expenses & Changes in Net Position (1)
Fiscal Year Ended June 30

Financial Information 27
Watershed Protection and Restoration Enterprise Fund
The County passed legislation to create a Watershed Protection and Restoration fund as a dedicated, non-lapsing,
enterprise fund. The legislation allowed for the collection of a watershed protection and restoration fee to allocate the
cost of the program to all owners of improved real property based on impervious surface measurement. The fee was
included, as a separate item, on a supplemental real property tax bill, for each property subject to the fee.
The following table presents the revenues, expenses and changes in net position of the watershed protection and
restoration enterprise fund for fiscal years 2015 through 2019.
Operating Revenues: 2015 2016 2017 2018 2019
User charges $11,106 $11,069 $11,033 $10,812 $9,476
Miscellaneous sales and services 29 25 17 25 25
Total Operating Revenues $11,135 $11,094 $11,050 $10,836 $9,501
Operating Expenses:
Salaries and employee benefits 1,158 771 830 938 1,049
Contractual services 653 738 935 1,586 1,477
Supplies and materials 1 - 28 1 8
Business, travel and vehicle expenses 1 2 - 1 2
Share of county administrative expense 710 1,107 1,094 1,253 1,096
Other 78 92 82 82 82
Depreciation expense 26 35 77 97 112
Total Operating Expenses $2,627 $2,745 $3,047 $3,959 $3,825
Operating Income/(Loss) $8,508 $8,350 $8,003 $6,877 $5,676
Nonoperating Revenues (Expenses):
Interest on investments 8 61 65 204 519
Gain (loss) on sale of capital assets - 63 - - (0)
Interest expense - - - - (25)
Total Nonoperating Revenues (Expenses) $8 $123 $65 $204 $493
Net Income before Contributions and Transfers 8,516 8,473 8,068 7,081 6,169
Capital contributions - - - - 30,367
Operating transfers in (out) (3,370) (2,808) (5,948) (7,888) (9,969)
Change in Net Position $5,146 $5,665 $2,120 ($807) $26,566
Net Position at Beginning of Period 1,696 6,842 12,506 14,626 $13,819
Net Position at End of Period $6,842 $12,506 $14,626 $13,819 $40,385
(1) This information should be read in conjunction with the audited basic financial statements set forth in Appendix A.
Watershed Protection and Restoration Enterprise Fund
Statement of Revenues, Expenses & Changes in Net Position (000)(1)
Fiscal Year Ending June 30

28 Financial Information
Retirement and Pension Programs
Overview of Programs
Each fully benefited employee of the County is provided retirement benefits through and must be a member of (1) the
Police and Fire Employees’ Retirement Plan (“Police/Fire Plan”), (2) the Howard County Retirement Plan (“County
Plan”) or (3) the Employee Retirement and Pension Systems of the State of Maryland (“State Systems”). The State
Systems are cost-sharing multiple-employer defined benefit systems; the Police/Fire Plan and the County Plan are single-
employer defined benefit public employee retirement plans administered by the County. Fully benefited employees of
the Component Units are provided retirement benefits through the State Systems; most contributions to the State Systems
for these employees are made directly by the State according to State statute. The Governor’s fiscal year 2013 budget
authorized the counties to share the cost of funding teachers’ pensions. As of this date, the General Assembly has not
adopted statutory changes to the current obligation of the State to pay pension costs or regarding any costs or
responsibilities for unfunded actuarial liabilities that might be passed on to the counties. The Component Units’ financial
reports for the year ended June 30, 2019 present information related to their participation in the State Systems.
The following table presents the enrollment (as of July 1, 2019) and payroll in fiscal year 2019 for County employees
covered by the State Systems (excluding Component Unit employees), Police/Fire Plan and County Plan.
Information regarding these retirement and pension programs is contained in Note 15 of the notes to the audited basic
financial statements.
Funding of Payments Retirement and pension payments are funded from three sources: County contributions, member contributions and
investment earnings. The following table presents the County’s total pension contributions for fiscal years 2015 through
2019.
Enrollment and Payroll of Covered Employees
Inactive Active Vested Active Non-Vested
State Systems - 58 - $4,433
Police/Fire Plan 447 751 178 85,171
County Plan 1078 1,195 594 120,834
Non-Covered Payroll - - - 19,940
Total 1,525 2,004 772 $230,378
Enrollment
Payroll (000)
Total Pension Contributions (000)
Fiscal Year
Police/Fire
Plan County Plan Total County
Ended June 30 Contribution Contribution Contribution
2019 $27,720 $14,155 $41,875
2018 26,337 14,841 41,178
2017 24,729 14,179 38,908
2016 21,636 13,428 35,064
2015 22,530 13,967 36,497

Financial Information 29
Pension Liability
The County’s funding policies provide for periodic employer contributions at rates determined actuarially to accumulate
sufficient assets to pay for benefits when due. The County had a net pension liability of $37.5 million and $121.8
million, as of June 30, 2019 for the County Plan and the Police/Fire Plan respectively. The County has always made its
annual required contributions. The following tables present the computation of contribution requirements for the
Police/Fire Plan and the County Plan through the most recent actuarial valuations.
The Police/Fire Plan was only 37% funded when it was established in 1990. The increase in unfunded accrued liabilities
of the Police/Fire Plan and the County Plan is primarily the result of a reduction in the assumed rate of return from 8.0%
on a gross basis to 7.50% on a net basis. Investment gains and losses are smoothed over five years and actuarial gains
and losses are amortized over 15 years for both plans.
Other Post-Employment Benefits
In the financial statements for fiscal year 2018, the County implemented the provisions of Governmental Accounting
Standards Board (GASB) Statement 75, Accounting and Financial Reporting for Postemployment Benefits Other Than
Pensions.
Computation of Contribution Requirements
2015 2016 2017 2018 2019
Valuation Valuation Valuation Valuation Valuation
Total Pension Liability ($000) 528,451 574,446 637,712 694,496 741,185
Net Position ($000) 430,364 441,335 505,924 562,284 619,358
Net Pension Liability ($000) (96,272) (105,913) (121,456) (122,594) (121,827)
Percentage Funded (1)
81.8 81.6 81.0 82.3 83.6
Annual Covered Payroll ($000) 62,709 72,790 80,814 81,037 83,746
Net Pension Liability as % of
Annual Covered Payroll (1)
153.5 145.5 150.3 151.3 145.5
2015 2016 2017 2018 2019
Valuation Valuation Valuation Valuation Valuation
Total Pension Liability ($000) 377,131 400,512 445,553 478,828 515,666
Net Position ($000) 353,239 356,119 401,208 440,606 478,198
Net Pension Liability ($000) (23,487) (22,498) (35,438) (31,068) (37,469)
Percentage Funded (1)
93.8 94.4 92.0 93.5 92.7
Annual Covered Payroll ($000) 101,085 108,292 114,349 119,686 123,090
Net Pension Liability as % of
Annual Covered Payroll (1)
23.2 20.8 31.0 26.0 30.4
(1) Based on Actuarial Value of Assets
Source: Bolton Partners, Inc., Actuarial Valuation
County Plan for the Fiscal Year Ended June 30
Police/Fire Plan for the Fiscal Year Ended June 30

30 Financial Information
The County’s OPEB plan is a Cost-Sharing Multiple Employer Defined Benefit Healthcare Plan. Per Section 1.406B
of Howard County Bill No. 14-2008, the County established an irrevocable trust for administering the plan assets and
paying healthcare costs on behalf of the participants. The Plan includes the County (consisting of the County government
and Howard County Soil Conservation District) and its component units: Howard County Housing Commission, the
Community College, Howard County Library, Howard County Economic Development Authority and Howard County
Public School System.
The County provides a post-employment health insurance program in addition to pension benefits. These post-
employment benefits are subject to change at any time. All employees who retire from the County may participate in
the program. In order to be eligible, the retiree must have a minimum of fifteen years of County service and, immediately
preceding retirement, have been enrolled in a medical, vision or prescription drug insurance plan offered to active
employees of the County. The County will pay a percentage of the retiree’s health insurance premium based upon these
criteria. This percentage varies with the number of years of service attained by the employee. Other retirees who do not
meet the eligibility criteria are permitted to participate in the retirees' health insurance program by paying the full
premium at the group rate. The component units provide medical benefits to eligible employees who retire from
employment with the entity. The eligibility requirements vary among different entities. Each entity pays a percentage of
the health insurance premium based on certain criteria. In addition to medical benefits, the school system offers life
insurance benefits to eligible retirees who have provided ten years of service with the school system and have retired
from the Howard County Public School System.
The Plan’s funding policy provides for the County to contribute to the trust the actuarially determined annual required
contribution. During fiscal year 2019, the County contributed $15.724 million to the trust. The County budget for fiscal
year 2020 includes funding for pay-as-you go OPEB costs as well as $13 million to the trust.
Based on the most recent actuarial valuation which was prepared as of July 1, 2017 and rolled forward to June 30, 2018,
the actuarially calculated proportionate share of total OPEB liability as of the measurement date of June 30, 2018 was
$417.9 million and there was $41.5 million of actuarial plan assets; therefore, the net OPEB liability for the County was
$376.3 million. The plan fiduciary net position as a percentage of the OPEB liability was 9.94%.
Howard
County
Government
*
Howard
County Public
Schools
Howard
Community
College
Howard
County
Library
Howard
County
Housing
Commission
**
Howard
County
Economic
Development
Authority
(EDA) ** Total
As of June 30, 2018:
Total proportion of net
OPEB liabilities 376,331,122$ 743,045,807$ 34,243,904$ 16,887,405$ 1,641,831$ 586,368$ 1,172,736,437$
Total proportion of
OPEB assets 41,532,494 82,003,702 3,779,210 1,863,721 181,195 64,713 129,425,035
Total deferred
outflows of resources
from OPEB 49,344,159 68,632,632 3,162,994 2,237,361 264,572 167,082 123,808,800
Total deferred inflows
of resources from
OPEB 61,379,328 136,208,782 6,601,450 2,754,323 267,781 95,636 207,307,300
For the year ended
June 30, 2018:
Total OPEB expense 26,715,357$ 47,759,737$ 2,165,032$ 1,198,655$ 121,763$ 51,553$ 78,012,097$
* Enterprise fund share of net OPEB liability, OPEB assets, deferred outflows, and deferred inflows is $23,102,908, $2,549,673, $5,402,144, and
$3,768,067, respectively. The portion allocated to the Howard County Soil Conservation District for net OPEB liability, OPEB assets, deferred
outflows, and deferred inflows is $351,821, $38,827, $32,497, and $57,382, respectively.
** EDA is not included in the CAFR due to immateriality. Also, Housing Commission has a different fiscal year end.

Financial Information 31
Actuarial Assumptions
The actuarial methods and significant assumptions used by the actuary are summarized in this note to conform to the
disclosure requirements for GASB Statement 75.
Accounting for Annual and Disability Leave
As of June 30, 2019, County employees paid from the General Fund, Special Revenue Funds, and Internal Service Funds
accrued unused annual leave of $26.4 million. Unused annual leave for County employees paid from the water and
sewer enterprise fund was $891,193. These amounts are based upon the average daily pay rate for County employees
at year-end. The annual leave amounts are recognized as liabilities in the County’s financial statements. The disability
leave amounts do not vest to the employees and are not reflected as liabilities.
Insurance and Risk Management
The County is exposed to various risks of loss related to torts; theft of, damage to, and destruction of assets; errors and
omissions; injuries to employees; environmental exposures; and natural disasters. The County, excluding the Howard
County Public School System, has established two internal service funds to account for and finance its risks of loss. The
County’s risk-financing techniques include a combination of risk retention through self-insurance and risk transfer using
a risk pool and commercial insurance. The Employee Benefits Self Insurance Fund is administered by the Office of
Human Resources and provides full coverage for employee benefits and long-term disability claims. The Risk
Management Self Insurance Fund is administered by the Office of Risk Management in the Department of County
Administration and provides coverage up to a maximum of $1 million for each automobile liability claim, $1 million
for each general liability claim, $100,000 for each property and first party vehicle damage claim and unlimited coverage
for each workers’ compensation claim.
The County belongs to the Local Government Insurance Trust (“LGIT”), a Maryland governmental insurance pool,
which provides insurance for claims in excess of coverage provided by the County’s Risk Management Fund. The
County pays an annual premium to LGIT for this coverage. The County participates in LGIT in the areas of excess
property, general and automobile liability coverages. LGIT was created to provide broader insurance coverages to
Maryland’s local governmental entities than those available from commercial insurers, coverages which would
otherwise be unavailable, and loss control and risk management services. Claims settled by the County in the past five
fiscal years have not exceeded the Risk Management Fund’s retention to trigger payment by LGIT except for the Bain
Center water damage loss on February 18, 2015.
All funds and component units of the County, excluding the Howard County Public School System, participate in the
risk management program and make annual payments to the internal service fund. These payments are calculated based
on a combination of actuarial estimates and historical cost information. These amounts are needed to pay administrative
costs, prior and current year claims and to establish a reserve for future claims and catastrophic losses.
At fiscal year-end, the combined Net Position for the two internal service funds was $17,559,388 and is reported as
unrestricted. The combined claims liability of the two funds, $20,215,850, is based on generally accepted accounting
principles, which require that a liability for claims be reported if information prior to the issuance of the financial
Actuarial Cost Method Entry Age Normal
Projected Cash Flows
Member & County contributions will continue to increase $3 million per
annum.
Discount rate of 3.98% was applied to investments in fiscal years 2018
through 2037.
Municipal Bond Rate
3.628% as of 6/30/18 based on the Bond Buyer General Obligation 20-year
Bond Municipal Bond Index.
Interest Assumption Equivalent single discount rate of 3.98% as of 6/30/18
Inflation 2.20%
Long-term Expected Real Rate of
Return, Based on Geometric Means
3.27% for Equity investments (based on 65% target allocation) and 1.25%
for Fixed Income investments (based on 35% target allocation), or a total of
4.52%
Healthcare Cost Trend Rate 3.80%

32 Financial Information
statements indicates that it is probable that a liability has been incurred at the date of the financial statements and the
amount of the loss is reasonably estimated.
Investment Policy
The County has established an investment policy that applies to all of its financial assets. This policy invests public
funds in a manner that conforms to all applicable State and County statutes while meeting the County’s investment
objectives. The three prioritized objectives of the County’s investment activities are (1) safety of principal through (a)
diversification, (b) third-party collateralization and safekeeping and (c) delivery versus payment; (2) liquidity sufficient
to meet all reasonably anticipated operating requirements; and (3) return on investment at least equal to the yield on U.S.
Treasury bills of comparable duration. The Director of Finance is required to develop and maintain written
administrative procedures as well as a system of controls to regulate the operation of the investment program.
Compliance with these procedures and controls is audited as part of the County’s annual financial audit.
As of June 30, 2019, the County had investments totaling approximately $484.2 million. Of these investments, none
have maturities in excess of one year, other than stripped-coupon U.S. Treasury securities that the County has purchased
to provide for the payment of the final installments under its agricultural land preservation installment-purchase
agreements. All investments were purchased to be held to maturity, and interest is paid throughout the term except as
previously noted. The County has never entered into reverse repurchase transactions, and does not invest in derivatives.
The County’s investment policy was updated in February 2019 and received a Certificate of Excellence from the
Association of Public Treasurers of the United States and Canada. The County is a member of the Investment and
Treasury Affinity Group of the Maryland GFOA, which periodically brings together public investment officers from
large Maryland counties, Baltimore City and the State.

Capital Requirements and Debt Management 33
Capital Requirements and Debt Management
Capital Projects Funds
The following table presents the sources and uses of funds in the County’s Capital Projects Funds over the last five fiscal
years.
Sources and Uses of Capital Projects Funds ($000)(1)
Fiscal Year Ended June 30
2015 2016 2017 2018 2019
Source of Funds:
Proceeds of bonds and notes 100,180$ 76,490$ 133,925$ 172,332$ 107,662$
Proceeds of refunding bonds 84,015 21,157 140,385 183,686 22,514
Bond Premium 17,523 13,509 43,899 49,186 12,219
Capital Leases - 10,058 3,368 11,937 -
Local transfer tax 19,353 19,732 23,690 23,641 26,933
Pay-as-you-go funding - 4,450 - - -
Revenues from other governmental agencies 14,408 7,147 21,847 23,243 15,289
Developer contributions 3,985 4,377 8,466 1,899 474
Other 11,816 9,249 7,655 9,149 10,478
Operating transfers in 21,379 3,491 23,429 25,869 34,960
Total Sources 272,659$ 169,661$ 406,663$ 500,942$ 230,529$
Use of Funds:
Capital projects expenditures 171,692 186,875 209,455 196,506 207,179
Operating transfers out 19,980 20,581 20,324 26,446 25,925
Payment to refunded bond escrow agent 93,817 26,441 169,144 219,086 24,007
Total Uses 285,488$ 233,898$ 398,923$ 442,038$ 257,111$
Excess (Deficit) of Sources over Uses (12,830) (64,237) 7,740 58,904 (26,582)
Fund Balance at Beginning of Period 52,026 39,196 (25,042) (17,302) 41,602
Fund Balance (Deficit) at End of Period $39,196 ($25,042) ($17,302) $41,602 $15,020
(1) The info rmatio n in this table s ho uld be read in co njunctio n with the audited bas ic financia l s ta tements s e t fo rth in Appendix A .

34 Capital Requirements and Debt Management
Board of Education Capital Projects
The following table presents the sources and uses of funds for the Board of Education’s capital projects for the last five
fiscal years.
Composition of Debt
The chart below presents how proceeds of outstanding County bonds were used as of June 30, 2019.
Composition of Issued General Obligation Debt
Sources and Uses of Funds for Board of Education Capital Projects ($000) ( 1 )
Fiscal Year Ended June 30
2015 2016 2017 2018 2019
46,452$ 61,232$ 53,016$ 54,858$ 36,280$
31,636 18,910 37,478 6,741 6,220
1 8 24 100 244
Total Sources 78,090$ 80,150$ 90,519$ 61,699$ 42,744$
80,462 79,066 83,538 63,212 37,053
Total Uses 80,462$ 79,066$ 83,538$ 63,212$ 37,053$
(2,372) 1,084 6,981 (1,513) 5,692
(1,411) (3,783) (2,699) 4,282 2,769
(3,783)$ (2,699)$ 4,282$ 2,769$ 8,460$
Source: Howard County Public School System Office of Finance
Excess (Deficit) of Sources over Uses
Fund Balance at Beginning of Period
Fund Balance at End of Period
(1) This table should be read in conjunction with the audited basic financial statements of the Board of Education.
Sources of Funds:
Proceeds of County bonds and notes
Revenues from County and State
Other
Uses of Funds:
Capital projects expenditures

Capital Requirements and Debt Management 35
Capital Budget and Program
The following table presents the County’s adopted capital budget for fiscal year 2020 and program for fiscal years 2021
through 2025.
Debt Management Policy
Section 17-207 of the Local Government Article of the Annotated Code of Maryland requires each local government
unit to adopt by resolution, motion or ordinance a local debt policy consistent with the Maryland Constitution, State law
and the Howard County Charter. On October 5, 2009, the County adopted an updated debt management policy that
establishes the processes employed in the management of its short- and long-term debt. The policy sets the parameters
for issuing debt and managing outstanding debt. It provides guidance to decision makers regarding the timing and
purposes for which debt may be issued, types and amounts of permissible debt, method of sale that may be used and
structural features that may be incorporated. The County added long-term variable rate debt as an approved type of debt
that can be issued. By establishing a debt policy, the County has recognized its binding commitment to full and timely
repayment of all debt. The policy ensures that the County maintains a sound debt position and that its credit quality is
protected.
In addition, the County adopted Build America Bonds (“BABs”) – Direct Pay Procedures in March 2010 and Tax-
Exempt Issuance Procedures in February 2012. The procedures ensure that the County does not expend bond proceeds
for non-eligible costs or projects and establish document retention, semi-annual filing and on-going compliance
guidelines.
Debt Capacity
Pursuant to Article VI of the County Charter and State law, the aggregate amount of bonds and other indebtedness of
the County outstanding at any one time may not exceed 4.8 percent of the full market value of real property and personal
property located within the County. In computing this percentage under the County Charter and State law, the following
are excluded: (1) tax anticipation notes or other debts having a maturity not in excess of 12 months, (2) bonds or other
debts issued or guaranteed by the County payable primarily or exclusively from taxes levied on or in, or other revenues
of, special taxing areas or districts and (3) bonds and other debts issued for self-liquidating and other projects payable
primarily or exclusively from the proceeds of assessments or charges for special benefits or services. Metropolitan
District debt, which is payable primarily from water and sewer charges, does not constitute general obligation debt for
the purpose of computing such percentage, and there are no other debt limitations applicable to Metropolitan District
debt. For the purpose of determining whether refunding bonds issued under such statute are within the legal debt
Capital Budget and Program ($000)
Authorization
Program Title Prior FY2020 Subtotal FY2021 FY2022 FY2023 FY2024 FY2025 Total
Bridge Improvements $22,369 $7,800 $30,169 $1,600 $4,500 $300 $3,200 $300 $40,069
Storm Drainage 158,964 28,200 187,164 34,900 33,675 27,875 28,175 27,875 339,664
Road Resurfacing 62,877 6,500 69,377 14,250 14,250 14,250 14,250 14,250 140,627
Road Construction 225,799 3,808 229,607 38,295 73,345 13,050 6,200 1,900 362,397
Sidewalk/Curb Projects 24,075 3,335 27,410 8,675 7,615 9,050 7,650 6,050 66,450
Traffic Improvements 22,413 1,420 23,833 6,180 3,955 3,105 1,500 270 38,843
General County 629,299 39,603 668,902 223,121 136,833 43,425 44,753 27,294 1,144,328
Fire 40,045 17,498 57,543 1,125 800 800 800 800 61,868
Library 31,927 488 32,415 1,022 296 5,211 32,960 2,575 74,479
Police 4,015 - 4,015 200 4,210 38,541 19,150 1,680 67,796
Recreation & Parks 199,824 4,459 204,283 14,050 12,150 8,475 13,225 7,900 260,083
Agricultural Preservation 170,608 - 170,608 - - - - - 170,608
Sewer 445,027 23,780 468,807 46,010 19,390 17,160 11,100 9,605 572,072
Water 219,787 9,975 229,762 20,630 15,483 13,533 8,295 8,075 295,778
Board of Education 648,694 54,615 703,309 122,472 135,504 130,022 140,043 105,451 1,336,801
Community College 143,041 4,824 147,865 17,868 30,205 30,097 27,785 14,085 267,905
Total $3,048,764 $206,305 $3,255,069 $550,398 $492,211 $354,894 $359,086 $228,110 $5,239,768

36 Capital Requirements and Debt Management
limitation of the County, the amount of bonds refunded is subtracted from, and the amount of refunding bonds issued is
added to, the aggregate of the County’s outstanding bonds.
Shown below is a calculation of the County’s legal debt capacity as of December 31, 2019, based on the County’s
estimated assessable base as of December 31, 2019.
Legal Debt Capacity ($000)
Assessable Base at 12/31/2019
$54,545,427,659
Assessable base limit on general obligation debt
$2,618,180,528
Total outstanding debt to be applied against County Charter limit
$1,042,479,325
Additional legal debt capacity
$1,575,701,202
Description of Debt
Public Improvement Debt
The County issues public improvement debt to defray the costs of general County capital projects, including storm
drainage, fire service, police, road construction, bridge, library, recreation and parks, school, community college,
sidewalk and curb, intersection and signal improvement, and community renewal capital projects. Such debt is a general
obligation of the County, and the County’s full faith and credit and unlimited taxing power are irrevocably pledged to
the punctual payment of principal of and interest on such debt when due and payable. Debt service on public
improvement debt is payable primarily from general tax revenues; however, building excise taxes, school surcharge,
broadband fees, environmental service fees, fire and transfer taxes are also used to pay debt service for certain types of
capital projects.
Short-Term Construction Financing Program
The County issues tax-exempt bond anticipation notes (BANs) in order to provide interim financing for a portion of the
cost of its ongoing capital projects. The notes are currently in the form of a line of credit and repaid with proceeds of
the County’s long-term bonds. The County typically issues its long-term bonds once a year in an amount corresponding
to the amount expended for capital projects since its last bond sale and uses such bond proceeds to redeem outstanding
notes and reimburse the capital projects fund. The outstanding amount of such notes as of December 31, 2019 was
$171.9 million. The County intends to refund all of the outstanding BANs with this bond issue.
Landfill Closure and Post-Closure Care Cost
State and federal laws and regulations require the County to place a final cap on closed landfill cells and to perform
certain maintenance and monitoring functions at cells for 30 years after closure. The County recognizes a portion of
these estimated closure and post-closure care costs in each operating budget, based on cell capacity used.
The County ceased using the Alpha Ridge landfill as its primary waste disposal site in 1997, and now exports waste to
a regional landfill in Virginia. The closure cap for a 70-acre cell at Alpha Ridge was completed and paid for in 2001.
The County does not expect to use the remaining capacity in the foreseeable future.
Closure costs for the existing cell and post-closure care cost for the closed and existing cells at the Alpha Ridge landfill
will approximate $29.4 million. Actual costs may differ due to inflation or future design changes. As of June 30, 2019,
the County has recognized $23.43 million of these costs. The County intends to fund the remaining costs from bond
proceeds and its annual Environmental Services Fund budget.

Capital Requirements and Debt Management 37
Metropolitan District
The County issues Metropolitan District debt to finance the costs of the County’s water and sewer capital projects as
well as its share of Baltimore City water and sewer capital projects. Such debt is a general obligation of the County,
and its full faith and credit and unlimited taxing power are irrevocably pledged to the punctual payment of principal of
and interest on such debt when due and payable. Debt service on Metropolitan District debt is payable from water and
sewer revenues and other revenues.
Maryland Water Quality Financing Administration
Under the Maryland Water Quality Financing Administration’s revolving loan program, the State has four outstanding
loans to the County at interest rates that are below market. The loans are tax-exempt obligations that were primarily
used to finance the expansion of the Little Patuxent Wastewater Treatment Plant and one financed the Holiday Hills
sewer project. As with Metropolitan District debt, such debt is payable from water and sewer revenues and other
revenues, but the full faith and credit of the County is also pledged to the payment thereof.
Agricultural Land Preservation Program
Through its agricultural land preservation program, the County finances the acquisition of development rights to a
particular parcel of agricultural property by entering into an installment-purchase agreement with the property owner.
Historically, under the terms of the installment-purchase agreement, the County paid the property owner semiannual
interest payments for up to 30 years, and minimal portions of the installment-purchase price biennially until maturity.
The rest of the purchase price for the development rights is paid at the end of the term with a balloon payment. Upon
execution of an installment-purchase agreement, the County purchased stripped-coupon United States Treasury
obligations in amounts sufficient to equal the balloon payment at the maturity of the installment purchase.
Under the current program, the County pays either five or ten percent of the purchase price at closing, with equal annual
principal payments over 15 or 20 years with interest. The County acquires the development rights to the land in
perpetuity. The County is using the 25 percent portion of the local transfer tax that is dedicated to agricultural land
preservation and the County’s share of the State transfer tax on agricultural land to fund this program.
Golf Course
In 1995, the County issued its Special Facility Revenue Bonds, 1995 Series A (the “Series 1995 Bonds”) to finance
construction of a public golf course and related facilities. The Series 1995 Bonds were refinanced with the issuance by
the County of its Golf Course Refunding Revenue Bonds, 2003 Series A (the “Series 2003 Bonds”). In May 2012, the
Series 2003 Bonds were redeemed by the County with issuance and sale of its Taxable Golf Course Refunding Revenue
Note (Timbers at Troy Golf Course), Series 2012 (the “Series 2012 Note”), which was privately negotiated with a
financial institution. Payment of the Series 2012 Note is secured by a pledge by the County of gross revenues generated
by the golf course facility and a debt service reserve fund. If a deficiency exists in the debt service reserve fund, the
County is obligated to restore the amount in such debt service reserve fund to the debt service reserve requirement of
$560,000 within 90 days, until the note has been paid in full. The County has never had to replenish the debt service
reserve fund due to any deficiency. The Series 2012 Note and the obligations payable thereunder do not constitute a
pledge of the County's full faith and credit or taxing power. The County's covenant to replenish the debt service reserve
fund and to maintain the facility in first class operating condition is a general contractual obligation of the County. In
fiscal years 2011, 2012, 2014, 2017, 2018 and 2019, the County General Fund subsidized a portion of the golf course
maintenance expenses.
Capital Leases
The County maintains leasing agreements with Banc of America Public Finance, KeyBank, SunTrust Bank, TD Asset
Management Funds, and Zions Bank for financing the acquisition of equipment. These lease agreements qualify as
capital leases for accounting purposes, and have been recorded at the present value of their future minimum lease
payments as of the inception date. The future minimum lease obligations total $35,443,286, and the net present value
of these minimum lease payments as of June 30, 2019 is $31,603,394.

38 Capital Requirements and Debt Management
Overlapping Debt
There are no incorporated towns, villages, municipalities or other subdivisions within the County boundaries having
separate taxing authority. Thus there is no overlapping municipal debt in the County. However, the Columbia
Association does have authority to issue debt which is funded via a fee. (See “Demography and Economy, Columbia”
herein.)
Tax Increment Financing
On March 11, 2014 the County issued its first Special Obligation Tax Increment Financing (TIF) Bonds in the amount
of $17 million, with an overall true interest cost of 6.148%. The proceeds were used to construct a 704-space parking
garage on 12.73 acres of land dedicated for commuter rail patrons. The County had previously designated the 12.73
acres as a Tax Increment Financing (TIF) District, at the site of the MARC Savage Commuter Rail Station. The land is
state-owned, thus no real property taxes were paid to the County for this property. However, County management
anticipates opportunities for local economic development by putting tax-exempt property on the local tax roll while
improving transportation infrastructure.
A companion special tax district has been created as a backup for the Special Obligation TIF bonds. Special taxes will
be imposed on property owners located within the special tax district in any year where the tax increment collections
are lower than the next year’s debt service obligation and TIF District expenses. The special taxes are also to be pledged
for the repayment of the Special Obligation TIF bonds.
These bonds are not general obligation bonds of the County; rather they are special obligations of the County payable
solely from the real property tax increment to be realized from the TIF District, any special taxes imposed and collected
from the companion Special Tax District, and any Base Realignment and Closure (BRAC) Zone payments awarded by
the State. The project was approved for designation as a BRAC Zone in June 2009. The total amount of pledged revenue
is $33,396,850. A reserve fund in the amount of $1,678,465 was established as part of the debt issuance. This reserve
will not be available for other purposes until the final maturity of the bonds in fiscal year 2044. Additionally, as of fiscal
year end 2019, $18,359 was held by an escrow agent for fiscal year 2020 debt service. Pledged revenues of $1,066,225
were recognized in fiscal year 2019. The outstanding debt of $16,875,000 is included in the primary government’s long-
term debt on the Statement of Net Position.
The bond offering is part of an overall Public Private Partnership (P3) development project known as Annapolis Junction
Town Center. When completed, the entire development project will be a comprehensive mixed-use State Transit-
Oriented Development (TOD) and will include 100,000 square feet of Class A office space, 416 luxury apartment units,
a 150-room hotel, 17,250 square feet of retail space and the 704-space parking garage (financed by the TIF). The project
will also include two additional parking garages, to be funded privately, to separately support parking needs for
businesses and residents.
On October 19, 2017, the County issued its $48,225,000 of Howard County, Maryland Special Obligation Bonds
(Downtown Columbia Project), Series 2017 A. The total amount of pledged revenue is $85,283,692. A reserve fund in
the amount of $3,921,283 was established as part of the debt issuance. This reserve will not be available for other
purposes until the final maturity of the bonds in fiscal year 2047. Additionally, as of fiscal year end, $124,434 is being
held by an escrow agent for fiscal year 2020 debt service. Pledged revenues of $4,137,520, were recognized in fiscal
year 2019. The outstanding debt of $48,225,000 is included in the primary government’s long-term debt on the Statement
of Net Position.
The development project consists of the redevelopment of a portion of the downtown area in the unincorporated master-
planned community of Columbia, Maryland, one of the first master-planned communities in the United States.
Downtown Columbia consists of an approximately 391-acre downtown area in Columbia designated by the County
Council and the County Executive of the County for development in the Downtown Columbia Plan, on February 3,
2010. Recognizing that additional housing in Downtown Columbia is fundamental to the economic future of Columbia,
the Downtown Columbia Plan recommends the development of an aggregate total of up to 6,244 additional residential
units of which, 656 to 2,296 units have been allocated to the Initial Stage of the Downtown Columbia Plan. The
Downtown Columbia Plan also recommends the development of an aggregate total of 1.25 million square feet of retail
(of which 300,000 to 676,446 square feet have been allocated to the Initial Stage of the Downtown Columbia Plan), 4.3
million square feet of office (of which amount 1,000,000 to 1,513,991 square feet have been allocated to the Initial Stage
of the Downtown Columbia Plan), and 640 additional hotel rooms (at least 100 of which have been allocated to the
Initial Stage of the Downtown Columbia Plan) to serve the present and future needs of the community, as well as

Capital Requirements and Debt Management 39
connected street networks, upgraded major intersections, and structured parking to accommodate future uses and
promote a “park-once” approach.
Conduit Debt
From time to time, the County has issued Industrial Revenue Bonds, Economic Revenue Development Bonds, Multi-
family Rental Housing Revenue Bonds, Retirement Community Revenue Bonds and Recovery Zone Facility Revenue
Bonds to provide financial assistance to private-sector entities for the acquisition and construction of industrial and
commercial facilities deemed to be in the public interest. The bonds are secured by the property financed and are payable
solely from payments received on the underlying mortgage loans. Upon repayment of the bonds, ownership of the
acquired facilities transfers to the private-sector entity served by the bond issuance. Neither the County, the State nor
any political subdivision thereof is obligated in any manner for repayment of the bonds. Accordingly, the bonds are not
reported as liabilities in the County’s financial statements.
At fiscal year-end June 30, 2019, there were 21 series of conduit debt outstanding. The aggregate principal amount
outstanding for the 12 series issued after July 1, 1996 was $93,428,065. The aggregate principal amount outstanding for
the 9 series issued prior to June 30, 1996 could not be determined; however, their original issue amounts totaled
$59,155,000.
The Howard County Housing Commission issued its $13,655,000 Lease Revenue Bonds (Roger Carter Recreation
Center), Series 2011 (the “Series 2011 Bonds”) in December 2011. The Commission used the proceeds of the Bonds to
finance a portion of the costs of the design, development, construction, and equipping of a recreation center, an indoor
swim center facility, and parking deck and related structures and site improvements (the “2011 Commission Project”)
located on Ellicott Mills Drive in Ellicott City in the County. The 2011 Commission Project was constructed on an
approximately 4.8-acre parcel of land owned by the Commission. The Commission and the County entered into a Lease
Agreement dated as of December 1, 2011 (the “2011 Lease Agreement”), under which the Commission leased the 2011
Commission Project and the Leased Premises (as defined in the 2011 Lease Agreement) to the County. The 2011 Lease
Agreement requires the County to make lease payments, which are calculated to be sufficient to pay when due the
principal of and interest on the Series 2011 Bonds. The 2011 Lease Agreement is not a general obligation of the County
and does not constitute a pledge of the faith and credit or the taxing powers of the County.
Public Private Partnership (P3) Agreement
On October 16, 2018, the County executed a Project Agreement with Edgemoor-Star America Judicial Partners (ESJP)
for the demolition of the Dorsey Building located at 9250 Judicial Way in Ellicott City and the construction and 30-year
maintenance of an approximately 240,000 square foot circuit courthouse and a 690-space parking garage. The County
is expected to take occupancy and make a $75 million milestone payment in June 2021. Annual availability payments,
consisting of a fixed capital charge of $6.6 million and a $3.3 million facility management charge, subject to CPI
escalation, will be made FY2022 through FY2057. The facility management charge is subject to unavailability and
performance failure deductions.

40 Capital Requirements and Debt Management
Outstanding Long-Term Debt
As of December 31, 2019, the County had outstanding long-term debt presented below.
Dated Date Issued ($000) Interest Rates (%) Final Maturity
Consolidated Public Improvement, Series A 03/16/10 49,015 4,355 3.00 - 5.00 02/15/23
Consolidated Public Improvement BABs, Series C (2) 03/16/10 39,405 39,405 5.00 - 5.55 02/15/30
Public Improvement and Refunding, Series B 11/17/11 182,055 83,405 3.00 - 5.00 08/15/31
Consolidated Public Improvement, Series A 03/20/12 37,370 1,640 2.00 - 4.00 02/15/32
Public Improvement and Refunding, Series A 03/19/13 97,910 3,925 2.38 - 5.00 02/15/33
Consolidated Public Improvement Project and Refunding, Series A 04/03/14 117,125 27,875 3.00-5.00 02/15/34
Consolidated Public Improvement Project and Refunding, Series A 04/22/15 184,195 120,330 3.00-5.00 02/15/35
Consolidated Public Improvement Project and Refunding, Series A 03/30/16 96,040 87,960 3.00-5.00 02/15/36
Consolidated Public Improvement Taxable, Series B 03/30/16 1,730 1,730 2.00 02/15/21
Consolidated Public Improvement, Series A 04/25/17 133,925 124,375 3.00 - 5.00 02/15/37
Consolidated Public Improvement Refunding, Series B 04/25/17 140,385 140,375 5.00 02/15/37
Consolidated Public Improvement Refunding, Series D 12/21/17 184,440 183,405 3.00 - 5.00 02/15/34
Consolidated Public Improvement Refunding, Series A 04/04/18 140,980 129,890 3.00 - 5.00 02/15/38
Consolidated Public Improvement Taxable, Series B 04/04/18 1,025 1,025 3.00 02/15/38
Consolidated Public Improvement Project and Refunding, Series A 05/29/19 133,630 128,960 2.75 - 5.00 08/15/38
Total Long-Term Public Improvement Debt $1,078,655
Maryland Water Quality Financing Administration 10/18/00 34,000(3)
6,182 2.40 02/01/22
Maryland Water Quality Financing Administration 01/29/02 22,000(3)
5,671 2.00 02/01/24
Maryland Water Quality Financing Administration 10/01/08 1,089 593 2.30 02/01/29
Maryland Water Quality Financing Administration 11/19/09 3,500 2,127 1.00 02/01/31
Metropolitan District Project and Refunding, Series B 11/17/11 36,245 12,915 3.00 - 5.00 08/15/41
Metropolitan District, Series A 03/20/12 19,970 660 3.00 - 4.00 02/15/37
Metropolitan District Project and Refunding, Series A 03/19/13 39,155 15,390 3.00 - 4.00 02/15/38
Metropolitan District Project and Refunding, Series A 04/03/14 22,055 8,450 2.00 - 4.00 02/15/44
Metropolitan District Project and Refunding, Series A 04/22/15 31,015 22,990 2.00 - 5.00 02/15/45
Metropolitan District Project and Refunding, Series A 03/30/16 26,190 24,840 3.00-5.00 02/15/46
Metropolitan District Project and Refunding, Series C 04/25/17 81,515 79,970 3.00 - 5.00 02/15/47
Metropolitan District Refunding, Series E 12/21/17 56,075 54,960 3.00 - 5.00 02/15/44
Metropolitan District Project and Refunding, Series C 04/04/18 38,150 37,250 2.50 - 5.00 02/15/48
Metropolitan District Project and Refunding, Series B 05/29/19 66,605 64,950 3.00 - 5.00 08/15/48
Total Water and Sewer Enterprise Fund Debt(4)
$336,948
Agricultural Land Preservation Program(5)
1989-2017 112,359 39,500 2.19 - 8.60 02/15/35
Golf Course Refunding Revenue(6)
05/30/12 5,400 1,965 2.475 08/15/22
Special Obligation (Annapolis Junction TIF) 03/11/14 17,000 16,875 4.80 - 6.10 02/15/44
Special Obligation (Downtown Columbia TIF) 10/19/17 48,225 48,225 4.00 - 4.50 02/15/47
$106,565
Outstanding ($000)(1)
(5) This amount does not include a portion of these obligations in the aggregate principal amount of $45,133,000, which will be paid in fiscal years 2020-2028 with
proceeds of U.S. Treasury obligations purchased by the County.
(6) These bonds do not constitute a pledge of the County’s full faith and credit or taxing power, but the County’s covenant to restore the amount in the debt service
reserve fund is a general contractual obligation of the County.
Total Special Revenue Funds, Other Enterprise Fund and Special Obligation Debt
(1) The outstanding amounts do not include bonds to be redeemed with the proceeds of refunding bonds previously issued by the County; such bonds to be redeemed
are not considered as outstanding debt of the County for debt limitation purposes.
(2) The gross interest rate and debt service are shown, the County expects to receive a Federal Subsidy of $5,956,637.
(3) This amount is the maximum that the County is authorized to draw down from the Maryland Water Quality Financing Administration.
(4) The payment of the principal of and interest on this debt is to be made first from certain charges the County is authorized to levy within the Metropolitan
District, but the full faith and credit of the County are also unconditionally pledged to such payment.

Capital Requirements and Debt Management 41
Schedules of Long-Term Debt Principal and Interest Payments
The following table presents the principal and interest payments for the County’s long-term public improvement debt
as of December 31, 2019. Debt service on the Public Improvement Bonds is shown in Appendix D.
The Internal Revenue Service released guidance stating that due to federal budget sequestration, federal direct credit
subsidies for ARRA bonds are subject to reduction beginning October 1, 2019 and extending until September 30,
2020. The amount of the reduction is 6.2% of the February 15, 2020 and August 15, 2020 interest payments, or
approximately $22,501 each.
Debt Service on Long-Term Consolidated Public Improvement Debt ($000)
Fiscal Year Principal (1)
Interest BAB Subsidy(2)
Total
2020 $ 36,630 $ 24,067 $ (726) $ 59,971
2021 69,825 45,628 (726) 114,727
2022 74,010 42,324 (726) 115,608
2023 78,465 38,745 (726) 116,484
2024 78,795 34,917 (726) 112,987
2025 77,550 31,026 (637) 107,939
2026 74,690 27,431 (545) 101,576
2027 72,150 23,955 (446) 95,659
2028 69,175 20,514 (344) 89,345
2029 65,455 17,181 (235) 82,401
2030 62,950 14,203 (121) 77,032
2031 59,205 11,387 - 70,592
2032 53,480 8,726 - 62,206
2033 47,220 6,873 - 54,093
2034 42,350 5,125 - 47,475
2035 36,185 3,723 - 39,908
2036 30,260 2,574 - 32,834
2037 25,820 1,552 - 27,372
2038 16,870 654 - 17,524
2039 7,570 114 7,684
Totals $1,078,655 $360,718 ($5,957) $1,433,417
(1) Includes mandatory sinking fund redemption payments on term bonds.
(2) BABs sudsidy is subject to a reduction of 6.2% due to sequestration as described below.

42 Capital Requirements and Debt Management
The following table presents the principal and interest payments for the County’s self-liquidating long-term debt, as of
December 31, 2019. Debt service on the Metropolitan District Bonds is shown in Appendix D.
Debt Service on Self-Liquidating Long-Term Debt ($000)
Water and Sewer Enterprise Fund Special Recreation Facility
(Metropolitan District and Water Quality Agricultural Land (Golf Course)
Financing Administration) (1) Preservation Program(2)Enterprise Fund
Fiscal
Year Principal(3)
Interest Total Principal Interest Total Principal Interest Total
2020 12,342$ 6,215$ 18,558$ 8,209$ 2,211$ 10,420$ 258$ 23$ 281$
2021 14,498 12,295 26,793 17,839 3,454 21,292 522 36 558
2022 14,625 11,709 26,334 7,108 2,346 9,454 535 23 558
2023 13,054 11,106 24,160 3,358 2,108 5,466 650 3 653
2024 12,437 10,538 22,976 13,588 2,024 15,612 - - -
2025 12,337 9,968 22,305 3,358 1,155 4,513 - - -
2026 12,780 9,376 22,156 3,919 1,054 4,972 - - -
2027 13,179 8,763 21,941 8,583 771 9,354 - - -
2028 12,907 8,151 21,058 5,496 509 6,005 - - -
2029 13,482 7,549 21,031 3,338 286 3,624 - - -
2030 12,055 7,007 19,062 2,924 205 3,129 - - -
2031 12,436 6,525 18,960 2,924 132 3,055 - - -
2032 12,505 6,031 18,536 997 79 1,075 - - -
2033 12,730 5,520 18,250 730 59 789 - - -
2034 12,815 5,088 17,903 730 43 773 - - -
2035 13,075 4,661 17,736 621 28 649 - - -
2036 13,350 4,233 17,583 380 16 396 - - -
2037 13,790 3,793 17,583 380 8 387 - - -
2038 12,475 3,340 15,815 155 2 156 - - -
2039 10,920 2,926 13,846 - - - - - -
2040 11,275 2,570 13,845 - - - - - -
2041 11,655 2,197 13,852 - - - - - -
2042 9,250 1,812 11,062 - - - - - -
2043 8,445 1,517 9,962 - - - - - -
2044 8,725 1,240 9,965 - - - - - -
2045 8,285 953 9,238 - - - - - -
2046 7,095 679 7,774 - - - - - -
2047 6,180 435 6,615 - - - - - -
2048 5,110 222 5,332 - - - - - -
2049 3,135 47 3,182 - - - - - -
$336,948 $156,464 $493,412 $84,633 $16,489 $101,122 $1,965 $85 $2,050
(1) Excludes administrative fees of five percent o f to tal debt service over the to tal loan period for the Water Quality Financing Administration debt.
(2) This amount includes obligations in the aggregate principal amount o f $45,133,000 which will be paid in fiscal years 2020 - 2028 with proceeds of U.S.
Treasury obligations purchased by the County.
(3) Includes mandatory sinking fund redemption payments on term bonds rounded to the nearest do llar.

Capital Requirements and Debt Management 43
The following table presents the principal and interest payments for the County’s special obligation long-term debt, as of
December 31, 2019.
Debt Service on Special Obligation Long-Term Debt
Special Obligation Special Obligation
(Annapolis Junction TIF) (Downtown Columbia TIF)
Fiscal
Year Principal Interest Total Principal Interest Total
2020 90,000$ 503,283$ 593,283$ - $1,051,109 $1,051,109
2021 115,000 1,002,245 1,117,245 200,000$ 2,102,219 2,302,219
2022 145,000 996,725 1,141,725 100,000 2,094,219 2,194,219
2023 175,000 989,765 1,164,765 100,000 2,090,219 2,190,219
2024 205,000 981,365 1,186,365 485,000 2,086,219 2,571,219
2025 240,000 971,525 1,211,525 465,000 2,066,819 2,531,819
2026 275,000 957,605 1,232,605 875,000 2,048,219 2,923,219
2027 315,000 941,655 1,256,655 1,100,000 2,013,219 3,113,219
2028 360,000 923,385 1,283,385 1,175,000 1,969,219 3,144,219
2029 405,000 902,505 1,307,505 1,250,000 1,922,219 3,172,219
2030 455,000 879,015 1,334,015 1,325,000 1,870,656 3,195,656
2031 510,000 852,625 1,362,625 1,400,000 1,816,000 3,216,000
2032 565,000 823,045 1,388,045 1,475,000 1,758,250 3,233,250
2033 625,000 790,275 1,415,275 1,575,000 1,697,406 3,272,406
2034 690,000 754,025 1,444,025 1,650,000 1,632,438 3,282,438
2035 760,000 714,005 1,474,005 1,750,000 1,564,375 3,314,375
2036 835,000 667,645 1,502,645 1,850,000 1,487,813 3,337,813
2037 915,000 616,710 1,531,710 1,925,000 1,406,875 3,331,875
2038 1,005,000 560,895 1,565,895 2,050,000 1,322,656 3,372,656
2039 1,095,000 499,590 1,594,590 2,725,000 1,232,969 3,957,969
2040 1,195,000 432,795 1,627,795 2,900,000 1,113,750 4,013,750
2041 1,300,000 359,900 1,659,900 3,125,000 983,250 4,108,250
2042 1,410,000 280,600 1,690,600 3,350,000 842,625 4,192,625
2043 1,530,000 194,590 1,724,590 3,600,000 691,875 4,291,875
2044 1,660,000 101,260 1,761,260 3,850,000 529,875 4,379,875
2045 - - - 4,125,000 356,625 4,481,625
2046 - - - 3,650,000 171,000 3,821,000
2047 - - - 150,000 6,750 156,750
$16,875,000 $17,697,033 $34,572,033 $48,225,000 $39,928,865 $88,153,865

44 Capital Requirements and Debt Management
Rapidity of Long-Term Debt Principal Repayment
The following table analyzes how much of the County’s long-term public improvement debt outstanding as of December
31, 2019 is scheduled to be repaid over 20 years. This excludes $123.1 million in short-term construction financing
currently outstanding.
The following table analyzes how much of the County’s long-term water and sewer enterprise fund debt outstanding as
of December 31, 2019 is scheduled to be repaid over a maximum of 30 years. This excludes $48.8 million in short-term
construction financing currently outstanding.
Rapidity of Consolidated Public Improvement Debt Principal Repayment
Before Issuance After Issuance
of 2020 Bonds of 2020 Bonds
On or before Amount % of On or before Amount % of
Fiscal Year ($000) Outstanding Fiscal Year ($000) Outstanding
2024 337,725 31.31% 2024 320,085 27.41%
2029 696,745 64.59% 2029 705,625 60.43%
2034 961,950 89.18% 2034 1,002,695 85.87%
2039 1,078,655 100.00% 2039 1,167,715 100.00%
Rapidity of Metropolitan District Debt Principal Repayment
Before Issuance After Issuance
of 2020 Bonds of 2020 Bonds
On or before Amount % of On or before Amount % of
Fiscal Year ($000) Outstanding Fiscal Year ($000) Outstanding
2024 66,957 19.87% 2024 49,775 13.61%
2029 131,642 39.07% 2029 119,335 32.62%
2034 194,183 57.63% 2034 188,970 51.66%
2039 257,793 76.51% 2039 261,380 71.45%
2044 307,143 91.15% 2044 321,030 87.76%
2049 336,948 100.00% 2049 365,825 100.00%

Capital Requirements and Debt Management 45
Long-Term Debt Ratios
The following table presents the County’s net long-term public improvement debt per capita and ratios of net long-term
public improvement debt to assessed value and to per capita personal income at the end of the last five fiscal years.
The following table presents the County’s debt service expenditures for long-term public improvement debt as a
percentage of current revenues. The County policy is to limit debt service to 10% or less of current revenues in the
General, Environmental Services and Fire Tax Funds.
Future Financing Plans
The County’s debt policy is circumscribed by the legal debt margin for general obligation indebtedness established in
the County Charter. In addition, the County’s budget policy is reviewed annually by a committee of financially
experienced residents that recommends the amount of debt that the County can afford. As of June 30, 2019, the County
had authorized, unissued General County Bonds of $446,618,476, Metropolitan District Bonds of $222,646,214 and
Tax Increment Finance Bonds at fiscal year-end of $71,775,000. These amounts include bonds authorized to redeem
the $171.9 million in outstanding short-term construction financing debt. It is the County’s intent to use such unissued
bonds to fund future capital projects. The County currently expects to authorize $70 to $90 million of public
improvement bonds annually for new capital projects identified in the annual Capital Budget and annually issue
approximately $40 to $65 million of Metropolitan District. Where direct benefits from capital improvements can be
identified to specific users, the County intends to finance such improvements from user charges.
Long-Term Consolidated Public Improvement Debt Ratios
Net Long-Term Debt
Net As % of As % of
Fiscal Year Long-Term Estimated Assessed Per Assessed Personal
Ended June 30 Debt ($000) Population ($000) (1)
Value ($000) Capita Value Income (2)
2019 $1,107,025 326 $53,412,616 3,393 2.1 4.77
2018 1,064,880 321 51,518,005 3,316 2.1 4.66
2017 1,012,915 317 49,626,809 3,193 2.0 4.49
2016 959,245 317 47,641,613 3,030 2.0 4.26
2015 945,305 305 45,731,165 3,095 2.1 4.45
(1) Source: Howard County Department of Planning and Zoning.
(2) Source: Howard County Budget Off ice
Long-Term Debt Service as Percentage of Current Revenues
Public Public Public Debt Service
Improvement Improvement Improvement Current as % of
Fiscal Year Debt Debt Debt Revenues Current
Ended June 30 Principal ($000) Interest ($000) Service ($000)
Expenditures
($000) Revenues
2020 Budget $69,870 $47,365 $117,235 $1,321,231 8.87
2019 63,010 46,709 109,719 1,231,900 8.91
2018 60,901 39,057 99,957 1,187,664 8.42
2017 65,452 40,821 106,273 1,161,948 9.15
2016 65,702 39,911 105,612 1,168,111 9.04
2015 58,735 40,157 98,892 1,118,247 8.84

46 Government and Infrastructure
Government and Infrastructure
General
Under the County Charter adopted in 1968, the County’s executive functions are vested in the elected County Executive,
who is the chief executive officer of the County and is responsible for the proper and efficient administration of the
affairs of the County. The Council, which consists of five members elected by district, is the County’s legislative body.
The County Executive is limited to two consecutive four-year terms, and Council members are limited to three
consecutive four-year terms.
Each Council member has one vote, and a simple majority vote is sufficient to pass ordinary legislation. Emergency
bills require the vote of two-thirds of the members of the Council as do Council actions to override a veto by the County
Executive. A majority of the members of the Council constitute a quorum for the transaction of business, except that
for emergency sessions two-thirds of the members of the Council are required. Except as otherwise provided in the
County Charter, all laws stand enacted upon approval by the County Executive and take effect 60 days after their
enactment, unless by affirmative vote of two-thirds of the members of the Council any such law is declared to be effective
on a later date or is declared an emergency measure affecting the public health, safety and welfare, in which event it is
effective from the date of its enactment. The Council elects a Chairperson and a Vice Chairperson from its membership
at its first meeting in December of each year.
The Chief Administrative Officer performs such duties and exercises such general supervision over the offices and
departments of the County government as the County Executive may direct and the Charter specifies. The Chief
Administrative Officer acts as the chief budget officer, personnel officer, purchasing agent and central services officer
of the County. In addition, the Chief Administrative Officer has been designated to perform the duties of the County
Executive during the temporary inability of the County Executive to perform by reason of absence from the County or
disability. County financial matters are administered through the Department of Finance by the Director of Finance.
The Director of Finance is charged with the administration of the financial affairs of the County, which generally include
the collection of State and County taxes, special assessments, Metropolitan District charges, fees and other revenues and
funds of every kind due to the County; the enforcement of the collection of taxes in the manner provided by law; the
custody and safekeeping of all funds and securities belonging to or by law deposited with, distributed to or handled by
the County; the disbursement of County funds; the keeping and supervision of all accounts; the control of all
expenditures on the basis of budgetary appropriations and allotments; the preparation of bond sales and advising on debt
management; and such other functions as may be prescribed by directive of the County Executive or by legislative act
of the Council.
The County Solicitor is appointed by the County Executive subject to confirmation by the Council. All other officials
of the County government are appointed by, and serve at the pleasure of, the County Executive.

Government and Infrastructure 47

48 Government and Infrastructure
Executive, Administrative, Legislative and Education Officials
Executive
The Honorable Dr. Calvin Ball was elected November 6, 2018 to serve as Howard County’s 10th County Executive. He
is a Maryland native and Columbia resident, where he and his wife Shani Ball, RN, BSN are proud parents of two
daughters who attend Howard County Public Schools. Dr. Ball holds a Bachelor of Arts in Philosophy and Religion
from Towson State University, Master of Arts in Legal and Ethical Studies from the University of Baltimore, and Doctor
of Education from Morgan State University, where he also taught doctoral level courses in topics including finance and
budgeting as well as planning and management. He made history in 2006 when he was elected as the youngest Council
Chairperson in Howard County history. As County Executive, Dr. Ball remains dedicated to making our community a
better, brighter place for future generations, while respecting taxpayer dollars and exercising sound fiscal management.
Dr. Ball, a dedicated educator and certified mediator, continuously works to collaborate with all community stakeholders
to create the very best Howard County for all. Dr. Ball has been honored with numerous awards including the Michaeline
R. Fedder Award for Public Health Legislator of 2015, the Marilyn J. Praisner Public Service Award, Daily Record’s
2014 Very Important Professionals Successful by 40 Award, William Donald Schaefer Helping People Award, Louis
Goldstein Award for Democratic Spirit, the Kittleman Award for Legislative Leadership, Community Champion of the
Year Award, Jenkins Odoms, Jr., Freedom Fighter Award, Richard C. McCauley Transformative Leader Award,
Humanitarian Award, and 2018 Senator James Clark Award.
Sameer Sidh was appointed Chief of Staff effective December 3, 2018. In his role as Chief of Staff, Mr. Sidh has broad
oversight over the County Executive’s land use, infrastructure, legislative and communications functions. Mr. Sidh
works closely with internal and external stakeholders to ensure that government operations are consistent with the vision
and goals of the County Executive. Mr. Sidh previously served as Chief of Staff at Towson University, where he led
planning, coordination, and project management of presidential-initiated efforts, and worked closely with the
university’s leadership team to “boundary span” across university divisions to ensure alignment of objectives and budget.
Mr. Sidh came to Towson University from the Office of the Mayor of Baltimore City, where he served as the Director
of the Mayor’s Office of Citistat. In his tenure as director, Mr. Sidh drove significant productivity and transparency
improvements through increased communications and convening cross-agency and cross-sector workgroups. Prior to
serving as the Director of Citistat, Mr. Sidh worked as the Deputy Chief of Staff for the Maryland Department of
Transportation where he held a position on the senior executive team of a 9,000-employee department collaborating on
policy direction with senior management. He also previously served as both Acting Director and Deputy Director of the
StateStat in the Office of the Governor. Mr. Sidh holds a J.D. from the University of Baltimore School of Law, and is a
member of the Maryland State Bar. He earned his bachelor’s degree in political science from James Madison University. Gary W. Kuc was appointed Howard County Solicitor effective July 1, 2015 and reappointed effective March 4,
2019. Prior to that, Mr. Kuc was a Senior Assistant County Solicitor in the Howard County Office of Law for six years,
during which time he advised both branches of County government on a variety subjects, and represented Howard
County before federal and State courts and various administrative bodies. Before joining the County’s Office of Law,
Mr. Kuc was a Senior Assistant Attorney General for the State of Maryland for five years, and handled complex civil
litigation in the Civil Division of the Attorney General’s Office. Prior to his public service, Mr. Kuc was in private
practice, as an associate attorney and then partner at Whiteford, Taylor & Preston, LLP, for seven years, and as an
associate attorney at Semmes, Bowen & Semmes for three years. Mr. Kuc also was a law clerk to the Honorable Irma
S. Raker, Court of Appeals of Maryland. Mr. Kuc holds a Bachelor of Arts in Political Science, Public Service
Emphasis, from the University of California, Santa Barbara, and a Juris Doctor, Magna Cum Laude, from the Catholic
University of America. He is admitted to practice in the Court of Appeals of Maryland, and is admitted to practice in
the U.S. District Court for the District of Maryland, the U.S. Court of Appeals for the Fourth Circuit, and the U.S.
Supreme Court.
Administrative
Lonnie R. Robbins was appointed Chief Administrative Officer effective January 3, 2007 after serving as Deputy Chief
Administrative Officer since 2004. Mr. Robbins has served as both a Senior Assistant County Solicitor and Assistant
County Solicitor in the Howard County Office of Law. He has also worked as the procurement advisor for the Maryland
State Board of Public Works, Administrator for Maryland State Department of General Services, and executive aide for
the Office of Governor Harry R. Hughes. Mr. Robbins received his B.S. degree in Business and Public Administration
from the University of Maryland and a J.D. degree from the University of Baltimore. Mr. Robbins is active in Howard
County and Maryland State Bar Associations, Leadership Howard County and First Tee of Howard County. Mr.
Robbins was recently appointed by Governor Larry Hogan to the Board of Trustees of the Maryland Automobile
Insurance Fund.

Government and Infrastructure 49
Janet Irvin was appointed Director of Finance effective January 29, 2018. Ms. Irvin previously served as Chief Financial
Officer for the Maryland Environmental Service (MES) since 2013. Additionally, she served as Treasurer for MES’s
Board of Directors. Ms. Irvin previously served for six years as Deputy Director for the Office of Finance at the Maryland
State Highway Administration (SHA) in Baltimore. Prior to serving in state government, she worked in Howard County
Government for 14 years, first as a payroll supervisor and accountant, then as Chief of the Bureau of Accounting and
Financial Reporting. In addition to more than 25 years of experience in finance and accounting, Ms. Irvin is a Certified
Public Finance Officer and has a Bachelor of Science degree in Business Management from the University of Maryland
University College. An Ellicott City resident, Ms. Irvin serves as Immediate Past President of the Board of Directors of
the Government Finance Officers Association, Maryland Chapter and is a 2009 Graduate of the State Highway
Administration Advanced Leadership Program.
Dr. Holly Sun became Howard County’s Budget Administrator in January 2015. Dr. Sun has two decades of budget
management experience at local governments, including revenues, operating budget, capital budget, and performance
management. She previously served as Deputy Director of the Office of Management and Budget, Prince George’s
County and Budget Manager of the Maryland National Capital Park and Planning Commission. She has a PhD in Public
Policy and Public Administration from George Washington University, and a Master in Public Policy from Duke
University. She served on the Committee on Governmental Budgeting and Fiscal Policy of the Government Finance
Officers Association (GFOA) for six years and was a member of the Board of Directors of Maryland GFOA.
Legislative
Opel Jones was elected in 2018 to his first term serving District Two. He is a seasoned higher education administrator
and lecturer of the mathematical sciences. He is currently a faculty member at American University in Washington, DC.
Dedicated to the community, Opel Jones mentors, tutors, and volunteers in his free time through his fraternity, as well
as with the Howard County Democratic Party. He is a Life Member of Alpha Phi Alpha Fraternity, Inc., the Columbia
Democratic Club, Ellicott City/Western Howard County Democratic Club, Thurgood Marshall Democratic Club,
Greater Elkridge Community Association, and the Howard County Chapter of the NAACP. Additionally, he is a former
Human Rights Commissioner for Howard County, appointed by then-County Executive, Ken Ulman. Throughout the
years, and in addition to teaching mathematics and statistics, Opel Jones has worked as a systems/software engineer,
development officer, and a computer scientist, at Lockheed Martin, Hampton University, Bowie State University, and
the United States Census Bureau. While a faculty member at Hampton University, he served as Director of the
Leadership Institute for several years, teaching leadership studies, developing leaders, all the while teaching mathematics
and honors seminars. Opel Jones is a proud graduate of High Point High School in Beltsville, Maryland, where he
lettered in four sports (baseball, football, indoor track, and outdoor track), served as President of the National Honor
Society, and played in the marching and concert bands. Since then he has earned a bachelor’s degree in mathematics
from Hampton University, a master’s degree in mathematics from Howard University, and is currently a doctoral
candidate in mathematics also at Howard University.
David Yungmann was elected in 2018 to his first term representing District Five. He grew up in the Valley
Mede/Chatham and Mt. Hebron communities after his family moved to Ellicott City in 1972. He attended public schools
and is a graduate of Mt. Hebron High School, where he showed leadership at a young age as Drum Major of the award-
winning marching unit. After graduating from Mt. Hebron in 1985, David attended Loyola University Maryland where
he earned a bachelor’s degree in Finance in 1989. David most recently moved to Woodbine in 2000 where he has raised
his own family, volunteered in the classroom, coached sports, enjoyed field trips and become a dedicated and successful
community leader. He has supported numerous efforts to stop excessive development, especially in the rural west,
including the construction of the massive religious and educational campus proposed for the former Woodmont
Academy site. He was an early player in the effort to change the leadership of the school system and led a successful
Board of Education campaign in 2016. David has represented two schools as a PTACHC Delegate, supported
PTA/Booster Club boards, and served on many non-profit boards and committees from economic and employment
advocacy to education and land use. David has also been active in the Republican Party for over 30 years, during which
he has led the College Republicans, worked on campaigns, raised funds and most recently been voted Howard County’s
Republican Man of the Year. His professional career began in commercial banking before moving into mergers and
acquisitions, corporate and project finance, financial planning and executive management – all within the real estate and
healthcare fields. David co-founded several companies providing healthcare products and services. In 2003, he changed
careers to start The Yungmann Group, a residential real estate team based in Ellicott City. David’s team has earned a
Best of Howard County award for the past several years and has continued to be a market leader in and around Howard
County. In 2018, David was elected to the Howard County to represent Council District 5. District 5 encompasses the
entire western portion of the county, spanning south to Fulton and east into Ellicott City. This is David’s first elected
public office and his first term will run through 2022.

50 Government and Infrastructure
Deb Jung was elected in 2018 to represent District Four. She is currently serving as Howard County Council Chair. She
is a 30-year resident of Howard County and lives in Columbia with her husband Ben. Her daughter Alyssa graduated
from Howard County public schools and recently completed a double major in Environmental Biology and Public Health
from Tulane University. Deb has been an attorney since 1984 and has her own private practice providing legal and
strategic advice, training, and consulting to nonprofit organizations throughout Maryland. Previously, she served as a
litigation associate at Whiteford Taylor Preston in Baltimore, Maryland; General Counsel to the Close-Up Foundation
(a civic education organization for high school students and teachers) in Alexandria, Virginia; and as General Counsel
to the Maryland Association of Nonprofit Organizations in Baltimore, Maryland. At the latter two organizations, she
reviewed budgets and responded to employment and pension benefits matters. She is a member of the Maryland State
Bar Association and Society for Human Resource Management. A longtime community leader, Deb served as: Co-Chair
of the Howard County Sesquicentennial Celebration Committee; Co-Chair of the Martin Luther King, Jr. Holiday
Commission; and was a five-year member of the Howard County Human Rights Commission. Deb also served as
President and was one of the founders of the Executive’s Charity for the Arts established to raise money for scholarships
for Howard County residents to study in the arts. Deb is a member of the Howard County NAACP, the Howard County
Women’s Democratic Alliance, and the Sierra Club of Howard County. In addition to her community work, Deb has
been very active as a parent in Howard County local schools, having spent many hours assisting with PTA activities and
serving two years as the Booster Club President at Wilde Lake High School. She is a member of the HCPSS School
Health Council and has helped lead the Start School Later effort in Howard County. Deb was born in Hartford City,
Indiana, and was raised in York and Pittsburgh, Pennsylvania, Charlotte, North Carolina, and Severna Park, Maryland.
She graduated from Severna Park High School, obtained a B.A. in Political Science from Duke University, and a Juris
Doctorate from the University of Maryland School of Law.
Christiana Rigby's family moved to Columbia in the 1970’s, following the vision of Jim Rouse, and settling into the
villages of Owen Brown and Kings Contrivance. After graduating from Hammond High School and UMBC, she started
her career as a community organizer, giving communities a voice in government. Christiana returned to start her family
in Howard County and she has served our area as a tireless advocate through her roles as Vice Chair of the Kings
Contrivance Village Board, a member of the Economic Resource Allocation Committee under Howard County’s Board
to Promote Self-Sufficiency board member to Howard EcoWorks, and founder of the Howard County Women’s
Democratic Alliance. Christiana’s professional life has been dedicated to public service. She has spent over a decade
working in the government and nonprofit sectors with organizations such as the U.S Fish and Wildlife Service, Public
Interest Research Group (PIRGS), Alice Ferguson Foundation, and United Way of Central Maryland. Her highest
priority is to create and expand opportunities for all residents. She is a strong supporter of our public education system
and believes all children should receive a quality education. Christiana will work to ensure safe and inclusive
neighborhoods that provide people of all ages, backgrounds, and abilities a welcoming place to call home. Within District
3, she will work with our communities and focus on increasing investment and revitalization in our older neighborhoods.
Christiana is deeply committed to continuing to serve our residents and will steward their issues and concerns. In 2018,
Christiana was elected to represent District Three on the Howard County Council, which includes the Villages of Owen
Brown and Kings Contrivance, as well as communities in North Laurel, Savage, and Jessup. At the Council’s first
legislative meeting in 2018, Christiana was nominated to serve as the Chair of the County Council, responsible for
guiding the body through its first year in office. From 2018 - 2019, she served as the youngest woman Chair of the
County Council.
Liz Walsh is a Mount Hebron Viking, Class of ‘89—just in time to be part of Hebron’s first-ever girls’ lacrosse team.
She attended Georgia Tech on scholarship as a National Merit Scholar and graduated with honors in 1993 with a degree
in Civil Engineering. After graduation Liz became a project engineer for a national general contractor where she bid and
ran construction projects in the field. If all her projects had been like her last one—rebuilding an old-time swinging
bridge over the Cedar Creek in Slaughter Beach, Delaware—Liz probably never would have applied to law school. But
she did. Liz graduated from Georgetown Law, also with honors, in 2000. For nearly twenty years now, she has been a
construction lawyer in practice at large, global law firms. She drafts and negotiates contracts to design, build and manage
mega-construction projects and advises her general contractor and project owner clients as to their rights and
responsibilities under those contracts and applicable law. She also tries cases, typically in arbitration. Since 2009 Liz
has lived in historic Ellicott City. When it came time to raise her own family, she returned to her hometown, where her
parents still live in their same house behind the old Enchanted Forest. She found a century-old four-square in the hills
above Main Street and lives there now with her two children and their rescue German Shepherd. In 2018, Liz was elected
to represent District One, which includes nationally-designated historic districts in Ellicott City and Elkridge, vast
acreages of state park and other dedicated forestlands, and miles of streambanks along the Patapsco River and its smaller
tributaries.

Government and Infrastructure 51
Craig Glendenning was appointed County Auditor effective September 4, 2012. Mr. Glendenning was previously the
Assistant County Auditor with the Anne Arundel County Auditor’s Office, and prior to that time held positions within
the Maryland State Office of Legislative Audits. Mr. Glendenning is a Certified Public Accountant in the State of
Maryland, and is a member of the Maryland Government Finance Officers Association, the American Institute of
Certified Public Accountants, the Institute of Internal Auditors, and the Association of Local Government Auditors. Mr.
Glendenning has more than 25 years of auditing, finance, and budgeting experience in the government sector.
Education
Dr. Michael J. Martirano was named superintendent for the Howard County Public School System (HCPSS) in July
2018 after serving as interim superintendent since May 2017. Dr. Martirano has been an educator for more than 35 years.
Prior to joining HCPSS, he most recently served as West Virginia state superintendent of schools, during which the state
saw notable success in the areas of early childhood literacy, graduation rates and career technical education. He
previously served as superintendent of St. Mary’s County Public Schools (Maryland), and has a wide range of
educational and administrative experience through his work as a science teacher, principal and visiting professor at Johns
Hopkins University. In rejoining the HCPSS, he returned to the system where he previously served as a director of
School Administration and to the county where he lived 19 years. In 2017, Dr. Martirano was named a Distinguished
West Virginian, the highest award given by the Governor of West Virginia. He also was named a “Chief Making A
Difference” and one of 50 people “Shaping the Future of K–12 Education in America” in the 2014 and 2015 Annual
Smart List Awards. Other honors include the 2009 Superintendent of the Year in Maryland, Maryland Daily Record
Innovator of the Year and Most Admired CEO awards, Howard County NAACP Education Champion award, and the
2011 Jack Epstein Award for contribution to multicultural education in Maryland. He holds a Doctorate of Education
degree in school management and instructional leadership from Nova Southeastern University, and two Master of
Education degrees and a Bachelor of Science degree from the University of Maryland.
Responsibilities and Services
County and Board of Education Employees
The following table presents the number of County (including Library, Community College and Housing Commission)
and Board of Education full-time and permanent part-time employees for the last five fiscal years as authorized in the
County budget.
The County has experienced no work stoppages due to labor difficulties and considers its relationship with employees
to be satisfactory. The County currently has collective bargaining with the following exclusive representatives and their
bargaining units: (1) American Federation of State, County and Municipal Employees (“AFSCME”), which represents
correctional officers and correctional dietary officers of the County’s Detention Center (Local 3080), a separate local
representing blue collar workers of various County departments (Local 3085), Local 3888 representing blue collar
supervisors of various County departments, and Local 1810 which represents employees in specific clerical and white
collar classifications of various County departments; (2) International Association of Firefighters Local 2000,
representing firefighters below the rank of captain; (3) Howard County Police Officers’ Association Lodge 21,
representing sworn police officers below the rank of sergeant; (4) Howard County Police Supervisors’ Association
Lodge 143, representing sergeants, and (5) Howard County Public Safety Dispatchers Association, which represents
911 dispatchers. The County has successfully negotiated contracts with unions which will expire on June 30, 2020
(Dispatchers, Local 3080, Local 3085, Local 3888, Local 1810, Lodge 21, Lodge 143, and Local 2000) and are currently
in the process of negotiations for fiscal year 2021.
Fiscal Year Public Safety Other County Board of Education Total
2019 1,381 2,741 8,297 12,419
2018 1,336 2,719 8,045 12,100
2017 1,298 2,676 7,826 11,800
2016 1,285 2,629 7,710 11,624
2015 1,296 2,622 7,693 11,611
County and Board of Education Employees

52 Government and Infrastructure
Most Board of Education employees are represented by a bargaining unit. The Howard County Education Association
(HCEA), affiliated with the Maryland State Education Association and the National Education Association, represents
teachers and other certificated non-supervisory personnel. The Howard County Education Association–Education
Support Professionals (HCEA ESP) represents non-certificated, non-supervisory personnel such as clerical, secretarial,
instructional, student, food and nutrition service, health, and security assistants, educational interpreters, registered
nurses and central office technical staff. The American Federation of State, County and Municipal Employees (AFSCME
- Local 1899) represents non-certificated, non-supervisory personnel such as custodial, grounds, maintenance and
warehouse staff. The Howard County Administrators Association (HCAA) represents certificated supervisory personnel
such as school-based administrators, leadership interns, athletics and activities managers, and instructional facilitators.
Board of Education of Howard County
The Board of Education is a Component Unit of the County. The educational policies, procedures and programs of the
public schools in the County are the responsibility of the Board of Education, a seven-member elected body, working
with the County Superintendent of Schools appointed by the Board of Education. The County program is governed by
the State Board of Education. Daily functions within the schools are the responsibility of the County Superintendent of
Schools and his staff.
The Howard County School System offers a comprehensive education program, kindergarten through grade 12, with
pre-kindergarten programs available in some schools. Academic support services and gifted programs are available in
all schools and in all grades. Special education services are provided for identified students from birth through age 21.
For the 2019-2020 school year, the Board of Education exercised responsibility for 42 elementary schools, 20 middle
schools, 12 high schools, and three education centers that accommodate approximately 59,000 students. The teacher-to-
student ratio is presented in the following table.
Teacher to Student Ratio
Kindergarten 1 professional to 22 students
Grades 1-2 1 professional to 20 students
Grades 3-5 1 professional to 26 students
Middle school 1 professional to 21 students
High school 1.4 professional to 28 students
The Strategic Call to Action (SCTA), Learning and Leading with Equity, underlies all Howard County School System
initiatives and decisions in alignment with its mission, to ensure academic success and social-emotional well-being for
each student in an inclusive and nurturing environment that closes opportunity gaps. The HCPSS vision is that every
student and staff member embraces diversity and possesses the skills, knowledge and confidence to positively influence
the larger community. The SCTA, mission and vision are supported by four overarching commitments:
● Value: Every HCPSS stakeholder feels happy and rewarded in their roles and takes pride in cultivating the
learning community.
● Achieve: An individualized focus supports every person in reaching milestones for success.
● Connect: Students and staff thrive in a safe, nurturing environment that embraces diversity.
● Empower: Schools, families and the community are mutually invested in student achievement and well-being.

Government and Infrastructure 53
Howard Community College
Howard Community College (“HCC”) is a public community college serving nearly 30,000 credit and noncredit students
at its main campus in Columbia, Maryland, and in other locations. Since 1970, HCC has been helping build the workforce
of the future by educating the students who will contribute to the businesses and organizations within Howard County.
HCC offers associate degrees and certificates built around academic areas such as arts, humanities, health sciences,
engineering, business, and cyber technology. With associate degrees or related coursework, students have the
opportunity to transfer to four-year colleges or universities to complete their baccalaureate degrees. Students also attend
HCC to sharpen job skills, prepare for a new career, pursue professional training, or explore personal interests. HCC
offers flexible scheduling with day, evening, and weekend courses, as well as online, hybrid, and accelerated learning
formats.
HCC is governed by a board of trustees appointed by the Governor of Maryland. For fiscal year 2020, the HCC’s
unrestricted budget reflects the following sources: 37 percent from tuition and fees, 29 percent from the County, 16
percent from the State, and 18 percent from auxiliary operations and other sources. HCC is a Component Unit of the
County. HCC was one of six organizations to receive the 2019 Malcolm Baldrige National Quality Award, the nation’s
only Presidential Award for performance excellence, recognizing U.S. organizations and businesses that have shown an
increasing drive for innovative solutions to complex challenges, visionary leadership and operational excellence.
Howard County Library System
An educational institution and allied agency alongside Howard County Public School System and Howard Community
College, Howard County Library System (HCLS) delivers high-quality public education for all ages. Designated a
national Five Star Library System by Library Journal, HCLS consistently earns the highest five-star ranking attained by
fewer than one percent of public libraries in the U.S., and the only library system in Maryland to do so. HCLS’
curriculum comprises three pillars: (1) Self-Directed Education through a collection available in print, audio and
electronic formats; specialized online research tools; DIY tools for repairing, creating, and adventuring; and more than
300 framed photos and prints as part of its Art Education Collection, (2) Research Assistance & Instruction for
individuals and groups through classes taught by HCLS instructors and, (3) Instructive & Enlightening Experiences
through cultural and community center concepts; partnerships such as A+ Partners in Education; and signature events
including notable author appearances, Spelling Bee, Battle of the Books, and HiTech, HCLS’ STEM education initiative.
A component unit of the County, HCLS is governed by a seven-member Board of Trustees. The HCLS Board forwards
nominees to the County Executive, who appoints members to the Board of Trustees subject to approval by the County
Council. HCLS’ Operating Budget is funded by the County (88%), HCLS/grants (8%), and the Maryland State
Department of Education (4%). Capital projects are funded chiefly by the County, supplemented with grant funding
from the Maryland State Library. Students of all ages, means, and backgrounds visited HCLS’ six branches nearly 2
million times in FY19 to borrow 8.5 million items and conduct research. Attendance at HCLS’ classes and events totaled
314,000 and research assistance interactions reached 1.6 million. A recognized leader in the state and nation for
excellence in education for all, HCLS’ per capita borrowing stands in the top 10 nationally and continues to lead all
other systems in the State.
Public Safety
The County Department of Police (the “Police Department”), administered by the Chief of Police, is responsible for
enforcing State and County laws, rules, and regulations. The Police Department employs 714 persons (which includes
479 sworn officers, 224 civilian employees, 38 school crossing guards) and has a fleet of 571 vehicles utilized by sworn
and civilian employees. These vehicles include: two armored rescue vehicles, two tactical support vehicles, command
post, bus, eight motorcycles, two traffic support vehicles, four electric motorcycles, three all-terrain vehicles and one
electric all-terrain cart. The number of officers per 1,000 residents is approximately 1.5. Additionally, the Police
Department has 15 Volunteer Auxiliary Officers, 6 Volunteer Mounted Horse Patrol and 8 Volunteer Chaplains (all
non-sworn).
Howard County Department of Fire and Rescue Services (the “Fire Department”) partners highly-trained career and
volunteer personnel to provide 24/7 emergency services to citizens, businesses, and visitors in and around Howard
County at the direction of a Fire and EMS Chief who is appointed by the County Executive. These services include fire
suppression and investigation, emergency medical services (including both basic and advanced life support), technical
rescue, and hazardous materials mitigation. The Department operates from 13 stations located throughout the County,
seven of which are also home to the County’s six volunteer fire corporations.

54 Government and Infrastructure
In 2019, the Fire Department responded to over 38,216 incidents, approximately 77% of which involved providing
emergency medical care. The Fire Department also provides stand-by medical coverage for large concerts, sporting
tournaments, and public events. In addition, a wide variety of community risk reduction programs are managed that
include a localized fire code, a crowd manager program, commercial and residential fire safety inspection services, a
‘Safety House’ elementary education fire prevention program, and a highly-successful community CPR program which
includes curriculum in the public school system. The Fire Department is also designated by County Code as the lead
agency for the Office of Emergency Management for Howard County and has responsibility for county-wide emergency
planning, preparedness, and response.
The County Department of Corrections, administered by its Director, is responsible for the operation of the Howard
County Detention Center, Central Booking Facility and Community Services Program. The Detention Center holds
individuals who are detained pending trial as well as those sentenced up to 18 months. The Detention Center has an
operating capacity for 398 inmates. Approximately 3,000 inmates are processed annually through the Detention Center.
The Central Booking Facility (CBF), opened in 2005, is the location for processing all adult arrests which occur in
Howard County. At CBF all arrestees are fingerprinted, photographed, screened for warrants and officially served with
charging documents before appearing before a District Court Commissioner for an initial appearance. In 2019, 2,334
individuals were processed at CBF. The Howard County Community Service Program places and supervises individuals
with court-ordered community service. Staff place participants at non-profit and government agencies to perform
required community service hours. Reports of completion or non-compliance are sent to the sentencing judge. The
program supervises approximately 500 individuals per year. The Department is accredited by the Maryland Commission
on Correctional Standards.
Planning and Zoning
The Howard County Department of Planning and Zoning (DPZ) is responsible for comprehensively planning for growth,
development, and conservation in the County. To accomplish this, DPZ undertakes many diverse activities:
comprehensive planning; preparing growth projections; managing growth based on the adequacy of public facilities;
enhancing existing communities and redeveloping older commercial-industrial areas; agricultural and historic
preservation, environmental planning; development review; and the administration of zoning and subdivision
regulations.
The County’s General Plan, PlanHoward 2030, adopted in 2012, focuses on sustainability in terms of our environment,
economy and the quality of life in our communities. PlanHoward 2030 retains and builds on the strong growth
management system that was adopted following the 1990 General Plan. DPZ will be conducting an update to the General
Plan beginning in calendar year 2020, which is anticipated to be a 2-year process.
The rural western 60 percent of the County is zoned to protect agriculture and environmental resources, promote the
agricultural economy, and cluster limited residential development. In the urban eastern 40 percent of the County,
planning policies encourage higher intensity employment areas, mixed-use redevelopment in Downtown Columbia and
the U.S. Route 1 and Route 40 corridors, and increased housing densities. Mixed-use zoning on Route 1 has stimulated
nine pioneer developments with over 4,000 housing units, as well as commercial uses. To create an urban center for the
County, the Downtown Columbia plan promotes redeveloping parking lots and underutilized land to add 6,244 new
residences, 640 new hotel rooms, 1.25 million square feet of retail and 4.3 million square feet of office space. In addition,
the County requires moderate income housing in residential zoning districts as a way to address the demand for
affordable housing.
Adequate Public Facilities regulations, adopted in 1992, require proposed development to be tested for adequate schools
and roads as a condition of plan approval. Milestones, incorporated into the legislation, require properties to move in an
orderly and predictable manner through the development process. The County in turn adopts a six-year plan for its
infrastructure, particularly schools and roads, to serve this pace of development. Based on PlanHoward 2030 and the
County’s Adequate Public Facilities legislation, residential development outside Downtown Columbia is restricted to
1,850 units per year. A cap of 100 units per year limits rural subdivisions and combined with an ambitious agricultural
land preservation program, serves to redirect rural growth pressure into the County’s eastern Planned Service Area for
Public Water and Sewer. A significant part of Council Bill 1-2018, effective in July 2019, further limits the number of
building permits which may be issued based on public school capacity. The County has several community planning
and corridor revitalization initiatives underway to maintain the quality of life and property values in older residential
neighborhoods, as well as promoting revitalization and redevelopment of older corridors and commercial centers.

Government and Infrastructure 55
As the transition from development occurring on vacant land to redevelopment of older built properties continues at
greater levels, the County will be refining policies and developing new strategies for accommodating continuing business
and housing growth in ways that sustain and enhance our quality of life, our economy and our natural and built
environments. This will be a major focus on the next General Plan.
Inspections, Licenses and Permits
The goal of the Howard County Department of Inspections, Licenses, & Permits (DILP) is “A Quality Product, Fast &
Friendly.” A quality product ultimately means safe and healthy buildings and our aim is to achieve this in an efficient,
customer-friendly manner.
DILP is responsible for the intake, processing, review and approval, issuance, and inspection of all licensing and
permitting work related to the built and rental environment in the County. DILP accomplishes this through the
cooperative and coordinated activities of four divisions within DILP: Operations; Licenses & Permits; Plan Review; and
Inspections & Enforcement. This activity is done to assure public safety through the adoption and enforcement of the
Howard County Building Code. This “code” includes the adoption of the International Building Code (IBC), the
International Residential Code (IRC), the Life Safety Code (NFPA 101), the National Fire Prevention Code (NFPA 1),
the National Electrical Code (NFPA 70), the Maryland Accessibility Code, and related Plumbing, Mechanical, Fuel Gas,
and HVAC codes, as well as the Property Maintenance Code for Rental Housing (the International Property Maintenance
Code).
By adopting up-to-date codes and standards, new buildings in the County will have better resilience and sustainability.
Also, hazards are mitigated before the hazard ever occurs since structures built to modern building code standards are
better equipped and constructed to withstand the effects of natural and man-made disasters. Code-compliant structures
are less likely to catch fire or be prematurely affected by decay, rot or the effects of nature and general wear and tear;
they are also more energy efficient and environmentally friendly. In addition, should the effects of nature come to the
County: fire; flood; high-wind; etc., these structures are more likely to withstand these effects with less damage than
non-code-compliant structures.
DILP is also responsible for the County Coordinating Function for Damage Assessment (CCF-3) of the Howard County
Comprehensive Emergency Response and Recovery Plan (CERRP). Following a disaster (e.g. fire, flood, tornado, etc.)
DILP is responsible for assessing the level, nature and extend of the damage to individual structures; known to the
Federal and Maryland Emergency Management Agencies (FEMA and MEMA) as “individual assistance,” or “IA.”
Additionally, DILP coordinates the damage assessments from public buildings and infrastructures, known as “public
assistance,” or “PA.” This work is required to first determine the extent of an event, as well as to begin the process of
hazard mitigation and planning for the recovery and rebuilding process.
Recreation and Parks
The County Department of Recreation and Parks (DRP), administered by its Director, is responsible for the organization
and conduct of recreational programs and the development and operation of parks and other recreational facilities in the
County. County parks and programs are estimated to serve over two million visitors each year. In 2017 the County’s
Land Preservation Parks and Recreation Plan was completed and adopted by the County Council and the County
Executive. The plan surveys current and expected needs for park facilities and recreation programs, outlines goals and
offers strategies for implementation. Land acquisition for recreation areas and natural resource preservation is a critical
element of the Plan. Land is purchased using federal, state and local dollars. DRP currently manages over 9,600 acres
of park land and open space, three community centers, an indoor pool, two community buildings, one nature center,
one athletic complex and an 18-hole golf course, and 26 active historic sites. DRP is one of only 165 Recreation and
Parks agencies accredited through the National Recreation and Parks Association’s Commission for Accreditation of
Park and Recreation Agencies. Financial information regarding the golf course is shown under “Financial Information,
Special Recreation Facility Enterprise Fund” herein.

56 Government and Infrastructure
Housing and Community Development
The Department of Housing and Community Development (“DHCD”) strives to create strong, sustainable communities
by fostering public and private partnerships to provide affordable housing resources for residents of all income levels.
Through its use of the Community Renewal Program Fund, DHCD can support initiatives such as the Moderate-Income
Housing Unit (MIHU) Rental and Homeownership Program, the Settlement Downpayment Loan Program (SDLP),
County Rehabilitation Loan Program (RRR) and homebuyer education to provide affordable housing opportunities for
low and moderate income families who live or work in Howard County. DHCD also administers funding for several
federal and state programs, including Community Development Block Group (CDBG), Home Investment Partnership
Program (HOME) and Community Legacy, to provide loans and grants for special needs housing programs, rental
assistance, rehabilitation loans and community facilities and programs.
Community Resources and Services
As the human service arm of County Government, the Department of Community Resources and Services (“DCRS”),
consists of the Office of ADA Coordination, Office on Aging and Independence, Office of Children and Families, Office
of Local Children’s Board, Office of Consumer Protection, Office of Community Partnerships and the Office of Veterans
and Military Families. DCRS serves as the lead agency for the County’s Continuum of Care for homeless services;
manages the Community Service Partnership program, which provides county funding to non-profit human service
agencies; and administers federal, state and private source grants that support services to individuals and families in the
community, including older adults, youth and homeless persons. DCRS also serves as the lead agency for mass care
and shelter, and manages donations in the events of disaster. In collaboration with local private and public agencies,
DCRS plays an integral role in strengthening the effectiveness and efficiency of the County’s overall human service
delivery system. Staff support is provided to the Board to Promote Self-Sufficiency, Commission on Aging and
Independence, Commission on Disability Issues, Commission for Women, Consumer Affairs Advisory Board, Local
Children’s Board, Transition Council, Human Trafficking Coordinating Council and the Veterans Commission.
Public Works
The County Department of Public Works (“DPW”), administered by its Director through five bureaus, is responsible for
the programming, design, construction, operation and maintenance of public works facilities in accordance with the
County’s General Plan. DPW also provides for the administration, enforcement and inspection of site development
construction activities.
The Bureau of Engineering is responsible for the design, inspection and construction of public works projects. The
Bureau of Engineering also prepares engineering water and sewer plans and develops and implements the water and
sewer program in the County capital budget. The Bureau of Engineering also acts as the County’s agent in all functions
related to the construction of roads, bridges, water, sewer, storm drainage, traffic control and underground private
utilities in the public right of way. The Bureau of Engineering has been designated the responsibility of ensuring that
Public Works’ projects are constructed according to standards established by the County. These projects include both
developer and capital type facilities such as storm drains, water systems, sewer facilities, roadways and public parks. The Bureau of Engineering manages all Underground Utility Permits and is the enforcement authority under the Grading
Permits for erosion and sediment control.
The Bureau of Facilities is responsible for maintaining the daily operations of all County-owned facilities which fall
under the direction of the Director of Public Works. This responsibility includes building service and maintenance,
technical expertise in the development of new facilities, control of energy use and costs, control of building service
contracts, i.e. custodial services and corresponding costs to the County, and providing security guards and systems where
necessary.
The Bureau of Highways is responsible for maintenance and repair of all County-owned roadways, bridges, drainage
facilities, and other public roadway infrastructure. The Bureau of Highways’ responsibilities also include tree care,
snow removal, traffic signals operation and street signs.
The Bureau of Utilities is responsible for the operation, maintenance and construction of the County’s water and sewer
system within the Metropolitan District and Shared Sewerage Disposal Facilities. The Bureau of Utilities is operated as
a public utility and is financially a self-supporting operation. Financial information regarding the system is shown under
“Financial Information, Water and Sewer Enterprise Fund” herein.

Government and Infrastructure 57
The Bureau of Environmental Services is responsible for an integrated solid waste management system and watershed
management efforts in accordance with local, state, and federal laws. The integrated solid waste management system
includes curbside trash and recycling collection; the County’s Alpha Ridge Solid Waste Management Center including
the landfill, transfer station, residential drop-off center, and recycling center; and the contracts associated with the
collections, processing, and disposal of the solid waste and recyclables. The watershed management program includes
inspection and oversight of maintenance of existing stormwater management facilities, floodplain studies, an illicit
discharge elimination program, stream restorations, and retrofitting stormwater management facilities. All programs
include education and outreach. Financial information regarding the system is shown under “Financial Information,
Special Recreation Facility Enterprise Fund” herein.
Water and Sewer System
The Metropolitan District is located in the eastern part of the County and encompasses over one third of the County’s
area. It functions as a single sanitary district for both water and sewer purposes. The County provides water and sewer
services to 98.9 percent of the County residents located in areas of heavy residential and commercial population within
the Metropolitan District. Little public water or sewer service is provided to County residents residing outside the
Metropolitan District.
The County neither owns nor operates any water supply treatment facilities. Instead, it has entered into agreements with
the City of Baltimore and the Washington Suburban Sanitary Commission for the purchase of water. The County
purchases 85 percent of its potable water from Baltimore City and 10 percent from the Washington Suburban Sanitary
Commission. Commitments from the County’s water suppliers total over 41.5 million gallons per day (mgd) average
daily flow and 55.5 mgd maximum daily flow. Improvements to the distribution system and storage facilities are under
construction or included in the capital program in order to increase the service area within the Metropolitan District. The
County signed a 40-year agreement with the City of Baltimore in 2017 guaranteeing water supply to the County. While
the County’s water system is being expanded to meet future demands, the County Department of Public Works closely
monitors its water capacity.
The County is located in and served by two major watersheds: the Patapsco River watershed and the Patuxent River
watershed. The sewer system is designed so that sewage from the northeastern part of the Metropolitan District flows
into the Patapsco River watershed through four connections that lead to the Patapsco Treatment Plant in Baltimore City.
Sewage from the southwestern part of the Metropolitan District flows into the Patuxent River watershed to the Little
Patuxent Water Reclamation Plant (the “Plant”). The Plant is located east of the community of Savage in the County,
and provides tertiary treatment. A $100+ million expansion/upgrade to the Plant was completed in 2012 to meet the
State’s requirements for Enhanced Nutrient Removal (ENR). The Plant is currently undergoing another $100+ million
upgrade to its Biosolids Management Facilities with an estimated construction completion by June 2020. The following
table summarizes the overall sewage treatment capacity for the County:
County Sewage Treatment Capacity
Watershed
Current
Flow
(mgd)
Current
Treatment
Capacity
(mgd)
Projected
Treatment
Capacity
(mgd)
Patuxent 21.0 29.0 29.0
Patapsco 8.8 11.6 12.4
The County’s rate of development requires effective management of the allocation of water and sewer capacity. The
County policy allocates service on a “first-come, first-served” basis. This policy commits capacity only to parcels ready
to be developed, allowing more orderly development with known allocation priorities and recovery of costs in a more
orderly and timely manner. All County sewage treatment facilities meet current State Department of the Environment
standards, and State approval is being obtained for the sewage treatment facility expansion.

58 Government and Infrastructure
Technology and Communication Services
The vision of the Department of Technology and Communication Services (“DTCS”) is to connect County residents
and the County workforce on a secure and stable environment. DTCS has implemented a robust security program
allowing for remote work and enhanced capabilities for County government. DTCS provides security of our data using
NIST guidelines and HIPAA, CJIS, FERPA and PCI compliance. DTCS is responsible for maintaining and updating
all technology services within the county, including: maintaining of the network, patching of all servers and endpoints.
DTCS maintains and supports multiple applications within the County and has a cloud presence as well. DTCS
maintains a remote DR site which allows for quick delivery and backup for critical applications if needed. In addition,
DTCS also supports the County’s phone system, maps, and cable administration for the public.

Demography and Economy 59
Demography and Economy
Size and Land Use
The County is 251 square miles in area, making it the second smallest in the State. The chart below presents the
composition of land use in the County as of September 30, 2019.
Population
The County experienced rapid population growth beginning in the late 1960s with the development of the master-
planned community of Columbia. The rate of growth has slowed over the last decade with the maturation of Columbia.
The County’s population density has increased from 247 persons per square mile in 1970 to 1,300 persons per square
mile in 2019. The following table presents data on the population of the County and the State in the years 1970, 1980,
1990, 2000, 2010, and 2019.
Population
Howard County Density State of County as %
County Per Square Mile Maryland of State
2019 326,286 1,300 6,042,718 5.4
2010 287,085 1,144 5,773,552 5.0
2000 247,842 987 5,296,486 4.7
1990 187,328 746 4,781,468 3.9
1980 118,570 472 4,216,446 2.8
1970 61,910 247 3,923,897 1.6
Source: Maryland State Data Center, Department of Planning

60 Demography and Economy
A large part of the County’s recent growth has been the result of domestic and international migration. The following
table presents population growth by component of change for selected larger counties and the State from 2010 to 2018.
Compared to the counties listed and the State, the County has had the greatest percentage increase in population.
The following table presents data on the age and sex composition of the County’s population for the years 2010 and
2018.
Education
The County’s residents are among the best educated in the region. The following table presents the percentage of
residents who are high school graduates or higher and college graduates or higher.
Net Migration
Place of Residence
Natural
Increase
Domestic
Migration
International
Migration Total 2010 2018
Percent
Change
Howard County 15,558 9,298 11,255 36,111 287,085 323,196 12.6%
Anne Arundel County 22,771 7,814 7,790 38,375 537,656 576,031 7.1%
Baltimore County 14,316 (14,312) 23,398 23,402 805,029 828,431 2.9%
Montgomery County 59,163 (49,603) 71,230 80,790 971,777 1,052,567 8.3%
Prince George's County 52,618 (50,740) 44,010 45,888 863,420 909,308 5.3%
State of Maryland 213,403 (136,582) 192,345 269,166 5,773,552 6,042,718 4.7%
Source: U.S. Department of Commerce, Bureau of Census, Population Division
2010 to 2018 Total Population
Age Group Male % Female % Age Group Male % Female %
Under 5 8,892 6.5% 8,554 6.0% Under 5 9,720 6.3% 9,179 5.7%
5-19 32,284 23.6% 30,225 21.2% 5-19 33,788 21.9% 31,886 19.8%
19-44 44,869 32.8% 47,761 33.5% 19-44 49,525 32.1% 51,694 32.1%
45-64 39,123 28.6% 41,060 28.8% 45-64 43,046 27.9% 45,736 28.4%
Over 65 11,628 8.5% 14,970 10.5% Over 65 18,206 11.8% 22,546 14.0%
Total* 136,795 100.0% 142,571 100.0% Total* 154,285 100.0% 161,042 100.0%
*May not total 100 due to rounding
Source: U.S. Department of Commerce, Bureau of the Census, American Community Survey, 2014 - 2018
Age and Sex Distribution
2010 2018
Level of Educational Attainment
% High School % College Graduate
County Graduate or Higher or Higher
Howard County, Maryland 96.2 61.2
Anne Arundel County, Maryland 93.4 43.3
Baltimore County, Maryland 93.0 40.6
Montgomery County, Maryland 92.1 58.0
Prince George's County, Maryland 86.8 34.4
State of Mayland 91.3 42.1
United States 90.3 35.1
Source: U.S. Department of Commerce, Bureau of Census, American Community Survey, 2014 - 2018

Demography and Economy 61
The County consistently spends more per pupil on its students than school systems in most other parts of the State. The
following table presents the budgeted expenses per pupil in the public schools in selected counties and the State for the
indicated school years.
Income
The County’s median household income is the highest in Maryland and third highest of all counties in the nation. The
following table presents the median household income for selected counties in the State in 2018.
The following table presents the top 15 affluent counties in the nation by their national ranking for median household
income.
Budgeted Expenses Per Pupil
Howard Anne Arundel Baltimore Montgomery Prince George's State of
School Year County County County County County Maryland
2017-2018 $14,474 $12,892 $13,116 $14,867 $14,014 $13,541
2016-2017 14,178 12,448 13,037 14,581 13,920 13,503
2015-2016 14,316 12,210 12,535 14,017 13,614 13,126
2014-2015 14,345 12,198 12,405 13,994 13,350 13,036
2013-2014 14,025 12,178 12,323 14,012 12,880 12,893
Source: Maryland Department of Education, Fact Book
Howard County $117,730
Anne Arundel County 97,810
Baltimore County 74,127
Montgomery County 106,287
Prince George's County 81,969
Source: U.S. Department of Commerce, Bureau of Census, American Community Survey, 2014 - 2018
Median Household Income
National Rankings by Median Household Income
Rank County, State Median Household Income
1 Loudoun County, Virginia $136,268
2 Fairfax County, Virginia 121,133
3 Howard County, Maryland 117,730
4 Arlington County, Virginia 117,374
5 Santa Clara County, California 116,178
6 Douglas County, Colorado 115,314
7 Los Alamos County, New Mexico 115,248
8 San Mateo County, California 113,776
9 Hunterdon County, New Jersey 112,535
10 Somerset County, New Jersey 111,772
11 Morris County, New Jersey 111,316
12 Nassau County, New York 111,240
13 Marin County, California 110,217
14 Williamson County, Tennessee 109,026
15 Stafford County, Virginia 106,773
Source: U.S. Census Bureau, 2018 American Community Survey 2014 - 2018

62 Demography and Economy
A comparison of County and Maryland personal income for the past five years available is presented in the following
table.
The chart below presents the per capita income for the County and the State from 2014 through 2018.
Comparative Income Per Capita
Source: U.S. Department of Commerce, Bureau of Economic Analysis
Poverty is less of a problem in the County than in other counties in the Baltimore-Washington metropolitan region. The
following table presents the percentage of the population living below the poverty level for selected jurisdictions in
2018.
Howard County Change Maryland Change Howard
Personal Income from Previous Personal Income from Previous County
Year ($000,000) Year ($000,000) Year Proportion
2018 24,652 4.7% 373,702 3.9% 6.6%
2017 23,543 3.8% 359,513 3.2% 6.5%
2016 22,684 4.4% 348,262 4.3% 6.5%
2015 21,730 4.3% 333,955 4.7% 6.5%
2014 20,829 0.9% 319,082 1.7% 6.5%
Source: The Jacob France Institute, University of Baltimore.
Personal Income
Population Below Poverty Level
County Percentage Below Poverty Level
Howard County 5.4%
Anne Arundel County 6.0%
Baltimore County 9.2%
Montgomery County 6.9%
Prince George's County 8.9%
State of Maryland 9.4%
United States 14.1%
Source: U.S. Department of Commerce, Bureau of the Census, American Community Survey, 2014 - 2018

Demography and Economy 63
Housing
The County’s housing stock predominately consists of owner-occupied single-family houses. The following table
presents the distribution of housing in the County by type of structure as of 2018.
The following table presents the average and median sales price of housing in selected counties and the State as of
December 2019. The average number of days on the market was 34, lower than the State average of 37.
The following table presents the distribution of housing by year of construction in selected counties in the State
through 2018.
The following table presents data regarding the size of housing in selected counties in the State in 2018.
Distribution of Housing by Type
Type of Structure Number Percent
Single-Family 87,051 72.6%
Multi-Family 33,771 28.0%
Total 120,822 100.6%
Source: U.S. Census Bureau, 2018 American Community Survey 1-Year Estimates
Sales Price of Housing
County Average Price Median Price
Howard County $415,000 $422,500
Anne Arundel County 355,000 370,000
Baltimore County 250,000 243,000
Montgomery County 450,016 449,747
Prince George's County 310,000 314,950
Maryland 365,000 368,000
Source: Bright M LS, 2019.
Age of Housing
County 1939 or earlier 1940 to 1979 1980 to 1989 1990 to 1999 2000 or later
Howard County 2.0 30.1 24.2 21.5 22.2
Anne Arundel County 4.7 43.1 16.4 17.2 18.6
Baltimore County 8.4 52.6 14.5 13.8 10.7
Montgomery County 4.8 47.3 20.5 12.4 15.0
Prince George's County 4.5 53.1 13.7 14.6 14.1
Source: U.S. Department of Commerce, Bureau of the Census, American Community Survey, 2014-2018
Year Structure Built
Size of Housing
Four to Seven Rooms Eight or More Rooms Median Number
County of Rooms
Howard County 47.7% 43.4% 6.9
Anne Arundel County 57.0% 36.1% 6.6
Baltimore County 62.2% 28.5% 6.1
Montgomery County 48.7% 37.2% 6.4
Prince George's County 55.9% 32.1% 6.1
Source: U.S. Department of Commerce, Bureau of the Census, American Community Survey, 2014 - 2018
Percentage of Housing with

64 Demography and Economy
The following table presents new construction and renovation activity throughout the County from 2015 through 2019,
as illustrated by the number of building permits issued and their estimated cost.
Economy
Jobs in the County
In the past four decades the County has changed from a farming community into a community of urban, suburban and
rural components. This is due, in part, to the County’s close proximity to the cities of Washington, D.C. and Baltimore,
as well as to the County’s active promotion of economic development. The following table presents full- and part-time
jobs located in the County and the State, regardless of the worker’s place of residence. The first segment of the Services
category, Trade, Transportation, and Utilities, includes utilities, wholesale and retail, couriers and transit. The fourth,
Professional and Business, includes professional and technical services, management and administrative services and
waste management and remediation services.
Building Permits
Commercial Residential Non-Taxable
Estimated Estimated Estimated
Permits Construction Permits Construction Permits Construction
Calendar Year Issued Cost ($000) Issued Cost ($000) Issued Cost ($000)
2019 606 $818,182 2,994 $239,780 15 $137,008
2018 663 578,170 2,948 454,853 14 9,909
2017 767 375,282 3,054 294,172 39 66,882
2016 748 240,854 3,820 523,634 16 66,562
2015 1,394 294,549 5,943 384,212 50 44,466
Source: Howard County Department of Inspections, Licenses and Permits
Employment Categories 2019 2015 2019 2015
Construction 11,488 10,300 166,003 153,542
Manufacturing 8,693 7,586 111,870 103,920
Natural Resources and Mining 349 326 7,681 6,773
Services
Trade, Transp. and Utils. 33,743 34,019 458,786 455,269
Information 3,583 3,359 35,118 38,686
Financial Activities 9,633 9,490 135,306 138,969
Professional and Business 48,063 43,776 464,829 430,824
Education and Health 20,273 18,633 449,547 417,905
Leisure and Hospitality 17,357 15,501 291,931 275,594
Other 4,539 4,572 95,501 91,594
Government 17,404 17,532 500,101 496,785
Other - - 17 -
Total 175,125 165,094 2,716,690 2,609,861
Source: Maryland Department of Labor, Licensing and Regulation
Jobs in County and State
Howard County State of Maryland

Demography and Economy 65
Workers Living in the County
The following table presents employment statistics, by employee’s place of residence, for the County and the State in
December of the last five years.
Unemployment
The chart below compares the unemployment rates in the County of the last three years with the rates in the Baltimore
metropolitan region, Maryland and the United States.
Source: Bureau of Labor Statistics (BLS)
Employment by Residence
Howard County State of Maryland
Year Employment Labor Force Employment Labor Force
2019 186,843 191,006 3,174,515 3,288,322
2018 179,320 183,963 3,075,662 3,194,248
2017 176,715 181,689 3,091,074 3,221,685
2016 173,944 178,854 3,049,523 3,182,680
2015 169,332 175,095 3,019,686 3,165,323
Source: Maryland Department of Labor, Licensing and Regulation

66 Demography and Economy
Local Firms and Employers
Listed below are the County’s ten largest private employers in 2019.
Listed below are representative examples of other major private employers located in the County and the employment
size in 2019. This list is presented for the purposes of demonstrating the diversity of employment opportunities in the
County and is not intended to be a ranking of employers or an exhaustive list of all major private employers in the
County.
Economic Development
The County is a major commercial center for the Washington-Baltimore region, with over 1,900 properties offering 76.5
million square feet of space to over 9,225 businesses. Several of the largest office and business parks in the Washington-
Baltimore region are located in the County, including Columbia Gateway with 756 acres, Gateway Commerce Center
with 164 acres, Maryland Wholesale Food Center with 400 acres and Rivers Corporate Park with 350 acres. The County
is also home to Emerson Corporate Commons with 570 acres and Maple Lawn with 506 acres, both mixed-use
developments with over 3 million square feet of office space. Downtown Columbia is experiencing substantial
reinvestment by the County and Howard Hughes Corporation adding 4.3 million square feet of office space.
Employer Products or Activities Employment
Johns Hopkins Applied Physics
Laboratory
Research & Development Systems
Engineering 6,400
Howard County General Hospital Medical Services 1,765
Verizon Telecommunications 1,700
Howard County Community College Higher Education 1,410
Lorien Health Systems Nursing Care 1,190
The Columbia Association Nonprofit Civic Organization 1,180
Coastal Sunbelt Produce Produce Processing 1,050
Nestle Dreyer's Ice Cream Frozen Desserts 890
Wells Fargo Financial Services 805
Sysco Food Services Food Products Distribution 800
Source: Maryland Department of Commerce, 2019.
Ten Largest Private employers
Employer Products or Activities Employment
Enterprise Community Partners Community Development 505
Humanim Services for the Disabled 460
Leidos Engineering Services 450
Maxim Healthcare Services Medical Staffing/Wellness 675
Oracle HQ/Software Development 650
Tenable Network Security Cybersecurity 415
W.R. Grace & Co. Chemical R&D 500
Source: Maryland Department of Commerce, 2019
Other Major Private Employers

Demography and Economy 67
The following table presents statistics for the industrial and commercial space available in the metropolitan area of the
County through the fourth quarter of 2019.
Retail Sales
The fourth-largest shopping center in the region, the Mall in Columbia, is located in the County. At 1.4 million square
feet, the Mall in Columbia features 215 stores, as well as both fast-casual and sit-down dining options. The property also
includes four major department stores and a 14-screen movie theater. Ten village centers throughout Columbia feature
over 1.0 million square feet of retail space. Other shopping centers in the County in excess of 100,000 square feet are
Columbia Crossing, Long Gate Shopping Center, Chatham Station Shopping Center, Dobbin Center, Normandy
Shopping Center, Savage Mill, Enchanted Forest Shopping Center, Snowden Square, Gateway Overlook I and Gateway
Overlook II. These centers offer over 4 million additional square feet of leasable space. Downtown Columbia
reinvestment is bringing an additional 1.2 million square feet of experiential retail to the area.
Columbia
Howard Research and Development Corporation (“HRD”) began the development of Columbia with initial land
purchases in 1962. Today, Columbia is an unincorporated city built on 14,000 acres in the east-central portion of the
County. Columbia has 103,663 residents, 5,500 businesses and 84,000 local jobs located in over 23 million square feet
of commercial office, industrial and research and development buildings. Ten village centers, each providing a variety
of day-to-day shopping needs and community and professional facilities and services, are now in operation. In addition,
the Mall in Columbia, Columbia Crossing, Dobbin Center and Snowden Square provide 3.5 million square feet of retail
stores, shops and restaurants. The redevelopment of the Wilde Lake Village Center is complete. Planning for the Long
Reach Village Center and a $70 million redevelopment of the Hickory Ridge Village Center is in progress. HRD is
continuing a $2.2 billion 20 year re-development of downtown Columbia surrounding the Mall in Columbia that will
include up to 6,200 residential units, 1.25 million square feet of retail space, 4.3 million square feet of office space and
a hotel.
If Columbia were to become a municipality, the Maryland Constitution provides that the County’s assessable base would
not be affected. Services provided by the Columbia Association for Columbia residents, which include primarily
provision of recreational facilities and maintenance of open space areas, are separate and distinct from the services
provided by the County and are paid for through separate assessments made annually by the Columbia Association
against residential and commercial property located in Columbia and facility user fees.
As of December 31, 2019, the Columbia Association had long-term debt of $21.0 million in aggregate principal amount.
As additional facilities are constructed, the amount of debt of the Columbia Association may increase. The interest on
the Columbia Association’s debt is not tax-exempt. Payments on such property assessments are not deductible for
federal income tax purposes, and liens for such property assessments are subordinate to liens for State and County real
property taxes.
Industrial and Commercial Space
Number Total Total Available
of Square Square Vacancy
Type of Space Buildings Footage (000) Footage (000) Rate
Flexible 224 11,721 524 4.5% 305
Industrial 416 33,648 1,729 5.1% 1,872
Office 550 19,654 1,744 8.9% 121
Retail 770 12,536 350 2.8% 643
Total 1,960 77,559 4,347 5.6% 2,941
Source: CoStar Realty Inc.
2019 Sq. Ft.
Absorption
(000)

68 Legal and Miscellaneous
Legal and Miscellaneous
Approval of Legal Proceedings
All legal matters incident to the authorization, issuance and sale of the Bonds are subject to the approval of McKennon
Shelton & Henn LLP, Bond Counsel. Delivery of the Bonds is conditioned upon delivery by Bond Counsel of opinions
substantially in the forms included in Appendix B of this Official Statement. In addition, certain other legal matters will
be passed upon for the Underwriters by its counsel, McGuireWoods LLP.
Tax Matters
The following is only a general summary of certain provisions of the Internal Revenue Code of 1986, as amended (the
“Code”), as enacted and in effect on the date hereof and does not purport to be complete; holders of the Bonds should
consult their own tax advisors as to the effects, if any, of the Code (and any proposed or subsequently enacted
amendments to the Code) in their particular circumstances.
Maryland Income Taxation
In the opinion of Bond Counsel, (i) under existing statutes, regulations and decisions, the Tax-Exempt Bonds, their
transfer, the interest payable on them, and any income derived from them, including any profit realized in their sale or
exchange shall be exempt from taxation of any kind by the State, any of its political subdivisions, or any other public
entity; no opinion is expressed as to estate or inheritance taxes, or any other taxes not levied or assessed directly on the
Tax-Exempt Bonds or the interest thereon; and (ii) under existing law, interest on the Taxable Bonds and profit realized
from their sale or exchange will be exempt from State income taxation; no opinion is expressed as to estate or inheritance
taxes, or any other taxes not levied or assessed directly on the Taxable Bonds or the interest thereon. Under existing law,
interest on the Bonds may be subject to state or local income taxes in jurisdictions other than the State under applicable
state or local tax laws. Purchasers of the Bonds should consult their own tax advisors with respect to the taxable status
of the Bonds in jurisdictions other than the State.
Tax-Exempt Bonds
Federal Income Taxation
In the opinion of Bond Counsel, assuming compliance with certain covenants described herein and under existing
statutes, regulations, and decisions, interest on the Tax-Exempt Bonds will be excludable from gross income for federal
income tax purposes.
Under the provisions of the Code, there are certain restrictions that must be met subsequent to the delivery of the Tax-
Exempt Bonds, including restrictions that must be complied with throughout the term of the Tax-Exempt Bonds in order
that the interest thereon be excludable from gross income. These include the following: (i) a requirement that certain
earnings received from the investment of the proceeds of the Tax-Exempt Bonds be rebated to the United States of
America under certain circumstances (or that certain payments in lieu of rebate be made); (ii) other requirements
applicable to the investment of the proceeds of the Tax-Exempt Bonds; and (iii) other requirements applicable to the use
of the proceeds of the Tax-Exempt Bonds and the facilities financed or refinanced with such proceeds. Failure to comply
with one or more of these requirements could result in the inclusion of the interest payable on the Tax-Exempt Bonds in
gross income for federal income tax purposes, effective from the date of their issuance. The County has covenanted to
regulate the investment of the proceeds of the Tax-Exempt Bonds and to take such other actions as may be required to
maintain the excludability from gross income for federal income tax purposes of interest on the Tax-Exempt Bonds.
Further, under existing statutes, regulations and decisions, Bond Counsel is of the opinion that interest on the Tax-
Exempt Bonds is not included in the alternative minimum taxable income of individuals as an enumerated item of tax
preference or other specific adjustment. In addition, interest income on the Tax-Exempt Bonds will be includable in the

Legal and Miscellaneous 69
applicable tax base for the purpose of determining the branch profits tax imposed by the Code on certain foreign
corporations engaged in a trade or business in the United States of America.
In rendering its opinion, Bond Counsel will rely, without independent investigation on the representations of certain
officials of the County made on behalf of the County in its Tax and Section 148 Certificate with respect to certain
material facts within the knowledge of the County relevant to the tax-exempt status of interest on the Tax-Exempt Bonds.
Additional Federal Tax Considerations There are other federal income tax consequences of ownership of obligations such as the Tax-Exempt Bonds under
certain circumstances, including the following: (i) deductions are disallowed for certain expenses of taxpayers allocable
to interest on tax-exempt obligations, as well as interest on indebtedness incurred or continued to purchase or carry tax-
exempt obligations and interest expense of financial institutions allocable to tax-exempt interest; (ii) for property and
casualty insurance companies, the amount of the deduction for losses incurred must be reduced by 25% of the sum of
tax-exempt interest income and the deductible portion of dividends received by such companies; (iii) interest income
that is exempt from tax must be taken into account for the purpose of determining whether, and what amount of, social
security or railroad retirement benefits are includable in gross income for federal income tax purposes; (iv) for S
corporations having Subchapter C earnings and profits, the receipt of certain levels of passive investment income, which
includes interest on tax-exempt obligations such as the Tax-Exempt Bonds, can result in the imposition of tax on such
passive investment income and, in some cases, loss of S corporation status; (v) net gain realized upon the sale or other
disposition of the Tax-Exempt Bonds generally must be taken into account when computing the 3.8% Medicare tax with
respect to net investment income imposed on certain high income individuals and specific trusts or estates; and (vi)
receipt of certain investment income, including interest on the Tax-Exempt Bonds, is considered when determining
qualification limits for obtaining the earned income credit provided by Section 32(a) of the Code.
Tax Accounting Treatment of Tax-Exempt Discount Bonds Certain maturities of the Tax-Exempt Bonds may be issued at an initial public offering price which is less than the
amount payable on such Tax-Exempt Bonds at maturity (the “Tax-Exempt Discount Bonds”). The difference between
the initial offering price at which a substantial amount of the Tax-Exempt Discount Bonds of each maturity was sold,
and the principal amount of such Tax-Exempt Discount Bonds payable at maturity constitutes original issue discount.
In the case of any holder of Tax-Exempt Discount Bonds, the amount of such original issue discount that is treated as
having accrued with respect to such Tax-Exempt Discount Bonds is added to the original cost basis of the holder in
determining, for federal income tax purposes, gain or loss upon disposition (including sale, early redemption or
repayment at maturity).
For federal income tax purposes (a) any holder of a Tax-Exempt Discount Bond will recognize gain or loss upon the
disposition of such security (including sale, early redemption or payment at maturity) in an amount equal to the
difference between (i) the amount received upon such disposition and (ii) the sum of (1) the holder's original cost basis
in such Tax-Exempt Discount Bond, and (2) the amount of original issue discount attributable to the period during which
the holder held such Tax-Exempt Discount Bond, and (b) the amount of the basis adjustment described in clause (a)(ii)(2)
will not be included in the gross income of the holder.
Original issue discount on Tax-Exempt Discount Bonds will be attributed to permissible compounding periods during
the life of any Tax-Exempt Discount Bonds in accordance with a constant rate of interest accrual method. The yield to
maturity of the Tax-Exempt Discount Bonds of each maturity is determined using permissible compounding periods. In
general, the length of a permissible compounding period cannot exceed the length of the interval between debt service
payments on the Tax-Exempt Discount Bonds and must begin or end on the date of such payments. Such yield then is
used to determine an amount of accrued interest for each permissible compounding period. For this purpose, interest is
treated as compounding periodically at the end of each applicable compounding period. The amount of original issue
discount that is treated as having accrued in respect of a Tax-Exempt Discount Bond for any particular compounding
period is equal to the excess of (a) the product of (i) the yield for such Tax-Exempt Discount Bond (adjusted as necessary
for an initial short period) divided by the number of compounding periods in a year multiplied by (ii) the amount that
would be the tax basis of such Tax-Exempt Discount Bond at the beginning of such period if held by an original
purchaser who purchased at the initial public offering price, over (b) the amount actually payable as interest on such
Tax-Exempt Discount Bond during such period. For purposes of the preceding sentence the tax basis of a Tax-Exempt
Discount Bond, if held by an original purchaser, can be determined by adding to the initial public offering price of such
Tax-Exempt Discount Bond the original issue discount that is treated as having accrued during all prior compounding
periods. If a Tax-Exempt Discount Bond is sold or otherwise disposed of between compounding dates, then interest

70 Legal and Miscellaneous
which would have accrued for that compounding period for federal income tax purposes is to be apportioned in equal
amounts among the days in such compounding period.
Holders of Tax-Exempt Discount Bonds should note that, under the tax regulations, the yield and maturity of a Tax-
Exempt Discount Bond is determined without regard to commercially reasonable sinking fund payments, and any
original issue discount remaining unaccrued at the time that a Tax-Exempt Discount Bond is redeemed in advance of
stated maturity will be treated as taxable gain.
Moreover, tax regulations prescribe special conventions for determining the yield and maturity of certain debt
instruments that provide for alternative payment schedules applicable on the occurrence of certain contingencies. The
prices or yields furnished by the successful bidder for the Tax-Exempt Bonds as shown on the inside cover of this
Official Statement may not reflect the initial issue prices for the purpose of determining the original issue discount for
federal income tax purposes.
The foregoing summarizes certain federal income tax consequences of original issue discount with respect to the Tax-
Exempt Discount Bonds but does not purport to deal with all aspects of federal income taxation that may be relevant to
particular investors or circumstances, including those set out above. Prospective purchasers of Tax-Exempt Discount
Bonds should consider possible state and local income, excise or franchise tax consequences arising from original issue
discount on Tax-Exempt Discount Bonds. In addition, prospective corporate purchasers should consider possible federal
tax consequences arising from original issue discount on such Tax-Exempt Discount Bonds under the branch profits tax.
The amount of original issue discount considered to have accrued may be reportable in the year of accrual for state and
local tax purposes or for purposes of the branch profits tax without a corresponding receipt of cash with which to pay
any tax liability attributable to such discount. Purchasers with questions concerning the detailed tax consequences of
transactions in the Tax-Exempt Discount Bonds should consult their tax advisors.
Purchase, Sale and Retirement of Tax-Exempt Bonds
Except as noted below in the case of market discount, the sale or other disposition of a Bond will normally result in
capital gain or loss to its holder. A holder’s initial tax basis in a Tax-Exempt Bond will be its cost.
Upon the disposition of a Tax-Exempt Bond (including sale, early redemption, purchase or payment at maturity), for
federal income tax purposes, a holder will recognize capital gain or loss upon the disposition of such security in an
amount equal to the difference between (a) the amount received upon such disposition and (b) the tax basis in such Tax-
Exempt Bond, determined by adding to the original cost basis in such Tax-Exempt Bond the amount of original issue
discount that is treated as having accrued as described above under “Tax Accounting Treatment of Tax-Exempt Discount
Bonds.” Such gain or loss will be a long-term capital gain or loss if at the time of the sale or retirement the Tax-Exempt
Bond has been held for more than one year. Present law taxes both long and short-term capital gains of corporations at
the rates applicable to ordinary income. For noncorporate taxpayers, however, short-term capital gains are taxed at the
rates applicable to ordinary income, while net capital gains are taxed at lower rates. Net capital gains are the excess of
net long-term capital gains (gains on capital assets held for more than one year) over net short-term capital losses.
Market Discount
If a holder acquires a Tax-Exempt Bond after its original issuance at a discount below its principal amount (or in the
case of a Tax-Exempt Bond issued at an original issue discount, at a price that produces a yield to maturity higher than
the yield to maturity at which such Tax-Exempt Bond was first issued), the holder will be deemed to have acquired the
Tax-Exempt Bond at “market discount,” unless the amount of market discount is de minimis, as described in the
following paragraph. If a holder that acquires a Tax-Exempt Bond with market discount subsequently realizes a gain
upon the disposition of the Tax-Exempt Bond, such gain shall be treated as taxable interest income to the extent such
gain does not exceed the accrued market discount attributable to the period during which the holder held such Tax-
Exempt Bond, and any gain realized in excess of such market discount will be treated as capital gain. Potential
purchasers should consult their tax advisors as to the proper method of accruing market discount.
In the case of a Tax-Exempt Bond not issued at an original issue discount, market discount will be de minimis if the
excess of the Tax-Exempt Bond’s stated redemption price at maturity over the holder's cost of acquiring the Tax-Exempt
Bond is less than 0.25% of the stated redemption price at maturity multiplied by the number of complete years between
the date the holder acquires the Tax-Exempt Bond and its maturity date. In the case of a Tax-Exempt Bond issued with
original issue discount, market discount will be de minimis if the excess of the Tax-Exempt Bond's revised issue price
over the holder's cost of acquiring the Tax-Exempt Bond is less than 0.25% of the revised issue price multiplied by the
number of complete years between the date the holder acquires the Tax-Exempt Bond and its stated maturity date. For

Legal and Miscellaneous 71
this purpose, a “revised issue price” is the sum of (i) its original issue price and (ii) the aggregate amount of original
issue discount that is treated as having accrued with respect to the Tax-Exempt Bond during the period between its
original issue date and the date of acquisition by the holder.
Amortizable Bond Premium
A Tax-Exempt Bond will be considered to have been acquired at a premium if, and to the extent that, immediately after
the acquisition of such Tax-Exempt Bond, the holder's tax basis in the Tax-Exempt Bond exceeds the amount payable
at maturity (or, in the case of a Tax-Exempt Bond callable prior to maturity, the amount payable on the earlier call date).
Under tax regulations applicable to the Tax-Exempt Bonds, the amount of the premium would be determined with
reference to the amount payable on that call date (including for this purpose the maturity date) which produces the lowest
yield to maturity on the Tax-Exempt Bonds. The holder will be required to reduce his tax basis in the Tax-Exempt Bond
for purposes of determining gain or loss upon disposition of the Tax-Exempt Bond by the amount of amortizable bond
premium that accrues, determined in the manner prescribed in the regulations. Generally, no deduction (or other tax
benefit) is allowable in respect of any amount of amortizable bond premium on the Tax-Exempt Bonds.
U.S. Federal Backup Withholding and Information Reporting
In general, information reporting requirements apply with respect to payments to certain non-corporate United States
holders of interest and original issue discount on, and payments to such holder of the proceeds of the sale, exchange,
redemption, retirement or other disposition of a Tax-Exempt Bond. If a United States holder of a Tax-Exempt Bond
(other than a corporation or other specified exempt entity) fails to satisfy applicable information reporting requirements
imposed by the Code, payments to such holder will be subject to “backup withholding,” which means that the payor is
required to deduct and withhold a tax equal to 24% of the payments. In general, the information reporting requirements
(where applicable) are satisfied if the holder completes, and provides the payor with, a Form W-9, “Request for Taxpayer
Identification Number and Certification.” Backup withholding should not occur if a holder purchases a Tax-Exempt
Bond through a brokerage account with respect to which a Form W-9 has been provided, as generally can be expected.
Any amounts withheld pursuant to backup withholding would be subject to recovery by the holder through proper refund
or credit.
Taxable Bonds
General
Many factors may impact the application of federal income tax laws pertaining to the Taxable Bonds and the receipt of
interest on Taxable Bonds, including the status of the beneficial owner of the Taxable Bonds as a United States holder
or non-United States holder under the Code, whether Taxable Bonds are held as capital assets or in some other context
and whether the status of the beneficial owner or the financial context in which it is operating represents a special tax
situation, such as an S corporation, insurance company, tax-exempt organization, financial institution, regulated
investment company, real estate investment trust or broker-dealer or trader in securities. Persons considering the
purchase of the Taxable Bonds should consult their tax advisors concerning the application of federal income tax laws
to their particular situations.
The following is a summary of certain federal income tax consequences of the ownership of Taxable Bonds held as
capital assets by United States holders. The discussion below is based upon the provisions of the Code and regulations,
rulings and judicial decisions as of the date of this Official Statement. Those provisions may be changed, in some cases
retroactively, so as to result in federal income tax consequences different from those discussed below.
As used herein, “United States holder” means a beneficial owner of a Taxable Bond who or that, for United States federal
income tax purposes, is (i) a citizen or resident of the United States, (ii) an entity taxable as a corporation created or
organized in or under the laws of the United States or any political subdivision of the United States, (iii) an estate, the
income of which is subject to federal income taxation regardless of its source or (iv) a trust, if it is subject to the primary
supervision of a court within the United States and one or more United States persons have the authority to control all
substantial decisions of the trust or if it has a valid election in effect under applicable United States Treasury regulations
to be treated as a United States person.
If a partnership, or other entity classified as a partnership for federal income tax purposes, holds Taxable Bonds, the tax
treatment of a partner will generally depend upon the status of the partner and upon the activities of the partnership. A
partner of a partnership holding Taxable Bonds should consult its tax advisor.

72 Legal and Miscellaneous
Payment of Interest
Interest on a Taxable Bond will be taxable to a United States holder as ordinary income at the times accrued or paid in
accordance with the United States holder’s method of accounting for federal income tax purposes.
Tax Accounting Treatment of Taxable Discount Bonds
Certain maturities of the Taxable Bonds may be issued at an initial public offering price that is less than the stated
redemption price at maturity of such Taxable Bonds (the “Taxable Discount Bonds”). If the stated redemption price at
maturity of Taxable Discount Bonds of a particular maturity exceeds the first price at which a substantial amount of
such Bonds was sold for money (excluding sales to bond houses, brokers or similar persons acting as underwriters,
placement agents or wholesalers) by more than a de minimis amount, the Taxable Discount Bonds will be treated as
having original issue discount. A holder of Taxable Discount Bonds (whether a cash or accrual method taxpayer) is
required to include in gross income as interest the amount of such original issue discount which is treated as having
accrued during a taxable year with respect to such Bonds, in advance of the receipt of some or all of the related cash
payments. Accrued original issue discount is added to the original cost basis of the holder in determining, for federal
income tax purpose, gain or loss upon disposition (including sale, early redemption or repayment at maturity).
Original issue discount on Taxable Discount Bonds will be attributed to permissible compounding periods during the
life of any Taxable Discount Bonds in accordance with a constant rate of interest accrual method. The yield to maturity
of the Taxable Discount Bonds of each maturity is determined using permissible compounding periods. In general, the
length of a permissible compounding period cannot exceed the length of the interval between debt service payments on
the Taxable Discount Bonds and must begin or end on the date of such payments. The amount of original issue discount
allocable to any compounding period is equal to the excess, if any, of (a) the Taxable Discount Bond’s adjusted issue
price at the beginning of the compounding period multiplied by its yield to maturity, determined on the basis of
compounding at the close of each compounding period and properly adjusted for the length of the compounding period,
over (b) the aggregate of all qualified stated interest allocable to the compounding period. Original issue discount
allocable to a final compounding period is the difference between the amount payable at maturity, other than a payment
of qualified stated interest, and the adjusted issue price at the beginning of the final compounding period. Special rules
apply for calculating original issue discount for an initial short compounding period. The “adjusted issue price” of a
Taxable Discount Bond at the beginning of any compounding period is equal to its issue price increased by the accrued
original issue discount for each prior compounding period (determined without regard to the amortization of any
acquisition or bond premium, as described below) and reduced by any payments made on the Taxable Discount Bond
(other than qualified stated interest) on or before the first day of the compounding period. Under these rules, a holder of
a Taxable Discount Bond will have to include in income increasingly greater amounts of original issue discount in
successive compounding periods. The amount of original issue discount accrued on Taxable Discount Bonds held of
record by persons other than corporations and other exempt holders will be reported to the Internal Revenue Service. If
a Taxable Discount Bond is sold or otherwise disposed of between compounding dates, then interest that would have
accrued for that compounding period for federal income tax purposes is to be apportioned in equal amounts among the
days in such compounding period.
The term “qualified stated interest” means stated interest that is unconditionally payable in cash or in property, other
than debt instruments of the issuer, if the interest to be paid is payable at least once per year, is payable over the entire
term of the Taxable Discount Bond and is payable at a single fixed rate or, subject to certain conditions, based on one
or more interest indices.
Holders of Taxable Discount Bonds should note that, under applicable regulations, the yield and maturity of a Taxable
Discount Bond is determined without regard to commercially reasonable sinking fund payments and any original issue
discount remaining unaccrued at the time that a Taxable Discount Bond is redeemed in advance of stated maturity will
be treated as taxable gain. Moreover, tax regulations prescribe special conventions for determining the yield and maturity
of certain debt instruments that provide for alternative payment schedules applicable upon the occurrence of certain
contingencies.
The prices or yields furnished by the successful bidder for the Taxable Bonds as shown on the inside cover of this
Official Statement may not reflect the initial issue prices for the purposes of determining the original issue discount for
federal income tax purposes.
The foregoing summarizes certain federal income tax consequences of original issue discount with respect to the Taxable
Discount Bonds but does not purport to deal with all aspects of federal income taxation that may be relevant to particular
investors or circumstances, including those set out above. Prospective purchasers of Taxable Discount Bonds should
consider possible state and local income, excise or franchise tax consequences arising from original issue discount on

Legal and Miscellaneous 73
Taxable Discount Bonds. In addition, prospective foreign corporate purchasers should consider possible federal tax
consequences arising from original issue discount on such Bonds under the branch profits tax. The amount of original
issue discount considered to have accrued may be reportable in the year of accrual for state and local tax purposes or for
purposes of the branch profits tax without a corresponding receipt of cash with which to pay any tax liability attributable
to such discount. Purchasers with questions concerning the detailed tax consequences of transactions in the Taxable
Discount Bonds should consult their tax advisors.
Purchase, Sale and Retirement of Taxable Bonds
Except as noted below in the case of market discount, the sale or other disposition of a Taxable Bond will normally
result in capital gain or loss. A United States holder’s initial tax basis in a Taxable Bond will be its cost. Upon the
disposition of a Taxable Bond (including sale, early redemption, purchase or payment maturity), for federal income tax
purposes, a United States holder will recognize capital gain or loss upon the disposition of such security in an amount
equal to the difference between (a) the amount received upon such disposition (less an amount equal to any accrued
qualified stated interest, which will be treated as a payment of interest) and (b) the tax basis in such Bond, determined
by adding to the original cost basis in such Bond the amount of any original issue discount and any market discount
previously included in such holder’s income, and by subtracting any amortized premium and any cash payments on the
Taxable Bond other than qualified stated interest, as more fully described above under “Tax Accounting Treatment of
Taxable Discount Bonds.” Such gain or loss will be long-term capital gain or loss if at the time of the sale, redemption
or retirement, the Taxable Bond has been held for more than one year. Under present law, both long and short-term
capital gains of corporations are taxed at the rates applicable to ordinary income. For noncorporate taxpayers, however,
short-term capital gains are taxed at the rates applicable to ordinary income, while net capital gains are taxed at lower
rates. Net capital gains are the excess of net long-term capital gains (gains on capital assets held for more than one year)
over net short-term capital losses.
If a United States holder acquires a Taxable Bond after its original issuance at a cost which is less than its stated
redemption price at maturity (or, in the case of a Taxable Bond having original issue discount, its revised issue price)
by more than a certain de minimis amount, such holder will be deemed to have acquired the Taxable Bond at “market
discount.” The amount of market discount treated as having accrued will be determined either on a ratable basis, or, if
the holder so elects, on a constant interest method. Upon any subsequent disposition (including a gift, redemption or
payment at maturity) of such Taxable Bond (other than in connection with certain nonrecognition transactions), the
lesser of any gain on such disposition (or appreciation, in the case of a gift) or the portion of the market discount that
accrued while the Taxable Bond was held by such holder will be treated as ordinary income at the time of the disposition.
In lieu of including accrued market discount in income at the time of disposition, a holder may elect to include market
discount in income currently. Unless a holder so elects, a holder may be required to defer deductions for a portion of
such holder’s interest expense with respect to any indebtedness incurred or maintained to purchase or carry such Bond
until the holder disposes of the Taxable Bond. The election to include market discount in income currently, once made,
is irrevocable and applies to all market discount obligations acquired on or after the first day of the first taxable year to
which the election applies and may not be revoked without the consent of the Internal Revenue Service.
Acquisition Premium
A subsequent United States holder of a Taxable Bond is generally subject to rules for accruing original issue discount
described above. However, if such holder’s purchase price for a Taxable Bond exceeds the adjusted issue price (the sum
of the issue price of the Taxable Bond and the aggregate amount of the original issue discount includable in the gross
income of all holders for periods before the acquisition of the Taxable Bond by such holder, and reduced by any
payments previously made on the Taxable Bond other than payments of qualified stated interest), the excess (referred
to as “acquisition premium”) is offset ratably against the amount of original issue discount otherwise includable in such
holder’s taxable income (i.e., such holder may reduce the daily portion of original issue discount by a fraction, the
numerator of which is the excess of such holder’s purchase price for the Taxable Bond over the adjusted issue price, and
the denominator of which is the excess of the sum of all amounts payable on the Taxable Bond after the purchase date
other than qualified stated interest over the Taxable Bond’s adjusted price).
Amortizable Bond Premium
If a United States holder’s basis in a Taxable Bond exceeds the sum of all amounts payable on the Taxable Bond after
the date on which the holder acquires it other than qualified stated interest, such excess will constitute amortizable bond
premium with respect to the Taxable Bond and, in the case of a Taxable Discount Bond, such holder will not have to
account for original issue discount with respect to such Bond. The holder of a Taxable Bond having amortizable bond
premium generally may elect to amortize the premium over the remaining term of the Taxable Bond on a constant yield
method as an offset to interest when includable in income under its regular accounting method. In the case of instruments

74 Legal and Miscellaneous
that provide for alternative payment schedules, bond premium amortization is calculated by assuming that (a) the holder
will exercise or not exercise options in a manner that maximizes its yield and (b) the issuer will exercise or not exercise
options in a manner that minimizes the holder’s yield (except that the issuer will be assumed to exercise call options in
a manner that maximizes the holder’s yield). In addition, bond premium amortization is calculated without regard to
commercially reasonable sinking fund payments. If the holder does not elect to amortize bond premium, that premium
will decrease the gain or increase the loss that would otherwise be recognized on disposition of the Taxable Bond. An
election to amortize premium on a constant yield method will also apply to all debt obligations held or subsequently
acquired by the holder on or after the first day of the first taxable year to which the election applies. The holder may not
revoke the election without the consent of the Internal Revenue Service. Holders of Taxable Bonds having amortizable
bond premium should consult with their own tax advisors before making this election.
Election to Use Original Discount Method with Respect to a Taxable Bond
The holder of a Taxable Bond may elect to treat all interest on the Taxable Bond as original issue discount and calculate
the amount includable in gross income under the constant yield method described above. For the purposes of this
election, interest includes stated interest, acquisition discount, original issue discount, de minimis original issue discount,
market discount, de minimis market discount and unstated interest, as adjusted by any amortizable bond premium or
acquisition premium. The holder must make this election for the taxable year in which the Taxable Bond is acquired and
may not revoke the election without the consent of the Internal Revenue Service. Holders of Taxable Bonds should
consult with their own tax advisors about this election.
Medicare Tax
Interest income from the Taxable Bonds (including accrued original issue discount and market discount) and net gain
realized on the sale or other disposition of property such as the Taxable Bonds generally must be taken into account
when computing the 3.8% Medicare tax with respect to net investment income imposed on certain high income
individuals and specified trusts and estates.
U.S. Federal Backup Withholding and Information Reporting
In general, information reporting requirements apply with respect to payments to certain non-corporate United States
holders of interest and original issue discount on, and payments to such holder of the proceeds of the sale, exchange,
redemption, retirement or other disposition of a Taxable Bond. If a United States holder of a Taxable Bond (other than
a corporation or other specified exempt entity) fails to satisfy applicable information reporting requirements imposed by
the Code, payments to such holder will be subject to “backup withholding,” which means that the payor is required to
deduct and withhold a tax equal to 24% of the payments. In general, the information reporting requirements (where
applicable) are satisfied if the holder completes, and provides the payor with, a Form W-9, “Request for Taxpayer
Identification Number and Certification.” Backup withholding should not occur if a holder purchases a Taxable Bond
through a brokerage account with respect to which a Form W-9 has been provided, as generally can be expected. Any
amounts withheld pursuant to backup withholding would be subject to recovery by the holder through proper refund or
credit.
Foreign Investors
Subject to the discussion in the following paragraph, payments with respect to the Taxable Bonds to a non-United States
holder that has no connection with the United States other than holding its Taxable Bonds generally will be exempt from
United States income tax and will be made free of withholding tax, as long as that holder has complied with certain tax
identification and certification requirements. Non-United States holders should consult their tax advisors regarding the
possible United States income tax implications of their ownership and disposition of the Taxable Bonds.
Sections 1471 through 1474 of the Code and related federal income tax guidance, collectively referred to as FATCA,
generally impose United States federal withholding tax at a rate of 30% on certain types of payments to certain foreign
entities, unless various information reporting and diligence requirements are satisfied. This tax generally would apply
in the case of Taxable Bonds held through foreign financial institutions that do not satisfy such requirements. Generally,
the 30% United States federal withholding tax under FATCA will apply to United States-source interest (such as interest
and original issue discount on the Taxable Bonds) and, under current guidance, would apply to certain “passthru”
payments no earlier than the date that is two years after publication of final regulations defining the term “foreign
passthru payments.” Non-United States holders should consult their tax advisors regarding the possible implications of
FATCA on their ownership and disposition of the Taxable Bonds.

Legal and Miscellaneous 75
Legislative Developments
Legislative proposals proposed after issuance and delivery of the Bonds could adversely affect the market value of the
Bonds. Further, if enacted into law, any such legislation could cause the interest on the Bonds to be subject, directly or
indirectly, to federal or state income taxation and could otherwise alter or amend one or more of the provisions of federal
or state tax law described above or their consequences, as applicable. Prospective purchasers of the Bonds should consult
with their tax advisors as to the status and potential effect of any legislative proposals, as to which Bond Counsel
expresses no opinion.
Ratings
Fitch Ratings, Moody’s Investors Service and S&P Global Ratings have given the Bonds the ratings indicated on the
cover page of this Official Statement. An explanation of the significance of any rating may be obtained from the
appropriate rating agency. The County furnished to each rating agency the information contained in a preliminary
Official Statement and other materials and information. Generally, rating agencies base their ratings on such materials
and information, as well as their own investigations, studies and assumptions. Each rating may be changed at any time
and no assurance can be given that it will not be revised downward or withdrawn by the applicable rating agency if, in
the judgment of such rating agency, circumstances should warrant such action. Any such downward revision or
withdrawal of any rating could have an adverse effect on the market price of the Bonds.
Litigation
The County is a party to numerous legal proceedings of the type that normally occur in governmental operations. The
pending legal proceedings are not, in the opinion of the County Solicitor, likely to have a material adverse impact on
the County’s financial condition. In addition, the County is currently reviewing and adjusting a number of claims
through its self-insurance program. In the opinion of the County Solicitor, none of these pending matters is likely to
have a material adverse impact on the County’s financial condition, nor should there be any substantial recovery against
the County in amounts in excess of reserved funds.
Independent Auditors
The basic financial statements of Howard County, Maryland for the year ended June 30, 2019 in Appendix A have been
audited by CliftonLarsonAllen LLP, independent certified public accountants, and have been included in reliance upon the
qualification of the firm to issue the report. The independent accountants were not requested to review or update such
financial statements or their report in connection with the issuance of the Bonds. CliftonLarsonAllen LLP has not been
engaged to perform and has not performed, since the date of its report included herein, any procedures on the financial
statements addressed in that report. CliftonLarsonAllen LLP also has not performed any procedures relating to this Official
Statement.
Financial Advisor Davenport & Company LLC of Towson, Maryland, has acted as financial advisor to the County in connection with the
issuance of the Bonds. Davenport & Company LLC is not obligated to undertake, and has neither undertaken an
independent verification of, or assumed responsibility for the accuracy, completeness or fairness of the information
contained in this Official Statement.
Underwriting
The Bonds are being purchased by Citigroup Global Markets Inc. (“Citigroup”), Barclays Capital Inc., M&T Securities,
Inc. and Siebert Williams Shank & Co., LLC (collectively, the “Underwriters”). Citigroup, on behalf of itself and the
other Underwriters, has agreed to purchase the Tax-Exempt Bonds at a purchase price of $196,819,318.19, representing
the principal amount of the Tax-Exempt Bonds plus an original issue premium in the amount of $28,750,574.00 and less
an Underwriters’ discount in the amount of $291,255.81. Furthermore, the Underwriters have agreed to purchase the
Taxable Bonds at a purchase price of $86,982,076.61, representing the principal amount of the Taxable Bonds less an
Underwriters’ discount in the amount of $127,923.39. The obligation of the Underwriters to purchase the Bonds is
subject to certain conditions set forth in the Bond Purchase Agreements between the County and the Underwriters (the
“Bond Purchase Agreements”) but the Bond Purchase Agreements provide that the Underwriters will purchase all of the
Bonds if any are purchased. The Underwriters may offer and sell the Bonds to certain dealers (including dealers

76 Legal and Miscellaneous
depositing Bonds into investment trusts, certain of which may be sponsored or managed by an Underwriter) and others
at prices lower than the offering prices of the Bonds.
Citigroup Global Markets Inc. has entered into a retail distribution agreement with Fidelity Capital Markets, a division
of National Financial Services LLC (together with its affiliates, “Fidelity”). Under this distribution agreement, Citigroup
Global Markets Inc. may distribute municipal securities to retail investors at the original issue price through Fidelity.
As part of this arrangement, Citigroup Global Markets Inc. will compensate Fidelity for its selling efforts.
The yields or prices shown on the inside cover of this Official Statement are based on information supplied to the County
by the Underwriters respecting the resale prices (not including concessions) of the Bonds established on the date hereof.
Any other information concerning the terms of reoffering of the Bonds, if any, including yields or prices, should be
obtained from the Underwriters and not from the County.
Certain Relationships
M&T Securities, Inc., one of the Underwriters of the Bonds, is a subsidiary of Manufacturers and Traders Trust Company,
the Escrow Agent and the Bond Registrar for the Bonds.
McKennon Shelton & Henn LLP, Bond Counsel to the County in connection with the issuance of the Bonds, has served
from time to time as outside counsel to certain of the Underwriters and Manufacturers and Traders Trust Company in
unrelated matters.
McGuireWoods LLP, counsel to the Underwriters, serves from time to time as counsel to the County on other unrelated
matters.
Verification of Mathematical Computations
The arithmetical accuracy of certain computations included in the schedules provided by the Financial Advisor on behalf
of the County relating to (a) computation of forecasted receipts of principal and interest on the Government Obligations
and cash held uninvested in the Escrow Deposit Fund and the forecasted payments of principal, redemption premium (if
any) and interest on the Refunded Bonds, and (b) computation of the yields on the Bonds and such Government
Obligations was examined by Bingham Arbitrage Rebate Services, Inc. (“Bingham”). Such computations were based
solely upon assumptions and information supplied by the Financial Advisor on behalf of the County. Bingham has
restricted its procedures to examining the arithmetical accuracy of certain computations and has not made any study or
evaluation of the assumptions and information upon which the computations are based and accordingly, has not
expressed an opinion on the date used, the reasonableness of the assumptions, or the achievability of the forecasted
outcome.
Certificate of County Officials
Simultaneously with or before delivery of and payment for the Bonds, the County will furnish to the purchasers of the
Bonds a certificate of the County Executive, the Chief Administrative Officer and the Director of Finance that will state
that, to the best of their knowledge and belief, this Official Statement (and any amendment or supplement hereto) as of the
date of sale and as of the date of delivery of the Bonds does not contain any untrue statement of material fact and does not
omit to state a material fact necessary to make the statements herein, in the light of the circumstances under which they
were made, not misleading, and that between the date of sale and the date of delivery of the Bonds there has been no
material adverse change in the financial position or revenues of the County, except as reflected or contemplated in this
Official Statement (and any amendment or supplement hereto).

Legal and Miscellaneous 77
Miscellaneous
Any statements made in this Official Statement involving matters of opinion or estimates, whether or not expressly so
stated, are set forth as such and not as representations of fact, and no representation is made that any estimates will be
realized. Neither this Official Statement nor any statement which may have been made verbally or in writing is to be
construed as a contract with the holders of any of the Bonds.
The execution and delivery of this Official Statement have been approved by Howard County, Maryland.
HOWARD COUNTY, MARYLAND
By: /S/ Calvin Ball
CALVIN BALL
County Executive
and
By: /S/ Janet R. Irvin
JANET R. IRVIN
Director of Finance

[This Page Intentionally Left Blank]

Audited Financial Statements of the County A-1
Audited Financial Statements of the County for
the fiscal year ended June 30, 2019
Appendix A

HOWARD COUNTY, MARYLAND
COMPREHENSIVE ANNUAL FINANCIAL REPORT
FOR THE FISCAL YEAR ENDED
JUNE 30, 2019

Howard County, Maryland3430 Court House DriveEllicott City, Maryland 21043Telephone (410) 313-2195Fax (410) 313-4433www.howardcountymd.gov
Certain Appointed OfficialsLonnie R. Robbins
Chief Administrative OfficerJanet R. Irvin
Director of FinanceJames M. Irvin
Director of Public WorksGary W. Kuc
County SolicitorHolly Sun
Budget AdministratorCraig Glendenning
County Auditor
Financial AdvisorDavenport & Company8600 LaSalle Road, Sute 324Towson, MD 21286Telephone (410) 296-9426Fax (866) 932-6660www.investdavenport.com
Bond CounselMcKennon Shelton & Henn LLP401 East Pratt Street, Suite 2315Baltimore, Maryland 21202Telephone (410) 843-3500Fax (410) 843-3501www.mshllp.com
Independent AuditorCliftonLarsonAllen LLP1966 Greenspring Drive, Suite 300Timonium, MD 21093Telephone (410) 453-0900Fax (410) 453-0914www.claconnect.com
County Executive
Calvin Ball
County Council
Christiana Mercer RigbyChair and CouncilwomanDistrict 3
Opel JonesVice Chair andCouncilmanDistrict 2
Liz WalshCouncilwomanDistrict 1
Deb JungCouncilwomanDistrict 4
David YungmannCouncilmanDistrict 5

Comprehensive AnnualFinancial Report
For the Fiscal Year Ended June 30, 2019
Prepared by the Department of Finance
Howard County, Maryland


Speed Enforcement Fund 134
Combining Balance Sheet – Non-Major Capital Project Funds 135Combining Statement of Revenues, Expenditures and Changes in
Fund Balances – Non-Major Capital Project Funds 136Combining Balance Sheet – Non-Major Debt Service Funds 137Combining Statement of Revenues, Expenditures and Changes in
Fund Balances – Non-Major Debt Service Funds 138Schedule of Revenues, Expenditures and Changes in Fund Balance –
Budgetary BasisBond Anticipation Note Fund 139Tax Increment Financing Fund 140
Non-Major Enterprise FundsCombining Statement of Net Position 144Combining Statement of Revenues, Expenses and Changes in Net Position 145Combining Statement of Cash Flows 146
Internal Service FundsCombining Statement of Net Position 150Combining Statement of Revenues, Expenses and Changes in Net Position 151Combining Statement of Cash Flows 152
Fiduciary FundsCombining Statement of Net Position – Pension and Other Post-
Employment Benefits Trust Funds 156Combining Statement of Changes in Net Position – Pension and Other
Post-Employment Benefits Trust Funds 157Combining Statement of Assets and Liabilities – Agency Funds 158
Combining Statement of Changes in Assets and Liabilities –Agency Funds 159
Capital Assets Used in the Operation of GovernmentalFundsSchedule by Function and Activity 162Schedule of Changes by Function and Activity 163
Capital Assets Used in the Operation of Enterprise FundsSchedule of Capital Assets and Depreciation 166
Long-Term DebtSchedule of Bonded and Other Long-Term Debt – General 170Schedule of Changes in General Long-Term Debt – Long-Term
Obligations 171Schedule of Bonded and Other Long-Term Debt – Enterprise Funds 172Schedule of Changes in Bonded Long-Term Debt – Enterprise Funds 173
Statistical SectionIndex 176Net Position by Category 178Changes in Net Position 179Fund Balances, Governmental Funds 181Changes in Fund Balances of Governmental Funds 182Assessed and Estimated Accrual Value of Taxable Property 183Direct and Overlapping Property Tax Rates 184Principal Property Taxpayers 185Property Tax Levies and Collections 186Ratios of Outstanding Debt by Type 187Ratios of General Bonded Debt Outstanding 188Legal Debt Margin 189Pledged Revenue Coverage - Special Recreation Facility 190Pledged Revenue Coverage - Annapolis Junction Special Taxing District 191Pledged Revenue Coverage - Crescent Special Taxing District 192Demographic and Economic Statistics 193Principal Employers 194County Government Employees by Function 195Capital Asset Statistics by Function 196Operating Indicators by Function/Program 197
Table of ContentsIntroductory Section
Listing of County OfficialsCounty Executive and CouncilTitle PageTable of Contents iOrganizational Chart iiLetter of Transmittal iiiCertificate of County Auditor xiCertificate of Achievement for Excellence in Financial Reporting xii
Financial SectionIndependent Auditor’s Report 1Management’s Discussion and Analysis – Required Supplementary
Information 5
Basic Financial StatementsGovernment-wide Financial StatementsStatement of Net Position 21Statement of Activities 23Fund Financial StatementsBalance Sheet – Governmental Funds 24Reconciliation of the Balance Sheet of Governmental Funds to the
Statement of Net Position 25Statement of Revenues, Expenditures and Changes in Fund Balances –
Governmental Funds 26Reconciliation of the Statement of Revenues, Expenditures and Changes in
Fund Balances of Governmental Funds to the Statement of Activities 27Statement of Revenues, Expenditures, and Changes in Fund Balances –
Budgetary Basis - General Fund 28Statement of Revenues, Expenditures and Changes in Fund Balances –
Budgetary Basis – Agricultural Land Preservation Fund 29
Statement of Net Position – Proprietary Funds 30Statement of Revenues, Expenses and Changes in Net Position –
Proprietary Funds 32Statement of Cash Flows – Proprietary Funds 33Statement of Fiduciary Net Position – Pension and Other Post –
Employment Benefits Trust Funds and Agency Funds 34Statement of Changes in Fiduciary Net Position – Pension and Other Post-
Employment Benefits Trust Funds 35Combining Statement of Net Position – Component Units 36Combining Statement of Activities – Component Units 37Notes to the Financial StatementsNotes to Basic Financial Statements – Index 41Notes to Basic Financial Statements 42
Required Supplementary InformationPension Trust Funds 102Other Post-Employment Benefits Funds 106Length of Service 109
Combining and Individual Fund Statementsand Schedules – Supplementary InformationGeneral FundSchedule of Revenues and Appropriations from Fund Balances –Budgetary Basis 114Schedule of Expenditures and Encumbrances – Budgetary Basis 116
Non-Major Governmental FundsCombining Balance Sheet – Non-Major Governmental Funds 124Combining Statement of Revenues, Expenditures and Changes inFund Balances – Non-Major Governmental Funds 125Combining Balance Sheet – Non-Major Special Revenue Funds 126Combining Statement of Revenues, Expenditures and Changes inFund Balances – Non-Major Special Revenue Funds 127Schedule of Revenues, Expenditures and Changes in Fund Balance –
Budgetary BasisCommunity Renewal Program Fund 128Environmental Services Fund 129Fire and Rescue Reserve Fund 130Forest Conservation Fund 131Grants Fund 132Recreation Program Fund 133
i

______________________________________________________________________________________________________
HOWARD COUNTY GOVERNMENTORGANIZATIONAL CHART
ii

HOWARD COUNTY DEPARTMENT OF FINANCE3430 Court House Drive n Ellicott City, Maryland 21043 n 410-313-2195
Janet R. Irvin, Director FAX [email protected] TDD 410-313-2323
November 22, 2019
Honorable County Executive,Honorable Members of the County Council andCitizens of Howard County
Ladies and Gentlemen:
FORMAL TRANSMITTAL OF THE CAFR
The audited Comprehensive Annual Financial Report (CAFR) of Howard County, Maryland (theCounty) prepared by the Department of Finance for the fiscal year (FY) ended June 30, 2019, is herebysubmitted in compliance with Howard County Charter, Section 212 and includes the auditor’s opinionissued by the independent public accounting firm of CliftonLarsonAllen LLP hired by the CountyCouncil. The annual report was prepared by the Howard County Department of Finance in cooperationwith the finance departments of the County’s component units.
Management assumes full responsibility for the completeness and reliability of the informationcontained in this report, based upon a comprehensive framework of internal control that it has establishedfor this purpose. Because the cost of internal control should not exceed anticipated benefits, the objectiveis to provide reasonable, rather than absolute, assurance that the financial statements are free of anymaterial misstatements.
CliftonLarsonAllen LLP, licensed certified public accountants, performed an independent audit andissued an unmodified (“clean”) opinion on the County’s financial statements for the fiscal year endedJune 30, 2019. The Independent Auditor’s Report is presented as the first element of the FinancialSection of this report.
Management’s Discussion and Analysis (MD&A) immediately follows the Independent Auditor’sReport and provides a narrative introduction, overview, and analysis to accompany the basic financialstatements. The MD&A is designed to complement this letter of transmittal and should be read inconjunction with it.
PROFILE OF THE GOVERNMENT
Howard County, Maryland was formed in 1851 and was named for the fifth Governor of Maryland,Colonel John Eager Howard. Under a home rule charter adopted in 1968, the County’s executivefunctions are vested in the elected County Executive. The County Council consists of five memberselected by district.
Howard County Government, Calvin Ball County Executive www.howardcountymd.gov
Letter of Transmittal iii

Located directly between Baltimore, Maryland and Washington, D.C. and at its closest point is lessthan four miles from the former and 13 miles from the latter, the County is 251 square miles in area.The County was predominantly agricultural in character until 1966, when construction began on theplanned community of Columbia. Columbia is unique for its purposeful goal to be an integratedcommunity at a time before the Fair Housing Act of 1968 made it illegal to discriminate in housingbased on race, color, national origin or religion. Howard County is home to approximately 323,293residents based on 2018 estimates by the Howard County Department of Planning & Zoning. TheHoward County Library System (HCLS) was named one of the best Library Systems in North Americaby the Library Journal Index of Public Service for five straight years. Columbia/Ellicott City was namedby Money Magazine as the #1 best place to live in 2016 and ranked in the top ten for the fifth time ina row. According to the U.S. Census Bureau’s American Community Survey in 2017, Howard Countyhas both the highest median income in the State and the third highest in the nation.
Howard County, MarylandMedian Household Income
125,000
120,000
115,000
110,000
105,000
100,0002012 2013 2014 2015 2016 2017
Source: United States Department of Commerce, Bureau of the Census, State and County QuickFacts (5-year estimates)
COMPONENT UNITS
The County government provides all the local government services as there are no incorporated citiesor towns in Howard County. Services provided by the County include police, fire and rescue, sheriff,corrections, public works, planning and zoning, landfill, water and sewer, public housing, and recreationand parks. In addition to general government activities, the governing body has financial accountabilityfor the Howard County Public School System, Howard Community College, the Howard County LibrarySystem, and the Howard County Housing Commission. Therefore, the activities of these entities areincluded in this annual report. Additional information on all four of these legally separate entities can
Howard County Government, Calvin Ball County Executive www.howardcountymd.gov
iv Letter of Transmittal

be found in Note 1A in the Notes to Basic Financial Statements. The financial activities of the HowardCounty Economic Development Authority, which is also a component unit of the County, are excludeddue to immateriality. The Volunteer Fire Districts do not meet the established criteria for inclusion inthe reporting entity and, accordingly, are excluded from this report.
BUDGET
The Howard County budget is a comprehensive plan of all monies spent by County departments andagencies. As required by County law, the budget consists of the current operating expenditure andrevenue budget (with five-year spending projections), the capital budget and capital program, and thebudget message. The annual budget includes all revenues, all expenditures and the projected surplusor deficit in the general fund and all other funds. Funds in the operating budget include appropriationsfor the following functional areas: education, public safety, public works, community services, generalgovernment, legislative and judicial, and capital, debt and reserves. The capital budget includes fundsto construct major government facilities such as roads, bridges, schools, libraries, water and sewerinfrastructure and fire stations. Capital projects usually take more than a year to complete, unlike theoperating budget which covers only one year.
The budget process begins each fall when the County Executive appoints a Spending AffordabilityAdvisory Committee to establish guidelines for determining debt affordability levels for the upcomingyear. County departments and agencies submit budget requests to the Executive in December. After apublic process that involves two public hearings and a thorough review of departmental requests, theCounty Executive submits proposed capital and operating budgets to the County Council by April 1and 21, respectively. The County Council then conducts a series of public hearings and work sessionsin April and May to review the Executive’s proposed budget. The County Council cannot change theform of the budget as submitted by the Executive to alter the revenue estimates or to increase anyexpenditure recommended by the Executive for current or capital purposes unless expressly providedfor in State law or to correct mathematical errors. The County Council can reduce the Executive’sbudget, but not increase it, except in the case of the Public School’s budget. The County Council mayrestore funds back to the level requested by the School Board. After its review, the County Councilfinalizes the entire budget and sets tax rates, fees and charges needed to generate enough revenue tobalance the budget. The Annual Budget must be adopted by the County Council by the first day of thelast month of the current fiscal year. Expenditure authority for the operating budget is at the fund anddepartment level in major categories, including personnel costs, various operating expenses and capitalcost. Appropriations in the capital budget are determined at the project level on an annual basis.
Once the budget is approved, the County Council can only amend it at the request of the CountyExecutive. The operating budget is amended during the year through the use of supplemental budgetappropriation ordinances (SAOs). The County Executive may request at any time during the fiscal year,the approval of an SAO by transferring funds from the County’s budgeted contingency reserves. Thecapital budget may be amended through the use of Transfer Appropriation Ordinances (TAOs). TheCounty Executive may request, at any time during the fiscal year that a TAO be approved by transferringfunds from one capital project to another. At no time may the bottom line of the capital budget beincreased. The County maintains an encumbrance system for budgetary control. All unencumberedappropriations of the operating budget lapse at year-end. Unencumbered capital appropriations continueuntil the specific capital project is closed.
Howard County Government, Calvin Ball County Executive www.howardcountymd.gov
Letter of Transmittal v

ECONOMIC CONDITION AND OUTLOOK
Howard County continues to have a diverse economic base, taking advantage of a friendly businessclimate, a highly educated workforce and superb quality of life. It is located in the heart of the corridorbetween Washington, D.C. and Baltimore. Employment is expected to remain stable and theunemployment rate is expected to remain below the state (3.9%) and national (3.7%) levels as evidencedby the June 2019 rate of 3.1%.
Howard Baltimore Metro Maryland
United States
Unemployment Rates
10.09.08.07.06.05.04.03.02.01.00.0
Perc
enta
ge
2010 2011 2012 2013 2014 2015 2016 2017 2018 2019
Source: Maryland Department of Labor, Licensing and Regulation
LOCAL ECONOMY
Howard County’s ideal geographic location is a major factor in the substantial economic growth acrossa wide variety of industry sectors. According to the Maryland Department of Labor Licensing andRegulation, over 10,161 businesses in Howard County employ 170,949 workers in industries such asinformation technology, telecommunications, biotechnology, research and development, wholesaledistribution, manufacturing, agriculture and in multinational corporations. The service sector is thelargest industry in the County, employing 88% of the workforce. In the service industry, governmentcontracts support cybersecurity and information technology programs and will continue to do so withthe growth projected at Fort George Meade, which is less than two miles outside the County border.Although BRAC (Base Realignment and Closure) officially ended in 2011, projections indicate thatthe on-base workforce could grow to a total of 64,000 by 2020.
Howard County Government, Calvin Ball County Executive www.howardcountymd.gov
vi Letter of Transmittal

Commercial real estate vacancy rates continue to decline and the average remains below 7% for flex,retail, industrial, and office space as reported by Costar. The year-to-date average vacancy rate for 2019is 5.1%. FY 2019 property tax revenues increased 3.8% above the previous fiscal year. In its FY 2020budget, Howard County projects a modest increase in property tax revenues. One-third of property inthe County is assessed each year, with increases in assessed values phased in over 3 years. This triennialassessment of property, the phasing in of assessment increases, and the County’s 5% Homestead PropertyTax Credit rate help to stabilize the tax base and tax revenues.
Local income tax is the County’s other main revenue source. Income tax collection increased by 6.4%when compared to the actual for FY 2018, partially due to increased capital gains. The FY 2020projection for income tax collections represents a 2.5% increase from what was budgeted in FY 2019.
Recordation tax, a leading indicator of the health of the local real estate market, continues to fluctuate.FY 2019 revenue from recordation tax decreased 6.9% from the previous fiscal year. The FY 2020budget projects a 6.6% decrease in recordation tax collections compared to FY 2019. The decliningrecordation tax is attributed to fewer refinancings. The average days on market increased to 62 days.
YTD Median Sale Price YTD Number of Sales
Howard County, MarylandMedian Home Sale Price and Number of Home Sales Trend
As of December
450,000400,000350,000300,000250,000200,000150,000100,000
50,0000
5,0004,5004,0003,5003,0002,5002,0001,5001,0005000
2009 2010 2011 2012 2013 2014 2015 2016 2017 2018
Source: Metropolitan Regional Information Systems Inc.
As a result of continued focus on opportunities to reduce spending and increase efficiencies, the Countyhad a surplus at the end of FY 2019. Looking forward, overall economic performance is expected toimprove slightly in FY 2020. The adopted budget projects the FY 2020 gross assessable base of HowardCounty will increase by 3.9% from FY 2019. Due to decreasing Homestead Tax Credits, the net taxable
Howard County Government, Calvin Ball County Executive www.howardcountymd.gov
Letter of Transmittal vii

assessment will increase by approximately 5.2%. This is because the Homestead Tax Credit limitstaxable increases on homeowner occupied properties to 5% per year, and most residential propertieshave fully phased in the pre-2006 housing market increases. Approximately 13% of homeowneroccupied properties in Howard County received this credit in FY 2019.
MAJOR INITIATIVES
The County will continue the strong fiscal management policies which have led to AAA rating fromall three major credit rating agencies. Consultants presented findings of The Fiscal Impact of NewDevelopment in Howard County, Maryland Under Two Scenarios in July 2019. The analysis comparedthe projected short-term and long-term fiscal impact of growth and development in the County bothbefore and after the passage of Council Bill 1-2018, which amended the Adequate Public FacilitiesOrdinance. Under both scenarios, the revenues generated by the residential and non-residentialdevelopment are estimated to exceed the cost to provide County services. Construction continues onthe Howard County Circuit Courthouse, which will be the 1st on the East Coast to be delivered usinga Public Private Partnership (P3) model. Upon expected occupancy in June 2021, the County will payEdgemoor-StarAmerica Judicial Partners (ESJP) $78 million. The County will then make monthlypayments to ESJP to operate and maintain the Courthouse for the next 30 years to the high standardsestablished by the County. Howard County will focus on the following priority areas in the future:Ready and successful students; Safe and engaged communities; Clean and sustainable environment;Thriving and healthy residents; Reliable and accessible infrastructure; Strong and prosperous businessesand Innovative and efficient government.
LONG TERM FINANCIAL PLANNING
Rainy Day FundCounty voters approved an amendment to the County Charter to establish a budget stabilization account,also known as a Rainy Day Fund, to provide a financial safety net for the County effective December3, 1992. The amendment requires all surplus funds in the County be placed in this fund until it reaches7% of the prior year’s audited expenditures. The funds may be used if an emergency exists pursuant tothe County Charter, or if the County Executive determines that actual revenues will be substantiallybelow the revenues budgeted and reasonable expenditure reduction will not offset the anticipated loss.See Note 1Q in the Notes to Basic Financial Statements for a discussion of the status of the Rainy DayFund. The Rainy Day Fund’s balance is currently at the target level.
Capital Projects and Debt AdministrationThe County funds its capital programs based on the requirements of the General Plan and supportingmaster plans for schools, recreation and parks, human services, water and sewer, solid waste, libraries,fire stations and public facilities.
The County plans long and short-term debt issuance to finance its capital budget based on cash flowneeds, sources of revenue, capital construction periods, available financing instruments and marketconditions. The County finances its capital needs on a regular basis dictated by its capital spendingpattern. External financial specialists assist the County in developing a bond issuance strategy, preparing
Howard County Government, Calvin Ball County Executive www.howardcountymd.gov
viii Letter of Transmittal

bond documents, and marketing bonds to investors. Bonds issued by the County mature over a termthat does not exceed the economic life of the improvements that they finance.
The County consolidates general County improvements into Consolidated Public Improvement bondswith a term of up to 20 years and water and sewer improvements into Metropolitan District Bonds witha term of up to 30 years. Debt obligations are generally issued through a competitive sale. However,the County has the option to use a negotiated sale process when it will provide significant savings and/or if the terms of the offering are sufficiently complex that a competitive sale may not be financiallyprudent.
Spending Affordability Advisory CommitteeThe Spending Affordability Advisory Committee was established by Executive Order in 1987 to providerecommendations and projections for the upcoming budget year. Specifically, the Committee is chargedto review in detail the status and projections of revenues and expenditures for the County for the nextbudget year and subsequent five years; to evaluate future County revenue levels and consider the impactof economic indicators such as changes in residential personal income and assessable base growth; andto evaluate expenditure levels with consideration of County long-term obligations and the best way topay for them.
The Committee recommends revenue projections and the amount of new County debt authorizationfor the upcoming fiscal year. The Committee report includes the effect its recommendations will haveon future budgets. This Committee also assesses the County’s ability to repay bond debt and issues anannual report defining debt capacity of the County.
FINANCIAL POLICIES
The financial policies and management practices of Howard County were recognized by all three majorrating agencies with a continued Triple-A credit rating, the highest possible rating.
Debt Management PolicyThe County adopted an updated debt management policy on October 7, 2009 that establishes theprocesses employed to manage its debt. The policy sets the parameters for issuing debt and managingoutstanding debt. It provides guidance to decision makers regarding the timing and purposes for whichdebt may be issued, types and amounts of permissible debt, method of sale that may be used andstructural features that may be incorporated. By establishing a debt policy, the County has recognizedthe binding commitment to full and timely repayment of all debt. The policy ensures that the Countymaintains a sound debt position and that credit quality is protected.
Investment PolicyThe County’s investment policy provides for the safety and liquidity of public funds by minimizingcredit and market risk while maintaining a competitive yield on the investment portfolio. Investmentactivities are governed by State laws. Accordingly, the County invests in: certificates of deposit(Maryland State banks only); repurchase agreements; banker’s acceptances; commercial paper; U.S.Government and Federal agency obligations; Treasury and other government mutual funds; and theState of Maryland investment pool. Repurchase agreements and certificates of deposit are subject tothe County’s collateralization policy. The investment policy was updated and adopted by the County
Howard County Government, Calvin Ball County Executive www.howardcountymd.gov
Letter of Transmittal ix

Council on February 4, 2019. The Association of Public Treasurers of the United States and Canadapresented the County with the Association's Investment Policy Certificate of Excellence Award in June2019.
The investment policies for the two Howard County retirement plans establish asset allocation targets,investment manager selection, and investment performance guidelines.
AWARDS AND ACKNOWLEDGMENTS
The Government Finance Officers Association (GFOA) awarded a Certificate of Achievement forExcellence in Financial Reporting to Howard County, Maryland for its Comprehensive Annual FinancialReport (CAFR) for the fiscal year ended June 30, 2018. This was the 43rd consecutive year that theCounty received this prestigious award. In order to be awarded a Certificate of Achievement, the Countypublished an easily readable and efficiently organized CAFR. This report satisfied both GenerallyAccepted Accounting Principles (GAAP) and applicable legal requirements.
A Certificate of Achievement is valid for a period of one year only. We believe that our current CAFRcontinues to meet the Certificate of Achievement Program’s requirements and we are submitting it tothe GFOA to determine its eligibility for another certificate.
In addition, the County also received the GFOA’s Distinguished Budget Presentation Award for itsannual budget document dated July 1, 2018. This was the 25th consecutive year the County has receivedthis award. In order to qualify for the Distinguished Budget Presentation Award, the County’s budgetdocument was judged as proficient in several categories, including as a policy document, a financialplan, an operations guide and a communication device.
A very special thank you to the Department of Finance, for their efforts in preparing and publishingthis document. Credit also must be given to the County Executive and the County Council for theirunwavering support for maintaining the highest standards of professionalism in the management ofHoward County’s finances.
Respectfully submitted,
Janet R. Irvin, CPFO Director of Finance
Howard County Government, Calvin Ball County Executive www.howardcountymd.gov
x Letter of Transmittal

Certificate of the County Auditor xi

MLK celebration
In 2019, Howard County’s Martin Luther King, Jr. Holiday Commission honored the civil rights leader’sdream with a keynote address from the first county executive of color, an awards presentation to communityleaders, and countywide volunteer opportunities during a Day of Service.


Financial Section• Basic Financial Statements• Notes to Financial Statements• Combining and Individual Fund Statements and Schedules


Independent Auditor's Report 1

2 Independent Auditor's Report

Independent Auditor's Report 3


Management’s Discussion and Analysis
As management of Howard County, Maryland (the County), we offer readers of the County’s financialstatements this narrative overview and analysis of the financial activities of the County for the fiscal yearended June 30, 2019. We encourage readers to consider the information presented here in conjunction withadditional information furnished in our letter of transmittal (found on pages iii to x of this report). The discussionfocuses on the County’s primary government and, unless otherwise noted, does not include component unitsreported separately from the primary government.
Financial Highlights
• The assets and deferred outflows of resources of the County exceeded its liabilities and deferred inflowsof resources at the close of the most recent fiscal year by $612.0 million. That amount is net of a $850.9million unrestricted deficit. The unrestricted deficit occurs because the County issues debt to fundconstruction costs for the Public School System and the Community College, two of its componentunits, but does not own the corresponding assets. Debt outstanding for education projects is $474.5million and for college projects is $117.0 million. Public School System ownership of buildingstransfers to the County if the assets are no longer needed for educational purposes. The current netbook value of the Public School System’s buildings and improvements and construction in progressis $1.19 billion. Additionally, the unrestricted deficit is caused by the net pension liability of $152.7million and net OPEB liability of $376.3 million.
• The $41.4 million increase in the government’s total net position is primarily due to an increase of$57.5 million in total general revenues.
• The County’s property tax revenues increased this year by $24.0 million, or 3.8%, due to rising propertyvalues.
• Approximately 46.4% of the total governmental fund balance, $134.5 million, is available to meet theCounty’s current and future needs as mandated by the appropriate level of authority within the Countyand is properly designated as committed, assigned and unassigned. Available fund balance for theGeneral Fund is $128.3 million, or 11.6% of total General Fund expenditures.
• At the end of the fiscal year, the County’s governmental funds reported combined ending fund balancesof $289.7 million, a decrease of about $25.7 million in comparison with the prior year. Specifically,the fund balance of the General Fund decreased by $1.6 million primarily due to increases of $28.8million and $12.0 million in the County’s funding of educational and debt service expenditures,respectively, offset by an increase in revenue of $37.6 million.
• The reserve for the budget stabilization account balance is $74.0 million, an increase of $2.6 millionmillion or 6.7% of fiscal year 2019 General Fund expenditures. That balance meets the target set bythe County Charter (7% of fiscal year 2017 expenditures). We have reached that target and assigned$3.7 million for subsequent years’ budget stabilization. The County is committed to meeting thismandated target in future years.
• The County’s total long-term debt increased by $78.3 million, (4.5% during the current fiscal year).The major factors in this increase were the issuance of $133.6 million Consolidated Public Improvement(CPI) Project Bonds, $66.6 million in Metropolitan (Metro) District Project Bonds and $2.2 millionof capital leases. The County refunded $23.6 million in CPI bonds and $6.1 million in Metro bonds
Management's Discussion and Analysis 5

and retired $63.0 million, $11.5 million and $3.4 million of CPI, Metro, and Water Quality Bonds,respectively. The County also retired $497,000 of Special Facility Revenue bonds.
Overview of the Financial Statements
This discussion and analysis is intended to serve as an introduction to Howard County, Maryland’s basicfinancial statements that include: 1) government-wide financial statements, 2) fund financial statements, and3) notes to the financial statements. This report also contains other supplementary information in addition tothe basic financial statements themselves.
Government-wide financial statements. The government-wide financial statements provide readers with abroad overview of the County’s finances, in a manner similar to a private-sector business. The two government-wide statements are on a full accrual accounting basis, including the elimination and/or reclassification ofinternal activities.
The first government-wide statement is the Statement of Net Position. This is the Countywide statementpresenting information that includes all County assets and deferred outflows of resources and County liabilitiesand deferred inflows of resources, with the difference reported as net position. Over time, increases or decreasesin net position may serve as a useful indicator of whether the financial position of the County is improvingor deteriorating. Evaluations of the overall health of the County would extend to other non-financial factorssuch as diversification of the taxpayer base or the condition of County infrastructure in addition to the financialinformation provided in this report.
The second government-wide statement is the Statement of Activities, which presents information showinghow the government’s net position changed during the current fiscal year. All current-year revenues andexpenses are included regardless of when cash is received or disbursed. An important purpose of the Statementof Activities is to show the financial reliance of the County’s distinct activities or functions on revenuesprovided by the County’s taxpayers.
Both government-wide financial statements distinguish functions of the County that are principally supportedby taxes and intergovernmental revenues (governmental activities) from other functions that are intended torecover all or a significant portion of their costs through user fees and charges (business-type activities). Thegovernmental activities of the County include general government, public safety, public works (roads, trashcollection and disposal, planning and zoning, inspections and permits), legislative and judicial, education,community services (health, housing, aging, and consumer protection), recreation and parks, and capitalimprovements. The business-type activities of the County include the operations of water and sewer services,watershed restoration and protection services, broadband services, and a public golf course. Fiduciaryactivities, such as employee pension plans, are not included in the government-wide statements since theseassets are not available to fund County programs.
The government-wide financial statements include not only the County, the primary government, but also alegally separate school system, community college, library system, and housing commission for which theCounty is financially accountable. Financial information for these component units is reported separately fromthe financial information presented for the primary government itself.
The government-wide financial statements are located on pages 21-23 of this report.
Fund financial statements. A fund is an accountability unit used to maintain control over resources that havebeen segregated for specific activities or objectives. State and local governments use fund accounting to ensure
6 Management's Discussion and Analysis

and demonstrate compliance with finance-related legal requirements. All of the funds of the County can bedivided into three categories: governmental funds, proprietary funds, and fiduciary funds. Within the basicfinancial statements, fund financial statements focus on the County’s most significant funds rather than theCounty as a whole. Major funds are separately reported while all others are combined into a single, aggregatepresentation. Individual fund data for nonmajor funds is provided in the form of combining statements in thelatter section of this report.
Governmental funds are used to account for essentially the same functions reported as governmental activitiesin the government-wide financial statements. However, the focus is very different with fund statementsfocusing on near-term inflows and outflows of spendable resources, as well as on balances of spendableresources available at the end of the fiscal year. Such information may be useful in evaluating a government’snear-term financing requirements.
Since the government-wide focus includes the long-term view and the fund focus includes the short-termview, comparisons between these two perspectives may provide insight into the long-term impact of short-term financing decisions. Both the governmental fund balance sheet and the governmental fund statement ofrevenues, expenditures, and changes in fund balance provide a reconciliation to facilitate this comparisonbetween governmental funds and government-wide activities.
The County maintains sixteen individual governmental funds. Information is presented separately in thegovernmental fund balance sheet and in the governmental fund statements of revenues, expenditures, andchanges in fund balances for the general, agricultural land preservation, and general capital projects funds,all of which are major funds. Data from the other thirteen non-major governmental funds are combined intoa single, aggregated presentation. Individual fund data for each of these non-major governmental funds isprovided in the form of combining statements elsewhere in this report.
The County adopts an annual appropriated budget for its non-capital governmental funds. Budgetarycomparison statements are provided for the general and agricultural land preservation funds to demonstratecompliance with this budget. Budgetary statements for non-major special revenue and debt service funds areprovided in the combining section of this report.
The basic governmental fund financial statements are located on pages 24-29 of this report.
Proprietary funds are reported in the fund financial statements and generally report services for which theCounty charges customers a fee. The County maintains two different types of proprietary funds. Enterprisefunds are used to report the same functions presented as business-type activities in the government-widefinancial statements. The County uses enterprise funds to account for its water and sewer infrastructure andoperations, its watershed restoration and protection services, its broadband services, and for the operations ofits public golf course. Internal service funds are an accounting structure used to accumulate and allocate costsinternally among the County's various functions. The County uses internal service funds to account for itsfleet of vehicles, technology and communication systems, risk management self-insurance program, andemployee benefits self-insurance. Because the internal service funds’ services predominantly benefitgovernmental rather than business-type functions, they have been included within governmental activities inthe government-wide financial statements.
Proprietary funds provide both long- and short-term financial information consistent with the focus providedby the government-wide financial statements, only in more detail. The proprietary fund financial statementsprovide separate information for the water and sewer operations, which is a major fund of the County, andcombined fund information for the watershed restoration and protection services, broadband services, and
Management's Discussion and Analysis 7

golf course operations, which are all non-major funds of the County. Conversely, all internal service fundsare combined into a single, aggregate presentation in the proprietary fund financial statements. Individualfund data for the non-major enterprise funds and the internal service funds is provided in the form of combiningstatements elsewhere in this report.
The basic proprietary funds financial statements are located on pages 30-33 of this report.
Fiduciary funds are used to account for resources held for the benefit of parties outside the government.Fiduciary funds are not reflected in the government-wide financial statements because the resources of thosefunds are not available to support the County’s own programs. The accounting used for fiduciary funds ismuch like that used for proprietary funds.
The basic fiduciary funds financial statements are located on pages 34-35 of this report.
The component unit financial statements are located on pages 36-37 of this report.
Notes to basic financial statements. The notes provide additional information essential to a fullunderstanding of the data provided in the government-wide and fund financial statements. The Notes to BasicFinancial Statements are located immediately after the Basic Financial Statements on pages 41-99.
Other information. In addition to the basic financial statements and accompanying notes, this report alsopresents certain required supplementary information concerning management’s discussion and analysis andthe County’s progress in funding its obligation to provide pension and other post-employment benefits (OPEB)to its employees. Required supplementary information is located on pages 102-109 of this report.
The combining statements referred to earlier in connection with the general fund, non-major governmentalfunds, enterprise funds, internal service funds, and fiduciary funds are presented immediately following therequired supplementary information on pensions and are considered to be supplementary information.Combining and individual fund statements and schedules start on page 114 of this report.
Detailed capital asset schedules for governmental and proprietary funds are located on pages 162-166.Schedules providing additional long-term debt detail start on page 169. The Statistical Section begins onpage 175.
Government-Wide Financial Analysis
Over time, changes in net position serve as a useful indicator of a government’s financial position. HowardCounty’s assets and deferred outflows of resources exceeded liabilities and deferred inflows of resources by$612.0 million at the close of the most recent fiscal year.
The largest portion of the County’s net position reflects its investment in capital assets (e.g., land, buildings,machinery, and equipment) less any related debt used to acquire or construct those assets that is still outstanding.The County uses these capital assets to provide services to citizens; consequently, these assets are not availablefor future spending.
Although the County’s investment in its capital assets is reported net of related debt, it should be noted thatthe resources needed to repay this debt must be provided from other sources since the capital assets themselvescannot be used to liquidate these liabilities. It is important to note that although counties in the State of Marylandissue debt for the construction of schools, the school buildings are owned by each county’s Public School
8 Management's Discussion and Analysis

System. Ownership reverts to the County if the local board determines a building is no longer needed. TheCounty also funds projects for the Howard Community College and for intersection improvements to state-owned roads. As of June 30, 2019, debt outstanding for education projects is $474.5 million and for collegeprojects is $117.0 million. Therefore, while the County’s financial statements include this outstanding debt,they do not include the capital assets funded by the debt. The negative unrestricted governmental activities’net position of $997.5 million reflects the imbalance of liabilities without corresponding assets as well as thegovernmental activities’ portion of the County’s Net OPEB liability of $353.2 million and net pension liabilityof $150.7 million. An additional portion of the County’s net position ($164.1 million or 26.8%) represents resources subject toexternal restrictions on their usage.
Summary of Net Position
Governmental activities Business-type activities Total2019 2018 2019 2018 2019 2018
Current and other assets $ 574,494,784 570,256,100 261,977,435 254,410,191 836,472,219 824,666,291Capital assets 1,519,048,191 1,471,809,169 805,427,740 732,651,692 2,324,475,931 2,204,460,861
Total assets 2,093,542,975 2,042,065,269 1,067,405,175 987,061,883 3,160,948,150 3,029,127,152Deferred outflows ofresources 129,499,985 133,975,754 11,034,327 7,950,943 140,534,312 141,926,697
Total assets and deferredoutflows 2,223,042,960 2,176,041,023 1,078,439,502 995,012,826 3,301,482,462 3,171,053,849
Long-term liabilitiesoutstanding 2,041,573,904 1,970,434,368 401,129,274 347,366,753 2,442,703,178 2,317,801,121
Other liabilities 117,523,265 133,064,667 47,555,964 48,446,726 165,079,229 181,511,393Total liabilities 2,159,097,169 2,103,499,035 448,685,238 395,813,479 2,607,782,407 2,499,312,514
Deferred inflows ofresources 77,223,192 96,775,805 4,516,165 4,424,258 81,739,357 101,200,063
Total liabilities and deferredinflows 2,236,320,361 2,200,274,840 453,201,403 400,237,737 2,689,521,764 2,600,512,577
Net positionInvested in capital assets 841,929,843 826,399,982 456,887,408 419,010,628 1,298,817,251 1,245,410,610Restricted 142,249,607 153,326,501 21,823,966 24,709,724 164,073,573 178,036,225Unrestricted (997,456,851) (1,003,960,300) 146,526,725 151,054,737 (850,930,126) (852,905,563)
Total net position $ (13,277,401) (24,233,817) 625,238,099 594,775,089 611,960,698 570,541,272
At the end of the current fiscal year, the County is able to report positive balances in two of the three categoriesof net position for the government as a whole, as well as for its separate governmental activities. Business-type activities show positive balances in all three categories.
Management's Discussion and Analysis 9

Changes in Net Position
Governmental activities Business-type activities Total2019 2018 2019 2018 2019 2018
RevenuesProgram revenues
Charges for services $ 132,468,245 129,677,448 76,378,400 78,354,625 208,846,645 208,032,073Operating grants andcontributions 40,559,501 43,351,124 35,349,018 33,958,088 75,908,519 77,309,212Capital grants andcontributions 18,377,194 24,455,008 43,164,177 11,976,929 61,541,371 36,431,937
General revenuesProperty taxes 654,794,565 630,762,037 — — 654,794,565 630,762,037Local income taxes 496,679,385 466,935,173 — — 496,679,385 466,935,173Other taxes 69,739,135 77,122,059 — — 69,739,135 77,122,059Other 17,772,744 9,289,565 5,204,513 2,488,271 22,977,257 11,777,836
Total revenues 1,430,390,769 1,381,592,414 160,096,108 126,777,913 1,590,486,877 1,508,370,327
ExpensesGeneral government 65,241,233 58,020,097 — — 65,241,233 58,020,097Public safety 249,887,935 217,378,984 — — 249,887,935 217,378,984Public works 207,843,230 194,980,993 — — 207,843,230 194,980,993Recreation and parks 54,344,080 25,923,502 — — 54,344,080 25,923,502Legislative and judicial 30,139,996 27,484,681 — — 30,139,996 27,484,681Community services 50,250,870 47,215,901 — — 50,250,870 47,215,901State highways 9,286,446 4,934,098 — — 9,286,446 4,934,098Education 710,311,491 701,633,749 — — 710,311,491 701,633,749Interest on long-term debt 51,541,615 61,452,013 — — 51,541,615 61,452,013Water & Sewer — — 113,056,969 105,229,515 113,056,969 105,229,515Other — — 7,163,586 6,585,542 7,163,586 6,585,542
Total expenses 1,428,846,896 1,339,024,018 120,220,555 111,815,057 1,549,067,451 1,450,839,075
Increase (decrease) in netposition 1,543,873 42,568,396 39,875,553 14,962,856 41,419,426 57,531,252Transfers 9,412,543 9,151,633 (9,412,543) (9,151,633) — —Total Increase (decrease) innet position 10,956,416 51,720,029 30,463,010 5,811,223 41,419,426 57,531,252
Net position beginning (24,233,817) (198,072,383) 594,775,089 599,911,965 570,541,272 401,839,582Adjustment to restate netposition — 122,118,537 — (10,948,099) — 111,170,438
Net position ending $ (13,277,401) (24,233,817) 625,238,099 594,775,089 611,960,698 570,541,272
*FY18 amounts have been restated for GASB 75
Governmental activities. Governmental activities increased the County’s net position by $11.0 million.Key elements of this increase are as follows:
• Property tax revenues increased by $24.0 million due to rising property values.• Income tax revenues increased by $29.7 million due to the continued recovery of the job market.• Recordation tax revenues decreased by $1.6 million due to a decrease in property transfers and
refinancings.• Net OPEB liability increased by $31.7 million and and net pension liability decreased by $2.8 million.• Education expenses increased by $8.7 million; $1.3 million for the Public School System, $5.5 million
for the Community College, and $1.8 million for the Library.
10 Management's Discussion and Analysis

Expenses and Program Revenues - Governmental Activities
Expenses Revenues
$800,000
$700,000
$600,000
$500,000
$400,000
$300,000
$200,000
$100,000
$0
(Tho
usan
ds)
Gen
eral
Gov
ernm
ent
Publ
icSa
fety
Publ
icW
orks
Rec
reat
ion
&Pa
rks
Legi
slat
ive
&Ju
dici
al
Com
mun
itySe
rvic
es
Educ
atio
n
Inte
rest
-long
term
debt
Management's Discussion and Analysis 11

Revenues by Source - Governmental Activities
Property taxes 46%
Other local taxes 40%
Charges for services 9%
Operating grants and contributions 3%
Capital grants and contributions 1%Other 1%
Business-type activities. Business-type activities increased the County’s net position by $30.5 million. Thecomponents of this increase are as follows:
• Charges for services decreased by $2.0 million due to a decrease in water and sewer consumption.• Operating grants and contributions, which totaled $35.3 million, represent an annual ad valorem fee
levied on all properties within the water and sewer service district. This charge is used primarily tofund debt service payments and pay-as-you-go funding on capital projects.
• $43.2 million was received in capital contributions. This revenue includes the value of water and sewerlines constructed by developers and donated at no cost to the County. The County pays for additionalwater and sewer lines built by developers through a rebate process. Capital contributions also includefront foot revenues assessed to properties connected to the water and sewer system. These front footrevenues fund the debt issued to pay developer rebates. Effective July 1, 2004, the County has notentered into any new rebate contracts. Developers pay for those improvements and are still requiredto donate the assets to the County. Overall, capital grants and contributions increased by $31.2 millionfrom fiscal year 2018.
Business-type activities are shown comparing costs to revenues generated by related services. Both water andsewer and other activities, consisting of Golf Course, Broadband Services, and Watershed Protection andRestoration, are self-supporting.
12 Management's Discussion and Analysis

Expenses and Program Revenues - Business-type activities
Expenses
Revenues
$120,000
$100,000
$80,000
$60,000
$40,000
$20,000
$0
(Tho
usan
ds)
Water & Sewer Other
Revenues by Source - Business-type Activities
Charges forServices48%
Operating grants andcontributions
22%
Capital grants andcontributions
27%
Other3%
Management's Discussion and Analysis 13

Financial Analysis of the County’s Funds
As noted earlier, the County uses fund accounting to ensure and demonstrate compliance with finance-relatedlegal requirements.
Governmental funds. The focus of Howard County’s governmental funds is to provide information on near-term inflows, outflows, and balances of spendable resources. Such information is useful in assessing theCounty’s financing requirements. In particular, unreserved fund balances may serve as a useful measure of agovernment’s net resources available for spending at the end of the fiscal year.
As of the end of the current fiscal year, the County’s governmental funds reported combined ending fundbalances of $289.7 million, a decrease of $25.7 million in comparison with the prior year. Of this fund balance,$12.9 million is nonspendable, $142.2 million is restricted by enabling legislation, $128.4 million is committedby the County, at the highest level of authority, $98.4 million is assigned by management, and $92.3 millionis a deficit unassigned fund balance.
The general fund is the chief operating fund of the County. At fiscal year-end, the total General Fund fundbalance was $140.6 million, $1.6 million or 1.2% less than the prior year primarily due to an increase of theCounty's funding of educational and debt service expenditures.
The $58.9 million total fund balance of the Agricultural Land Preservation Fund is a $0.1 million increasefrom the prior year. The increase is the result of a decrease in debt service expenditures.
The general capital projects fund is used to track the construction of general county buildings, as well asschools, libraries, and other buildings for the community college. The fund balance is a $33.4 million deficit.This is a timing issue due to capital project expenditures occurring before revenues from grants and bondsare recognized.
Proprietary funds. The County’s proprietary funds provide the same type of information found in thegovernment-wide financial statements, but in more detail.
All assets in the Water and Sewer Proprietary Fund, except those available to fund current liabilities, areconsidered restricted because a change in the County charter is required to allow these assets to be used forother purposes. Net position of the water and sewer operations at fiscal year-end was $561.1 million. Netposition of the Water and Sewer Proprietary Fund increased $3.8 million due to the receipt of ad valorem feesand capital contributions.
General Fund Budgetary Highlights
The County spent $8.1 million less than the budget as the County departments exercised caution with spending.The County experienced a favorable variance of $2.3 million budget versus actual due to lower than anticipatedexpenditures within General Government. Public Safety showed a favorable variance of budget versus actualexpenditures of $2.5 million.
14 Management's Discussion and Analysis

Capital Assets and Debt Administration
Capital assets - The County’s investment in capital assets for its governmental and business-type activitiesas of June 30, 2019 is $2.3 billion (net of accumulated depreciation). Capital assets include land, easements,buildings, improvements, machinery and equipment, park facilities, sidewalks, roads, highways, bridges, waterand sewer lines, and stormwater management systems. The total increase in the County’s investment in capitalassets for the current fiscal year was 5.4% (a 3.2% increase for governmental activities and a 9.9% increasefor business-type activities).
Major capital asset events during the current fiscal year included the following:
• $17.2 Million for construction of US 29 Water Main• $8.3 Million for various stream/pond renovations including Maple Dell Farm Stream and Red
Cravat Pond• $7.6 Million for completion of Composting Facility Phase 2A• $5.3 Million for completion of Montevideo Rd Improvements Phase 1A• $4.3 Million for completion of Crescent Neighborhood Road Segment 1A• $4.2 Million for construction of Broken Land Parkway 30" Transmission Main• $2.4 Million for completion of Old Stockbridge Rd Culvert Replacement• $2.4 Million for completion of Mendenhall Interior Renovations Phase 2• $2.0 Million for construction of Little Patuxent Water Reclamation Plant Effluent Pumping Station
Capital Assets (net of depreciation)
Governmental activities Business-type activities Total2019 2018 2019 2018 2019 2018
Land and landimprovements $ 602,390,872 594,852,144 12,202,828 11,753,538 614,593,700 606,605,682Construction in progress 101,613,027 70,541,932 127,333,464 95,136,036 228,946,491 165,677,968Buildings and improvements 443,851,768 430,869,137 181,453,447 186,164,811 625,305,215 617,033,948Machinery and equipment 76,914,875 73,597,335 10,243,651 10,246,747 87,158,526 83,844,082Infrastructure 294,277,649 301,948,621 474,194,350 429,350,560 768,471,999 731,299,181
Total capital assets $ 1,519,048,191 1,471,809,169 805,427,740 732,651,692 2,324,475,931 2,204,460,861
Additional information on the County’s capital assets are located in Note 6 on pages 62-63 of this report.
Long-term debt. At the end of the current fiscal year, the County had total long-term debt outstanding of$1.8 billion. Of this amount, $1.7 billion comprises debt backed by the full faith and credit of the government.The remainder of the County’s debt represents bonds secured solely by specific revenue sources (i.e., revenuebonds).
Management's Discussion and Analysis 15

Outstanding DebtGovernmental activities Business-type activities Total2019 2018 2019 2018 2019 2018
General obligation bonds $ 1,246,382,174 1,203,277,708 351,004,168 304,153,642 1,597,386,342 1,507,431,350State water quality loan — 14,572,847 17,956,260 14,572,847 17,956,260Tax increment financing bonds 65,100,000 65,165,000 — — 65,100,000 65,165,000Agricultural land preservationprogram 93,483,238 97,715,767 — — 93,483,238 97,715,767Special facility revenue bonds — — 2,217,000 2,714,000 2,217,000 2,714,000Other 31,603,394 35,011,551 874,412 922,923 32,477,806 35,934,474
Total outstanding debt $ 1,436,568,806 1,401,170,026 368,668,427 325,746,825 1,805,237,233 1,726,916,851
The County’s total long-term debt increased by $78.3 million, (4.5% during the current fiscal year). The majorfactors in this increase were the issuance of $133.6 million Consolidated Public Improvement (CPI) ProjectBonds, and $66.6 million in Metropolitan (Metro) District Project Bonds. The County refunded $23.6 millionin CPI bonds and $6.1 million in Metro bonds and retired $63.0 million, $11.5 million and $3.4 million ofCPI, Metro, and Water Quality Bonds, respectively. The County also retired $497,000 of Special FacilityRevenue bonds. The County maintains an “AAA” rating from both Standard & Poor’s and Fitch Ratings, andan “Aaa” rating from Moody’s Investors Service for general obligation debt.
Local statutes limit the amount of general obligation debt a governmental entity may issue to 4.8% of its totalassessed valuation. The current debt limitation for the County is $2.6 billion, which is significantly more thanthe County’s outstanding general obligation debt at fiscal year-end.
Additional information on the County’s long-term debt is located in Note 7 starting on page 64 of this report.
Economic Factors and Next Year’s Budgets and Rates
Howard County has a relatively low unemployment rate as evidenced by the following:
• The June 2019 unemployment rate for the County was 3.1%. This compares favorably to the state’sunemployment rate of 3.9% and the national rate of 3.7% for the same period.
• The occupancy rate for commercial space as of June 2019 was 94.9% which is the same as a year ago.Howard County had an increase of 1,084,843 total rentable building area (RBA) during this fiscalyear.
• Inflationary trends in the region compare favorably to national indices.
All of these factors were considered in preparing the County’s budget for the 2020 fiscal year.
The fiscal year 2020 general fund budget is $22.6 million or 2% more than the fiscal year 2019 budget. Thisincrease is primarily the result of an $8.9 million increase in funding of education, a $4.1 million increasefor public safety, and a $3.1 million increase for public works.
The County’s property tax and income tax rates remained the same for fiscal year 2020. There were also nochanges to the Building Excise Tax (used to fund road expansion), Water and Sewer charges, recycling feesor the water and sewer ad valorem. The annual refuse fee was increased by $100 per year for residentialproperty and the Fire and Rescue tax increased by 6 cents per $100 assessed value.
16 Management's Discussion and Analysis

Currently Known Facts, Decisions and Conditions
The County is anticipating a modest surplus in fiscal year 2020 based on year-to-date performance. All othermajor revenue sources are on budget for fiscal year 2020.
Requests for Information
This financial report is designed to provide a general overview of Howard County’s finances for all those withan interest in the government’s finances. Questions concerning any of the information provided in this reportor requests for additional financial information can be addressed to the:
Department of Finance3430 Court House DriveEllicott City, Maryland 21043(410) [email protected].
Complete financial reports are also available on our website: www.howardcountymd.gov.
Management's Discussion and Analysis 17

50th Anniversary of the County Charter
In January of 2019, Former County Executives Ken Ulman, James Robey and Ed Cochran joined with CountyExecutive Calvin Ball to mark the 50th anniversary of Charter Government and shared their reflections andadvice.

Basic Financial Statements
Government-wide financial statements combine all ofHoward County’s governmental and business-typeactivities, as well as its discretely presented componentunits.
Fund financial statements show the financial positionand the operating results by fund.


Howard County, MarylandStatement of Net Position
June 30, 2019Primary Government
Governmental Business-type ComponentActivities Activities Total Units
ASSETSEquity in pooled cash $ 287,339,777 58,175,522 345,515,299 62,784,448Cash and securities with fiscal agents 20,410,337 — 20,410,337 —Investments 42,810,778 — 42,810,778 85,609,970Receivables:
Property taxes, net 5,376,769 341,177 5,717,946 —Due from other governments 169,095,033 93,497 169,188,530 39,811,986Service billings — 11,917,268 11,917,268 —Due from component units 26,583,676 — 26,583,676 —Other 18,308,784 674,241 18,983,025 3,008,999
Materials and supplies 2,760,221 1,293,239 4,053,460 1,313,579Prepaids 17,882 — 17,882 2,089,697Restricted assets:
Cash and cash equivalent and equity in pooled cash — 167,524,190 167,524,190 7,809,892Investments — — — 8,636,903Water and sewer assessments receivable — 3,561,977 3,561,977 —Other receivables — — — 6,573,992Internal balances (568,864) 568,864 — —Other non-current receivables 2,360,391 17,827,460 20,187,851 —
Capital Assets:Land and land improvements 602,390,872 12,202,828 614,593,700 117,860,689Construction in progress 101,613,027 127,333,464 228,946,491 51,835,597Buildings and improvements, net 443,851,768 181,453,447 625,305,215 1,593,081,998Machinery and equipment, net 76,914,875 10,243,651 87,158,526 11,804,896Infrastructure, net 294,277,649 474,194,350 768,471,999 —Other capital assets — — — 2,890,977Other non-current assets — — — 186,923Total assets 2,093,542,975 1,067,405,175 3,160,948,150 1,995,300,546
DEFERRED OUTFLOWS OF RESOURCESDeferred refunding amount 2,176,511 4,418,962 6,595,473 —Retirement plans 82,622,915 1,213,221 83,836,136 17,005,235Other post employment benefits 43,942,015 5,402,144 49,344,159 73,415,144Length of service award program 758,544 — 758,544 —Derivative instruments - interest rate swap — — — 624,012
Total deferred outflows of resources 129,499,985 11,034,327 140,534,312 91,044,391Total assets and deferred outflows of resources 2,223,042,960 1,078,439,502 3,301,482,462 2,086,344,937
LIABILITIESAccounts payable and other current liabilities 31,965,455 24,086,312 56,051,767 103,166,500Accrued interest payable 19,348,004 4,484,828 23,832,832 —Accrued wages and benefits 17,782,956 715,097 18,498,053 2,613,891Deposits 7,381,157 1,607,739 8,988,896 851,955Short-term loans and notes payable 29,798,579 15,677,570 45,476,149 —Due to primary government — — — 26,583,676Unearned revenues 11,247,114 984,418 12,231,532 10,954,342
(Continued)
Basic Financial Statements 21

The accompanying notes are an integral part of these financial statements.
Howard County, MarylandStatement of Net Position
June 30, 2019
Primary GovernmentGovernmental Business-type Component
Activities Activities Total Units
Noncurrent liabilities:Due within one year 105,227,935 17,365,827 122,593,762 8,581,429Due in more than one year, net 1,936,345,969 383,763,447 2,320,109,416 1,106,325,966
Total liabilities 2,159,097,169 448,685,238 2,607,782,407 1,259,077,759
DEFERRED INFLOWS OF RESOURCESRetirement plans 15,925,132 748,098 16,673,230 4,104,740Other post employment benefits 57,611,261 3,768,067 61,379,328 145,832,335Length of service award program 3,686,799 — 3,686,799 —
Total deferred inflows of resources 77,223,192 4,516,165 81,739,357 149,937,075Total liabilities and deferred inflows of resources 2,236,320,361 453,201,403 2,689,521,764 1,409,014,834
NET POSITIONNet investment in capital assets 841,929,843 456,887,408 1,298,817,251 1,507,176,298Restricted:
Business-type operations — — — 15,796,103Catalyst loan program 1,024,177 — 1,024,177 —Economic development initiatives 741,484 — 741,484 —Fee in lieu 469,647 — 469,647 —Fire & rescue services 11,927,046 — 11,927,046 —Forest conservation 1,964,542 — 1,964,542 —Middle Patuxent environmental area program 44,511 — 44,511 —Open space 576,876 — 576,876 —Parkland watershed facilities 13,602,040 — 13,602,040 —Permanent public improvement 1,157,451 — 1,157,451 —Program revenue 568,509 — 568,509 —Public road facilities 61,223,169 — 61,223,169 —Public school facilities 20,944,530 — 20,944,530 12,987,811Speed enforcement 805,201 — 805,201 —Tax increment financing project 27,200,424 — 27,200,424 —Debt Services — 21,823,966 21,823,966 —
Unrestricted (997,456,851) 146,526,725 (850,930,126) (858,630,109)Total net position $ (13,277,401) 625,238,099 611,960,698 677,330,103
22 Basic Financial Statements

Howard County, MarylandStatement of Activities
For the Year Ended June 30, 2019Primary Government
Program Revenues Net (Expense) Revenue and Changes in Net PositionOperating Capital
Charges for Grants and Grants and Governmental Business-TypePrograms Expenses Services Contributions Contributions Activities Activities Total Component UnitsPrimary government:Governmental activities:
General government $ 65,241,233 48,266,394 10,666,705 168,700 (6,139,434) — (6,139,434) —Public safety 249,887,935 8,285,012 6,190,580 — (235,412,343) — (235,412,343) —Public works 207,843,230 49,166,390 16,826,813 9,476,991 (132,373,036) — (132,373,036) —Recreation and parks 54,344,080 20,905,820 652,004 255,730 (32,530,526) — (32,530,526) —Legislative and judicial 30,139,996 868,699 586,545 — (28,684,752) — (28,684,752) —Community services 50,250,870 4,975,930 5,636,854 — (39,638,086) — (39,638,086) —State highways 9,286,446 — — — (9,286,446) — (9,286,446) —Education 710,311,491 — — 8,475,773 (701,835,718) — (701,835,718) —Interest on long-term debt 51,541,615 — — — (51,541,615) — (51,541,615) —
Total governmental activities 1,428,846,896 132,468,245 40,559,501 18,377,194 (1,237,441,956) — (1,237,441,956) —
Business-type activities:Water and sewer 113,056,969 64,833,505 35,349,018 12,779,321 — (95,125) (95,125) —Other 7,163,586 11,544,895 — 30,384,856 — 34,766,165 34,766,165 —
Total business-type activities 120,220,555 76,378,400 35,349,018 43,164,177 — 34,671,040 34,671,040 —Total primary government 1,549,067,451 208,846,645 75,908,519 61,541,371 (1,237,441,956) 34,671,040 (1,202,770,916) —
Component units: Housing commission 49,078,184 21,860,202 763,968 11,180,962 — — — (15,273,052) Public school system 1,085,224,351 21,997,083 175,495,114 42,744,155 — — — (844,987,999) Library 25,850,569 817,278 — — — — — (25,033,291) Community college 121,417,907 36,666,657 516,596 21,990,363 — — — (62,244,291)
Total component units $ 1,281,571,011 81,341,220 176,775,678 75,915,480 — — — (947,538,633)
General revenues:Property taxes $ 654,794,565 — 654,794,565 —Local income taxes 496,679,385 — 496,679,385 —Transfer tax 31,367,019 — 31,367,019 —Recordation tax 21,142,956 — 21,142,956 —Building excise tax 7,328,571 — 7,328,571 —Hotel / motel tax 5,538,425 — 5,538,425 —Admission tax 3,361,722 — 3,361,722 —County development tax 314,891 — 314,891 —Mobile home tax 685,551 — 685,551 —Appropriations from primary government — — — 657,135,569Intergovernmental, unrestricted 1,673,415 — 1,673,415 265,944,561Unrestricted investment income 13,585,602 5,998,775 19,584,377 3,534,259Miscellaneous 2,513,727 (794,262) 1,719,465 23,835,463
Transfers 9,412,543 (9,412,543) — —Total general revenues 1,248,398,372 (4,208,030) 1,244,190,342 950,449,852
Change in net position 10,956,416 30,463,010 41,419,426 2,911,219Net position - beginning (24,233,817) 594,775,089 570,541,272 675,831,166
Adjustment to restate beginning net position — — — (1,412,282)Net position - beginning of year, as restated (24,233,817) 594,775,089 570,541,272 674,418,884Net position - ending $ (13,277,401) 625,238,099 611,960,698 677,330,103
The accompanying notes are an integral part of these financial statements.
Basic Financial Statements 23

24 Basic Financial Statements
Howard County, Maryland Balance Sheet
Governmental FundsJune 30, 2019
Agricultural GeneralLand Capital Other Total
General Preservation Projects Governmental GovernmentalFund Fund Fund Funds Funds
ASSETSEquity in pooled cash $ 93,323,456 15,262,349 — 125,943,374 234,529,179Cash with fiscal agent — — 14,667,797 5,742,540 20,410,337Investments — 42,810,778 — — 42,810,778Receivables:
Property taxes, net 4,518,964 — — 857,805 5,376,769Due from other governments 151,072,305 829,492 1,153,110 16,040,126 169,095,033Due from other funds 19,821,488 — — 22,862,545 42,684,033Due from component units 11,632,263 — 9,268,869 5,682,544 26,583,676Housing loans — — — 13,588,326 13,588,326Other 1,570,361 — — 838,023 2,408,384
Prepaid Items 8,104 — — 2,704 10,808Economic development loans — — — 351,633 351,633Materials and supplies 624,672 — — 668,338 1,293,010
Total assets 282,571,613 58,902,619 25,089,776 192,577,958 559,141,966
LIABILITIESDue to other funds — — 16,478,013 22,440,545 38,918,558Accounts payable / accrued liabilities 5,543,928 7,361 8,156,487 13,298,302 27,006,078Accrued wages and benefits 11,677,071 6,221 63,650 5,327,086 17,074,028Short-term loans and notes payable — — 23,259,381 6,539,198 29,798,579Deposits and connection fees 7,033,645 — — 256,072 7,289,717Unearned revenue 85,943 — 995,362 10,165,809 11,247,114
Total liabilities 24,340,587 13,582 48,952,893 58,027,012 131,334,074
DEFERRED INFLOWS OF RESOURCESUnavailable income taxes 112,047,048 — — — 112,047,048Unavailable property taxes 3,299,267 — — 711,410 4,010,677Unavailable fees 2,219,049 — — 7,167,322 9,386,371Unavailable grant revenues 57,745 — 9,583,906 3,004,592 12,646,243
Total deferred inflows 117,623,109 — 9,583,906 10,883,324 138,090,339Total liabilities and deferred inflows 141,963,696 13,582 58,536,799 68,910,336 269,424,413
FUND BALANCESNonspendable 12,265,039 — — 671,042 12,936,081Restricted — — 36,769,778 105,479,829 142,249,607Committed 73,958,202 1,162,093 — 53,312,092 128,432,387Assigned 35,997,183 57,726,944 — 4,660,775 98,384,902Unassigned 18,387,493 — (70,216,801) (40,456,116) (92,285,424)
Total fund balances (deficits) 140,607,917 58,889,037 (33,447,023) 123,667,622 289,717,553Total liabilities, deferred inflows and fund
balances $ 282,571,613 58,902,619 25,089,776 192,577,958 559,141,966
The accompanying notes are an integral part of these financial statements.

Howard County, Maryland Reconciliation of the Balance Sheet of Governmental Funds
to the Statement of Net PositionJune 30, 2019
Amounts reported for governmental activities in the statement of net position (page 22) are
different because:
Total fund balances - governmental funds (page 24) ................................................................................................. $ 289,717,553
Internal service funds are used by management to charge the costs of certain activities,
such as insurance and telecommunications, to individual funds. The assets and
liabilities of certain internal service funds are included in governmental activities
in the statement of net position. .............................................................................................................................. 60,380,107
Long-term liabilities, including bonds payable, are not due and payable in the current
period and therefore are not reported in the funds:
Bonds and notes payable $ (1,265,608,716)
Capital leases (21,216,421)
Deferred refunding gain/loss and premium (137,155,669)
Other noncurrent liabilities (9,132,931)
Accrued interest payable (19,348,003)
Compensated absences (25,454,432)
Landfill closure and post-closure (23,430,000) (1,501,346,172)
Capital assets used in governmental activities are not financial resources and therefore
are not reported in the funds. .................................................................................................................................. 1,473,344,886
The net pension, LOSAP and OPEB liabilities are not due and payable in the current period and related
deferred inflows and outflows are not an available resource and, therefore, are not reported in thefunds. .............................................................................................................................................................................
(475,707,226)
Other long-term assets are not available to pay for current-period expenditures and,
therefore, are reported as deferred inflows in the funds. ..................................................................................... 140,333,451
Net position of governmental activities (page 22) ..................................................................................................... $ (13,277,401)
The accompanying notes are an integral part of these financial statements.
Basic Financial Statements 25

Howard County, MarylandStatement of Revenues, Expenditures and Changes in Fund Balances
Governmental FundsFor the Year Ended June 30, 2019
Agricultural GeneralLand Capital Other Total
General Preservation Projects Governmental GovernmentalFund Fund Fund Funds Funds
REVENUESProperty taxes $ 552,123,621 — — 102,102,956 654,226,577Other local taxes 494,141,081 8,156,646 7,841,755 23,012,081 533,151,563State shared taxes 1,673,415 — — — 1,673,415Revenues from other governments 9,666,904 — 10,774,536 23,049,357 43,490,797Charges for services 13,775,589 — — 45,762,142 59,537,731Investment income:
Interest on investments 5,427,798 3,002,004 491,736 4,645,767 13,567,305Decrease in fair value of investments — (496,321) — — (496,321)Installment interest from housing loans — — — 60,540 60,540
Licenses and permits 6,641,437 — — — 6,641,437Fines and forfeitures 3,018,280 — — 1,053,027 4,071,307Developer fees — — — 852,987 852,987Payments from component units 1,546,337 — — — 1,546,337Miscellaneous program revenues 2,139,487 6,000 6,778,364 7,956,241 16,880,092
Total revenues 1,090,153,949 10,668,329 25,886,391 208,495,098 1,335,203,767
EXPENDITURESCurrent:
General government 46,348,699 — 10,363,285 3,917,786 60,629,770Legislative & judicial 27,881,384 — — 639,007 28,520,391Public works 74,745,429 1,013,484 2,984,222 34,693,526 113,436,661Public safety 129,734,600 — — 106,217,400 235,952,000Recreation and parks 22,773,852 — — 20,397,611 43,171,463Community services 37,380,452 — — 10,011,335 47,391,787Education 655,977,569 — 51,268,431 — 707,246,000Capital improvements — — 76,358,310 64,102,437 140,460,747
Debt service:Principal 65,121,048 4,232,529 — 374,920 69,728,497Interest 46,853,007 5,077,092 2,102,219 3,023,665 57,055,983
Total expenditures 1,106,816,040 10,323,105 143,076,467 243,377,687 1,503,593,299Excess (deficiency) of revenues over expenditures (16,662,091) 345,224 (117,190,076) (34,882,589) (168,389,532)
OTHER FINANCING SOURCES (USES)Bond premium — — 10,165,667 2,054,325 12,219,992Capital lease — — — 2,223,000 2,223,000Capital-related issuance of debt 793,086 — 88,394,770 19,522,621 108,710,477Refunding bonds issued — — 20,272,862 2,312,138 22,585,000Payment to bond refunding escrow agent — — (21,617,153) (2,407,405) (24,024,558)Transfers in 26,946,081 — 13,203,236 24,657,113 64,806,430Transfers out (12,713,690) (203,633) (10,741,677) (20,201,518) (43,860,518)
Total other financing sources (uses) 15,025,477 (203,633) 99,677,705 28,160,274 142,659,823
Net change in fund balances (1,636,614) 141,591 (17,512,371) (6,722,315) (25,729,709)Fund balances (deficit) - beginning 142,244,531 58,747,446 (15,934,652) 130,389,937 315,447,262Fund balances (deficit) - ending $ 140,607,917 58,889,037 (33,447,023) 123,667,622 289,717,553
The accompanying notes are an integral part of these financial statements.
26 Basic Financial Statements

Howard County, MarylandReconciliation of the Statement of Revenues, Expenditures and
Changes in Fund Balances of Governmental Funds to the Statement of ActivitiesFor the Year Ended June 30, 2019
Amounts reported for governmental activities in the statement of activities (page 23) aredifferent because:
Net change in fund balances - total governmental funds (page 26) ............................................................ $ (25,729,709)
Governmental funds report capital outlays as expenditures. However, in the statement ofactivities the cost of those assets is allocated over their estimated useful lives andreported as depreciation expense. The details of the amount by which capital outlays exceeddepreciation in the current period is as follows:
Capital outlays $ 109,726,546Less: Depreciation expense ......................................................................................................................... (46,826,274) 62,900,272
In the statement of activities, only the gain on the sale of land and buildings is reported,whereas in the governmental funds, the proceeds from the sales increase financial resources.Thus, the change in net position differs from the change in fund balance by the cost ofthe land and buildings sold. ............................................................................................................................ (3,097,920)
Donations of capital assets increase net position in the statement of activities, but do notappear in the governmental funds because they are not financial resources. ............................................ 11,600,114
Revenues to governmental funds that relate to prior periods are not reported in the statementof activities. Similarly, revenues in the statement of activities that do not provide currentfinancial resources are not reported as revenues in the fund. The details are as follows:
Revenues related to prior periods (96,672,185)Revenues that do not provide current financial resources ....................................................................... 138,090,339 41,418,154
Long-term debt proceeds (i.e., bonds, leases, installment purchase agreements) provide current financialresources to governmental funds, while the repayment of the principal of the long-term debt consumesthe current financial resources of governmental funds. Neither transaction has any effect on net position. Also, governmental funds report the effect of premiums, discounts and similaritems when debt is first issued, whereas these amounts are deferred and amortized in the statement (40,689,097)of activities. .......................................................................................................................................................
In the statement of activities, some expenses do not require the use of current financial resources andtherefore are not reported as expenditures in governmental funds. ........................................................... (31,600,473)
Internal service funds are used by management to charge the costs of certain activities,such as insurance and telecommunications, to individual funds. The new revenue (expense)of certain internal service funds is reported with governmental activities. ................................................ (3,844,925)
Change in net position of governmental activities (page 23) ............................................................................ $ 10,956,416
The accompanying notes are an integral part of these financial statements.
Basic Financial Statements 27

Howard County, MarylandStatement of Revenues, Expenditures, and Changes in Fund Balances - Budgetary Basis
General FundFor the Year Ended June 30, 2019
Budget Amounts Variance withREVENUES Original Final Actual Final Budget
Property taxes $ 550,177,993 550,177,993 552,098,523 1,920,530Other local taxes 486,547,544 486,547,544 494,141,082 7,593,538State shared taxes 1,620,478 1,620,478 1,673,415 52,937Revenues from other governments 8,370,696 8,370,696 9,666,906 1,296,210Charges for services 14,794,584 14,794,584 13,775,591 (1,018,993)Interest on investments 2,020,000 2,020,000 7,262,415 5,242,415Licenses and permits 7,177,314 7,177,314 6,662,734 (514,580)Recoveries for inter-fund services 16,903,716 16,703,716 16,520,981 (182,735)Fines and forfeitures 3,108,514 3,108,514 3,018,279 (90,235)Component units return of funding 2,861,374 2,861,374 1,546,337 (1,315,037)Miscellaneous 16,596,833 1,951,761 2,293,758 341,997
Total revenues 1,110,179,046 1,095,333,974 1,108,660,021 13,326,047
EXPENDITURESCurrent:
General government 48,927,267 49,782,345 47,482,351 2,299,994Legislative & judicial 28,869,795 28,869,795 27,944,728 925,067Public works 82,689,684 83,854,037 83,091,822 762,215Public safety 138,183,479 138,183,479 135,696,195 2,487,284Recreation and parks 24,550,738 24,550,738 24,547,220 3,518Community services 37,842,319 26,380,821 25,709,591 671,230Education 655,977,569 655,977,569 655,977,569 —Health Department 13,211,498 12,920,789 11,930,892 989,897
Debt service:Principal 65,386,547 65,121,056 65,121,048 8Interest 46,837,027 46,853,005 46,853,007 (2)
Total expenditures 1,142,475,923 1,132,493,634 1,124,354,423 8,139,211Excess (deficiency) of revenues over expenditures (32,296,877) (37,159,660) (15,694,402) (21,465,258)
OTHER FINANCING SOURCES (USES)Appropriation from fund balance 24,132,758 24,132,758 1,128,017 (23,004,741)Capital related debt issued — — 793,086 793,086Transfers in 19,507,515 34,061,878 33,918,275 (143,603)Transfers out (11,343,396) (21,034,976) (20,144,976) 890,000
Total other financing sources (uses) 32,296,877 37,159,660 15,694,402 (21,465,258)
Net change in fund balance — — — —Plus prior year encumbrances lapsed 2,510,564Less appropriation from fund balance (1,128,017)
Fund balances - beginning 126,430,852Fund balances - ending $ 127,813,399
Health Department's fund balance is combined with the General Fund for the budgetary basis statement only.
The accompanying notes are an integral part of these financial statements.
28 Basic Financial Statements

Howard County, MarylandStatement of Revenues, Expenditures and Changes in Fund Balance - Budgetary Basis
Agricultural Land Preservation FundFor the Year Ended June 30, 2019
Budget Amounts Variance withOriginal Final Actual Final Budget
REVENUESLocal taxes $ 7,150,000 7,150,000 8,156,646 1,006,646Investment income 1,500,000 1,500,000 2,502,050 1,002,050Miscellaneous 5,000 5,000 6,000 1,000
Total revenues 8,655,000 8,655,000 10,664,696 2,009,696
EXPENDITURESPublic works:
Agricultural land preservation program administration 858,369 859,669 855,414 4,255Agricultural land preservation board 1,300 — — —
Debt service:Principal 4,232,529 4,232,529 4,232,529 —Interest 5,077,092 5,077,092 5,077,092 —Total expenditures 10,169,290 10,169,290 10,165,035 4,255
Excess (deficiency) of revenues over expenditures (1,514,290) (1,514,290) 499,661 2,013,951
OTHER FINANCING SOURCESAppropriation from fund balance 1,714,290 1,714,290 — (1,714,290)Transfers out (200,000) (200,000) (200,000) —
Total other financing sources 1,514,290 1,514,290 (200,000) (1,714,290)
Net change in fund balance — — 299,661 299,661Fund balance - beginning 58,747,446Fund balance - ending $ 59,047,107
The accompanying notes are an integral part of these financial statements.
Basic Financial Statements 29

Howard County, MarylandStatement of Net Position
Proprietary FundsJune 30, 2019
Business-Type ActivitiesGovernmental
ActivitiesWater and Other Internal Services
Sewer Fund Enterprise Funds Total FundsASSETSCurrent assets:
Equity in pooled cash $ 40,176,845 17,998,677 58,175,522 52,810,598Receivables:
Property taxes 341,177 — 341,177 —Due from other governments 93,497 — 93,497 —Service billings 11,760,834 156,434 11,917,268 —Other receivables 674,241 — 674,241 2,077,717
Prepaid Expenses — — — 7,074Materials and supplies 1,293,239 — 1,293,239 1,467,211Restricted assets:
Equity in pooled cash and cash equivalents 166,964,190 560,000 167,524,190 —Water and sewer assessments 3,561,977 — 3,561,977 —
Total current assets 224,866,000 18,715,111 243,581,111 56,362,600
Noncurrent assets:Restricted assets:
Receivables:Water and sewer assessments 17,701,989 — 17,701,989 —Other receivables — 125,471 125,471 —
Capital assets:Land and land improvements 3,068,642 9,134,186 12,202,828 —Construction in progress 127,333,464 — 127,333,464 —Buildings and improvements, net 177,622,414 3,831,033 181,453,447 1,968,153Machinery and equipment, net 8,795,219 1,448,432 10,243,651 43,735,152Infrastructure, net 434,584,890 39,609,460 474,194,350 —
Total noncurrent assets 769,106,618 54,148,582 823,255,200 45,703,305Total assets 993,972,618 72,863,693 1,066,836,311 102,065,905
DEFERRED OUTFLOWS OF RESOURCESDeferred refunding amount 4,407,029 11,933 4,418,962 —Retirement plans 1,213,221 — 1,213,221 —Other post employment benefits 5,402,144 — 5,402,144 —
Total deferred outflows of resources 11,022,394 11,933 11,034,327 —Total assets and deferred outflows of resources 1,004,995,012 72,875,626 1,077,870,638 102,065,905
LIABILITIESCurrent liabilities:
Due to other funds — 3,765,475 3,765,475 —Accounts payable 23,839,978 246,334 24,086,312 4,959,377Accrued wages and benefits 639,493 75,604 715,097 708,928Compensated absences 19,804 — 19,804 12,733Short-term loans and notes payable 15,677,570 — 15,677,570 —Deposits and connection fees — — — 91,440Unpaid insurance claims — — — 7,518,251Current portion capital lease obligation — — — 1,643,192
Current liabilities 40,176,845 4,087,413 44,264,258 14,933,921
(Continued)
30 Basic Financial Statements

The accompanying notes are an integral part of these financial statements.
Howard County, MarylandStatement of Net Position
Proprietary FundsJune 30, 2019
Business-Type ActivitiesGovernmental
ActivitiesWater and Other Internal Services
Sewer Enterprise Funds Total Funds
Current liabilities payable from restricted assets:Deposits and connection fees 1,607,739 — 1,607,739 —Developer agreement rebates and deposits 49,000 — 49,000 —Other debt payable 3,457,397 — 3,457,397 —Bonds and note payable 13,085,000 608,400 13,693,400 —Loan payable — 146,226 146,226 —Interest payable 4,484,828 — 4,484,828 —
Current liabilities payable from restricted assets 22,683,964 754,626 23,438,590 —Total current liabilities 62,860,809 4,842,039 67,702,848 14,933,921
Noncurrent liabilities:Developer agreement rebates and deposits 825,412 — 825,412 —Net OPEB liability 23,102,908 — 23,102,908 —Net pension liability 2,037,339 — 2,037,339 —Compensated absences 796,429 74,960 871,389 976,158Unpaid insurance claims — — — 12,697,599Long-term capital lease obligation — — — 8,743,781Refunding revenue note payable — 1,707,000 1,707,000 —Metropolitan district bonds payable 337,682,647 — 337,682,647 —Long-term bonds payable — 5,007,644 5,007,644 —Loans payable — 1,413,658 1,413,658 —Unearned revenue 984,418 — 984,418 —Other long-term debt 11,115,450 — 11,115,450 —
Total noncurrent liabilities 376,544,603 8,203,262 384,747,865 22,417,538Total liabilities 439,405,412 13,045,301 452,450,713 37,351,459
DEFERRED INFLOWS OF RESOURCESRetirement plans 748,098 — 748,098 —OPEB 3,768,067 — 3,768,067 —
Total deferred inflows of resources 4,516,165 — 4,516,165 —Total liabilities and deferred inflows of resources 443,921,577 13,045,301 456,966,878 37,351,459
NET POSITIONNet investment in capital assets 411,735,292 45,152,116 456,887,408 35,316,332Restricted:
For debt service 21,263,966 560,000 21,823,966 —Unrestricted 128,074,177 14,118,209 142,192,386 29,398,114
Total net position 561,073,435 59,830,325 620,903,760 64,714,446
Adjustment to reflect consolidation of internal service fund activities related to enterprise funds 4,334,339Net position of business-type activities $ 625,238,099
Basic Financial Statements 31

Howard County, Maryland Statement of Revenues, Expenses and Changes in Net Position
Proprietary FundsFor the Year Ended June 30, 2019
Governmental Business-Type Activities Activities
Water and Other Internal ServiceSewer Enterprise Funds Total Funds
Operating revenues:User charges $ 60,910,861 11,217,442 72,128,303 114,066,093Insurance recoveries — — — 306,224Miscellaneous sales and services 2,004,526 327,453 2,331,979 1,947,398
Total operating revenues 62,915,387 11,544,895 74,460,282 116,319,715
Operating expenses:Salaries and employee benefits 13,651,019 1,545,551 15,196,570 14,353,343Contractual services 16,508,475 2,717,779 19,226,254 13,685,565Supplies and materials 3,323,452 358,470 3,681,922 3,714,971Business and travel 94,155 2,022 96,177 626,988Vehicle fuels and supplies 1,879,978 — 1,879,978 3,786,519Purchased water and transmission charges 30,403,169 — 30,403,169 —Sewage treatment charges 8,032,473 — 8,032,473 —Share of county administrative expenses 5,681,387 1,095,684 6,777,071 831,049Insurance claims 1,219,571 — 1,219,571 62,304,714Other administrative — 82,293 82,293 2,395,772Depreciation expense 23,014,627 1,136,282 24,150,909 8,880,414Less: house connection and capitalized overhead costs (9,000) — (9,000) —
Total operating expenses 103,799,306 6,938,081 110,737,387 110,579,335Operating income (loss) (40,883,919) 4,606,814 (36,277,105) 5,740,380
Nonoperating revenues (expenses):Ad valorem charges 35,349,018 — 35,349,018 —Water and sewer assessment charges 1,123,856 — 1,123,856 —Interest on investments 5,341,200 657,575 5,998,775 1,235,399Interest expense (9,038,792) (202,590) (9,241,382) (194,957)Gain (loss) on sale of capital assets (794,262) — (794,262) — Grant 1,298,667 — 1,298,667 —Revenue from other government — — — 34,944Other, net (31,609) (22,915) (54,524) —
Total nonoperating revenues (expenses) 33,248,078 432,070 33,680,148 1,075,386
Net income (loss) before contributions and transfers (7,635,841) 5,038,884 (2,596,957) 6,815,766Capital contributions 11,480,654 30,384,856 41,865,510 1,479,682Transfers in — 556,841 556,841 —Transfers out — (9,969,384) (9,969,384) (11,533,369)
Change in net position 3,844,813 26,011,197 29,856,010 (3,237,921)Net position - beginning of year, as restated 557,228,622 33,819,128 — 67,952,367Net position - ending 561,073,435 59,830,325 620,903,760 64,714,446
Adjustment to reflect the consolidation of internal service fund activities related to enterprise funds 607,000Change in net position of business - type activities $ 30,463,010
The accompanying notes are an integral part of these financial statements.
32 Basic Financial Statements

Howard County, Maryland Statement of Cash Flows
Proprietary FundsFor the Year Ended June 30, 2019
Governmental Business-Type Activities Activities
Water and Other InternalSewer Enterprise Funds Total Service Funds
CASH FLOWS FROM OPERATING ACTIVITIESCash received from customers $ 65,701,165 11,245,804 76,946,969 116,707,273Cash paid to suppliers (53,088,250) (2,875,500) (55,963,750) (73,112,497)Cash paid to / for employees (13,824,275) (1,503,266) (15,327,541) (15,051,619)Cash paid for inter-fund services used (6,434,111) (487,834) (6,921,945) (10,716,612)Other operating cash receipts 110,000 — 110,000 —Other operating disbursements — (480,630) (480,630) (515,474)
Net cash provided by (used for) operating activities (7,535,471) 5,898,574 (1,636,897) 17,311,071
CASH FLOWS FROM NONCAPITAL FINANCING ACTIVITIESInter-fund payable — 1,051,578 1,051,578 —Inter-fund operating transfers in (out) — (9,412,543) (9,412,543) (10,886,865)
Net cash (used for) noncapital financing activities — (8,360,965) (8,360,965) (10,886,865)
CASH FLOWS FROM CAPITAL AND RELATED FINANCING ACTIVITIESProceeds from sale of county bonds 58,697,746 2,563,999 61,261,745 —Cash receipts from assessments & connection charges 36,542,396 1,646,000 38,188,396 —Proceeds from grant 2,114,791 — 2,114,791 —Proceeds from capital lease — — — 9,716,783Acquisition and construction of capital assets (57,733,664) (49,900) (57,783,564) (10,025,088)Capital contribution 1,925,957 — 1,925,957 —Payment of long-term debt principal (21,008,413) (583,116) (21,591,529) (906,225)Interest paid on long-term debt (8,296,751) (146,413) (8,443,164) (216,157)
Net cash provided by (used for) capital and related financingactivities 12,242,062 3,430,570 15,672,632 (1,430,687)
CASH FLOWS FROM INVESTING ACTIVITIESInterest on investments 4,736,759 484,041 5,220,800 1,270,344
Net cash provided by investing activities 4,736,759 484,041 5,220,800 1,270,344
Net increase (decrease) in cash and cash equivalents 9,443,350 1,452,220 10,895,570 6,263,863Cash and cash equivalents -beginning of the year 197,697,685 17,106,457 214,804,142 46,546,735Cash and cash equivalents - end of the year 207,141,035 18,558,677 225,699,712 52,810,598
Reconciliation of operating (loss) income to net cash (used for) provided by operating activities
Operating (loss) income (40,883,919) 4,606,814 -36,277,105 5,740,380Adjustments to reconcile operating income (loss) to net cash provided by (used for) operating activities:
Depreciation expense 23,014,627 1,136,282 24,150,909 8,880,414Effect of changes in operating assets and liabilities:
Accounts and other receivables (1,160,815) 92,441 (1,068,374) 312,555 Prepaid expenses — — — (2,029) Inventories (271,429) — (271,429) (59,615) Accounts payable 6,520,179 18,597 6,538,776 790,532 Accrued wages and benefits — 5,526 5,526 (37,306) Compensated absences (37,360) 38,914 1,554 (34,085) Deposits and connection fees — — — 23,200 Unpaid insurance claims — — — 1,704,527 Unearned revenue — — (7,502)Increase in net OPEB obligation and net pension liability 5,283,246 — 5,283,246 —
Total adjustments 33,348,448 1,291,760 34,640,208 11,570,691Net cash provided by (used in) operating activities $ (7,535,471) 5,898,574 (1,636,897) 17,311,071
Noncash investing, capital, and financing activities: In Fiscal Year 2019, $9,554,697 was contributed to the Water and Sewer Enterprise Fund by various entities and developers for water and sewer lines and $1,925,957 was posted as cash receipt. In Fiscal Year 2019, $18,052 of capital assets were contributed to the Broadband Fund from the governmental Capital Projects Fund. In Fiscal Year 2019, $30,366,804 of capital assets were contributed to the Watershed Protection Fund from the General Fund.
The accompanying notes are an integral part of these financial statements.
Basic Financial Statements 33

Howard County, MarylandStatement of Fiduciary Net Position
Pension and Other Post Employment Benefits Trust Funds and Agency FundsJune 30, 2019
Pension and OPEB Trust Agency
Funds FundsASSETS
Equity in pooled cash and cash equivalents $ — $ 7,242,780Receivables:
Property tax — 534,227Interest and dividends 1,214,106 —Employer contributions 2,644,804 —Member contributions 752,143 —Sale of investments 186,253 —Other 15,246 3,845
Investments, at fair value:Cash 336,048 —Equities 462,432,977 —Alternative investments 270,113,695 —Mutual funds 154,445,416 —Money market funds 20,936,932 —Fixed income securities 307,599,448 —Real assets 37,911,182 —
Prepaid insurance 43,758 —Total assets 1,258,632,008 7,780,852
LIABILITIESAccounts payable 57,556 1,935,896Investments purchased 5,460,439 —Deposits 1,328,446 5,842,649Other — 2,307
Total liabilities $ 6,846,441 $ 7,780,852
NET POSITION
Net position restricted for pension and OPEB benefits $ 1,251,785,567
The accompanying notes are an integral part of these financial statements.
34 Basic Financial Statements

Howard County, MarylandStatement of Changes in Fiduciary Net Position
Pension and Other Post Employment Benefits Trust FundsFor the Year Ended June 30, 2019
ADDITIONSContributions:
Employer $ 80,256,200Member 12,502,973
Total contributions 92,759,173
Investment income:Net change in fair value of investments 50,434,717Interest 5,094,965Dividends 27,922,584Other 155,436Investment expense (3,328,359)
Net investment (loss) income 80,279,343Total additions 173,038,516
DEDUCTIONSBenefits 69,338,784Administrative expenses 1,000,746
Total deductions 70,339,530Change in net position 102,698,986
Net position - beginning 1,149,086,581
Net position - ending $ 1,251,785,567
The accompanying notes are an integral part of these financial statements.
Basic Financial Statements 35

Howard County, MarylandCombining Statement of Net Position
Component UnitsJune 30, 2019
Community Housing PublicCollege Commission Library School System Total
ASSETSCash and cash equivalents $ 43,127,521 $ 6,544,748 $ 2,006,015 $ 11,106,164 $ 62,784,448Investments 4,651,215 2,974,889 1,362,224 76,621,642 85,609,970Receivables:
Due from other governments 13,008,977 — — 26,803,009 39,811,986Other 403,474 628,797 69,699 1,907,029 3,008,999
Materials and supplies — — — 1,313,579 1,313,579Prepaid items 1,028,673 305,065 516,495 239,464 2,089,697Restricted assets:
Cash and cash equivalents — 7,749,528 60,364 — 7,809,892Investments 8,459,498 — 177,405 — 8,636,903Mortgage receivable — 6,573,992 — — 6,573,992
Capital Assets:Land and land improvements 620,547 82,779,404 — 34,460,738 117,860,689Construction in progress 27,306,647 16,562,559 — 7,966,391 51,835,597Buildings and improvements, net 247,418,807 159,131,523 — 1,186,531,668 1,593,081,998Machinery and equipment, net 3,937,328 — 213,681 7,653,887 11,804,896Other capital assets 364,196 139,307 2,387,474 — 2,890,977Other non-current assets 186,923 — — — 186,923Total assets 350,513,806 283,389,812 6,793,357 1,354,603,571 1,995,300,546
DEFERRED OUTFLOWSRetirement plans 779,251 235,166 — 15,990,818 17,005,235Other post employment benefits 2,348,125 221,556 2,212,831 68,632,632 73,415,144Derivative instruments - interest rate swap — 624,012 — — 624,012
Total deferred outflows 3,127,376 1,080,734 2,212,831 84,623,450 91,044,391Total assets and deferred outflows 353,641,182 284,470,546 9,006,188 1,439,227,021 2,086,344,937
LIABILITIESCurrent liabilities:
Accounts payable and other current liabilities 7,467,825 2,640,542 885,454 92,172,679 103,166,500Accrued salaries and benefits 1,755,860 — 858,031 — 2,613,891Deposits 63,345 788,610 — — 851,955Due to primary government 20,901,132 5,682,544 — — 26,583,676Unearned revenue 2,855,911 1,189,865 460,857 6,447,709 10,954,342
Long-term liabilities:Due within one year 2,496,599 2,030,128 — 4,054,702 8,581,429Due in more than one year, net 36,790,135 249,043,720 18,027,082 802,465,029 1,106,325,966
Total liabilities 72,330,807 261,375,409 20,231,424 905,140,119 1,259,077,759
DEFERRED INFLOWSRetirement plans 273,396 190,554 — 3,640,790 4,104,740Other post employment benefits 6,601,449 267,782 2,754,323 136,208,781 145,832,335
Total deferred inflows 6,874,845 458,336 2,754,323 139,849,571 149,937,075Total liabilities and deferred inflows 79,205,652 261,833,745 22,985,747 1,044,989,690 1,409,014,834
NET POSITIONNet investment in capital assets 265,841,551 4,718,173 2,601,155 1,234,015,419 1,507,176,298Restricted for:
Business-type operations 401,388 6,934,325 — 8,460,390 15,796,103Education 11,474,677 — — 1,275,365 12,750,042Restricted for deferred support — — 237,769 — 237,769
Unrestricted (3,282,086) 10,984,303 (16,818,483) (849,513,843) (858,630,109)Total net position $ 274,435,530 $ 22,636,801 $ (13,979,559) $ 394,237,331 $ 677,330,103
The accompanying notes are an integral part of these financial statements.
36 Basic Financial Statements

Howard County, MarylandStatement of Activities
Component UnitsFor the Year Ended June 30, 2019
Net (Expense) Revenue andProgram Revenues Changes in Net Position
OperatingCharges for Grants and Capital Community Housing Public School
Programs Expenses Services Contributions Contributions College Commission Library System Total
Component units:Community college $ 121,417,907 $ 36,666,657 $ 516,596 $ 21,990,363 $ (62,244,291) $ — $ — $ — $ (62,244,291)Housing commission* 49,078,184 21,860,202 763,968 11,180,962 — (15,273,052) — — (15,273,052)Library 25,850,569 817,278 — — — — (25,033,291) — (25,033,291)Public school system 1,085,224,351 21,997,083 175,495,114 42,744,155 — — — (844,987,999) (844,987,999)
Total component units $ 1,281,571,011 $ 81,341,220 $ 176,775,678 $ 75,915,480 (62,244,291) (15,273,052) (25,033,291) (844,987,999) (947,538,633)
General revenues:Appropriations from primary government 36,143,816 — 20,937,872 600,053,881 657,135,569Intergovernmental, unrestricted 39,799,165 — 3,652,024 222,493,372 265,944,561Investment income 1,567,400 321,314 33,540 1,612,005 3,534,259Miscellaneous — 10,935,907 — 12,899,556 23,835,463
Total general revenues 77,510,381 11,257,221 24,623,436 837,058,814 950,449,852 Change in net position 15,266,090 (4,015,831) (409,855) (7,929,185) 2,911,219
Net position as previously stated 259,169,440 28,064,914 (13,569,704) 402,166,516 675,831,166 Adjustment to restate beginning balance — (1,412,282) — — (1,412,282)Net position - beginning, as restated 259,169,440 26,652,632 (13,569,704) 402,166,516 674,418,884
Net position - end of year $ 274,435,530 $ 22,636,801 $ (13,979,559) $ 394,237,331 $ 677,330,103
*Financial statements for the Housing Commission are reported on a calendar year basis.
The accompanying notes are an integral part of these financial statements.
Basic Financial Statements 37

Farm Academy
Howard County supports the county’s agriculture economy through farm academies for the community,neighborhood farmer’s markets, the HoCo Fresh program for restaurants and the Agricultural LandPreservation Program.

Notes to Basic Financial Statements
The Notes are an integral part of the financial statements.


Notes to Basic Financial Statements IndexNOTE DESCRIPTION PAGE
1. Summary of Significant Accounting Policies 42A. The Reporting Entity 42
Discretely Presented Component Units 42B. Government-Wide and Fund Financial Statements 43C. Measurement Focus, Basis of Accounting and Financial Statement Presentation 43D. Budgetary Process 45E. Deposits and Investments 46
Cash Equivalents 46Investments 46
F. Loans Receivable 46G. Inventory 46H. Capital Assets 46I. Compensated Absences 46J. Self-Insurance 47K. Water and Sewer Assessments 47L. Deferred Outflows/Inflows of Resources 47M. Net Position Flow Assumptions 47N. Fund Balance Flow Assumptions 48O. Fund Balance 48P. Reconciliation Between GAAP and Budgetary Basis 49Q. Budget Stabilization Account 49R. Net Position Restricted by Enabling Legislation 50S. Fair Value Measurements 50T. Implementation of New Accounting Principles 50
2. Equity in Pooled Cash and Cash Equivalents and Investments 523. Receivables 614. Interfund Receivables, Payables and Transfers 615. Property Tax and Transfer Tax 626. Capital Assets 637. Long-Term Obligations 65
A. Primary Government 65B. Component Units 72
8. Short-Term Debt 729. Conduit Debt 7210. Lease Obligations 73
A. Operating Leases - Primary Government 73B. Capital Leases 73
11. Restricted Assets 7412. Fund Equity 7513. Landfill Closure and Post-Closure Care Cost 7714. Tax Abatement 7715. Retirement Plans 7916. Other Post-Employment Benefits 8617. Length of Service Award Program 9518. Deferred Compensation Plan 9719. Risk Management 9720. Individual Fund Disclosures, Change in Accounting Principle, and Prior Period Adjustments 9821. Commitments and Contingencies 99
A. Grants 99B. Construction 99C. Encumbrances 99D. Public Private Partnership 99
Notes to Basic Financial Statements 41

Notes to Basic Financial Statements
42 Notes to Basic Financial Statements
1. Summary of Significant Accounting Policies
A. The Reporting Entity
Howard County, Maryland (the County), was formed in 1851 under a commission form of government. Under home rulecharter since 1968, the County is governed by an elected County Executive and a five-member County Council serving separateexecutive and legislative functions.
The basic financial statements include Howard County, Maryland as the primary government and its significant componentunits, entities for which the County is considered to be financially accountable. The component units include the activitiesof the Howard County Public School System, the Library, the Community College, and the Housing Commission. TheVolunteer Fire Districts have not met the established criteria for inclusion in the reporting entity and, accordingly, are excludedfrom this report. The component units are included in the County’s reporting entity because of the significance of theiroperational or financial relationship with the County in that the County approves budgetary requests and provides a significantamount of funding.
Discretely Presented Component Units
The financial data of the County’s component units are discretely presented in a column separate from the financial data ofthe primary government. They are reported in a separate column to emphasize that they are legally separate from the County.The following are the County’s component units that are included in the reporting:
The Howard County Public School System is responsible for the operation of special education, elementary, middle andhigh schools. The Board of Education is comprised of five members elected by County voters. The County is responsiblefor levying taxes and has budgetary control over the Board.
The Howard County Library System operates various library branches throughout the County. The Library is governedby a seven-member board nominated by the County Executive and approved by the County Council. The County approvesthe Library’s annual budget and provides substantial funding to the Library.
The Howard Community College provides educational services to County citizens by offering two- year associate degreesand a continuing education program. The Community College is governed by a seven-member board appointed by thegovernor of Maryland. The County approves the College’s annual budget and provides substantial funding to the College.
The Howard County Housing Commission is a public corporation established by Maryland and Howard County law toact as builder, developer, owner, and manager of housing for eligible participants. The Commission is comprised ofseven commissioners appointed by the County Executive and approved by the County Council. The County providessubstantial funding to the Commission and approves its annual budget.
Financial information regarding the component units is included in the component units combining statements. Annualfinancial reports for individual component units can be obtained from their respective administrative offices:
Howard County Public School System Howard County Library System10910 Route 108 9411 Frederick RoadEllicott City, Maryland 21042 Ellicott City, MD 21042
Howard Community College Howard County Housing Commission10901 Little Patuxent Parkway 9770 Patuxent Woods Drive, Suite 100Columbia, Maryland 21044 Columbia, Maryland 21046

B. Government-Wide and Fund Financial Statements
The Statement of Net Position and Statement of Activities present financial information on all of the non-fiduciary activitiesof the primary government and its component units. Generally, the effect of interfund activity has been removed fromthese statements with the exception of interfund services provided and used. Government activities, which primarily aresupported by taxes and intergovernmental revenues, are reported separately from business-type activities, which rely toa significant extent on fees and charges for support. Likewise, the primary government is reported separately from certainlegally separate component units for which the primary government is financially accountable.
The Statement of Activities displays the extent to which direct expenses are offset by program revenues for each functionof governmental activities and for each segment of business-type activities. Direct expenses are those that can be attributedto a specific function or segment. Program revenues include 1) charges to customers or applicants who purchase, use,or directly benefit from goods, services, or privileges provided by a given function or segment, and 2) grants andcontributions that are restricted to meeting the operational or capital requirements of a particular function or segment.Taxes and other items not properly included among program revenues are reported instead as general revenues.
Separate financial statements are provided for governmental funds, proprietary funds, and fiduciary funds even thoughthe latter are excluded from the government-wide financial statements. Major individual governmental funds and majorindividual enterprise funds are reported as separate columns in the fund financial statements.
Notes to Basic Financial Statements 43
C. Measurement Focus, Basis of Accounting, and Financial Statement Presentation
The government-wide financial statements are reported using the economic resources measurement focus and the accrualbasis of accounting, as are the proprietary fund and pension trust fund financial statements. Agency funds do not have ameasurement focus and are reported using the accrual basis of accounting. Revenues are recognized when earned andexpenses are recorded when liabilities are incurred, regardless of the timing of related cash flows. Property taxes arerecognized as revenues in the year for which they are levied. Grants and similar items are recognized as revenue as soonas all eligibility requirements have been met.
Governmental fund financial statements are reported using the current financial resources measurement focus and themodified accrual basis of accounting. Revenues are recognized when they become both measurable and available.Revenues are considered to be available when they are collectible within the current period, or soon enough thereafterto pay liabilities of the current period. The County considers all revenues, with the exception of income tax revenue, tobe available if they are collected within sixty days after the end of the current fiscal period. Income tax revenue isconsidered to be available if it is collected within thirty days after the end of the current fiscal period. Expendituresgenerally are recorded when a liability is incurred, as under accrual accounting. However, principal and interest on long-term debt, as well as expenditures related to vacation, sick leave, claims, and judgments, are recorded only when paymentis due.
Property taxes, other local taxes, state shared taxes, fines and forfeitures, and interest associated with the current fiscalperiod are all considered to be susceptible to accrual and so have been recognized as revenues of the current fiscal period.Only the portion of special assessments receivable due within the current fiscal period is considered to be susceptible toaccrual as revenue of the current period. All other revenue items are considered to be measurable and available onlywhen cash is received by the County.
The County reports the following major governmental funds:
The General Fund is the County’s primary operating fund. It accounts for all financial resources of the generalgovernment, except those required to be accounted for in another fund. The Health Department Fund is includedfor reporting purposes.
The Agricultural Land Preservation Fund accounts for 25% of the local transfer tax and the County developmenttax which are dedicated to preserving the agricultural use of land through the purchase of development rights ofproperty owners.
The General Capital Projects Fund is used to account for the construction of general capital projects such as seniorcenters, community centers, and administrative buildings, in addition to public schools and buildings for theCommunity College.

The County reports the following major proprietary fund:
The Water and Sewer Fund accounts for the County’s water and sewer operations, construction or acquisition ofcapital assets, and related debt service costs. All assets, except those available to fund current liabilities, areconsidered restricted because a change in the charter is required to allow these assets to be used for other purposes.
The County reports the following fund types:
Special Revenues Funds are used to account for and report the proceeds of special revenue sources that are restrictedor committed to expenditures for specified purposes other than debt service or capital projects. This definitionestablishes that at least one restricted or committed revenue source must be the foundation of the special revenuefund. The following revenue sources are included in special revenue funds: local transfer tax, fire and rescue tax,forest conservation developer fees, residential trash collection and disposal fees, grants, registration fees forrecreational programs and fines for speed enforcement.
Capital Projects Funds are used to account for and report financial resources that are restricted, committed, orassigned to expenditure for capital outlays, including the acquisition or construction of capital facilities and othercapital assets, except those accounted for in the General Capital Projects Fund and proprietary fund types.
Debt Service Funds are used to account for the accumulation of resources that are restricted, committed, or assignedfor the payment of principal and interest on long-term obligations of governmental funds.
Enterprise Funds are used to account for the activities of the Special Recreation Facility Fund, Watershed Protectionand Restoration Fund and Broadband Fund. The Special Recreation Facility Fund accounts for the operations andrelated debt service costs of a public golf course, the Watershed Protection and Restoration Fund accounts for themaintenance, operations, and improvement of the local stormwater management system and the Broadband Fundaccounts for broadband services to private sector businesses as well as non-County government agencies andCounty departments and component units. All assets, except those available to fund current liabilities, are consideredrestricted because a change in the charter is required to allow these assets to be used for other purposes.
Internal Service Funds are funds used to account for goods and services furnished by one County department toanother County department on a cost reimbursement basis. Internal Service Funds account for centralized vehiclefleet services; technology and communication operation; risk management activities for workers’ compensation,general liability, environmental, vehicle and property insurance; and County employee health benefit costs.
Agency Funds are used to account for resources held in a custodial capacity on behalf of parties outside thegovernment, including money paid by residents for State property tax, bay restoration fees, surety bonds held onconstruction work, and multifarious funds donated to be used by the Law Library, the Revenue Authority and theDomestic Violence Center.
Pension Trust Funds are used to account for the activities of the County’s single-employer public employeeretirement plans. These include the Police and Fire Employees’ Retirement Plan and the General Employees’ Plan.The plans account for employee contributions, County contributions and the earnings and profits from investments.They also account for the disbursements made for employee retirements, withdrawals, disability, and death benefitsas well as administrative expenses. Annual Financial Reports for both pension trust funds can be obtained fromtheir administrative office at Howard County, Maryland, Director of Finance, 3430 Court House Drive, EllicottCity, Maryland, 21043 or from the website at www.howardcountymd.gov.
Other Post-Employment Benefits (OPEB) Trust Fund was established to account for the other post employmentbenefits of the County and its component units. The trust fund acts as a funding mechanism for employers’ costof retiree benefits.
Generally, the effect of interfund activity has been eliminated from the government-wide financial statements. Anexception to this general rule is charges between water and sewer operations and other County departments because theelimination of those charges would distort the direct costs and program revenues reported for the various functionsconcerned.
44 Notes to Basic Financial Statements

Amounts reported as program revenues include 1) charges to customers or applicants for goods, services, or privilegesprovided, 2) operating grants and contributions, and 3) capital grants and contributions, including special assessments.Internally dedicated resources are reported as general revenues rather than as program revenues. Likewise, generalrevenues include all taxes.
Proprietary funds distinguish operating revenues and expenses from non-operating items. Operating revenues andexpenses generally result from providing services and producing and delivering goods in connection with a proprietaryfund’s principal ongoing operations. The principal operating revenues of the Enterprise Funds and Internal Service Fundsare charges to customers for sales and services. Operating expenses for Enterprise Funds and Internal Service Fundsinclude the cost of services, administrative expenses, and depreciation on capital assets. All revenues and expenses notmeeting this definition are reported as non-operating revenues and expenses.
When both restricted and unrestricted resources are available for use, it is the County’s policy to use restricted resourcesfirst and then unrestricted resources as they are needed.
Notes to Basic Financial Statements 45
D. Budgetary Process
Pursuant to County Charter, the County Executive’s capital and operating portions of the budget for all County funds aresubmitted to the County Council by April 1 and 21, respectively. The County Council holds public hearings beforepassing the annual budget appropriation ordinance. If the County Council does not pass the budget ordinance, theExecutive’s proposed budget ordinance stands adopted. The adopted budget becomes effective July 1, and provides thespending authority at the individual department level for the operations of the County government with the unexpendedor unencumbered appropriation authority of the operating budget expiring the following June 30. Transfer ofappropriations between general classifications of expenditures in the current expense budget within the same office ordepartment and within the same fund may be authorized by the Executive. Transfers between offices, departments,institutions, boards, commissions or other agencies of the County government and within the same fund of the currentexpense budget may be made during the last quarter of the fiscal year and then only on the recommendation of theExecutive and with the approval of the Council. Capital unencumbered appropriations continue until the capital projectis closed.
During the fiscal year, the County Council, upon the request of the County Executive, may approve transfers betweenprojects in the capital budget but it may not increase the total size of the capital budget. The County Council, at any timeduring the fiscal year, may approve supplemental operating budget requests from the County Executive. The budgetedcontingency reserve, which may not exceed 4 percent of the appropriated budget, is the funding source for supplementalrequests. After April 1 of each year, the Council may also, at the request of the Executive, approve transfers betweendepartments in the operating budgets. The Council may approve supplemental budgets from un-appropriated funds onlyin emergencies affecting “life, health, and property.” Additionally, the County Executive has the authority to maketransfers within a department at any time during the year without approval of the County Council. During fiscal year2019, the Council approved one operating budget supplement and two capital budget transfers.
Budgetary data, as revised, is presented in the Basic Financial Statements for the General and Agricultural LandPreservation Funds. Outstanding encumbrances are included in the final budget as actual expenditure amounts in thosestatements because they remain in force and do not lapse until the end of the subsequent fiscal year. Lapsed appropriationsare reported as additions to fund balance on a budgetary basis.

E. Deposits and Investments
46 Notes to Basic Financial Statements
Cash Equivalents
The County considers all demand deposits and investments with a maturity of three months or less when purchased tobe cash and cash equivalents.
Investments
The County follows Governmental Accounting Standards Board (GASB) Statement 31, Accounting and FinancialReporting for Certain Investments and for External Investment Pools, which requires marketable securities to be carriedat fair value. The County has an internal investment pool that is available for use by all funds.
The investments of the Pension Trust Funds are reported at fair value or net asset value, as further described in note 2.The securities of the Pension Trust Funds traded on a national or international exchange are valued at the last reportedsales price at current exchange rates. Investments in the Governmental Funds represent stripped-coupon U.S. Treasurysecurities stated at fair value in the Agricultural Land Preservation Fund. They are also reported in aggregate as part ofU.S. Government Securities in the Equity in Pooled Cash and Cash Equivalents and Investments note.
Also, in accordance with investment policy, the Pension Trust Funds may invest in collateralized mortgage obligations(CMO) and putable bonds. These investments are reported as part of U.S. Government Agency notes in the Equity inPooled Cash and Cash Equivalents and Investments note disclosure.
F. Loans Receivable
For purposes of the fund financial statements, housing loans in the Community Renewal Fund are charged to the budgetupon funding, and the loans are recorded with an offset to a committed fund balance account. A receivable, “due fromcomponent units,” along with an offset to non-spendable fund balance, is recorded in the General Fund as the HowardCommunity College has an agreement to reimburse the County for bond issues related to construction costs of a parkingdeck and the Horowitz Visual and Performing Arts Center. For purposes of the government-wide financial statements,neither housing loans nor the receivable from the College are offset by restricted Net Position accounts.
G. Inventory
Materials and supplies are valued at cost, using the weighted average method. Materials and supplies are recorded asassets when purchased, and charged to expenditures/expenses when consumed. This is referred to as the consumptionmethod of inventory accounting. The County also has some materials and supplies that are expensed off directly whenpurchased, as they are consumable items purchased for the use within County, examples include office supplies, papertowels and cleaning materials.
H. Capital Assets
Capital assets include property, plant, equipment, and infrastructure assets (e.g., roads, bridges, sidewalks, and similaritems). The threshold for capital assets as defined by Howard County was raised to include assets with an initial, individualcost of $10,000 or greater and an estimated useful life in excess of one year. Such assets are recorded at historical or atestimated historical cost if actual historical cost is not available. Donated capital assets, donated works of art and similaritems, and capital assets received in a service concession arrangement should be reported at acquisition value at the datedonated.
Capital assets are depreciated using the straight-line method over the estimated useful lives (in years) as follows:Buildings 50 Computer Software 5Infrastructure 15-40 Vehicles 5-10Water and sewer lines 50-100 Furniture and equipment 5-20
The costs of normal maintenance and repairs that do not add to the value of the asset or materially extend asset lives arenot capitalized; they are charged to operations when incurred. Betterments and major improvements that significantlyincreases values, change capacities or extend useful lives are capitalized.

I. Compensated Absences
County employees are granted vacation, personal, and sick leave in varying amounts. In the event of termination, anemployee is reimbursed for accumulated vacation days. Classified employees are limited to an accrual of forty days andexecutive exempt employees are limited to an accrual of one hundred days. Employees who terminate employment arenot reimbursed for accumulated sick leave. Payments made to terminated employees for accumulated vacation leave arecharged as expenditures/expenses, primarily in the General Fund, Special Revenue Funds, and Proprietary Funds, whenpaid. Accumulated vacation benefits at year-end are recorded as obligations in the Statement of Net Position andProprietary Fund Statements.
Notes to Basic Financial Statements 47
J. Self-Insurance
The County establishes its funding of claims liabilities as they occur. This funding level includes provisions for indemnity,medical losses, and allocated loss adjustment expenses which are all classified as incremental claim adjustment expenses.Unpaid claims in the self-insurance funds include liabilities for unpaid claims based upon individual case estimates forclaims reported and claims incurred but not reported (IBNR) as of fiscal year-end.
K. Water and Sewer Assessments
Water and sewer assessments are charged to property owners on a 30-year basis to recover the debt service on bonds usedto construct main and lateral water and sewer lines which benefit such properties. A water and sewer assessments receivable(restricted assets) is established for the entire uncollected assessed amount. The portion of the receivable relating to bondprincipal is credited to Net Position and the portion representing interest is recognized as revenue when billed.
From 1980 to 2004, the receivable increased as the water and sewer system was being built. The receivable is nowdeclining and will continue to do so as debt is retired and there are minimal new assessments. The Water and Sewer advalorem charge (billed annually to all property within the Metropolitan District) is sufficient to fund the debt servicerelated to the cost of infrastructure.
L. Deferred Outflows/Inflows of Resources
In addition to assets, the statement of net position reports a separate section for deferred outflows of resources. Thisseparate financial statement element, deferred outflows of resources, represents a consumption of net position that appliesto a future period(s) and so will not be recognized as an outflow of resources (expense) until then. The government hasseveral items that qualify for reporting in this category. The first is the deferred refunding amount reported in thegovernment-wide statement of net position. A deferred charge on refunding results from the difference in the carryingvalue of refunded debt and its reacquisition price. The remaining line items are related to the pension, OPEB, and LengthOf Service Award Program (LOSAP) plans reported in the government-wide statement of net position and encompassthe following: changes in actuarial assumptions are amortized over the average expected remaining service life ofemployees, and the difference between expected and actual experience and the difference between projected and actualearnings on pension plan investments are amortized over five years. The final item is for pension, OPEB, and LOSAPcontributions made subsequent to the measurement date.
In addition to liabilities, the statement of net position reports a separate section for deferred inflows of resources. Thisseparate financial statement element, deferred inflows of resources, represents an acquisition of net position that appliesto future period(s) and so will not be recognized as an inflow of resources (revenue) until that time. The government hasseveral types of deferred inflows of resources that qualify for reporting in this category. In the government-wide statementof net position the government reports the following items related to the pension, OPEB, and LOSAP plans. Changes inactuarial assumptions and changes in actuarial experience study are amortized over the average expected remainingservice life of employees. Investment earnings greater than projected are amortized over five years.
Under the modified accrual basis of accounting, several deferred inflows of resources are reported as unavailable revenues.In the governmental balance sheet the government reports deferred inflows of resources from: income and property taxes,fees, grant revenues and prepaid taxes. These amounts are deferred and recognized as an inflow of resources in the periodthat the amounts become available.

M. Net Position Flow Assumptions
Sometimes the County will fund outlays for a particular purpose from both restricted (e.g., restricted bond or grantproceeds) and unrestricted resources. In order to calculate the amounts to report as restricted net position and unrestrictednet position in the government-wide and proprietary fund financial statements, a flow assumption must be made aboutthe order in which the resources are considered to be applied.
It is the County’s policy to consider restricted net position to have been depleted before unrestricted net position is applied.
48 Notes to Basic Financial Statements
N. Fund Balance Flow Assumptions
Sometimes the County will fund outlays for a particular purpose from both restricted and unrestricted resources (the totalof committed, assigned, and unassigned fund balance). In order to calculate the amounts to report as restricted, committed,assigned, and unassigned fund balance in the governmental fund financial statements, a flow assumption must be madeabout the order in which the resources are considered to be applied. It is the County’s policy to consider restricted fundbalance to have been depleted before using any of the components of unrestricted fund balance. Further, when thecomponents of unrestricted fund balance can be used for the same purpose, committed fund balance is depleted first,followed by assigned fund balance. Unassigned fund balance is applied last.
O. Fund Balance
In the fund financial statements, fund balance is classified based on the extent to which the County is bound to observeconstraints on the specific purposes for which the amounts can be spent. Fund balance is reported within one of the fivefund balance categories listed below:
Nonspendable – Includes fund balance amounts that cannot be spent because they are either (1) not in spendableform or (2) legally or contractually required to be maintained intact such as a permanent fund. Not in spendableform includes items that are not expected to be converted to cash, such as inventories and prepaid items.
Restricted – Includes fund balance amounts that are restricted to specific purposes when constraints are placed onthe use of resources by external parties, constitution provisions or enabling legislation. Enabling legislationauthorizes the County to assess, levy, charge or otherwise mandate payment of resources and includes a legallyenforceable requirement that those resources be used only for the specific purpose stipulated in the legislation.
Committed – Includes fund balance amounts for which constraints have been imposed by the government itself,using the highest level of decision-making authority via County ordinances. In addition, these constraints can onlybe removed or changed through formal action by the Council.
Assigned – Includes fund balance amounts intended to be used for specific purposes. It is County policy that theCounty Executive assigns fund balance amounts in the General Fund at the recommendation of both the Directorof Finance and the Budget Administrator. In addition, GASB 54 requires all residual amounts in special revenuefunds to be reported as assigned.
Unassigned - Represents the residual fund balance of the General Fund (cannot be reported in other GovernmentalFunds unless amount is reported negative) after the above fund balance categories are reported.

P. Reconciliation Between GAAP and Budgetary Basis
The General and Special Revenue Funds of the primary government have legally adopted annual budgets. The “Statementof Revenues, Expenditures, and Changes in Fund Balances – Budgetary Basis” of both the General Fund and AgriculturalLand Preservation Fund are prepared on a basis consistent with their budgets and are reported within the basic financialstatements. The “Schedule of Revenues, Expenditures, and Changes in Fund Balance – Budgetary Basis” for Non-majorSpecial Revenue Funds are prepared on a basis consistent with those budgets and are presented as supplementaryinformation. The budgets are prepared using encumbrance accounting wherein encumbrances are treated as expendituresof the current period, including certain contractual services. Also, the budgets include appropriations of prior year fundbalances as other sources in the current year. The "Statement of Revenues, Expenditures, and Changes in Fund BalancesGovernmental Funds" is prepared on a basis consistent with GAAP wherein encumbrances are treated only as anassignment of fund balance, prior year fund balances are not included as other sources, and contractual services/expenditures are recorded on a modified accrual basis.
The financial statements are reconciled below:
General FundAgricultural
Land Pres. FundBudgetary basis - revenues and other sources
over expenditures and other uses $ — 299,661 Appropriation from fund balance (1,128,017) —
Current year encumbrances outstanding 9,003,069 —Prior year encumbrances expended this year (7,818,394) —Effect of recording contractual service expenditures
modified accrual basis (167,272) —Unbudgeted transfers (1,375,527)Other (150,473) (158,070)
GAAP basis - net change in fund balances $ (1,636,614) 141,591
The ending fund balances are reconciled as follows:
General FundAgricultural
Land Pres. Fund
Budgetary basis - ending fund balance $ 127,813,399 59,047,107Adjustments:
Elimination of encumbrances outstanding 16,525,513 —Accruals (1,162,308) —Unbudgeted transfers (1,375,527) —Other (1,193,160) (158,070)
GAAP basis - ending fund balance $ 140,607,917 58,889,037
Notes to Basic Financial Statements 49
Q. Budget Stabilization Account
The County has established a budget stabilization account (also known as the Rainy Day Fund) to provide funding incases of revenue shortfalls, which would not include anticipated revenue shortfalls unless the shortfall was quantified,and was of a magnitude that would distinguish it from other shortfalls that regularly occur during the normal course ofgovernmental operation or emergency situations affecting life, health, or property. The County Charter sets a goal ofmaintaining the account at seven percent of audited General Fund expenditures for the most recently completed fiscalyear at the time the budget is prepared. When the fiscal year 2019 budget was prepared, the fiscal year 2017 financialstatements were the most recently completed and audited. Therefore, the charter target is based upon fiscal year 2017audited expenditures. An increase of $2,619,263 was made to the fund in fiscal year 2019, which resulted in achievingthe charter target of $73,958,202.

The budget stabilization account is calculated as follows:
Budget Fiscal YearAudited Expenditures
from Fiscal YearAudited
Expenditures* Percentage Charter Target2019 2017 $ 1,056,545,745 7% $ 73,958,2022020 2018 $ 1,083,504,317 7% $ 75,845,3022021 2019 $ 1,109,325,749 7% $ 77,652,802
*Budgetary expenditures and encumbrances less pay-as-you-go expenditures.
50 Notes to Basic Financial Statements
R. Net Position Restricted
Net Position restricted by enabling legislation represents accumulated Net Position attributed to revenue sources, suchas taxes and fees, which are restricted for specified purposes by State enabling legislation in the County Code. Theseamounts, which are included with restricted Net Position in the government-wide Statement of Net Position, were asfollows at year-end:
Governmental activities $ 142,249,607Business-type activities 21,823,966Component units activities 28,783,914
Total $ 192,857,487
S. Fair Value Measurements
Howard County categorizes its fair value measurements within the fair value hierarchy established by generally acceptedaccounting principles. The hierarchy is based on the valuation inputs used to measure the fair value of the asset:
• Level 1 – Valuations based on unadjusted quoted prices for identical assets or liabilities in active markets;• Level 2 – Valuations based on quoted prices for similar assets or liabilities in active markets or identical assets or
liabilities in less active markets, such as dealer or broker markets; and• Level 3 – Valuations derived from valuation techniques in which one or more significant inputs or significant value
drivers are unobservable, such as pricing models, discounted cash flow models and similar techniques not based onmarket, exchange, dealer or broker-traded transactions.
T. Implementation of New Accounting Principles
Statement No. 83, "Certain Asset Retirement Obligations," effective for reporting periods beginning after June 15, 2018.The requirements of this Statement will enhance comparability of financial statements among governments by establishinguniform criteria for governments to recognize and measure certain asset retirement obligations (ARO), includingobligations that may not have been previously reported. This Statement also will enhance the decision-usefulness of theinformation provided to financial statement users by requiring disclosures related to those AROs. The Statementestablished criteria for determining the timing and pattern of recognition of a liability and a corresponding deferredoutflow of resources for AROs. The Statement requires the measurement of an ARO to be based on the best estimate ofthe current value of outlays expected to be incurred. The Statement requires the current value of a government's AROsto be adjusted for the effects of general inflation or deflation at least annually. The Statement also requires disclosure ofinformation about the nature of a government's AROs, the methods and assumptions used for the estimates of the liabilities,and the estimated remaining useful life to the associated tangible capital assets. The County does not own any types oftangible capital assets that has a legal obligation to perform future asset retirement activities related to this Statement.

Statement No. 88, "Certain Disclosures Related to Debt, including Direct Borrowings and Direct Placements", effectivefor reporting periods beginning after June 15, 2018. The requirements of this Statement will improve financial reportingby providing users of financial statements with essential information that currently is not consistently provided. Inaddition, information about resources to liquidate debt and the risks associated with changes in terms associated withdebt will be disclosed. This Statement defines debt for purposes of disclosure in notes to financial statements as a liabilitythat arises from a contractual obligation to pay cash or in lieu of cash in one or more payments to settle an amount thatis fixed at the date the contractual obligation is established. This Statement also requires that additional essentialinformation related to debts be disclosed in notes to financial statements. For notes to financial statements related todebts, this Statement also requires that existing and additional information be provided for direct borrowings and directplacements of debt separately from other debt. The required changes are reflected in the County's financial statements.
Statement No. 89, “Accounting for Interest Incurred Before the End of a Construction Period”, effective for reportingperiods beginning after December 15, 2019. The requirement of this Statement will improve financial reporting byproviding more relevant information about capital assets and the cost of borrowing. This Statement requires the interestcost incurred before the end of a construction period be recognized as an expense in the period in which the cost is incurredfor financial statements prepared using the economic resources measurement focus. As a result, interest cost incurredbefore the end of a construction period will not be included in the historical cost of a capital asset reported in a business-type or enterprise fund. The resulting information also will enhance the comparability of information about capital assetsand the cost of borrowing for a reporting period for both governmental activities and business-type activities. TheStatement requires that the provisions be applied prospectively. The required changes currently have no impact on theCounty’s financial statements and notes to the statements.
Notes to Basic Financial Statements 51

2. Equity in Pooled Cash and Cash Equivalents and Investments
The County’s cash and cash equivalents and investments are managed separately from the Pension and Other Post-EmploymentBenefits Trust funds and each are discussed separately below.
A. County’s Cash and Cash Equivalents and Investments
The County maintains a cash, cash equivalents, and investment pool that is available for use by all funds except the Pensionand Other Post-Employment Benefits Trust funds. Each County fund is allocated interest income based on its share of theinvestment pool. Except as otherwise legislated, interest income earned by Governmental and Internal Service Funds istransferred to the General Fund.
Custodial Credit Risk - Deposits: In the case of deposits, this is the risk that in the event of a bank failure, the government’sdeposits may not be returned to it. The County’s investment policy requires at least 102% collateralization of deposits. Thecarrying amount of total deposits, including certificates of deposit, for the County was 53,161,843 and the bank balance was$57,009,870, at fiscal year-end. The bank balance was covered by federal depositary insurance or by collateral held by theCounty’s agent in the County’s name. Petty cash was $14,224 at June 30, 2019.
The County's component units had a combined bank balance of $40,384,301, of which $304,532, reported by the HousingCommission, was not collateralized. All other bank balances were covered by federal depositary insurance or by collateralheld by the component unit's agent in the component unit's name. The component units do not have a policy covering deposits.
The table below reconciles the County’s deposits and investments to the government-wide Statement of Net Position and theStatement of Fiduciary Net Position – Pension and Other Post-Employment Benefits Trust Funds and Agency Funds:
Primary Fiduciary ComponentStatement of Net Position Amounts: Government Funds Units
Equity in pooled cash and investments $ 345,515,299 7,242,780 62,784,448Cash with fiscal agent 20,410,337 — —Restricted equity in pooled cash and cash equivalents 167,524,190 — 7,809,892Investments 42,810,778 1,253,775,698 94,246,873
Total 576,260,604 1,261,018,478 164,841,213
Deposits and Investment Summary:Carrying value of cash deposits 45,919,063 7,242,780 70,594,340Investments 530,341,541 1,253,775,698 94,246,873
Total $ 576,260,604 1,261,018,478 164,841,213
Investments: The County has adopted an investment policy that is designed to provide maximum safety and liquidity of fundswhile providing a reasonable rate of return. Permissible investments include U.S. Treasury Obligations, U.S. GovernmentAgency and U.S. Government-Sponsored Enterprises, repurchase agreements, collateralized certificates of deposit, bankers’acceptances, commercial paper, the Maryland Local Government Investment Pool, and mutual funds dealing in governmentsecurities. The County’s policy and State law require that the underlying collateral for repurchase agreements and certificatesof deposit must have a market value of at least 102% of the investment’s cost plus accrued interest.
The County’s policy is more restrictive than State law, limiting the percentage of total portfolio that can be invested in certaininvestment types. These investment types, and the maximum percentage of the portfolio that can be invested in each are: U.S.Treasury Obligations – 100%, U.S. Government Agency and U.S. Government-Sponsored Enterprises – 90%, repurchaseagreements – 90%, collateralized certificates of deposit – 5%, bankers’ acceptances – 30%, commercial paper – 10%, mutualfunds – 60% and supranational issuers - 40%. State law places no limits on these types of investments. Another restrictionthe County has is to limit the maximum amount invested through any broker, dealer or other financial institution to 40% ofthe portfolio. In addition, all component units have investment policies.
52 Notes to Basic Financial Statements

Investments of the County and its Component Units at fiscal year-end:
Fair Value
PrimaryGovernment
ComponentUnits
Total ReportingEntityInvestment Type
U.S. Government Securities $ 42,810,778 — 42,810,778U.S. Government - Sponsored Enterprises 266,755,000 — 266,755,000Maryland Local Govt. Investment Pool 191,296,460 77,426,320 268,722,780Money market funds 29,479,303 — 29,479,303Fixed income — 2,877,196 2,877,196Mutual funds — 5,093,739 5,093,739Interest in external investment pool — 5,006,807 5,006,807Interest in irrevocable trust — 132,971 132,971Treasury bills — 734,951 734,951Equity in properties under home ownership — 2,974,889 2,974,889
Total $ 530,341,541 94,246,873 624,588,414
Fair Value Measurement
The County categorizes its fair value measurements within the fair value hierarchy established by generally accepted accountingprinciples. The hierarchy is based on the valuation inputs used to measure the fair value of the asset. Level 1 inputs are quotedprices in active markets for identical assets; Level 2 inputs are significant other observable inputs; Level 3 inputs are significantunobservable inputs.
The County has the following recurring fair value measurements as of June 30, 2019:
Primary GovernmentFair Value Measurements Using
Investments by fair value level: Total (Level 1) (Level 2) (Level 3)
U.S. Government Securities $ 42,810,778 42,810,778 — —U.S. Government - Sponsored Enterprises 266,755,000 — 266,755,000 —
Total investments by fair value level 309,565,778 42,810,778 266,755,000 —
Investments measured at amortized cost:Maryland Local Govt. Investment Pool 191,296,460Money market funds 29,479,303
Investments measured at amortized cost 220,775,763
Total investments $ 530,341,541
Debt and equity securities classified in Level 1 of the fair value hierarchy are valued using prices quoted in active marketsfor those securities. Debt securities classified in Level 2 of the fair value hierarchy refers to securities not traded on an activemarket but for which observable market inputs are readily available. Fixed income securities are priced on a daily basis,market to market, using a variety of third party pricing sources, market data and methodologies.
Notes to Basic Financial Statements 53

Component UnitsFair Value Measurements Using
Investments by fair value level: Total (Level 1) (Level 2) (Level 3)*
Treasury bills $ 734,951 734,951 — —Fixed income 2,877,196 2,877,196 — —Mutual funds 5,093,739 5,093,739 — —Interest in external investment pool 5,006,807 — — 5,006,807Interest in irrevocable trust 132,971 — 132,971 —
Total investments by fair value level 13,845,664 8,705,886 132,971 5,006,807
Investments measured at amortized cost:Maryland Local Govt. Investment Pool 77,426,320
Investments measured at amortized cost 77,426,320
Investments measured at the net asset value (NAV):Equity in properties under home ownership 2,974,889
Total investments measured at the NAV 2,974,889
Total investments $ 94,246,873
* The Howard Community College Educational Foundation’s interest in an external investment pool have no readily determined market value and are valuedat fair value as estimated by the University System of Maryland Foundation (USMF). USMF’s management estimates fair value of the underlying marketvalues of the investments. Because of the inherent uncertainty of the valuation, it is reasonably possible that such estimated values may differ from the valuesthat would have been used had a ready market for the securities existed.
Interest Rate Risk: The County’s investment policy requires that the majority of investments have a maturity of one year orless, except for U.S. Treasury stripped coupon securities purchased as part of the Agricultural Land Preservation Program(see Note 7). These securities have no coupon and have long-term maturity lengths; therefore, they are very interest-ratesensitive. If market interest rates were to rise, the market value of these securities would decline further than a similar coupon-paying Treasury security. Conversely, if market interest rates were to fall, the market value of these securities would risefurther than a similar coupon-paying Treasury security. The County plans to hold these securities to their maturity.
At fiscal year-end, the County had a $25,245,000 callable investment. The call date was 9 months before final maturity. Incalculating weighted average maturity, we made the assumption that the investment would be called.
The following is a list of County investments included in the computation of weighted average maturities:
Investment TypeFair Value/
Amortized CostWeighted AverageMaturity (in years)
U.S. Government Securities $ 42,810,778 2.92U.S. Government - Sponsored Enterprises 266,755,000 0.46
Total $ 309,565,778
Portfolio weighted average maturity 0.80
The Maryland Local Government Investment Pool (MLGIP) was created under the Annotated Code of Maryland. The intentof the pool is to provide a safe investment vehicle for short-term investments. The MLGIP is administrated by the MarylandState Treasurer. Participation is voluntary and eligibility is regulated by MLGIP Local Government Article.
54 Notes to Basic Financial Statements

The MLGIP and the money market funds used by the County are operated in accordance with Rule 2a-7 of the InvestmentCompany Act of 1940 and not registered with the Securities and Exchange Commission (SEC). The County’s investmentsin these pools are not included in the computation of weighted average maturity. The unit value is at amortized cost with a$1 per share value.
Credit Risk: State law limits investments in bankers’ acceptances and commercial paper to the highest short-term debt letterand numerical rating by at least one nationally recognized statistical rating organization. All investments in U.S. GovernmentSponsored Enterprises are rated AA+ by Standard & Poor’s. The Maryland Local Government Investment Pool and themoney market fund are both rated AAAm by Standard & Poor’s. Investments in short-term commercial paper is rated P-1by Moody’s Investor Services.
Concentration of Credit Risk: The County’s investment policy places no limit on the amount the County may invest in anyone issuer. More than 5% of the County’s investments are in the Federal Home Loan Bank, Federal Farm Credit Bank andthe Federal Agricultural Mortgage Corporation. At fiscal year-end, investments in these U.S. Government SponsoredEnterprises represent 86.17% of the County’s total investments.
B. Pension Trust Funds’ Cash and Investments
The County’s Pension Trust funds, the Howard County Police and Fire Employees’ Retirement Plan, and the Howard CountyRetirement Plan (the Plans), share commingled funds that are allocated based on each Plan’s percentage of ownership. ThePlans have an investment policy that is designed to provide benefits as anticipated through a carefully planned and executedinvestment program that achieves a reasonable long-term total return consistent with the level of risk assumed. To help achievethis return, professional investment managers are employed by the Plans to manage the Plans’ assets. The Plans employ StateStreet Bank as trustee for their assets.
Investments: The Plans’ investment policy includes an asset allocation plan for investments:
Asset ClassMinimumAllocation Target
MaximumAllocation
Equities 30.0% 40.0% 50.0%Fixed income 20.0% 30.0% 40.0%Alternative investments 18.0% 23.0% 28.0%Real assets 2.0% 7.0% 12.0%
Investments of the Plans at fiscal year-end:
Investments Fair Value/NAV
Equities $ 462,432,977Fixed income 307,599,448Alternative investments 270,113,695Real assets 37,911,182Money market funds 20,808,171
Total $ 1,098,865,473
Notes to Basic Financial Statements 55

Interest rate risk: The Plans’ investment policy does not place any limits on the professional investment managers with respectto the duration of investments managed for the Plans. Following is a list of County Plan investments included in the computationof weighted average maturities.
Investment TypeFair Value/
NAVWeighted AverageMaturity (in years)
Corporate bonds $ 54,960,762 11.93U.S. Government - Sponsored Enterprises 41,911,945 25.13Government Issued / Treasuries 11,375,089 7.04Other asset backed securities 6,831,038 22.78Collateralized mortgage obligations 4,964,122 39.77Municipal securities 2,350,916 16.40Alternative investments, mutual funds and TIPS identified as fixedincome for reporting purposes 185,205,576 N/A
Total $ 307,599,448
Portfolio weighted average maturity 17.82
Credit Risk: The money market fund used by State Street Bank is unrated, as are the mutual funds used by the Plans. At fiscalyear-end, the Plans’ fixed income investments had the following risk characteristics:
Standard & Poor's Rating or Comparable Fair ValueAAA to A- $ 18,205,054BBB to BB- 45,579,038Not rated 243,815,356
Total $ 307,599,448
Custodial Credit Risk: State Street Bank invests in Government Short-Term Investment Fund (GSTIF) on behalf of the Plans.At fiscal year-end, the amount in this fund at fair value was $18,583,966 which was partially used for settlement of openpurchases of $5,460,439. All other investments of the fund are held by State Street Bank as trustee in the Plans’ names.
Credit Risk - Currency Forward Contract: One of the Plans’ investment objectives is to diversify assets in accordance withthe Modern Portfolio Theory (MPT) in order to reduce overall risk. Consistent with this objective, the Plans have participatedin a mutual fund that holds three-month currency forward contracts. This strategy is undertaken to protect the dollar value ofunderlying international investments. The hedging is restricted to 100% of the underlying asset value and 50% of the totalFund value. At fiscal year-end, there were no hedges in place.
Foreign Currency Risk: The Plans’ exposure to foreign currency risk derives from its investments in foreign currency orinstruments denominated in foreign currency. Investments in such securities are limited to a maximum net currency exposureof 37.0% at any given time. The Plans were exposed to foreign currency risk through the Pool's investments in Euro denominatedalternative investments. The Pool total of these investments were $17,753,986 and $19,054,279 in 2019 and 2018, respectively.
56 Notes to Basic Financial Statements

Pension Trust Funds’ Fair Value Measurement
The Plan categorizes its fair value measurements within the fair value hierarchy established by generally accepted accountingprinciples. The hierarchy is based on the valuation inputs used to measure the fair value of the asset. Level 1 inputs are quotedprices in active markets for identical assets; Level 2 inputs are significant other observable inputs; Level 3 inputs are significantunobservable inputs. It has the following recurring fair value measurements as of June 30, 2019:
Fair Value Measurement Using
Investments by fair value level Total (Level 1) (Level 2) (Level 3)Debt securities:
Collaterized Mortgage Obligations (FannieMae and Freddie Mac) $ 4,964,122 — 4,964,122 —Corporate bonds 54,960,763 — 54,960,763 —Commingled funds (fixed income) 115,749,970 — 115,749,970 —FHLMC and FNMA bonds 41,911,945 — 41,911,945 —U.S. Treasury Securities 11,375,089 — 11,375,089 —Municipals bonds 2,350,916 — 2,350,916 —Other asset backed securities 6,831,038 — 6,831,038 —Preferred stock 1,310,525 1,310,525 — —
Total debt securities 239,454,368 1,310,525 238,143,843 —
Equity securities:Common Stocks 236,766,214 236,766,214 — —Small Company Portfolio 22,809,550 22,809,550 — —Emerging Markets Value Portfolio 95,276,505 95,276,505 — —Real Estate Investment Trusts (REITS) 4,389,970 4,389,970 — —
Total equity securities 359,242,239 359,242,239 — —Total investment by fair value level 598,696,607 360,552,764 238,143,843 —
Investments measured at the net asset value(NAV):
Private equity funds 148,138,133Equity hedge funds 121,975,562Real assets funds 37,911,182International equity funds 60,521,468Commingled fund within internationalequities 42,669,270Commingled fund within international fixedincome 45,609,054Commingled fund within domestic fixedincome 22,536,026
Total investments measured at the NAV 479,360,695
Total investments measured at fair value/NAV* $ 1,078,057,302
*Does not include money market funds totaling $20,808,171, of which $18,583,966 represents securities that have remaining maturities of less than 1 yearand may be measured at amortized cost.
Debt and equity securities classified in Level 1 of the fair value hierarchy are valued using prices quoted in active marketsfor those securities. Debt securities classified in Level 2 of the fair value hierarchy refers to securities not traded on an activemarket but for which observable market inputs are readily available. Fixed income securities are priced on a daily basis,market to market, using a variety of third party pricing sources, market data and methodologies.
Notes to Basic Financial Statements 57

The valuation method for investments measured at the net asset value (NAV) per share (or its equivalent) ispresented below:
FairValue
UnfundedCommitments
Frequency(if Currently
Eligible)NoticePeriod
Private equity funds $ 148,138,133 43,992,324 Illiquid N/AEquity Hedge fund 1 60,318,661 — Quarterly 65 daysEquity Hedge fund 2 61,656,901 — Semi Annually 95 daysReal assets funds 37,911,182 39,424,314 Illiquid N/AInternational equity funds 60,521,468 — Monthly 15 daysCommingled fund withininternational equities 42,669,270 — Weekly 4 daysCommingled fund withininternational fixed income 45,609,054 — Bi-monthly 5 daysCommingled fund withindomestic fixed income 22,536,026 — Daily 2 days
$ 479,360,695
Private Equity Funds: This represents investments through fund of funds (“FOF”) vehicles and invest in both debt and equitystrategies. Exposures are diversified by manager, region, strategy and vintage year. Managers retained pursue distressed debt,venture, or buyout strategies. This type also includes investment in the private equity secondary market. The FOF investmentshave 10 – 40 underlying managers/funds building broad exposures for diversified performance. These funds have liquidityrestrictions for the life of the investment, 7 – 10 years. Options for exit are limited to sale on the secondary market. Capitalcommitments are made to these types of investments and funds are invested through a call down structure.
Equity Hedge Funds: This represents investments in two Hedge Fund of Fund (“FOF”) managers. Each FOF manager investsin underlying hedge funds to provide a broadly diversified portfolio. One invests with 90 – 100 underlying managers/fundsto execute its global market strategy. The other invests in 20 – 40 underlying managers/funds in a relative value mandate. Thehedge fund strategy is designed to diversify by manager/fund to reduce single manager/fund risk while offering portfoliodiversification and provide a return profile that is uncorrelated to the rest of the assets in the portfolio. The fair values of theinvestments are determined using the NAV per share (or its equivalent) of the investments. These funds have liquidityrestrictions of 3 to 6 months.
Real Assets Funds: This represents funds that invest in institutional real estate (office, multi-family, industrial, and retail)and natural resources strategies. The fair values of the investments in these strategies are determined using the NAV per share(or its equivalent) of the Plan’s ownership interest in partnership’s capital. The real estate strategies deployed include a USfocused property strategy (core to core plus) and a global fund of funds (“FOF”) strategy. The global FOF manager investsin 20 – 30 underlying managers/funds. The natural resources investments are through FOF strategies. The natural resourcemanagers invest in 10 – 25 underlying relationships as they build a diversified portfolio with exposure to oil, natural gas,agriculture, timber and other natural resources. Capital commitments are made to these types of investments and funds areinvested through a call down structure. These funds have liquidity restrictions for the life of the investment, 7 – 10 years.Options for exit are limited to sale on the secondary market.
International Equity Funds: This represents investments primarily in value oriented equity securities of international developedmarkets (non-U.S. issuers; e.g. MSCI/EAFE) with the objective of achieving a long term return above a passive benchmark(EAFE). This manager focuses on a dividend discount model value based philosophy for publicly traded equity. All securitiesare recorded at fair value. Foreign securities are valued on the basis of quotations from the primary market in which they aretraded and translated at each valuation date from the local currency into U.S. dollars using current exchange rates. The Fundmay enter into forward foreign currency exchange contracts primarily to hedge against foreign currency exchange rate riskson its non-U.S. dollar-denominated investment securities.
Commingled Fund within International Equities: This represents investments made in predominantly listed large and megacapitalization securities in emerging markets. The objective of this fund is to achieve a long-term return above a passivebenchmark (e.g. MSCI EM Index). The manager employs a flexible, research intensive investment approach to own high
58 Notes to Basic Financial Statements

quality businesses over the long term. NAVs are normally calculated as of 4:00pm Eastern Time for each business day therelevant exchange is open. Securities for which market quotations are readily available and reliable are to be valued using theapplicable market quotations.
Commingled Fund within International Fixed Income: This represents investments primarily in a globally diversified portfolioof high quality sovereign bonds and currencies in emerging markets (non U.S. issuers; e.g. MSCI EM). The objective of thisfund is to generate income, preserve capital, and enhance principal above a passive benchmark (JP Morgan GBI-EM GlobalDiversified Index). NAV for the Fund is only calculated twice a month on the last business day and the 15th (or next businessday if the 15th is a non-business day).
Commingled Fund within Domestic Fixed Income: The Strategy is managed using an "indexing" investment approach, bywhich the manager attempts to approximate, before expenses, the performance of the Index (e.g. Bloomberg Barclays U.S.Treasury Inflation Protected Securities Index) over the long term. The manager expects that it will typically seek to replicateIndex returns for the Portfolio through investments in the "cash" markets - actual holdings of debt securities and otherinstruments - rather than through "notional" or "synthetic" positions achieved through the use of derivatives, such as futurescontracts or swap transactions (except in the unusual case where the manager believes that use of derivatives is necessary toachieve an exposure that is not readily available through the cash markets). NAVs are normally calculated as of 4:00pmEastern Time for each business day the relevant exchange is open. Securities for which market quotations are readily availableand reliable are to be valued using the applicable market quotations.
Other Post-Employment Benefits (OPEB) Trust Funds’ Cash, Cash Equivalents and Investments
The County’s OPEB Trust funds have an investment policy that is designed to provide benefits as anticipated through acarefully planned and executed investment program that achieves a reasonable long-term total return consistent with the levelof risk assumed. To help achieve this return, professional investment managers are employed by the Plans to manage thePlans’ assets. The Trust employs U.S. Bank as the custodian of its assets.
Investments: The Plans’ investment policy includes an asset allocation plan for investments:
Asset ClassMinimumAllocation Target
MaximumAllocation
Equities 39.0% 65.0% 99.0%Fixed income 20.0% 35.0% 60.0%
Investments of the Plans at fiscal year-end:
Investments Fair Value/Amortized CostCash $ 336,048Mutual Funds 154,445,416Money market funds 128,761
Total $ 154,910,225
Credit Risk: The Maryland Local Government Investment Pool, included in Money Market Funds in the above schedule, israted AAAm by Standard & Poor’s. The money market funds used by U.S. Bank are unrated, as are the mutual funds usedby the Plans.
Other Post Employment Benefits (OPEB) Trust Funds’ Fair Value Measurement
The Plan categorizes its fair value measurements within the fair value hierarchy established by generally accepted accountingprinciples. Level 1 inputs are quoted prices in active markets for identical assets; Level 2 inputs are significant other observableinputs; Level 3 inputs are significant unobservable inputs. It has the following recurring fair value measurements as of June 30,2019:
Notes to Basic Financial Statements 59

Fair Value Measurement Using
Investments by fair value level Total (Level 1) (Level 2) (Level 3)Mutual Funds:
Mutual Funds - Equity $ 100,582,025 100,582,025 — —Mutual Funds - Fixed Income 53,863,391 53,863,391 — —
Total Mutual Funds 154,445,416 154,445,416 — —Total investment by fair value level * $ 154,445,416 154,445,416 — —*Does not include cash and money market funds totaling $220,451, which represents securities that have remaining maturities of less than 1 year and maybe measured at amortized cost.
60 Notes to Basic Financial Statements

3. Receivables
Receivables at fiscal year-end of the County’s major individual funds and other aggregate remaining funds (including non-major governmental funds, non-major proprietary funds, internal service funds, and fiduciary funds), including the applicableallowances for uncollectible accounts, are as follows:
Receivables:General
Fund
AgriculturalLand Pres.
Fund
GeneralCapital
Project FundWater and
Sewer FundFiduciary
Funds
Non-Majorand Other
Funds Total
Property taxes $ 5,808,086 — — 341,177 534,227 857,805 7,541,295
Due from othergovernments 151,072,305 829,492 1,153,110 93,497 — 16,040,126 169,188,530
Due fromcomponent units 11,632,263 — 9,268,869 — — 5,682,544 26,583,676
Housing loans — — — — — 13,588,326 13,588,326
Other 1,570,361 — — 674,241 4,816,397 3,392,844 10,453,843
Service billings — — — 11,760,834 156,434 11,917,268
Water and sewerassessments — — — 21,263,966 — — 21,263,966
Grossreceivables 170,083,015 829,492 10,421,979 34,133,715 5,350,624 39,718,079 260,536,904
Less: Allowanceforuncollectibles (1,289,122) — — — — — (1,289,122)
Total Receivables $ 168,793,893 829,492 10,421,979 34,133,715 5,350,624 39,718,079 259,247,782
Property tax, services billings and water and sewer assessments receivables in the proprietary funds are liens on real propertythat will be sold via the annual tax sale process if not paid, therefore, an allowance has not been established. Due from othergovernments consists of uncollected tax and grant revenues from Federal and State governments.
Notes to Basic Financial Statements 61
4. Interfund Receivables, Payables, and Transfers
Interfund Receivables and Payables:
The composition of interfund balances (Due to/from other funds) at fiscal year-end is as follows:
Due from other funds Due to other funds Amount
General Fund General Capital Projects $ 16,478,013Special Recreation Facility 3,343,475
19,821,488
Highway Fund Storm Drain Capital Projects 22,440,545Recreation Program Fund Special Recreation Facility 422,000
22,862,545Total Inter-fund Receivable/Payable $ 42,684,033
The balances are cash deficits related to normal operations.

Transfers:
Interfund transfers for the year consisted of the following:
Non-Major Governmental Funds
FundGeneral
Fund
GeneralCapitalProjects
Fund
AgriculturalLand Pres.
Fund
SpecialRevenue
Funds
DebtServiceFunds
CapitalProjectsFunds
EnterpriseFunds
InternalServiceFunds Total In
Major FundsGeneralFund $ — 7,311,346 203,633 3,472,316 170,439 15,173,434 — 614,913 26,946,081GeneralCapitalProjects 2,767,274 — — — — — 72,676 10,363,286 13,203,236
Non-MajorFunds
SpecialRevenue 515,608 — — — 175,000 — — — 690,608DebtService 2,210,094 — — — — — — — 2,210,094CapitalProjects 7,219,043 4,731,759 — 1,200,000 — 10,329 9,896,708 — 23,057,839
EnterpriseFunds 1,671 — — — — — — 555,170 556,841
Total Out $12,713,690 12,043,105 203,633 4,672,316 345,439 15,183,763 9,969,384 11,533,369 66,664,699
The transfers from the General Fund are the disbursement of pay-as-you-go funding to various capital projects, funding of bondanticipation note, debt service expenditures in excess of interest income, and interest allocation to various funds. Transfer taxrevenue is dedicated to various functions in the Capital Projects and Non-Major Special Revenue Funds. Part of that revenue isthen transferred to the General Fund to cover each function’s share of debt service costs for the year. Transfers from the Non-Major Enterprise Funds are to pay for watershed protection related capital projects.
62 Notes to Basic Financial Statements
5. Property Tax and Transfer Tax
The County’s real property tax is levied each July 1 on the assessed value certified as of that date for all taxable real propertylocated in the County. Assessed values are established by the Maryland State Department of Assessments and Taxation at 100percent of estimated market value. The State uses January 1 as the date of finality and processes additions, deletions andcorrections throughout the year. A revaluation of all property is required to be completed every three years. County taxes aredue and payable, and become a lien on the property, on July 1 of each fiscal year. A discount of ½ percent is allowed if paymentis made in July. Property taxes are billed and payable semi-annually on properties designated as “principal residence” unlessa taxpayer makes an election to pay annually. The first installment is due by September 30 while the second installment isdue December 31. If delinquent, taxes are charged a penalty and interest (1.5 percent) each month that they remain unpaid.If the annual payment election is made, taxes become delinquent October 1 and are charged a penalty and interest (1.5 percent)each month that taxes remain unpaid. Tax lien certificates are sold at a public auction in May or June for properties withdelinquent taxes. Property taxes levied during the current year are recorded as receivables and revenue, net of estimateduncollectible amounts of personal property tax. The net receivables uncollected 60 days after year-end are recorded as deferredinflows of resources as described in Note 3.
The Howard County Code imposes a transfer tax upon every instrument of writing conveying title to real or leasehold propertyoffered for sale or lease and recorded in Howard County. The Code specifies that the proceeds shall be distributed to theSchool Construction Fund (25 percent), the Recreation and Parks Fund (25 percent), the Agricultural Land Preservation Fund(25 percent), the Community Renewal Fund (12-1/2 percent), and the Fire Service Building and Equipment Fund (12-1/2percent).

6. Capital Assets
Capital asset activity for governmental activities for the fiscal year was as follows:
BeginningBalance Increases Decreases
EndingBalance
Governmental activities
Capital assets not being depreciated:Land and land improvements $ 594,852,144 7,988,018 449,290 602,390,872Construction in progress 70,541,932 127,351,645 96,280,550 101,613,027
Total capital assets, not being depreciated 665,394,076 135,339,663 96,729,840 704,003,899
Capital assets being depreciated:Buildings 405,562,714 5,867,535 1,560,050 409,870,199Improvements other than buildings 260,918,061 35,922,232 4,601,402 292,238,891Machinery and equipment 199,660,114 19,055,431 7,343,784 211,371,761Infrastructure 534,834,905 32,365,670 24,937,439 542,263,136
Total capital assets, being depreciated 1,400,975,794 93,210,868 38,442,675 1,455,743,987
Less accumulated depreciation for:Buildings 112,958,950 8,064,878 458,034 120,565,794Improvements other than buildings 122,652,690 17,009,104 1,970,266 137,691,528Machinery and equipment 126,062,779 15,074,615 6,680,508 134,456,886Infrastructure 232,886,284 15,932,127 832,924 247,985,487
Total accumulated depreciation 594,560,703 56,080,724 * 9,941,732 640,699,695
Total capital assets, being depreciated, net 806,415,091 37,130,144 28,500,943 815,044,292
Governmental activities capital assets, net $ 1,471,809,167 172,469,807 125,230,783 1,519,048,191
Depreciation expense was charged to functions/programs of governmental activities as follows:Governmental activities: Amount
General government $ 1,620,210Public safety 5,140,306Public facilities 30,148,373Legislative and judicial 25,244Community services 302,951Recreation and parks 7,013,718Education 2,575,472Capital assets held by the government's internal service fundsare charged to the various functions based on usage of assets 8,880,415
Total depreciation expense - governmental activities $ 55,706,689 *
* Transfer of assets are processed via the gross method, wherein the original acquisition cost and accumulated depreciation amounts are transferred separately.Among transfers between governmental and enterprise business type activities, the related depreciation expense does not transfer with the asset resulting ina variance between increases to accumulated depreciation and depreciation expense.
Notes to Basic Financial Statements 63

Capital asset activity for business-type activities for the fiscal year was as follows:
BeginningBalance Increases Decreases
EndingBalance
Business-type activities
Capital assets not being depreciated: Land and land improvements $ 11,753,538 449,290 — 12,202,828 Construction in progress 95,136,036 63,602,848 31,405,420 127,333,464
Total capital assets, not being depreciated 106,889,574 64,052,138 31,405,420 139,536,292
Capital assets being depreciated:Buildings 238,062,093 — — 238,062,093Improvements other than buildings 84,015,815 3,542,719 91,754 87,466,780Machinery and Equipment 17,169,581 2,179,690 1,135,826 18,213,445Infrastructure 741,431,449 60,298,590 — 801,730,039
Total capital assets, being depreciated 1,080,678,938 66,020,999 1,227,580 1,145,472,357
Less accumulated depreciation for:Buildings 88,110,302 4,684,796 — 92,795,098Improvements other than buildings 47,802,795 3,569,287 91,754 51,280,328Machinery and Equipment 6,922,834 1,420,997 374,037 7,969,794Infrastructure 312,080,889 15,454,800 — 327,535,689
Total accumulated depreciation 454,916,820 25,129,880 * 465,791 479,580,909
Total capital assets, being depreciated, net 625,762,118 40,891,119 761,789 665,891,448
Business-type activities capital assets, net $ 732,651,692 104,943,257 32,167,209 805,427,740
Depreciation expense was charged to functions/programs of business-type activities as follows:Business-type activities: Amount
Water and sewer system $ 23,014,627Golf course 147,141Inter-County Broadband 876,907Watershed 112,234
Total depreciation expense - business-type activities $ 24,150,909 *
* Transfer of assets are processed via the gross method, wherein the original acquisition cost and accumulated depreciation amounts are transferred separately.Among transfers between governmental and enterprise business type activities, the related depreciation expense does not transfer with the asset resulting ina variance between increases to accumulated depreciation and depreciation expense.
Construction Commitments:
Total construction encumbrances outstanding at fiscal year-end were $115,463,939.
64 Notes to Basic Financial Statements

7. Long-Term Obligations
Notes to Basic Financial Statements 65
A. Primary Government
A summary of long-term liabilities outstanding for the primary government at fiscal year-end is as follows:
Due Dates at FiscalYear Ending Interest Rates
AmountOutstanding
Governmental Activities
Consolidated public improvementbonds 2020 - 2039 3.00% to 5.00% $ 1,107,025,478
Total debt subject to statutory limit 1,107,025,478
Tax increment financing bonds 2020 - 2048 4.00% to 6.10% 65,100,000Capital leases various 1.639% to 2.880% 31,603,394Agricultural land preservationprogram 2019 - 2037 2.19% to 8.60% 93,483,238
Total Governmental Activities (1) $ 1,297,212,110
Business Type Activities:
Metropolitan district bonds 2020 - 2049 2.00% to 5.00% $ 326,560,000State water quality revolving loan 2019 - 2031 1.00% to 2.40% 14,572,847Consolidated Public ImprovementBonds - Watershed Protection 2020 - 2039 3.00% to 5.00% 2,334,523Special facility revenue bonds 2019 - 2022 2.475% 2,217,000MDE Loan 2019 - 2028 2.95% 1,559,884Broadband Bonds 2021 - 2023 2.00% to 3.00% 2,535,000
Total Business Type Activities (2) $ 349,779,254
Total $ 1,646,991,364Note (1): Does not include deferred refunding premium liability of $139,356,696, compensated absences of $26,443,323, net OPEB liability
of $353,228,214, net pension liability of $150,671,742, LOSAP liability of $21,907,552, landfill closure liability of $23,430,000unpaid claims of $20,215,850 other non-current liabilities of $9,132,933 and unamortized bond discount of ($24,516) included inthe Statement of Net Position.
Note (2): Does not include compensated absences liability of $891,193, net OPEB liability of $23,102,908, net pension liability of $2,037,339,major water and sewer agreements $874,412 and deferred refunding premium of $24,444,168 included in the Statement of NetPosition.
The County is subject to State and County law which limits the amount of applicable General County debt outstanding to 4.8percent of the assessed value of real property and personal property located in the County. At fiscal year-end the statutory debtlimit was $2,563,805,580, providing a debt margin of $1,360,076,708. The authorized, unissued General County Bonds,Metropolitan District Bonds and Tax Increment Finance Bonds at fiscal year-end were $446,618,476, $222,646,214 and$71,775,000, respectively. It is the County’s intent to use such unissued bonds to fund future capital projects. There is nooverlapping municipal bonded debt in the County and the County is in compliance with debt agreement provisions.

The changes in long-term obligations for the primary government for the fiscal year are as follows:
BeginningBalance Increases Decreases
EndingBalance
AmountsDue WithinOne Year
Governmental Activities
Consolidated publicimprovement bonds $ 1,062,345,001 131,295,477 86,615,000 1,107,025,478 69,771,600
Tax increment financing bonds 65,165,000 — 65,000 65,100,000 90,000Compensated absences 26,336,346 * 3,845,962 3,738,985 26,443,323 273,037Capital leases 35,011,551 2,223,000 5,631,157 31,603,394 4,521,335Landfill closure obligation 23,085,000 345,000 — 23,430,000 5,994,184Agricultural land preservationprogram 97,715,767 — 4,232,529 93,483,238 17,059,529
Deferred refunding premium 140,958,111 — 1,601,415 139,356,696 —Unpaid Claims 18,511,322 1,704,528 — 20,215,850 7,518,250Net OPEB liability 321,573,764 31,654,450 — 353,228,214 —Net pension liability 153,482,520 — 2,810,778 150,671,742 —Length of service awardprogram liability 22,648,821 — 741,269 21,907,552 —Total Governmental Activities $ 1,966,833,203 171,068,417 105,436,133 2,032,465,487 105,227,935
Business Type Activities:
Metropolitan district bonds $ 277,580,000 66,605,000 17,625,000 326,560,000 13,085,000State water quality revolvingloan 17,956,260 — 3,383,413 14,572,847 3,457,397
Consolidated PublicImprovement Bonds -Watershed Protection — 2,334,523 — 2,334,523 98,400Broadband bonds 2,535,000 — — 2,535,000 —MDE Loan 1,646,000 86,116 1,559,884 146,226Special facility revenue bonds 2,714,000 — 497,000 2,217,000 510,000Compensated absences 889,638 84,319 82,764 891,193 19,804Major water and seweragreements 922,923 49,000 97,511 874,412 49,000
Deferred refunding premium 24,038,642 405,526 — 24,444,168 —Net OPEB liability 18,409,093 4,693,815 — 23,102,908 —Net pension liability 2,321,197 — 283,858 2,037,339 —
Total Business Type Activities $ 347,366,753 75,818,183 22,055,662 401,129,274 17,365,827
Total $ 2,314,199,956 246,886,600 127,491,795 2,433,594,761 122,593,762
Note (1): Does not include other non- current liabilities of $9,132,933 and unamortized bond discount of ($24,516) included in the Statementof Net Position.*Restated by $12,789 to correct prior year's compensated absences.
Funding Source for Other Non-debt Related Liabilities
Net other post-employment benefit (OPEB) liabilities are liquidated with Employee Benefit Fund resources. Net pensionliabilities are liquidated with General Fund resources. Compensated absences are liquidated by the governmental funds thatincurred the associated personnel cost.
66 Notes to Basic Financial Statements

Metropolitan District bonds and their related interest charges are being financed from front foot benefit assessment charges, advalorem taxes and in-aid-of-construction charges. In the event such revenues and charges are insufficient to finance the debtservice, the full faith and credit and unlimited taxing power of the County are irrevocably pledged to the payment of the principaland interest of these bonds.
On May 29, 2019, the County issued $133,630,000 in Consolidated Public Improvement Project and Refunding Bonds 2019Series A and $66,605,000 in Metropolitan District Project and Refunding Bonds 2019 Series B. The true interest costs were2.47% and 2.84% for the Series A and B respectively. The County issued these bonds to pay off $181,167,650 of outstandingConsolidated Public Improvement Bond Anticipation Notes, 2017 Series (BANs); refund $23,605,000 and $6,115,000 ofConsolidated Public Improvement and Metropolitan District Bonds, respectively and reimburse the County for costs related tocapital projects; and to pay bond issuance costs. The economic gain or net present value of savings from refunding ConsolidatedPublic Improvement Bonds was $1,066,188 and from refunding Metropolitan District Bonds was $671,207.
The County issues debt to finance the construction of certain capital facilities of its component units and to finance major waterand sewer projects done in conjunction with the City of Baltimore (the “City”) and Baltimore County, which affects the“unrestricted” net position component in the statement of net position.
The following summarizes these situations in which the County is reporting the debt in its financial statements, while thecorresponding assets are reported by the other reporting entity.
• The Board of Education (Public School System) and the Community College have no authority to issue bonded debt.The authority rests with the County subject to approval of the Council. The County had approximately $592 millionof its net Consolidated Public Improvement general obligation bonds outstanding that are related to capital facilitiesof the component units at fiscal year end.
• The Metropolitan District Act requires Baltimore City to provide water to the County’s Metropolitan District. The Cityalso treats sewage from the Metropolitan District at cost. The County has agreed to pay the City on a pro rata basis forconstruction of certain City-owned water and sewer capital projects that serve the Metropolitan District. Since 2004,the County has contributed approximately $83 million toward these City-owned facilities that are funded primarilywith bond proceeds. The County estimates 7.3% of its net Metropolitan District general obligation bonds outstandingor $23.8 million is related to these facilities at fiscal year-end.
Since 1993, the County has participated in the State Water Quality Revolving Loan Program. Under this program, the Statemakes loans to local governments with interest rates that are below the market rate for tax exempt financing. As of fiscal year-end, the County has borrowed $91,255,779, of which $77,045,779 was borrowed by the Water and Sewer Enterprise Fund toexpand the County’s water reclamation. The outstanding balances of these loans are $14,572,847.
Industrial revenue bonds issued by the County for the benefit of private businesses in the County are neither debt of nor chargesagainst the general credit or taxing power of the County. These amounts are not included in general long-term debt (see Note9).
In prior years, the County defeased certain Consolidated Public Improvement and Metropolitan District bonds by placing theproceeds of new bonds in an irrevocable trust to provide for all future debt service payments on the old bonds. Accordingly, thetrust account assets and the liability for the defeased bonds are not included as long-term obligations of the County. At fiscalyear-end, $302,466,000 of Consolidated Public Improvement Bonds and $57,554,700 of Metropolitan District Bonds wereconsidered defeased.
Under its Agricultural Land Preservation Program, the County acquires development rights on a parcel of agricultural propertyby entering into an installment purchase agreement with the property owner. The County acquires the development rights to theland in perpetuity. Historically, under the terms of the agreement, the County paid the property owner semiannual interestpayments for 30 years and minimal portions of the installment purchase price until maturity. The remaining amount of thepurchase price was paid at the end of 30 years with a balloon payment. Upon execution of an agreement, the County purchasedstripped-coupon U.S. Treasury obligations in amounts sufficient to equal the balloon payment in 30 years (see Note 2). Underthe current program, the County pays five or ten percent of the purchase price at closing, with equal annual principal paymentsover 15 or 20 years with interest.
Notes to Basic Financial Statements 67

Direct Placements
On May 30, 2012, the County refunded the balance of the 2003 Golf Course Refunding Bonds, which was $5,775,000, andissued a Taxable Golf Course Refunding Note in the amount of $5,400,000. The original bonds were issued for the purpose ofconstructing a public golf course with related facilities. Income derived from the golf course facility was pledged to pay debtservice on the bonds and to establish a Debt Service Reserve Fund (DSRF) equal to the greatest amount of debt service payablein a fiscal year. The balance in the DSRF at fiscal year-end is $560,000. The reserve funds will not be available for otherpurposes until the maturity of the notes on August 15, 2022. If a deficiency exists in the debt service reserve fund securing thenote, the County is obligated to restore the amount in the DSRF to $560,000 not later than 30 days after the beginning of firstfiscal year following such deficiency. The note does not constitute a pledge of the County’s full faith and credit or taxing power,but the County’s covenant to restore the amount in the DSRF is a general contractual obligation of the County. For fiscal year2019, the net available revenue and debt service payments were ($525,765) and $558,570 respectively.
The County issues tax-exempt bond anticipation notes (BANs) in order to provide interim financing for a portion of the costsof on-going capital projects. On May 26, 2017 the County entered a Credit Agreement for a $200,000,000 Line of Credit whichis repaid annually with the proceeds of General Obligation bonds. The outstanding amount of such notes as of June 30, 2019was $45,476,149. The agreement will expire on May 25, 2020 and the County intends to pay-off prior to the expiration date.
On November 20, 2018, the County borrowed $1,646,000 from Sandy Spring Bank to fund a portion of the cost of a storm waterrestoration project located at 1960 Daisy Road in Woodbine, Maryland. The loan was made through the Maryland Departmentof the Environment (the “MDE”) Linked Deposit Water Quality Program. MDE has placed $1,646,000 on deposit with SandySpring Bank for the ten-year term of the loan. The interest earned on the funds on deposit will be used to offset the marketinterest rate.
The County maintains leasing agreements with Banc of America Public Finance, Key Bank, Sun Trust, TD Asset ManagementFunds, and Zions Bank. The lease agreements financed the acquisition of equipment including transit buses, emergency vehicles,portable radios, water meters, an ERP system, heavy equipment and energy saving equipment. The agreements mature betweenDecember 2019 and June 2030
A summary of debt service requirements to maturity, including principal and interest, for certain long-term obligations at fiscalyear-end are below.
Debt service requirements of governmental activities:
Year ending General County Bonds Agricultural Land ProgramJune 30: Principal Interest* Principal Interest
2020 $ 69,771,600 47,240,884 17,059,529 4,709,4792021 68,239,035 45,481,191 17,838,529 3,453,6182022 73,930,140 42,211,307 7,107,529 2,346,3522023 77,356,030 38,635,776 3,357,529 2,107,9932024 78,706,820 34,843,707 13,587,529 2,024,3492025-2029 358,506,160 119,810,914 24,691,643 3,775,0342030-2034 264,559,040 46,150,302 8,305,486 517,3172035-2039 115,956,653 8,560,542 1,535,464 53,232
Total $ 1,107,025,478 382,934,623 93,483,238 18,987,374*Includes administrative fees
68 Notes to Basic Financial Statements

Debt service requirements of business-type activities:
Yearending Metro District Bonds
Special FacilityRevenue Bonds Water Quality Bonds Broadband Watershed Protection MDE
June 30: Principal Interest Principal Interest Principal Interest* Principal Interest * Principal Interest * Principal Interest *
2020 $ 13,085,000 11,862,574 510,000 49,123 3,457,397 471,449 — 60,950 98,400 63,540 146,226 44,047
2021 10,965,000 12,073,880 522,000 36,364 3,533,036 395,810 1,510,000 60,950 75,965 86,000 150,594 39,678
2022 11,015,000 11,564,780 535,000 23,296 3,610,367 318,479 — 30,750 79,860 82,110 155,097 35,175
2023 11,525,000 11,041,330 650,000 2,588 1,528,976 136,226 1,025,000 30,750 83,970 78,015 159,734 30,537
2024 11,550,000 10,502,605 — — 887,329 107,245 — — 88,180 73,710 164,511 25,760
2025-2029 63,455,000 43,741,372 — — 1,229,876 127,387 — — 513,840 295,860 783,722 52,891
2030-2034 62,215,000 30,165,791 — — 325,866 22,789 — — 645,960 163,734 — —
2035-2039 63,610,000 18,952,498 — — — — — — 748,348 55,935 — —
2040-2044 49,350,000 9,335,813 — — — — — — — — — —
2045-2049 29,790,000 2,335,838 — — — — — — — — — —
Total $ 326,560,000 161,576,481 2,217,000 111,371 14,572,847 1,579,385 2,535,000 183,400 2,334,523 898,904 1,559,884 228,088*Includes administrative fees.
Notes to Basic Financial Statements 69

Tax Incremental Financing Bonds
On March 11, 2014, the County issued its first Special Obligation Bonds (Annapolis Junction Town Center) 2014 Series inthe amount of $17 million, with an overall true interest cost of 6.148%. The proceeds were used to construct a 704-spaceparking garage on 12.73 acres of land dedicated for commuter rail patrons. The County had previously designated the 12.73acres as a Development District, at the site of the MARC Savage Commuter Rail Station. The land is state-owned, thus noreal property taxes were paid to the County for this property. However, County management anticipates opportunities forlocal economic development by putting tax-exempt property on the local tax roll while improving transportation infrastructure.
A companion special taxing district was created as a backup for the Special Obligation bonds. Special taxes will be imposedon property owners located within the special taxing district in any year where the tax increment collections are lower thanthe next year’s debt service obligation and TIF District expenses. The special taxes are also to be pledged for the repaymentof the Special Obligation bonds.
These bonds are not general obligation bonds of the County; rather they are special obligations of the County payable solelyfrom the incremental real property taxes collected within the Development District, any special taxes imposed and collectedfrom the companion Special Tax District, and any Base Realignment and Closure (BRAC) Zone Grant awarded by the Stateof Maryland. The project was approved for designation as a BRAC Zone in June 2009. The total amount of pledged revenueis $33,396,850. A reserve fund in the amount of $1,678,465 was established as part of the debt issuance. This reserve willnot be available for other purposes until the final maturity of the bonds in fiscal year 2044. Additionally, as of fiscal year end,$18,359 is being held by an escrow agent for fiscal year 2019 debt service. Pledged revenues of $1,066,225 were recognizedin fiscal year 2019. The outstanding debt of $16,875,000 is included in the primary government’s long-term debt on theStatement of Net Position.
The bond offering is part of an overall Public Private Partnership (P3) development project known as Annapolis JunctionTown Center. When completed, the entire development project will be a comprehensive mixed-use State Transit-OrientedDevelopment (TOD) and will include 100,000 square feet of Class A office space, 416 luxury apartment units, a 150-roomhotel, 17,250 square feet of retail space and the 700-space parking garage (financed by the general obligations bonds). Theproject will also include two additional parking garages, to be funded privately, to separately support parking needs forbusinesses and residents.
On October 19, 2017, the County issued $48,225,000 of Special Obligation Bonds (Downtown Columbia Project) Series 2017A, with an overall true interest cost of 4.48%. The development project consists of the re-development of a portion of thedowntown area in the unincorporated master-planned community of Columbia, Maryland, one of the first master-plannedcommunities in the United States. Howard Research and Development Corporation intends to develop the downtown area inmultiple phases over approximately 15 to 20 years. The Development District is comprised of approximately 148.6 acreswithin Downtown Columbia excluding The Mall and Merriweather-Symphony Woods neighborhoods. The Special TaxingDistrict consists of an approximately 65-acre parcel located within the Crescent neighborhood of the Development District.Special taxes will be imposed on property owners located within the special taxing district in any year where the tax incrementrevenues are lower than the next year’s debt service obligation and District expenses.
The bond proceeds are being used to finance the construction of roads, intersections, related water, sewer and storm waterimprovements and an EMT/Quick Strike Facility in the Special Taxing District and to pay bond issuance costs. These bondsare not general obligation bonds of the County; rather they are special obligations of the County payable solely from theincremental real property taxes collected on the Phase One properties and any special taxes imposed and collected within theCrescent Special Taxing District. The Phase One properties include The Metropolitan, m.flats, TEN.M, One Merriweather,Two Merriweather, Area One Parking garage, Project 3 Office A, Project 3 Multifamily B, Project 3 Multifamily C, Project3 Office B, Project # Retail and Area Three Parking garage.
The total amount of pledged revenue is $85,283,692. A reserve fund in the amount of $3,921,283 was established as part ofthe debt issuance. This reserve will not be available for other purposes until the final maturity of the bonds in fiscal year 2047.Additionally, as of fiscal year end, $124,434 is being held by an escrow agent for fiscal year 2019 debt service. Pledgedrevenues of $4,137,520 were recognized in fiscal year 2019. The outstanding debt of $48,225,000 is included in the primarygovernment’s long-term debt on the Statement of Net Position.
A summary of debt service requirements to maturity, including principal and interest, for the TIF governmental activities atfiscal year-end are below.
70 Notes to Basic Financial Statements

Debt service requirements of TIF governmental activities:
Year ending Tax Increment Financing Bonds
June 30: Principal InterestAnnual Debt
Service2020 $ 90,000 3,108,784 3,198,7842021 315,000 3,104,464 3,419,4642022 245,000 3,090,944 3,335,9442023 275,000 3,079,984 3,354,9842024 690,000 3,067,584 3,757,5842025-2029 6,460,000 14,716,369 21,176,3692030-2034 10,270,000 12,873,735 23,143,7352035-2039 14,910,000 10,073,532 24,983,5322040-2044 23,920,000 5,530,520 29,450,5202045-2047 7,925,000 534,375 8,459,375
Total $ 65,100,000 59,180,291 124,280,291
Notes to Basic Financial Statements 71

B. Component Units
The changes in long-term obligations for the component units for the fiscal year are as follows:
BeginningBalance
EndingBalanceComponent Unit Additions Reductions
Community College:Compensated absences, net OPEB liability andnet pension liability $ 38,137,176 2,128,029 978,471 39,286,734
*Housing:Loans, compensated absences and net pensionliability 251,524,681 36,207,062 36,657,895 251,073,848
Library:
Compensated absences and net OPEB liability 16,393,492 1,830,653 197,063 18,027,082
Public School System:Capital leases, workers compensation,compensated absences, net OPEB liability and netpension liability 777,556,536 35,495,989 6,532,794 806,519,731
Total $ 1,083,611,885 75,661,733 44,366,223 1,114,907,395*Restated per GASB75; Financial statements for the Housing Commission are reported on a calendar year basis.
72 Notes to Basic Financial Statements
8. Short-Term Debt
The changes in short-term debt for the primary government for the fiscal year are as follows:
BeginningBalance
EndingBalanceType Issued Retired
Bond Anticipation Notes $ 54,987,329 176,656,467 186,167,647 45,476,149
Bond anticipation notes (BANS) are issued to finance expenditures of certain capital projects and will be repaid from theproceeds when the County issues debt.
9. Conduit Debt
From time-to-time, the County has issued Industrial Revenue Bonds, Economic Revenue Development Bonds, RetirementCommunity Revenue Bonds, and Recovery Zone Facility Revenue Bonds to provide financial assistance to private-sectorentities for the acquisition and construction of industrial and commercial facilities deemed to be in the public interest. Thebonds are secured by the property financed and are payable solely from payments received on the underlying mortgage loans.Upon repayment of the bonds, ownership of the acquired facilities transfers to the private-sector entity served by the bondissuance. Neither the County, the State, nor any political subdivision thereof, is obligated in any manner for repayment of thebonds. Accordingly, the bonds are not reported as liabilities in the accompanying financial statements.
At fiscal year-end, there were 21 series of conduit debt outstanding. The aggregate principal amount outstanding for the 12series issued after July 1, 1996 was $93,428,065. The aggregate principal amount outstanding for the 9 series issued prior toJune 30, 1996 could not be determined; however, their original issue amounts totaled $59,155,000.

10. Lease Obligations
Notes to Basic Financial Statements 73
A. Operating Leases - Primary Government
The County is committed under various long-term operating lease agreements for office space as lessee. Lease expendituresfor the fiscal year amounted to $3,428,610.
Future lease payments including any agreed-upon percentage increases are as follows:
Fiscal Year2020 $ 5,264,0132021 5,084,5682022 5,082,1252023 4,056,8412024 4,056,841
2025-2029 18,489,626
The County, as lessor, leases County-owned tower space under various long-term operating lease agreements.
Lease revenues for the year amounted to $1,986,441. Future lease revenues are as follows:
Fiscal Year2020 $ 1,341,8252021 987,9282022 891,2632023 883,1062024 898,355
2025-2029 3,165,060
B. Capital Leases
The County maintains lease agreements with Grant Capital Management Inc., Key Bank and TD Asset Management Fund,for financing the acquisition of equipment. These lease agreements qualify as capital leases for accounting purposes, andtherefore, have been recorded at the present value of their future minimum lease payments as of the inception dates of theleases.
The assets acquired and placed in service are as follows:
Machinery and equipment $ 28,308,824Less: accumulated depreciation (10,597,370)
Total asset value under capital leases $ 17,711,454
The leases have maturity dates ranging from December 2019 to June 2030. The County makes annual principal and interestpayments.

The future minimum lease obligations and the net present value of these minimum lease payments as of June 30, 2019 are asfollows:
Year ending June 30: Activities2020 $ 5,330,0932021 4,662,1772022 4,516,3612023 4,340,4312024 4,047,2392025-2029 12,546,9852030 —Total minimum lease payments 35,443,286
Less: amount representing interest (3,839,892)Present value of minimum lease payments $ 31,603,394
74 Notes to Basic Financial Statements
11. Restricted Assets
Federal and State grants, water and sewer assessments, user charges, in-aid-of-construction charges, developer contributions,and bond and loan proceeds for purposes of construction of the water and sewer system are restricted. The cumulative amountsof other non-operating revenues are available for construction activities and reflected as restricted net position. Assets andliabilities arising from the construction and operation of the County’s publicly owned golf course are restricted in the SpecialRecreation Facility Fund. Restricted assets also include funds that are legally restricted for special purposes such as publichousing projects.

12. Fund Equity
The governmental fund balances at June 30, 2019 are composed of the following:
General Fund
AgriculturalLand
PreservationFund
General CapitalProjects Funds
OtherGovernmental
Funds Total
FUND BALANCESNonspendable:
Inventory $ 624,672 — — 668,338 1,293,010Prepaid items 8,104 — — 2,704 10,808
Long-term receivable:Due from component units 11,632,263 — — — 11,632,263
Total nonspendable 12,265,039 — — 671,042 12,936,081
Restricted for:Catalyst loan program — — — 1,024,177 1,024,177Economic developmentinitiative — — — 741,484 741,484Fee in lieu — — — 469,647 469,647Fire & rescue services — — — 11,927,046 11,927,046Forest conservation — — — 1,964,542 1,964,542Middle Patuxentenvironmental area program — — — 44,511 44,511Open space — — — 576,876 576,876Parkland watershed facilities — — — 13,602,040 13,602,040Program revenue — — — 568,509 568,509Public road facilities — — — 61,223,169 61,223,169Public school facilities — — 20,944,530 — 20,944,530Speed enforcement — — — 805,201 805,201Tax increment financingproject — — 14,667,797 12,532,627 27,200,424Permanent PublicImprovement Contribution — — 1,157,451 — 1,157,451
Total restricted — — 36,769,778 105,479,829 142,249,607
Committed for:Budget stabilization account 73,958,202 — — — 73,958,202Agricultural land preservation — 1,162,093 — — 1,162,093Community renewal programs — — — 32,067,143 32,067,143Environmental services — — — 9,246,805 9,246,805Firehouse & training facilities — — — 8,064,285 8,064,285Recreation programs — — — 3,933,859 3,933,859
Total committed 73,958,202 1,162,093 — 53,312,092 128,432,387
(Continued)
Notes to Basic Financial Statements 75

General Fund
AgriculturalLand
PreservationFund
General CapitalProjects Funds
OtherGovernmental
Funds Total
Assigned for:Capital projects — — — 3,227,918 3,227,918Funding for one timeexpenditures 3,594,032 — — — 3,594,032Future balloon payments — 42,810,778 — — 42,810,778Pay-as-you-go contributionsto capital projects 5,703,000 — — — 5,703,000Policy Reserve 7,500,000 — — — 7,500,000Purchase commitments 15,487,067 — — — 15,487,067Streetlights — — — 1,432,857 1,432,857Subsequent year's budgetstabilization account 3,713,084 — — — 3,713,084Subsequent year'sexpenditures — 14,916,166 — — 14,916,166
Total assigned 35,997,183 57,726,944 — 4,660,775 98,384,902
Unassigned 18,387,493 — (70,216,801) (40,456,116) (92,285,424)
Total fund balance $ 140,607,917 58,889,037 (33,447,023) 123,667,622 289,717,553
76 Notes to Basic Financial Statements

13. Landfill Closure and Post-Closure Care Cost
State and Federal laws and regulations require the County to place a final cover cap on closed cells at the currently operatingAlpha Ridge Landfill and to perform certain maintenance and monitoring functions at the landfill site for a minimum periodof 30 years after closure. The County recognizes a portion of these costs in each operating period based on landfill capacityused as of each fiscal year-end. Closure and post-closure care costs are paid after each cell is filled to capacity. The closurecap for a 70-acre inactive landfill cell was completed in fiscal year 2000. A separate active lined landfill cell is projected toclose no earlier than 2050 if current operating conditions continue and will be capped at that time. In addition, the Countyhas constructed closure caps and groundwater treatment systems at two older closed landfills, and the post-closure operatingcost are included in the Environmental Services Fund budget. The long-term liability for these older landfills has been removedfrom long-term debt. Future total closure and post-closure care costs for the Alpha Ridge Landfill as determined throughengineering studies will approximate $29,424,184. Actual costs may differ due to inflation or future design changes. TheCounty ceased using the Alpha Ridge Landfill as its primary disposal site as of March 1997, and thus it is not expected to usethe landfill to its full capacity in the foreseeable future. The County is exporting waste to a regional landfill in Virginia. Theremaining capacity at the landfill will be held for backup or future use. At fiscal year-end, the County has recognized$23,430,000 of these costs. This cumulative amount reported to date is based on the use of 69.93% of the existing cell and100% of the closed cell. The total current cost of closure and post-closure care to be recognized in future years is $5,994,184.The County intends to finance these costs through the proceeds of bonds and through its annual operating budget. The GeneralFund has been used in prior years to liquidate the liability.
Notes to Basic Financial Statements 77
14. Tax Abatements
As of June 30, 2019, the County provides tax abatements through the Pilot Program and Commercial or Industrial BusinessProgram.
PILOT (Payment in Lieu of Taxes)
Nixon Farm
In accordance with Howard County Council Resolution No. 11-2018, the County approved the terms and conditions of aPayment in Lieu of Taxes Agreement with the owners of 2800 Nixon's Farm Lane, LLC, regarding the construction andoperation of an alternative and renewable energy project. Pursuant to Section 7-514 of the Tax-Property Article of the AnnotatedCode of Maryland, the County permits the owners to make payments in lieu of County real property taxes. The code provides,among other things, that real property may be exempt from County property tax and to induce the development of sustainableenergy projects, the County agrees to abate County real property taxes for the property on a sliding scale as follows:
a) For years 1 through 7 from the effective date, all Howard County real property taxes for the Property shall be abateand the owners shall pay to the County in lieu of such taxes, $1 each year;
b) For years 8 through 14 from the effective date, the owners shall receive a thirty percent (30%) abatement of allHoward County real property taxes for the property;
c) For years 15 through 20 from the Effective Date, the owners shall receive a twenty percent (20%) abatement of allHoward County real property taxes for the property.
No other commitments were made by the County as part of this agreement.
Housing
In accordance with Howard County Code Sec. 13.1320. Property of Commission tax-exempt; exemption of property fromlevy and execution, the property of the Commission is declared to be used for essential public and governmental purposesand the Commission and its property are exempt from all taxes and special assessments of the County or the State. The HousingCommission which is a separate legal entity serves as the Public Housing Authority for the purpose of developing and managinghousing resources for low and moderate income residents of Howard County. The Commission also owns and managesresidential property, maintains these properties, develops affordable housing opportunities for the citizens of Howard Countythrough partnerships with developers or land acquisition for development, and operates the Housing Choice Voucher. In lieuof County taxes and special assessments, the Commission makes payments to the County in an amount set by mutual agreement

between the Commission and the County; provided, however, that the sum to be paid to the County does not exceed an amountequal to the regular taxes levied upon similar property.
By virtue of this agreement, all real property of the Commission is exempt from levy and sale and no execution or otherjudicial process shall issue against the same, nor shall any judgment against the Commission be a charge or lien upon its realproperty. The provisions shall not limit a right to foreclose or otherwise enforce:
(1) Any mortgage or deed of trust recorded against any property of the Commission; or(2) Any pledge or lien given by the Commission on its rents, fees, or revenues.(3) May not deprive the County of its right to collect any service charge agreed upon in lieu of taxes in the same manner asall such taxes are now, or may hereafter be, collectible under the laws of this State and of the County.
No other commitments were made by the County as part of these agreements. Commercial or Industrial Business
In accordance with § 9-315(a)(3) of the Tax-Property Article, Annotated Code of Maryland, there is a Howard County propertytax credit against the tax on real property owned or occupied by a commercial or industrial business that engaged in an activityidentified in the Howard County Economic Development Strategic Plan as a target for the County's business attraction andretention efforts. A commercial or industrial business qualifies for a tax credit under this section if the business:
(1) Applies for the credit under procedures of Howard County Code Sec.20.123-Commerical or industrial business(2) (i) Owns real property in Howard County that is new construction, or an improvement to an existing facility; or(ii) Subject to the provisions of subsection (f)(2) of this section, rents or leases real property in Howard County that is newconstruction or an improvement to an existing facility;(3) Is currently or will be doing business in Howard County;(4) Will employ at least 12 additional full-time local employees by the second year in which the credit is allowed, not includingan employee filling a job created when a job function is shifted from an existing location in the State to Howard County; and(5) Makes a substantial investment in Howard County which includes the acquisition of a building, land, or equipment thattotals at least $2,000,000; or the creation of ten positions with salaries greater than the current average wage in Howard County.
The tax credit under this section shall be granted annually for a term not to exceed ten years beginning with the first tax yearin which the real property tax would increase as a result of an increase in assessment due to new construction or an improvementto an existing facility. The tax credit under this section may not exceed the amount of the County property tax imposed onthe property that is a result of an increase in assessment due to the new construction or improvement. Because taxes are abatedafter the qualifying spending has taken place, there are no provisions for recapturing abated taxes. No other commitmentswere made by the County as part of these agreements.
For the fiscal year ended June 30, 2019, the County abated taxes totaling $1,492,585 including the following tax abatementagreement/s that exceeds 10 percent of the total amount abated:
Tax Abatement ProgramAmount of Taxes
Abated
PILOT (Payment in Lieu of Taxes) $ 1,453,661
78 Notes to Basic Financial Statements

15. Retirement Plans
Summary of Significant Accounting Policies
Pension: For purposes of measuring the net pension liability, deferred outflows of resources and deferred inflows of resourcesrelated to pensions, and pension expense, information about the fiduciary net position of the Howard County Retirement Plan(HCRP) and Police and Fire Employees’ Plan (PFEP) and additions to/deductions from the two plans’ fiduciary net positionhave been determined on the same basis as they were reported by each plan as of the June 30, 2018 measurement date. Thefinancial statements of the Plans were prepared using the accrual basis of accounting. Plan member contributions are recognizedin the period in which the contributions are due. Benefits and refunds are recognized when due and payable in accordancewith the terms of the plan. Employee and employer contributions are recognized as revenues in the period in which employeeservices are performed and expenses, benefits, and refunds are recorded when the corresponding liabilities are incurred,regardless of when payment is made. Investments were reported at fair value.
General Information about the Pension Plans
Plan description: The Howard County Retirement Plan (“Retirement Plan”) and the Howard County Police and Fire Plan(“Police and Fire Plan”) are single-employer defined benefit public employee retirement plans administered by HowardCounty, Maryland, which provide retirement benefits as well as death and disability benefits and cost-of-living adjustments.
The Plans were established and operate under the provisions of the Howard County Code, Sections 1.400, 1.401 to 1.478,and 1.401A to 1.478A. Essentially all the County full-time benefited and part-time benefited employees are eligible toparticipate in one of the Retirement Plans, except for certain exceptions provided for in Howard County Code Section 1.406.
Responsibilities for administration and operation of the Retirement Plan and Police and Fire Plan vest in Retirement Committeeswith seven members each (“Committees”). The Committees have authority to establish and amend the respective benefit andcontribution provisions.
Generally, the majority of employees of the primary government, except certain police officers and fire personnel, participatein the Retirement Plan, which was established July 1, 1995. As of that date, approximately 73 percent of the County employeesparticipating in the Maryland State Retirement Systems, described below, transferred to the Retirement Plan. Police officersand fire personnel participate in the Police and Fire Plan, which was established July 1, 1990.
The remaining employees of the primary government participate in the State Employees Retirement System (“RetirementSystem”) established October 1, 1941, and the State Employees’ Pension System (“Pension System”) established January 1,1980. These cost-sharing multiple-employer defined benefit systems administered by the Maryland State Retirement Systemswere established under the provisions of Article 73B of the Annotated Code of Maryland. Responsibility for administrationand operation of the systems vests in a 14-member Board of Trustees (“Trustees”). The respective costs and related pensionliability of the Retirement Plan are not significant.
Both the Retirement Plan and the Police and Fire Plan issue separate audited financial reports which may be obtained bywriting to: Howard County, Maryland, Director of Finance, 3430 Court House Drive, Ellicott City, Maryland 21043, or byaccessing the reports online at www.howardcountymd.gov.
A. Howard County Retirement Plan:
Benefits provided: Under the Retirement Plan, participants become vested after five years of eligibility service and are entitledto a benefit beginning at age 62. If an employee leaves employment or dies before five years of eligibility service, accumulatedemployee contributions plus interest are refunded to the employee or designated beneficiary.
A participant who becomes totally and permanently disabled may retire prior to normal retirement and receive a benefit. Bothdisability and death benefits vary if incurred in the line of duty.
Participating general employees with 30 years of eligibility service, regardless of age, or who attain the age of 62 and older,with two to five years of eligibility service (for a total of 67 years), are entitled to a normal retirement benefit. For creditableservice earned prior to June 30, 2012, the benefit is 1.55% of the participant’s average compensation times the participant’screditable service; for creditable service after July 1, 2012, the multiplier is 1.66%. The Plan permits early retirement for
Notes to Basic Financial Statements 79

participants who attain the age of 55 with at least 15 years of Eligibility Service or have 25 years of eligibility service, regardlessof age. For early retirement, the benefit is reduced by 0.5% for each month that the benefit begins prior to normal retirementdate.
For participating AFSCME Local 3085, the benefit is 1.66% of the participant’s average compensation times all years ofcreditable service.
Participating Corrections employees are entitled to receive a normal retirement benefit of 2.5% of average compensationmultiplied by years of creditable service (up to 20 years) plus 1.0% of average compensation multiplied by creditable servicegreater than 20 years but less than 30 years (excluding sick leave, which is always credited at 1.0% of average compensation).Normal retirement is the attainment of age 62 and older, with two to five years of eligibility service (for a total of 67 years),or the completion of 20 years of eligibility service regardless of age.
Annually, the retirement benefits are adjusted for cost of living adjustment (“COLA”). The Plan uses the Consumer PriceIndex (“CPI-U”) for the Baltimore/Columbia/Towson area as published by the Bureau of Labor Statistics to calculate thechange in retiree allowances each July. The Maximum annual COLA is 3%. A retiree must be in pay status 12 or more monthsto be awarded a COLA.
Employees covered by benefit terms: At July 1, 2017, the following employees were covered by the benefit terms:
Inactive employees or beneficiaries currently receiving benefits 748Inactive employees entitled to but not yet receiving benefits 191Active employees 1,803
Total 2,742
Contributions: The Plan is authorized to establish or amend the obligation to make contributions under the provisions ofSections 1.423 and 1.465 of the Howard County Code. The Plan's funding policy provides for periodic employer contributionsat actuarially determined rates that, expressed as percentages of annual covered payroll, are sufficient to accumulate adequateassets to pay benefits when due. Participant contributions are 8.5% of base pay for participating Corrections participants withless than 20 years of creditable service, 0% for Corrections participants with greater than 20 years of creditable service, and,effective January 1, 2014, 3.0% of base pay for other participants. The County funds the remainder of the cost of its employees’participation in the Retirement Plan which was 12.4% of covered payroll in fiscal years 2018 and 2017, respectively.
Net Pension Liability
The County’s net pension liability was measured as of June 30, 2018, and the total pension liability used to calculate the netpension liability was determined by an actuarial valuation as of July 1, 2017 rolled forward to June 30, 2018.
Actuarial Assumption: The total pension liability was determined by an actuarial valuation as of July 1, 2017 rolled forwardto June 30, 2018 using the following actuarial assumptions, applied to all periods included in the measurement:
Inflation 2.75 percentSalary increases Varies by service, 4.00 to 6.75 percent, including inflationInvestment rate of return 7.50 percent, net of pension plan investment expense,
including inflationMortality RP-2000 Combined Healthy tables with generational
projection by Scale AA.
The actuarial assumptions used in the July 1, 2017 valuation were based on the 2014 Experience Study covering the periodof July 1, 2009 through June 30, 2013.
The long-term expected rate of return on pension plan investments was determined using a building-block method in whichbest-estimate ranges of expected future real rates of return (expected returns, net of pension plan investment expense andinflation) are developed for each major asset class. These ranges are combined to produce the long-term expected rate of
80 Notes to Basic Financial Statements

return by weighting the expected future real rates of return by the target asset allocation percentage and by adding expectedinflation.
The target allocation and best estimates of geometric real rates of return for each major asset class are summarized in thefollowing table:
Asset Class Target AllocationLong-Term Expected
Rate of ReturnEquities 40.0% 5.37%Fixed income 30.0% 3.50%Alternative investments 22.5% 6.05%Real assets 7.50% 5.45%
Total 100.0%
For the year ended June 30, 2018, the annual money-weighted rate of return on pension plan investments, net of the pensionplan investment expense, was 8.55 percent.
Discount rate: The discount rate used to measure the total pension liability was 7.50 percent. The projection of cash flowsused to determine the discount rate assumed that employee contributions will be made at the current contribution rate andthat County contributions will be made at rates equal to the difference between total actuarially determined contribution ratesand the employee rate. Based on those assumptions, the pension plan’s fiduciary net position was projected to be availableto make all projected future benefit payment of current active and inactive employees. Therefore, the long-term expected rateof return on pension plan investments was applied to all periods of projected benefit payments to determine the total pensionliability.
Changes in the Net Pension Liability
Total PensionLiability
Plan FiduciaryNet
PositionNet Pension
Liability(a) (b) (a) - (b)
Balances at 6/30/2017 $ 445,552,992 410,114,885 35,438,107Changes for the year:
Service cost 16,918,575 — 16,918,575Interest 32,786,122 — 32,786,122Changes of benefit terms — — —Differences between expected and actual experience 379,328 — 379,328Changes of assumptions — — —Contributions - employer — 14,841,120 (14,841,120)Contributions - member — 4,155,758 (4,155,758)Net investment income — 35,807,945 (35,807,945)Benefit payments, including refunds of employee contributions (16,809,399) (16,809,399) —Administrative expense — (350,799) 350,799
Net changes 33,274,626 37,644,625 (4,369,999)
Balance as of 6/30/2018 $ 478,827,618 447,759,510 31,068,108
Sensitivity of the net pension liability to changes in the discount rate: The following presents the net pension liability of theCounty and the component units participating in the General Employees Plan (Economic Development Authority (1) andHousing Commission), calculated using the discount rate of 7.50 percent, as well as what the County’s net pension liabilitywould be if it were calculated using a discount rate that is 1 percentage-point lower (6.50 percent) or 1 percentage-point higher(8.50 percent) than the current rate:
Notes to Basic Financial Statements 81

1% Decrease (6.50%)
Current Discount Rate
(7.50%)
1% Increase (8.50%)
County's net pension liability $ 89,734,450 30,115,355 (19,810,734)Economic Development Authority1 1,452,778 487,560 (320,731)Housing Commission 1,386,131 465,193 (306,017)
Total $ 92,573,359 31,068,108 (20,437,482)1Economic Development Authority statements are not included in the County’s CAFR due to immateriality.
Pension plan fiduciary net position: Detailed information about the pension plan’s fiduciary net position is available in theseparately issued financial reports for both Plans.
Pension Expense and Deferred Outflows of Resources and Deferred Inflows of Resources Related to Pensions
For the year ended June 30, 2018, the County and the participating component units recognized pension expense of $12,500,566,and $395,478 respectively. The County's share of deferred outflows of resources and deferred inflows of resources related tothe pension is reported below. The portions allocated to the component units are not reported due to immateriality for EconomicDevelopment Authority and a different fiscal year end for Housing.
Deferred Outflowsof Resources
Deferred Inflows ofResources
Differences between expected and actual experience $ 315,167 7,816,132Changes of assumptions 3,023,756 353,514Net difference between projected and actual
earnings on pension plan investments — 2,888,528Changes in proportion 115,556 —Contributions subsequent to the measurement date 13,766,516 —
Total $ 17,220,995 11,058,174
Other than contributions subsequent to the measurement date ($13,766,516), which will be recognized as a reduction of thenet pension liability in the fiscal year ended June 30, 2020, amounts reported as deferred outflows of resources and deferredinflows of resources related to pensions will be recognized in pension expense for the fiscal years ended June 30:
2020 $ 2,449,0592021 (588,239)2022 (6,356,550)2023 (2,350,879)2024 (808,966)
Thereafter 51,880Total $ (7,603,695)
B. Police and Fire Plan:
Benefits provided: All of the County’s full-time career police and fire officers hired on or after July 1, 1990 must enroll inthe Police and Fire Plan. The Plan provides retirement benefits as well as death and disability benefits and cost-of-livingadjustment.
Participants become vested after five years of eligibility service and are entitled to a benefit beginning at age 62. Terminatedvested employees with less than 20 years of service will receive a benefit equal to 2.5% of average compensation times thenumber of years of creditable service, payable at age 62. If an employee leaves employment or dies before five years ofeligibility service, accumulated employee contributions plus interest are refunded to the employee or the designated beneficiary.A participant who becomes totally and permanently disabled may retire prior to normal retirement and receive a benefit. Bothdisability and death benefits vary if incurred in the line of duty.
82 Notes to Basic Financial Statements

Employees who attain the age of 62 with at least five years of eligibility service and employees who have completed 20 yearsof eligibility service, if at least 10 years were served as a covered employee, are entitled to a normal retirement benefit. Theamount will vary, based on the number of years of creditable service, from 50% (with 20 years of service) to 80% (with 30years of service) of average compensation for police, and from 50% (with 20 years of service) to 70% (with 30 years ofservice) of average compensation for firefighters.
Annually, the retirement benefits are adjusted for COLA. The Plan uses the CPI-U for the Baltimore/Columbia/Towson areaas published by the Bureau of Labor Statistics to calculate the change in retiree allowances each July. The Maximum annualCOLA is 2%. A retiree must be in pay status 12 or more months to be awarded a COLA.
Employees covered by benefit terms: At July 1, 2017, the following employees were covered by the benefit terms:
Inactive employees or beneficiaries currently receiving benefits 374Inactive employees entitled to but not yet receiving benefits 18Active employees 904
Total 1,296
The Plan offers a program called Deferred Retirement Option Plan (DROP). This is a voluntary benefit program which offersqualified active Participants, who would be entitled to retire and receive benefits, the option to continue working. An individualDROP record is created and is credited with the monthly retirement benefits that would have been paid during the DROPperiod had the participant actually retired. The record is also credited with the required employee contributions and interest.The payment is made to the employee, in addition to the benefit payment entitled under the defined benefit plan based on theearlier years of service, when the employee eventually retires. Participating members may elect distribution as one lump sumpayment, a rollover or in monthly payments. Balance held by plan as of June 30, 2018 is $17,149,709.
Contributions: The Plan is authorized to establish or amend the obligations to make contributions under the provisions of theHoward County Code, Sections 1.423A and 1.465A. The Plan’s funding policy provides for periodic employer contributionsat actuarially determined rates that, expressed as percentages of annual covered payroll, are sufficient to accumulate sufficientassets to pay benefits when due. For employees with less than 30 years of service, participant contributions are 11.6% of payfor participating Police Department Employees and 7.7% of pay for participating Fire Department Employees. Employeeswith 30 or more years pay no participant contributions.The County funds the remainder of the cost of its employees’participation in the Police and Fire Plan, which was 32.5% and 30.6% of covered payroll in fiscal years 2018 and 2017,respectively.
Net Pension Liability
The County’s net pension liability was measured as of June 30, 2018, and the total pension liability used to calculate the netpension liability was determined by an actuarial valuation as of July 1, 2017 rolled forward to June 30, 2018.
Actuarial Assumptions: The total pension liability in the July 1, 2017 actuarial valuation rolled forward to June 30, 2018 wasdetermined using the following actuarial assumptions, applied to all periods included in the measurement:
Inflation 2.75 percentSalary increases Varies by service, 4.25 to 7.55 percent, including inflation
Investment rate of return 7.50 percent, net of pension plan investment expense,including inflation
Mortality RP-2000 Combined Healthy tables with generationalprojection by Scale AA.
The actuarial assumptions used in the July 1, 2017 valuation were based on the 2014 Experience Study covering the periodof July 1, 2009 through June 30, 2013.
Notes to Basic Financial Statements 83

The long-term expected rate of return on pension plan investments was determined using a building-block method in whichbest-estimate ranges of expected future real rates of return (expected returns, net of pension plan investment expense andinflation) are developed for each major asset class. These ranges are combined to produce the long-term expected rate ofreturn by weighting the expected future real rates of return by the target asset allocation percentage and by adding expectedinflation.The target allocation and best estimates of geometric real rates of return for each major asset class are summarized in thefollowing table:
Asset Class Target AllocationLong-Term Expected
Rate of ReturnEquities 40.0% 5.37%Fixed income 30.0% 3.50%Alternative investments 22.5% 6.05%Real assets 7.5% 5.45%
Total 100.0%
For the year ended June 30, 2018, the annual money-weighted rate of return on pension plan investments, net of the pensionplan investment expense, was 8.55 percent.
Discount rate: The discount rate used to measure the total pension liability was 7.50 percent. The projection of cash flowsused to determine the discount rate assumed that employee contributions will be made at the current contribution rate andthat County contributions will be made at rates equal to the difference between total actuarially determined contribution ratesand the employee rate. Based on those assumptions, the pension plan’s fiduciary net position was projected to be availableto make all projected future benefit payments of current active and inactive employees. Therefore, the long-term expectedrate of return on pension plan investments was applied to all periods of projected benefit payments to determine the totalpension liability.
Changes in the Net Pension Liability
Total PensionLiability
Plan Fiduciary NetPosition
Net PensionLiability
(a) (b) (a) - (b)
Balances at 6/30/2017 $ 637,712,072 516,255,787 121,456,285Changes for the year:
Service cost 21,108,198 — 21,108,198Interest 46,900,089 — 46,900,089Changes of benefit terms — — —Differences between expected and actual experience 13,530,486 — 13,530,486Changes of assumptions — — —Contributions - employer — 26,337,085 (26,337,085)Contributions - member — 7,859,400 (7,859,400)Net investment income — 46,560,088 (46,560,088)Benefit payments, including refunds of employee contributions (24,755,084) (24,755,084) —Administrative expense — (355,240) 355,240
Net changes 56,783,689 55,646,249 1,137,440
Balance as of 6/30/2018 $ 694,495,761 571,902,036 122,593,725
84 Notes to Basic Financial Statements

Sensitivity of the net pension liability to changes in the discount rate: The following presents the net pension liability of theCounty, calculated using the discount rate of 7.50 percent, as well as what the County’s net pension liability would be if itwere calculated using a discount rate that is 1 percentage-point lower (6.50 percent) or 1 percentage-point higher (8.50 percent)than the current rate:
1%Decrease
CurrentDiscount Rate
1%Increase
(6.5)% (7.5)% (8.5)%County's net pension liability $ 221,639,954 122,593,725 41,463,640
Pension plan fiduciary net position: Detailed information about the pension plan’s fiduciary net position is available in theseparately issued financial reports for both Plans.
Pension Expense and Deferred Outflows of Resources and Deferred Inflows of Resources Related to Pensions
For the year ended June 30, 2018, the County recognized pension expense of $25,373,063. The County reported outflows ofresources and deferred inflows of resources related to pensions from the following sources:
DeferredOutflows
of Resources
Deferred Inflowsof
ResourcesDifferences between expected and actual experience $ 22,260,736 957,962Changes of assumptions 16,634,566 —Net difference between projected and actual earnings on pension planinvestments 4,657,094Contributions subsequent to the measurement date 27,719,839 —
Total $ 66,615,141 5,615,056
Other than contributions subsequent to the measurement date ($27,719,839), which will be recognized as a reduction of thenet pension liability in the fiscal year ended June 30, 2020, amounts reported as deferred outflows of resources and deferredinflows of resources related to pensions will be recognized in pension expense for the fiscal years ended June 30:
2020 $ 9,453,0112021 5,528,4212022 261,3112023 4,633,2352024 4,467,773
Thereafter 8,936,495Total $ 33,280,246
Notes to Basic Financial Statements 85

C. Employer Aggregate Pension Disclosure
General Police & Fire TotalAs of June 30, 2018: Total net pension liabilities $ 30,115,355 122,593,725 152,709,080 Total pension assets 448,243,834 572,493,836 1,020,737,670 Total deferred outflows of resources from pension 17,220,995 66,615,141 83,836,136 Total deferred inflows of resources from pension 11,058,174 5,615,056 16,673,230
For the year ended June 30, 2018: Total pension expense $ 12,500,566 25,373,063 37,873,629
Note: Excludes component units. EDA is not included in the CAFR due to immateriality; Housing Commission has a different fiscal year end; Public Schools,Community College and Library participate in the Maryland State Retirement Plans.
D. Component Units:
Generally, all employees of three of the component units (Board of Education, Howard Community College and Library) arecovered by the Maryland State Retirement and Pension System (the System), which is a cost-sharing, multi-employer definedbenefit pension plan. The System was established by the State Personnel and Pensions Article of the Annotated Code ofMaryland to provide retirement allowances and other benefits to State employees, teachers and employees of participatinggovernmental units. The plans are administered by the State Retirement Agency.
These three component units adopted GASB 68 for the year ended June 30, 2015 and reported their proportionate share ofthe collective pension amounts calculated by the Maryland State Retirement and Pension System. The net pension liabilitywas measured as of June 30, 2018 and the total pension liability used to calculate the net pension liability was determined byan actuarial valuation as of that date. The proportionate share of these component units’ net pension liability was based on aprojection of its long-term share of contributions to the pension plan relative to the projected contributions of all participatingreporting units, actuarially determined.
As of June 30, 2019, the Howard County School System and Howard County Community College proportions for the Systemwere 0.230% and 0.0121%, respectively. Howard County School System and Howard County Community College reportednet pension liabilities of $48,232,399 and $2,546,231, respectively. For the year ended June 30, 2018, Howard County SchoolSystem and Howard County Community College recognized pension expense of $6,889,517 and $359,231 (related to theemployee's system only and does not include amounts that may be included in the state paid benefits), respectively. HowardCounty Library has no expense for pension costs, is not responsible for unfunded pension obligation and did not report anynet pension liability due to a special funding situation.
86 Notes to Basic Financial Statements
16. Other Post-Employment Benefits (OPEB)
Summary of Significant Accounting Policies
For purposes of measuring the net OPEB liability, deferred outflows of resources and deferred inflows of resources related topensions, and pension expense, information about the fiduciary net position of the Howard County OPEB Plan and additionsto/deductions from the plan’s fiduciary net position have been determined on the same basis as they were reported by the planas of June 30, 2018 which is the measurement date. The financial statements of the Plan were prepared using the accrual basisof accounting. Expenditures are recognized on the accrual basis as retirees’ insurance costs are incurred. The Plan’s insurancecosts are paid by the retirees, the County and its component units through the County’s self-insurance fund (internal servicefund).

Plan Description
The County’s OPEB plan is a Cost-Sharing Multiple Employer Defined Benefit Healthcare Plan. Per Section 1.406B of HowardCounty Bill No. 14-2008, the County established an irrevocable trust for administering the plan assets and paying healthcarecosts on behalf of the participants. The Plan includes the County (consisting of the County government and Howard CountySoil Conservation District) and its component units: Howard Community College, Howard County Public School System,Howard County Library, Howard County Economic Development Authority, and Howard County Housing Commission. ThePlan is administered and overseen by a Board of Trustees comprised of the Chief Administrative Officer, the Director of Finance,and Budget Administrator.
The County provides a post-employment health insurance program in addition to the pension benefits described in Note 15.These post-employment benefits are subject to change at any time. All employees who retire from the County may participatein the program. In order to be eligible, the retiree must have a minimum of 15 years of County service and, immediatelypreceding retirement, have been enrolled in a medical, vision or prescription drug insurance plan offered to active employeesof the County. The County will pay a percentage of the retiree’s health insurance premium based upon these criteria. Thispercentage varies with the number of years of service attained by the employee. Other retirees who do not meet the eligibilitycriteria are permitted to participate in the retirees’ health insurance program by paying the full premium at the group rate.
The component units provide medical benefits to eligible employees who retire from employment with the entity. The eligibilityrequirements vary among different entities. Each entity pays a percentage of the health insurance premium based on certaincriteria. In addition to medical benefits, the school system offers life insurance benefits to eligible retirees who have provided10 years of service with the school system and have retired from the Howard County Public School System.
Plan membership per the actuarial valuation as of January 1, 2018 consisted of the following:
Retirees and beneficiaries receiving benefits 3,398Active plan members 10,111Deferred vested terminations 29
Total 13,538
There are no separate financial statements for the Plan.
Funding Policies and Funded Progress from Employer’s Perspective under GASB Statement No. 75
The Plan’s funding policy provides for the County to contribute to the trust as determined by the County budget. During thefiscal year, the County’s proportionate share of the collective net other post-employment benefits liability is 32.09% of the$16,000,000 contributed to the trust by the County, or $5,134,400. The County budget for fiscal year 2019 included fundingfor pay-as-you-go OPEB costs as well as $15,724,000 to the trust.
Based on the most recent actuarial valuation which was prepared as of July 1, 2017 and rolled forward to June 30, 2018, theactuarially calculated proportionate share of total OPEB liability as of the measurement date of June 30, 2018 was $417,863,617and there was $41,532,494 of actuarial plan assets; therefore, the net OPEB liability for the County was $376,331,122. Theplan fiduciary net position as a percentage of the total OPEB liability was 9.94%.
Actuarial Assumptions
The actuarial methods and significant assumptions used by the actuary are summarized on the next page to conform to thedisclosure requirements for GASB Statement 75.
Notes to Basic Financial Statements 87

Actuarial cost method Entry Age Normal
Projected cash flows
Member and County contributions will continue to increase $3million per annum.Discount rate of 3.98% was applied to investments in fiscalyears 2018 through 2037.
Municipal bond rate 3.62% as of 6/30/18 based on the Bond Buyer GeneralObligation 20-year Bond Municipal Bond Index
Interest assumption Equivalent single discount rate of 3.98% as of 6/30/18
Inflation 2.20%
Long-term expected real rate of return, based ongeometric means
3.27% for Equity investments (based on 65% target allocation)and 1.25% for Fixed Income investments (based on 35% targetallocation), or a total of 4.52%
Healthcare cost trend rate 3.80%
The long-term expected rate of return on plan investments was determined using a building-block method in which best-estimateranges of expected future real rates of return (expected returns, net of plan investment expense and inflation) are developedfor each major asset class. These ranges are combined to produce the long-term expected rate of return by weighting the expectedfuture real rates of return by the target asset allocation percentage and by adding expected inflation.
For the fiscal year-ended June 30, 2018, the annual money-weighted rate of return on investments, net of investment expense,was 8.53%. The money-weighted rate of return expresses investment performance, net of investment expense, adjusted forthe changing amounts actually invested.
In measuring the total liability and determining the discount rate, the actuary projected cash flows by assuming that the Countywill continue to make the current contribution levels increasing 3% per annum. These contributions were first allocated to thenormal cost for future hires. The present value of payments through 2035 was determined using the expected rate of return ofassets of 7.5% and using the 20 year municipal bond rate of 3.62% for benefit payments after 2035. The equivalent single rateis 3.98%.
88 Notes to Basic Financial Statements

The end-of-year net OPEB liability for the County is calculated below:
Increase (Decrease)Total OPEB
LiabilityPlan Fiduciary Net
PositionNet OPEBLiability
(a) (b) (a) - (b)
Balances at June 30, 2017 $ 388,262,030 33,463,661 354,798,369Changes for the year:
Service Cost 17,665,113 — 17,665,113
Interest 15,128,967 — 15,128,967Experience loss/(gains) (20,869,327) — (20,869,327)Contributions -Employer — 12,395,321 (12,395,321)
Net investment income — 2,952,273 (2,952,273)Changes inassumptions 24,937,754 — 24,937,754Changes inproportions — — —
Benefit payments (7,260,921) (7,260,921) —Administrativeexpenses — (17,840) 17,840
Net Changes 29,601,586 8,068,833 21,532,753Balances at June 30, 2018 $ 417,863,616 41,532,494 376,331,122
The following presents what the County’s Total and Net OPEB liability would be if it were calculated using a discount ratethat is one percentage point lower or one percentage point higher:
Discount Rate Sensitivity1%
Decrease Discount Rate 1%Increase
2.98% 3.98% 4.98%
Total OPEB Liability $ 501,527,470 $ 417,863,616 $ 352,080,174Net OPEB Liability $ 459,994,976 $ 376,331,122 $ 310,547,680
The following presents what the County’s Total and Net OPEB liability would be if it were calculated using a health care costtrend rate that is one percentage point lower or one percentage point higher:
Notes to Basic Financial Statements 89

Trend Sensitivity Year 20751%
Decrease Medical Trend 1%Increase
2.80% 3.80% 4.80%
Total OPEB Liability $ 345,943,228 $ 417,863,616 $ 513,806,340Net OPEB Liability $ 304,410,733 $ 376,331,122 $ 472,273,846
For the year-ended June 30, 2018, the County recognized OPEB expense of $26,715,357. At June 30, 2018, the Countyreported deferred outflows of resources and deferred inflows of resources related to OPEB from the following sources:
Deferred Outflows Deferred Inflowsof Resources of Resources
Differences between expected and actualexperience $ — 18,782,393Changes of assumptions 22,443,979 41,756,327Changes in proportion 15,131,475 —Net difference between projected and actual earnings on OPEB plan investments — 840,608Contributions subsequent to themeasurement date 11,768,705 — Total $ 49,344,159 61,379,328
The contributions made subsequent to the measurement date but before the reporting period will be recognized as a reductionof the net OPEB liability in the subsequent fiscal year.
Amounts reported as deferred inflows of resources related to OPEB will be recognized in OPEB expense as follows:
Fiscal Year ended June 30:2020 $ (3,394,920)2021 (3,394,920)2022 (3,394,917)2023 (3,181,547)2024 (3,131,424)Thereafter (7,306,148)
$ (23,803,876)
90 Notes to Basic Financial Statements

Employer Aggregate Disclosure
HowardCounty
Government*
HowardCountyPublic
Schools
HowardCommunity
College
HowardCountyLibrary
HowardCountyHousing
Commission**
HowardCounty
EconomicDevelop-
mentAuthority(EDA) ** Total
As of June 30,2018: Total proportionof net OPEBliabilities $ 376,331,122 743,045,807 34,243,904 16,887,405 1,641,831 586,368 $ 1,172,736,437 Total proportionof OPEB assets 41,532,494 82,003,702 3,779,210 1,863,721 181,195 64,713 129,425,035 Total deferredoutflows ofresources fromOPEB 49,344,159 68,632,632 3,162,994 2,237,361 264,572 167,082 123,808,800 Total deferredinflows ofresources fromOPEB 61,379,328 136,208,782 6,601,450 2,754,323 267,781 95,636 207,307,300
For the year endedJune 30, 2018: Total OPEBexpense $ 26,715,357 47,759,737 2,165,032 1,198,655 121,763 51,553 78,012,097
* Enterprise fund share of net OPEB liability, OPEB assets, deferred outflows, and deferred inflows is $23,102,908,$2,549,673, $5,402,144, and $3,768,067, respectively. The portion allocated to the Howard County Soil ConservationDistrict for net OPEB liability, OPEB assets, deferred outflows, and deferred inflows is $351,821, $38,827, $32,497, and$57,382, respectively.** EDA is not included in the CAFR due to immateriality. Also, Housing Commission has a different fiscal year end.
Plan Perspective under GASB Statement No. 74
The OPEB plan is presented in accordance with the provisions of GASB Statement No. 74, “Financial Reporting for Post-employment Benefit Plans Other than Pension Plans,” which supersedes Statement No. 43. A separate actuarial valuationreport was prepared using January 1, 2018 census data rolled forward to June 30, 2019.
Plan membership per the actuarial valuation as of January 1, 2018 consisted of the following:
Retirees and beneficiaries receiving benefits 3,398Active plan members 10,111Deferred vested terminations 29Total 13,538
Notes to Basic Financial Statements 91

A summary of the assumptions included in the June 30, 2019 report are as follows.
Actuarial cost method Entry Age NormalInterest assumption Discount rate of 3.56% as of 6/30/19
Inflation 2.20%
Municipal bond rate 3.13% as of 6/30/19 based on the Bond Buyer GeneralObligation 20-year Bond Municipal Bond Index
Projected cash flows
Member and County contributions will continue to increase $3million per annum.Long-term expected rate of return was applied to fiscal years2019 through 2039.
Long-term expected real rate of return, based ongeometric means
3.14% for Equity investments (based on 65% target allocation)and 1.13% for Fixed Income investments (based on 35% targetallocation), or a total of 4.27%
Mortality Generational RP-2000 Combined Mortality Table for Males andFemales projected using Scale AA
The long-term expected rate of return on plan investments was determined using a building-block method in which best-estimateranges of expected future real rates of return (expected returns, net of plan investment expense and inflation) are developedfor each major asset class. These ranges are combined to produce the long-term expected rate of return by weighting the expectedfuture real rates of return by the target asset allocation percentage and by adding expected inflation.
For the fiscal year-ended June 30, 2019, the annual money-weighted rate of return on investments, net of investment expense,was 7.07%. The money-weighted rate of return expresses investment performance, net of investment expense, adjusted forthe changing amounts actually invested.
In measuring the total liability and determining the discount rate, the actuary projected cash flows by assuming that the Countywill continue to make the current contribution levels increasing 3% per annum. These contributions were first allocated to thenormal cost for future hires. The present value of payments through 2039 was determined using the expected rate of return ofassets of 7.50% and using the bond rate of 3.13% for benefit payments after 2039. The equivalent single rate is 3.56%.
Based on the aforementioned methods and assumptions, the components of the County’s Net OPEB liability as of June 30,2019 were as follows:
Total OPEB liability $ 1,495,316,166Plan fiduciary net position 154,229,775
County’s net OPEB liability $ 1,341,086,391
Plan fiduciary net position as a percentage of thetotal OPEB liability 10.31%
The following presents what the County’s Total and Net OPEB liability would be if it were calculated using a discount ratethat is one percentage point lower or one percentage point higher:
Discount Rate Sensitivity1%
Decrease Discount Rate 1%Increase
2.56% 3.56% 4.56%
Total OPEB Liability $ 1,801,176,915 $ 1,495,316,166 $ 1,255,586,672Net OPEB Liability $ 1,646,947,140 $ 1,341,086,391 $ 1,101,356,897
92 Notes to Basic Financial Statements

The following presents what the County’s Total and Net OPEB liability would be if it were calculated using a health care costtrend rate that is one percentage point lower or one percentage point higher:
Trend Sensitivity Year 20751%
Decrease Discount Rate 1%Increase
2.8% 3.8% 4.8%
Total OPEB Liability $ 1,221,999,212 $ 1,495,316,166 $ 1,863,868,761Net OPEB Liability $ 1,067,769,437 $ 1,341,086,391 $ 1,709,638,986
Notes to Basic Financial Statements 93

Financial Statements
Summary financial information for the Other Post-Employment Benefits Trust is presented below:
Statement of Net Position
ASSETSReceivables:
Interest and dividends $ 506Investments, at fair value:
Cash 336,048Mutual funds 154,445,416Money market funds 128,761
Total assets 154,910,731
LIABILITIESAccounts payable 57,556Other 623,400
Total liabilities 680,956Net position held in trust forother post-employment benefits 154,229,775
Statement of Changes in Net Position
ADDITIONSContributions:
Employer 38,380,982Total contributions 38,380,982
Investment income (expense):Net change in fair value of investments 6,137,909Dividends 3,477,923Investment expense (330,787)
Net investment income 9,285,045Total additions and net investment income 47,666,027
DEDUCTIONSBenefits 22,755,131Administrative expenses 106,156
Total deductions 22,861,287Change in net position 24,804,740
Net position - beginning 129,425,035Net position - ending $ 154,229,775
94 Notes to Basic Financial Statements

17. Length of Service Award Program
Summary of Significant Accounting Policies
Pension: For purposes of measuring the net pension liability, deferred outflows of resources and deferred inflows of resourcesrelated to pensions, and pension expense, information about the fiduciary net position of the Howard County Length of ServiceAward Program (LOSAP) have been determined on the full accrual basis of accounting. Benefits are recognized when dueand payable in accordance with the terms of the plan.
General Information about the Pension Plans
Plan description: The Howard County Length of Service Award Program (LOSAP) is a single-employer defined benefitretirement plan administered by Howard County, Maryland, which provides retirement and death benefits to volunteerfirefighting and emergency medical service personnel who donate their time and services to one of the six volunteer firecorporations in the County.
The LOSAP was established and operates under the provisions of the Howard County Code, Sections 17.102 and 17.103. Itwas established in 1991 and last amended effective January 1, 2015. Separate financial statements for the program are notissued.
Benefits provided: Under the LOSAP, participants become vested after 25 years of eligible service beginning at age 50. Nobenefit is paid if service is less than 25 years.
There are no disability benefits. A death benefit equal to the total of six months LOSAP payment is paid to the designatedbeneficiary. In addition, $5,000 is paid to the designated beneficiary for burial expenses.
Participants aged 50 years with 25 years of eligibility service are entitled to a normal retirement benefit. Effective January 1,2015, a monthly benefit is equal to 1% of the current annual starting salary of a trainee in the Department of Fire and RescueServices (which is $512 as of January 1, 2018), plus $10 for each full year of certified active service over 25 years. Themonthly amount representing 1% of the current starting salary of a trainee cannot exceed $770.25 based on limitations presentedin the County Code.
All benefits are paid from the Fire and Rescue Reserve Fund as they become due. This is an unfunded program; therefore,there are no assets in the program.
Employees covered by benefit terms: At January 1, 2018 the following employees were covered by the benefit terms:
2018
Inactive employees or beneficiaries currently receiving benefits 99Active employees 358
Total 457
Notes to Basic Financial Statements 95

Net Pension Liability
The County’s net pension liability was measured as of June 30, 2018, and the total pension liability used to calculate the netpension liability was determined by an actuarial valuation as of January 1, 2018 rolled forward to June 30, 2018.
Actuarial Assumption: The total pension liability was determined by an actuarial valuation as of January 1, 2018 rolledforward to June 30, 2018 using the following actuarial assumptions, applied to all periods included in the measurement:
Inflation 2.75 %
Salary increases The starting salary of a trainee in the DFRS is assumed toincrease by 2.75% annually
Interest 3.62% compounded annuallyInvestment rate of return 3.62%
Mortality RP-2000 Combined Healthy tables with generationalprojection by Scale AA.
Discount rate: The discount rate used to measure the total pension liability was 3.62 percent.
Changes in the Net Pension Liability
Total PensionLiability
Plan Fiduciary NetPosition
Net PensionLiability
(a) (b) (a) - (b)
Balances at 6/30/2017 $ 22,648,821 — 22,648,821
Changes for the year:Service cost 836,909 — 836,909Interest 823,257 — 823,257Changes of benefit terms — — —Differences between expected and actual experience (1,417,288) — (1,417,288)Changes of assumptions (263,086) — (263,086)Contributions - employer — 721,061 (721,061)Contributions - member — — —Net investment income — — —Benefit payments (721,061) (721,061) —Administrative expense — — —Other changes — — —
Net changes (741,269) — (741,269)
Balance as of 6/30/2018 $ 21,907,552 — 21,907,552
96 Notes to Basic Financial Statements

Sensitivity of the net pension liability to changes in the discount rate: The following presents the net pension liability of theCounty LOSAP, calculated using the discount rate of 3.62 percent, as well as what the County’s net pension liability wouldbe if it were calculated using a discount rate that is 1 percentage-point lower (2.62 percent) or 1 percentage-point higher (4.62percent) than the current rate:
1% Decrease (2.62%)
Current Discount Rate
(3.62%)
1% Increase (4.62%)
County's net pension liability $ 25,739,493 21,907,552 18,878,800
Pension plan fiduciary net position: There are no separately issued financial reports for the LOSAP.
Pension Expense and Deferred Outflows of Resources and Deferred Inflows of Resources Related to Pensions
For the year ended June 30, 2018, the County recognized pension expense of $1,173,060. The County reported outflows ofresources and deferred inflows of resources related to pensions from the following sources:
Deferred Outflowsof Resources
Deferred Inflows ofResources
Differences between expected and actual experience $ — 1,240,127Changes of assumptions — 2,446,672Contributions subsequent to the measurement date 758,544 —
Total $ 758,544 3,686,799
Other than contributions subsequent to the measurement date ($758,544), which will be recognized as a reduction of the netpension liability in the fiscal year ended June 30, 2019, amounts reported as deferred outflows of resources and deferredinflows of resources related to pensions will be recognized in pension expense for the fiscal years ended June 30:
2020 $ (487,106)2021 (487,106)2022 (487,106)2023 (487,106)2024 (487,106)
Thereafter (1,251,269)Total $ (3,686,799)
Notes to Basic Financial Statements 97
18. Deferred Compensation Plan
Deferred compensation plans are available to all County employees. The plans were established in accordance with InternalRevenue Code Section 457. A deferred compensation plan offers employees an opportunity to defer a portion of their salaryalong with the related Federal and State income taxes until future years. The deferred compensation funds are not availableto employees until termination, retirement, death, or unforeseeable emergency. The assets of this plan were transferred tocustodial accounts and the County no longer reports those assets and liabilities in the Agency Funds of the County.

19. Risk Management
The County is exposed to various risks of loss related to torts; theft of, damage to, and destruction of assets; errors andomissions; injuries to employees; and natural disasters. The reporting entity, excluding the Howard County Public SchoolSystem, has established two internal service funds to account for and finance its uninsured risks of loss. The reporting entity’srisk financing techniques include a combination of risk retention through self-insurance and risk transfer using a risk pool.The Employee Benefits Self-Insurance Fund provides full coverage for employee benefits and long-term disability claims.The Risk Management Self-Insurance Fund provides coverage up to a maximum of $1,000,000 for each automobile liabilityclaim, $1,000,000 for each general liability claim, $100,000 for each property damage claim, and unlimited coverage for eachworkers’ compensation claim.
The reporting entity belongs to the Maryland Local Government Insurance Trust (“LGIT”), which provides insurance forclaims in excess of coverage for the entity’s property, general, and automobile liability coverages. LGIT consists of variouscounties and local municipalities and was created to provide broader insurance coverages than those available from commercialinsurers, as well as loss control and risk management services. The County pays an annual premium to LGIT for this coverage.
Liability claims settled by the County in the past five fiscal years have not exceeded the Risk Management Fund’s $1,000,000retention to trigger payment by LGIT; however, a few small property claims have exceeded the $100,000 retention and havebeen paid by LGIT. All funds and component units of the reporting entity, excluding the Howard County Public School System,participate in the risk management program and make payments to the internal service funds based on a combination ofactuarial estimates and historical cost information. These amounts are needed to pay prior and current year claims and toestablish a reserve for future claims and/or catastrophic losses. The Howard County Public School System has its own riskmanagement programs.
At fiscal year-end, the combined Net Position for the two internal service funds was $17,559,388. The combined claimsliability of the two funds, $20,215,850, is based on generally accepted accounting principles, which require that a liability forclaims be reported if information prior to the issuance of the financial statements indicates that it is probable that a liabilityhas been incurred at the date of the financial statements and the amount of the loss can be reasonably estimated.
The changes in the combined self-insurance funds’ unpaid claims liability in fiscal years 2019 and 2018 are presented below:
Beginning Current Year Claims and Claims End Expected Amount
of Year Changes in Estimates Payments of Year Due Within One Year2019 $18,511,322 62,304,714 (60,600,186) $20,215,850 $7,518,2512018 $17,608,081 58,527,241 (57,624,000) $18,511,322 $7,613,609
The current portion is included in the non-current liabilities - due within one year and the non-current portion is included innon-current liabilities - due in more than one year, on the government-wide Statement of Net Position.
98 Notes to Basic Financial Statements
20. Individual Fund Disclosure
Individual Fund Disclosure:
The General Capital Projects Fund, a major fund, as well as the Storm Drainage Capital Projects Fund, a non-major fund,plan to eliminate their deficit fund balances of ($33,447,023) and ($24,575,810), respectively, through receipt of future grantrevenues and future bond sales.
The Grants Fund, a non-major Special Revenue Fund, will eliminate its deficit of ($2,466,703) through receipt of future grantrevenues in fiscal year 2020.

Change in Accounting Principle:
Component Units
The Howard County Housing Commission: Net position of the Howard County Housing Commission has been restatedby ($1,412,282), due to the implementation of GASB Statement No. 75, Accounting and Financial Reporting forPostemployment Benefit Plans Other Than Pension Plans.
Notes to Basic Financial Statements 99
21. Commitments and Contingencies
A. Grants
The County receives grant funds, principally from the U.S. Government, for various County programs. Expenditures fromcertain of these funds are subject to audit by the grantor, and the County is contingently liable to refund amounts received inexcess of allowable expenditures. In the opinion of County management, no material refunds will be required as a result ofexpenditures disallowed by the grantors.
B. Construction
The County had $784,696,943 authorized but unobligated capital project appropriations at fiscal year-end.
C. Encumbrances
The County uses “encumbrances” to control expenditure commitments for the year. Encumbrances represent commitmentsrelated to contracts executed and not yet performed and purchase orders not yet fulfilled. Commitments for such expenditureof monies are encumbered to reserve applicable appropriations. Depending on the source(s) of funding, encumbrances arereported as part of restricted, committed or assigned fund balance on the governmental funds balance sheet.
The encumbrance balances for the governmental funds at fiscal year-end are reported as follows:
Restricted Committed Assigned Total
Major Governmental Funds General Fund $ — — 15,487,066 15,487,066Non-Major Governmental Funds 35,911,393 2,472,611 — 38,384,004
Total $ 35,911,393 2,472,611 15,487,066 53,871,070
D. Public Private Partnership
On July 27, 2018, the Howard County Council adopted CB54-2018 approving a multi-year Project Agreement betweenHoward County, Maryland and a special purpose entity formed by Edgemoor-Star America Judicial Partners (ESJP) for thedesign, construction, partial financing, operation and maintenance of a new Courthouse and related Parking Structure to belocated on the Project Site located at 9250 Judicial Way (formerly known as 9240 and 9250 Bendix Road) in Ellicott City.The County reached commercial and financial close with ESJP on October 16, 2018. The County has a commitment to makea $75 million milestone payment to ESJP on the expected occupancy readiness date of June 30, 2021. Council Bill 41-2017authorized the issuance of General Obligation bonds to finance the milestone payment.

Required SupplementaryInformation


Howard County, MarylandHoward County Retirement Plan
Schedule of Required Supplementary InformationSchedule of Changes in the County's Net Pension Liability and Related Ratios
Last 10 Fiscal Years
(Dollar amounts in thousands)
2019 2018 2017 2016 2015 2014 2013Total pension liability *
Service cost $ 17,330 16,919 15,861 15,093 14,073 12,727Informationfor FY2013and earlier
notavailable
Interest 34,964 32,786 30,959 29,046 27,198 24,974
Changes of benefit terms — — — — — 3,534Differences between expected and actualexperience (5,973) 379 (6,369) (4,093) (2,741) —
Changes of assumptions 9,529 — — — (851) 10,918Benefit payments, including refunds ofmember contributions (19,012) (16,809) (15,379) (13,700) (12,375) (11,139)
Net change in total pension liability 36,838 33,275 25,072 26,346 25,304 41,014
Total pension liability - beginning 478,828 445,553 420,481 394,135 368,831 327,817
Total pension liability - ending (a) 515,666 478,828 445,553 420,481 394,135 368,831
Plan fiduciary net position
Contributions - employer 14,155 14,841 14,179 13,428 13,967 12,778
Contributions - member 4,378 4,156 3,904 3,757 3,573 2,979
Net investment income 31,355 35,808 45,447 4,743 9,983 45,956Benefit payments, including refunds ofmember contributions (19,012) (16,809) (15,379) (13,700) (12,375) (11,139)
Administrative expense (438) (351) (336) (341) (311) (283)
Net change in plan fiduciary net position 30,438 37,645 47,815 7.887 14,837 50,291
Plan fiduciary net position - beginning 447,760 410,115 362,300 354,413 339,576 289,285
Plan fiduciary net position - ending (b) 478,198 447,760 410,115 362,300 354,413 339,576
County's net pension liability - ending (a)-(b) $ 37,468 31,068 35,438 58,181 39,722 29,255
Plan fiduciary net position as a percentage ofthe total pension liability 92.73% 93.51% 92.05% 86.16% 89.92% 92.07%
Covered payroll $123,090 119,686 114,349 108,292 103,462 97,542
County's net pension liability as a percentageof covered payroll 30.44% 25.96% 30.99% 53.73% 38.39% 29.99%
Expected average remaining service years ofall participants 7 7 7 7 7 7
* The measurement date for the pensionliability is as of June 30 of the fiscalyear stated.
Notes to Schedule:
Benefit changes: NoneChange of assumptions: Based on the recent experience study, the following assumptions were changed: interest rate, post retirementCOLA increases, salary increases, mortality, retirement rates, termination rates and disability rates.
102 Required Supplementary Information

Howard County, MarylandHoward County Retirement Plan
Schedule of Required Supplementary InformationSchedule of County Contributions
Last 10 Fiscal Years
(Dollar amounts in thousands)
2019 2018 2017 2016 2015 2014 2013
Actuarially determined contribution $ 14,155 14,003 13,265 13,428 13,967 12,778Informationfor FY2013and earlier
notavailable
Contributions in relation to the actuariallydetermined contribution 14,155 14,841 14,179 13,428 13,967 12,778
Contribution deficiency (excess) $ — (838) (914) — — —
Covered payroll $ 123,090 119,685 114,349 108,292 103,462 97,542
Contributions as a percentage of coveredpayroll 11.50% 12.40% 12.40% 12.40% 13.50% 13.10%
Note: ADC rate for FY 18 and FY 17 were 11.7% and 11.6%, respectively.
Notes to Schedule:
Valuation date:
Actuarially determined contribution amounts are calculated as of the beginning of the fiscal year (July1) for the year immediately followingthe fiscal year. Actuarial valuations are performed every year. The assumptions shown below are from the currently approved assumptionsand assumptions used to determine all contributions in the past would not have been the same.
Methods and assumptions used to determine contribution rates:
Actuarial cost method Projected Unit Credit (Entry Age used for GASB 67 purposes)
Amortization method Level percentage of pay increasing 2.75% per year
Remaining amortization period Remaining Amortization periods range from 4 to 21 years.
Asset valuation method 5-year smoothed market
Inflation 2.70%
Salary increases Varies by service. 3.75 to 6.50 percent, including inflation
Investment rate of return 7.45%, before expenses, including inflation
Retirement age Rates vary by participant age and service
Mortality RP-2014 Combined Healthy tables with generational projectionfrom 2006 base year using scale MP-2017.
Cost-of-Living Increases 2.70%
Required Supplementary Information 103

Howard County, MarylandHoward County Police and Fire Employees' Retirement Plan
Schedule of Required Supplementary InformationSchedule of Changes in the County's Net Pension Liability and Related Ratios
Last 10 Fiscal Years
(Dollar amounts in thousands)
2019 2018 2017 2016 2015 2014 2013Total pension liability
Service cost $ 22,278 21.109 19.163 18.974 17,708 17,535 Information for
FY2013and
earliernot
available
Interest 50,713 46,900 43,426 39,998 36,208 33,630
Changes of benefit terms — — — (1,705) — —Differences between expected and actualexperience (2,667) 13,530 6,319 7,599 (1,596) —
Changes of assumptions 3,936 — — — 16,621 14,989
Benefit payments, including refunds ofmember contributions (27,571) (24,755) (20,422) (17,890) (18,941) (15,679)
Net change in total pension liability 46,689 56,784 48,486 46,976 50,000 50,475
Total pension liability - beginning 694,496 637,712 589,226 542,250 492,250 441,775
Total pension liability - ending (a) 741,185 694,496 637,712 589,226 542,250 492,250
Plan fiduciary net position
Contributions - employer 27,720 26.337 24.729 21.636 22,530 20,822
Contributions - member 8,125 7,859 7,387 7,041 7,006 6,526
Net investment income 39,639 46,560 55,956 6,459 11,531 54,733Benefit payments, including refunds ofmember contributions (27,571) (24,755) (20,421) (17,889) (18,941) (15,679)
Administrative expense (457) (355) (344) (327) (368) (271)
Net change in plan fiduciary net position 47,456 55,646 67,307 16,920 21,758 66,131
Plan fiduciary net position - beginning 571,902 516,256 448,949 432,029 410,271 344,140
Plan fiduciary net position - ending (b) 619,358 571,902 516,256 448,949 432,029 410,271
County's net pension liability - ending (a)-(b) $ 121,827 122,594 121,456 140,277 110,221 81,979
Plan fiduciary net position as a percentageof the total pension liability 83.56% 82.35% 80.95% 76.19% 79.67% 83.35 %
Covered payroll $ 83,746 81,037 80,814 72,121 70,406 67,169
County's net pension liability as apercentage of covered payroll 145.47% 151.28% 150.29% 194.50% 156.55% 122.05 %
Expected average remaining service yearsof all participants 9 9 9 10 10 9* The measurement date for the pensionliability is as of June 30 of the fiscalyear stated.
Notes to Schedule:Benefit changes. Effective January 1, 2015, DROP 1 is closed to new entrants and DROP II is open to all plan members who meet theeligibility requirements. DROP I members may elect to transfer to DROP II.
Changes of assumptions. Based on the recent experience study, the following assumptions were changed: interest rate, post-retirementCOLA increases, salary increases, mortality, retirement rates, termination rates and disability rates.
104 Required Supplementary Information

Howard County, MarylandHoward County Police and Fire Employees' Retirement Plan
Schedule of County ContributionsLast 10 Fiscal Years
(Dollar amounts in thousands)2019 2018 2017 2016 2015 2014 2013
Actuarially determined contribution $ 27,720 26,337 24,729 21,636 22,530 20,822 Informationfor FY2013and earlier
notavailable
Contributions in relation to theactuarially determined contribution 27,720 26,337 24,729 21,636 22,530 20,822
Contribution deficiency (excess) — — — — — —
Covered payroll $ 83,746 81,037 80,814 72,121 70,406 67,169
Contributions as a percentage ofcovered payroll 33.10% 32.50% 30.60% 30.00% 32.00% 31.00%
Notes to Schedule
Valuation date:Actuarially determined contribution amounts are calculated as of the beginning of the fiscal year (July 1) for the yearimmediately following the fiscal year. Actuarial valuations are performed every year.
Methods and assumptions used to determine contribution rates:Actuarial cost method Projected Unit Credit (Entry Age used for GASB 67 purposes)Amortization method Level percentage of pay increasing 2.75% per yearRemaining amortization period Remaining Amortization periods range from 4 to 15 years.Asset valuation method 5-year smoothed marketInflation 2.70%Salary increases Varies by service. 4.25% to 7.75%, including inflationInvestment rate of return 7.45%, net of pension plan investment expense, including
inflationRetirement age Rates vary by participant age and service and (for GASB
purposes only) set at 100% at DROP entry (or expected entry).Normal Cost (for GASB purposes) ceases for Police and Firemembers when they enter DROP since GASB 67 does not allowNormal Cost while in DROP.
Mortality RP-2014 Combined Healthy tables with generational projectionfrom 2006 base year using scale MP-2017.
Cost-of-Living Increases 2.00%
Required Supplementary Information 105

Howard County, MarylandOther Post-Employment Benefits (OPEB) Fund
Schedule of Required Supplementary InformationSchedule of Employer's Proportionate Share of Net OPEB Liability
Last 10 Fiscal Years(Dollar amounts in thousands)
2018 2017 2016*Total OPEB liabilityEmployer's proportion of the net OPEB liability 32.09% 30.75% Information
forEmployer's proportionate share of net OPEB liability $376,331 $339,983 FY2016 andCovered-employee payroll $193,828 $184,681 earlier is notEmployer's proportionate share of the net OPEB liability available.as a percentage of covered-employee payroll 51.50% 54.32%Plan fiduciary net position as apercentage of total OPEB liability 9.94% 8.62%
* The measurement date for the OPEB liability is as of June 30 of the fiscal year stated.
This schedule is presented to illustrate the requirement to show information for 10 years.However, until a full 10-year trend is completed, governments should present informationfor which information is available.
106 Required Supplementary Information

Howard County, MarylandOther Post-Employment Benefits (OPEB) Fund
Schedule of Required Supplementary InformationSchedule of Changes in the OPEB Trust's Net OPEB Liability and Related Ratios
Last 10 Fiscal Years
(Dollar amounts in thousands)
2019 2018 2017 2016*Total OPEB liability
Service cost $ 60,150 55,049 64,957 Informationfor FY2016and earlier
is notavailable
Interest 51,309 47,145 40,906Differences between expected and actualexperience (3,241) (65,034) —Changes of assumptions 107,691 77,712 (162,653)Benefit payments (22,755) (22,627) (23,244)
Net change in total OPEB liability 193,154 92,245 (80,034)Total OPEB liability - beginning 1,302,161 1,209,916 1,289,950Total OPEB liability - ending (a) $ 1,495,315 1,302,161 1,209,916
Plan fiduciary net positionContributions - employer $ 38,381 38,627 36,324Net investment income 9,285 9,200 9,912Benefit payments (22,755) (22,627) (23,244)Administrative expense (106) (56) (3)
Net change in plan fiduciary net position 24,805 25,144 22,989Plan fiduciary net position - beginning 129,425 104,281 81,292Plan fiduciary net position - ending (b) $ 154,230 129,425 104,281
County's net OPEB liability - ending (a)-(b) $ 1,341,086 1,172,736 1,105,635
Plan fiduciary net position as a percentage ofthetotal OPEB liability 10.31% 9.94% 8.62%
Covered employee payroll 798,788 799,110 760,624
County's net OPEB liability as a percentageofcovered-employee payroll 167.89% 146.76% 145.36%
Expected average remaining service years ofall participants 10 10 10
Notes to Schedule:Benefit changes. NoneChanges of assumptions. Discount rate at 6/30/18 is 3.98% and at 6/30/19 is 3.56%.* The measurement date for the OPEB liability is as of June 30 of the fiscal year stated.
Required Supplementary Information 107

Howard County, MarylandOther Postemployment Benefits
Schedule of Required Supplementary InformationSchedule of Investment Returns
Last 10 Fiscal Years
Fiscal Year EndedAnnual money-
weighted rate of return,net of investment
expenses
June 30, 2019 7.07%June 30, 2018 8.53%June 30, 2017 11.65%June 30, 2016 2.02%June 30, 2015 2.65%June 30, 2014 17.26%June 30, 2013 12.02%
Information prior toFY 2013 is not
available.
108 Required Supplementary Information

Howard County, MarylandLength of Service Award Program
Schedule of Required Supplementary InformationSchedule of Changes in the County's Net Pension Liability and Related Ratios
Last 10 Fiscal Years(Dollar amounts in thousands)
2018 2017 2016 2015Total pension liability
Service cost $ 837 1,026 1,027Informationfor FY2015and earlier
not available
Interest 823 714 655Changes of benefit terms — — —Differences between expected and actualexperience (1,417) — —Changes of assumptions (263) (2,771) —Benefit payments, including refunds ofmember contributions (721) (669) (610)
Net change in total pension liability (741) (1,700) 1,072Total pension liability - beginning 22,649 24,349 23,277Total pension liability - ending (a) $ 21,908 22,649 24,349
Plan fiduciary net positionNet investment income — — —Benefit payments, including refunds ofmember contributions — — —Administrative expense — — —Net change in plan fiduciary net position — — —
Plan fiduciary net position - beginning — — —Plan fiduciary net position - ending (b) — — —
County's net pension liability - ending (a)-(b) $ 21,908 22,649 24,349
Plan fiduciary net position as a percentage ofthe total pension liability —% —% —%
Covered-employee payroll n/a n/a n/a
County's net pension liability as a percentageof covered-employee payroll n/a n/a n/a
Expected average remaining service years ofall participants 8 10 10
Notes to Schedule: Assets. There are no assets accumulated in a trust to pay related benefits. All benefits are paid on a pay-as-you-go basis. Benefit changes. None Changes of assumptions. Discount rate changed from 3.56% to 3.62%.
Required Supplementary Information 109

Combining and Individual FundStatements and Schedules
The Combining and Individual fund statements and schedules providedetailed information concerning financial position and results ofoperations.
• General Fund• Non-Major Governmental Funds• Enterprise Funds-Other• Internal Service Funds• Fiduciary Funds• Capital Assets Used in the Operation of Governmental
Funds• Capital Assets Used in the Operation of Enterprise
Funds• Long-Term Debt


General Fund
The General fund is the general operating fund of the County.This fund is used to account for all financial resources exceptthose required to be accounted for in another fund.


Howard County, MarylandSchedule of Revenues and Appropriations from Fund Balances - Budgetary Basis
General FundFor the Year Ended June 30, 2019
Budget Amounts Variance withOriginal Final Revenues Final Budget
Property taxes:Real, personal and corporate $ 547,827,993 547,827,993 550,439,065 2,611,072Payment in lieu of taxes 1,500,000 1,500,000 1,535,279 35,279Additions and abatements (150,000) (150,000) (924,271) (774,271)Interest on taxes 900,000 900,000 1,048,450 148,450Tax sale revenue 100,000 100,000 — (100,000)
Total property taxes 550,177,993 550,177,993 552,098,523 1,920,530
Other local taxes:Heavy equipment 800,000 800,000 967,390 167,390Local income tax surcharge 454,296,364 454,296,364 462,445,038 8,148,674Admission tax 2,500,000 2,500,000 3,361,722 861,722 Local recordation tax 22,968,000 22,968,000 21,142,956 (1,825,044) Mobile home tax 633,180 633,180 685,551 52,371 Room rental tax 5,350,000 5,350,000 5,538,425 188,425
Total other local taxes 486,547,544 486,547,544 494,141,082 7,593,538
State shared taxes:Highway 1,620,478 1,620,478 1,673,415 52,937
Total state shared taxes 1,620,478 1,620,478 1,673,415 52,937
Revenues from other governments 8,370,696 8,370,696 9,666,906 1,296,210
Charges for services:Boarding prisoners 2,914,446 2,914,446 2,869,437 (45,009)Cable TV franchise fees 5,725,138 5,725,138 5,829,293 104,155Civil marriage 11,000 11,000 11,140 140Developer - water and sewer overhead 500,000 500,000 310,104 (189,896)Development - review fees 1,500,000 1,500,000 1,082,356 (417,644)Development - specifications 1,000 1,000 — (1,000)Extension development agreement fees 35,000 35,000 31,425 (3,575)House type revision fees 177,500 177,500 113,935 (63,565)Master in chancery fees 100,000 100,000 5 (99,995)Other charges for services 219,935 219,935 47,860 (172,075)Parking meters 5,000 5,000 4,613 (387)Planning and zoning fees 613,500 613,500 622,123 8,623Police records check discovery fee 35,000 35,000 55,296 20,296Recreation and parks 80,000 80,000 62,069 (17,931)Rental housing inspection fees 1,387,065 1,387,065 1,319,719 (67,346)Sale of maps and publications 75,000 75,000 39,644 (35,356)Sale of topographic maps — — 230 230Sheriff fees 400,000 400,000 482,693 82,693Tax certificates 300,000 300,000 290,820 (9,180)Weekender inmate fees 45,000 45,000 22,479 (22,521)Food and beverage 150,000 150,000 135,384 (14,616)
Total charges for services 14,274,584 14,274,584 13,330,625 (943,959)
(Continued)
The accompanying notes are an integral part of these financial statements.
114 Combining and Individual Fund Statements and Schedules

Howard County, MarylandSchedule of Revenues and Appropriations from Fund Balances - Budgetary Basis
General FundFor the Year Ended June 30, 2019
Budget Amounts Variance withOriginal Final Revenues Final Budget
Interest on investments 2,020,000 2,020,000 7,236,783 5,216,783
Licenses and permits:Animal licenses 60,340 60,340 57,187 (3,153)Beer, wine and liquor 309,595 309,595 299,686 (9,909)Building 3,892,001 3,892,001 3,572,860 (319,141)Concert/special event permit fees — — 65,599 65,599Electrical 1,184,836 1,184,836 1,118,331 (66,505)Marriage licenses 2,000 2,000 — (2,000)Marriage license surcharge 95,000 95,000 83,115 (11,885)Mobile home park 6,450 6,450 6,450 —Other — — 957 957Peddlers and solicitors 23,315 23,315 12,466 (10,849)Plumbing 1,128,777 1,128,777 961,815 (166,962)Signs 50,000 50,000 37,700 (12,300)Traders 425,000 425,000 446,568 21,568
Total licenses and permits 7,177,314 7,177,314 6,662,734 (514,580)
Recoveries for interfund services:Agricultural land preservation fund 520,662 320,662 320,662 —Finance - Employee health benefits fund 17,481 17,481 38,341 20,860Fire and rescue fund 5,319,994 5,319,994 5,319,994 —Forest Conservation pro rata share — — 28,984 28,984General County capital projects pro rata share 100,000 100,000 — (100,000)Housing and community development 452,010 452,010 452,010 —Office of law - self insurance 416,260 416,260 416,260 —Pension plan 319,000 319,000 406,867 87,867Public works - water & sewer capital projects pro rata share 450,000 450,000 400,000 (50,000)Public works - water and sewer developer capital projects 500,000 500,000 440,000 (60,000)Public works operations - utility pro rata 4,766,602 4,766,602 4,766,602 —Recreation and parks 1,799,307 1,799,307 1,770,323 (28,984)Streetlight districts 30,000 30,000 11,300 (18,700)Waste management pro rata share 1,333,734 1,333,734 1,333,734 —Watershed pro rata share 878,666 878,666 815,904 (62,762)
Total recoveries for interfund services 16,903,716 16,703,716 16,520,981 (182,735)
Fines and forfeitures 3,108,514 3,108,514 3,018,279 (90,235)
Component units return of funding:Community college 1,099,269 1,099,269 487,078 (612,191)Public school system 1,762,105 1,762,105 1,059,259 (702,846)
Total component units return of funding 2,861,374 2,861,374 1,546,337 (1,315,037)
Miscellaneous revenues:Commissions, rents and concessions 409,570 409,570 432,334 22,764Miscellaneous program revenue 7,108,644 — 555,150 555,150Other intergovernmental revenue — — 12,292 12,292Other revenue 602,900 602,900 1,274,546 671,646Sale of property and equipment — — 29,359 29,359Sale of surplus property — — (9,923) (35,273)
Total miscellaneous revenue 8,121,114 1,012,470 2,293,758 1,255,938Total revenues 1,108,429,046 1,093,874,683 1,108,189,423 14,314,740
Other financing sources:Transfers in:
Operating transfer — 200,000 200,000 —Community renewal program fund - debt 208,592 208,592 208,592 —Fire and rescue reserve fund - debt 2,293,220 2,293,220 2,293,220 —Recreation program fund - debt 4,962,170 4,962,170 4,962,170 —Excise tax debt — 7,245,719 7,262,117 16,398Public school system debt — 7,108,644 7,108,643 (1)Capital contributions 160,000 160,000 — (160,000)Environmental services fund 629,907 629,907 629,907 —Master lease debt service reimbursement 682,128 682,128 682,128 —
Total other financing sources 8,936,017 23,490,380 23,346,777 (143,603)
Appropriation from fund balance 23,242,758 23,242,758 238,017 (23,004,741)Capital Related Debt Issued — — 793,086 793,086
Total revenues and other financing sources $ 1,140,607,821 1,140,607,821 1,132,567,303 (8,040,518)
The accompanying notes are an integral part of these financial statements.
Combining and Individual Fund Statements and Schedules 115

Howard County, MarylandSchedule of Expenditures and Encumbrances - Budgetary Basis
General FundFor the Year Ended June 30, 2019
Expenditures Budget Amounts and Variance with
Original Final Expenditures Encumbrances Encumbrances Final Budget
General GovernmentOffice of the County Executive $ 2,053,798 2,053,798 2,022,123 18,500 2,040,623 13,175
Office of the County Administrator:Bureau of staff services:
Staff services 2,433,971 2,372,609 2,053,158 200,000 2,253,158 119,451Environmental sustainability 512,655 517,655 517,632 — 517,632 23Office of human rights 922,825 922,825 875,610 — 875,610 47,215Workforce development 248,791 248,791 183,629 — 183,629 65,162
Total bureau of staff services 4,118,242 4,061,880 3,630,029 200,000 3,830,029 231,851
Bureau of management services:Budget division 1,219,663 1,226,163 1,141,325 63,560 1,204,885 21,278Human resources 2,492,759 2,581,517 2,161,160 352,726 2,513,886 67,631Purchasing division 1,645,334 1,606,438 1,520,699 — 1,520,699 85,739Central services 733,840 733,840 690,964 — 690,964 42,876Public information 1,272,895 1,272,895 1,219,448 10,000 1,229,448 43,447
Total bureau of managementservices 7,364,491 7,420,853 6,733,596 426,286 7,159,882 260,971
Total Office of the CountyAdministrator 11,482,733 11,482,733 10,363,625 626,286 10,989,911 492,822
Department of economicdevelopment 2,783,222 2,783,222 2,783,221 — 2,783,221 1
Department of finance:Office of the director 2,281,694 2,201,086 2,022,273 72,251 2,094,524 106,562Office of the controller 2,672,803 2,672,803 2,202,351 26,930 2,229,281 443,522Office of business management and
customer service 2,884,494 2,887,102 2,559,975 29,538 2,589,513 297,589Bureau of disbursements 943,387 1,021,387 922,090 38,448 960,538 60,849
Total department of finance 8,782,378 8,782,378 7,706,689 167,167 7,873,856 908,522
Office of law 4,153,455 4,153,455 4,113,138 — 4,113,138 40,317
Technology and communicationservices 279,681 279,681 272,244 6,510 278,754 927
General fund contingency 2,000,000 321,300 — — — 321,300
Non-departmental expenses 17,392,000 19,925,778 18,687,146 715,702 19,402,848 522,930Total General Government 48,927,267 49,782,345 45,948,186 1,534,165 47,482,351 2,299,994
Legislative and JudicialLegislative:
County council 3,599,180 3,599,180 3,240,813 170,000 3,410,813 188,367County auditor 1,508,624 1,508,624 1,376,862 125,330 1,502,192 6,432Board of license commissioners 152,721 152,721 144,755 — 144,755 7,966Zoning board 89,933 89,933 79,417 — 79,417 10,516Board of appeals 101,979 101,979 40,017 — 40,017 61,962
Total legislative 5,452,437 5,452,437 4,881,864 295,330 5,177,194 275,243
(Continued)
The accompanying notes are an integral part of these financial statements.
116 Combining and Individual Fund Statements and Schedules

Howard County, MarylandSchedule of Expenditures and Encumbrances - Budgetary Basis
General FundFor the Year Ended June 30, 2019
Expenditures Budget Amounts and Variance with
Original Final Expenditures Encumbrances Encumbrances Final Budget
JudicialCircuit court 3,117,023 3,117,023 2,936,937 — 2,936,937 180,086Orphan's court 54,196 54,196 52,182 — 52,182 2,014Sheriff's department 8,106,481 8,106,481 7,882,970 30,190 7,913,160 193,321State attorney's office 8,577,811 8,577,811 8,443,971 70,500 8,514,471 63,340
Total judicial 19,855,511 19,855,511 19,316,060 100,690 19,416,750 438,761
Board of election supervisors 2,018,719 1,978,719 1,698,562 200,000 1,898,562 80,157
Election expense 1,543,128 1,583,128 1,452,222 — 1,452,222 130,906Total Legislative and Judicial 28,869,795 28,869,795 27,348,708 596,020 27,944,728 925,067
Public WorksDepartment of public works:Office of the director 4,724,099 4,516,313 4,482,401 32,482 4,514,883 1,430
Total office of the director 4,724,099 4,516,313 4,482,401 32,482 4,514,883 1,430
Bureau of engineering:Administrative management
division 582,727 660,391 658,474 — 658,474 1,917Transportation & watershed
management 1,371,584 1,454,019 1,448,687 — 1,448,687 5,332Construction inspection division 3,661,741 3,224,962 3,181,062 — 3,181,062 43,900Survey and drafting division 925,171 884,637 873,406 — 873,406 11,231
Total bureau of engineering 6,541,223 6,224,009 6,161,629 — 6,161,629 62,380
Bureau of highways:Operations 1,566,117 1,418,117 1,401,987 — 1,401,987 16,130Highway maintenance division 20,036,761 21,380,561 18,428,678 2,936,889 21,365,567 14,994Traffic engineering division 2,237,873 2,272,873 1,820,623 439,550 2,260,173 12,700
Total bureau of highways 23,840,751 25,071,551 21,651,288 3,376,439 25,027,727 43,824
Bureau of facilities:Administration 7,871,803 8,624,653 8,350,548 262,151 8,612,699 11,954Building and ground maintenance 11,373,278 11,558,328 11,454,530 103,244 11,557,774 554
Total bureau of facilities 19,245,081 20,182,981 19,805,078 365,395 20,170,473 12,508
Bureau of environmental services:Stormwater management 1,228,236 1,263,236 1,257,713 — 1,257,713 5,523
Total bureau of environmentalservices 1,228,236 1,263,236 1,257,713 — 1,257,713 5,523Total Department of PublicWorks 55,579,390 57,258,090 53,358,109 3,774,316 57,132,425 125,665
Department of inspections, licensesand permits:Operations division 2,147,083 2,147,083 1,954,400 90,888 2,045,288 101,795Inspection and enforcement
division 3,675,301 3,653,301 3,440,543 71,000 3,511,543 141,758Plan review division 1,405,581 1,427,581 1,404,782 — 1,404,782 22,799Licenses and permits division 850,252 850,252 842,028 — 842,028 8,224
Total department of inspections,licenses and permits 8,078,217 8,078,217 7,641,753 161,888 7,803,641 274,576
(Continued)
The accompanying notes are an integral part of these financial statements.
Combining and Individual Fund Statements and Schedules 117

Howard County, MarylandSchedule of Expenditures and Encumbrances - Budgetary Basis
General FundFor the Year Ended June 30, 2019
Budget Amounts Expendituresand
EncumbrancesVariance withFinal Budget Original Final Expenditures Encumbrances
Department of planning and zoning:Office of the director 1,608,079 1,773,585 1,461,548 84,728 1,546,276 227,309Division of land development 1,417,728 1,350,728 1,320,729 — 1,320,729 29,999Division of research 899,703 894,103 860,132 — 860,132 33,971Public service and zoning
administration 1,047,236 990,236 975,904 — 975,904 14,332Environmental and community
planning 531,510 475,010 453,488 — 453,488 21,522Development engineering division 1,078,617 1,089,117 1,086,830 — 1,086,830 2,287Conservation easements program 592,769 602,863 600,833 — 600,833 2,030
Total department of planningand zoning 7,175,642 7,175,642 6,759,464 84,728 6,844,192 331,450
Soil conservation district 994,804 994,804 994,804 — 994,804 —
Department of transportation 10,861,631 10,347,284 9,274,184 1,042,576 10,316,760 30,524Total Public Works 82,689,684 83,854,037 78,028,314 5,063,508 83,091,822 762,215
Public SafetyPolice department:
Animal control division 1,816,350 1,816,350 1,654,294 61,717 1,716,011 100,339Office of the chief 6,156,007 6,273,007 6,198,486 — 6,198,486 74,521Administrative command 810,511 795,511 777,209 — 777,209 18,302Command operations 47,304,970 45,780,400 44,806,296 22,915 44,829,211 951,189Bureau of criminal investigations 18,698,993 18,583,993 18,222,298 108,936 18,331,234 252,759Special operations bureau 9,862,565 9,771,535 8,914,953 635,269 9,550,222 221,313Operations support 1,474,334 2,052,334 1,930,104 500 1,930,604 121,730Information and technology
bureau 16,734,142 16,468,041 16,029,897 32,918 16,062,815 405,226Human resource bureau 4,875,311 5,849,311 5,736,427 38,782 5,775,209 74,102Management services bureau 10,896,799 11,129,500 10,653,285 308,662 10,961,947 167,553Investigations and special
operations 249,682 359,682 352,517 — 352,517 7,165Total police department 118,879,664 118,879,664 115,275,766 1,209,699 116,485,465 2,394,199
Department of corrections 19,303,815 19,303,815 19,023,646 187,084 19,210,730 93,085Total Public Safety 138,183,479 138,183,479 134,299,412 1,396,783 135,696,195 2,487,284
Recreation and ParksDepartment of recreation and parks 24,550,738 24,550,738 24,509,682 37,538 24,547,220 3,518
Total Recreation and Parks 24,550,738 24,550,738 24,509,682 37,538 24,547,220 3,518
Community ServicesDepartment of social services 678,494 678,494 598,580 — 598,580 79,914
Department of CommunityResources and Services 10,330,267 10,375,562 9,734,286 158,686 9,892,972 482,590Consumer affairs division 480,845 435,549 402,076 — 402,076 33,473Office on aging 3,124,818 3,124,819 3,070,661 2,905 3,073,566 51,253Cooperative extension services 543,717 543,717 539,231 — 539,231 4,486Health department 11,461,498 — — — — —
Total Community Services 26,619,639 15,158,141 14,344,834 161,591 14,506,425 651,716
(Continued)
The accompanying notes are an integral part of these financial statements.
118 Combining and Individual Fund Statements and Schedules

Howard County, MarylandSchedule of Expenditures and Encumbrances - Budgetary Basis
General FundFor the Year Ended June 30, 2019
Expenditures Budget Amounts and Variance with
Original Final Expenditures Encumbrances Encumbrances Final Budget
County grants in-aid:Arts & tourism grants:
Center of African-AmericanCulture 39,960 39,960 39,960 — 39,960 —African Art Museum of Maryland 12,000 12,000 12,000 — 12,000 —Ellicott City Partnership 50,000 50,000 50,000 — 50,000 —Inner Arbor 5,000 5,000 5,000 — 5,000 —Patapsco Heritage Greenway 50,000 62,500 62,500 — 62,500 —Local / regional arts grants 865,000 865,000 865,000 — 865,000 —Tourism Council 1,009,877 1,009,877 1,009,877 — 1,009,877 —
Total arts and tourism grants 2,031,837 2,044,337 2,044,337 — 2,044,337 —
Civic grants:Historical society 80,000 80,000 80,000 — 80,000 —
Total civic grants 80,000 80,000 80,000 — 80,000 —
Community service partnershipshuman service grants 9,110,843 9,098,343 9,008,829 70,000 9,078,829 19,514
Total County Grants in-Aid 11,222,680 11,222,680 11,133,166 70,000 11,203,166 19,514Total Community Service andgrants in-aid 37,842,319 26,380,821 25,478,000 231,591 25,709,591 671,230
EducationPublic schools 600,053,881 600,053,881 600,053,881 — 600,053,881 —Community college 34,985,816 34,985,816 34,985,816 — 34,985,816 —Library 20,937,872 20,937,872 20,937,872 — 20,937,872 —
Total Education 655,977,569 655,977,569 655,977,569 — 655,977,569 —
(Continued)
The accompanying notes are an integral part of these financial statements.
Combining and Individual Fund Statements and Schedules 119

Howard County, MarylandSchedule of Expenditures and Encumbrances - Budgetary Basis
General FundFor the Year Ended June 30, 2019
Expenditures Budget Amounts and Variance with
Original Final Expenditures Encumbrances Encumbrances Final Budget
Debt ServicePrincipal:
Community college 5,486,956 5,486,958 5,486,954 — 5,486,954 4Community renewal 138,405 138,405 138,405 — 138,405 —Environmental services — 299,471 299,471 — 299,471 —Excise bonds 4,529,057 4,229,587 4,229,586 — 4,229,586 1Fire 1,077,738 1,077,739 1,077,738 — 1,077,738 1General county projects 13,775,229 13,775,230 13,775,230 — 13,775,230 —Police 443,843 443,843 443,843 — 443,843 —Recreation and parks 2,375,420 2,375,421 2,375,420 — 2,375,420 1School surcharge 5,205,144 5,205,144 5,205,144 — 5,205,144 —Schools 28,049,896 28,049,898 28,049,897 — 28,049,897 1Storm drainage 1,928,312 1,928,312 1,928,312 — 1,928,312 —Master lease financing 2,376,547 1,702,008 1,702,008 — 1,702,008 —Lease financing — 409,040 409,040 — 409,040 —
Total principal 65,386,547 — 65,121,056 — 65,121,048 — — — 65,121,048 — 8
Interest:Community college 4,815,456 4,815,456 4,815,458 — 4,815,458 (2)Community renewal 70,187 70,187 70,187 — 70,187 —Environmental services — 330,436 330,436 — 330,436 —Excise bonds 3,346,569 3,032,531 3,032,531 — 3,032,531 —Fire 1,215,482 1,215,482 1,215,482 — 1,215,482 —General county projects 12,732,540 12,656,174 12,656,174 — 12,656,174 —Police 234,158 234,158 234,158 — 234,158 —Recreation and parks 2,586,750 2,586,750 2,586,750 — 2,586,750 —School surcharge 1,903,500 1,903,500 1,903,500 — 1,903,500 —Schools 18,278,297 18,278,298 18,278,298 — 18,278,298 —Storm drainage 1,586,401 1,586,401 1,586,401 — 1,586,401 —Master lease financing 67,687 38,326 38,326 — 38,326 —Lease financing — 105,306 105,306 — 105,306 —
Total interest 46,837,027 — 46,853,005 — 46,853,007 — — — 46,853,007 — (2)Total Debt Service 112,223,574 111,974,061 111,974,055 — 111,974,055 6
Total expenditures andencumbrances before transfersout 1,129,264,425 1,119,572,845 1,103,563,926 8,859,605 1,112,423,531 7,149,314
Other financing usesHealth department — 11,461,498 10,571,498 — 10,571,498 890,000General government — 763,860 763,860 — 763,860 —Recreation and Parks 414,618 414,618 414,618 — 414,618 —Paygo - capital 8,395,000 8,395,000 8,395,000 — 8,395,000 —Paygo - operating 2,533,778 — — — — —
Total other financing uses 11,343,396 21,034,976 20,144,976 — 20,144,976 890,000
Total Expenditures, Encumbrancesand other financing uses $1,140,607,821 1,140,607,821 1,123,708,902 8,859,605 1,132,568,507 8,039,314
The accompanying notes are an integral part of these financial statements.
120 Combining and Individual Fund Statements and Schedules

Howard County, MarylandSchedule of Revenues, Expenditures and Changes in Fund Balance - Budgetary Basis
Health Department FundFor the Year Ended June 30, 2019
Budget Amounts Variance withOriginal Final Actual Final Budget
REVENUESCharges for services $ 520,000 520,000 444,966 (75,034)Interest on investments — — 25,632 25,632Miscellaneous 1,230,000 939,291 — (939,291)
Total revenue 1,750,000 1,459,291 470,598 (988,693)
EXPENDITURESCommunity Services:
General health services 12,211,498 12,210,498 11,409,413 801,085Grant programs 1,000,000 710,291 521,479 188,812 Total expenditures 13,211,498 12,920,789 11,930,892 989,897
Excess (deficiency) of revenues over expenditures (11,461,498) (11,461,498) (11,460,294) 1,204
OTHER FINANCING SOURCES (USES)Appropriation from fund balance 890,000 890,000 890,000 —Transfers in 10,571,498 10,571,498 10,571,498 —
Total other financing sources (uses) 11,461,498 11,461,498 11,461,498 —
Net change in fund balance — — 1,204 1,204Plus: Prior year encumbrances lapsed 386,328Less appropriation from fund balance (890,000)
Fund balances - beginning 83,901Fund balances - ending $ (418,567)
Combining and Individual Fund Statements and Schedules 121

Non-Major Governmental Funds
Special revenue funds are used to account for specific revenues that are legallyrestricted to expenditure for particular purposes or are committed for a particularpurpose by action of the County Council.
Capital project funds are used to account for the construction of major capitalfacilities. These funds are generally financed by bond issues, intergovernmentalrevenue, and contributions.
Debt service funds are used to account for the accumulation of resources that arerestricted, committed, or assigned for the payment of principal and interest on long-term obligations of governmental funds.


Howard County, MarylandCombining Balance Sheet
Non-Major Governmental FundsJune 30, 2019
Special Capital Debt Revenue Project Service Funds Funds Funds Total
ASSETSEquity in pooled cash $ 52,789,011 66,079,698 7,074,665 125,943,374Cash with fiscal agents — — 5,742,540 5,742,540Receivables:
Property taxes 857,805 — — 857,805Due from other governments 8,553,563 7,486,563 — 16,040,126Due from other funds 422,000 22,440,545 — 22,862,545Due from component units 5,682,544 — — 5,682,544Housing loans 13,588,326 — — 13,588,326Other 834,364 3,659 — 838,023
Prepaid items 2,704 — — 2,704Economic development loans 351,633 — — 351,633Material and supplies 668,338 — — 668,338
Total assets 83,750,288 96,010,465 12,817,205 192,577,958
LIABILITIESDue to other funds — 22,440,545 — 22,440,545Accounts payable / accrued liabilities 3,797,808 9,215,916 284,578 13,298,302Accrued wages and benefits 5,311,776 15,310 — 5,327,086Short-term loans and notes payable — 6,539,198 — 6,539,198Deposits and connection fees 256,072 — — 256,072Unearned revenue 10,165,809 — — 10,165,809
Total liabilities 19,531,465 38,210,969 284,578 58,027,012
DEFERRED INFLOWS OF RESOURCESUnavailable property taxes 711,410 — — 711,410Unavailable fees 2,356,590 4,810,732 — 7,167,322Unavailable grant revenues 3,004,592 — — 3,004,592
Total deferred inflows 6,072,592 4,810,732 — 10,883,324Total liabilities and deferred inflows 25,604,057 43,021,701 284,578 68,910,336
FUND BALANCESNonspendable:
Inventory 668,338 — — 668,338Prepaid Items 2,704 — — 2,704
Restricted:Catalyst loan program 1,024,177 — — 1,024,177Economic development initiatives 741,484 — — 741,484Fees in lieu 259,000 210,647 — 469,647Fire & rescue services 11,927,046 — — 11,927,046Forest conservation 1,964,542 — — 1,964,542Middle Patuxent environmental area program 44,511 — — 44,511Open space — 576,876 — 576,876Parkland watershed facilities — 13,602,040 — 13,602,040Program revenue 568,509 — — 568,509Public road facilities — 61,223,169 — 61,223,169Speed enforcement 805,201 — — 805,201Tax incremental financing project — — 12,532,627 12,532,627
Committed:Community renewal programs 32,067,143 — — 32,067,143Environmental services 9,246,805 — — 9,246,805Fire house & training facilities — 8,064,285 — 8,064,285Recreation programs 3,933,859 — — 3,933,859
Assigned:Capital projects — 3,227,918 — 3,227,918Streetlights — 1,432,857 — 1,432,857
Unassigned (5,107,088) (35,349,028) — (40,456,116)Total fund balances 58,146,231 52,988,764 12,532,627 123,667,622
Total liabilities, deferred inflows and fund balances $ 83,750,288 96,010,465 12,817,205 192,577,958
The accompanying notes are an integral part of these financial statements.
124 Combining and Individual Fund Statements and Schedules

Howard County, Maryland Combining Statement of Revenues, Expenditures, and Changes in Fund Balances
Non-Major Governmental FundsFor the Year Ended June 30, 2019
Special Capital Debt Revenue Project Service Funds Funds Funds Total
REVENUESProperty taxes $ 97,667,382 — 4,435,574 102,102,956Other local taxes 3,920,877 19,091,204 — 23,012,081Revenues from other governments 18,534,656 4,514,701 — 23,049,357Charges for services 45,131,971 630,171 — 45,762,142Investment income:
Interest on investments 2,002,205 1,857,536 786,026 4,645,767Installment interest from housing loans 60,540 — — 60,540
Fines and forfeitures 1,053,027 — — 1,053,027Developer fees 379,315 473,672 — 852,987Miscellaneous program revenue 7,046,974 720,640 188,627 7,956,241
Total revenues 175,796,947 27,287,924 5,410,227 208,495,098
EXPENDITURESCurrent:
General government 3,617,431 — 300,355 3,917,786Legislative and judicial 639,007 — — 639,007Public works 34,693,526 — — 34,693,526Public safety 106,217,400 — — 106,217,400Recreation and parks 20,397,611 — — 20,397,611Community services 10,011,335 — — 10,011,335Capital improvements — 64,102,437 — 64,102,437
Debt service:Principal payments on debt — — 374,920 374,920Interest payments on debt — — 3,023,665 3,023,665
Total expenditures 175,576,310 64,102,437 3,698,940 243,377,687Excess (deficiency) of revenues over expenditures 220,637 (36,814,513) 1,711,287 (34,882,589)
OTHER FINANCING SOURCES (USES)Bond premium 1,123 2,053,202 — 2,054,325Capital lease 2,223,000 — — 2,223,000Capital-related issuance of debt — 19,267,186 255,435 19,522,621Refunding bonds issued 16,809 2,240,889 54,440 2,312,138Payment to bond refunding escrow agent (17,923) (2,389,482) — (2,407,405)Transfers in 690,608 21,756,411 2,210,094 24,657,113Transfers out (4,672,316) (15,183,763) (345,439) (20,201,518)
Total other financing sources (1,758,699) 27,744,443 2,174,530 28,160,274
Net change in fund balances (1,538,062) (9,070,070) 3,885,817 (6,722,315) Fund balances - beginning 59,684,293 62,058,834 8,646,810 130,389,937 Fund balances - ending $ 58,146,231 52,988,764 12,532,627 123,667,622
The accompanying notes are an integral part of these financial statements.
Combining and Individual Fund Statements and Schedules 125

Howard County, MarylandCombining Balance Sheet
Non-Major Special Revenue FundsJune 30, 2019
Community Fire andRenewal Environmental Rescue Forest Recreation SpeedProgram Services Reserve Conservation Grants Program Enforcement
Fund Fund Fund Fund Fund Fund Fund TotalASSETS
Equity in pooled cash $ 12,559,043 10,115,626 16,462,750 1,976,252 1,078,029 9,741,105 856,206 52,789,011Receivables:
Property taxes — 22,529 835,276 — — — — 857,805
Due from other funds — — — — — 422,000 — 422,000
Due from other governments 414,746 — — — 8,129,561 9,256 — 8,553,563
Due from component units 5,682,544 — — — — — — 5,682,544
Housing loans 13,588,326 — — — — — — 13,588,326
Other — 169,433 48,492 — 609,102 6,177 1,160 834,364
Prepaid items — — — — 2,704 — — 2,704
Economic development loans — — — — 351,633 — — 351,633
Materials and supplies — — 459,208 — — 209,130 — 668,338Total assets 32,244,659 10,307,588 17,805,726 1,976,252 10,171,029 10,387,668 857,366 83,750,288
LIABILITIES
Accounts payable / accrued liabilities 123,620 719,841 494,834 741 1,844,500 582,448 31,824 3,797,808
Accrued wages and benefits 53,896 221,673 4,213,228 10,969 175,057 616,612 20,341 5,311,776
Deposits and connection fees — — — — 256,072 — — 256,072
Unearned revenue — 119,269 — — 5,000,921 5,045,619 — 10,165,809
Total liabilities 177,516 1,060,783 4,708,062 11,710 7,276,550 6,244,679 52,165 19,531,465
DEFERRED INFLOWS OFRESOURCES
Unavailable property taxes — — 711,410 — — — — 711,410
Unavailable fees — — — — 2,356,590 — — 2,356,590
Unavailable grant revenues — — — — 3,004,592 — — 3,004,592
Total deferred inflows of resources — — 711,410 — 5,361,182 — — 6,072,592Total liabilities and deferred inflows of
resources 177,516 1,060,783 5,419,472 11,710 12,637,732 6,244,679 52,165 25,604,057
FUND BALANCESNonspendable:
Inventory — — 459,208 — — 209,130 — 668,338Prepaid items — — — — 2,704 — — 2,704
Restricted:Catalyst loan program — — — — 1,024,177 — — 1,024,177Economic development initiatives — — — — 741,484 — — 741,484Fees in lieu — — — — 259,000 — — 259,000Fire & rescue services — — 11,927,046 — — — — 11,927,046Forest conservation — — — 1,964,542 — — — 1,964,542
Middle Patuxent environmental areaprogram — — — — 44,511 — — 44,511
Program revenue — — — — 568,509 — — 568,509Speed enforcement — — — — — — 805,201 805,201
Committed:Community renewal programs 32,067,143 — — — — — — 32,067,143Environmental services — 9,246,805 — — — — — 9,246,805Recreation programs — — — — — 3,933,859 — 3,933,859
Unassigned — — — — (5,107,088) — — (5,107,088)Total fund balances (deficits) 32,067,143 9,246,805 12,386,254 1,964,542 (2,466,703) 4,142,989 805,201 58,146,231
Total liabilities, deferred inflows andfund balances $ 32,244,659 10,307,588 17,805,726 1,976,252 10,171,029 10,387,668 857,366 83,750,288
The accompanying notes are an integral part of these financial statements.
126 Combining and Individual Fund Statements and Schedules

Howard County, MarylandCombining Statement of Revenues, Expenditures and Changes in Fund Balances
Non-major Special Revenue FundsFor the Year Ended June 30, 2019
Community Fire and
Renewal Environmental Rescue Forest Recreation SpeedProgram Services Reserve Conservation Grants Program Enforcement
Fund Fund Fund Fund Fund Fund Fund TotalREVENUES
Property taxes $ — 39,615 97,627,767 — — — — 97,667,382Other local taxes 3,920,877 — — — — — — 3,920,877
Revenues from other governments — 6,430 536,051 3,561 17,639,863 348,751 — 18,534,656Charges for services — 23,545,093 278,923 — 803,241 20,504,714 — 45,131,971Investment income:
Interest on investments 231,993 447,930 1,075,915 40,652 25,732 158,893 21,090 2,002,205Installment interest from housingloans 60,540 — — — — — — 60,540
Fines and forfeitures — — 700 — 35 30,817 1,021,475 1,053,027Developer fees — — — 379,315 — — — 379,315Miscellaneous program revenue 4,526,426 7,526 144,553 — 2,130,899 222,496 15,074 7,046,974
Total revenues 8,739,836 24,046,594 99,663,909 423,528 20,599,770 21,265,671 1,057,639 175,796,947
EXPENDITURESGeneral government — — — — 3,617,431 — — 3,617,431Legislative and judicial — — — — 639,007 — — 639,007Public works — 25,405,030 — — 9,288,496 — — 34,693,526Public safety — — 100,792,143 4,440,491 — 984,766 106,217,400Recreation and parks — — — 319,031 77,610 20,000,970 — 20,397,611
Community services 2,924,127 — — — 7,087,208 — — 10,011,335
Total expenditures 2,924,127 25,405,030 100,792,143 319,031 25,150,243 20,000,970 984,766 175,576,310
Excess (deficiency) of revenues overexpenditures 5,815,709 (1,358,436) (1,128,234) 104,497 (4,550,473) 1,264,701 72,873 220,637
OTHER FINANCING SOURCES (USES)Bond premium 1,123 — — — — — — 1,123Capital lease proceeds — — — — 2,223,000 — — 2,223,000Refunding bonds issued 16,809 — — — — — — 16,809
Payment to bond refunding escrow agent (17,923) — — — — — — (17,923)Transfers in — — 175,000 — 100,992 414,616 — 690,608Transfers out (440,582) (1,077,837) (2,258,043) (565) (15,306) (158,893) (721,090) (4,672,316)
Total other financing sources (uses) (440,573) (1,077,837) (2,083,043) (565) 2,308,686 255,723 (721,090) (1,758,699)
Net change in fund balances 5,375,136 (2,436,273) (3,211,277) 103,932 (2,241,787) 1,520,424 (648,217) (1,538,062)Fund balances - beginning 26,692,007 11,683,078 15,597,531 1,860,610 (224,916) 2,622,565 1,453,418 59,684,293
Fund balances - ending $ 32,067,143 9,246,805 12,386,254 1,964,542 (2,466,703) 4,142,989 805,201 58,146,231
The accompanying notes are an integral part of these financial statements.
Combining and Individual Fund Statements and Schedules 127

128 Combining and Individual Fund Statements and Schedules
Howard County, MarylandSchedule of Revenues, Expenditures and Changes in Fund Balance - Budgetary Basis
Community Renewal Program FundFor the Year Ended June 30, 2019
Budget Amounts Variance with Original Final Actual Final Budget
REVENUESLocal taxes $ 3,500,000 3,500,000 3,920,877 420,877Revenue from other agencies 110,000 110,000 — (110,000)Installment interest from housing loans 75,000 75,000 60,540 (14,460)Miscellaneous 1,759,444 1,759,444 4,526,427 2,766,983
Total revenues 5,444,444 5,444,444 8,507,844 3,063,400
EXPENDITURESCommunity services:
Revolving Loan Program Income 110,000 110,000 26,553 83,447Housing initiatives 3,479,000 3,479,000 3,281,907 197,093Housing and community developmentadministration 1,646,852 1,646,852 1,515,014 131,838
Total expenditures 5,235,852 5,235,852 4,823,474 412,378 Excess (deficiency) of revenues over expenditures 208,592 208,592 3,684,370 3,475,778
OTHER FINANCING SOURCES (USES)Transfers out (208,592) (208,592) (208,592) —
Total other financing sources (uses) (208,592) (208,592) (208,592) —
Net change in fund balance — — 3,475,778 3,475,778Plus: Prior year encumbrance lapsed 9,390
Fund balance - beginning 22,938,743Fund balance - ending 26,423,911
The ending fund balance is reconciled as follows:Budgetary basis, end of the fiscal year 26,423,911
Adjustments:Elimination of encumbrances outstanding 429,500Accruals (Housing loans) 6,291,947Non budgeted - Bad debt expense (1,078,215)
GAAP basis, end of fiscal year $ 32,067,143
The accompanying notes are an integral part of these financial statements.

Howard County, MarylandSchedule of Revenues, Expenditures and Changes in Fund Balance - Budgetary Basis
Environmental Services FundsFor the Year Ended June 30, 2019
Budget Amounts Variance with Original Final Actual Final Budget
REVENUESProperty taxes $ 20,000 20,000 39,615 19,615Revenue from other governments — — 6,430 6,430Charges for services 22,592,500 22,592,500 23,545,092 952,592Miscellaneous 3,000 3,000 7,013 4,013
Total revenues $ 22,615,500 $ 22,615,500 $ 23,598,150 $ 982,650
EXPENDITURESPublic works:
Administrative services 3,033,452 2,913,952 2,159,524 754,428 Operations 12,521,114 12,521,114 12,057,952 463,162 Collections 4,794,911 4,664,911 4,530,906 134,005 Recycling 6,783,019 6,948,519 6,915,652 32,867Contingency — 804,000 — 804,000
Total expenditures 27,132,496 27,852,496 25,664,034 2,188,462 Excess (deficiency) of revenues over expenditures (4,516,996) (5,236,996) (2,065,884) 3,171,112
OTHER FINANCING SOURCES (USES) Appropriation from fund balance 5,146,903 5,146,903 2,695,791 (2,451,112) Transfers out (629,907) (629,907) (629,907) —
Total other financing sources (uses) 4,516,996 4,516,996 2,065,884 (2,451,112)
Net change in fund balance $ — (720,000) — 720,000Plus: Prior year encumbrance lapsed 152,549Less: Appropriation from fund balance (2,695,791)
Fund balance - beginning 10,881,372Fund balance - ending 8,338,130
The ending fund balance is reconciled as follows:Budgetary basis, end of the fiscal year 8,338,130
Adjustments:Elimination of encumbrances outstanding 1,402,210Accruals (457,030)
Non budgeted - Bad debt expense (36,505)GAAP basis, end of fiscal year $ 9,246,805
The accompanying notes are an integral part of these financial statements.
Combining and Individual Fund Statements and Schedules 129

Howard County, MarylandSchedule of Revenues, Expenditures and Changes in Fund Balance - Budgetary Basis
Fire and Rescue Reserve FundFor the Year Ended June 30, 2019
Budget Amounts Variance withOriginal Final Actual Final Budget
REVENUESProperty taxes $ 97,724,150 97,724,150 97,627,767 (96,383)Revenues from other governments — — 536,051 536,051Charges for services 325,000 325,000 278,923 (46,077)Fines and forfeitures 700 700Miscellaneous 306,000 131,000 141,797 10,797 Total revenues 98,355,150 98,180,150 98,585,238 405,088
EXPENDITURESPublic safety:
Administrative 106,402,807 105,902,807 102,335,312 3,567,495 Total expenditures 106,402,807 105,902,807 102,335,312 3,567,495
Excess (deficiency) of revenues over expenditures (8,047,657) (7,722,657) (3,750,074) 3,972,583
OTHER FINANCING SOURCES (USES)Appropriation from fund balance 8,729,785 8,729,785 4,757,202 (3,972,583)Transfers in 175,000 175,000 —Transfers out (682,128) (1,182,128) (1,182,128) —
Total other financing sources (uses) 8,047,657 7,722,657 3,750,074 (3,972,583)
Net change in fund balance — — — — Plus prior year encumbrances lapsed 73,500
Less: Appropriation from fund balance (4,757,202)Fund balance - beginning 13,383,064Fund balance - ending 8,699,362
The ending fund balance is reconciled as follows:Budgetary basis, end of the fiscal year 8,699,362
Adjustments:Elimination of encumbrances outstanding 3,743,610Accruals (15,175)Non budgeted - Bad debt expense (41,543)
GAAP basis, end of fiscal year $ 12,386,254
The accompanying notes are an integral part of these financial statements.
130 Combining and Individual Fund Statements and Schedules

Plus: Prior year encumbrance lapsed
Howard County, MarylandSchedule of Revenues, Expenditures and Changes in Fund Balance - Budgetary Basis
Forest Conservation FundFor the Year Ended June 30, 2019
Budget Amounts Variance withOriginal Final Actual Final Budget
REVENUESRevenue from other governments $ — — 40,087 40,087Interest on investments — — 3,561 3,561Developer fees - inspections 15,000 15,000 — (15,000)Developer fees - mitigation 167,500 167,500 379,315 211,815 Total revenues 182,500 182,500 422,963 240,463
EXPENDITURESPublic Works:
Forest mitigation 658,087 658,087 322,330 335,757 Total expenditures 658,087 658,087 322,330 335,757
Excess (deficiency) of revenues over expenditures (475,587) (475,587) 100,633 576,220
OTHER FINANCING SOURCES (USES)Appropriation from fund balance 475,587 475,587 — (475,587)
Total other financing sources (uses) 475,587 475,587 — (475,587)
Net change in fund balance — — 100,633 100,633Fund balance - beginning 1,864,651Fund balance - ending 1,965,284
The ending fund balance is reconciled as follows:Budgetary basis, end of the fiscal year 1,965,284
Accruals (742)GAAP basis, end of fiscal year $ 1,964,542
The accompanying notes are an integral part of these financial statements.
Combining and Individual Fund Statements and Schedules 131

Howard County, MarylandSchedule of Revenues, Expenditures and Changes in Fund Balance - Budgetary Basis
Grants FundFor the Year Ended June 30, 2019
Budget Amounts Variance withOriginal Final Actual Final Budget
REVENUESRevenue from other agencies:
Grants from federal government $ 8,927,351 8,776,351 8,914,467 138,116Grants from state government 8,066,870 8,217,870 8,554,642 336,772Other local grants 4,032,569 4,032,569 170,755 (3,861,814)
Total revenue from other agencies 21,026,790 21,026,790 17,639,864 (3,386,926)
Charges for services 775,000 775,000 803,241 28,241Interest on investments — — 10,427 10,427Contingency 5,000,000 4,993,700 — (4,993,700)Miscellaneous 10,499,551 10,149,551 1,898,396 (8,251,155) Total revenues 32,301,341 31,951,341 20,351,928 (11,599,413)
EXPENDITURESGeneral government 4,418,077 4,068,077 3,879,228 188,849Legislative & judicial 797,513 797,513 635,826 161,687Public works 8,543,790 8,543,790 7,651,541 892,249Public safety 4,600,336 4,600,336 4,761,289 (160,953)Recreation & parks 417,690 417,690 79,134 338,556Community services 8,523,935 8,523,935 7,040,562 1,483,373Contingency 5,000,000 5,000,000 — 5,000,000 Total expenditures 32,301,341 31,951,341 24,047,580 7,903,761
Excess (deficiency) of revenues over expenditures — — (3,695,652) (3,695,652)
OTHER FINANCING SOURCES (USES)Capital lease proceeds — — 2,223,000 2,223,000
Total other financing sources (uses) — — — — 2,223,000 — 2,223,000
Net change in fund balance — — (1,472,652) (1,472,652)Plus: Prior year encumbrances lapsed (723,259)
Fund balances - beginning (56,724)Fund balances - ending (2,252,635)
The ending fund balance is reconciled as follows:Budgetary basis, end of the fiscal year (2,252,635)
Adjustments:Elimination of encumbrances outstanding 1,589,609Accruals (58,017)Non budgeted revenue - Bad debt expense/write off (492,711)Elimination of loan expenses 924,334Credit Adjustment (2,177,283)
GAAP basis, end of fiscal year $ (2,466,703)
The accompanying notes are an integral part of these financial statements.
132 Combining and Individual Fund Statements and Schedules

Howard County, MarylandSchedule of Revenues, Expenditures and Changes in Fund Balance - Budgetary Basis
Recreation Program FundFor the Year Ended June 30, 2019
Budget Amounts Variance with Original Final Actual Final Budget
REVENUESRevenue from other governments $ — — 348,751 348,751Charges for services 21,128,304 21,128,304 20,504,714 (623,590)Fines and forfeitures 75,000 75,000 30,817 (44,183)Miscellaneous program revenue 180,000 180,000 219,397 39,397
Total revenues 21,383,304 21,383,304 21,103,679 (279,625)
EXPENDITURESRecreation and parks:
Administration 21,994,905 21,994,905 20,000,218 1,994,687Total expenditures 21,994,905 21,994,905 20,000,218 1,994,687
Excess (deficiency) of revenues over expenditures (611,601) (611,601) 1,103,461 1,715,062
OTHER FINANCING SOURCES (USES)Transfers in 611,601 611,601 414,616 (196,985)
Total other financing sources (uses) 611,601 611,601 414,616 (196,985)
Net change in fund balance — — 1,518,077 1,518,077Plus: Prior year encumbrances lapsed 14,054
Fund balance - beginning 2,575,865Fund balance - ending 4,107,996
The ending fund balance is reconciled as follows:Budgetary basis, end of the fiscal year 4,107,996Adjustments:
Elimination of encumbrances outstanding 70,793Accruals (31,072)Non budgeted - Bad debt expense (4,728)
GAAP basis, end of fiscal year $ 4,142,989
The accompanying notes are an integral part of these financial statements.
Combining and Individual Fund Statements and Schedules 133

Howard County, MarylandSchedule of Revenues, Expenditures and Changes in Fund Balance - Budgetary Basis
Speed Enforcement FundFor the Year Ended June 30, 2019
Budget Amounts Variance with Original Final Actual Final Budget
REVENUESFines & forfeitures $ 1,648,369 1,648,369 1,021,475 (626,894)Other 20,000 20,000 15,074 (4,926)
Total revenues 1,668,369 1,668,369 1,036,549 (631,820)
EXPENDITURESPublic safety:
Administrative 968,369 968,369 899,914 68,455Total expenditures 968,369 968,369 899,914 68,455
Excess (deficiency) of revenues over expenditures 700,000 700,000 136,635 (563,365)
OTHER FINANCING SOURCES (USES)Transfers out (700,000) (700,000) (700,000) —
Total other financing sources (uses) (700,000) (700,000) (700,000) —
Net change in fund balance — — (563,365) (563,365)Plus: prior year encumbrances lapsed 148
Fund balance - beginning 1,368,407Fund balance - ending 805,190
The ending fund balance is reconciled as follows:Budgetary basis, end of the fiscal year 805,190Adjustments:
Non budgeted - Bad debt expense 11GAAP basis, end of fiscal year $ 805,201
The accompanying notes are an integral part of these financial statements.
134 Combining and Individual Fund Statements and Schedules

Howard County, MarylandCombining Balance Sheet
Non-Major Capital Project FundsJune 30, 2019
Fire Service Public Recreation Storm
Bldg & Equip Highway Libraries and Parks Drainage
Fund Fund Fund Fund Fund Total
ASSETSEquity in pooled cash $ 11,034,511 48,376,375 — 6,668,812 — 66,079,698Due from other governments 414,746 408,504 — 4,461,122 2,202,191 7,486,563Due from other funds — 22,440,545 — — — 22,440,545Other — 3,659 — — — 3,659
Total assets 11,449,257 71,229,083 — 11,129,934 2,202,191 96,010,465
LIABILITIESDue to other funds — — — — 22,440,545 22,440,545Accounts payable/accrued liability 1,273 5,140,097 — 1,988,724 2,085,822 9,215,916Accrued wages and benefits 9,781 5,529 — — — 15,310Short-term loans and notes payable 146,000 3,108,213 — 1,897,000 1,387,985 6,539,198
Total liabilities 157,054 8,253,839 — 3,885,724 25,914,352 38,210,969
DEFERRED INFLOWS OF RESOURCESUnavailable grant revenues — 319,218 — 3,627,865 863,649 4,810,732
Total liabilities and deferred inflows of resources 157,054 8,573,057 — 7,513,589 26,778,001 43,021,701
FUND BALANCESRestricted:
Fees in Lieu — — — — 210,647 210,647Open space — — — 576,876 — 576,876Parkland watershed facilities — — — 13,602,040 — 13,602,040Public road facilities — 61,223,169 — — — 61,223,169
Committed:Firehouse & training facilities 8,064,285 — — — — 8,064,285
Assigned:Capital projects 3,227,918 — — — — 3,227,918
Street lights — 1,432,857 — — — 1,432,857Unassigned — — — (10,562,571) (24,786,457) (35,349,028)
Total fund balances 11,292,203 62,656,026 — 3,616,345 (24,575,810) 52,988,764Total liabilities, deferred inflows and fund balances $ 11,449,257 71,229,083 — 11,129,934 2,202,191 96,010,465
The accompanying notes are an integral part of these financial statements.
Combining and Individual Fund Statements and Schedules 135

Howard County, MarylandCombining Statement of Revenues, Expenditures and Changes in Fund Balances
Non-Major Capital Project FundsFor the Year Ended June 30, 2019
Fire Service Public Recreation Storm
Bldg & Equip Highway Libraries and Parks Drainage
Fund Fund Fund Fund Fund Total
REVENUESOther local taxes $ 3,920,878 7,328,571 — 7,841,755 — 19,091,204Revenues from other governments — 910,905 — 13,998 3,589,798 4,514,701Charges for services — 584,560 — 45,611 — 630,171Interest on investments 207,450 1,452,988 — 197,098 — 1,857,536Developer contributions — 383,637 — 50,520 39,515 473,672Miscellaneous program revenues 650,000 3,280 — — 67,360 720,640
Total revenues 4,778,328 10,663,941 — 8,148,982 3,696,673 27,287,924
EXPENDITURESCapital improvements 1,502,198 24,906,217 — 12,278,461 25,415,561 64,102,437
Total expenditures 1,502,198 24,906,217 — 12,278,461 25,415,561 64,102,437Excess (deficiency) of revenues over expenditures 3,276,130 (14,242,276) — (4,129,479) (21,718,888) (36,814,513)
OTHER FINANCING SOURCES (USES)Bond premium 354,136 1,441,357 123,390 134,319 2,053,202Capital related debt issued 3,539,822 13,644,442 1,014,298 1,068,624 19,267,186Refunding bonds issued 66,172 1,397,435 — 347,016 430,266 2,240,889Payment to bond refunding escrow agent (70,560) (1,490,099) — (370,026) (458,797) (2,389,482)Transfers in 500,000 7,445,000 3,404,282 200,000 10,207,129 21,756,411Transfers out (2,500,671) (7,523,823) — (5,159,269) — (15,183,763)
Total other financing sources (uses) 1,888,899 14,914,312 3,404,282 (3,844,591) 11,381,541 27,744,443
Net change in fund balances 5,165,029 672,036 3,404,282 (7,974,070) (10,337,347) (9,070,070)Fund balances - beginning 6,127,174 61,983,990 (3,404,282) 11,590,415 (14,238,463) 62,058,834Fund balances - ending $ 11,292,203 62,656,026 — 3,616,345 (24,575,810) 52,988,764
The accompanying notes are an integral part of these financial statements.
136 Combining and Individual Fund Statements and Schedules

Howard County, MarylandCombining Balance Sheet
Non-Major Debt Service FundsJune 30, 2019
TaxBond Increment
Anticipation Note FinancingFund Fund Total
ASSETSEquity in pooled cash and cash equivalents $ 284,417 6,790,248 7,074,665Cash and securities with Fiscal Agents — 5,742,540 5,742,540
Total assets 284,417 12,532,788 12,817,205
LIABILITIES —Accounts payable / accrued liabilities 284,417 161 284,578
Total liabilities 284,417 161 284,578
FUND BALANCESRestricted:
Tax incremental financing project — 12,532,627 12,532,627Total fund balances — 12,532,627 12,532,627
Total liabilities and fund balances $ 284,417 12,532,788 12,817,205
The accompanying notes are an integral part of these financial statements.
Combining and Individual Fund Statements and Schedules 137

Howard County, MarylandCombining Statement of Revenues, Expenditures and Changes in Fund Balances
Non-major Debt Service FundsFor the Year Ended June 30, 2019
Bond TaxAnticipation
NoteFinancingIncrement
Fund Fund TotalREVENUES
Property taxes $ — 4,435,574 4,435,574Interest on investments 6 786,020 786,026Miscellaneous program revenue — 188,627 188,627
Total revenues 6 5,410,221 5,410,227
EXPENDITURESCurrent:
General government 196,075 104,280 300,355Debt service:
Principal payments on debt 309,920 65,000 374,920Interest payments on debt 2,013,980 1,009,685 3,023,665
Total expenditures 2,519,975 1,178,965 3,698,940Excess (deficiency) of revenues over expenditures (2,519,969) 4,231,256 1,711,287
OTHER FINANCING SOURCES (USES)Refunding bonds issued 54,440 — 54,440Capital-related issuance of debt 255,435 — 255,435Transfers in 2,210,094 — 2,210,094Transfers out — (345,439) (345,439)
Total other financing sources (uses) 2,519,969 (345,439) 2,174,530
Net change in fund balances — 3,885,817 3,885,817Fund balances - beginning — 8,646,810 8,646,810Fund balances - ending $ — 12,532,627 12,532,627
The accompanying notes are an integral part of these financial statements.
138 Combining and Individual Fund Statements and Schedules

Combining and Individual Fund Statements and Schedules 139
Howard County, MarylandSchedule of Revenues, Expenditures and Changes in Fund Balance - Budgetary Basis
Bond Anticipation NotesFor the Year Ended June 30, 2019
Budget Amounts Variance withOriginal Final Actual Final Budget
REVENUESInterest on investments — — 6 6
Total revenues — — 6 6
EXPENDITURESGeneral government:
Bond anticipation notes $ 3,000,000 1,428,750 188,739 1,240,011Debt service:
Issuance costs 2,000,000 571,250 309,920 261,330Interest — 3,000,000 1,987,770 1,012,230
Total expenditures 5,000,000 5,000,000 2,486,429 2,513,571Excess (deficiency) of revenues over expenditures (5,000,000) (5,000,000) (2,486,423) 2,513,577
OTHER FINANCING SOURCESCapital related debt issued 2,000,000 2,000,000 255,435 (1,744,565)Refunding bonds issued — — — 54,440 54,440Transfers in 3,000,000 3,000,000 763,860 (2,236,140)
Total other financing sources 5,000,000 5,000,000 1,073,735 (3,926,265)
Net change in fund balance — — (1,412,688) (1,412,688)Fund balances - beginning (93,088)Fund balances - ending (1,505,776)
Budgetary Basis, end of the fiscal year (1,505,776)Adjustments:Accruals (7,336)Additional transfers from General Fund on modifiedaccruals 1,513,112GAAP Basis, end of fiscal year $ —
The accompanying notes are an integral part of these financial statements.

Howard County, MarylandSchedule of Revenues, Expenditures and Changes in Fund Balance - Budgetary Basis
Tax Increment Financing FundFor the Year Ended June 30, 2019
Budget Amounts Variance withOriginal Final Actual Final Budget
REVENUESOther local taxes $ 2,427,403 2,427,403 4,435,574 2,008,171Interest on investments 15,000 15,000 615,581 600,581Miscellaneous 45,000 45,000 188,627 143,627
Total revenues 2,487,403 2,487,403 5,239,782 2,752,379
EXPENDITURESGeneral government:
Tax incremental financing 230,000 230,000 104,280 125,720Debt Service:
Principal 65,000 65,000 65,000 —Interest 1,010,000 1,010,000 1,009,685 315
Total expenditures 1,305,000 1,305,000 1,178,965 126,035Excess of revenues over expenditures 1,182,403 1,182,403 4,060,817 2,878,414
OTHER FINANCING SOURCESAppropriation from fund balance (1,007,403) (1,007,403) — 1,007,403Transfers out (175,000) (175,000) (175,000) —
Total other financing sources (1,182,403) (1,182,403) (175,000) 1,007,403
Net change in fund balance — — 3,885,817 3,885,817Fund balances - beginning 8,558,993Fund balances - ending 12,444,810
The ending fund balance is reconciled as follows:Budgetary Basis, end of the fiscal year 12,444,810 Adjustments: Accruals 87,817GAAP Basis, end of fiscal year $ 12,532,627
The accompanying notes are an integral part of these financial statements.
140 Combining and Individual Fund Statements and Schedules

Opioid Funding
Howard County is showing progress in reducing opioid overdose deaths and continues to expand its effortsthrough a $1 million grant to establish 24-hour substance misuse services at the Grassroots Crisis InterventionCenter. The County also opened the 16-bed Howard House, the first treatment facility of its kind in the county.

Non-Major Enterprise Funds
Enterprise funds are used to account for services for whichcustomers are charged a fee.


Howard County, MarylandCombining Statement of Net Position
Non-Major Enterprise FundsJune 30, 2019
Special WatershedRecreation Protection
Broadband Facility and Restoration TotalASSETSCurrent assets:
Equity in pooled cash $ 4,747,168 — 13,251,509 17,998,677Receivables:
Service billings 156,434 — — 156,434Restricted assets:
Equity in pooled cash and cash equivalents — 560,000 — 560,000Total current assets 4,903,602 560,000 13,251,509 18,715,111
Noncurrent assets:Restricted assets:
Other receivables 24,648 — 100,823 125,471Capital assets:
Land — 8,684,896 449,290 9,134,186Buildings and improvements, net — 2,523,704 1,307,329 3,831,033Machinery and equipment, net 719,012 17,605 711,815 1,448,432Infrastructure, net 10,702,482 — 28,906,978 39,609,460
Total noncurrent assets 11,446,142 11,226,205 31,476,235 — 54,148,582Total assets 16,349,744 11,786,205 44,727,744 72,863,693
DEFERRED OUTFLOWS OF RESOURCESDeferred refunding amount — 11,933 — 11,933
Total deferred outflows of resources — 11,933 — 11,933Total assets and deferred outflows of resources 16,349,744 11,798,138 44,727,744 72,875,626
LIABILITIESCurrent liabilities:
Due to other funds — 3,765,475 — 3,765,475Accounts payable 1,460 112,248 132,626 246,334Accrued wages and benefits 29,621 — 45,983 75,604
Total current liabilities 31,081 3,877,723 178,609 4,087,413
Current liabilities payable from restricted assets:Note payable — 510,000 98,400 608,400Loan Payable - current — — 146,226 146,226
Total current liabilities payable from restricted assets — 510,000 244,626 754,626Total current liabilities 31,081 4,387,723 423,235 4,842,039
Noncurrent liabilities:Compensated absences 35,189 — 39,771 74,960Refunding revenue note payable — 1,707,000 — 1,707,000LT Bond Payable 2,541,883 — 2,465,761 5,007,644Loan payable — — 1,413,658 1,413,658
Total noncurrent liabilities 2,577,072 — 1,707,000 — 3,919,190 — 8,203,262Total liabilities 2,608,153 6,094,723 4,342,425 13,045,301
NET POSITIONNet investment in capital assets 8,879,611 9,021,138 27,251,367 45,152,116Restricted:
For debt service — 560,000 — 560,000Unrestricted 4,861,980 (3,877,723) 13,133,952 14,118,209
Total net position $ 13,741,591 5,703,415 40,385,319 59,830,325
The accompanying notes are an integral part of these financial statements.
144 Combining and Individual Fund Statements and Schedules

Howard County, Maryland Combining Statement of Revenues, Expenses and Changes in Net Position
Non-Major Enterprise FundsFor the Year Ended June 30, 2019
Special WatershedRecreation Protection
Broadband Facility and Restoration TotalOperating revenues:
User charges $ 1,741,432 — 9,476,010 11,217,442Miscellaneous sales and services 2,385 300,000 25,068 327,453
Total operating revenues 1,743,817 300,000 9,501,078 11,544,895
Operating expenses:Salaries and employee benefits 496,654 — 1,048,897 1,545,551Contractual services 415,418 825,765 1,476,596 2,717,779Supplies and materials 350,792 — 7,678 358,470Business and travel 105 — 1,917 2,022Share of county administrative expenses — — 1,095,684 1,095,684Other administrative — — 82,293 82,293Depreciation expense 876,907 147,141 112,234 1,136,282
Total operating expenses 2,139,876 972,906 3,825,299 6,938,081Operating income (loss) (396,059) (672,906) 5,675,779 4,606,814
Nonoperating revenues (expenses):Interest on investments 131,891 6,957 518,727 657,575Interest expense (59,968) (117,747) (24,875) (202,590)Other, net — (22,754) (161) (22,915)
Total nonoperating revenues (expenses) 71,923 (133,544) 493,691 432,070
Net income (loss) before contributions and transfers (324,136) (806,450) 6,169,470 5,038,884Capital contribution 18,052 — 30,366,804 30,384,856Transfers in 555,170 1,671 — 556,841Transfers out — — (9,969,384) (9,969,384)
Change in net position 249,086 (804,779) 26,566,890 26,011,197Net position - beginning 13,492,505 6,508,194 13,818,429 33,819,128Net position - ending $ 13,741,591 5,703,415 40,385,319 59,830,325
The accompanying notes are an integral part of these financial statements.
Combining and Individual Fund Statements and Schedules 145

Howard County, Maryland Combining Statement of Cash Flows
Non-Major Enterprise FundsFor the Year Ended June 30, 2019
Special WatershedRecreation Protection
Broadband Facility and Restoration TotalCASH FLOWS FROM OPERATING ACTIVITIES
Cash received from customers $ 1,720,529 — 9,525,275 11,245,804Cash paid to suppliers (766,399) (839,133) (1,269,968) (2,875,500)Cash paid to / for employees (460,355) — (1,042,911) (1,503,266)Cash paid for interfund services used — — (487,834) (487,834)Other operating disbursements — 393,675 (874,305) (480,630)
Net cash provided by (used for) operating activities 493,775 (445,458) 5,850,257 5,898,574
CASH FLOWS FROM NONCAPITAL FINANCINGACTIVITIES
Interfund payable — 1,051,578 — 1,051,578Interfund operating transfers in (out) 555,170 1,671 (9,969,384) (9,412,543)
Net cash provided by (used for) noncapital financing activities 555,170 1,053,249 (9,969,384) (8,360,965)
CASH FLOWS FROM CAPITAL AND RELATED FINANCINGACTIVITIES
Proceeds from sale of county bonds — — 2,563,999 2,563,999Proceeds from loan — — 1,646,000 1,646,000Acquisition and construction of capital assets — — (49,900) (49,900)Payment of long-term debt principal — (497,000) (86,116) (583,116)Interest paid on long-term debt (59,968) (61,570) (24,875) (146,413)
Net cash (used for) capital and related financing activities (59,968) (558,570) 4,049,108 3,430,570
CASH FLOWS FROM INVESTING ACTIVITIESInterest on investments 108,500 (49,221) 424,762 484,041
Net cash provided by (used for) investing activities 108,500 (49,221) 424,762 484,041
Net increase (decrease) in cash and cash equivalents 1,097,477 — 354,743 1,452,220Balances - beginning of the year 3,649,691 560,000 12,896,766 17,106,457Balances - end of the year 4,747,168 560,000 13,251,509 18,558,677
Reconciliation of operating income (loss) to net cash provided byoperating activities:Operating (loss) income (396,059) (672,906) 5,675,779 4,606,814Adjustments to reconcile operating income to net cash:
Depreciation expense 876,907 147,141 112,234 1,136,282Effect of changes in operating assets and liabilities:
Accounts and other receivables (23,288) 93,674 22,055 92,441 Accounts payable (190) (13,367) 32,154 18,597 Accrued wages and benefits 1,216 — 4,310 5,526 Compensated absences 35,189 — 3,725 38,914
Total adjustments 889,834 227,448 174,478 1,291,760Net cash provided by (used in) operating activities $ 493,775 (445,458) 5,850,257 5,898,574
The accompanying notes are an integral part of these financial statements.
146 Combining and Individual Fund Statements and Schedules

Reading Across Running Brook
At events like Reading Across Running Brook, Howard County works to ensure that education supports allstudents and focuses on closing achievement gaps for disadvantaged youth.

Internal Service Funds
Internal service funds are used to account for the financing, on acost-reimbursement basis, of goods and services provided by onedepartment to other departments within the County.


Howard County, MarylandCombining Statement of Net Position
Internal Services FundsJune 30, 2019
Employee Technology RiskBenefits Fleet and Management
Self-Insurance Operations Communications Self-Insurance TotalASSETSCurrent assets:
Equity in pooled cash $ 14,744,353 9,079,099 6,554,869 22,432,277 52,810,598Other receivables 1,278,428 219,074 52,928 527,287 2,077,717Prepaid expenses — 7,074 — — 7,074Materials and supplies — 1,296,601 170,610 — 1,467,211
Total current assets 16,022,781 10,601,848 6,778,407 22,959,564 56,362,600
Noncurrent assets:Capital assets:
Buildings and improvements, net — 1,104,896 863,257 — 1,968,153Machinery and equipment, net — 27,494,606 16,238,843 1,703 43,735,152
Total noncurrent assets — 28,599,502 17,102,100 1,703 45,703,305Total assets 16,022,781 39,201,350 23,880,507 22,961,267 102,065,905
LIABILITIESCurrent liabilities:
Accounts payable 854,966 911,852 2,946,283 246,276 4,959,377Accrued wages and benefits 33,447 206,606 441,859 27,016 708,928Compensated absences — 8,100 4,633 — 12,733Deposits and connection fees — — 91,440 — 91,440Unpaid insurance claims 2,819,303 — — 4,698,948 7,518,251Current portion capital lease obligation — 264,452 1,378,740 — 1,643,192
Total current liabilities 3,707,716 1,391,010 4,862,955 4,972,240 14,933,921
Noncurrent liabilities:Compensated absences 23,783 307,752 621,301 23,322 976,158Unpaid insurance claims 57,537 — — 12,640,062 12,697,599Long-term capital lease obligation — 405,738 8,338,043 — 8,743,781
Total noncurrent liabilities 81,320 713,490 8,959,344 12,663,384 22,417,538Total liabilities 3,789,036 2,104,500 13,822,299 17,635,624 37,351,459
NET POSITIONNet investment in capital assets — 27,929,312 7,385,317 1,703 35,316,332Unrestricted 12,233,745 9,167,538 2,672,891 5,323,940 29,398,114
Total net position $ 12,233,745 37,096,850 10,058,208 5,325,643 64,714,446
The accompanying notes are an integral part of these financial statements.
150 Combining and Individual Fund Statements and Schedules

Howard County, Maryland Combining Statement of Revenues, Expenses and Changes in Net Position
Internal Service FundsFor the Year Ended June 30, 2019
Employee Technology RiskBenefits Fleet and Management
Self-Insurance Operations Communications Self-Insurance TotalOperating revenues:
User charges $ 61,760,988 18,761,195 23,033,872 10,510,038 114,066,093Insurance recoveries — — — 306,224 306,224Miscellaneous sales and services — 687,170 1,246,111 14,117 1,947,398
Total operating revenues 61,760,988 19,448,365 24,279,983 10,830,379 116,319,715
Operating expenses:Salaries and employee benefits 458,687 4,103,245 8,804,362 987,049 14,353,343Contractual services 704,875 1,408,591 11,478,176 93,923 13,685,565Supplies and materials 643 2,246,651 1,452,474 15,203 3,714,971Business and travel — 8,996 615,360 2,632 626,988Vehicle fuels and supplies — 3,711,367 66,830 8,322 3,786,519Share of County administrative expenses 3,637 337,521 24,095 465,796 831,049Insurance claims 54,844,428 — — 7,460,286 62,304,714Other administrative 2,323,912 — — 71,860 2,395,772Depreciation expense — 5,401,484 3,477,791 1,139 8,880,414
Total operating expenses 58,336,182 17,217,855 25,919,088 9,106,210 110,579,335Operating income (loss) 3,424,806 2,230,510 (1,639,105) 1,724,169 5,740,380
Nonoperating revenues (expenses):Interest on investments 275,623 240,647 97,097 622,032 1,235,399Interest expense — (15,689) (179,268) — (194,957)Revenue from other government — — — 34,944 34,944
Total nonoperating revenues (expenses) 275,623 224,958 (82,171) 656,976 1,075,386
Net income (loss) before contributions andtransfers 3,700,429 2,455,468 (1,721,276) 2,381,145 6,815,766
Capital contributions — 1,044,329 456,199 (20,846) 1,479,682Transfers out (275,623) (240,647) (11,015,553) (1,546) (11,533,369)
Change in net position 3,424,806 3,259,150 (12,280,630) 2,358,753 (3,237,921)Net position - beginning 8,808,939 33,837,700 22,338,838 2,966,890 67,952,367Net position - ending $ 12,233,745 37,096,850 10,058,208 5,325,643 64,714,446
The accompanying notes are an integral part of these financial statements.
Combining and Individual Fund Statements and Schedules 151

Howard County, MarylandCombining Statement of Cash Flows
Internal Service FundsFor the Year Ended June 30, 2019
Employee Technology RiskBenefits Fleet and Management
Self-Insurance Operations Communications Self-Insurance Total
CASH FLOWS FROM OPERATING ACTIVITIESCash received from customers $ 62,301,791 19,491,453 24,231,444 10,682,585 116,707,273Cash paid to suppliers (58,029,354) (5,299,872) (3,997,303) (5,785,968) (73,112,497)Cash paid to / for employees (454,546) (4,117,635) (9,477,655) (1,001,783) (15,051,619)Cash paid for quasi-external transactions (10,420) (1,976,543) (8,669,835) (59,814) (10,716,612)Other operating cash disbursements — — (90,892) (424,582) (515,474)
Net cash provided by operating activities 3,807,471 8,097,403 1,995,759 3,410,438 17,311,071
CASH FLOWS FROM NONCAPITALFINANCING ACTIVITIES
Operating subsidies and transfers to other funds (275,623) (240,647) (10,369,049) (1,546) (10,886,865)Net cash used for noncapital financing activities (275,623) (240,647) (10,369,049) (1,546) (10,886,865)
CASH FLOWS FROM CAPITAL AND RELATEDFINANCING ACTITIVIES
Acquisition and construction of capital assets — (10,025,088) — — (10,025,088)Proceeds from Capital Lease — — 9,716,783 — 9,716,783Payment of long-term debt principal — (259,722) (646,503) — (906,225)Interest paid — (15,689) (179,268) (21,200) (216,157)
Net cash (used for) provided by capital andrelated financing activities — (10,300,499) 8,891,012 (21,200) (1,430,687)
CASH FLOWS FROM INVESTING ACTIVITIESInterest on investments 275,623 240,647 97,097 656,977 1,270,344
Net cash (used for) provided by investingactivities 275,623 240,647 97,097 656,977 1,270,344
Net increase (decrease) in cash and cashequivalents 3,807,471 (2,203,096) 614,819 4,044,669 6,263,863
Cash and cash equivalents - beginning of the year 10,936,882 11,282,195 5,940,050 18,387,608 46,546,735Cash and cash equivalents - end of the year 14,744,353 9,079,099 6,554,869 22,432,277 52,810,598
Reconciliation of operating income (loss) to net cashprovided by operating activities:
Operating income (loss) 3,424,806 2,230,510 (1,639,105) 1,724,169 5,740,380
Adjustments to reconcile operating income to netcash provided by (used for) operating activities:Depreciation expense — 5,401,484 3,477,791 1,139 8,880,414Effect of changes in operating assets and liabilities:
Accounts and other receivables 540,801 43,087 (48,539) (222,794) 312,555 Prepaid expenses — (2,029) — — (2,029)Inventories — (60,778) 1,163 — (59,615) Accounts payable (12,980) 490,521 246,789 66,202 790,532 Accrued wages and benefits 305 (17,770) (17,760) (2,081) (37,306)
Compensated absences 3,836 12,378 (40,278) (10,021) (34,085) Deposits and connection fees — — 23,200 — 23,200 Unpaid insurance claims (149,297) — — 1,853,824 1,704,527 Unearned revenue — — (7,502) — (7,502)
Total adjustments 382,665 5,866,893 3,634,864 1,686,269 11,570,691Net cash provided by operating activities $ 3,807,471 8,097,403 1,995,759 3,410,438 17,311,071
The accompanying notes are an integral part of these financial statements.
152 Combining and Individual Fund Statements and Schedules

RTA
The Regional Transportation Agency of Central Maryland announced enhancements and improvements in2019 that added 5,600 new service hours to Howard County routes. The changes shorten wait times so thatall buses operate on 30-minute or one-hour intervals, with expanded service on Sundays.

Fiduciary Funds
Fiduciary funds are used to report assets held in a trustee oragency capacity for others and which cannot be used to supportthe government’s own programs.


Howard County, MarylandCombining Statement of Net Position
Pension and Other Post-Employment Benefits Trust FundsJune 30, 2019
Howard County Howard CountyHoward County Police and Fire Other Post-
Retirement Employees' EmploymentPlan Retirement Plan Benefits Fund Total
ASSETSReceivables:
Interest and dividends $ 529,156 684,444 506 1,214,106Employer contributions 914,183 1,730,621 — 2,644,804Member contributions 290,277 461,866 — 752,143Sale of investments 81,133 105,120 — 186,253Other 6,641 8,605 — 15,246
Investments, at fair value:Cash — — 336,048 336,048Equities 201,438,898 260,994,079 — 462,432,977Alternative investments 117,663,332 152,450,363 — 270,113,695Mutual funds — — 154,445,416 154,445,416Money market funds 9,445,607 11,362,564 128,761 20,936,932Fixed income securities 133,992,377 173,607,071 — 307,599,448Real assets 16,514,364 21,396,818 — 37,911,182
Prepaid insurance 19,687 24,071 — 43,758Total assets 480,895,655 622,825,622 154,910,731 1,258,632,008
LIABILITIESAccounts payable — — 57,556 57,556Investments purchased 2,378,604 3,081,835 — 5,460,439Other 319,692 385,354 623,400 1,328,446
Total liabilities 2,698,296 3,467,189 680,956 6,846,441
NET POSITIONNet position restricted for pension and other post-employmentbenefits $ 478,197,359 619,358,433 154,229,775 1,251,785,567
156 Combining and Individual Fund Statements and Schedules

Howard County, MarylandCombining Statement of Changes in Net Assets
Pension and Other Post Employment Benefits Trust FundsFor the Year Ended June 30, 2019
Howard County Howard CountyPolice and Fire Other Post-
Howard County Employees' EmploymentRetirement Plan Retirement Plan Benefits Fund Total
ADDITIONSContributions:
Employer $ 14,155,379 27,719,839 38,380,982 80,256,200Member 4,378,114 8,124,859 — 12,502,973
Total contributions 18,533,493 35,844,698 38,380,982 92,759,173
Investment income (expense):Net change in fair value of investments 19,695,913 24,600,895 6,137,909 50,434,717Interest 2,232,787 2,862,178 — 5,094,965Dividends 10,691,643 13,753,018 3,477,923 27,922,584Other 67,972 87,464 — 155,436Investment expense (1,333,203) (1,664,369) (330,787) (3,328,359)
Net investment income 31,355,112 39,639,186 9,285,045 80,279,343Total additions 49,888,605 75,483,884 47,666,027 173,038,516
DEDUCTIONSBenefits 19,012,353 27,571,300 22,755,131 69,338,784Administrative expenses 438,403 456,187 106,156 1,000,746
Total deductions 19,450,756 28,027,487 22,861,287 70,339,530
Change in net position 30,437,849 47,456,397 24,804,740 102,698,986Net position - beginning of year 447,759,510 571,902,036 129,425,035 1,149,086,581Net position - end of year $ 478,197,359 619,358,433 154,229,775 1,251,785,567
Combining and Individual Fund Statements and Schedules 157

Howard County, MarylandCombining Statement of Assets and Liabilities
Agency FundsJune 30, 2019
Road StateSurety Property Tax
Multifarious Deposit and InterestFund Fund Fund Total
ASSETSEquity in pooled cash $ 417,463 5,423,648 1,401,669 7,242,780Property taxes receivable — 534,227 534,227Other receivable 3,845 3,845
Total assets 421,308 5,423,648 1,935,896 7,780,852
LIABILITIESAccounts payable — — 1,935,896 1,935,896Deposits 419,001 5,423,648 — 5,842,649Other liabilities 2,307 — — 2,307
Total liabilities $ 421,308 5,423,648 1,935,896 7,780,852
158 Combining and Individual Fund Statements and Schedules

Howard County, MarylandCombining Statement of Changes in Assets and Liabilities
Agency FundsFor the Year Ended June 30, 2019
Balance BalanceJune 30, 2018 Additions Deductions June 30, 2019
Multifarious FundASSETS
Equity in pooled cash and cash equivalents $ 381,922 75,999 40,458 417,463Other receivable — 3,845 — 3,845
Total assets 381,922 79,844 40,458 421,308
LIABILITIESDeposits 379,615 79,844 40,458 419,001Other liabilities 2,307 — — 2,307
Total liabilities 381,922 79,844 40,458 421,308
Road Surety Deposit FundASSETS
Equity in pooled cash and cash equivalents 5,766,486 1,497,920 1,840,758 5,423,648Total assets 5,766,486 1,497,920 1,840,758 5,423,648
LIABILITIESAccounts payable 63,910 5,384,553 5,448,463 —Deposits 5,702,576 1,432,949 1,711,877 5,423,648
Total liabilities 5,766,486 6,817,502 7,160,340 5,423,648
State Property Tax and Interest FundASSETS
Equity in pooled cash and cash equivalents 1,618,463 313,783,258 314,000,052 1,401,669Property taxes receivable 425,119 274,165,839 274,056,731 534,227
Total assets 2,043,582 587,949,097 588,056,783 1,935,896
LIABILITIESAccounts payable 2,043,582 270,323,874 270,431,560 1,935,896
Total liabilities 2,043,582 270,323,874 270,431,560 1,935,896
Total Agency FundsASSETS
Equity in pooled cash and cash equivalents 7,766,871 315,357,177 315,881,268 7,242,780Property taxes receivable 425,119 274,165,839 274,056,731 534,227Other receivable — 3,845 — 3,845
Total assets 8,191,990 589,526,861 589,937,999 7,780,852
LIABILITIESAccounts payable 2,107,492 275,708,427 275,880,023 1,935,896Deposits 6,082,191 1,512,793 1,752,335 5,842,649Other liabilities 2,307 — — 2,307
Total liabilities $ 8,191,990 277,221,220 277,632,358 7,780,852
Combining and Individual Fund Statements and Schedules 159

Capital Assets Used in the Operation ofGovernmental Funds


Howard County, MarylandSchedule By Function and Activity
Capital Assets Used in the Operation of Governmental FundsFor the Year Ended June 30, 2019
Improvements Land and
Land Other Than
Buildings Construction
Function and Activity Improvements Buildingsand
Infrastructure Equipment In Progress TotalGeneral government:
County executive $ — — 7,314 — — 7,314Technology and communication — — — 5,586,895 — 5,586,895Finance — — — 2,033,222 — 2,033,222County administration — — 32,457,859 639,741 — 33,097,600
Total general government — — 32,465,173 8,259,858 — 40,725,031
Public safety:Corrections — — — 396,070 — 396,070Fire 5,710,331 50,299,292 12,174,217 43,136,858 — 111,320,698Police — 7,102,814 4,452,304 13,792,450 — 25,347,568
Total public safety 5,710,331 57,402,106 16,626,521 57,325,378 — 137,064,336
Public facilities:Public works 331,785,012 185,572,822 657,054,789 13,629,274 — 1,188,041,897Planning and zoning 13,476 — 323,226 322,889 — 659,591Inspections, licenses and permits — — — 2,788,579 — 2,788,579Transportation 2,679,368 12,146,655 283,461 14,401,917 — 29,511,401
Total public facilities 334,477,856 197,719,477 657,661,476 31,142,659 — 1,221,001,468
Legislative and judicial:Circuit court — — 63,560 77,383 — 140,943County council — — — 32,616 — 32,616State's attorney — — — 59,229 — 59,229Sheriff — 25,434 — 206,677 — 232,111
Total legislative and judicial — 25,434 63,560 375,905 — 464,899
Community services:Community Resources & Services — — 176,213 306,004 — 482,217Health department — — 374,202 1,486,968 — 1,861,170Housing and communitydevelopment 490,900 3,400,119 — — — 3,891,019Library 3,164,668 94,991,306 6,667,280 209,830 — 105,033,084
Total community services 3,655,568 98,391,425 7,217,695 2,002,802 — 111,267,490
Recreation and parks:Recreation and parks 118,833,945 56,261,556 117,725,295 5,082,509 — 297,903,305
Total recreation and parks 118,833,945 56,261,556 117,725,295 5,082,509 — 297,903,305
Agricultural land preservation:Agricultural land easements 139,713,172 — — — — 139,713,172
Total agricultural landpreservation 139,713,172 — — — — 139,713,172
Construction in progress — — — — 101,613,027 101,613,027Total governmental funds capitalassets $ 602,390,872 409,799,998 831,759,720 104,189,111 101,613,027 2,049,752,728
This schedule presents only the capital asset balances related to governmental funds. Accordingly, the capital assets reported in internal service fundsare excluded from the above amounts. Generally, the capital assets of internal service funds are included as governmental activities in the Statementof Net Position.
162 Combining and Individual Fund Statements and Schedules

Howard County, MarylandSchedule of Changes By Function and Activity
Capital Assets Used in the Operation of Governmental FundsFor the Year Ended June 30, 2019
Balances Assets Balances Balances Allowance for Depreciation Balances
Function and Activity June 30, 2018 Additions Deductions June 30, 2019 June 30, 2018 Additions Deductions June 30, 2019General government:
County executive $ 7,314 — — 7,314 5,846 488 — 6,334Technology and communication 5,586,895 — — 5,586,895 5,585,843 8,820 — 5,594,663Finance 2,033,222 — — 2,033,222 1,978,695 5,842 — 1,984,537County administration 33,097,600 — — 33,097,600 29,682,760 1,600,182 — 31,282,942
Total general government 40,725,031 — — 40,725,031 37,253,144 1,615,332 — 38,868,476
Public safety:Corrections 383,615 35,145 22,690 396,070 126,101 33,639 4,017 155,723Fire 108,167,607 3,720,646 567,555 111,320,698 38,869,048 3,996,354 486,861 42,378,541Police 23,968,843 1,598,660 219,935 25,347,568 11,279,485 1,119,834 67,385 12,331,934
Total public safety 132,520,065 5,354,451 810,180 137,064,336 50,274,634 5,149,827 558,263 54,866,198
Public facilities:Public works 1,143,188,845 65,723,611 20,870,559 1,188,041,897 346,673,534 28,527,567 3,093,818 372,107,283Planning and zoning 659,591 — — 659,591 391,431 25,847 — 417,278Inspections, licenses and permits 2,788,579 — — 2,788,579 2,742,292 6,545 — 2,748,837Transportation 28,795,822 2,536,961 1,821,382 29,511,401 8,545,402 1,585,715 1,818,308 8,312,809
Total public facilities 1,175,432,837 68,260,572 22,691,941 1,221,001,468 358,352,659 30,145,674 4,912,126 383,586,207
Legislative and judicial:County council 32,616 — — 32,616 4,271 4,659 — 8,930Circuit court 140,943 — — 140,943 68,271 8,678 — 76,949States attorney 59,229 — — 59,229 59,230 — — 59,230Sheriff 255,302 — 23,191 232,111 140,734 16,566 9,019 148,281
Total legislative and judicial 488,090 — 23,191 464,899 272,506 29,903 9,019 293,390
Community services:Community resources and services 366,367 115,850 — 482,217 155,349 49,244 — 204,593Health department 1,859,321 21,788 19,939 1,861,170 1,244,308 185,705 19,939 1,410,074Housing and community development 3,891,019 — — 3,891,019 2,242,061 68,003 — 2,310,064Library 104,714,532 318,552 — 105,033,084 21,237,527 2,575,473 — 23,813,000
Total community services 110,831,239 456,190 19,939 111,267,490 24,879,245 2,878,425 19,939 27,737,731
Recreation and parks:Recreation and parks 293,897,701 15,239,354 11,233,750 297,903,305 64,366,464 6 7,013,718 324,342 71,055,840
Total recreation and parks 293,897,701 15,239,354 11,233,750 297,903,305 64,366,464 7,013,718 324,342 71,055,840
Agricultural land preservation:Agricultural land easements 139,713,172 — — 139,713,172 — — — —
Total agricultural land preservation 139,713,172 — — 139,713,172 — — — —
Total county government 1,893,608,135 89,310,567 34,779,001 1,948,139,701 535,398,652 46,832,879 5,823,689 576,407,842Construction in progress 70,541,932 127,351,645 96,280,550 101,613,027 — — — —
Total governmental funds capital assets $ 1,964,150,067 216,662,212 131,059,551 2,049,752,728 535,398,652 46,832,879 5,823,689 576,407,842
This schedule presents only the capital asset balances related to governmental funds. Accordingly, the capital assets reported in internal service funds are excluded from the above amounts. Generally, the capitalassets of internal service funds are included as governmental activities in the statement of net position.
Combining and Individual Fund Statements and Schedules 163

Capital Assets Used in the Operation ofEnterprise Funds


Howard County, MarylandSchedule of Capital Assets and Depreciation
Schedule of Capital Assets Used in the Operation of Enterprise FundsFor the Year Ended June 30, 2019
Balances Assets Balances Balances Allowance for Depreciation Balances
June 30, 2018 Additions Deductions June 30, 2019 June 30, 2018 Additions Deductions June 30, 2019Land:
Utility $ 3,068,642 — — 3,068,642 — — — —Watershed — 449,290 — 449,290 — — — —Golf course 8,684,896 — — 8,684,896 — — — —
Total land 11,753,538 449,290 — 12,202,828 — — — —
Buildings:Utility 236,808,771 — — 236,808,771 87,549,526 4,659,730 — 92,209,256Golf course 1,058,133 — — 1,058,133 548,624 21,162 — 569,786Watershed 195,189 — — 195,189 12,152 3,904 — 16,056
Total buildings 238,062,093 — — 238,062,093 88,110,302 4,684,796 — 92,795,098
Improvements other than buildings:Utility 81,646,895 2,268,474 91,754 83,823,615 47,587,678 3,304,792 91,754 50,800,716Watershed — 1,274,245 — 1,274,245 — 146,049 — 146,049Golf course 2,368,920 — — 2,368,920 215,117 118,446 — — 333,563
Total improvements 84,015,815 3,542,719 91,754 87,466,780 47,802,795 3,569,287 91,754 51,280,328
Infrastructure:Utility 727,249,909 30,535,863 — 757,785,772 309,294,824 13,906,058 — 323,200,882Watershed — 29,746,575 — 29,746,575 — 839,597 — 839,597Broadband 14,181,540 16,152 — 14,197,692 2,786,065 709,145 — 3,495,210
Total infrastructure 741,431,449 60,298,590 — 801,730,039 312,080,889 15,454,800 — 327,535,689
Machinery and equipment:Utility 14,445,660 2,129,790 973,653 15,601,797 5,998,727 1,144,048 336,197 6,806,578Golf course 326,646 — — 326,646 301,510 7,531 — 309,041Watershed 1,114,107 49,900 162,173 1,001,834 226,203 101,656 37,840 290,019 Broadband 1,283,168 — — 1,283,168 396,394 167,762 — 564,156
Total machinery and equipment 17,169,581 2,179,690 1,135,826 18,213,445 6,922,834 1,420,997 374,037 7,969,794Grand total $ 1,092,432,476 66,470,289 1,227,580 1,157,675,185 454,916,820 25,129,880 465,791 479,580,909
Does not include $127,333,464 of construction in progress.
166 Combining and Individual Fund Statements and Schedules

Practice Howard
Howard County Government and Howard County General Hospital have partnered for an innovative programto boost the number of primary care physicians in the county by offering funding and support to new doctorsin exchange for five-year commitments to serve our community. In 2019, Howard County was named oneof the Top Ten Healthiest Communities by U.S. News & World Report.

Long-Term Debt
Liabilities of the County represented by outstanding generalobligation bonds and other long-term debt.


Howard County, MarylandSchedule of Bonded and Other Long-Term Debt
GeneralJune 30, 2019
Rate ofInterestPayable Total Due to
Type of Debt Maturity Interest Issued Outstanding to Maturity Maturity
Consolidated PublicImprovement Bonds
02/12/2004 2006-2025 2.00 - 5.00 $ 112,305,000 7,995,000 199,875 * 8,194,87512/08/2009 2012-2023 2.00 - 5.00 85,860,000 13,940,000 348,500 14,288,50003/16/2010 2011-2030 3.00 - 5.55 88,420,000 43,760,000 17,193,163 60,953,16311/17/2011 2013-2032 3.00 - 5.00 182,055,000 90,040,000 18,446,240 108,486,24004/11/2012 2013-2032 2.00 - 4.00 37,370,000 1,640,000 65,600 1,705,60004/04/2013 2014-2033 2.375 - 5.00 97,910,000 3,925,000 196,250 4,121,25004/03/2014 2015-2034 3.00 - 5.00 117,125,000 27,875,000 3,509,000 31,384,00004/22/2015 2016-2035 3.00 - 5.00 184,195,000 120,330,000 33,146,462 153,476,46203/30/2016 2017-2036 2.00 - 5.00 96,260,000 88,180,000 30,436,100 118,616,10004/25/2017 2018-2037 3.25 - 5.00 274,310,000 264,750,000 98,768,488 363,518,48812/21/2017 2018-2034 3.00 - 5.00 184,440,000 183,405,000 79,543,700 262,948,70004/18/2018 2020-2038 3.25 - 5.00 129,890,001 129,890,001 57,127,938 187,017,93905/29/2019 2020-3039 2.75 - 5.00 131,295,477 131,295,477 43,953,307 175,248,784
Total Consolidated PublicImprovement Bonds 1,721,435,478 1,107,025,478 382,934,623 1,489,960,101
Tax increment financing bonds 2017-2047 4.00 - 6.10 65,225,000 65,100,000 59,180,291 124,280,291
Compensated absences n/a n/a n/a 26,443,323 n/a 26,443,323
Capital leases n/a n/a n/a 31,603,394 n/a 31,603,394
Landfill closure obligations n/a n/a n/a 23,430,000 n/a 23,430,000
Agricultural land preservationprogram 2018-2037 2.19 - 8.60 n/a 93,483,238 18,987,374 112,470,612
Total debt $ 1,786,660,478 1,347,085,433 ** 461,102,288 1,808,187,721
* Includes administrative fees.
** Does not include deferred refunding premium liability of $139,356,696, unamortized bond discount of $(24,516), unpaid claims of $20,215,850, net OPEBliability of $353,228,214, net LOSAP liability of $21,907,552 and net pension liability of $150,671,742 and other non-current liabilities of $9,132,933 includedin the Statement of Net Position.
170 Combining and Individual Fund Statements and Schedules

Howard County, MarylandSchedule of Changes in General Long-Term Debt
Long-Term ObligationsFor the Year Ended June 30, 2019
Balance Balance
June 30, 2018 Issued Refunded Retired June 30, 2019
General county bonds:General improvement $ 353,719,803 62,521,492 6,702,993 18,304,287 391,234,015Storm drain 35,949,116 1,498,890 450,785 1,928,312 35,068,909Police department 6,519,037 395,097 149,703 443,843 6,320,588Fire department 26,580,852 3,605,994 69,328 1,077,738 29,039,780Schools 475,436,432 45,739,490 13,408,442 33,255,041 474,512,439Community renewal 1,681,915 16,808 17,610 138,405 1,542,708Recreation and parks 53,635,481 1,361,313 363,564 2,375,420 52,257,810Community college 108,822,365 16,156,393 2,442,575 5,486,954 117,049,229
Total Bonds 1,062,345,001 131,295,477 23,605,000 63,010,000 1,107,025,478
Other long-term debtTax increment financing 65,165,000 — — 65,000 65,100,000Compensated absences 26,336,346 3,845,962 — 3,738,985 26,443,323Capital Leases 35,011,551 2,223,000 — 5,631,157 31,603,394Landfill closure obligation 23,085,000 345,000 — — 23,430,000Agricultural land preservation program 97,715,767 — — 4,232,529 93,483,238
Total other long-term debt 247,313,664 6,413,962 — 13,667,671 240,059,955
Total long-term debt $ 1,309,658,665 137,709,439 23,605,000 76,677,671 1,347,085,433 *
* Does not include deferred refunding premium liability of $139,356,696, unamortized bond discount of ($25,404), unpaid claims of ($24,516) (including$7,518,251 due within one year), other non-current liabilities of $9,132,933, net OPEB liability of $353,228,214, net LOSAP liability of $21,907,552 and netpension liability of $150,671,742 included in the Statement of Net Position.
Combining and Individual Fund Statements and Schedules 171

Howard County, MarylandSchedule of Bonded and Other Long-Term Debt
Enterprise FundJune 30, 2019
Rate of Amount Interest Payable Total DueDate of Issue Maturity Interest Issued Outstanding to Maturity to Maturity
Metropolitan district bonds:12/08/2009 2011-2031 1.00 - 4.00 $ 7,255,000 335,000 5,025 340,02511/17/2011 2013-2042 3.00 - 5.00 36,245,000 15,110,000 5,875,725 20,985,72504/11/2012 2013-2037 3.00 - 4.00 19,970,000 660,000 19,800 679,80004/04/2013 2014-2038 2.375 - 4.00 39,155,000 15,390,000 5,845,450 21,235,45004/03/2014 2015-2044 2.00 - 4.00 22,055,000 8,450,000 3,152,301 11,602,30104/22/2015 2016-2045 2.00 - 5.00 31,015,000 22,990,000 12,322,628 35,312,62803/30/2016 2017-2046 3.00 - 5.00 26,190,000 24,840,000 12,524,744 37,364,74404/25/2017 2018-2047 3.00 - 5.00 81,515,000 79,970,000 37,819,702 117,789,70212/21/2017 2018-2044 3.00 - 5.00 56,075,000 54,960,000 23,033,856 77,993,85604/18/2018 2019-2048 3.125 - 5.00 38,150,000 37,250,000 25,084,432 62,334,43205/29/2019 2020-2049 3.00 - 5.00 66,605,000 66,605,000 35,892,818 102,497,818
Total metropolitan district bonds 424,230,000 326,560,000 161,576,481 488,136,481
MD water quality 10/18/00 2003-2022 2.40 34,000,000 6,182,266 608,666 * 6,790,932MD water quality 01/29/02 2005-2024 2.00 21,329,363 5,671,086 613,960 * 6,285,046MD water quality 10/1/08 2009-2029 2.30 1,197,362 592,832 109,994 * 702,826MD water quality 11/19/09 2010-2031 1.00 3,443,711 2,126,663 246,763 * 2,373,426Total water quality 59,970,436 14,572,847 1,579,383 16,152,230
Watershed Protection 05-29-19 2020-2039 2.75-5.00 2,334,523 2,334,523 898,904 3,233,427
Broadband 03/15/16 2021 2.00 1,510,000 1,510,000 60,400 1,570,400Broadband 04/18/18 2023 3.00 1,025,000 1,025,000 123,000 1,148,000Total Broadband 2,535,000 2,535,000 183,400 2,718,400
Special recreation facility bonds 2012-2022 2.48 5,400,000 2,217,000 111,371 2,328,371
MDE Loan 2019-2028 2.95 1,646,000 1,559,884 228,088 1,787,972
Compensated absences n/a n/a n/a 891,193 n/a 891,193
Major water and sewer agreements n/a n/a n/a 874,412 n/a 874,412
Total debt $ 496,115,959 351,544,859 ** 164,577,627 516,122,486
* Includes administrative fees.
**Does not include deferred refunding premium of $24,444,168, net OPEB liability of $23,102,908, and net pension liability of $2,037,339 included in theStatement of Net Position.
172 Combining and Individual Fund Statements and Schedules

Howard County, MarylandSchedule of Changes in Bonded Long-Term Debt
Enterprise FundFor the Year Ended June 30, 2019
Balance BalanceJune 30, 2018 Issued Refunded Retired June 30, 2019
Metropolitan district bonds:04/08/2009 $ 1,255,000 — — 1,255,000 —12/08/2009 6,775,000 — 6,115,000 325,000 335,00003/09/2011 1,140,000 — — 1,140,000 —11/17/2011 17,480,000 — — 2,370,000 15,110,00004/11/2012 1,300,000 — — 640,000 660,00004/04/2013 17,190,000 — — 1,800,000 15,390,00004/03/2014 9,490,000 — — 1,040,000 8,450,00004/22/2015 23,645,000 — — 655,000 22,990,00003/15/2016 25,270,000 — — 430,000 24,840,00004/25/2017 80,460,000 — — 490,000 79,970,00012/21/2017 55,425,000 — — 465,000 54,960,00004/18/2018 38,150,000 — — 900,000 37,250,00005/15/2019 — 66,605,000 — — 66,605,000
Total Bonds 277,580,000 66,605,000 6,115,000 11,510,000 326,560,000
Other long-term debtMD water quality 10/18/00 8,147,187 — — 1,964,921 6,182,266MD water quality 01/29/02 6,865,803 — — 1,194,719 5,671,084MD water quality 10/1/08 646,177 — — 53,353 592,824MD water quality 11/19/09 2,297,093 — — 170,420 2,126,673
Total other long-term debt 17,956,260 — — 3,383,413 14,572,847
Watershed Protection — 2,334,523 — — 2,334,523
Broadband 03/15/16 1,510,000 — — — 1,510,000Broadband 04/18/18 1,025,000 — — — 1,025,000
Total Broadband 2,535,000 — — — 2,535,000
Special recreation facility bonds 2,714,000 — — 497,000 2,217,000
MDE Loan — 1,646,000 — 86,116 1,559,884
Compensated absences 889,638 84,319 — 82,764 891,193
Major water and sewer agreements 922,923 49,000 — 97,511 874,412
Total long-term debt $ 302,597,821 70,718,842 6,115,000 15,656,804 351,544,859 *
*Does not include deferred refunding premium of $24,444,168, net OPEB liability of $23,102,908, and net pension liability of $2,037,339 included in theStatement of Net Position.
Combining and Individual Fund Statements and Schedules 173

Statistical Section
The Statistical Section provides detailed information for the primarygovernment as a context for understanding what the information in thefinancial statements, note disclosures, and required supplementaryinformation says about the County’s overall financial health. The tablesin this section are unaudited because they often present data fromoutside accounting records.


Statistical Section (Unaudited)
Index
Financial Trends - These schedules contain trend information to help the reader understand how the County’s financialperformance and well-being have changed over time.
Revenue Capacity - These schedules contain information to help the reader assess the County’s most significant localrevenue source, the property tax.
Debt Capacity - These schedules present information to help the reader assess the affordability of the County’s currentlevels of outstanding debt and the County’s ability to issue additional debt in the future.
Demographic and Economic Information - These schedules offer demographic and economic indicators to help thereader understand the environment within which the County’s financial activities take place.
Operating Information - These schedules contain service and infrastructure data to help the reader understand how theinformation in the County’s financial report relates to the services the County provides and the activities it performs.
176 Statistical Section


Howard County, MarylandNet Position by Category
Last Ten Fiscal Years(accrual basis of accounting)
2010 2011 2012 2013 2014 2015 2016 2017 2018 2019
Governmental activities
Net investment in capital assets $ 735,346,804 780,074,223 716,222,072 740,258,162 755,904,065 754,407,588 772,350,290 834,114,554 826,399,982 841,929,843
Restricted 163,458,570 83,470,483 82,432,184 94,955,786 109,207,649 99,723,862 109,620,128 114,206,491 153,326,501 142,249,607
Unrestricted (a) (629,621,547) (619,606,891) (620,794,431) (727,260,025) (905,160,838) (950,355,750) (991,153,043) (1,207,393,428) (1,003,960,300) (997,456,851)
Subtotal governmental activities netposition (b) 269,183,827 (c) 243,937,815 (d) 177,859,825 (e) 107,953,923 (40,049,124) (f) (96,224,300) (109,182,625) (259,072,383) (24,233,817) (13,277,401)
Business-type activities
Net investment in capital assets 391,047,153 412,443,596 352,371,984 343,029,639 349,976,408 410,168,067 410,561,263 414,126,888 419,010,628 456,887,408
Restricted 120,266,910 132,071,680 60,755,862 54,677,366 48,248,364 48,241,852 42,470,585 27,949,207 24,709,724 21,823,966
Unrestricted 719,135 1,877,926 85,856,157 114,065,506 115,007,448 107,862,198 138,508,000 157,835,870 151,054,737 146,526,725
Subtotal business-type activities netposition 512,033,198 (c) 546,393,202 (d) 498,984,003 (e) 511,772,511 513,232,220 (f) 566,272,117 591,539,848 599,911,965 594,775,089 625,238,099
Primary government
Net investment in capital assets 1,126,393,957 1,068,594,056 1,083,287,801 1,105,880,473 1,164,575,655 1,164,575,655 1,182,911,553 1,248,241,442 1,245,410,610 1,298,817,251
Restricted 283,725,480 143,188,046 149,633,152 157,456,013 147,965,714 147,965,714 152,090,713 142,155,698 178,036,225 164,073,573
Unrestricted (628,902,412) (534,938,274) (613,194,519) (790,153,390) (842,493,552) (842,493,552) (852,645,043) (1,049,557,558) (852,905,563) (850,930,126)
Total primary government net position $ 781,217,025 676,843,828 619,726,434 473,183,096 470,047,817 470,047,817 482,357,223 340,839,582 570,541,272 611,960,698
(a) Deficits occur in unrestricted net position for governmental activities because the County issues debt to fund construction costs for the Public School. (b) System and Community College, yet these component units own the capital assets. See the Management's Discussion and Analysis for further details. (c) FY2010 net positions of governmental and business-type activities were restated in fiscal year 2011. (d) FY2011 net positions of governmental and business-type activities were restated in fiscal year 2012. (e) FY2012 net positions of governmental and business-type activities were restated in fiscal year 2013.(f) FY2014 net positions of governmental and business-type activities were restated in fiscal year 2015, mainly due to the implementation of GASB 68, which resulted in an overall negative net positions of
governmental activities.
178 Statistical Section

Howard County, MarylandChanges in Net Position
Last Ten Fiscal Years(accrual basis of accounting)
2010 2011 2012 2013 2014 2015 2016 2017 2018 2019ExpensesGovernmental activities:
General government $ 40,551,179 50,599,944 84,025,615 (a) 87,405,901 104,520,136 75,558,318 66,234,421 66,948,584 58,020,097 65,241,233Public safety 154,381,502 167,113,492 184,324,533 196,950,283 198,590,882 208,298,711 207,170,029 230,134,183 217,378,984 249,887,935Public works 101,682,165 102,947,974 115,231,452 130,500,653 148,889,651 179,349,488 156,707,838 168,834,876 194,980,993 207,843,230Recreation and parks 26,909,791 27,086,201 29,974,257 29,210,799 35,764,376 37,193,427 42,880,875 47,094,291 25,923,502 54,344,080Legislative and judicial 19,917,865 21,684,657 22,248,551 23,682,923 23,259,531 27,110,955 26,070,345 27,693,094 27,484,681 30,139,996Community services 38,203,641 38,522,217 45,302,315 38,506,895 45,311,763 48,650,488 45,928,376 44,497,229 47,215,901 50,250,870State highways 2,450,937 1,917,170 2,900,053 7,225,028 6,634,669 763,353 3,341,087 5,842,868 4,934,098 9,286,446Education 557,205,570 605,557,506 610,774,387 639,025,259 637,839,632 669,067,653 717,742,080 739,013,105 701,633,749 710,311,491Interest on long-term debt 32,759,477 37,102,195 53,851,903 47,729,955 50,489,693 43,648,543 49,977,613 57,494,607 61,452,013 51,541,615
Total governmental activities expenses 974,062,127 1,052,531,356 1,148,633,066 1,200,237,696 1,251,300,333 1,289,640,936 1,316,052,664 1,387,552,837 1,339,024,018 1,428,846,896Business-type activities:
Water and sewer 64,845,285 66,636,363 67,635,638 87,569,376 98,795,678 97,764,211 95,781,698 101,312,345 105,229,515 113,056,969Golf course 1,791,000 1,762,425 1,921,518 1,885,101 — — — — — —Other (b) — — — — 3,094,253 5,977,330 6,551,799 7,356,981 6,585,542 7,163,586
Total business-type activities expenses 66,636,285 68,398,788 69,557,156 89,454,477 101,889,931 103,741,541 102,333,497 108,669,326 111,815,057 120,220,555
Total primary government expenses 1,040,698,412 1,120,930,144 1,218,190,222 1,289,692,173 1,353,190,264 1,393,382,477 1,418,386,161 1,496,222,163 1,450,839,075 1,549,067,451
Program revenuesGovernmental activities:
Charges for servicesGeneral government 29,198,040 33,914,325 42,534,975 46,065,885 49,312,264 40,365,251 41,462,547 52,783,407 47,092,030 48,266,394Public works 42,937,855 41,652,829 46,145,115 43,476,909 44,007,973 48,319,370 50,419,335 48,313,166 49,740,333 49,166,390Recreation and parks 12,621,042 13,361,672 13,591,958 14,420,583 16,481,357 17,471,881 18,231,380 20,182,293 19,791,578 20,905,820Other 7,079,677 8,665,495 22,407,037 10,725,120 12,538,229 25,188,353 13,987,065 10,672,780 13,053,507 14,129,641
Operating grants and contributions 26,732,848 26,559,373 46,323,888 27,837,622 33,472,335 35,864,017 40,094,831 39,402,540 43,351,124 40,559,501Capital grants and contributions 22,998,508 24,715,975 68,472,451 (c) 42,575,352 10,215,527 16,814,899 27,792,294 18,163,355 24,455,008 18,377,194
Total governmental activities programrevenues 141,567,970 148,869,669 239,475,424 185,101,471 166,027,685 184,023,771 191,987,452 189,517,541 197,483,580 191,404,940
Business-type activities:Charges for services
Water and sewer 44,355,147 48,606,394 50,729,734 54,712,858 59,641,881 64,133,085 64,965,916 64,761,724 64,642,532 64,833,505Golf course 2,149,442 2,056,408 2,134,912 2,069,082 — — — — — —Other (b) — — — — 12,310,600 14,129,334 14,256,985 13,906,569 13,712,093 11,544,895
Operating grants and contributions 32,395,714 30,884,327 29,880,497 29,006,605 29,196,783 30,010,057 31,339,509 32,669,952 33,958,088 35,349,018Capital grants and contributions 9,666,912 24,331,033 21,109,099 16,285,260 11,361,621 51,939,661 14,728,750 10,262,423 11,976,929 43,164,177
Total business-type activities programrevenues 88,567,215 105,878,162 103,854,242 102,073,805 112,510,885 160,212,137 125,291,160 121,600,668 124,289,642 154,891,595
Total primary government program revenues $ 230,135,185 254,747,831 343,329,666 287,175,276 278,538,570 344,235,908 317,278,612 311,118,209 321,773,222 346,296,535
(continued)
Statistical Section 179

Howard County, MarylandChanges in Net Position
Last Ten Fiscal Years(accrual basis of accounting)
2010 2011 2012 2013 2014 2015 2016 2017 2018 2019Net (expenses)/revenue
Governmental activities $(832,494,157) (903,661,687) (909,157,642) (1,015,136,225) (1,085,272,648) (1,105,617,165) (1,124,065,212) (1,198,035,296) (1,141,540,438) (1,237,441,956)
Business-type activities 21,930,930 37,479,374 34,297,086 12,619,328 10,620,954 54,470,596 22,957,663 12,931,342 12,474,585 34,671,040
Total primary government net expenses (810,563,227) (866,182,313) (874,860,556) (1,002,516,897) (1,074,651,694) (1,051,146,569) (1,101,107,549) (1,185,103,954) (1,129,065,853) (1,202,770,916)
General revenues and other changes in net position
Governmental activities:
Taxes
Property taxes 494,218,364 504,884,233 504,771,008 523,266,142 539,731,584 559,405,539 586,123,532 608,458,370 630,762,037 654,794,565
Local income taxes 266,953,624 331,334,252 358,356,561 360,251,116 400,455,701 412,674,188 431,743,893 436,993,783 466,935,173 496,679,385
Other local taxes 47,911,642 46,357,182 54,343,807 61,337,101 61,035,196 68,300,957 72,656,951 77,911,373 77,122,059 69,739,135
Intergovernmental, unrestricted 790,181 (d) 1,089,121 780,358 1,422,086 1,466,960 1,553,636 1,836,227 1,763,063 1,590,437 1,673,415
Unrestricted investment income 6,481,902 2,890,191 9,636,106 (552,647) (e) 2,230,944 2,840,722 5,054,711 1,206,178 4,998,389 13,585,602
Miscellaneous 861,084 816,830 1,216,774 1,195,039 1,102,401 970,104 3,347,590 90,510 2,700,739 2,513,727
Transfers (587,000) 2,995,034 (586,842) — 7,345,000 3,696,843 2,318,086 5,389,399 9,151,633 9,412,543
Subtotal governmental activities 816,629,797 890,366,843 928,517,772 946,918,837 1,013,367,786 1,049,441,989 1,103,080,990 1,131,812,676 1,193,260,467 1,248,398,372
Business-type activities:
Unrestricted investment income 395,605 196,349 170,617 169,180 135,292 242,826 823,902 830,024 2,434,920 5,998,775
Miscellaneous — — — — — 23,318 3,804,252 150 53,351 (794,262)
Transfers 587,000 (2,995,034) 586,842 — (7,345,000) (3,696,843) (2,318,086) (5,389,399) (9,151,633) (9,412,543)
Subtotal business-type activities 982,605 (2,798,685) 757,459 169,180 (7,209,708) (3,430,699) 2,310,068 (4,559,225) (6,663,362) (4,208,030)
Total primary government 817,612,402 887,568,158 929,275,231 947,088,017 1,006,158,078 1,046,011,290 1,105,391,058 1,127,253,451 1,186,597,105 1,244,190,342
Net position balances
Governmental activities:
Change in net position, governmental activities (15,864,360) (13,294,844) 19,360,130 (68,217,388) (71,904,862) (48,149,278) (20,984,222) (66,222,620) 51,720,029 10,956,416
Net position, beginning-governmental activities 388,436,002 377,349,272 254,510,988 263,297,945 107,953,923 36,049,061 (88,198,403) (131,849,763) (198,072,383) (24,233,817)
Restatement 4,777,630 (109,543,440) (10,573,173) (87,126,634) — (76,098,186) — — 122,118,537 —
Net position, ending-governmental activities 377,349,272 254,510,988 263,297,945 107,953,923 36,049,061 (88,198,403) (109,182,625) (198,072,383) (24,233,817) (13,277,401)
Business-type activities:
Change in net position, business-type activities 22,913,535 34,680,689 35,054,545 12,788,508 3,411,246 53,039,897 25,267,731 8,372,117 5,811,223 30,463,010
Net position, beginning-business-type activities 491,434,162 514,347,697 546,713,887 581,447,747 511,772,511 515,183,757 566,272,117 591,539,848 599,911,965 594,775,089
Restatement — (2,314,499) (320,685) (82,463,744) — (1,951,537) — — (10,948,099) —
Net position, ending-business-type activities 514,347,697 546,713,887 581,447,747 511,772,511 515,183,757 566,272,117 591,539,848 599,911,965 594,775,089 625,238,099
Total primary government $ 891,696,969 801,224,875 844,745,692 619,726,434 551,232,818 478,073,714 482,357,223 401,839,582 570,541,272 611,960,698
(a) The increase from prior period is due to expenses incurred on behalf of the other local government jurisdictions participating in the Inter-County Broadband Network (ICBN) Project.
(b) Other consists of golf course and watershed restoration and protection in fiscal year 2014, as well as broadband services starting in fiscal year 2015.
(c) The increase from prior period is due to recognizing significant Federal grant monies for the ICBN Project.
(d) In fiscal year 2010, funding from the State government for highway improvements was drastically reduced.
(e) The decrease from prior period is due to decreases in the fair value of U.S. Treasury Strips investments.
180 Statistical Section

Howard County, MarylandFund Balances, Governmental Funds
Last Ten Fiscal Years(modified accrual basis of accounting)
2010 2011 2012 2013 2014 2015 2016 2017 2018 2019General fund
Nonspendable $ — — — — 3,319 8,140,178 7,632,118 9,045,255 12,600,473 12,265,039Restricted — — — — — — 1,972,282 2,070,419 1,024,450 —Committed — 56,803,611 56,258,912 57,209,710 59,271,162 61,260,575 64,172,639 67,382,973 71,338,939 73,958,202Assigned — 27,137,601 45,003,053 67,354,332 64,171,013 34,992,177 53,577,009 31,953,418 49,382,483 35,997,183Unassigned — 8,732,004 10,616,787 9,095,856 2,831,645 3,295,630 12,015,718 26,239,270 7,898,186 18,387,493Reserved 61,447,806 — — — — — — — — —Unreserved (a) 10,324,543 — — — — — — — — —Total general fund 71,772,349 92,673,216 (b) 111,878,752 (b) 133,659,898 126,277,139 107,688,560 (c) 139,369,766 136,691,335 142,244,531 140,607,917
All other governmentalfundsNonspendable 14,244,327 14,620,132 14,929,252 16,636,383 22,166,070 648,352 644,176 656,721 671,042Restricted 83,470,483 82,432,184 94,955,786 97,656,784 100,314,009 107,647,846 112,136,072 152,302,051 142,249,607Committed 39,463,332 46,521,229 47,867,222 38,602,234 35,555,303 46,729,075 48,677,180 52,857,796 54,474,185Assigned 77,104,933 72,761,301 62,934,694 63,615,900 63,398,155 63,361,371 60,075,902 56,117,487 62,387,719
Unassigned (106,842,248) (82,621,664) (77,809,341) (67,616,626) (72,262,418) (125,621,490) (119,153,788) (88,731,324) (110,672,917)Reserved 94,605,498 — — — — — — — — —
Unreserved reported in:Special revenue funds 102,795,989 — — — — — — — — —Capital projects funds (54,747,305) — — — — — — — — —Total all other
governmental funds 142,654,182 107,440,827 133,713,182 142,877,613 148,894,675 149,171,119 92,765,154 102,379,542 173,202,731 149,109,636
Total governmental funds $ 214,426,531 200,114,043 245,591,934 276,537,511 275,171,814 256,859,679 232,134,920 239,070,877 315,447,262 289,717,553
Notes: Fund balance format for 2011 has been updated due to implementation of GASB Statement No. 54.
(a) Decrease in the general fund - unreserved fund balance from fiscal years 2007 to 2010 were the result of downturns in the national economy. (b) Increases in the total fund balance of the general fund in fiscal years 2011 through 2013 are due to increases in the local income taxes received. (c) Decrease in the total balance of the general fund in fiscal year 2015 was due to one-time initiatives of $37.7 million.
Statistical Section 181

Howard County, MarylandChanges in Fund Balances of Governmental Funds
Last Ten Fiscal Years (modified accrual basis of accounting)
2010 2011 2012 2013 2014 2015 2016 2017 2018 2019REVENUES
Property taxes (a) $ 494,641,029 504,030,717 504,228,502 524,942,040 539,320,074 559,393,599 586,906,599 608,790,864 630,002,471 654,226,577Other local taxes 341,954,181 (b) 361,710,858 411,966,798 436,072,090 453,982,722 463,904,916 506,819,854 514,455,726 523,874,099 533,151,563State shared taxes 790,181 (c) 1,089,121 780,358 1,422,086 1,247,317 1,531,596 2,077,909 1,818,048 1,595,662 1,673,415Revenues from other agencies (grants) — — — — — — — — — —Revenues from other governments 30,866,154 40,479,177 80,612,132 73,118,716 37,436,410 35,645,234 30,616,053 53,144,527 46,881,676 43,490,797Charges for services 47,153,092 49,916,981 49,498,494 51,204,711 53,168,180 54,693,447 55,954,266 57,428,448 58,820,287 59,537,731Interest on investments 6,435,344 2,394,644 9,487,997 (712,942) (e) 2,010,668 2,574,475 4,970,717 4,878,623 7,961,507 13,567,305Decrease in fair value of investments (3,699,638) (3,203,311) (496,321)Installment interest from housing loans — 495,546 148,109 160,296 220,274 268,410 83,994 27,190 53,025 60,540Licenses and permits 5,839,006 5,651,511 5,754,961 6,455,619 6,696,288 6,586,220 7,200,241 7,090,791 6,874,461 6,641,437Recoveries for interfund services 11,457,728 11,734,246 11,720,813 11,553,101 11,633,284 14,133,304 15,706,180 — — —Fines and forfeitures 2,983,119 3,393,723 3,534,706 3,462,342 3,863,722 4,024,120 4,356,639 4,481,676 4,315,875 4,071,307Developer contributions (d) 1,665,829 1,363,545 1,556,906 1,767,910 1,446,618 4,561,155 4,612,357 9,070,823 2,372,712 852,987Rental of property (d) 206,754 197,100 196,214 159,373 177,814 111,853 — — — —Payments from component units (d) 861,084 816,830 817,842 818,144 818,167 351,439 2,588,330 2,076,568 2,095,129 1,546,337Sale of property — — — — — 3,464,497 — — — —Miscellaneous program revenues 8,189,651 8,645,463 8,752,216 22,328,003 13,318,287 14,594,154 25,441,734 15,406,458 17,149,954 16,880,092
Total revenues 953,043,152 991,919,462 1,089,056,048 1,132,751,489 1,125,339,825 1,165,838,419 1,247,334,873 1,274,970,104 1,298,793,547 1,335,203,767
EXPENDITURESCurrent:
General government 21,822,449 23,691,385 25,227,536 33,612,637 45,526,306 50,754,551 54,918,742 48,703,477 51,307,571 60,629,770Legislative & judicial 19,370,470 20,263,005 20,919,318 21,547,432 22,684,466 24,165,800 25,893,292 26,315,797 27,175,301 28,520,391Public works 87,553,902 84,173,380 92,598,067 90,672,711 97,867,406 104,503,144 102,894,102 104,307,451 112,420,109 113,436,661Public safety 148,773,884 156,336,439 168,832,385 175,555,967 191,882,471 205,038,450 208,774,567 219,541,903 228,466,896 235,952,000Recreation and parks 24,363,103 23,856,314 27,999,911 30,906,131 35,432,626 36,911,248 38,473,557 39,667,818 41,877,752 43,171,463Community services 37,096,762 36,935,327 36,671,787 37,503,416 45,406,497 46,474,576 44,631,695 42,267,451 44,819,301 47,391,787Education 542,819,926 572,584,372 584,322,887 603,534,562 606,673,692 651,103,285 651,837,577 699,206,963 704,546,696 707,246,000
Capital improvements (d) 79,441,474 129,566,744 146,521,532 101,470,657 106,355,030 112,042,331 133,208,954 134,994,751 114,284,257 140,460,747Debt service:
Principal 50,192,000 52,461,000 58,381,930 54,262,375 60,433,375 61,185,578 68,484,249 74,766,641 66,443,603 69,728,497Interest 33,465,400 37,179,040 40,178,908 43,795,819 45,176,541 45,595,837 45,384,247 47,438,207 47,177,499 57,055,983
Total expenditures 1,044,899,370 1,137,047,006 1,201,654,261 1,192,861,707 1,257,438,410 1,337,774,800 1,374,500,982 1,437,210,459 1,493,230,012 1,503,593,299Excess (deficiency) of revenues overexpenditures (91,856,218) (145,127,544) (112,598,213) (60,110,218) (132,098,585) (171,936,381) (127,166,109) (162,240,355) (194,436,465) (168,389,532)
OTHER FINANCING SOURCES (USES)Bond premium 18,974,053 4,604,998 30,560,868 9,283,948 11,979,779 17,522,949 13,541,018 43,899,251 49,340,059 12,219,992Capital lease proceeds 4,909,012 186,598 — — — 12,562,393 10,058,351 3,368,036 11,936,898 2,223,000Capital related debt issued 101,010,000 111,115,000 109,310,002 91,930,000 117,315,277 100,180,000 76,490,000 133,925,001 128,380,000 108,710,477Tax increment financing bonds — — — — — — — — 48,225,000Refunding bonds issued 85,860,000 — 110,115,000 5,980,000 16,809,723 84,015,000 21,280,000 140,385,000 184,440,000 22,585,000Capital lease (4,909,012) — — — — — — — — —Installment purchase agreements issued (d) — 10,274,400 25,253,100 — 4,951,615 3,448,120 4,817,735 10,756,470 3,095,670 —Payment to bond refunding escrow agent (99,078,896) — (128,985,283) (6,714,081) (32,958,802) (93,816,818) (26,600,367) (169,143,917) (219,985,848) (24,024,558)Transfers in 35,705,614 39,835,317 38,465,384 45,403,189 66,149,637 53,153,609 27,765,305 47,227,975 58,254,689 64,806,430Transfers out (36,246,056) (36,788,523) (40,218,754) (45,378,817) (54,790,208) (47,084,255) (24,910,692) (41,241,503) (47,584,645) (43,860,518)
Total other financing sources and uses 106,224,715 129,227,790 144,500,317 100,504,239 129,457,021 129,980,998 102,441,350 169,176,313 216,101,823 142,659,823
Net change in fund balances $ 14,368,497 (15,899,754) 31,902,104 40,394,021 (2,641,564) (41,955,383) (24,724,759) 6,935,958 21,665,358 (25,729,709)
Debt service as a percentage of noncapitalexpenditures 8.35% 8.67% 8.87% 8.92% 8.61% 8.91% 8.71% (f) 8.94% 8.60% 9.10%
(a) Increase in real property taxes is due to steady increases in property values in the County. (b) Other local taxes decreased due to declines in the quantity and value of real estate transactions. (c) Decrease in State shared taxes is due to drastic decline in State highways funding. (d) Reclassifications of prior years' data were made to allow for consistency purposes and comparison amongst all years. (e) The decrease from prior period is due to decreases in the fair value of U.S. Treasury Strips investments. (f) Capital outlay used in FY16 calculation reported incorrectly.
182 Statistical Section

Howard County, MarylandAssessed and Estimated Accrual Value of Taxable Property
Last Ten Fiscal Years
Real Property Personal Property Total
Fiscal Residential Commercial Assessed Total Direct Assessed Total Direct AssessedYear Assessed Value Assessed Value Value (a) Tax Rate (b) Value (a) Tax Rate (b) Value2010 $ 41,289,749,176 7,374,511,107 48,664,260,283 1.014 1,588,889,810 2.535 50,253,150,0932011 39,020,062,724 7,498,201,792 46,518,264,516 1.014 1,623,786,020 2.535 48,142,050,5362012 36,128,044,459 7,493,817,659 43,621,862,118 1.014 1,555,657,980 2.535 45,177,520,0982013 35,145,195,556 7,494,536,821 42,639,732,377 1.014 1,561,354,930 2.535 44,201,087,3072014 35,501,333,441 7,489,276,140 42,990,609,581 1.014 1,561,531,690 2.535 44,552,141,2712015 36,390,442,780 7,722,275,864 44,112,718,644 1.014 1,618,445,500 2.535 45,731,164,1442016 37,954,765,647 7,984,317,384 45,939,083,031 1.014 1,702,530,310 2.535 47,641,613,3412017 39,566,020,328 8,410,004,037 47,976,024,365 1.014 1,650,784,630 2.535 49,626,808,9952018 40,976,007,300 (c) 8,845,776,496 (c) 49,821,783,796 1.014 1,696,221,380 2.535 51,518,005,1762019 42,313,103,881 9,366,459,559 51,679,563,440 1.014 1,733,052,800 2.535 53,412,616,240
(a) Real property and personal property assessments are done every three years and every year, respectively, by the State Department of Assessments and Taxation at 100% of estimated fair value.Tax-exempt property is not included in the assessed value.
(b) Rates are per $100 of assessed value. (c) Residential and commercial assessed value amounts were revised for FY18
Statistical Section 183

Howard County, MarylandDirect and Overlapping Property Tax Rates
Last Ten Fiscal Years(Per $100 of Assessed Value)
Howard County Direct Rates
PersonalFiscal Year Real Property Property
2010 1.014 2.5352011 1.014 2.5352012 1.014 2.5352013 1.014 2.5352014 1.014 2.5352015 1.014 2.5352016 1.014 2.5352017 1.014 2.5352018 1.014 2.5352019 1.014 2.535
184 Statistical Section

Howard County, MarylandPrincipal Property Taxpayers
Current Year and Nine Years Ago
2019 2010
Taxable Percentage of Taxable Percentage ofAssessed Total County Assessed Total County
Taxpayer Valuation Assessed Valuation Taxpayer Valuation Assessed ValuationBaltimore Gas & Electric Company $ 458,256,170 0.86% Baltimore Gas & Electric Company $ 319,284,746 0.64%Parcel D Property LLC 276,187,367 0.52% Mall in Columbia Business Trust 179,702,000 0.36%Mall in Columbia Business Trust 143,429,033 0.27% Verizon-Maryland Inc. 167,551,260 0.33%Howard Properties HowardCrossing 128,384,010 0.24% Magazine Howard Crossing LLC 120,280,100 0.24%
Verizon-Maryland Inc. 124,848,114 0.23%Sprint CommunicationsCompanyLLC 99,760,250 0.20%
Seasons of Laurel LLC 100,299,266 0.19% Seasons of Laurel LLC 78,184,964 0.16%API Columbia Town Center LLC 99,483,367 0.19% Liberty Property LTD Partnership 76,856,466 0.15%
KMF Sherwood Crossing LLC 80,161,333 0.15% Sherwood Crossing Apts LLCAP 69,779,400 0.14%Cellco Partnership 79,114,700 0.15% API Columbia Town Center LLC 67,101,400 0.13%New Cingular Wireless PCS LLC 73,930,059 0.14% New Cingular Wireless PCS LLC 34,354,830 0.07%
Total $ 1,564,093,419 2.94% Total $ 1,212,855,416 2.42%
Source: Howard County Department of Finance, Bureau of Revenue
Statistical Section 185

Howard County, MarylandProperty Tax Levies and Collections
Last Ten Fiscal Years
Collected within theFiscal Year of the Levy Total Collection to Date
Taxes Leviedfor the Percentage Subsequent tax Percentage
Fiscal Year Fiscal Year Amount of Levy Collections Amount of Levy
2010 $ 601,068,331 599,327,223 99.7% 1,273,293 600,600,516 99.9%
2011 577,633,399 574,828,923 99.5% 2,627,076 577,455,999 100.0%
2012 541,972,687 540,659,569 99.8% 1,070,239 541,729,808 100.0%
2013 551,716,941 547,732,006 99.3% 3,889,326 551,621,332 100.0%
2014 555,254,638 550,755,917 99.2% 4,241,759 554,997,676 100.0%
2015 569,892,160 568,111,915 99.7% 1,427,707 569,539,622 99.9%
2016 594,757,776 593,510,182 99.8% 816,953 594,327,135 99.9%
2017 616,633,669 612,695,057 99.4% 3,333,271 616,028,328 99.9%
2018 639,933,124 635,257,806 99.3% 4,143,773 639,401,579 99.9%
2019 663,038,666 656,951,368 99.1% — 656,951,368 99.1%
Source: Howard County Department of Finance, Bureau of Revenue
Subsequent tax collections for fiscal years 2010-2018, updated per Howard County Department of Finance, Bureau of Revenue.
186 Statistical Section

Howard County, MarylandRatios of Outstanding Debt by Type
Last Ten Fiscal Years(in thousands of dollars, except per capita amount)
Governmental Activities Business-Type Activities
State Special State
GeneralWater
Quality Installment Tax Total Metropolitan FacilityWater
Quality Total Total Percentage Portion of Per
Fiscal Obligation Revolving Purchase Increment Capital Governmental District Revenue Revolving Business-Type Primary of Personal Capita Personal
Year Bonds (a) Loans Agreements Bonds Leases Activities Bonds (a) Bonds Loans Activities Government Income (b) Income (b)
2010 $ 771,706 5,795 60,998 — 4,889 843,388 113,712 6,870 43,220 163,802 1,007,190 5.52% 3,491
2011 832,751 4,050 71,122 — 4,945 912,868 157,344 6,330 41,958 205,632 1,118,500 5.75% 3,816
2012 901,586 2,850 94,623 — 4,738 1,003,797 189,930 5,400 38,364 233,694 1,237,491 5.86% 4,133
2013 943,831 2,840 92,695 — 5,191 1,044,557 213,780 5,022 34,110 252,912 1,297,469 6.01% 4,260
2014 989,035 2,830 95,629 17,000 5,062 1,109,556 220,642 4,583 30,930 256,155 1,365,711 n/a n/a
2015 1,035,280 2,475 96,626 17,000 17,894 1,169,275 238,963 4,133 27,679 270,775 1,440,050 n/a n/a
2016 1,050,289 — 98,661 17,000 24,874 1,190,824 251,963 3,240 24,508 279,711 1,470,535 n/a n/a
2017 1,128,705 — 100,123 16,980 24,802 1,270,610 270,211 3,199 21,267 294,677 1,565,287 n/a n/a
2018 1,205,838 — 97,716 65,165 35,012 1,403,731 301,619 2,714 17,956 322,289 1,726,020 n/a n/a
2019 1,246,358 — 93,483 65,100 31,603 1,436,544 351,004 2,217 14,573 367,794 1,804,338 n/a n/a
Note: Details regarding the County's outstanding debt can be found in the notes to basic financial statements.
(a) The amounts reported for debt include deferred refunding premium and discount. (b) See the Demographic and Economic Statistics schedule for personal income and population data.
Statistical Section 187

.
Howard County, MarylandRatios of General Bonded Debt Outstanding
Last Ten Fiscal Years(in thousands of dollars, except per capita amount)
Percentage ofEstimated General
General Actual Taxable ObligationFiscal Estimated Obligation Value of DebtYear Population Debt (a) Property (b) per Capita (c)
2010 287,907 $ 782,390 1.5% 2,7182011 291,200 841,746 1.6% 2,8912012 294,256 909,174 1.7% 3,0902013 297,732 951,863 2.0% 3,1972014 302,113 1,013,927 (d) 2.2% 3,3562015 305,462 1,072,650 2.2% 3,5122016 316,579 1,103,582 (d) 2.3% 3,4862017 317,233 1,170,487 2.2% 3,6902018 321,113 1,306,015 2.5% 4,0672019 326,286 1,343,061 2.5% 4,116
Note: Details regarding the County's outstanding debt can be found in the notes to basic financial statements.
(a) General obligation debt is a total of governmental activities debt less Agricultural Land Preservation Program installment purchase agreements. The amounts reported for debtinclude deferred refunding premium and discount.
(b) See the Assessed Value and Estimated Actual Value of Taxable Property schedule for property value data. (c) See the Demographic and Economic Statistics schedule for population data. (d) General obligation debt correct to equal total of governmental activities debt less Agricultural Land Preservation Program installment purchase agreements.
188 Statistical Section

Howard County, MarylandLegal Debt Margin
Last Ten Fiscal Years(thousands of dollars)
2010 2011 2012 2013 2014 2015 2016 2017 2018 2019
Assessed value (a)
Real property $ 48,664,260 46,518,265 43,621,862 42,639,732 42,990,610 44,112,719 45,939,083 47,976,024 49,821,784 51,679,563
Personal property 1,588,890 1,623,786 1,555,658 1,561,355 1,561,532 1,618,446 1,702,530 1,650,785 1,696,221 1,733,053
Total assessed value 50,253,150 48,142,051 45,177,520 44,201,087 44,552,142 45,731,165 47,641,613 49,626,809 51,518,005 53,412,616
Legal debt margin
Debt limit (4.8% of assessed value ofreal property and personal property) 2,412,151 2,310,818 2,168,521 2,121,652 2,138,503 2,195,096 2,286,797 2,382,087 2,472,864 2,563,806
Total debt limit $ 2,412,151 2,310,818 2,168,521 2,121,652 2,138,503 2,195,096 2,286,797 2,382,087 2,472,864 2,563,806
Debt applicable to limit
General county $ 728,194 788,800 (b) 832,318 (b) 871,701 (b) 911,842 (b) 936,199 (b) 984,119 1,037,717 1,099,892 1,203,729
State Water Quality Revolving Loan 5,795 4,050 2,850 2,840 2,830 2,475 — — — —
Total debt applicable to limit 733,989 792,850 835,168 874,541 914,672 938,674 984,119 1,037,717 1,099,892 1,203,729
Legal debt margin $ 1,678,162 1,517,968 1,333,353 1,247,111 1,223,831 1,256,422 1,302,678 1,344,370 1,372,972 1,360,077
Total debt applicable to the limit as apercentage of debt limit 30.43% 34.31% 38.51% 41.22% 42.77% 42.76% 43.03% 43.56% 44.48% 46.95%
Note: The amounts reported for debt include deferred refunding premium and discount.
(a) Revised to include capital leases (b) Amount previously reported should not have included deferred refunding premium and discount.
Statistical Section 189

Howard County, MarylandPledged Revenue Coverage
Special Recreation Facility (Golf Course)Last Ten Fiscal Years
Less: NetFiscal Gross Operating Available Debt ServiceYear Revenues Expenses Revenue Principal Interest Coverage
2010 $ 2,174,432 1,460,408 714,024 525,000 232,347 0.94
2011 2,080,177 1,444,807 635,370 540,000 219,822 0.84
2012 2,164,962 1,458,542 706,420 555,000 204,748 0.93
2013 2,091,506 1,482,180 609,326 378,000 135,504 1.19
2014 2,010,152 1,570,610 439,542 439,000 119,351 0.79
2015 1,893,015 1,459,050 433,965 450,000 108,362 0.78
2016 1,840,152 1,556,796 283,356 461,000 98,429 0.51
2017 1,260,820 2,728,803 (1,467,983) 473,000 85,688 -2.63
2018 1,089,224 945,289 143,935 485,000 73,710 0.26
2019 300,000 825,765 (525,765) 497,000 117,747 -0.86
Note: Operating expenses do not include depreciation or interest paid as part of debt service
190 Statistical Section

Howard County, MarylandPledged Revenue Coverage
Annapolis Junction Special Taxing DistrictLast Ten Fiscal Years
Less: Net
Fiscal Gross Operating Available Debt Service
Year Revenues Expenses Revenue Principal Interest Coverage
2014 $ 6,110 340 5,770 — — —
2015 63,097 733 62,365 — 939,435 (a) 0.07
2016 69,604 14,340 55,264 — 1,012,565 (a) 0.05
2017 593,746 11,744 582,002 20,000 1,012,605 (a) 0.56
2018 1,423,528 18,884 1,404,644 40,000 1,011,605 1.34
2019 1,066,225 18,541 1,047,684 65,000 1,009,686 0.97
Note: Information for FY2013 and earlier not available.Gross revenues include incremental tax, special tax ad interest earnings. Gross revenues do not include the capitalized interest account funded with bond proceeds.Operating expenses do not include depreciation or interest paid as part of debt service.(a) The interest was paid from the capitalized account held by the Trustee.
Statistical Section 191

Howard County, MarylandPledged Revenue Coverage
Crescent Special Taxing DistrictLast Ten Fiscal Years
Less: Net
Fiscal Gross Operating Available Debt Service
Year Revenues Expenses Revenue Principal Interest Coverage
2018 $ 2,297,099 84,510 2,212,589 — 677,382 3.27
2019 4,137,520 244,394 3,893,126 — 2,102,219 1.85
Note: Information for FY2017 and earlier not available.Gross revenues include incremental tax, special tax ad interest earnings. Gross revenues do not include the capitalized interest account funded with bond proceeds.Operating expenses do not include depreciation or interest paid as part of debt service.(a) The interest was paid from the capitalized account held by the Trustee.
192 Statistical Section

Howard County, MarylandDemographic and Economic Statistics
Last Ten Fiscal Years
Personal Per CapitaFiscal Estimated Income (b) Personal Public School UnemploymentYear Population (a) (thousands of dollars) Income (b) Enrollment (c) Rate (d)
2010 288,605 $18,452,859 $63,938 49,683 5.8%2011 293,858 19,987,372 68,017 49,991 5.7%2012 299,552 20,778,363 69,365 50,997 5.6%2013 304,210 20,499,507 67,386 51,190 5.5%2014 307,784 21,158,756 68,745 51,701 4.8%2015 312,400 22,203,989 71,076 52,511 4.5%2016 316,966 23,070,751 72,786 54,870 3.5%2017 321,113 24,063,585 74,938 55,638 3.5%2018 323,293 n/a n/a 58,019 3.6%2019 326,286 n/a n/a 58,284 2.8%
Sources:(a) Estimated Population, Personal Income, and Per Capita Personal Income revised and restated for 2010- 2017 per Bureau of Economic Analysis, U.S. Dept. ofCommerce. (b) Estimated Populations for 2018 -2019 are from Howard County Department of Planning and Zoning for April 2018 and April 2019
(c) Howard County Public School System - School enrollment is based on head count taken September 30th of each year. (d) State of Maryland, Dept. of Labor, Licensing and Regulation Unemployment rate is as of June 30th.
Statistical Section 193

Howard County, MarylandPrincipal Employers
Current Year and Nine Years Ago
2019 2010Percentage Percentage
of Total County of Total CountyEmployer Employees Rank Employment Employees Rank Employment
Howard County Public Schools 8,297 1 4.83% 7,850 1 5.29%Johns Hopkins Applied Physics Laboratory 5,000 2 4.11% 4,400 2 2.96%Howard County Government 3,256 3 1.76% 2,869 3 1.93%Verizon 1,700 6 1.00% 2,028 4 1.37%Howard County General Hospital 1,827 5 1.04% 1,720 6 1.16%Lorien Health Systems 2,000 4 0.70%Coastal Sunbelt Produce 1,050 8 0.62%Giant Food 1,050 8 0.62% 1,953 5 1.32%Columbia Association 1,600 7 1.08%SAIC 1,058 8 0.71%Wells Fargo Securities Administrative Services 842 9 0.47% 842 9 0.57%MICROS 815 10 0.55%Howard Community College 1,438 7 0.43%
Total 26,460 15.58% 25,135 16.94%
Source: Howard County Economic Development Authority
194 Statistical Section

Howard County, MarylandCounty Government Employees by Function
Last Ten Fiscal Years
2010 2011 2012 2013 2014 2015 2016 2017 2018 2019
Function/program
General government 287 288 292 299 312 335 341 349 354 348
Public safetyPolice 624 624 634 635 651 672 667 677 691 697Fire 417 419 419 461 463 472 465 468 491 530Corrections 144 145 144 144 148 152 153 153 154 154
Public works 579 575 572 577 599 612 611 614 617 619
Recreation andparks 246 252 256 261 268 281 283 295 304 300
Legislative andjudicial 202 202 202 202 204 206 208 212 216 219
Community services 358 341 343 299 307 324 325 330 341 367
Total 2,857 2,846 2,862 2,878 2,952 3,054 3,053 3,098 3,168 3,234
Source: Howard County Budget Office
Statistical Section 195

Howard County, MarylandCapital Asset Statistics by Function
Last Ten Fiscal Years
Function/program 2010 2011 2012 2013 2014 2015 2016 2017 2018 2019
General GovernmentBuildings 19 20 23 38 40 44 44 45 44 48Vehicles 65 54 57 45 43 51 51 64 60 105
Legislative and judicialVehicles 67 66 70 70 77 71 71 78 81 72
Public safetyPolice:
Stations 2 2 2 2 2 2 2 2 2 2Patrol units (vehicles) 265 265 286 292 291 292 284 274 275 274Other vehicles 237 212 250 264 226 214 214 271 282 295
Fire:Stations (a) 6 6 6 6 6 6 6 6 7 11Pumpers/tankers 28 28 29 25 28 29 29 28 29 31Ladder trucks 5 5 6 6 6 7 8 8 8 8Paramedic units 30 30 32 34 32 32 37 35 39 39Vehicles 128 133 119 118 119 120 120 211 193 193
Public WorksBuildings (b) 31 31 36 40 40 40 42 42 42 44Transit buses 67 58 57 52 57 42 42 68 62 65Vehicles 385 339 354 355 354 367 367 395 446 393Streets (miles) (c) 1,014 1,015 1,030 1,035 1,044 1,062 1,066 1,066 1,066 1,042Streetlights (d) 6,944 7,048 7,315 7,558 7,750 7,941 8,131 8,447 8,720 10,149Stormwater management facilities (e) 850 908 933 983 1,011 1,127 1,216 1,250 1,313 1,343
Recreation and parksBuildings 45 44 59 62 62 62 65 65 65 64Parks and open space acreage 8,846 8,850 9,097 9,116 9,173 9,227 9,255 9,493 9,579 9,647Playgrounds 42 40 39 41 43 44 44 44 44 44Vehicles 76 78 85 96 99 103 103 159 120 115
Water and sewerWastewater treatment plants 1 1 1 1 1 1 1 1 1 1Water mains (miles) 1,005 1,024 1,028 1,041 1,054 1,089 1,100 1,078 1,078 1,107Sanitary sewers (miles) 962 971 980 987 999 1,018 1,026 1,026 1,026 1,030
Golf course 1 1 1 1 1 1 1 1 1 1
Sources: Various Howard County Departments Note: Indicators are not available for State highways and education functions.
(a) Prior period 2010 through 2014 restated to exclude non County-owned fire stations (b) Prior periods 2009 through 2014 restated to exclude nonbuilding structures. (c) Prior period 2014 restated due to error in previous amount reported. (d) Prior periods 2009 and 2012 restated to exclude fixtures that Howard County rented/leased to BGE. (e) Prior period 2014 restated to exclude Board of Education facilities that are owned by the school system.
196 Statistical Section

Howard County, MarylandOperating Indicators by Function/Program
Last Ten Fiscal YearsDate of incorporation 1851Form of government Executive/CouncilDate present charteradopted 1968Area in square miles 215
Function/program 2010 2011 2012 2013 2014 2015 2016 2017 2018 2019
General GovernmentFinance:
Real property tax accounts billed 95,846 97,099 98,023 98,884 99,034 105,692 105,692 107,342 108,292 108,952Business personal property tax accounts billed 9,833 11,658 9,809 9,829 8,831 10,628 13,232 14,803 11,323 9,822
Public SafetyPolice:
Physical arrests 10,383 10,451 10,810 10,315 10,885 10,016 9,351 8,379 7,527 6,627Parking violations 6,919 5,445 4,415 9,052 9,439 7,180 7,180 7,545 7,104 8,624Traffic violations 80,735 81,588 84,306 85,682 88,987 99,963 92,314 82,917 75,402 69,180
Fire:Emergency responses 65,362 60,183 59,887 58,129 56,925 58,369 58,484 60,997 69,074 68,897Inspections 1,425 1,217 2,173 2,516 2,203 2,742 2,865 3,274 2,498 2,969
Corrections:Average daily prison population 287 308 320 340 348 304 284 285 319 318
Public WorksInspections, licenses and permits:
Construction permits issued 5,047 5,249 5,583 6,293 6,007 6,379 7,145 6,599 5,575 5,249Environmental services:
Refuse collected (tons per year) 102,492 103,749 102,249 101,912 103,120 115,941 103,719 109,313 109,397 118,247Recyclables collected (tons per year) 61,993 63,100 64,619 61,974 58,197 55,704 57,815 67,006 59,024 59,689
Recreation and parksPrograms operated 4,328 3,998 4,479 5,723 6,792 7,250 7,324 6,562 7,441 6,746Registrations processed 113,354 85,598 84,420 89,345 102,305 103,731 105,522 77,682 80,410 105,826
Legislative and judicialCircuit court cases filed 957 985 1,021 1,007 1,057 1,064 1,238 1,203 1,069 1,198District court cases filed 13,193 13,379 13,867 12,685 10,730 9,296 9,527 10,131 9,346 11,055
Community services50+ centers operated (a) 9 9 7 7 7 7 7 7 7 7Consumer affairs - cases closed 225 210 278 246 319 282 287 271 313 295Community service partnership grants 36 33 33 28 28 30 30 29 29 32Assisted living monitoring visits 172 418 183 205 543 461 535 622 774 876
Water and sewerWater main breaks 185 174 172 189 176 186 170 119 275 156Average daily water consumption (thousands of gallons) 23,910 24,930 22,610 22,370 23,580 21,870 22,100 23,600 23,470 24,016Number of water customers 70,646 70,062 72,229 73,121 74,153 74,991 74,206 75,266 75,933 76,586Average daily sewage treatment (thousands of gallons) 26,530 24,628 26,350 26,860 26,980 27,500 27,660 24,880 24,850 29,100Number of sewer customers 66,862 68,163 68,872 69,727 70,714 71,547 72,474 73,537 74,215 74,872
Golf courseRounds played 35,525 34,309 36,142 35,432 34,197 31,260 31,271 23,003 30,196 31,997
Sources: Various Howard County Departments Note: Indicators are not available for the State highways or education functions.
(a) Senior centers renamed to 50+ centers in 2015.
Statistical Section 197


Howard County Regional Location

Department of Finance, 3430 Court House Drive, Ellicott City, Maryland 21043(410) 313-2195 TDD 313-2323

[This Page Intentionally Left Blank]

Forms of Bond Counsel Opinions B-1
Forms of Bond Counsel Opinions
[Closing Date]
County Executive and County Council
of Howard County, Maryland
3430 Court House Drive
Ellicott City, Maryland 21043
County Executive and Council Members:
We have examined a record of proceedings relating to the issuance by Howard County, Maryland (the “County”)
of its Consolidated Public Improvement Project Bonds, 2020 Series A (Tax-Exempt) (the “Bonds”).
The Bonds are dated on their date of delivery and are issued in fully registered in form in the denomination of
$5,000 each or any integral multiple thereof. The Bonds are consolidated and issued pursuant to Section 10-203 of the
Local Government Article of the Annotated Code of Maryland (2013 Replacement Volume and 2019 Supplement)
(collectively, the “Enabling Law”), Section 19-101 of the Local Government Article of the Annotated Code of Maryland
(2013 Replacement Volume and 2019 Supplement) (the “Consolidating Act”), the County Charter (the “Charter”), certain
bond enabling ordinances of the County Council of the County (the “Enabling Ordinances”), Council Bill No. 44-2019
enacted during the 2019 Legislative Session (the “Bond Ordinance”), and Executive Order No. 2020-__, executed and
delivered on _________, 2020 (the “Executive Order”).
In rendering this opinion, we have relied without investigation on the County’s Tax and Section 148 Certificate
dated this date made on behalf of the County by officers thereof with respect to certain material facts within the knowledge
of the County relevant to the tax-exempt status of interest on the Bonds.
With respect to the executed and authenticated Bond that we have examined, and the Bonds similarly executed
and identical thereto in form except for numbers, interest rates, denominations, and maturities, and under existing statutes,
regulations, and decisions, we are of the opinion that:
(a) The County is a validly created and existing body politic and corporate and political subdivision
of the State of Maryland, possessing authority under the Enabling Law, the Charter, the Consolidating Act, the Enabling
Ordinances, the Bond Ordinance and the Executive Order to issue the Bonds.
(b) The Bonds are valid and legally binding obligations of the County to which its full faith and
credit and taxing power are pledged, and for the payment of which the County is empowered and directed to levy ad
valorem taxes unlimited as to rate and amount upon all real and tangible personal property and certain intangible personal
property subject to assessment for unlimited County taxation.
(c) To provide for the payment of the principal of and interest on the Bonds, the County has
covenanted to levy or cause to be levied ad valorem taxes upon all the assessable property within the corporate limits of
the County, in rate and amount sufficient for that purpose in each fiscal year in which provision must be made for the
payment of such principal and interest.
(d) The Bonds, their transfer, the interest payable on them, and any income derived from them,
including any profit realized in their sale or exchange, shall be exempt from taxation of any kind by the State of Maryland,
any of its political subdivision, or any other public entity. No opinion is expressed as to estate or inheritance taxes, or any
other taxes not levied or assessed directly on the Bonds or the interest thereon.
(e) Assuming compliance with certain covenants referred to herein, interest on the Bonds will be
excludable from gross income for federal income tax purposes. It is noted that under the provisions of the Internal Revenue
Code of 1986, as amended (the “Code”), there are certain restrictions that must be met subsequent to the delivery of the
Appendix B

B-2 Forms of Bond Counsel Opinions
Bonds, including restrictions that must be complied with throughout the term of the issue of bonds of which the Bonds are
a part in order that the interest thereon be excludable from gross income. These include the following: (i) a requirement
that certain earnings received from the investment of the proceeds of the issue of bonds of which the Bonds are a part be
rebated (or that certain payments in lieu of rebate be made) to the United States of America under certain circumstances;
(ii) other requirements applicable to the investment of the proceeds of the issue of bonds of which the Bonds are a part;
and (iii) requirements applicable to the use of the proceeds of the issue of bonds of which the Bonds are a part and the use
of the facilities financed or refinanced with such proceeds. Failure to comply with one or more of these requirements
could result in the inclusion of the interest payable on the Bonds in gross income for federal income tax purposes, effective
from the date of their issuance. The County has covenanted to regulate the investment of the proceeds of the issue of
bonds of which the Bonds are a part and to take such other actions as may be required to maintain the excludability of
interest on the Bonds from gross income for federal income tax purposes.
(f) Interest on the Bonds is not includable in the alternative minimum taxable income of individuals
as an enumerated item of tax preference or other specific adjustment. Interest income on the Bonds will be includable in
the applicable tax base for the purpose of determining the branch profits tax imposed by the Code on certain foreign
corporations engaged in a trade or business in the United States of America.
We express no opinion with respect to any other federal or state tax consequences under the present law or any
proposed legislation resulting from the receipt of interest on, or the acquisition or disposal of the Bonds.
The opinions expressed above are limited to the matters set forth above, and no other opinions should be inferred
beyond the matters expressly stated. We assume no obligation to supplement this opinion if any applicable laws or
interpretations thereof change after the date hereof or if we become aware of any facts or circumstances that might change
the opinions expressed herein after the date hereof.
Very truly yours,

Forms of Bond Counsel Opinions B-3
[Closing Date]
County Executive and County Council
of Howard County, Maryland
3430 Court House Drive
Ellicott City, Maryland 21043
County Executive and Council Members:
We have examined a record of proceedings relating to the issuance by Howard County, Maryland (the “County”)
of its Metropolitan District Project Bonds, 2020 Series B (Tax-Exempt) (the “Bonds”).
The Bonds are dated on their date of delivery and are issued in fully registered in form in the denomination of
$5,000 each or any integral multiple thereof. The Bonds are consolidated and issued pursuant to Section 10-203 of the
Local Government Article of the Annotated Code of Maryland (2013 Replacement Volume and 2019 Supplement)
(collectively, the “Enabling Law”), the County Charter (the “Charter”), Chapter 991 of the Acts of the General Assembly
of Maryland of 1943, as amended, Chapter 609 of the Acts of the General Assembly of Maryland of 1945, as amended,
Chapter 369 of the Acts of the General Assembly of Maryland of 1963, as amended and Chapter 356 of the Acts of the
General Assembly of Maryland of 1965, as amended (collectively, the “Acts”), certain bond enabling ordinances of the
County Council of the County (the “Enabling Ordinances”), Council Bill No. 44-2019 enacted during the 2019 Legislative
Session (the “Bond Ordinance”), and Executive Order No. 2020-__, executed and delivered on __________, 2020 (the
“Executive Order”).
In rendering this opinion, we have relied without investigation on the County’s Tax and Section 148 Certificate
dated this date made on behalf of the County by officers thereof with respect to certain material facts within the knowledge
of the County relevant to the tax-exempt status of interest on the Bonds.
With respect to the executed and authenticated Bond that we have examined, and the Bonds similarly executed
and identical thereto in form except for numbers, interest rates, denominations, and maturities, and under existing statutes,
regulations and decisions, we are of the opinion that:
(a) The County is a validly created and existing body politic and corporate and political subdivision
of the State of Maryland, possessing authority under the Enabling Law, the Charter, the Acts, the Enabling Ordinances,
the Bond Ordinance and the Executive Order to issue the Bonds.
(b) The Bonds are valid and legally binding obligations of the County to which its full faith and
credit and taxing power are pledged, payable primarily from ad valorem taxes, unlimited in rate and amount, which the
County is empowered to levy upon all taxable property within the Metropolitan District of the County, together with benefit
assessments and other available funds, but if not so paid, are payable as to both principal and interest, as general obligations,
ultimately from ad valorem taxes, unlimited in rate and amount, which the County is empowered to levy upon all real and
tangible personal property and certain intangible personal property subject to assessment for unlimited County taxation.
(c) To provide for the payment of the principal of and interest on the Bonds, the County has
covenanted to levy or cause to be levied ad valorem taxes upon all the assessable property within the corporate limits of
the County, in rate and amount sufficient for that purpose in each fiscal year in which provision must be made for the
payment of such principal and interest.
(d) The Bonds, their transfer, the interest payable on them, and any income derived from them,
including any profit realized in their sale or exchange shall be exempt from taxation of any kind by the State of Maryland,
any of its political subdivision, or any other public entity. No opinion is expressed as to estate or inheritance taxes, or any
other taxes not levied or assessed directly on the Bonds or the interest thereon.
(e) Assuming compliance with certain covenants referred to herein, interest on the Bonds will be
excludable from gross income for federal income tax purposes. It is noted that under the provisions of the Internal Revenue
Code of 1986, as amended (the “Code”), there are certain restrictions that must be met subsequent to the delivery of the
Bonds, including restrictions that must be complied with throughout the term of the issue of bonds of which the Bonds are
a part, in order that the interest thereon be excludable from gross income. These include the following: (i) a requirement
that certain earnings received from the investment of the proceeds of the issue of bonds of which the Bonds are a part be
rebated (or that certain payments in lieu of rebate be made) to the United States of America under certain circumstances;

B-4 Forms of Bond Counsel Opinions
(ii) other requirements applicable to the investment of the proceeds of the issue of bonds of which the Bonds are a part;
and (iii) requirements applicable to the use of the proceeds of the issue of bonds of which the Bonds are a part and the use
of the facilities financed or refinanced with such proceeds. Failure to comply with one or more of these requirements
could result in the inclusion of the interest payable on the Bonds in gross income for federal income tax purposes, effective
from the date of their issuance. The County has covenanted to regulate the investment of the proceeds of the issue of
bonds of which the Bonds are a part and to take such other actions as may be required to maintain the excludability of
interest on the Bonds from gross income for federal income tax purposes.
(f) Interest on the Bonds is not includable in the alternative minimum taxable income of individuals
as an enumerated item of tax preference or other specific adjustment. Interest income on the Bonds will be includable in
the applicable tax base for the purpose of determining the branch profits tax imposed by the Code on certain foreign
corporations engaged in a trade or business in the United States of America.
We express no opinion with respect to any other federal or state tax consequences under the present law or any
proposed legislation resulting from the receipt of interest on, or the acquisition or disposal of the Bonds.
The opinions expressed above are limited to the matters set forth above, and no other opinions should be inferred
beyond the matters expressly stated. We assume no obligation to supplement this opinion if any applicable laws or
interpretations thereof change after the date hereof or if we become aware of any facts or circumstances that might change
the opinions expressed herein after the date hereof.
Very truly yours,

Forms of Bond Counsel Opinions B-5
[Closing Date]
County Executive and County Council
of Howard County, Maryland
3430 Court House Drive
Ellicott City, Maryland 21043
County Executive and Council Members:
We have examined a record of proceedings relating to the issuance by Howard County, Maryland (the “County”)
of its Consolidated Public Improvement Project and Refunding Bonds, 2020 Series C (Taxable) (the “Bonds”).
The Bonds are dated on their date of delivery and are issued in fully registered in form in the denomination of
$5,000 each or any integral multiple thereof. The Bonds are consolidated and issued pursuant to Section 10-203 of the
Local Government Article of the Annotated Code of Maryland (2013 Replacement Volume and 2019 Supplement)
(collectively, the “Enabling Law”), Section 19-207 of the Local Government Article of the Annotated Code of Maryland
(2013 Replacement Volume and 2019 Supplement) (the “Refunding Act”), Section 19-101 of the Local Government
Article of the Annotated Code of Maryland (2013 Replacement Volume, 2019 Supplement) (“Section 19-101”), the County
Charter (the “Charter”), certain bond enabling ordinances of the County Council of the County (the “Enabling
Ordinances”), Council Bill No. 44-2019 enacted during the 2019 Legislative Session (the “Bond Ordinance”), Council
Bill No. 45-2019 enacted during the 2019 Legislative Session (the “Refunding Ordinance”) and Executive Order No. 2020-
__, executed and delivered on _________, 2020 (the “Executive Order”).
With respect to the executed and authenticated Bond that we have examined, and the Bonds similarly executed
and identical thereto in form except for numbers, interest rates, denominations, and maturities, and under existing statutes,
regulations, and decisions, we are of the opinion that:
(a) The County is a validly created and existing body politic and corporate and political subdivision
of the State of Maryland, possessing authority under the Enabling Law, the Refunding Act, Section 19-101, the Charter,
the Enabling Ordinances, the Bond Ordinance, the Refunding Ordinance and the Executive Order to issue the Bonds.
(b) The Bonds are valid and legally binding obligations of the County to which its full faith and
credit and taxing power are pledged, and for the payment of which the County is empowered and directed to levy ad
valorem taxes unlimited as to rate and amount upon all real and tangible personal property and certain intangible personal
property subject to assessment for unlimited County taxation.
(c) To provide for the payment of the principal of and interest on the Bonds, the County has
covenanted to levy or cause to be levied ad valorem taxes upon all the assessable property within the corporate limits of
the County, in rate and amount sufficient for that purpose in each fiscal year in which provision must be made for the
payment of such principal and interest.
(d) Interest on the Bonds, and profit realized from their sale or exchange, will be exempt from State
of Maryland income taxation. No opinion is expressed as to estate or inheritance taxes, or any other taxes not levied or
assessed directly on the Bonds or the interest thereon.
(e) Interest on the Bonds will be includable in gross income for federal income tax purposes.
We express no opinion with respect to any other federal or state tax consequences under the present law or any
proposed legislation resulting from the receipt of interest on, or the acquisition or disposal of the Bonds.
The opinions expressed above are limited to the matters set forth above, and no other opinions should be inferred
beyond the matters expressly stated. We assume no obligation to supplement this opinion if any applicable laws or
interpretations thereof change after the date hereof or if we become aware of any facts or circumstances that might change
the opinions expressed herein after the date hereof.
Very truly yours,

B-6 Forms of Bond Counsel Opinions
[Closing Date]
County Executive and County Council
of Howard County, Maryland
3430 Court House Drive
Ellicott City, Maryland 21043
County Executive and Council Members:
We have examined a record of proceedings relating to the issuance by Howard County, Maryland (the “County”)
of its Metropolitan District Refunding Bonds, 2020 Series D (Taxable) (the “Bonds”).
The Bonds are dated on their date of delivery and are issued in fully registered in form in the denomination of
$5,000 each or any integral multiple thereof. The Bonds are consolidated and issued pursuant to Section 10-203 of the
Local Government Article of the Annotated Code of Maryland (2013 Replacement Volume and 2019 Supplement)
(collectively, the “Enabling Law”), Section 19-207 of the Local Government Article of the Annotated Code of Maryland
(2013 Replacement Volume and 2019 Supplement) (the “Refunding Act”), the County Charter (the “Charter”), Chapter
991 of the Acts of the General Assembly of Maryland of 1943, as amended, Chapter 609 of the Acts of the General
Assembly of Maryland of 1945, as amended, Chapter 369 of the Acts of the General Assembly of Maryland of 1963, as
amended and Chapter 356 of the Acts of the General Assembly of Maryland of 1965, as amended (collectively, the “Acts”),
certain bond enabling ordinances of the County Council of the County (the “Enabling Ordinances”), Council Bill No. 45-
2019 enacted during the 2019 Legislative Session (the “Refunding Ordinance”) and Executive Order No. 2020-__,
executed and delivered on _________, 2020 (the “Executive Order”).
With respect to the executed and authenticated Bond that we have examined, and the Bonds similarly executed
and identical thereto in form except for numbers, interest rates, denominations, and maturities, and under existing statutes,
regulations, and decisions, we are of the opinion that:
(a) The County is a validly created and existing body politic and corporate and political subdivision
of the State of Maryland, possessing authority under the Enabling Law, the Refunding Act, the Charter, the Acts, the
Enabling Ordinances, the Refunding Ordinance and the Executive Order to issue the Bonds.
(b) The Bonds are valid and legally binding obligations of the County to which its full faith and
credit and taxing power are pledged, payable primarily from ad valorem taxes, unlimited in rate and amount, which the
County is empowered to levy upon all taxable property within the Metropolitan District of the County, together with benefit
assessments and other available funds, but if not so paid, are payable as to both principal and interest, as general obligations,
ultimately from ad valorem taxes, unlimited in rate and amount, which the County is empowered to levy upon all real and
tangible personal property and certain intangible personal property subject to assessment for unlimited County taxation.
(c) To provide for the payment of the principal of and interest on the Bonds, the County has
covenanted to levy or cause to be levied ad valorem taxes upon all the assessable property within the corporate limits of
the County, in rate and amount sufficient for that purpose in each fiscal year in which provision must be made for the
payment of such principal and interest.
(d) Interest on the Bonds, and profit realized from their sale or exchange, will be exempt from State
of Maryland income taxation. No opinion is expressed as to estate or inheritance taxes, or any other taxes not levied or
assessed directly on the Bonds or the interest thereon.
(e) Interest on the Bonds will be includable in gross income for federal income tax purposes.
We express no opinion with respect to any other federal or state tax consequences under the present law or any
proposed legislation resulting from the receipt of interest on, or the acquisition or disposal of the Bonds.

Forms of Bond Counsel Opinions B-7
The opinions expressed above are limited to the matters set forth above, and no other opinions should be inferred
beyond the matters expressly stated. We assume no obligation to supplement this opinion if any applicable laws or
interpretations thereof change after the date hereof or if we become aware of any facts or circumstances that might change
the opinions expressed herein after the date hereof.
Very truly yours,

[This Page Intentionally Left Blank]

Continuing Disclosure Agreement C-1
Continuing Disclosure Agreement
This CONTINUING DISCLOSURE AGREEMENT (the “Disclosure Agreement”) is executed and delivered by
Howard County, Maryland (the “County”) in connection with the issuance of its Consolidated Public Improvement Project
Bonds, 2020 Series A (Tax-Exempt), its Metropolitan District Project Bonds, 2020 Series B (Tax-Exempt), its
Consolidated Public Improvement Project and Refunding Bonds, 2020 Series C (Taxable) and its Metropolitan District
Refunding Bonds, 2020 Series D (Taxable) (collectively, the “Bonds”). The County, intending to be legally bound hereby
and in consideration of good and valuable consideration, the receipt and sufficiency of which is hereby acknowledged,
does hereby covenant and agree as follows:
Section 1. Purpose of the Disclosure Agreement.
This Disclosure Agreement is being executed and delivered by the County for the benefit of the beneficial owners
of the Bonds and in order to assist the Participating Underwriters in complying with Securities and Exchange Commission
Rule 15c2-12(b)(5).
Section 2. Definitions.
In addition to the definitions set forth above, which apply to any capitalized term used in this Disclosure
Agreement unless otherwise defined in this Section, the following capitalized terms shall have the following meanings:
“Dissemination Agent” shall mean the County, acting as Dissemination Agent hereunder, or any successor
Dissemination Agent designated in writing by the County.
“EMMA” shall mean Electronic Municipal Market Access System maintained by the MSRB.
“Financial Obligation” shall mean a (i) debt obligation; (ii) derivative instrument entered into in connection
with, or pledged as security or a source of payment for, an existing or planned debt obligation; or (iii) guarantee of
(i) or (ii). The term Financial Obligation shall not include municipal securities as to which a final official statement
has been provided to the MSRB consistent with the Rule.
“Listed Events” shall mean any of the events listed in Section 4(a) of this Disclosure Agreement.
“MSRB” shall mean the Municipal Securities Rulemaking Board, established pursuant to Section 15B(b)(1) of the
Securities Exchange Act of 1934, as amended.
“Participating Underwriter” shall mean any of the original underwriters of the Bonds required to comply with
the Rule in connection with offering of the Bonds.
“Rule” shall mean Rule 15c2-12(b)(5) adopted by the Securities and Exchange Commission under the Securities
Exchange Act of 1934, as the same may be amended from time to time.
“State” shall mean the State of Maryland.
Section 3. Provision of Annual Financial Information, Operating Data and Audited Information.
(a) The County shall provide to the MSRB annual financial information and operating data set forth in the
“Financial Information” Section of the Official Statement under the heading “Total Property Tax Levies and Collections,”
and information regarding assessed accrual value of and county direct tax rate on real and personal property set forth in
the “Financial Information” section of the Official Statement under the heading “Assessed Values, Tax Rates and Tax
Levies”, each to be updated as of the end of the preceding fiscal year, utilizing the same accounting principles as were
used in preparing such information for the Official Statement subject to changes in Generally Accepted Accounting
Principles, and shall be made available within 275 days after the end of the County’s fiscal year.
Appendix C

C-2 Continuing Disclosure Agreement
(b) The County shall provide to the MSRB annual audited financial statements for the County, such
information to be made available within 275 days after the end of the County’s fiscal year, unless the audited financial
statements are not available on or before such date, in which event said financial statements will be provided promptly
when and if available. In the event that audited financial statements are not available within 275 days after the end of the
County’s fiscal year, the County will provide unaudited financial statements within said time period.
(c) The presentation of the financial information referred to in paragraph (a) and in paragraph (b) shall be
made in accordance with the same accounting principles as utilized in connection with the presentation of applicable
comparable financial information included in the final official statement for the Bonds, provided that the County may
modify the accounting principles utilized in the presentation of financial information by amending this Disclosure
Agreement pursuant to the provisions of Section 7 hereof. Changes in Generally Accepted Accounting Principles, where
applicable to financial information to be provided by the County, shall not require the County to amend this Disclosure
Agreement.
(d) If the County is unable to provide the annual financial information and operating data within the
applicable time periods specified in (a) and (b) above, the County shall send in a timely manner a notice of such failure to
the MSRB.
Section 4. Reporting of Significant Events.
(a) This Section 4 shall govern the giving of notices of the occurrence of any of the following events with
respect to the Bonds:
(1) principal and interest payment delinquencies;
(2) non-payment related defaults, if material;
(3) unscheduled draws on debt service reserves reflecting financial difficulties;
(4) unscheduled draws on credit enhancements reflecting financial difficulties;
(5) substitution of credit or liquidity providers, or their failure to perform;
(6) adverse tax opinions, the issuance by the Internal Revenue Service of proposed or final
determinations of taxability, Notices of Proposed Issue (IRS Form 5701-TEB) or other material
notices or determinations with respect to the tax status of the Bonds or other material events
affecting the tax status of the Bonds;
(7) modifications to rights of Bondholders, if material;
(8) bond calls, if material, and tender offers;
(9) defeasances;
(10) release, substitution or sale of property securing repayment of the Bonds, if material;
(11) rating changes;
(12) bankruptcy, insolvency, receivership or similar event of the County; 1
(13) appointment of a successor or additional trustee or the change of name of a trustee, if material;
(14) the consummation of a merger, consolidation, or acquisition involving the County or the sale
of all or substantially all of the assets of the County, other than in the ordinary course of
1 For the purposes of the event identified in clause (12) above, the event is considered to occur when any of the following occur: the appointment of a receiver, fiscal agent
or similar officer for the County in a proceeding under the U.S. Bankruptcy Code or in any other proceeding under state or federal law in which a court or governmental
authority has assumed jurisdiction over substantially all of the assets or business of the County or if such h jurisdiction has been assumed by leaving the existing governing
body and officials or officers in possession but subject to the supervision and orders of a court or governmental authority, or the entry of an order confirming a plan of
reorganization, arrangement or liquidation by a court or governmental authority having supervision or jurisdiction over substantially all of the assets or business of the
County

Continuing Disclosure Agreement C-3
business, the entry into a definitive agreement to undertake such an action or the termination of
a definitive agreement relating to any such actions, other than pursuant to its terms, if material;
(15) incurrence of a Financial Obligation of the County, if material, or agreement to covenants,
events of default, remedies, priority rights, or other similar terms of a Financial Obligation of
the County, any of which affect bondholders, if material; and
(16) default, event of acceleration, termination event, modification of terms, or other similar events
under the terms of a Financial Obligation of the County, any of which reflects financial
difficulties.
(b) In a timely manner, not in excess of ten business days after the occurrence of an event listed in Section
4(a) above, the County shall file a notice of such occurrence with the MSRB.
Section 5. Filing with EMMA.
Unless otherwise required by the MSRB, all filings with the MSRB shall be made with EMMA and shall be
accompanied by identifying information as prescribed by the MSRB.
Section 6. Termination of Reporting Obligation.
The County obligations under this Disclosure Agreement shall terminate upon the payment in full of all of the
Bonds either at their maturity or by early redemption. In addition, the County may terminate its obligations under this
Disclosure Agreement if and when the County no longer remains an obligated person with respect to the Bonds within the
meaning of Securities and Exchange Commission Rule 15c2-12.
Section 7. Amendment.
The County may provide further or additional assurances that will become part of the County’s obligations under
this Disclosure Agreement. In addition, this Disclosure Agreement may be amended by the County in its discretion
provided that (i) the amendment may only be made in connection with a change in circumstances that arises from a change
in legal requirements, change in law, or change in the identity, nature, or status of the County as the obligated person with
respect to the Bonds, or type of business conducted; (ii) this Disclosure Agreement, as amended, would have complied
with the requirements of the Rule at the time of the issuance of the Bonds, after taking into account any amendments or
interpretations of the Rule, as well as any change in circumstances; and (iii) the amendment does not materially impair the
interests of holders of the Bonds, as determined either by counsel selected by the County that is expert in federal securities
law matters, or by an approving vote of the holders of 25% of the outstanding aggregate principal amount of Bonds. The
reasons for the County agreeing to provide any further or additional assurances or for any amendment and the impact of
the change in the type of operating data or financial information being provided will be explained in information provided
with the annual financial information containing the additional or amended operating data or financial information.
Section 8. Additional Information.
Nothing in this Disclosure Agreement shall be deemed to prevent the County from disseminating any other
information, using the means of dissemination set forth in this Disclosure Agreement or any other means of
communication, or including any other information in any disclosure made pursuant to Section 4(a) or (b) hereof or notice
of occurrence of a Listed Event in addition to that which is required by this Disclosure Agreement. If the County chooses
to include any information in any disclosure made pursuant to Section 4(a) or (b) hereof or notice of occurrence of a Listed
Event in addition to that which is specifically required by this Disclosure Agreement, the County shall have no obligation
under this Disclosure Agreement to update such information or include it in any future disclosure made pursuant to Section
4(a) or (b) hereof or notice of occurrence of a Listed Event.
Section 9. Dissemination Agent.
The County may, from time to time, appoint or engage a Dissemination Agent to assist it in carrying out its
obligations under this Disclosure Agreement, and may discharge any such Dissemination Agent, with or without
appointing a successor Dissemination Agent. The Dissemination Agent shall not be responsible in any manner for the
content of any notice or report prepared by the County pursuant to this Disclosure Agreement. If at any time there is not
any other designated Dissemination Agent, the County shall be the Dissemination Agent.

C-4 Continuing Disclosure Agreement
Section 10. Law of Maryland.
This Disclosure Agreement, and any claim made with respect to the performance by the County of its obligations
hereunder, shall be governed by, subject to, and construed according to the laws of the State.
Section 11. Limitation of Forum.
Any suit or other proceeding seeking redress with regard to any claimed failure by the County to perform its
obligations under this Disclosure Agreement must be filed in the Circuit Court of Howard County, Maryland.
Section 12. Limitation on Remedies.
The County shall be given written notice at the address set forth below of any claimed failure by the County to
perform its obligations under the Disclosure Agreement, and the County shall be given 15 days to remedy any such claimed
failure. Any suit or other proceeding seeking further redress with regard to any such claimed failure by the County shall
be limited to specific performance as the adequate and exclusive remedy available in connection with such action. Written
notice to the County shall be given to the Director of Finance at 3540 Court House Drive, Ellicott City, Maryland 21043
or at such alternate address as shall be specified by the County with disclosures made pursuant to Section 4(a) or 4(b)
hereof or a notice of occurrence of a Listed Event.
Section 13. Relationship to Bonds.
This Disclosure Agreement constitutes an undertaking by the County that is independent of the County’s
obligations with respect to the Bonds; any breach or default by the County under this Disclosure Agreement shall not
constitute or give rise to a breach or default under the Bonds.
Section 14. Beneficiaries.
This Disclosure Agreement shall inure solely to the benefit of the beneficial owners from time to time of the
Bonds, and shall create no rights in any other person or entity.
IN WITNESS WHEREOF this Continuing Disclosure Agreement is being executed on behalf of Howard County,
Maryland by the Director of Finance, as of this _____ day of _________, 2020.
HOWARD COUNTY, MARYLAND
By:_________________________________________
Janet R. Irvin
Director of Finance

Bond Amortization Tables D-1
Bond Amortization Tables
$117,230,000 Consolidated Public Improvement Project Bonds, 2020 Series A (Tax-Exempt)
Date Principal Maturity Interest Rate Semiannual Interest Semiannual Debt Service Annual Debt Service
8/15/2020 4,705,000$ 5.000% 1,468,516$ 6,173,516$
2/15/2021 2,579,650 2,579,650 8,753,166$
8/15/2021 3,685,000 5.000% 2,579,650 6,264,650
2/15/2022 2,487,525 2,487,525 8,752,175
8/15/2022 3,875,000 5.000% 2,487,525 6,362,525
2/15/2023 2,390,650 2,390,650 8,753,175
8/15/2023 4,075,000 5.000% 2,390,650 6,465,650
2/15/2024 2,288,775 2,288,775 8,754,425
8/15/2024 4,285,000 5.000% 2,288,775 6,573,775
2/15/2025 2,181,650 2,181,650 8,755,425
8/15/2025 4,505,000 5.000% 2,181,650 6,686,650
2/15/2026 2,069,025 2,069,025 8,755,675
8/15/2026 4,735,000 5.000% 2,069,025 6,804,025
2/15/2027 1,950,650 1,950,650 8,754,675
8/15/2027 4,975,000 5.000% 1,950,650 6,925,650
2/15/2028 1,826,275 1,826,275 8,751,925
8/15/2028 5,230,000 5.000% 1,826,275 7,056,275
2/15/2029 1,695,525 1,695,525 8,751,800
8/15/2029 5,500,000 5.000% 1,695,525 7,195,525
2/15/2030 1,558,025 1,558,025 8,753,550
8/15/2030 5,780,000 5.000% 1,558,025 7,338,025
2/15/2031 1,413,525 1,413,525 8,751,550
8/15/2031 6,080,000 5.000% 1,413,525 7,493,525
2/15/2032 1,261,525 1,261,525 8,755,050
8/15/2032 6,390,000 5.000% 1,261,525 7,651,525
2/15/2033 1,101,775 1,101,775 8,753,300
8/15/2033 6,715,000 5.000% 1,101,775 7,816,775
2/15/2034 933,900 933,900 8,750,675
8/15/2034 7,025,000 4.000% 933,900 7,958,900
2/15/2035 793,400 793,400 8,752,300
8/15/2035 7,315,000 4.000% 793,400 8,108,400
2/15/2036 647,100 647,100 8,755,500
8/15/2036 7,610,000 4.000% 647,100 8,257,100
2/15/2037 494,900 494,900 8,752,000
8/15/2037 7,920,000 4.000% 494,900 8,414,900
2/15/2038 336,500 336,500 8,751,400
8/15/2038 8,245,000 4.000% 336,500 8,581,500
2/15/2039 171,600 171,600 8,753,100
8/15/2039 8,580,000 4.000% 171,600 8,751,600
2/15/2040 - 8,751,600
TOTAL $117,230,000 $57,832,466 $175,062,466 $175,062,466
Appendix D

D-2 Bond Amortization Tables
$51,130,000 Metropolitan District Project Bonds, 2020 Series B (Tax-Exempt)
Date Principal Maturity Interest Rate Semiannual Interest Semiannual Debt Service Annual Debt Service
8/15/2020 1,260,000$ 5.000% 530,316$ 1,790,316$
2/15/2021 942,550 942,550 2,732,866$
8/15/2021 870,000 5.000% 942,550 1,812,550
2/15/2022 920,800 920,800 2,733,350
8/15/2022 915,000 5.000% 920,800 1,835,800
2/15/2023 897,925 897,925 2,733,725
8/15/2023 960,000 5.000% 897,925 1,857,925
2/15/2024 873,925 873,925 2,731,850
8/15/2024 1,010,000 5.000% 873,925 1,883,925
2/15/2025 848,675 848,675 2,732,600
8/15/2025 1,060,000 5.000% 848,675 1,908,675
2/15/2026 822,175 822,175 2,730,850
8/15/2026 1,115,000 5.000% 822,175 1,937,175
2/15/2027 794,300 794,300 2,731,475
8/15/2027 1,175,000 5.000% 794,300 1,969,300
2/15/2028 764,925 764,925 2,734,225
8/15/2028 1,235,000 5.000% 764,925 1,999,925
2/15/2029 734,050 734,050 2,733,975
8/15/2029 1,300,000 5.000% 734,050 2,034,050
2/15/2030 701,550 701,550 2,735,600
8/15/2030 1,365,000 5.000% 701,550 2,066,550
2/15/2031 667,425 667,425 2,733,975
8/15/2031 1,435,000 5.000% 667,425 2,102,425
2/15/2032 631,550 631,550 2,733,975
8/15/2032 1,510,000 5.000% 631,550 2,141,550
2/15/2033 593,800 593,800 2,735,350
8/15/2033 1,585,000 5.000% 593,800 2,178,800
2/15/2034 554,175 554,175 2,732,975
8/15/2034 1,665,000 5.000% 554,175 2,219,175
2/15/2035 512,550 512,550 2,731,725
8/15/2035 1,735,000 3.000% 512,550 2,247,550
2/15/2036 486,525 486,525 2,734,075
8/15/2036 1,785,000 3.000% 486,525 2,271,525
2/15/2037 459,750 459,750 2,731,275
8/15/2037 1,840,000 3.000% 459,750 2,299,750
2/15/2038 432,150 432,150 2,731,900
8/15/2038 1,895,000 3.000% 432,150 2,327,150
2/15/2039 403,725 403,725 2,730,875
8/15/2039 1,955,000 3.000% 403,725 2,358,725
2/15/2040 374,400 374,400 2,733,125
8/15/2040 2,015,000 3.000% 374,400 2,389,400
2/15/2041 344,175 344,175 2,733,575
8/15/2041 2,080,000 * 344,175 2,424,175
2/15/2042 308,825 308,825 2,733,000
8/15/2042 2,150,000 * 308,825 2,458,825
2/15/2043 272,275 272,275 2,731,100
8/15/2043 2,225,000 * 272,275 2,497,275
2/15/2044 234,400 234,400 2,731,675
8/15/2044 2,305,000 * 234,400 2,539,400
2/15/2045 195,150 195,150 2,734,550
8/15/2045 2,385,000 * 195,150 2,580,150
2/15/2046 154,500 154,500 2,734,650
8/15/2046 2,460,000 3.000% 154,500 2,614,500
2/15/2047 117,600 117,600 2,732,100
8/15/2047 2,535,000 3.000% 117,600 2,652,600
2/15/2048 79,575 79,575 2,732,175
8/15/2048 2,615,000 3.000% 79,575 2,694,575
2/15/2049 40,350 40,350 2,734,925
8/15/2049 2,690,000 3.000% 40,350 2,730,350
2/15/2050 - 2,730,350
TOTAL $51,130,000 $30,857,866 $81,987,866 $81,987,866
*Interest rates for the Metropolitan District Bonds Mandatory Sinking Fund Redemptions maturing on August 15, 2045 and 2049 are
4.00% and 3.00% respectively.

Bond Amortization Tables D-3
$63,050,000 Consolidated Public Improvement Project and Refunding Bonds, 2020 Series C (Taxable)
Date Principal Maturity Interest Rate Semiannual Interest Semiannual Debt Service Annual Debt Service
8/15/2020 220,000$ 1.224% 275,882$ 495,882$
2/15/2021 505,375 505,375 1,001,257$
8/15/2021 200,000 1.224% 505,375 705,375
2/15/2022 504,151 504,151 1,209,527
8/15/2022 10,615,000 1.224% 504,151 11,119,151
2/15/2023 439,187 439,187 11,558,339
8/15/2023 13,070,000 1.337% 439,187 13,509,187
2/15/2024 351,815 351,815 13,861,002
8/15/2024 10,540,000 1.454% 351,815 10,891,815
2/15/2025 275,189 275,189 11,167,003
8/15/2025 6,810,000 1.554% 275,189 7,085,189
2/15/2026 222,275 222,275 7,307,464
8/15/2026 3,090,000 1.763% 222,275 3,312,275
2/15/2027 195,037 195,037 3,507,312
8/15/2027 3,150,000 1.913% 195,037 3,345,037
2/15/2028 164,907 164,907 3,509,944
8/15/2028 3,215,000 1.960% 164,907 3,379,907
2/15/2029 133,400 133,400 3,513,307
8/15/2029 3,275,000 1.990% 133,400 3,408,400
2/15/2030 100,814 100,814 3,509,214
8/15/2030 3,345,000 2.060% 100,814 3,445,814
2/15/2031 66,360 66,360 3,512,174
8/15/2031 3,415,000 2.160% 66,360 3,481,360
2/15/2032 29,478 29,478 3,510,838
8/15/2032 240,000 2.310% 29,478 269,478
2/15/2033 26,706 26,706 296,184
8/15/2033 245,000 2.410% 26,706 271,706
2/15/2034 23,754 23,754 295,460
8/15/2034 250,000 2.510% 23,754 273,754
2/15/2035 20,616 20,616 294,370
8/15/2035 260,000 2.590% 20,616 280,616
2/15/2036 17,249 17,249 297,866
8/15/2036 265,000 3.108% 17,249 282,249
2/15/2037 13,131 13,131 295,381
8/15/2037 275,000 3.108% 13,131 288,131
2/15/2038 8,858 8,858 296,989
8/15/2038 280,000 3.108% 8,858 288,858
2/15/2039 4,507 4,507 293,364
8/15/2039 290,000 3.108% 4,507 294,507
2/15/2040 - 294,507
TOTAL $63,050,000 $6,481,500 $69,531,500 $69,531,500

D-4 Bond Amortization Tables
$24,060,000 Metropolitan District Refunding Bonds, 2020 Series D (Taxable)
Date Principal Maturity Interest Rate Semiannual Interest Semiannual Debt Service Annual Debt Service
8/15/2020 275,000$ 1.224% 145,679$ 420,679$
2/15/2021 265,891 265,891 686,571$
8/15/2021 580,000 1.224% 265,891 845,891
2/15/2022 262,342 262,342 1,108,233
8/15/2022 735,000 1.224% 262,342 997,342
2/15/2023 257,844 257,844 1,255,186
8/15/2023 1,075,000 1.337% 257,844 1,332,844
2/15/2024 250,657 250,657 1,583,501
8/15/2024 950,000 1.454% 250,657 1,200,657
2/15/2025 243,751 243,751 1,444,408
8/15/2025 970,000 1.554% 243,751 1,213,751
2/15/2026 236,214 236,214 1,449,965
8/15/2026 960,000 1.763% 236,214 1,196,214
2/15/2027 227,752 227,752 1,423,965
8/15/2027 740,000 1.913% 227,752 967,752
2/15/2028 220,673 220,673 1,188,425
8/15/2028 670,000 1.960% 220,673 890,673
2/15/2029 214,107 214,107 1,104,781
8/15/2029 1,375,000 1.990% 214,107 1,589,107
2/15/2030 200,426 200,426 1,789,534
8/15/2030 1,495,000 2.060% 200,426 1,695,426
2/15/2031 185,028 185,028 1,880,454
8/15/2031 1,530,000 2.160% 185,028 1,715,028
2/15/2032 168,504 168,504 1,883,531
8/15/2032 1,390,000 2.310% 168,504 1,558,504
2/15/2033 152,449 152,449 1,710,953
8/15/2033 2,705,000 2.410% 152,449 2,857,449
2/15/2034 119,854 119,854 2,977,303
8/15/2034 2,615,000 2.510% 119,854 2,734,854
2/15/2035 87,036 87,036 2,821,890
8/15/2035 2,685,000 2.590% 87,036 2,772,036
2/15/2036 52,265 52,265 2,824,301
8/15/2036 510,000 3.158% 52,265 562,265
2/15/2037 44,212 44,212 606,477
8/15/2037 525,000 3.158% 44,212 569,212
2/15/2038 35,922 35,922 605,134
8/15/2038 540,000 3.158% 35,922 575,922
2/15/2039 27,396 27,396 603,318
8/15/2039 560,000 3.158% 27,396 587,396
2/15/2040 18,553 18,553 605,949
8/15/2040 580,000 3.158% 18,553 598,553
2/15/2041 9,395 9,395 607,948
8/15/2041 595,000 3.158% 9,395 604,395
2/15/2042 - 604,395
TOTAL $24,060,000 $6,706,221 $30,766,221 $30,766,221


HO
WA
RD
CO
UN
TY
, MA
RY
LA
ND
• Co
ns
ol
ida
te
d Pu
bl
iC im
Pr
ov
em
en
t Pr
oje
Ct b
on
ds, 2020 s
er
ies a
(ta
x-ex
em
Pt) a
nd m
et
ro
Po
lit
an d
ist
riC
t Pr
oje
Ct b
on
ds, 2020 s
er
ies b
(ta
x-ex
em
Pt)
Co
ns
ol
ida
te
d Pu
bl
iC im
Pr
ov
em
en
t Pr
oje
Ct a
nd r
ef
un
din
g bo
nd
s, 2020 se
rie
s C (t
ax
ab
le) a
nd m
et
ro
Po
lit
an d
ist
riC
t re
fu
nd
ing b
on
ds, 2020 s
er
ies d
(ta
xa
bl
e)
$117,230,000 Consolidated Public Improvement Project Bonds, 2020 Series A (Tax-Exempt)
$51,130,000 Metropolitan District Project Bonds, 2020 Series B (Tax-Exempt)
$63,050,000 Consolidated Public Improvement Project and Refunding Bonds, 2020 Series C (Taxable)
$24,060,000 Metropolitan District Refunding Bonds, 2020 Series D (Taxable)
Howard County, Maryland, 3430 Court House Drive, Ellicott City, Maryland 21043 · (410) 313-2195
Official Statement