How to Maximally Support Local and Regional Biodiversity in Applied Conservation? Insights from Pond...
13
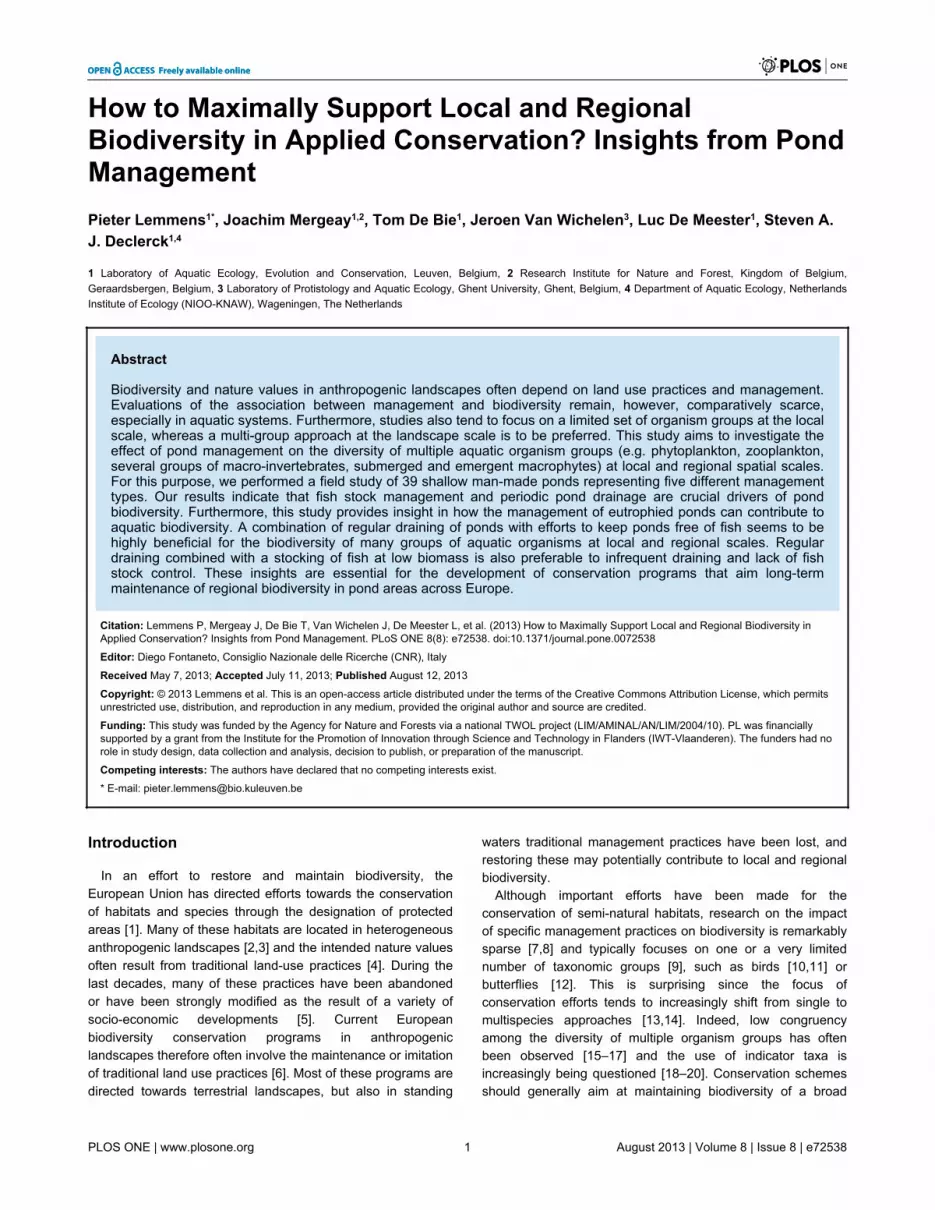
How to Maximally Support Local and Regional Biodiversity in Applied Conservation? Insights from Pond Management Pieter Lemmens 1* , Joachim Mergeay 1,2 , Tom De Bie 1 , Jeroen Van Wichelen 3 , Luc De Meester 1 , Steven A. J. Declerck 1,4 1 Laboratory of Aquatic Ecology, Evolution and Conservation, Leuven, Belgium, 2 Research Institute for Nature and Forest, Kingdom of Belgium, Geraardsbergen, Belgium, 3 Laboratory of Protistology and Aquatic Ecology, Ghent University, Ghent, Belgium, 4 Department of Aquatic Ecology, Netherlands Institute of Ecology (NIOO-KNAW), Wageningen, The Netherlands Abstract Biodiversity and nature values in anthropogenic landscapes often depend on land use practices and management. Evaluations of the association between management and biodiversity remain, however, comparatively scarce, especially in aquatic systems. Furthermore, studies also tend to focus on a limited set of organism groups at the local scale, whereas a multi-group approach at the landscape scale is to be preferred. This study aims to investigate the effect of pond management on the diversity of multiple aquatic organism groups (e.g. phytoplankton, zooplankton, several groups of macro-invertebrates, submerged and emergent macrophytes) at local and regional spatial scales. For this purpose, we performed a field study of 39 shallow man-made ponds representing five different management types. Our results indicate that fish stock management and periodic pond drainage are crucial drivers of pond biodiversity. Furthermore, this study provides insight in how the management of eutrophied ponds can contribute to aquatic biodiversity. A combination of regular draining of ponds with efforts to keep ponds free of fish seems to be highly beneficial for the biodiversity of many groups of aquatic organisms at local and regional scales. Regular draining combined with a stocking of fish at low biomass is also preferable to infrequent draining and lack of fish stock control. These insights are essential for the development of conservation programs that aim long-term maintenance of regional biodiversity in pond areas across Europe. Citation: Lemmens P, Mergeay J, De Bie T, Van Wichelen J, De Meester L, et al. (2013) How to Maximally Support Local and Regional Biodiversity in Applied Conservation? Insights from Pond Management. PLoS ONE 8(8): e72538. doi:10.1371/journal.pone.0072538 Editor: Diego Fontaneto, Consiglio Nazionale delle Ricerche (CNR), Italy Received May 7, 2013; Accepted July 11, 2013; Published August 12, 2013 Copyright: © 2013 Lemmens et al. This is an open-access article distributed under the terms of the Creative Commons Attribution License, which permits unrestricted use, distribution, and reproduction in any medium, provided the original author and source are credited. Funding: This study was funded by the Agency for Nature and Forests via a national TWOL project (LIM/AMINAL/AN/LIM/2004/10). PL was financially supported by a grant from the Institute for the Promotion of Innovation through Science and Technology in Flanders (IWT-Vlaanderen). The funders had no role in study design, data collection and analysis, decision to publish, or preparation of the manuscript. Competing interests: The authors have declared that no competing interests exist. * E-mail: [email protected] Introduction In an effort to restore and maintain biodiversity, the European Union has directed efforts towards the conservation of habitats and species through the designation of protected areas [1]. Many of these habitats are located in heterogeneous anthropogenic landscapes [2,3] and the intended nature values often result from traditional land-use practices [4]. During the last decades, many of these practices have been abandoned or have been strongly modified as the result of a variety of socio-economic developments [5]. Current European biodiversity conservation programs in anthropogenic landscapes therefore often involve the maintenance or imitation of traditional land use practices [6]. Most of these programs are directed towards terrestrial landscapes, but also in standing waters traditional management practices have been lost, and restoring these may potentially contribute to local and regional biodiversity. Although important efforts have been made for the conservation of semi-natural habitats, research on the impact of specific management practices on biodiversity is remarkably sparse [7,8] and typically focuses on one or a very limited number of taxonomic groups [9], such as birds [10,11] or butterflies [12]. This is surprising since the focus of conservation efforts tends to increasingly shift from single to multispecies approaches [13,14]. Indeed, low congruency among the diversity of multiple organism groups has often been observed [15–17] and the use of indicator taxa is increasingly being questioned [18–20]. Conservation schemes should generally aim at maintaining biodiversity of a broad PLOS ONE | www.plosone.org 1 August 2013 | Volume 8 | Issue 8 | e72538
-
Upload
independent -
Category
Documents
-
view
0 -
download
0
Transcript of How to Maximally Support Local and Regional Biodiversity in Applied Conservation? Insights from Pond...
How to Maximally Support Local and RegionalBiodiversity in Applied Conservation? Insights from PondManagementPieter Lemmens1*, Joachim Mergeay1,2, Tom De Bie1, Jeroen Van Wichelen3, Luc De Meester1, Steven A.J. Declerck1,4
1 Laboratory of Aquatic Ecology, Evolution and Conservation, Leuven, Belgium, 2 Research Institute for Nature and Forest, Kingdom of Belgium,Geraardsbergen, Belgium, 3 Laboratory of Protistology and Aquatic Ecology, Ghent University, Ghent, Belgium, 4 Department of Aquatic Ecology, NetherlandsInstitute of Ecology (NIOO-KNAW), Wageningen, The Netherlands
Abstract
Biodiversity and nature values in anthropogenic landscapes often depend on land use practices and management.Evaluations of the association between management and biodiversity remain, however, comparatively scarce,especially in aquatic systems. Furthermore, studies also tend to focus on a limited set of organism groups at the localscale, whereas a multi-group approach at the landscape scale is to be preferred. This study aims to investigate theeffect of pond management on the diversity of multiple aquatic organism groups (e.g. phytoplankton, zooplankton,several groups of macro-invertebrates, submerged and emergent macrophytes) at local and regional spatial scales.For this purpose, we performed a field study of 39 shallow man-made ponds representing five different managementtypes. Our results indicate that fish stock management and periodic pond drainage are crucial drivers of pondbiodiversity. Furthermore, this study provides insight in how the management of eutrophied ponds can contribute toaquatic biodiversity. A combination of regular draining of ponds with efforts to keep ponds free of fish seems to behighly beneficial for the biodiversity of many groups of aquatic organisms at local and regional scales. Regulardraining combined with a stocking of fish at low biomass is also preferable to infrequent draining and lack of fishstock control. These insights are essential for the development of conservation programs that aim long-termmaintenance of regional biodiversity in pond areas across Europe.
Citation: Lemmens P, Mergeay J, De Bie T, Van Wichelen J, De Meester L, et al. (2013) How to Maximally Support Local and Regional Biodiversity inApplied Conservation? Insights from Pond Management. PLoS ONE 8(8): e72538. doi:10.1371/journal.pone.0072538
Editor: Diego Fontaneto, Consiglio Nazionale delle Ricerche (CNR), Italy
Received May 7, 2013; Accepted July 11, 2013; Published August 12, 2013
Copyright: © 2013 Lemmens et al. This is an open-access article distributed under the terms of the Creative Commons Attribution License, which permitsunrestricted use, distribution, and reproduction in any medium, provided the original author and source are credited.
Funding: This study was funded by the Agency for Nature and Forests via a national TWOL project (LIM/AMINAL/AN/LIM/2004/10). PL was financiallysupported by a grant from the Institute for the Promotion of Innovation through Science and Technology in Flanders (IWT-Vlaanderen). The funders had norole in study design, data collection and analysis, decision to publish, or preparation of the manuscript.
Competing interests: The authors have declared that no competing interests exist.
* E-mail: [email protected]
Introduction
In an effort to restore and maintain biodiversity, theEuropean Union has directed efforts towards the conservationof habitats and species through the designation of protectedareas [1]. Many of these habitats are located in heterogeneousanthropogenic landscapes [2,3] and the intended nature valuesoften result from traditional land-use practices [4]. During thelast decades, many of these practices have been abandonedor have been strongly modified as the result of a variety ofsocio-economic developments [5]. Current Europeanbiodiversity conservation programs in anthropogeniclandscapes therefore often involve the maintenance or imitationof traditional land use practices [6]. Most of these programs aredirected towards terrestrial landscapes, but also in standing
waters traditional management practices have been lost, andrestoring these may potentially contribute to local and regionalbiodiversity.
Although important efforts have been made for theconservation of semi-natural habitats, research on the impactof specific management practices on biodiversity is remarkablysparse [7,8] and typically focuses on one or a very limitednumber of taxonomic groups [9], such as birds [10,11] orbutterflies [12]. This is surprising since the focus ofconservation efforts tends to increasingly shift from single tomultispecies approaches [13,14]. Indeed, low congruencyamong the diversity of multiple organism groups has oftenbeen observed [15–17] and the use of indicator taxa isincreasingly being questioned [18–20]. Conservation schemesshould generally aim at maintaining biodiversity of a broad
PLOS ONE | www.plosone.org 1 August 2013 | Volume 8 | Issue 8 | e72538
variety of organism groups. Furthermore, while most studiesare geared at evaluating restoration measures at relativelysmall, local scales, conservation schemes should take aregional perspective and try to ensure the long-termmaintenance of biodiversity at the landscape scale. Such aimsrequire a profound knowledge of how different groups oforganisms respond to different management regimes andwhich combinations of these regimes may ensure amaximization of biodiversity at larger spatial scales.
Several studies have highlighted the importance of ponds foraquatic biodiversity at regional scales [21–24]. Ponds oftencontain rare, protected and endemic species [25,26]. InWestern Europe ponds are often of anthropogenic origin [27]and traditional management practices, such as low-intensityfish farming, often allowed the persistence of high naturevalues, such as high levels of biodiversity and the occurrenceof rare and endangered species. However, eutrophication andpollution combined with the abandonment or modification ofmanagement practices has resulted in a considerable decreasein habitat quality and the loss of species [28,29]. Althoughimportant efforts to restore and maintain aquatic biodiversityhave been made, evaluations on management measures havemainly focused on their effects on the physical and chemicalenvironment or on food web structure and dynamics [30–32].Studies on the impact of management practices on diversity atlocal and regional spatial scales remain scarce (but see 33).
With this study, we aimed to investigate the impact ofdifferent management practices on biodiversity in ponds. Weevaluate their effect on the diversity of multiple taxonomicgroups (e.g. phytoplankton, zooplankton, several groups ofmacro-invertebrates, submerged and emergent macrophytes)simultaneously. To accomplish this, we surveyed a total of 39shallow ponds, representing five major pond managementtypes differing in fish stock management and in the frequencyof pond drainage. Rather than focusing solely on the effects ofmanagement at the level of individual ponds, we also took abroader approach by evaluating the relative contribution ofdifferent management types to regional biodiversity in thestudied pond network, with special attention for the occurrenceof rare and endangered species.
Methods
1: Ethics statementWe sampled in accordance to the European directive
2010/63/EU and had explicit permission of respective owners(fish farmers and the Agency for Nature and Forests) to enterprivate property. No additional permissions were required forthis study.
2: Study areaThis study was performed in the region called “Vijvergebied
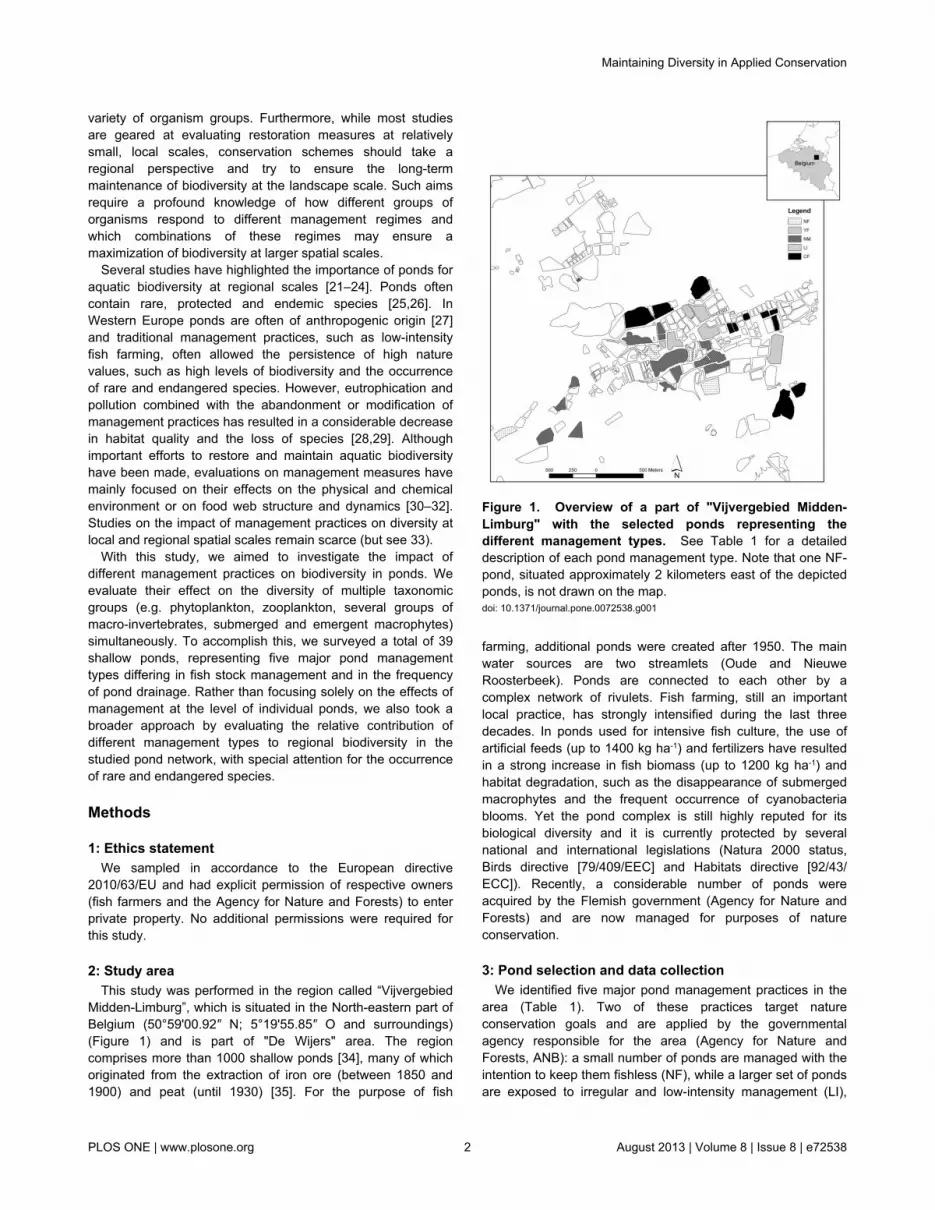
Midden-Limburg”, which is situated in the North-eastern part ofBelgium (50°59'00.92″ N; 5°19'55.85″ O and surroundings)(Figure 1) and is part of "De Wijers" area. The regioncomprises more than 1000 shallow ponds [34], many of whichoriginated from the extraction of iron ore (between 1850 and1900) and peat (until 1930) [35]. For the purpose of fish
farming, additional ponds were created after 1950. The mainwater sources are two streamlets (Oude and NieuweRoosterbeek). Ponds are connected to each other by acomplex network of rivulets. Fish farming, still an importantlocal practice, has strongly intensified during the last threedecades. In ponds used for intensive fish culture, the use ofartificial feeds (up to 1400 kg ha-1) and fertilizers have resultedin a strong increase in fish biomass (up to 1200 kg ha-1) andhabitat degradation, such as the disappearance of submergedmacrophytes and the frequent occurrence of cyanobacteriablooms. Yet the pond complex is still highly reputed for itsbiological diversity and it is currently protected by severalnational and international legislations (Natura 2000 status,Birds directive [79/409/EEC] and Habitats directive [92/43/ECC]). Recently, a considerable number of ponds wereacquired by the Flemish government (Agency for Nature andForests) and are now managed for purposes of natureconservation.
3: Pond selection and data collectionWe identified five major pond management practices in the
area (Table 1). Two of these practices target natureconservation goals and are applied by the governmentalagency responsible for the area (Agency for Nature andForests, ANB): a small number of ponds are managed with theintention to keep them fishless (NF), while a larger set of pondsare exposed to irregular and low-intensity management (LI),
Figure 1. Overview of a part of "Vijvergebied Midden-Limburg" with the selected ponds representing thedifferent management types. See Table 1 for a detaileddescription of each pond management type. Note that one NF-pond, situated approximately 2 kilometers east of the depictedponds, is not drawn on the map.doi: 10.1371/journal.pone.0072538.g001
Maintaining Diversity in Applied Conservation
PLOS ONE | www.plosone.org 2 August 2013 | Volume 8 | Issue 8 | e72538
the latter mainly involving occasional dry-stands (approximatelyevery five years, but irregularly spaced in time). Two practicesare commercial and performed by local fish farmers. The mostcommon of these practices is the intensive farming of commoncarp Cyprinus carpio (L.) (further referred to as carp ponds,CF). Some ponds are also used for raising juvenile cyprinids,such as common carp and ide Leuciscus idus (L.) (YF). Finally,a large proportion of the ponds in the area remains unmanagedfor long periods of time (NM). The management practices differnot only in fish stock management, but also in the frequency ofdrainage and in measures to prevent fish immigration andemigration. Carp farming ponds (CF), fishless ponds (NF) andponds with young-of-the-year fish (YF) are drained annuallyduring winter. Carp farming ponds are initially stocked withrelatively high biomasses of common carp, often accompaniedby other species, such as tench Tinca tinca (L.). Initial stockingbiomasses are approximately 100 kg ha-1. The management ofNF-ponds is entirely focused on preventing the establishmentof fish populations, whereas YF-ponds are initially stocked withlow densities of young-of-the-year fish. These ponds are onlystocked with fish around May, allowing the development of lushemergent and submersed vegetation in the months prior tostocking. During the filling of NF- and YF-ponds, the inlets arecovered with stainless steel grids (mesh size, 2mm) to preventimmigration of fish from outside the pond. Ponds with lowintensity management (LI) are only occasionally drained (everythree to six years); the last time these ponds were drained priorto the present study varied from two to three years. Afterdrainage, LI-ponds were stocked with intermediate densities ofpike Esox lucius (L.), roach Rutilus rutilus (L.), rudd Scardiniuserythrophthalmus (L.) and tench (total fish biomass, 40 kg ha-1),whose population development was subsequently notcontrolled. Ponds without management (NM) were neverstocked and are seldom or never drained. They haven’t beendrained in more than 10 years prior to our study. For oursurvey, we randomly selected replicate ponds for eachmanagement type (n = 7, except for CF where n = 11) (Figure
1). The ponds were surveyed either in 2006 or 2007 (2006, n =22; 2007, n = 17), making sure that all management types weremore or less equally represented in both years (2006: NF, n =3; YF, n = 4; NM, n = 4; LI, n = 4; CF, n = 8 and 2007: NF, n =4; YF, n = 3; NM, n = 3; LI, n = 3; CF, n = 3).
Pond surfaces were calculated with the GIS softwarepackage ArcView GIS 3.2a (ESRI, Inc.). We measuredmaximum pond depths once during summer with a graduatedstick at the deepest point of each pond (nearby the outlet). Atthe same moment, we estimated the thickness of the silt layerfrom the profile of sediment cores taken at 2 random chosenspots in the deeper part of the ponds. We used electrodes(WTW multiline F meter, Geotech ©) to measure pH anddaytime oxygen concentration in spring (May) and summer(July). Water transparency was determined during spring andsummer campaigns using a Snell tube [36]. Using a tube-sampler (length 1.2 m; diameter 75 mm), we took depth-integrated samples in the open water at five locations in eachpond during spring (May) and summer (July). The sampleswere pooled and subsamples of 1 L were immediately storedon ice in the dark for further analysis of suspended solids,chlorophyll a and nutrient concentrations. Suspended solidswere determined gravimetrically in the laboratory by filtering aknown volume of pond water on pre-weighed GF/F filters(Whatmann). Chlorophyll a concentrations were measuredspectrophotometrically according to Ritchie [37] after methanolextraction [38]. We measured total concentrations of nitrogen(TN) and phosphorus (TP) after alkaline persulfate digestion[39] on a Technicon Autoanalyzer II (Technicon, Tarrytown,New York, USA).
Fish community characteristics were determined by placingmultiple (n =3-5, dependent on pond surface area) double fykenets (length 7.7 m, mesh size 8 mm) in each pond for 24 hours.Specimens were identified, measured (fork length) andweighted. The total biomass of each species per pond wasexpressed as catch per unit effort (CPUE; kg per fyke net).
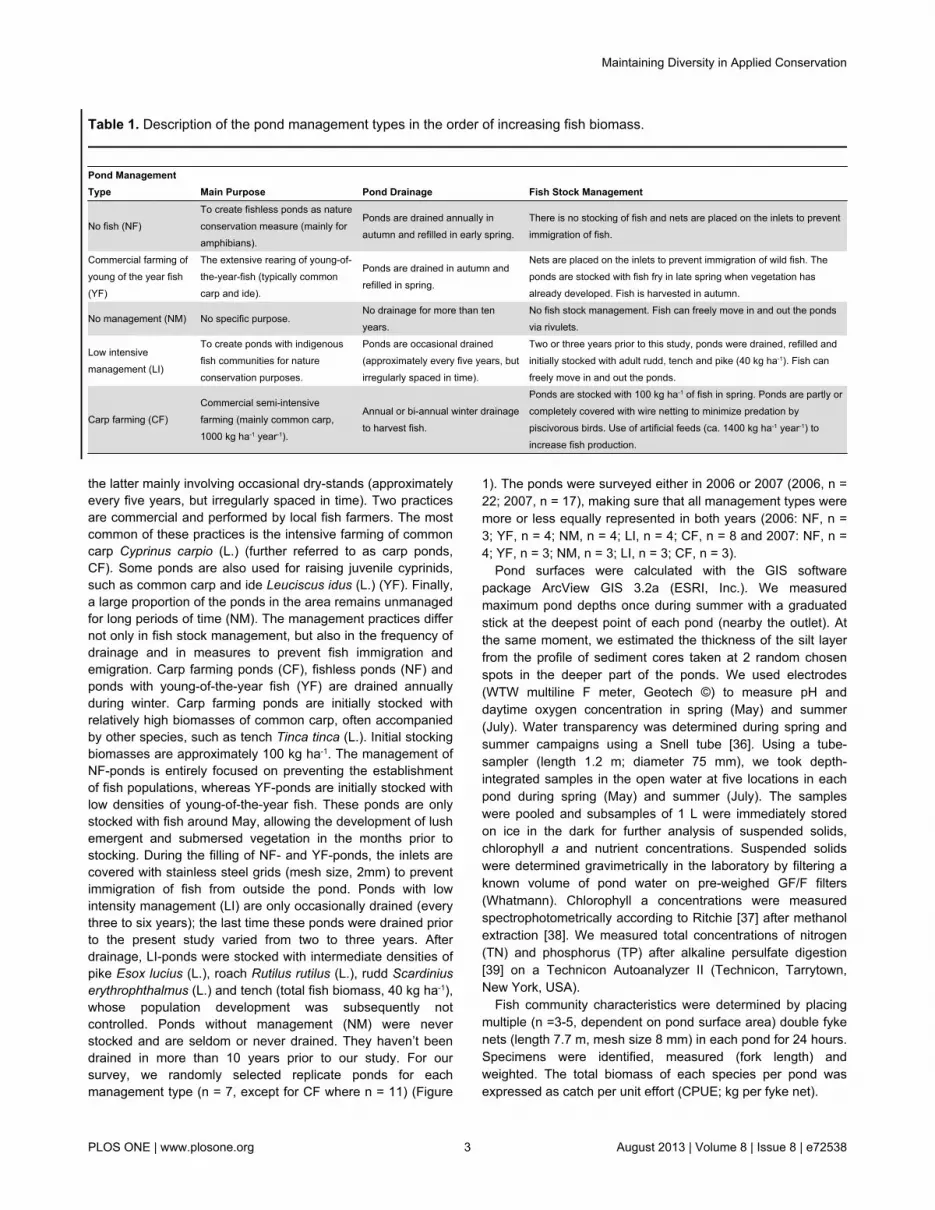
Table 1. Description of the pond management types in the order of increasing fish biomass.
Pond ManagementType Main Purpose Pond Drainage Fish Stock Management
No fish (NF)To create fishless ponds as natureconservation measure (mainly foramphibians).
Ponds are drained annually inautumn and refilled in early spring.
There is no stocking of fish and nets are placed on the inlets to preventimmigration of fish.
Commercial farming ofyoung of the year fish(YF)
The extensive rearing of young-of-the-year-fish (typically commoncarp and ide).
Ponds are drained in autumn andrefilled in spring.
Nets are placed on the inlets to prevent immigration of wild fish. Theponds are stocked with fish fry in late spring when vegetation hasalready developed. Fish is harvested in autumn.
No management (NM) No specific purpose.No drainage for more than tenyears.
No fish stock management. Fish can freely move in and out the pondsvia rivulets.
Low intensivemanagement (LI)
To create ponds with indigenousfish communities for natureconservation purposes.
Ponds are occasional drained(approximately every five years, butirregularly spaced in time).
Two or three years prior to this study, ponds were drained, refilled andinitially stocked with adult rudd, tench and pike (40 kg ha-1). Fish canfreely move in and out the ponds.
Carp farming (CF)Commercial semi-intensivefarming (mainly common carp,1000 kg ha-1 year-1).
Annual or bi-annual winter drainageto harvest fish.
Ponds are stocked with 100 kg ha-1 of fish in spring. Ponds are partly orcompletely covered with wire netting to minimize predation bypiscivorous birds. Use of artificial feeds (ca. 1400 kg ha-1 year-1) toincrease fish production.
Maintaining Diversity in Applied Conservation
PLOS ONE | www.plosone.org 3 August 2013 | Volume 8 | Issue 8 | e72538
Zooplankton and phytoplankton communities were sampledquantitatively during summer in the littoral and pelagic zone ofeach pond. Using a tube sampler, we collected depth-integrated samples (25 L) at five randomly chosen locations inboth mesohabitats separately. At very shallow locations weused a 5 L-beaker. Samples from both habitats were pooledtogether. For zooplankton samples, we filtered 40 L of thiscombined sample through a conical plankton net (mesh size,64 µm). We used 250 mL from the pooled sample tocharacterize the phytoplankton community. Zooplankton andphytoplankton samples were preserved in formaldehyde (4%).
Cladocerans were identified to species level using Flössner[40] and counted. Daphnia galeata (Sars) and D. longispina(Müller) were considered as one taxon. Copepods were dividedin two main groups (Cyclopoids and Calanoids) and counted.Taxon richness in zooplankton was estimated throughrarefaction, with cut off values at 300 individuals using thesoftware Primer v5 [41]. For the analysis of phytoplanktontaxon richness, we identified 200 cells, coenobia or coloniesfrom each sample to genus level using John et al. [42].
Aquatic macro-invertebrates were sampled twice a year(May and July) by intensive sweeping in the littoral zone ofeach pond with a D-shaped net (23 cm x 23 cm, 500 µm meshsize). The time effort of sampling was standardized to 10minutes for each pond and the time of sampling within differentmesohabitats (emergent, floating and submerged vegetation)was proportional to their relative abundance in each individualpond. Samples were fixed immediately on 70% ethanol. In thelaboratory, samples were sieved over a mesh of 1 mm and allanimals retained by the sieve were sorted, identified andcounted using a stereomicroscope by using De Pauw andVannevel [43]. Ephemeropterans, hemipterans and molluscswere identified to species level. Determination of dipterans wasdone up to family level. Other organisms were only sorted tohigher taxomic level and counted (Acari and Hirudinaea tosubclass, Trichoptera and Lepidoptera to order).
During August, we estimated the percentage of pond areacovered by submerged, floating and emergent macrophytesand we inventoried the species composition of each of thesevegetation types.
4: Data analysisWe used non-parametric Kruskall Wallis tests to test for an
effect of pond management on total fish biomass and therelative biomass of dominant fish species. Furthermore, weapplied parametric one-way ANOVA analyses and Tukey post-hoc tests to compare major pond characteristics (i.e. TN, TP,suspended matter, phytoplankton chlorophyll a, oxygensaturation, water transparency, cover by submerged andemergent vegetation, pond surface, water depth, thickness ofthe silt layer and pH) across different pond management types.For variables that were measured twice a year (spring andsummer), we used averaged values from both samplingcampaigns.
Taxon richness of each of the studied organism groups wasused as measure of biological diversity. We defined ‘localrichness’ as the average number of taxa recorded for anorganism group in all ponds that belong to a specific
management type. ‘Total richness’ was calculated as the totalnumber of taxa found for a given management type. We basedthis calculation on a total of five randomly selected ponds permanagement type to standardize for pond number. We testedfor differences in local richness among management types withparametric ANOVA and applied Tukey post-hoc tests tocompare pairs of management types. Similarly, we analyzedthe true Shannon index for local and total diversity (calculatedas the exponent of the Shannon diversity indices) in order toalso incorporate the evenness component of diversity in theevaluation of pond management [44].
We explored associations among the taxon richness (localand total) of organism groups using Principal ComponentAnalyses (PCA) and we applied redundancy analysis (RDA) toformally test the overall effects of management. In addition,both for local and total richness, we applied Wilcoxon signed-rank tests to explore for consistent differences among pairs ofmanagement types across organism groups.
We defined ‘regional richness’ of an organism group as thetotal number of taxa recorded in a set of 20 randomly chosenponds equally representing the five management types (4ponds per management type). To evaluate the uniquecontribution of a management type to regional richness, wesimulated the percentage change in regional richness thatwould result from the replacement of this management type bya random mixture of ponds belonging to the other managementtypes. In order to assess the reproducibility of the result, thisprocedure was repeated 100 times for each pond managementtype per organism group.
National Red Lists of threatened species were used to countthe number of rare plant [45] and hemipteran [46] species ineach management type. These counts included species listedas ‘threatened’, ‘vulnerable’, ‘endangered’, ‘rare’ and ‘veryrare‘. For zooplankton, we counted the number of nationallyrare species as listed by Louette et al. [47].
With the exception of pH, all variables were logarithmicallytransformed prior to analysis. All univariate analyses wereperformed in STATISTICA 9.1 (StatSoft, Inc., Tulsa,Oklahoma). We used CANOCO 4.5 [48] for the multivariateanalyses. The significance of the RDA models was evaluatedwith 999 random Monte Carlo permutations [49]. Thesimulations were written and performed in R [50]. One pondwith NF management dried out unexpectedly during thesummer of 2006 and was excluded from all analyses.
Results
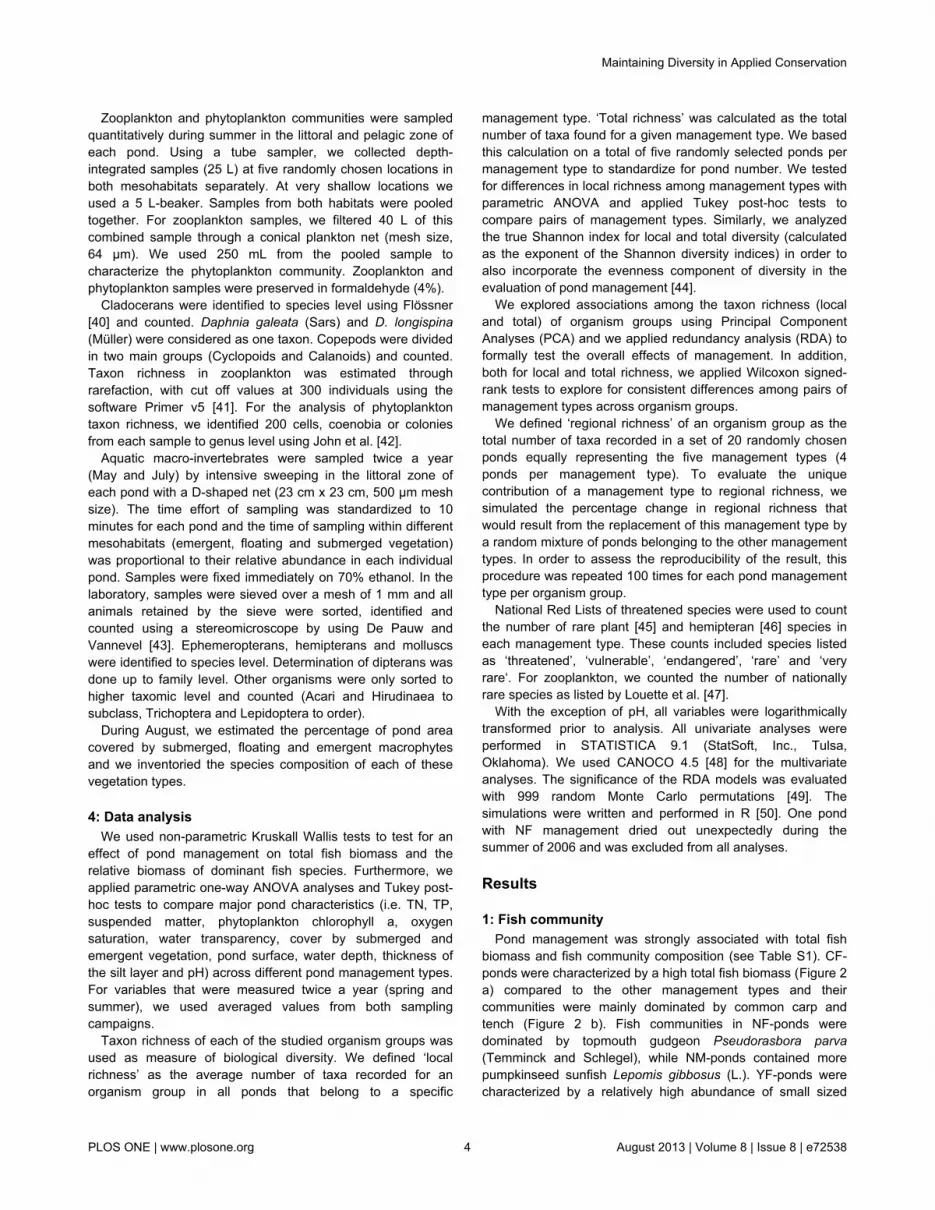
1: Fish communityPond management was strongly associated with total fish
biomass and fish community composition (see Table S1). CF-ponds were characterized by a high total fish biomass (Figure 2a) compared to the other management types and theircommunities were mainly dominated by common carp andtench (Figure 2 b). Fish communities in NF-ponds weredominated by topmouth gudgeon Pseudorasbora parva(Temminck and Schlegel), while NM-ponds contained morepumpkinseed sunfish Lepomis gibbosus (L.). YF-ponds werecharacterized by a relatively high abundance of small sized
Maintaining Diversity in Applied Conservation
PLOS ONE | www.plosone.org 4 August 2013 | Volume 8 | Issue 8 | e72538
gibel carp Carassius gibelio (Bloch) and juvenile common carp.Despite the initial stocking of LI-ponds with rudd, roach, tenchand pike, fish communities in these ponds tended to bedominated by gibel carp. Over the total set of ponds,piscivorous fish were not abundant. Only two ponds containedpike (one individual caught in a NM-pond and four individualscaught in a CF-pond) and over the total set of investigatedponds only small size classes of perch Perca fluviatilis (L.) (<12 cm) were found. All management types were characterizedby a strong proliferation of non-native fish species (60 to 80%of the total fish biomass, e.g. American brown bullheadAmeiurus nebulosus (Lesueur), common carp, gibel carp,pumpkinseed sunfish and topmouth gudgeon).
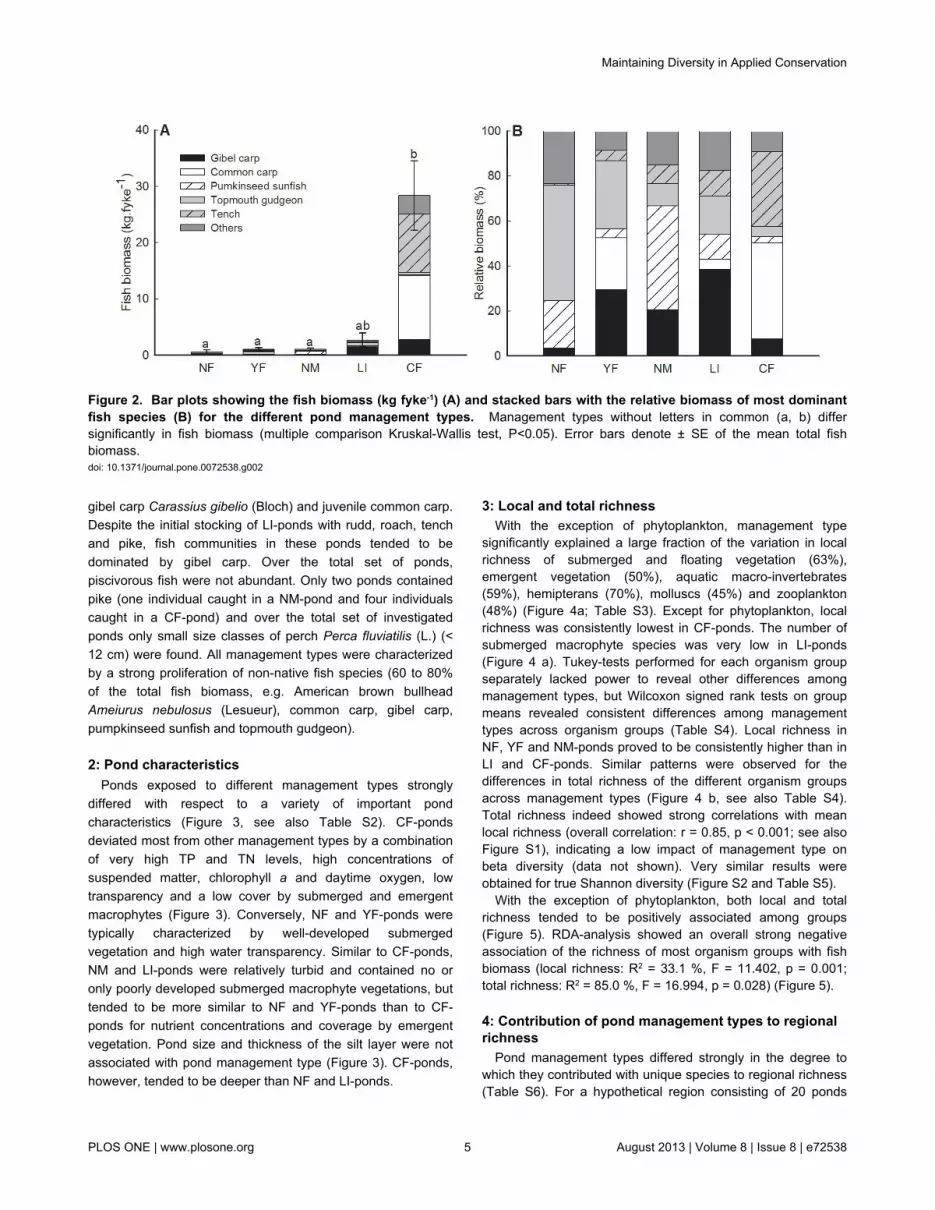
2: Pond characteristicsPonds exposed to different management types strongly
differed with respect to a variety of important pondcharacteristics (Figure 3, see also Table S2). CF-pondsdeviated most from other management types by a combinationof very high TP and TN levels, high concentrations ofsuspended matter, chlorophyll a and daytime oxygen, lowtransparency and a low cover by submerged and emergentmacrophytes (Figure 3). Conversely, NF and YF-ponds weretypically characterized by well-developed submergedvegetation and high water transparency. Similar to CF-ponds,NM and LI-ponds were relatively turbid and contained no oronly poorly developed submerged macrophyte vegetations, buttended to be more similar to NF and YF-ponds than to CF-ponds for nutrient concentrations and coverage by emergentvegetation. Pond size and thickness of the silt layer were notassociated with pond management type (Figure 3). CF-ponds,however, tended to be deeper than NF and LI-ponds.
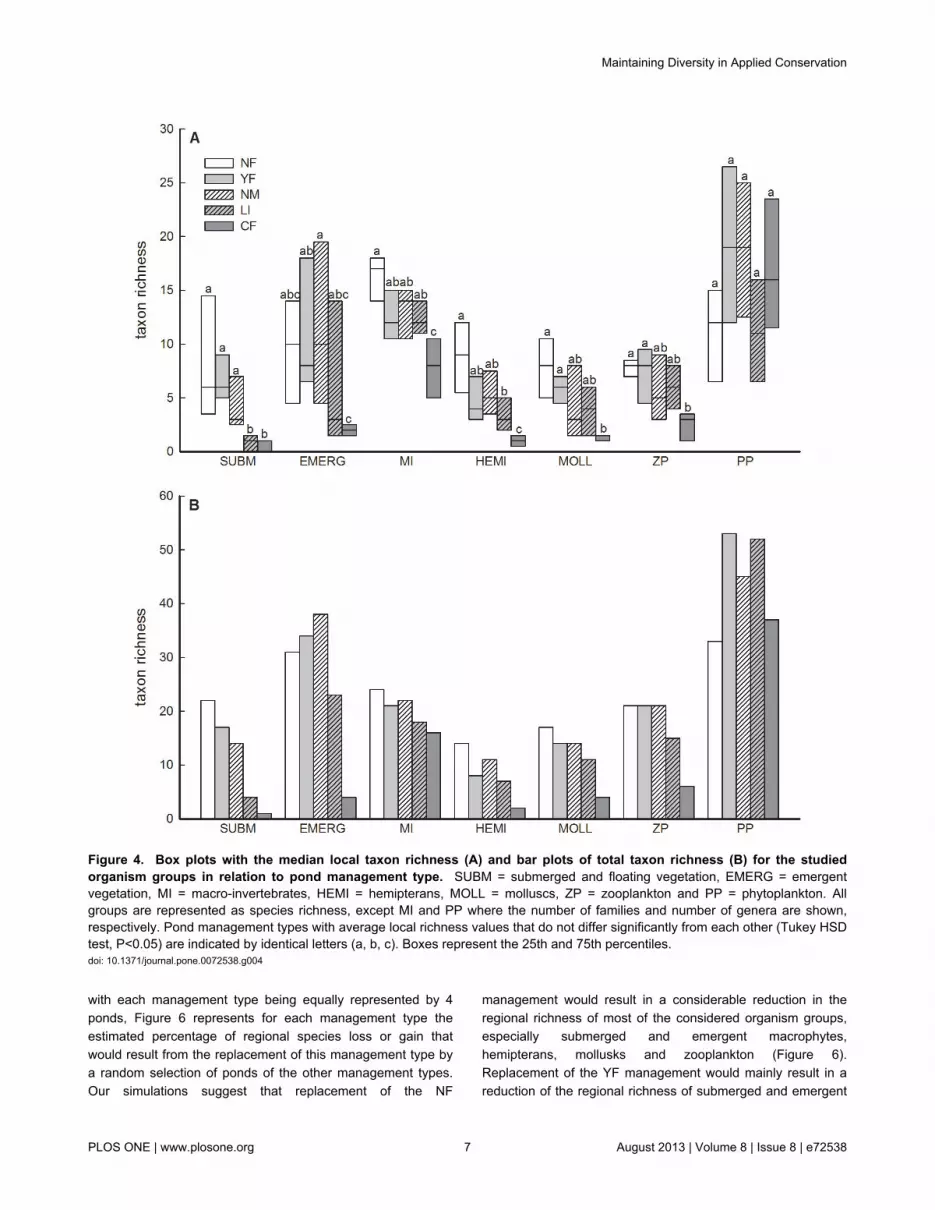
3: Local and total richnessWith the exception of phytoplankton, management type
significantly explained a large fraction of the variation in localrichness of submerged and floating vegetation (63%),emergent vegetation (50%), aquatic macro-invertebrates(59%), hemipterans (70%), molluscs (45%) and zooplankton(48%) (Figure 4a; Table S3). Except for phytoplankton, localrichness was consistently lowest in CF-ponds. The number ofsubmerged macrophyte species was very low in LI-ponds(Figure 4 a). Tukey-tests performed for each organism groupseparately lacked power to reveal other differences amongmanagement types, but Wilcoxon signed rank tests on groupmeans revealed consistent differences among managementtypes across organism groups (Table S4). Local richness inNF, YF and NM-ponds proved to be consistently higher than inLI and CF-ponds. Similar patterns were observed for thedifferences in total richness of the different organism groupsacross management types (Figure 4 b, see also Table S4).Total richness indeed showed strong correlations with meanlocal richness (overall correlation: r = 0.85, p < 0.001; see alsoFigure S1), indicating a low impact of management type onbeta diversity (data not shown). Very similar results wereobtained for true Shannon diversity (Figure S2 and Table S5).
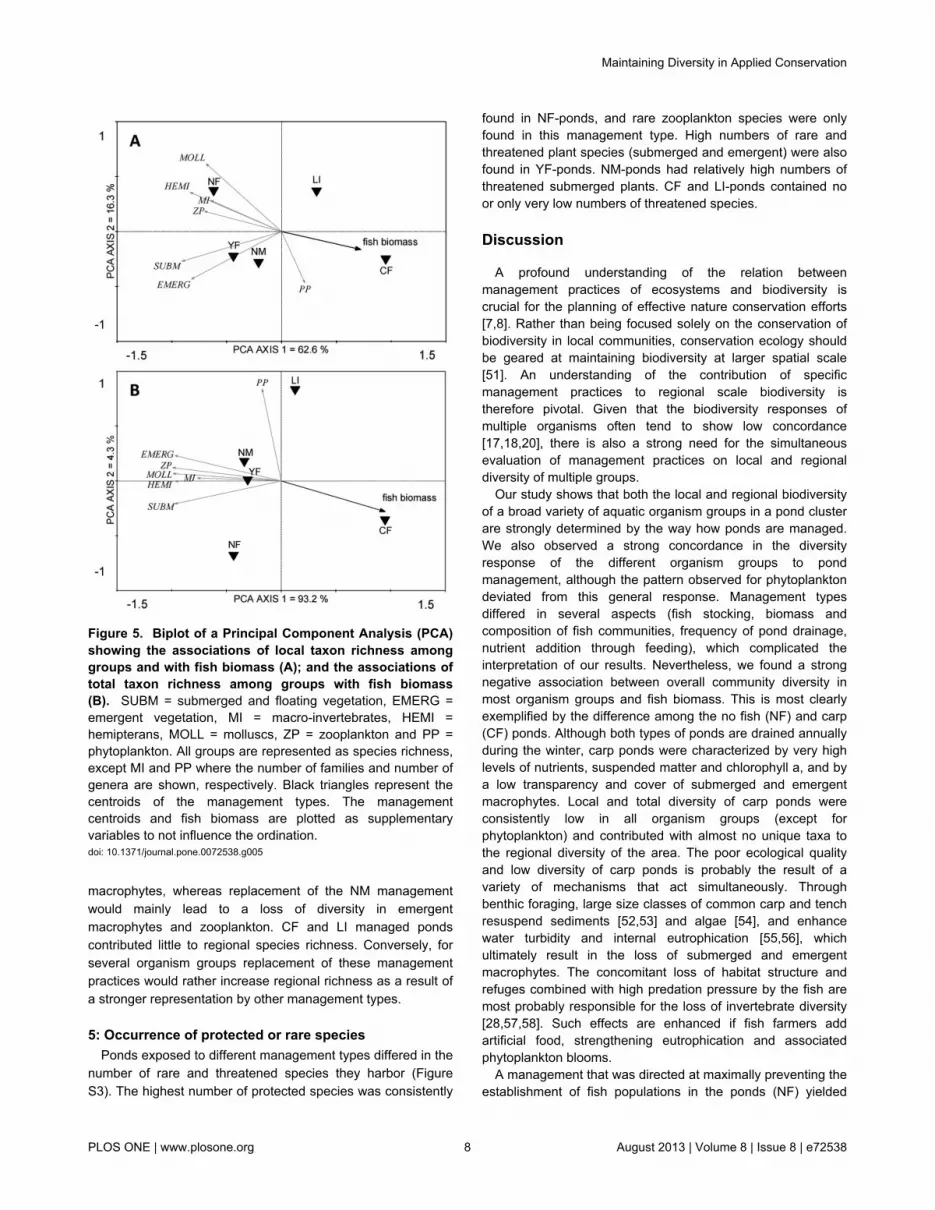
With the exception of phytoplankton, both local and totalrichness tended to be positively associated among groups(Figure 5). RDA-analysis showed an overall strong negativeassociation of the richness of most organism groups with fishbiomass (local richness: R2 = 33.1 %, F = 11.402, p = 0.001;total richness: R2 = 85.0 %, F = 16.994, p = 0.028) (Figure 5).
4: Contribution of pond management types to regionalrichness
Pond management types differed strongly in the degree towhich they contributed with unique species to regional richness(Table S6). For a hypothetical region consisting of 20 ponds
Figure 2. Bar plots showing the fish biomass (kg fyke-1) (A) and stacked bars with the relative biomass of most dominantfish species (B) for the different pond management types. Management types without letters in common (a, b) differsignificantly in fish biomass (multiple comparison Kruskal-Wallis test, P<0.05). Error bars denote ± SE of the mean total fishbiomass.doi: 10.1371/journal.pone.0072538.g002
Maintaining Diversity in Applied Conservation
PLOS ONE | www.plosone.org 5 August 2013 | Volume 8 | Issue 8 | e72538
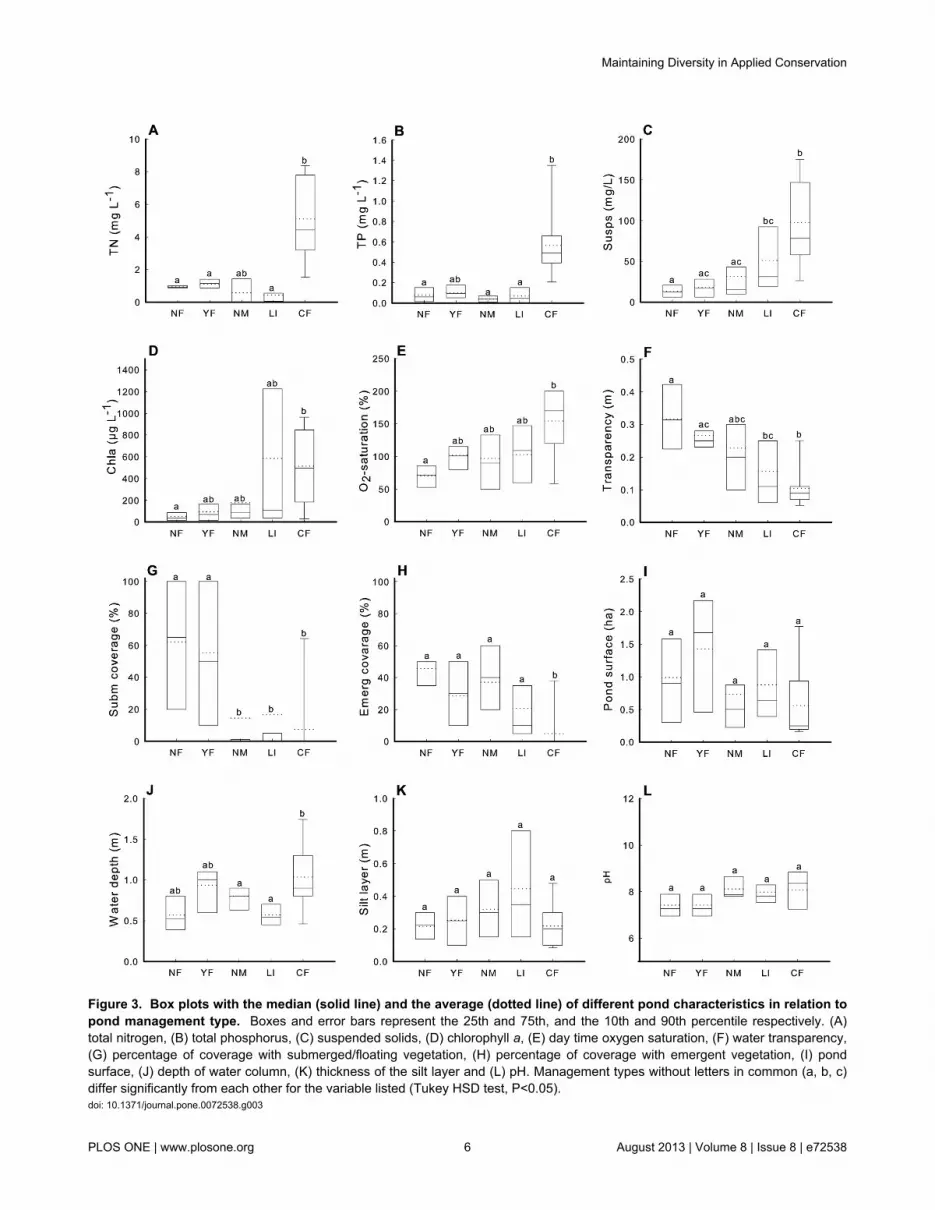
Figure 3. Box plots with the median (solid line) and the average (dotted line) of different pond characteristics in relation topond management type. Boxes and error bars represent the 25th and 75th, and the 10th and 90th percentile respectively. (A)total nitrogen, (B) total phosphorus, (C) suspended solids, (D) chlorophyll a, (E) day time oxygen saturation, (F) water transparency,(G) percentage of coverage with submerged/floating vegetation, (H) percentage of coverage with emergent vegetation, (I) pondsurface, (J) depth of water column, (K) thickness of the silt layer and (L) pH. Management types without letters in common (a, b, c)differ significantly from each other for the variable listed (Tukey HSD test, P<0.05).doi: 10.1371/journal.pone.0072538.g003
Maintaining Diversity in Applied Conservation
PLOS ONE | www.plosone.org 6 August 2013 | Volume 8 | Issue 8 | e72538
with each management type being equally represented by 4ponds, Figure 6 represents for each management type theestimated percentage of regional species loss or gain thatwould result from the replacement of this management type bya random selection of ponds of the other management types.Our simulations suggest that replacement of the NF
management would result in a considerable reduction in theregional richness of most of the considered organism groups,especially submerged and emergent macrophytes,hemipterans, mollusks and zooplankton (Figure 6).Replacement of the YF management would mainly result in areduction of the regional richness of submerged and emergent
Figure 4. Box plots with the median local taxon richness (A) and bar plots of total taxon richness (B) for the studiedorganism groups in relation to pond management type. SUBM = submerged and floating vegetation, EMERG = emergentvegetation, MI = macro-invertebrates, HEMI = hemipterans, MOLL = molluscs, ZP = zooplankton and PP = phytoplankton. Allgroups are represented as species richness, except MI and PP where the number of families and number of genera are shown,respectively. Pond management types with average local richness values that do not differ significantly from each other (Tukey HSDtest, P<0.05) are indicated by identical letters (a, b, c). Boxes represent the 25th and 75th percentiles.doi: 10.1371/journal.pone.0072538.g004
Maintaining Diversity in Applied Conservation
PLOS ONE | www.plosone.org 7 August 2013 | Volume 8 | Issue 8 | e72538
macrophytes, whereas replacement of the NM managementwould mainly lead to a loss of diversity in emergentmacrophytes and zooplankton. CF and LI managed pondscontributed little to regional species richness. Conversely, forseveral organism groups replacement of these managementpractices would rather increase regional richness as a result ofa stronger representation by other management types.
5: Occurrence of protected or rare speciesPonds exposed to different management types differed in the
number of rare and threatened species they harbor (FigureS3). The highest number of protected species was consistently
Figure 5. Biplot of a Principal Component Analysis (PCA)showing the associations of local taxon richness amonggroups and with fish biomass (A); and the associations oftotal taxon richness among groups with fish biomass(B). SUBM = submerged and floating vegetation, EMERG =emergent vegetation, MI = macro-invertebrates, HEMI =hemipterans, MOLL = molluscs, ZP = zooplankton and PP =phytoplankton. All groups are represented as species richness,except MI and PP where the number of families and number ofgenera are shown, respectively. Black triangles represent thecentroids of the management types. The managementcentroids and fish biomass are plotted as supplementaryvariables to not influence the ordination.doi: 10.1371/journal.pone.0072538.g005
found in NF-ponds, and rare zooplankton species were onlyfound in this management type. High numbers of rare andthreatened plant species (submerged and emergent) were alsofound in YF-ponds. NM-ponds had relatively high numbers ofthreatened submerged plants. CF and LI-ponds contained noor only very low numbers of threatened species.
Discussion
A profound understanding of the relation betweenmanagement practices of ecosystems and biodiversity iscrucial for the planning of effective nature conservation efforts[7,8]. Rather than being focused solely on the conservation ofbiodiversity in local communities, conservation ecology shouldbe geared at maintaining biodiversity at larger spatial scale[51]. An understanding of the contribution of specificmanagement practices to regional scale biodiversity istherefore pivotal. Given that the biodiversity responses ofmultiple organisms often tend to show low concordance[17,18,20], there is also a strong need for the simultaneousevaluation of management practices on local and regionaldiversity of multiple groups.
Our study shows that both the local and regional biodiversityof a broad variety of aquatic organism groups in a pond clusterare strongly determined by the way how ponds are managed.We also observed a strong concordance in the diversityresponse of the different organism groups to pondmanagement, although the pattern observed for phytoplanktondeviated from this general response. Management typesdiffered in several aspects (fish stocking, biomass andcomposition of fish communities, frequency of pond drainage,nutrient addition through feeding), which complicated theinterpretation of our results. Nevertheless, we found a strongnegative association between overall community diversity inmost organism groups and fish biomass. This is most clearlyexemplified by the difference among the no fish (NF) and carp(CF) ponds. Although both types of ponds are drained annuallyduring the winter, carp ponds were characterized by very highlevels of nutrients, suspended matter and chlorophyll a, and bya low transparency and cover of submerged and emergentmacrophytes. Local and total diversity of carp ponds wereconsistently low in all organism groups (except forphytoplankton) and contributed with almost no unique taxa tothe regional diversity of the area. The poor ecological qualityand low diversity of carp ponds is probably the result of avariety of mechanisms that act simultaneously. Throughbenthic foraging, large size classes of common carp and tenchresuspend sediments [52,53] and algae [54], and enhancewater turbidity and internal eutrophication [55,56], whichultimately result in the loss of submerged and emergentmacrophytes. The concomitant loss of habitat structure andrefuges combined with high predation pressure by the fish aremost probably responsible for the loss of invertebrate diversity[28,57,58]. Such effects are enhanced if fish farmers addartificial food, strengthening eutrophication and associatedphytoplankton blooms.
A management that was directed at maximally preventing theestablishment of fish populations in the ponds (NF) yielded
Maintaining Diversity in Applied Conservation
PLOS ONE | www.plosone.org 8 August 2013 | Volume 8 | Issue 8 | e72538
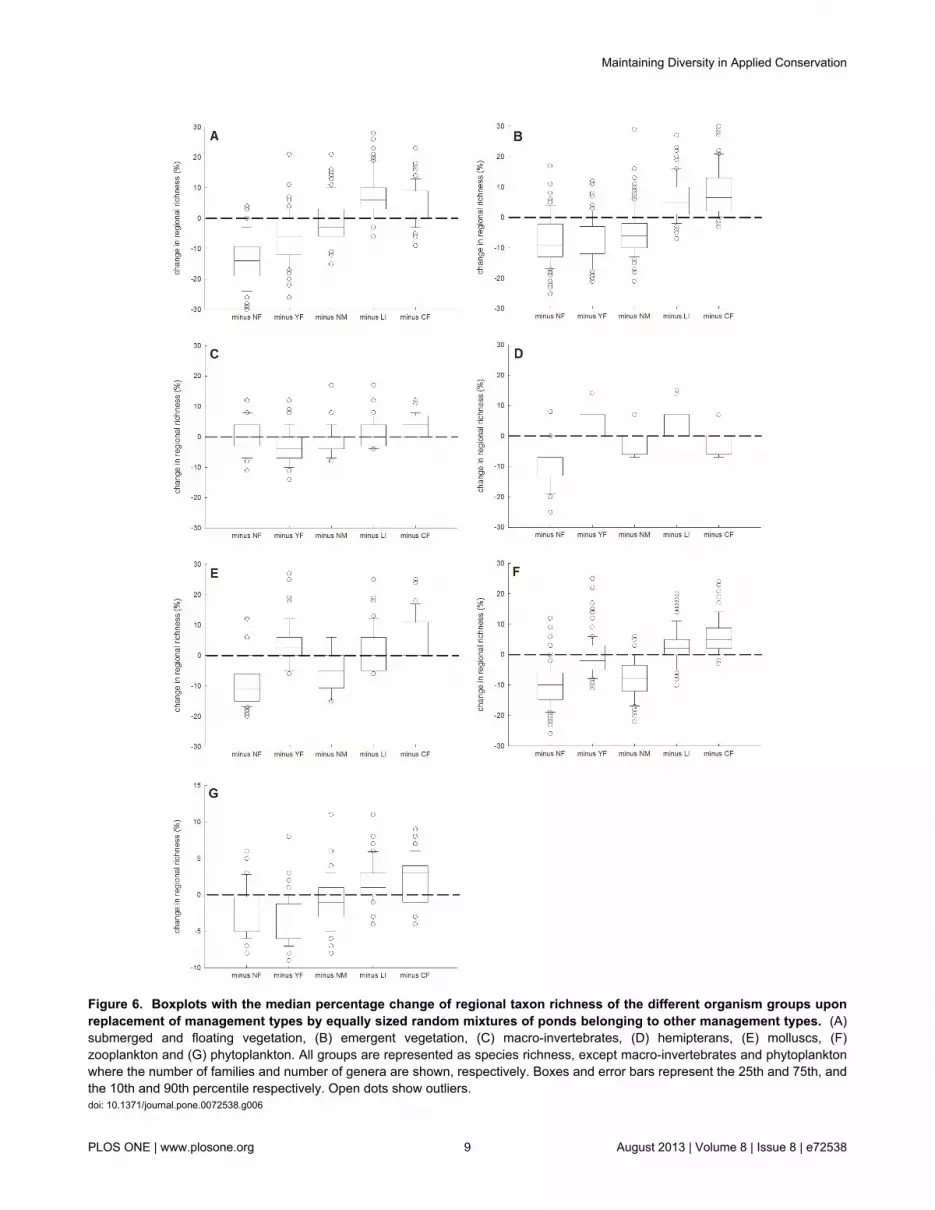
Figure 6. Boxplots with the median percentage change of regional taxon richness of the different organism groups uponreplacement of management types by equally sized random mixtures of ponds belonging to other management types. (A)submerged and floating vegetation, (B) emergent vegetation, (C) macro-invertebrates, (D) hemipterans, (E) molluscs, (F)zooplankton and (G) phytoplankton. All groups are represented as species richness, except macro-invertebrates and phytoplanktonwhere the number of families and number of genera are shown, respectively. Boxes and error bars represent the 25th and 75th, andthe 10th and 90th percentile respectively. Open dots show outliers.doi: 10.1371/journal.pone.0072538.g006
Maintaining Diversity in Applied Conservation
PLOS ONE | www.plosone.org 9 August 2013 | Volume 8 | Issue 8 | e72538
clear water with well-developed aquatic vegetation, with highlevels of local and total richness in almost all of the investigatedorganism groups. NF-ponds also contained relatively highnumbers of rare and protected species and our simulationssuggest that omission of this management type in the areawould result in a substantial reduction of the regional richnessof a variety of organism groups, such as macrophytes,hemipterans, mollusks and zooplankton. The high conservationvalue of NF-ponds probably resulted from a combination ofvery low fish densities with annual drainage during winter.Periodic pond drainage can stimulate the development ofsubmerged vegetation [59,60] and strengthen the mechanismsthat stabilize the clear water macrophyte dominated state,especially in systems that are subjected to eutrophication (cf.theory of alternative stable states [28,58,61,62]:). Throughincreased habitat complexity, food availability and shelter forprey against predation [28,61,63,64] the development ofmacrophyte vegetations can contribute to a higher biodiversityin other groups of aquatic biota. In addition, regular drainagestimulates the decomposition of organic matter in thesediments and promotes the establishment of typicalpioneering Littoretea vegetation of which many members areconsidered of high conservation concern in Western Europe[eg. Elatine triandra (Schkuhr), Baldellia repens (Lam.), Apiuminundatum (L.)] [65,66]. Although CF-ponds are also drainedannually, these ponds lacked high levels of diversity. Thepositive effects of drainage in these ponds are seemingly offsetby their high fish biomass.
Ponds in use for the commercial farming of young-of-the-year fish (YF) were characterized by extensive macrophytestands and a high water transparency, and contributeddisproportionally to the regional richness of emergent andsubmerged macrophytes. Biodiversity levels for most groups inYF-ponds were consistently high. As in NF-ponds, the highecological quality and biodiversity of YF-ponds is likely theresult of a combination of annual drainage during winter andstocking of low biomasses of fish in late spring.
In the absence of any management (NM), ponds containedno or only a sparse vegetation of submerged macrophytes. Thelocal and total diversity of most organism groups were relativelyhigh. The absence of management is a cheap option thatseems to be associated with reasonable levels of biodiversity inmost groups. Despite its low short term costs, we would adviseagainst this option for several reasons. First, the absence ofsubmerged macrophyte vegetation is striking and is probablyrelated to the permanency of high water levels. Fish wereprobably not responsible for the absence of submergedmacrophytes, given the relatively low total fish biomass anddominance by small-bodied species. The absence ofmacrophytes results in poor habitat heterogeneity and wesuspect that this would lead to an impoverishment of most ofthe invertebrate and zooplankton fauna on a longer term[61,64]. Second, we expect that the absence of periodicdrainage would inevitably result in the loss of the ponds due tosuccession and filling. We therefore do not consider zeromanagement as a valid management option for the longerterm.
Surprisingly, the ecological quality of ponds with low intensitymanagement (LI) proved to be low. Limnological characteristicswere similar for LI-ponds and ponds without management(NM), and submerged vegetation was nearly absent in bothtypes of ponds. In addition, a considerable fraction of LI-pondscontained very high levels of suspended matter andphytoplankton chlorophyll a. Levels of taxon richness weresystematically lower in the LI than in the NF, YF and NM-ponds. Most probably, this poor quality was the result of acombination of low drainage frequency combined with a highbiomass of relatively large-bodied benthic fish, mostly gibelcarp. The observed fish communities failed to reflect thecomposition of the initially stocked fish (i.e. rudd, roach, tenchand pike), and tended to be higher in fish biomass than the NFand YF-ponds, probably as the result of inadequate drainage.In contrast to the NF and YF-ponds, where drainage wascarefully performed and where considerable efforts were doneto keep out fish from nearby rivulets, the winter drainage of LI-ponds is often carried out with less care. Some species, likegibel carp, are robust and can survive extended periods inharsh conditions in small puddles and pools [67]. Carefuldrainage may therefore be a prerequisite for any managementtype aiming at sustaining pond biodiversity.
Conclusion
We observed a remarkable concordance in the diversityresponse of organism groups to pond management types in thestudied pond cluster. A management focusing on keepingponds free of fish via repeated and carefully applied ponddrainage combined with additional measures aimed atpreventing fish from entering ponds through inlets appeared tobe the best guarantee for high local diversity across organismgroups. Such management also resulted in the strongestcontribution to regional biodiversity and supported highnumbers of rare and endangered species. Based on theseresults we conclude that such management forms an importanttool for the maintenance of aquatic biodiversity in ponds andshould therefore be regarded as an essential part of regionalconservation plans for pond areas, at least in eutrophiedregions like Flanders where fish populations oftenspontaneously develop to high densities. Alternativemanagement types, such as the commercial farming of juvenilecyprinids, also resulted in good ecological quality and highlevels of biodiversity, presumably due to the combination ofregular periodic drainage and stocking of only a low fishbiomass relatively late in the season, allowing for thedevelopment of aquatic vegetation. Although zero managementis by far the cheapest non-commercial option on the short term,we do not recommend this management type because it doesnot support the development of submerged macrophytesvegetations. Furthermore, this management involves a seriousrisk of losing valuable ponds on a longer time scale due tosuccession and filling. Zero or low-intensity pond managementis often applied by nature conservation organizations in Europebecause of lack of financial resources, but involves a risk ofgradual deterioration of ponds on a longer term. When strictlyregulated, specific types of commercial fish farming have
Maintaining Diversity in Applied Conservation
PLOS ONE | www.plosone.org 10 August 2013 | Volume 8 | Issue 8 | e72538
considerable potential to contribute to the conservation ofregional nature values in semi-natural meso- to eutrophic pondclusters, especially when such activities combine regular ponddrainage with low fish stock biomass and when the use offertilizers and artificial feeds are avoided.
Supporting Information
Figure S1. Association between mean local and total richnessacross management types for all investigated biota together (r= 0.85, p <0.001) (a) and for organism groups separately;SUBM = submerged and floating vegetation (r = 0.99, p =0.002) (b), EMERG = emergent vegetation (r = 0.99, p = 0.001)(c), MI = all taxa of macro-invertebrates (r = 0.91, p = 0.030)(d), HEMI = hemipterans (r = 0.96, p = 0.008) (e), MOLL =molluscs (r = 0.95, p = 0.013) (f), ZP = zooplankton (r = 0.92, p= 0.027) (g), PP = phytoplankton (r = 0.28, p = 0.65) (h).(TIF)
Figure S2. Box plots with the median local true Shannondiversity (a) and bar plots of total true Shannon diversity(b) for the studied organism groups in relation to pondmanagement type.SUBM = submerged and floating vegetation, EMERG =emergent vegetation, MI = macro-invertebrates, HEMI =hemipterans, MOLL = molluscs, ZP = zooplankton and PP =phytoplankton. All groups are presented at the species level,except MI and PP where the number of families and number ofgenera are shown, respectively. Pond management types withaverage local diversity values that do not differ significantlyfrom each other (Tukey HSD test, P<0.05) are indicated byidentical letters (a, b, c). Boxes represent the 25th and 75thpercentile.(TIF)
Figure S3. The number of protected species ofsubmerged/floating plants (SUBM), emergent plants(EMERG), aquatic macro-invertebrates (without Dipteraand Molluscs), and the number of national rarezooplankton species (ZP) observed in each pondmanagement type.(TIF)
Table S1. Results of Kruskal-Wallis analyses testing foreffects of pond management type on total fish biomassand the relative biomass of the dominant fish species.Df = degrees of freedom, H = H-values, P = p-value.
(XLSX)
Table S2. Results of one-way ANOVA analyses testing foreffects of pond management type on pond characteristics.Df = degrees of freedom, SS = Sum of Squares, MS = MeanSquares, F = F-ratio, P = p-values.(XLSX)
Table S3. Results of ANOVA-analyses testing for effectsof pond management type on the local richness of each ofthe studied organism groups.All groups are represented as species richness, except MI andPP where the number of families and number of genera areshown, respectively. Df = degrees of freedom, SS = Sum ofSquares, MS = Mean Squares, F = F-ratio, P = p-values.(XLSX)
Table S4. Results of Wilcoxon signed-rank tests testingfor differences in local richness and total richness amongpairs of pond management types across organism groups.(XLSX)
Table S5. Results of ANOVA-analyses testing for effectsof pond management type on the true local diversity ofeach of the studied organism groups.Df = degrees of freedom, SS = Sum of Squares, MS = MeanSquares, F = F-ratio, P = p-values.(XLSX)
Table S6. List of taxa uniquely found to be present in eachof the management types during the course of the study.(XLSX)
Acknowledgements
We cordially thank the local fish farmers for allowing access totheir ponds and acknowledge Dirk Ercken for his assistancewith the practical work. We are grateful to Lily Gora and TomVerschraegen from the Agency for Nature and Forests for theirlogistic support and additional information on the managementtypes.
Author Contributions
Conceived and designed the experiments: PL JM TDB LDMSAJD. Performed the experiments: PL JM TDB JVW. Analyzedthe data: PL SAJD. Contributed reagents/materials/analysistools: SAJD LDM. Wrote the manuscript: PL JM TDB JVWLDM SAJD.
References
1. Maes J, Paracchini ML, Zulian G, Dunbar MB, Alkemade R (2012)Synergies and trade-offs between ecosystem service supply,biodiversity, and habitat conservation status in Europe. Biol Conserv155: 1-12. doi:10.1016/j.biocon.2012.06.016.
2. Hendrickx F, Maelfait J-P, Van Wingerden W, Schweiger O, SpeelmansM et al. (2007) How landscape structure, land-use intensity and habitatdiversity affect components of total arthropod diversity in agricultural
landscapes. J Appl Ecol 44: 340-351. doi:10.1111/j.1365-2664.2006.01270.x.
3. Wright HL, Lake IR, Dolman PM (2012) Agriculture—a key element forconservation in the developing world. Conserv Lett 5: 11-19. doi:10.1111/j.1755-263X.2011.00208.x.
4. Dolman PM, Panter CJ, Mossman HL (2012) The biodiversity auditapproach challenges regional priorities and identifies a mismatch in
Maintaining Diversity in Applied Conservation
PLOS ONE | www.plosone.org 11 August 2013 | Volume 8 | Issue 8 | e72538
conservation. J Appl Ecol 49: 986-997. doi:10.1111/j.1365-2664.2012.02174.x.
5. Thiere G, Milenkovski S, Lindgren P-E, Sahlén G, Berglund O et al.(2009) Wetland creation in agricultural landscapes: Biodiversity benefitson local and regional scales. Biol Conserv 142: 964-973. doi:10.1016/j.biocon.2009.01.006.
6. Bignal EM, McCracken DI (2000) The nature conservation value ofEuropean traditional farming systems. Environ Rev 8: 149-171. doi:10.1139/a00-009.
7. Poschlod P, Bakker JP, Kahmen S (2005) Changing land use and itsimpact on biodiversity. Basic Appl Ecol 6: 93-98. doi:10.1016/j.baae.2004.12.001.
8. Kleijn D, Baquero RA, Clough Y, Díaz M, De Esteban J et al. (2006)Mixed biodiversity benefits of agri-environment schemes in fiveEuropean countries. Ecol Lett 9: 243-254. doi:10.1111/j.1461-0248.2005.00869.x. PubMed: 16958888.
9. Heino J, Muotka T, Paavola R (2003) Determinants ofmacroinvertebrate diversity in headwater streams: regional and localinfluences. J Anim Ecol 72: 425-434. doi:10.1046/j.1365-2656.2003.00711.x.
10. Lindenmayer D, Wood J, Montague-Drake R, Michael D, Crane M et al.(2012) Is biodiversity management effective? Cross-sectionalrelationships between management, bird response and vegetationattributes in an Australian agri-environment scheme. Biol Conserv 152:62-73. doi:10.1016/j.biocon.2012.02.026.
11. Perkins AJ, Maggs HE, Watson A, Wilson JD (2011) Adaptivemanagement and targeting of agri-environment schemes does benefitbiodiversity: a case study of the corn bunting Emberiza calandra. J ApplEcol 48: 514-522. doi:10.1111/j.1365-2664.2011.01958.x.
12. Moranz R, Debinski D, McGranahan D, Engle D, Miller J (2012)Untangling the effects of fire, grazing, and land-use legacies ongrassland butterfly communities. Biodivers Conserv 21: 2719-2746. doi:10.1007/s10531-012-0330-2.
13. Regan HM, Hierl LA, Franklin J, Deutschman DH, Schmalbach HL etal. (2008) Species prioritization for monitoring and management inregional multiple species conservation plans. Divers Distrib 14:462-471.
14. Wilson KA, McBride MF, Bode M, Possingham HP (2006) Prioritizingglobal conservation efforts. Nature 440: 337-340. doi:10.1038/nature04366. PubMed: 16541073.
15. Fattorini S, Dennis RLH, Cook LM (2012) Use of Cross-TaxonCongruence for Hotspot Identification at a Regional Scale. PLOS ONE7: e40018. doi:10.1371/journal.pone.0040018. PubMed: 22761947.
16. Gaston KJ (2000) Global patterns in biodiversity. Nature 405: 220-227.doi:10.1038/35012228. PubMed: 10821282.
17. Longmuir A, Shurin JB, Clasen JL (2007) Independent Gradients ofProducer, Consumer, and Microbial Diversity in Lake Plankton. Ecology88: 1663-1674. doi:10.1890/06-1448.1. PubMed: 17645013.
18. Heino J (2010) Are indicator groups and cross-taxon congruence usefulfor predicting biodiversity in aquatic ecosystems? Ecol Indic 10:112-117. doi:10.1016/j.ecolind.2009.04.013.
19. Oertli S, Müller A, Steiner D, Breitenstein A, Dorn S (2005) Cross-taxoncongruence of species diversity and community similarity among threeinsect taxa in a mosaic landscape. Biol Conserv 126: 195-205. doi:10.1016/j.biocon.2005.05.014.
20. Padial AA, Declerck SAJ, De Meester L, Bonecker C, Lansac-Tôha FAet al. (2012) Evidence against the use of surrogates for biomonitoringof Neotropical floodplains. Freshw Biol 57: 2411-2423. doi:10.1111/fwb.12008.
21. Williams P, Whitfield M, Biggs J, Bray S, Fox S et al. (2004)Comparative biodiversity of rivers, streams, ditches and ponds in anagricultural landscape in Southern England. Biol Conserv 115:329-341. doi:10.1016/S0006-3207(03)00153-8.
22. De Bie T, Declerck S, Martens K, De Meester L, Brendonck L (2010) Acomparative analysis of cladoceran communities from different waterbody types: patterns in community composition and diversity. In: BOertliR CéréghinoJ BiggsS DeclerckA Hull. Pond Conservation inEurope. Netherlands: Springer Verlag. pp. 19-27.
23. Davies B, Biggs J, Williams P, Whitfield M, Nicolet P et al. (2008)Comparative biodiversity of aquatic habitats in the Europeanagricultural landscape. Agric Ecosyst Environ 125: 1-8. doi:10.1016/j.agee.2007.10.006.
24. Oertli B, Joye DA, Castella E, Juge R, Cambin D et al. (2002) Doessize matter? The relationship between pond area and biodiversity. BiolConserv 104: 59-70. doi:10.1016/S0006-3207(01)00154-9.
25. Oertli B, Biggs J, Céréghino R, Grillas P, Joly P et al. (2005)Conservation and monitoring of pond biodiversity: introduction. AquatConserv Mar Freshw Ecosyst 15: 535-540. doi:10.1002/aqc.752.
26. Nicolet P, Biggs J, Fox G, Hodson MJ, Reynolds C et al. (2004) Thewetland plant and macroinvertebrate assemblages of temporary pondsin England and Wales. Biol Conserv 120: 261-278. doi:10.1016/j.biocon.2004.03.010.
27. Hansson L-A, Brönmark C, Anders Nilsson P, Åbjörnsson K (2005)Conflicting demands on wetland ecosystem services: nutrient retention,biodiversity or both? Freshw Biol 50: 705-714. doi:10.1111/j.1365-2427.2005.01352.x.
28. Scheffer M (1998) Ecology of shallow lakes. London: Chapman andHall.
29. Pechar L (2000) Impacts of long-term changes in fishery managementon the trophic level water quality in Czech fish ponds. Fish Manag Ecol7: 23-31. doi:10.1046/j.1365-2400.2000.00193.x.
30. Van Wichelen J, Declerck S, Muylaert K, Hoste I, Geenens V et al.(2007) The importance of drawdown and sediment removal for therestoration of the eutrophied shallow lake Kraenepoel (Belgium). In: RGulatiE LammensN PauwE Donk. Shallow Lakes in a Changing World.Netherlands: Springer Verlag. pp. 291-303.
31. Jeppesen E, Jensen JP, Søndergaard M, Lauridsen T (1999) Trophicdynamics in turbid and clearwater lakes with special emphasis on therole of zooplankton for water clarity. Hydrobiologia 408-409: 217-231.doi:10.1023/A:1017071600486.
32. Jeppesen E, Meerhoff M, Jacobsen BA, Hansen RS, Søndergaard M etal. (2007) Restoration of shallow lakes by nutrient control andbiomanipulation—the successful strategy varies with lake size andclimate. Hydrobiologia 581: 269-285. doi:10.1007/s10750-006-0507-3.
33. Louette G, Declerck S, Vandekerkhove J, De Meester L (2009)Evaluation of Restoration Measures in a Shallow Lake through aComparison of Present Day Zooplankton Communities with HistoricalSamples. Restor Ecol 17: 629-640. doi:10.1111/j.1526-100X.2008.00409.x.
34. Hermy M (1993) Annex I of the Habitat Directive 92/43/EEC:Comments with respect to Flanders, Wallonia, Belgium: Institute ofNature Conservation. Report A/93/33, Hasselt, Belgium
35. Burny J (1999) Bijdrage tot de historische ecologie van de LimburgseKempen (1910-1950) - Tweehonderd gesprekken samengevat.Maastricht: Natuurhistorisch Genootschap in Limburg (Nederland).
36. Louette G, De Meester L (2005) High dispersal capacity of cladoceranzooplankton in newly founded communities. Ecology 86: 353-359. doi:10.1890/04-0403.
37. Ritchie RJ (2006) Consistent Sets of Spectrophotometric ChlorophyllEquations for Acetone, Methanol and Ethanol Solvents. PhotosynthRes 89: 27-41. doi:10.1007/s11120-006-9065-9. PubMed: 16763878.
38. Talling JF, Driver D (1963) Some problems in the estimation ofchlorophyll a in phytoplankton. Washington, D.C.: U.S. Atomic EnergyCommission, Division of Technical Information. pp. 142-146.
39. Koroleff F (1970) Determination of total phosphorus in natural watersby means of persulphate oxidation.
40. Flössner D (2000) Die Haplopoda und Cladocera Mitteleuropas Leiden.Backhuys Publishers.
41. Clarke KR, Gorley RN (2001) PRIMERv5: User manual/tutorial. UK:Plymouth.
42. John DM, Whitton BA, Brook AJ (2002) The freshwater algal flora of theBritish isles. Cambridge: Cambridge University Press.
43. De Pauw N, Vannevel R (1991) Macro-invertebraten en waterkwaliteit.Antwerpen: Stichting Leefmilieu.
44. Jost L (2007) PARTITIONING DIVERSITY INTO INDEPENDENTALPHA AND BETA COMPONENTS. Ecology 88: 2427-2439. doi:10.1890/06-1736.1. PubMed: 18027744.
45. Van Landuyt W, Hoste I, Vanhecke L, Van den Bremt P, Vercruysse Wet al. (2006) Atlas van de Flora van Vlaanderen en het Brussel Gewest:Instituut voor natuur- en bosonderzoek, Nationale Plantentuin vanBelgie & Flo. Wer
46. Bonte D, Vandomme V, Muylaert J, Bosmans R (2001) Eengedocumenteerde Rode Lijst van de water- en oppervlaktewantsen vanVlaanderen. Gent: Universiteit Gent.
47. Louette G, De Bie T, Vandekerkhove J, Declerck S, De Meester L(2007) Analysis of the inland cladocerans of Flanders (Belgium) –Inferring changes over the past 70 years. Belg J Zool 137: 117-123.
48. ter Braak CJF, Šmilauer T (2002) CANOCO Reference manual anduser’s guide to Canoco for Windows: software for canonical communityordination (version 4.5) M Power. Ithaca: New York.
49. Lepš J, Šmilauer P (2003) Multivariate Analysis of Ecological Datausing CANOCO. New York: Cambridge University Press.
50. Team RDC (2008) R: A language and environment for statisticalcomputing. In: RFfS, Computing. Austria: Vienna.
51. Jost L, DeVries P, Walla T, Greeney H, Chao A et al. (2010)Partitioning diversity for conservation analyses. Divers Distrib 16:65-76. doi:10.1111/j.1472-4642.2009.00626.x.
Maintaining Diversity in Applied Conservation
PLOS ONE | www.plosone.org 12 August 2013 | Volume 8 | Issue 8 | e72538
52. Breukelaar AW, Lammens EHHR, Klein Breteler JG, [!(surname)!],Tátrai I (1994) Effects of benthivorous bream (Abramis brama) andcarp (Cyprius carpio) on sediment resuspension and concentration ofnutrients and chlorophyll-a. Freshw Biol 32: 113-121. doi:10.1111/j.1365-2427.1994.tb00871.x.
53. Zambrano L, Scheffer M, Martínez-Ramos M (2001) Catastrophicresponse of lakes to benthivorous fish introduction. Oikos 94: 344-350.doi:10.1034/j.1600-0706.2001.940215.x.
54. Roozen FCJM, Lürling M, Vlek H, Van Der Pouw Kraan EAJ, IbelingsBW et al. (2007) Resuspension of algal cells by benthivorous fishboosts phytoplankton biomass and alters community structure inshallow lakes. Freshw Biol 52: 977-987. doi:10.1111/j.1365-2427.2007.01729.x.
55. Havens KE (1991) Fish-induced sediment resuspension: effects onphytoplankton biomass and community structure in a shallowhypereutrophic lake. J Plankton Res 13: 1163-1176. doi:10.1093/plankt/13.6.1163.
56. Søndergaard M, Kristensen P, Jeppesen E (1992) Phosphorus releasefrom resuspended sediment in the shallow and wind-exposed LakeArresø, Denmark. Hydrobiologia 228: 91-99. doi:10.1007/BF00006480.
57. Carpenter SR, Kitchell JF, Hodgson JR (1985) Cascading TrophicInteractions and Lake Productivity. BioScience 35: 634-639. PubMed:4039589
58. Scheffer M, Hosper SH, Meijer ML, Moss B, Jeppesen E (1993)Alternative equilibria in shallow lakes. Trends Ecol Evol 8: 275-279. doi:10.1016/0169-5347(93)90254-M. PubMed: 21236168.
59. Woltemade CJ (1997) Water level management opportunities forecological benefit, Pool 5 Mississippi River. J Am Water Resour Assoc33: 443-454. doi:10.1111/j.1752-1688.1997.tb03523.x.
60. Hough RA, Allenson TE, Dion DD (1991) The response of macrophytecommunities to drought-induced reduction of nutrient loading in a chainof lakes. Aquat Bot 41: 299-308. doi:10.1016/0304-3770(91)90049-B.
61. Jeppesen E, Sondergaard M, Christofferson K (1998) The structuringrole of submerged macrophytes in lakes. New York: Springer Verlag.
62. Scheffer M, Carpenter S, Foley JA, Folke C, Walker B (2001)Catastrophic shifts in ecosystems. Nature 413: 591-596. doi:10.1038/35098000. PubMed: 11595939.
63. Burks RL, Jeppesen E, David M, Lodge DM (2001) Littoral ZoneStructures as Daphnia Refugia against Fish Predators. LimnolOceanogr Vol. 46: 230-237. doi:10.4319/lo.2001.46.2.0230.
64. Declerck SAJ, Bakker ES, van Lith B, Kersbergen A (2011) Effects ofnutrient additions and macrophyte composition on invertebratecommunity assembly and diversity in experimental ponds. Basic ApplEcol 12: 466-475. doi:10.1016/j.baae.2011.05.001.
65. Arts GHP (2002) Deterioration of atlantic soft water macrophytecommunities by acidification, eutrophication and alkalinisation. AquatBot 73: 373-393. doi:10.1016/S0304-3770(02)00031-1.
66. Arts GHP, Van Der Velde G, Roelofs JGM, Van Swaay CAM (1990)Successional changes in the soft-water macrophyte vegetation of(sub)atlantic, sandy, lowland regions during this century. Freshw Biol24: 287-294. doi:10.1111/j.1365-2427.1990.tb00709.x.
67. Liasko R, Koulish A, Pogrebniak A, Papiggioti O, Taranenko L et al.(2011) Influence of environmental parameters on growth pattern andpopulation structure of Carassius auratus gibelio in Eastern Ukraine.Hydrobiologia 658: 317-328. doi:10.1007/s10750-010-0502-6.
Maintaining Diversity in Applied Conservation
PLOS ONE | www.plosone.org 13 August 2013 | Volume 8 | Issue 8 | e72538