![To Identify the given inorganic salt[Ba(NO3)2] To Identify the ...](https://static.fdokumen.com/doc/165x107/63169e619076d1dcf80b7c23/to-identify-the-given-inorganic-saltbano32-to-identify-the-.jpg)
To Identify the given inorganic salt[Ba(NO3)2] To Identify the ...

How to Identify Food Deserts: Measuring Physicaland Economic Access to Supermarkets in KingCounty, WashingtonJunfeng Jiao, PhD, Anne V. Moudon, DrSc, Jared Ulmer, MPH, Philip M. Hurvitz, PhD, and Adam Drewnowski, PhD
Inequitable access to healthy, affordable foodsin some US communities may be one reasonfor the observed social disparities in health.1---3
The term “food desert,” originally coined inthe United Kingdom,4,5 describes low-incomeneighborhoods, both urban and rural, that havelimited access to full-service supermarkets orgrocery stores.2,6 Because supermarkets gener-ally offer a variety of healthy foods at reasonablecost, food access is defined by proximity toa supermarket or large grocery store.2,7,8
Eliminating food deserts has become a prior-ity issue in national-level food and nutritionpolicies. Implementation of these policies re-quires accurate definition and identification offood deserts. The 2008 Farm Bill, Section 7527,defines a food desert as “an area . . . with limitedaccess to affordable and nutritious food, partic-ularly such an area composed of predominantlylower-income . . . communities.”9(p1031) TheInstitute of Medicine and the National ResearchCouncil use a similar definition.10
Studies in public health and urban planninghave applied both criteria—low-income statusand low access to supermarkets—to identify fooddeserts.2,7,11---13 Various geographic boundaries,such as zip codes,14---16 census tracts,7,17---22 andcensus block groups,12,23,24 have also been used.A national study by the US Department ofAgriculture relied on a 1-by-1-kilometer grid.2
Measures to define a low-income area and itsvulnerable population have included zip codeswith a median household income at the bottomquintile of the national level (£ 80% of thesurrounding area),19 census tracts with morethan 20% of the population living below thepoverty level,22 and a1-by-1-kilometer grid withmore than 40% of its population at or below2 times the poverty level.2
Food access has typically been measuredas the physical distance between the centroidsof spatial units of analysis (e.g., census tracts or
the 1-km grid as the neighborhood), or be-tween the centroids of spatial units housing thepopulation and the closest supermarket orlarge grocery store. Various distance thresholdshave been used for urban residents: 0.8 kilo-meters,25 1 kilometer,18 1 mile,2,23 2 kilome-ters,22 and 2.5 kilometers.8 In rural areas,10 miles has been used.2,15
Methodological limitations of past studiesincluded coarse levels of income data aggre-gation, such as zip codes or census tracts.Analyses based on census block groups, thefinest unit for which income data are available,provide more accurate figures of economicallychallenged populations. Distances betweenplaces where people live and shop for foodhave often been measured as straight-line(Euclidian) distance. Some studies haveemployed the more realistic street networkdistance measure.7,24,26---28 Most studies havefocused on driving as the default transportationmode, although some investigated access toa supermarket by walking2,25,26,29 or taking
public transit.26,29 Finally, with few excep-tions,30---32 most studies have not consideredfood cost differences among supermarketchains, assuming that all supermarkets offer thesame variety of healthy foods at the same costto consumers.
We sought to introduce an improved ap-proach to measuring food deserts and to refinemeasures of access to supermarkets. In addition toincome, we used 2 access criteria to determinefood deserts at the census block group level inSeattle---King County, Washington. We evaluatedphysical access for different modes of travel. Wemeasured economic access by stratifying super-markets by food price, with the assumption thatlow-income populations need to access low-costsupermarkets. We added car ownership asa measure of population vulnerability.27
METHODS
Data on population, households, income, carownership, and poverty rates came from the
Objectives. We explored new ways to identify food deserts.
Methods. We estimated physical and economic access to supermarkets for 5
low-income groups in Seattle–King County, Washington. We used geographic
information system data to measure physical access: service areas around each
supermarket were delineated by ability to walk, bicycle, ride transit, or drive
within 10 minutes. We assessed economic access by stratifying supermarkets
into low, medium, and high cost. Combining income and access criteria
generated multiple ways to estimate food deserts.
Results. The 5 low-income group definitions yielded total vulnerable popula-
tions ranging from 4% to 33% of the county’s population. Almost all of the
vulnerable populations lived within a 10-minute drive or bus ride of a low- or
medium-cost supermarket. Yet at most 34% of the vulnerable populations could
walk to any supermarket, and as few as 3% could walk to a low-cost supermarket.
Conclusions. The criteria used to define low-income status and access to
supermarkets greatly affect estimates of populations living in food deserts.
Measures of access to food must include travel duration and mode and
supermarket food costs. (Am J Public Health. 2012;102:e32–e39. doi:10.2105/
AJPH.2012.300675)
RESEARCH AND PRACTICE
e32 | Research and Practice | Peer Reviewed | Jiao et al. American Journal of Public Health | October 2012, Vol 102, No. 10
2000 US Census.33 The study’s area extentwas King County within its urban growthboundary, which contained 90% of thecounty’s population.
We examined 5 groups of low-incomepopulations to test the effect of different mea-sures of low income on the definition of fooddeserts. We summed population counts forblock groups with more than 20% of thepopulation at or below the poverty level,22,33
with more than 40% of the population at orbelow twice the poverty level,2 and witha median household income less than 80% ofthe median income of King County.19,33 Twoadditional measures of vulnerability wereblock groups in which more than 30% of thehouseholds did not own a car and block groupsin which more than 20% of the populationwere below the poverty level and more than30% of the households had no car.
Supermarkets
Data and geocoding. We identified super-markets from the 2008 food establishmentpermits provided by Public Health Seattle andKing County. We defined supermarkets asstores that were run by national or regionalchains and sold a broad selection of foods, suchas canned and frozen foods, fresh fruit andvegetables, and fresh and prepared meats, fish,seafood, and poultry. The data comprised10 254 permit records, 926 of which belongedto 207 unique supermarkets (most individualsupermarkets had multiple permits). UrbanForm Lab geocoded all permit addresses andmatched them to King County parcel centroidswith ArcGIS, version 9.3.1 (ESRI, Redlands,CA). Addresses that failed automatic geocoding(n = 1500) were manually located with GoogleMaps and Microsoft Live Local searches. Atotal of 10 215 (99.6%) food permit addresseswere geocoded.Classification by food cost. To measure eco-
nomic access to food, the University of Wash-ington Center for Obesity Research classifiedsupermarkets into 3 categories: high, medium,and low cost. The classification was basedon the cost of a market basket of commonlyconsumed food items across 8 supermarketchains.34 The market basket data were col-lected between January and April 2009 andanalyzed according to a method described andused in previous studies.35,36 Our study priced
fewer foods than the earlier studies (100 vs384), but the pricing rules and procedureswere the same.
The market basket cost in the lowest-costsupermarket chain served as a baseline for theclassification: chains with a market basket cost40% higher than baseline were classified asmedium-cost chains, and those with a marketbasket cost 60% above baseline were classifiedas high-cost chains.34 Of the 8 supermarketchains, 2 were low cost, 3 medium cost, and3 high cost. We conducted further marketbasket research both on-site and online for 6local supermarkets chains that respondents ina parallel study in King County had reportedusing as their primary supermarket.37 Wecompared the results with the baseline marketbasket and classified all 6 as low cost. We alsoclassified the county’s 3 warehouse chains aslow-cost supermarkets. Of the 207 supermar-kets in King County, 80 were low cost, 110medium cost, and 17 high cost.
Physical and Economic Access
A service area around each supermarketdefined the population that could reach thestore by a predefined travel distance or dura-tion along the road network.26 Thus individ-uals living within a service area had access toa supermarket, and residents outside serviceareas were in potential food deserts. Weidentified 5 service areas for each supermarket.First, an area of 1 mile or less from a super-market served as a baseline, because thisdistance was used in previous research.2,3,23,38
The other 4 service areas encompassed a10-minute travel time to a supermarket byeither walking, bicycling, riding transit, ordriving. This 10-minute travel threshold camefrom previous research in which 60% of re-spondents reported traveling less than 10minutes, and 38% reported traveling 10 to30 minutes to their primary grocery store.37
We delineated service areas in 2 steps withthe network analyst in ArcGIS 9.3.1 (ESRI).We first identified the farthest points that couldbe reached away from a supermarket locationfollowing the network of streets within the1-mile distance or the 10 minutes for eachtravel mode. Second, we connected each pointidentified along the network to its closestpoints by straight lines, which eventually cre-ated a service area as the smallest polygon
delineated by the points. If the service areas of2 or more supermarkets overlaid each other,the network analysis merged them into 1polygon.
Street network data came from ESRIStreetMap Premium North America NAVTEQ2009 release 1. These data were encodedwith mode restrictions, estimated car travelspeeds, and physical accessibility (e.g., limited-access roadway on- and off-ramp restrictions),allowing distances to be calculated by eitherphysical distance or travel duration imped-ances. Service area delineation employed thefollowing distance measures: for the baseline,a physical distance of 1 mile or less; for a10-minute walk or bicycle trip, a physicaldistance of 0.5 and 2 miles, respectively; fordriving, the 10-minute driving travel imped-ance, which took into account vehicular travelspeeds and directional restrictions; and forriding transit, the 10-minute transit travelimpedance. The transit service area also ex-cluded areas that were farther than 0.25 milesof a bus route, a documented median walkingdistance to a bus stop.39 Bus route datacame from King County Metro Transit.
We applied service areas created for the1-mile baseline distance and for the 4 travelmodes separately to all supermarket locationsas well as to the 3 classes of supermarkets byfood cost, yielding a total of 20 geographicdefinitions of service areas.
Populations
To identify the populations living within andoutside of supermarket service areas, weintersected census block groups with the ser-vice area layers, by geographic informationsystem overlay methods. Where block groupboundaries only partially intersected with theservice area, we adjusted the service areapopulation proportionally to the area of blockgroups falling within it. We designated areasoutside the service areas but within theKing County urban growth boundary as fooddeserts.
Analyses compared vulnerable populations’access to supermarkets according to the dif-ferent criteria and measures to define fooddeserts (Figure 1). First, a set of baselinemeasures followed the traditional definitionof a food desert and included the 5 low-incomepopulation groups living within or beyond
RESEARCH AND PRACTICE
October 2012, Vol 102, No. 10 | American Journal of Public Health Jiao et al. | Peer Reviewed | Research and Practice | e33

1 mile of a supermarket. Second, we stratifiedeconomic access to a supermarket by the 3supermarket cost levels. Third, we measuredphysical access for the vulnerable populationsresiding within or beyond a 10-minute travelduration from a supermarket, stratified bymode of travel. Finally, we derived a combinedphysical and economic access measure fromfood cost and travel duration by mode.
RESULTS
King County had 1445 census block groups.The population residing in block groups witha median household income of less than 80%of the county’s median income constituted36% of the county’s population; 9% of thecounty’s population lived in block groups withmore than 20% of the population below thepoverty level, 12% lived in block groups withmore than 40% below twice the poverty level,5% lived in block groups in which more than30% of the households had no car, and 3%lived in block groups with more than 20% ofthe population below the poverty level and
more than 30% of the households lacking a car(data not shown).
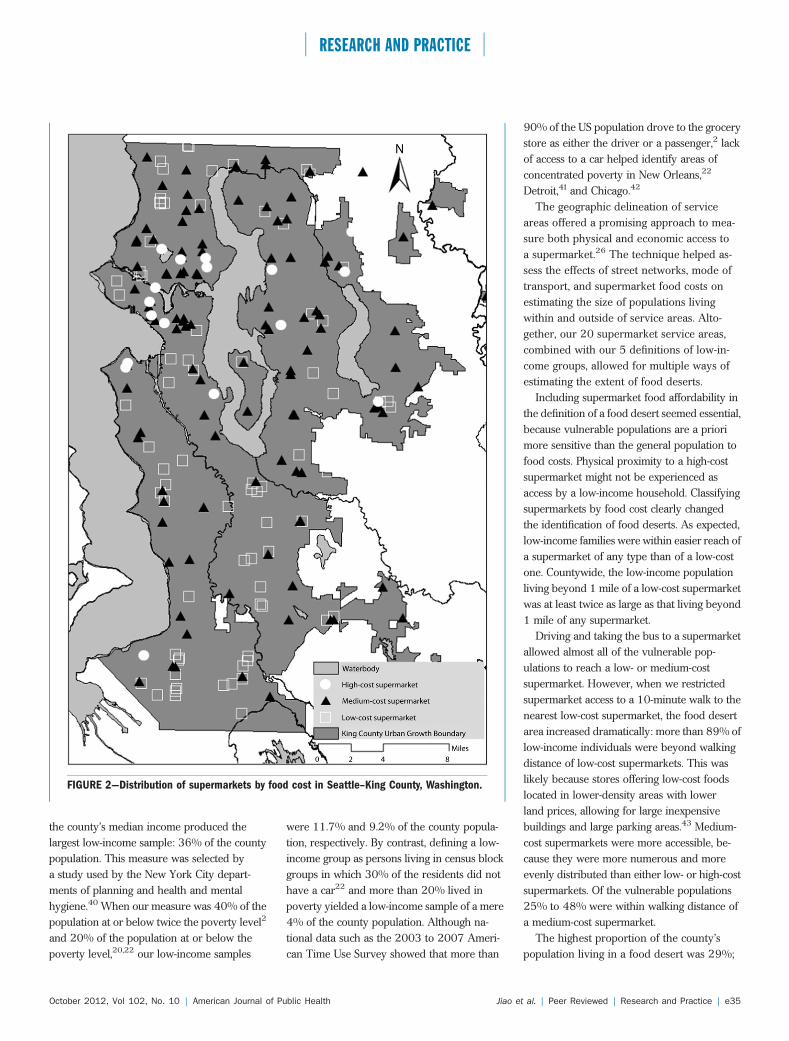
The 80 low- and 110 medium-cost super-markets were evenly distributed across thecounty. By contrast, most of the 17 high-costsupermarkets were located in North KingCounty (Figure 2).
Baseline data showed that only up to 29% ofthe vulnerable population (and 44% of thecounty’s total population) lived farther than1 mile from any supermarket (Table 1). Thesmallest proportion of the population in low-income groups lived beyond 1 mile of a me-dium-cost supermarket (26%---42%; 57% ofthe total population), 69% to 82% (and 78% ofthe total population) lived more than 1 milefrom a low-cost supermarket, and 58% to 85%(and 87% of the total population) lived fartherthan 1 mile from a high-cost supermarket. Thelargest proportion of the low-income popula-tion whose neighborhoods were food desertsresided in block groups with a median house-hold income of less than 80% of the county’smedian income: 166 000 persons lived be-yond 1 mile of any supermarket, 263 000
lacked access to a medium-cost supermarket,395 000 (and 0.9 million of the total popu-lation) lacked access to a low-cost supermar-ket, and 486 000 (and 1.2 million of thetotal population) lacked access to a high-costsupermarket.
When we measured access as a 10-minutetrip by different travel modes, we found thatless than 8% of the vulnerable populationgroups lived beyond a 10-minute bicycle ortransit ride or drive of any supermarket, but45% to 66%were beyond a 10-minute walk ofany supermarket; 78% of the total populationhad more than a 10-minute walk.
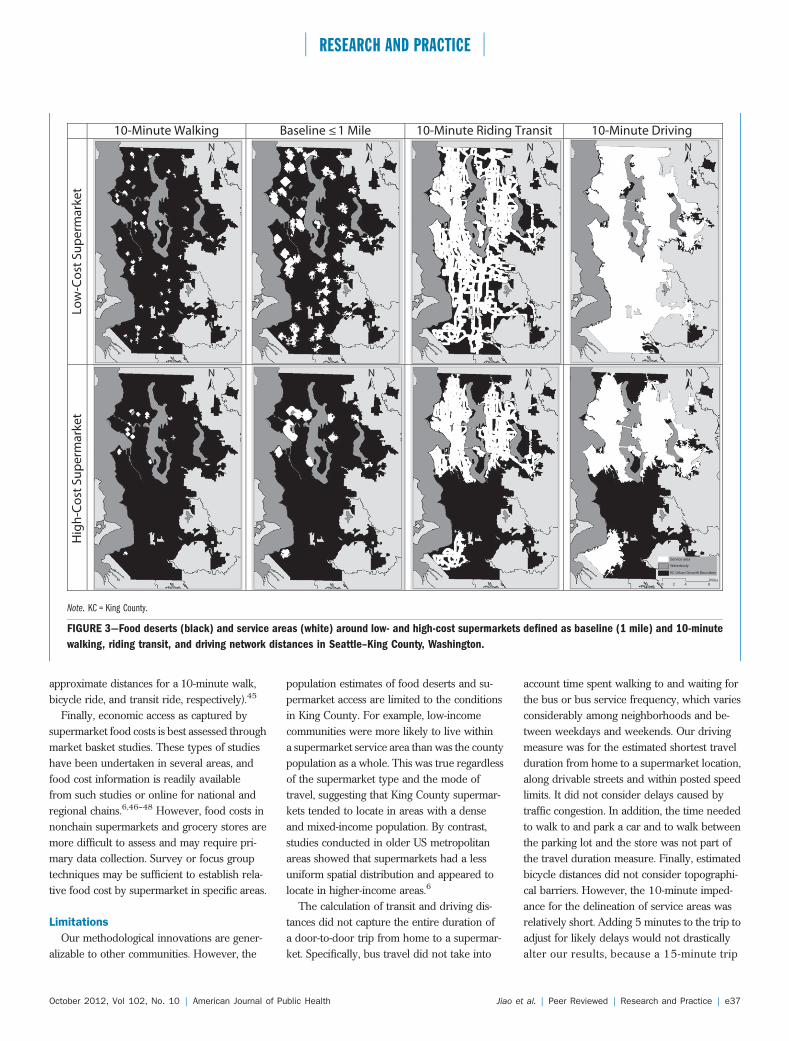
Considering both travel duration by modeand supermarket by cost yielded different sizes,shapes, and geographic locations of serviceareas (Figure 3). These in turn generateddifferent population estimates. Access to a high-cost supermarket was limited for all travelmodes, but fewer than 2% of persons invulnerable population groups lived beyonda 10-minute drive of a low- and medium-costsupermarket. Fewer than 8% lived beyonda 10-minute bus ride of these 2 types ofsupermarkets. Although fewer than 14% oflow-income persons lived beyond a 10-minutebicycling distance of a medium-cost supermar-ket, up to 37% could not bicycle to a low-cost supermarket. We observed a similarpattern in access by walking, but the popula-tions affected were substantially greater: up to75% of low-income individuals could not takea short walk to a medium-cost supermarket,and up to 97% were farther than 10 minutesby foot from a low-cost supermarket.
DISCUSSION
Eliminating food deserts has become a pri-ority issue in food policy at the nationallevel.2,3,9,10 To qualify for funding under theCommunity Foods Project Competitive GrantsProgram2 or the Healthy Food Financing Ini-tiative, communities must meet both criteria:low income and low access.3 Our resultsdemonstrated that estimates of populationsliving in food deserts depend on how thecriteria are defined and what measurementtechniques are employed.
Five different ways of identifying low-in-come populations yielded different group sizes.Median household income at less than 80% of
LOW-INCOME CRITERIA ACCESS CRITERIA
Vulnerable Population Physical Access Economic Access
All block groups in King County Baseline < 1 mile All supermarkets (SMs)
≥ 20% below poverty
≥ 40% below double poverty
≤ 80% median household
income
≥ 30% households with no car
10-min walk Low-cost SMs
10-min bicycle Medium-cost SMs
10-min bus High-cost SMs
10-min drive
≥ 20% below poverty +
≥ 30% households with no car
VULNERABLE POPULATIONS x SUPERMARKET SERVICE AREAS/
FOOD DESERTS
=VULNERABLE POPULATIONS LIVING IN FOOD DESERTS
FIGURE 1—Methodological grid to identify food deserts in Seattle–King County, Washington.
RESEARCH AND PRACTICE
e34 | Research and Practice | Peer Reviewed | Jiao et al. American Journal of Public Health | October 2012, Vol 102, No. 10
the county’s median income produced thelargest low-income sample: 36% of the countypopulation. This measure was selected bya study used by the New York City depart-ments of planning and health and mentalhygiene.40 When our measure was 40% of thepopulation at or below twice the poverty level2
and 20% of the population at or below thepoverty level,20,22 our low-income samples
were 11.7% and 9.2% of the county popula-tion, respectively. By contrast, defining a low-income group as persons living in census blockgroups in which 30% of the residents did nothave a car22 and more than 20% lived inpoverty yielded a low-income sample of a mere4% of the county population. Although na-tional data such as the 2003 to 2007 Ameri-can Time Use Survey showed that more than
90% of the US population drove to the grocerystore as either the driver or a passenger,2 lackof access to a car helped identify areas ofconcentrated poverty in New Orleans,22
Detroit,41 and Chicago.42
The geographic delineation of serviceareas offered a promising approach to mea-sure both physical and economic access toa supermarket.26 The technique helped as-sess the effects of street networks, mode oftransport, and supermarket food costs onestimating the size of populations livingwithin and outside of service areas. Alto-gether, our 20 supermarket service areas,combined with our 5 definitions of low-in-come groups, allowed for multiple ways ofestimating the extent of food deserts.
Including supermarket food affordability inthe definition of a food desert seemed essential,because vulnerable populations are a priorimore sensitive than the general population tofood costs. Physical proximity to a high-costsupermarket might not be experienced asaccess by a low-income household. Classifyingsupermarkets by food cost clearly changedthe identification of food deserts. As expected,low-income families were within easier reach ofa supermarket of any type than of a low-costone. Countywide, the low-income populationliving beyond 1 mile of a low-cost supermarketwas at least twice as large as that living beyond1 mile of any supermarket.
Driving and taking the bus to a supermarketallowed almost all of the vulnerable pop-ulations to reach a low- or medium-costsupermarket. However, when we restrictedsupermarket access to a 10-minute walk to thenearest low-cost supermarket, the food desertarea increased dramatically: more than 89% oflow-income individuals were beyond walkingdistance of low-cost supermarkets. This waslikely because stores offering low-cost foodslocated in lower-density areas with lowerland prices, allowing for large inexpensivebuildings and large parking areas.43 Medium-cost supermarkets were more accessible, be-cause they were more numerous and moreevenly distributed than either low- or high-costsupermarkets. Of the vulnerable populations25% to 48% were within walking distance ofa medium-cost supermarket.
The highest proportion of the county’spopulation living in a food desert was 29%;
FIGURE 2—Distribution of supermarkets by food cost in Seattle–King County, Washington.
RESEARCH AND PRACTICE
October 2012, Vol 102, No. 10 | American Journal of Public Health Jiao et al. | Peer Reviewed | Research and Practice | e35

we derived this figure from the measures ofthe population living in block groups witha median household income of less than 80%of the county’s median income and livingwithin a network distance of more than 1 milefrom any supermarket. Nationally, morethan 20% of low-income urban residents areestimated to live in food deserts, defined asplaces located more than 1 mile from theclosest supermarket2; almost 42% live within0.5 to 1 mile; and 38% within a half mileor less. In rural areas, almost 90% of low-income persons live within 10 miles of a super-market, almost 9% live within 10 to 20 miles,and about 2% more than 20 miles away.2
Other communities wanting to use our ap-proach should select among the criteria andmeasures listed in Figure 1. The use of medianhousehold income will identify the largestvulnerable population that will be at risk forresiding in a food desert. By contrast, definingthe low-income population as block groups inwhich 40% are below double the poverty levelwill target the populations with the lowestincome. Census data provide readily availableestimates of these populations.
Physical access and travel mode criteriadiffer by type of community. In general, bothcar ownership and driving distance should beincluded in food desert research.28,41 For
research focused on large cities, especiallythose with high rates of poverty and low ratesof car ownership, transit and walk accessgreatly matter.20,22,42,44 For research on ruralfood deserts, distance to food stores serves asa measure for driving time and costs.2,24 Thestreet network data we used are availablecommercially (Google Maps uses the samedata). Travel mode restrictions encoded inthese data help to estimate physical access bytravel mode. However, simple distance mea-sures can also define service areas aroundsupermarkets as long as they are weighted byestimates of travel mode impedances (0.5, 2,and 5 miles are commonly used as
TABLE 1—Vulnerable Populations and Food Deserts: Seattle–King County, Washington.
Travel Distance or Trip Time From Supermarket
Vulnerable Population, by Block Group 1 Mile, % 10-Min Walk, % 10-Min Bicycle Ride, % 10-Min Transit Ride, % 10-Min Drive, %
All supermarkets
Below poverty level, ‡ 20% 24 60 3 5 1
Below double the poverty level, ‡ 40% 27 65 4 5 1
Median income £ 80% of county median income 29 66 5 8 1
Households with no car, ‡ 30% 9 45 0 1 0
Below poverty level, ‡ 20% and ‡ 30% with no car 14 55 1 1 1
Total county populationa 44 78 11 16 2
Low-cost supermarkets
Below poverty level, ‡ 20% 72 90 37 6 2
Below double the poverty level, ‡ 40% 69 89 34 6 2
Median income £ 80% of county median income 69 90 29 8 2
Households with no car, ‡ 30% 81 95 34 1 0
Below poverty level, ‡ 20% and ‡ 30% with no car 82 97 36 1 1
Total county populationa 78 94 42 17 3
Medium-cost supermarkets
Below poverty level, ‡ 20% 42 69 8 5 1
Below double the poverty level, ‡ 40% 46 75 12 5 1
Median income £ 80% of county median income 46 74 14 8 2
Households with no car, ‡ 30% 26 52 1 1 0
Below poverty level, ‡ 20% and ‡ 30% with no car 31 61 2 1 1
Total county populationa 57 84 19 16 2
High-cost supermarkets
Below poverty level, ‡ 20% 79 97 51 27 26
Below double the poverty level, ‡ 40% 85 98 61 37 1
Median income £ 80% of county median income 85 96 67 39 37
Households with no car, ‡ 30% 58 91 23 6 5
Below poverty level, ‡ 20% and ‡ 30% with no car 64 96 23 8 8
Total county populationa 87 96 72 41 35
Note. Poverty level and car ownership data are from the 2000 US Census. The food establishment data were collected in 2008. The market basket data were collected between January and April2009.aWithin urban growth boundary.
RESEARCH AND PRACTICE
e36 | Research and Practice | Peer Reviewed | Jiao et al. American Journal of Public Health | October 2012, Vol 102, No. 10
approximate distances for a 10-minute walk,bicycle ride, and transit ride, respectively).45
Finally, economic access as captured bysupermarket food costs is best assessed throughmarket basket studies. These types of studieshave been undertaken in several areas, andfood cost information is readily availablefrom such studies or online for national andregional chains.6,46---48 However, food costs innonchain supermarkets and grocery stores aremore difficult to assess and may require pri-mary data collection. Survey or focus grouptechniques may be sufficient to establish rela-tive food cost by supermarket in specific areas.
Limitations
Our methodological innovations are gener-alizable to other communities. However, the
population estimates of food deserts and su-permarket access are limited to the conditionsin King County. For example, low-incomecommunities were more likely to live withina supermarket service area than was the countypopulation as a whole. This was true regardlessof the supermarket type and the mode oftravel, suggesting that King County supermar-kets tended to locate in areas with a denseand mixed-income population. By contrast,studies conducted in older US metropolitanareas showed that supermarkets had a lessuniform spatial distribution and appeared tolocate in higher-income areas.6
The calculation of transit and driving dis-tances did not capture the entire duration ofa door-to-door trip from home to a supermar-ket. Specifically, bus travel did not take into
account time spent walking to and waiting forthe bus or bus service frequency, which variesconsiderably among neighborhoods and be-tween weekdays and weekends. Our drivingmeasure was for the estimated shortest travelduration from home to a supermarket location,along drivable streets and within posted speedlimits. It did not consider delays caused bytraffic congestion. In addition, the time neededto walk to and park a car and to walk betweenthe parking lot and the store was not part ofthe travel duration measure. Finally, estimatedbicycle distances did not consider topographi-cal barriers. However, the 10-minute imped-ance for the delineation of service areas wasrelatively short. Adding 5 minutes to the trip toadjust for likely delays would not drasticallyalter our results, because a 15-minute trip
10-Minute Walking Baseline ≤ 1 Mile 10-Minute Riding Transit 10-Minute Driving
Service area
Waterbody
KC Urban Growth Boundary
0 2 4 8Miles
N N N N
N NN N
Low
-Co
st S
up
erm
ark
et
Hig
h-C
ost
Su
pe
rma
rke
t
Note. KC = King County.
FIGURE 3—Food deserts (black) and service areas (white) around low- and high-cost supermarkets defined as baseline (1 mile) and 10-minute
walking, riding transit, and driving network distances in Seattle–King County, Washington.
RESEARCH AND PRACTICE
October 2012, Vol 102, No. 10 | American Journal of Public Health Jiao et al. | Peer Reviewed | Research and Practice | e37
to a supermarket would remain a realisticestimate of convenient travel time for groceryshopping.
Block groups have limitations as spatial unitsof analysis. Our use of the proportion of theblock group area falling within a supermarketservice area as a way to distribute the populationin the service area assumed that the populationwas evenly distributed within the block group,which was not necessarily the case.
Our definition of supermarket ensured thatthe stores had a broad selection of products,including dry goods and fresh fruit and vege-tables. Although we measured the cost of thefood, we did not assess the quality of theproducts. The assumption that high-cost su-permarkets have fresher products than do low-cost stores needs further research. Finally,future studies might also consider stores thatsupply socially relevant foods for particularpopulations.44,49
Conclusions
We found that the identification of vulner-able populations living in food deserts is highlydependent on the definition and measurementof low-income status and of economic andphysical access to supermarkets. Although KingCounty’s low-income groups had good accessto a supermarket, their access to a low-costsupermarket was more limited. Access bytransit was satisfactory for travel duration toaffordable food, but this assumed that vulner-able populations’ time schedule for shoppingcoincided with bus service frequency in theirneighborhood. Having access to a car was thebest guarantee for the majority of the vulner-able populations to reach any supermarketwithin 10 minutes, making food shopping acar-dependent activity. When supermarket ac-cess was defined as pedestrian access to a low-cost supermarket, the area defined as a fooddesert dramatically increased. j
About the AuthorsJunfeng Jiao is with the Department of Urban Planning,College of Architecture and Urban Planning, Ball StateUniversity, Muncie, IN. Anne Vernez Moudon, JaredUlmer, and Philip M. Hurvitz are with the Department ofUrban Design and Planning, College of Built Environments,and Adam Drewnowski is with the Department of Epide-miology, School of Public Health, University of Washington,Seattle.Correspondence should be sent to Junfeng Jiao, PhD,
Assistant Professor, Department of Urban Planning,
College of Architecture and Planning, Ball State University,Muncie, IN 47306 (e-mail: [email protected]). Reprintscan be ordered at http://www.ajph.org by clicking the“Reprints” link.This article was accepted January 11, 2012.
ContributorsJ. Jiao developed the research design, finished the dataanalysis, and led the writing. A. V. Moudon helpedinterpret findings, write the article, and review drafts. J.Ulmer and P. M. Hurvitz assisted with the study and dataanalysis. A. Drewnowski helped write the article andreview drafts.
AcknowledgmentsThis work was supported by the National Institute ofDiabetes and Digestive and Kidney Diseases (grantR01DK076608 to the Food Environment, Diet Quality,and Disparities in Obesity project).
Human Participant ProtectionThe institutional review board of the University ofWashington approved the study.
References1. Treuhaft S, Karpyn A. The Grocery Gap: Who hasAccess to Healthy Food and Why It Matters. Oakland, CA:PolicyLink and Food Trust; 2010. Available at: http://www.policylink.org/atf/cf/97C6D565-BB43-406D-A6D5-ECA3BBF35AF0/FINALGroceryGap.pdf. Ac-cessed April 9, 2011.
2. US Department of Agriculture. Access to affordableand nutritious food: measuring and understanding fooddeserts and their consequences. 2009. Available at:http://www.ers.usda.gov/Publications/AP/AP036.Accessed April 11, 2011.
3. The White House. First Lady Michelle ObamaLaunches Let’s Move: America’s Move to Raise a HealthierGeneration of Kids. Washington, DC: Office of the FirstLady; 2010. Available at: http://www.whitehouse.gov/the-press-office/first-lady-michelle-obama-launches-lets-move-americas-move-raise-a-healthier-genera. AccessedApril 9, 2011.
4. Cummins S, Macintyre S. “Food deserts”—evidenceand assumption in health policy making. BMJ. 2002;325(7361):436---438.
5. Lang T, Caraher M. Access to healthy foods: part II.Food poverty and shopping deserts: what are the im-plications for health promotion policy and practice?Health Educ J. 1998;57(3):202---211.
6. Walker RE, Keane CR, Burke JG. Disparities and accessto healthy food in the United States: a review of food desertsliterature. Health Place. 2010;16(5):876---884.
7. Apparicio P, Cloutier M-S, Shearmur R. The case ofMontreal’s missing food deserts: evaluation of accessibil-ity to food supermarkets. Int J Health Geogr. 2007;6(4).
8. Coveney J, O’Dwyer LA. Effects of mobility andlocation on food access.Health Place. 2009;15(1):45---55.
9. Food, Conservation, and Energy Act of 2008, 110thCong, 2nd Sess, HR 6124, Title VII. Available at: http://www.gpo.gov/fdsys/pkg/BILLS-110hr6124eh/pdf/BILLS-110hr6124eh.pdf. Accessed April 12, 2011.
10. Whitacre PT, Tsai P. Janet Mulligan. The PublicHealth Effects of Food Deserts. Washington, DC: Food and
Nutrition Board; 2009. Available at: http://www.nap.edu/catalog.php?record_id=12623. Accessed April 9,2011.
11. Wrigley N. ‘Food deserts’ in British cities: policycontext and research priorities. Urban Stud. 2002;39(11):2029---2040.
12. Kowaleski-Jones L, Fan JX, Yamada I, Zick CD,Smith KR, Brown BB. Alternative measures of fooddeserts: fruitful options or empty cupboards? NationalPoverty Center working paper. 2009. Available at:http://www.npc.umich.edu/news/events/food-access/kowaleski-jones_et_al.pdf. Accessed April 9, 2011.
13. Powell LM, Auld MC, Chaloupka FJ, O’Malley PM,Johnston LD. Associations between access to food storesand adolescent body mass index. Am J Prev Med.2007;33(4 suppl):S301---S307.
14. Alwitt LF, Donley TD. Retail stores in poor urbanneighborhoods. J Consum Aff. 1997;31(1):139---164.
15. Blanchard T, Lyson T. Access to Low Cost Groceriesin Nonmetropolitan Counties: Large Retailers and theCreation of Food Deserts. Starkville: Mississippi StateUniversity---Southern Rural Development Center; 2006.Available at: http://srdc.msstate.edu/trainings/presentations_archive/2002/2002_blanchard.pdf.Accessed April 9, 2011.
16. Kaufman PR. Rural poor have less access tosupermarkets, large grocery stores. Rural Dev Perspect.1999;13(3):19---25.
17. Baker EA, Schootman M, Barnidge E, Kelly C. Therole of race and poverty in access to foods that enableindividuals to adhere to dietary guidelines. Prev ChronicDis. 2006;3(3):A76.
18. Bodor JN, Rose D, Farley TA, Swalm C, Scott SK.Neighbourhood fruit and vegetable availability and con-sumption: the role of small food stores in an urbanenvironment. Public Health Nutr. 2008;11(4):413---420.
19. Powell LM, Slater S, Mirtcheva D, Bao Y, ChaloupkaFJ. Food store availability and neighborhood characteristicsin the United States. Prev Med. 2007;44(3):189---195.
20. Sparks A, Bania N, Leete L. Finding food deserts:methodology and measurement of food access in Port-land, Oregon. Paper presented at: National PovertyCenter---US Department of Agriculture Economic Re-search Service conference, Understanding the EconomicConcepts and Characteristics of Food Access; February2009; Washington, DC. Available at: http://www.npc.umich.edu/news/events/food-access/sparks_et_al.pdf.Accessed April 9, 2011.
21. Morland K, Wing S, Diez Roux A, Poole C.Neighborhood characteristics associated with the locationof food stores and food service places. Am J Prev Med.2002;22(1):23---29.
22. Rose D, Bodor JN, Swalm CM, Rice JC, Farley TA,Hutchinson PL. Deserts in New Orleans? Illustrations ofurban food access and implications for policy. Paperpresented at: National Poverty Center---US Departmentof Agriculture Economic Research Service conference,Understanding the Economic Concepts and Characteris-tics of Food Access; February 2009; Washington, DC.Available at: http://www.npc.umich.edu/news/events/food-access/rose_et_al.pdf. Accessed April 9, 2011.
23. Berg N, Murdoch J. Access to grocery stores inDallas. Int J Behav Healthc Res. 2008;1(1):22---37.
24. Sharkey JR, Horel S. Neighborhood socioeconomicdeprivation and minority composition are associated with
RESEARCH AND PRACTICE
e38 | Research and Practice | Peer Reviewed | Jiao et al. American Journal of Public Health | October 2012, Vol 102, No. 10
better potential spatial access to the ground-truthed foodenvironment in a large rural area. J Nutr. 2008;138(3):620---627.
25. Algert SJ, Agrawal A, Lewis DS. Disparities in accessto fresh produce in low-income neighborhoods in LosAngeles. Am J Prev Med. 2006;30(5):365---370.
26. Larsen K, Gilliland J. Mapping the evolution of ‘fooddeserts’ in a Canadian city: supermarket accessibilityin London, Ontario, 1961---2005. Int J Health Geogr.2008;7:16.
27. O’Dwyer LA, Coveney J. Scoping supermarketavailability and accessibility by socio-economic status inAdelaide. Health Promot J Austr. 2006;17(3):240---246.
28. Smoyer-Tomic KE, Spence JC, Amrhein C. Fooddeserts in the prairies? Supermarket accessibility andneighborhood need in Edmonton, Canada. Prof Geogr.2006;58(3):307---326.
29. Pearson T, Russell J, Campbell MJ, Barker ME. Do‘food deserts’ influence fruit and vegetable consumption?A cross-sectional study. Appetite. 2005;45(2):195---197.
30. Chung C, Myers SL. Do the poor pay more for food?An analysis of grocery store availability and food pricedisparities. J Consum Aff. 1999;33(2):276---296.
31. Andrews M, Kantor LS, Lino M, Ripplinger D. UsingUSDA’s Thrifty Food Plan To Assess Food Availabilityand Affordability. Food Access. 2001;24(2):45---53.
32. MacDonald JM, Nelson PE Jr. Do the poor still paymore? Food price variations in large metropolitan areas.J Urban Econ. 1991;30(3):344---359.
33. US Bureau of the Census. Direct file access, 2000census. Available at: http://www.census.gov/main/www/access.html. Accessed April 12, 2011.
34. Mahmud NK, Monsivais P, Drewnowski A. TheSearch for Affordable Nutrient Rich Foods: A Comparisonof Supermarket Food Prices in Seattle---King County. Seat-tle, WA: Center for Public Health Nutrition; 2009.Available at: http://depts.washington.edu/uwcphn/reports/cphnbrf2.pdf. Accessed April 9, 2011.
35. Monsivais P, Drewnowski A. The rising cost of low-energy-density foods. J Am Diet Assoc. 2007;107(12):2071---2076.
36. Monsivais P, Drewnowski A. Lower energy-densitydiets are associated with higher monetary costs perkilocalorie and are consumed by women of highersocioeconomic status. J Am Diet Assoc. 2009;109(5):814---822.
37. Jiao J, Moudon AV, Drewnowski A. Grocery shop-ping: how individuals and built environments influencechoice of travel mode. Transp Res Rec. 2011; 2230:85---95.
38. Sharkey JR, Horel S. Characteristics of potentialspatial access to a variety of fruits and vegetables ina large rural area. Paper presented at: National PovertyCenter---US Department of Agriculture Economic Re-search Service conference, Understanding the EconomicConcepts and Characteristics of Food Access; February2009; Washington, DC. Available at: http://www.npc.umich.edu/news/events/food-access/sharkey.pdf.Accessed April 9, 2011.
39. Lee C, Moudon AV. Correlates of walking fortransportation or recreation purposes. J Phys Act Health.2006;3(suppl 1):S77---S98.
40. Smith L, Goranson C, Bryon J, Kerker B, Nonas C.Developing a supermarket need index. In: Maantay J,McLafferty S, eds. Geospatial Analysis of Environmental
Health. Dordrecht, Netherlands: Springer; 2011:205---221.
41. Zenk SN, Schulz AJ, Israel BA, James SA, Bao S,Wilson ML. Neighborhood racial composition, neigh-borhood poverty, and the spatial accessibility of super-markets in metropolitan Detroit. Am J Public Health.2005;95(4):660---667.
42. Gallagher, M. Examining the Impact of Food Desertson Public Health in Chicago. Chicago, IL: Mari GallagherResearch and Consulting Group; 2006. Available at:http://www.marigallagher.com/site_media/dynamic/project_files/Chicago_Food_Desert_Report.pdf.Accessed December 19, 2011.
43. Dunkley B, Helling A, Sawicki DS. Accessibilityversus scale: examining the tradeoffs in grocery stores.J Plann Educ Res. 2004;23(4):387---401.
44. Raja S, Ma C, Yadav P. Beyond food deserts:measuring and mapping racial disparities in neighbor-hood food environments. J Plann Educ Res. 2008;27(4):469---482.
45. Bossard E, Hobbs J, Hondorp B, et al. EnvisioningNeighborhoods With Transit-Oriented Development Poten-tial. Washington, DC: US Department of Transportation;2002. Report FHWA/CA/OR-2001-25. Available at:http://transweb.sjsu.edu/MTIportal/research/publications/documents/01-15.pdf. Accessed December19, 2011.
46. Beaulac J, Kristjansson E, Cummins S. A systematicreview of food deserts, 1966---2007. Prev Chronic Dis.2009;6(3):A105.
47. Anderson AS, Dewar J, Marshall D, et al. Thedevelopment of a healthy eating indicator shoppingbasket tool (HEISB) for use in food access studies—identification of key food items. Public Health Nutr.2007;10(12):1440---1447.
48. Kelly B, Flood VM, Yeatman H. Measuring localfood environments: an overview of available methodsand measures. Health Place. 2011;17(6):1284---1293.
49. Wang MC, Kim S, Gonzalez AA, MacLeod KE,Winkleby MA. Socioeconomic and food-related physicalcharacteristics of the neighbourhood environment areassociated with body mass index. J Epidemiol CommunityHealth. 2007;61(6):491---498.
RESEARCH AND PRACTICE
October 2012, Vol 102, No. 10 | American Journal of Public Health Jiao et al. | Peer Reviewed | Research and Practice | e39

Copyright of American Journal of Public Health is the property of American Public Health Association and its
content may not be copied or emailed to multiple sites or posted to a listserv without the copyright holder's
express written permission. However, users may print, download, or email articles for individual use.
Copyright © 2022 FDOKUMEN