How the right B2B SaaS and subscription metrics tools ...
22
How the right B2B SaaS and subscription metrics tools accelerate growth and attract investors
-
Upload
khangminh22 -
Category
Documents
-
view
5 -
download
0
Transcript of How the right B2B SaaS and subscription metrics tools ...

How the right B2B SaaS and subscription metrics tools accelerate growth and attract investors

Table of contentsSUMMARYThe right, real-time metrics drive SaaS and subscription business growth 1
SECTION ONEKey SaaS metrics to position for long-term growth and attract investors 2
Nine key SaaS and subscription metrics to understand business health 3
Attracting investors: Key financial metrics for early stage and series A funding 7
Attracting investors: Key financial metrics for series B funding 8
SECTION TWO How the right tools for SaaS and subscription business reporting and metrics propel growth
and attract investors 9
Why spreadsheets are a formula for failure 9
The solution: A modern, purpose-built SaaS and subscription reporting and metrics too 10
SECTION THREE How Baker Tilly Digital SaaS Intelligence delivers granular insights to propel growth and
attract investors 11
How Baker Tilly SaaS Intelligence provides richer metrics and powers deeper insights 11
The Baker Tilly SaaS Intelligence difference —The power of granular insights 13
Case study: Quest Analytics relies on SaaS Intelligence to automate subscription KPIs 16
Baker Tilly SaaS Intelligence: The right SaaS and subscription metrics at the right time 18
REFERENCES 19 ABOUT BAKER TILLY DIGITAL 20

The right, real-time metrics drive SaaS and subscription business growth
– It’s been more than 20 years since Salesforce first launched their CRM, and today it stands as one of the largest SaaS companies in the world. In that time, the SaaS model has become ubiquitous.
– Despite incredible market growth, many SaaS and subscription startups fail for financial reasons, such as funding issues, operational reasons or market fit.
– Many of these challenges are addressable: with automated, real-time access to the right metrics, SaaS and subscription businesses can identify issues and course correct, taking advantage of opportunities, and compete for investors’ dollars.
– In this whitepaper, we explore what metrics early, Series A, and Series B startups should track; the challenges that come with relying on spreadsheets, and the solution: a purpose-built reporting and metrics tool that provides deep, granular insights.
According to the market research firm Valuates,1 the global SaaS market size is projected to reach $307.3 billion by 2026. Despite the disruption of a global pandemic, or perhaps because of it, the SaaS market continues to grow, spurred in part by the rapid, global shift to a geographically distributed workforce. A McKinsey Global Survey2 of approximately 900 C-level executives indicates that the pandemic accelerated the adoption of digitized products and services by six years. Further, enterprise SaaS is proving particularly resilient: as a recent McAfee3 survey showed that the average enterprise employee uses 36 different apps.
Still, SaaS and subscription startups face discouraging odds, with many of them failing. Leaders need to ask themselves, why do so many fail, or fail to thrive? Some of the reasons include:
– Leadership – Organizational structure – Culture – Financial factors – Operational failures
Operational failures are typically the result of product-market fit, undercapitalization, lack of cash runway visibility, unprofitable unit economics, a leaky bucket of recurring revenue, inability to pivot or lack of awareness that pivoting is necessary.
To succeed, SaaS and subscription businesses need real-time, reliable intelligence about their financial and operational health. Unfortunately, this critical information often lives in different systems, and it is not easy to aggregate. To get a clear understanding of where they stand and to better communicate that positioning to potential investors, businesses must first identify what metrics they need, pull the relevant data, compile, calculate and analyze it. It is a time-consuming process that often results in delayed, error-prone information. The dynamic nature and rapid growth trajectory of SaaS and subscription businesses further complicates matters; the metrics a very early-stage startup needs may be quite different from what is needed in later stages. However, it doesn’t have to be this way.
$307.3BGlobal SaaS market by 2026
6Years of accelerated
adoption
36 Average number of apps
employees use
@BakerTillyUS Baker Tilly US faas.bakertilly.com1

The annual and monthly recurring revenue that is the driving force behind B2B SaaS and subscription-based businesses presents a unique set of challenges, particularly in the early and growth stages. While recurring revenue is integral to long-term financial health, early and growth stage businesses must establish cash flow and recapture startup and operational costs at a time when they may still be determining product market fit. Businesses in this stage may not fully comprehend the total cost of acquiring new customers, what it takes to keep them or the impact of losing them. Financial metrics can help, and many businesses rightly focus a fair amount of time manually capturing and parsing these metrics. However, this necessary process can be greatly simplified with the right SaaS reporting tools and dashboards.
The right financial metrics can provide critical insights into organizational health, help businesses optimize their sales and marketing and ultimately position them for long-term growth. Further, investors are more likely to be attracted to businesses that have a deep understanding of their financial growth metrics and can present them in a clear, concise way. Even if the numbers are not wholly positive, by illuminating the drivers behind them, challenges become more actionable, businesses can pivot and the transparency helps build the confidence of, and trust with, potential investors.
One of the primary challenges many SaaS and subscription businesses face is determining what metrics to track. While all B2B SaaS and subscription businesses are different, there are a handful of key metrics that most can benefit from to optimize performance, propel growth and attract investors.
Section One:Using key SaaS metrics to position for long-term growth and attract investors
By using the right automated tools that integrate with their financial software stack and other third-party systems, SaaS and subscription businesses can get real-time access to a broad range of objective, accurate key metrics and granular insights tailored to their specific stage and needs—without the manual effort. These metrics indicate financial and operational health, illuminate performance trends and the drivers behind them and inform proactive decision-making. Further, the metrics are essential to attracting the investors needed to extend the financial runway, help scale and report out to existing investors.
The first section of this paper will explore nine key metrics that SaaS and subscription businesses need in order to understand product-market fit and customer behavior, make sound financial decisions, position themselves for long-term growth and attract investors. Then we take a deeper dive into what key metrics and KPIs investors are looking for from early stage, Series A, and Series B SaaS and subscription businesses.
In the second section of this paper, we explore challenges that SaaS and subscription business face in accessing their data, especially if they are reliant on spreadsheets (e.g., Microsoft Excel or Google Sheets) as their “database.” Then, we demonstrate how a purpose-built SaaS reporting and metrics tool can streamline access to objective data. We also recommend key features and functionality that SaaS and subscription businesses should look for when evaluating this type of tool: real-time access, process automation, reliability and granular insights.
The final section will examine how SaaS Intelligence, a real-time, automated intelligence tool built atop Sage Intacct financial management platform, can help SaaS and subscription businesses access the critical data they need to propel long-term growth and attract investors. We also look closely at how the broad set of key metrics and deep, granular insights available with automated tools, such as SaaS Intelligence, can support SaaS and subscription businesses from their earliest stages through steady, consistent growth.
@BakerTillyUS Baker Tilly US faas.bakertilly.com2

Nine key SaaS and subscription metrics to understand business healthSaaS and subscription business metrics are nuanced and can have slightly different meanings depending on context. Before we dive into what key metrics, specifically, investors are looking for from early- and growth-stage SaaS and subscription businesses, we thought it might be helpful to level set. The following is a brief glossary in which we identify nine key metrics that are critical for businesses to track to make informed decisions and attract investors. The list includes the metrics captured in Bessemer Venture Partner’s Six Cs of Cloud Finance,4 a widely cited, well-curated and valuable list of key metrics, but for the purposes of this paper, we have included a handful of other metrics that we find particularly relevant.
1. Committed Annual Recuring Revenue (CARR) and Committed Monthly Recurring Revenue (CMRR)
All SaaS and subscription businesses should be tracking annual recurring revenue (ARR) and monthly recurring revenue (CMRR). CMRR can be an indicator of that steady, predictable growth that investors are seeking. However, an equally powerful metric, and one that is more granular, and therefore tells a more comprehensive story about financial health, is committed annual recurring revenue (CARR). CARR and CMRR are calculated by combining current recurring revenue with future recurring revenue from committed new bookings and contracted expansion (commitments to purchase your product), then subtracting known future contraction and churn. These key SaaS and subscription metrics help businesses and investors determine whether churn is cutting into CARR or CMRR, and if so, to what degree.
Calculating CARR and CMRR:
[New logo CARR (incl. signed but not live CARR) + upsell CARR (incl. signed but not live CARR)- churned CARR (incl. projected churned) - downsell CARR (incl. projected downsell)]
CMRR = CARR/12
CARR percent growth rate benchmarks
Good Better Best
Series A/B: 50-100% 100-200% 200%+
Series C+: 50% 50-100% 100%+
Source4
2. Customer Acquisition Cost (CAC) and CAC Payback
CAC is the marketing and sales costs associated with the acquisition of a new customer. When calculating CAC, SaaS and subscription businesses should consider the cost of marketing staff and programs, advertising, free trials, sales staff and effort put into closing sales. This key SaaS and subscription metric helps businesses and investors understand whether growth is dependent on high marketing and sales spend and where that spend lies. Tracking CAC provides visibility into the cost-effectiveness of your sales and marketing spend and helps you measure the efficacy of your go-to-market strategy.
CAC Payback period extends the value of tracking CAC by placing a spotlight on the time it takes to recoup the cost of acquiring a customer. In essence, it provides a time horizon (in months) for when the average customer has generated enough revenue to overcome the initial acquisition investment and will move to generating profit.
@BakerTillyUS Baker Tilly US faas.bakertilly.com3

Calculating CAC payback (months):
Prior period sales and marketing expense/ [(quarterly net new CMRR) x gross margin]
CAC payback (number months) benchmarks
Good Better Best
SMB: 12 6-12 <6
Mid-market: 18 9-18 <9
Enterprise: 24 12-24 <12
Source4
3. Customer Lifetime Value (CLTV)
CLTV is the total amount of profit a SaaS or subscription business can earn from a customer throughout the lifetime of the relationship. This key SaaS and subscription metric is important to businesses and investors because it demonstrates how much a customer contributes towards the organization’s revenue or profitability, more accurately over their lifetime. CLTV can also be explored by cohort—subsets of customers that share similar characteristics like tenure, demographics, industry vertical or product line. Exploring CLTV by cohort helps businesses determine which customer segments are most valuable.
Calculating CLTV:
Customer Lifetime = 1/(1 – Customer Retention Rate)
Customer Lifetime Value = Customer Lifetime x average revenue per customer x profit margin
Source4
4. CLTV-to-CAC ratio
The CLTV-to-CAC ratio reflects the relationship between CAC, the cost of acquiring a customer, and CLTV, the lifetime value of that customer. If CAC is high, then CLTV will correspondingly need to be high to cover the cost of acquisition. A CLTV:CAC ratio of 1x implies that you are spending too much on acquisition and will be fortunate to break even. Less than 1x means that the revenue generated by customers in their lifetime will not cover the cost to acquire them—the business model is broken. You should be aiming for a 3-5x, which represents the industry standard for a good-to-great ratio. While greater than 5x is exceptional, it may also indicate that a business is underinvesting in sales and marketing spend and could be holding back your potential for higher growth momentum.
This key SaaS and subscription metric helps businesses and investors determine an appropriate CAC threshold—how much it makes sense to spend on CAC to effectively calibrate profitability and growth.
Calculating CLTV-to-CAC:
[Customer Lifetime Value / Customer Acquisition Cost]
CLTV / CAC benchmarks
Good Better Best
3x 3-5x 5x+
Source6
@BakerTillyUS Baker Tilly US faas.bakertilly.com4

5. Churn: Logo Churn, Gross Revenue Churn and Net Revenue Churn
For the purposes of this paper, we will look at a few different types of churn: Logo Churn, (often called Customer Churn), Gross Revenue Churn, and Net Revenue Churn. Logo Churn is about customers: it is the percentage of customers a business loses in a given period of time, either because they cancel their service or do not renew their contract. Logo Churn is important to businesses and investors as an indicator of product-market fit and customer success and because it impacts cash flow.
There is a fair amount of nuance around the timing of recording Logo Churn. Some customers cannot churn because of the terms of their contract but have indicated intent to churn, while others may appear to have churned when they are simply late to renew. Still others may churn and return within a short period of time. Beyond that, customers churn for a variety of reasons, some which you control (ex: dissatisfaction with services) and others you may not (ex: customer bankruptcy). These reasons are a critical data point in identifying and remediating operational challenges resulting in churn. All of these situations can lead to complexity in understanding how and when to track churn in order to most effectively address underlying issues spurring this behavior.
Gross and Net Revenue Churn are about dollars. Gross Revenue Churn shows how much recurring revenue is lost on existing customers in a given time period due to contraction resulting from customers dropping subscriptions, downgrading their service, price decreases (or increased discounts) on existing subscriptions and churn. Net Revenue Churn is gross churn (lost revenue) minus the recurring revenue gained via expansion on existing customers through subscription activities such as addons, upsells, cross-sells and price uplifts. Businesses and investors keep a keen eye on Net Revenue Churn to determine if a company is effective in mitigating the effects of gross churn. Ideally, the rate of expansion should outpace the rate of contraction.
Calculating Gross Revenue Churn:
Calculating Gross Revenue Churn(- downsell CARR - churned CARR) / starting CARR
Gross Churn percent benchmarks
Good Better Best
SMB: 20-30% 15-20% <15%
Mid-market: 20% 10-20% <10%
Enterprise: 15% 10-15% <10%
Source4
Calculating Net Revenue Churn:
Calculating Net Revenue Churn(upsell CARR - downsell CARR- churned CARR) / starting CARR
Net Churn percent benchmarks
Good Better Best
SMB: 10-20% 0-10% <0%
Mid-market: 0-10% -10-0% -10%+
Enterprise: -10% -10-20% -20%+
Source4
6. Cash flow
Managing cash flow is critical for SaaS and subscription businesses that are trying to pay for up-front investments and capital expenditures, cover monthly operating costs and reinvest in the business. Rapid growth only makes this more challenging—the dollars needed for growth can extend the length of time it takes to become profitable. Cash flow is a key metric for SaaS and subscription businesses to determine how long it will be before the company is profitable and how long their runway is (how many months before they run out of cash). The length of a cash runway plays an important role in determining when to seek the next round of funding.
@BakerTillyUS Baker Tilly US faas.bakertilly.com5

Calculating cash flow:
Calculating cash flow:[Earnings before interest and tax x (1 – tax rate)]+ depreciation and amortization- change in net working capital- capital expenditures+ non-cash charges
Calculating cash flow margin:Cash flow / revenue
Cash flow margin benchmarks
Good Better Best
-50-0% Breakeven CF+
Source4
7. Cash Conversion Score (CCS)
CCS is a relatively new metric, one that Bessemer Venture Partners has identified as important, particularly in later funding rounds. As SaaS and subscription businesses grow, investors want to know that a company has a solid track record of yielding a return on previously invested capital—they want to know future invested dollars will be well spent. CCS is the ratio of CARR to total capital raised to date, including both equity and debt, minus the cash on the balance sheet. Investors look to this metric to better determine potential ROI as well as readiness for investment—if a company is operationally sound enough to put future capital to good use.
Calculating CCS:
CARR / (Capital raised to date – cash)
Cash conversion score benchmarks
Good Better Best
0.25-0.5x 0.5-1x 1x+
Source4
8. Gross margin
Gross margin reflects how much revenue is left after the costs of generating that revenue have been deducted: SaaS and subscription businesses are known for higher gross margins relative to other types of businesses. As businesses begin to grow, investors will be looking to understand current gross margins and what gross margins might be achievable in the future.
Calculating gross margin:
(Total revenue – cost of goods sold)/ total revenue
Gross margin percent benchmarks
Good Better Best
75% 75%-85% 85%+
Source7
@BakerTillyUS Baker Tilly US faas.bakertilly.com6

9. Gross Dollar Retention and Net Dollar Retention
Gross Dollar Retention is measured over a specific period of time. It reflects the percentage of recurring revenue that is retained from existing customers at the end of a given time period, as calculated by taking the starting recurring revenue for the period minus any contraction or churn. Net Dollar Retention is similar, but it includes the benefit of expansion revenue to offset losses. Both metrics are tracked on a percentage basis with Gross Dollar Retention having a maximum value of 100%, since only losses are incorporated in the metric.
If you did not have any contraction or churn, you would have retained 100% of the dollars (revenue) from your existing customer base. Generally, Net Dollar Retention should be greater than 100%, indicating that your organization is able to expand on existing customers at a rate that outpaces losses. Investors look for high Net Dollar Retention as a primary indicator of product-market fit, customer stickiness and an effective monetization strategy.
Calculating Gross Dollar Retention:(Starting CARR– downsell CARR– churned CARR/ starting CARR)x 100
Gross Dollar Retention benchmarks
Good Better Best
70-80% 80-90% 90-100%
Source5
Calculating Net Dollar Retention:(Starting CARR – upsell CARR – downsell CARR– churned CARR/ starting CARR)x 100
Net Dollar Retention benchmarks
Good Better Best
100-110% 110%-120% 120%+
Source5
Attracting investors: Key financial metrics for early stage and series A funding
SaaS and subscription businesses in the early stage are often still trying to find their footing. They may still be determining product-market fit and may not have gained robust market traction. In addition, their financial tracking may not be fully mature. At this stage, investors are asking broader questions: Is there a market for this product? Can the company grow or is it beginning to grow? They may look to metrics like CARR and CMRR growth as an indicator of market fit and to determine if that growth is steady and predictable (or at least has the potential to be). Cash flow is a critical metric at every stage, but early-stage companies face particular challenges as they seek to cover startup and operating expenses at a time when they have very few customers. Investors may pay close attention to operational issues that drain cash flow and whether the company can cost-effectively attract enough customers to help sustain it.
@BakerTillyUS Baker Tilly US faas.bakertilly.com7

While these early metrics remain important as SaaS and subscription businesses move into Series A, investors begin to dig deeper in a broader set of metrics. They may look at CAC to better understand the cost of acquiring new customers, what types of activities are driving that spend, and how high-touch those activities are (as high-touch activities like personal interaction can be more costly or challenging at scale). They may look closely at churn to determine how long customers are staying, if the customer lifetime is long enough to cover CAC payback, whether they are renewing, and what the potential impact of their behavior is on cash flow. They may also begin to look at gross margin to understand whether the business model has potential for levels of profitably that meet their expectations.
Attracting investors: Key financial metrics for series B fundingWhen SaaS and subscription businesses begin to grow and are well into Series B, they have validated product-market fit, and investor dollars are now focused on growing revenue engines. At this stage, investors begin to ask additional, more detailed questions that tell them more about the viability of those revenue engines. They are looking for early indicators for when they will become profitable, and just how profitable they might be. Is the company growing, and if so, how quickly? Can it scale in a rapid and predictable way?
And also, why is the company growing? What are the primary drivers and can those levers be adjusted to accelerate growth? At this stage, some of the more telling metrics include gross margin; CLTV-to-CAC ratio; customer, gross and net revenue churn; and gross and net dollar retention.
Gross margins are increasingly important at this stage, and investors may want to know what gross margins are achievable. For more mature businesses, they may also look to whether gross margins have improved over time. Improving margins may indicate increasing operational efficiencies and economies of scale that translate to increased revenue per customer. Digging deeper, they may want to understand the drivers behind gross margins to determine its overall health. For instance, subscriptions should be driving greater gross margins than related professional services.
The CLTV-to-CAC ratio is another important metric at this stage, as the business has matured enough to start producing consistent trends that can be used to predict future behavior. Investors will want to understand not just how much it costs to acquire a customer, but also whether a business is spending too much relative to the CLTV, and whether those costs can be brought into alignment in the short or long term. If the business has an extremely high CLTV-to-CAC, they may want to explore further investing in sales and marketing to accelerate growth and leverage first-mover or fast-mover advantages.
Additionally, churn becomes ever more important at this stage. Investors will want to dig deeper into the financial impact of churn, possibly expecting to explore logo, net, and gross churn by customer or product cohort. Investors at this stage will also have a keen eye on net churn as an indicator of the organization’s ability to plug the leaky bucket.
At this stage, investors are increasingly looking at gross and net dollar retention as key metrics to indicate revenue retention, monetization and potential profitability. Since it is generally costlier to acquire new customers versus retain existing ones, high dollar retention can help keep gross margins up. High Net Dollar Retention (100%+) has the added benefit of reducing the burden on the sales organization to hit recurring revenue growth goals by generating excess revenue from the existing customer base. This means that new customer acquisition sales are additive to the CARR bucket, as opposed to recuperative. Recent analyses have shown a strong correlation between a company’s Net Dollar Retention and their Enterprise Value to CARR multiple garnered at time of investment.
In addition to these metrics, this is the point at which CCS may become relevant to some investors. They may be interested in understanding the ROI of previous influxes of capital as an indicator that a company is prepared to make sound use of a future one.
@BakerTillyUS Baker Tilly US faas.bakertilly.com8

Section Two:How the right tools for SaaS and subscription business reporting and metrics propel growth and attract investors
For SaaS and subscription companies, capturing, categorizing, calculating and analyzing objective financial and operational metrics is an essential methodology for determining the health of the business, establishing efficiencies, identifying issues and opportunities, and driving predictable growth. These objective metrics are used as quantitative KPIs, enabling unbiased analysis, informed decision-making, and organizational alignment around specific key results. These essential KPIs are critical to attracting new investors and providing reporting to existing ones.
However, accessing even the most basic, industry-standard metrics can be challenging due to both bandwidth and logistical constraints, especially for the many businesses still relying on spreadsheets. In this section, we will explore the challenges SaaS and subscription businesses face in trying to use spreadsheets to capture and analyze data. Then we will introduce the alternative—a modern, purpose-built SaaS and subscription reporting and metrics tool—and explore what to look for when selecting one.
Why spreadsheets are a formula for failureMany SaaS and subscription businesses begin their customer subscription management and metric tracking with Microsoft Excel or another spreadsheet tool, either relying on readily available templates or building their own. While Excel and other spreadsheets are unquestionably valuable tools for specific financial and accounting tasks, as SaaS and subscription businesses scale, they rapidly outgrow them. For all but the earliest startups, manually capturing, calculating and analyzing data in spreadsheets is simply too time- consuming, laborious, error-prone and complex.
SaaS and subscription businesses face many common challenges when using spreadsheets for reporting on key metrics. Spreadsheets are:
– Time-consuming and delayed: Pulling data from disparate systems, manually entering it into spreadsheets, running the appropriate calculations and analyzing the resultant raw data is time consuming. Because this process is laborious, many businesses cannot prioritize it to the degree they should, and they miss out on valuable insights that hinder their growth. Those that do invest the necessary time may find the information that the insights are derived from is weeks or months old—perhaps even too outdated to be useful.
– Error-prone and unreliable: Spreadsheets present a host of opportunities for error, starting with manual data entry and multiple formulas in hundreds of cells that do not carry over or break with the slightest change. Further, when multiple people need to work in a single spreadsheet at the same time, they often create duplicates, which inevitably leads to version control issues. Strategic blunders arise from erroneous data, placing crucial business objectives, investments opportunities, and even professional careers at risk.
– Static and lacking scalability: As SaaS and subscription businesses scale, their needs evolve—the key metrics essential to an early start up may be different from what a growth-stage company is seeking. Spreadsheets are static and built with specific formulas to perform a defined set of functions—they do not evolve the way your business needs do. There is also a functional barrier to scaling spreadsheets. As data sets grow, the spreadsheets used to track them become increasingly cumbersome and unstable —they simply were not intended for data sets at scale.
@BakerTillyUS Baker Tilly US faas.bakertilly.com9

The solution: A modern, purpose-built SaaS and subscription reporting and metrics tool
– Broad and lacking detail: For SaaS and subscription businesses, data can unlock critical information about the health of the organization, identify opportunities, and support data-driven decision-making, but only if they can efficiently access and analyze that data. Spreadsheets are limiting—because of their complexity, it’s hard to identify patterns that might elucidate meaningful trends, either positive or negative. Sure, there is a lot of information, but information is not the same thing as insight. Spreadsheets lack the necessary details to deeply analyze subscription activity and uncover the underlying drivers of recurring revenue growth. Templatized spreadsheets barely scratch the surface of tracking subscription activity by providing only the broadest of categories like expansion or contraction, making it difficult to interpret or expose the real drivers of those outcomes.
If Excel and other spreadsheet applications are not the answer, then what is? SaaS and subscription businesses would be well-served by investing early in a modern, purpose-built reporting and metrics tool that is fully integrated with their accounting software stack and other critical business systems. The tool should be able to capture, categorize, calculate and analyze data from these systems without manual entry or other human intervention. It should also support reporting on a comprehensive set of SaaS and subscription analytics that will serve businesses over their lifetime, from the earliest seed stages through growth, private equity or even IPO.
Following are four key characteristics to look for in a modern, purpose-built SaaS and subscription reporting and metrics tool:
– Real-time data: It is imperative that SaaS and subscription businesses are able to access in-depth data in real time so they can understand and respond to trends as they are emerging and evolving, rather than catching up weeks, months or quarters later as a result of cumbersome, manual processes. Real-time data limits risk by enabling businesses to identify and respond to issues before they become critical and allows them to take advantage of positive trends. Being able to react quickly and efficiently to trends, both positive and negative, has downstream impact on cash management and may enable early- and growth-stage businesses to extend their runway at a critical time in their growth and development.
– Automation: As SaaS and subscription businesses scale, so does the volume of data related to customer and subscription activity. Very rapidly, the volume of data reaches the point at which it would be nearly impossible to capture, calculate and interpret the intricacies and nuances in a manual fashion. SaaS and subscription businesses benefit from an intelligence engine running in the background that can automatically categorize and analyze the behavior and activity of both new and existing customers as it is happening.
– Reliability: SaaS and subscription businesses cannot afford to make decisions based on erroneous or outdated data, nor can they lean on it to attract new investors or provide transparency to their existing ones. They require a reliable system that integrates with their accounting software stack and other critical business systems. The tool should automate the process of assessing, categorizing, calculating and analyzing data from these systems without manual entry or other human intervention in order to minimize the potential for errors.
– Granular insights: The right SaaS and subscription reporting and metrics tool should not only be able to categorize data and analyze activity by various cohorts (e.g., customers by size/region/industry/tenure, or products by family/manager/dev team), but it should also be able to deliver detailed insights far deeper than broad categories such as expansion and contraction.Ideally, it should be able to expose the activities that drive and/or result in expansion and contraction within each cohort, such as addons, price changes (uplifts and markdowns), downgrades and de-books to existing customers.
@BakerTillyUS Baker Tilly US faas.bakertilly.com10

How Baker Tilly Digital SaaS Intelligence provides richer metrics and powers deeper insightsBaker Tilly Digital SaaS Intelligence leverages Sage Intacct’s innovative general ledger as well as built-in and user-defined dimensions to add analytical depth to SaaS metrics. With this additional layer of information, businesses can segment and analyze data by customer and product cohorts, as well as analyze the behavior patterns of individual customers, products, legal entities, or other specified dimensions.
Baker Tilly Digital SaaS Intelligence is the only SaaS and subscription reporting and metrics tool that tracks trends across both the Sage Intacct Contracts and Order Entry subledgers at the same time. This means transactions can seamlessly flow back and forth through the Sage Intacct Contracts module—typically for sales team-driven bookings managed and synchronized from a CRM system like Salesforce—while simultaneously supporting orders flowing into the Order Entry module from an external billing system or e-commerce site. SaaS Intelligence is able to see subscription details across disparate modules, weave the data together, and interpret it holistically, in order to provide a complete picture of customer subscription activity.
Baker Tilly Digital SaaS Intelligence is an automated SaaS and subscription metrics tracking solution specifically designed for SaaS and subscription businesses. Built on Sage Intacct, a cloud-based SaaS accounting software platform for SaaS and subscription companies, SaaS Intelligence delivers insights into crucial industry metrics to augment Sage Intacct’s already powerful GAAP financial capabilities. SaaS Intelligence leverages Baker Tilly’s proprietary intelligence engine to automatically interpret and categorize customer subscription activity in real time as accounting transactions flow through Sage Intacct—without manual user involvement—generating an assortment of reports, graphs and critical KPIs that are immediately available at your fingertips.
Section Three:How Baker Tilly Digital SaaS Intelligence delivers granular insights in real time
@BakerTillyUS Baker Tilly US faas.bakertilly.com11

The synergy between Baker Tilly Digital SaaS Intelligence and Sage Intacct also:
– Empowers users with direct drill-down capabilities from the metrics presented on the SaaS Intelligence dashboards to their underlying subledger transactions for ease of research and auditability
– Leverages native Sage Intacct reporting features to provide limitless user-generation of custom KPIs, performance cards, reports, graphs and dashboards suited to the organizations specific reporting needs
– Enables users to build custom dashboards and reports that blend key Sage Intacct GAAP financial reporting with the SaaS and subscription metrics available in SaaS Intelligence to provide an accurate, holistic view of the financial health of the organization
– Directly accesses live financial and statistical information from Sage Intacct and integrated applications to provide real-time data for vital metrics like customer acquisition cost, gross margin, revenue per employee and cash burn that are all reliant on up-to- date core financial system data such as expenditures by department, employee headcount, bank balances and cash spend
@BakerTillyUS Baker Tilly US faas.bakertilly.com12

In addition to providing a comprehensive set of industry-standard SaaS and subscription business metrics, Baker Tilly Digital SaaS Intelligence offers an unparalleled set of deep, granular insights. Among them are detailed CMRR analysis around expansion and contraction, renewal and retention and available-to-renew forecasting.
SaaS Intelligence also provides tight controls over churn and supports in-depth cohort analysis, so businesses can segment customers and products based on characteristics like tenure, demographics, industry vertical or product line, and explore subscription activity behavior based on those factors.
– Dashboards for key SaaS and subscription metrics: Baker Tilly Digital SaaS Intelligence is equipped with a set of dashboards that provides real-time data and deep insights on a comprehensive set of key SaaS metrics focused on distinct areas of the business: growth, retention, unit economics, cash and audit. Each of these dashboards includes a unique analysis of subscription activity and business—highlighting the most important metrics and trends within each applicable view. The application boasts dozens of KPIs available at a glance, including several of the metrics we outlined earlier in this paper, as well as a comprehensive set of additional, crucial metrics, such as:
The Baker Tilly Digital SaaS Intelligence difference - the power of granular insights
— Total CMRR— Total CARR— Total Bookings— Total Contract Value— Average New Deal CMRR— Customer Acquisition Cost (CAC)— CAC Payback in Months— Customer Lifetime Value (LTV)— LTV:CAC Ratio— Customer Retention Cost (CRC)— Customer Retention Rate— Customer Renewal Rate— Customer Churn (% up for renewal)— Total Customer Churn (% of total)— Gross Dollar Retention Rate
— Net Dollar Retention Rate— Gross CMRR Churn— Net CMRR Churn— Gross CMRR Renewal Rate— Net CMRR Renewal Rate— Net CMRR Growth Rate— Rule of 40— SaaS Quick Ratio— Cash Conversion Score— Gross Burn Rate— Net Burn Rate— Runway (Months)— Total Billings— Days Sales Outstanding (DSO)
SaaS Intelligence dashboard example
@BakerTillyUS Baker Tilly US faas.bakertilly.com13
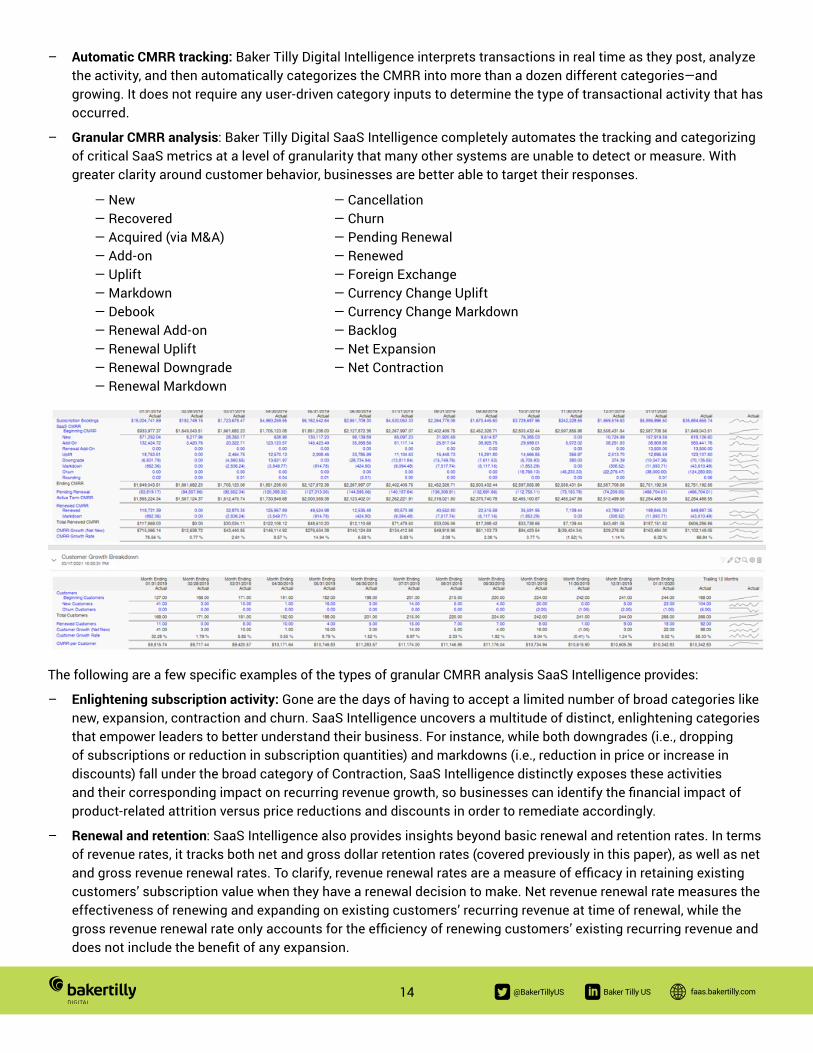
– Automatic CMRR tracking: Baker Tilly Digital Intelligence interprets transactions in real time as they post, analyze the activity, and then automatically categorizes the CMRR into more than a dozen different categories—and growing. It does not require any user-driven category inputs to determine the type of transactional activity that has occurred.
– Granular CMRR analysis: Baker Tilly Digital SaaS Intelligence completely automates the tracking and categorizing of critical SaaS metrics at a level of granularity that many other systems are unable to detect or measure. With greater clarity around customer behavior, businesses are better able to target their responses.
— New— Recovered— Acquired (via M&A)— Add-on— Uplift— Markdown— Debook— Renewal Add-on— Renewal Uplift— Renewal Downgrade— Renewal Markdown
— Cancellation— Churn— Pending Renewal— Renewed— Foreign Exchange— Currency Change Uplift— Currency Change Markdown— Backlog— Net Expansion— Net Contraction
The following are a few specific examples of the types of granular CMRR analysis SaaS Intelligence provides:
– Enlightening subscription activity: Gone are the days of having to accept a limited number of broad categories like new, expansion, contraction and churn. SaaS Intelligence uncovers a multitude of distinct, enlightening categories that empower leaders to better understand their business. For instance, while both downgrades (i.e., dropping of subscriptions or reduction in subscription quantities) and markdowns (i.e., reduction in price or increase in discounts) fall under the broad category of Contraction, SaaS Intelligence distinctly exposes these activities and their corresponding impact on recurring revenue growth, so businesses can identify the financial impact of product-related attrition versus price reductions and discounts in order to remediate accordingly.
– Renewal and retention: SaaS Intelligence also provides insights beyond basic renewal and retention rates. In terms of revenue rates, it tracks both net and gross dollar retention rates (covered previously in this paper), as well as net and gross revenue renewal rates. To clarify, revenue renewal rates are a measure of efficacy in retaining existing customers’ subscription value when they have a renewal decision to make. Net revenue renewal rate measures the effectiveness of renewing and expanding on existing customers’ recurring revenue at time of renewal, while the gross revenue renewal rate only accounts for the efficiency of renewing customers’ existing recurring revenue and does not include the benefit of any expansion.
@BakerTillyUS Baker Tilly US faas.bakertilly.com14

– In terms of customer (logo) rates, SaaS Intelligence tracks both customer retention rate and customer renewal rate. The application differentiates between these rates based on tracking the renewal and attrition decisions of bound and unbound customers (i.e., customers who are bound by contracts and cannot leave, versus and those who are no longer bound by a contract and have a decision to make whether to renew or churn).
– Available-to-renew forecast: SaaS Intelligence tracks the renewal timing of existing CMRR value so businesses can accurately forecast renewals of recurring revenue and coordinate appropriately with customer success and/or renewals teams. This forecasting enables visibility into the CMRR value related to specific customers and their associated products that will be coming up for renewal.
– Control over churn: Customers are sometimes delayed in signing their renewals, SaaS Intelligence does not immediately churn customers at the end of their subscription term. Instead, it isolates those at-risk customers and their related recurring revenue, making the late renewal status of customers apparent by shining a spotlight on it. This allows businesses to identify potential churn without making a premature decision around it and empowers users in Sage Intacct with visibility into late renewal statuses without having to venture out into other applications (like a CRM system). As a result, businesses can appropriately and proactively address late renewals versus actual customer churn.
Further, SaaS Intelligence maintains a configurable “auto-churn” feature that will automatically churn a customer after a pre- defined number of days of no renewal activity. This enables organizations to adhere to specific business policies related to churn and ensure that inactive customers do not get overlooked and remain as active recurring revenue indefinitely.
– Cohort Analysis: Without the proper SaaS and subscription business reporting and metrics tools, understanding of customers wants, needs and behaviors is limited—they can only be understood as a single, homogenous subscription base. In reality, a customer base is typically comprised of many cohorts, smaller subsets of customers or products grouped by similar features and characteristics like tenure, demographics (SMB, midmarket, enterprise), industry vertical, or product line/family.
SaaS Intelligence enables businesses to analyze behavior by cohort, at a level of granularity that goes undetected and unmeasured by other reporting and metrics tools and would be impossible in a spreadsheet. Granular cohort analysis informs decisions and actions that enable businesses to better acquire and onboard new customers; maintain, upsell and cross-sell existing customers; manage through customer inflection points such as renewals; address the unique needs of companies at all growth stages; and refine product offerings.
@BakerTillyUS Baker Tilly US faas.bakertilly.com15

Case study: Quest Analytics relies on SaaS Intelligence to automate subscription KPIs
Background Quest Analytics is is a technology company dedicated to improving healthcare provider network management and, in turn, helping people across America receive the information and care they deserve. Their Provider Network Management platform brings trust, transparency, and confidence in the process of measuring, managing and monitoring provider networks. Quest Analytics partners with both providers and healthcare organizations to address two significant issues facing the healthcare industry today: accessible networks and accurate provider directories.
A paradigm shift As the company moved more of its products and services to the cloud, it became clear that Quest Analytics should be measuring itself against subscription business model metrics and evaluating its business as a SaaS company. Upgrading their financials from QuickBooks and spreadsheets was a major step in that direction and the company chose Sage Intacct over NetSuite. Sage Intacct’s subscription billing and contract management capabilities and its native integration with Salesforce made it the best solution for the organization.
Quest Analytics originally looked at Sage Intacct’s Digital Board Book application as a SaaS and subscription metrics tracking solution but ultimately selected SaaS Intelligence to provide those KPIs. Baker Tilly Digital’s SaaS Intelligence is built on the Sage Intacct development platform, so it sits natively inside Sage Intacct, and it automatically categorizes transactions in real time using a sophisticated intelligence engine, providing metrics that are automatic, reliable and insightful.
Sam Robertson, Corporate Controller at Quest Analytics, stated the company has had to shift recently and Baker Tilly Digital has played a part in that transformation.
“As we moved more of our solutions to the cloud, we knew we needed to think in terms of more complex multi-year, multi-element contracts, and that managing those
contracts with QuickBooks and spreadsheets wasn’t going to work long term.”
“The company has been in business since 2003 and had historically been a desktop software provider,” says Robertson. “As we moved more of our solutions to the cloud, we knew we needed to think in terms of more complex multi-year, multi-element contracts, and that managing those contracts with QuickBooks and spreadsheets wasn’t going to work long term.” Robertson knew they needed an ERP system, Sage Intacct, that could manage their increasingly complex billing and revenue recognition requirements, while also automating the tracking of crucial SaaS KPIs for the organization. And for this, he turned to SaaS Intelligence.
According to Robertson, the implementation of SaaS Intelligence was straightforward. The product team, led by Baker Tilly Digital’s Head of SaaS Vertical, Chris Price, helped Robertson understand exactly how the metrics were being calculated. “The team was super responsive and always provided me with a lot of detail whenever I had questions,” says Robertson. “The product works exactly as it was sold to us.”
@BakerTillyUS Baker Tilly US faas.bakertilly.com16

“When you keep everything in Excel and split your data by year, it can make trailing twelve-month analysis difficult and it’s less likely that you’ll discover actionable insights and trends. With [Baker Tilly’s] SaaS Intelligence, we can do that kind of analysis easily.”
'Spreadsheets aren’t systems’ “Spreadsheets aren’t systems,” he says, explaining that it’s too easy to make manual interventions, judgement calls, and even mistakes when you’re using spreadsheets, making it difficult to trust the data and even more difficult to surface insights about the business.
“When you keep everything in Excel and split your data by year, it can make trailing 12-month analysis difficult and it’s less likely that you’ll discover actionable insights and trends,” says Robertson. “With [Baker Tilly Digital’s] SaaS Intelligence, we can do that kind of analysis easily.”
Baker Tilly Digital's SaaS Intelligence automatically identifies different SaaS metrics scenarios to provide an accurate representation of customer subscription activity and the impact on ARR or CMRR. The application’s intelligent engine can distinguish between different factors driving changes in CMRR, removing the need for manual intervention or additional analysis of transactions, giving finance teams a single source of the truth.
“We found ourselves often saying ‘What does the spreadsheet say?’ and then‘But what does SaaS Intelligence say?’ and that process has taught us a lot about
our assumptions and our policies around SaaS metrics.”
Surfacing both insights and process and data gaps According to Robertson, SaaS Intelligence has become a check on previous policies to make sure that KPIs are being calculated properly. “We found ourselves often saying ‘What does the spreadsheet say?’ and then ‘But what does SaaS Intelligence say?’ and that process has taught us a lot about our assumptions and our policies around SaaS metrics,” says Robertson. “It gives you the flexibility to look at things differently, to challenge your assumptions, and to look at true KPIs. It spurs conversations we didn’t use to have around things like Customer Acquisition Cost (CAC) and Customer Lifetime Value (CLTV).”
“Going in front of the Executive Team to present these metrics is spurring conversations about where to focus our efforts. Having these insights that are actionable
and strategic come out of the finance department is really cool.”
Transforming finance and accounting into a strategic asset Robertson is having these conversations at the executive team level and SaaS Intelligence is helping him communicate these key metrics.
“Going in front of the executive team to present these metrics is spurring conversations about where to focus our efforts,” says Robertson. “Having these insights that are actionable and strategic come out of the finance department is really cool,” he adds.
@BakerTillyUS Baker Tilly US faas.bakertilly.com17

The SaaS and subscription business ecosystem is incredibly complex and fast paced. Success depends on identifying the right key financial metrics and KPIs for each specific situation and stage of growth, then having streamlined, real-time access to those metrics so that businesses can manage cash flow and finances, make informed business decisions, pivot as needed, and attract investors. And since SaaS and subscription businesses are incredibly dynamic, it is essential to have a toolset that will grow and evolve along with the business. A modern, purpose-built, SaaS and subscription reporting and metrics tool like Baker Tilly Digital’s SaaS Intelligence that sits on top of a financial platform like Sage Intacct to deliver key metrics and granular insights can make all the difference.
SaaS Intelligence enables businesses to analyze behavior by cohort, at a level of granularity that goes undetected and unmeasured by other reporting and metrics tools and would be impossible in a spreadsheet. Granular cohort analysis informs decisions and actions that enable businesses to better acquire and onboard new customers; maintain, upsell and cross-sell existing customers; manage through customer inflection points such as renewals; address the unique needs of companies at all growth stages; and refine product offerings.
Baker Tilly Digital Intelligence: the right tool at the right time
Contact usPlease contact Baker Tilly Digital with questions or for guidance if you are interested in learning more about how our SaaS Intelligence can help propel the growth of your SaaS or subscription business.
@BakerTillyUS Baker Tilly US faas.bakertilly.com18
References1. “COVID-19 Impact on Global Software as a Service (SaaS) Market Size, Status and Forecast 2020-2026” Valuates Reports,
https://reports.valuates.com/market-reports/QYRE-Othe-1G311/covid-19-impact-on-global-software-as-a-service
2. “How COVID-19 has pushed companies over the technology tipping point—and transformed business forever” McKinsey https://www.mckinsey.com/business-functions/strategy-and-corporate-finance/our-insights/how-covid-19-has-pushed-companies-over-the-technology-tipping-point-and-transformed-business-forever
3. “Cloud Adoption and Risk Report” McAfee https://www.mcafee.com/enterprise/en-us/assets/reports/restricted/rp-cloud-adoption-risk.pdf
4. “State of the Cloud 2020: Cloud macro trends, growth strategies for founders, 2020 predictions, and why we believe the future is forged in the cloud” Byron Deeter, Elliott Robinson, Hansae Catlett, Mary D’Onofrio, Bessemer Venture Partners https://www.bvp.com/atlas/state-of-the-cloud-2020
5. “110% net dollar retention is the benchmark” Blossom Street Ventures https://blossomstreetventures.com/2019/09/10/110-net-dollar-retention-is-the-benchmark
6. “How to Calculate the LTV:CAC Ratio for Your SaaS Business” Medium https://medium.com/corl/how-to-calculate-lifetime-value-customer-acquisition-cost-ratio-for-your-saas-business-332510188726
7. “The Impact of Gross Margin on SaaS Valuations” Software Equity Group https://softwareequity.com/the-impact-of-gross-margin-on-saas-valuations/
@BakerTillyUS Baker Tilly US faas.bakertilly.com19

@BakerTillyUS Baker Tilly US faas.bakertilly.com
The information provided here is of a general nature and is not intended to address the specific circumstances of any individual or entity. In specific circumstances, the services of a professional should be sought. Tax information, if any, contained in this communication was not intended or written to be used by any person for the purpose of avoiding penalties, nor should such information be construed as an opinion upon which any person may rely. The intended recipients of this communication and any attachments are not subject to any limitation on the disclosure of the tax treatment or tax structure of any transaction or matter that is the subject of this communication and any attachments. Baker Tilly US, LLP, trading as Baker Tilly, is a member of the global network of Baker Tilly International Ltd., the members of which are separate and independent legal entities. © 2022 Baker Tilly US, LLP
About Baker Tilly DigitalBaker Tilly Digital combines strategic industry insight and advanced technical expertise to uncover and solve your digital transformation challenges, providing informed perspectives and working with you to deliver your optimized future state.