How many forms of perseveration? Evidence from cancellation tasks in right hemisphere patients
16
How many forms of perseveration? Evidence from cancellation tasks in right hemisphere patients Martina Gandola a,1,n , Alessio Toraldo a,1 , Paola Invernizzi b , Laura Corrado c , Maurizio Sberna d , Ignazio Santilli e , Gabriella Bottini a,c , Eraldo Paulesu b,f a Department of Brain and Behavioural Sciences, University of Pavia, Piazza Botta 11, Pavia 27100, Italy b Department of Psychology, University of Milano-Bicocca, Milano, Italy c Cognitive Neuropsychology Centre, Niguarda Ca' Granda Hospital, Milano, Italy d Neuroradiology Department, Niguarda Ca' Granda Hospital, Milano, Italy e Neurology Department, Niguarda Ca' Granda Hospital, Milano, Italy f IRCCS Galeazzi, Milano, Italy article info Article history: Received 1 June 2013 Received in revised form 23 September 2013 Accepted 28 October 2013 Available online 4 November 2013 Keywords: Neglect Perseveration Lesion mapping Disengagement of attention Directional hypokinesia Motor disinhibition abstract Neglect patients' performance during cancellation tasks is characterized by left sided omissions and, in many cases, by the production of inappropriate material of various kinds in the ipsilesional space, e.g. additional marks over already cancelled targets, marks drawn away from targets, scribbles, irrelevant drawings. It is unclear whether these behaviours, which have collectively been called perseverative, are functionally and anatomically connected and whether they correlate with the severity of neglect. Here we report a retrospective study on 33 right brain damaged patients with neglect after right hemisphere lesions in whom we measured the intensity of perseveration of the three following kinds: (1) ‘additional marks' (AM) perseveration where patients cancelled a target with two or more well separated marks; (2) ‘scribble’ perseveration, where patients, instead of cancelling the target with a single pen stroke as required by the task, performed multiple pen strokes without breaking the pen-to-paper contact, with the final product being a scribble; (3) ‘flying marks’ (FM) perseveration where patients produced cancellation marks well away from the targets. We found that AM and FM perseveration correlated with neglect severity, while ‘scribble’ perseveration did not. The lesion-symptom mapping showed three separate anatomical areas in the right hemisphere: ‘scribble’ perseveration was associated with lesions of the orbitofrontal cortex and caudate nucleus; AM perseveration was associated with damage to the rolandic operculum, superior temporal gyrus and inferior frontal gyrus; FM perseveration was associated with damage to the dorsal premotor cortex and the temporal pole. Neglect severity followed damage to a region which grossly corresponds to the sum of the regions associated with AM and FM perseveration respectively. This complex behavioural and anatomical pattern is interpreted in terms of a three-factor model, in which AM perseveration is caused by a deficit of disengagement of attention from the right side (also causing omissions), FM perseveration is caused by directional hypokinesia (also causing left-side omissions), and ‘scribble’ perseveration is the consequence of a failure to inhibit an initiated motor act, which is completely separate (both anatomically and functionally) from the disorder inducing omissions. & 2013 Elsevier Ltd. All rights reserved. 1. Introduction Perseveration has been historically defined as ‘any continuation or recurrence of experience or activity without the appropriate stimulus’ (Sandson & Albert, 1984, p. 715). This pathological behaviour can emerge in different cognitive domains (e.g. visual, motor, sensory, or verbal perseveration; Allison & Hurwitz, 1967; Critchley, 1964; Kinsbourne & Warrington, 1963; Yamadori, 1981) and can be observed in a number of neurological or psychiatric disorders (Cohen & Dehaene, 1998; Luria, 1965). In this paper we will focus on those forms of motor perseveration elicited by the Contents lists available at ScienceDirect journal homepage: www.elsevier.com/locate/neuropsychologia Neuropsychologia 0028-3932/$ - see front matter & 2013 Elsevier Ltd. All rights reserved. http://dx.doi.org/10.1016/j.neuropsychologia.2013.10.023 Abbreviations: AM, additional marks; FM, flying marks; CoC, centre of cancellation; DD, double dissociation; SD, simple dissociation; SIQR, semi interquartile range; GzLM, generalized linear model; MGzLM, mixed generalized linear model; VLSM, voxel-based symptom-lesion mapping; HTP, horizontal target position; STG, superior temporal gyrus; MTG, middle temporal gyrus; IFG, inferior frontal gyrus; IPL, inferior parietal lobule; SSTM, spatial short-term memory; FWE, family-wise error correction; MNI, Montreal Neurological Institute n Corresponding author. Tel.: þ39 382986375; fax: þ39 382986272. E-mail addresses: [email protected], [email protected] (M. Gandola). 1 M. Gandola and A. Toraldo contributed equally to the authorship of this paper. Neuropsychologia 51 (2013) 2960–2975
Transcript of How many forms of perseveration? Evidence from cancellation tasks in right hemisphere patients

How many forms of perseveration? Evidence from cancellation tasksin right hemisphere patients
Martina Gandola a,1,n, Alessio Toraldo a,1, Paola Invernizzi b, Laura Corrado c,Maurizio Sberna d, Ignazio Santilli e, Gabriella Bottini a,c, Eraldo Paulesu b,f
a Department of Brain and Behavioural Sciences, University of Pavia, Piazza Botta 11, Pavia 27100, Italyb Department of Psychology, University of Milano-Bicocca, Milano, Italyc Cognitive Neuropsychology Centre, Niguarda Ca' Granda Hospital, Milano, Italyd Neuroradiology Department, Niguarda Ca' Granda Hospital, Milano, Italye Neurology Department, Niguarda Ca' Granda Hospital, Milano, Italyf IRCCS Galeazzi, Milano, Italy
a r t i c l e i n f o
Article history:Received 1 June 2013Received in revised form23 September 2013Accepted 28 October 2013Available online 4 November 2013
Keywords:NeglectPerseverationLesion mappingDisengagement of attentionDirectional hypokinesiaMotor disinhibition
a b s t r a c t
Neglect patients' performance during cancellation tasks is characterized by left sided omissions and,in many cases, by the production of inappropriate material of various kinds in the ipsilesional space,e.g. additional marks over already cancelled targets, marks drawn away from targets, scribbles, irrelevantdrawings. It is unclear whether these behaviours, which have collectively been called perseverative, arefunctionally and anatomically connected and whether they correlate with the severity of neglect. Herewe report a retrospective study on 33 right brain damaged patients with neglect after right hemispherelesions in whom we measured the intensity of perseveration of the three following kinds: (1) ‘additionalmarks' (AM) perseveration where patients cancelled a target with two or more well separated marks;(2) ‘scribble’ perseveration, where patients, instead of cancelling the target with a single pen stroke asrequired by the task, performed multiple pen strokes without breaking the pen-to-paper contact, withthe final product being a scribble; (3) ‘flying marks’ (FM) perseveration where patients producedcancellation marks well away from the targets. We found that AM and FM perseveration correlated withneglect severity, while ‘scribble’ perseveration did not. The lesion-symptom mapping showed threeseparate anatomical areas in the right hemisphere: ‘scribble’ perseveration was associated with lesions ofthe orbitofrontal cortex and caudate nucleus; AM perseveration was associated with damage to therolandic operculum, superior temporal gyrus and inferior frontal gyrus; FM perseveration was associatedwith damage to the dorsal premotor cortex and the temporal pole. Neglect severity followed damage to aregion which grossly corresponds to the sum of the regions associated with AM and FM perseverationrespectively. This complex behavioural and anatomical pattern is interpreted in terms of a three-factormodel, in which AM perseveration is caused by a deficit of disengagement of attention from the rightside (also causing omissions), FM perseveration is caused by directional hypokinesia (also causingleft-side omissions), and ‘scribble’ perseveration is the consequence of a failure to inhibit an initiatedmotor act, which is completely separate (both anatomically and functionally) from the disorder inducingomissions.
& 2013 Elsevier Ltd. All rights reserved.
1. Introduction
Perseveration has been historically defined as ‘any continuationor recurrence of experience or activity without the appropriatestimulus’ (Sandson & Albert, 1984, p. 715). This pathologicalbehaviour can emerge in different cognitive domains (e.g. visual,motor, sensory, or verbal perseveration; Allison & Hurwitz, 1967;Critchley, 1964; Kinsbourne & Warrington, 1963; Yamadori, 1981)and can be observed in a number of neurological or psychiatricdisorders (Cohen & Dehaene, 1998; Luria, 1965). In this paper wewill focus on those forms of motor perseveration elicited by the
Contents lists available at ScienceDirect
journal homepage: www.elsevier.com/locate/neuropsychologia
Neuropsychologia
0028-3932/$ - see front matter & 2013 Elsevier Ltd. All rights reserved.http://dx.doi.org/10.1016/j.neuropsychologia.2013.10.023
Abbreviations: AM, additional marks; FM, flying marks; CoC, centre of cancellation;DD, double dissociation; SD, simple dissociation; SIQR, semi interquartile range; GzLM,generalized linear model; MGzLM, mixed generalized linear model; VLSM, voxel-basedsymptom-lesion mapping; HTP, horizontal target position; STG, superior temporalgyrus; MTG, middle temporal gyrus; IFG, inferior frontal gyrus; IPL, inferior parietallobule; SSTM, spatial short-term memory; FWE, family-wise error correction; MNI,Montreal Neurological Institute
n Corresponding author. Tel.: þ39 382986375; fax: þ39 382986272.E-mail addresses: [email protected], [email protected]
(M. Gandola).1 M. Gandola and A. Toraldo contributed equally to the authorship of this paper.
Neuropsychologia 51 (2013) 2960–2975

cancellation tasks used to diagnose unilateral visual neglect in rightbrain-damaged patients (from now on, the word perseveration – initalics – will refer to these particular forms). Consider e.g. the Albert(1973) line cancellation task, in which patients are presented with apaper-sheet with 40 pre-drawn lines. The patient holds a pen in hisipsilesional hand and is instructed to cross out each line with asingle pen stroke. Patients with brain damage can show a widevariety of behaviours, which we exemplified in five main categories,illustrated in Fig. 1 [(i) to (v)]. The five categories are: (i) the beha-viour of cancelling a target with multiple, separate marks; (ii)performing multiple back-and-forth or circular movements ofthe pen-tip, without interrupting the pen-to-paper contact,hence producing scribbles or even inkblots; (iii) drawing cancel-lation marks that lie outside the target; (iv) drawing extra-targets and crossing them out; (v) drawing irrelevant graphicmaterial—e.g. spontaneous drawings (such as the goose in Fig. 1(v) of the present paper, or the incomplete hen in Fig. 4B, patient#4, Rusconi, Maravita, Bottini, & Vallar, 2002), the patient'ssignature, or anything that is clearly not a proper cancella-tion mark. These phenomena have been labelled in differentways in different taxonomies. On a first taxonomy, Na et al.(1999) called the aforementioned class (i) ‘Type I’ perseveration,and class (iv) ‘Type II’ perseveration. A similar classification, butwith a different terminology, was introduced by Rusconi et al.(2002). They labelled (i) ‘simple’ perseverations, and (iv) and (v)‘complex’ perseverations. Rusconi et al. (2002) noticed thatcategory (i) might be an example of what Sandson and Albert(1984, 1987) call ‘recurrent perseveration’. Vallar, Zilli, Gandola,and Bottini (2006) assumed (i), (iv), and (v) to express progres-sively more severe forms of perseveration, and proposed scoresranging from 1 to 4 as a continuous measure (Fig. 1). Toraldoet al. (2005) introduced the distinction between (i) and (ii),naming category (ii) ‘inkblots’, and proposing that form (ii) couldbe reminiscent of the ‘continuous’ type of perseverationdescribed by Sandson and Albert (1984, 1987). They also thor-oughly discussed category (iii), which they named ‘flying marks’.
In the present paper, we will provide unambiguous referenceto each of the five behavioural categories by calling type (i)‘additional marks’ (AM), (ii) ‘scribble’; (iii) ‘flying marks’ (FM), (iv)
and (v) ‘complex’ perseverations.2 Note that for some categories[especially (iii), (iv) and (v)], the presence of an action that is beinginappropriately repeated is far from obvious, so the use of the term‘perseveration’ is debatable; we decided to use it anyway becausethose phenomena are now widely known under that label.
The first aim of our work was to use the above categories tomeasure perseveration in a set of neglect patients performing acancellation task. While all agree that there is a strong statisticalassociation between the presence of neglect and the presence ofperseveration on cancellations tasks (e.g. Rusconi et al., 2002,reported perseveration in 88% neglect patients and in only 12%of right hemisphere patients without neglect), there is muchdebate in the literature about whether, and why, the severity ofperseveration in such tasks correlates with the severity of neglect(Kleinman, DuBois, Newhart, & Hillis, 2013; Pia, Folegatti,Guagliardo, Genero, & Gindri, 2009; Ronchi, Posteraro, Fortis,Bricolo, & Vallar, 2009; Vallar et al., 2006). Hence we tried to shedlight over the problem by learning whether the correlationbetween perseveration severity and neglect severity depends onthe particular type of perseveration being measured.
Some studies report such a correlation (e.g. Na et al., 1999; Nys,van Zandvoort, van der Worp, Kappelle, & de Haan, 2006), someothers do not (e.g. Pia et al., 2009; Ronchi, Algeri, Chiapella, Spada,& Vallar, 2012; Ronchi et al., 2009; Rusconi et al., 2002; but seeToraldo et al., 2005, for a discussion of score use artefacts). Ronchiet al. (2012) proposed that the two disorders might be functionallyindependent. Support to this idea was provided by the authors,who could show that the same experimental manipulation—theuse of letters versus stars as targets, influenced neglect andperseveration severity in opposite ways (omissions were morefrequent with letters than with stars, and perseverations showedthe opposite profile). Moreover, studies that investigated the
Fig. 1. Retrospective perseveration taxonomies. Different varieties of perseverative behaviour in cancellation are shown in separate images, and the labels given to them bydifferent authors are shown below the images. ‘?’ indicates cases where the categorization (if any) by the authors was not fully specified. The goose in panel (v) is taken fromBottini, Bisiach, Sterzi, and Vallar (2002).
2 We avoided to use some of the terms from previous taxonomies (e.g. Type-I,or ‘simple’, etc.) because it is often unclear to which of the five categories weidentified the labels apply. For instance, Na et al. (1999) and Rusconi et al. (2002)observed clear examples of (ii) (patient 48 in Na et al., 1999; patient 4 in Rusconiet al., 2002) and did not specify if, and in which of their categories those behaviourswere classified.
M. Gandola et al. / Neuropsychologia 51 (2013) 2960–2975 2961

effects of prism adaptation (Nys, Seurinck, & Dijkerman, 2008) andmonocular patching (Khurshid, Longin, Crucian, & Barrett, 2009)showed that both techniques ameliorated only neglect, whileperseveration increased or remained unchanged. Nonetheless,other authors have proposed that neglect and perseverations mightfrequently co-occur for specific functional reasons. For instance,Bottini & Toraldo (2003) showed that, in some cases, perseverationis modulated by the presence/absence of left-sided targets (but seePia et al., 2009), and reasoned that perseveration on the right sidemight be the effect of implicit processing of contralesionalneglected targets, either because they are misperceived as locatedon the right side (visual allochiria) or because of a failure in theprogramming leftward movements (Bottini & Toraldo, 2003;Manly, Woldt, Watson, & Warburton, 2002; Toraldo et al., 2005);Posner, Walker, Friedrich, and Rafal (1984) proposed that a failureto disengage visuo-spatial attention from the right side wouldcause both neglect of left-sided targets, and perseveration whilecancelling right-sided targets (see also Kim et al., 2009).
To a deeper analysis, the two perspectives—that neglect andperseveration reflect separate functional deficits, and that neglectand perseveration are functionally associated, are not in contra-diction. It might well be that neglect and perseveration share someprocesses, and do not share some other processes, which arespecific of one of the two. Thus the evidence for separate under-lying deficit (e.g. Khurshid et al., 2009; Nys et al., 2008; Ronchiet al., 2012) does not falsify the hypothesis that some otherprocesses are shared by both neglect and perseveration (seeSections 6 and 6.2.2, for further remarks).
This is the integrated and multi-componential perspectivetaken in this paper, tested on both behavioural and anatomicaldata. A confirmation of discrete anatomical correlates for specificforms of perseveration and their possible association with neglectseverity would be useful at this stage and would make theintegrated multi-componential perspective stronger. While thereare reports on the role of the right frontal, subcortical (basalganglia), insular regions in perseveration (Na et al., 1999; Nys et al.,2006; Pia et al., 2009; Rusconi et al., 2002), these anatomo-clinicalassociations were proposed without distinguishing between thedifferent types of perseveration.
We are aware that richer classifications of perseveration thanthe one proposed here are possible, e.g., by video-recording themovements made by the patient while s/he cancels the targets, asKim et al. (2009) recently did in three single-case studies. Theauthors could distinguish between two different kinds of ‘addi-tional marks’ perseverative behaviours: in one case a patient‘repeatedly marked through a target with consecutive but spatiallydistant strokes before moving to the next target’ (consecutivemotor perseveration); in another case a patient ‘moved from acancelled target to another target and then returned to cancel apreviously cancelled target again’ (return motor perseveration,p. 122; Kleinman et al., 2013, called them ‘re-markings’ and ‘re-visits’ respectively). However, since the present study is retro-spective (as virtually all studies in the field so far) we could notconsider the order in which the targets were marked, and focusedon the final products of cancellation performance.
2. Materials and methods
2.1. Patients
We retrospectively selected 33 cases from a continuous series of patients whohad been admitted at the Neurological Ward of the Niguarda Ca’ Granda Hospital inMilano. Selection criteria were: (i) evidence of a single, vascular lesion confined to theright hemisphere, as assessed by inspection of CT scans (which were obtained anaverage of 125.2 h post-stroke, SIQR¼90); (ii) no history or evidence of previouscerebrovascular disease or psychiatric disorders; (iii) evidence of neglect (a left–right
difference of at least two omissions) either on a modified version of the Albert linecancellation task (Albert, 1973) or, when available, on a modified version of the Dillerletter cancellation task (Diller & Weinberg, 1977); see Section 2.2 below for furtherdetails. The demographic and clinical data of the 33 patients are reported in Table 1.The patients’ mean age and education were 68.8 (range: 39–86, SD: 10) and 6.8(range: 0–14, SD: 3.6). All patients gave their informed consent to participate in thestudy, which has been performed in accordance with the ethical standards laid downin the Declaration of Helsinki and approved by the Local Ethical Committee of theNiguarda Ca’ Granda Hospital in Milano. As a standard procedure, all patientsunderwent an evaluation that included a neurological examination and a neuropsy-chological assessment (see Table 1).
2.2. Visual neglect
In our modified Albert line cancellation task, forty black lines (25 mm long and2 mm thick) were dispersed on an A4 (297�210 mm) sheet of paper. The arrayconsisted of six columns with six lines each, three on the left and three on the rightside of the A4 sheet, and one central column with four lines. Patients wererequested to cross out all the lines on the sheet using only one mark per target. Thistask was also used to assess the presence and type of perseverative responses. In ourmodified Diller letter cancellation test the patients’ task was to explore an A4 sheetprinted with six rows of 52 letters each. The 312 letters were capital 3-mm-tallTimes New Roman characters. Of these, 106 were H letters, and had to be cancelledout (targets), leaving out the other 206 (distractors). The targets were symme-trically distributed around the array midline (53 on each side). In the standardizedprocedure of the Niguarda Ca’ Granda Hospital, patients are first administered theAlbert task; then, if the patient’s clinical conditions allow the examiner to do so, themore demanding Diller task is also administered. Of the 33 patients included in thepresent study, 33/33 performed the Albert task; 25/33 patients could also performthe Diller task. The inclusion criterion was a left–right difference of at least twoomissions in at least one task; 27 out of the 33 patients showed spatial neglectalready at the Albert task; all of the remaining six patients showed neglect on theDiller task, with a minimum left–right difference of seven omissions. In any event, amore accurate measurement of neglect severity was later obtained (see Section2.3.1). A full description of the performance of each patient is given in Table 1.
2.3. Quantitative evaluation of neglect and perseveration
2.3.1. Indices of neglect severityTo quantify neglect severity, we used a method proposed by Binder, Marshall,
Lazar, Benjamin, and Mohr (1992) which we have used thoroughly in subsequentclinical and experimental work in our lab (e.g. Gandola et al., 2007) and which waslater standardized by Rorden and Karnath (2010). This scoring method considersthe average position of the detected targets across the array (Centre of Cancellation,CoC, as named by Rorden & Karnath, 2010). By scoring the position of each target interms of its column (from �3, extreme left, to þ3, extreme right), the resulting CoCranged from �3, extreme right neglect, to 0, no neglect, to þ3, extreme leftneglect. For the Diller task, the position of each target (letter H) was measured inmm with respect to the centre of the display, and then normalized into the scale�50% (leftmost letters) to þ50% (rightmost letters). Hence the CoC ranged from�50% (extreme right neglect), to þ50% (extreme left neglect), with 0% indicatingno neglect. Both CoC measures are reported in Table 1.
2.3.2. Types and indices of perseverationAs mentioned in the Introduction, we wished to study four different types of
perseveration, (i) ‘additional marks’ (AM), (ii) ‘scribble’, (iii) ‘flying marks’ (FM),(iv) ‘complex marks’ perseveration. To do so, we devised a procedure (see AppendixA) for analysing each mark drawn by each patient on the Albert display; afterhaving applied such a procedure we ended up having, for each target and eachpatient, the number of ‘cancellation marks’ drawn to detect it and the number of‘flying marks’ (44 mm away from any target—but see Appendix A) for which thattarget was the closest; moreover, each mark was assigned with a ScribblePerseveration Index (SPI, developed by one of us recently – see Toraldo, 2013) –
a measure which is proportional (r¼ .97) to the number of to-and-fro (or circular)movements that had likely been made to produce the mark. An index of 0 indicatedthat the mark was a perfectly linear segment (no scribbling behaviour at all), andpositive values indicate scribbling behaviour: the mark in Fig. 1(ii) has a Scribbleindex of 6.7. Furthermore, marks that carried a meaning (writing, symbols,drawings) were classified as ‘complex’. This classification was used to obtain threeindices that summarized the performance of each patient, and which weremutually independent from the mathematical viewpoint:
(i) AM density, i.e., the average number of AM per target. To compute it, weapplied the formula AM density¼(cMtot�Ttot)/Ttot, where cMtot¼total numberof cancellation marks and Ttot¼total number of cancelled targets. AMdensity¼0 means that no additional mark was produced; AM density¼1means that, on the average, each target was cancelled with 2 marks, i.e., with1 unnecessary extra mark.
M. Gandola et al. / Neuropsychologia 51 (2013) 2960–29752962

(ii) Scribble index. This was the SPI (Toraldo, 2013), averaged out across all marks(both cancellation and FM).
(iii) FM density, i.e. the average number of FM in the area surrounding a target. Thiswas computed dividing the overall number of FM by the area explored by thepatient—the latter was estimated as the overall number of targets that eitherhad been cancelled or were the closest to some FM; density¼0 means that noFM was produced; FM density¼1 means that a patient produced as many FMas the targets s/he cancelled.
We did not derive a ‘Complex’ perseveration index as such behaviour proved tobe too infrequent (see Section 3 below).
2.4. Behavioural data analyses
The three perseveration indices, and the neglect severity index (CoC), were used todetermine: (i) whether double dissociations could be found between patients (t orbinomial tests); (ii) whether the different indices correlated across patients (SpearmanRho, Generalized Linear Model, GzLM); (iii) whether the indices correlated withinpatients (i.e. across targets; Mixed Generalized LinearModel, MGzLM). Details as to thelogic and procedures of analyses (i)–(iii) are discussed below.
2.4.1. Double dissociations between patientsDouble dissociation (DD) has long been considered as convincing evidence for
the existence of functional fractionations in the cognitive architecture (Shallice,1988). There are two main varieties of DD. In within-patients DD, patient 1 performsbetter on test A than on test B, while patient 2 performs better on test B than on A.Here z-scores are necessary to compare the performance of a same patient ondifferent tests. We could not rely on this kind of DD, because our three persevera-tion indices have markedly skewed distributions (with a peak around zero, thelower limit, and a long tail on positive values), a feature that makes z-scores invalidmeasures of deficit. Hence we relied on between-patients DD, in which patient
1 outperforms patient 2 on test A, while patient 2 outperforms patient 1 on test B.Here comparisons are between different patients, on a same scale, so no znormalization is required.
To diagnose between-patient DDs we proceeded as follows. First, we tested allpossible between-patients simple dissociations (SDs) for significance, i.e., wedetermined whether patient 1 and patient 2 significantly differed on measure A,and we did so for all possible pairs of patients. Second, we repeated the procedurefor measure B. Third, we searched for pairs of patients showing significant SD onmeasure A in one direction, and significant SD on measure B in the oppositedirection. Note that the critical feature is the combination between opposite SDs intwo measures: a single SD in one measure has no particular meaning, as it onlyshows that patients differ from each other in deficit severity concerning thatmeasure (but, see Table 2 and related text).
Significance of SDs in continuous measures (neglect severity—CoC, and Scribbleindex) were obtained by means of unequal variance t-tests, which allowed us tocompare the positions of cancelled targets (CoC), or the Scribble indices of marks,between two patients. By contrast, SDs in discrete measures (AM and FM counts pertarget) were assessed by using the binomial test (see later), both because its statisticalassumptions are fully met, and because it proved a more powerful detector of SDs thanthe t-test (the latter detected 55/528 SDSs for AM and 0/528 for FM, while the binomialtest had a 133/528 and 53/528 scoreline). The binomial test worked as follows. A patientwas classified as producing a higher AM density than another patient, when theproportion of AM produced by the first patient (out of all the AM produced by both) wassignificantly higher than predicted by the null hypothesis of equal AM density, whichtook into account differences in the areas explored by the two patients on their sheets.
When assessing SDs, we applied the Sidak multiple comparison correction,dividing α by the overall number of between-patients pairwise comparisons (496to 528, according to the measure) adjusted for the partial between-comparisondependence (not all of the comparisons are mutually independent). Hence a SDwas diagnosed when significant at about the .00001 level. When we combined SDsto identify DDs, no further multiple-comparison correction was applied, because aDD requires that both of the SDs that compose it are significant.
Table 1Demographic and clinical data of the 33 right brain damaged patients.
Patient Age Education (years) Illness duration (days) Neurological deficits AHP PN Neglect severity: CoC Perseveration indices
M SS V Albert task Diller task AM density Scribble index FM density
P1 71 13 5 1 1 1 0 0 2.75 46.04 0.000 0.409 0.000P2 77 3 10 0 0 0 n.a. n.a. 2.60 n.a. 0.400 1.791 0.000P3 75 8 10 3 3 3 3 3 3.00 48.97 0.833 0.393 0.000P4 83 6 18 3 1 2 0 0 0.62 36.59 0.625 2.795 0.029P5 69 5 13 3 1 1 0 0 0.00 21.99 0.025 1.621 0.000P6 65 5 3 3 2 3 0 0 2.06 35.91 0.118 1.407 0.000P7 68 5 20 3 0 3 0 0 �0.05 19.98 0.000 0.331 0.000P8 86 5 0 2 0 0 0 0 0.03 37.36 0.471 0.114 0.083P9 65 5 7 3 3 3 3 0 3.00 49.61 3.333 0.131 2.875P10 82 13 1 3 3 3 3 3 2.67 n.a. 1.143 0.362 0.000P11 75 5 36 3 1 1 0 0 2.00 30.50 0.000 2.412 0.000P12 71 3 0 3 3 1 3 0 2.60 n.a. 0.714 1.166 1.158P13 59 9 22 3 1 1 2 1 0.46 n.a. 0.185 1.560 0.000P14 61 8 2 3 3 1 2 1 0.05 38.12 0.132 0.000 0.000P15 67 8 2 3 3 3 0 0 2.55 45.78 0.909 0.096 0.091P16 48 3 3 2 1 3 0 0 0.34 30.40 0.067 0.150 0.000P17 62 5 1 3 3 0 0 0 0.02 14.97 0.000 - 0.049P18 39 6 10 3 3 1 0 0 1.06 36.19 0.280 0.900 0.000P19 62 14 11 3 3 1 0 0 0.23 18.11 0.028 0.053 0.077P20 75 8 7 3 0 1 0 0 0.55 n.a. 1.000 0.206 0.125P21 71 7 16 3 1 1 0 0 1.18 35.38 0.522 0.070 0.000P22 71 3 3 2 3 3 0 0 0.00 4.68 0.000 0.188 0.000P23 73 10 5 3 3 1 0 0 1.07 24.18 0.074 0.214 0.000P24 78 3 8 3 3 3 0 0 1.75 47.22 1.895 0.086 0.050P25 65 5 8 3 0 0 0 0 0.22 28.34 0.059 0.019 0.000P26 82 0 5 3 3 0 3 0 2.00 n.a. 0.111 0.006 0.000P27 82 5 4 2 3 3 3 0 1.62 38.35 1.950 0.124 0.000P28 72 12 6 3 3 3 3 1 2.75 n.a. 0.250 0.044 0.125P29 63 13 35 3 3 3 2 0 3.00 49.36 0.500 0.675 0.143P30 72 13 11 3 0 0 0 0 2.50 21.52 0.222 0.260 0.333P31 56 5 28 3 3 3 3 3 2.60 50.00 0.400 1.414 0.100P32 65 8 7 0 0 0 0 0 0.00 3.46 0.000 0.076 0.000P33 62 5 22 2 3 3 0 0 0.47 n.a. 0.774 0.583 0.031
M: motor deficits (0–3); SS: somatosensory deficits (0–3); V: visual half-field deficits (0–3); AHP: anosognosia for hemiplegia (0–3); PN: personal neglect (0–3); all previousscores were from Bisiach, Vallar, Perani, Papagno, and Berti (1986) standard clinical examination. CoC: centre of cancellation; AM density: ‘additional marks’ index (min¼0);Scribble index: min¼0; FM density: ‘flying marks’ index (min¼0); n.a.:¼test not administered. Patient 33 was EZ (Toraldo et al., 2005). Patient 17 did not obtain a Scribbleindex because all of her cancellation marks were symbolic (‘V’ letters), so Scribble scores were meaningless in this case.
M. Gandola et al. / Neuropsychologia 51 (2013) 2960–2975 2963

2.4.2. Across-patients correlationsGiven that AM, FM and Scribble indices have highly skewed distributions, we
used Spearman’s Rho to correlate them across patients. However Spearman’s Rhodoes not allow partial correlation coefficients to be derived. So we also appliedGeneralized Linear Model (GzLM; SPSS 20, IBM statistical package) to model therelationship between any two variables, partialling out the effect of other variables.AM density, FM density and Scribble index were modelled as Tweedie distributionswith log-link function. Albert CoC was modelled by a normal distribution withidentity link. We called such analyses ‘partial correlations’ for the sake of clarity,albeit the term ‘regression’ would be more appropriate.
2.4.3. Across-targets (within-patient) correlationsWe also wished to learn whether two given variables also co-vary across the
different targets explored by a patient. In this case we used Mixed GeneralizedLinear Models (MGzLM; SPSS 20, IBM software). The unit of analysis was the singletarget, for which we obtained: AM count, FM count (how many FM had that markas the closest), and average Scribble index of all its marks (AM and FM). Thesevariables were used as regressors (Xs) or as dependent variables (Ys) in differentanalyses; when used as Ys, AM and FM counts were modelled as Poissondistributions with log-link, and average Scribble index as a Gamma-distributionwith log-link (after having replaced zeros with half the smallest value in the wholeset). We also introduced Horizontal Target Position (HTP: columns �3 to þ3 in theAlbert cancellation display) as an X. Patient was introduced as random interceptand Patientn(each of the Xs) were introduced as random slope effects. Patientswere excluded when they had zero values in the Y (MGzLM cannot estimateregression parameters when Y frequencies are zero; thus e.g. we excluded patientswho did not produce any AM from an analysis that estimated the effect of HTP onAM), or when they explored less than two columns in an analysis with HTP (theeffect of HTP is impossible to estimate within a single patient if one only columnhas been explored). Single-target outliers points were detected by interpolating theY with a Poisson distribution (AM, FM) or a Gamma distribution (Scribble) to thesmallest Y values (0–3) and setting the cut-off with alpha¼ .01 and Bonferronicorrection for the overall number of visited targets (which ranged from 288 to 673according to the analysis). Excluded data points were very few (0–4; 0–1.39%).Because of the nature of MGzL modeling, a same relationship—e.g. that betweenAM and FM counts, can give slightly different p-values when one of the twovariables is treated as an X vs. when it is treated as a Y. Hence in the ResultsSections we only reported the smaller p-value for each relationship.
2.5. Lesion mapping (VLSM)
In order to learnwhether the different indices correlatedwith different anatomicalsubstrates, a Voxel-based Lesion-Symptom Mapping analysis (VLSM; Rorden, Karnath,& Bonilha, 2007) was performed. Brain lesions were identified by computerizedtomography (CT) and mapped, using a computerized method, in the stereotactic spaceof the Montreal Neurological Institute as defined by the templates released with SPM2(Statistical Parametric Mapping, Wellcome Department of Imaging Neuroscience,London, UK). The methods of the CT scanning lesion mapping are fully describedelsewhere (Gandola et al., 2012). The voxel-by-voxel statistical analysis was performedusing the Brunner–Munzel test implemented in the NPM program distributed withthe MRIcron package (Rorden et al., 2007). By using this test, the presence/absence ofdamage in a given voxel is used as a classifying criterion that separates subjects ashaving or not-having the lesion, while the behaviour is the dependent variablescrutinized for significance by the non-parametric test: accordingly, in each voxel, thestatistical maps visualizes the significance of a behavioural difference between twogroups of subjects identified on the ground of having or not-having a lesion. Theanatomical distribution of the statistical results was assessed using the AutomatedAnatomical Labelling map (template AAL; Tzourio-Mazoyer et al., 2002) whichclassifies the anatomical distribution of digital brain images in stereotactic space.
3. Behavioural results and discussion
Table 1 reports both demographic and experimental data fromall patients. Neglect was often florid: omission % was 43.6730.9 inthe whole sample (Albert). Perseverations of the AM, FM, andscribble types were very frequent: we observed 270 AM in 27/33patients and 57 FM in 14/33 patients; 17/33 patients produced 177marks whose Scribble index was 41 (i.e. likely to have beenproduced by more than 2 to-and-fro pen strokes). Finally, 12Complex marks were found in 3/33 patients. Clearly, Complexmarks were too few and in too few patients to be further analysed.So we only included AM, FM and scribble perseverations in theanalyses.
Table 3Group analyses: Spearman correlations and GzLM-derived regressions. For simple correlations, Spearman Rho is reported with significance as well as slope parameter B,Wald statistic (W), and significance from GzLM analyses. In the ‘Partial correlations’ Section, results from GzLM are reported where each relationship has been derivedpartialling out the effect of other variables. Scribble index was not used in the Partial Correlation analyses because it failed to correlate with any other variable in the SimpleCorrelation analysis. All p-values are two-tailed, and reported in bold when significant (o .05); when a two-tailed p-value is o .1 but the correlation is in the expecteddirection (i.e. positive), the p-value is reported in bold italic to signal one-tailed significance. Note that the term ‘correlation’ is used here and in the text to express therandom-variable nature of all measures, even though ‘regression’ would be more appropriate in the case of GzLM parameters.
Neglect severity (Albert CoC) AM density FM density
Simple correlations AM density Rho¼ .503, p¼ .003B¼ .524; W¼8.902; p¼ .003
FM density Rho¼ .31, p¼ .079 Rho¼ .442, p¼ .01B¼1.21; W¼16.374; po .001 B¼1.236; W¼19.22; po .001
Scribble index Rho¼ .217, p¼ .234 Rho¼� .003, p¼ .986 Rho¼� .043, p¼ .817B¼ .096; W¼ .378; p¼ .539 B¼� .491; W¼2.515; p¼ .113 B¼� .518; W¼ .749; p¼ .387
Partial correlations AM density B¼ .357; W¼3.573; p¼ .059FM density B¼ .755; W¼5.652; p¼ .017 B¼ .922; W¼9.456; p¼ .002
Table 2Simple and Double dissociations between patients. Simple dissociations report how many of the pairwise comparisons between patients led to a significant difference in themeasure, and gives an idea of each measure’s sensitivity. e.g. patients differed from each other for AM density in 133 of the 528 comparisons. Double dissociations are casesin which the simple dissociation in one measure (e.g. AM density) combines with an opposite simple dissociation in another measure (e.g. FM density). The significance levelfor each dissociation was .00001 (see Section 2.4.1 Double dissociations between patients).
Simple dissociations Double dissociations
Neglect severity (Albert CoC) AM density FM density
Neglect severity (Albert CoC) 216/528(40.9%)
AM density 133/528 0/528 (0%)(25.2%)
FM density 53/528 0/528 (0%) 0/528 (0%)(10%)
Scribble index 167/496 36/496 (7.3%) 29/496 (5.8%) 7/496 (1.4%)(34%)
M. Gandola et al. / Neuropsychologia 51 (2013) 2960–29752964

3.1. Double dissociations (DD)
Table 2 reports the between-patients DD that were found in thewhole set.
Results were clear-cut. We failed to find DD between CoC – themeasure of neglect severity – AM density and FM density. Bycontrast, several DD were found between each of those measuresand the Scribble index.
3.2. Discussion: A sensitivity artefact?
Perhaps scribble perseveration dissociated from neglect severity,while AM and FM perseveration failed to do so, just because AM andFM are less sensitive measures of deficit than Scribble index is.Indeed, by inspecting Table 2 (first column), AM and FM densities doseem to be less sensitive than Scribble index: between-patientssimple dissociations, which reflect measure sensitivity to deficit, aremuch more frequent for Scribble (34%) than for AM (25.2%) and FM(10%). However, if measure sensitivity had been the only reason whyAM–FM did not dissociate from neglect severity while Scribble did,then the across-patient correlation of AM–FM with neglect severityshould be lower than the correlation of Scribble with neglect severity;indeed, less sensitive (more noisy) measures are expected to corre-late less with any other variable. As we will see in the next Section(3.3), exactly the opposite held true; hence we safely rejected thehypothesis that the absence of DD between AM–FM and neglectseverity was only an artefact of low sensitivity.
3.3. Across-patients correlations
Table 3 shows the pattern of correlations between neglectseverity, AM, FM, and scribble perseveration across patients. In thetop part of Table 3, ‘simple correlations’ are reported. AM and FMdensities were significantly and positively associated to each otherand each with neglect severity (Albert CoC); by contrast, Scribbleindex failed to significantly correlate with any of the othervariables. Note that the simple correlations between AM, FM andneglect severity became even more pronounced whenwe used theDiller CoC—a more sensitive measure of neglect severity [Diller-AM: Spearman Rho¼ .737, po .001; GzLM, B¼ .116, Wald¼27.245,po .001; Diller-FM: Rho¼ .36, p¼ .078; B¼ .09, Wald¼8.1, p¼ .004;Diller-Scribble: Rho¼ .154, p¼ .473; B¼ .013, Wald¼ .547, p¼ .46].To search for the source of the correlations linking the three
variables AM, FM, and neglect severity, we derived ‘partial correla-tion’ coefficients by means of GzLM analyses, which are reportedin the bottom part of Table 3. Clearly, the triple correlation patternis confirmed: all three partial correlations were positive andsignificant (the AM-neglect severity correlation was significantfor the one-tailed test—which is justified because deficits areexpected to correlate positively across patients).
3.4. Discussion: Anatomical contiguity of separate cognitiveprocesses?
The scenario emerging from both the DD and the correlationalanalyses is that AM perseveration, FM perseveration and neglectseverity might share some underlying factor(s) that scribble persevera-tion does not share. However, the correlations between AM, FM, andneglect severity might be trivially interpreted in terms of anatomicalcontiguity of functionally separate processes. We will now studyanother kind of correlation, which is immune to such criticism. Iftwo measures correlate not only across patients, but also withinpatients – i.e. across the different targets of the Albert display – thatcorrelation cannot be interpreted in terms of mere anatomical con-tiguity of independent processes, and thus suggests a genuine func-tional link (unless one assumes that the lesion site changes in the timewindow inwhich the patient performs the Albert task, simultaneouslyproducing changes in both functions – a very unlikely scenarioindeed). Therefore, we looked at the joint variation of the differentmeasures across targets. While we had AM, FM, and Scribble measuresalso for single targets, we did not have a measure of ‘neglect’ varyingfrom target to target, hence we introduced Horizontal Target Position(HTP), i.e., in which of the seven columns of the Albert display (from�3 to þ3) a target was, as a within-patient regressor in the analyses.We reasoned that if a symptom is functionally related to neglect, it willvary as a function of horizontal position.
3.5. Across-targets (within-patient) correlations
Table 4 reports the correlations between AM count, FM count,and Scribble index across targets, as well as the effects of thehorizontal target position (HTP) on the same variables. On the‘simple correlation’ analyses (Table 4, top), HTP significantlyinfluenced AM count: the more on the right a target was, themore AM were found over it; moreover, a negative relationshipwas found between Scribble index and AM count, and between
Table 4Across-targets correlations and regressions: Mixed GzLM analyses. For simple correlations-regressions, slope parameter B, Wald statistic (W), and significance from M GzLManalyses are reported. In the ‘Partial correlations-Multiple regression’ Section, results fromM GzLM are reported where each relationship has been derived partialling out theeffect of other variables. N indicates the number of patients participating in each analysis, eDP the data points excluded from those patients out of the overall set (inclusion/exclusion criteria are reported in Section 2.4.3). All p-values are two-tailed, and reported in bold when significant (o .05).
Horizontal target position HTP AM count FM count
Simple correlations / regressions AM count B¼ .162F(1, 540)¼5.578, p¼ .019(N¼24, eDP¼2/544)
FM count B¼ .044 B¼ .166F(1, 282)¼1.144, p¼ .286(N¼14, eDP¼4/288)
F(1, 552)¼1.135, p¼ .287(N¼27, eDP¼3/562)
Scribble index B¼ .058 B¼�0.151 B¼� .284F(1, 666)¼ .988, p¼ .321 F(1, 659)¼4.147, p¼ .042 F(1, 668)¼3.918, p¼ .048(N¼30, eDP¼3/671) (N¼31, eDP¼3/673) (N¼31, eDP¼3/673)
Partial correlations / Multiple regressions AM count B¼ .162F(1, 537)¼5.719, p¼ .017 (N¼24, eDP¼2/544)
FM count B¼ .027 B¼ .157F(1, 232)¼ .358, p¼ .55(N¼14, eDP¼4/288)
F(1, 550)¼ .994, p¼ .319(N¼27, eDP¼3/562)
Scribble index B¼ .062 B¼�0.214 B¼ .03F(1, 655)¼1.033, p¼ .31 F(1, 657)¼6.915, p¼ .009 F(1, 232)¼ .29, p¼ .591(N¼30, eDP¼3/671) (N¼31, eDP¼3/673) (N¼14, eDP¼4/288)
M. Gandola et al. / Neuropsychologia 51 (2013) 2960–2975 2965

Scribble index and FM count. Thus, the more ‘scribbled’ the markson a given target, the less frequent they were; and, the more‘scribbled’ the marks over a given target, the less frequent were FMin its vicinities. On the ‘partial correlation’ analyses (Table 4,bottom), the effect of HTP on AM count and the negative correla-tion between Scribble index and AM count survived.
3.6. Discussion: An explanatory diagram and predictions on VLSM
The across-targets correlations (Table 4) confirmed most, but notall of the results from the across-patients correlations (Table 3).Scribble index was confirmed not to be related to any of the otherthree measures (if anything, it correlated negativelywith AM3). Of thetriple across-patients correlation involving AM, FM and neglectseverity (Table 3), only the AM-neglect severity correlation was(indirectly) confirmed in the within-patients analysis (AM densitysignificantly increased from left to right in the Albert display,Table 4). So, by following the reasoning we proposed in Section3.4, only the AM-neglect severity correlation should be assumed toreflect a real functional link; by contrast, the correlations FM-AM andFM-neglect severity, which were significant only across-patients butnot within-patients, might be (provisionally) ascribed to simpleanatomical contiguity of the processes underlying them.
To summarize, we should assume a first set of processesunderlying scribble perseveration, that is separate from anotherset of processes that is shared by AM perseveration and neglect,which in turn is separate from, but anatomically contiguous to, athird set of processes that is responsible for FM perseveration.
We sketched these inferences in an explanatory diagram (Fig. 2).Hypothetical cognitive processes (C1–C3) are depicted in the middlerow, which cause, when damaged (arrows), changes in the observedbehavioural measures (top row). Just look at solid arrows at thisstage. Scribble perseveration is assumed to reflect damage to aprocess C3 that is completely separate from the processes underlyingAM perseveration, neglect severity (measured by Albert CoC) and FMperseveration. Another process C1 is assumed to be shared by AM andneglect severity. FM is assumed to depend on a separate process, C2,which is anatomically contiguous to C1.
We will now test such a diagram against anatomo-functionalmapping data. The diagram’s prediction is that, by mapping the
four measures AM density, neglect severity, FM density, andScribble index in the brain, we should identify three differentareas, corresponding to the putative processes C1–C3. AM andneglect severity should identify a first area—the site of C1, in whichtheir two maps should largely overlap; FM should correspond to asecond, different area (putative site of C2), which however shouldbe relatively close to the first (see ‘anatomical contiguity’ in Fig. 2);Scribble index should identify a third, separate area (putative siteof C3), which should be relatively far from the other two.
4. Lesion analysis: Results and discussion
4.1. Lesional volume
We failed to find significant correlations between total volumeof brain damage (Nys et al., 2006, Kleinman et al., 2013) andthe different behavioural measures (neglect severity: Rho¼ .269,one-tailed p¼ .065; AM: Rho¼ .225; one-tailed p¼ .104; Scribble:Rho¼ .158; one-tailed p¼ .194; FM: Rho¼ .114; one-tailed p¼ .263).
4.2. Neglect severity
Fig. 3A shows the VLSM for neglect severity. This measure wasassociated with damage in several regions including: precentral(4% of voxels surviving the statistical threshold) and postcentral(3%) gyri; orbitofrontal cortex (12%); middle (11%) and inferior(21%) frontal gyri; rolandic operculum (34%); insula (10%); hippo-campus (2%); amygdala (6%); parahippocampal region (1%); supra-marginal gyrus (5%); superior (13%), middle (3%) and inferior (1%)temporal gyri; Heschl gyrus (20%) and temporal pole (16%).
4.3. Perseveration
As predicted, discrete anatomical patterns were found for thethree classes of perseveration (Fig. 4). AM perseveration wasassociated with lesions of: right rolandic operculum; precentraland postcentral gyri; inferior frontal gyrus (opercular and trian-gular parts); insula; superior and middle temporal gyri (alsoincluding the Heschl gyrus); supramarginal gyrus (red in Fig. 4;Table C1-A, Appendix A). Conversely, scribble perseveration wasassociated with lesions of: superior, middle, and medial orbito-frontal cortex; caudate nucleus; superior and middle frontal gyri(blue in Fig. 4; Table C1-B). FM perseveration was associated withlesion of: precentral gyrus; middle and inferior (opercular andtriangular part) frontal gyri; orbitofrontal cortex (mainly in theinferior frontal gyrus); inferior temporal gyrus; temporal polarcortex (green in Fig. 4; Table C1-C).
Fig. 2. Diagram showing the minimal set of cognitive factors necessary to explain the results. The top row reports the four behavioural measures: AM¼ ‘additional marks’perseveration; neglect severity¼the Centre of Cancellation (CoC) in the Albert display; FM¼ ‘flying marks’ perseveration; Scribble¼ intensity of scribbling perseveration. Themiddle row reports the hypothetical cognitive deficits (C1–C3) assumed to have a causal role (arrows) on behavioural measures. Behavioural results (correlations across- andwithin patients) suggested that a first deficit C1 is shared by AM and neglect severity, while two separate factors, C2 and C3, underlie FM and scribble perseveration (solidarrows). C1 and C2 were predicted to be anatomically contiguous (curved link). Anatomical results (VLSM) suggested that C2 is actually shared by FM and neglect severity(dashed arrow added). The bottom row reports the main brain regions associated to the hypothetical C1–C3 deficits: Rol Oper¼Rolandic Operculum, STG¼SuperiorTemporal Gyrus, IFG¼ Inferior Frontal Gyrus.
3 This means that, if the marks drawn on a given target were intensely‘scribbled’, they tended to be less frequent than when they were little scribbled.This can be easily explained in terms of visual feedback from cancellation.Irrespective of the reason why patients produced AM, patients likely stoppedacting over a target when they were satisfied that the overall set of marks drawn onit was well visible. If those marks were intensely scribbled, fewer of them sufficedto reach the threshold of ‘visibility’, while if the marks were less scribbled, more ofthem were necessary to reach that same threshold.
M. Gandola et al. / Neuropsychologia 51 (2013) 2960–29752966

4.4. Distance between the centroids of FM, AM, Scribble
The centroids of the statistical mappings of AM, FM andScribble index were obtained by computing the average positionsof the z-score peaks in each area listed in Table C1 (Appendix A),weighted for voxel counts. Consistently with our prediction, thecentroids of AM (48, �1, 11) and FM (52, 9, 0) were closer to eachother than they were to the Scribble centroid (39, 38, 1). Distanceswere: FM-AM, 14.9; AM-Scribble, 40.9; FM-Scribble 31.5.
4.5. Degree of anatomical overlap between neglect severity anddifferent kinds of perseveration
The last three columns of Table C1-A–C show the voxel countsfor overlay between neglect severity and the three types ofperseveration. We found a substantial absence of overlay betweenbrain regions associated with neglect severity and scribble perse-veration (compare Fig. 3A, the map of neglect severity, with blueareas in Fig. 4, the map of Scribble). Conversely, we found aconsistent degree of overlap for both AM and FM with the neglectseverity statistical map; however the overlap between AM andneglect severity (blue in Fig. 3B) was in different regions withrespect to the overlap between FM and neglect severity (red in
Fig. 3B). AM and neglect severity shared the damage of severalregions including the rolandic operculum, the superior temporalgyrus (STG) as well as the ventral frontal cortex (blue in Fig. 3B;Table C1-A). Conversely the overlay between FM and neglectseverity involved the dorsal premotor cortex and temporo-polarregions (red in Fig. 3B; Table C1-C).
4.6. Discussion: A revised diagram
As predicted by our diagram (Fig. 2), we found three well-separate regions corresponding to the three different types ofperseveration (Fig. 4). Again as predicted, the AM and FM regionswere closer to each other than they were to the Scribble region(albeit we do not have statistical variation in these measures so wecannot test differences for significance). Finally, we found thepredicted overlap between the neglect-severity map and the AMmap. An unexpected result was that the neglect severity map alsooverlapped the FM map (red in Fig. 3B). Overall, neglect severityidentified an area which grossly corresponds to the sum of the AMand FM areas (compare map in Fig. 3A, neglect severity, to the sumredþgreen maps in Fig. 4, AMþFM).
A small change in the diagram in Fig. 2 can nicely account forthese lesion-symptom mapping results. Let us assume that factor C2,
Fig. 3. (A) Brain regions significantly associated with neglect severity (Albert CoC). The colour scale illustrates the corresponding Z-score values. (B) Overlay maps betweenneglect severity and AM (blue) and between neglect severity and FM (red). Voxels that survived the statistical threshold of FWE po .01 are shown. MNI z coordinates of eachtransverse section are reported.
Fig. 4. Brain regions significantly associated with different types of perseveration. Voxels that survived the statistical threshold of FWE po .01 are shown. The colour scaleillustrates the corresponding Z-score values. MNI z coordinates of each transverse section are reported.
M. Gandola et al. / Neuropsychologia 51 (2013) 2960–2975 2967
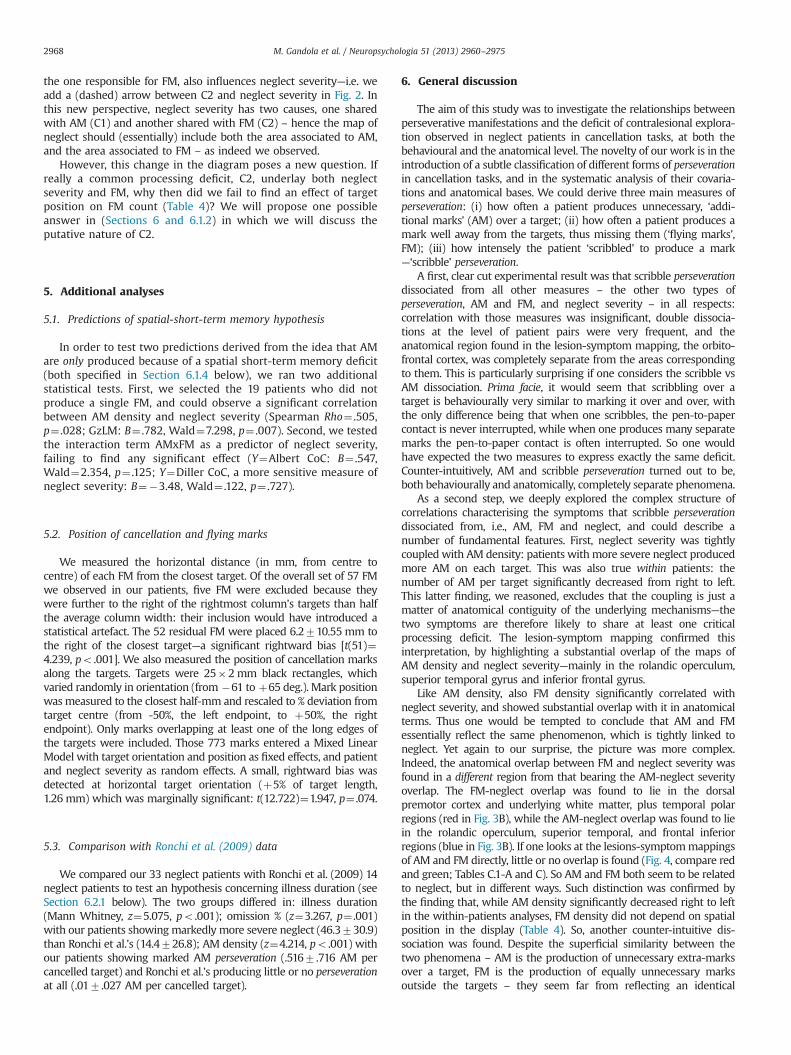
the one responsible for FM, also influences neglect severity—i.e. weadd a (dashed) arrow between C2 and neglect severity in Fig. 2. Inthis new perspective, neglect severity has two causes, one sharedwith AM (C1) and another shared with FM (C2) – hence the map ofneglect should (essentially) include both the area associated to AM,and the area associated to FM – as indeed we observed.
However, this change in the diagram poses a new question. Ifreally a common processing deficit, C2, underlay both neglectseverity and FM, why then did we fail to find an effect of targetposition on FM count (Table 4)? We will propose one possibleanswer in (Sections 6 and 6.1.2) in which we will discuss theputative nature of C2.
5. Additional analyses
5.1. Predictions of spatial-short-term memory hypothesis
In order to test two predictions derived from the idea that AMare only produced because of a spatial short-term memory deficit(both specified in Section 6.1.4 below), we ran two additionalstatistical tests. First, we selected the 19 patients who did notproduce a single FM, and could observe a significant correlationbetween AM density and neglect severity (Spearman Rho¼ .505,p¼ .028; GzLM: B¼ .782, Wald¼7.298, p¼ .007). Second, we testedthe interaction term AMxFM as a predictor of neglect severity,failing to find any significant effect (Y¼Albert CoC: B¼ .547,Wald¼2.354, p¼ .125; Y¼Diller CoC, a more sensitive measure ofneglect severity: B¼�3.48, Wald¼ .122, p¼ .727).
5.2. Position of cancellation and flying marks
We measured the horizontal distance (in mm, from centre tocentre) of each FM from the closest target. Of the overall set of 57 FMwe observed in our patients, five FM were excluded because theywere further to the right of the rightmost column’s targets than halfthe average column width: their inclusion would have introduced astatistical artefact. The 52 residual FM were placed 6.2710.55 mm tothe right of the closest target—a significant rightward bias [t(51)¼4.239, po.001]. We also measured the position of cancellation marksalong the targets. Targets were 25�2mm black rectangles, whichvaried randomly in orientation (from �61 to þ65 deg.). Mark positionwas measured to the closest half-mm and rescaled to % deviation fromtarget centre (from -50%, the left endpoint, to þ50%, the rightendpoint). Only marks overlapping at least one of the long edges ofthe targets were included. Those 773 marks entered a Mixed LinearModel with target orientation and position as fixed effects, and patientand neglect severity as random effects. A small, rightward bias wasdetected at horizontal target orientation (þ5% of target length,1.26 mm) which was marginally significant: t(12.722)¼1.947, p¼ .074.
5.3. Comparison with Ronchi et al. (2009) data
We compared our 33 neglect patients with Ronchi et al. (2009) 14neglect patients to test an hypothesis concerning illness duration (seeSection 6.2.1 below). The two groups differed in: illness duration(Mann Whitney, z¼5.075, po.001); omission % (z¼3.267, p¼ .001)with our patients showingmarkedly more severe neglect (46.3730.9)than Ronchi et al.’s (14.4726.8); AM density (z¼4.214, po.001) withour patients showing marked AM perseveration (.5167.716 AM percancelled target) and Ronchi et al.’s producing little or no perseverationat all (.017.027 AM per cancelled target).
6. General discussion
The aim of this study was to investigate the relationships betweenperseverative manifestations and the deficit of contralesional explora-tion observed in neglect patients in cancellation tasks, at both thebehavioural and the anatomical level. The novelty of our work is in theintroduction of a subtle classification of different forms of perseverationin cancellation tasks, and in the systematic analysis of their covaria-tions and anatomical bases. We could derive three main measures ofperseveration: (i) how often a patient produces unnecessary, ‘addi-tional marks’ (AM) over a target; (ii) how often a patient produces amark well away from the targets, thus missing them (‘flying marks’,FM); (iii) how intensely the patient ‘scribbled’ to produce a mark—‘scribble’ perseveration.
A first, clear cut experimental result was that scribble perseverationdissociated from all other measures – the other two types ofperseveration, AM and FM, and neglect severity – in all respects:correlation with those measures was insignificant, double dissocia-tions at the level of patient pairs were very frequent, and theanatomical region found in the lesion-symptom mapping, the orbito-frontal cortex, was completely separate from the areas correspondingto them. This is particularly surprising if one considers the scribble vsAM dissociation. Prima facie, it would seem that scribbling over atarget is behaviourally very similar to marking it over and over, withthe only difference being that when one scribbles, the pen-to-papercontact is never interrupted, while when one produces many separatemarks the pen-to-paper contact is often interrupted. So one wouldhave expected the two measures to express exactly the same deficit.Counter-intuitively, AM and scribble perseveration turned out to be,both behaviourally and anatomically, completely separate phenomena.
As a second step, we deeply explored the complex structure ofcorrelations characterising the symptoms that scribble perseverationdissociated from, i.e., AM, FM and neglect, and could describe anumber of fundamental features. First, neglect severity was tightlycoupled with AM density: patients withmore severe neglect producedmore AM on each target. This was also true within patients: thenumber of AM per target significantly decreased from right to left.This latter finding, we reasoned, excludes that the coupling is just amatter of anatomical contiguity of the underlying mechanisms—thetwo symptoms are therefore likely to share at least one criticalprocessing deficit. The lesion-symptom mapping confirmed thisinterpretation, by highlighting a substantial overlap of the maps ofAM density and neglect severity—mainly in the rolandic operculum,superior temporal gyrus and inferior frontal gyrus.
Like AM density, also FM density significantly correlated withneglect severity, and showed substantial overlap with it in anatomicalterms. Thus one would be tempted to conclude that AM and FMessentially reflect the same phenomenon, which is tightly linked toneglect. Yet again to our surprise, the picture was more complex.Indeed, the anatomical overlap between FM and neglect severity wasfound in a different region from that bearing the AM-neglect severityoverlap. The FM-neglect overlap was found to lie in the dorsalpremotor cortex and underlying white matter, plus temporal polarregions (red in Fig. 3B), while the AM-neglect overlap was found to liein the rolandic operculum, superior temporal, and frontal inferiorregions (blue in Fig. 3B). If one looks at the lesions-symptommappingsof AM and FM directly, little or no overlap is found (Fig. 4, compare redand green; Tables C.1-A and C). So AM and FM both seem to be relatedto neglect, but in different ways. Such distinction was confirmed bythe finding that, while AM density significantly decreased right to leftin the within-patients analyses, FM density did not depend on spatialposition in the display (Table 4). So, another counter-intuitive dis-sociation was found. Despite the superficial similarity between thetwo phenomena – AM is the production of unnecessary extra-marksover a target, FM is the production of equally unnecessary marksoutside the targets – they seem far from reflecting an identical
M. Gandola et al. / Neuropsychologia 51 (2013) 2960–29752968

underlying deficit. They are in clear-cut anatomical double dissociation,a profile that rules out interpretations in terms of differentialsensitivity, 4 and show different behavioural characteristics, with AMperseveration depending on spatial position, and FM being inde-pendent of it.
6.1. Hypothesised processing deficits
We could account for such a complex picture by assumingthree separate underlying factors (see the diagram in Fig. 2): C1,shared by AM and neglect severity; C2, shared by FM and neglectseverity; C3, a separate factor accounting for scribble perseveration.We will now propose a set of deficits which fit the descriptions ofthe C1, C2, and C3 components of the diagram, and which fit theanatomical bases we could describe for them. It is important toclarify here that the proposed deficits will not be offered as theonly causes of the perseverative phenomena under investigation;they will just be proposed as some of the possible causes, whichcan account for the complex pattern of behavioural and anatomi-cal correlations we observed (see also Section 6.4).
6.1.1. C3—Deficit of inhibition of initiated motor behaviour?The behavioural characteristics of the ‘scribbling’ phenomenon
closely recall what has been labelled in many different waysin the literature: efferent motor perseveration (Luria, 1965),clonic perseveration (Liepmann, 1905) or continuous perseveration(Sandson & Albert, 1987). The underlying cognitive deficit can behypothesized to be a specific, high-order dysfunction of motorcontrol, i.e. a failure to inhibit an initiated motor act, when theact continuation becomes inappropriate (Luria, 1965; Fig. 1; Plate1, performance 2). The prefrontal cortex, especially in the righthemisphere (Casey et al., 1997; Garavan, Ross, & Stein, 1999;Rieger, Gauggel, & Burmeister, 2003), and the basal ganglia areinvolved in response inhibition as demonstrated by lesional,electrophysiological and neuroimaging studies in humans, andby data emerging from animal studies. A role of basal ganglia inthe inhibition of ongoing responses also emerges from studies ofpatients with Parkinson disease (e.g. Cooper, Sagar, Tidswell, &Jordan, 1994). The lesion localization we obtained from scribbleperseveration is compatible with such anatomical descriptions(we found involvement of the orbitofrontal cortex and of thecaudate nucleus, see Table C.1-B).
6.1.2. C2—Directional hypokinesia?A second factor (C2) was assumed to explain the association
between FM production and neglect severity, whose anatomicalcounterpart is (mainly) in the dorsal premotor cortex and underlyingwhite matter. We reasoned that directional hypokinesia5 (Heilman,Bowers, Coslett, Whelan, & Watson, 1985), i.e. the inability to program
and execute movements towards the contralesional side (also called‘premotor neglect’ Bisiach, Geminiani, Berti, & Rusconi, 1990; or‘output-related neglect’, e.g. Bisiach, Ricci, Lualdi, & Colombo, 1998;Toraldo, Laiacona, Pagani, Mandelli, & Capitani, 2012; Toraldo,McIntosh, Dijkerman, and Milner, 2004) is a good candidate: it canexplain left-sided omissions (hence, the relationship with neglectseverity); it can explain FM as the result of a failure to programmetrically appropriate reaching movements from target to target, withthe pen-tip landing in an empty region of the sheet; its anatomicalcorrelate, described by Sapir, Kaplan, He, and Corbetta (2007) is partlycompatible with the mapping we derived by overlapping the neglectseverity and FM maps: Sapir et al. (2007) found involvement of theputamen, claustrum, inferior frontal gyrus, frontal operculum, andanterior insula, but also of the white matter underlying the ventralfrontal cortex, which is what matches our results (but see Husain,Mattingley, Rorden, Kennard, & Driver, 2000). Moreover, directionalhypokinesia also explains why FM count, unlike AM count, did notvary as a function of left–right target position in the display (Table 4).Because the frame of reference relevant for directional hypokinesia ishand-centred, and not display-centred (Mattingley, Husain, Rorden,Kennard, & Driver, 1998), FM density is expected to depend on thelocation relative to the hand starting position (the position where thehand was before the mis-reaching movement that led to the produc-tion of each FM was performed), and not as a function of the display-centred coordinates.
Given that our study is retrospective, we do not know where thehand was prior to the production of each FM; however, we identifiedone further, independent prediction of such a directional hypokinesiainterpretation which could be tested on our data. If really directionalhypokinesia contributed to the genesis of FM, then FM should beobserved more often to the right than to the left of the target of theplanned movement. As a first approximation, we assumed that thelikely target of the movement which led to the production of anygiven FM was the Albert stimulus line that was the closest to that FM.We measured the horizontal position of each FM with respect to thatstimulus, and could observe, as predicted, that FM lay significantlymore often on the right of the putative target of the movement (seeSection 5.2).
We excluded optic ataxia as an explanation for FM for threereasons. (i) Lesions leading to optic ataxia are typically posterior(occipito-parietal. e.g. Perenin & Vighetto, 1988), while FM wereassociated to anterior lesions. (ii) Optic ataxia patients typicallymisreach targets when they cannot foveate them (e.g. Blangeroet al., 2010); by contrast, the Albert test is performed in freevision, with unlimited possibility for self-corrections, and ratherlarge targets (25 mm), so FM are quite unlikely to be the productof optic ataxia. (iii) Even in the case of failure to fixate the targets,the predicted pattern would have been that of leftward misreach-ing errors: optic ataxia patient misreach towards fixation(Blangero et al., 2010), and fixation is expected to have lied tothe left of the target, to compensate for possible visual fielddefects. Contrary to this prediction, we observed FM to lie on theright side of the closest target, again falsifying the optic ataxiahypothesis.
We also considered visual allochiria—the misperception of left-sided targets as located on the right side (Bottini & Toraldo, 2003;Toraldo et al., 2005) which would explain both left-sided omis-sions and right-sided FM: indeed patients, in the attempt to cancela target that is physically located on the left, but that theymisperceive as located on the right, would produce marks in anempty region of the sheet (FM). However visual allochiria—a (mis)perception phenomenon, should have been most likely associatedto posterior regions. This clashes with the (mainly) frontal locali-zation of the neglect-severity-FM overlap maps; moreover, allo-chiria would not explain why FM were found to lie more often onthe right than on the left of the closest target.
4 If AM and FM had reflected exactly the same underlying disorder(s), and hadjust differed in sensitivity, the less sensitive measure should have identified a brainarea that is smaller than, and included in, the area identified by the more sensitivemeasure. Areas that are specific of the less sensitive measure should not have beenfound. By contrast, we found areas (dorsal premotor, temporal pole) that are clearlyspecific of the less sensitive measure (FM). So, FM and AM should reflect at leastpartly separate disorders (which is consistent with our diagrams in Fig. 2, C1 andC2). Conversely, the no-overlap pattern does not demonstrate that AM and FM donot have any disorder in common: sensitivity limitations might have led to under-estimation of the extension of the relevant brain areas, so we cannot exclude thatwith more sensitive tests (i.e. with many more patients) we would have foundsome overlap between the two regions.
5 Strictly speaking, directional hypokinesia concerns the omission, or delayedexecution, of motor acts when these are towards the contralesional side. If themovement is performed, but is metrically inappropriate (as we need to assume inorder to explain FM), a perhaps more appropriate terminology would be directionaldysmetria (Buiatti, Mussoni, Toraldo, Skrap, & Shallice, 2011; Toraldo & Bottini,2006).
M. Gandola et al. / Neuropsychologia 51 (2013) 2960–2975 2969

6.1.3. C1—Deficit of attentional disengagement?According to our diagram (Fig. 2), C1 must have the following
characteristics: (i) a causal role on neglect severity—i.e. on thefrequency of omissions of left-sided targets; (ii) a causal role onAM production; (iii) it should be compatible with a lesion mainlylocated in the rolandic operculum, superior temporal gyrus andinferior frontal gyrus of the right hemisphere. One good candidateis the attentional disengagement deficit proposed by Posner et al.(1984). On this account, patients with right hemisphere lesionswould be specifically unable to disengage attention from a right-sided stimulus, once attention has landed over it. If attentioncannot be disengaged from a right-sided target in a cancellationtask, there are two consequences: first, the patient will be unableto explore the left side, thus producing left-sided omissions;second the patient might mark the target where attention cannotdisengage from repeatedly, thus producing AM (see also Kim et al.,2009; Toraldo et al., 2005). Moreover, since it is reasonable toassume that the disengagement problem is less and less severethe more on the left the stimulus is, we can also explain whyAM density decreased right to left. Finally, there is someevidence that attentional disengagement involves one of theareas which we found responsible for the AM-neglect severityassociation (blue in Fig. 3B), namely, the superior temporalgyrus (Friedrich, Egly, Rafal, & Beck, 1998), albeit the picture iscontroversial (see Corbetta & Shulman, 2011, for a differentinterpretation).
6.1.4. C1—Deficit of spatial short term memory (SSTM)?AM could have actually been caused by a SSTM deficit (e.g.
Husain et al. 2001). The idea is that targets would be markedrepeatedly as a consequence of re-visits: the patient would oftenforget what positions of the display s/he has already explored, andwould thus re-visit them adding further marks. Malhotra et al.(2005) measured neglect severity and SSTM, and found that theycorrelate positively. So the inference can be made that thecorrelation we found between AM and neglect severity mightactually reflect a correlation between the SSTM deficit and neglectseverity. We do agree that SSTM is likely to have a role—as Kimet al. (2009) found by videotaping the cancellation performance ofthree neglect patients, many of the AM were of the ‘return’ type, aspredicted by the SSTM view (see also thorough discussion inCorbetta & Shulman, 2011; and Husain & Rorden, 2003). However,we believe that SSTM cannot be the only explanation of AM, andcertainly not of the correlation AM-neglect severity. First, Kimet al. (2009) also described ‘consecutive’ AM—the patients drewmultiple marks consecutively in time on a given target, a behaviourwhich cannot be accounted for by a SSTM deficit (and which Kimet al., 2009 also explained in terms of an attentional disengagedeficit). Second, we could derive two complex predictions fromthe hypothesis that SSTM is the only source of AM, and of thecorrelation AM-neglect, and found them both to be false in ourdata. We discuss them below.
Suppose that the SSTM deficit were indeed the only source ofAM perseveration—henceforth, the ‘SSTM-only’ hypothesis. If thiswere true, SSTM would necessarily correspond to factor C1 in ourdiagram (Fig. 2). By admission of the advocates of the SSTM theory(e.g. Husain et al., 2001; Husain & Rorden, 2003), a SSTM deficitalone cannot cause omission of left-sided target: a SSTM deficitwill only cause an increase in the probability of left-sided omissionsif a concomitant rightward visual search bias is present. So, we haveto assume that factor C2 in the diagram corresponds to such avisual search bias. And here comes the first prediction: (i) if norightward bias is present, omissions should be zero or close to zero,and their frequency should not be influenced by SSTM deficitseverity. Translating in terms of observable measures: if FM density
is zero (FM is, by hypothesis, a measure of rightward bias C2—seeFig. 2), then the correlation between AM (by hypothesis, a measureof SSTM) and neglect severity should be null. Interestingly, ourproposal that C1 reflects an attentional disengage deficit insteadof a SSTM deficit predicts exactly the opposite results, i.e. that asignificant correlation between AM and neglect severity shouldbe found, even in patients who do not produce any FM. The resultsfalsify the SSTM-only and confirm the attentional disengagehypothesis: a significant correlation AM-neglect severity was foundin the 19 patients who did not produce FM (see Section 5.1).A second, more general prediction is derived from the SSTM-onlyhypothesis, i.e., (ii) there should be a significant interaction bet-ween SSTM deficit and rightward bias in determining omissions.In terms of observable variables, the AMxFM interaction (AM andFM are, by hypothesis, measures of SSTM and of rightward biasrespectively) should be a significant predictor of neglect severity.Again, the attentional disengage theory predicts a differentresult: according to it, attentional disengage deficit (measuredby AM density) and directional hypokinesia (measured by FM)would be independent sources of rightward bias, which wouldsum up in determining neglect severity, without necessarilyinteracting. Once again, results were more consistent with theattentional disengage hypothesis than with the SSTM-onlyhypothesis, as the AMxFM interaction failed to predict neglectseverity (Section 5.1). So, thus far, we have evidence that aninterpretation of C1 in terms of an attentional disengage deficit ismore adequate than an interpretation in terms of an isolatedSSTM deficit. A SSTM deficit might well be present, but it cannotbe the only factor in play.
It is important to emphasize here that the above reasoningdoes not apply only to SSTM: it can be extended to any otherhypothetical disorder that, like SSTM, does not vary along thehorizontal dimension. Hence, many deficits that are not spatiallylateralized, but which are likely to exacerbate neglect (e.g. selec-tive attention, sustained attention, salience detection: all thor-oughly discussed by Husain & Rorden, 2003), can be assumed tohave a role, but should not be assumed to be the only factorsinvolved in C1.
6.2. Comparison of our behavioural results with the literature
6.2.1. Correlation between neglect severity and (AM) perseverationThe problem of whether neglect severity (omissions) and
perseveration correlate is controversial in the literature. Na et al.(1999), and Nys et al. (2006), p. 2152 reported a significant,positive correlation; Rusconi et al. (2002), Vallar et al. (2006), Piaet al. (2009), and Ronchi et al. (2012, 2009), failed to find acorrelation. Kleinman et al. (2013) found a non-linear, inverted-‘U’-shaped relationship, with perseveration being minimal formild and severe neglect, and maximal for intermediate neglect.In the present work, we found a solid, positive relationship: whenusing the Diller Centre of Cancellation, a quite sensitive neglectmeasure, we obtained a correlation as high as Rho¼ .737 with AM.
Part of the discrepancies is easily explained in terms of thedifferent mathematics used in the perseveration scores: in theabove list, some authors used perseveration density (i.e. number ofperseverations per cancelled target, or a measure with a similarmeaning, % of ‘perseverated’ targets out of all cancelled targets);other authors (Kleinman et al., 2013; Rusconi et al., 2002; Vallaret al., 2006) used the overall number of perseverations in thedisplay. As Toraldo et al. (2005) pointed out (pp. 233–234), theoverall number of perseverations can give a distorted picture,swamping real effects, so density should be preferred: theyshowed that, by reanalysing Rusconi et al. (2002) data usingperseveration density, a significant neglect-perseveration correla-tion emerges. The same result is obtained by re-analysing the data
M. Gandola et al. / Neuropsychologia 51 (2013) 2960–29752970
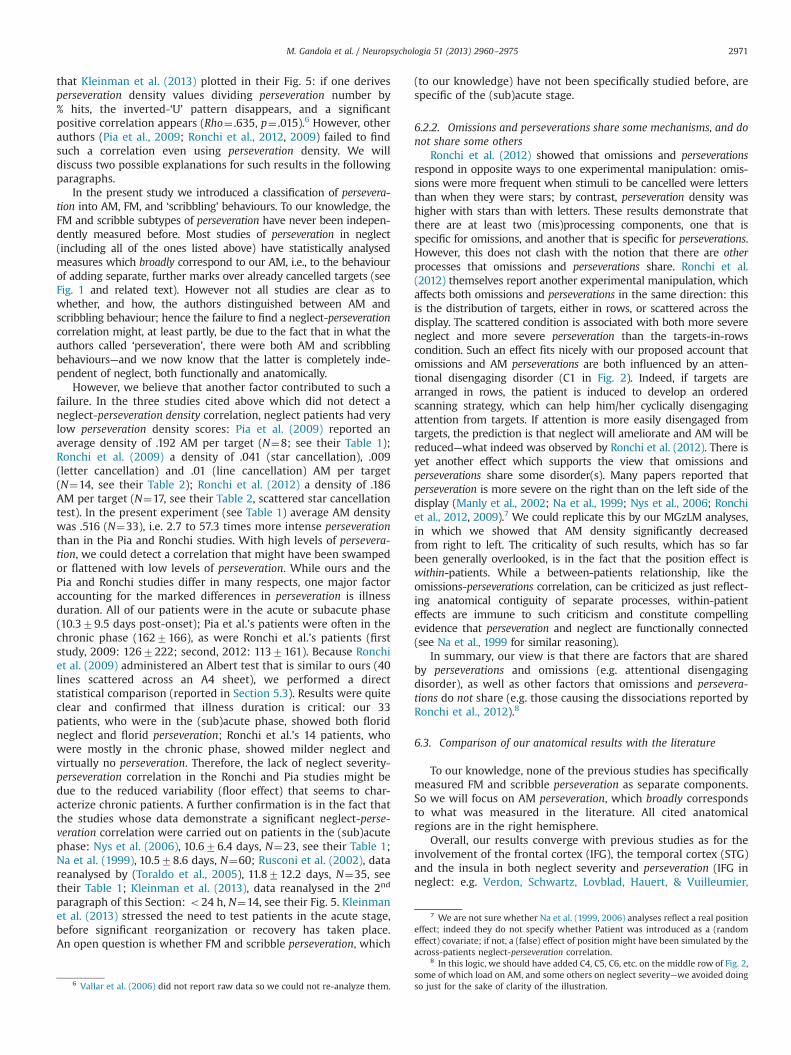
that Kleinman et al. (2013) plotted in their Fig. 5: if one derivesperseveration density values dividing perseveration number by% hits, the inverted-‘U’ pattern disappears, and a significantpositive correlation appears (Rho¼ .635, p¼ .015).6 However, otherauthors (Pia et al., 2009; Ronchi et al., 2012, 2009) failed to findsuch a correlation even using perseveration density. We willdiscuss two possible explanations for such results in the followingparagraphs.
In the present study we introduced a classification of persevera-tion into AM, FM, and ‘scribbling’ behaviours. To our knowledge, theFM and scribble subtypes of perseveration have never been indepen-dently measured before. Most studies of perseveration in neglect(including all of the ones listed above) have statistically analysedmeasures which broadly correspond to our AM, i.e., to the behaviourof adding separate, further marks over already cancelled targets (seeFig. 1 and related text). However not all studies are clear as towhether, and how, the authors distinguished between AM andscribbling behaviour; hence the failure to find a neglect-perseverationcorrelation might, at least partly, be due to the fact that in what theauthors called ‘perseveration’, there were both AM and scribblingbehaviours—and we now know that the latter is completely inde-pendent of neglect, both functionally and anatomically.
However, we believe that another factor contributed to such afailure. In the three studies cited above which did not detect aneglect-perseveration density correlation, neglect patients had verylow perseveration density scores: Pia et al. (2009) reported anaverage density of .192 AM per target (N¼8; see their Table 1);Ronchi et al. (2009) a density of .041 (star cancellation), .009(letter cancellation) and .01 (line cancellation) AM per target(N¼14, see their Table 2); Ronchi et al. (2012) a density of .186AM per target (N¼17, see their Table 2, scattered star cancellationtest). In the present experiment (see Table 1) average AM densitywas .516 (N¼33), i.e. 2.7 to 57.3 times more intense perseverationthan in the Pia and Ronchi studies. With high levels of persevera-tion, we could detect a correlation that might have been swampedor flattened with low levels of perseveration. While ours and thePia and Ronchi studies differ in many respects, one major factoraccounting for the marked differences in perseveration is illnessduration. All of our patients were in the acute or subacute phase(10.379.5 days post-onset); Pia et al.’s patients were often in thechronic phase (1627166), as were Ronchi et al.’s patients (firststudy, 2009: 1267222; second, 2012: 1137161). Because Ronchiet al. (2009) administered an Albert test that is similar to ours (40lines scattered across an A4 sheet), we performed a directstatistical comparison (reported in Section 5.3). Results were quiteclear and confirmed that illness duration is critical: our 33patients, who were in the (sub)acute phase, showed both floridneglect and florid perseveration; Ronchi et al.’s 14 patients, whowere mostly in the chronic phase, showed milder neglect andvirtually no perseveration. Therefore, the lack of neglect severity-perseveration correlation in the Ronchi and Pia studies might bedue to the reduced variability (floor effect) that seems to char-acterize chronic patients. A further confirmation is in the fact thatthe studies whose data demonstrate a significant neglect-perse-veration correlation were carried out on patients in the (sub)acutephase: Nys et al. (2006), 10.676.4 days, N¼23, see their Table 1;Na et al. (1999), 10.578.6 days, N¼60; Rusconi et al. (2002), datareanalysed by (Toraldo et al., 2005), 11.8712.2 days, N¼35, seetheir Table 1; Kleinman et al. (2013), data reanalysed in the 2nd
paragraph of this Section: o24 h, N¼14, see their Fig. 5. Kleinmanet al. (2013) stressed the need to test patients in the acute stage,before significant reorganization or recovery has taken place.An open question is whether FM and scribble perseveration, which
(to our knowledge) have not been specifically studied before, arespecific of the (sub)acute stage.
6.2.2. Omissions and perseverations share some mechanisms, and donot share some others
Ronchi et al. (2012) showed that omissions and perseverationsrespond in opposite ways to one experimental manipulation: omis-sions were more frequent when stimuli to be cancelled were lettersthan when they were stars; by contrast, perseveration density washigher with stars than with letters. These results demonstrate thatthere are at least two (mis)processing components, one that isspecific for omissions, and another that is specific for perseverations.However, this does not clash with the notion that there are otherprocesses that omissions and perseverations share. Ronchi et al.(2012) themselves report another experimental manipulation, whichaffects both omissions and perseverations in the same direction: thisis the distribution of targets, either in rows, or scattered across thedisplay. The scattered condition is associated with both more severeneglect and more severe perseveration than the targets-in-rowscondition. Such an effect fits nicely with our proposed account thatomissions and AM perseverations are both influenced by an atten-tional disengaging disorder (C1 in Fig. 2). Indeed, if targets arearranged in rows, the patient is induced to develop an orderedscanning strategy, which can help him/her cyclically disengagingattention from targets. If attention is more easily disengaged fromtargets, the prediction is that neglect will ameliorate and AM will bereduced—what indeed was observed by Ronchi et al. (2012). There isyet another effect which supports the view that omissions andperseverations share some disorder(s). Many papers reported thatperseveration is more severe on the right than on the left side of thedisplay (Manly et al., 2002; Na et al., 1999; Nys et al., 2006; Ronchiet al., 2012, 2009).7 We could replicate this by our MGzLM analyses,in which we showed that AM density significantly decreasedfrom right to left. The criticality of such results, which has so farbeen generally overlooked, is in the fact that the position effect iswithin-patients. While a between-patients relationship, like theomissions-perseverations correlation, can be criticized as just reflect-ing anatomical contiguity of separate processes, within-patienteffects are immune to such criticism and constitute compellingevidence that perseveration and neglect are functionally connected(see Na et al., 1999 for similar reasoning).
In summary, our view is that there are factors that are sharedby perseverations and omissions (e.g. attentional disengagingdisorder), as well as other factors that omissions and persevera-tions do not share (e.g. those causing the dissociations reported byRonchi et al., 2012).8
6.3. Comparison of our anatomical results with the literature
To our knowledge, none of the previous studies has specificallymeasured FM and scribble perseveration as separate components.So we will focus on AM perseveration, which broadly correspondsto what was measured in the literature. All cited anatomicalregions are in the right hemisphere.
Overall, our results converge with previous studies as for theinvolvement of the frontal cortex (IFG), the temporal cortex (STG)and the insula in both neglect severity and perseveration (IFG inneglect: e.g. Verdon, Schwartz, Lovblad, Hauert, & Vuilleumier,
6 Vallar et al. (2006) did not report raw data so we could not re-analyze them.
7 We are not sure whether Na et al. (1999, 2006) analyses reflect a real positioneffect; indeed they do not specify whether Patient was introduced as a (randomeffect) covariate; if not, a (false) effect of position might have been simulated by theacross-patients neglect-perseveration correlation.
8 In this logic, we should have added C4, C5, C6, etc. on the middle row of Fig. 2,some of which load on AM, and some others on neglect severity—we avoided doingso just for the sake of clarity of the illustration.
M. Gandola et al. / Neuropsychologia 51 (2013) 2960–2975 2971

2010; IFG in perseveration: Kleinman et al., 2013, Brodmann Area46; STG in neglect: Karnath, Ferber, & Himmelbach, 2001; Karnath,Fruhmann Berger, Kuker, & Rorden, 2004; Karnath, Rennig,Johannsen, & Rorden, 2011; STG in perseveration: Pia et al., 2009;insula in neglect: Karnath et al., 2011; insula in perseveration:Ronchi et al., 2012). However, we failed to find basal gangliainvolvement (perseveration: Na et al., 1999; Rusconi et al., 2002;Nys et al., 2006, caudate nucleus; Pia et al., 2009; neglect: Karnathet al., 2011) or parietal involvement (neglect: Mort et al. 2003,angular gyrus; Verdon et al., 2010, IPL; perseveration: Pia et al.,2009, supramarginal and angular gyri); conversely, we found amassive involvement of rolandic operculum in both symptoms,a result which, to our knowledge, was never reported before (Karnathet al., 2011, reported a minor 5% involvement in neglect). We are notsurprised by the discrepancies between ours and other studies, giventhat each study used a different combination of task(s), measures,sampling procedure, and lesion-symptom mapping method (seeCorbetta & Shulman, 2011, and Husain & Rorden, 2003, for criticalreviews). The VLSM analysis we performed is likely to be the mostpowerful method given the available data, as it exploits all of thevariance involved in the observed measures (Rorden et al., 2007).Part of the discrepancies might be due to our separate evaluation ofperseveration sub-varieties, AM, FM and scribble, which was notapplied by other authors, and to the fact that we tested patient inthe (sub)acute phase, while other authors studied patients in thechronic phase, i.e. after significant reorganization of the cognitivesystem.
The involvement of STG in both neglect severity and perseveration(which was found in our study and confirmed in at least one of theprevious studies), is fully compatible with our view that they bothshare a common factor—an attentional disengage deficit (C1 inFig. 2). Hence an indirect inference would be that the right STGmight be critical for disengaging attention from right-sided stimuli.Some positive evidence has been reported by Friedrich et al. (1998);but see Corbetta & Shulman, 2011, for an alternative view.
7. Conclusions
To conclude, our data strongly suggest the existence of threeseparate dysfunctional mechanisms producing perseveration inneglect. One mechanism, linked to a first set of areas (rolandicoperculum, superior temporal cortex, frontal inferior cortex),produces ‘additional marks’ perseveration, which in turn is statis-tically correlated with neglect severity. We interpreted suchmechanism to be a failure in disengaging spatial attention fromright-sided targets (Posner et al., 1984). A second mechanism,linked to dorsal premotor and temporal pole lesions, yields ‘flyingmarks’ perseverations, which also are statistically associated withneglect severity. We speculated the underlying factor to be adeficit of directional hypokinesia (Sapir et al., 2007). A thirdmechanism, anatomically determined by a lesion of the prefrontalcortex and caudate nucleus, produces scribble perseveration, whichis not statistically related to neglect severity. The straightforwardinference is that the latter mechanism does not entail anythingspatial in nature, but rather, relates to executive aspects of motorcontrol. The ideal candidate is a mechanism of action monitoring(Luria, 1965), whose disruption leads to inability to stop aninitiated motor response—hence the scribbling behaviour.
The proposed distinction between three systems/dysfunctions canexplain part of the discrepancies across studies concerning, forinstance, the relationship between perseveration and neglect severity(Kleinman et al., 2013; Na et al., 1999; Pia et al., 2009; Ronchi et al.,2009; Rusconi et al., 2002; Toraldo et al., 2005), the effect of thepresence of left sided targets on perseveration severity (Bottini &Toraldo, 2003; Manly et al., 2002; Pia et al., 2009; Toraldo et al., 2005)
and the effect of physiological manipulations (Khurshid et al., 2009;Nys et al., 2008; Vallar et al., 2006), albeit we provided evidence thatmarked differences in illness duration also played a critical role.
We do not imply that our three-factor model explains all thefeatures of the three types of perseveration, and of neglect. Each ofthe four symptoms is certainly multifactorial: an immense litera-ture has demonstrated the multicomponentiality of neglect, Kimet al. (2009) have already described different sub-types of ‘addi-tional marks’ perseveration, etc. Moreover, the deficits of atten-tional disengaging and of directional hypokinesia, which weproposed as factors in the genesis of ‘additional’ and ‘flying’ marksproduction respectively, are certainly incomplete explanations.Indeed, while a failure to disengage attention from a target canstrongly facilitate a re-marking of it, it does not explain why thepatient fails to consider that the target has already been cancelled.Similarly, directional hypokinesia can lead to the programming of amovement towards an empty region of the display, but it does notexplain why the patient then fails to stop the inappropriate markingof that empty region. We believe that dis-executive deficits of adifferent nature—e.g. of monitoring, or of inhibition of pre-activatedschemas (Cooper & Shallice, 2006; Reverberi, Lavaroni, Gigli, Skrap, &Shallice, 2005; Trafton, Altmann, & Ratwani, 2011) should have a role.For instance, a promising way forward might be to interpret our AMand FM errors as, respectively, ‘recurrent perseveration’ and ‘antici-pation’ errors9, which have been successfully modelled by, e.g.,Trafton et al. (2011) in studies about sequential actions regulation.However, our present data cannot speak against or in favour of anysuch a model, so any conclusion is premature at this stage. We onlywish to emphasize that three (C1, C2, C3) is certainly less than thereal number of disorders intervening in AM, FM, scribble persevera-tion and left-side omissions. Our three-factor model is offered just asa parsimonious account of the complex pattern of correlations,dissociations, and anatomical overlapping profiles that we observed,and as a possible starting point to drive further investigation.
Acknowledgements
This study was supported in part by the grant PRIN 2007 to EPand GB.
Appendix A. Procedure of mark classification andmeasurement
The procedure begunwith the use of a flowchart (Fig. A1), whichclassified the ink traces found on the paper sheet of the Albert task.First, separate ink traces were identified—i.e., ink traces that wereeach produced by a separate pen-to-paper contact, without inter-rupting it. Second, ink traces that were probably produced byaccidental pen-to-paper contacts were excluded from further ana-lyses; the remaining ink traces, which were produced voluntarily,were called ‘marks’, and were further subdivided into ‘complexmarks’ – marks that have a meaning, form a recognizable drawing,or are part of a symbol like a letter etc., and ‘proper marks’, i.e.meaningless marks – those usually produced for cancelling targets.The next step was to classify each proper mark according to thedistance from the closest target: marks that overlapped a target orwere less than 4 mm away from it (we considered the minimaldistance between any part of the mark and any part of the target),were classified as ‘cancellation marks’; marks lying further awaywere classified as ‘flying marks’. In the last step of the procedure,we measured how much ‘scribbling behaviour’ characterised each
9 The patient might ‘anticipate’ the action of marking, i.e. perform it before thepre-condition of having landed onto a target has been achieved.
M. Gandola et al. / Neuropsychologia 51 (2013) 2960–29752972

proper mark, by following the procedure in Toraldo (2013). Detailsfrom single steps of the procedure are provided below.
Complex marks
If a ‘complex mark’ (e.g. the drawing of a goose, or a writtenword—e.g. Sedda, Passoni, & Bottini, 2012) was drawn across orvery close to a target (distance criteria fulfilled), that mark countedas a ‘cancellation mark’ because the proximity to the targetwitnesses the intention to cancel it. So the mark entered the AMcomputation, and the target was classified as a ‘detected’ target.However, no Scribble index was computed on the mark becausethe nature of ‘complex marks’ makes the Scribble index mean-ingless. By contrast, if a ‘complex mark’ was found away from anytarget (distance criterion not fulfilled) it did not count as a ‘flyingmark’. Indeed a ‘flying mark’ is conceptually defined as a mark inwhich the intention to cancel a target is transparent, but thelocation is wrong. When a mark was found well away from anytarget, the only feature that could witness the intention to cancelsomething, was the nature of the mark: if it was a proper(classical) one, then the intention to use it for cancelling wasassumed to be clear and the mark was classified as a ‘flying mark’.By contrast, if the distant mark was of the ‘complex’ type, theintention to use it for cancelling something became opaque:a goose drawn well away from any target is more likely to reflect abizarre, task-irrelevant behavior than the intention to cancel a targetanywhere in the display.
Distance criterion
The logic here was to understand whether the patient had hitor missed the target—i.e., whether s/he had produced a ‘cancella-tion mark’, or a ‘flying’ mark. Obviously, if the mark was drawnover the target, or in the very close vicinities of it (we chose 4 mmof distance as a cut-off), a hit was diagnosed, and the mark wascalled a ‘cancellation mark’. If the mark was further out (more than4 mm away in our procedure), that did not necessarily mean thatthe patient missed the target. Indeed there are subjects whose‘cancellation style’ is to draw a mark some distance away from the
target, and not over it—one patient in our sample (#17) ‘cancelled’all the targets in this way, with distances up to 6 mm from them.So we developed a statistical criterion that took into account eachpatient’s cancellation style—namely, we looked at the distributionof distances of all marks from their closest target, and moved thecut-off of the patient to the distance where the decreasing portionof the frequency distribution ended. In any case, the cut-off couldnot be less than 4 mm.
Appendix B. Methodological remarks
Two methodological remarks are provided here. (i) In our analysis,we included an example of how a theory derived from purelybehavioural measures, and expressed in purely cognitive terms (ourdiagram in Fig. 2) can produce predictions on an anatomo-functionalmapping and even on anatomical distance between critical regions(Section 3.6). In turn, the empirically observed anatomo-functionalmapping (Fig. 4, Section 4.3) suggested a modification in the cognitivetheory (dashed arrow in Fig. 2), with, again, new cognitive predictionsbeing generated (Section 4.6) and later tested (Sections 6.1.2, 5.2).We believe this is a valuable example of fruitful interaction betweenbehavioural data analysis, cognitive modelling, and anatomical dataanalysis (see Toraldo, Cattani, Zonca, Saletta, & Luzzatti, 2006, p. 486,for another example). (ii) We provided a useful example of how ananatomical double-dissociation can serve neuropsychological theoriz-ing. AM and FM did not double-dissociate behaviourally (Table 2)—perhaps because of statistical power limitations (see low SD detectionrates in Table 2). However, they double-dissociated anatomically,given that there were large areas specific of AM and large areasspecific of FM (Fig. 4, red vs. green). So, we could reject the scenariothat FM and AM reflect exactly a same disorder, and could assumethat FM and AM reflect at least partly separate disorders (C1 and C2in Fig. 2), on grounds of anatomical data, and despite the failure tofind behavioural double dissociations.
Appendix C. Results of the VLSM analysis
See Table C1.
Fig. A1. Procedure of classification of cancellation performance. The top row of boxes (text in italics) reports successive steps (left to right) in the classification procedure. Theother boxes, arranged in a flowchart, report the categories resulting from successive steps of classification. See text for other details.
M. Gandola et al. / Neuropsychologia 51 (2013) 2960–2975 2973

References
Albert, M. L. (1973). A simple test of visual neglect. Neurology, 23, 658–664.Allison, R. S., & Hurwitz, L. J. (1967). On perseveration in aphasics. Brain, 90, 429–448.Binder, J., Marshall, R., Lazar, R., Benjamin, J., & Mohr, J. P. (1992). Distinct
syndromes of hemineglect. Archives of Neurology, 49, 1187–1194.
Bisiach, E., Geminiani, G., Berti, A., & Rusconi, M. L. (1990). Perceptual and premotorfactors of unilateral neglect. Neurology, 40, 1278–1281.
Bisiach, E., Ricci, R., Lualdi, M., & Colombo, M. R. (1998). Perceptual and responsebias in unilateral neglect: Two modified versions of the milner landmark task.Brain and Cognition, 37, 369–386.
Bisiach, E., Vallar, G., Perani, D., Papagno, C., & Berti, A. (1986). Unawarenessof disease following lesions of the right hemisphere: Anosognosia for
Table C1Brain regions significantly associated with each type of perseveration are reported: ‘additional marks’ (A), ‘scribble’ (B) and ‘flying marks’ perseveration (C). Total number (N)and percentage (%) of voxels that showed a significant difference at the Bruner-Munzel (BM) test (statistical threshold: po .01 uncorrected) are reported together with themaximum Z-score and its MNI coordinates. The last three columns (voxel count overlay) report the voxel counts for areas of overlap between the perseveration measure andthe other three measures: Ng¼neglect severity; AM¼ ‘additional marks’; S¼ ‘scribble’; FM¼ ‘flying marks’ perseveration. White matter¼subcortical white matter regions notincluded in the AAL template. Regions with a number of damaged voxels lower than 50 were not reported.
A. ‘Additional Marks’ perseverationBrain region Voxel count at BM test MNI coordinates Voxel count overlay
N % x y z Z-score AMþNg AMþS AMþFM
White matter 4556 0.08 41 �22 26 3.6 2439 0 2Precentral gyrus 333 1.23 65 9 18 2.8 295 0 0Middle frontal gyrus 336 0.83 34 44 3 2.4 335 0 0Inferior frontal gyrusOpercular part 2406 21.53 64 16 10 3.4 519 0 0Triangular part 1938 11.31 39 21 15 2.8 1800 0 0Rolandic operculum 4649 43.32 48 2 10 4.2 2378 0 0Insula 1425 10.09 48 �7 7 3.8 348 0 30Hippocampus 53 0.70 42 �17 �13 3.0 18 0 0Postcentral gyrus 463 1.51 60 �1 18 3.3 435 0 0Supramarginal gyrus 277 1.76 47 �25 25 2.9 166 0 0Heschl gyrus 678 35.02 47 �10 7 3.8 198 0 0Superior temporal gyrus 1927 7.63 51 �1 4 3.3 866 0 12Superior temporal pole 191 1.79 43 28 �31 2.9 0 0 0Middle temporal gyrus 1288 3.63 47 �5 �17 3.0 221 0 0Middle temporal pole 104 1.10 49 20 �30 2.9 0 0 0Inferior temporal gyrus 257 0.90 63 �11 �31 2.9 0 0 0
B. ‘Scribble’ perseverationBrain region Voxel count at BM test MNI coordinates Voxel count overlay
N % x y z Z-score SþNg SþAM SþFM
White matter 2343 0.04 68 1 6 3.4 1 0 0Superior frontal gyrus 1681 5.24 29 45 7 2.5 0 0 0Orbitofrontal cortexSuperior 1527 19.43 13 67 �17 2.4 0 0 0Middle 342 4.24 46 53 �4 2.5 0 0 0Medial 237 3.45 11 52 �14 2.4 0 0 0Middle frontal gyrus 1803 4.47 44 58 3 2.5 0 0 0Caudate 593 7.47 14 9 12 2.9 0 0 0
C. ‘Flying Marks’ perseverationBrain region Voxel count at BM test MNI coordinates Voxel count overlay
N % x y z Z-score FMþNg FMþAM FMþS
White matter 5051 0.09 71 �34 3 3.2 2927 2 0Precentral gyrus 1466 5.42 66 12 21 3.2 507 0 0Superior frontal gyrus 207 0.65 26 �11 57 2.5 0 0 0Orbitofrontal cortexSuperior 72 0.92 10 68 �17 2.7 72 0 0Middle 55 0.68 47 55 0 3.2 34 0 0Inferior 465 3.38 55 44 �7 2.7 448 0 0Middle frontal gyrus 3755 9.30 48 54 0 3.2 3686 0 0Inferior frontal gyrusOpercular part 1462 13.08 29 13 30 2.6 1375 0 0Triangular part 1170 6.83 60 37 1 3.2 1138 0 0Insula 74 0.52 33 �14 22 2.9 60 30 0ParaHippocampal 134 1.48 29 4 �32 2.5 134 0 0Amygdala 154 7.84 30 2 �20 2.6 75 0 0Superior occipital gyrus 158 1.42 35 �78 44 2.6 0 0 0Fusiform 108 0.53 31 0 �32 2.5 108 0 0Postcentral gyrus 89 0.29 67 �11 32 2.6 60 0 0Superior parietal lobe 85 0.48 24 �62 50 2.6 0 12 0Superior temporal gyrus 137 0.54 70 �12 �1 3.2 9 0 0Superior temporal pole 1393 13.07 35 15 �22 2.6 1221 0 0Middle temporal gyrus 259 0.73 56 �69 21 3.1 161 0 0Middle temporal pole 1746 18.44 32 24 �37 2.5 1746 0 0Inferior temporal gyrus 396 1.39 39 �1 �31 2.5 374 0 0
M. Gandola et al. / Neuropsychologia 51 (2013) 2960–29752974

hemiplegia and anosognosia for hemianopia. Neuropsychologia, 24,471–482.
Blangero, A., Ota, H., Rossetti, Y., Fujii, T., Ohtake, H., Tabuchi, M., et al. (2010).Systematic retinotopic reaching error vectors in unilateral optic ataxia. Cortex,46, 77–93.
Bottini, G., Bisiach, E., Sterzi, R., & Vallar, G. (2002). Feeling touches in someoneelse's hand. Neuroreport, 13, 249–252.
Bottini, G., & Toraldo, A. (2003). The influence of contralesional targets on thecancellation of ipsilesional targets in unilateral neglect. Brain and Cognition, 53,117–120.
Buiatti, T., Mussoni, A., Toraldo, A., Skrap, M., & Shallice, T. (2011). Two qualitativelydifferent impairments in making rotation operations. Cortex, 47, 166–179.
Casey, B. J., Trainor, R. J., Orendi, J. L., Schubert, A. B., Nystrom, L. E., Giedd, J. N., et al.(1997). A developmental functional MRI study of prefrontal activation duringperformance of a go-no-go task. Journal of Cognitive Neuroscience, 9, 835–847.
Cohen, L., & Dehaene, S. (1998). Competition between past and present. Assessmentand interpretation of verbal perseverations. Brain, 121, 1641–1659.
Cooper, J. A., Sagar, H. J., Tidswell, P., & Jordan, N. (1994). Slowed central processingin simple and go/no-go reaction time tasks in Parkinson's disease. Brain, 117,517–529.
Cooper, R. P., & Shallice, T. (2006). Hierarchical schemas and goals in the control ofsequential behavior. Psychological Review, 113, 887–916 (discussion 917-831).
Corbetta, M., & Shulman, G. L. (2011). Spatial neglect and attention networks.Annual Review of Neuroscience, 34, 569–599.
Critchley, M. (1964). Psychiatric symptoms and parietal disease: Differentialdiagnosis. Proceedings of the Royal Society of Medicine, 57, 422-428.
Diller, L., & Weinberg, J. (1977). Hemi-inattention in rehabilitation. The evolution ofa rational remediation program. In: E. A. Weinstein, & R. P. Friedland (Eds.),Hemi-inattention and Hemisphere Specialization (pp. 62–82). New York: RavenPress.
Friedrich, F. J., Egly, R., Rafal, R. D., & Beck, D. (1998). Spatial attention deficits inhumans: A comparison of superior parietal and temporal-parietal junctionlesions. Neuropsychology, 12, 193–207.
Gandola, M., Invernizzi, P., Sedda, A., Ferrè, E. R., Sterzi, R., Sberna, M., et al. (2012).An anatomical account of somatoparaphrenia. Cortex, 48, 1165–1178.
Gandola, M., Toraldo, A., Paulesu, E., Corrado, L., Invernizzi, P., & Bottini, G. (2007).Anatomical correlates of different types of perseveration in patients withneglect. Body Representation Workshop, Rovereto, Italy, 8–10 October 2007.
Garavan, H., Ross, T. J., & Stein, E. A. (1999). Right hemispheric dominance ofinhibitory control: An event-related functional MRI study. Proceedings of theNational Academy of Sciences of the United States of America, 96, 8301–8306.
Heilman, K. M., Bowers, D., Coslett, H. B., Whelan, H., & Watson, R. T. (1985).Directional hypokinesia: Prolonged reaction times for leftward movements inpatients with right hemisphere lesions and neglect. Neurology, 35, 855–859.
Husain, M., Mannan, S., Hodgson, T., Wojciulik, E., Driver, J., & Kennard, C. (2001).Impaired spatial working memory across saccades contributes to abnormalsearch in parietal neglect. Brain, 124, 941–952.
Husain, M., Mattingley, J. B., Rorden, C., Kennard, C., & Driver, J. (2000). Distinguish-ing sensory and motor biases in parietal and frontal neglect. Brain, 123,1643–1659.
Husain, M., & Rorden, C. (2003). Non-spatially lateralized mechanisms in hemi-spatial neglect. Nature Reviews, Neuroscience, 4, 26–36.
Karnath, H. O., Ferber, S., & Himmelbach, M. (2001). Spatial awareness is a functionof the temporal not the posterior parietal lobe. Nature, 411, 950–953.
Karnath, H. O., Fruhmann Berger, M., Kuker, W., & Rorden, C. (2004). The anatomyof spatial neglect based on voxelwise statistical analysis: A study of 140patients. Cerebral Cortex, 14, 1164–1172.
Karnath, H. O., Rennig, J., Johannsen, L., & Rorden, C. (2011). The anatomy under-lying acute versus chronic spatial neglect: A longitudinal study. Brain, 134,903–912.
Khurshid, S., Longin, H., Crucian, G. P., & Barrett, A. M. (2009). Monocular patchingaffects inattention but not perseveration in spatial neglect. Neurocase, 15,311–317.
Kim, E. J., Lee, B. H., Park, K. C., Suh, M. K., Ku, B. D., Heilman, K. M., et al. (2009).Consecutive versus return motor perseveration during line cancellation task inhemispatial neglect. Cognitive and Behavioral Neurology, 22, 122–126.
Kinsbourne, M., & Warrington, E. K. (1963). A study of visual perservation. Journal ofNeurology, Neurosurgery, and Psychiatry, 26, 468–475.
Kleinman, J. T., DuBois, J. C., Newhart, M., & Hillis, A. E. (2013). Disentangling theneuroanatomical correlates of perseveration from unilateral spatial neglect.Behavioural Neurology, 26, 131–138.
Liepmann, H. (1905). Über die Störungen des Handelns bei Gehirnkranken. Berlin:S. Karger Verlag.
Luria, A. R. (1965). Two kinds of motor perseveration in massive injury of thefrontal lobes. Brain, 88, 1–10.
Malhotra, P., Jager, H. R., Parton, A., Greenwood, R., Playford, E. D., Brown, M. M.,et al. (2005). Spatial working memory capacity in unilateral neglect. Brain, 128,424–435.
Manly, T., Woldt, K., Watson, P., & Warburton, E. (2002). Is motor perseveration inunilateral neglect 'driven' by the presence of neglected left-sided stimuli?Neuropsychologia, 40, 1794–1803.
Mattingley, J. B., Husain, M., Rorden, C., Kennard, C., & Driver, J. (1998). Motor role ofhuman inferior parietal lobe revealed in unilateral neglect patients. Nature, 392,179–182.
Mort, D. J., Malhotra, P., Mannan, S. K., Rorden, C., Pambakian, A., Kennard, C., et al.(2003). The anatomy of visual neglect. Brain, 126, 1986–1997.
Na, D. L., Adair, J. C., Kang, Y., Chung, C. S., Lee, K. H., & Heilman, K. M. (1999). Motorperseverative behavior on a line cancellation task. Neurology, 52, 1569–1576.
Nys, G. M., Seurinck, R., & Dijkerman, H. C. (2008). Prism adaptation movesneglect-related perseveration to contralesional space. Cognitive and BehavioralNeurology, 21, 249–253.
Nys, G. M., van Zandvoort, M. J., van der Worp, H. B., Kappelle, L. J., & de Haan, E. H.(2006). Neuropsychological and neuroanatomical correlates of perseverativeresponses in subacute stroke. Brain, 129, 2148–2157.
Perenin, M. T., & Vighetto, A. (1988). Optic ataxia: A specific disruption invisuomotor mechanisms. I. Different aspects of the deficit in reaching forobjects. Brain, 111, 643–674.
Pia, L., Folegatti, A., Guagliardo, M., Genero, R., & Gindri, P. (2009). Are drawingperseverations part of the neglect syndrome? Cortex, 45, 293–299.
Posner, M. I., Walker, J. A., Friedrich, F. J., & Rafal, R. D. (1984). Effects of parietalinjury on covert orienting of attention. Journal of Neuroscience, 4, 1863–1874.
Reverberi, C., Lavaroni, A., Gigli, G. L., Skrap, M., & Shallice, T. (2005). Specificimpairments of rule induction in different frontal lobe subgroups. Neuropsy-chologia, 43, 460–472.
Rieger, M., Gauggel, S., & Burmeister, K. (2003). Inhibition of ongoing responsesfollowing frontal, nonfrontal, and basal ganglia lesions. Neuropsychology, 17,272–282.
Ronchi, R., Algeri, L., Chiapella, L., Spada, M. S., & Vallar, G. (2012). Spatialneglect and perseveration in visuomotor exploration. Neuropsychology, 26,588–603.
Ronchi, R., Posteraro, L., Fortis, P., Bricolo, E., & Vallar, G. (2009). Perseveration in leftspatial neglect: Drawing and cancellation tasks. Cortex, 45, 300–312.
Rorden, C., & Karnath, H. O. (2010). A simple measure of neglect severity.Neuropsychologia, 48, 2758–2763.
Rorden, C., Karnath, H. O., & Bonilha, L. (2007). Improving lesion-symptommapping. Journal of Cognitive Neuroscience, 19, 1081–1088.
Rusconi, M. L., Maravita, A., Bottini, G., & Vallar, G. (2002). Is the intact side reallyintact? Perseverative responses in patients with unilateral neglect: A produc-tive manifestation. Neuropsychologia, 40, 594–604.
Sandson, J., & Albert, M. L. (1984). Varieties of perseveration. Neuropsychologia, 22,715–732.
Sandson, J., & Albert, M. L. (1987). Perseveration in behavioral neurology. Neurology,37, 1736–1741.
Sapir, A., Kaplan, J. B., He, B. J., & Corbetta, M. (2007). Anatomical correlates ofdirectional hypokinesia in patients with hemispatial neglect. Journal of Neuro-science, 27, 4045–4051.
Sedda, A., Passoni, S., & Bottini, G. (2012). Perseverations and non-verbal con-fabulations on the Rey-Osterrieth complex figure test in a fronto-temporaldementia single case study. Neurocase, 18, 366–376.
Shallice, T. (1988). From neuropsychology to mental structure. Cambridge: CambridgeUniversity Press.
Toraldo, A. (2013). How many movements in a scribble? A method for quantifying"continuous" perseveration in cancellation tasks. Frontiers in Human Neu-roscience, 7, 332.
Toraldo, A., & Bottini, G. (2006). Omission vs. shift of details in spatial representa-tions. In: T. Vecchi, & G. Bottini (Eds.), Imagery and spatial cognition: Methods,models and clinical assessment (advances in consciousness research) (pp. 395–415). Amsterdam: Benjamins.
Toraldo, A., Cattani, B., Zonca, G., Saletta, P., & Luzzatti, C. (2006). Reading disordersin a language with shallow orthography: A multiple single-case study in Italian.Aphasiology, 20, 823–850.
Toraldo, A., Gandola, M., Loffredo, S., Rancati, A., Zanardi, G., & Bottini, G. (2005).Canceling out both the real and the spectral lines. Brain and Cognition, 57,226–235.
Toraldo, A., Laiacona, M., Pagani, R., Mandelli, A., & Capitani, E. (2012). Perceptualand response-related components of unilateral neglect may evolve indepen-dently of one another: Evidence from five single-case studies. Neurocase, http://dx.doi.org/10.1080/13554794.2012.741257.
Toraldo, A., McIntosh, R. D., Dijkerman, H. C., & Milner, A. D. (2004). A revisedmethod for analysing neglect using the landmark task. Cortex, 40, 415–431.
Trafton, J. G., Altmann, E. M., & Ratwani, R. M. (2011). A memory for goals model ofsequence errors. Cognitive Systems Research, 12, 134–143.
Tzourio-Mazoyer, N., Landeau, B., Papathanassiou, D., Crivello, F., Etard, O., Delcroix,N., et al. (2002). Automated anatomical labeling of activations in SPM using amacroscopic anatomical parcellation of the MNI MRI single-subject brain.NeuroImage, 15, 273–289.
Vallar, G., Zilli, T., Gandola, M., & Bottini, G. (2006). Productive and defectiveimpairments in the neglect syndrome: Graphic perseveration, drawing produc-tions and optic prism exposure. Cortex, 42, 911–920.
Verdon, V., Schwartz, S., Lovblad, K. O., Hauert, C. A., & Vuilleumier, P. (2010).Neuroanatomy of hemispatial neglect and its functional components: A studyusing voxel-based lesion-symptom mapping. Brain, 133, 880–894.
Yamadori, A. (1981). Verbal perseveration in aphasia. Neuropsychologia, 19,591–594.
M. Gandola et al. / Neuropsychologia 51 (2013) 2960–2975 2975