How is the Mobile Internet Different?
38
Electronic copy available at: http://ssrn.com/abstract=1732759 1 How is the Mobile Internet Different? Ranking Effects and Local Activities * Anindya Ghose New York University [email protected] Avi Goldfarb University of Toronto [email protected] Sang Pil Han City University of Hong Kong [email protected] November 2011 Abstract We explore how internet browsing behavior varies between mobile phones and personal computers. Smaller screen sizes on mobile phones increase the cost to the user of reading information. In addition, a wider range of offline locations for mobile internet usage suggests that local activities are particularly important. Using data on user behavior at a (Twitter-like) microblogging service, we exploit exogenous variation in the ranking mechanism of posts to identify the ranking effects. We show (1) Ranking effects are higher on mobile phones: Links that appear at the top of the screen are especially likely to be clicked on mobile phones and (2) The benefit of searching for geographically close matches is higher on mobile phones: Stores located in close proximity to a user are much more likely to be clicked on mobile phones. Thus, the mobile internet is somewhat less “internet-like”: search costs related to ranking effects are higher and distance matters more. Our results also suggest a possible exception: while ranking effect- related search costs are higher in a mobile phone, recency-related search costs (the cost of acquiring timely information) appear to be lower on a mobile phone than on a PC. We speculate on how these changes may affect the future direction of internet commerce. Keywords: Mobile Internet, Ranking Effects, Primacy Effects, Recency Effects, Local Commerce, Microblogging, Social Media, User Behavior, Hierarchical Bayesian. * We thank the Wharton Interactive Media Initiative for support, and Ramayya Krishnan, Vandana Ranachandran, Raghuram Iyengar and seminar participants at SICS 2011, Marketing Science Conference 2011, Second Annual Searle Center Conference on Internet Search and Innovation 2011, SCECR 2011, WISE 2010, INFORMS-CIST 2010, and the MSI-WIMI Conference on Crossplatform and Multichannel Customer Behavior for helpful comments. Support was provided by an NSF CAREER Award IIS-0643847 and a MSI-WIMI research grant. All opinions and errors are ours alone.
Transcript of How is the Mobile Internet Different?
Electronic copy available at: http://ssrn.com/abstract=1732759
1
How is the Mobile Internet Different? Ranking Effects and Local Activities*
Anindya Ghose New York University [email protected]
Avi Goldfarb University of Toronto
Sang Pil Han City University of Hong Kong
November 2011
Abstract
We explore how internet browsing behavior varies between mobile phones and personal computers. Smaller screen sizes on mobile phones increase the cost to the user of reading information. In addition, a wider range of offline locations for mobile internet usage suggests that local activities are particularly important. Using data on user behavior at a (Twitter-like) microblogging service, we exploit exogenous variation in the ranking mechanism of posts to identify the ranking effects. We show (1) Ranking effects are higher on mobile phones: Links that appear at the top of the screen are especially likely to be clicked on mobile phones and (2) The benefit of searching for geographically close matches is higher on mobile phones: Stores located in close proximity to a user are much more likely to be clicked on mobile phones. Thus, the mobile internet is somewhat less “internet-like”: search costs related to ranking effects are higher and distance matters more. Our results also suggest a possible exception: while ranking effect-related search costs are higher in a mobile phone, recency-related search costs (the cost of acquiring timely information) appear to be lower on a mobile phone than on a PC. We speculate on how these changes may affect the future direction of internet commerce. Keywords: Mobile Internet, Ranking Effects, Primacy Effects, Recency Effects, Local Commerce, Microblogging, Social Media, User Behavior, Hierarchical Bayesian.
* We thank the Wharton Interactive Media Initiative for support, and Ramayya Krishnan, Vandana Ranachandran, Raghuram Iyengar and seminar participants at SICS 2011, Marketing Science Conference 2011, Second Annual Searle Center Conference on Internet Search and Innovation 2011, SCECR 2011, WISE 2010, INFORMS-CIST 2010, and the MSI-WIMI Conference on Crossplatform and Multichannel Customer Behavior for helpful comments. Support was provided by an NSF CAREER Award IIS-0643847 and a MSI-WIMI research grant. All opinions and errors are ours alone.
Electronic copy available at: http://ssrn.com/abstract=1732759
2
1. Introduction
After nearly two decades of research on the economic consequences of the internet, two findings
have consistently appeared in the literature: search costs are lower online (Bakos 1997, Baye et al. 2009,
etc.) and the internet can overcome geographic isolation (Balasubramanian 1998, Forman et al. 2009,
Choi and Bell 2011, etc.). Both of these suggest that the addition of the internet channel has generated
increased competition for both online and offline firms. While companies try to mitigate these effects
with obfuscation, differentiation, and targeting (Ellison and Ellison 2009, Brynjolfsson et al. 2010, etc.),
the fundamental shift is to an increasingly competitive e-commerce environment.
In today’s information-rich world, attention is a scarce commodity (Simon 1997). To help
consumers focus their attention, companies have built systems that filter out unimportant or irrelevant
information (Simon 1996). For example, search engines have become the primary means for finding and
accessing information on the web. A higher rank in the results for certain queries has become a valuable
commodity. Especially in situations where exposure to the items is casual rather than motivated (e.g.,
Facebook news feeds or updates), high-ranked items are likely to receive more attention. A number of
papers that shown that people are more likely to click on the top positions on a varied number of lists:
yellow pages ads, music choices of unknown songs, Google listings, movie or hotel listings, etc (Ansari
and Mela 2003, Drèze and Zufryden 2004, Baye et al. 2009, Ghose and Yang 2009, Brynjolfsson et al.
2010, Yao and Mela 2011, Agarwal et al. 2011, etc.). Thus, while search costs are generally lower, rank
plays an important role in the search process.
As consumers increasingly use mobile phones to access the internet, it is important to understand
when and how these results on ranking and geography transfer to the use of different devices. Currently,
we have little understanding of whether mobile user behavior matches behavior on personal computers
(PCs). There are reasons to expect both similarities and differences. The two are similar because both
provide instant access to roughly the same internet sources with vast amounts of information. The
browsing experience, however, is different for three main reasons. First, mobile phones typically have
smaller screens than PCs. Second, mobile phones are, by definition, portable and not fixed to a location.
Electronic copy available at: http://ssrn.com/abstract=1732759
3
Third, due to the portability, mobile users have access to timely information.
In this study, we compare behavior when the internet is accessed on a mobile phone and when the
internet is accessed on a PC. The purpose of this paper is to examine whether these characteristics of the
PC-based internet will still apply to the mobile internet.1 In other words, we aim to empirically examine
whether the theoretical models of Bakos (1997), Balasubramanian (1998), and others that have played a
prominent role in the academic discussion of internet commerce apply equally well in an online world
that is increasingly accessed with mobile phones.
We first examine whether the ranking effect is different on the mobile internet as compared to the PC
internet. Because consumers exert more cognitive effort while scrolling down a list of items displayed on
small screens, the ranking effect may be higher in a mobile phone as compared to a PC. When searching
for information, however, consumers are likely to place higher valuation on timely information using
mobile phones, which suggests the same post generates different utility on a PC and a mobile phone.
Therefore, to make the claim that ranking effects are higher on a mobile device based on the estimation
results we show that it is not differences in the gains from search (i.e., getting timely information) across
platforms that is driving the findings. Next, we examine how the impact of local activities is different
between on the mobile internet as compared to on PC internet. For example, when searching for the
information about local activities (e.g., best local restaurants), consumers may place higher valuation on
stores located in close proximity on mobile phones, perhaps because it is easier for them to travel there.
We do this comparison using data from a South Korean microblogging website, similar to Twitter.
As on Twitter, users share their thoughts in short posts distributed by the mobile phone-based or PC-
based Web. A microblog differs from a traditional blog in that its content is typically much smaller in
size, consisting of a short sentence fragment described within a limit of 140 characters. The central
feature of microblogging is a stream of messages (i.e. tweets) that a user receives from those they follow.
In our setting, these messages are listed in reverse chronological order and contain clickable links. We
have information on all such links related to brands for 260 distinct users between November 29, 2009 1 We use the term “mobile internet” and “mobile phone-based internet” interchangeably in this paper.

4
and March 6, 2010. We examine whether the user clicked on the link as a function of the access
technology (mobile phones or PCs), the rank of the link on the screen, and the geographical distance
between the user’s address and the retail location of the brand mentioned in the link.
Rank allows us to measure the search costs related to ranking effects. Higher ranking effects mean
that it is more valuable to be ranked near the top. Distance allows us to examine the role of geography and
local activities of users. Importantly, for identification of rank effects, we exploit a source of
randomization in the ranking mechanism that generates these microblog posting feeds. The rank is
determined only by the timing of the posting by the creator, the frequency of log-in by the user, and the
number of feeds that the user follows, independent of any prior click-through decisions by users and
brand advertisement by advertisers. So we find that the ranking effect is present even when the lists are
scrambled in a way that the resulting ordering does not reflect an intrinsic valuation of the items on the
list. Further, using post-specific fixed effects to control for post quality and focusing on the first
appearance of a brand post, the posting mechanism provides exogenous variation in the ranking, under the
assumption that our key controls (specifically, post tenure and the number of followees) capture those
potential confounds. In this way, variation in the posting mechanism can be seen as something like a
natural experiment in ranking.
To the extent that our covariates do not capture user-level heterogeneity in propensity to click on
different types of posts, we include user-level random coefficients in a hierarchical Bayesian framework
and estimate it with Markov Chain Monte Carlo methods, using an adaptive Metropolis-Hastings
algorithm. User decisions are captured with a revealed preference econometric model of user clicking
behavior that controls of recency effects and other factors. The model is estimated on a unique panel
dataset of users encompassing their click-through decisions on microblog posting feeds.
Examining the value of clicking in this revealed preference model generates our main results. First,
the negative and statistically significant relationship between the rank of a post and a click of that post is
much stronger for mobile users than PC users. For PC users, moving one position upward in rank yields
an increase in the odds of clicking on that brand post by 25%. For mobile phone users, a one position

5
upward increase in rank yields an increase in odds of clicking on that brand post by 37%. This result
suggests that ranking effects are higher on mobile phones.
Second, we find that the benefit of searching for geographically proximate brands is higher on
mobile phones. For PC users, a one mile decrease in distance between a user and a brand store yields an
increase in the odds of clicking on that brand post by 11%. For mobile users, a one mile decrease in
distance between a user and a brand store yields an increase in the odds of clicking on that brand post by
23%. This result suggests that there are stronger local interests for mobile users than PC users. These
results are robust to a variety of alternative specifications and controls.
In this way, the mobile internet is somewhat less “internet-like”: search costs related to ranking
effects are higher and distance matters more. Speculatively, this suggests that the features of the internet
market that depend on search costs and distance effects will change as the mobile internet becomes
proportionately larger.
In addition, the coefficient estimates on one of our controls are suggestive of a possible exception to
the finding of higher (ranking- or “primacy”-related) search costs on the mobile internet: time-related
search costs may fall. That is, our results suggest that more recent posts are more likely to be clicked on a
mobile phone. In other words, the cost of acquiring timely information may be lower on a mobile phone
than on a PC. The coefficient estimates suggest that, for PC users, an increase in the recency of a post by
one day yields an increase in the odds of clicking on that post by 7.1%. For mobile phone users, an
increase in the recency of a post by one day yields an increase in odds of clicking on that post by 8.3%.
Hence, the estimated magnitude of the post time-sensitivity effect on the odds of clicking in mobile phone
settings is larger than that in PC settings.
Therefore, in considering the impact of search costs on equilibrium outcomes on the mobile internet,
it may be important to consider the type of search cost: is it one related to primacy effects or to recency of
information? If it is related to recency, many of the models emphasizing low online search costs become
even more fundamental. On the other hand, if it is related to primacy, then these models are less likely to
be fundamental.
6
Overall, this paper provides an understanding of how the mobile internet is different from the PC-
based internet. As local commerce begins to explode on the internet, we are seeing an increasing number
of high profile acquisitions in this industry such as Ebay’s recent acquisition of Milo, Google’s massive
bid for Groupon, Amazon’s investment in LivingSocial, and so on. Industry reports have predicted that
local commerce will be primarily conducted through the mobile internet (Marcus 2010). However, to our
knowledge, no prior academic work has scientifically documented how the mobile Internet is different or
similar to the PC-based internet. By demonstrating that users’ preferences for proximate brands are
stronger when using a mobile phone, and that the primacy effect is higher when using a mobile phone, our
paper provides insight for managers regarding the future potential of local and mobile commerce. For
example, the asymmetric distance and primacy effects between mobile phones and PCs suggest that in
many ways competition is likely to be less severe on the mobile internet than on the PC-based internet
due to higher geographic frictions and search frictions.
2. Related literature
In this section, we explain why it is important to examine ranking effects and distance effects. We
also discuss some other related literature.
2.1 Why do ranking effects matter?
A long literature suggests that there are primacy effects on choice, or benefits to being first or early
in a sequence (Becker 1954, Miller and Krosnick 1998, Carney and Banaji 2008, etc.). Most people start
browsing from the top of lists, so higher ranked items are likely to receive more attention. These effects
have been documented in a variety of contexts such as food and beverages (Coney 1977, Dean 1980),
election (Miller 1998), and elsewhere. In online contexts, a number of papers have shown that primacy
effects have important market consequences. For example, better ranked links are more likely to be
clicked in desktop environments (Ansari and Mela 2003, Drèze and Zufryden 2004, Baye et al. 2009,
Ghose and Yang 2009, Yang and Ghose 2010, Agarwal et al. 2011).
Broadly, our paper is related to the literature on search costs in the online environment. As the
7
ranking effect is often interpreted as a type of search cost in an online setting (e.g. Yao and Mela 2011),
Brynjolfsson et al. (2010) have quantified such search costs as quite substantial in online settings when
users are exposed to multiple offers on a computer screen, as in a shopbot setting. The reduction in search
costs associated with the internet affected prices, price dispersion, product quality, online demand, market
structure, unemployment, and many other areas of economic life (see, Lynch and Ariely 2000, Autor
2001, Ellison and Ellison 2009, Kim et al. 2010, etc.).
The wider literature on search also emphasized that lower search costs reduce price dispersion. These
effects have been documented in a variety of industries including books and CDs (Brynjolfsson and Smith
2000), life insurance (Brown and Goolsbee 2002), and automobiles (Scott Morton et al. 2001). Overall,
however, the evidence suggests that lower search costs online lead to lower prices and lower price
dispersion. If search costs via the ranking effect on the mobile internet differ from those on the PC-based
internet, price dispersion online may change.
Another consequence of the reduced search costs online is increased variety of products offered and
purchased. Because it is possible for consumers to find even obscure products relatively easily (and
because inventory costs are lower), Brynjolfsson et al. (2003) argue that the internet increases the variety
of products available. Similarly, Kuksov (2004) argues that lower search costs increase the incentives to
differentiate. Broadly, while the inventory costs do not change whether consumers access the internet
through a PC or a mobile phone, differences in consumers’ cognitive load (or search costs) in scrolling
through these product listings on a computer screen might affect the benefit to firms of holding variety.
In this paper, we examine whether a ranking effect is different on the mobile internet as compared to
on the PC-based internet. That type of search cost is the cognitive effort consumers engage in while
scrolling down a list of links displayed on small screens. They cognitively process incoming posting feeds
before choosing to click one to learn more about it. Screen sizes have important consequences. A small
screen view can cause information chunking and users to lose a global view of the task, incurring
cognitive load (Nunamaker et al. 1987, 1988). Numerous studies have documented that the small screens
of mobile phones create a serious obstacle to users’ navigation activities and perceptions (Chae and Kim
8
2004), the effectiveness of the learning experience (Maniar et al. 2008), and in mobile marketing
(Shankar et al. 2010). Since only a small amount of information can be shown on the screen, users need to
scroll up/down and left/right continuously within a web page, making it difficult to find target
information (Jones et al. 1999). These search processes place a heavy cognitive load on users (Albers and
Kim 2000). Due to the small screen, users need to remember the content and context of a Web page that
they have already viewed, which further increases the cognitive load and the potential for errors (Davison
and Wickens 1999). Hence, adapting the presentation of web pages to the unique mobile context is critical
to enabling effective mobile web browsing and information searching (Adipat et al. 2011).
Overall then, while a long literature has documented how serial position in a sequence influences
choice, it remains unexplained how the ranking effect varies by the access channel (mobile phones vs.
PCs). We examine this research question in situations where people browse through lists. Because we
document a stronger primacy effect when the internet is accessed on a (small-screen) mobile phone even
after controlling for a recency effect, we argue that this kind of search cost is higher on the mobile
internet. Our real-world setting allows us to measure the overall magnitude, and the directional nature of
such costs in mobile phones as opposed to in PCs.
2.2 Why do distance effects matter?
A long literature documents the role of distance in social and economic behavior. Tobler’s (1970)
first law of geography is that “all things are related, but near things are more related than far things”. The
internet reduces the cost of communication. Therefore, the popular press has frequently emphasized the
ability of the internet ends this relationship and brings about the “Death of Distance” (Cairncross 1997) or
a “Flat World” (Friedman 2005). In the academic literature, this idea has been explored in depth.
Balasubramanian (1998) and Zhang (2009) analytically discuss the role of distance to offline stores in an
online and offline substitution setting. Several empirical studies show that the online channel is more
valuable when consumers have to travel further to reach an offline store (Forman et al. 2009, Anderson et
al. 2010). Therefore, the online channel helps reduce the importance of distance in many ways, generally
9
increasing the competition faced by any particular firm.
Still, the consequences of lowered communications costs depend on several local factors. Therefore,
much online behavior is local. Blum and Goldfarb (2006) show that surfing behavior is disproportionately
local and Hampton and Wellman (2002) find that online social interactions are also disproportionately
local. Overall, the literature suggests an important role for distance in determining online behavior.
If the benefit of accessing local information is different when people access the internet on a mobile
phone, even though communication costs fall it suggests that online behavior more broadly may change.
Hence, if surfing behavior becomes more local then local retailers may disproportionately benefit. For
example, people might access the internet on a mobile phone to sort or filter information by location to
make it more relevant to their surroundings (Mountain et al. 2009). Location-based services are tools that
tailor retrieved information based on the location at which a query was made (Brimicombe and Li 2006,
Jiang and Yao 2006). The location-based services allow for ‘where’s my nearest’ services, for example,
they include searches for local news, weather or sports reports, navigation, friend-finder services,
location-based gaming, etc (Mountain et al. 2009). In this sense, distance between a user and a store
interacts with whether the user accesses the internet through a mobile phone or a PC.
Therefore, because we document a stronger impact of distance on click-through decisions when the
internet is accessed on a mobile phone, we argue that the distance effects are higher on the mobile
internet. To the best of our knowledge, no previous study has examined the distance effect in a mobile
phone setting. Hence, the overall magnitude of the distance effect in mobile phones as opposed to PCs
also remains an important empirical question.
2.3 Other related literature
Our paper is related to the literatures on user-generated content in social media platforms, on mobile
marketing, and on user behavior across channels. By studying microblogs, we examine an increasingly
popular form of user-generated content that can potentially have a strong economic and social impact. An
emerging stream of relevant work has investigated the economic and social impact of user-generated

10
multimedia content on the mobile internet by mapping the interdependence between content generation
and usage (Ghose and Han 2011) and modeling how consumers learn about different kinds of content
(Ghose and Han 2010). A handful of papers have focused on microblogs in particular, including for
example, Java et al. (2007) and Boyd et al. (2010). Stephen et al. (2011) use data from Twitter to study
transmission activity as a driver of retransmission and diffusion in online social networks.
Our paper builds on and relates to the literatures on mobile marketing. We examine user search costs
and distance effects on the mobile internet. This can have important managerial implications for firms’
mobile marketing strategies. An emerging stream of relevant literature has discussed the role of mobile
technologies in marketing. Shankar and Balasubramanian (2009) provide an extensive review of mobile
marketing. Shankar et al. (2010) develop a conceptual framework on mobile marketing in the retailing
environment and provide discussions on retailers’ mobile marketing practices. For example, retailers can
communicate with consumers near their stores via mobile phones by transmitting relevant information
such as the store’s location, product availability, quality, price, and coupon in its response to the
customer’s mobile phone-initiated requests. Moreover, specific consumer segments such as the Gen Y
youth market increasingly use mobile phones as single-source communication devices (Sultan et al. 2009)
to gain greater access to social circles, location-based information and content. Sinisalo (2011) examines
the role of the mobile medium among other channels within multichannel CRM communication.
3. Data Description
In this section, we describe the data that we collected from a microblogging service company in
South Korea. The company was founded in November 2008. As of November 2009, there were about
40,000 registered members. Members can post a message about what they are doing or what they are
thinking, and also they can read posts created by other members. Furthermore, there are mobile phone
application versions of the service (i.e., iPhone and Android application). Hence, members can use the
service anywhere and anytime.
Our sample is randomly drawn from brand-related posts created by members of the microblogging
11
service between November 29, 2009 and March 6, 2010. We have data on users’ click behavior at the
microblogging site using both their PCs and their mobile phones. To be specific, the dataset consists of
440 posts created by 88 distinct users and whether each post is viewed and clicked by 260 other users
(i.e., followers). So the unit of analysis is the post-user and the dataset contains 8,896 such observations.
Our dataset contains all brand-related posts (defined by a brand mentioned in the post listed). Brands
range from prominent international brands like Starbucks and McDonalds, to the relatively unknown.
Table 1 shows summary statistics of the key variables in the sample.
When members use the service, they see a list of posting feeds that looks much like the home page of
a user’s Facebook account containing the latest news feeds from his social network or the search results
from a query issued on a search engine. The initial views of the posts are limited to 140 characters. Most
postings exceed this limit and therefore users are motivated to read the full content of the post. In
addition, when they click on a brand post, they can also view content from other posts which also
mentioned that brand name. Furthermore, some posts contain marketing promotion information that
customers need to click to take advantage of them.
There are two sources of brand-related feeds in our setting: 1) brand-related updates from other
members that one is following (i.e., followees) and 2) updates posted at a brand site that one has
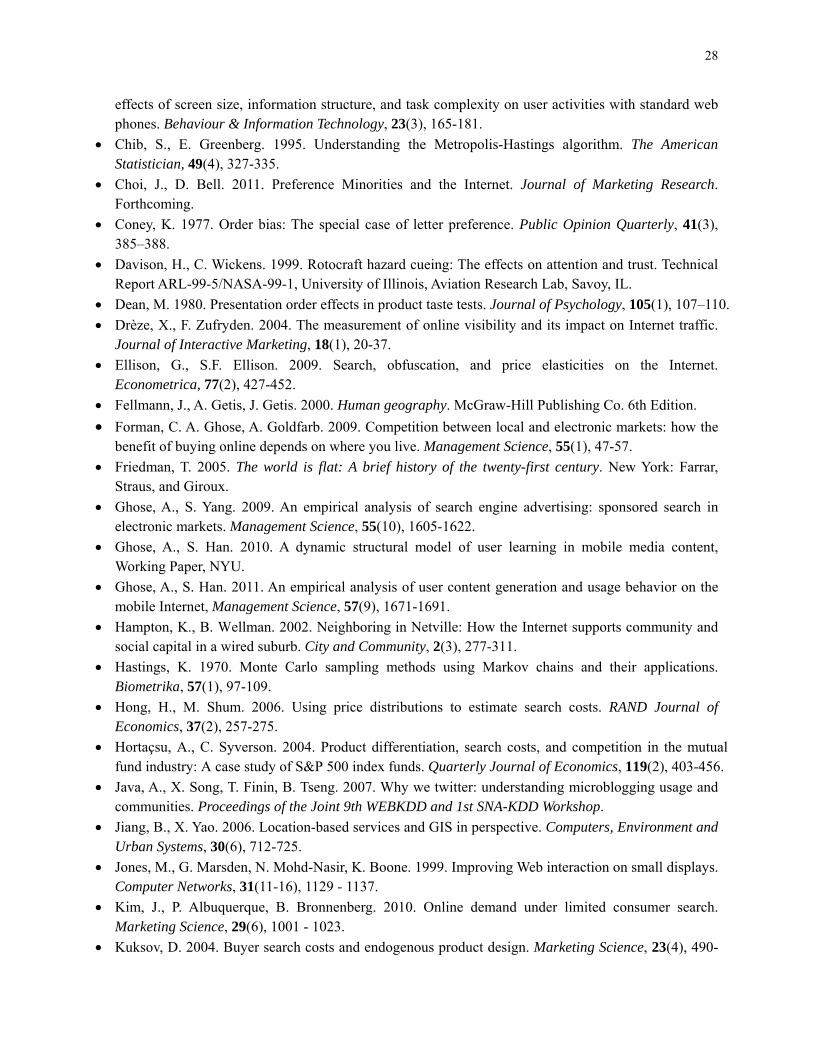
bookmarked. Brand-specific variables include brand category (refer to Figure 1 for the complete list),
brand profile tenure (days since brand first appeared on the website), post tenure (days since post first
appeared on the website), and number of bookmarks. User-specific variables include age, gender, number
of followees, and type of access channel. Our dataset has only two types of user access
technologies/device - PCs vs. mobile phones, excluding tablets. So our definition of the mobile internet is
internet access through mobile phones only. Importantly, users that access the website by both channels
might be fundamentally different from the users that use only mobile phones or only PCs. So we focus
our analysis on the 1,940 total brand post views by those users who access the website at least once with
each channel to ensure the results are not a result of unobserved heterogeneity across users in the sample.
The brand- and user-specific variables include the rank of a brand post on a user’s login page, the
12
distance between the user and the brand store, and whether a user clicked that brand post or not. Summary
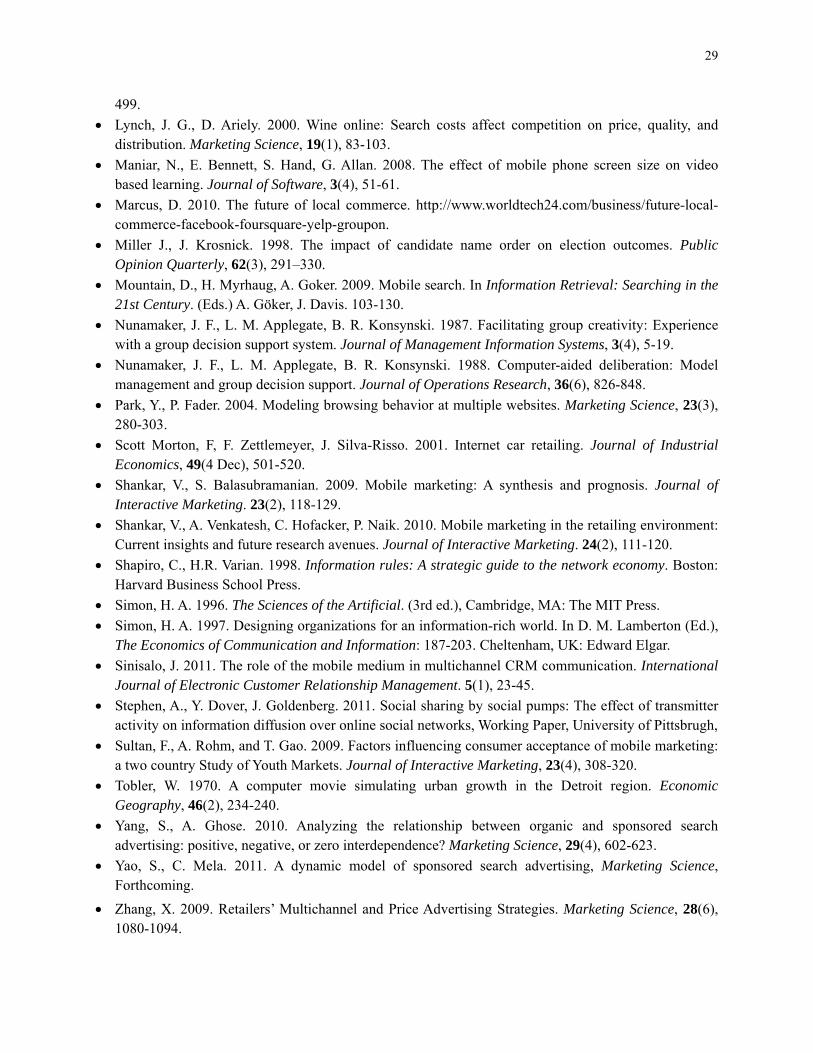
statistics of these variables are given for each channel separately in Table 1. For example, the click-
through rates are 6.8% in mobile phones and 3.3% in PCs. Moreover, the ranking of clicks are different
across platforms. Figure 2 illustrates that users are more likely to click on better ranked posts when they
access through mobile phones as opposed to PCs. Crucially, the rank of the same brand post varies across
users and we exploit this variation for identification (see Section 4.1 for detail).
Regarding the distance variable, we compute the geographical distance between a user’s home
address and the retail location of the brand mentioned in the post. Because many brands do not have a
physical store (including several common categories such as books, computer games, and multimedia
clips), we only have distance information for brands in 48% of the observations in our main sample. To
ensure the interpretation of the distance coefficients, we use brand post-level fixed effects. These controls
capture situations when distance is missing (i.e., posts which mention brands with no physical store) and
therefore we do not require any further controls.
4. Econometric Analysis
To formally characterize our econometric model, we model user click-through decisions in terms of
brand attributes, user characteristics, and brand- and user-characteristics. A user can navigate all posting
feeds or notification messages when he logs on the microblog platform using a PC or a mobile phone. In
our model, a user decides to click a post that provides the maximum expected utility to explore the
content of the post. To better control for heterogeneity, we characterize our model in a hierarchical
Bayesian framework and estimate it using Markov Chain Monte Carlo methods. The rest of this section is
organized as follows: a brief sketch of our research design using a natural experiment, the econometric
model, the estimation method, and a discussion of the identification strategy.
4.1 Research design: Exogenous variation in ranking
We treat the posting of a new brand-related message by users as an “event” in a natural experiment-
like setting. Upon a posting event, after logging in, all followers of the post creator and bookmarkers of

13
the brand can view the post and click on it to read the full content of the post.2 Users view the same brand
post message regardless of platforms. In each posting event, we examine the impact of a post rank,
distance between a user and the offline location of the posting brand’s store, and other factors upon
clicking decisions. Thus, we control for any post-specific unobserved quality issues when it comes to
mapping their click-through rates. The rationale for this control is that some postings attract more user
clicks than others for their unobserved inherent characteristics (i.e., length, sentiment, theme, relevance).
In addition, the microblog service in our setting provides an ideal setting for identifying the impact
of post rank because it provides a unique source of variation in the ranking mechanism. When a user
generates a post, the same post would appear at different positions (ranks) for different users. However,
unlike in sponsored search engines, the rank order in our empirical context is determined independent of
any prior click-through decisions by users and brand advertisement by advertisers.3 Instead, given that
users play a dual role of consumers (i.e., read posts created by other members) and suppliers (e.g.,
generate new posts) in the microblogging context, the rank order is solely determined by user traits (e.g.,
login frequency and posting frequency). For example, the more frequently a user logs in, the less quickly
does the rank of a given post increase, and the more frequently a user’s followee creates posts, the more
quickly does the rank of a given post increase. We control for these factors directly with covariates and
there ascribe all remaining variation in rank to factors that are exogenous to the propensity to click. In this
way, it is something like a natural experiment. As described below, to the extent that our controls do not
address all user-level heterogeneity in these dimensions, we further control for user-level differences with
random coefficients in a Hierarchical Bayes framework.
Importantly, we only use the first appearance of a brand post on a user’s screen in our analysis to
avoid the following potential confound. Suppose a user is unlikely to click on the same post across
successive login sessions. By construction, any given brand post can re-appear to the same user at worse
2 Users in this microblogging service company do not receive a notification message through an email or a text message regarding a new post, which might result in a login if the post is interesting enough to the user. This helps motivate our assumption of randomness of users’ login decisions. 3 This is true because there is no systematic brand advertising by companies in our setting. So all posts presented to users are ordered by time.

14
ranks across login sessions (i.e., an older post will be located towards to the bottom of the screen). Also
by construction, the likelihood that a user has already clicked on a link increases across login sessions.
Hence, even without a structural preference for rank, there might be a negative correlation between
ranking and click propensity. Furthermore, if there is just a short period between a current login and a
previous login, it is more likely that higher ranked posts have already been seen, which makes it more
likely that a user clicks on a top ranked post. If a user logs in more often on a mobile phone than on a PC,
this could bias the results.
We also excluded brand posts which were displayed to only one user, in order to identify effects
through across-user comparisons. Moreover, we emphasize results that include only those users who have
accessed the microblogging platform via both mobile phones and PCs (i.e., dual channel users). This
helps us to identify the “within-user” moderating effect of access channels on user click decisions.
However, our results are robust to the use of the entire sample of users in our data.
4.2 Econometric model
Our model consists of two-level specification models: 1) post-level latent utility model and 2)
population-level model with user- and brand post-level heterogeneity. Notation and variable descriptions
are provided in Table 2.
4.2.1 Post-level model
The observed user’s binary response (i.e., whether to click or not) can be modeled using a random-
utility framework. We posit that users click on a posting feed when the utility for reading the full content
of the post exceeds a certain threshold. For a given brand post k, at time j, the relationship between the
observed response y and the latent utility u of clicking for user i can be written as:
y 0 if u 0
1 if u 0 (1)
We model the latent utility u from clicking on a post k at time j for user i as the function of
observed and unobserved post and user characteristics in the following way. We are primarily interested
15
in the effect of rank and distance on a user’s propensity to click on a brand posting that appears on his
screen. Rank allows us to measure ranking effects. It is more valuable to be ranked near the top, and
hence such high ranked postings are likely to get higher click-throughs. Distance allows us to examine the
role of geography and local activities of users. Higher click-through rates on postings involving brands
located closer to the user mean that consumers have a preference for geographically local activities.
Because the address information of brand stores is often provided to users, we assume that users are fully
informed about the locations of brand stores that appear in the posts. Our main findings emphasize how
these effects vary between a mobile phone and a PC.
We also control for the user-level observed heterogeneity by including access channel (mobile
phones vs. PCs), number of followees, number of bookmarks, age, and gender of each user. For example,
users’ motivation of browsing and clicking may differ between mobile phones and PCs. We capture such
discrepancy in propensity to click by including an indicator of whether a user accessed through mobile
phones as opposed to PCs. Also, as the duration of time since the establishment of a brand profile
increases, the likelihood of a click on that brand may change. We capture such brand-level observed
heterogeneities by including brand tenure. We add a control for the recency of the information capturing
time elapsed since posting (i.e., post tenure). The rationale for including this control is that users might
place higher valuation in higher ranked posts because the posts are ordered and presented by time. Hence,
if users have higher valuation for timely posts, they will be more likely to click on higher ranked posts.
Further, to control for the different value of timely posts across channels, we also include an interaction
between post tenure and access channel.
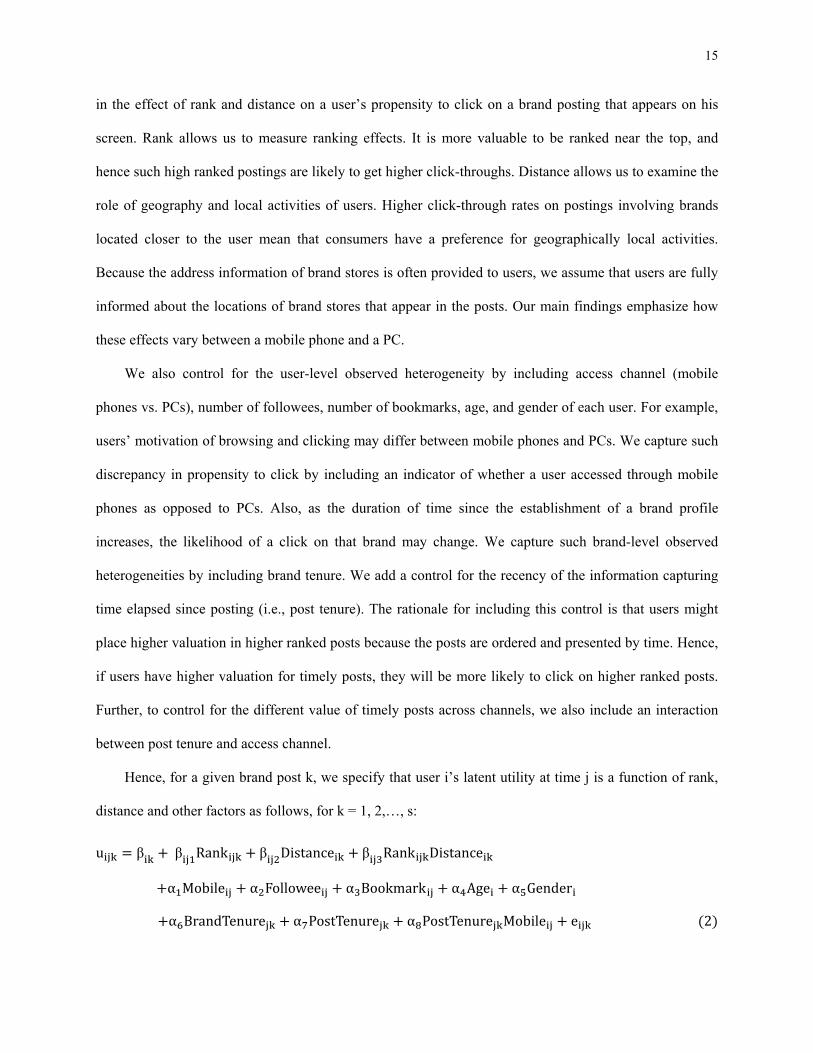
Hence, for a given brand post k, we specify that user i’s latent utility at time j is a function of rank,
distance and other factors as follows, for k = 1, 2,…, s:
u β β Rank β Distance β Rank Distance
α Mobile α Followee α Bookmark α Age α Gender
α BrandTenure α PostTenure α PostTenure Mobile e 2
16
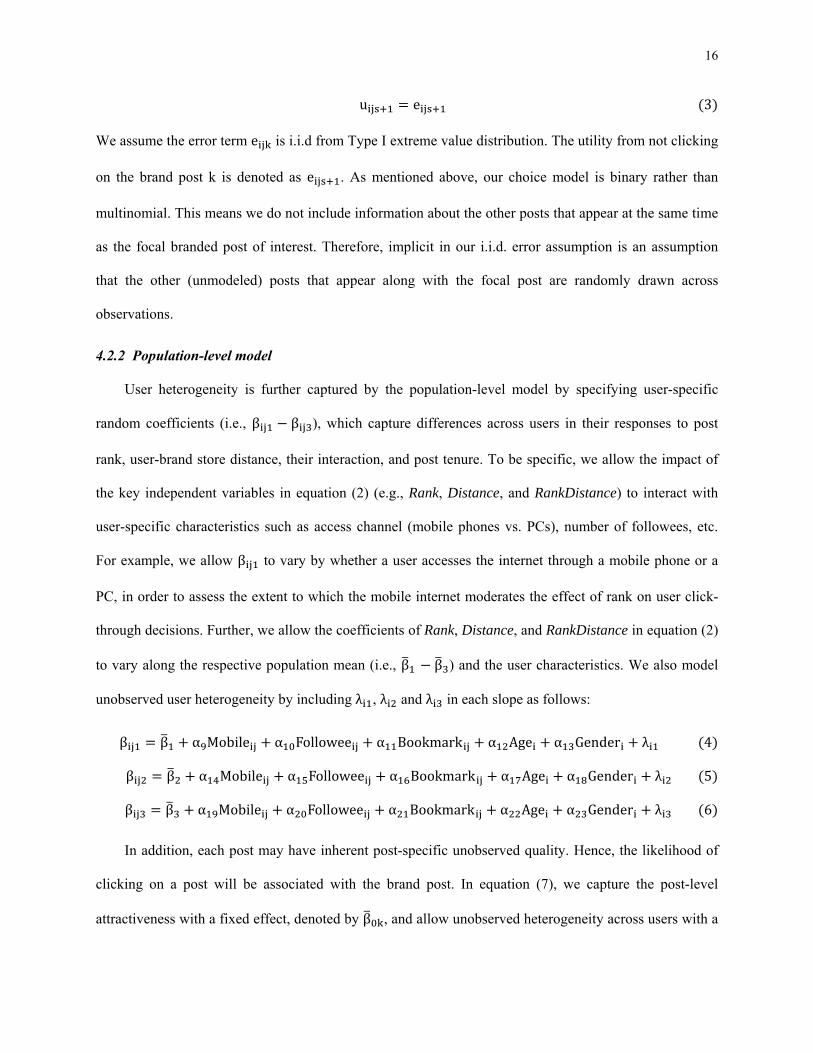
u e 3
We assume the error term e is i.i.d from Type I extreme value distribution. The utility from not clicking
on the brand post k is denoted as e . As mentioned above, our choice model is binary rather than
multinomial. This means we do not include information about the other posts that appear at the same time
as the focal branded post of interest. Therefore, implicit in our i.i.d. error assumption is an assumption
that the other (unmodeled) posts that appear along with the focal post are randomly drawn across
observations.
4.2.2 Population-level model
User heterogeneity is further captured by the population-level model by specifying user-specific
random coefficients (i.e., β β ), which capture differences across users in their responses to post
rank, user-brand store distance, their interaction, and post tenure. To be specific, we allow the impact of
the key independent variables in equation (2) (e.g., Rank, Distance, and RankDistance) to interact with
user-specific characteristics such as access channel (mobile phones vs. PCs), number of followees, etc.
For example, we allow β to vary by whether a user accesses the internet through a mobile phone or a
PC, in order to assess the extent to which the mobile internet moderates the effect of rank on user click-
through decisions. Further, we allow the coefficients of Rank, Distance, and RankDistance in equation (2)
to vary along the respective population mean (i.e., β β ) and the user characteristics. We also model
unobserved user heterogeneity by including λ , λ and λ in each slope as follows:
β β α Mobile α Followee α Bookmark α Age α Gender λ 4
β β α Mobile α Followee α Bookmark α Age α Gender λ 5
β β α Mobile α Followee α Bookmark α Age α Gender λ 6
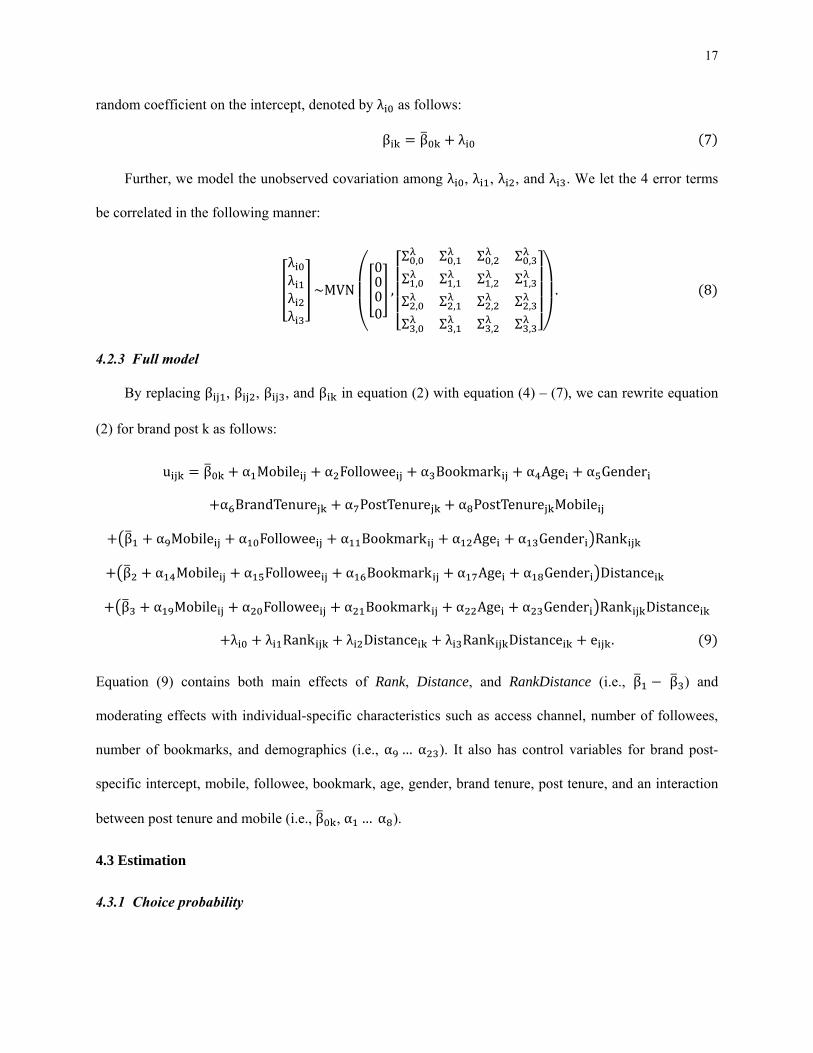
In addition, each post may have inherent post-specific unobserved quality. Hence, the likelihood of
clicking on a post will be associated with the brand post. In equation (7), we capture the post-level
attractiveness with a fixed effect, denoted by β , and allow unobserved heterogeneity across users with a
17
random coefficient on the intercept, denoted by λ as follows:
β β λ 7
Further, we model the unobserved covariation among λ , λ , λ , and λ . We let the 4 error terms
be correlated in the following manner:
λλλλ
~MVN0000,
Σ , Σ ,
Σ , Σ ,
Σ , Σ ,
Σ , Σ ,
Σ , Σ ,
Σ , Σ ,
Σ , Σ ,
Σ , Σ ,
. 8
4.2.3 Full model
By replacing β , β , β , and β in equation (2) with equation (4) – (7), we can rewrite equation
(2) for brand post k as follows:
u β α Mobile α Followee α Bookmark α Age α Gender
α BrandTenure α PostTenure α PostTenure Mobile
β α Mobile α Followee α Bookmark α Age α Gender Rank
β α Mobile α Followee α Bookmark α Age α Gender Distance
β α Mobile α Followee α Bookmark α Age α Gender Rank Distance
λ λ Rank λ Distance λ Rank Distance e . 9
Equation (9) contains both main effects of Rank, Distance, and RankDistance (i.e., β β ) and
moderating effects with individual-specific characteristics such as access channel, number of followees,
number of bookmarks, and demographics (i.e., α … α ). It also has control variables for brand post-
specific intercept, mobile, followee, bookmark, age, gender, brand tenure, post tenure, and an interaction
between post tenure and mobile (i.e., β , α … α ).
4.3 Estimation
4.3.1 Choice probability

18
We rewrite user i’s latent utility above as being composed of a systematic part (i.e., v ) and a
stochastic part (i.e., e ) as follows:
u v e . (10)
Recall that we assume that e is i.i.d from Type I extreme value distribution. Hence, the probability of
user i clicking on brand post k at time j is
Pr y 1|β (11)
where β denotes all parameters in the model.
4.3.2 Hierarchical Bayesian modeling and estimation
We cast our model in a hierarchical Bayesian framework and estimate it using Markov Chain Monte
Carlo methods. We rewrite our main equations as follows:
u X β e (12)
β Z µ λ (13)
where Pr µ N η, C , λ λ , … , λ ~N 0, Λ , and Pr Λ W ρ, R .
The corresponding mixed model is as follows.
u W µ X λ e (14)
Hence, the full conditionals are: (A) Pr λ |µ, Λ, y , (B) Pr µ|Λ, λ , y , and (C)
Pr Λ | λ where n is the total number of users in the sample.
In order to gain efficiency in estimation, we use an adaptive Metropolis-Hastings algorithm with a
random walk chain (Atchadè 2006, Chib and Greenberg 1995, Hastings 1970) to generate draws of λ and
µ in conditional (A) and (B). Hence we can adjust the tuning constant to vary by an individual (see the
Appendix for a more detailed description of the MCMC algorithm).4
4.4 Identification 4 It is important to note that conditional (C) described above can be computed using Wishart the distribution. However, conditionals (A) and (B) cannot be directly computed because they are not conjugate.
19
We briefly discuss identification issues in our model mathematically and empirically.
4.4.1 Mathematical identification
First, we impose a location normalization restriction by setting the constant utility term for any one
brand post to be zero. This is because one can change all the brand post-specific constant terms by
adding/subtracting a constant k, without changing the choices implied by the model. As a reference brand
post, we set the mean value for a brand post in the “local restaurant” category to be 0. The qualitative
nature of our results do not change based on the choice of a reference brand post. Second, we impose a
scale normalization restriction by allowing the distribution for the error term, e , to be the type I extreme
value distribution. This is because one can scale all the parameters in equation (2) by k, while scaling the
error term by k, without changing the choices implied by the model.
4.4.2 Empirical identification
The identification of the impact of rank depends on a unique source of randomization in the ranking
mechanism. Unlike in the search engine context where the rank is determined by algorithms based on
popularity and relevance, the rank in our microblog setting is determined by “recency.” Thus, the posts
appear on a user’s log-in screen in reverse chronological order (i.e., the most recent one appear at the top).
Because we control directly for recency and individual heterogeneity, this setting reduces concerns for
endogeneity issues in ranks because previous clicks by users on a post do not affect the rank of that post
in any subsequent periods.
Further, we consider the rank order of a post as random and exogenous for the following reasons: 1)
the frequency that a content creator generates a brand post and the system automatically sends the brand
post to a user is independent of that user’s log-in frequency, 2) the user is able to see the rank of a post
only after the user logs in, and 3) we include post fixed effects and therefore identify off variation across
users in the rank of the same post. Hence a user’s log-in decision can be considered as a random stopping
decision during the process of continual posting feeds from his followees or bookmarks. Said simply, we
can consider users' log-in timing decisions as exogenous to the determination of the rank of a post. We
20
can do this if we assume that our controls for recency, user characteristics, and user heterogeneous
response (i.e. the random coefficients) adequately control for the differences in rank. The required
assumptions for the main results of the paper are somewhat weaker. In particular, given that the main
results of the paper rely on the interaction between access device and rank, we need to assume that the
controls for recency, user characteristics, device-specific habits, and user heterogeneous response
adequately control for all non-random differences in rank.
5. Results
We ran the MCMC chain for 60,000 iterations and used the last 20,000 iterations to compute the
mean and standard deviation of the posterior distribution of the model parameters. We next present our
key results on search costs and distance effects across the two kinds of access technologies (mobile vs.
PC). We discuss the economic impact of our results to gain further insights. We also show robustness to a
variety of alternative specifications and samples.
5.1 Main results
5.1.1 Estimation results
We present the results on the coefficients of the main model in Table 3. The first column shows the
effect of rank, distance, and their interaction on clicks when users access the microblogging site with a
PC. Consistent with prior evidence on the primary effect, the first column shows that better rank increases
clicks (rank is significantly negative). Furthermore, people click on nearby links (distance is significantly
negative). People are more interested in proximate brands. This is consistent with a distance decay effect
(Fellmann et al. 2000), in which interaction between two entities declines as the distance between them
increases. These effects reinforce each other in combination as the interaction of rank and distance is
significantly negative.
Our primary focus is on the difference between PCs and mobile phones. The second column of Table
3 shows that the estimate for the interaction between the rank and the mobile phone access channel is
negative and statistically significant (the coefficient is -0.088), implying that the ranking effect is
21
strengthened in a mobile setting. In other words, users are more likely to click on a highly ranked post in a
mobile setting, as opposed to in PC settings in which they see more messages on a given screenshot. As
mentioned in Shankar et al. (2010), “real estate” is particularly important in a mobile setting.
We also find that distance matters more in the mobile setting than in the PC setting, even though our
measure of the user’s location reflects a physical address. Therefore, this result should not be interpreted
as a contextual effect. Instead, it suggests that people tend to prefer local brands that are near their homes
on their mobile phones, perhaps because it is easier for them to travel there but perhaps for reasons
unrelated to context. The interaction between distance and rank is also stronger in the mobile channel.5
Some of the control variables yield interesting insights. Specifically, the estimate for mobile phone
access is positive and statistically significant (the coefficient is 0.151). This result suggests that a user
accessing through mobile phones is in general more likely to click on brand posts, which is consistent
with the higher click rates for mobile access (6.8%) as opposed to PC access (3.3%) in the raw data. This
also suggests consumers place higher valuation on posts in the mobile setting, perhaps because they can
access to timely information anytime and anywhere using mobile phones.
Regarding a control for the recency of information, the coefficient on post tenure can be interpreted
as a type of search cost. In particular, due to the ubiquitous access, the cost of acquiring timely
information should be lower on a mobile phone than on a PC. The premise of this interpretation is that if
the sign of this interaction term is negative, then it suggests that the screen-related ranking effects in a
mobile phone are mitigated for timely information (i.e., more recent posts). Our results confirm this
notion (the coefficient of the interaction term is -0.011 and p-value < 0.01). Therefore, this result
indicates that the ranking effects are negative and statistically significant in our context after controlling
for information timeliness.
5.1.2 Economic importance of the effects
We discuss the economic impact of each effect using odds ratios. For PC users, moving one position 5 Including an interaction term between a dummy for non-geographic brands and the mobile setting yielded qualitatively identical results. The coefficient on the interaction term was statistically insignificant and economically small. Therefore, we do not include it in the analysis.

22
upward in rank for a brand post yields an increase in the odds of clicking on that post by 25% (exp(0.227)
= 1.25) holding the other variables constant. This is comparable to the 17.5% drop in click-through rates
with position found in a shopbot setting by Baye et al. (2009) and the drop in click-through rates with
position found in a search engine setting by Ghose and Yang (2009) and Yang and Ghose (2010). For
mobile phone users, one position upward increase in rank of a brand post yields an increase in odds of
clicking on that post by 37% (exp(0.227+0.088) = 1.37). So the ratio of the odds (mobile phone vs. PCs)
is 1.10. Hence, the odds ratio increases 10% through mobile phones as compared to PCs for each unit
decrease in rank.
Note that the main mobile effect (i.e., the positive propensity to click through mobile phones)
alleviates the stronger ranking effect in a mobile setting. The odds of clicking increase 16% for mobile
users as compared to PC users. The magnitude of the ranking effects varies by the size of ranks changed,
whereas the main mobile effect is fixed. Hence, we examined the overall ranking effects as we gradually
increase the rank from 1 to 10. Except when we increase the rank by 1, we find that the overall ranking
effects are always dominated by the stronger ranking effects in a mobile setting. For example, the odds
ratios of clicking (mobile phones vs. PCs) are 1.06, 0.75, and 0.48 when we increase the rank by 1, 5, and
10, respectively. This confirms our interpretation that the difference in the ranking effects is the result of a
higher cognitive load in a mobile phone setting as compared to a PC setting after controlling for the
higher propensity of mobile users to click relative to PC users.
Regarding distance effects, for PC users, a one mile decrease in distance between a user and a brand
store yields an increase in the odds of clicking on that post by 11%. This result is consistent with evidence
that people generally have local interests (Hampton and Wellman 2002). For mobile users, moving one
mile closer in distance between a user and a brand store yields a decrease in the odds of clicking on that
post by 23%. So the odds ratio is 1.11. Hence, the odds ratio increases 11% through mobile phones as
compared to PCs for each unit decrease in distance. Similarly, we checked the overall distance effects as
23
we increase the distance from 1 to 10.6 The result also warrants our interpretation that the difference in
the distance effects is higher in a mobile phone setting as compared to in a PC setting after controlling for
higher propensity to click of mobile users than PC users.
Regarding post tenure, for PC users, an increase in the recency of a post by one day yields an
increase in the odds of clicking on that post by 7.1% holding the other variables constant. For mobile
phone users, an increase in the recency of a post by one day yields an increase in odds of clicking on that
post by 8.3%. Hence, the estimated magnitude of the post time-sensitivity effect on the odds of clicking in
mobile phone settings is larger than that in PC settings. Lastly, the statistically significant results on
unobserved heterogeneity covariance estimates in Table 3 suggest that controlling for unobserved
heterogeneity is important in our setting.
5.2 Robustness checks
Table 4 shows that the results are robust to a number of alternative specifications. In particular,
model (1) shows that the results on rank hold without controls for distance. Similarly, model (2) shows
that the results on distance hold without the controls for rank. Model (3) shows that excluding the
interaction between rank and distance does not affect the qualitative results on rank or distance. Models
(4) and (5) show robustness to fewer interaction terms as controls.
Table 5 shows that the results are robust to alternative samples. In particular, sample (1) includes all
users, not just the dual channel users. Sample (2) includes only posts from bookmarked brands. Because
users explicitly opted in to receive these bookmarked brand posts, they reduce the likelihood that users
will make false quality inferences based on rank.
Potentially, the identified ranking effect across platforms is simply the difference in the number of
posts viewable on a single page across platforms. Typically, a PC lists about 30 posts per page and a
mobile phone lists about 10 posts per page in this microblogging setting. Hence, we did some additional
robustness checks to only account for the same number of postings that are listed in the first page of a PC 6 Except when we increase the distance by 1, we find that the overall distance effects are always dominated by the stronger distance effects in a mobile setting. For example, the odds ratios of clicking are 1.05, 0.71, and 0.44 when we increase the distance by 1, 5, and 10, respectively.
24
and the mobile screen. Table 6 shows that the results are robust to additional sub-samples in which we
only look at posting that appear in the top N ranks (where N=10, 20, and 30). Overall, our key coefficient
estimates remain qualitatively the same in terms of the sign and the statistical significance.
An interesting observation from Table 6 is that as we move from the original sample to the top 10
ranked posts sub-sample, the magnitude of coefficient estimates for the product of rank and mobile
increases in an absolute sense from -0.078 in the original sample to -0.127 in the sample consisting of top
10 posts. This suggests that search costs appear to be highest for the top ranked links in mobile settings.
This observation should be interpreted with caution as a formal statistical test would not be valid given
that the coefficients are identified up to scale. Still, the relatively high value of the coefficient in the
sample consisting of top 10 posts is suggestive that ranking effects are relatively high on the mobile
internet, even between the top few posts.
6. Discussion and implications
We examine how the economics of the mobile internet differ from the economics of the PC-based
internet. Focusing on ranking effects and distance effects, we show that ranking effects are higher on the
mobile internet, and preferences for geographically proximate brands are also higher.
This study provides several important insights for managers. First, and most directly, our results can
provide microblogging service companies with insights about how they can target access channel-based
sponsored messages using the information of whether a user accessed through a PC or a mobile phone.
Our results show there is a stronger primacy effect in a mobile phone setting compared to that in a PC
setting. This has useful implications for the monetization of social media and user-generated content in
such settings. Increasingly, like in sponsored search ads, we see that microblogging sites are moving
towards a model of sponsoring posts (tweets) in which advertisers can bid on rank (location). In
particular, the asymmetric primacy effect suggests that microblogging companies can charge different
prices to advertisers for sponsored messages based on the type of user access channel. For example, the
stronger primacy effect on mobile phone users implies that for a given brand advertisement,
25
microblogging platforms such as Twitter can charge more for a high ranking of sponsored messages
displayed on mobile phone users as opposed to PC users. Further, this result suggests that advertisers that
buy positions (rank) in sponsored search listings have an incentive to bid higher for the highest ranked
sponsored links in mobile phones as compared to PCs. Of course, to be clear, one would have to take into
account the penetration and reach of such devices as well in any customized pricing strategy for ads.
Second, there may be an exception to the finding of higher search costs on the mobile internet: time-
related search costs appear to fall. That is, the cost of acquiring timely information may be lower on a
mobile phone than on a PC. This finding can have implications for how companies advertise and
monetize time-sensitive content. As an example, for discount coupons embedded in sponsored messages
that are valid for a very short period of time, advertisers are more likely to get higher redemption rates on
mobile phones than PCs. Third, our results can provide microblogging companies and advertisers with
insights about how they can target location-based sponsored messages using geographical proximity
between users and brand stores. Our results show that users in our microblogging setting exhibit strong
local interests, particularly on mobile devices. Hence, when sponsored messages are accompanied with
user-generated posts, as the proportion of mobile users increases, such messages should be increasingly
related to brand stores near the user’s geographical location.
Finally, and most generally, our results contrast with the literature on the PC-based internet that has
hypothesized and documented that lower search and geographic frictions mean that the PC-based internet
is a particularly competitive environment. If search and geographic frictions are higher on the mobile
internet than the PC-based internet, it suggests that competition on the mobile internet may be relatively
muted compared to that on PCs. This would then have implications for product pricing and price
dispersion that are likely to be somewhat different on the mobile internet than on the PC-based internet.
While we showed these results in the context of microblogging, the implications are much wider.
Mobile devices are increasingly important tools for accessing the internet. While it is possible there are
differences from setting to setting, our results broadly suggest that higher search costs and higher benefits
to geographic targeting may impact all aspects of the mobile internet including search engines, e-
26
commerce sites, and social media sites. Furthermore, and more speculatively, higher search costs may
mean higher equilibrium prices, more price dispersion, less product variety, and more market
concentration as the mobile internet grows in importance. Larger distance effects in the mobile internet
may mean an increasing role for local businesses (and perhaps even local social relationships) in
determining online behavior.
Data availability issues suggest that some caution is warranted in this speculation. For example, we
do not observe users’ internet surfing location, only their address. Hence, we cannot claim a “contextual
effect” here in which the immediate environment and vicinity plays a role in consumer's mobile usage
behavior. Moreover, we do not have information about the textual content in a microblog post (e.g.,
length, sentiment, theme) and therefore cannot examine how specific content matters across channels.
Furthermore, our analysis focuses on brand posts in the microblogging setting and it is possible that the
magnitudes of the differences across access channels will vary across settings. Our analysis also focuses
on reduced-form analysis utilizing a natural experiment. Future work may consider using a model of the
underlying search process and structurally estimate search costs (e.g., Hong and Shum 2006, Hortaçsu
and Syverson 2004 among others), provided they have data on prices or demand. In addition, our analysis
assumes linearity of ranking and distance effects and it is possible that these effects will be non-linear.
Future research may model such non-linearity and even rank-specific and mile-specific distance effects
(e.g., Ghose and Yang 2009, Carare 2011). Finally, our data on the mobile internet comes from mobile
phones only. It does not address tablet computers such as the iPad, which have somewhat larger screens
than phones but are somewhat less mobile. Future research can examine if consumer’s usage of the
internet on these tablet devices are more similar to PCs or mobile phones.
Notwithstanding these limitations, our analysis documents higher search costs associated with the
mobile internet as well as a greater role for geographic proximity. To the extent that search costs and
geographic proximity affect market outcomes online, the increasing size of the mobile internet may have
profound implications for the future direction of internet commerce.
27
References
• Adipat, B., D. Zhang, L. Zhou. 2011. The effects of tree-view based presentation adaptation on mobile web browsing. Management Information Systems Quarterly, 35(1), 99-121.
• Agarwal, A., K. Hosanagar, M. D. Smith. 2011. Location, location, location: An analysis of profitability of position in online advertising markets. Journal of Marketing Research, Forthcoming.
• Albers, M., L. Kim. 2000. User Web browsing characteristics using Palm handhelds for information retrieval. Proceedings of IEEE Professional Communication Society International Professional Communication Conference, Cambridge, MA, 125 - 135.
• Andrieu, C., Y. Atchadè. 2007. On the efficiency of adaptive MCMC algorithms. Electronic Communications of Probability, 12, 336-349.
• Anderson, E., N. Fong, D. Simester, C. Tucker. 2010. How sales taxes affect customer and firm behavior: the role of search on the Internet. Journal of Marketing Research, 47(2), 229-239.
• Ansari, A., C. Mela. 2003. E-customization. Journal of Marketing Research, 40(2), 131-145. • Atchadè, Y. 2006. An adaptive version for the Metropolis adjusted Langevin algorithm with a
truncated drift. Methodology and Computing in Applied Probability, 8, 235-254. • Autor, D. 2001. Wiring the labor market. Journal of Economic Perspectives 15(1), 25-40. • Bakos, J. 1997. Reducing buyer search costs: Implications for electronic marketplaces. Management
Science, 43(12), 1676-1692. • Balasubramanian, S. 1998. Mail versus mall: a strategic analysis of competition between direct
marketers and conventional retailers. Marketing Science, 17(3), 181-195. • Baye, M., R. Gatii, P. Kattuman, J. Morgan. 2009. Clicks, discontinuities, and firm demand online.
Journal of Economics and Management Strategy, 18(4), 935-975. • Becker, S. 1954. Why an order effect? Public Opinion Quarterly, 18(3), 271–278. • Blum, B., A. Goldfarb. 2006. Does the Internet defy the law of gravity? Journal of International
Economics, 70(2), 384-405. • Boyd, D., S. Golder, G. Lotan. 2010. Tweet, tweet, retweet: conversational aspects of retweeting on
twitter. Proceedings of the 43th Hawaii International Conference on System Sciences (HICSS). • Brimicombe, A., Y. Li. 2006. Mobile space-time envelopes for location-based services. Transactions
in Geographical Information Systems, 10(1), 5-23. • Brown, J., A. Goolsbee. 2002. Does the Internet make markets more competitive? Evidence from the
life insurance industry. Journal of Political Economy, 110(3 June), 481-507. • Brynjolfsson, E., M. Smith. 2000. Frictionless commerce? A comparison of Internet and conventional
retailers. Management Science 46(4), 563-585. • Brynjolfsson, E., Y. J. Hu, M. Smith. 2003. Consumer surplus in the digital economy: Estimating the
value of increased product variety at online booksellers. Management Science, 49(11), 1580-1596. • Brynjolfsson, E., A. Dick, M. Smith. 2010. A nearly perfect market? Differentiation versus price in
consumer choice. Quantitative Marketing and Economics, 8(1), 1-33. • Cairncross, F. 1997. The Death of Distance. Cambridge, MA: Harvard University Press. • Carare, O. 2011. The impact of bestseller rank on demand: Evidence from the app market.
International Economic Review, Forthcoming. • Carney, D. R., M. R., Banaji. 2008. First is Best. Working Paper, Columbia University. • Chae, M., J. Kim. 2004. Do size and structure matter to mobile users? An empirical study of the
28
effects of screen size, information structure, and task complexity on user activities with standard web phones. Behaviour & Information Technology, 23(3), 165-181.
• Chib, S., E. Greenberg. 1995. Understanding the Metropolis-Hastings algorithm. The American Statistician, 49(4), 327-335.
• Choi, J., D. Bell. 2011. Preference Minorities and the Internet. Journal of Marketing Research. Forthcoming.
• Coney, K. 1977. Order bias: The special case of letter preference. Public Opinion Quarterly, 41(3), 385–388.
• Davison, H., C. Wickens. 1999. Rotocraft hazard cueing: The effects on attention and trust. Technical Report ARL-99-5/NASA-99-1, University of Illinois, Aviation Research Lab, Savoy, IL.
• Dean, M. 1980. Presentation order effects in product taste tests. Journal of Psychology, 105(1), 107–110. • Drèze, X., F. Zufryden. 2004. The measurement of online visibility and its impact on Internet traffic.
Journal of Interactive Marketing, 18(1), 20-37. • Ellison, G., S.F. Ellison. 2009. Search, obfuscation, and price elasticities on the Internet.
Econometrica, 77(2), 427-452. • Fellmann, J., A. Getis, J. Getis. 2000. Human geography. McGraw-Hill Publishing Co. 6th Edition. • Forman, C. A. Ghose, A. Goldfarb. 2009. Competition between local and electronic markets: how the
benefit of buying online depends on where you live. Management Science, 55(1), 47-57. • Friedman, T. 2005. The world is flat: A brief history of the twenty-first century. New York: Farrar,
Straus, and Giroux. • Ghose, A., S. Yang. 2009. An empirical analysis of search engine advertising: sponsored search in
electronic markets. Management Science, 55(10), 1605-1622. • Ghose, A., S. Han. 2010. A dynamic structural model of user learning in mobile media content,
Working Paper, NYU. • Ghose, A., S. Han. 2011. An empirical analysis of user content generation and usage behavior on the
mobile Internet, Management Science, 57(9), 1671-1691. • Hampton, K., B. Wellman. 2002. Neighboring in Netville: How the Internet supports community and
social capital in a wired suburb. City and Community, 2(3), 277-311. • Hastings, K. 1970. Monte Carlo sampling methods using Markov chains and their applications.
Biometrika, 57(1), 97-109. • Hong, H., M. Shum. 2006. Using price distributions to estimate search costs. RAND Journal of
Economics, 37(2), 257-275. • Hortaçsu, A., C. Syverson. 2004. Product differentiation, search costs, and competition in the mutual
fund industry: A case study of S&P 500 index funds. Quarterly Journal of Economics, 119(2), 403-456. • Java, A., X. Song, T. Finin, B. Tseng. 2007. Why we twitter: understanding microblogging usage and
communities. Proceedings of the Joint 9th WEBKDD and 1st SNA-KDD Workshop. • Jiang, B., X. Yao. 2006. Location-based services and GIS in perspective. Computers, Environment and
Urban Systems, 30(6), 712-725. • Jones, M., G. Marsden, N. Mohd-Nasir, K. Boone. 1999. Improving Web interaction on small displays.
Computer Networks, 31(11-16), 1129 - 1137. • Kim, J., P. Albuquerque, B. Bronnenberg. 2010. Online demand under limited consumer search.
Marketing Science, 29(6), 1001 - 1023. • Kuksov, D. 2004. Buyer search costs and endogenous product design. Marketing Science, 23(4), 490-
29
499. • Lynch, J. G., D. Ariely. 2000. Wine online: Search costs affect competition on price, quality, and
distribution. Marketing Science, 19(1), 83-103. • Maniar, N., E. Bennett, S. Hand, G. Allan. 2008. The effect of mobile phone screen size on video
based learning. Journal of Software, 3(4), 51-61. • Marcus, D. 2010. The future of local commerce. http://www.worldtech24.com/business/future-local-
commerce-facebook-foursquare-yelp-groupon. • Miller J., J. Krosnick. 1998. The impact of candidate name order on election outcomes. Public
Opinion Quarterly, 62(3), 291–330. • Mountain, D., H. Myrhaug, A. Goker. 2009. Mobile search. In Information Retrieval: Searching in the
21st Century. (Eds.) A. Göker, J. Davis. 103-130. • Nunamaker, J. F., L. M. Applegate, B. R. Konsynski. 1987. Facilitating group creativity: Experience
with a group decision support system. Journal of Management Information Systems, 3(4), 5-19. • Nunamaker, J. F., L. M. Applegate, B. R. Konsynski. 1988. Computer-aided deliberation: Model
management and group decision support. Journal of Operations Research, 36(6), 826-848. • Park, Y., P. Fader. 2004. Modeling browsing behavior at multiple websites. Marketing Science, 23(3),
280-303. • Scott Morton, F, F. Zettlemeyer, J. Silva-Risso. 2001. Internet car retailing. Journal of Industrial
Economics, 49(4 Dec), 501-520. • Shankar, V., S. Balasubramanian. 2009. Mobile marketing: A synthesis and prognosis. Journal of
Interactive Marketing. 23(2), 118-129. • Shankar, V., A. Venkatesh, C. Hofacker, P. Naik. 2010. Mobile marketing in the retailing environment:
Current insights and future research avenues. Journal of Interactive Marketing. 24(2), 111-120. • Shapiro, C., H.R. Varian. 1998. Information rules: A strategic guide to the network economy. Boston:
Harvard Business School Press. • Simon, H. A. 1996. The Sciences of the Artificial. (3rd ed.), Cambridge, MA: The MIT Press. • Simon, H. A. 1997. Designing organizations for an information-rich world. In D. M. Lamberton (Ed.),
The Economics of Communication and Information: 187-203. Cheltenham, UK: Edward Elgar. • Sinisalo, J. 2011. The role of the mobile medium in multichannel CRM communication. International
Journal of Electronic Customer Relationship Management. 5(1), 23-45. • Stephen, A., Y. Dover, J. Goldenberg. 2011. Social sharing by social pumps: The effect of transmitter
activity on information diffusion over online social networks, Working Paper, University of Pittsbrugh, • Sultan, F., A. Rohm, and T. Gao. 2009. Factors influencing consumer acceptance of mobile marketing:
a two country Study of Youth Markets. Journal of Interactive Marketing, 23(4), 308-320. • Tobler, W. 1970. A computer movie simulating urban growth in the Detroit region. Economic
Geography, 46(2), 234-240. • Yang, S., A. Ghose. 2010. Analyzing the relationship between organic and sponsored search
advertising: positive, negative, or zero interdependence? Marketing Science, 29(4), 602-623. • Yao, S., C. Mela. 2011. A dynamic model of sponsored search advertising, Marketing Science,
Forthcoming. • Zhang, X. 2009. Retailers’ Multichannel and Price Advertising Strategies. Marketing Science, 28(6),
1080-1094.

30
Appendix: The MCMC Algorithm
We ran the MCMC chain for 60,000 iterations and used the last 20,000 iterations to compute the
mean and standard deviation of the posterior distribution of the model parameters. We report below the
MCMC algorithm for the full model.
Step 1. Draw λ :
Conditional (A) can be written as follows:
Pr λ |µ,Λ, y L λ |µ, y Pr λ |Λ A1
Recall that L λ |µ, y is the same as L y |µ, λ in a conceptual manner. Then, it is important to note
that in conditional (A) we cannot apply normal-normal conjugacy because likelihood is based on Type 1
extreme value distribution whereas the prior is based on normal distribution. When we compute the
posterior, we need to multiply the likelihood by the prior. Hence, we use Metropolis-Hasting algorithm to
generate draws of λ . A chain of draws for λ can be generated in the following way:
λ ~N λ , Ω A2
where Ω is an individual i’s mth iteration. In addition, we use the adaptive Metropolis-Hasting
algorithm (Andrieu and Atchade 2007) to generate draws with higher efficiency while maintaining
Markov chain properties with the acceptance probability given by:
a λ ; λ min 1 ,L λ |y Pr λ |µ,Λ
L λ |y Pr λ |µ,Λ. A3
Step 2. Draw µ β , α :
Conditional (B) can be written as follows:
Pr µ|Λ, λ , y L µ| λ , y Pr µ|Λ A4

31
where n is the total number of users in the sample. Recall that L µ| λ , y is the same as
L y | λ , µ in a conceptual manner. Then, in conditional (B) we cannot apply normal-normal
conjugacy because likelihood is based on Type 1 extreme value distribution whereas the prior is based on
normal distribution. Hence, we use Metropolis-Hasting algorithm to generate draws of µ β , α . A
chain of draws for µ can be generated in the following way:
µ ~N µ ,Ψ A5
where Ψ is a tuning constant at mth iteration. We set the multivariate normal prior for µ such that η is
a zero vector of size npar and inversed C is the npar × npar square matrix with 0.001 on the main
diagonal and zeros elsewhere. npar is the number of random coefficients. Similar to conditional (A), we
use the adaptive Metropolis-Hasting algorithm to generate draws with the acceptance probability given
by:
a µ ; µ min 1 ,L µ | λ , y Pr µ |Λ
L µ | λ , y Pr µ |Λ. A6
Step 3. Draw Λ :
Conditional (C) can be computed using Wishart distribution as follows:
Pr Λ | λ W ρ n, ∑ λ λ R . A7
We set the Wishart prior for Λ where the degree of freedom, ρ is (npar + 2). We also set the Wishart
scale matrix, R to the identity matrix of size npar. Note that npar is 4 in the main model. We inverse Λ
to generate draws of Λ.
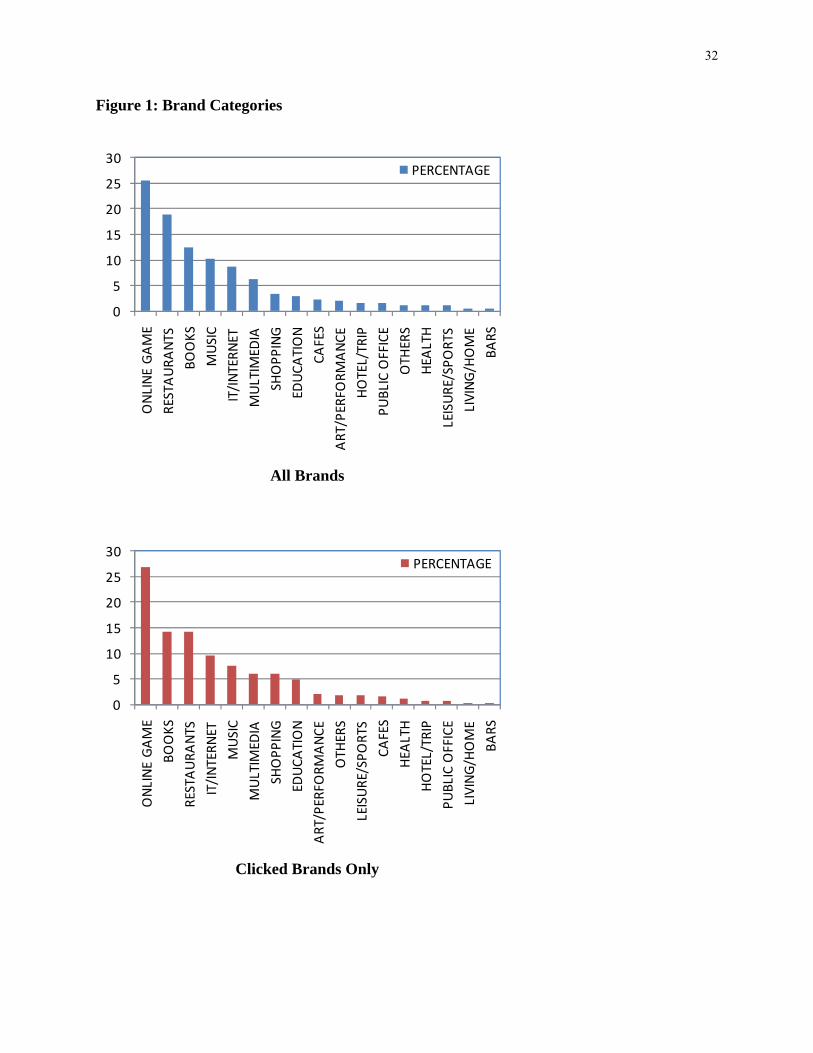
32
Figure 1: Brand Categories
All Brands
Clicked Brands Only
0
5
10
15
20
25
30ONLINE GAME
RESTAURA
NTS
BOOKS
MUSIC
IT/INTERN
ET
MULTIM
EDIA
SHOPP
ING
EDUCA
TION
CAFES
ART/PERFO
RMANCE
HOTEL/TRIP
PUBLIC OFFICE
OTH
ERS
HEA
LTH
LEISURE/SPO
RTS
LIVING/HOME
BARS
PERCENTAGE
0
5
10
15
20
25
30
ONLINE GAME
BOOKS
RESTAURA
NTS
IT/INTERN
ET
MUSIC
MULTIM
EDIA
SHOPP
ING
EDUCA
TION
ART/PERFO
RMANCE
OTH
ERS
LEISURE/SPO
RTS
CAFES
HEA
LTH
HOTEL/TRIP
PUBLIC OFFICE
LIVING/HOME
BARS
PERCENTAGE
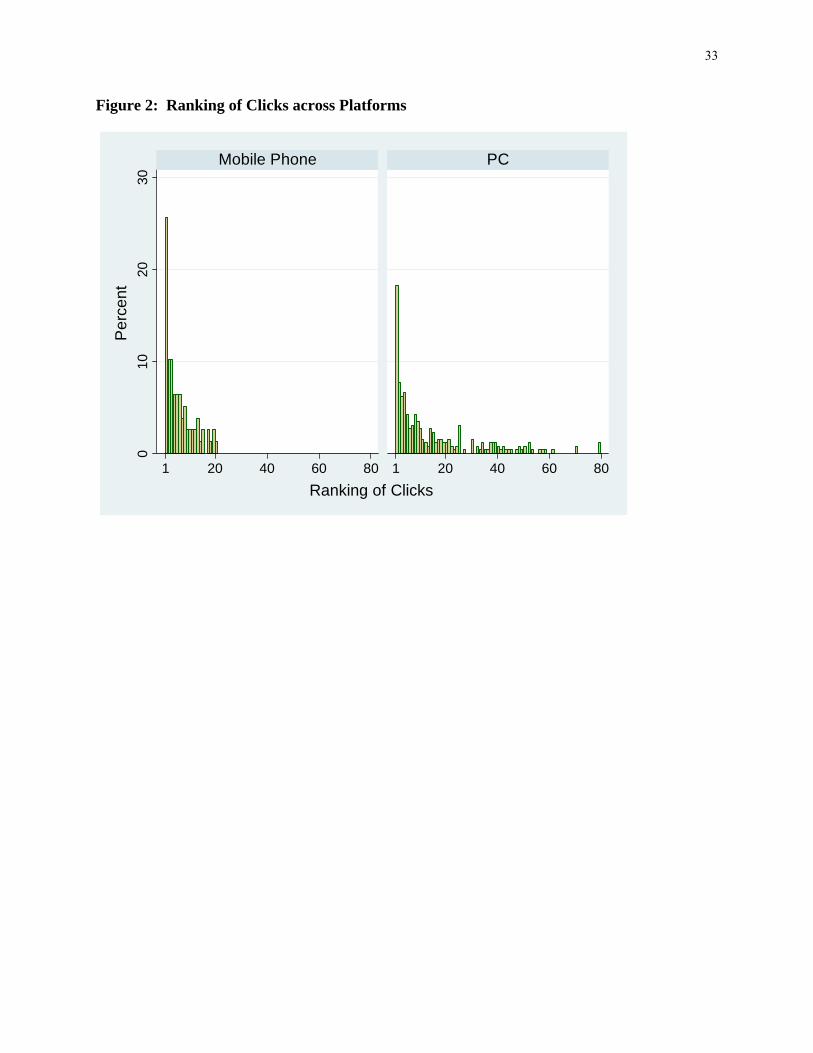
33
Figure 2: Ranking of Clicks across Platforms
010
2030
1 20 40 60 80 1 20 40 60 80
Mobile Phone PC
Per
cent
Ranking of Clicks
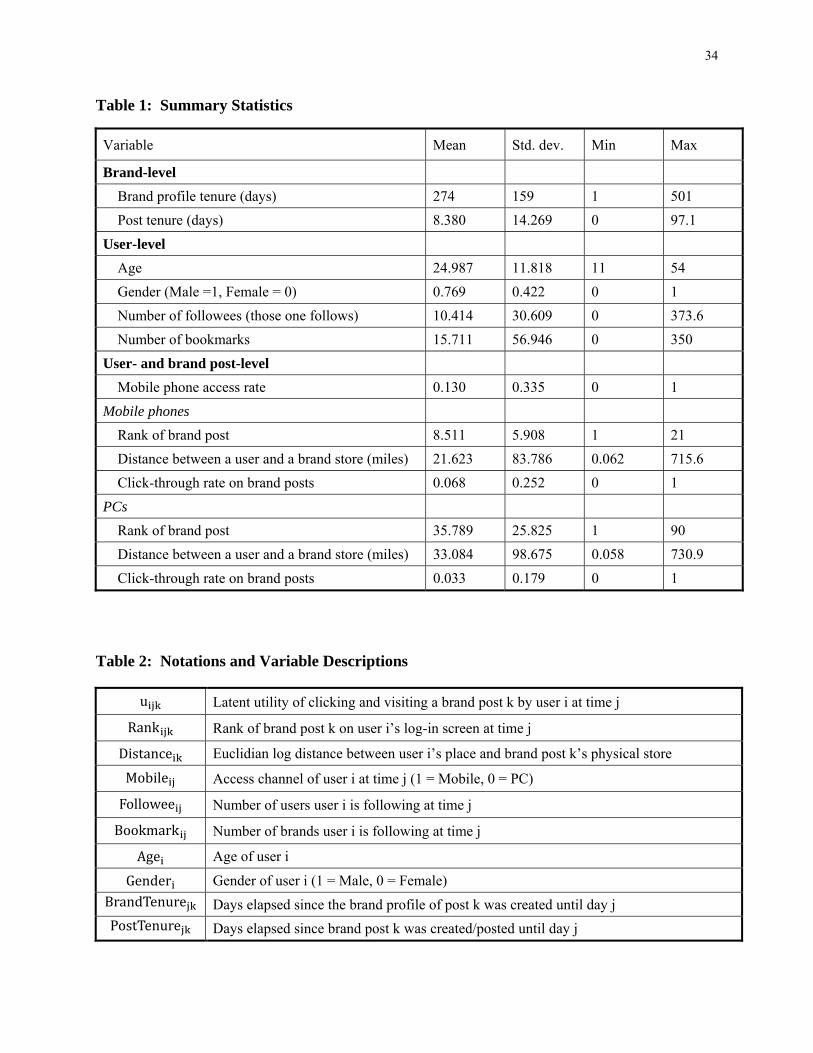
34
Table 1: Summary Statistics
Variable Mean Std. dev. Min Max
Brand-level Brand profile tenure (days) 274 159 1 501 Post tenure (days) 8.380 14.269 0 97.1
User-level Age 24.987 11.818 11 54 Gender (Male =1, Female = 0) 0.769 0.422 0 1 Number of followees (those one follows) 10.414 30.609 0 373.6 Number of bookmarks 15.711 56.946 0 350
User- and brand post-level Mobile phone access rate 0.130 0.335 0 1
Mobile phones Rank of brand post 8.511 5.908 1 21 Distance between a user and a brand store (miles) 21.623 83.786 0.062 715.6 Click-through rate on brand posts 0.068 0.252 0 1
PCs Rank of brand post 35.789 25.825 1 90 Distance between a user and a brand store (miles) 33.084 98.675 0.058 730.9 Click-through rate on brand posts 0.033 0.179 0 1
Table 2: Notations and Variable Descriptions
u Latent utility of clicking and visiting a brand post k by user i at time j
Rank Rank of brand post k on user i’s log-in screen at time j
Distance Euclidian log distance between user i’s place and brand post k’s physical store
Mobile Access channel of user i at time j (1 = Mobile, 0 = PC)
Followee Number of users user i is following at time j
Bookmark Number of brands user i is following at time j
Age Age of user i
Gender Gender of user i (1 = Male, 0 = Female) BrandTenure Days elapsed since the brand profile of post k was created until day j PostTenure Days elapsed since brand post k was created/posted until day j
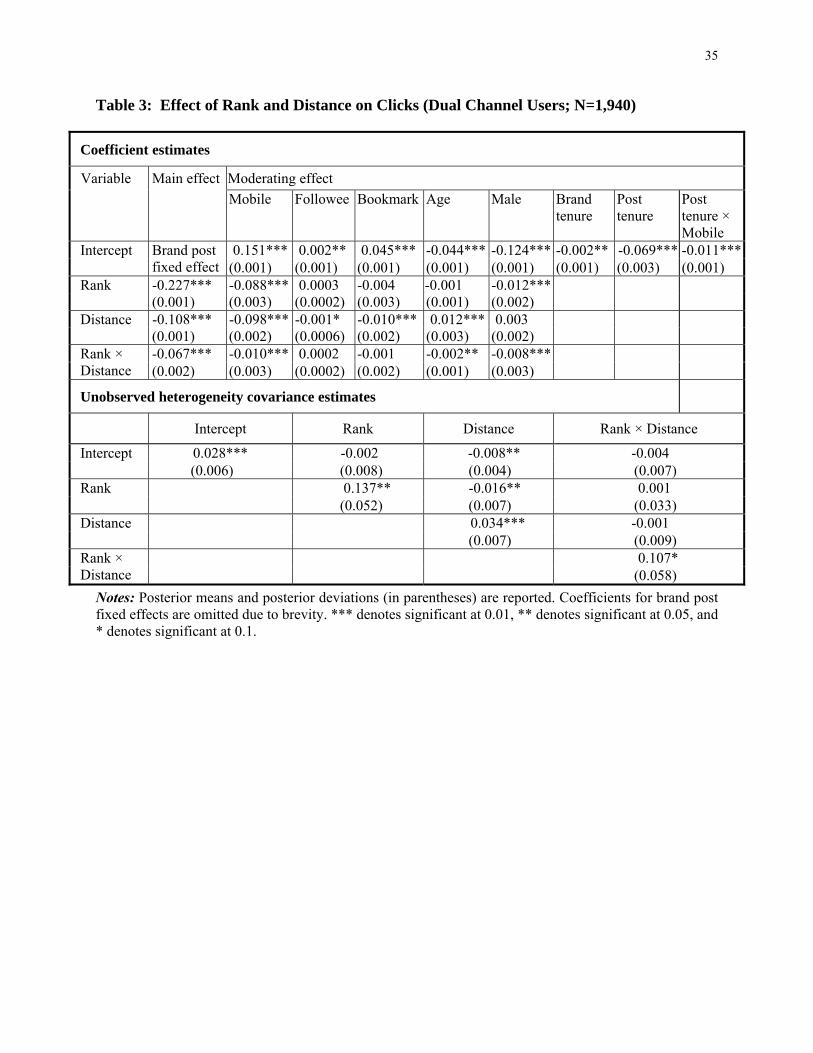
35
Table 3: Effect of Rank and Distance on Clicks (Dual Channel Users; N=1,940)
Coefficient estimates
Variable Main effect Moderating effect Mobile Followee Bookmark Age Male Brand
tenure Post tenure
Post tenure × Mobile
Intercept Brand post fixed effect
0.151*** 0.002** 0.045*** -0.044*** -0.124*** -0.002** -0.069*** -0.011***(0.001) (0.001) (0.001) (0.001) (0.001) (0.001) (0.003) (0.001)
Rank -0.227*** -0.088*** 0.0003 -0.004 -0.001 -0.012*** (0.001) (0.003) (0.0002) (0.003) (0.001) (0.002) Distance -0.108*** -0.098*** -0.001* -0.010*** 0.012*** 0.003 (0.001) (0.002) (0.0006) (0.002) (0.003) (0.002) Rank × Distance
-0.067*** -0.010*** 0.0002 -0.001 -0.002** -0.008*** (0.002) (0.003) (0.0002) (0.002) (0.001) (0.003)
Unobserved heterogeneity covariance estimates
Intercept Rank Distance Rank × Distance
Intercept
0.028*** -0.002 -0.008** -0.004 (0.006) (0.008) (0.004) (0.007)
Rank
0.137** -0.016** 0.001 (0.052) (0.007) (0.033)
Distance
0.034*** -0.001 (0.007) (0.009)
Rank × Distance
0.107* (0.058)
Notes: Posterior means and posterior deviations (in parentheses) are reported. Coefficients for brand post fixed effects are omitted due to brevity. *** denotes significant at 0.01, ** denotes significant at 0.05, and * denotes significant at 0.1.
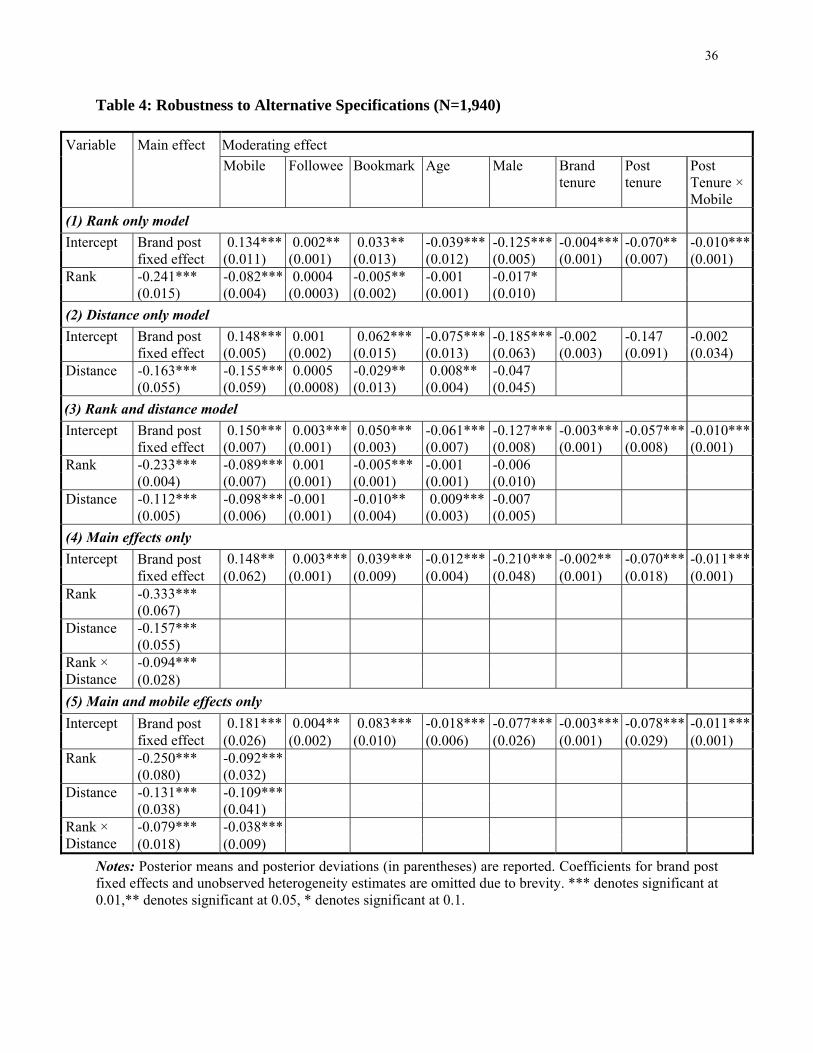
36
Table 4: Robustness to Alternative Specifications (N=1,940)
Variable Main effect Moderating effect Mobile Followee Bookmark Age Male Brand
tenure Post tenure
Post Tenure × Mobile
(1) Rank only model Intercept Brand post
fixed effect 0.134*** 0.002** 0.033** -0.039*** -0.125*** -0.004*** -0.070** -0.010***
(0.011) (0.001) (0.013) (0.012) (0.005) (0.001) (0.007) (0.001) Rank -0.241*** -0.082*** 0.0004 -0.005** -0.001 -0.017* (0.015) (0.004) (0.0003) (0.002) (0.001) (0.010) (2) Distance only model Intercept Brand post
fixed effect 0.148*** 0.001 0.062*** -0.075*** -0.185*** -0.002 -0.147 -0.002
(0.005) (0.002) (0.015) (0.013) (0.063) (0.003) (0.091) (0.034) Distance -0.163*** -0.155*** 0.0005 -0.029** 0.008** -0.047 (0.055) (0.059) (0.0008) (0.013) (0.004) (0.045) (3) Rank and distance model Intercept Brand post
fixed effect 0.150*** 0.003*** 0.050*** -0.061*** -0.127*** -0.003*** -0.057*** -0.010***
(0.007) (0.001) (0.003) (0.007) (0.008) (0.001) (0.008) (0.001) Rank -0.233*** -0.089*** 0.001 -0.005*** -0.001 -0.006 (0.004) (0.007) (0.001) (0.001) (0.001) (0.010) Distance -0.112*** -0.098*** -0.001 -0.010** 0.009*** -0.007 (0.005) (0.006) (0.001) (0.004) (0.003) (0.005) (4) Main effects only Intercept Brand post
fixed effect 0.148** 0.003*** 0.039*** -0.012*** -0.210*** -0.002** -0.070*** -0.011***
(0.062) (0.001) (0.009) (0.004) (0.048) (0.001) (0.018) (0.001) Rank -0.333*** (0.067) Distance -0.157*** (0.055) Rank × Distance
-0.094*** (0.028)
(5) Main and mobile effects only Intercept Brand post
fixed effect 0.181*** 0.004** 0.083*** -0.018*** -0.077*** -0.003*** -0.078*** -0.011***
(0.026) (0.002) (0.010) (0.006) (0.026) (0.001) (0.029) (0.001) Rank -0.250*** -0.092*** (0.080) (0.032) Distance -0.131*** -0.109*** (0.038) (0.041) Rank × Distance
-0.079*** -0.038*** (0.018) (0.009)
Notes: Posterior means and posterior deviations (in parentheses) are reported. Coefficients for brand post fixed effects and unobserved heterogeneity estimates are omitted due to brevity. *** denotes significant at 0.01,** denotes significant at 0.05, * denotes significant at 0.1.
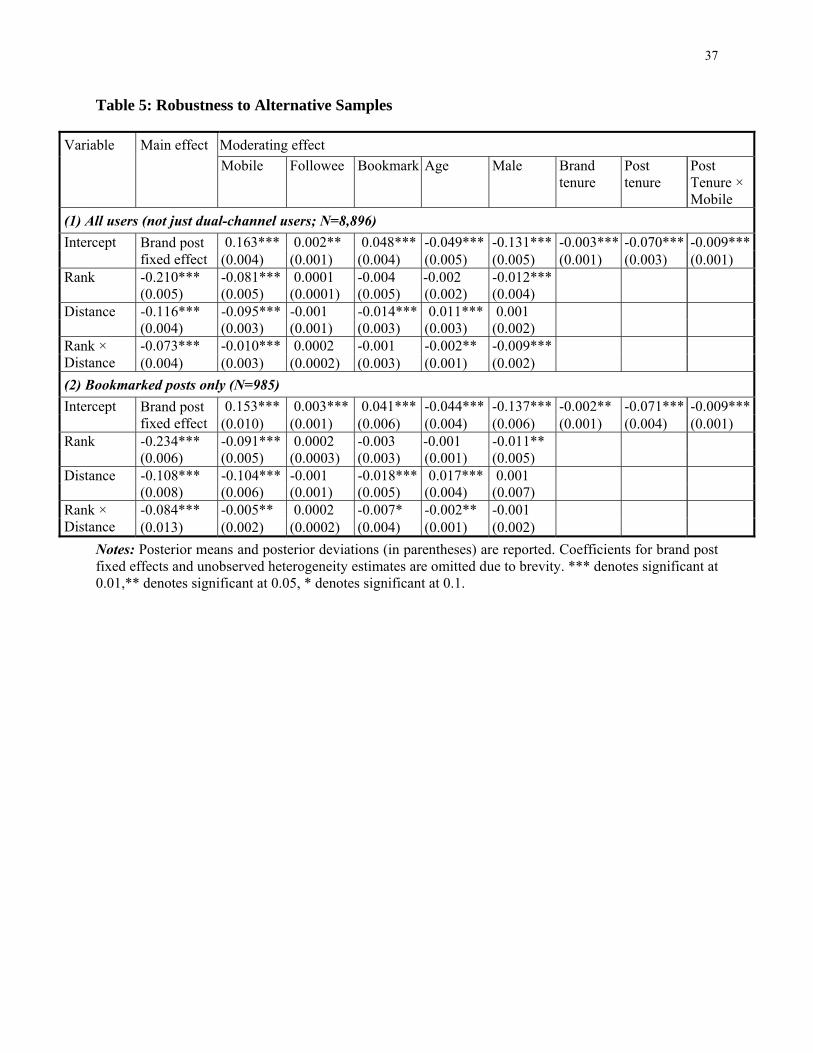
37
Table 5: Robustness to Alternative Samples
Variable Main effect Moderating effect Mobile Followee Bookmark Age Male Brand
tenure Post tenure
Post Tenure × Mobile
(1) All users (not just dual-channel users; N=8,896) Intercept Brand post
fixed effect 0.163*** 0.002** 0.048*** -0.049*** -0.131*** -0.003*** -0.070*** -0.009***
(0.004) (0.001) (0.004) (0.005) (0.005) (0.001) (0.003) (0.001) Rank -0.210*** -0.081*** 0.0001 -0.004 -0.002 -0.012*** (0.005) (0.005) (0.0001) (0.005) (0.002) (0.004) Distance -0.116*** -0.095*** -0.001 -0.014*** 0.011*** 0.001 (0.004) (0.003) (0.001) (0.003) (0.003) (0.002) Rank × Distance
-0.073*** -0.010*** 0.0002 -0.001 -0.002** -0.009*** (0.004) (0.003) (0.0002) (0.003) (0.001) (0.002)
(2) Bookmarked posts only (N=985) Intercept Brand post
fixed effect 0.153*** 0.003*** 0.041*** -0.044*** -0.137*** -0.002** -0.071*** -0.009***
(0.010) (0.001) (0.006) (0.004) (0.006) (0.001) (0.004) (0.001) Rank -0.234*** -0.091*** 0.0002 -0.003 -0.001 -0.011** (0.006) (0.005) (0.0003) (0.003) (0.001) (0.005) Distance -0.108*** -0.104*** -0.001 -0.018*** 0.017*** 0.001 (0.008) (0.006) (0.001) (0.005) (0.004) (0.007) Rank × Distance
-0.084*** -0.005** 0.0002 -0.007* -0.002** -0.001 (0.013) (0.002) (0.0002) (0.004) (0.001) (0.002)
Notes: Posterior means and posterior deviations (in parentheses) are reported. Coefficients for brand post fixed effects and unobserved heterogeneity estimates are omitted due to brevity. *** denotes significant at 0.01,** denotes significant at 0.05, * denotes significant at 0.1.
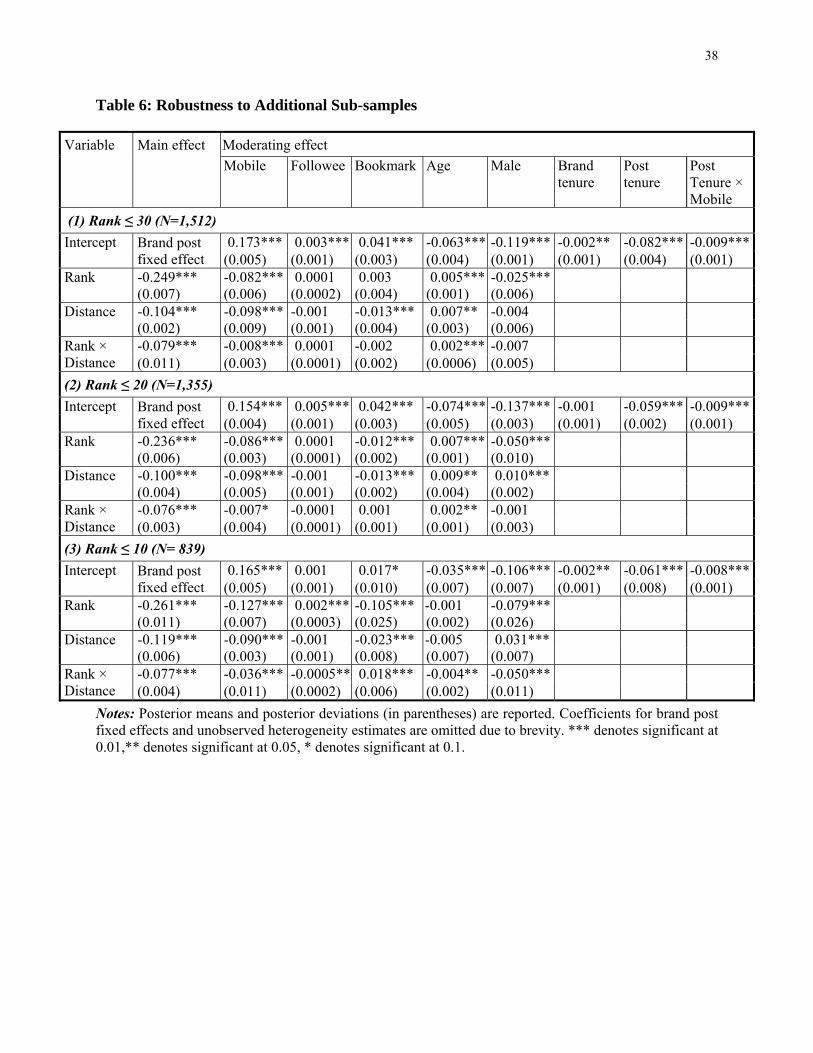
38
Table 6: Robustness to Additional Sub-samples
Variable Main effect Moderating effect Mobile Followee Bookmark Age Male Brand
tenure Post tenure
Post Tenure × Mobile
(1) Rank ≤ 30 (N=1,512) Intercept Brand post
fixed effect 0.173*** 0.003*** 0.041*** -0.063*** -0.119*** -0.002** -0.082*** -0.009***
(0.005) (0.001) (0.003) (0.004) (0.001) (0.001) (0.004) (0.001) Rank -0.249*** -0.082*** 0.0001 0.003 0.005*** -0.025*** (0.007) (0.006) (0.0002) (0.004) (0.001) (0.006) Distance -0.104*** -0.098*** -0.001 -0.013*** 0.007** -0.004 (0.002) (0.009) (0.001) (0.004) (0.003) (0.006) Rank × Distance
-0.079*** -0.008*** 0.0001 -0.002 0.002*** -0.007 (0.011) (0.003) (0.0001) (0.002) (0.0006) (0.005)
(2) Rank ≤ 20 (N=1,355) Intercept Brand post
fixed effect 0.154*** 0.005*** 0.042*** -0.074*** -0.137*** -0.001 -0.059*** -0.009***
(0.004) (0.001) (0.003) (0.005) (0.003) (0.001) (0.002) (0.001) Rank -0.236*** -0.086*** 0.0001 -0.012*** 0.007*** -0.050*** (0.006) (0.003) (0.0001) (0.002) (0.001) (0.010) Distance -0.100*** -0.098*** -0.001 -0.013*** 0.009** 0.010*** (0.004) (0.005) (0.001) (0.002) (0.004) (0.002) Rank × Distance
-0.076*** -0.007* -0.0001 0.001 0.002** -0.001 (0.003) (0.004) (0.0001) (0.001) (0.001) (0.003)
(3) Rank ≤ 10 (N= 839) Intercept Brand post
fixed effect 0.165*** 0.001 0.017* -0.035*** -0.106*** -0.002** -0.061*** -0.008***
(0.005) (0.001) (0.010) (0.007) (0.007) (0.001) (0.008) (0.001) Rank -0.261*** -0.127*** 0.002*** -0.105*** -0.001 -0.079*** (0.011) (0.007) (0.0003) (0.025) (0.002) (0.026) Distance -0.119*** -0.090*** -0.001 -0.023*** -0.005 0.031*** (0.006) (0.003) (0.001) (0.008) (0.007) (0.007) Rank × Distance
-0.077*** -0.036*** -0.0005** 0.018*** -0.004** -0.050*** (0.004) (0.011) (0.0002) (0.006) (0.002) (0.011)
Notes: Posterior means and posterior deviations (in parentheses) are reported. Coefficients for brand post fixed effects and unobserved heterogeneity estimates are omitted due to brevity. *** denotes significant at 0.01,** denotes significant at 0.05, * denotes significant at 0.1.