Efficient Cancelable Biometric Key Generation Scheme for Cryptography
How Does It Play Better? Exploring User Testing and Biometric Storyboards in Games User Research
Pejman Mirza-Babaei University of Sussex
Brighton, BN1 9RH, UK [email protected]
Lennart E. Nacke University of Ontario Institute
of Technology Oshawa, L1H7K4, Canada [email protected]
John Gregory University of Ontario Institute
of Technology Oshawa, L1H7K4, Canada
[email protected] Nick Collins
University of Sussex Brighton, BN1 9RH, UK
Geraldine Fitzpatrick Vienna University of Technology
A-1040 Vienna, Austria [email protected]
ABSTRACT Improving game design is a hard task. Few methods are available in games user research (GUR) to test formally how game designs work for players. In particular, the usefulness of user tests (UTs) for game designers has not been fully studied in the CHI community. We propose a novel GUR method called Biometric Storyboards (BioSt) and present a study demonstrating how a Classic UT and a BioSt UT both help designers create a better gameplay experience. In addition, we show that BioSt can help designers deliver significantly better visuals, more fun, and higher gameplay quality than designing without UTs and that classic UTs do not provide this significant advantage. Our interviews support the idea that BioSt provides more nuanced game design improvement. The design implication is that a game designed with the BioSt method will result in high gameplay quality.
Author Keywords Games; Games User Research; User Testing; Storyboards; Physiological Measures; User Experience; Visualization.
ACM Classification Keywords H.5.2 [Information Systems]: User Interfaces; K.8.0 [Gen-eral]: Games – Personal Computing;
INTRODUCTION Video games are often designed without formal user testing methods. The problem is that we currently do not know whether games will be designed better with or without user testing. Validating game design frequently relies on the informal skills that game designers acquire on the job. Game design itself often follows the prescriptions and rules developed by people with considerable experience on the job (e.g., Formal Abstract Design Tools [6]). However,
academic research takes an analytic stance to understanding game design, focused on observing, measuring and testing player reactions (e.g., prescribing design heuristics [23]). Games user research (GUR) lies somewhere between these approaches, aiming to improve game design by providing sufficient information about gameplay for designers to draw the best conclusion possible for improving their designs. While traditional video game testing has focused on the improvement of software (e.g., bug tracking and quality assurance), as part of GUR it has become more common to run user tests (UT) to improve a game’s design [10]. Games are an art form as much they are new interactive media, often pioneering novel user interfaces and exploring new target groups. For this reason, UTs are becoming an essen-tial part of every game’s development cycle. However, the usefulness of UTs for game designers has not been studied sufficiently. We address this shortcoming by comparing the quality of three games: two designed with contrasting UT methods and one designed with no UT method at all.
Previous work has demonstrated that physiological measures are suitable for evaluating user engagement in games with regard to the emotional component of their ex-perience [14,19], thus the game industry has shown interest in integrating these methods in game development and evaluation [1,26]. However, to apply these measurements, a major challenge for the game industry and researchers alike is tying together the results of physiological measures and player experience reports. To address this problem, a meth-od called Biometric Storyboards (BioSt) was developed that combines designer intentions, user experience evaluations, and player reactions (physiological and observed) in a sin-gle UT report. We believe that such a GUR approach could provide the most value for a game development team. However, since the field of physiological player evaluation is still emerging, we have yet to understand the usefulness of BioSt and its relative value in regards to classic UTs and to prescriptive and intuitive game design approaches.
In this paper, we investigate the differences in game design between games developed using a Classic UT, a BioSt UT, and no UTs (i.e., designer expertise only). We had a game
Permission to make digital or hard copies of all or part of this work forpersonal or classroom use is granted without fee provided that copies arenot made or distributed for profit or commercial advantage and that copiesbear this notice and the full citation on the first page. To copy otherwise,or republish, to post on servers or to redistribute to lists, requires priorspecific permission and/or a fee. CHI 2013, April 27–May 2, 2013, Paris, France. Copyright © 2013 ACM 978-1-4503-1899-0/13/04...$15.00.
Session: Game Design CHI 2013: Changing Perspectives, Paris, France
1499
programmer create three different versions of a game proto-type based on the recommendations of game designers that used a Classic UT, a BioSt UT, or no UTs to create a list of design recommendations. Our results support the GUR mindset that UTs improve a game considerably by showing that using either BioSt UT or Classic UT leads to games that are better designed and that rate more positively than games designed without any form of UTs.
The key contribution of this paper then is providing evi-dence that games evaluated with Classic UT or BioSt UT actually provide a higher quality product and a better gameplay experience. In addition, our findings indicate that BioSts provide more nuanced design suggestions. This im-plies that a game designed with the BioSt method will result in higher perceived gameplay quality and will provoke more subtle changes to game mechanics.
RELATED WORK Many researchers have studied game design concepts and gameplay criteria, for example, to investigate what compo-nents make gameplay more fun and enjoyable [13,23]. However, using data based on players’ interaction with the game for evaluating and explaining their gameplay experi-ence is relatively new.
GUR is an emerging field that specifically investigates the interaction between players and games, with the purpose of evaluation and gaining insights from players to optimize game design. The methods used in game UT sessions have been extended and modified from existing HCI methodolo-gies. However, the usefulness of such UTs in improving game development has yet to be established.
Classic UT and GUR methods include player self-report measures (e.g., questionnaires, interviews, and focus groups) as well as observational video analysis reports [20]. Although, classic UTs are relatively easy to conduct, and can potentially provide a rich source of data, video games require measures that can take into account how player en-gagement can change during gameplay events [2].
A number of industry-standard GUR approaches use classic HCI evaluation methods in combination (e.g., RITE [16]). Other variations include open-ended usability tasks, paper prototypes, and empirical guideline documents [20]. A new direction emerging in GUR is physiological player evalua-tion, another approach still to be evaluated in terms of its actual usefulness in game development. The use of physio-logical data can be a powerful research tool when examin-ing communication, media, and media interfaces as well as video games [21]. Physiological evaluation measures (also called biometrics in GUR), such as Skin Conductance (SC), facial Electromyography (EMG), Heart Rate (HR), and Electroencephalography (EEG) are slowly becoming an integral part of GUR methods [7,17]. General approaches distinguish physiological analysis on a temporal dimension, for example, studying responses at points in time [22] and studying averaged responses over a time span [14].
In related work, Hazlett [9] describes the use of facial EMG as a measure of positive and negative emotional valence during gameplay. Mandryk et al. [14] described experi-ments designed to test the efficacy of physiological measures as evaluators of collaborative entertainment tech-nologies by examining physiological responses to different interactive play environments. Nacke et al. [19] created an emotional profile of flow and immersion during gameplay by measuring facial EMG and SC level. For a detailed re-view of the current state of physiological game research see Kivikangas et al. [11].
There is a growing interest in HCI to explore the potential of physiological measurements to modify user experience as well as to explore players’ cognitive, motivational, and emotional responses in physiological computing [8]. One challenge of physiological evaluation comes from the ‘many-to-one’ relationship between psychological pro-cessing and physiological responses that allows for physio-logical measures to be linked to a number of psychological structures [5]. For example, a player could be physiologi-cally aroused not because of a specific in-game element but as a response to an external activity, anticipation, or as a result of something else that was not observed.
In using biometrics in conjunction with other user research methods, one of the current challenges is tying together the results of physiological evaluation and player experience reports, because the data are different and identifying ac-tionable results is difficult. Presenting results from high-resolution data to game designers is often not straightfor-ward. A common approach is to visualize large data sets captured directly from gameplay (i.e., game metrics). These visualizations aim at analyzing player performance aspects, such as player progress (e.g., time taken, location of death) or to balance gameplay [15,24]. However, most of these techniques focus on player behavior (e.g., ‘what they did’) but do not address player experience, such as reasoning (e.g., ‘why they did it’), or emotion (e.g., ‘how they felt’).
In summary, while classic UTs and biometric UT methods are increasingly being used in GUR, there are many open questions about both techniques and their value for improv-ing game design. In this paper, we explore the use of two exemplar UT techniques in the development of a game, with each technique taking the game to a different parallel version. First, we use a Classic UT technique, for which we chose to combine gameplay observation, questionnaires and interviews. Second, we use a physiological GUR technique (BioSt) that explores the use of graph storyboarding (in the sense of a plot graph) to visualize physiological data.
Physiological Measures Used in BioSt UTs Skin-conductance level (SCL) or galvanic skin response (GSR) is a physiological measurement with easy applica-tion. SCL is regulated by the production of sweat in the eccrine glands, where increased activity is associated with psychological arousal. This makes it an ideal physiological
Session: Game Design CHI 2013: Changing Perspectives, Paris, France
1500

measure for analyzing games, where exciting moments are likely to elicit high arousal and engagement in the game [7]. For BioSt UTs, we measured SCL using passive SC sensors attached to the medial phalanx of the ring and little fingers on player’s left hand (Figure 1 right image).
Figure 1. EMG sensors (left) and SC sensors (right).
EMG sensors measure electrical activation of muscle tissue, and facial EMG has been used in emotion detection [5]. Zygomaticus major (smiling) and corrugator supercilii (frowning) facial muscle activity was measured for BioSt UTs using passive EMG sensors on a player’s cheek, brow, and ear lobule (for ground sensor) shown in Figure 1 (left). The raw data was analyzed to indicate activation in smiling and frowning muscles. We followed the analysis described by Hazlet [9], where we considered a muscle significantly active if the signal was above a threshold value of our total sample average (M) plus the total standard deviation (SD). After calculating the threshold values for both muscles, thresholds were compared to each sampled EMG value. If the value was above the threshold, the measuring muscle was noted as active at that moment.
BIOMETRIC STORYBOARDS (BIOST) BioSt uses the idea of graph storyboarding to communicate player experience issues. The graphs are based on data col-lected during a GUR session including player comments, observational notes, gameplay metrics and a player’s physi-ological state. The BioSt tool discussed here is the result of a three-year iterative prototype development process [18].
The BioSt Tool Implementation The purpose of the BioSt tool, which was developed using the Unity game engine, is to visualize the data gathered from SCL and facial EMG measurements and UT sessions. These responses are combined into a single view that can later be shown to game designers and compared to their intended player experience. One can also create an aggre-gated graph representing GUR findings from a number of players. In total, the BioSt tool has three parts: 1) The in-tended player experience graph 2) The player’s input view, and 3) The GUR view. We now explain each of these parts.
The intended player experience graph (Figure 2) is where the game designer draws the expected player experience. The tool has functionality for adding beats (thematic areas of game events). It allows labeling each beat with an appro-
priate name and corresponding time, and labeling key nodes in the player experience (e.g., high: to suggest an exciting experience or low: to suggest a less exciting part). This in-formation is then saved for later use in the GUR view.
Figure 2. Intended player experience graph (representing what
designers think exciting gameplay moments are) showing game beats, times and key events.
Player input view: After a gameplay session the player and researcher together review the gameplay video. The re-searcher types in the player’s comments and naming of pos-itive and negative experience into the player input view of the tool, identified with a unique player’s ID and event timestamp (this is so that the following data will line up the physiological measurements).
The GUR view is where the tool enables a link between the designer’s intended player experience, and the player’s ac-tual physiological reaction to game events and self-reported comments. The GUR view has three components: the in-tended graph (see again Figure 2), a single player’s data graph and the aggregated players’ graph. The single play-er’s data graph includes the player’s physiological reaction to game events and their self-reported comments (Figure 3). Each player’s data is viewed individually, showing SCL, facial EMG measurements and player comments.
Figure 3. Single player’s data graph in GUR view synchro-
nized based on the frame counter timestamp.
Figure 3 shows how the various elements of player data are represented along a timeline. It shows the normalized SC level graph, muscle activation bars (green: smiling muscle, red: frown muscle), boxes for player’s comments and expe-rience descriptions, which are visible at mouse-over (blue: positive comments, red: negative comments). Game beats (thematic areas of game events) are also indicated by a col-ored line and show the time a player spent in each beat. Further, all players’ experiences can be aggregated – as per the experience graph shown in Figure 4 – and located at the
Session: Game Design CHI 2013: Changing Perspectives, Paris, France
1501

bottom of the GUR view. This has the same visual format as the designer’s intended player experience graph.
Figure 4. GUR aggregated player experience graph, indicating areas of difficulty and average time spent in each game beat.
Physiological Recording We used a NeXuS-10 MKII device to record physiological measurements; recording software was a custom C++ ap-plication using the NeXuS SDK to collect raw data from the device and display the recording timestamp on the comput-er screen (timestamp display enabled mapping between the physiological data and in-game events). SC level is one of the easiest physiological measures to apply and analyze. Together with the similarly easy-to-use facial EMG, these two physiological signals provide relevant data for player engagement and the ease of application necessary in the games industry (see Figure 1 again for the respective elec-trodes used). SC level shows the change in player’s arousal levels and EMG of smiling and frowning muscles provide an indication of player’s emotional valence levels.
EVALUATIONS
Figure 5. Overview of our game evaluation experiment.
The aim of the evaluation was to demonstrate whether dif-ferent GUR techniques can facilitate the game design pro-cess to optimize the quality of the game. For this purpose, we selected a test game under development from an indie game programmer. In phase 1 (see Figure 5) we conducted a UT session on the test game using both classic UT and a biometric (with BioSt) UT. In phase 2, three pairs of exter-
nal designers (see section Phase 2 – Developing Three Game Prototypes for details) provided us with their im-provement suggestions on our initial version of the game. One group of designers was given classic UT report from Phase 1, the other group of designers used a BioSt UT re-port, a third (control) group of designers had to suggest design improvements without any UT reports based solely on their design intuition. In phase 3, the same game pro-grammer improved the game based on the design feedback. Each game prototype was evaluated as a level of the inde-pendent variable in the experiment described in phase 4.
The Game: Matter of Seconds (MoS) The game used in this is study was the independent game Matter of Seconds, a fast 2D platform jump-and-run game, under commercial development (see Figure 6). The game programmer agreed to contribute to this project in return for receiving feedback to improve the quality of the game for its future release. In MoS, the main game goal of the hour-glass-shaped player avatar is to stay alive. The game is lin-ear, as the player automatically moves forward to the game world with controls only allowing them to slow down, speed up, or jump over obstacles and gaps using three ar-row keys. The player must collect items to add to the time left for completing a level while avoiding crashing. If the player dies they teleport back in time to the last checkpoint that they hit. If they run out of time, they must start over from the beginning of that level. Only the first two levels of the game were developed and completed to a playable qual-ity indicative of the final release, and only these sections were tested, intended for about six minutes of gameplay.
Figure 6. Screenshot of MoS level 1.
PHASE1 - USER TEST SESSION We recruited six PC gamers for the UT sessions, all male university undergraduate students, who played video games frequently. They were recruited using the department’s in-ternal mailing list, and their participation was voluntary. The aim of running the UTs was identifying usability and user experience (UX) issues with the initial game version. The UTs were conducted by a professional GUR experi-menter with industry experience, who had worked for a GUR company for more than two years and prepared sever-al professional UT reports for game companies before.
Testing was conducted over 3 days in a game laboratory. Participants played the game on a PC (Windows 7) con-
Session: Game Design CHI 2013: Changing Perspectives, Paris, France
1502
nected to a 24” display. Video cameras captured the player, physiological recording software recorded SC and EMG signals, and real-time footage from the screen and simulta-neous frame counter from the biometric software was digi-tally recorded for later analysis.
Before starting the UT, the players signed an informed con-sent form, and the GUR experimenter attached SC and faci-al EMG sensors (see Figure 1). The players were asked to relax for a few minutes so baseline measures could be rec-orded. The GUR experimenter informed the players that they would play the first two levels of a new game under development and their feedback was needed to improve the game. Each player played MoS for 10 minutes or two lev-els. Before the UT started the players were given a written explanation of the game mechanics and had a few minutes to familiarize themselves with the controls. Once they felt comfortable, the GUR experimenter started the game, the video recording software and the physiological recorder. After they finished both levels (or 10 minutes of play) the recording was stopped and the participant filled out a ques-tionnaire asking them about their experience (e.g., game features they liked and did not like). After this, the players watched their gameplay video and were asked to pause the video to indicate and explain moments where they had any positive or negative experiences and provide qualitative comments on those moments. The GUR experimenter used the Player Input view of BioSt to enter the video timestamp and player’s comments at the selected moments.
Two UT reports were then created by the GUR experiment-er from the same UT session data: one, a classic text and video based UT report (this was later used by Classic UT team), and the other, a BioSt UT report (this was later used by BioSt UT team).
The Classic UT report included: the information about the game, the game’s core mechanics, the participant’s game profile details, and the gameplay videos of the six partici-pants. It also contained checklist of nine gameplay issues identified from the user test sessions and a one-page de-scription of each issue, followed by a screenshot, gameplay example video and participants’ questionnaire comments.
The BioSt UT report included the same information about the game and participants as the Classic UT report, the same gameplay videos of six participants. However, instead of a description page of each issue, and participants’ com-ments from the questionnaire, it included a printed version of the BioSt GUR view, including the designer’s intended player experience graph (Figure 2), the player’s SC graph, the EMG positive and negative activations and the player’s commented events (Figure 3), and the aggregated player experiences graph (Figure 4).
PHASE 2 – DEVELOPING THREE GAME PROTOTYPES We had two aims for this development process: first, to create three parallel versions of our game for the experi-ment (these versions served as three levels of the independ-
ent variable); second, to evaluate the different approaches the game designers used for generating their recommenda-tions list. We were particularly interested to see the ad-vantages and limitations of each approach in a complete development cycle, how the designers applied them, and to explore the difference in recommendations resulting from the different evaluation approaches.
For this, we recruited six external game designers, all male graduates from a game development degree with profes-sional experience of developing video games. The designers were recruited carefully (same level of education and pro-fessional experience) to make sure they all had an equal level of expertise. We also randomly grouped them into three teams (two game designers per team) to reduce the effect of a designer’s individual abilities. None of the re-cruited game designers were involved in the initial game development, neither were they aware of the study’s aims nor of the BioSt tool. They were told they were recruited to provide feedback on a game prototype for the programmer.
Each team was given the original version of MoS, the game’s design intention, a core game mechanics list that could not be modified (serving as publisher requirements). The designers were given 3 hours and asked to prepare their list of game improvement recommendations for the pro-grammer. The designers were also asked to rate their confi-dence in each recommendation. Once they had prepared their list, they met the programmer explaining the requested changes. Each team (Classic UT, BioSt UT, and Non-UT) attended their session on a separate day.
At the end of the session, we interviewed both game de-signers in the team together. We were interested to know how and why they had come up with their recommenda-tions list. Overall, designers working with BioSt requested the most changes (18, compared to 17 in Classic UT and 16 by Non-UT team) and had the highest average confidence rating (4.8 out of 5 compared to 4.5 for Classic UT and 3.8 for Non-UT) among the groups.
All three groups modified the interface and the game’s scoring system aiming to simplify them. In the Classic UT game and the Non-UT game, the new scoring system was based on the number of collected items and the time a play-er stayed alive. However, in the BioSt UT game, the de-signers changed the scoring system to making players race against a timer so collectables reduced overall time.
The Classic UT team added a short tutorial at the beginning of level one, introducing the core game mechanics such as jumps. The BioSt UT team aimed to introduce these me-chanics through the levels. For example, they relocate the collectables showing a curve that players could use to make a good jump, or the ideal level path they should take.
Only the Classic UT team changed the high jumping me-chanics and introduced a double jump. The BioSt UT team decided to modify the level, and omitted the platforms that needed a high jump. The BioSt game was the only game
Session: Game Design CHI 2013: Changing Perspectives, Paris, France
1503
where designers changed the level design; adding to plat-form length before main challenges and after checkpoints.
The Non-UT team requested changes to give more feedback to players. For example, they asked for checkpoints to change color once they had been activated. The Classic UT and BioSt UT teams requested changes to the ending of each level. The Classic UT team added a static ending screen showing players overall time and score. The BioSt team requested a dynamic score bar which would activate based on the number of collected items. The players had to jump through the bar to reduce their overall time.
PHASE 3 - IMPLEMENTING REQUESTED CHANGES Once he had the three lists of suggested improvement changes, the game programmer then applied all requested changes in each set to create three different parallel ver-sions of MoS. He did not make any of his own modifica-tions beyond these. This phase took about three weeks and the resulting three different versions of MoS were used as a condition for the experiment reported next.
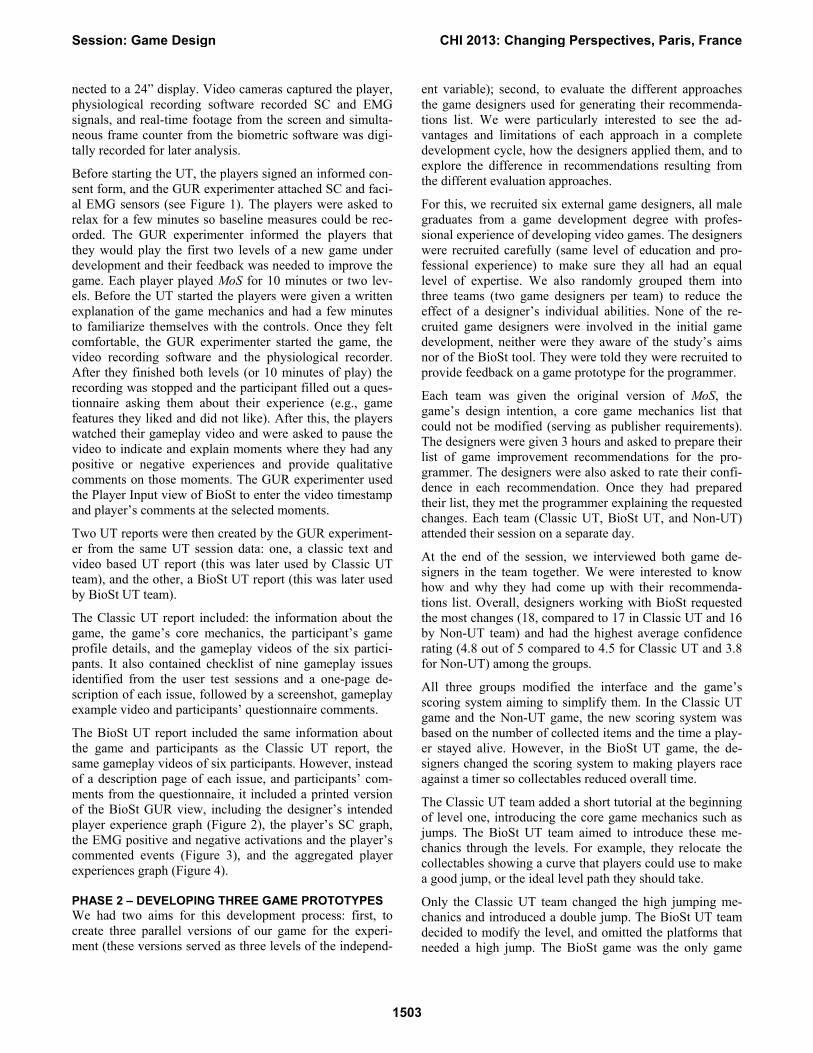
PHASE 4 - EXPERIMENT In overview, to evaluate the relative value of the different GUR approaches, 24 participants (see below) played all three versions of the game: one developed using a Classic UT text and video report, one developed by using a BioSt UT report, and one control condition developed only based on designers’ expert opinions (see Table 1).
Conditions Development method
Classic UT Classic video and text UT evaluation and report BioSt UT BioSt UT evaluation and report Non-UT Designer’s expert opinion
Table 1. Game conditions.
Experimental Procedure The study used a three-condition (2 UT variations, 1 control without UT) within-subjects design. All participants played all three conditions, which were counterbalanced and pre-sented using a randomized ordering. This means with the 24 participants in this study each counterbalanced sequence has been tested four times. After providing informed con-sent, the participants completed a demographics question-naire, which also asked questions about their gameplay ex-perience. Each participant was given a few minutes to get comfortable with the game controller (3 arrow keys) before the trial began. Participants played each game condition for 10 minutes or until they completed both levels, a common playing time in game research [11]. After each game, par-ticipants completed four surveys (PANAS [25], SAM [3], SUS [4] and our Likert questionnaire on the game features). Following completion of all conditions, players were inter-viewed and completed a final rating soliciting their opinions of the three games. The experiment was conducted over 7 days under laboratory conditions. The game was played on a Dell computer running Windows 7 with a 24” display. Participants were seated on a chair behind an office desk.
They played the game using a standard Dell keyboard and speakers.
Participants Twenty-four participants, all male students between 19 and 27 years old (M=23.3, SD=2.5) completed the study. They were all experienced PC gamers and played video games at least twice a month. We recruited participants from a mail-ing list and they received $10 for participating in the study.
RESULTS The ratings data were analyzed using the Shapiro-Wilk test to check whether data were parametric or not. For our three related samples, significance was tested using a one-way repeated measures (RM) analyses of variance (ANOVA) for parametric data and using Friedman’s ANOVA with an exact test for non-parametric data. We present quantitative results on the SUS, PANAS, and SAM scales as well as our Likert questionnaire on the game features.
Results from SUS, PANAS, and SAM Scales The data from the SUS was normally distributed, but the results were not significantly different between the condi-tions (F=2.83, p=.069). Positive affect (PA) and negative affect (NA) scores were calculated from the PANAS. For NA, the Friedman’s test results were not significant. For PA, the data was parametric and analyzed with an RM ANOVA. The main results were significant (F=7.23, p=.002). Pairwise comparisons revealed significant con-trasts between Classic UT and Non-UT games (p=.006) and BioSt UT and Non-UT games (p=.004). Figure 7 shows the differences between PA in the three different conditions.
10 20 30 40 50
Classic UTBioSt UTNon-UT
PANAS Positive Affect Ratings
Figure 7. Significant averages(CI: 95%) of PANAS PA rating.
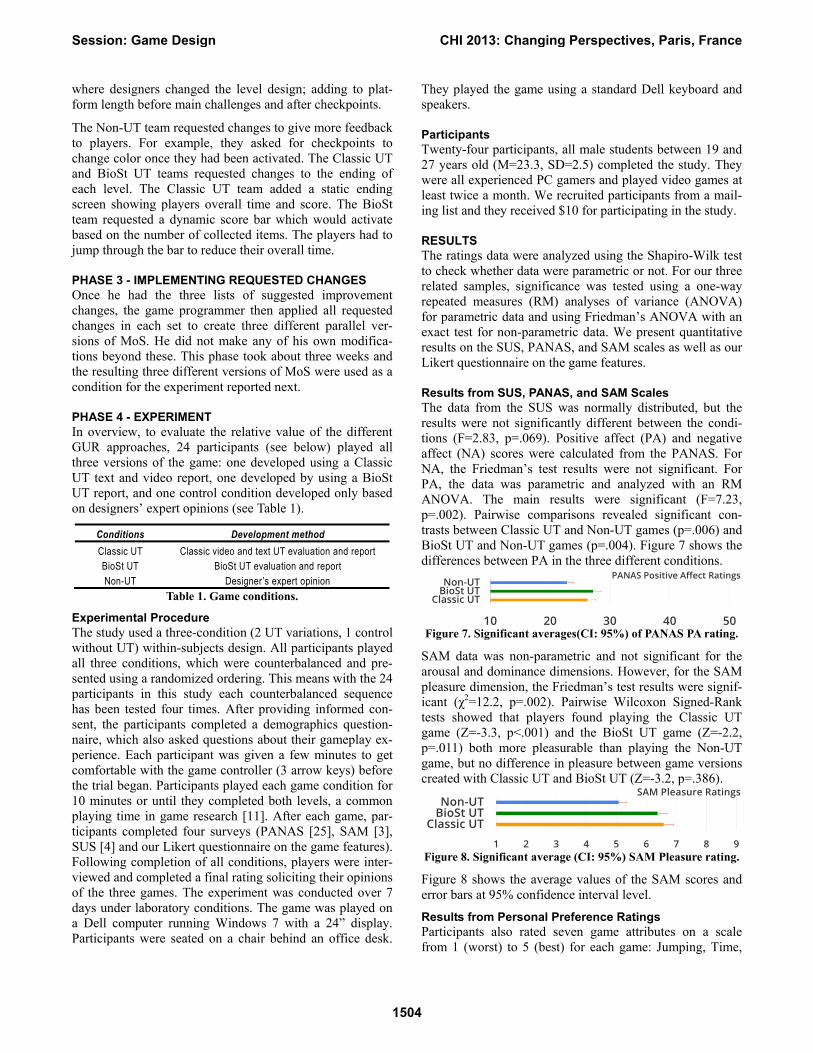
SAM data was non-parametric and not significant for the arousal and dominance dimensions. However, for the SAM pleasure dimension, the Friedman’s test results were signif-icant (χ2=12.2, p=.002). Pairwise Wilcoxon Signed-Rank tests showed that players found playing the Classic UT game (Z=-3.3, p<.001) and the BioSt UT game (Z=-2.2, p=.011) both more pleasurable than playing the Non-UT game, but no difference in pleasure between game versions created with Classic UT and BioSt UT (Z=-3.2, p=.386).
1 2 3 4 5 6 7 8 9
Classic UTBioSt UTNon-UT
SAM Pleasure Ratings
Figure 8. Significant average (CI: 95%) SAM Pleasure rating.
Figure 8 shows the average values of the SAM scores and error bars at 95% confidence interval level.
Results from Personal Preference Ratings Participants also rated seven game attributes on a scale from 1 (worst) to 5 (best) for each game: Jumping, Time,
Session: Game Design CHI 2013: Changing Perspectives, Paris, France
1504
Scoring, Controls, Speed, Collectables, and Level Design. All the data were non-parametric and a Friedman’s test showed significant differences for time (χ2=8.2, p=.015), scoring (χ2=13.8, p=.001), and collectables (χ2=13.1, p=.001). Pairwise Wilcoxon Signed-Rank tests showed that players saw no differences between playing the Classic UT and the BioSt UT games. However, they thought that both games improved time (both Z=-2.1, BioSt UT p=.012; Clas-sic UT p=.024), scoring (both Z=-3.2, p<.001), and collect-ables (BioSt UT Z=-3.1, p=.001; Classic UT Z=-3.2, p<.001) compared to the Non-UT version.
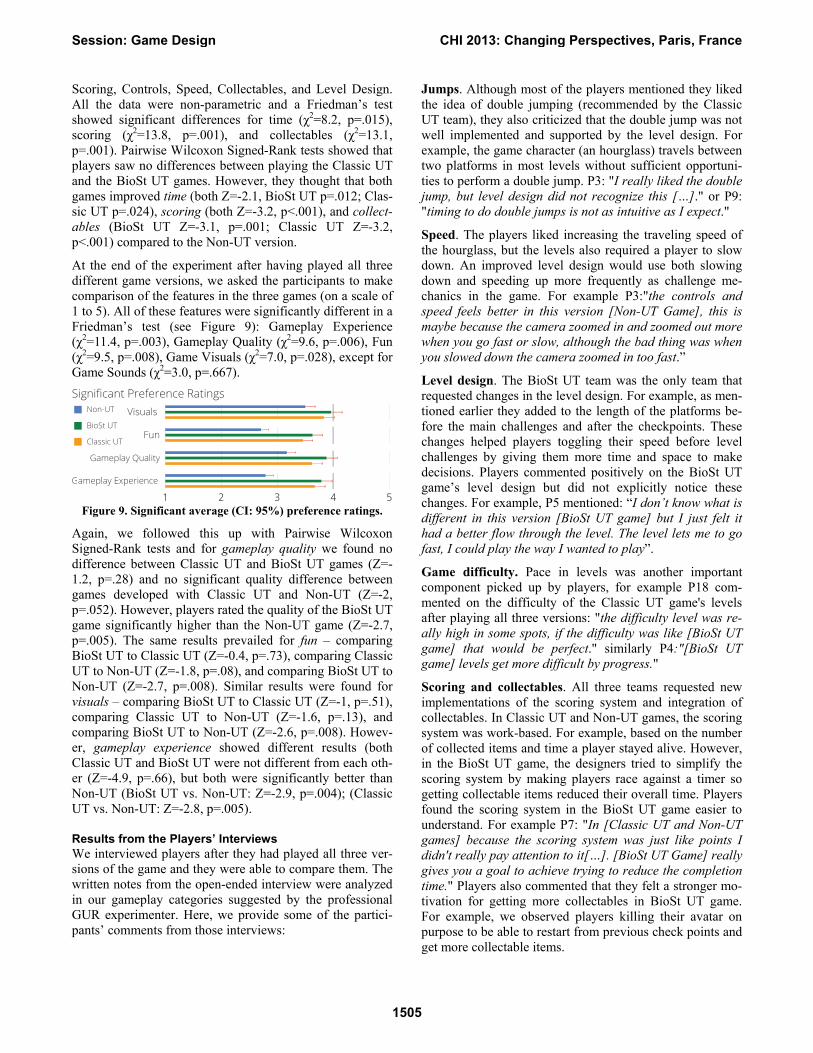
At the end of the experiment after having played all three different game versions, we asked the participants to make comparison of the features in the three games (on a scale of 1 to 5). All of these features were significantly different in a Friedman’s test (see Figure 9): Gameplay Experience (χ2=11.4, p=.003), Gameplay Quality (χ2=9.6, p=.006), Fun (χ2=9.5, p=.008), Game Visuals (χ2=7.0, p=.028), except for Game Sounds (χ2=3.0, p=.667).
1 2 3 4 5
Gameplay Experience
FunClassic UT
BioSt UT
Non-UT Visuals
Significant Preference Ratings
Gameplay Quality
Figure 9. Significant average (CI: 95%) preference ratings.
Again, we followed this up with Pairwise Wilcoxon Signed-Rank tests and for gameplay quality we found no difference between Classic UT and BioSt UT games (Z=-1.2, p=.28) and no significant quality difference between games developed with Classic UT and Non-UT (Z=-2, p=.052). However, players rated the quality of the BioSt UT game significantly higher than the Non-UT game (Z=-2.7, p=.005). The same results prevailed for fun – comparing BioSt UT to Classic UT (Z=-0.4, p=.73), comparing Classic UT to Non-UT (Z=-1.8, p=.08), and comparing BioSt UT to Non-UT (Z=-2.7, p=.008). Similar results were found for visuals – comparing BioSt UT to Classic UT (Z=-1, p=.51), comparing Classic UT to Non-UT (Z=-1.6, p=.13), and comparing BioSt UT to Non-UT (Z=-2.6, p=.008). Howev-er, gameplay experience showed different results (both Classic UT and BioSt UT were not different from each oth-er (Z=-4.9, p=.66), but both were significantly better than Non-UT (BioSt UT vs. Non-UT: Z=-2.9, p=.004); (Classic UT vs. Non-UT: Z=-2.8, p=.005).
Results from the Players’ Interviews We interviewed players after they had played all three ver-sions of the game and they were able to compare them. The written notes from the open-ended interview were analyzed in our gameplay categories suggested by the professional GUR experimenter. Here, we provide some of the partici-pants’ comments from those interviews:
Jumps. Although most of the players mentioned they liked the idea of double jumping (recommended by the Classic UT team), they also criticized that the double jump was not well implemented and supported by the level design. For example, the game character (an hourglass) travels between two platforms in most levels without sufficient opportuni-ties to perform a double jump. P3: "I really liked the double jump, but level design did not recognize this […]." or P9: "timing to do double jumps is not as intuitive as I expect."
Speed. The players liked increasing the traveling speed of the hourglass, but the levels also required a player to slow down. An improved level design would use both slowing down and speeding up more frequently as challenge me-chanics in the game. For example P3:"the controls and speed feels better in this version [Non-UT Game], this is maybe because the camera zoomed in and zoomed out more when you go fast or slow, although the bad thing was when you slowed down the camera zoomed in too fast.”
Level design. The BioSt UT team was the only team that requested changes in the level design. For example, as men-tioned earlier they added to the length of the platforms be-fore the main challenges and after the checkpoints. These changes helped players toggling their speed before level challenges by giving them more time and space to make decisions. Players commented positively on the BioSt UT game’s level design but did not explicitly notice these changes. For example, P5 mentioned: “I don’t know what is different in this version [BioSt UT game] but I just felt it had a better flow through the level. The level lets me to go fast, I could play the way I wanted to play”.
Game difficulty. Pace in levels was another important component picked up by players, for example P18 com-mented on the difficulty of the Classic UT game's levels after playing all three versions: "the difficulty level was re-ally high in some spots, if the difficulty was like [BioSt UT game] that would be perfect." similarly P4:"[BioSt UT game] levels get more difficult by progress."
Scoring and collectables. All three teams requested new implementations of the scoring system and integration of collectables. In Classic UT and Non-UT games, the scoring system was work-based. For example, based on the number of collected items and time a player stayed alive. However, in the BioSt UT game, the designers tried to simplify the scoring system by making players race against a timer so getting collectable items reduced their overall time. Players found the scoring system in the BioSt UT game easier to understand. For example P7: "In [Classic UT and Non-UT games] because the scoring system was just like points I didn't really pay attention to it[…]. [BioSt UT Game] really gives you a goal to achieve trying to reduce the completion time." Players also commented that they felt a stronger mo-tivation for getting more collectables in BioSt UT game. For example, we observed players killing their avatar on purpose to be able to restart from previous check points and get more collectable items.
Session: Game Design CHI 2013: Changing Perspectives, Paris, France
1505

Designers in the BioSt UT team used collectables for guiding players through a level by showing them the ideal curve to perform a jump or showing the correct path to platforms with more collectables. Our interview transcripts showed that most of the players did not notice this guided use of collectables, but they commented that they thought the BioSt UT game had more collectables. They also felt they could perform better jumps. For example P5:"in this version [BioSt UT] I knew how to jump, before I had no idea how far I could jump and how high I could jump, but in this one [BioSt UT] I had the parabolic motion, with all the power ups and minus time [collectables] so I knew when I should be able to jump to get them all and that really helped me at the beginning […]."
We believe that these – from a player’s point of view – seemingly covert adjustments of the BioSt UT team had a great impact on a player’s experience and affected their rating on the overall game quality.
Results from the Game Designers’ Interviews Each designer group met the game programmer at the end of their session to explain their requested changes. The re-searcher observed the sessions and then interviewed the designers after they explained their change requests to the game programmer.
Designers in the Classic UT team mentioned: “we have fixed all the issues from the report.” The researcher ob-served them referring to each issue when discussing their solutions (e.g., they said: “Did we deal with issue 4?”).
The researcher observed designers in the BioSt UT team watching the gameplay video, pausing the video at the indi-cated moments and reading the player’s comments. They referred to a specific player when discussing their changes, for example they said: “this change is answering player 3’s comment but what about player 4.”
Although the BioSt UT report did not map the changes in a player’s physiological measure to any specific emotion, the designers tended to interpret the issues referring to emo-tions for example: “look this guy gets so frustrated here.”
The designers in the BioSt UT team were the only team that used their UT report while discussing their requested changes with the game programmer (e.g., to show him spe-cifically where in the game they wanted to apply changes). The designers also referred to the physiological data to convince each other about the changes they wanted to make or to prove the existence of a problem.
In the interview with the designers in the Non-UT team, they mentioned that they had based their changes on game design concepts, for example they requested changes to give the player more feedback.
Results from the Game Programmer’s Interview We also interviewed the game programmer after he had applied all changes from all three groups. His comments
showed that he felt that the designers in the BioSt UT team had a better understanding of players and the game. For example: "I found changes from the Classic UT and Non-UT teams were be based more on personal opinions of the designers, the BioSt UT team really focused on the com-ments made by the players." He added: "The BioSt UT team had the most significant changes in their version; the changes were not necessarily more complicated but rather they simplify and polish existing mechanics. This may be because the data and feedback is only useful if you improve on existing functionality or totally remove it." He concluded by mentioning: "There were some similarities, for example, all groups found problems with the interface [UIs]. Though I saw a difference in the BioSt UT team’s changes being the least extreme, only removing small elements that players commented on […]. The Classic UT and Non-UT teams choose to make major changes to both of their UIs."
DISCUSSION We found that the two different types of UTs improved the design of the game compared to designing without UTs. Our main findings are:
While players considered the usability of all three games equal (SUS), they rated games designed with UTs higher in positive affect (PANAS) and in pleasure (SAM).
When Classic UT or BioSt UT informed the design deci-sions, the gameplay experience was significantly better.
Fun, visuals, and gameplay quality were significantly better when using BioSt UT compared to using designers’ intuitions only (Non-UT). These differences were not significant between Classic UT and Non-UT games.
BioSt UT and Classic UT were not significantly different from each other in all players’ ratings (see Figure 9). However, both methods improved the game significantly.
The findings from our interviews suggest that BioSts provided more nuanced feedback on the details of the level design mechanics that helped the designers focus on suggestions that would improve player experience.
Benefits of physiological measures. One of the main GUR challenges is to have a better understanding of player expe-rience to identify issues with a game, especially where the players interact with a game in a way not intended by the game designers. Observing gameplay and interviewing players can provide a rich data source as part of a UT. We think that providing researchers and designers with player’s physiological responses and comments based on game events helps them have a better understanding of the player experience. This can also provide evidence for the existence of a problem, which might not be uncovered by classic UTs, such as the level design changes suggested by the Bio-St UT designers in our experiment. Both (a better under-standing and more evidence) can increase the user research-er’s confidence and the likelihood of an issue to be reported to and taken seriously by the game development team.
Session: Game Design CHI 2013: Changing Perspectives, Paris, France
1506
Gameplay experience is more than just usability. The usability of all three games was considered equal, but pref-erences and affect ratings differed significantly. This means even when the three versions of the game offer equal levels of usability, they were different in positive affect and pleas-ure. We can argue classic usability measures and scales do not provide enough information on player experience.
You need more than one round of tests. Our results also suggest that a single round of user testing is not sufficient to lead to an optimal game. For example, the existence of the double jump feature in the Classic UT game appealed to most of the players, but they also commented that it was not well implemented or supported by the level design. We believe that an iterative process, through various UT ses-sions, will bring the game closer to designers’ intentions.
GUR UTs provide different improvements to a game. GUR aims to let designers be creative while providing feedback on how players understand game design ideas. If this feedback shows that the idea is not well understood by the players, it may also provide information that allows the designer to improve the implementation of the original idea. We have seen how the two different UT approaches con-tribute to this in different ways. The BioSt UT supplied a naming and the location of the problems (e.g., "issue with jump") while the Classic UT included a page of explanation for each problem. It is possible to argue that the explanation in Classic UT could unintentionally prime the designer to-wards a specific solution. On the other hand, the BioSt can support the designer’s creativity by visualizing the problem and providing substantiation from the player’s comments, the gameplay video and the changes in the player’s physio-logical state, leaving designers to explore possible respons-es. Previous work on reporting GUR findings supports the idea that designers want to explore where the gameplay problems are rather being told a cookie-cutter solution [18].
BioSt seems suitable for level design and difficulty. The BioSt team was the only team recommending changes in level design. This could suggest that providing designers with the information on a player’s arousal level and com-ments in a level would give designers structural information on level design. This also seemed to work for pacing and influencing difficulty in the game used in this study, since pacing related directly to game difficulty.
GUR challenges. A challenge for GUR is that game de-signers can be resistant to trusting a UT report. As game designers usually spend many months developing their game, they can be defensive about acknowledging UX and GUR issues. This may be because the designers feel that the GURs are criticizing their design, since in a general UT report the inputs from users are often hidden in the text. We observed that our Classic UT team wrote (in the report in front of each reported issues) whether they agreed or disa-greed with the issue although the researcher did not ask for this. This shows designers’ tendency to believe or not be-lieve the reported issues. On the other hand, the texts in
BioSt reports are generated from players’ comments. We observed the designers in the BioSt team were using the report to convince and argue for their recommended solu-tion. We observed them pointing to players’ comments, or changes in a player’s physiological state to support or con-vince their teammate to recommend a change.
Player-centered design. Designers in the Classic UT team tended to use the report as a center of their improvement process. We noted that they frequently used phrases such as “did we answer this issue”. In the interview at the end of their session, they also mentioned, “we have answered all the reported issues.” However, for the designers in the Bio-St team, players were the center of attention. They frequent-ly used phrases such as “what about player X, would this change answer their comment?” We believe BioSt provide a tool that keeps the players at the centre of design deci-sions, which is critical for acceptance of GUR reports.
Plausibility and persuasiveness are two important factors when reporting usability and UX issues [12]. By visualizing player’s comments alongside the change in their physiolog-ical state, BioSt enabled GUR and game designers to achieve these two important components of UT reports.
Limitations. The work here does have limitations. We rec-ognized the risk of subjective-designer-abilities effects and made deliberate design decisions to manage these effects (as discussed in Phase 2 of Evaluation section). We also considered different study designs (e.g. repetition in game redesign with different methods), however, the study pre-sented in the paper was favored for following reasons: (1) the learning and creativity effects stemming from across and within methods study design would have posed a much larger problem than designer’s subjective capabilities. (2) Our study is similar to real scenarios hence providing more ecological validity. It was also essential to look at the whole GUR cycle (from report to game) to discuss the evaluation bandwidth of each approach. We were able to see how de-signers performed when applying these different methods to make their design decisions (using them towards plausibil-ity and persuasiveness) as well as to evaluate how designers communicated a report to programmers, a critical stage of the GUR cycle. (3) It was important for us to develop three playable prototypes and the quantitative results from the within-subjects study motivated the qualitative discussion.
We also recognize that having the game analyzed by de-signers who had no involvement in the game up until that time is not how UTs in game development normally work. However, this was necessary for the validity of the study so that all designers could provide suggestions that were equally weighted. Further, the game prototype, the small number of participants, and short gameplay, do not allow us to conclude that a single UT approach leads to the creation of a better game. Blending Classic UTs and BioSt UTs fur-ther could be an ideal solution for a future qualitative study to reveal constructive differences of each approach, build-ing on the results here.
Session: Game Design CHI 2013: Changing Perspectives, Paris, France
1507
CONCLUSION The study presented in this paper supports employing UTs in game development since they will yield a higher quality game and a better gameplay experience. A successful game will keep the player engaged and succeed at its goal, whether it is to entertain or to inform. Hence, our findings not only apply to the game industry for improving enter-taining games, but also to people seeking to create games around simulation environments or wanting to gamify ap-plications. Using either classic UTs or BioSt UTs will im-prove the gameplay value of these applications. Further-more, we have initial evidence that BioSts provide more nuanced design feedback and provoke more subtle changes to game mechanics. Dividing the game based on beats and visualizing the physiological and player comments for each beat brings a new perspective to GUR data that was not previously available to developers. By having this frame-work, we can add other gameplay data (e.g., heatmaps of player’s crashes) within a similar setting.
ACKNOWLEDGMENTS We thank our partners, participants, external designers and the game programmer for their study contributions. We also thank our colleagues at Sussex University’s HCT group and UOIT’s GAMER Lab. This research was supported by UOIT, NSERC, GRAND NCE, and SSHRC IMMERSe.
REFERENCES 1. Ambinder, M. Biofeedback in Gameplay: How Valve
Measures Physiology to Enhance Gaming Experience. Presentation at GDC 2011, (2011).
2. Bernhaupt, R., ed. Evaluating User Experience in Games. Springer, Berlin, 2010.
3. Bradley, M.M. and Lang, P.J. Measuring emotion: The self-assessment manikin and the semantic differential. J Behav Ther Exp Psy 25, 1 (1994), pp. 49–59.
4. Brooke, J. SUS-A quick and dirty usability scale. Usability evaluation in industry, 1996.
5. Cacioppo, J.T., Tassinary, L.G., and Berntson, G., eds. Handbook of Psychophysiology. Cambridge University Press, 2007.
6. Church, D. Formal abstract design tools. Game Developer Magazine, August (1999).
7. Drachen, A., Nacke, L.E., Yannakakis, G., and Pedersen, A.L. Correlation between heart rate, electrodermal activity and player experience in first-person shooter games. SIGGRAPH Sandbox (2010), pp. 49–54.
8. Fairclough, S.H. Fundamentals of physiological computing. Interact Comput 21, 1-2 (2009), 133–145.
9. Hazlett, R. Using Biometric Measurement to Help Develop Emotionally Compelling Games. In K. Isbister and N. Schaffer, eds., Game Usability. Morgan Kaufmann, Burlington, MA, 2008.
10. Isbister, K. and Schaffer, N. Game Usability. Morgan Kaufmann, Burlington, MA, 2008.
11. Kivikangas, J.M., Chanel, G., Cowley, B., et al. A review of the use of psychophysiological methods in game research. JGVW 3, 3 (2011), 181–199.
12. Law, E.L.-C. The measurability and predictability of user experience. Proc. of EICS'11 (2011), pp. 1-10.
13. Malone, T. Toward a theory of intrinsically motivating instruction. Cognitive Science 5, 4 (1981), 333–369.
14. Mandryk, R.L. and Atkins, M.S. A fuzzy physiological approach for continuously modeling emotion during interaction with play technologies. Int J Hum-Comput St, (2007), 329–347.
15. Medler, B., John, M., and Lane, J. Data cracker: developing a visual game analytic tool for analyzing online gameplay. Proc. of CHI'11 (2011), 2365–2374.
16. Medlock, M.C., Wixon, D., and Terrano, M. Using the RITE method to improve products: A definition and a case study. Proc. of UPA'02, 2002.
17. Mirza-Babaei, P., Long, S., Foley, E., and McAllister, G. Understanding the Contribution of Biometrics to Games User Research. Proc. of DiGRA 2011, (2011).
18. Mirza-Babaei, P., Nacke, L.E., Fitzpatrick, G., et al. Biometric storyboards: visualising game user research data. Proc. of CHI EA'12 (2012), pp. 2315–2320.
19. Nacke, L.E. and Lindley, C. Affective Ludology, Flow and Immersion in a First- Person Shooter: Measurement of Player Experience. Loading 3, 5 (2009).
20. Pagulayan, R.J., Keeker, K., Wixon, D., and Romero, R.L. User-centered design in games. The Human-Computer Interaction Handbook, 2003, pp. 883–906.
21. Ravaja, N. Contributions of Psychophysiology to Media Research: Review and Recommendations. Media Psychology 6, 2 (2004), pp. 193–235.
22. Ravaja, N., Turpeinen, M., Saari, T., Puttonen, S., and Keltikangas-Järvinen, L. The psychophysiology of James Bond: Phasic emotional responses to violent video game events. Emotion 8, 1 (2008), pp. 114–120.
23. Sweetser, P. and Wyeth, P. GameFlow: a model for evaluating player enjoyment in games. CiE 3, 3 (2005).
24. Wallner, G. and Kriglstein, S. A spatiotemporal visualization approach for the analysis of gameplay data. Proc. of CHI'12 (2012), pp. 1115–1124.
25. Watson, D., Clark, L.A., and Tellegen, A. Development and validation of brief measures of positive and negative affect: The PANAS scales. Journal of Personality and Social Psychology 54, 6 (1988), pp. 1063–1070.
26. Zammitto, V. The Science of Play Testing: EA's Methods for User Research. Presentation at GDC 2011.
Session: Game Design CHI 2013: Changing Perspectives, Paris, France
1508
Copyright © 2022 FDOKUMEN